Embed Size (px)
Citation preview
Establishment of no-till permanent bed
vegetable production systems in the major
vegetable growing regions in Australia
Gordon Rogers
The University of Sydney
Project Number: VX01033
VX01033 This report is published by Horticulture Australia Ltd to pass on information concerning horticultural research and development undertaken for the vegetable industry. The research contained in this report was funded by Horticulture Australia Ltd with the financial support of AHR CropScience, Robrock Pty Ltd, Corrick Plains Pty Ltd, Eco Foods Pty Ltd, AR & ES Young, Back O Bourke Fruits Pty Ltd and Red Dirt Fruits Pty Ltd. All expressions of opinion are not to be regarded as expressing the opinion of Horticulture Australia Ltd or any authority of the Australian Government. The Company and the Australian Government accept no responsibility for any of the opinions or the accuracy of the information contained in this report and readers should rely upon their own enquiries in making decisions concerning their own interests. ISBN 0 7341 1447 8 Published and distributed by: Horticultural Australia Ltd Level 1 50 Carrington Street Sydney NSW 2000 Telephone: (02) 8295 2300 Fax: (02) 8295 2399 E-Mail: [email protected] © Copyright 2007

1
ESTABLISHMENT OF NO-TILL PERMANENT BED
VEGETABLE PRODUCTION SYSTEMS IN THE MAJOR VEGETABLE GROWING
REGIONS IN AUSTRALIA
2
Horticulture Australia Project Number: VX01033
Project Leader
Dr. Gordon S. Rogers Applied Horticultural Research
Po Box 3114 BUNDEENA NSW 2230
Key Personnel
Funding Sources
This project is jointly funded by Horticulture Australia Limited, Corrick Plains, Eco Foods, Redgold Farms, Back O’ Bourke Fruits and Red Dirt Fruits
Funding by both the Industry and HAL is gratefully acknowledged by
Applied Horticultural Research. Date: April 2006 Disclaimer: Any recommendations contained in this publication do not necessarily represent current HAL Limited policy. No person should act on the basis of the contents of this publication, whether as to matters of fact or opinion or other content, without first obtaining specific, independent professional advice in respect of the matters set out in this publication.
Gordon Rogers – AHR Stuart Little – AHR
Brad Giggins – AHR
3
Table of Contents Table of Contents............................................................................................................................................3 Media Summary..............................................................................................................................................6 Technical Summary ........................................................................................................................................8 Introduction ...................................................................................................................................................11 Trial Site 1: Bowen, Queensland – Euri Gold Farms.....................................................................................14
Introduction ..........................................................................................................................................14 Methods ...............................................................................................................................................16 Results .................................................................................................................................................22 Conclusion ...........................................................................................................................................22
Trial Site 2: Bourke, New South Wales – Back O’ Bourke Fruits...................................................................23 Introduction ..........................................................................................................................................23 Methods ...............................................................................................................................................23 Results .................................................................................................................................................24 Conclusion ...........................................................................................................................................29
Trial Site 3: Laidley, Queensland – Paul Ziebarth .........................................................................................30 Introduction ..........................................................................................................................................30 Methods ...............................................................................................................................................30 Results .................................................................................................................................................31 Conclusion ...........................................................................................................................................32
Trial Site 3: Laidley, Queensland – Paul Ziebarth .........................................................................................34 Introduction ..........................................................................................................................................34 Methods ...............................................................................................................................................34 Results .................................................................................................................................................35
Trial Site 4: Wemen, Victoria – Andrew Young .............................................................................................38 Andrew Young Trials 2002-2003 ..............................................................................................................38
Introduction ..........................................................................................................................................38 Methods ...............................................................................................................................................39 Results .................................................................................................................................................40 Conclusion ...........................................................................................................................................42
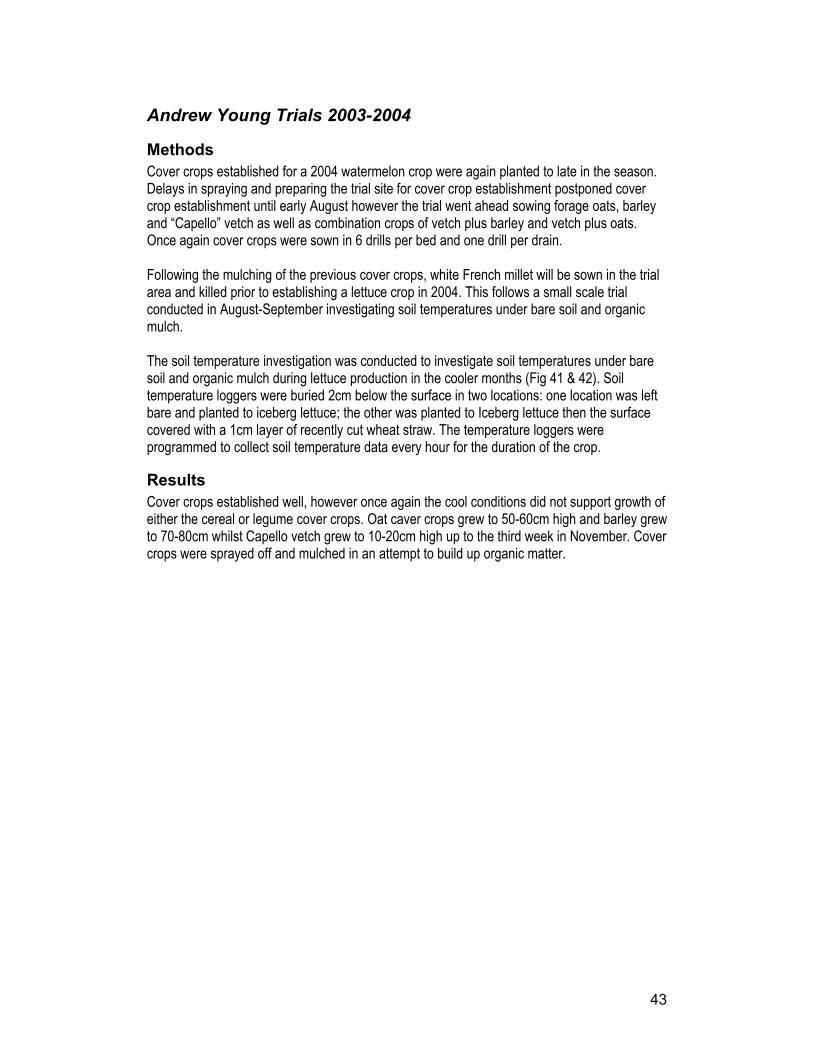
Andrew Young Trials 2003-2004 ..............................................................................................................43 Methods ...............................................................................................................................................43 Results .................................................................................................................................................43
Trial Site 5: Richmond, NSW – Valentine Micalef .........................................................................................46 Introduction ..........................................................................................................................................46 Methods ...............................................................................................................................................46 Results .................................................................................................................................................47 Conclusion ...........................................................................................................................................50
Trial Site 6: Richmond, NSW – University of Western Sydney......................................................................51 Introduction ..........................................................................................................................................51 Methods ...............................................................................................................................................51 Results .................................................................................................................................................52 Conclusion ...........................................................................................................................................52
Trial Site 7: Katherine, Northern Territory – Red Dirt Fruits ..........................................................................57 Introduction ..........................................................................................................................................57 Methods ...............................................................................................................................................57 Results .................................................................................................................................................59
4
A Review of the Effect of Organic Mulches on Soil Temperatures and the Implications for No-Till Vegetable Production.....................................................................................................................................................62
Site Descriptions ..................................................................................................................................62 Results .................................................................................................................................................62 Discussion............................................................................................................................................63 New system of crop establishment under investigation........................................................................64
An Investigation of Alternative Methods to Glyphosate Application, for weed control in No-Till Vegetable Production.....................................................................................................................................................70
Introduction & Research Objectives .....................................................................................................70 Methodology.........................................................................................................................................70 Results .................................................................................................................................................72 Discussion............................................................................................................................................88
Technology Transfer .....................................................................................................................................95 Commercial Implementation 1: Mataranka, Northern Territory – Kane and Marie Younghusband ...............95
Introduction ..........................................................................................................................................95 Methods ...............................................................................................................................................95 Results .................................................................................................................................................96 Conclusion ...........................................................................................................................................97
Commercial Implementation 2: Gympie, Queensland .................................................................................106 Introduction ........................................................................................................................................106 Methods .............................................................................................................................................106 Results ...............................................................................................................................................108 Conclusion .........................................................................................................................................108
Commercial Implementation 3: Giru, Queensland – Paul Le Feurve ..........................................................110 Paul Le Feurve Trials 2002-2003............................................................................................................110
Introduction ........................................................................................................................................110 Methods .............................................................................................................................................110 Results ...............................................................................................................................................112 Conclusion .........................................................................................................................................113
Paul Le Feurve Trials 2003-2004............................................................................................................114 Methods .............................................................................................................................................114 Results ...............................................................................................................................................114 Conclusion .........................................................................................................................................115
References..................................................................................................................................................116 Technology Transfer ...................................................................................................................................118
Extension Provision 1: Bowen, Queensland – Euri Gold Farms .............................................................118 Summary of Field Day, Conducted 20-06-03 .....................................................................................118 Summary of Media Exposure .............................................................................................................119
Extension Provision 2: Giru, Queensland – Paul Le Feurve ...................................................................122 Summary of Field Day, Conducted September, 2005 ........................................................................122
Concluding Remarks ..............................................................................................................................123 Future research ......................................................................................................................................124 Articles and Publications.........................................................................................................................125
Journal Articles (Refereed).................................................................................................................125 Conference Proceedings (not refereed) .............................................................................................125 Magazine Articles ...............................................................................................................................125 Articles in Newsletters and Grower Magazines ..................................................................................125 Newsletters ........................................................................................................................................126
Recommendations ......................................................................................................................................127 Appendices .................................................................................................................................................128

5
Appendix 1: Cost Analysis for alternative methods to Glyphosate Application, for weed control in No-Till Vegetable Production ...................................................................................................................128 Appendix 2 – Statistical Analysis - alternative methods to Glyphosate Application, for weed control in No-Till Vegetable Production -...........................................................................................................131
6
Media Summary A no-till farming system has been developed for horticultural production, utilizing permanent beds that are not cultivated after initial land preparation. While a previous HAL project (VG98050) developed the original system for horticultural crops grown in Bowen, Queensland, the present study has expanded the range of techniques which can be employed to address a wider range of crops and regions. By applying the most appropriate combination of practices to each production situation, this project broadens the relevance of previous work to Australian vegetable farmers, with an emphasis on implementation. Cover crops are established on beds, grown to maturity, killed and then flattened into an organic mulch. Commercial crops are directly sown or transplanted into this cover crop residue. This system aims to increase sustainability in relevant horticultural industries through the long-term maintenance of soil health and stability, as well as eliminating reliance on plastic mulch, which is difficult to dispose of, in an environmentally responsible fashion. The project aimed to identify appropriate cover crops for winter and summer growth in the tropical and temperate regions and implement the system on the farms of co-operating growers. Practices were developed for managing crop nutrition, planting, weed and pest control and irrigation, as well as the best techniques for killing the cover crop. Forage sorghum is the most commonly used summer season cover crop. Nutrifeed, a hybrid Pennisetum, has shown potential as a sorghum replacement in some regions, with fine stems resulting in mulch which is easier to manage. Millet can be used to provide mulch for both winter crops in the tropics and summer crops in the subtropics, although the cover produced is much thinner than that of sorghum. Winter cereals (wheat, oats and barley) as well as ryegrass grow well through the winter / spring period. Cereal rye produces very high quality mulch suitable for New South Wales and Victoria when sown at high density. Cereal growth in tropical areas can be relatively slow, leading to problems with weed management. Legumes were evaluated as cover crops, alone and in combination with a cereal or forage crop. White lupins and field peas were selected for temperate sites and Caloona cowpea and soybeans were examined in the tropics. Competition with weeds was poor for all legume species tested, although further research is needed to measure soybean performance. White lupin and field pea growth was suppressed when sown with barley. The best method for killing the cover crop was found to be an application of glyphosate, followed by rolling with a crimping roller within 7 days of herbicide application. Tank-mixing the glyphosate with a broadleaf herbicide was beneficial if legumes were present. Transplanting seedlings into cover crop residue requires access to no-till transplanters, such as the Canadian manufactured RJV-600. This type of transplanter was found to handle all conditions well, with the exception of wet mulch. Maximum soil temperatures under organic mulch were found to be lower than those under plastic mulch, leading to slower crop maturation, although yields were found to be comparable in some instances. This effect provided benefits in some situations, such as the reduction of excessive temperatures experienced in the tropics. Protection of produce from soil moisture was an observed advantage of organic mulch, relative to bare soil production. Irrigation frequency should be increased when using organic mulch, especially during the establishment stage, as soil moisture retention is less than that which is provided by a plastic mulch.

7
Conventional farming and no-till farming systems were compared throughout the project. The previous HAL project which investigated the use of cover crop mulches in Bowen (VG98050) provided an economic comparison of no-till and conventional farming. With further development of this system and it’s application to a greater number of production types, a more comprehensive economic review is now required to establish potential returns for a range of situations. Field days were held in Bowen and Giru, in North Queensland and articles were published in various publications, providing extension of project findings.
8
Technical Summary The problems associated with the disposal of plastic mulch in the conventional production of annual, horticultural crops had generated interest in an alternate system. No-till farming, increasingly popular in broadacre cropping, was examined as an option for growers of horticultural crops in the Bowen district of Queensland in previous HAL project VG98050. Project VX01033 was then initiated to apply this concept in the implementation of conservation tillage to a broader range of crops and sites across Australia. Suitable systems were designed, that would allow production without the use of plastic mulch. This involves, in the first instance, some initial tillage to prepare the land and form beds. These beds are considered permanent and are not re-formed until the replacement of sub-surface irrigation. Cover crops are grown prior to planting a commercial crop. Upon nearing maturity, the cover crop is killed (typically with a non-selective herbicide) and then flattened to form mulch over the beds, without the use of tillage. The commercial crop is then directly sown or transplanted into the mulch. As well as eliminating the need for plastic mulch, such a system holds potential long-term benefits such as soil health and stability, with the aim of increasing sustainability in small crop production. The principal aims of the project were to identify appropriate cover crops for winter and summer growth in the chosen regions and implement the system on the farms of co-operating growers. This involved the development of practices for the management of crop nutrition, planting, weed and pest control and irrigation, for both cover crops and commercial crops. The best techniques for killing the cover crop were also developed for various situations. A secondary focus was the use of legumes in cover cropping. The breakdown of organic material in soils, by microbial populations, requires the consumption of nitrogen, a process referred to as nutrient drawdown. The aim of evaluating legumes as cover crops was to determine if nitrogen fixation by these species could reduce the need for nitrogen fertilizer. A comparison of conventional farming and no-till farming was made throughout the project, with an emphasis on system outputs (produce yield and quality, soil health and stability) and inputs (labour, machinery running costs, fertilizers, pesticides, water use efficiency etc). Field days were held in Bowen and Giru, in North Queensland and articles were published in various publications, providing extension of project findings. Trials sites were located across four states, on grower properties, representing a variety of soil types and climatic conditions. No-till production in temperate conditions was investigated in Wemen (Victoria), Bourke and two sites in Richmond (New South Wales). Subtropical production was examined in Laidley (Queensland). Sites in Giru and Bowen (Queensland) and Katherine and Mataranka (Northern Territory) were established in the tropics. The installation of sub-surface irrigation is required, prior to initiating a permanent bed system. The predominant system used was trickle irrigation and adequate tape depth, superior filtration and tape wall strength were found to be critical for meeting the aim of leaving bed irrigation undisturbed for 5-10 years. Further work is needed to improve the lateral distribution of moisture across beds in some soil types, where sub-surface trickle tape is used.
9
Basal fertilizer for both the cover crop and the commercial crop is best applied prior to sowing the cover crop and nitrogen is the key nutrient to be managed. Soil testing should take place before planting both crops. Additional nutrition required for the commercial crop can be delivered via fertigation. Forage sorghum is commonly used as a summer season cover crop, however the coarse nature of the resulting mulch can make rolling and planting of the subsequent crop difficult. Nutrifeed, a hybrid Pennisetum, has shown potential as a sorghum replacement in some regions, with fine stems resulting in mulch which is easier to manage. Millet has proven to be a versatile cover crop, providing mulch for winter crops in the tropics and summer crops in the subtropics. Combination with a second cover crop may be beneficial in some situations however, as insufficient biomass is sometimes generated. Winter cereals (wheat, oats and barley) as well as ryegrass grow well through the winter / spring period. Cereal rye has shown particularly high potential for use in New South Wales and Victoria. The fine stems produce high quality mulch when this cover crop is sown at high density. Cereals exhibit slower growth in tropical areas and often fail to prevent weed establishment. Legumes were considered as cover crops with each species evaluated alone and in combination with a cereal (or forage sorghum in the case of soybeans, grown through summer). White lupins and field peas were selected for temperate sites and Caloona cowpea and soybeans were examined in the tropics. White lupins and field peas generated insufficient ground cover and did not compete well with weeds. Their growth was suppressed when sown with barley. Tropical legumes performed adequately but cowpea growth rates were significantly retarded during cooler conditions. Further work with soybeans and sowing density for other legume species is warranted. Termination of the cover crop was generally executed with an application of glyphosate (tank-mixed with a broadleaf herbicide if legumes are present) and then rolling with a crimping roller within 7 days of spraying. Organic Interceptor®, a herbicide approved for use in organic production, may also be a useful tool in no-till production. It has shown potential as a method of weed control, when combined with a flaming treatment and testing this application for cover crop termination may be beneficial. Direct seeding of commercial crops into organic mulch has been achieved with conventional seeders, in some cases after slight modification, such as lengthening the cups on a planter used for sowing rockmelon seed into plastic mulch. Transplanting seedlings into cover crop residue is a more specialised operation and ideally requires access to no-till transplanters, such as the Canadian manufactured RJV-600. This type of transplanter was found to handle all conditions well, with the exception of wet mulch. Organic mulch provided a buffering effect on soil temperature. Maximum soil temperatures under organic mulch were found to be lower than those under plastic mulch. These lower temperatures may lead to slower crop maturation and less vigorous growth, although in seedless watermelons, yields were comparable. Water retention was generally greater in soils under plastic mulch and irrigation frequency should therefore be increased when using organic mulch, especially during the establishment stage. The buffering effect was advantageous in certain situations, maintaining milder day temperatures through periods of excessive heat in the tropics and retaining a more optimal temperature through cold nights in northern Victoria. Organic mulch was also beneficial in protecting rockmelons from ground moisture. The prevention of ground rot in other crops needs further investigation.

10
The original research report and accompanying Best Practice Manual which documented the use of no-till vegetable farming in Bowen (HAL VG98050) included an economic comparison of this system to standard practice. The more recent application of these principles to a wider selection of crops and regions has provided a larger set of potential inputs for consideration. A more comprehensive review of the viability of no-till vegetable production is required, using a range of costs and returns applicable to the variation seen across crops and regions in Australian vegetable production.
11
Introduction Morse (1999) in a discussion of development of no-till vegetable production in the United States, attributes the progress and acceptance of no-till vegetable production to: advances in no-till planters; techniques for producing and managing high-residue cover crop mulches; improvements and acceptance of integrated weed management techniques. Tomato yield are 28% higher on average over 6 years using the Hairy vetch mulch system compared to plastic mulch at Beltsville, MD (USDA 1997). Hairy vetch, crimson clover and rye mixes were effective in providing nitrogen for fresh tomato production, and in the suppression of weed growth. The inclusion of the herbicide metribuzin has improved weed suppression and resulted in higher yields than mulch residues alone, indicating there is a place for herbicide use in the mulch/no-till system (Teasdal and Abdul-Baki 1998). The leguminous cover crop, hairy vetch is able to supply a significant part of a tomato crop nitrogen (N) requirement, reducing the need for inorganic N applications. The implication is that supplying N via a legume, reduces the opportunity for excess NO3 to leach, reducing the environmental impact of vegetable production using mulches compared to conventional cultivation under plastic (Adbul-Baki et al. 1997). The use of living mulches for cover cropping no-till vegetable production systems has great potential. A cover crop can suppress early season weed seed germination, but has very little effect late in the season due to breakdown of the residue (Hartwig 1989, Weston 1990). Suppressing the living mulch allows for regrowth that can maintain a mulch layer during the entire crop cycle (Elkins et al., 1979). The main problems with this approach in the past involved competition between the living mulch and the cash crop (ie nutrients, light, water etc) Recent advances in technology (ie irrigation methods, biotechnology, provide the potential to suppress living mulches during critical growth periods of the cash crop. In Australia, successful vegetable crops have been established and grown using tropical grasses and a tropical legume as cover crop species (Rogers et al. 1998-2000 various). The primary objective of this project was to build on the no-till permanent bed vegetable production system developed for North Queensland in project VG98050 to improve the flexibility of the system so that it can be used with confidence by growers in other vegetable growing regions in Australia, and on a wider range of vegetable crops. The key objectives to be addressed in addition to achievements made in VG98050 are:
(i) Select annual grasses and legumes which will fit different cropping cycles and/or and in different regions to those already evaluated;
(ii) Assess alternative methods of killing cover crops such as rolling and crimping; (iii) Investigate planting vegetable seedlings directly into fresh cover crop residues; (iv) Further investigate direct seeding into cover crop residues; (v) Broaden the range of vegetable crops to include: watermelons, rockmelons, honeydew melons,
capsicums, Brassicas, root crops and; Dr Rogers and Lionel Williams (Qld grower/collaborator) undertook a self-funded trip to the USA to observe progress in no-till vegetable production and the use of in-situ mulches. There is clear evidence that the techniques are successful, and no-till vegetable growing through mulch residues is viable, and is being practiced commercially in the USA
12
Resources for project VG98050 have focused on the Dry Tropics region (Bowen), as AHR had an excellent cooperator/ grower located there in Lionel Williams (Euri Gold Farms) who is committed to the success of the system. Our reasoning was that it is better to succeed in one area before adapting the system to other crops and regions. Smaller scale trials have also been completed at University of Western Sydney, Hawkesbury. These have focused on screening cover crop varieties suitable for cooler climates and best techniques for killing these varieties. A consequence of this strategy is that at the completion of project VG98050, the sustainable vegetable growing system will be completed for the Bowen/Burdekin region of Qld, and only indicative for other growing regions. Project (VG98050) established a number of important findings:
1. It is possible to successfully grow vegetable crops including capsicums, pumpkins, zucchini, rockmelons and eggfruit on no-till, permanent beds using cover crop residues to control weeds and improve soil health with yield and quality at least as good as using conventional farming (VG98050 Final Report sections 4 and 6).
2. Production of a tomato crop using the permanent bed system mulch is $600 per hectare cheaper
than conventional cultivation using plastic mulch (VG98050 Final Report section 10).
3. Soil health (organic matter, aggregate stability, bulk density, microbial mass, worm populations) are all significantly improved when cover crop residues are left on the soil surface in combination with controlled traffic and no-till techniques. Soils did not compact despite no cultivation for up to 4 years and bulk densities were lower in the permanent beds than in frequently cultivated soils used with plastic mulch (VG98050 Final Report section 4).
4. Techniques for transplanting vegetable crops and cover crops through organic mulch residues have
been developed (VG98050 Final Report section 3).
5. Soil microbial activity levels are higher in no-till vegetable plots compared to soil farmed conventionally. Biological Crop Protection (Dr Graham Stirling) has assessed soil biology in soil under plastic mulch and comparable plots under the permanent bed no-till system. Microbial activity levels assessed by fluorescein diacetate analysis (FDA) are 80% higher in the no-till plots compared to plots under plastic mulch before planting and 23% higher during active crop growth. (VG98050 Final Report section 4).
6. Water use efficiency has been increased using specifically-designed subsurface irrigation tubes.
Savings in water use of up to 50% were achieved using the “CRZI” system compared to buried trickle irrigation tube (VG98050 Final Report section 7).
The previous project has provided a lead into sustainable vegetable production in Australia. We have proved it is possible, and commercially viable, however two important tasks were beyond the scope of project VG98050:
1. The system needs to be adapted and promoted to suit the various crops and environments of the major vegetable growing areas in Australia.
2. Potential features of the system could be more fully developed to increase robustness and to take
advantage of environmental bonuses. Specific areas remaining to be investigated include: Verify reduced soil erosion in major rainfall events; reduce the requirement for inorganic N by the use of N-fixing legumes such as vetches in the rotation; fine-tune cover crop combinations and sequences

13
to suit various vegetable crops and climates, and; investigate non-chemical means of killing the cover crop such as rolling, crimping and using stalk choppers.
In a related project (VG97021) "Investigation of plastic mulch alternatives for intensive vegetable production", led by Dr Jason Ohlsen QDPI researchers were unable to overcome growth inhibition in capsicums caused by the mulch residues. It appears however, that capsicums have a special sensitivity to allelopathic chemicals, since US researchers Drs Abdul- Baki and Teasdale, have found similar problems with this crop. In the United States, research of Drs Abdul-Baki and Teasdale and in our Australian research, allelopathic growth suppression has not been observed in vegetable crops other than capsicums. RELEVANCE TO INDUSTRY The Australian Vegetable Industry Strategic Development Plan lists sustainable on-farm practices as the top strategy for the goal of managing the value train. The Qld Fruit and Vegetable Growers in their Survey of Qld growers (1999) and research priorities meeting (Brisbane 18th April 2000) rate sustainable vegetable production information and codes of practices highly. For the long-term viability, the vegetable production industry must be sustainable. The clean-green image, so important to domestic and export marketing, will become increasingly significant as awareness of environmental issues increases. Our work to date and international experience has shown beyond doubt that cultivation can be drastically reduced and organic mulches can replace plastic mulch in many cases. Practical aspects of the system such as transplanting techniques, fertiliser strategies, etc. will be developed throughout the project. Initial trials will investigate cover crop sowing methods and methods for improving transplant establishment. Also under investigation are techniques for direct sowing of crops through mulch residues and non-chemical methods for killing cover crops.
14
Trial Site 1: Bowen, Queensland – Euri Gold Farms Objective: No-Till Galea Melon
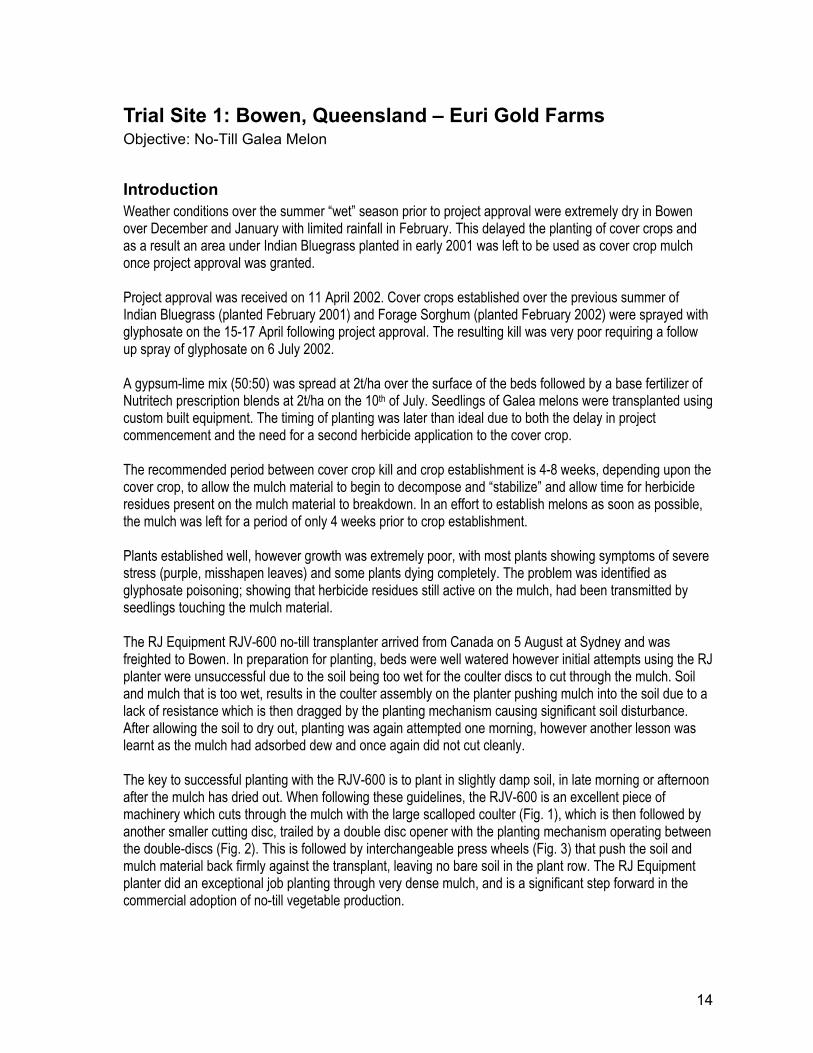
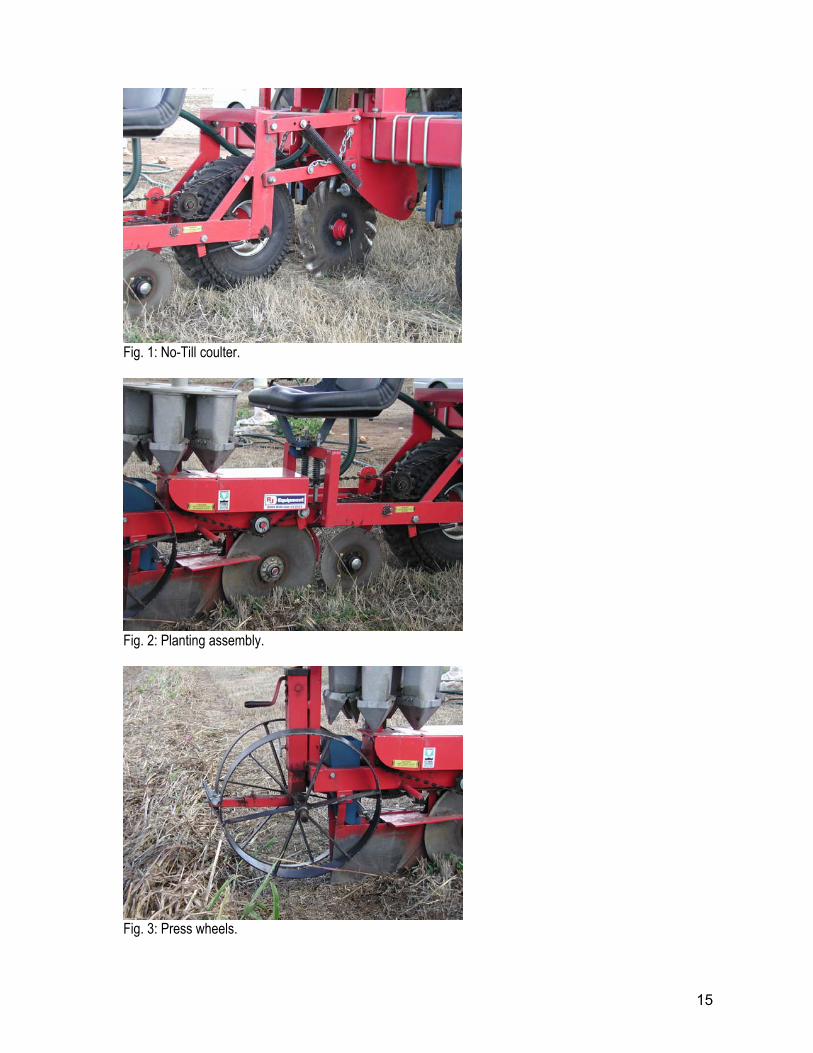
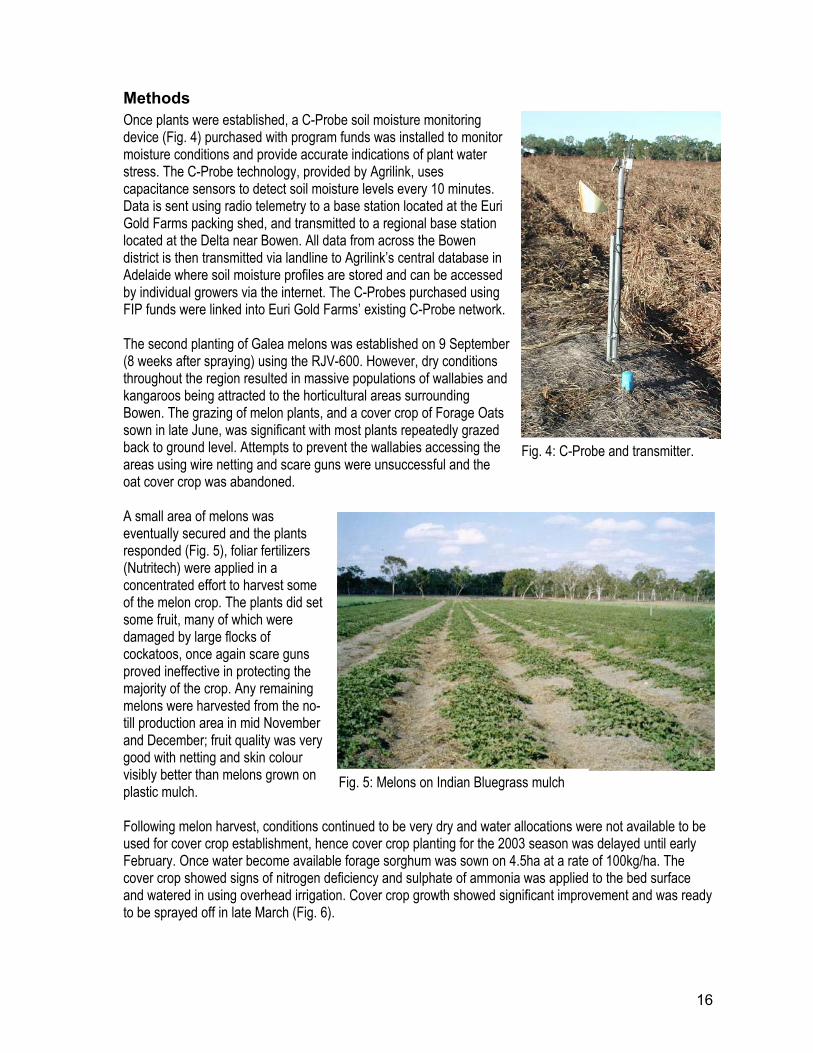
Introduction Weather conditions over the summer “wet” season prior to project approval were extremely dry in Bowen over December and January with limited rainfall in February. This delayed the planting of cover crops and as a result an area under Indian Bluegrass planted in early 2001 was left to be used as cover crop mulch once project approval was granted. Project approval was received on 11 April 2002. Cover crops established over the previous summer of Indian Bluegrass (planted February 2001) and Forage Sorghum (planted February 2002) were sprayed with glyphosate on the 15-17 April following project approval. The resulting kill was very poor requiring a follow up spray of glyphosate on 6 July 2002. A gypsum-lime mix (50:50) was spread at 2t/ha over the surface of the beds followed by a base fertilizer of Nutritech prescription blends at 2t/ha on the 10th of July. Seedlings of Galea melons were transplanted using custom built equipment. The timing of planting was later than ideal due to both the delay in project commencement and the need for a second herbicide application to the cover crop. The recommended period between cover crop kill and crop establishment is 4-8 weeks, depending upon the cover crop, to allow the mulch material to begin to decompose and “stabilize” and allow time for herbicide residues present on the mulch material to breakdown. In an effort to establish melons as soon as possible, the mulch was left for a period of only 4 weeks prior to crop establishment. Plants established well, however growth was extremely poor, with most plants showing symptoms of severe stress (purple, misshapen leaves) and some plants dying completely. The problem was identified as glyphosate poisoning; showing that herbicide residues still active on the mulch, had been transmitted by seedlings touching the mulch material. The RJ Equipment RJV-600 no-till transplanter arrived from Canada on 5 August at Sydney and was freighted to Bowen. In preparation for planting, beds were well watered however initial attempts using the RJ planter were unsuccessful due to the soil being too wet for the coulter discs to cut through the mulch. Soil and mulch that is too wet, results in the coulter assembly on the planter pushing mulch into the soil due to a lack of resistance which is then dragged by the planting mechanism causing significant soil disturbance. After allowing the soil to dry out, planting was again attempted one morning, however another lesson was learnt as the mulch had adsorbed dew and once again did not cut cleanly. The key to successful planting with the RJV-600 is to plant in slightly damp soil, in late morning or afternoon after the mulch has dried out. When following these guidelines, the RJV-600 is an excellent piece of machinery which cuts through the mulch with the large scalloped coulter (Fig. 1), which is then followed by another smaller cutting disc, trailed by a double disc opener with the planting mechanism operating between the double-discs (Fig. 2). This is followed by interchangeable press wheels (Fig. 3) that push the soil and mulch material back firmly against the transplant, leaving no bare soil in the plant row. The RJ Equipment planter did an exceptional job planting through very dense mulch, and is a significant step forward in the commercial adoption of no-till vegetable production.
15
Fig. 1: No-Till coulter.
Fig. 2: Planting assembly.
Fig. 3: Press wheels.
16
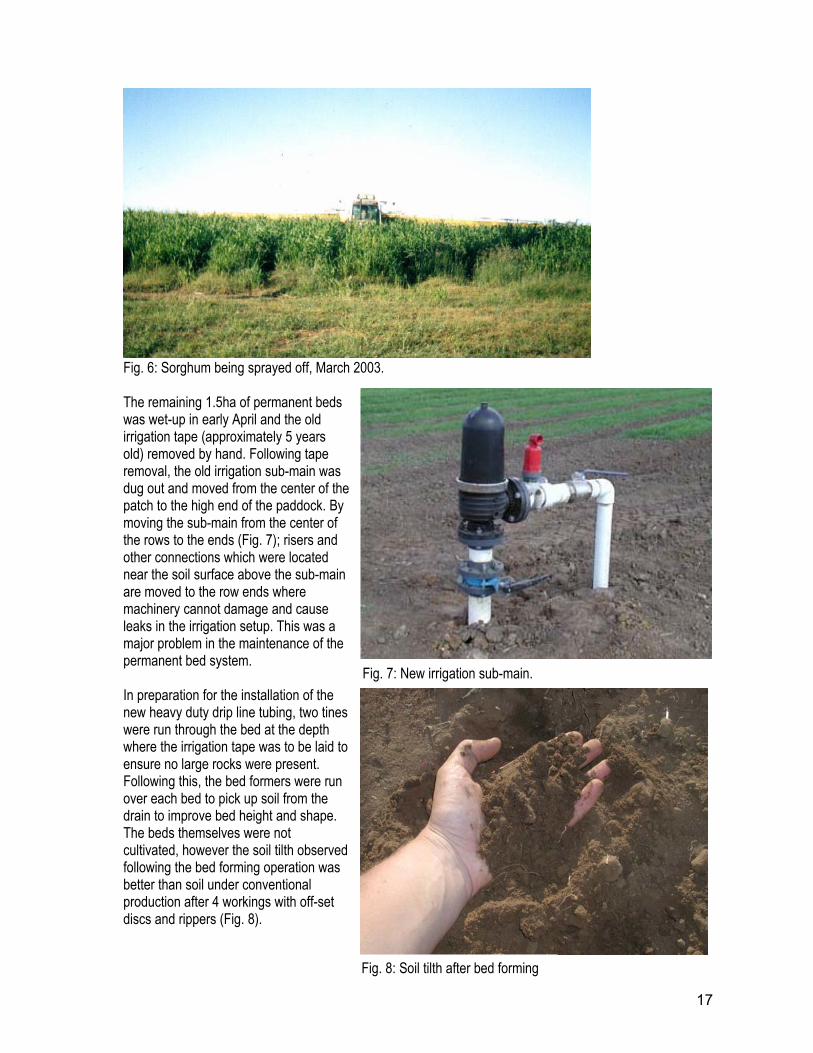
Methods Once plants were established, a C-Probe soil moisture monitoring device (Fig. 4) purchased with program funds was installed to monitor moisture conditions and provide accurate indications of plant water stress. The C-Probe technology, provided by Agrilink, uses capacitance sensors to detect soil moisture levels every 10 minutes. Data is sent using radio telemetry to a base station located at the Euri Gold Farms packing shed, and transmitted to a regional base station located at the Delta near Bowen. All data from across the Bowen district is then transmitted via landline to Agrilink’s central database in Adelaide where soil moisture profiles are stored and can be accessed by individual growers via the internet. The C-Probes purchased using FIP funds were linked into Euri Gold Farms’ existing C-Probe network. The second planting of Galea melons was established on 9 September (8 weeks after spraying) using the RJV-600. However, dry conditions throughout the region resulted in massive populations of wallabies and kangaroos being attracted to the horticultural areas surrounding Bowen. The grazing of melon plants, and a cover crop of Forage Oats sown in late June, was significant with most plants repeatedly grazed back to ground level. Attempts to prevent the wallabies accessing the areas using wire netting and scare guns were unsuccessful and the oat cover crop was abandoned. A small area of melons was eventually secured and the plants responded (Fig. 5), foliar fertilizers (Nutritech) were applied in a concentrated effort to harvest some of the melon crop. The plants did set some fruit, many of which were damaged by large flocks of cockatoos, once again scare guns proved ineffective in protecting the majority of the crop. Any remaining melons were harvested from the no-till production area in mid November and December; fruit quality was very good with netting and skin colour visibly better than melons grown on plastic mulch. Following melon harvest, conditions continued to be very dry and water allocations were not available to be used for cover crop establishment, hence cover crop planting for the 2003 season was delayed until early February. Once water become available forage sorghum was sown on 4.5ha at a rate of 100kg/ha. The cover crop showed signs of nitrogen deficiency and sulphate of ammonia was applied to the bed surface and watered in using overhead irrigation. Cover crop growth showed significant improvement and was ready to be sprayed off in late March (Fig. 6).
Fig. 4: C-Probe and transmitter.
Fig. 5: Melons on Indian Bluegrass mulch
17
Fig. 6: Sorghum being sprayed off, March 2003. The remaining 1.5ha of permanent beds was wet-up in early April and the old irrigation tape (approximately 5 years old) removed by hand. Following tape removal, the old irrigation sub-main was dug out and moved from the center of the patch to the high end of the paddock. By moving the sub-main from the center of the rows to the ends (Fig. 7); risers and other connections which were located near the soil surface above the sub-main are moved to the row ends where machinery cannot damage and cause leaks in the irrigation setup. This was a major problem in the maintenance of the permanent bed system. In preparation for the installation of the new heavy duty drip line tubing, two tines were run through the bed at the depth where the irrigation tape was to be laid to ensure no large rocks were present. Following this, the bed formers were run over each bed to pick up soil from the drain to improve bed height and shape. The beds themselves were not cultivated, however the soil tilth observed following the bed forming operation was better than soil under conventional production after 4 workings with off-set discs and rippers (Fig. 8).
Fig. 7: New irrigation sub-main.
Fig. 8: Soil tilth after bed forming
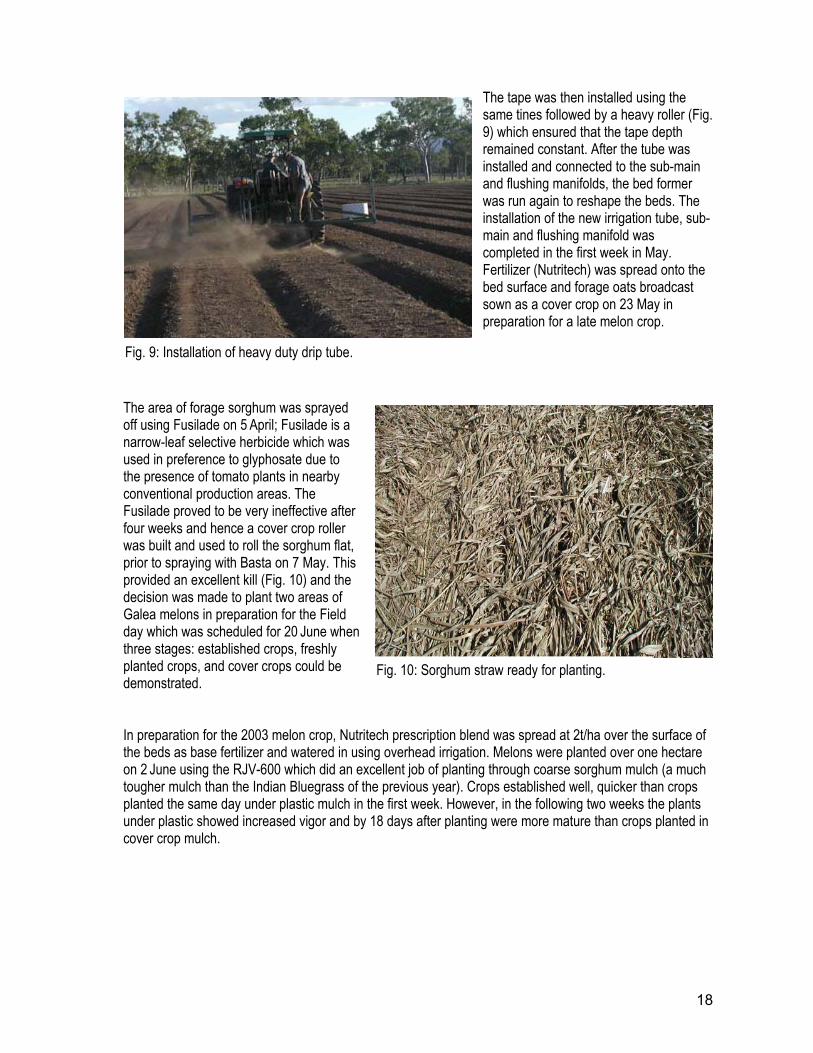
18
The tape was then installed using the same tines followed by a heavy roller (Fig. 9) which ensured that the tape depth remained constant. After the tube was installed and connected to the sub-main and flushing manifolds, the bed former was run again to reshape the beds. The installation of the new irrigation tube, sub-main and flushing manifold was completed in the first week in May. Fertilizer (Nutritech) was spread onto the bed surface and forage oats broadcast sown as a cover crop on 23 May in preparation for a late melon crop.
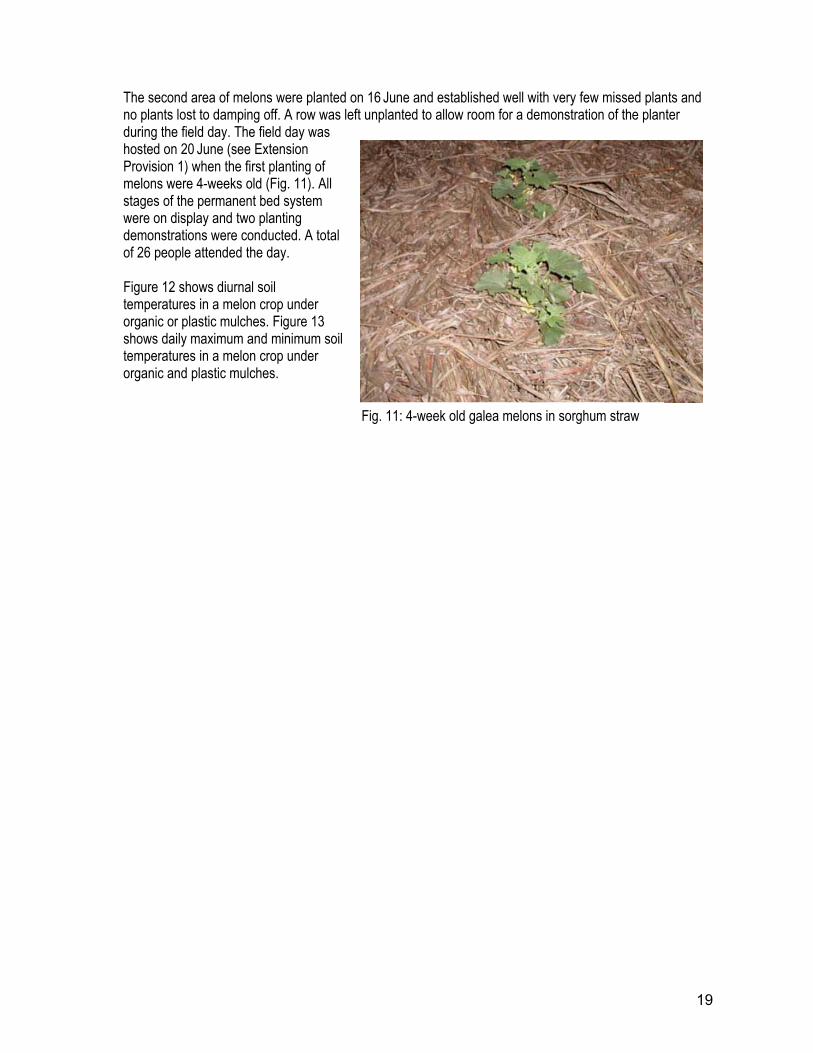
The area of forage sorghum was sprayed off using Fusilade on 5 April; Fusilade is a narrow-leaf selective herbicide which was used in preference to glyphosate due to the presence of tomato plants in nearby conventional production areas. The Fusilade proved to be very ineffective after four weeks and hence a cover crop roller was built and used to roll the sorghum flat, prior to spraying with Basta on 7 May. This provided an excellent kill (Fig. 10) and the decision was made to plant two areas of Galea melons in preparation for the Field day which was scheduled for 20 June when three stages: established crops, freshly planted crops, and cover crops could be demonstrated. In preparation for the 2003 melon crop, Nutritech prescription blend was spread at 2t/ha over the surface of the beds as base fertilizer and watered in using overhead irrigation. Melons were planted over one hectare on 2 June using the RJV-600 which did an excellent job of planting through coarse sorghum mulch (a much tougher mulch than the Indian Bluegrass of the previous year). Crops established well, quicker than crops planted the same day under plastic mulch in the first week. However, in the following two weeks the plants under plastic showed increased vigor and by 18 days after planting were more mature than crops planted in cover crop mulch.
Fig. 10: Sorghum straw ready for planting.
Fig. 9: Installation of heavy duty drip tube.
19
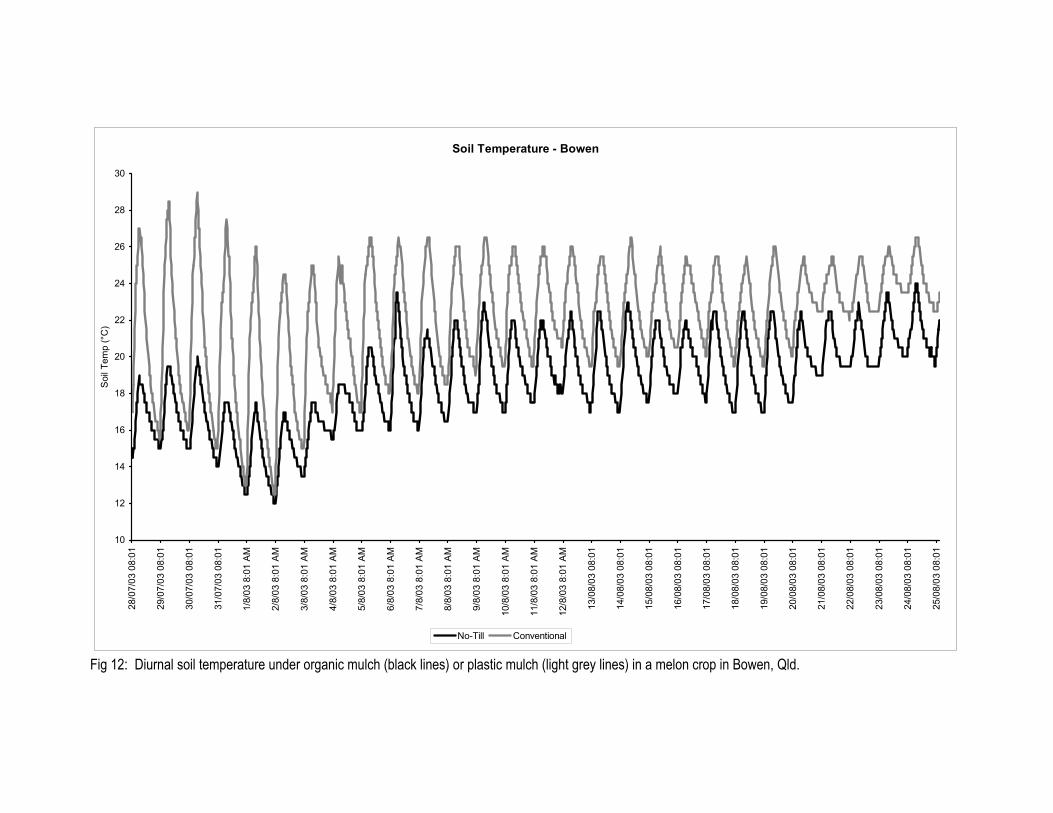
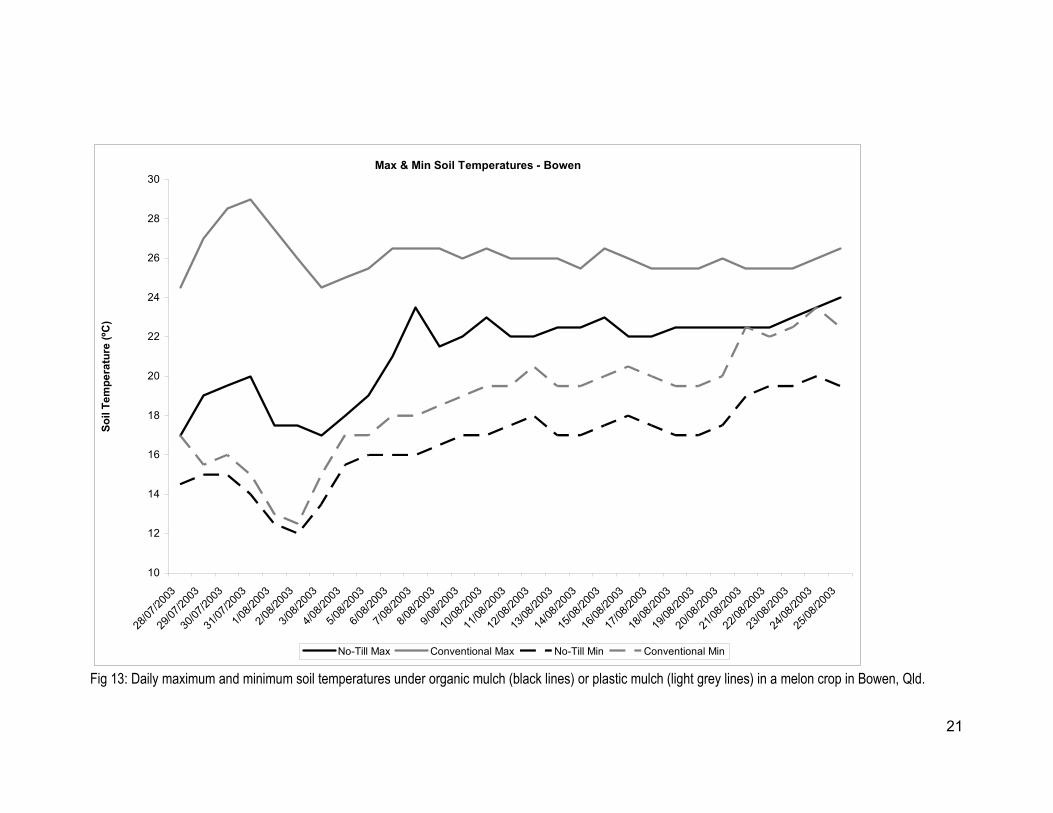
The second area of melons were planted on 16 June and established well with very few missed plants and no plants lost to damping off. A row was left unplanted to allow room for a demonstration of the planter during the field day. The field day was hosted on 20 June (see Extension Provision 1) when the first planting of melons were 4-weeks old (Fig. 11). All stages of the permanent bed system were on display and two planting demonstrations were conducted. A total of 26 people attended the day. Figure 12 shows diurnal soil temperatures in a melon crop under organic or plastic mulches. Figure 13 shows daily maximum and minimum soil temperatures in a melon crop under organic and plastic mulches.
Fig. 11: 4-week old galea melons in sorghum straw
Soil Temperature - Bowen
10
12
14
16
18
20
22
24
26
28
30
28/0
7/03
08:
01
29/0
7/03
08:
01
30/0
7/03
08:
01
31/0
7/03
08:
01
1/8/
03 8
:01
AM
2/8/
03 8
:01
AM
3/8/
03 8
:01
AM
4/8/
03 8
:01
AM
5/8/
03 8
:01
AM
6/8/
03 8
:01
AM
7/8/
03 8
:01
AM
8/8/
03 8
:01
AM
9/8/
03 8
:01
AM
10/8
/03
8:01
AM
11/8
/03
8:01
AM
12/8
/03
8:01
AM
13/0
8/03
08:
01
14/0
8/03
08:
01
15/0
8/03
08:
01
16/0
8/03
08:
01
17/0
8/03
08:
01
18/0
8/03
08:
01
19/0
8/03
08:
01
20/0
8/03
08:
01
21/0
8/03
08:
01
22/0
8/03
08:
01
23/0
8/03
08:
01
24/0
8/03
08:
01
25/0
8/03
08:
01
Soi
l Tem
p (°
C)
No-Till Conventional
Fig 12: Diurnal soil temperature under organic mulch (black lines) or plastic mulch (light grey lines) in a melon crop in Bowen, Qld.
21
Max & Min Soil Temperatures - Bowen
10
12
14
16
18
20
22
24
26
28
30
28/07
/2003
29/07
/2003
30/07
/2003
31/07
/2003
1/08/2
003
2/08/2
003
3/08/2
003
4/08/2
003
5/08/2
003
6/08/2
003
7/08/2
003
8/08/2
003
9/08/2
003
10/08
/2003
11/08
/2003
12/08
/2003
13/08
/2003
14/08
/2003
15/08
/2003
16/08
/2003
17/08
/2003
18/08
/2003
19/08
/2003
20/08
/2003
21/08
/2003
22/08
/2003
23/08
/2003
24/08
/2003
25/08
/2003
Soil
Tem
pera
ture
(ºC
)
No-Till Max Conventional Max No-Till Min Conventional Min
Fig 13: Daily maximum and minimum soil temperatures under organic mulch (black lines) or plastic mulch (light grey lines) in a melon crop in Bowen, Qld.
Results Prior to the commencement of this project, the agronomy of no-till vegetable production had been developed, however the equipment to carry out the key function of establishing crops was a home-made planter that had a number of flaws and risks associated with it if used on a commercial scale. By using the funds provided under this project, appropriate technology (i.e. the RJ Equipment planter) which had been proven in US no-till production systems could be purchased. The RJ Equipment planter was the “missing link” in the commercial implementation of no-till vegetable production. This project conducted by Euri Gold Farms has demonstrated that successful establishment of vegetable seedlings into a high residue no-till system can be achieved using appropriate technologies. Previously, the type of irrigation tube used in conventional production for a single season and discarded was also installed in the no-till system and expected to last for 5 or more years. The labour required in continually fixing leaks in the irrigation tube caused by rocky ground and chewing insects was another issue that needed to be resolved prior to full commercial adoption of the no-till system. The purchase of thick-walled drip irrigation tube which was installed under 1.5 hectares of permanent beds and connected to a single flushing manifold will provide a long-term solution to irrigation requirements under the no-till system. The performance of the heavier trickle tube over the next few years will determine if the higher cost of the tube is matched with savings in labour and longer life-span.
Conclusion The keys to the success of any no-till system are: • to establish a sub-surface irrigation system where infrastructure is buried deep enough to
avoid damage from farm implements and trickle tube is strong enough to resist damage; • to build or purchase appropriate technologies to carry out key operations such as direct
seeding cover crops, establishing transplants, and herbicide applications; • to convert your farming operation gradually by establishing 1 or 2 commercial blocks
initially, then converting your farm piece by piece after problems have been identified and solved.
23
Trial Site 2: Bourke, New South Wales – Back O’ Bourke Fruits Objective: No-Till Rockmelons
Introduction Rob Philip has done some observational trials using plastic mulches and these have shown some positive results for fruit sugars. The objective of this trial was to test these mulches in a more rigorous scientific trial and to investigate the advantages and disadvantages of transplanted crops compared to direct seeded crops under plastic and bare soil conditions.
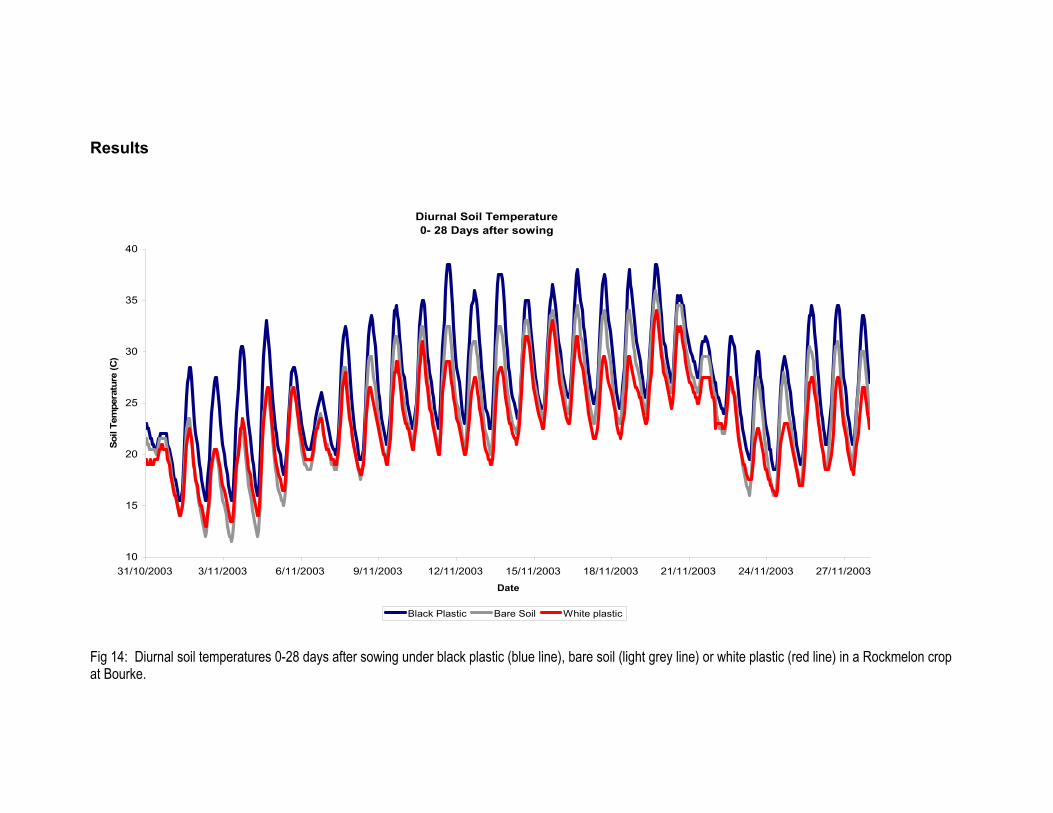
Methods The trial evaluated white and black plastic mulch relative to bare soil and transplanted versus direct seeded establishment. Twenty metre strips of white or black plastic were laid in a randomised complete block design including 20m bare soil treatments. Seed (variety: Durack) was planted by hand and watered using sub-surface trickle irrigation. Temperature loggers were installed 3-4cm below the soil surface to monitor soil temperatures under the three mulch treatments. Direct seeded and transplant treatments were arranged in a split plot design with direct seeded crops sown on 30 October and seedlings transplanted 21 days later on 20 November. All other agronomy was standard. Treatments 1 Bare Soil / Direct Seed 2 Bare Soil / Transplant 3 Black / Direct Seed 4 Black / Transplant 5 White / Direct Seed 6 White / Transplant
Results
Diurnal Soil Temperature0- 28 Days after sowing
10
15
20
25
30
35
40
31/10/2003 3/11/2003 6/11/2003 9/11/2003 12/11/2003 15/11/2003 18/11/2003 21/11/2003 24/11/2003 27/11/2003 Date
Soil
Tem
pera
ture
(C)
Black Plastic Bare Soil White plastic
Fig 14: Diurnal soil temperatures 0-28 days after sowing under black plastic (blue line), bare soil (light grey line) or white plastic (red line) in a Rockmelon crop at Bourke.
25
Diurnal Soil Temperature29-56 Days after Sowing
10
15
20
25
30
35
40
27/11/2003 30/11/2003 3/12/2003 6/12/2003 9/12/2003 12/12/2003 15/12/2003 18/12/2003 21/12/2003 24/12/2003 Date
Soil
Tem
pera
ture
(C)
Black Plastic Bare Soil White plastic
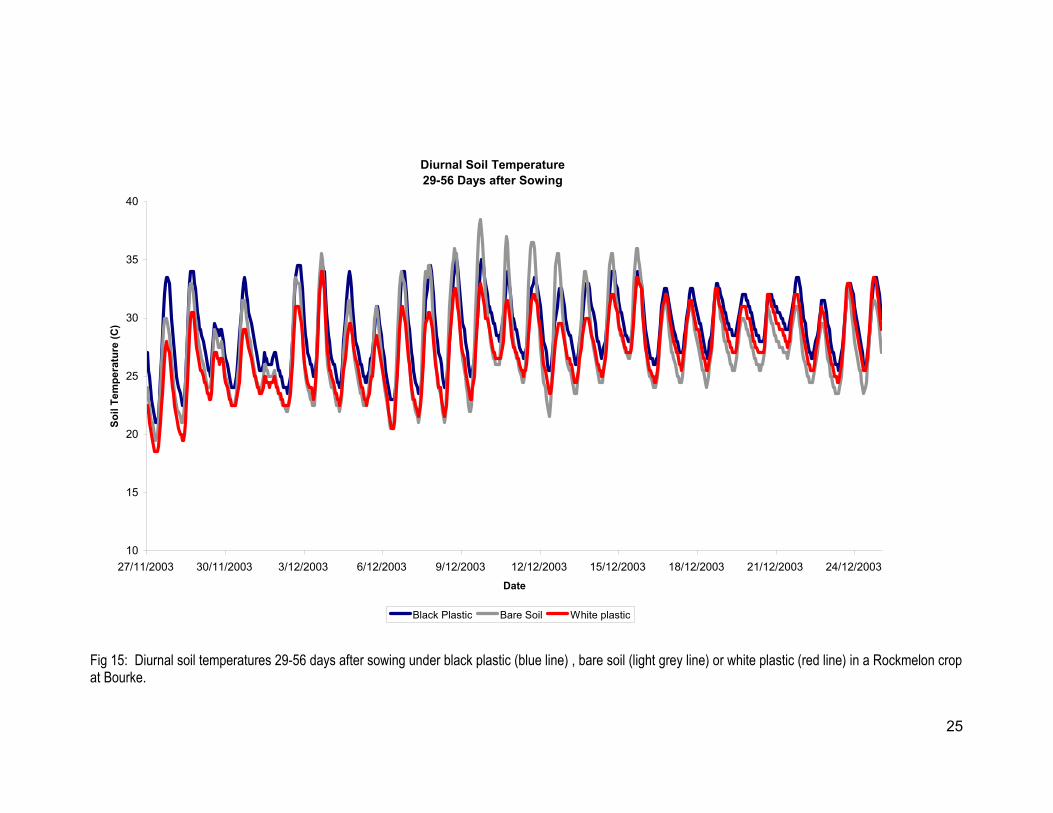
Fig 15: Diurnal soil temperatures 29-56 days after sowing under black plastic (blue line) , bare soil (light grey line) or white plastic (red line) in a Rockmelon crop at Bourke.
26
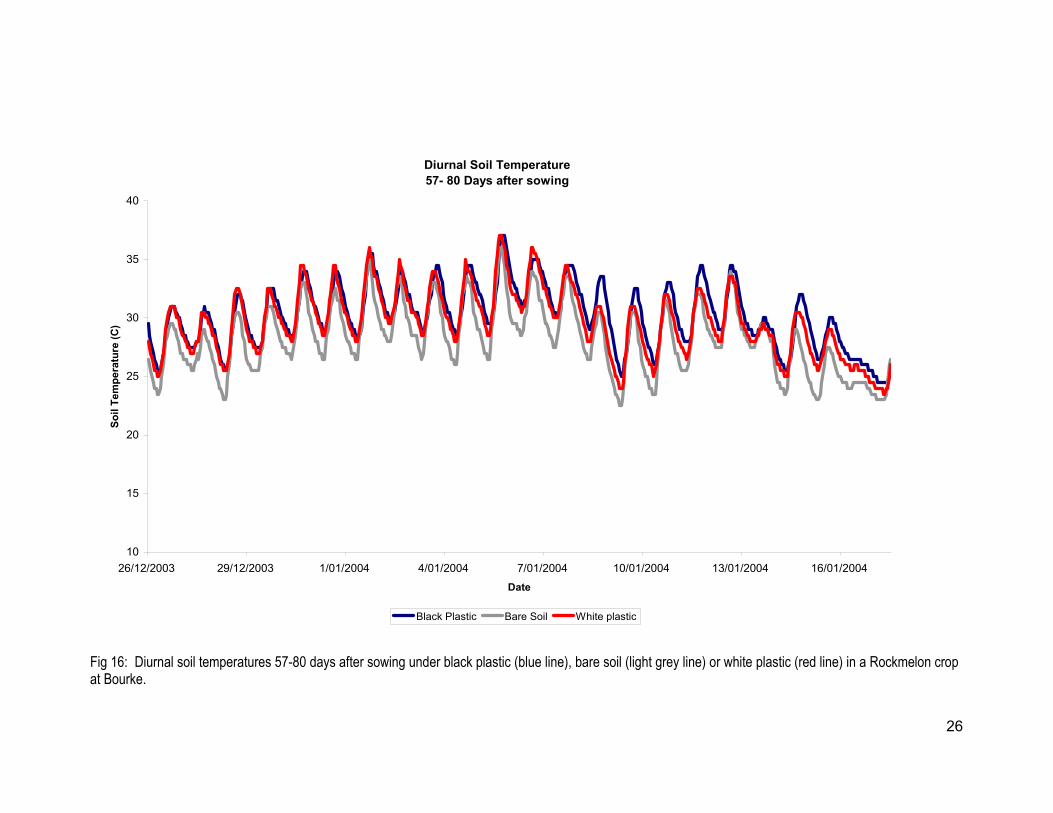
Diurnal Soil Temperature57- 80 Days after sowing
10
15
20
25
30
35
40
26/12/2003 29/12/2003 1/01/2004 4/01/2004 7/01/2004 10/01/2004 13/01/2004 16/01/2004
Date
Soil
Tem
pera
ture
(C)
Black Plastic Bare Soil White plastic
Fig 16: Diurnal soil temperatures 57-80 days after sowing under black plastic (blue line), bare soil (light grey line) or white plastic (red line) in a Rockmelon crop at Bourke.
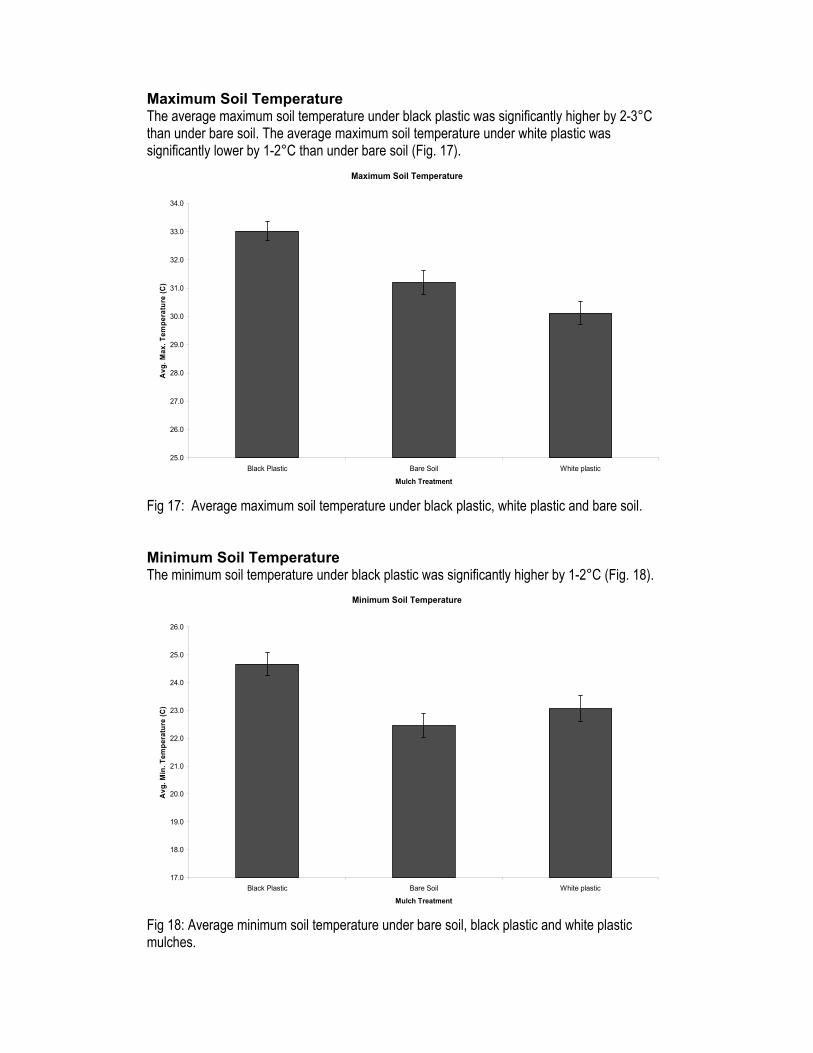
Maximum Soil Temperature The average maximum soil temperature under black plastic was significantly higher by 2-3°C than under bare soil. The average maximum soil temperature under white plastic was significantly lower by 1-2°C than under bare soil (Fig. 17).
Maximum Soil Temperature
25.0
26.0
27.0
28.0
29.0
30.0
31.0
32.0
33.0
34.0
Black Plastic Bare Soil White plastic
Mulch Treatment
Avg
. Max
. Tem
pera
ture
(C)
Fig 17: Average maximum soil temperature under black plastic, white plastic and bare soil. Minimum Soil Temperature The minimum soil temperature under black plastic was significantly higher by 1-2°C (Fig. 18).
Minimum Soil Temperature
17.0
18.0
19.0
20.0
21.0
22.0
23.0
24.0
25.0
26.0
Black Plastic Bare Soil White plastic
Mulch Treatment
Avg
. Min
. Tem
pera
ture
(C)
Fig 18: Average minimum soil temperature under bare soil, black plastic and white plastic mulches.
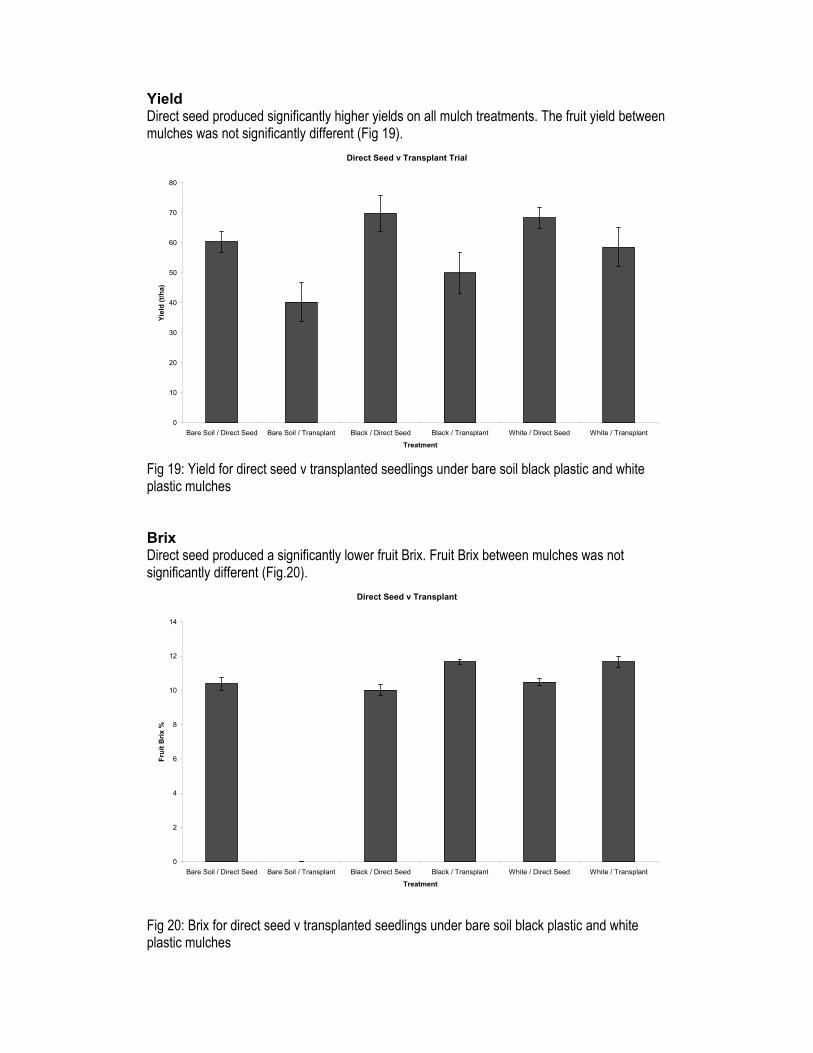
Yield Direct seed produced significantly higher yields on all mulch treatments. The fruit yield between mulches was not significantly different (Fig 19).
Direct Seed v Transplant Trial
0
10
20
30
40
50
60
70
80
Bare Soil / Direct Seed Bare Soil / Transplant Black / Direct Seed Black / Transplant White / Direct Seed White / Transplant
Treatment
Yiel
d (t/
ha)
Fig 19: Yield for direct seed v transplanted seedlings under bare soil black plastic and white plastic mulches Brix Direct seed produced a significantly lower fruit Brix. Fruit Brix between mulches was not significantly different (Fig.20).
Direct Seed v Transplant
0
2
4
6
8
10
12
14
Bare Soil / Direct Seed Bare Soil / Transplant Black / Direct Seed Black / Transplant White / Direct Seed White / Transplant
Treatment
Frui
t Brix
%
Fig 20: Brix for direct seed v transplanted seedlings under bare soil black plastic and white plastic mulches
29
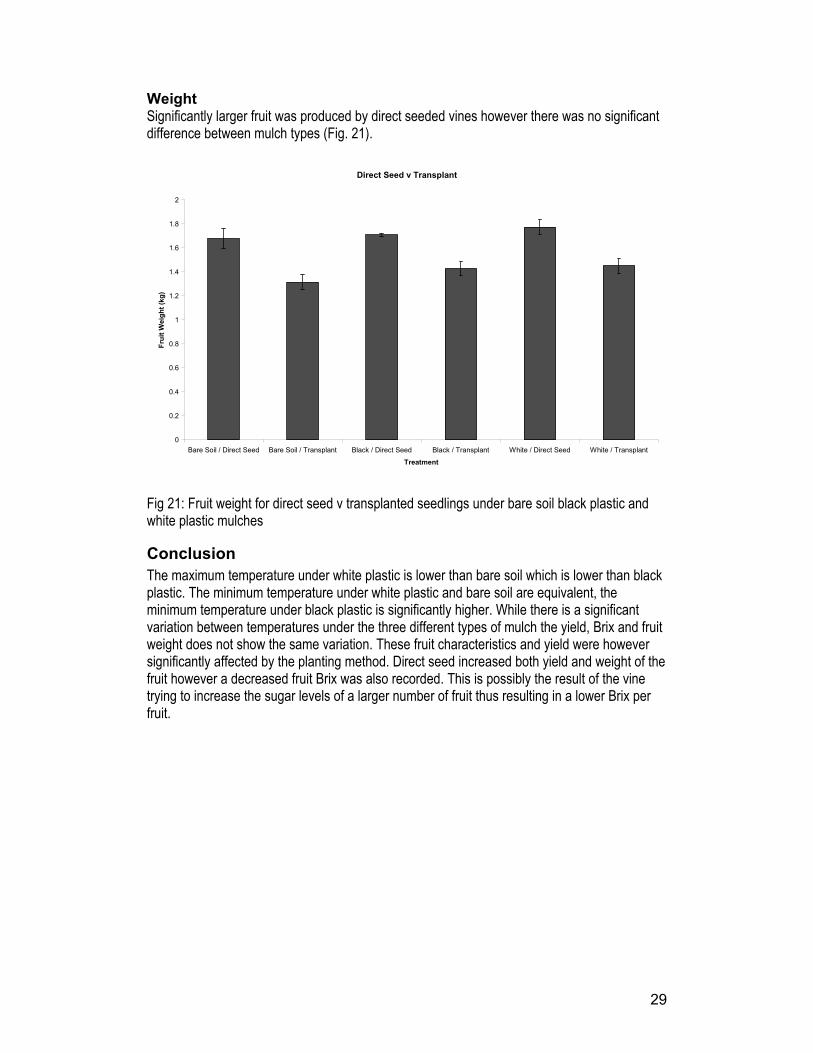
Weight Significantly larger fruit was produced by direct seeded vines however there was no significant difference between mulch types (Fig. 21).
Direct Seed v Transplant
0
0.2
0.4
0.6
0.8
1
1.2
1.4
1.6
1.8
2
Bare Soil / Direct Seed Bare Soil / Transplant Black / Direct Seed Black / Transplant White / Direct Seed White / Transplant
Treatment
Frui
t Wei
ght (
kg)
Fig 21: Fruit weight for direct seed v transplanted seedlings under bare soil black plastic and white plastic mulches
Conclusion The maximum temperature under white plastic is lower than bare soil which is lower than black plastic. The minimum temperature under white plastic and bare soil are equivalent, the minimum temperature under black plastic is significantly higher. While there is a significant variation between temperatures under the three different types of mulch the yield, Brix and fruit weight does not show the same variation. These fruit characteristics and yield were however significantly affected by the planting method. Direct seed increased both yield and weight of the fruit however a decreased fruit Brix was also recorded. This is possibly the result of the vine trying to increase the sugar levels of a larger number of fruit thus resulting in a lower Brix per fruit.
30
Trial Site 3: Laidley, Queensland – Paul Ziebarth Objective: No-Till Cucurbits
Introduction Winter cereals have been found to be suitable cover crop mulches for spring/summer vegetable production. Research conducted by AHR has found winter cereals such as Oats, Barley and Wheat provide excellent weed control during growth and form excellent mulch when rolled flat using a crimping roller. Cover crop mulches can reduce the level of fruit marking and ground rots relative to bare soil. Research in Rockmelon crops has shown that fruit marking and yield losses to ground rots was significantly lower in crops grown on cereal mulches than crops grown without mulch. However the effects of mulch on smooth skinned fruit such as watermelon and cucumber have yet to be evaluated.
Methods Cover Crop: Forage Oats @ ~ 350kg/ha Experimental Layout:
Roc
kmel
on
Roc
kmel
on
Wat
erm
elon
Wat
erm
elon
Wat
erm
elon
Roc
kmel
on
Whi
te
Cuc
umbe
r
Whi
te
Cuc
umbe
r
Gre
en
Cuc
umbe
r
Gre
en
Cuc
umbe
r
Zucc
hini
Zucc
hini
Row 1 Row 2 Row 3 Row 4 Row 5 Row 6 Row 7 Row 8 Row 9 Row 10 Row 11 Row 12 Rockmelon “Planters Jumbo” spaced at 50cm Watermelon “Red Tiger” spaced at 1m White Cucumber spaced at 30cm Green Cucumber spaced at 30cm Zucchini spaced at 50cm Beds were prepared with 2m centres consisting of 1.75m bed surface and 0.25m wheel tracks. The oat cover crop was broadcast sown by hand over the beds and wheel tracks and incorporated using rolling cultivators. The cover crop received subsurface irrigation to germinate the cover crop, and throughout the life cycle of the crop to promote biomass accumulation. The cover crop was sprayed once seed heads had formed with 4L/ha glyphosate and rolled using a rubber tyre roller. Crops were direct seeded by hand into moisture approximately two weeks after rolling. Base fertiliser was applied as a band 10cm to the side of the seed at approximately 125kg/ha. Overhead irrigation was applied to wash the fertiliser through the mulch and into the soil.
31
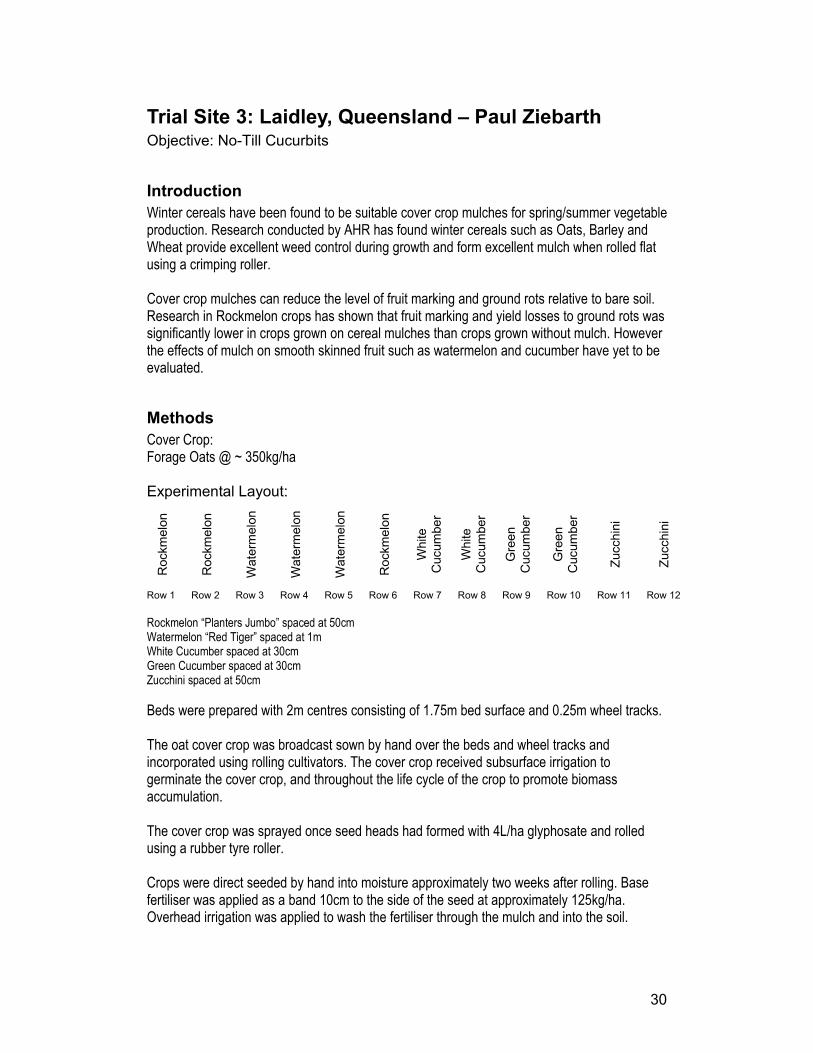
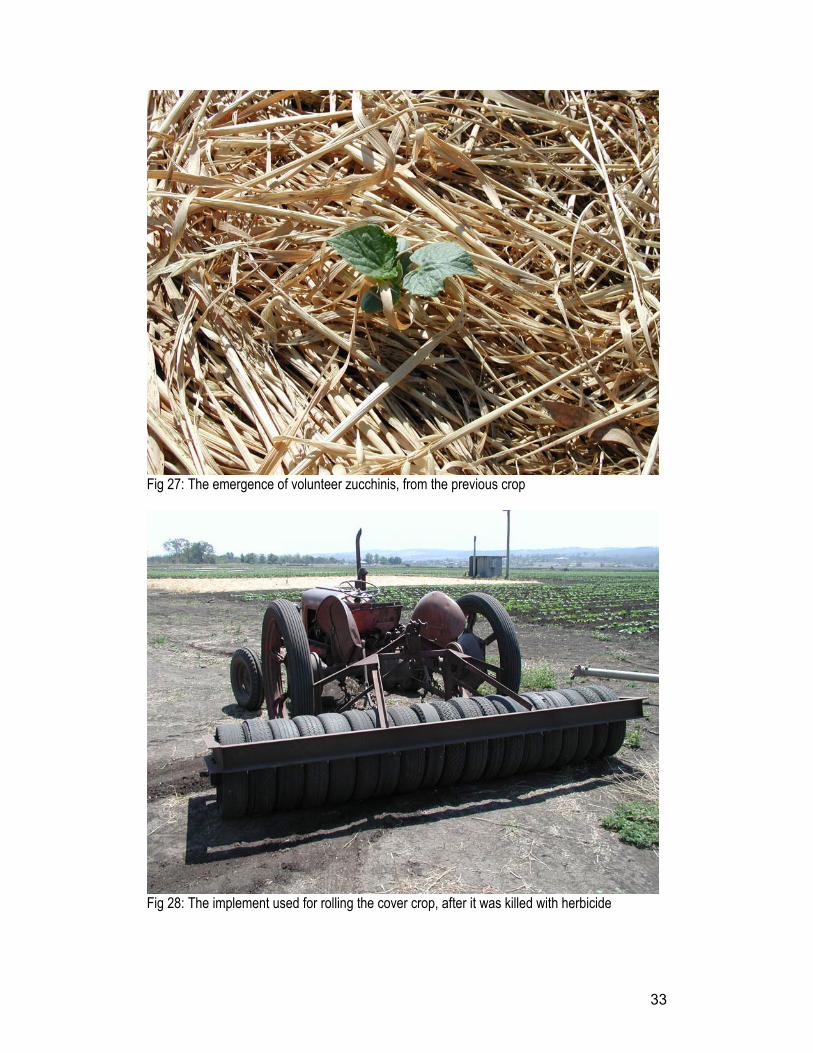
Results Cover crop growth was excellent and provided thick mulch when sprayed and rolled (Fig. 26 & 28). Cover crop kill was excellent with 100% kill achieved in one spray. In the weeks following cover crop kill, a number of volunteer cucumbers (Fig. 27) emerged through the mulch layer these were killed using Spray Seed prior to cucurbit establishment. Crop establishment was excellent for zucchini, rockmelon, watermelon and green cucumber; however no white cucumber plants emerged. The complete failure of the white cucumber to germinate was put down to unviable seed sourced from on-farm stock.
Fig. 22: Conventional zucchini production
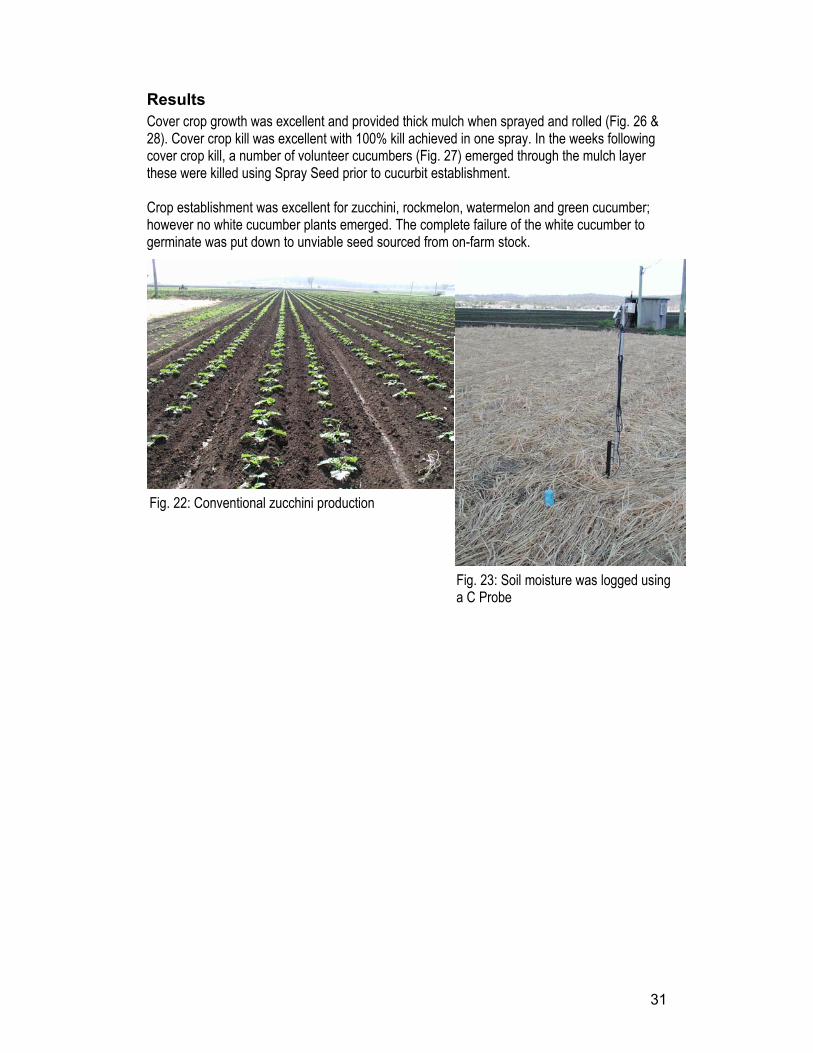
Fig. 23: Soil moisture was logged using a C Probe
32
Conclusion • Oats are a good winter cover crop for SE Queensland. • Oats sown at high sowing rates will form high quantities of mulch; however the nutrient and
water consumption of such a thick cover crop stand has not been assessed. • There did not appear to be any alleleopathic effects from the cover crop mulch on any of the
vegetable species planted.
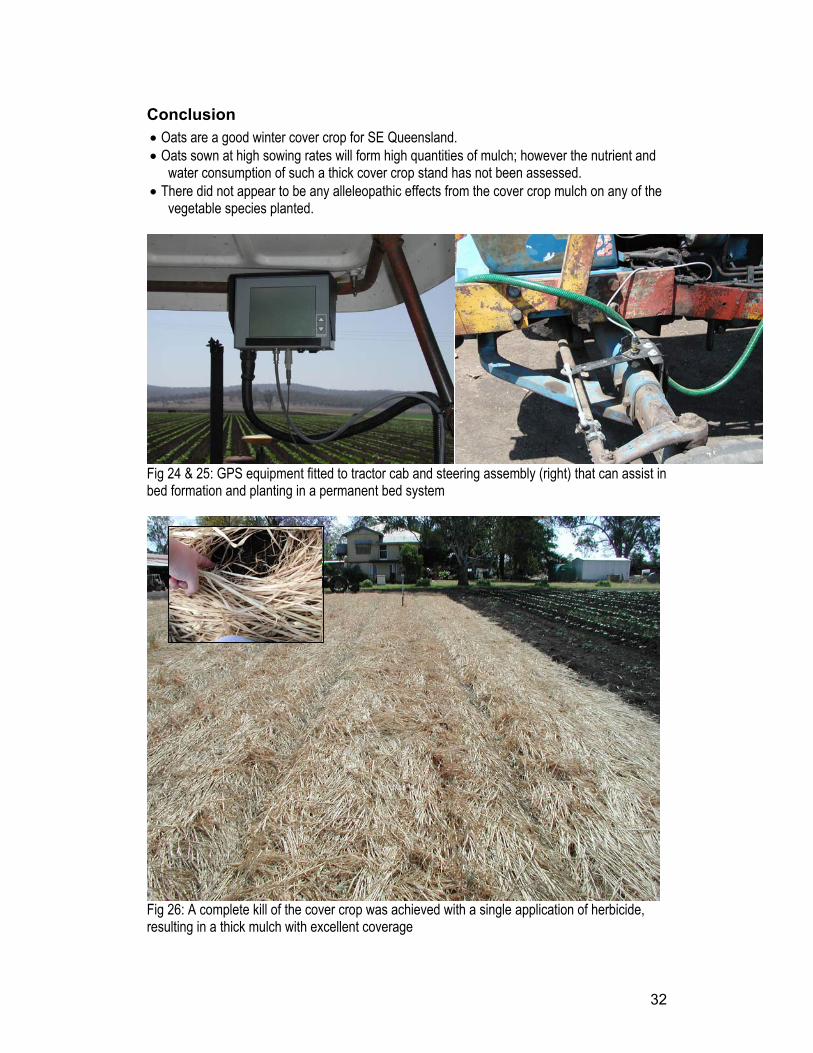
Fig 24 & 25: GPS equipment fitted to tractor cab and steering assembly (right) that can assist in bed formation and planting in a permanent bed system
Fig 26: A complete kill of the cover crop was achieved with a single application of herbicide, resulting in a thick mulch with excellent coverage
33
Fig 27: The emergence of volunteer zucchinis, from the previous crop
Fig 28: The implement used for rolling the cover crop, after it was killed with herbicide
34
Trial Site 3: Laidley, Queensland – Paul Ziebarth Objective: No-Till Tomatoes
Introduction The high intensity crop cycle of farms in the Lockyer Valley requires fast growing cover crops to fit into the small time gaps between crops. In the case of tomatoes grown in summer, a fast cover crop is required to grow over the cooler spring months following a winter vegetable crop. A cover crop of millet can provide rapid soil cover and biomass accumulation; research conducted by AHR has shown Shirohie and Japanese millet to be good spring/summer cover crop mulches in the Sydney basin. White French millet has been selected due to its availability and low cost per kilogram.
Methods Cover Crop: White French Millet @ 40kg/ha Experimental Layout:
Commercial Tomato Crop Area
Bare Soil Control Area
The system used combines permanent sub-surface irrigation, GPS guidance to maintain permanent wheel tracks, a fast growing cover crop of white french millet to form a mulch, and a biological approach to plant nutrition. Beds and irrigation were set up over the previous winter, GPS guidance was used to form the beds which are 2m wide but only around 20cm high a crop of bare soil cucumbers was grown over the summer of 2001/2. The beds were then reformed using only a bedformer and left to fallow over the winter of 2002 during which conditions were very dry, this allowed the bed to settle and firm prior to the establishment of the millet cover crop. White french millet was chosen as a cover crop because of its quick growing nature and suitability to the spring growing conditions applicable to the trial site, it was originally broadcast at 40kg/ha and lightly incorporated using diamond harrows followed by a rubber tyre roller. Prior to establishment, the site received 20mm of rainfall which washed a large portion of the millet seed into the drains resulting in a cover crop approximate to around 20kg/ha of millet seed. Later plantings of white millet were established by broadcasting millet, working to 1"
35
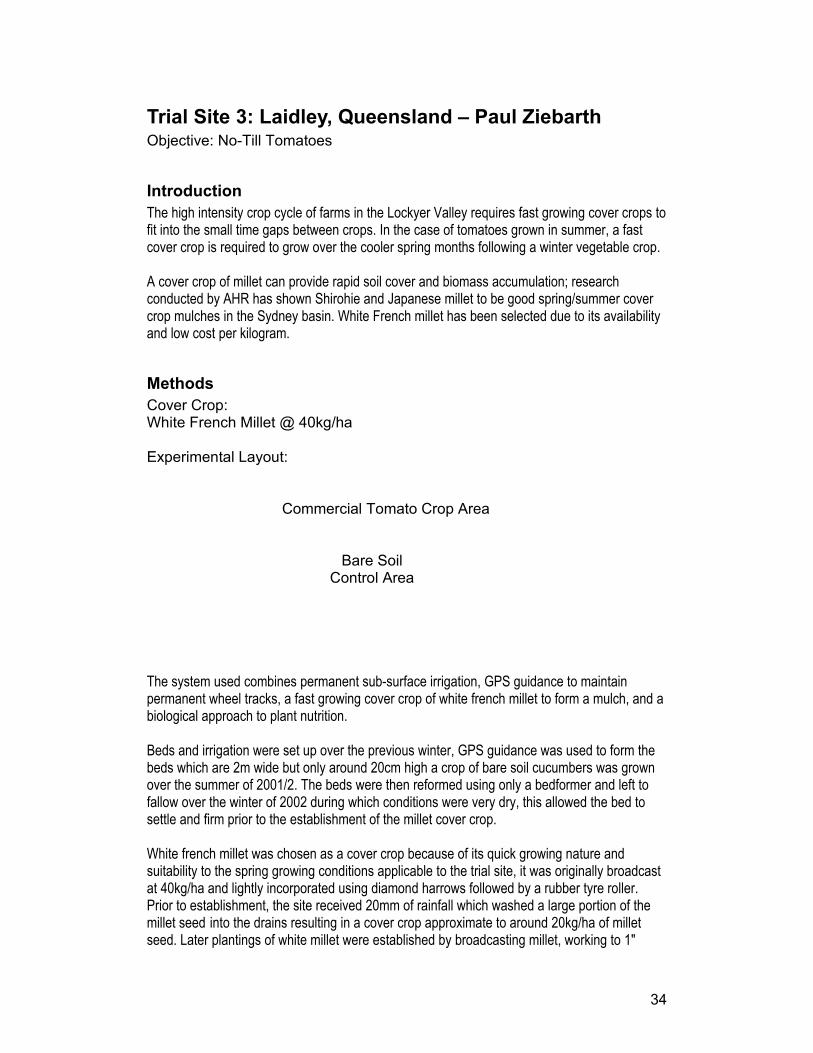
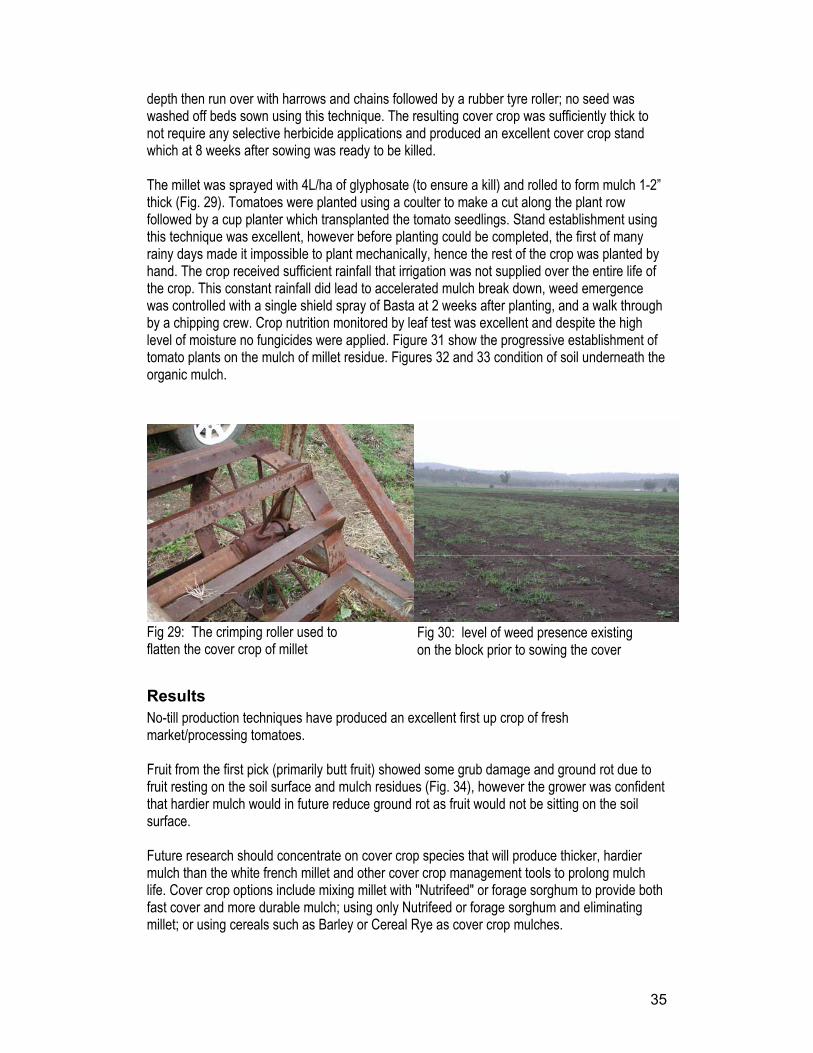
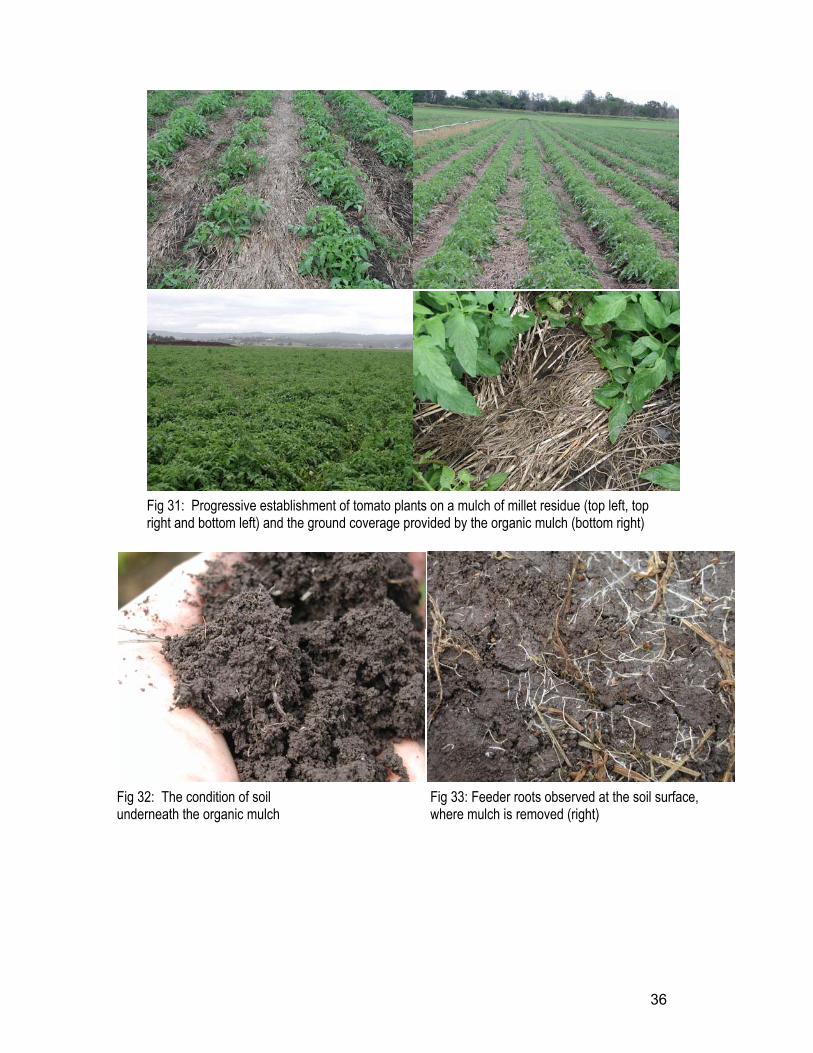
depth then run over with harrows and chains followed by a rubber tyre roller; no seed was washed off beds sown using this technique. The resulting cover crop was sufficiently thick to not require any selective herbicide applications and produced an excellent cover crop stand which at 8 weeks after sowing was ready to be killed. The millet was sprayed with 4L/ha of glyphosate (to ensure a kill) and rolled to form mulch 1-2” thick (Fig. 29). Tomatoes were planted using a coulter to make a cut along the plant row followed by a cup planter which transplanted the tomato seedlings. Stand establishment using this technique was excellent, however before planting could be completed, the first of many rainy days made it impossible to plant mechanically, hence the rest of the crop was planted by hand. The crop received sufficient rainfall that irrigation was not supplied over the entire life of the crop. This constant rainfall did lead to accelerated mulch break down, weed emergence was controlled with a single shield spray of Basta at 2 weeks after planting, and a walk through by a chipping crew. Crop nutrition monitored by leaf test was excellent and despite the high level of moisture no fungicides were applied. Figure 31 show the progressive establishment of tomato plants on the mulch of millet residue. Figures 32 and 33 condition of soil underneath the organic mulch.
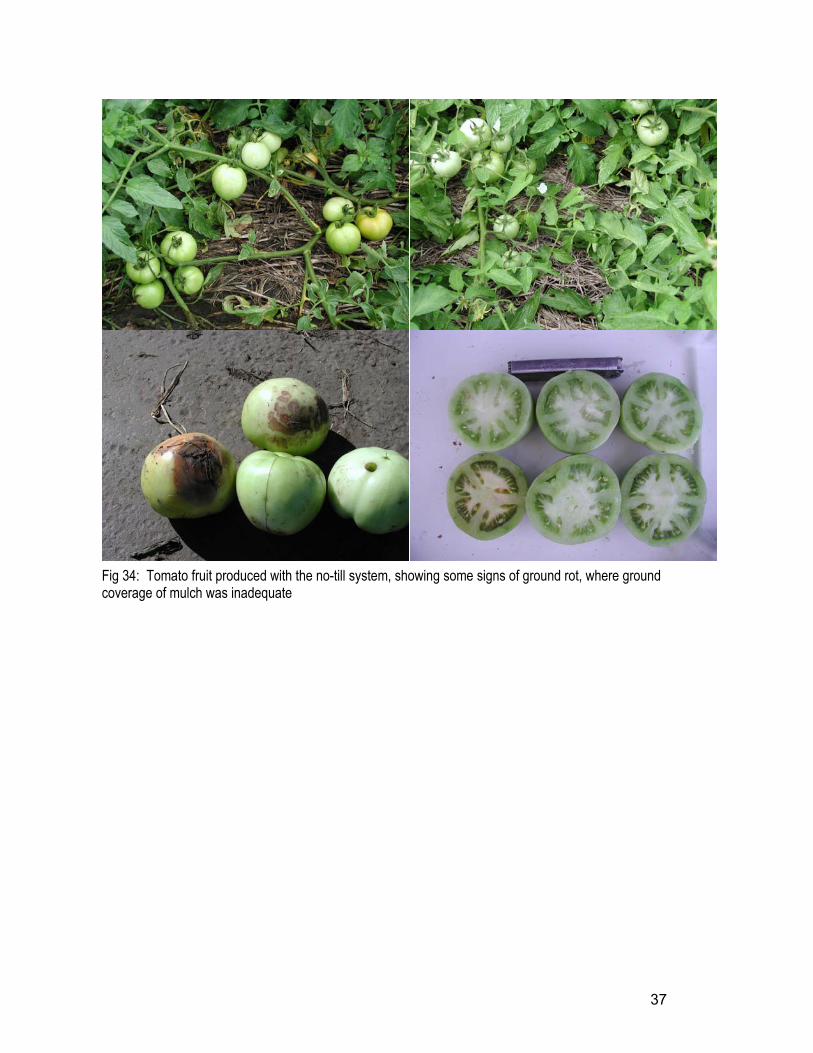
Results No-till production techniques have produced an excellent first up crop of fresh market/processing tomatoes. Fruit from the first pick (primarily butt fruit) showed some grub damage and ground rot due to fruit resting on the soil surface and mulch residues (Fig. 34), however the grower was confident that hardier mulch would in future reduce ground rot as fruit would not be sitting on the soil surface. Future research should concentrate on cover crop species that will produce thicker, hardier mulch than the white french millet and other cover crop management tools to prolong mulch life. Cover crop options include mixing millet with "Nutrifeed" or forage sorghum to provide both fast cover and more durable mulch; using only Nutrifeed or forage sorghum and eliminating millet; or using cereals such as Barley or Cereal Rye as cover crop mulches.
Fig 30: level of weed presence existing on the block prior to sowing the cover
Fig 29: The crimping roller used to flatten the cover crop of millet
36
Fig 31: Progressive establishment of tomato plants on a mulch of millet residue (top left, top right and bottom left) and the ground coverage provided by the organic mulch (bottom right)
Fig 33: Feeder roots observed at the soil surface, where mulch is removed (right)
Fig 32: The condition of soil underneath the organic mulch
37
Fig 34: Tomato fruit produced with the no-till system, showing some signs of ground rot, where ground coverage of mulch was inadequate
Trial Site 4: Wemen, Victoria – Andrew Young Objective: No-Till Seedless Watermelon
Andrew Young Trials 2002-2003
Introduction Winter cereals have been found to be suitable cover crop mulches for spring/summer vegetable production. Research conducted by AHR has found winter cereals such as Oats, Barley and Wheat provide excellent weed control during growth and form excellent mulch when rolled flat using a crimping roller. Other winter cereals have the same characteristics to Wheat, Oats and Barley which make them potential cover crop species. Cereal rye has been used as cover crop mulch in no-till research in Tasmania whilst triticale is a cross between cereal rye and wheat with cover crop potential. Hairy vetch is commonly used in US no-till systems as a legume cover crop that also provides sufficient mulch for tomato and other vegetable crops. A preliminary investigation was conducted to evaluate the potential of common vetch varieties as a cover crop mulch species in Australia. Common vetch is being investigated due to practical difficulties in using hairy vetch in Australia. Combination cover crops of cereal plus legumes (such as lupin, field pea, or chickpea may increase soil nitrogen through nitrogen fixation. Any Nitrogen fixed by the cover crop helps to balance out any nutrient draw down that may occur once the cover crop mulch begins to break down. Similarly, combination cover crops of cereals plus biofumigant mustards may provide some pest and disease suppression whilst still providing a suitable mulch. Research in Rockmelon crops has shown that fruit marking and yield losses to ground rots was significantly lower in crops grown on cereal mulches than crops grown without mulch. However the effects of mulch on smooth skinned fruit such as watermelon and comparisons between cover crop mulch and plastic mulch have not yet been investigated.
39
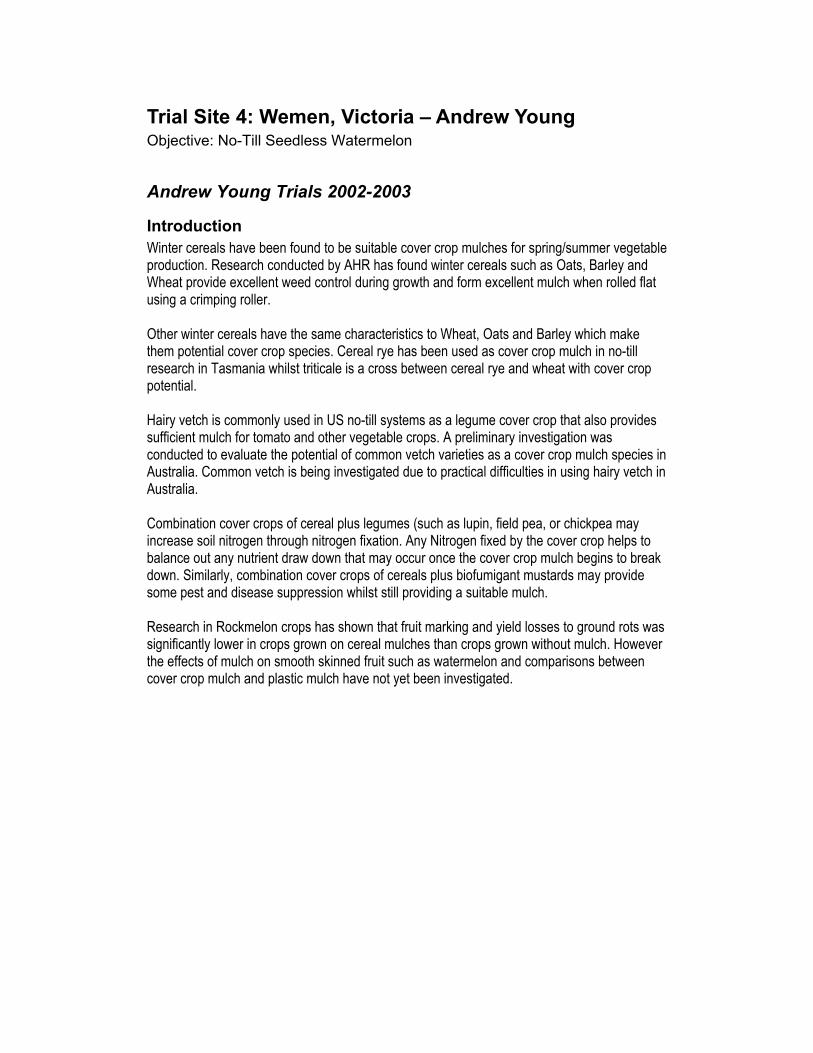
Methods Cover Crops: Barley "Schooner" @ 150kg/ha Oats "Graza" @ 150kg/ha Cereal Rye @ 150kg/ha Wheat "Chara" @ 150kg/ha Triticale @ 150kg/ha “Fumus” (Mustard) @ 8kg/ha and 5kg/ha in combination Vetch (unknown) @ 60kg/ha Yellow Lupin (unknown) @ 130kg/ha and 50kg/ha in combination Vetch "Capello" @ 60 kg/ha Field Pea "Dundale" @ 50kg/ha in combination Chick Pea "Kabuli" @ 50kg/ha in combination Experimental Layout: Commercial Trial Layout
10m20m30m40m50m60m70m80m90m
100m110m120m130m140m Row 4 Row 5 Row 6150m Row 4 Row 5 Row 6 Row 7 Row 8 Row 9 Row 1 Row 2 Row 3
Row 1 Row 2 Row 3
C Rye + Chick Pea Wheat + Chick Pea Trit + Chick Pea
Wheat
Cereal Rye + Field Pea Wheat + Field Pea Triticale + Field Pea
Triticale + Late Fumus
Triticale + Lupin
Wheat TriticaleBarley + Late Fumus Oats + Late Fumus Cereal Rye + Late Fumus Wheat + Late Fumus
Barley + Lupin Oats + Lupin Cereal Rye + Lupin Wheat + Lupin
Oats + Field Pea
Oats
Triticale
Triticale
Oats
Cereal RyeOats
Oats + Chick Pea
Oats Cereal Rye
Cereal Rye
Wheat
Bay 2aBay 2b
Bay 1aBay 1b Bay 1c
BarleyOats
Barley
Barley
BarleyBarley + Chick Pea
Barley + Field Pea
Barley
Cereal Rye
Triticale
Triticale
Wheat
Wheat
Cereal Rye
Cover Crop Trial Layout 10m20m30m40m50m60m70m80m90m
100m110m120m130m Row 7 Row 8 Row 9 Row 1 Row 2 Row 3140m150m
Vetch "Capello"
Bay 3b - 3cBay 3a
Vetch
Fumus
Barley
Bay 2c
Lupin
Cover crops were sown using an air seeder planting 6 drills per bed and two drills per wheel track. Cover crops received overhead irrigation to assist with establishment. Cover crops did not produce high biomass prior to seed heads forming, seed was allowed to mature and cover crops allowed to senesce naturally. Seed heads were removed using a flail mulcher.
40
The remaining cover crop stubble would not roll flat using a smooth roller and other research conducted (see trial site 4) indicates that the crimping roller is ineffective at rolling dry cover crop material.
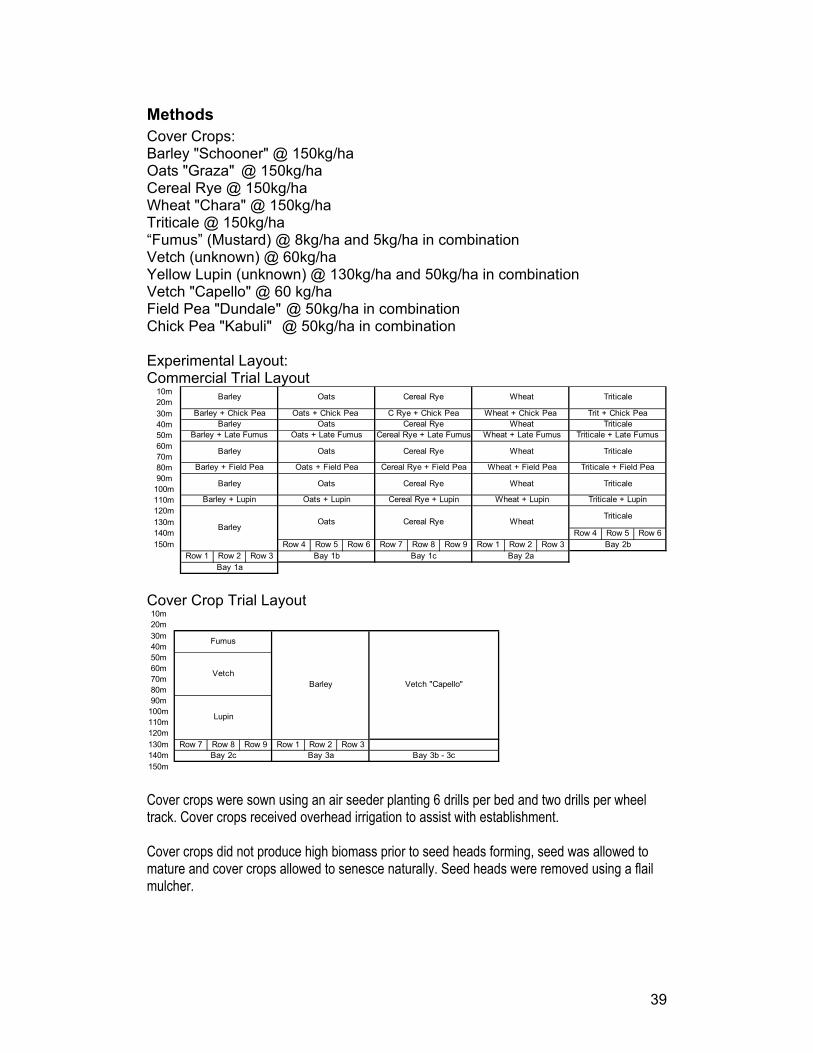
Results Only the cereal cover crops established well; chickpea, lupin, field pea and 'Fumus' (a biofumigant mustard) did not establish. Once established, the cereal cover crops did not produce high levels of biomass due to cool conditions and the resulting change in plant development towards grain production. Plants were then left to grow for as long as possible to accumulate maximum biomass which led to seed becoming mature. At this stage it was decided that seed heads would be mulched off to reduce weed potential, and the remaining stubble used as mulch. Several attempts to roll the stubble proved unsuccessful, residues were too dry to roll and when slashed did not provide sufficient cover. The stubble was eventually rolled flat using heavy equipment, which in turn compacted the soil surface. Once the stubble was finally rolled, watermelon seedlings were hand planted through the residues for a late crop. Watermelons did not grow well under the stubble mulch and were significantly slower growing than conventionally grown plants of the same age. The trial was abandoned as melon harvest became increasingly unlikely due to the late planting, cooler weather conditions, and slow melon growth.
Fig 35: A stand of barley (left) used as mulch to support watermelon growth (right)
41
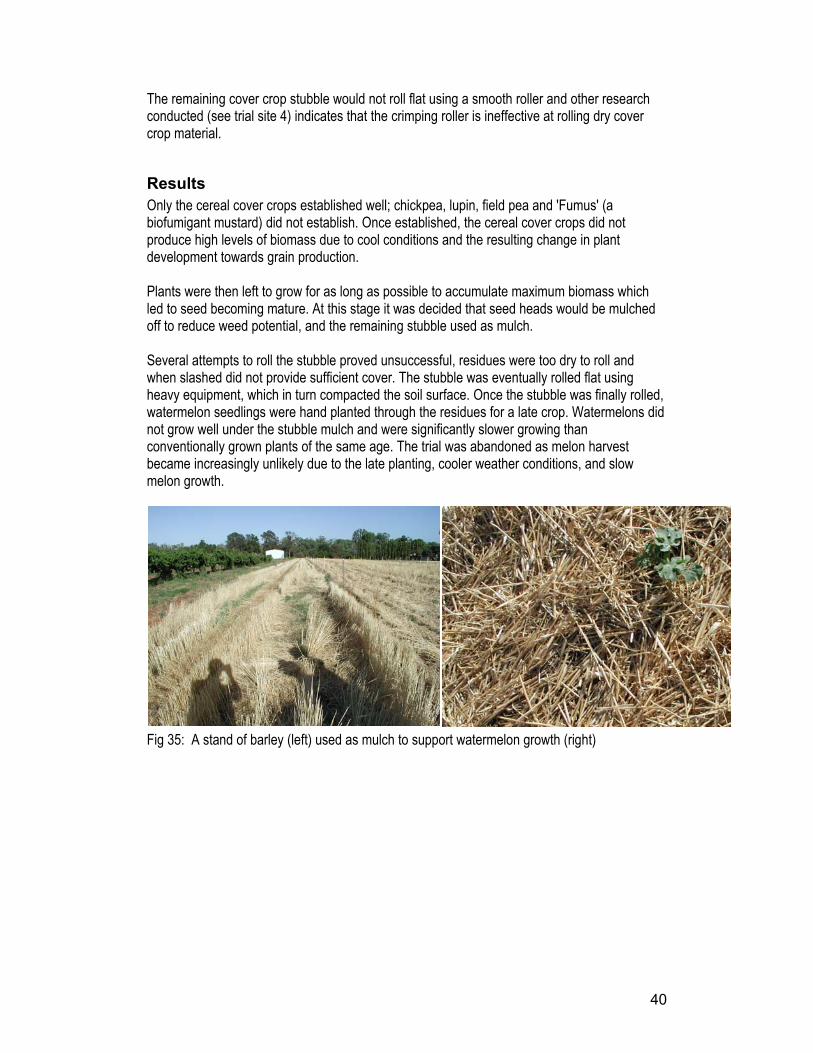
Fig 36: Trial plot with oats as a cover crop Fig 37: watermelon seedlings shown
after being directly planted into the mulch (right)
Fig 38 & 39: Experimental cover crops for watermelon production: cereal rye (left) and yellow lupin (right)
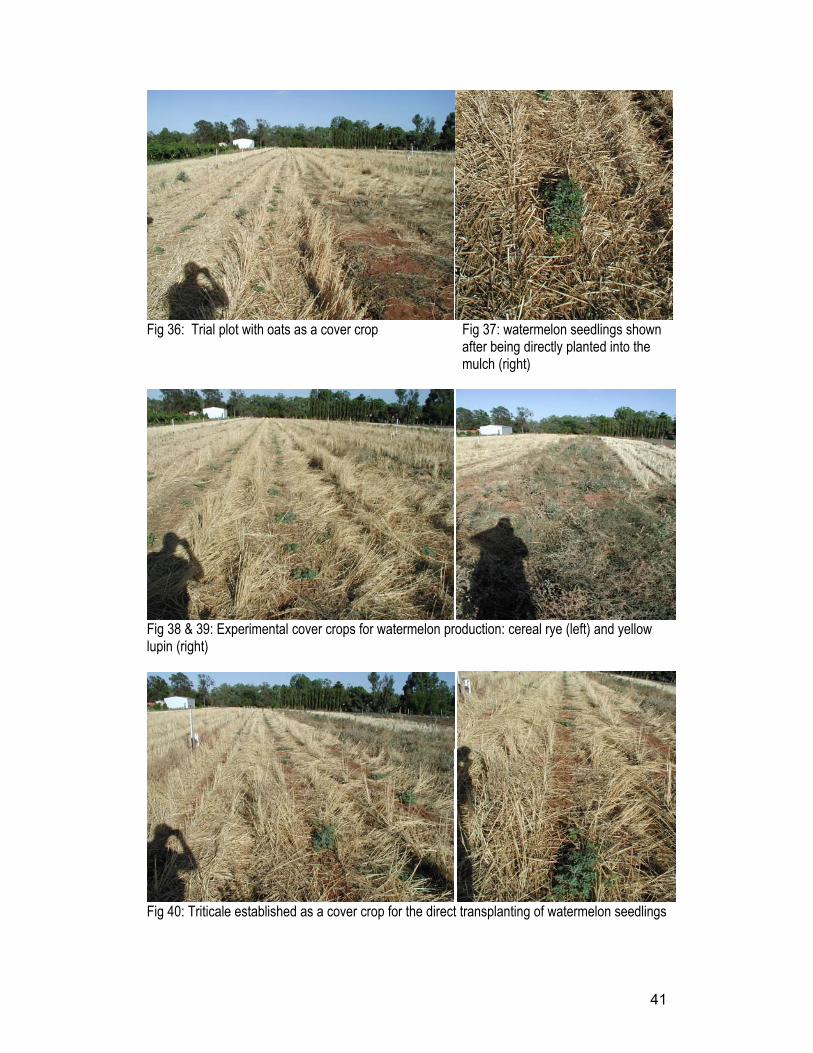
Fig 40: Triticale established as a cover crop for the direct transplanting of watermelon seedlings

42
Conclusion The trials at Robinvale show that cover crop species to be planted in late winter need to be carefully considered to avoid seed set. Forage crops, spring varieties or plant growth regulators may need to be considered to prevent plants from going to head following a cold stress. Furthermore, if cover crops do set seed, it is best to avoid seed maturity by killing cover crops at milky seed stage at the latest, regardless of the amount of biomass present. Once the cover crop is killed and lying flat, strategies such as the use of pre-emergent sprays or importing mulch can be considered to prevent weed emergence. Do not allow cover crops to die before they can be rolled. As shown in this and other trials, rolling cover crop residues after they have died and dried out is very difficult.
43
Andrew Young Trials 2003-2004
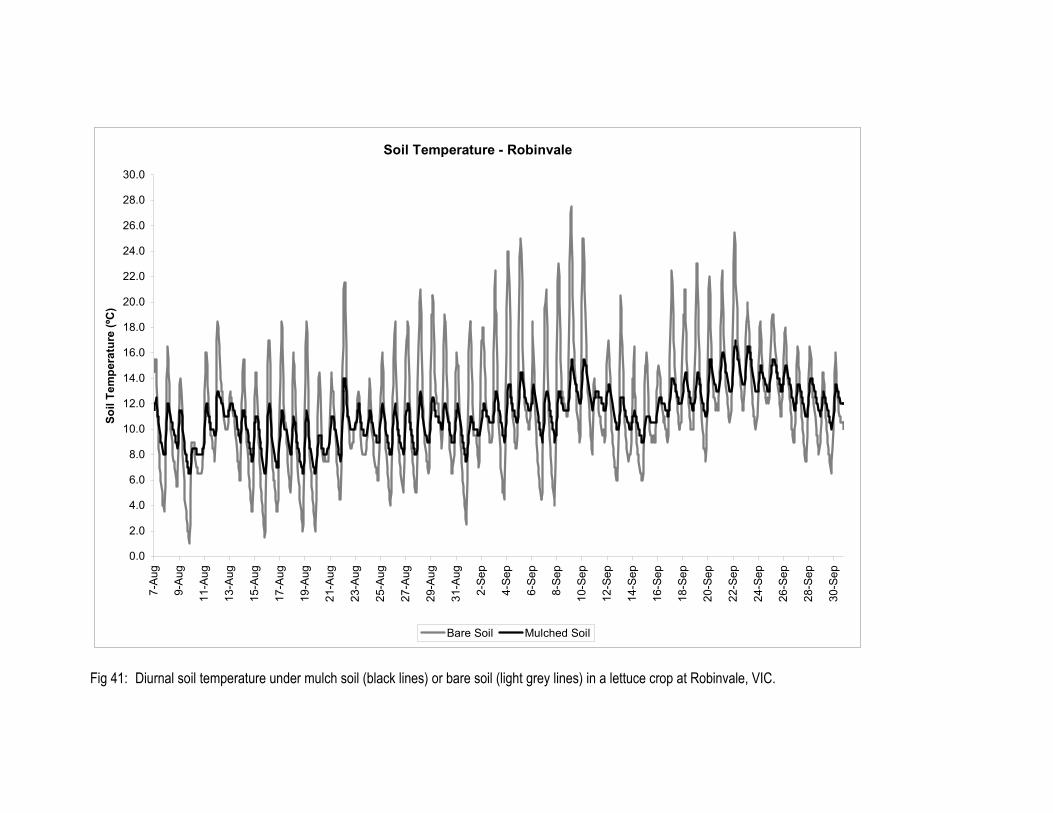
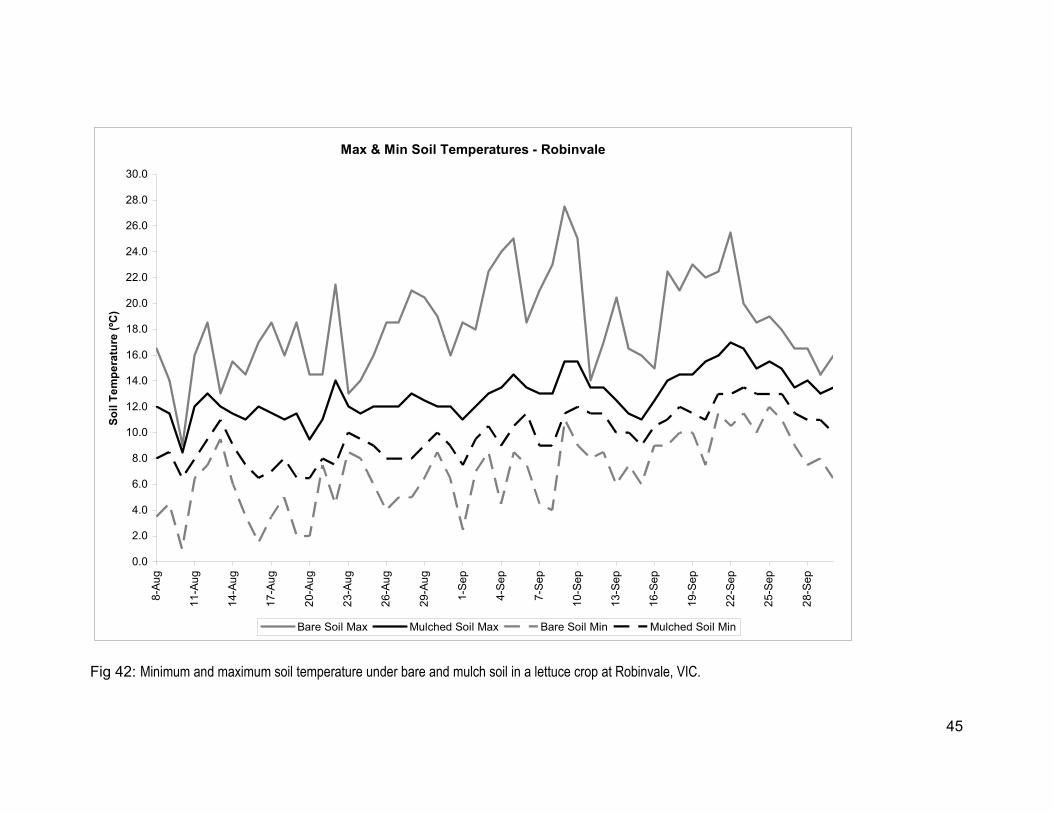
Methods Cover crops established for a 2004 watermelon crop were again planted to late in the season. Delays in spraying and preparing the trial site for cover crop establishment postponed cover crop establishment until early August however the trial went ahead sowing forage oats, barley and “Capello” vetch as well as combination crops of vetch plus barley and vetch plus oats. Once again cover crops were sown in 6 drills per bed and one drill per drain. Following the mulching of the previous cover crops, white French millet will be sown in the trial area and killed prior to establishing a lettuce crop in 2004. This follows a small scale trial conducted in August-September investigating soil temperatures under bare soil and organic mulch. The soil temperature investigation was conducted to investigate soil temperatures under bare soil and organic mulch during lettuce production in the cooler months (Fig 41 & 42). Soil temperature loggers were buried 2cm below the surface in two locations: one location was left bare and planted to iceberg lettuce; the other was planted to Iceberg lettuce then the surface covered with a 1cm layer of recently cut wheat straw. The temperature loggers were programmed to collect soil temperature data every hour for the duration of the crop.
Results Cover crops established well, however once again the cool conditions did not support growth of either the cereal or legume cover crops. Oat caver crops grew to 50-60cm high and barley grew to 70-80cm whilst Capello vetch grew to 10-20cm high up to the third week in November. Cover crops were sprayed off and mulched in an attempt to build up organic matter.
Soil Temperature - Robinvale
0.0
2.0
4.0
6.0
8.0
10.0
12.0
14.0
16.0
18.0
20.0
22.0
24.0
26.0
28.0
30.0
7-Au
g
9-Au
g
11-A
ug
13-A
ug
15-A
ug
17-A
ug
19-A
ug
21-A
ug
23-A
ug
25-A
ug
27-A
ug
29-A
ug
31-A
ug
2-Se
p
4-Se
p
6-Se
p
8-Se
p
10-S
ep
12-S
ep
14-S
ep
16-S
ep
18-S
ep
20-S
ep
22-S
ep
24-S
ep
26-S
ep
28-S
ep
30-S
ep
Soil
Tem
pera
ture
(ºC
)
Bare Soil Mulched Soil
Fig 41: Diurnal soil temperature under mulch soil (black lines) or bare soil (light grey lines) in a lettuce crop at Robinvale, VIC.
45
Max & Min Soil Temperatures - Robinvale
0.0
2.0
4.0
6.0
8.0
10.0
12.0
14.0
16.0
18.0
20.0
22.0
24.0
26.0
28.0
30.08-
Aug
11-A
ug
14-A
ug
17-A
ug
20-A
ug
23-A
ug
26-A
ug
29-A
ug
1-Se
p
4-Se
p
7-Se
p
10-S
ep
13-S
ep
16-S
ep
19-S
ep
22-S
ep
25-S
ep
28-S
ep
Soil
Tem
pera
ture
(ºC
)
Bare Soil Max Mulched Soil Max Bare Soil Min Mulched Soil Min
Fig 42: Minimum and maximum soil temperature under bare and mulch soil in a lettuce crop at Robinvale, VIC.
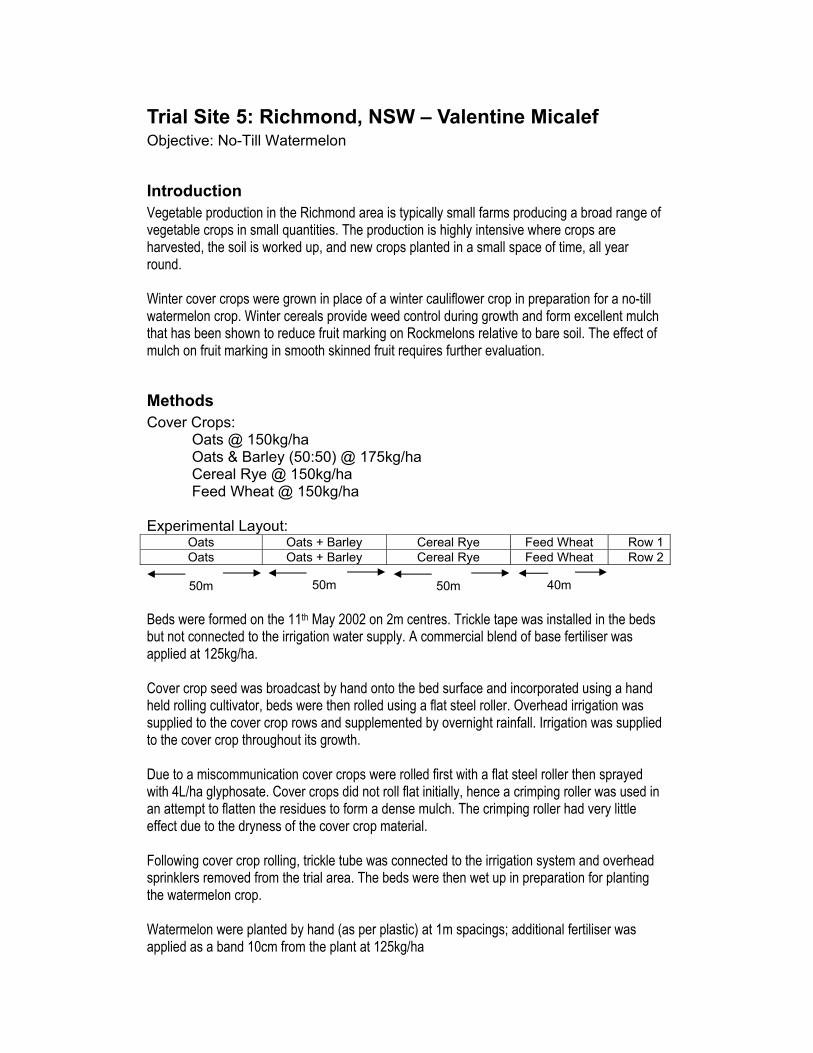
Trial Site 5: Richmond, NSW – Valentine Micalef Objective: No-Till Watermelon
Introduction Vegetable production in the Richmond area is typically small farms producing a broad range of vegetable crops in small quantities. The production is highly intensive where crops are harvested, the soil is worked up, and new crops planted in a small space of time, all year round. Winter cover crops were grown in place of a winter cauliflower crop in preparation for a no-till watermelon crop. Winter cereals provide weed control during growth and form excellent mulch that has been shown to reduce fruit marking on Rockmelons relative to bare soil. The effect of mulch on fruit marking in smooth skinned fruit requires further evaluation.
Methods Cover Crops:
Oats @ 150kg/ha Oats & Barley (50:50) @ 175kg/ha Cereal Rye @ 150kg/ha Feed Wheat @ 150kg/ha
Experimental Layout:
Oats Oats + Barley Cereal Rye Feed Wheat Row 1Oats Oats + Barley Cereal Rye Feed Wheat Row 2
50m 50m 50m 40m
Beds were formed on the 11th May 2002 on 2m centres. Trickle tape was installed in the beds but not connected to the irrigation water supply. A commercial blend of base fertiliser was applied at 125kg/ha. Cover crop seed was broadcast by hand onto the bed surface and incorporated using a hand held rolling cultivator, beds were then rolled using a flat steel roller. Overhead irrigation was supplied to the cover crop rows and supplemented by overnight rainfall. Irrigation was supplied to the cover crop throughout its growth. Due to a miscommunication cover crops were rolled first with a flat steel roller then sprayed with 4L/ha glyphosate. Cover crops did not roll flat initially, hence a crimping roller was used in an attempt to flatten the residues to form a dense mulch. The crimping roller had very little effect due to the dryness of the cover crop material. Following cover crop rolling, trickle tube was connected to the irrigation system and overhead sprinklers removed from the trial area. The beds were then wet up in preparation for planting the watermelon crop. Watermelon were planted by hand (as per plastic) at 1m spacings; additional fertiliser was applied as a band 10cm from the plant at 125kg/ha
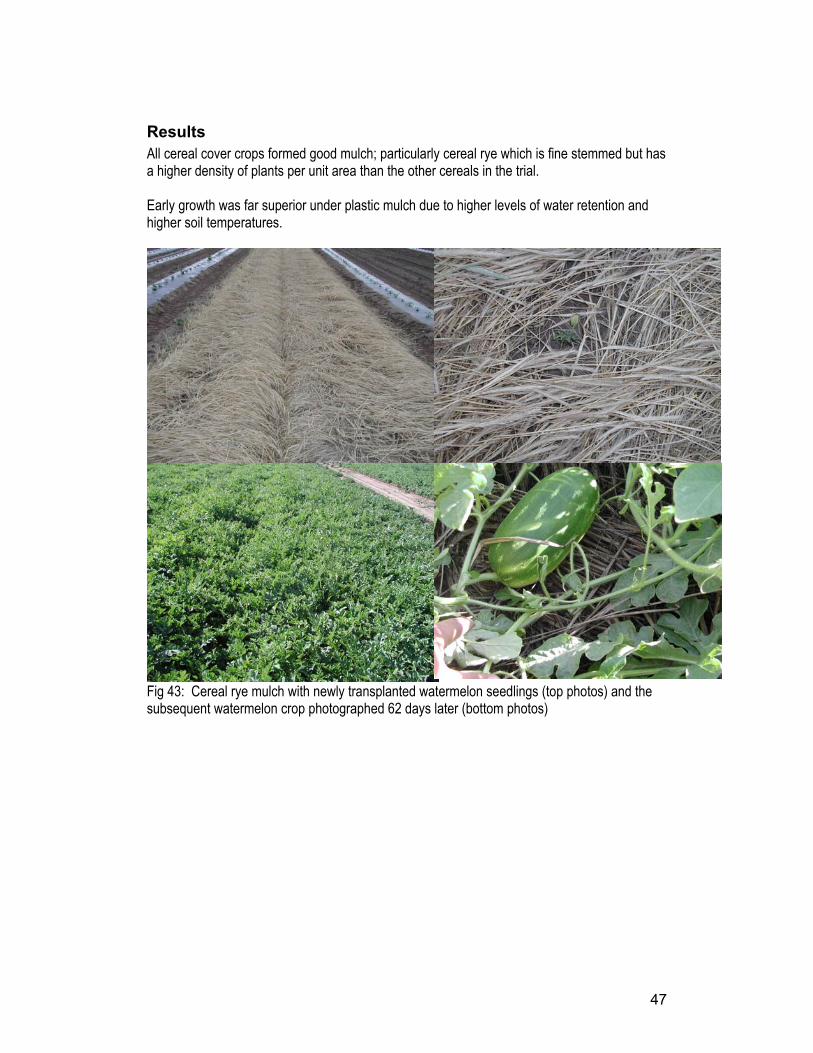
47
Results All cereal cover crops formed good mulch; particularly cereal rye which is fine stemmed but has a higher density of plants per unit area than the other cereals in the trial. Early growth was far superior under plastic mulch due to higher levels of water retention and higher soil temperatures.
Fig 43: Cereal rye mulch with newly transplanted watermelon seedlings (top photos) and the subsequent watermelon crop photographed 62 days later (bottom photos)
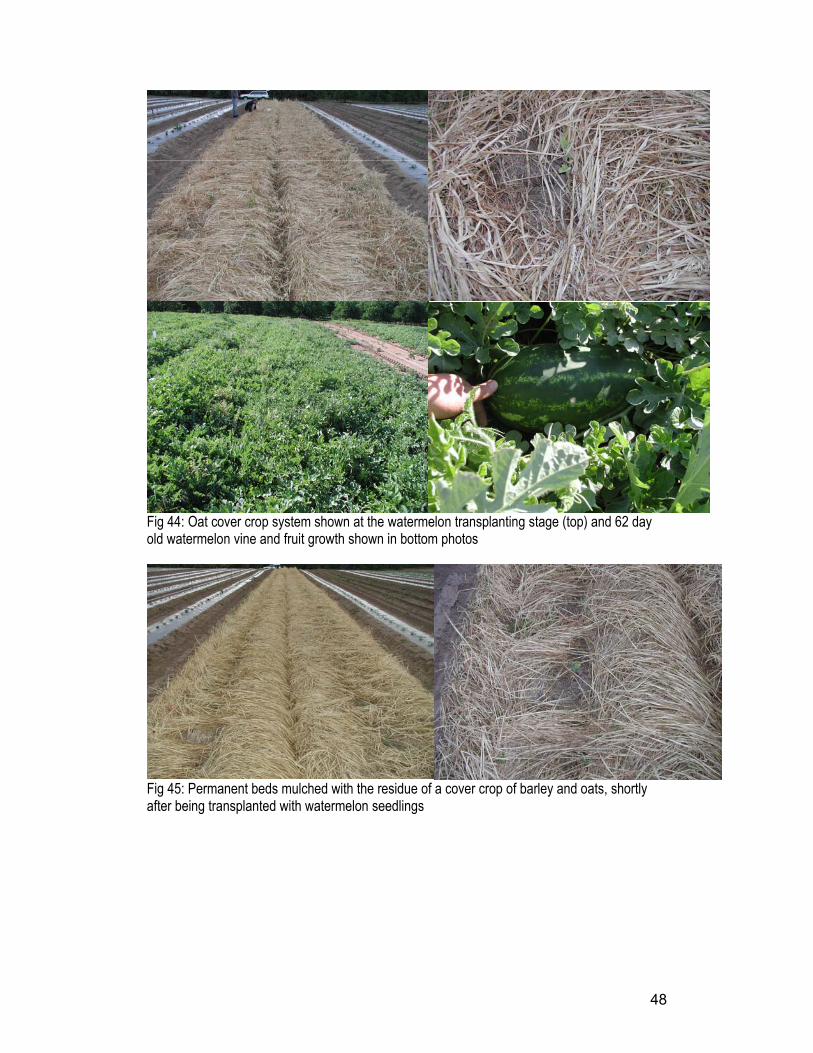
48
Fig 44: Oat cover crop system shown at the watermelon transplanting stage (top) and 62 day old watermelon vine and fruit growth shown in bottom photos
Fig 45: Permanent beds mulched with the residue of a cover crop of barley and oats, shortly after being transplanted with watermelon seedlings
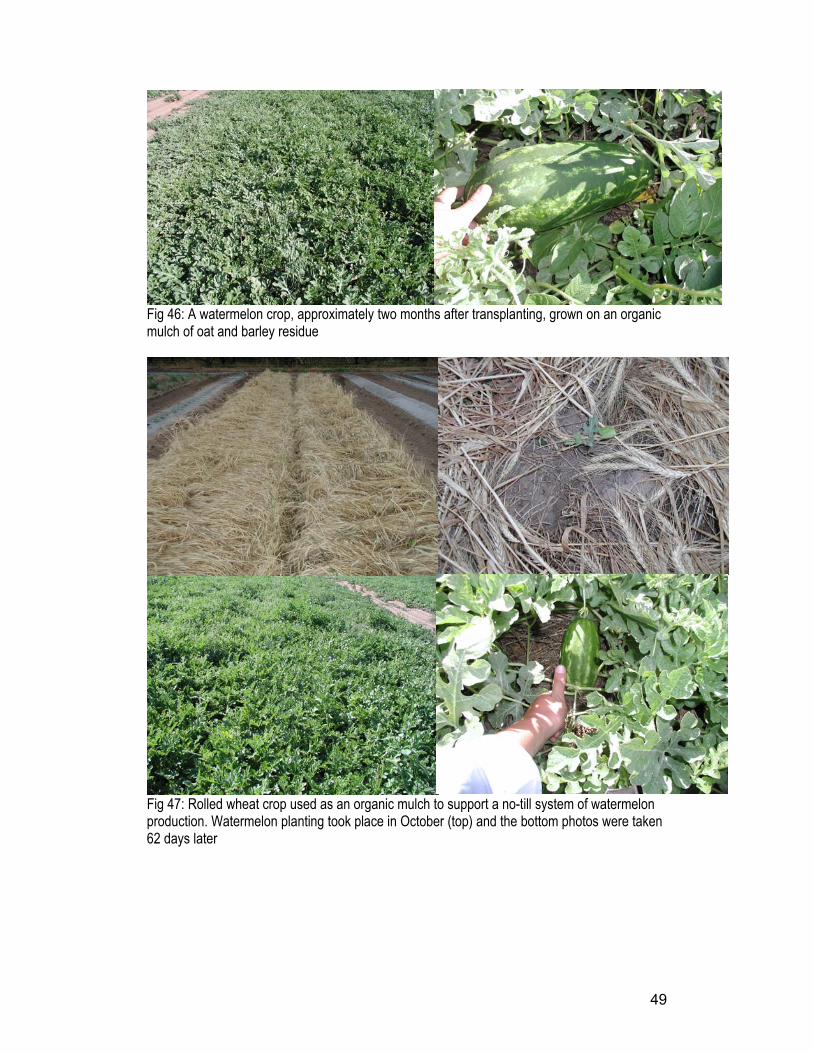
49
Fig 46: A watermelon crop, approximately two months after transplanting, grown on an organic mulch of oat and barley residue
Fig 47: Rolled wheat crop used as an organic mulch to support a no-till system of watermelon production. Watermelon planting took place in October (top) and the bottom photos were taken 62 days later
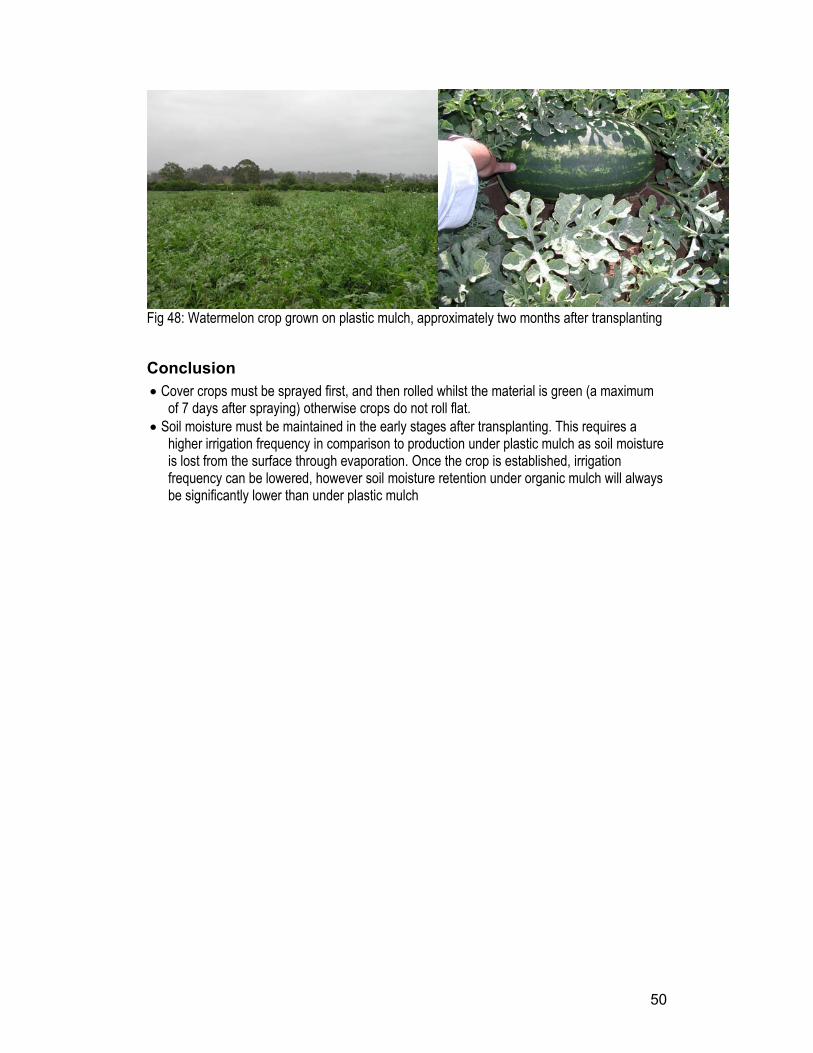
50
Fig 48: Watermelon crop grown on plastic mulch, approximately two months after transplanting
Conclusion • Cover crops must be sprayed first, and then rolled whilst the material is green (a maximum
of 7 days after spraying) otherwise crops do not roll flat. • Soil moisture must be maintained in the early stages after transplanting. This requires a
higher irrigation frequency in comparison to production under plastic mulch as soil moisture is lost from the surface through evaporation. Once the crop is established, irrigation frequency can be lowered, however soil moisture retention under organic mulch will always be significantly lower than under plastic mulch
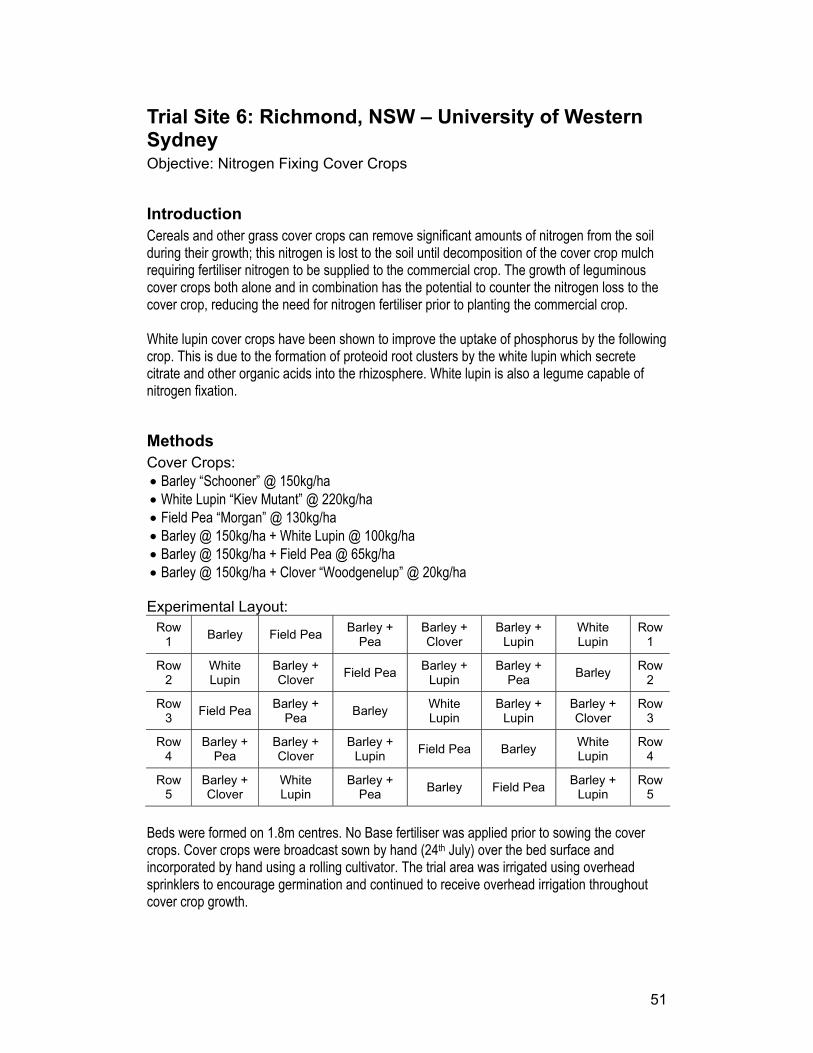
51
Trial Site 6: Richmond, NSW – University of Western Sydney Objective: Nitrogen Fixing Cover Crops
Introduction Cereals and other grass cover crops can remove significant amounts of nitrogen from the soil during their growth; this nitrogen is lost to the soil until decomposition of the cover crop mulch requiring fertiliser nitrogen to be supplied to the commercial crop. The growth of leguminous cover crops both alone and in combination has the potential to counter the nitrogen loss to the cover crop, reducing the need for nitrogen fertiliser prior to planting the commercial crop. White lupin cover crops have been shown to improve the uptake of phosphorus by the following crop. This is due to the formation of proteoid root clusters by the white lupin which secrete citrate and other organic acids into the rhizosphere. White lupin is also a legume capable of nitrogen fixation.
Methods Cover Crops: • Barley “Schooner” @ 150kg/ha • White Lupin “Kiev Mutant” @ 220kg/ha • Field Pea “Morgan” @ 130kg/ha • Barley @ 150kg/ha + White Lupin @ 100kg/ha • Barley @ 150kg/ha + Field Pea @ 65kg/ha • Barley @ 150kg/ha + Clover “Woodgenelup” @ 20kg/ha Experimental Layout:
Row 1 Barley Field Pea Barley +
Pea Barley + Clover
Barley + Lupin
White Lupin
Row 1
Row 2
White Lupin
Barley + Clover Field Pea Barley +
Lupin Barley +
Pea Barley Row 2
Row 3 Field Pea Barley +
Pea Barley White Lupin
Barley + Lupin
Barley + Clover
Row 3
Row 4
Barley + Pea
Barley + Clover
Barley + Lupin Field Pea Barley White
Lupin Row
4
Row 5
Barley + Clover
White Lupin
Barley + Pea Barley Field Pea Barley +
Lupin Row
5
Beds were formed on 1.8m centres. No Base fertiliser was applied prior to sowing the cover crops. Cover crops were broadcast sown by hand (24th July) over the bed surface and incorporated by hand using a rolling cultivator. The trial area was irrigated using overhead sprinklers to encourage germination and continued to receive overhead irrigation throughout cover crop growth.
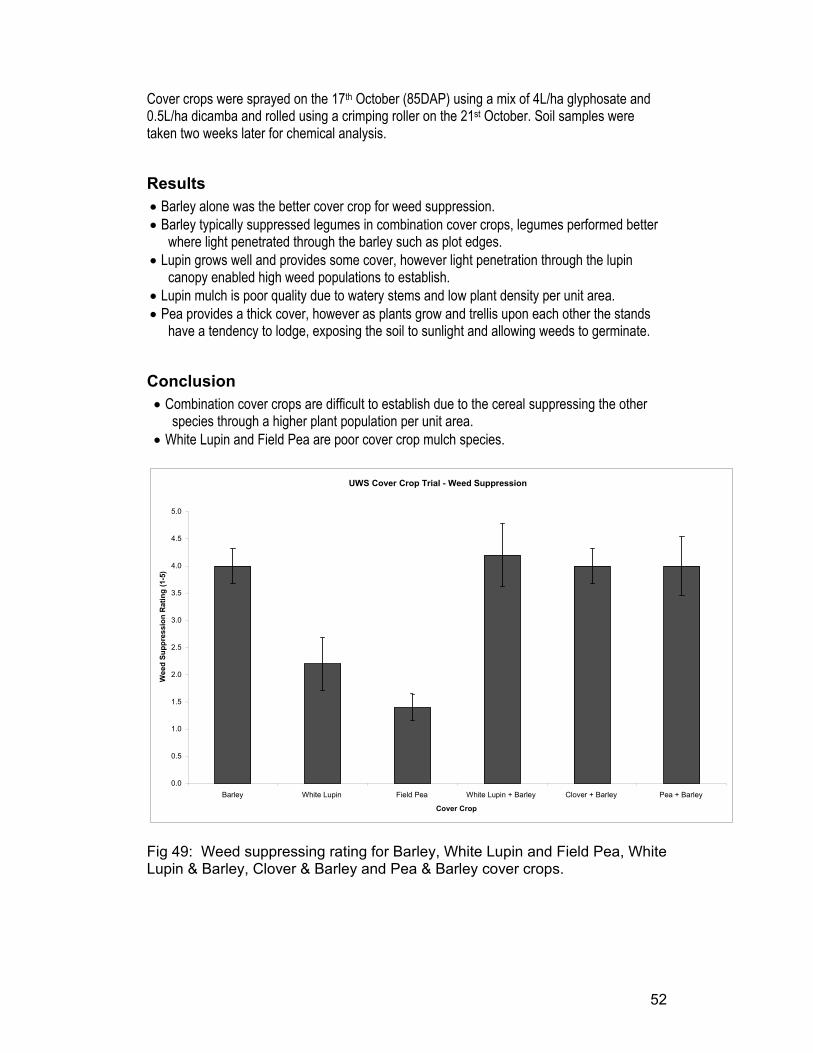
52
Cover crops were sprayed on the 17th October (85DAP) using a mix of 4L/ha glyphosate and 0.5L/ha dicamba and rolled using a crimping roller on the 21st October. Soil samples were taken two weeks later for chemical analysis.
Results • Barley alone was the better cover crop for weed suppression. • Barley typically suppressed legumes in combination cover crops, legumes performed better
where light penetrated through the barley such as plot edges. • Lupin grows well and provides some cover, however light penetration through the lupin
canopy enabled high weed populations to establish. • Lupin mulch is poor quality due to watery stems and low plant density per unit area. • Pea provides a thick cover, however as plants grow and trellis upon each other the stands
have a tendency to lodge, exposing the soil to sunlight and allowing weeds to germinate.
Conclusion • Combination cover crops are difficult to establish due to the cereal suppressing the other
species through a higher plant population per unit area. • White Lupin and Field Pea are poor cover crop mulch species.
Fig 49: Weed suppressing rating for Barley, White Lupin and Field Pea, White Lupin & Barley, Clover & Barley and Pea & Barley cover crops.
UWS Cover Crop Trial - Weed Suppression
0.0
0.5
1.0
1.5
2.0
2.5
3.0
3.5
4.0
4.5
5.0
Barley White Lupin Field Pea White Lupin + Barley Clover + Barley Pea + Barley
Cover Crop
Wee
d Su
ppre
ssio
n R
atin
g (1
-5)
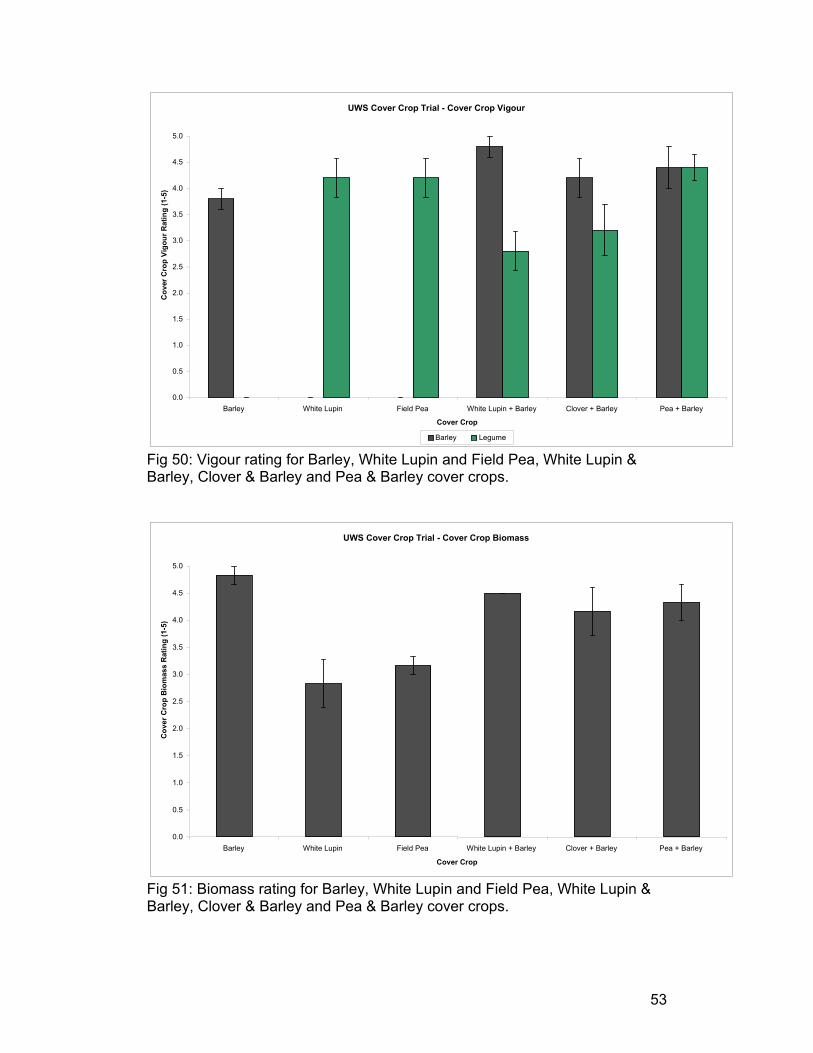
53
Fig 50: Vigour rating for Barley, White Lupin and Field Pea, White Lupin & Barley, Clover & Barley and Pea & Barley cover crops.
Fig 51: Biomass rating for Barley, White Lupin and Field Pea, White Lupin & Barley, Clover & Barley and Pea & Barley cover crops.
UWS Cover Crop Trial - Cover Crop Biomass
0.0
0.5
1.0
1.5
2.0
2.5
3.0
3.5
4.0
4.5
5.0
Barley White Lupin Field Pea White Lupin + Barley Clover + Barley Pea + Barley
Cover Crop
Cov
er C
rop
Bio
mas
s R
atin
g (1
-5)
UWS Cover Crop Trial - Cover Crop Vigour
0.0
0.5
1.0
1.5
2.0
2.5
3.0
3.5
4.0
4.5
5.0
Barley White Lupin Field Pea White Lupin + Barley Clover + Barley Pea + Barley
Cover Crop
Cov
er C
rop
Vigo
ur R
atin
g (1
-5)
Barley Legume
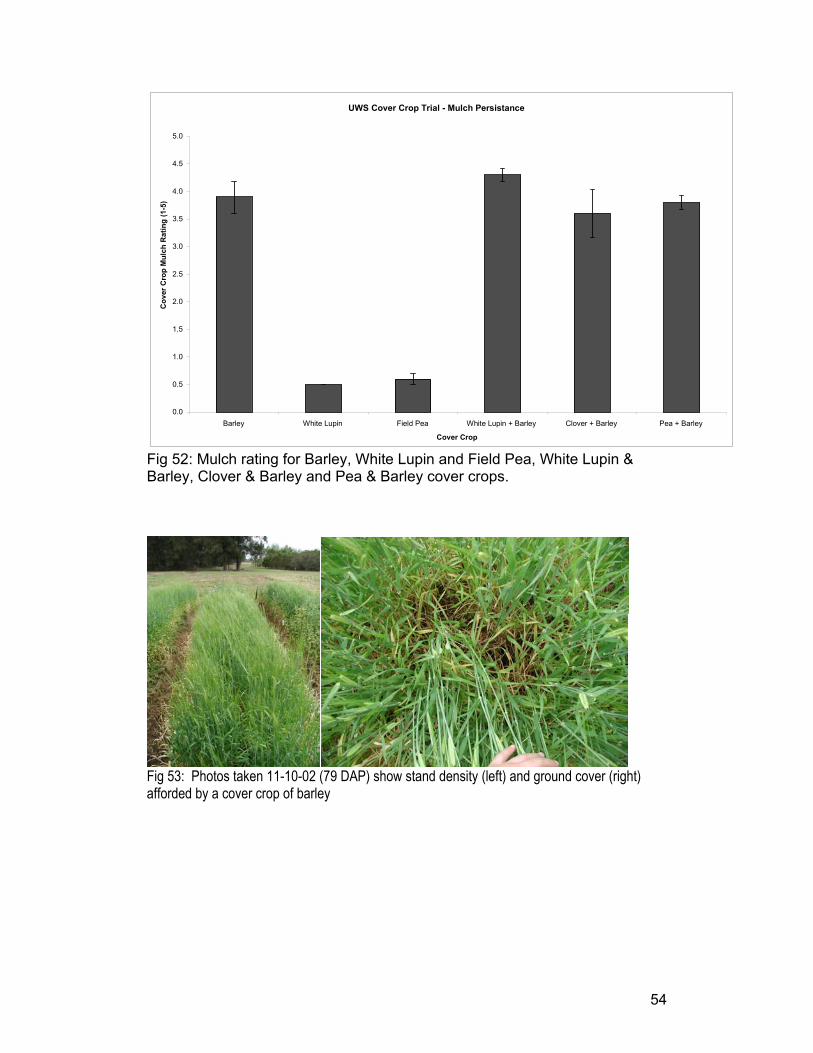
54
Fig 52: Mulch rating for Barley, White Lupin and Field Pea, White Lupin & Barley, Clover & Barley and Pea & Barley cover crops.
Fig 53: Photos taken 11-10-02 (79 DAP) show stand density (left) and ground cover (right) afforded by a cover crop of barley
UWS Cover Crop Trial - Mulch Persistance
0.0
0.5
1.0
1.5
2.0
2.5
3.0
3.5
4.0
4.5
5.0
Barley White Lupin Field Pea White Lupin + Barley Clover + Barley Pea + Barley
Cover Crop
Cov
er C
rop
Mul
ch R
atin
g (1
-5)
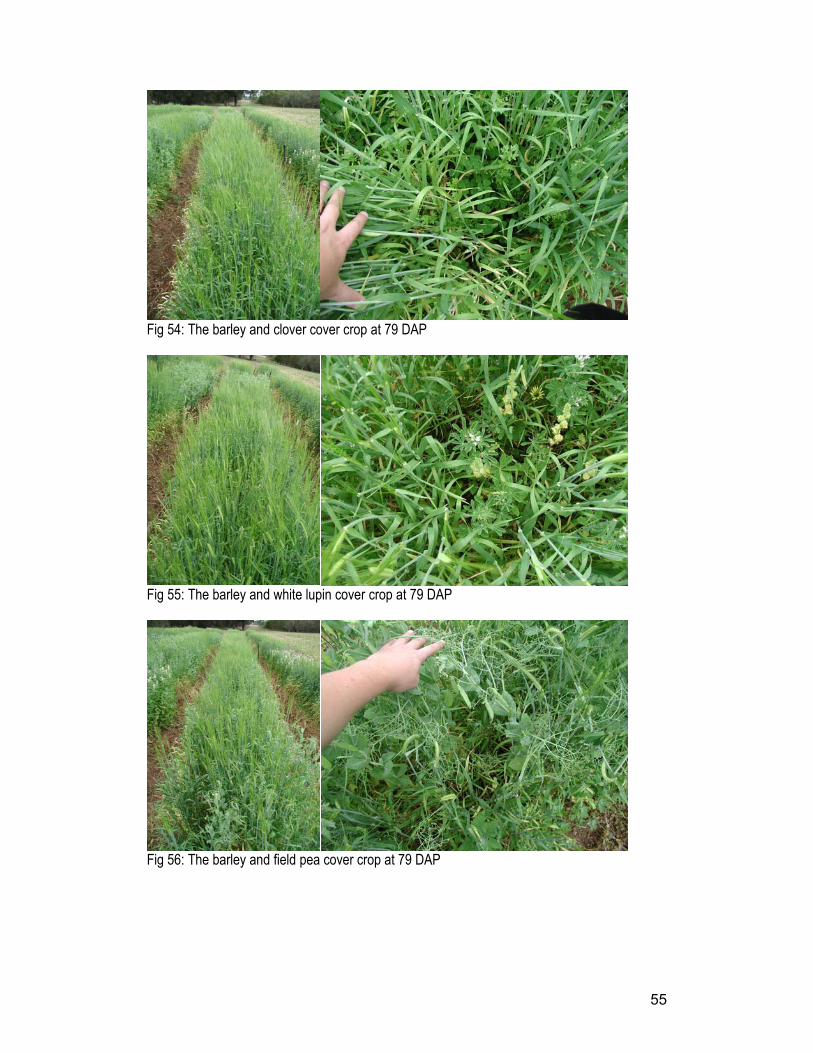
55
Fig 54: The barley and clover cover crop at 79 DAP
Fig 55: The barley and white lupin cover crop at 79 DAP
Fig 56: The barley and field pea cover crop at 79 DAP
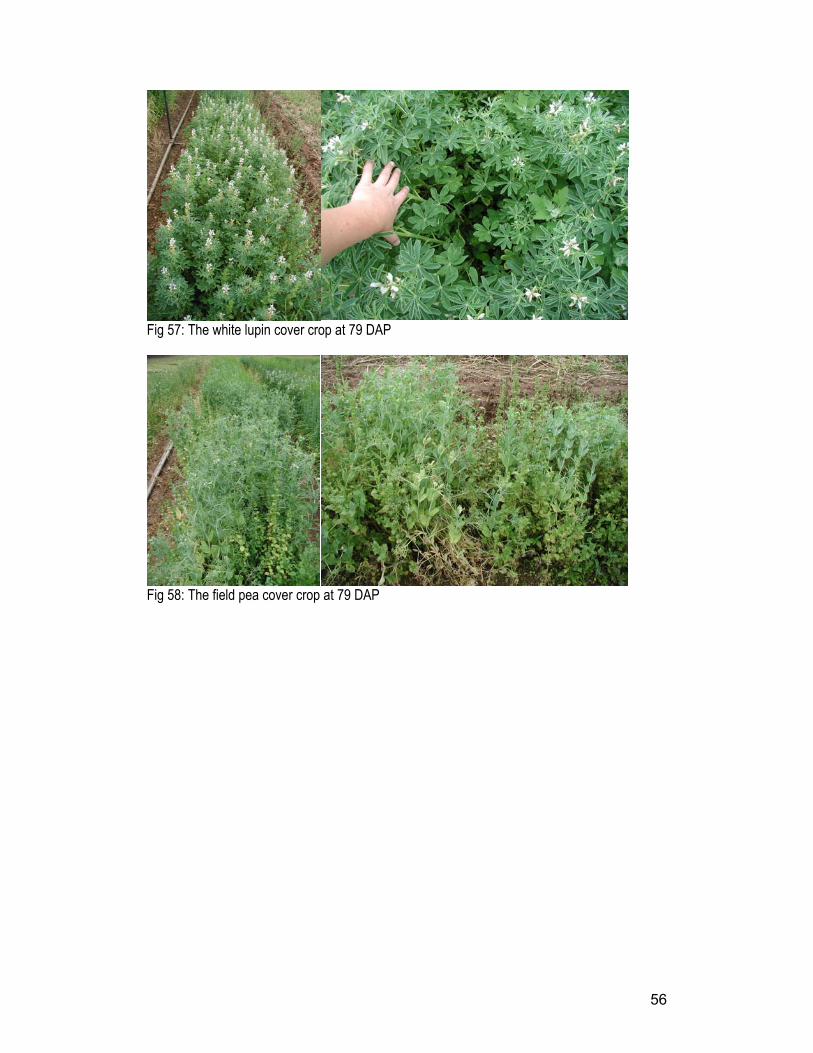
56
Fig 57: The white lupin cover crop at 79 DAP
Fig 58: The field pea cover crop at 79 DAP
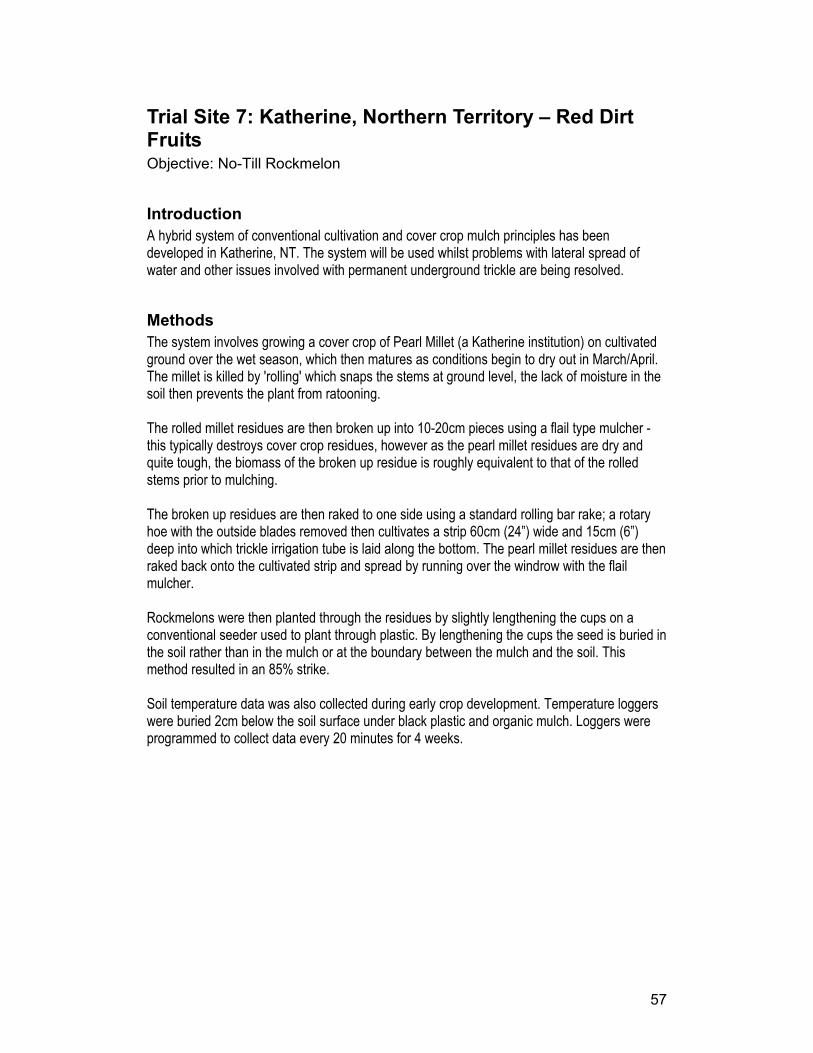
57
Trial Site 7: Katherine, Northern Territory – Red Dirt Fruits Objective: No-Till Rockmelon
Introduction A hybrid system of conventional cultivation and cover crop mulch principles has been developed in Katherine, NT. The system will be used whilst problems with lateral spread of water and other issues involved with permanent underground trickle are being resolved.
Methods The system involves growing a cover crop of Pearl Millet (a Katherine institution) on cultivated ground over the wet season, which then matures as conditions begin to dry out in March/April. The millet is killed by 'rolling' which snaps the stems at ground level, the lack of moisture in the soil then prevents the plant from ratooning. The rolled millet residues are then broken up into 10-20cm pieces using a flail type mulcher - this typically destroys cover crop residues, however as the pearl millet residues are dry and quite tough, the biomass of the broken up residue is roughly equivalent to that of the rolled stems prior to mulching. The broken up residues are then raked to one side using a standard rolling bar rake; a rotary hoe with the outside blades removed then cultivates a strip 60cm (24”) wide and 15cm (6”) deep into which trickle irrigation tube is laid along the bottom. The pearl millet residues are then raked back onto the cultivated strip and spread by running over the windrow with the flail mulcher. Rockmelons were then planted through the residues by slightly lengthening the cups on a conventional seeder used to plant through plastic. By lengthening the cups the seed is buried in the soil rather than in the mulch or at the boundary between the mulch and the soil. This method resulted in an 85% strike. Soil temperature data was also collected during early crop development. Temperature loggers were buried 2cm below the soil surface under black plastic and organic mulch. Loggers were programmed to collect data every 20 minutes for 4 weeks.
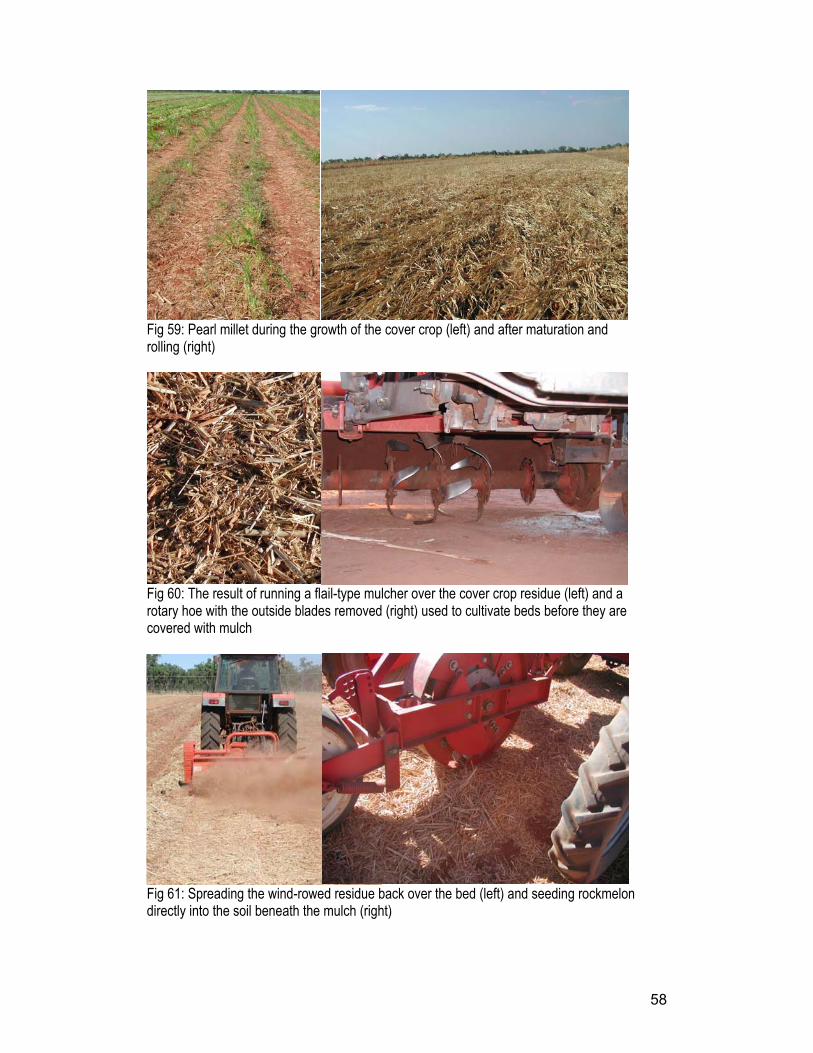
58
Fig 59: Pearl millet during the growth of the cover crop (left) and after maturation and rolling (right)
Fig 60: The result of running a flail-type mulcher over the cover crop residue (left) and a rotary hoe with the outside blades removed (right) used to cultivate beds before they are covered with mulch
Fig 61: Spreading the wind-rowed residue back over the bed (left) and seeding rockmelon directly into the soil beneath the mulch (right)

59
Results Rockmelons initially grew well, however large populations of volunteer Pearl Millet began emerging through the mulch, germinated by the irrigation supplied to the rockmelons. Sprays of Fusilade did control populations, however millet continued to emerge as the crop developed. The inability to control the volunteer Pearl millet and damage sustained by the crop due to feral animal activity led to the trial being abandoned. There is some data to suggest that fungal problems experienced in the conventional production areas (Fusarium, Phytophra, and Rhizoctonia) are not present in the trial area where cover crop mulch is used. The system would be dramatically simplified and improved by running a forage harvester to chop up a standing cover crop in front of a rotary hoe, trickle tape layer, and bed former; and throw the residues behind as the surface mulch.
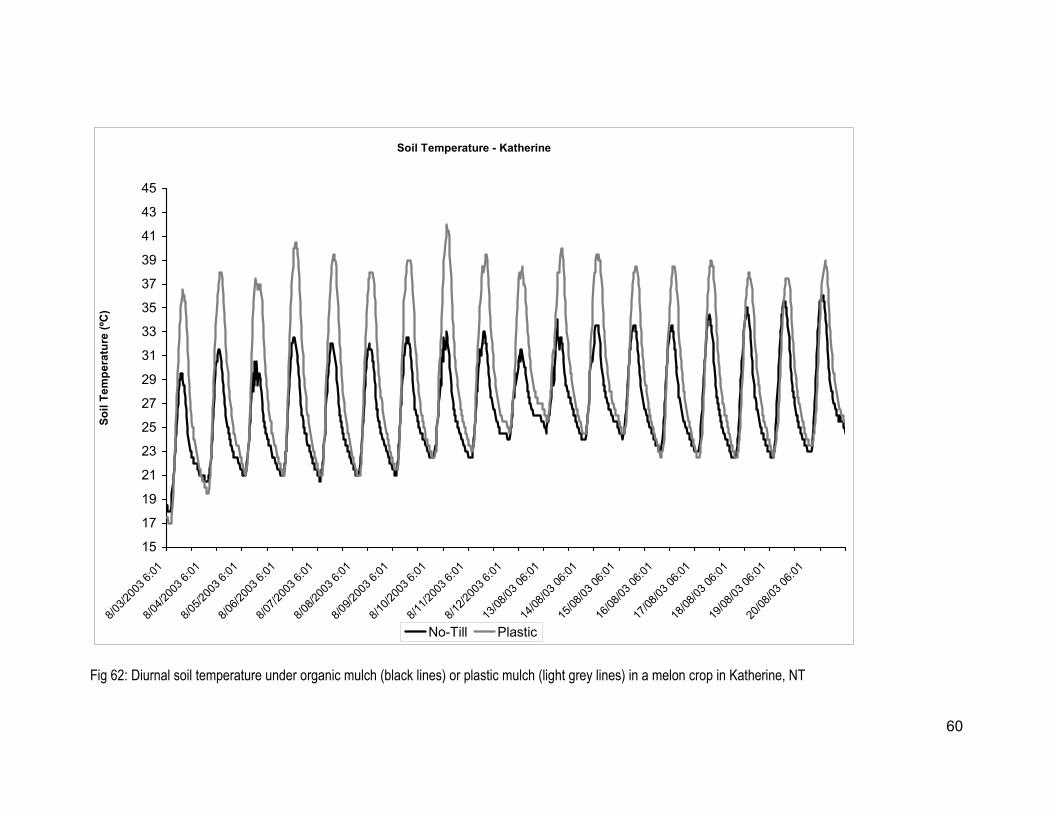
60
Soil Temperature - Katherine
15
17
19
21
23
25
27
29
31
33
35
37
39
41
43
45
8/03/2
003 6
:018/0
4/200
3 6:01
8/05/2
003 6
:018/0
6/200
3 6:01
8/07/2
003 6
:018/0
8/200
3 6:01
8/09/2
003 6
:018/1
0/200
3 6:01
8/11/2
003 6
:018/1
2/200
3 6:01
13/08
/03 06
:0114
/08/03
06:01
15/08
/03 06
:0116
/08/03
06:01
17/08
/03 06
:0118
/08/03
06:01
19/08
/03 06
:0120
/08/03
06:01
Soil
Tem
pera
ture
(ºC
)
No-Till Plastic
Fig 62: Diurnal soil temperature under organic mulch (black lines) or plastic mulch (light grey lines) in a melon crop in Katherine, NT
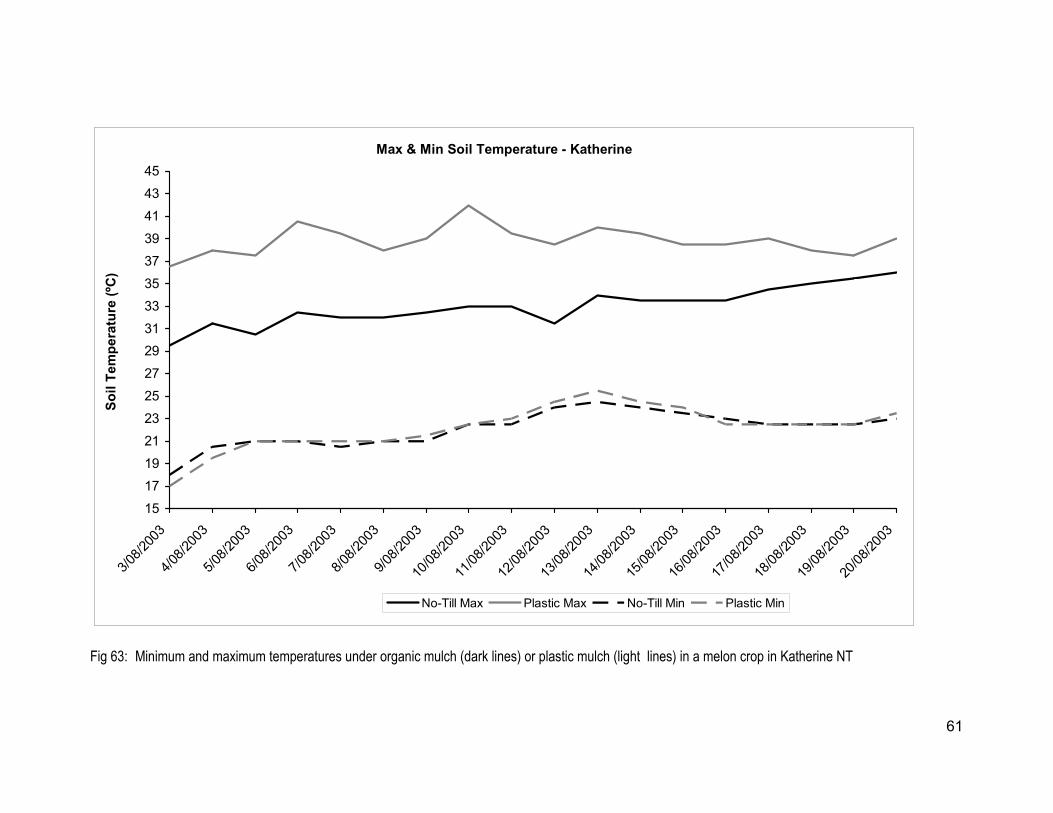
61
Max & Min Soil Temperature - Katherine
15
17
19
21
23
25
27
2931
33
35
37
39
41
43
45
3/08/2
003
4/08/2
003
5/08/2
003
6/08/2
003
7/08/2
003
8/08/2
003
9/08/2
003
10/08
/2003
11/08
/2003
12/08
/2003
13/08
/2003
14/08
/2003
15/08
/2003
16/08
/2003
17/08
/2003
18/08
/2003
19/08
/2003
20/08
/2003
Soil
Tem
pera
ture
(ºC
)
No-Till Max Plastic Max No-Till Min Plastic Min
Fig 63: Minimum and maximum temperatures under organic mulch (dark lines) or plastic mulch (light lines) in a melon crop in Katherine NT
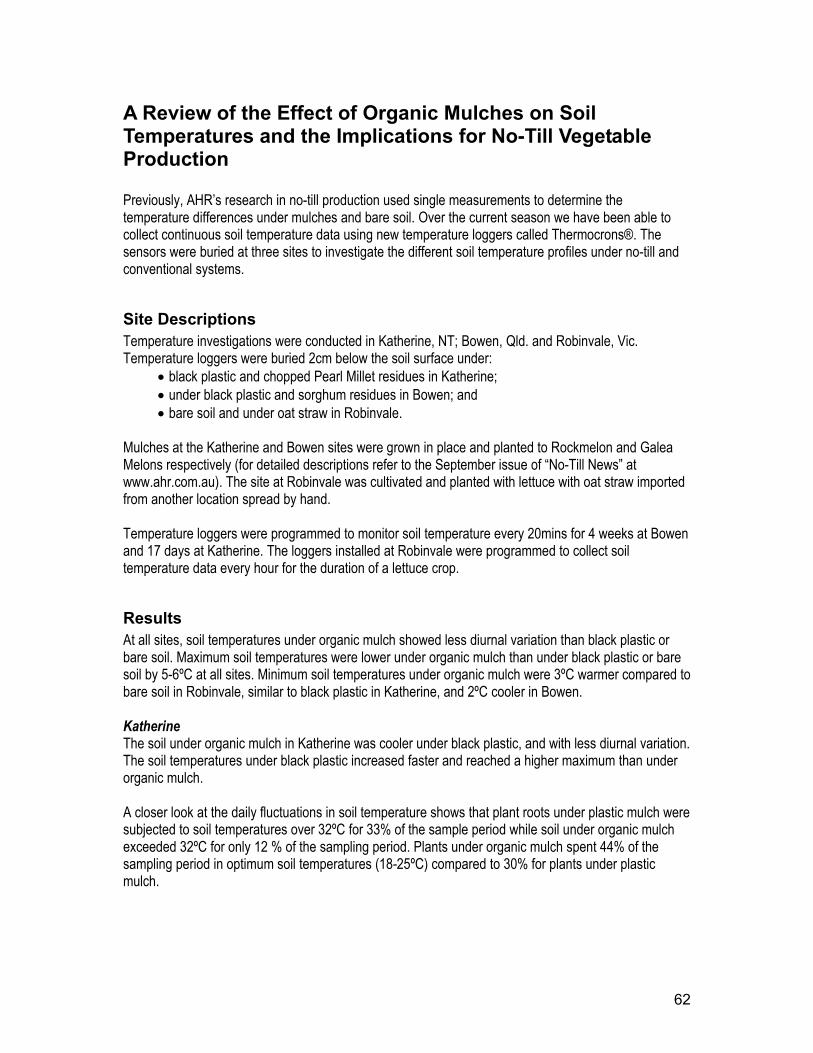
62
A Review of the Effect of Organic Mulches on Soil Temperatures and the Implications for No-Till Vegetable Production Previously, AHR’s research in no-till production used single measurements to determine the temperature differences under mulches and bare soil. Over the current season we have been able to collect continuous soil temperature data using new temperature loggers called Thermocrons®. The sensors were buried at three sites to investigate the different soil temperature profiles under no-till and conventional systems.
Site Descriptions Temperature investigations were conducted in Katherine, NT; Bowen, Qld. and Robinvale, Vic. Temperature loggers were buried 2cm below the soil surface under:
• black plastic and chopped Pearl Millet residues in Katherine; • under black plastic and sorghum residues in Bowen; and • bare soil and under oat straw in Robinvale.
Mulches at the Katherine and Bowen sites were grown in place and planted to Rockmelon and Galea Melons respectively (for detailed descriptions refer to the September issue of “No-Till News” at www.ahr.com.au). The site at Robinvale was cultivated and planted with lettuce with oat straw imported from another location spread by hand. Temperature loggers were programmed to monitor soil temperature every 20mins for 4 weeks at Bowen and 17 days at Katherine. The loggers installed at Robinvale were programmed to collect soil temperature data every hour for the duration of a lettuce crop.
Results At all sites, soil temperatures under organic mulch showed less diurnal variation than black plastic or bare soil. Maximum soil temperatures were lower under organic mulch than under black plastic or bare soil by 5-6ºC at all sites. Minimum soil temperatures under organic mulch were 3ºC warmer compared to bare soil in Robinvale, similar to black plastic in Katherine, and 2ºC cooler in Bowen. Katherine The soil under organic mulch in Katherine was cooler under black plastic, and with less diurnal variation. The soil temperatures under black plastic increased faster and reached a higher maximum than under organic mulch. A closer look at the daily fluctuations in soil temperature shows that plant roots under plastic mulch were subjected to soil temperatures over 32ºC for 33% of the sample period while soil under organic mulch exceeded 32ºC for only 12 % of the sampling period. Plants under organic mulch spent 44% of the sampling period in optimum soil temperatures (18-25ºC) compared to 30% for plants under plastic mulch.
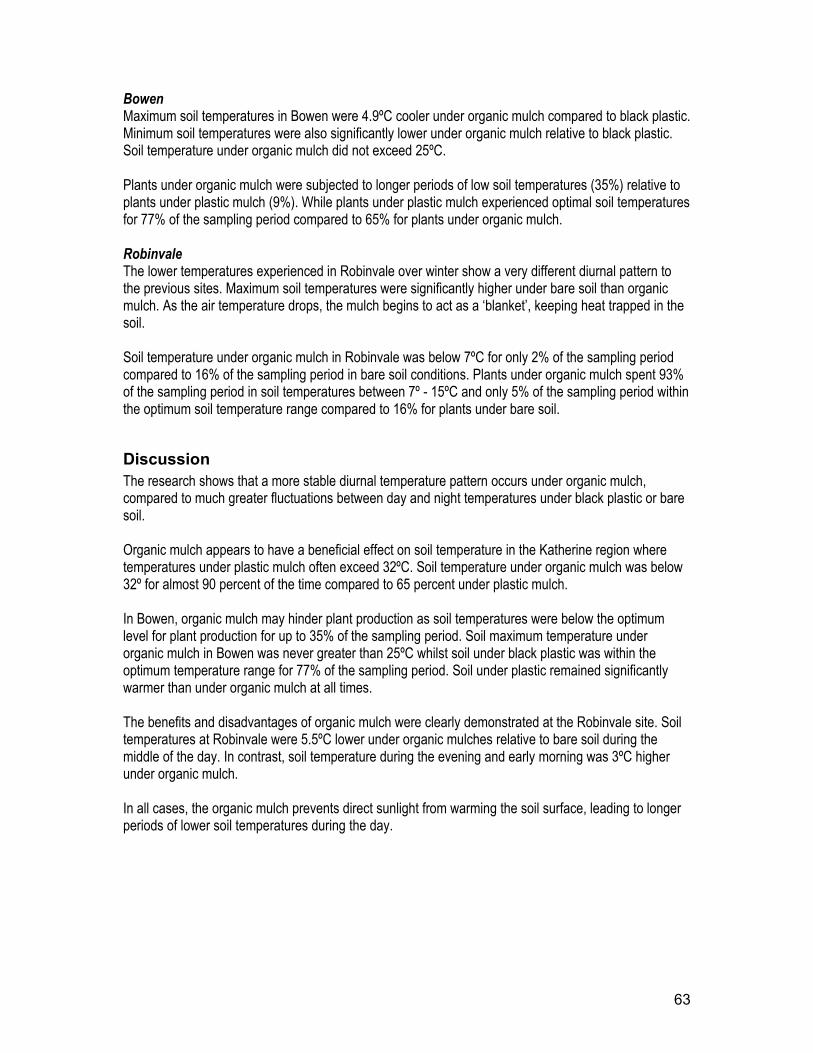
63
Bowen Maximum soil temperatures in Bowen were 4.9ºC cooler under organic mulch compared to black plastic. Minimum soil temperatures were also significantly lower under organic mulch relative to black plastic. Soil temperature under organic mulch did not exceed 25ºC. Plants under organic mulch were subjected to longer periods of low soil temperatures (35%) relative to plants under plastic mulch (9%). While plants under plastic mulch experienced optimal soil temperatures for 77% of the sampling period compared to 65% for plants under organic mulch. Robinvale The lower temperatures experienced in Robinvale over winter show a very different diurnal pattern to the previous sites. Maximum soil temperatures were significantly higher under bare soil than organic mulch. As the air temperature drops, the mulch begins to act as a ‘blanket’, keeping heat trapped in the soil. Soil temperature under organic mulch in Robinvale was below 7ºC for only 2% of the sampling period compared to 16% of the sampling period in bare soil conditions. Plants under organic mulch spent 93% of the sampling period in soil temperatures between 7º - 15ºC and only 5% of the sampling period within the optimum soil temperature range compared to 16% for plants under bare soil.
Discussion The research shows that a more stable diurnal temperature pattern occurs under organic mulch, compared to much greater fluctuations between day and night temperatures under black plastic or bare soil. Organic mulch appears to have a beneficial effect on soil temperature in the Katherine region where temperatures under plastic mulch often exceed 32ºC. Soil temperature under organic mulch was below 32º for almost 90 percent of the time compared to 65 percent under plastic mulch. In Bowen, organic mulch may hinder plant production as soil temperatures were below the optimum level for plant production for up to 35% of the sampling period. Soil maximum temperature under organic mulch in Bowen was never greater than 25ºC whilst soil under black plastic was within the optimum temperature range for 77% of the sampling period. Soil under plastic remained significantly warmer than under organic mulch at all times. The benefits and disadvantages of organic mulch were clearly demonstrated at the Robinvale site. Soil temperatures at Robinvale were 5.5ºC lower under organic mulches relative to bare soil during the middle of the day. In contrast, soil temperature during the evening and early morning was 3ºC higher under organic mulch. In all cases, the organic mulch prevents direct sunlight from warming the soil surface, leading to longer periods of lower soil temperatures during the day.
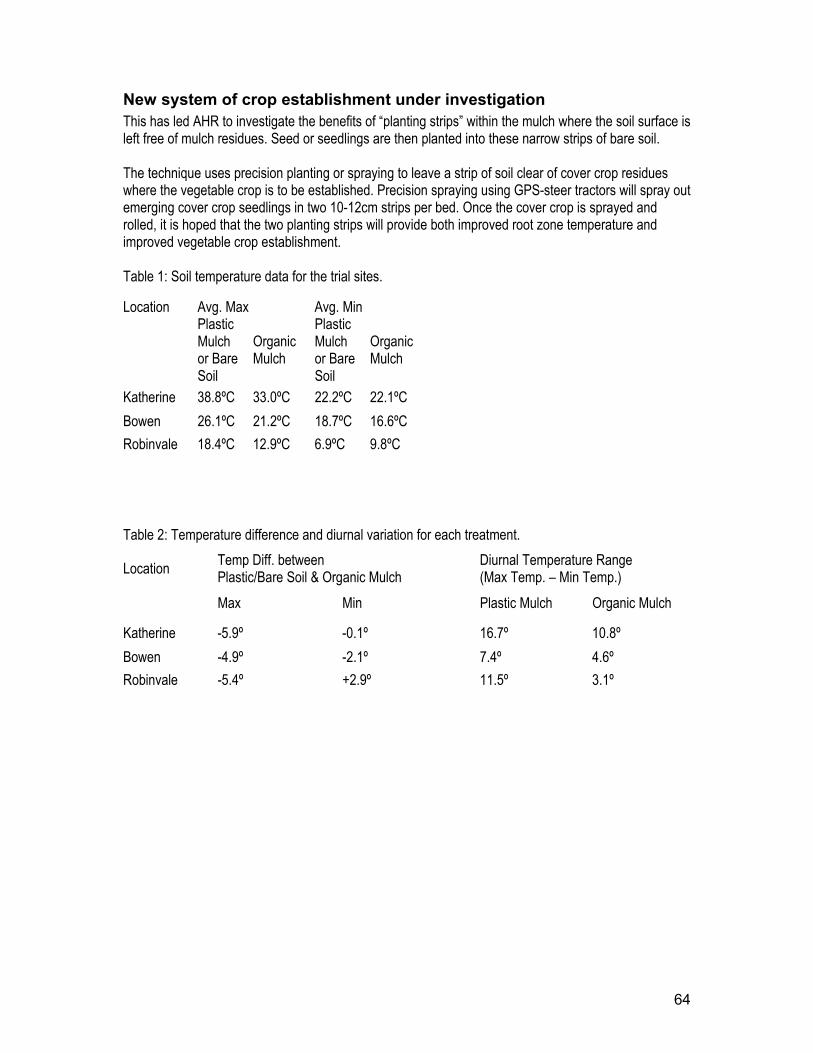
64
New system of crop establishment under investigation This has led AHR to investigate the benefits of “planting strips” within the mulch where the soil surface is left free of mulch residues. Seed or seedlings are then planted into these narrow strips of bare soil. The technique uses precision planting or spraying to leave a strip of soil clear of cover crop residues where the vegetable crop is to be established. Precision spraying using GPS-steer tractors will spray out emerging cover crop seedlings in two 10-12cm strips per bed. Once the cover crop is sprayed and rolled, it is hoped that the two planting strips will provide both improved root zone temperature and improved vegetable crop establishment. Table 1: Soil temperature data for the trial sites.
Table 2: Temperature difference and diurnal variation for each treatment.
Location Avg. Max Avg. Min
Plastic Mulch or Bare Soil
Organic Mulch
Plastic Mulch or Bare Soil
Organic Mulch
Katherine 38.8ºC 33.0ºC 22.2ºC 22.1ºC Bowen 26.1ºC 21.2ºC 18.7ºC 16.6ºC Robinvale 18.4ºC 12.9ºC 6.9ºC 9.8ºC
Location Temp Diff. between Plastic/Bare Soil & Organic Mulch
Diurnal Temperature Range (Max Temp. – Min Temp.)
Max Min Plastic Mulch Organic Mulch
Katherine -5.9º -0.1º 16.7º 10.8º Bowen -4.9º -2.1º 7.4º 4.6º Robinvale -5.4º +2.9º 11.5º 3.1º
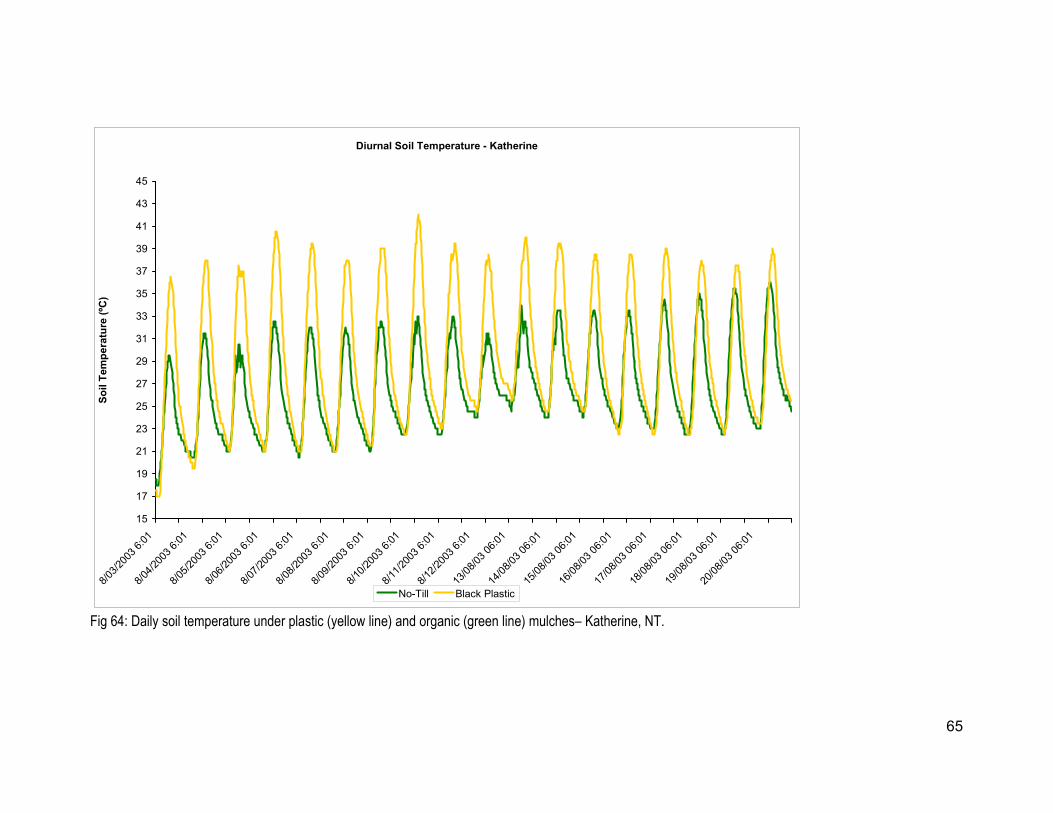
65
Diurnal Soil Temperature - Katherine
15
17
19
21
23
25
27
29
31
33
35
37
39
41
43
45
8/03/2
003 6
:018/0
4/200
3 6:01
8/05/2
003 6
:018/0
6/200
3 6:01
8/07/2
003 6
:018/0
8/200
3 6:01
8/09/2
003 6
:018/1
0/200
3 6:01
8/11/2
003 6
:018/1
2/200
3 6:01
13/08
/03 06
:0114
/08/03
06:01
15/08
/03 06
:0116
/08/03
06:01
17/08
/03 06
:0118
/08/03
06:01
19/08
/03 06
:0120
/08/03
06:01
Soil
Tem
pera
ture
(ºC
)
No-Till Black Plastic
Fig 64: Daily soil temperature under plastic (yellow line) and organic (green line) mulches– Katherine, NT.
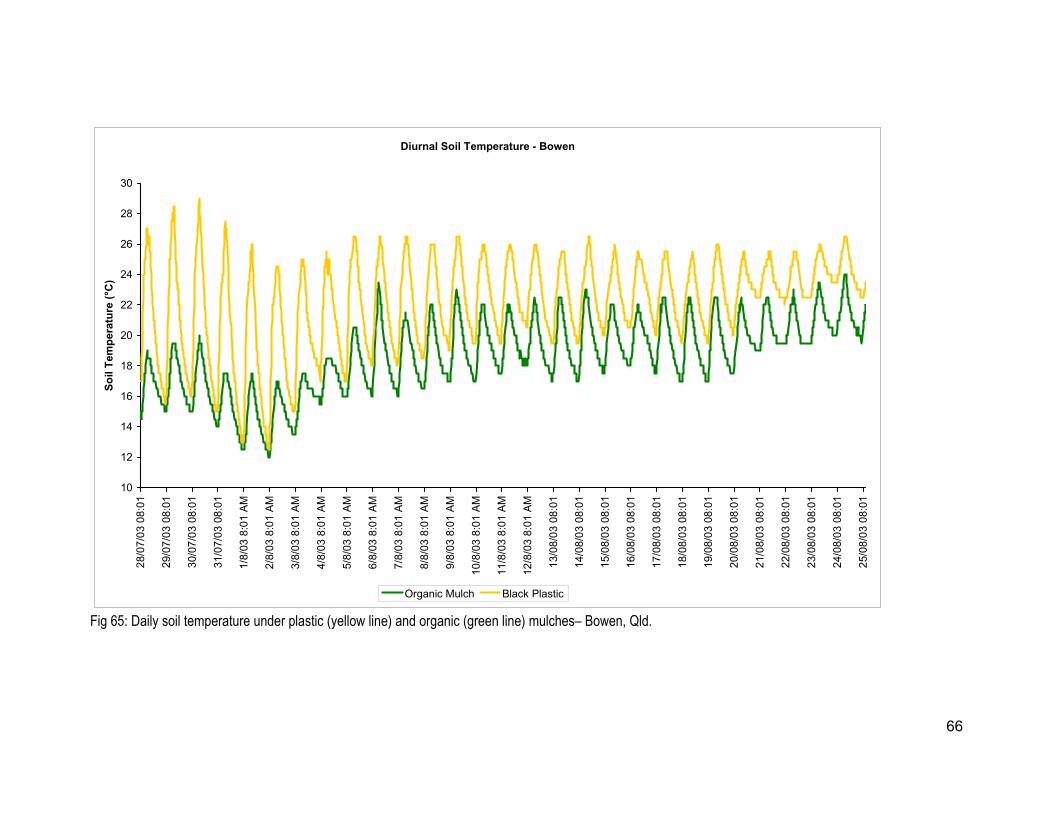
66
Diurnal Soil Temperature - Bowen
10
12
14
16
18
20
22
24
26
28
30
28/0
7/03
08:
01
29/0
7/03
08:
01
30/0
7/03
08:
01
31/0
7/03
08:
01
1/8/
03 8
:01
AM
2/8/
03 8
:01
AM
3/8/
03 8
:01
AM
4/8/
03 8
:01
AM
5/8/
03 8
:01
AM
6/8/
03 8
:01
AM
7/8/
03 8
:01
AM
8/8/
03 8
:01
AM
9/8/
03 8
:01
AM
10/8
/03
8:01
AM
11/8
/03
8:01
AM
12/8
/03
8:01
AM
13/0
8/03
08:
01
14/0
8/03
08:
01
15/0
8/03
08:
01
16/0
8/03
08:
01
17/0
8/03
08:
01
18/0
8/03
08:
01
19/0
8/03
08:
01
20/0
8/03
08:
01
21/0
8/03
08:
01
22/0
8/03
08:
01
23/0
8/03
08:
01
24/0
8/03
08:
01
25/0
8/03
08:
01
Soil
Tem
pera
ture
(°C
)
Organic Mulch Black Plastic
Fig 65: Daily soil temperature under plastic (yellow line) and organic (green line) mulches– Bowen, Qld.
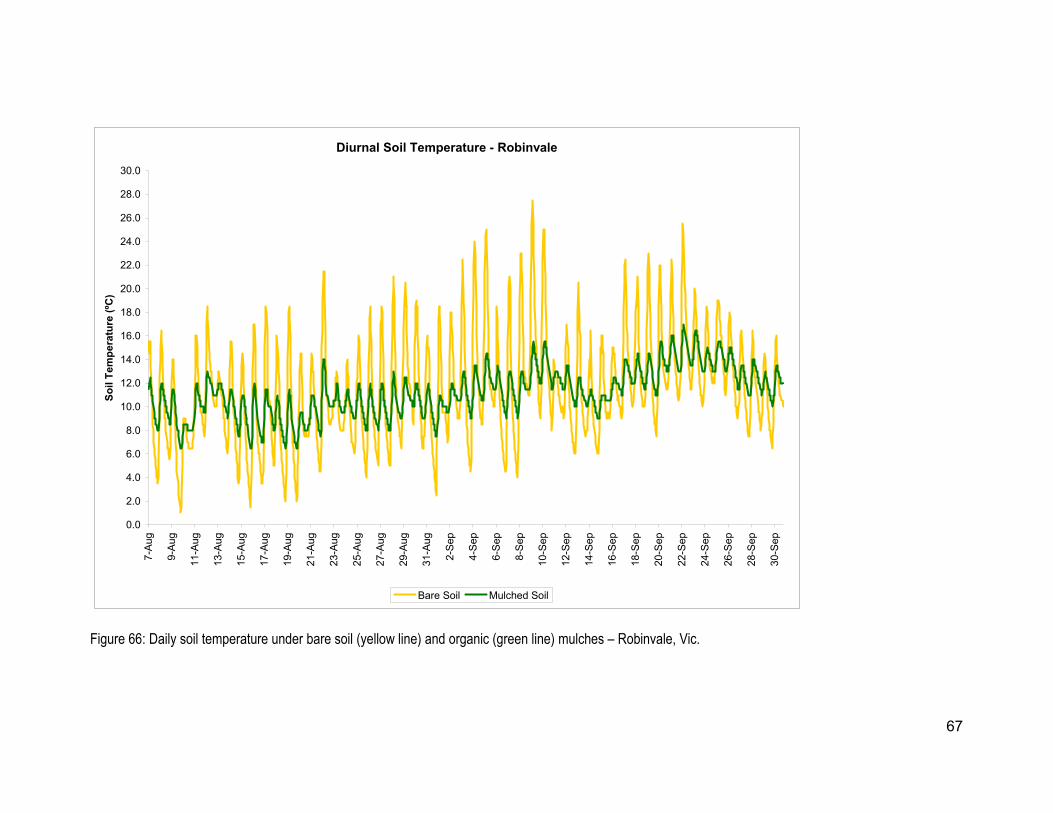
67
Diurnal Soil Temperature - Robinvale
0.0
2.0
4.0
6.0
8.0
10.0
12.0
14.0
16.0
18.0
20.0
22.0
24.0
26.0
28.0
30.0
7-A
ug
9-A
ug
11-A
ug
13-A
ug
15-A
ug
17-A
ug
19-A
ug
21-A
ug
23-A
ug
25-A
ug
27-A
ug
29-A
ug
31-A
ug
2-S
ep
4-S
ep
6-S
ep
8-S
ep
10-S
ep
12-S
ep
14-S
ep
16-S
ep
18-S
ep
20-S
ep
22-S
ep
24-S
ep
26-S
ep
28-S
ep
30-S
ep
Soil
Tem
pera
ture
(ºC
)
Bare Soil Mulched Soil
Figure 66: Daily soil temperature under bare soil (yellow line) and organic (green line) mulches – Robinvale, Vic.
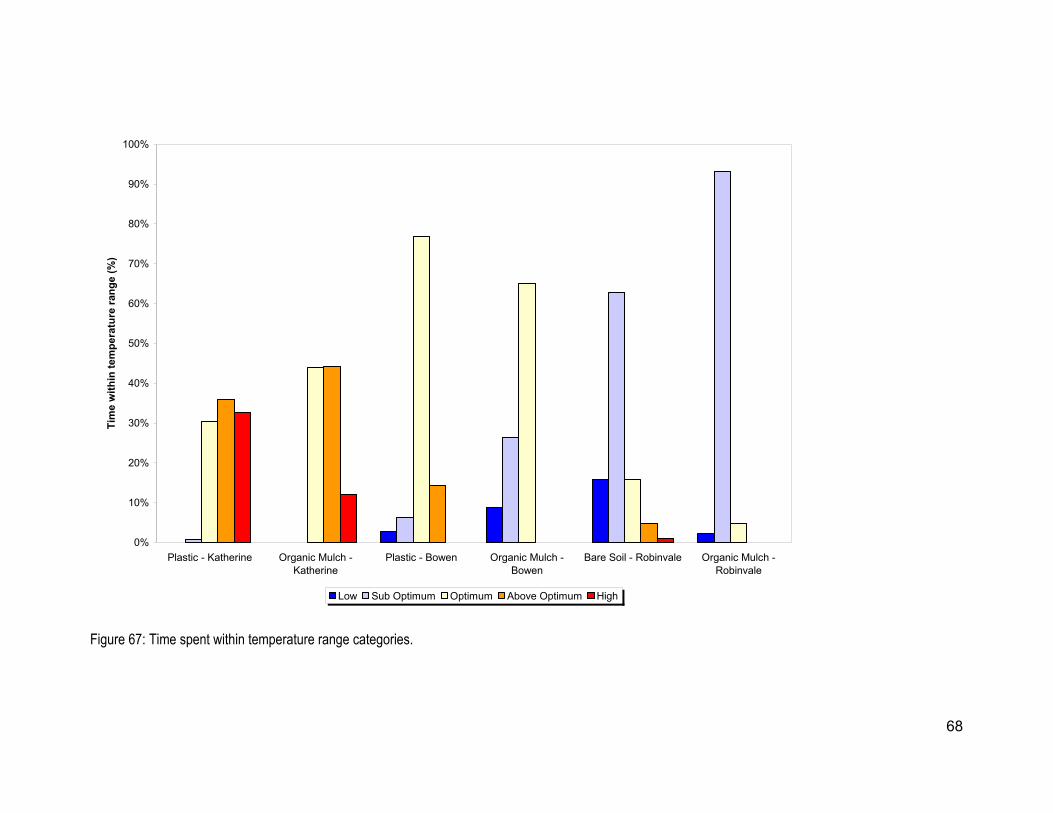
68
0%
10%
20%
30%
40%
50%
60%
70%
80%
90%
100%
Plastic - Katherine Organic Mulch -Katherine
Plastic - Bowen Organic Mulch -Bowen
Bare Soil - Robinvale Organic Mulch -Robinvale
Tim
e w
ithin
tem
pera
ture
rang
e (%
)
Low Sub Optimum Optimum Above Optimum High
Figure 67: Time spent within temperature range categories.
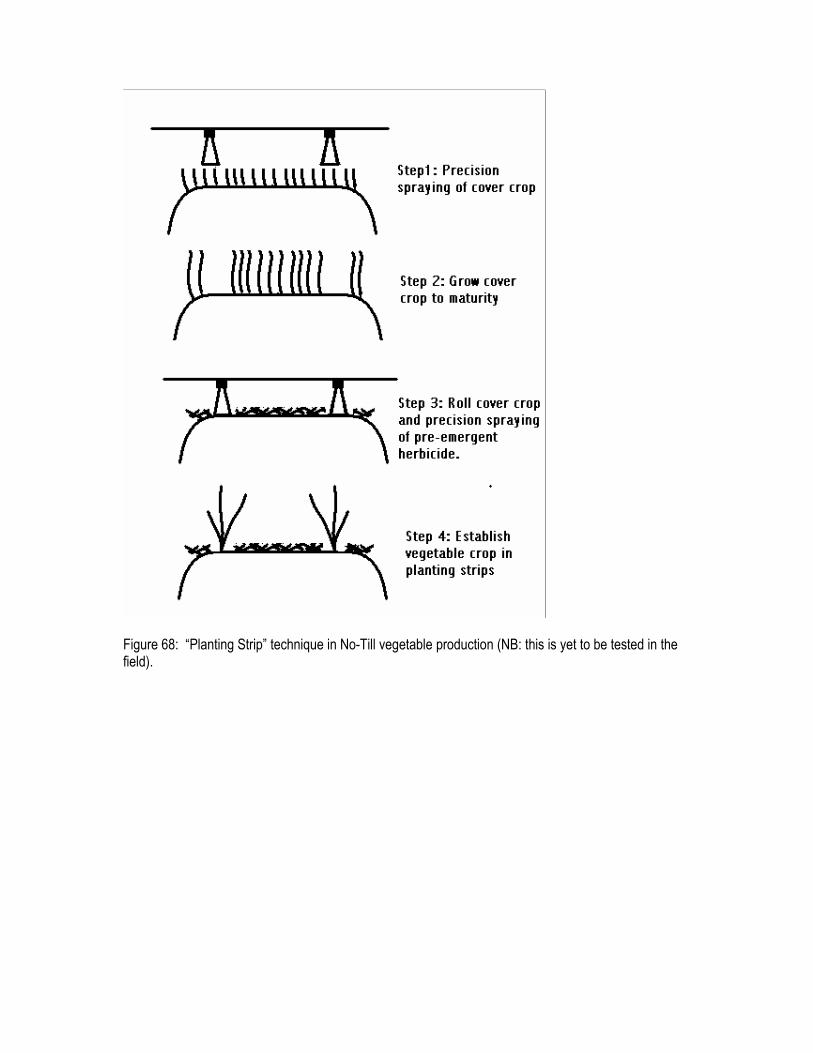
Figure 68: “Planting Strip” technique in No-Till vegetable production (NB: this is yet to be tested in the field).

70
An Investigation of Alternative Methods to Glyphosate Application, for weed control in No-Till Vegetable Production Introduction & Research Objectives Flaming for the killing of cover crops with the use of an organic herbicide may address a deficiency in the cover crop system, namely the need for glyphosate or other herbicides to kill cover crop prior to planting the vegetable crop. AHR has evaluated super-heated steam for killing the cover crop, but this was ineffective. Flame has been used for a long period for the control of weeds, and it is likely to effectively kill cover crops. Organic Interceptor is a fully certified, organic herbicide derived from pine extracts. It is a non-selective contact herbicide that breaks down plant cells resulting in dehydration and plant death. However the effectiveness of the product relies on complete coverage of the plant to ensure sufficient dehydration to achieve a complete kill. A key advantage of Interceptor ® is that it has been accepted for use in Australia by the Organic Certification agencies (BFA and NASA). The use of flame weeding for weed control has major applications in organic agricultural production. Flame weeding can also be considered a “soft” option for weed control by conventional farmers, however there is yet to be a major uptake of this technology. The manufacturers of Organic Interceptor believe that the combination of their organic herbicide, manufactured from pine extracts, with flame weeding techniques has the potential to increase the effectiveness of both forms of organic weed control. The objective of the research is to determine whether combining organic interceptor with flame weeding can:
1. Improve weed control in terms of length of time and efficacy of weed control; 2. Permit a faster rate of application of flame weeding; 3. Be used in a one pass application.
A primary focus of this particular trial is to determine the optimum application rate (water and active) of interceptor and the optimum tractor speed when flame weeding. Methodology Treatment Application Organic Interceptor is applied via a boom spray comprising four 95° flat spray stainless steel nozzles with orifice 1.6mm positioned 50cm above the soil surface resulting in a total spray width of 2m. Chemical was supplied to the boom from a 200L tank using a 12V electric pump wired to the tractor battery, pressure to the boom was regulated to 3 bar resulting in spray output of 2.4L/min per nozzle. Organic Interceptor was mixed with water at 5%, 10% and 20% and applied at two spray volumes: 1000L/ha and 1500L/ha.
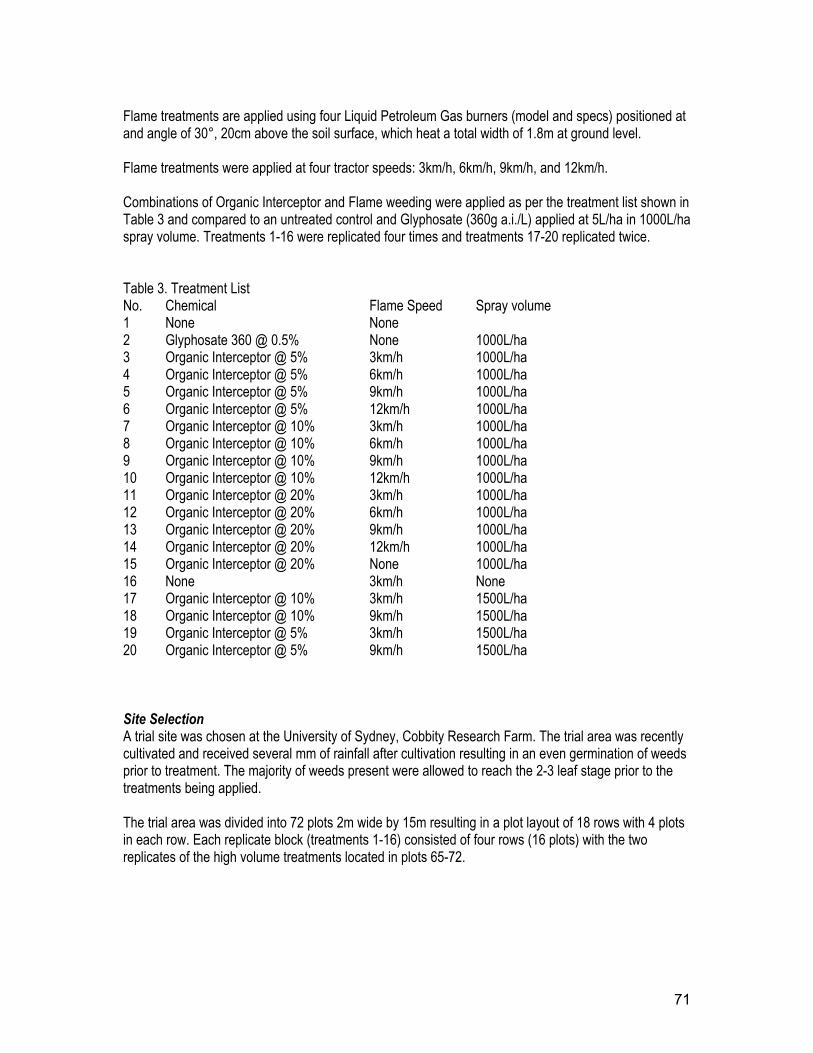
71
Flame treatments are applied using four Liquid Petroleum Gas burners (model and specs) positioned at and angle of 30°, 20cm above the soil surface, which heat a total width of 1.8m at ground level. Flame treatments were applied at four tractor speeds: 3km/h, 6km/h, 9km/h, and 12km/h. Combinations of Organic Interceptor and Flame weeding were applied as per the treatment list shown in Table 3 and compared to an untreated control and Glyphosate (360g a.i./L) applied at 5L/ha in 1000L/ha spray volume. Treatments 1-16 were replicated four times and treatments 17-20 replicated twice. Table 3. Treatment List No. Chemical Flame Speed Spray volume 1 None None 2 Glyphosate 360 @ 0.5% None 1000L/ha 3 Organic Interceptor @ 5% 3km/h 1000L/ha 4 Organic Interceptor @ 5% 6km/h 1000L/ha 5 Organic Interceptor @ 5% 9km/h 1000L/ha 6 Organic Interceptor @ 5% 12km/h 1000L/ha 7 Organic Interceptor @ 10% 3km/h 1000L/ha 8 Organic Interceptor @ 10% 6km/h 1000L/ha 9 Organic Interceptor @ 10% 9km/h 1000L/ha 10 Organic Interceptor @ 10% 12km/h 1000L/ha 11 Organic Interceptor @ 20% 3km/h 1000L/ha 12 Organic Interceptor @ 20% 6km/h 1000L/ha 13 Organic Interceptor @ 20% 9km/h 1000L/ha 14 Organic Interceptor @ 20% 12km/h 1000L/ha 15 Organic Interceptor @ 20% None 1000L/ha 16 None 3km/h None 17 Organic Interceptor @ 10% 3km/h 1500L/ha 18 Organic Interceptor @ 10% 9km/h 1500L/ha 19 Organic Interceptor @ 5% 3km/h 1500L/ha 20 Organic Interceptor @ 5% 9km/h 1500L/ha Site Selection A trial site was chosen at the University of Sydney, Cobbity Research Farm. The trial area was recently cultivated and received several mm of rainfall after cultivation resulting in an even germination of weeds prior to treatment. The majority of weeds present were allowed to reach the 2-3 leaf stage prior to the treatments being applied. The trial area was divided into 72 plots 2m wide by 15m resulting in a plot layout of 18 rows with 4 plots in each row. Each replicate block (treatments 1-16) consisted of four rows (16 plots) with the two replicates of the high volume treatments located in plots 65-72.
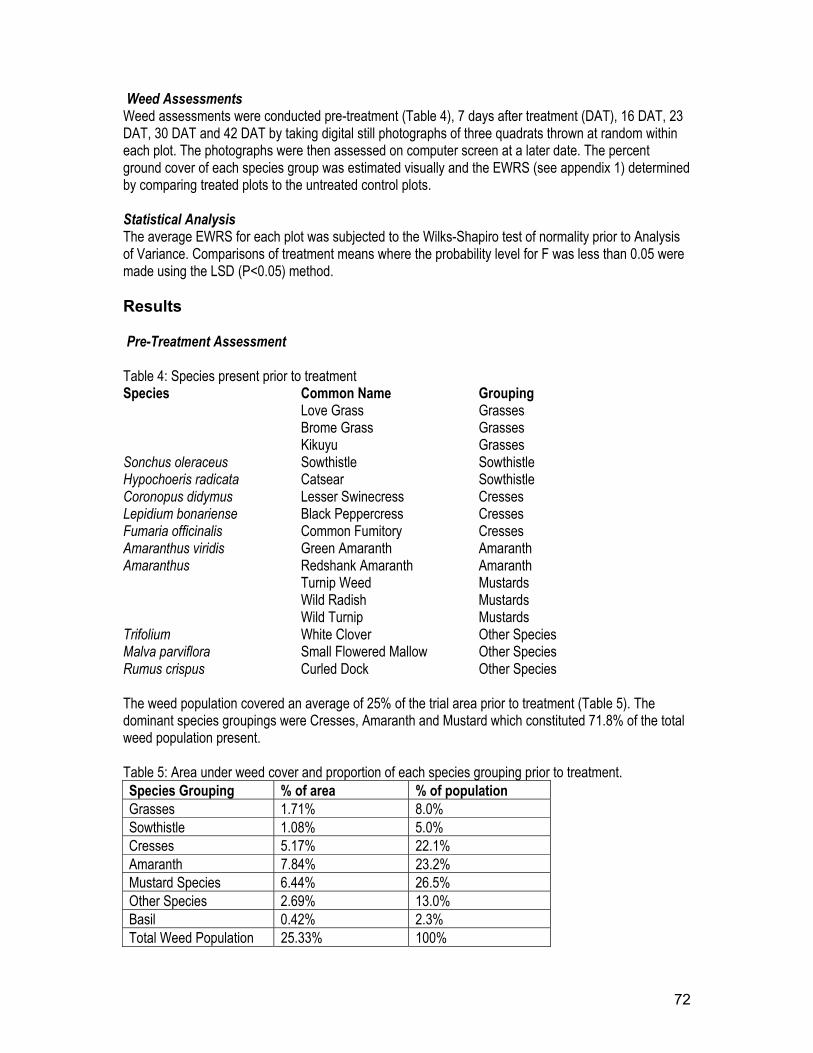
72
Weed Assessments Weed assessments were conducted pre-treatment (Table 4), 7 days after treatment (DAT), 16 DAT, 23 DAT, 30 DAT and 42 DAT by taking digital still photographs of three quadrats thrown at random within each plot. The photographs were then assessed on computer screen at a later date. The percent ground cover of each species group was estimated visually and the EWRS (see appendix 1) determined by comparing treated plots to the untreated control plots. Statistical Analysis The average EWRS for each plot was subjected to the Wilks-Shapiro test of normality prior to Analysis of Variance. Comparisons of treatment means where the probability level for F was less than 0.05 were made using the LSD (P<0.05) method. Results Pre-Treatment Assessment Table 4: Species present prior to treatment Species Common Name Grouping Love Grass Grasses Brome Grass Grasses Kikuyu Grasses Sonchus oleraceus Sowthistle Sowthistle Hypochoeris radicata Catsear Sowthistle Coronopus didymus Lesser Swinecress Cresses Lepidium bonariense Black Peppercress Cresses Fumaria officinalis Common Fumitory Cresses Amaranthus viridis Green Amaranth Amaranth Amaranthus Redshank Amaranth Amaranth Turnip Weed Mustards Wild Radish Mustards Wild Turnip Mustards Trifolium White Clover Other Species Malva parviflora Small Flowered Mallow Other Species Rumus crispus Curled Dock Other Species The weed population covered an average of 25% of the trial area prior to treatment (Table 5). The dominant species groupings were Cresses, Amaranth and Mustard which constituted 71.8% of the total weed population present. Table 5: Area under weed cover and proportion of each species grouping prior to treatment. Species Grouping % of area % of population Grasses 1.71% 8.0% Sowthistle 1.08% 5.0% Cresses 5.17% 22.1% Amaranth 7.84% 23.2% Mustard Species 6.44% 26.5% Other Species 2.69% 13.0% Basil 0.42% 2.3% Total Weed Population 25.33% 100%
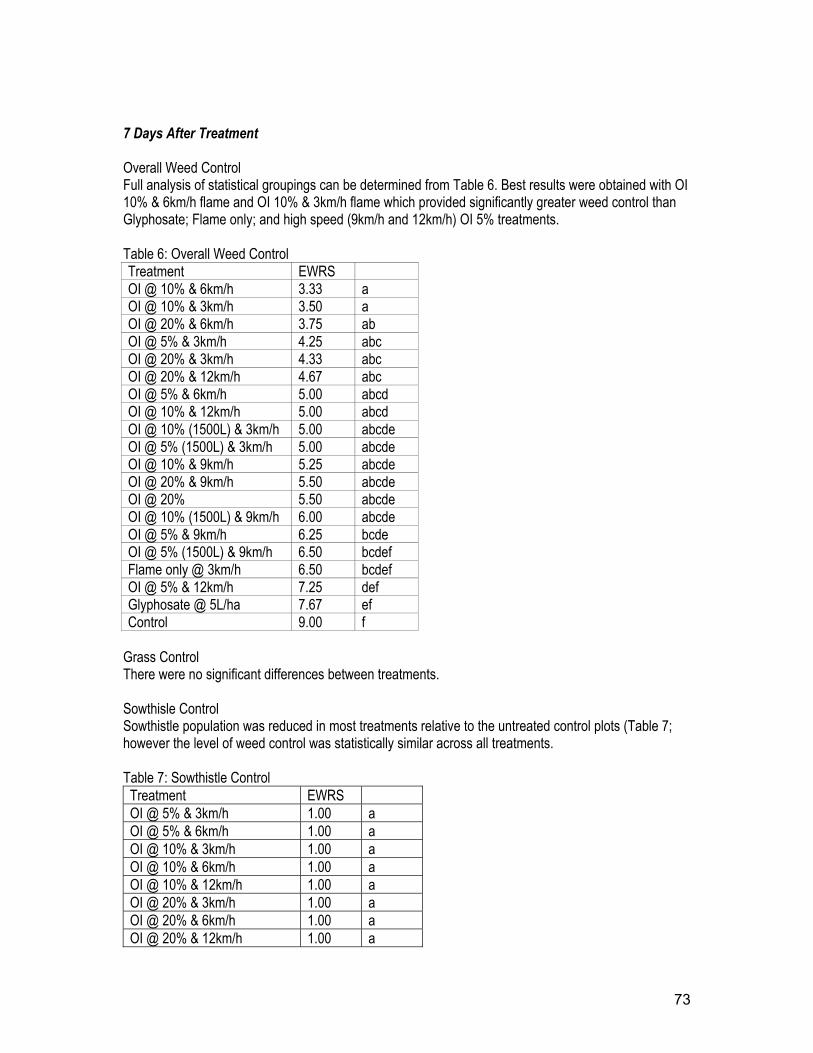
73
7 Days After Treatment Overall Weed Control Full analysis of statistical groupings can be determined from Table 6. Best results were obtained with OI 10% & 6km/h flame and OI 10% & 3km/h flame which provided significantly greater weed control than Glyphosate; Flame only; and high speed (9km/h and 12km/h) OI 5% treatments. Table 6: Overall Weed Control Treatment EWRS OI @ 10% & 6km/h 3.33 a OI @ 10% & 3km/h 3.50 a OI @ 20% & 6km/h 3.75 ab OI @ 5% & 3km/h 4.25 abc OI @ 20% & 3km/h 4.33 abc OI @ 20% & 12km/h 4.67 abc OI @ 5% & 6km/h 5.00 abcd OI @ 10% & 12km/h 5.00 abcd OI @ 10% (1500L) & 3km/h 5.00 abcde OI @ 5% (1500L) & 3km/h 5.00 abcde OI @ 10% & 9km/h 5.25 abcde OI @ 20% & 9km/h 5.50 abcde OI @ 20% 5.50 abcde OI @ 10% (1500L) & 9km/h 6.00 abcde OI @ 5% & 9km/h 6.25 bcde OI @ 5% (1500L) & 9km/h 6.50 bcdef Flame only @ 3km/h 6.50 bcdef OI @ 5% & 12km/h 7.25 def Glyphosate @ 5L/ha 7.67 ef Control 9.00 f
Grass Control There were no significant differences between treatments. Sowthisle Control Sowthistle population was reduced in most treatments relative to the untreated control plots (Table 7; however the level of weed control was statistically similar across all treatments. Table 7: Sowthistle Control Treatment EWRS OI @ 5% & 3km/h 1.00 a OI @ 5% & 6km/h 1.00 a OI @ 10% & 3km/h 1.00 a OI @ 10% & 6km/h 1.00 a OI @ 10% & 12km/h 1.00 a OI @ 20% & 3km/h 1.00 a OI @ 20% & 6km/h 1.00 a OI @ 20% & 12km/h 1.00 a
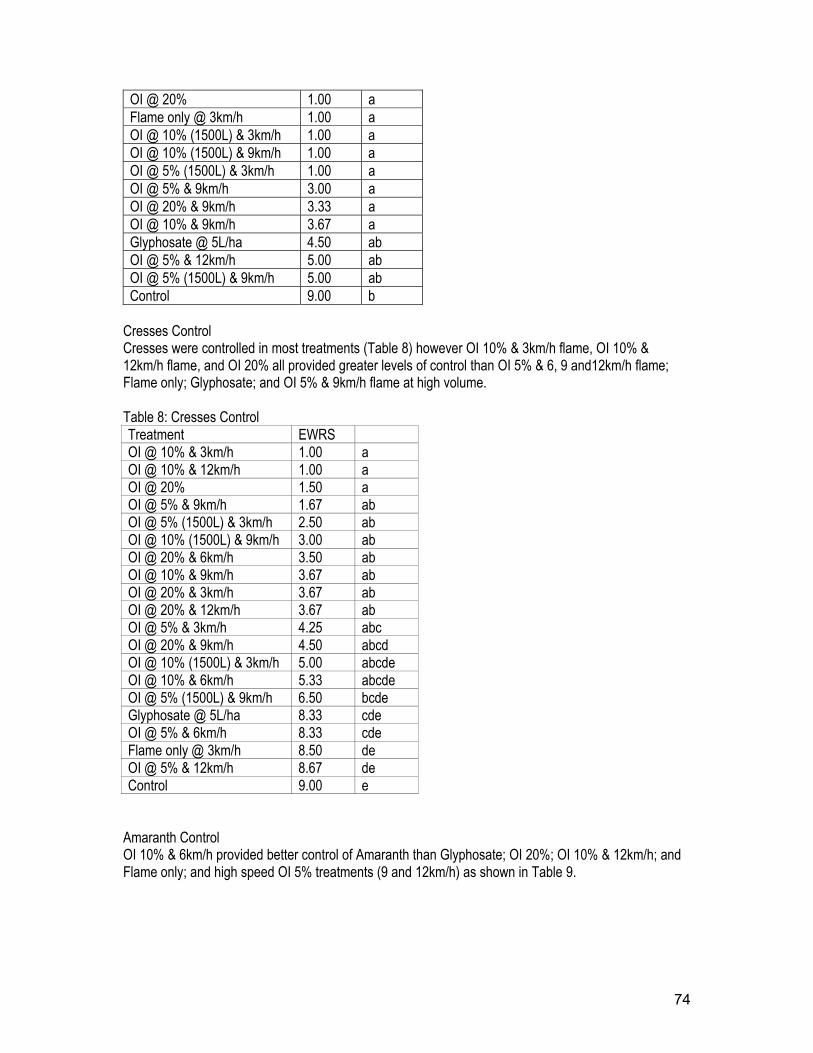
74
OI @ 20% 1.00 a Flame only @ 3km/h 1.00 a OI @ 10% (1500L) & 3km/h 1.00 a OI @ 10% (1500L) & 9km/h 1.00 a OI @ 5% (1500L) & 3km/h 1.00 a OI @ 5% & 9km/h 3.00 a OI @ 20% & 9km/h 3.33 a OI @ 10% & 9km/h 3.67 a Glyphosate @ 5L/ha 4.50 ab OI @ 5% & 12km/h 5.00 ab OI @ 5% (1500L) & 9km/h 5.00 ab Control 9.00 b
Cresses Control Cresses were controlled in most treatments (Table 8) however OI 10% & 3km/h flame, OI 10% & 12km/h flame, and OI 20% all provided greater levels of control than OI 5% & 6, 9 and12km/h flame; Flame only; Glyphosate; and OI 5% & 9km/h flame at high volume. Table 8: Cresses Control Treatment EWRS OI @ 10% & 3km/h 1.00 a OI @ 10% & 12km/h 1.00 a OI @ 20% 1.50 a OI @ 5% & 9km/h 1.67 ab OI @ 5% (1500L) & 3km/h 2.50 ab OI @ 10% (1500L) & 9km/h 3.00 ab OI @ 20% & 6km/h 3.50 ab OI @ 10% & 9km/h 3.67 ab OI @ 20% & 3km/h 3.67 ab OI @ 20% & 12km/h 3.67 ab OI @ 5% & 3km/h 4.25 abc OI @ 20% & 9km/h 4.50 abcd OI @ 10% (1500L) & 3km/h 5.00 abcde OI @ 10% & 6km/h 5.33 abcde OI @ 5% (1500L) & 9km/h 6.50 bcde Glyphosate @ 5L/ha 8.33 cde OI @ 5% & 6km/h 8.33 cde Flame only @ 3km/h 8.50 de OI @ 5% & 12km/h 8.67 de Control 9.00 e
Amaranth Control OI 10% & 6km/h provided better control of Amaranth than Glyphosate; OI 20%; OI 10% & 12km/h; and Flame only; and high speed OI 5% treatments (9 and 12km/h) as shown in Table 9.
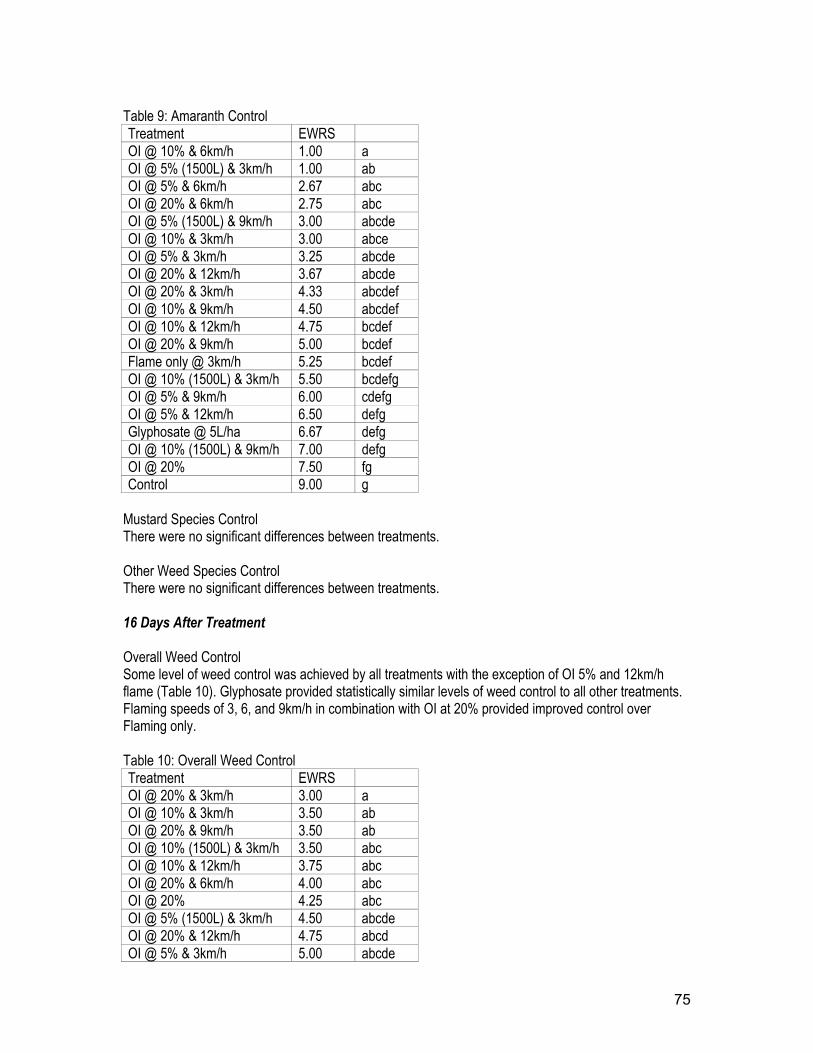
75
Table 9: Amaranth Control Treatment EWRS OI @ 10% & 6km/h 1.00 a OI @ 5% (1500L) & 3km/h 1.00 ab OI @ 5% & 6km/h 2.67 abc OI @ 20% & 6km/h 2.75 abc OI @ 5% (1500L) & 9km/h 3.00 abcde OI @ 10% & 3km/h 3.00 abce OI @ 5% & 3km/h 3.25 abcde OI @ 20% & 12km/h 3.67 abcde OI @ 20% & 3km/h 4.33 abcdef OI @ 10% & 9km/h 4.50 abcdef OI @ 10% & 12km/h 4.75 bcdef OI @ 20% & 9km/h 5.00 bcdef Flame only @ 3km/h 5.25 bcdef OI @ 10% (1500L) & 3km/h 5.50 bcdefg OI @ 5% & 9km/h 6.00 cdefg OI @ 5% & 12km/h 6.50 defg Glyphosate @ 5L/ha 6.67 defg OI @ 10% (1500L) & 9km/h 7.00 defg OI @ 20% 7.50 fg Control 9.00 g
Mustard Species Control There were no significant differences between treatments. Other Weed Species Control There were no significant differences between treatments. 16 Days After Treatment Overall Weed Control Some level of weed control was achieved by all treatments with the exception of OI 5% and 12km/h flame (Table 10). Glyphosate provided statistically similar levels of weed control to all other treatments. Flaming speeds of 3, 6, and 9km/h in combination with OI at 20% provided improved control over Flaming only. Table 10: Overall Weed Control Treatment EWRS OI @ 20% & 3km/h 3.00 a OI @ 10% & 3km/h 3.50 ab OI @ 20% & 9km/h 3.50 ab OI @ 10% (1500L) & 3km/h 3.50 abc OI @ 10% & 12km/h 3.75 abc OI @ 20% & 6km/h 4.00 abc OI @ 20% 4.25 abc OI @ 5% (1500L) & 3km/h 4.50 abcde OI @ 20% & 12km/h 4.75 abcd OI @ 5% & 3km/h 5.00 abcde
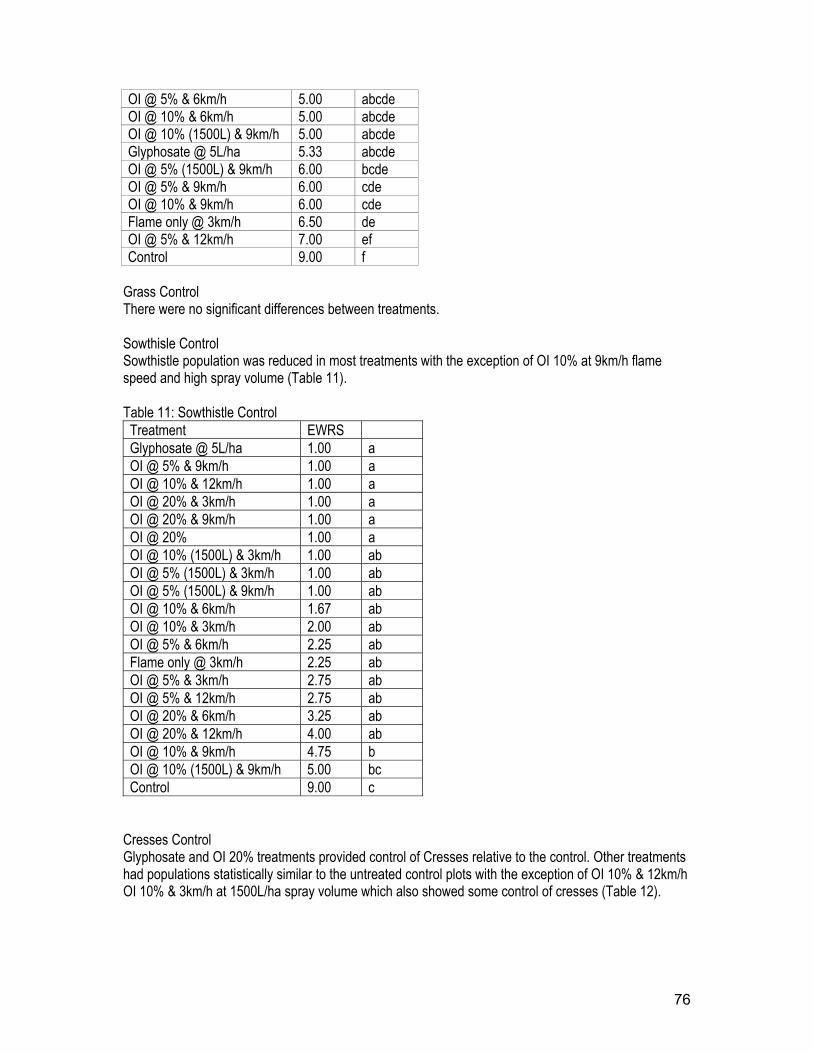
76
OI @ 5% & 6km/h 5.00 abcde OI @ 10% & 6km/h 5.00 abcde OI @ 10% (1500L) & 9km/h 5.00 abcde Glyphosate @ 5L/ha 5.33 abcde OI @ 5% (1500L) & 9km/h 6.00 bcde OI @ 5% & 9km/h 6.00 cde OI @ 10% & 9km/h 6.00 cde Flame only @ 3km/h 6.50 de OI @ 5% & 12km/h 7.00 ef Control 9.00 f
Grass Control There were no significant differences between treatments. Sowthisle Control Sowthistle population was reduced in most treatments with the exception of OI 10% at 9km/h flame speed and high spray volume (Table 11). Table 11: Sowthistle Control Treatment EWRS Glyphosate @ 5L/ha 1.00 a OI @ 5% & 9km/h 1.00 a OI @ 10% & 12km/h 1.00 a OI @ 20% & 3km/h 1.00 a OI @ 20% & 9km/h 1.00 a OI @ 20% 1.00 a OI @ 10% (1500L) & 3km/h 1.00 ab OI @ 5% (1500L) & 3km/h 1.00 ab OI @ 5% (1500L) & 9km/h 1.00 ab OI @ 10% & 6km/h 1.67 ab OI @ 10% & 3km/h 2.00 ab OI @ 5% & 6km/h 2.25 ab Flame only @ 3km/h 2.25 ab OI @ 5% & 3km/h 2.75 ab OI @ 5% & 12km/h 2.75 ab OI @ 20% & 6km/h 3.25 ab OI @ 20% & 12km/h 4.00 ab OI @ 10% & 9km/h 4.75 b OI @ 10% (1500L) & 9km/h 5.00 bc Control 9.00 c
Cresses Control Glyphosate and OI 20% treatments provided control of Cresses relative to the control. Other treatments had populations statistically similar to the untreated control plots with the exception of OI 10% & 12km/h OI 10% & 3km/h at 1500L/ha spray volume which also showed some control of cresses (Table 12).
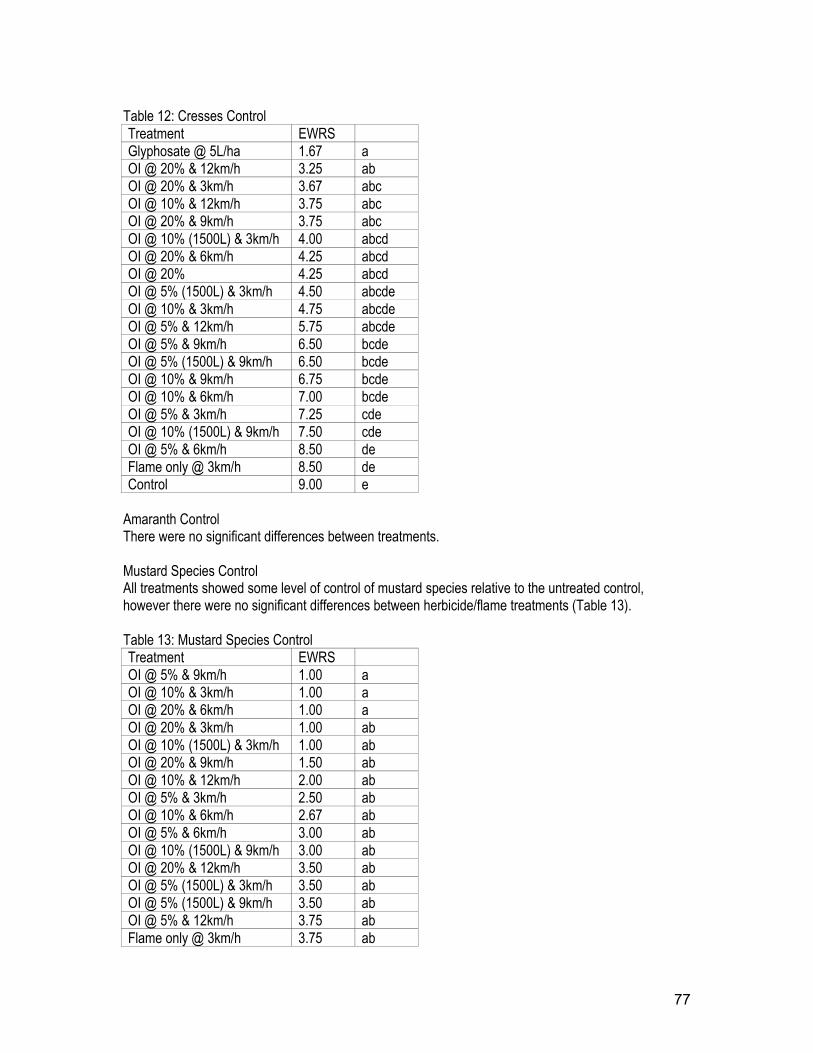
77
Table 12: Cresses Control Treatment EWRS Glyphosate @ 5L/ha 1.67 a OI @ 20% & 12km/h 3.25 ab OI @ 20% & 3km/h 3.67 abc OI @ 10% & 12km/h 3.75 abc OI @ 20% & 9km/h 3.75 abc OI @ 10% (1500L) & 3km/h 4.00 abcd OI @ 20% & 6km/h 4.25 abcd OI @ 20% 4.25 abcd OI @ 5% (1500L) & 3km/h 4.50 abcde OI @ 10% & 3km/h 4.75 abcde OI @ 5% & 12km/h 5.75 abcde OI @ 5% & 9km/h 6.50 bcde OI @ 5% (1500L) & 9km/h 6.50 bcde OI @ 10% & 9km/h 6.75 bcde OI @ 10% & 6km/h 7.00 bcde OI @ 5% & 3km/h 7.25 cde OI @ 10% (1500L) & 9km/h 7.50 cde OI @ 5% & 6km/h 8.50 de Flame only @ 3km/h 8.50 de Control 9.00 e
Amaranth Control There were no significant differences between treatments. Mustard Species Control All treatments showed some level of control of mustard species relative to the untreated control, however there were no significant differences between herbicide/flame treatments (Table 13). Table 13: Mustard Species Control Treatment EWRS OI @ 5% & 9km/h 1.00 a OI @ 10% & 3km/h 1.00 a OI @ 20% & 6km/h 1.00 a OI @ 20% & 3km/h 1.00 ab OI @ 10% (1500L) & 3km/h 1.00 ab OI @ 20% & 9km/h 1.50 ab OI @ 10% & 12km/h 2.00 ab OI @ 5% & 3km/h 2.50 ab OI @ 10% & 6km/h 2.67 ab OI @ 5% & 6km/h 3.00 ab OI @ 10% (1500L) & 9km/h 3.00 ab OI @ 20% & 12km/h 3.50 ab OI @ 5% (1500L) & 3km/h 3.50 ab OI @ 5% (1500L) & 9km/h 3.50 ab OI @ 5% & 12km/h 3.75 ab Flame only @ 3km/h 3.75 ab
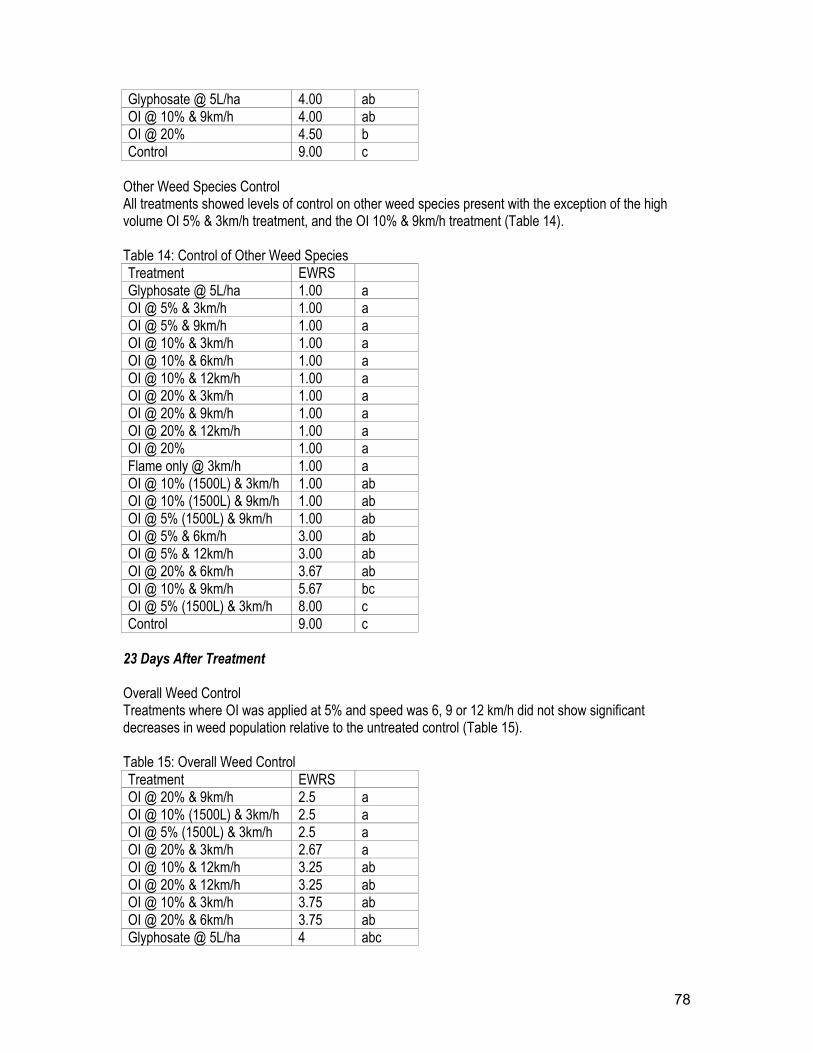
78
Glyphosate @ 5L/ha 4.00 ab OI @ 10% & 9km/h 4.00 ab OI @ 20% 4.50 b Control 9.00 c
Other Weed Species Control All treatments showed levels of control on other weed species present with the exception of the high volume OI 5% & 3km/h treatment, and the OI 10% & 9km/h treatment (Table 14). Table 14: Control of Other Weed Species Treatment EWRS Glyphosate @ 5L/ha 1.00 a OI @ 5% & 3km/h 1.00 a OI @ 5% & 9km/h 1.00 a OI @ 10% & 3km/h 1.00 a OI @ 10% & 6km/h 1.00 a OI @ 10% & 12km/h 1.00 a OI @ 20% & 3km/h 1.00 a OI @ 20% & 9km/h 1.00 a OI @ 20% & 12km/h 1.00 a OI @ 20% 1.00 a Flame only @ 3km/h 1.00 a OI @ 10% (1500L) & 3km/h 1.00 ab OI @ 10% (1500L) & 9km/h 1.00 ab OI @ 5% (1500L) & 9km/h 1.00 ab OI @ 5% & 6km/h 3.00 ab OI @ 5% & 12km/h 3.00 ab OI @ 20% & 6km/h 3.67 ab OI @ 10% & 9km/h 5.67 bc OI @ 5% (1500L) & 3km/h 8.00 c Control 9.00 c
23 Days After Treatment Overall Weed Control Treatments where OI was applied at 5% and speed was 6, 9 or 12 km/h did not show significant decreases in weed population relative to the untreated control (Table 15). Table 15: Overall Weed Control Treatment EWRS OI @ 20% & 9km/h 2.5 a OI @ 10% (1500L) & 3km/h 2.5 a OI @ 5% (1500L) & 3km/h 2.5 a OI @ 20% & 3km/h 2.67 a OI @ 10% & 12km/h 3.25 ab OI @ 20% & 12km/h 3.25 ab OI @ 10% & 3km/h 3.75 ab OI @ 20% & 6km/h 3.75 ab Glyphosate @ 5L/ha 4 abc
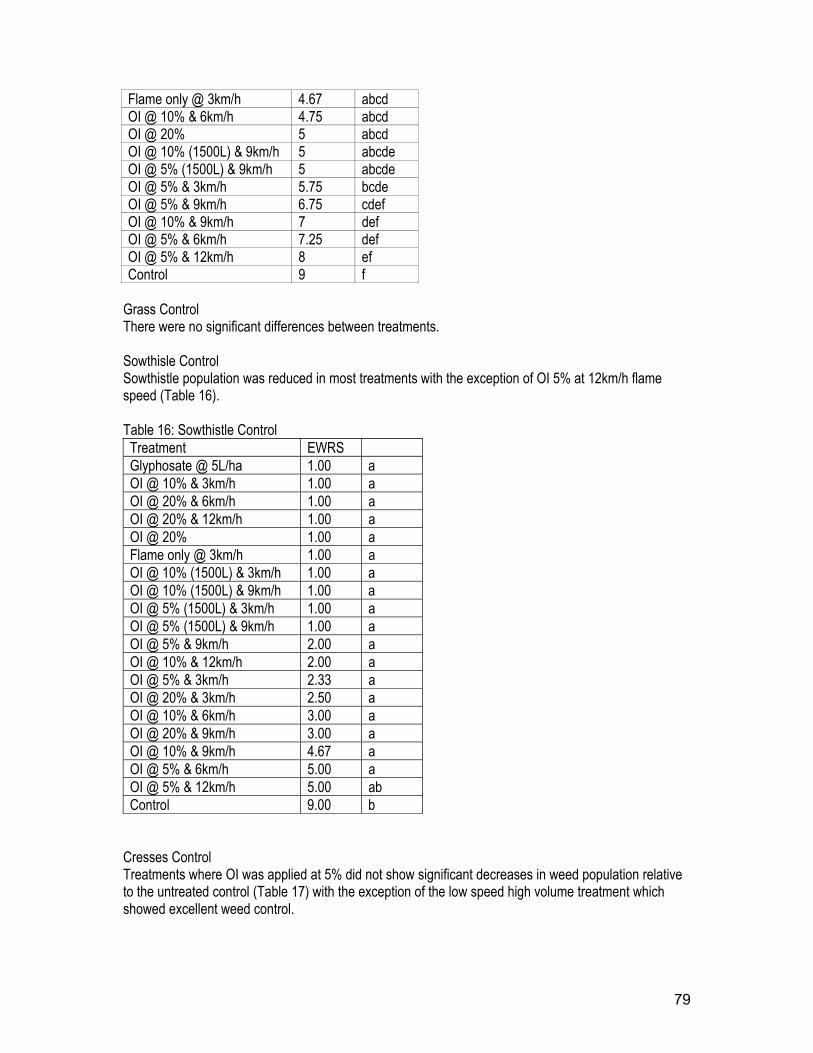
79
Flame only @ 3km/h 4.67 abcd OI @ 10% & 6km/h 4.75 abcd OI @ 20% 5 abcd OI @ 10% (1500L) & 9km/h 5 abcde OI @ 5% (1500L) & 9km/h 5 abcde OI @ 5% & 3km/h 5.75 bcde OI @ 5% & 9km/h 6.75 cdef OI @ 10% & 9km/h 7 def OI @ 5% & 6km/h 7.25 def OI @ 5% & 12km/h 8 ef Control 9 f
Grass Control There were no significant differences between treatments. Sowthisle Control Sowthistle population was reduced in most treatments with the exception of OI 5% at 12km/h flame speed (Table 16). Table 16: Sowthistle Control Treatment EWRS Glyphosate @ 5L/ha 1.00 a OI @ 10% & 3km/h 1.00 a OI @ 20% & 6km/h 1.00 a OI @ 20% & 12km/h 1.00 a OI @ 20% 1.00 a Flame only @ 3km/h 1.00 a OI @ 10% (1500L) & 3km/h 1.00 a OI @ 10% (1500L) & 9km/h 1.00 a OI @ 5% (1500L) & 3km/h 1.00 a OI @ 5% (1500L) & 9km/h 1.00 a OI @ 5% & 9km/h 2.00 a OI @ 10% & 12km/h 2.00 a OI @ 5% & 3km/h 2.33 a OI @ 20% & 3km/h 2.50 a OI @ 10% & 6km/h 3.00 a OI @ 20% & 9km/h 3.00 a OI @ 10% & 9km/h 4.67 a OI @ 5% & 6km/h 5.00 a OI @ 5% & 12km/h 5.00 ab Control 9.00 b
Cresses Control Treatments where OI was applied at 5% did not show significant decreases in weed population relative to the untreated control (Table 17) with the exception of the low speed high volume treatment which showed excellent weed control.
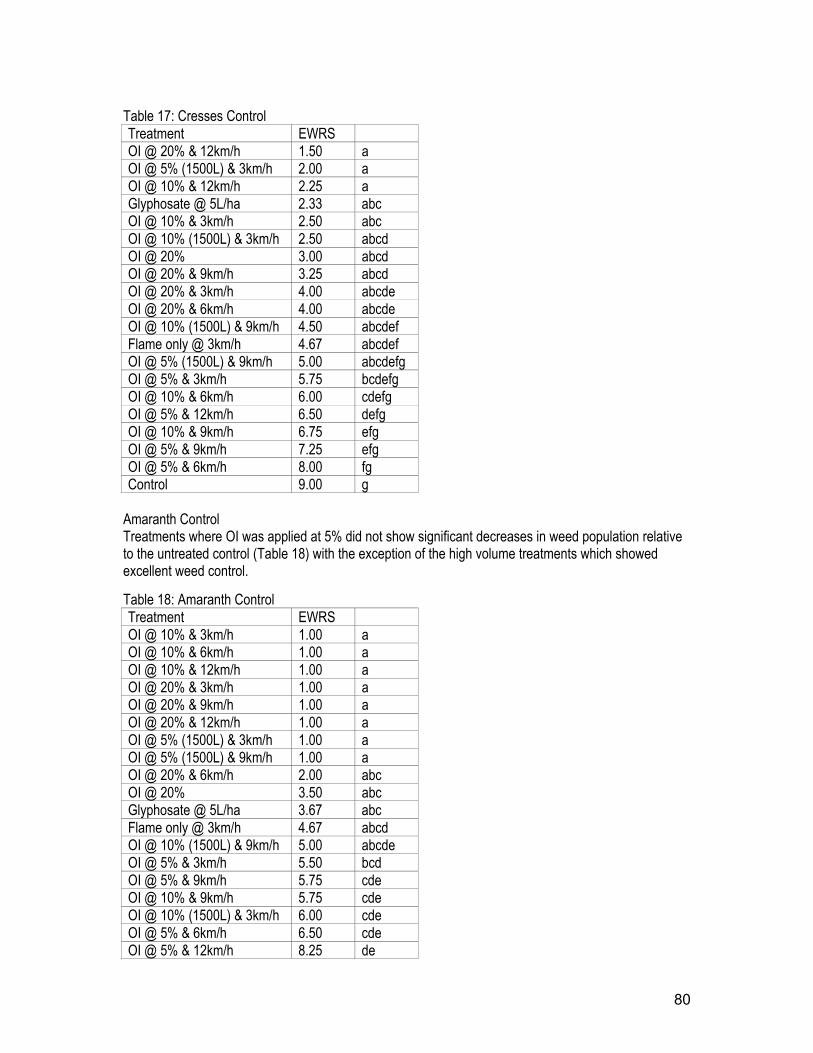
80
Table 17: Cresses Control Treatment EWRS OI @ 20% & 12km/h 1.50 a OI @ 5% (1500L) & 3km/h 2.00 a OI @ 10% & 12km/h 2.25 a Glyphosate @ 5L/ha 2.33 abc OI @ 10% & 3km/h 2.50 abc OI @ 10% (1500L) & 3km/h 2.50 abcd OI @ 20% 3.00 abcd OI @ 20% & 9km/h 3.25 abcd OI @ 20% & 3km/h 4.00 abcde OI @ 20% & 6km/h 4.00 abcde OI @ 10% (1500L) & 9km/h 4.50 abcdef Flame only @ 3km/h 4.67 abcdef OI @ 5% (1500L) & 9km/h 5.00 abcdefg OI @ 5% & 3km/h 5.75 bcdefg OI @ 10% & 6km/h 6.00 cdefg OI @ 5% & 12km/h 6.50 defg OI @ 10% & 9km/h 6.75 efg OI @ 5% & 9km/h 7.25 efg OI @ 5% & 6km/h 8.00 fg Control 9.00 g
Amaranth Control Treatments where OI was applied at 5% did not show significant decreases in weed population relative to the untreated control (Table 18) with the exception of the high volume treatments which showed excellent weed control. Table 18: Amaranth Control Treatment EWRS OI @ 10% & 3km/h 1.00 a OI @ 10% & 6km/h 1.00 a OI @ 10% & 12km/h 1.00 a OI @ 20% & 3km/h 1.00 a OI @ 20% & 9km/h 1.00 a OI @ 20% & 12km/h 1.00 a OI @ 5% (1500L) & 3km/h 1.00 a OI @ 5% (1500L) & 9km/h 1.00 a OI @ 20% & 6km/h 2.00 abc OI @ 20% 3.50 abc Glyphosate @ 5L/ha 3.67 abc Flame only @ 3km/h 4.67 abcd OI @ 10% (1500L) & 9km/h 5.00 abcde OI @ 5% & 3km/h 5.50 bcd OI @ 5% & 9km/h 5.75 cde OI @ 10% & 9km/h 5.75 cde OI @ 10% (1500L) & 3km/h 6.00 cde OI @ 5% & 6km/h 6.50 cde OI @ 5% & 12km/h 8.25 de
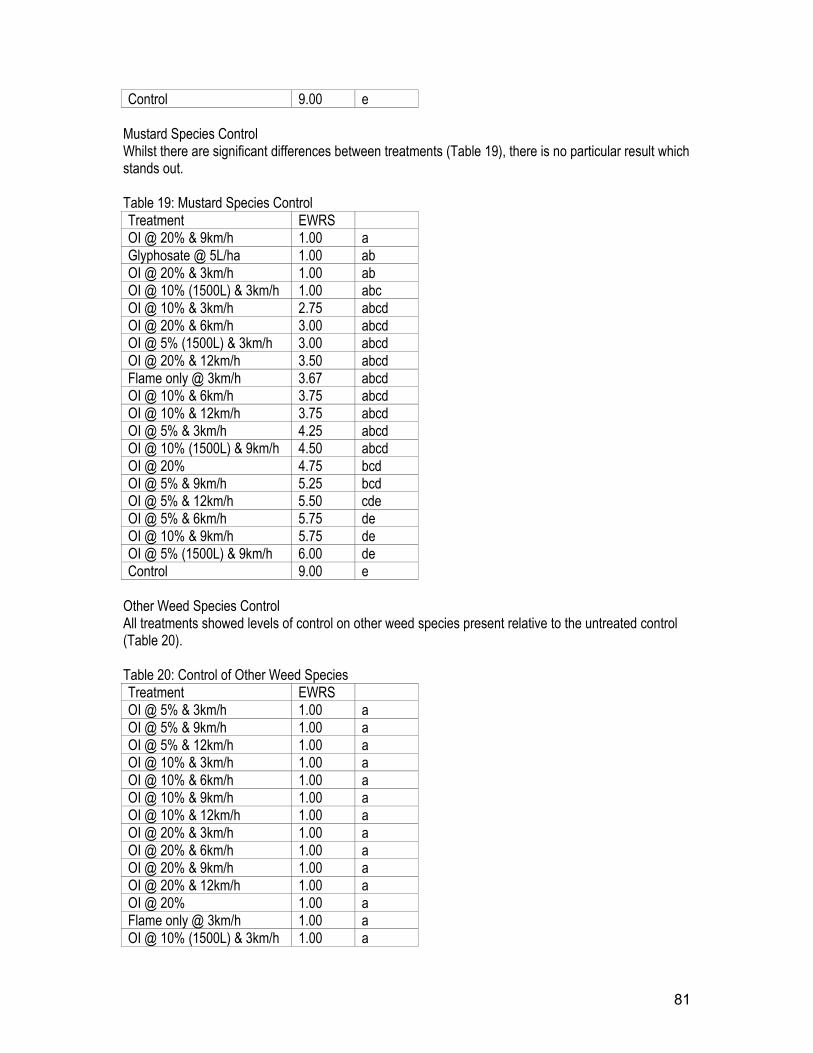
81
Control 9.00 e Mustard Species Control Whilst there are significant differences between treatments (Table 19), there is no particular result which stands out. Table 19: Mustard Species Control Treatment EWRS OI @ 20% & 9km/h 1.00 a Glyphosate @ 5L/ha 1.00 ab OI @ 20% & 3km/h 1.00 ab OI @ 10% (1500L) & 3km/h 1.00 abc OI @ 10% & 3km/h 2.75 abcd OI @ 20% & 6km/h 3.00 abcd OI @ 5% (1500L) & 3km/h 3.00 abcd OI @ 20% & 12km/h 3.50 abcd Flame only @ 3km/h 3.67 abcd OI @ 10% & 6km/h 3.75 abcd OI @ 10% & 12km/h 3.75 abcd OI @ 5% & 3km/h 4.25 abcd OI @ 10% (1500L) & 9km/h 4.50 abcd OI @ 20% 4.75 bcd OI @ 5% & 9km/h 5.25 bcd OI @ 5% & 12km/h 5.50 cde OI @ 5% & 6km/h 5.75 de OI @ 10% & 9km/h 5.75 de OI @ 5% (1500L) & 9km/h 6.00 de Control 9.00 e
Other Weed Species Control All treatments showed levels of control on other weed species present relative to the untreated control (Table 20). Table 20: Control of Other Weed Species Treatment EWRS OI @ 5% & 3km/h 1.00 a OI @ 5% & 9km/h 1.00 a OI @ 5% & 12km/h 1.00 a OI @ 10% & 3km/h 1.00 a OI @ 10% & 6km/h 1.00 a OI @ 10% & 9km/h 1.00 a OI @ 10% & 12km/h 1.00 a OI @ 20% & 3km/h 1.00 a OI @ 20% & 6km/h 1.00 a OI @ 20% & 9km/h 1.00 a OI @ 20% & 12km/h 1.00 a OI @ 20% 1.00 a Flame only @ 3km/h 1.00 a OI @ 10% (1500L) & 3km/h 1.00 a
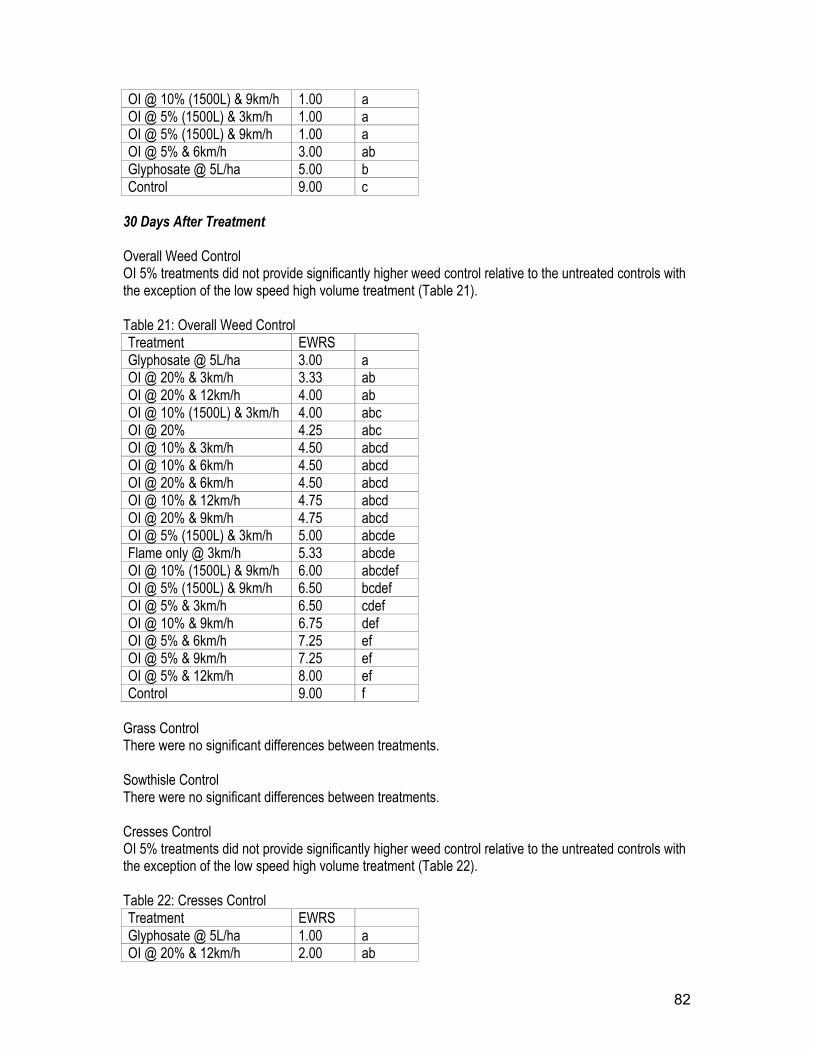
82
OI @ 10% (1500L) & 9km/h 1.00 a OI @ 5% (1500L) & 3km/h 1.00 a OI @ 5% (1500L) & 9km/h 1.00 a OI @ 5% & 6km/h 3.00 ab Glyphosate @ 5L/ha 5.00 b Control 9.00 c
30 Days After Treatment Overall Weed Control OI 5% treatments did not provide significantly higher weed control relative to the untreated controls with the exception of the low speed high volume treatment (Table 21). Table 21: Overall Weed Control Treatment EWRS Glyphosate @ 5L/ha 3.00 a OI @ 20% & 3km/h 3.33 ab OI @ 20% & 12km/h 4.00 ab OI @ 10% (1500L) & 3km/h 4.00 abc OI @ 20% 4.25 abc OI @ 10% & 3km/h 4.50 abcd OI @ 10% & 6km/h 4.50 abcd OI @ 20% & 6km/h 4.50 abcd OI @ 10% & 12km/h 4.75 abcd OI @ 20% & 9km/h 4.75 abcd OI @ 5% (1500L) & 3km/h 5.00 abcde Flame only @ 3km/h 5.33 abcde OI @ 10% (1500L) & 9km/h 6.00 abcdef OI @ 5% (1500L) & 9km/h 6.50 bcdef OI @ 5% & 3km/h 6.50 cdef OI @ 10% & 9km/h 6.75 def OI @ 5% & 6km/h 7.25 ef OI @ 5% & 9km/h 7.25 ef OI @ 5% & 12km/h 8.00 ef Control 9.00 f
Grass Control There were no significant differences between treatments. Sowthisle Control There were no significant differences between treatments. Cresses Control OI 5% treatments did not provide significantly higher weed control relative to the untreated controls with the exception of the low speed high volume treatment (Table 22). Table 22: Cresses Control Treatment EWRS Glyphosate @ 5L/ha 1.00 a OI @ 20% & 12km/h 2.00 ab
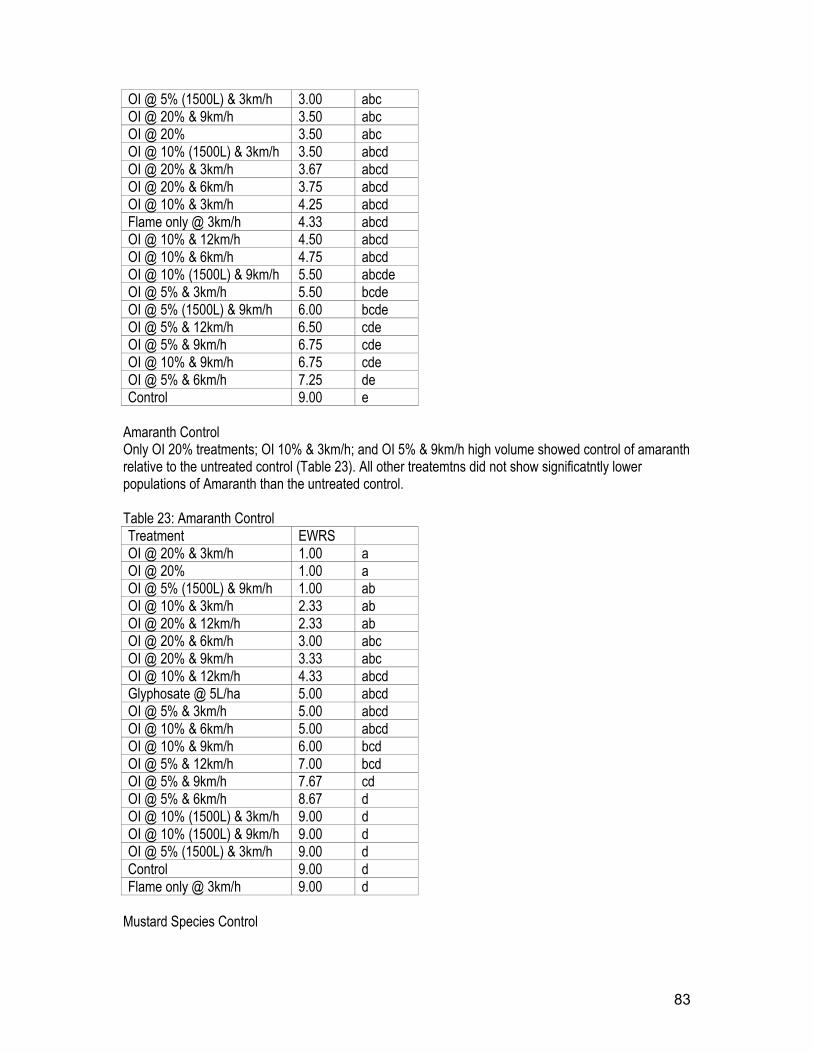
83
OI @ 5% (1500L) & 3km/h 3.00 abc OI @ 20% & 9km/h 3.50 abc OI @ 20% 3.50 abc OI @ 10% (1500L) & 3km/h 3.50 abcd OI @ 20% & 3km/h 3.67 abcd OI @ 20% & 6km/h 3.75 abcd OI @ 10% & 3km/h 4.25 abcd Flame only @ 3km/h 4.33 abcd OI @ 10% & 12km/h 4.50 abcd OI @ 10% & 6km/h 4.75 abcd OI @ 10% (1500L) & 9km/h 5.50 abcde OI @ 5% & 3km/h 5.50 bcde OI @ 5% (1500L) & 9km/h 6.00 bcde OI @ 5% & 12km/h 6.50 cde OI @ 5% & 9km/h 6.75 cde OI @ 10% & 9km/h 6.75 cde OI @ 5% & 6km/h 7.25 de Control 9.00 e
Amaranth Control Only OI 20% treatments; OI 10% & 3km/h; and OI 5% & 9km/h high volume showed control of amaranth relative to the untreated control (Table 23). All other treatemtns did not show significatntly lower populations of Amaranth than the untreated control. Table 23: Amaranth Control Treatment EWRS OI @ 20% & 3km/h 1.00 a OI @ 20% 1.00 a OI @ 5% (1500L) & 9km/h 1.00 ab OI @ 10% & 3km/h 2.33 ab OI @ 20% & 12km/h 2.33 ab OI @ 20% & 6km/h 3.00 abc OI @ 20% & 9km/h 3.33 abc OI @ 10% & 12km/h 4.33 abcd Glyphosate @ 5L/ha 5.00 abcd OI @ 5% & 3km/h 5.00 abcd OI @ 10% & 6km/h 5.00 abcd OI @ 10% & 9km/h 6.00 bcd OI @ 5% & 12km/h 7.00 bcd OI @ 5% & 9km/h 7.67 cd OI @ 5% & 6km/h 8.67 d OI @ 10% (1500L) & 3km/h 9.00 d OI @ 10% (1500L) & 9km/h 9.00 d OI @ 5% (1500L) & 3km/h 9.00 d Control 9.00 d Flame only @ 3km/h 9.00 d
Mustard Species Control
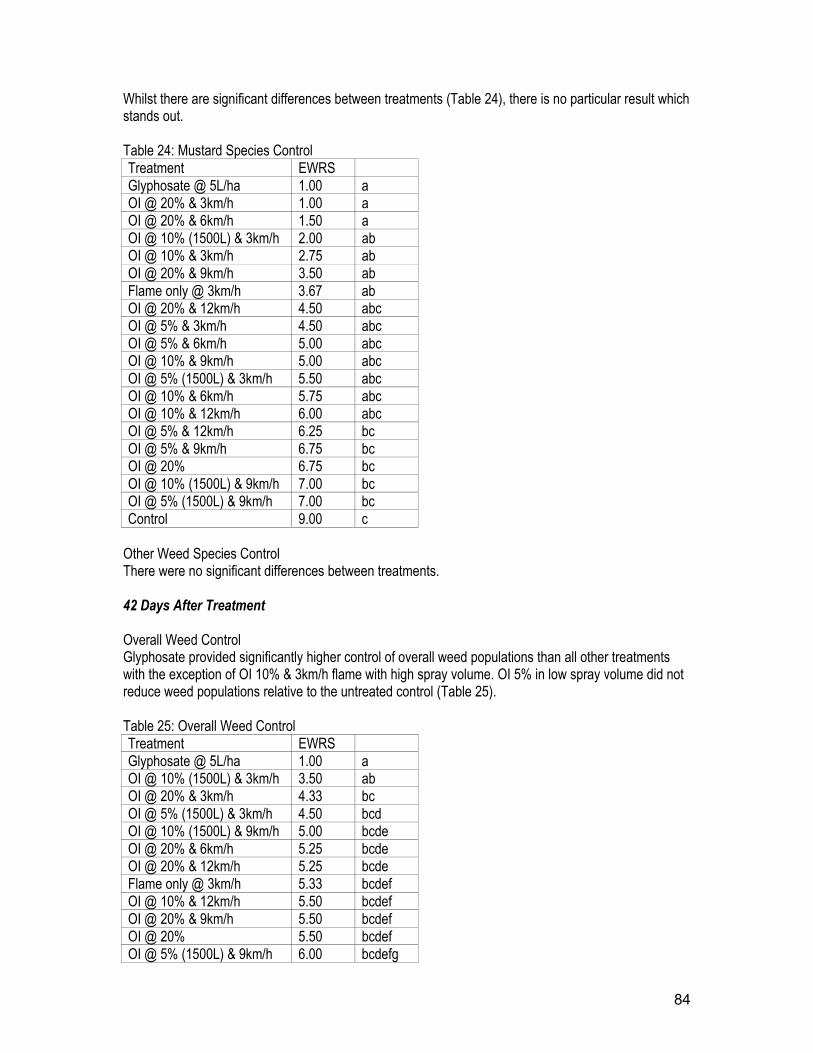
84
Whilst there are significant differences between treatments (Table 24), there is no particular result which stands out. Table 24: Mustard Species Control Treatment EWRS Glyphosate @ 5L/ha 1.00 a OI @ 20% & 3km/h 1.00 a OI @ 20% & 6km/h 1.50 a OI @ 10% (1500L) & 3km/h 2.00 ab OI @ 10% & 3km/h 2.75 ab OI @ 20% & 9km/h 3.50 ab Flame only @ 3km/h 3.67 ab OI @ 20% & 12km/h 4.50 abc OI @ 5% & 3km/h 4.50 abc OI @ 5% & 6km/h 5.00 abc OI @ 10% & 9km/h 5.00 abc OI @ 5% (1500L) & 3km/h 5.50 abc OI @ 10% & 6km/h 5.75 abc OI @ 10% & 12km/h 6.00 abc OI @ 5% & 12km/h 6.25 bc OI @ 5% & 9km/h 6.75 bc OI @ 20% 6.75 bc OI @ 10% (1500L) & 9km/h 7.00 bc OI @ 5% (1500L) & 9km/h 7.00 bc Control 9.00 c
Other Weed Species Control There were no significant differences between treatments. 42 Days After Treatment Overall Weed Control Glyphosate provided significantly higher control of overall weed populations than all other treatments with the exception of OI 10% & 3km/h flame with high spray volume. OI 5% in low spray volume did not reduce weed populations relative to the untreated control (Table 25). Table 25: Overall Weed Control Treatment EWRS Glyphosate @ 5L/ha 1.00 a OI @ 10% (1500L) & 3km/h 3.50 ab OI @ 20% & 3km/h 4.33 bc OI @ 5% (1500L) & 3km/h 4.50 bcd OI @ 10% (1500L) & 9km/h 5.00 bcde OI @ 20% & 6km/h 5.25 bcde OI @ 20% & 12km/h 5.25 bcde Flame only @ 3km/h 5.33 bcdef OI @ 10% & 12km/h 5.50 bcdef OI @ 20% & 9km/h 5.50 bcdef OI @ 20% 5.50 bcdef OI @ 5% (1500L) & 9km/h 6.00 bcdefg
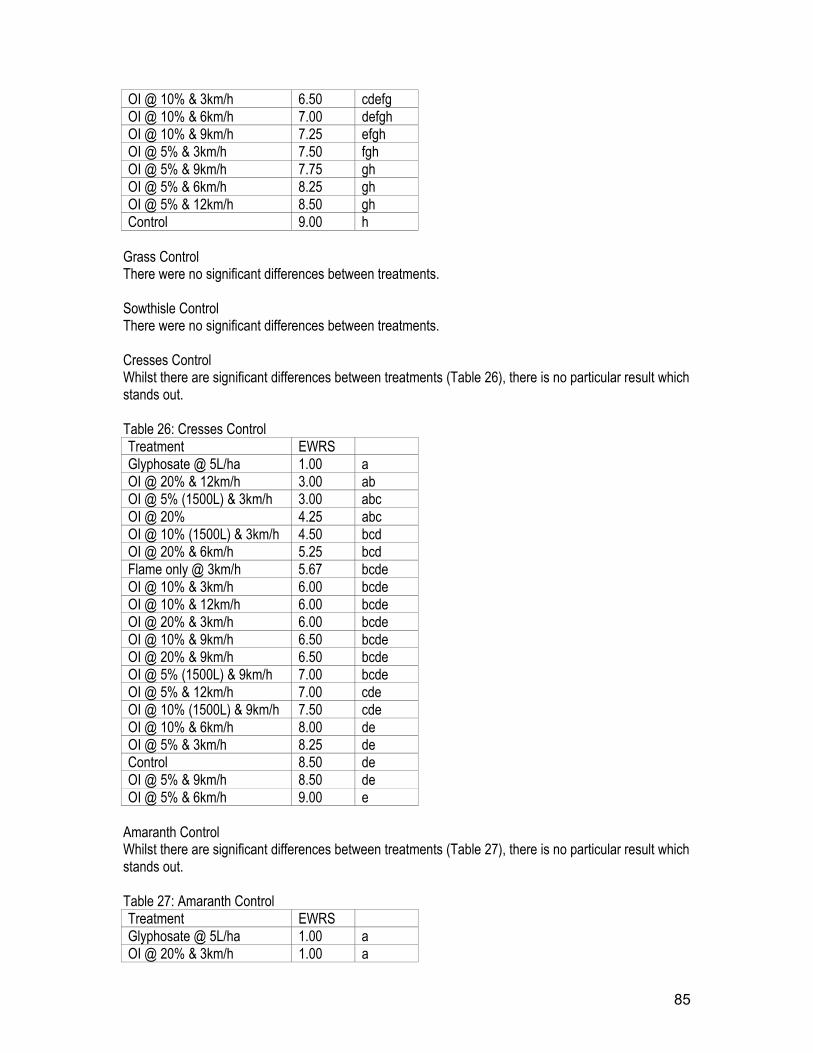
85
OI @ 10% & 3km/h 6.50 cdefg OI @ 10% & 6km/h 7.00 defgh OI @ 10% & 9km/h 7.25 efgh OI @ 5% & 3km/h 7.50 fgh OI @ 5% & 9km/h 7.75 gh OI @ 5% & 6km/h 8.25 gh OI @ 5% & 12km/h 8.50 gh Control 9.00 h
Grass Control There were no significant differences between treatments. Sowthisle Control There were no significant differences between treatments. Cresses Control Whilst there are significant differences between treatments (Table 26), there is no particular result which stands out. Table 26: Cresses Control Treatment EWRS Glyphosate @ 5L/ha 1.00 a OI @ 20% & 12km/h 3.00 ab OI @ 5% (1500L) & 3km/h 3.00 abc OI @ 20% 4.25 abc OI @ 10% (1500L) & 3km/h 4.50 bcd OI @ 20% & 6km/h 5.25 bcd Flame only @ 3km/h 5.67 bcde OI @ 10% & 3km/h 6.00 bcde OI @ 10% & 12km/h 6.00 bcde OI @ 20% & 3km/h 6.00 bcde OI @ 10% & 9km/h 6.50 bcde OI @ 20% & 9km/h 6.50 bcde OI @ 5% (1500L) & 9km/h 7.00 bcde OI @ 5% & 12km/h 7.00 cde OI @ 10% (1500L) & 9km/h 7.50 cde OI @ 10% & 6km/h 8.00 de OI @ 5% & 3km/h 8.25 de Control 8.50 de OI @ 5% & 9km/h 8.50 de OI @ 5% & 6km/h 9.00 e
Amaranth Control Whilst there are significant differences between treatments (Table 27), there is no particular result which stands out. Table 27: Amaranth Control Treatment EWRS Glyphosate @ 5L/ha 1.00 a OI @ 20% & 3km/h 1.00 a
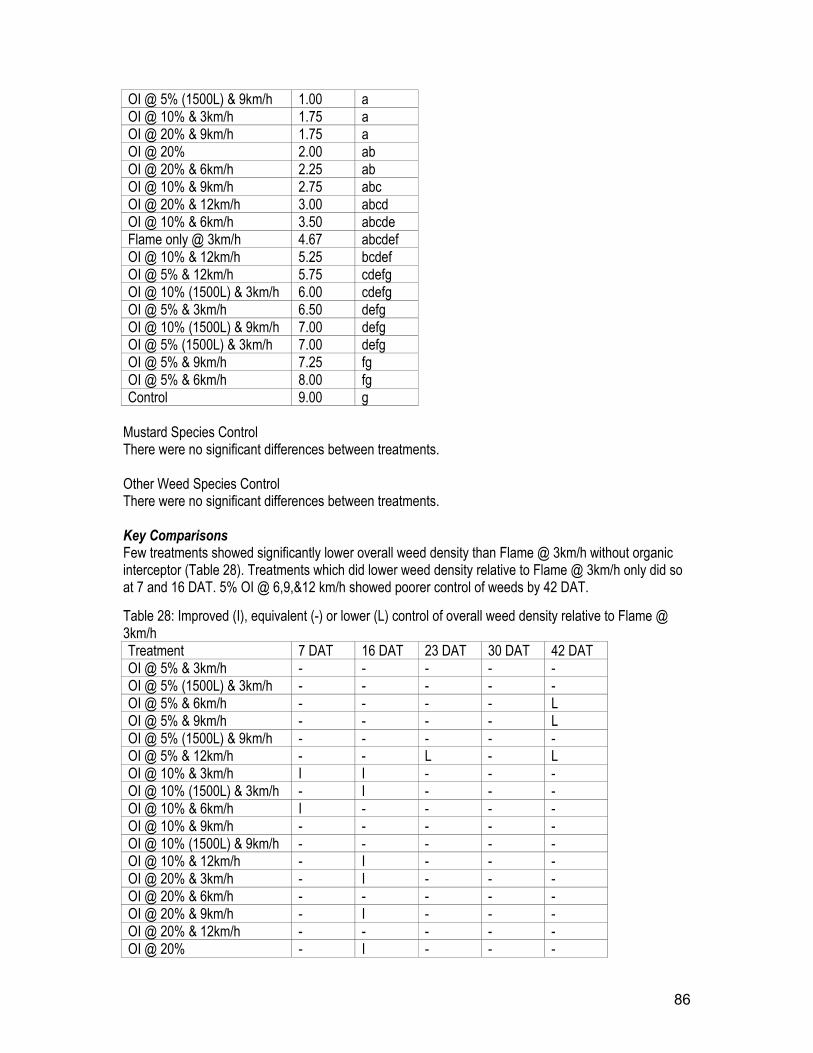
86
OI @ 5% (1500L) & 9km/h 1.00 a OI @ 10% & 3km/h 1.75 a OI @ 20% & 9km/h 1.75 a OI @ 20% 2.00 ab OI @ 20% & 6km/h 2.25 ab OI @ 10% & 9km/h 2.75 abc OI @ 20% & 12km/h 3.00 abcd OI @ 10% & 6km/h 3.50 abcde Flame only @ 3km/h 4.67 abcdef OI @ 10% & 12km/h 5.25 bcdef OI @ 5% & 12km/h 5.75 cdefg OI @ 10% (1500L) & 3km/h 6.00 cdefg OI @ 5% & 3km/h 6.50 defg OI @ 10% (1500L) & 9km/h 7.00 defg OI @ 5% (1500L) & 3km/h 7.00 defg OI @ 5% & 9km/h 7.25 fg OI @ 5% & 6km/h 8.00 fg Control 9.00 g
Mustard Species Control There were no significant differences between treatments. Other Weed Species Control There were no significant differences between treatments. Key Comparisons Few treatments showed significantly lower overall weed density than Flame @ 3km/h without organic interceptor (Table 28). Treatments which did lower weed density relative to Flame @ 3km/h only did so at 7 and 16 DAT. 5% OI @ 6,9,&12 km/h showed poorer control of weeds by 42 DAT. Table 28: Improved (I), equivalent (-) or lower (L) control of overall weed density relative to Flame @ 3km/h Treatment 7 DAT 16 DAT 23 DAT 30 DAT 42 DAT OI @ 5% & 3km/h - - - - - OI @ 5% (1500L) & 3km/h - - - - - OI @ 5% & 6km/h - - - - L OI @ 5% & 9km/h - - - - L OI @ 5% (1500L) & 9km/h - - - - - OI @ 5% & 12km/h - - L - L OI @ 10% & 3km/h I I - - - OI @ 10% (1500L) & 3km/h - I - - - OI @ 10% & 6km/h I - - - - OI @ 10% & 9km/h - - - - - OI @ 10% (1500L) & 9km/h - - - - - OI @ 10% & 12km/h - I - - - OI @ 20% & 3km/h - I - - - OI @ 20% & 6km/h - - - - - OI @ 20% & 9km/h - I - - - OI @ 20% & 12km/h - - - - - OI @ 20% - I - - -
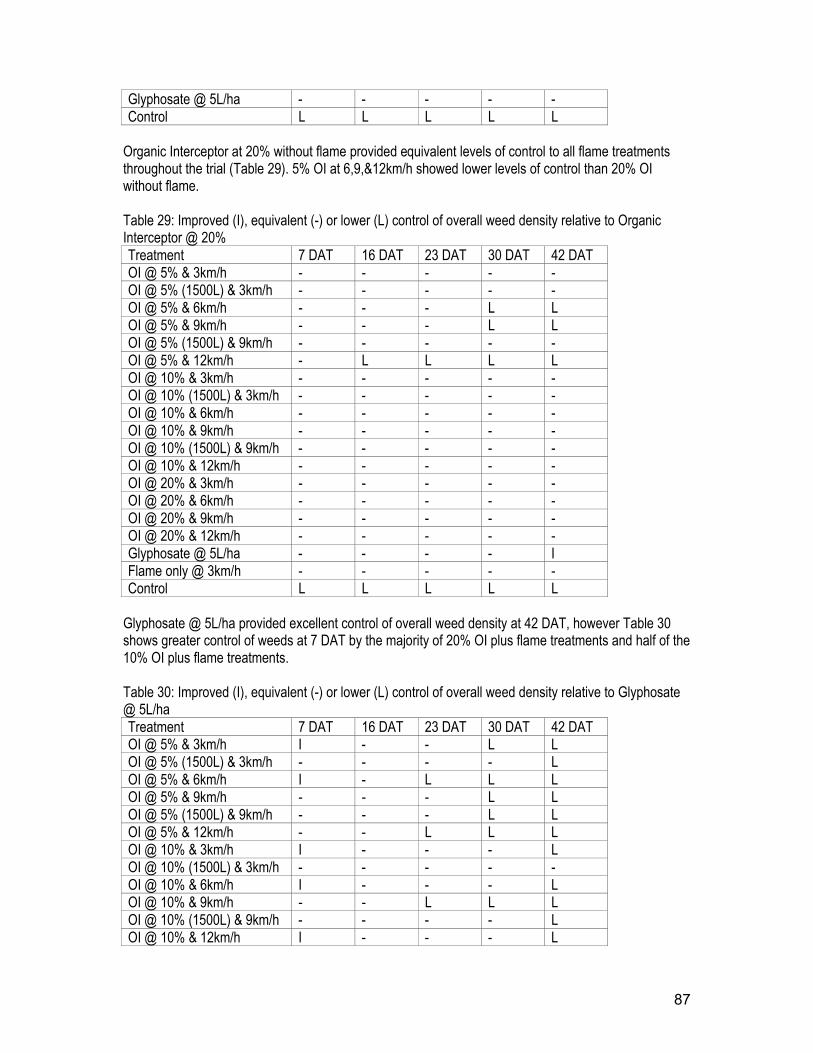
87
Glyphosate @ 5L/ha - - - - - Control L L L L L
Organic Interceptor at 20% without flame provided equivalent levels of control to all flame treatments throughout the trial (Table 29). 5% OI at 6,9,&12km/h showed lower levels of control than 20% OI without flame. Table 29: Improved (I), equivalent (-) or lower (L) control of overall weed density relative to Organic Interceptor @ 20% Treatment 7 DAT 16 DAT 23 DAT 30 DAT 42 DAT OI @ 5% & 3km/h - - - - - OI @ 5% (1500L) & 3km/h - - - - - OI @ 5% & 6km/h - - - L L OI @ 5% & 9km/h - - - L L OI @ 5% (1500L) & 9km/h - - - - - OI @ 5% & 12km/h - L L L L OI @ 10% & 3km/h - - - - - OI @ 10% (1500L) & 3km/h - - - - - OI @ 10% & 6km/h - - - - - OI @ 10% & 9km/h - - - - - OI @ 10% (1500L) & 9km/h - - - - - OI @ 10% & 12km/h - - - - - OI @ 20% & 3km/h - - - - - OI @ 20% & 6km/h - - - - - OI @ 20% & 9km/h - - - - - OI @ 20% & 12km/h - - - - - Glyphosate @ 5L/ha - - - - I Flame only @ 3km/h - - - - - Control L L L L L
Glyphosate @ 5L/ha provided excellent control of overall weed density at 42 DAT, however Table 30 shows greater control of weeds at 7 DAT by the majority of 20% OI plus flame treatments and half of the 10% OI plus flame treatments. Table 30: Improved (I), equivalent (-) or lower (L) control of overall weed density relative to Glyphosate @ 5L/ha Treatment 7 DAT 16 DAT 23 DAT 30 DAT 42 DAT OI @ 5% & 3km/h I - - L L OI @ 5% (1500L) & 3km/h - - - - L OI @ 5% & 6km/h I - L L L OI @ 5% & 9km/h - - - L L OI @ 5% (1500L) & 9km/h - - - L L OI @ 5% & 12km/h - - L L L OI @ 10% & 3km/h I - - - L OI @ 10% (1500L) & 3km/h - - - - - OI @ 10% & 6km/h I - - - L OI @ 10% & 9km/h - - L L L OI @ 10% (1500L) & 9km/h - - - - L OI @ 10% & 12km/h I - - - L
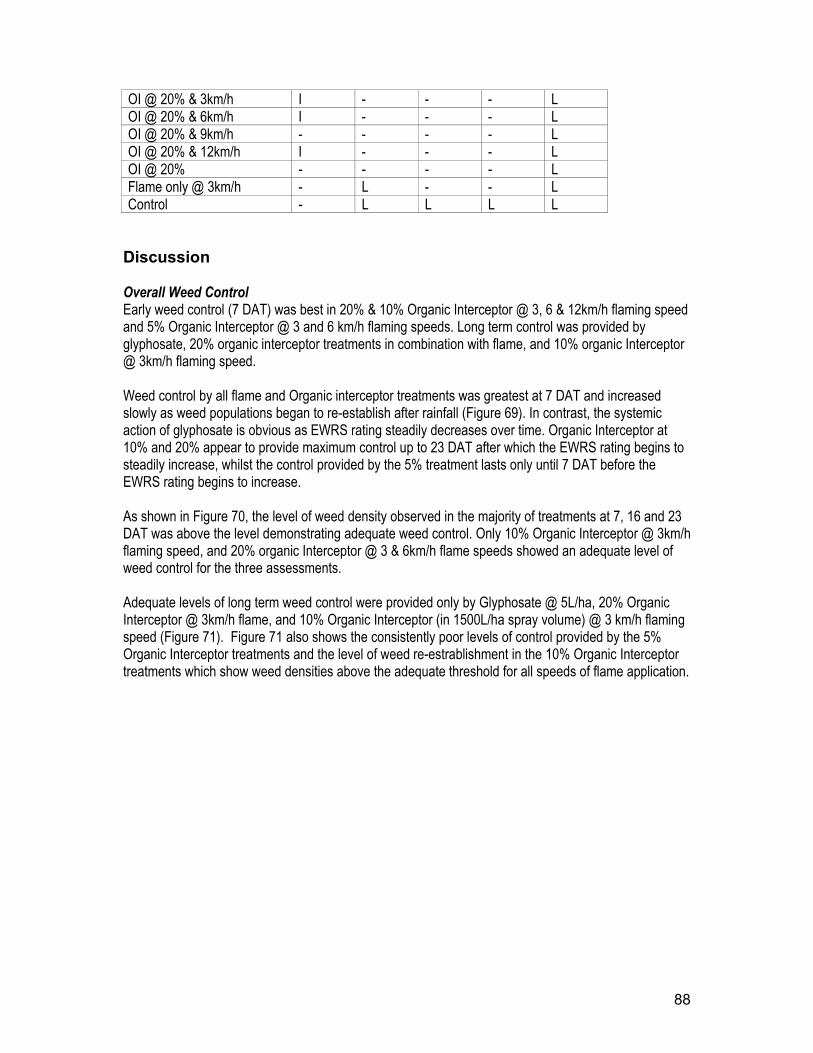
88
OI @ 20% & 3km/h I - - - L OI @ 20% & 6km/h I - - - L OI @ 20% & 9km/h - - - - L OI @ 20% & 12km/h I - - - L OI @ 20% - - - - L Flame only @ 3km/h - L - - L Control - L L L L
Discussion Overall Weed Control Early weed control (7 DAT) was best in 20% & 10% Organic Interceptor @ 3, 6 & 12km/h flaming speed and 5% Organic Interceptor @ 3 and 6 km/h flaming speeds. Long term control was provided by glyphosate, 20% organic interceptor treatments in combination with flame, and 10% organic Interceptor @ 3km/h flaming speed. Weed control by all flame and Organic interceptor treatments was greatest at 7 DAT and increased slowly as weed populations began to re-establish after rainfall (Figure 69). In contrast, the systemic action of glyphosate is obvious as EWRS rating steadily decreases over time. Organic Interceptor at 10% and 20% appear to provide maximum control up to 23 DAT after which the EWRS rating begins to steadily increase, whilst the control provided by the 5% treatment lasts only until 7 DAT before the EWRS rating begins to increase. As shown in Figure 70, the level of weed density observed in the majority of treatments at 7, 16 and 23 DAT was above the level demonstrating adequate weed control. Only 10% Organic Interceptor @ 3km/h flaming speed, and 20% organic Interceptor @ 3 & 6km/h flame speeds showed an adequate level of weed control for the three assessments. Adequate levels of long term weed control were provided only by Glyphosate @ 5L/ha, 20% Organic Interceptor @ 3km/h flame, and 10% Organic Interceptor (in 1500L/ha spray volume) @ 3 km/h flaming speed (Figure 71). Figure 71 also shows the consistently poor levels of control provided by the 5% Organic Interceptor treatments and the level of weed re-estrablishment in the 10% Organic Interceptor treatments which show weed densities above the adequate threshold for all speeds of flame application.
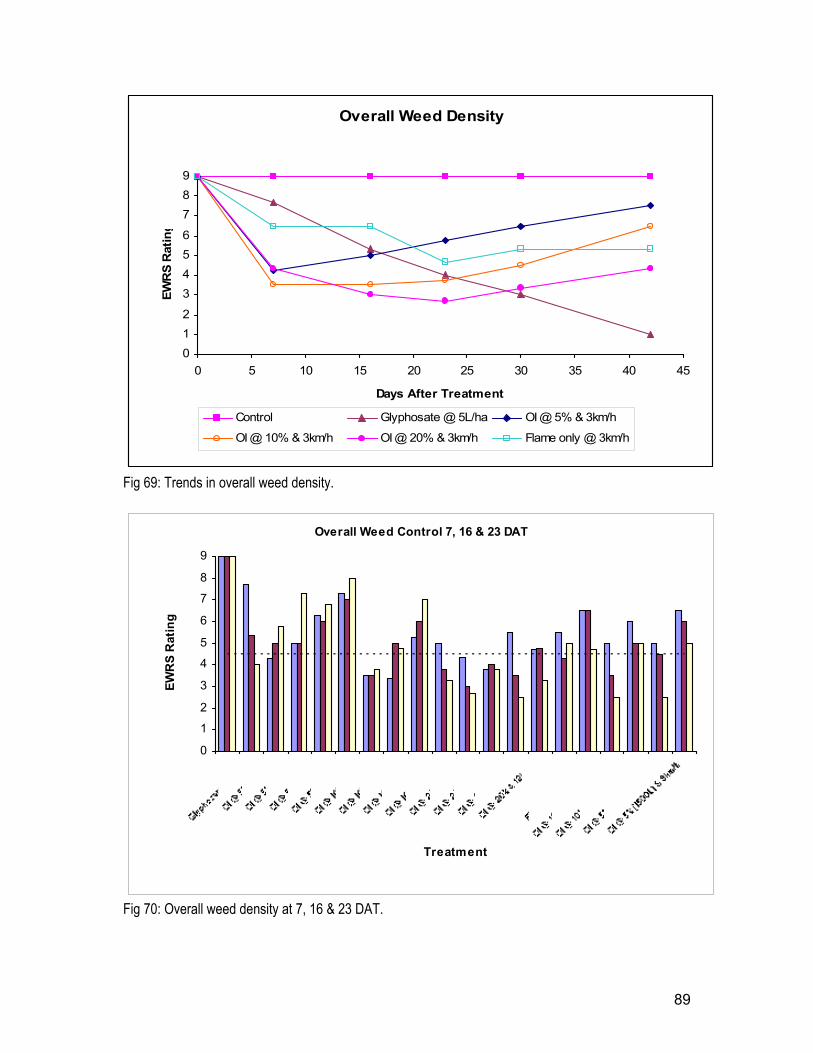
89
Overall Weed Density
012
3456
789
0 5 10 15 20 25 30 35 40 45
Days After Treatment
EWR
S R
atin
g
Control Glyphosate @ 5L/ha OI @ 5% & 3km/h
OI @ 10% & 3km/h OI @ 20% & 3km/h Flame only @ 3km/h
Fig 69: Trends in overall weed density.
Overall Weed Control 7, 16 & 23 DAT
0
1
2
3
4
5
6
7
8
9
Treatment
EWR
S R
atin
g
Fig 70: Overall weed density at 7, 16 & 23 DAT.
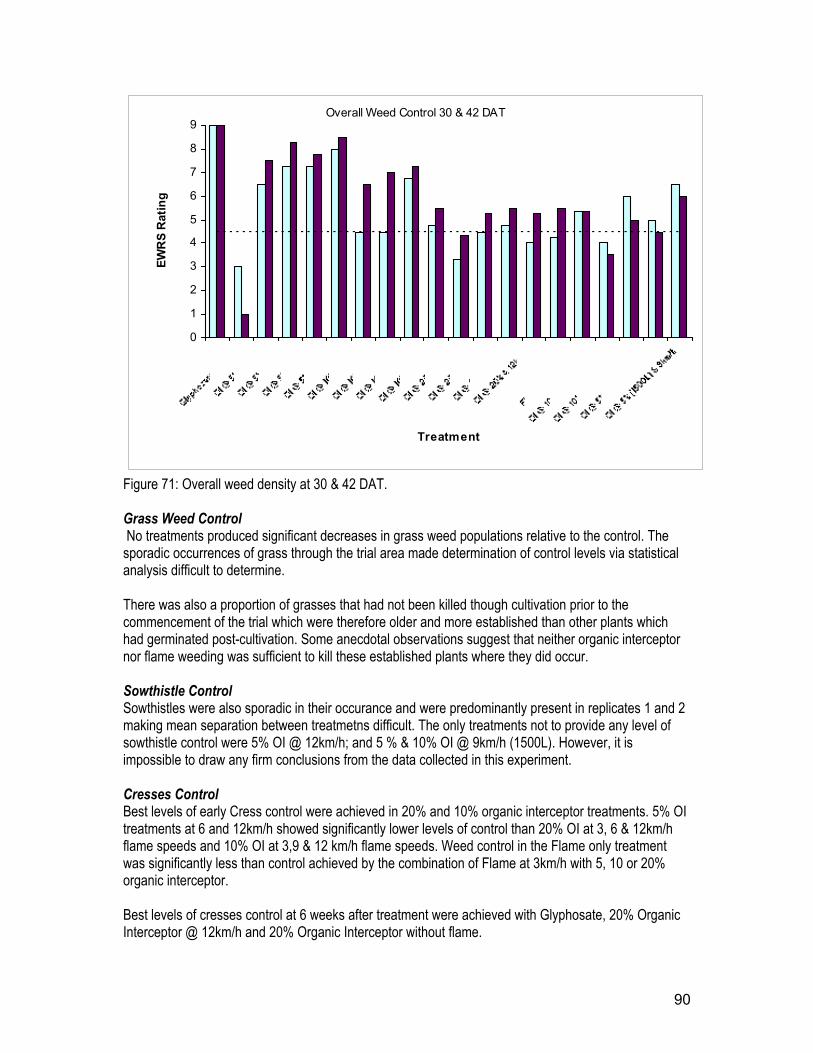
90
Overall Weed Control 30 & 42 DAT
0
1
2
3
4
5
6
7
8
9
Treatment
EWR
S R
atin
g
Figure 71: Overall weed density at 30 & 42 DAT. Grass Weed Control No treatments produced significant decreases in grass weed populations relative to the control. The sporadic occurrences of grass through the trial area made determination of control levels via statistical analysis difficult to determine. There was also a proportion of grasses that had not been killed though cultivation prior to the commencement of the trial which were therefore older and more established than other plants which had germinated post-cultivation. Some anecdotal observations suggest that neither organic interceptor nor flame weeding was sufficient to kill these established plants where they did occur. Sowthistle Control Sowthistles were also sporadic in their occurance and were predominantly present in replicates 1 and 2 making mean separation between treatmetns difficult. The only treatments not to provide any level of sowthistle control were 5% OI @ 12km/h; and 5 % & 10% OI @ 9km/h (1500L). However, it is impossible to draw any firm conclusions from the data collected in this experiment. Cresses Control Best levels of early Cress control were achieved in 20% and 10% organic interceptor treatments. 5% OI treatments at 6 and 12km/h showed significantly lower levels of control than 20% OI at 3, 6 & 12km/h flame speeds and 10% OI at 3,9 & 12 km/h flame speeds. Weed control in the Flame only treatment was significantly less than control achieved by the combination of Flame at 3km/h with 5, 10 or 20% organic interceptor. Best levels of cresses control at 6 weeks after treatment were achieved with Glyphosate, 20% Organic Interceptor @ 12km/h and 20% Organic Interceptor without flame.
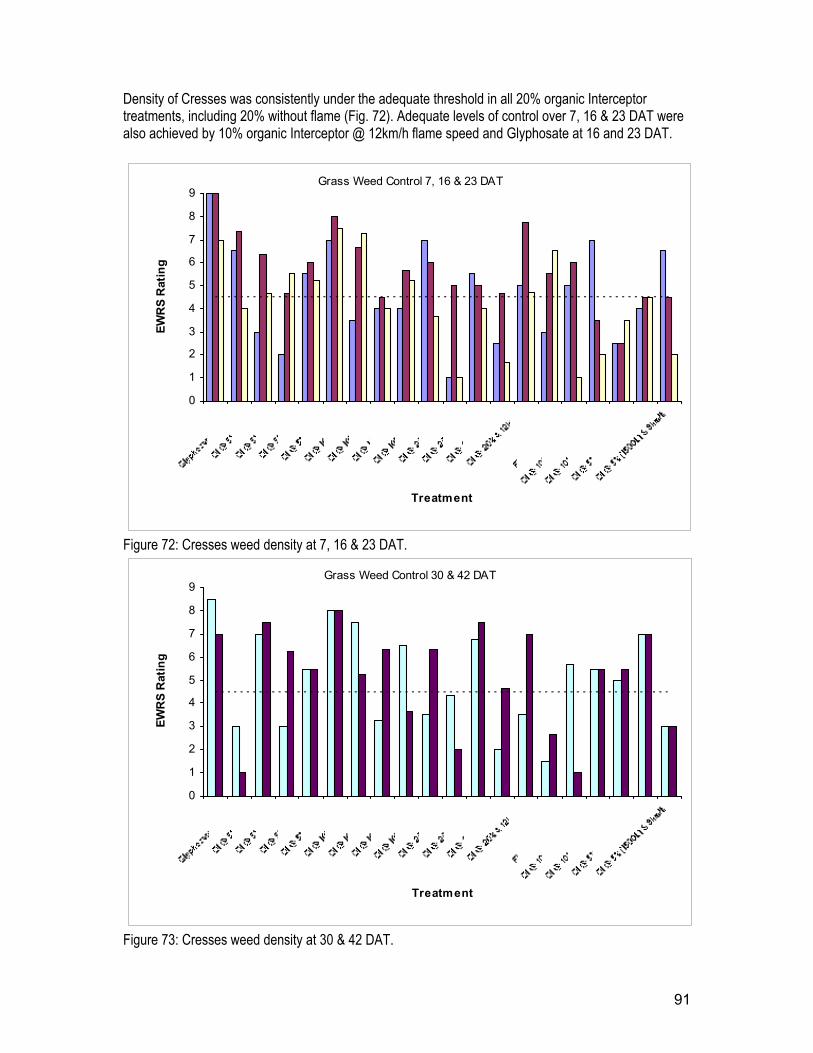
91
Density of Cresses was consistently under the adequate threshold in all 20% organic Interceptor treatments, including 20% without flame (Fig. 72). Adequate levels of control over 7, 16 & 23 DAT were also achieved by 10% organic Interceptor @ 12km/h flame speed and Glyphosate at 16 and 23 DAT.
Grass Weed Control 7, 16 & 23 DAT
0
1
2
3
4
5
6
7
8
9
Treatment
EWR
S R
atin
g
Figure 72: Cresses weed density at 7, 16 & 23 DAT.
Grass Weed Control 30 & 42 DAT
0
1
2
3
4
5
6
7
8
9
Treatment
EWR
S R
atin
g
Figure 73: Cresses weed density at 30 & 42 DAT.
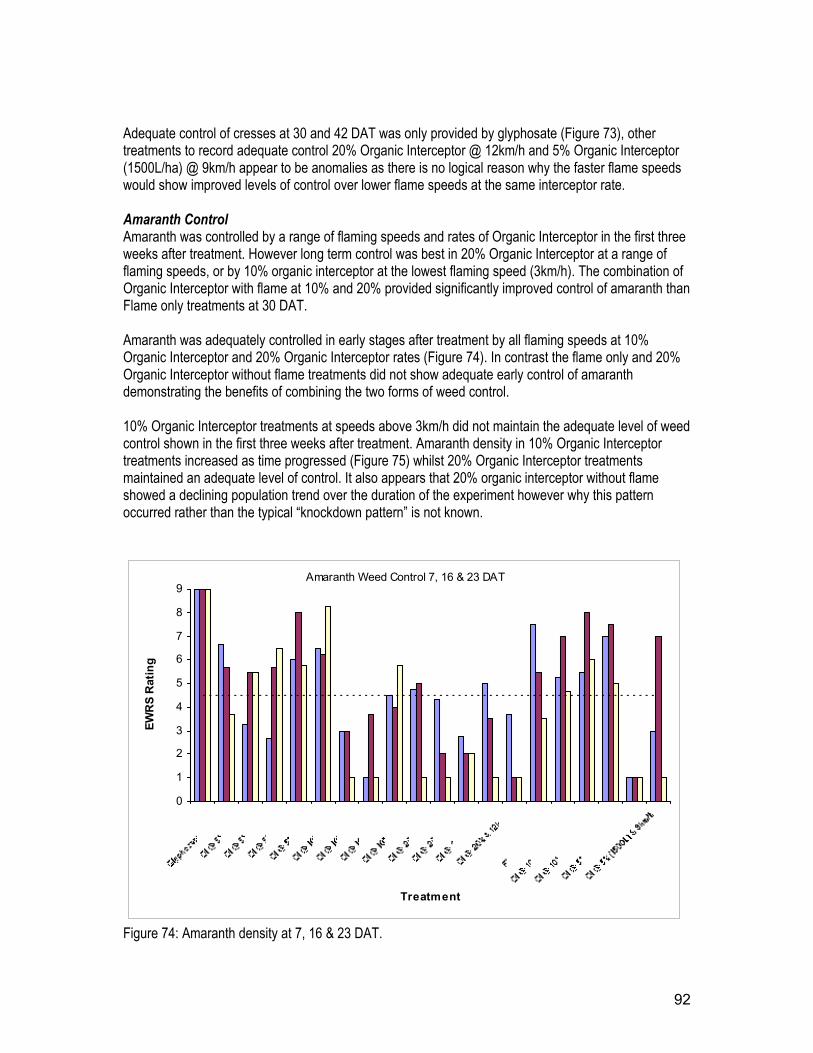
92
Adequate control of cresses at 30 and 42 DAT was only provided by glyphosate (Figure 73), other treatments to record adequate control 20% Organic Interceptor @ 12km/h and 5% Organic Interceptor (1500L/ha) @ 9km/h appear to be anomalies as there is no logical reason why the faster flame speeds would show improved levels of control over lower flame speeds at the same interceptor rate. Amaranth Control Amaranth was controlled by a range of flaming speeds and rates of Organic Interceptor in the first three weeks after treatment. However long term control was best in 20% Organic Interceptor at a range of flaming speeds, or by 10% organic interceptor at the lowest flaming speed (3km/h). The combination of Organic Interceptor with flame at 10% and 20% provided significantly improved control of amaranth than Flame only treatments at 30 DAT. Amaranth was adequately controlled in early stages after treatment by all flaming speeds at 10% Organic Interceptor and 20% Organic Interceptor rates (Figure 74). In contrast the flame only and 20% Organic Interceptor without flame treatments did not show adequate early control of amaranth demonstrating the benefits of combining the two forms of weed control. 10% Organic Interceptor treatments at speeds above 3km/h did not maintain the adequate level of weed control shown in the first three weeks after treatment. Amaranth density in 10% Organic Interceptor treatments increased as time progressed (Figure 75) whilst 20% Organic Interceptor treatments maintained an adequate level of control. It also appears that 20% organic interceptor without flame showed a declining population trend over the duration of the experiment however why this pattern occurred rather than the typical “knockdown pattern” is not known.
Amaranth Weed Control 7, 16 & 23 DAT
0
1
2
3
4
5
6
7
8
9
Treatment
EWR
S R
atin
g
Figure 74: Amaranth density at 7, 16 & 23 DAT.
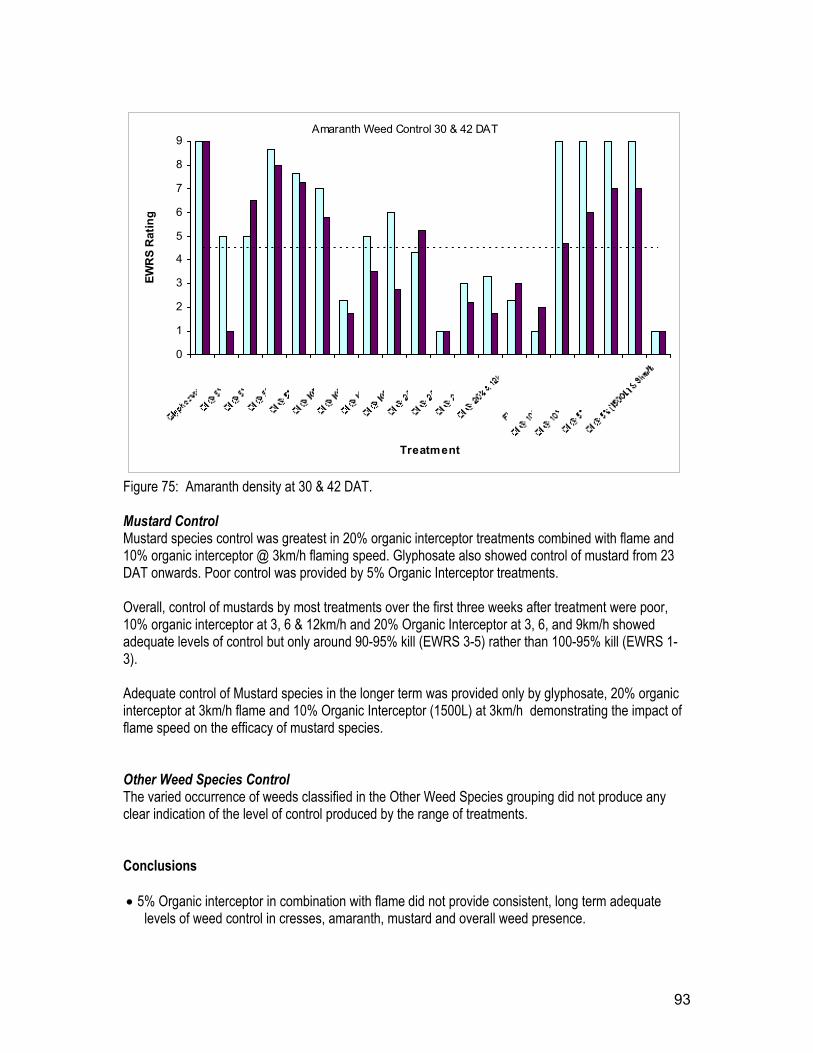
93
Amaranth Weed Control 30 & 42 DAT
0
1
2
3
4
5
6
7
8
9
Treatment
EWR
S R
atin
g
Figure 75: Amaranth density at 30 & 42 DAT. Mustard Control Mustard species control was greatest in 20% organic interceptor treatments combined with flame and 10% organic interceptor @ 3km/h flaming speed. Glyphosate also showed control of mustard from 23 DAT onwards. Poor control was provided by 5% Organic Interceptor treatments. Overall, control of mustards by most treatments over the first three weeks after treatment were poor, 10% organic interceptor at 3, 6 & 12km/h and 20% Organic Interceptor at 3, 6, and 9km/h showed adequate levels of control but only around 90-95% kill (EWRS 3-5) rather than 100-95% kill (EWRS 1-3). Adequate control of Mustard species in the longer term was provided only by glyphosate, 20% organic interceptor at 3km/h flame and 10% Organic Interceptor (1500L) at 3km/h demonstrating the impact of flame speed on the efficacy of mustard species. Other Weed Species Control The varied occurrence of weeds classified in the Other Weed Species grouping did not produce any clear indication of the level of control produced by the range of treatments. Conclusions • 5% Organic interceptor in combination with flame did not provide consistent, long term adequate
levels of weed control in cresses, amaranth, mustard and overall weed presence.
94
• 10% Organic interceptor in combination with flame at 6, 9 and 12km/h did not provide adequate levels of weed control in cresses, amaranth, mustard and overall weed presence in the long term. However the 6km/h treatments did provide adequate control of most species for up to 16 DAT.
• 10% Organic Interceptor in combination with flame at 3km/h provided adequate levels of control for up to 30 DAT in cresses, amaranth and mustard.
• 20% Organic Interceptor in combination with flame at all speeds provided adequate levels of control of all species present for up to 30 DAT.
• 20% Organic Interceptor without flame also provided adequate control of the species present for up to 30 DAT.
• Glyphosate provided the highest level of control in all species for up to 42 DAT, however the systemic nature of the chemical provided poorer levels of control than organic interceptor and flame treatments in the short-term 7-16 DAT.
• Comparisons between treatments suggest that the best level of control using the lowest concentration of Organic Interceptor is provided by combining 10% Organic Interceptor and 3km/h flame weeding.
• Appendix 1 contains a detailed cost comparison between Glyphosate, Organic Interceptor combined with Flame, and Organic Interceptor alone. The savings in running costs for organic growers when combing flame with reduced organic interceptor rate are equivalent to $395/ha.
95
Technology Transfer
Commercial Implementation 1: Mataranka, Northern Territory – Kane and Marie Younghusband Objective: No-Till Seedless Watermelon
Introduction Kane and Marie Younghusband of “Roper River Agriculture” south of Mataranka in the Northern Territory have adapted the no-till techniques to their seedless watermelon farming operation. The most significant change has been to move away from the traditional plastic mulch and replace this with organic mulch. In the past the removal of plastic at the end of the growing season, once the crops have been picked, has been an operation that has caused many headaches (Younghusband, pers. comm.). The removal of plastic takes place during the build up to the wet season in November – December when air temperature exceeds 40˚C. With the wet season rapidly approaching this operation needs to run smoothly and quickly. Under these hot conditions, plastic that has been on the ground for up to 6 months can be difficult to remove. The process of removing the plastic leaves the ground open, and although much of the property is only gently sloping, the red Tipperary sand is very prone to erosion. With the region receiving over 800mm of rainfall on average each year and nearly 90% of this falling in the four months from December to March the need for erosion control measures is critical. Not having to remove plastic mulch at the end of the season leaves the ground in a more stable state. Coupled with the minimum-till planting of next season’s mulch crop further adds to this soil stability. The presence of mulch also greatly reduces wind erosion and seedling damage associated with sand blasting.
Methods A cover crop of Pearl millet was sown into a sandy soil at Mataranka, Northern Territory and grown to a height of approximately 2m. The crop was then sprayed with glyphosate at 5 L/ha and then left for about two months. After this, irrigation tape (T-Systems) was laid to a depth of 10cm and weeds were sprayed with glyphosate. There was a concern that glyphosate residues on the mulch surface might affect the subsequent watermelon crop, however this did not occur. Weeds were not a significant problem, probably due to low weed seed numbers in the soil and the dry conditions. Pollinators (diploid watermelons – variety: Red Tiger) were established by direct seeding through millet residues and the soil profile watered. One week later, seedless watermelon plants (variety: Shadow) were transplanted at 1.5m between plants on beds with 1.8m between centres and irrigated again. Soil
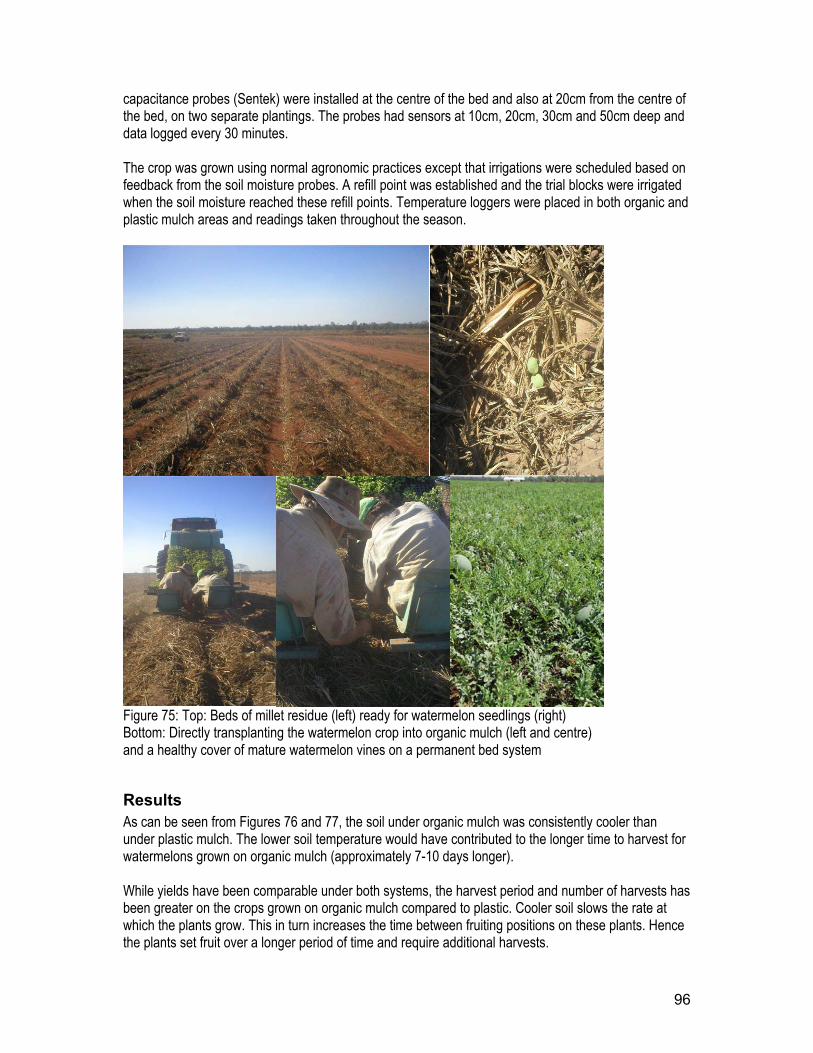
96
capacitance probes (Sentek) were installed at the centre of the bed and also at 20cm from the centre of the bed, on two separate plantings. The probes had sensors at 10cm, 20cm, 30cm and 50cm deep and data logged every 30 minutes. The crop was grown using normal agronomic practices except that irrigations were scheduled based on feedback from the soil moisture probes. A refill point was established and the trial blocks were irrigated when the soil moisture reached these refill points. Temperature loggers were placed in both organic and plastic mulch areas and readings taken throughout the season.
Figure 75: Top: Beds of millet residue (left) ready for watermelon seedlings (right) Bottom: Directly transplanting the watermelon crop into organic mulch (left and centre) and a healthy cover of mature watermelon vines on a permanent bed system
Results As can be seen from Figures 76 and 77, the soil under organic mulch was consistently cooler than under plastic mulch. The lower soil temperature would have contributed to the longer time to harvest for watermelons grown on organic mulch (approximately 7-10 days longer). While yields have been comparable under both systems, the harvest period and number of harvests has been greater on the crops grown on organic mulch compared to plastic. Cooler soil slows the rate at which the plants grow. This in turn increases the time between fruiting positions on these plants. Hence the plants set fruit over a longer period of time and require additional harvests.
97
Canopies differed considerably between mulch types with as much as twice the vine growth on plants grown on plastic mulch. The nutrient status of all plants was found to be satisfactory, in plantings where this was monitored. Some other advantages of organic mulch include:
• Reduced cost – no plastic purchase, laying or removal required. • No longer need to dispose of used plastic. • Adding extra organic matter to the soil – leading to improved soil health. • Reduced sand blasting make for better environment for plants and workers. • Increased flexibility in the use of the area after the melon crop is finished.
Conclusion The introduction of organic mulch into the farming operation at ‘Roper River Farms’ has been a positive step. So far Kane and Marie are happy with the crops they have grown on organic mulch and intend to develop this side of their farming operation in the future. It must be remembered however that the Northern Territory is a unique growing environment and that this practice would not necessary suit all other growing areas.
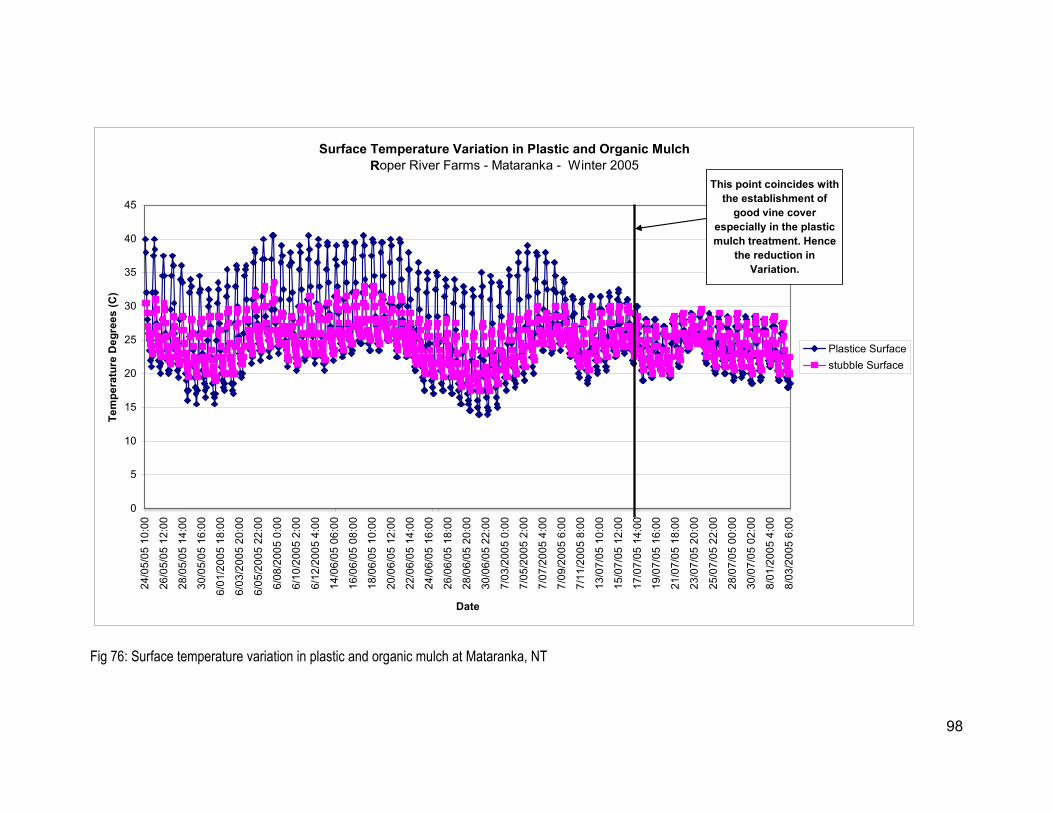
98
Surface Temperature Variation in Plastic and Organic Mulch Roper River Farms - Mataranka - Winter 2005
0
5
10
15
20
25
30
35
40
45
24/0
5/05
10:
00
26/0
5/05
12:
00
28/0
5/05
14:
00
30/0
5/05
16:
00
6/01
/200
5 18
:00
6/03
/200
5 20
:00
6/05
/200
5 22
:00
6/08
/200
5 0:
00
6/10
/200
5 2:
00
6/12
/200
5 4:
00
14/0
6/05
06:
00
16/0
6/05
08:
00
18/0
6/05
10:
00
20/0
6/05
12:
00
22/0
6/05
14:
00
24/0
6/05
16:
00
26/0
6/05
18:
00
28/0
6/05
20:
00
30/0
6/05
22:
00
7/03
/200
5 0:
00
7/05
/200
5 2:
00
7/07
/200
5 4:
00
7/09
/200
5 6:
00
7/11
/200
5 8:
00
13/0
7/05
10:
00
15/0
7/05
12:
00
17/0
7/05
14:
00
19/0
7/05
16:
00
21/0
7/05
18:
00
23/0
7/05
20:
00
25/0
7/05
22:
00
28/0
7/05
00:
00
30/0
7/05
02:
00
8/01
/200
5 4:
00
8/03
/200
5 6:
00
Date
Tem
pera
ture
Deg
rees
(C)
Plastice Surfacestubble Surface
This point coincides with the establishment of
good vine cover especially in the plastic mulch treatment. Hence
the reduction in Variation.
Fig 76: Surface temperature variation in plastic and organic mulch at Mataranka, NT
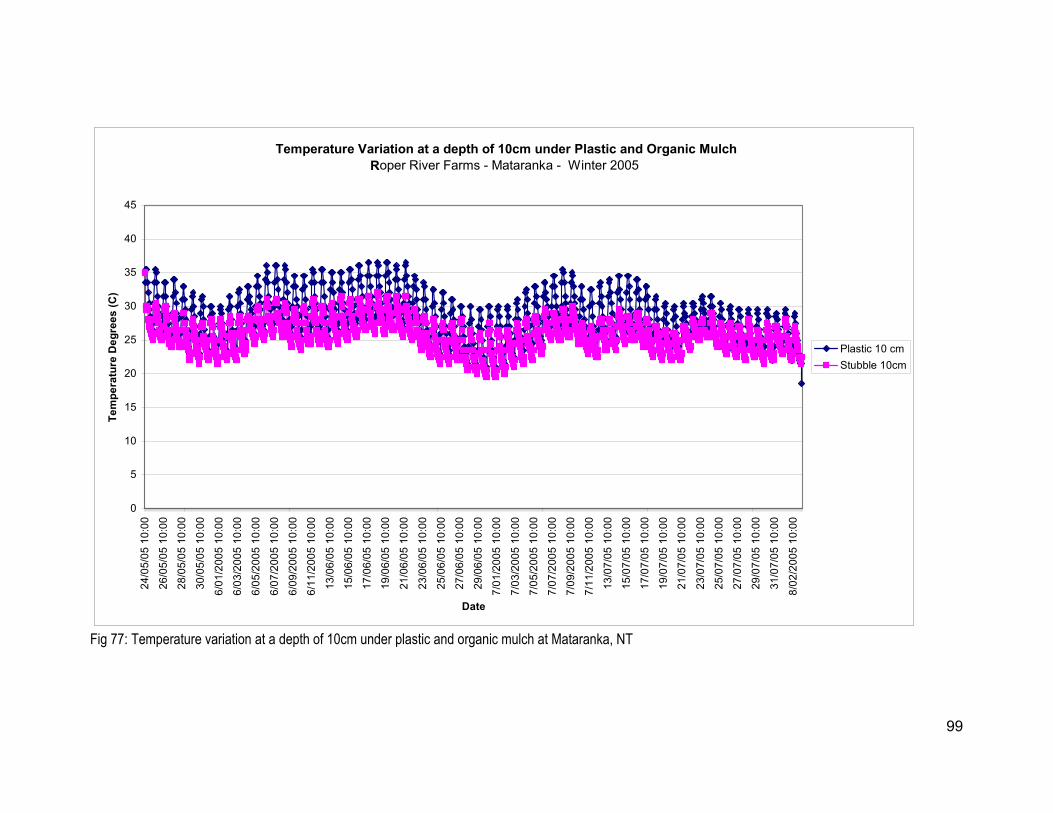
99
Temperature Variation at a depth of 10cm under Plastic and Organic Mulch Roper River Farms - Mataranka - Winter 2005
0
5
10
15
20
25
30
35
40
45
24/0
5/05
10:
00
26/0
5/05
10:
00
28/0
5/05
10:
00
30/0
5/05
10:
00
6/01
/200
5 10
:00
6/03
/200
5 10
:00
6/05
/200
5 10
:00
6/07
/200
5 10
:00
6/09
/200
5 10
:00
6/11
/200
5 10
:00
13/0
6/05
10:
00
15/0
6/05
10:
00
17/0
6/05
10:
00
19/0
6/05
10:
00
21/0
6/05
10:
00
23/0
6/05
10:
00
25/0
6/05
10:
00
27/0
6/05
10:
00
29/0
6/05
10:
00
7/01
/200
5 10
:00
7/03
/200
5 10
:00
7/05
/200
5 10
:00
7/07
/200
5 10
:00
7/09
/200
5 10
:00
7/11
/200
5 10
:00
13/0
7/05
10:
00
15/0
7/05
10:
00
17/0
7/05
10:
00
19/0
7/05
10:
00
21/0
7/05
10:
00
23/0
7/05
10:
00
25/0
7/05
10:
00
27/0
7/05
10:
00
29/0
7/05
10:
00
31/0
7/05
10:
00
8/02
/200
5 10
:00
Date
Tem
pera
ture
Deg
rees
(C)
Plastic 10 cmStubble 10cm
Fig 77: Temperature variation at a depth of 10cm under plastic and organic mulch at Mataranka, NT
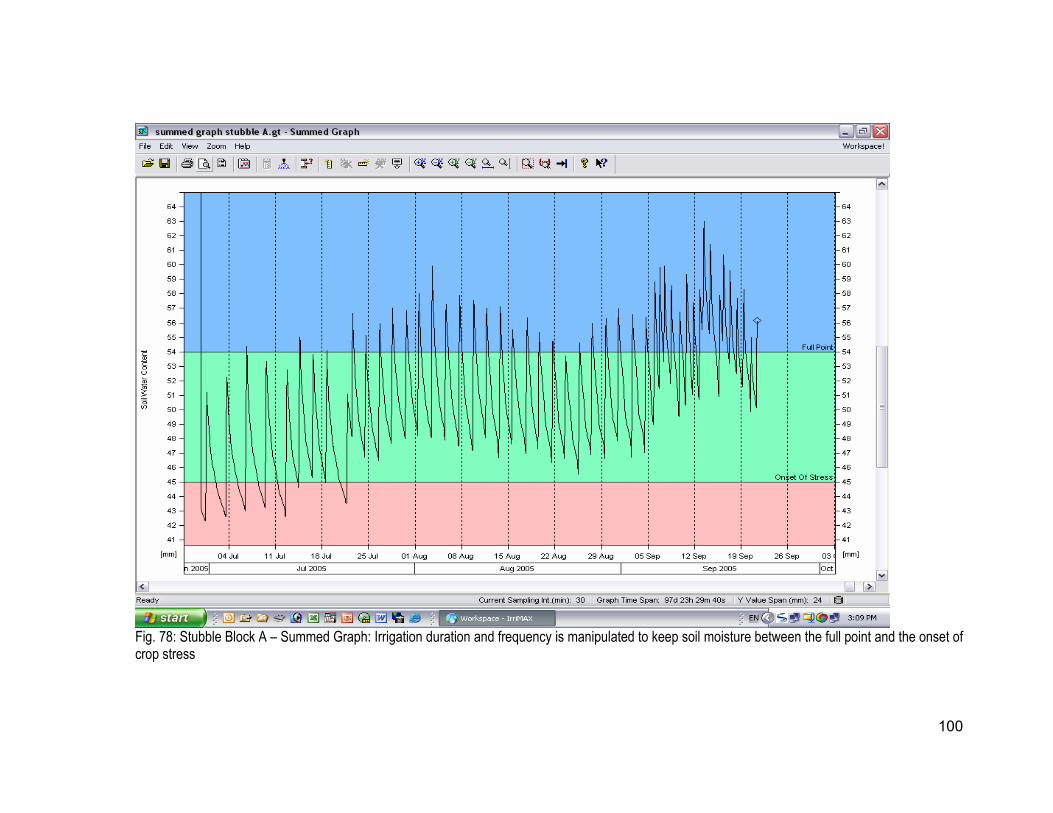
100
Fig. 78: Stubble Block A – Summed Graph: Irrigation duration and frequency is manipulated to keep soil moisture between the full point and the onset of crop stress
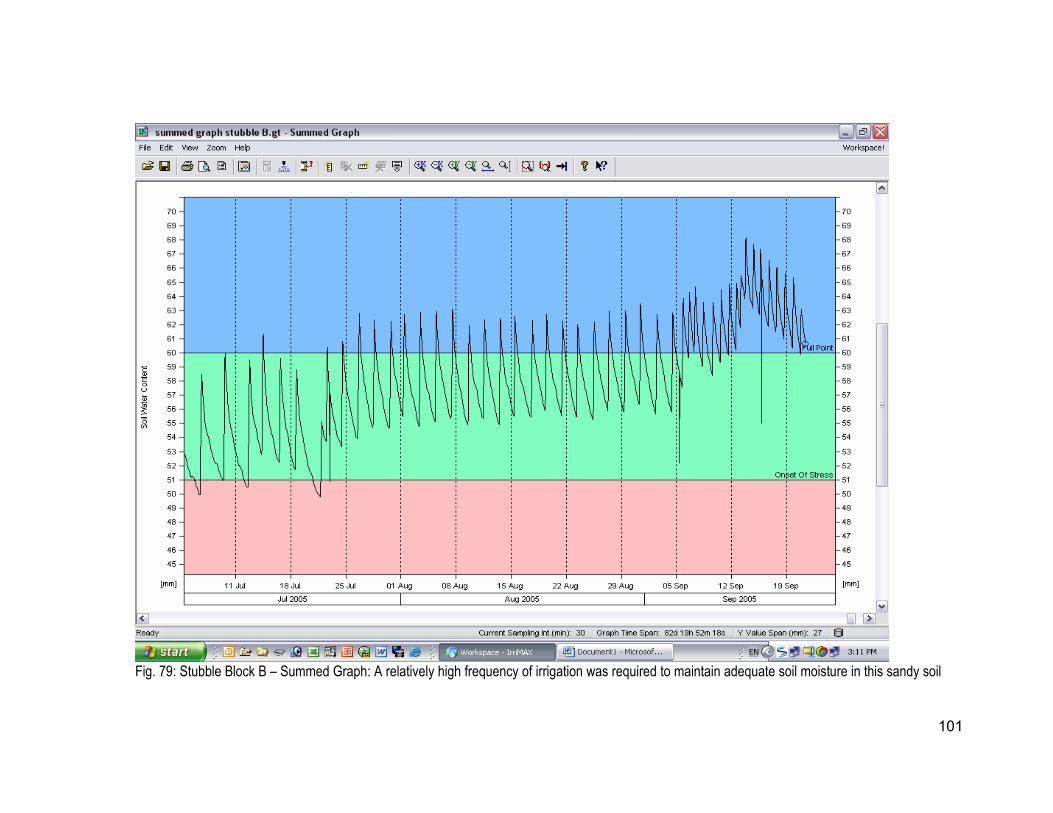
101
Fig. 79: Stubble Block B – Summed Graph: A relatively high frequency of irrigation was required to maintain adequate soil moisture in this sandy soil
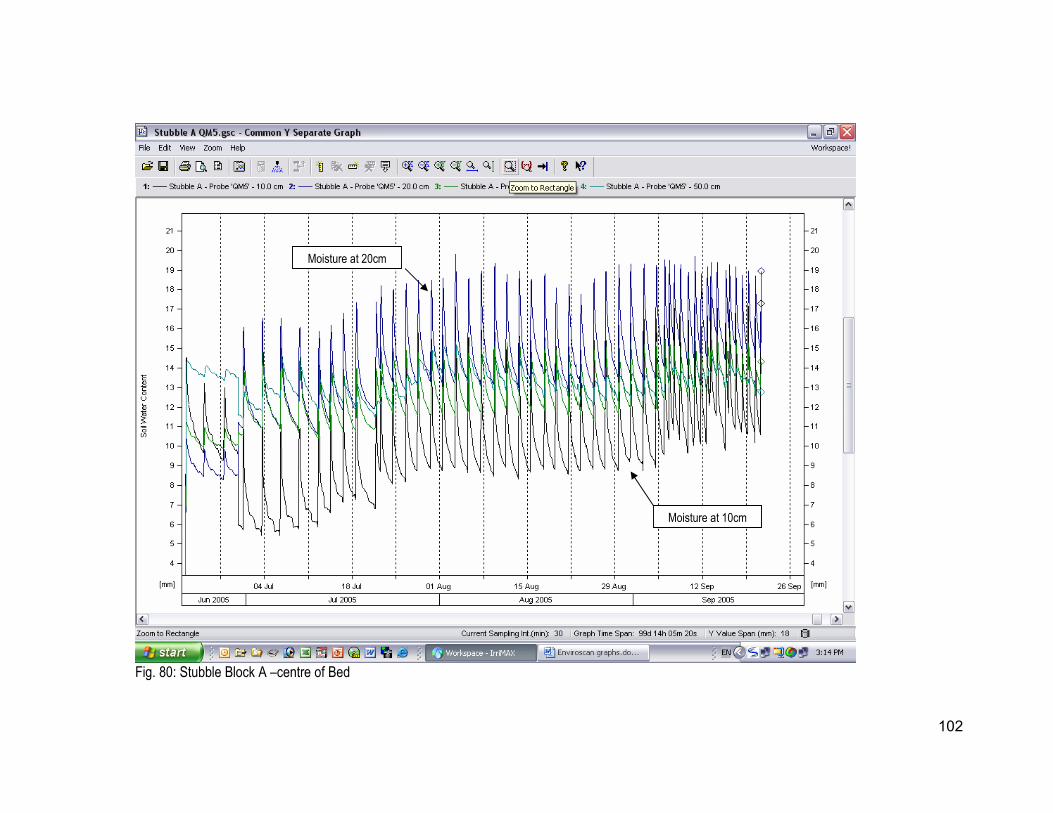
102
Fig. 80: Stubble Block A –centre of Bed
Moisture at 10cm
Moisture at 20cm
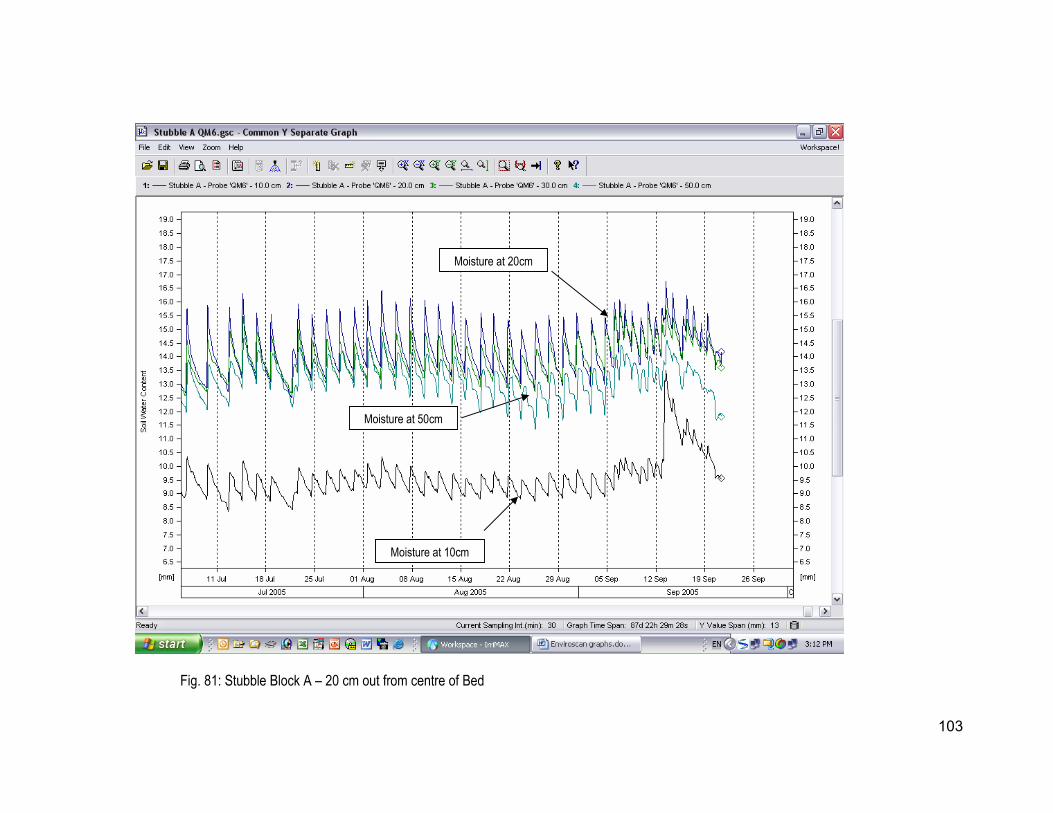
103
Fig. 81: Stubble Block A – 20 cm out from centre of Bed
Moisture at 10cm
Moisture at 20cm
Moisture at 50cm
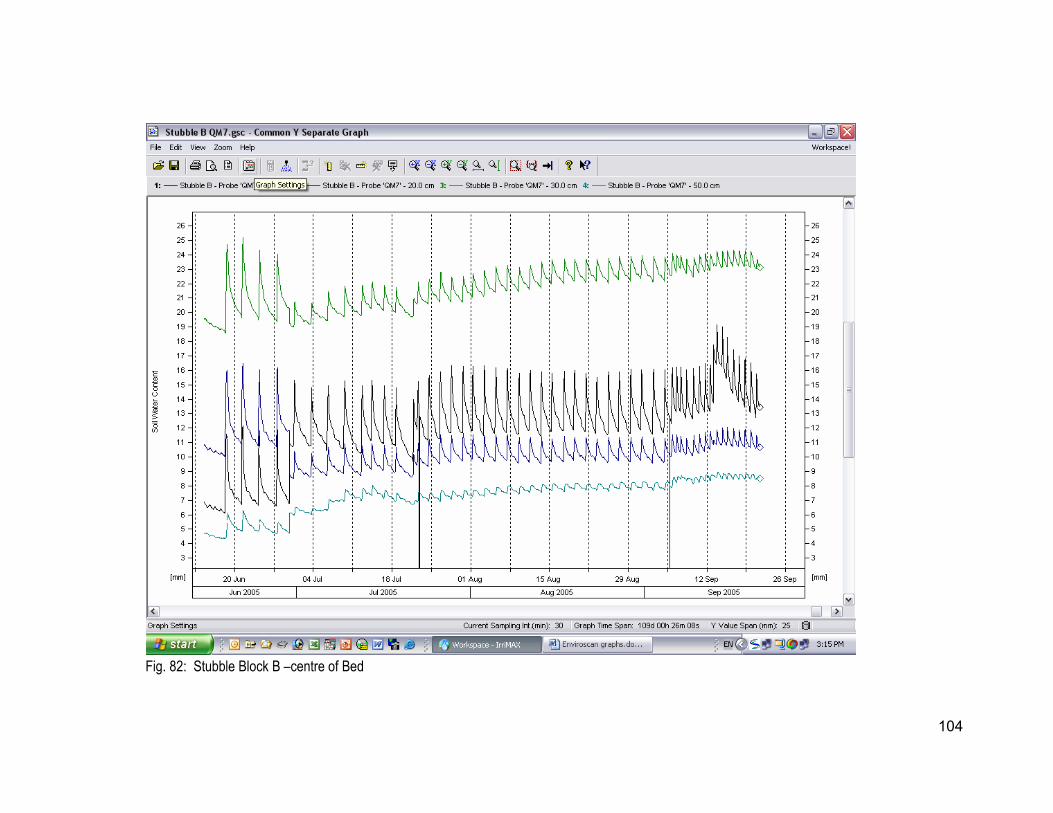
104
Fig. 82: Stubble Block B –centre of Bed
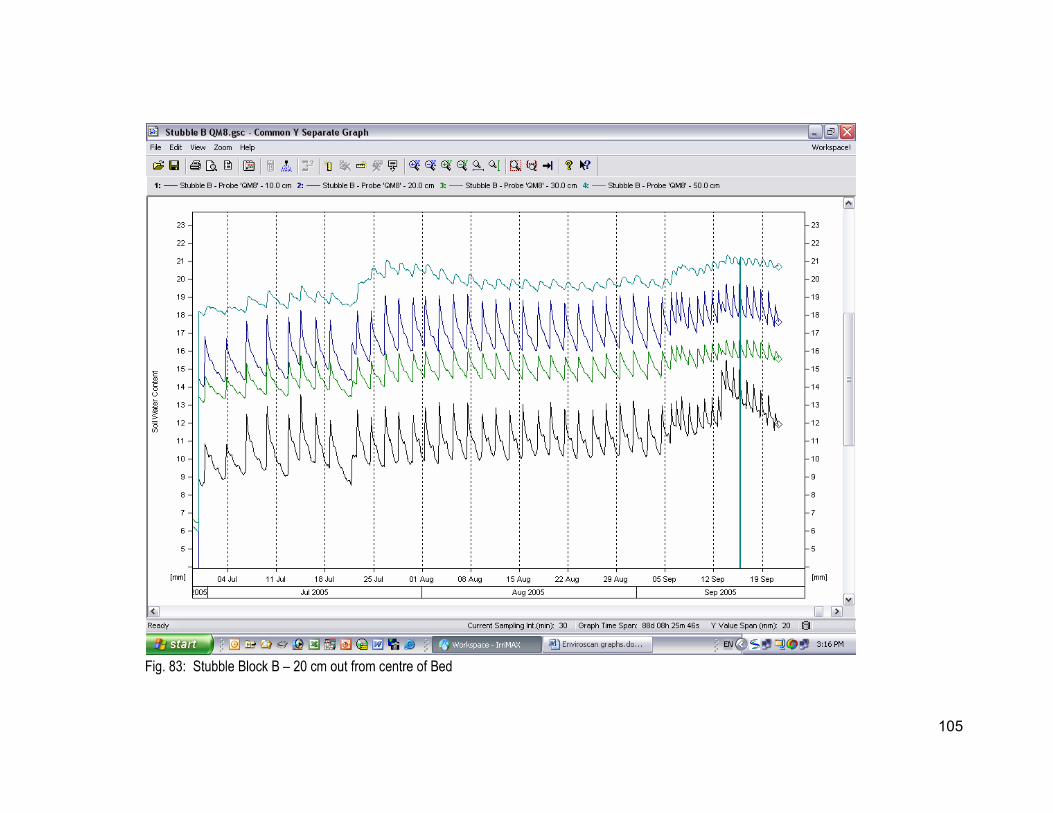
105
Fig. 83: Stubble Block B – 20 cm out from centre of Bed
Moisture at 20cm Moisture at 50cm
Moisture at 10cm
Moisture at 30cm
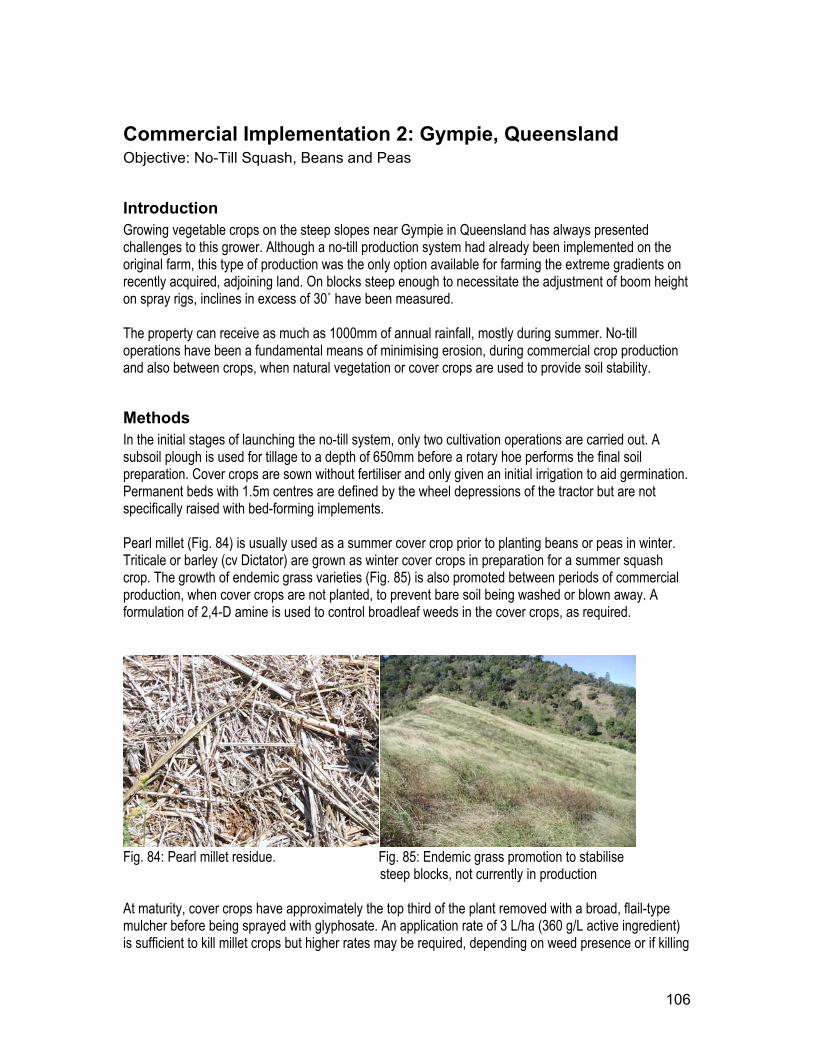
106
Commercial Implementation 2: Gympie, Queensland Objective: No-Till Squash, Beans and Peas
Introduction Growing vegetable crops on the steep slopes near Gympie in Queensland has always presented challenges to this grower. Although a no-till production system had already been implemented on the original farm, this type of production was the only option available for farming the extreme gradients on recently acquired, adjoining land. On blocks steep enough to necessitate the adjustment of boom height on spray rigs, inclines in excess of 30˚ have been measured. The property can receive as much as 1000mm of annual rainfall, mostly during summer. No-till operations have been a fundamental means of minimising erosion, during commercial crop production and also between crops, when natural vegetation or cover crops are used to provide soil stability.
Methods In the initial stages of launching the no-till system, only two cultivation operations are carried out. A subsoil plough is used for tillage to a depth of 650mm before a rotary hoe performs the final soil preparation. Cover crops are sown without fertiliser and only given an initial irrigation to aid germination. Permanent beds with 1.5m centres are defined by the wheel depressions of the tractor but are not specifically raised with bed-forming implements. Pearl millet (Fig. 84) is usually used as a summer cover crop prior to planting beans or peas in winter. Triticale or barley (cv Dictator) are grown as winter cover crops in preparation for a summer squash crop. The growth of endemic grass varieties (Fig. 85) is also promoted between periods of commercial production, when cover crops are not planted, to prevent bare soil being washed or blown away. A formulation of 2,4-D amine is used to control broadleaf weeds in the cover crops, as required.
Fig. 84: Pearl millet residue. Fig. 85: Endemic grass promotion to stabilise
steep blocks, not currently in production At maturity, cover crops have approximately the top third of the plant removed with a broad, flail-type mulcher before being sprayed with glyphosate. An application rate of 3 L/ha (360 g/L active ingredient) is sufficient to kill millet crops but higher rates may be required, depending on weed presence or if killing
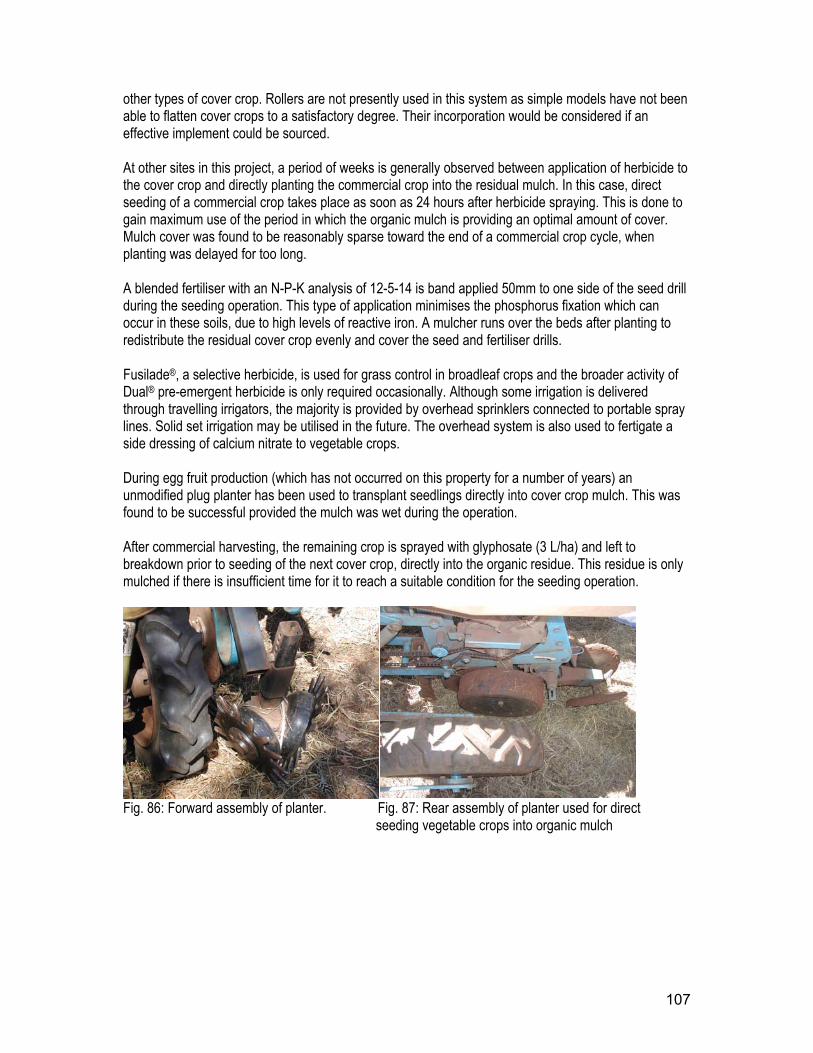
107
other types of cover crop. Rollers are not presently used in this system as simple models have not been able to flatten cover crops to a satisfactory degree. Their incorporation would be considered if an effective implement could be sourced. At other sites in this project, a period of weeks is generally observed between application of herbicide to the cover crop and directly planting the commercial crop into the residual mulch. In this case, direct seeding of a commercial crop takes place as soon as 24 hours after herbicide spraying. This is done to gain maximum use of the period in which the organic mulch is providing an optimal amount of cover. Mulch cover was found to be reasonably sparse toward the end of a commercial crop cycle, when planting was delayed for too long. A blended fertiliser with an N-P-K analysis of 12-5-14 is band applied 50mm to one side of the seed drill during the seeding operation. This type of application minimises the phosphorus fixation which can occur in these soils, due to high levels of reactive iron. A mulcher runs over the beds after planting to redistribute the residual cover crop evenly and cover the seed and fertiliser drills. Fusilade®, a selective herbicide, is used for grass control in broadleaf crops and the broader activity of Dual® pre-emergent herbicide is only required occasionally. Although some irrigation is delivered through travelling irrigators, the majority is provided by overhead sprinklers connected to portable spray lines. Solid set irrigation may be utilised in the future. The overhead system is also used to fertigate a side dressing of calcium nitrate to vegetable crops. During egg fruit production (which has not occurred on this property for a number of years) an unmodified plug planter has been used to transplant seedlings directly into cover crop mulch. This was found to be successful provided the mulch was wet during the operation. After commercial harvesting, the remaining crop is sprayed with glyphosate (3 L/ha) and left to breakdown prior to seeding of the next cover crop, directly into the organic residue. This residue is only mulched if there is insufficient time for it to reach a suitable condition for the seeding operation.
Fig. 86: Forward assembly of planter. Fig. 87: Rear assembly of planter used for direct
seeding vegetable crops into organic mulch
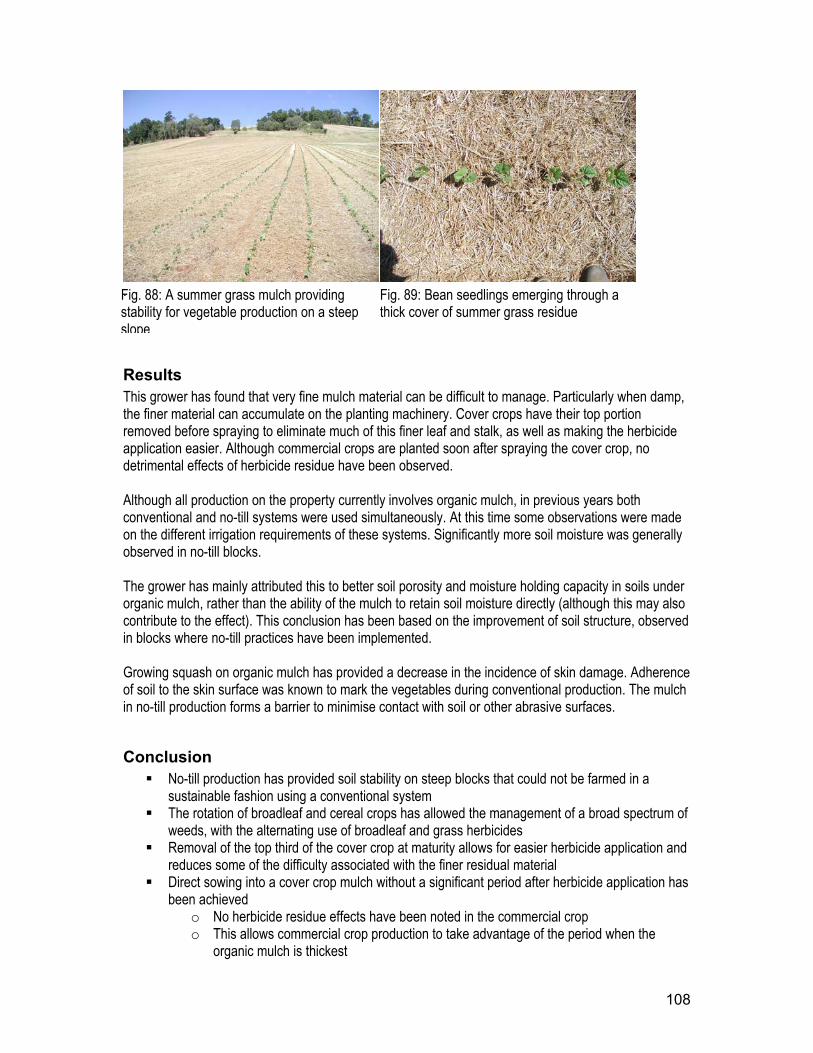
108
.
Results This grower has found that very fine mulch material can be difficult to manage. Particularly when damp, the finer material can accumulate on the planting machinery. Cover crops have their top portion removed before spraying to eliminate much of this finer leaf and stalk, as well as making the herbicide application easier. Although commercial crops are planted soon after spraying the cover crop, no detrimental effects of herbicide residue have been observed. Although all production on the property currently involves organic mulch, in previous years both conventional and no-till systems were used simultaneously. At this time some observations were made on the different irrigation requirements of these systems. Significantly more soil moisture was generally observed in no-till blocks. The grower has mainly attributed this to better soil porosity and moisture holding capacity in soils under organic mulch, rather than the ability of the mulch to retain soil moisture directly (although this may also contribute to the effect). This conclusion has been based on the improvement of soil structure, observed in blocks where no-till practices have been implemented. Growing squash on organic mulch has provided a decrease in the incidence of skin damage. Adherence of soil to the skin surface was known to mark the vegetables during conventional production. The mulch in no-till production forms a barrier to minimise contact with soil or other abrasive surfaces.
Conclusion No-till production has provided soil stability on steep blocks that could not be farmed in a
sustainable fashion using a conventional system The rotation of broadleaf and cereal crops has allowed the management of a broad spectrum of
weeds, with the alternating use of broadleaf and grass herbicides Removal of the top third of the cover crop at maturity allows for easier herbicide application and
reduces some of the difficulty associated with the finer residual material Direct sowing into a cover crop mulch without a significant period after herbicide application has
been achieved o No herbicide residue effects have been noted in the commercial crop o This allows commercial crop production to take advantage of the period when the
organic mulch is thickest
Fig. 89: Bean seedlings emerging through a thick cover of summer grass residue
Fig. 88: A summer grass mulch providing stability for vegetable production on a steep slope

109
Use of organic mulch appears to correlate with improved soil moisture retention An improvement in produce quality has been noted where cover crop residue minimises contact
with the soil The grower maintains that the greatest benefit of no-till production is the reduction of labour,
diesel and machinery costs associated with a system without cultivation practices
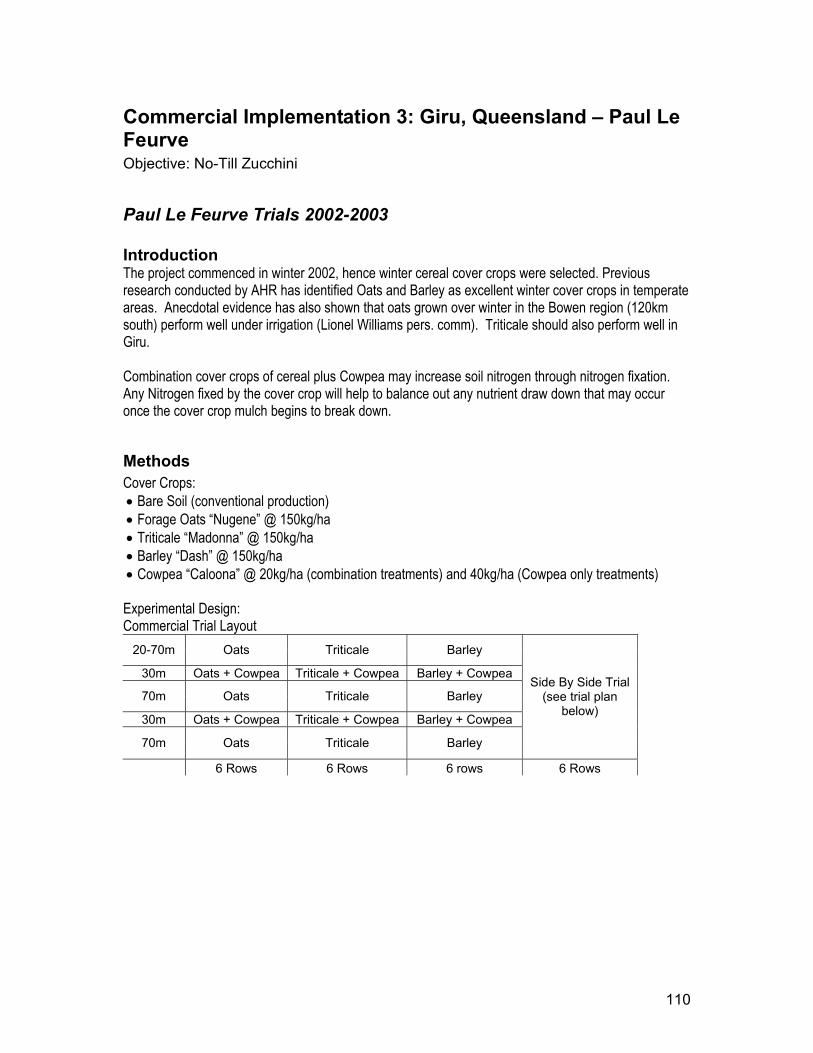
110
Commercial Implementation 3: Giru, Queensland – Paul Le Feurve Objective: No-Till Zucchini
Paul Le Feurve Trials 2002-2003 Introduction The project commenced in winter 2002, hence winter cereal cover crops were selected. Previous research conducted by AHR has identified Oats and Barley as excellent winter cover crops in temperate areas. Anecdotal evidence has also shown that oats grown over winter in the Bowen region (120km south) perform well under irrigation (Lionel Williams pers. comm). Triticale should also perform well in Giru. Combination cover crops of cereal plus Cowpea may increase soil nitrogen through nitrogen fixation. Any Nitrogen fixed by the cover crop will help to balance out any nutrient draw down that may occur once the cover crop mulch begins to break down.
Methods Cover Crops: • Bare Soil (conventional production) • Forage Oats “Nugene” @ 150kg/ha • Triticale “Madonna” @ 150kg/ha • Barley “Dash” @ 150kg/ha • Cowpea “Caloona” @ 20kg/ha (combination treatments) and 40kg/ha (Cowpea only treatments)
Experimental Design: Commercial Trial Layout
20-70m Oats Triticale Barley
30m Oats + Cowpea Triticale + Cowpea Barley + Cowpea
70m Oats Triticale Barley
30m Oats + Cowpea Triticale + Cowpea Barley + Cowpea
70m Oats Triticale Barley
Side By Side Trial (see trial plan
below)
6 Rows 6 Rows 6 rows 6 Rows
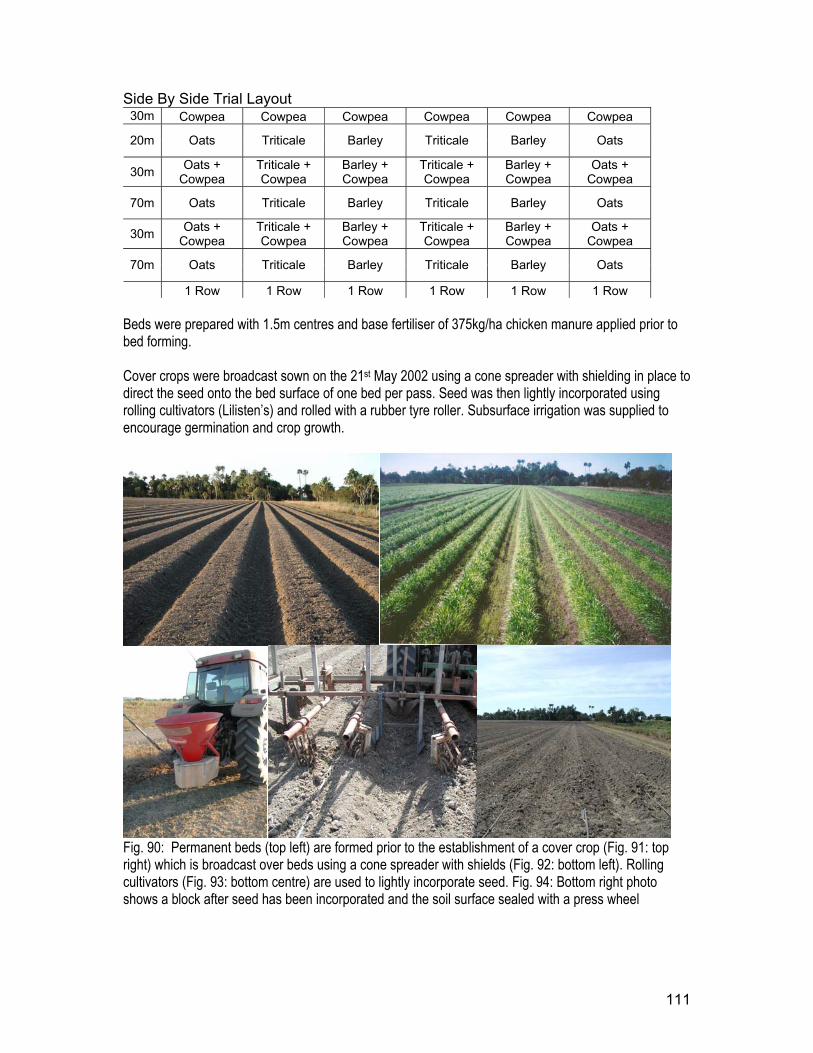
111
Side By Side Trial Layout 30m Cowpea Cowpea Cowpea Cowpea Cowpea Cowpea
20m Oats Triticale Barley Triticale Barley Oats
30m Oats + Cowpea
Triticale + Cowpea
Barley + Cowpea
Triticale + Cowpea
Barley + Cowpea
Oats + Cowpea
70m Oats Triticale Barley Triticale Barley Oats
30m Oats + Cowpea
Triticale + Cowpea
Barley + Cowpea
Triticale + Cowpea
Barley + Cowpea
Oats + Cowpea
70m Oats Triticale Barley Triticale Barley Oats
1 Row 1 Row 1 Row 1 Row 1 Row 1 Row Beds were prepared with 1.5m centres and base fertiliser of 375kg/ha chicken manure applied prior to bed forming. Cover crops were broadcast sown on the 21st May 2002 using a cone spreader with shielding in place to direct the seed onto the bed surface of one bed per pass. Seed was then lightly incorporated using rolling cultivators (Lilisten’s) and rolled with a rubber tyre roller. Subsurface irrigation was supplied to encourage germination and crop growth.
Fig. 90: Permanent beds (top left) are formed prior to the establishment of a cover crop (Fig. 91: top right) which is broadcast over beds using a cone spreader with shields (Fig. 92: bottom left). Rolling cultivators (Fig. 93: bottom centre) are used to lightly incorporate seed. Fig. 94: Bottom right photo shows a block after seed has been incorporated and the soil surface sealed with a press wheel
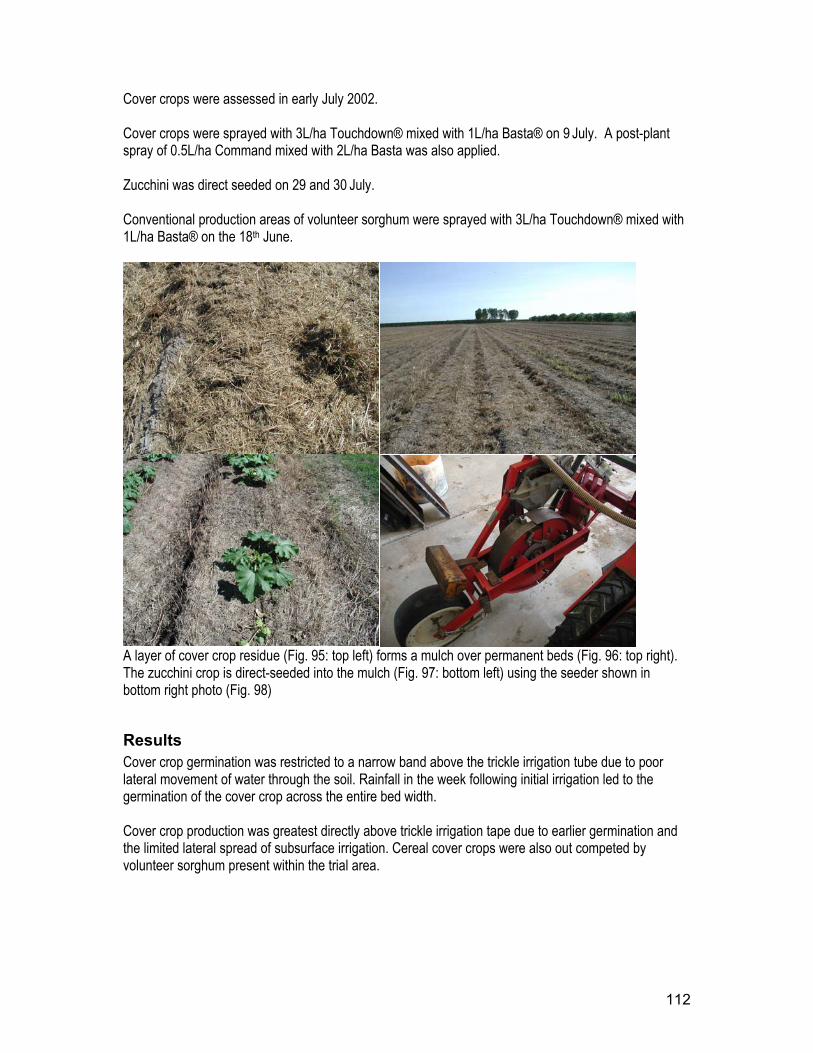
112
Cover crops were assessed in early July 2002. Cover crops were sprayed with 3L/ha Touchdown® mixed with 1L/ha Basta® on 9 July. A post-plant spray of 0.5L/ha Command mixed with 2L/ha Basta was also applied. Zucchini was direct seeded on 29 and 30 July. Conventional production areas of volunteer sorghum were sprayed with 3L/ha Touchdown® mixed with 1L/ha Basta® on the 18th June.
A layer of cover crop residue (Fig. 95: top left) forms a mulch over permanent beds (Fig. 96: top right). The zucchini crop is direct-seeded into the mulch (Fig. 97: bottom left) using the seeder shown in bottom right photo (Fig. 98)
Results Cover crop germination was restricted to a narrow band above the trickle irrigation tube due to poor lateral movement of water through the soil. Rainfall in the week following initial irrigation led to the germination of the cover crop across the entire bed width. Cover crop production was greatest directly above trickle irrigation tape due to earlier germination and the limited lateral spread of subsurface irrigation. Cereal cover crops were also out competed by volunteer sorghum present within the trial area.
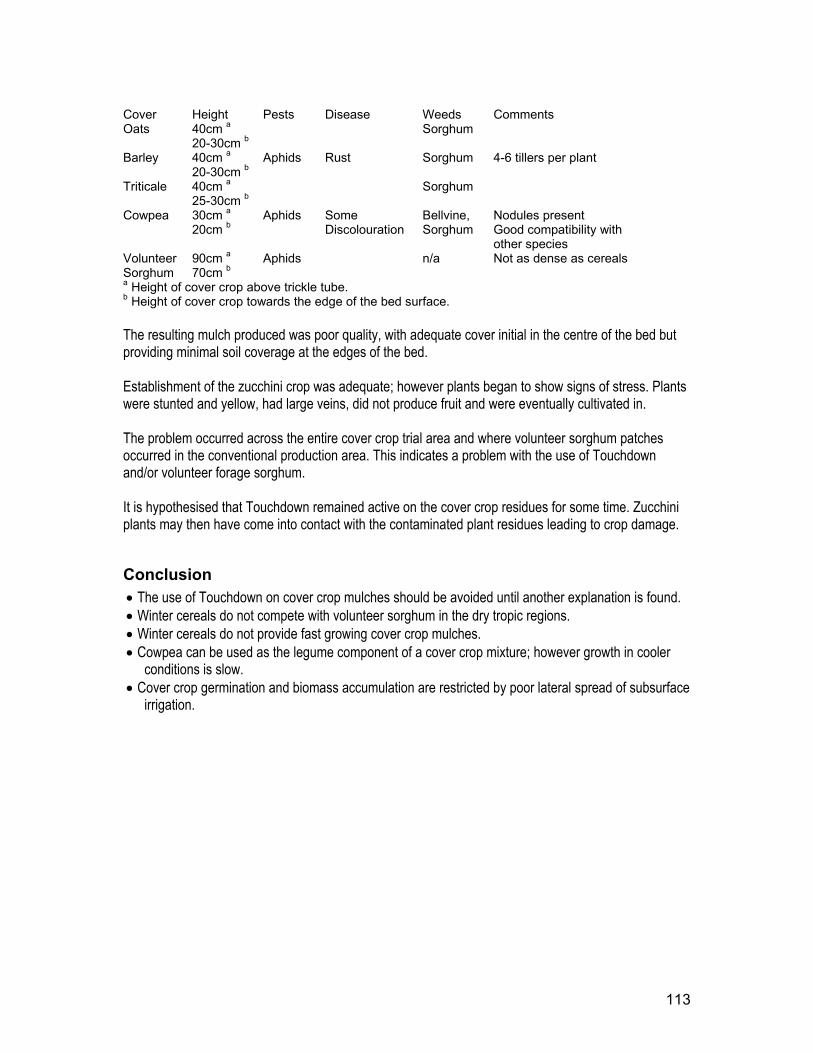
113
Cover Height Pests Disease Weeds Comments Oats 40cm a
20-30cm b Sorghum
Barley 40cm a 20-30cm b
Aphids Rust Sorghum 4-6 tillers per plant
Triticale 40cm a 25-30cm b
Sorghum
Cowpea 30cm a 20cm b
Aphids Some Discolouration
Bellvine, Sorghum
Nodules present Good compatibility with other species
Volunteer Sorghum
90cm a 70cm b
Aphids n/a
Not as dense as cereals
a Height of cover crop above trickle tube. b Height of cover crop towards the edge of the bed surface. The resulting mulch produced was poor quality, with adequate cover initial in the centre of the bed but providing minimal soil coverage at the edges of the bed. Establishment of the zucchini crop was adequate; however plants began to show signs of stress. Plants were stunted and yellow, had large veins, did not produce fruit and were eventually cultivated in. The problem occurred across the entire cover crop trial area and where volunteer sorghum patches occurred in the conventional production area. This indicates a problem with the use of Touchdown and/or volunteer forage sorghum. It is hypothesised that Touchdown remained active on the cover crop residues for some time. Zucchini plants may then have come into contact with the contaminated plant residues leading to crop damage.
Conclusion • The use of Touchdown on cover crop mulches should be avoided until another explanation is found. • Winter cereals do not compete with volunteer sorghum in the dry tropic regions. • Winter cereals do not provide fast growing cover crop mulches. • Cowpea can be used as the legume component of a cover crop mixture; however growth in cooler
conditions is slow. • Cover crop germination and biomass accumulation are restricted by poor lateral spread of subsurface
irrigation.
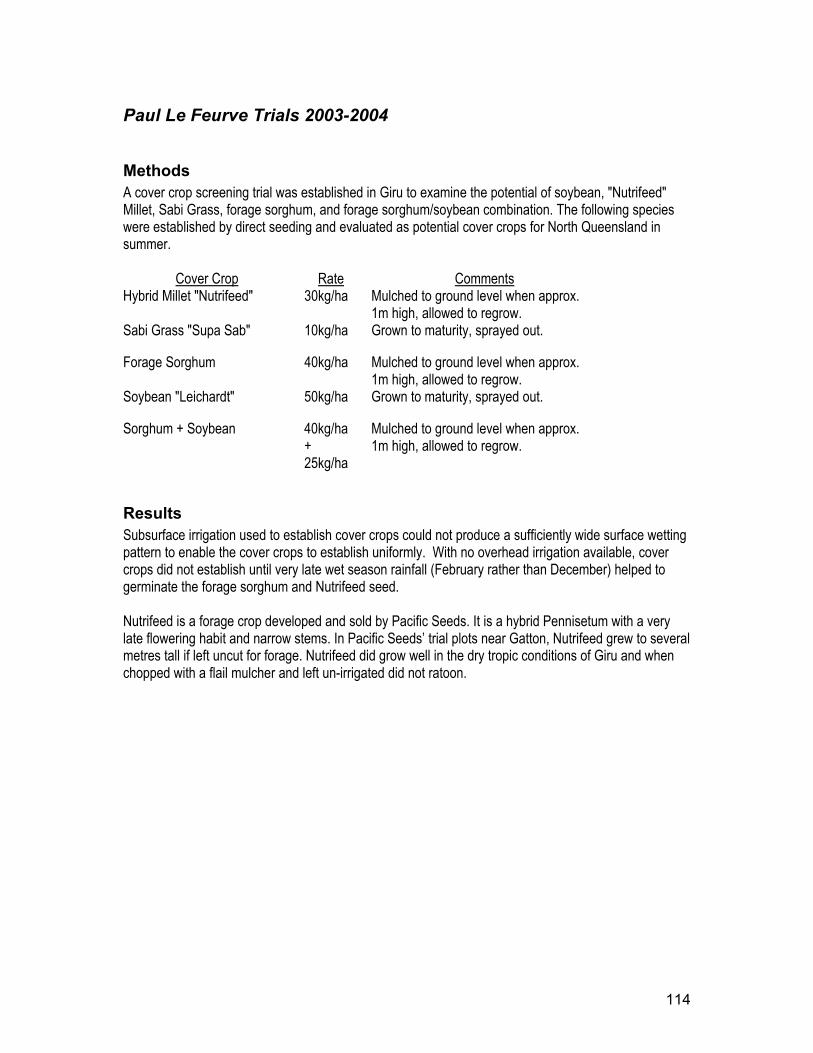
114
Paul Le Feurve Trials 2003-2004
Methods A cover crop screening trial was established in Giru to examine the potential of soybean, "Nutrifeed" Millet, Sabi Grass, forage sorghum, and forage sorghum/soybean combination. The following species were established by direct seeding and evaluated as potential cover crops for North Queensland in summer.
Cover Crop Rate Comments Hybrid Millet "Nutrifeed" 30kg/ha Mulched to ground level when approx.
1m high, allowed to regrow. Sabi Grass "Supa Sab" 10kg/ha Grown to maturity, sprayed out.
Forage Sorghum 40kg/ha Mulched to ground level when approx. 1m high, allowed to regrow.
Soybean "Leichardt" 50kg/ha Grown to maturity, sprayed out.
Sorghum + Soybean 40kg/ha + 25kg/ha
Mulched to ground level when approx. 1m high, allowed to regrow.
Results Subsurface irrigation used to establish cover crops could not produce a sufficiently wide surface wetting pattern to enable the cover crops to establish uniformly. With no overhead irrigation available, cover crops did not establish until very late wet season rainfall (February rather than December) helped to germinate the forage sorghum and Nutrifeed seed. Nutrifeed is a forage crop developed and sold by Pacific Seeds. It is a hybrid Pennisetum with a very late flowering habit and narrow stems. In Pacific Seeds’ trial plots near Gatton, Nutrifeed grew to several metres tall if left uncut for forage. Nutrifeed did grow well in the dry tropic conditions of Giru and when chopped with a flail mulcher and left un-irrigated did not ratoon.
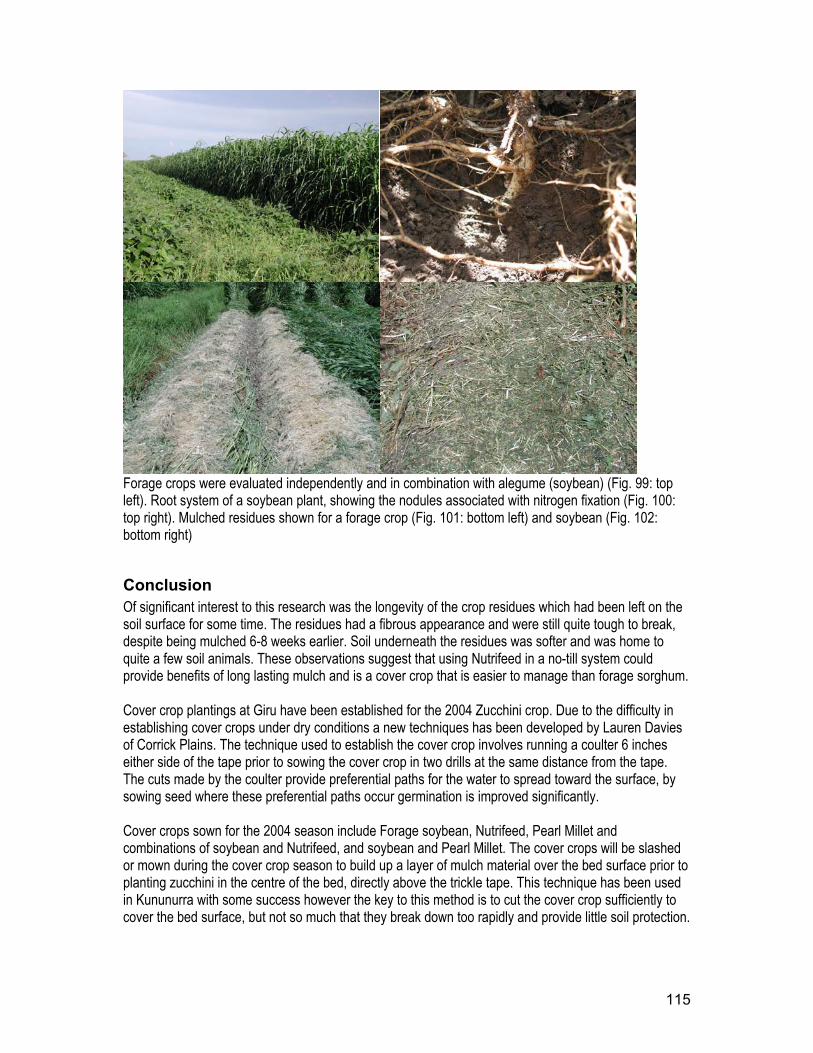
115
Forage crops were evaluated independently and in combination with alegume (soybean) (Fig. 99: top left). Root system of a soybean plant, showing the nodules associated with nitrogen fixation (Fig. 100: top right). Mulched residues shown for a forage crop (Fig. 101: bottom left) and soybean (Fig. 102: bottom right)
Conclusion Of significant interest to this research was the longevity of the crop residues which had been left on the soil surface for some time. The residues had a fibrous appearance and were still quite tough to break, despite being mulched 6-8 weeks earlier. Soil underneath the residues was softer and was home to quite a few soil animals. These observations suggest that using Nutrifeed in a no-till system could provide benefits of long lasting mulch and is a cover crop that is easier to manage than forage sorghum. Cover crop plantings at Giru have been established for the 2004 Zucchini crop. Due to the difficulty in establishing cover crops under dry conditions a new techniques has been developed by Lauren Davies of Corrick Plains. The technique used to establish the cover crop involves running a coulter 6 inches either side of the tape prior to sowing the cover crop in two drills at the same distance from the tape. The cuts made by the coulter provide preferential paths for the water to spread toward the surface, by sowing seed where these preferential paths occur germination is improved significantly. Cover crops sown for the 2004 season include Forage soybean, Nutrifeed, Pearl Millet and combinations of soybean and Nutrifeed, and soybean and Pearl Millet. The cover crops will be slashed or mown during the cover crop season to build up a layer of mulch material over the bed surface prior to planting zucchini in the centre of the bed, directly above the trickle tape. This technique has been used in Kununurra with some success however the key to this method is to cut the cover crop sufficiently to cover the bed surface, but not so much that they break down too rapidly and provide little soil protection.
116
References Adbul-Baki ,AA, Teasdale, JR, and Korcak, RF (1997) Nitrogen requirement of fresh-market tomatoes on Hairy Vetch and black polyethylene mulch. HortScience 32: 217-221. Chaloner, D., Williams, L., and Rogers, G. (1999). Better bed systems for vegetables. Good Fruit and Vegetables 9, 48. Elkins, D.W., JW. Vandeventer, G. Kapusta, and M.R. Anderson (1979). No tillage maize production in chemically suppressed grass sod. Agron. J. 17: 101-105. Hartwig, N.L. (1989). Influence of a crown vetch living mulch on dandelion invasion in corn. Proc. N.E. Weed Sci. Soc. 43:39-42. Little, S., Rogers, G., Silcock, S., and Williams, L. (2000). Experiencing the no-till thrill. Good Fruit and Vegetables, October 2000. pp. 80-81. Morse, RD (1999) No-till vegetable production - Its' time is now. HortTechnology 9:373-379. North Queensland Register (2000). Soil coverage key to US no-till success. North Queensland Fruit and Vegetable Grower. In North Queensland Register 10/8/2000. pp. 33. Robinson, R. (2000). Rain can't stop conservation lessons at Farm Field Day. Lancaster, PA. New Era, 27/7/2000. pp. B1 Rogers, G.S., Little, S.A., Silcock, S.J., Williams, L. (2002) No-till vegetable production using organic mulches in the dry tropics of Australia ACTA Horticulturae. XXVI International Horticultural Congress, Toronto, Canada, 11th-17th August, 2002 Rogers, G., Silcock, S., and Williams, L. (2000) Sustainable Permanent Bed Systems for Vege Production. North Queensland Register 27/4/2000. pp. 22-23. Rogers, G., Silcock, S., and Williams, L. (2000) Sustainable Permanent Bed Systems for Vegetable Production. Good Fruit and Vegetables May 2000. pp. 48-89. Rogers, G. S., Silcock, S., Little, S., and Williams, L. (2000). Integrated system improves vegetable establishment results. Good Fruit and Vegetables March 2000. pp 35-36. Rogers, G. (1999). Sustainable permanent bed system for vegetable production. In 'HortReport 98'.(Eds M. Darcey.) p.24. (Horticultural research and Development Corporation: Sydney.) Rogers, G. (1999). Sustainable permanent bed systems for vegetable production. North Queensland Register - Rural Care99. 18th March. Rogers, G. (1999). Sustainable permanent bed systems for vegetable production. Queensland Country Life March.
117
Rogers, G.S. and Chaloner, D. (1998) Biofumigant Plants to Play a Crucial Role in Sustainable Vegetable Production. Biofumigation Update - CSIRO Division of Entomology. Teasdale, JR and Abdul-Baki, AA (1998) Comparison of mixtures v’s monoculture of cover crops for fresh-market tomato production with and without herbicide. HortScience 33:1163-1166. USDA (1997) Sustainable production of fresh-market tomatoes ad other summer vegetable with organic mulches. USDA Farmers Bulletin No.2279. Weston, L. (1990). Cover crop and herbicide influence on row crop seedling establishment in no-till culture. Weed Sci.38: 166-171
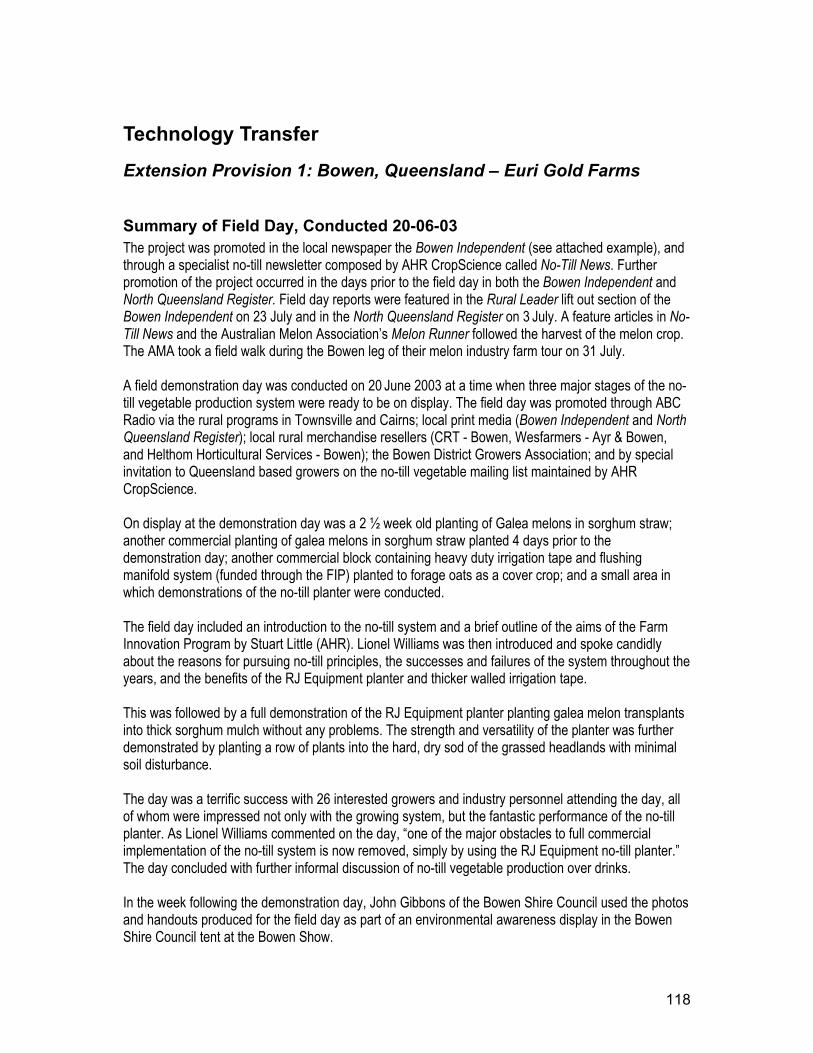
118
Technology Transfer
Extension Provision 1: Bowen, Queensland – Euri Gold Farms
Summary of Field Day, Conducted 20-06-03 The project was promoted in the local newspaper the Bowen Independent (see attached example), and through a specialist no-till newsletter composed by AHR CropScience called No-Till News. Further promotion of the project occurred in the days prior to the field day in both the Bowen Independent and North Queensland Register. Field day reports were featured in the Rural Leader lift out section of the Bowen Independent on 23 July and in the North Queensland Register on 3 July. A feature articles in No-Till News and the Australian Melon Association’s Melon Runner followed the harvest of the melon crop. The AMA took a field walk during the Bowen leg of their melon industry farm tour on 31 July. A field demonstration day was conducted on 20 June 2003 at a time when three major stages of the no-till vegetable production system were ready to be on display. The field day was promoted through ABC Radio via the rural programs in Townsville and Cairns; local print media (Bowen Independent and North Queensland Register); local rural merchandise resellers (CRT - Bowen, Wesfarmers - Ayr & Bowen, and Helthom Horticultural Services - Bowen); the Bowen District Growers Association; and by special invitation to Queensland based growers on the no-till vegetable mailing list maintained by AHR CropScience. On display at the demonstration day was a 2 ½ week old planting of Galea melons in sorghum straw; another commercial planting of galea melons in sorghum straw planted 4 days prior to the demonstration day; another commercial block containing heavy duty irrigation tape and flushing manifold system (funded through the FIP) planted to forage oats as a cover crop; and a small area in which demonstrations of the no-till planter were conducted. The field day included an introduction to the no-till system and a brief outline of the aims of the Farm Innovation Program by Stuart Little (AHR). Lionel Williams was then introduced and spoke candidly about the reasons for pursuing no-till principles, the successes and failures of the system throughout the years, and the benefits of the RJ Equipment planter and thicker walled irrigation tape. This was followed by a full demonstration of the RJ Equipment planter planting galea melon transplants into thick sorghum mulch without any problems. The strength and versatility of the planter was further demonstrated by planting a row of plants into the hard, dry sod of the grassed headlands with minimal soil disturbance. The day was a terrific success with 26 interested growers and industry personnel attending the day, all of whom were impressed not only with the growing system, but the fantastic performance of the no-till planter. As Lionel Williams commented on the day, “one of the major obstacles to full commercial implementation of the no-till system is now removed, simply by using the RJ Equipment no-till planter.” The day concluded with further informal discussion of no-till vegetable production over drinks. In the week following the demonstration day, John Gibbons of the Bowen Shire Council used the photos and handouts produced for the field day as part of an environmental awareness display in the Bowen Shire Council tent at the Bowen Show.
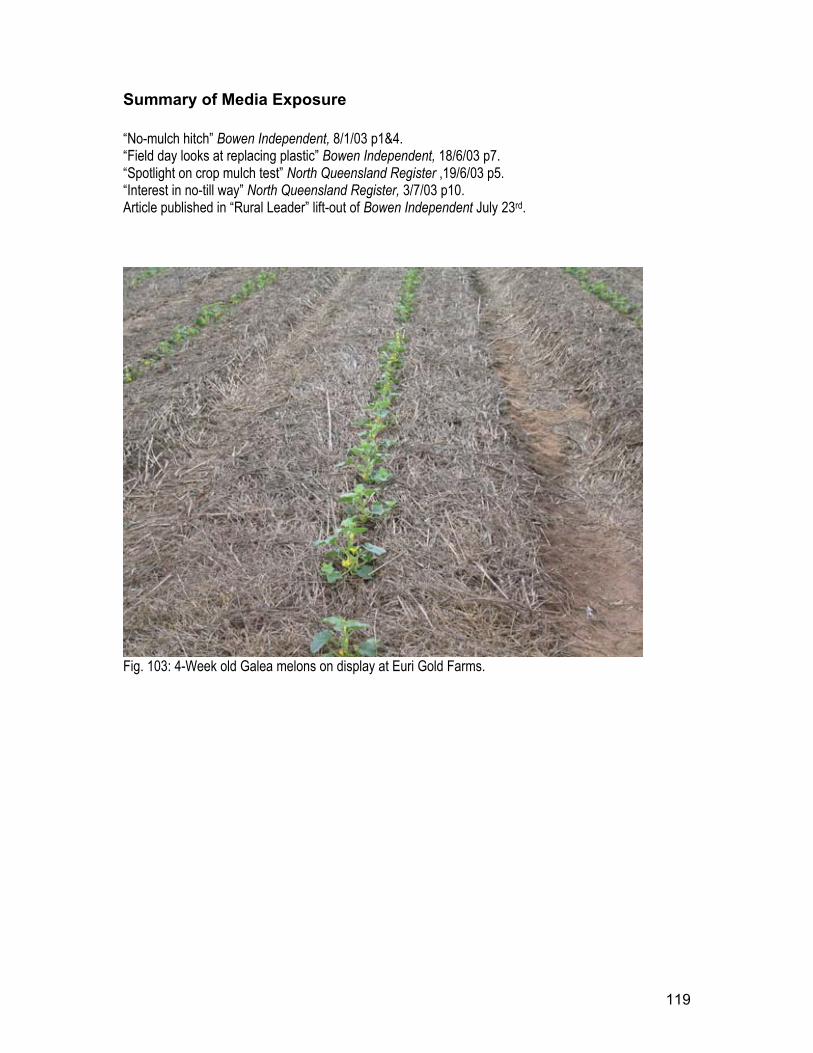
119
Summary of Media Exposure “No-mulch hitch” Bowen Independent, 8/1/03 p1&4. “Field day looks at replacing plastic” Bowen Independent, 18/6/03 p7. “Spotlight on crop mulch test” North Queensland Register ,19/6/03 p5. “Interest in no-till way” North Queensland Register, 3/7/03 p10. Article published in “Rural Leader” lift-out of Bowen Independent July 23rd.
Fig. 103: 4-Week old Galea melons on display at Euri Gold Farms.
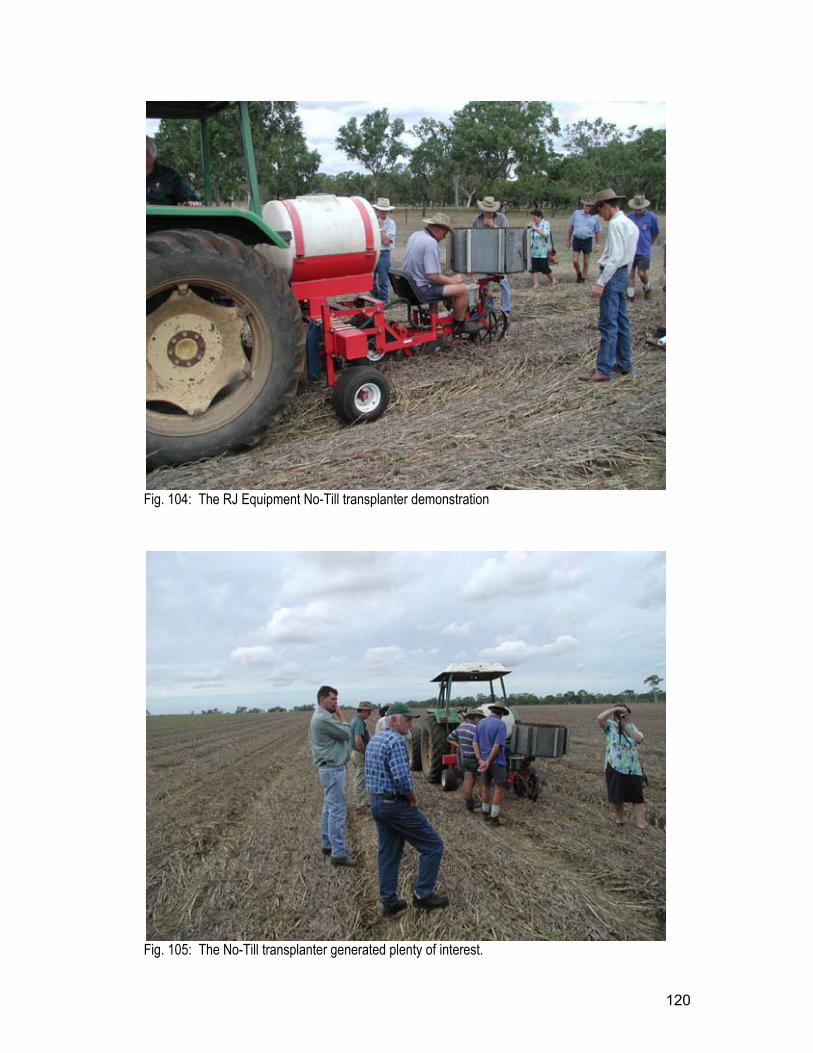
120
Fig. 104: The RJ Equipment No-Till transplanter demonstration
Fig. 105: The No-Till transplanter generated plenty of interest.
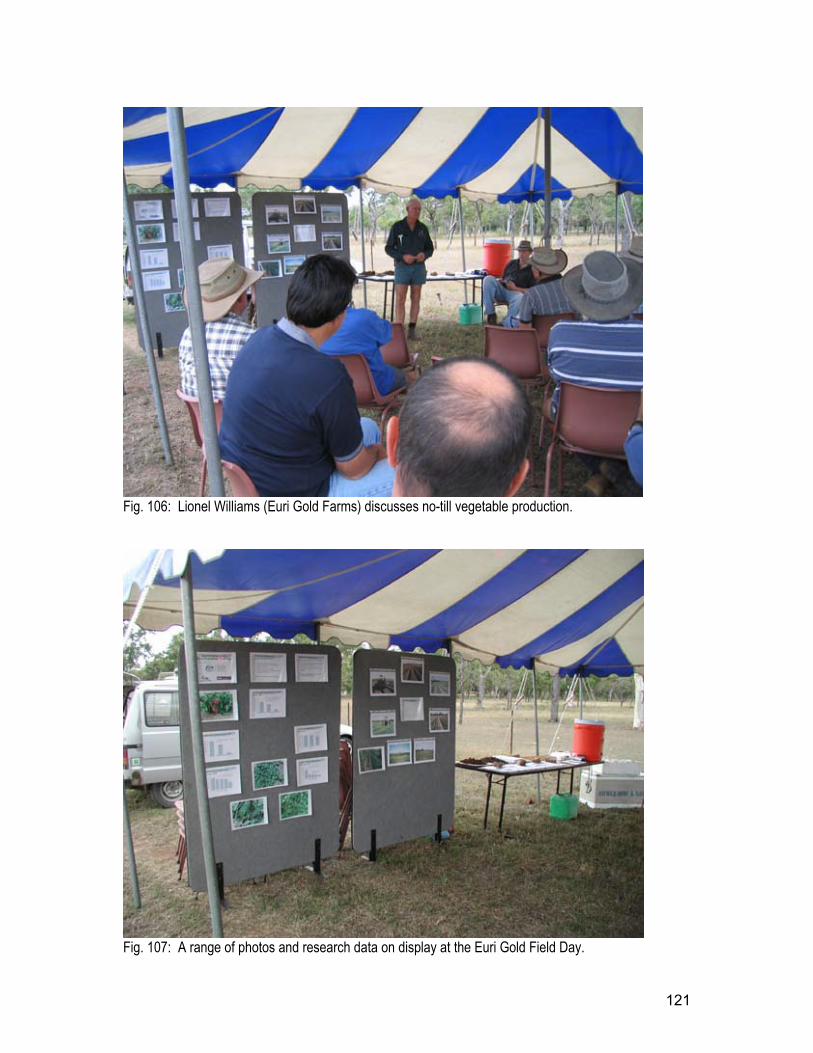
121
Fig. 106: Lionel Williams (Euri Gold Farms) discusses no-till vegetable production.
Fig. 107: A range of photos and research data on display at the Euri Gold Field Day.
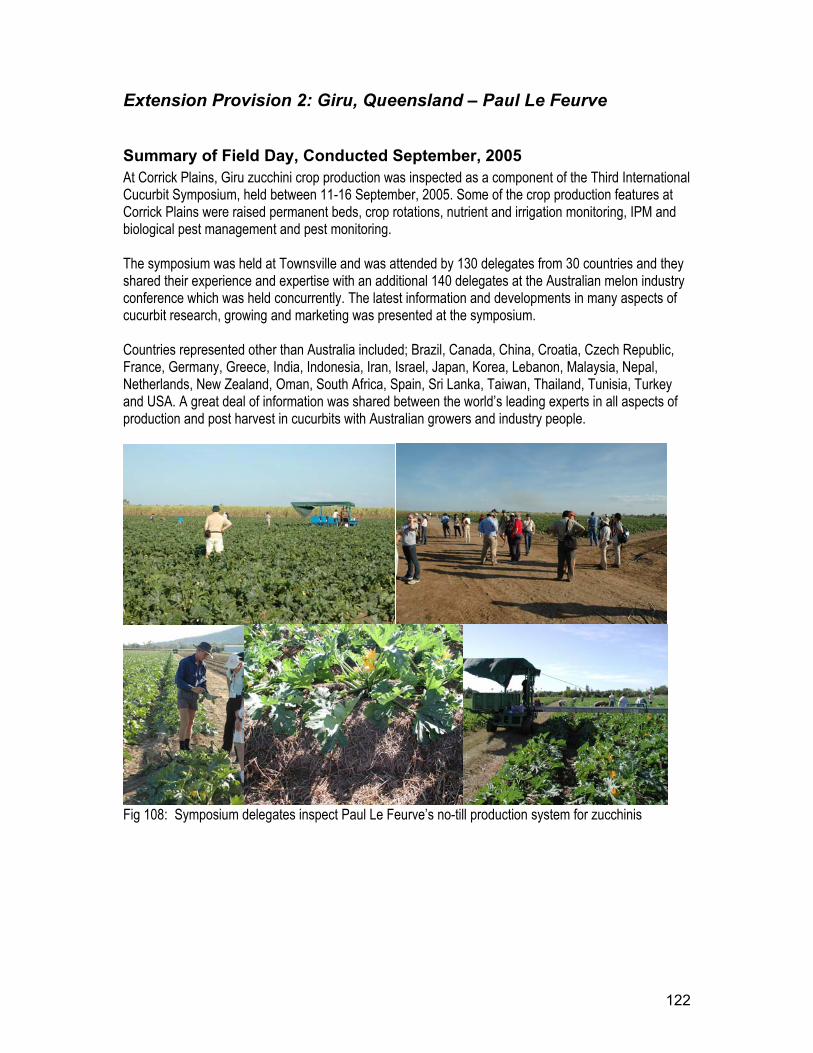
122
Extension Provision 2: Giru, Queensland – Paul Le Feurve
Summary of Field Day, Conducted September, 2005 At Corrick Plains, Giru zucchini crop production was inspected as a component of the Third International Cucurbit Symposium, held between 11-16 September, 2005. Some of the crop production features at Corrick Plains were raised permanent beds, crop rotations, nutrient and irrigation monitoring, IPM and biological pest management and pest monitoring. The symposium was held at Townsville and was attended by 130 delegates from 30 countries and they shared their experience and expertise with an additional 140 delegates at the Australian melon industry conference which was held concurrently. The latest information and developments in many aspects of cucurbit research, growing and marketing was presented at the symposium. Countries represented other than Australia included; Brazil, Canada, China, Croatia, Czech Republic, France, Germany, Greece, India, Indonesia, Iran, Israel, Japan, Korea, Lebanon, Malaysia, Nepal, Netherlands, New Zealand, Oman, South Africa, Spain, Sri Lanka, Taiwan, Thailand, Tunisia, Turkey and USA. A great deal of information was shared between the world’s leading experts in all aspects of production and post harvest in cucurbits with Australian growers and industry people.
Fig 108: Symposium delegates inspect Paul Le Feurve’s no-till production system for zucchinis
123
Concluding Remarks The report presents details of a number of trials and three commercial implementations using the principles of no-till vegetable farming. The project has shown that no till vegetable production is a viable alternative for vegetable growers who wish to get away form using use plastic mulch and cultivation. In addition, the system has potential long-term benefits such as soil health and stability, with the aim of increasing sustainability in small crop production. The principal aims of the project were to identify appropriate cover crops for winter and summer growth in selected regions and implement the system on the farms of co-operating growers. This involved the development of practices for the management of crop nutrition, planting, weed and pest control and irrigation, for both cover crops and commercial crops. The best techniques for killing the cover crop were also developed for various situations. A secondary focus was the use of legumes in cover cropping. The breakdown of organic material in soils, by microbial populations, requires the consumption of nitrogen. The aim of evaluating legumes as cover crops was to determine if nitrogen fixation by these species could reduce the need for nitrogen fertilizer. A comparison of conventional farming and no-till farming was made throughout the project, with an emphasis on system outputs (produce yield and quality, soil health and stability) and inputs (labour, machinery running costs, fertilizers, pesticides, water use efficiency). The trial sites covered a variety of soil types and climatic conditions including in Wemen (Victoria), Bourke and two sites in Richmond (New South Wales), Laidley (Queensland), Giru and Bowen (Queensland) and Katherine and Mataranka (Northern Territory. The main system used for irrigation was trickle and adequate tape depth, superior filtration and tape wall strength were found to be critical for meeting the aim of leaving bed irrigation undisturbed for 5-10 years. In temperate climates, a sorghum variety Nutrifeed, a hybrid Pennisetum, and millet have shown potential for summer cover crops with fine stems resulting in mulch which is easier to manage. For winter cover crops, cereals such as wheat, oats and barley as well as ryegrass grow well. Cereal rye has shown particularly high potential for use in New South Wales and Victoria. The fine stems produce high quality mulch when this cover crop is sown at high density. Cereals exhibit slower growth in tropical areas and often fail to prevent weed establishment. In the tropics, Millet has performed the best, as a summer-grown cover crop mulch for spring, winter and autumn vegetable crops. Legumes were also investigated as cover crops with each species evaluated alone and in combination with a cereal (or forage sorghum in the case of soybeans, grown through summer). White lupins and field peas were selected for temperate sites and Caloona cowpea and soybeans were examined in the tropics. White lupins and field peas generated insufficient ground cover and did not compete well with weeds. Their growth was suppressed when sown with barley. Tropical legumes performed adequately but cowpea growth rates were significantly retarded during cooler conditions.
124
Cover crops could be killed adequately with glyphosate (tank-mixed with a broadleaf herbicide if legumes are present) and then rolling with a crimping roller within 7 days of spraying. Organic Interceptor®, a herbicide approved for use in organic production, may also be a useful tool in no-till production. Direct seeding of commercial crops into organic mulch has been achieved with conventional seeders, in some cases after slight modification, such as lengthening the cups on a planter used for sowing rockmelon seed into plastic mulch. Transplanting seedlings into cover crop residue is a more specialised operation and ideally requires access to no-till transplanters, such as the Canadian manufactured RJV-600. This type of transplanter was found to handle all conditions well, with the exception of wet mulch. Organic mulch provided a buffering effect on soil temperature. Maximum soil temperatures under organic mulch were found to be lower than those under plastic mulch. These lower temperatures may lead to slower crop maturation and less vigorous growth, although in seedless watermelons, yields were comparable. Water retention was generally greater in soils under plastic mulch and irrigation frequency should therefore be increased when using organic mulch, especially during the establishment stage. The insulating effect was useful in certain situations, maintaining milder day temperatures through periods of excessive heat in the tropics and retaining a more optimal temperature through cold nights in northern Victoria. Organic mulch was also beneficial in protecting rockmelons from ground moisture. Details on how to implement the no-till system as well as a cost/benefit analysis is presented in the accompanying Best Practice Manual.
Future research With an increase in the interest in sustainable vegetable there is a need to continue research into no-till vegetable farming in Australia. Key focus areas for this research include:
• Strategies to improve the lateral distribution of water across beds in some soil types, where sub-surface trickle tape is used.
• Evaluation of a wider range of cover crops including soybeans. • Sowing density for other legume species such as Lucerne. • The prevention of ground rot in crops grown on mulch. • A comprehensive study of the viability of no-till vegetable production using a range of costs and
returns applicable to the variation seen across crops and regions in Australian vegetable production.
125
Articles and Publications
Journal Articles (Refereed) Rogers, G.S., Little, S.A., Silcock, S.J., Williams, L.F. (2004) “No-Till Vegetable Production using Organic Mulches in the Dry Tropics of Australia” Acta Hort, 638, pp215-223
Conference Proceedings (not refereed) Rogers, G.S., Little, S.A. (2002) “Sustainability research in Rockmelon Production – Minimum Tillage, Cover Crops and Organic Mulches” Presentation to Australian Society of Horticultural Science – Australian Melon Conference – Melbourne, Australia, July 2002. Rogers, G.S., Little, S.A. (2002) “No-Till Vegetable Production using Cover Crop Mulches” Presentation to Australian Society of Horticultural Science National Conference – Sydney, Australia, September 29 – October 2 2002. Rogers, G.S. Little, S.A. (2002) “No-Till Vegetable Production using Cover Crop Mulches” Presentation to Select Melons Australia – All Heart Conference – Townsville, Australia, October 29 – November 1 2002.
Magazine Articles A number of articles have been published in the industry magazine Good Fruit and Vegetables outlining the progress and practical aspects of the research. These articles were: “Vegetable Platter” – Good Fruit & Vegetables August 2002 “Vegetable Platter” – Good Fruit & Vegetables January 2003 Giggins, B., 2006, “Sustainable melon growing in NT’s Top End”, Good Fruit & Vegetables 16:10, 22-23 Little, S., Rogers, G. “Soil Temperatures under Organic Mulch: A double edged sword”, Good Fruit and Vegetables Bauer, B., “No-Till beans and squash at Gympie”. Submitted to Good Fruit & Vegetables April 2006
Articles in Newsletters and Grower Magazines Articles have also been published in state based vegetable growers magazines and newsletters. These articles were typically one-page summaries of the research with contact details for Applied Horticultural Research attached, encouraging growers to seek further information. Articles have been placed in the following publications: “No-Till transplanter gets plenty of attention” Melon News Vol 16, August 2003, p4 Article published in VEGELink NSW, 5, Summer 2002/2003 Little. S., 2004, “No-till a goer for the vegetable industries”, Sustainable Horticulture – progress in Sustainable Development for Australian Horticultural Industries – 2004. p6
126
Newsletters A newsletter entitled “No-Till News” was produced as part of the project and distributed to growers and other interested subscribers. The newsletters featured updates on the progress of the project and also included relevant articles about no-till farming and research in Australia and internationally. No-Till News No.1 July 2002 No-Till News No.2 October 2002 No-Till News No.3 December 2002 No-Till News No.4 March 2003 No-Till News No.5 June 2003 No-Till News No.6 September 2003 No-Till News No.7 January 2004 No-Till News No.9 October 2004 No-Till News No.10 December 2004 No-Till News No.11 September 2005 No-Till News No.12 December 2005

127
Recommendations • Refer to Best Practice Manual entitled No-Till, Permanent Bed, Vegetable Production Systems.
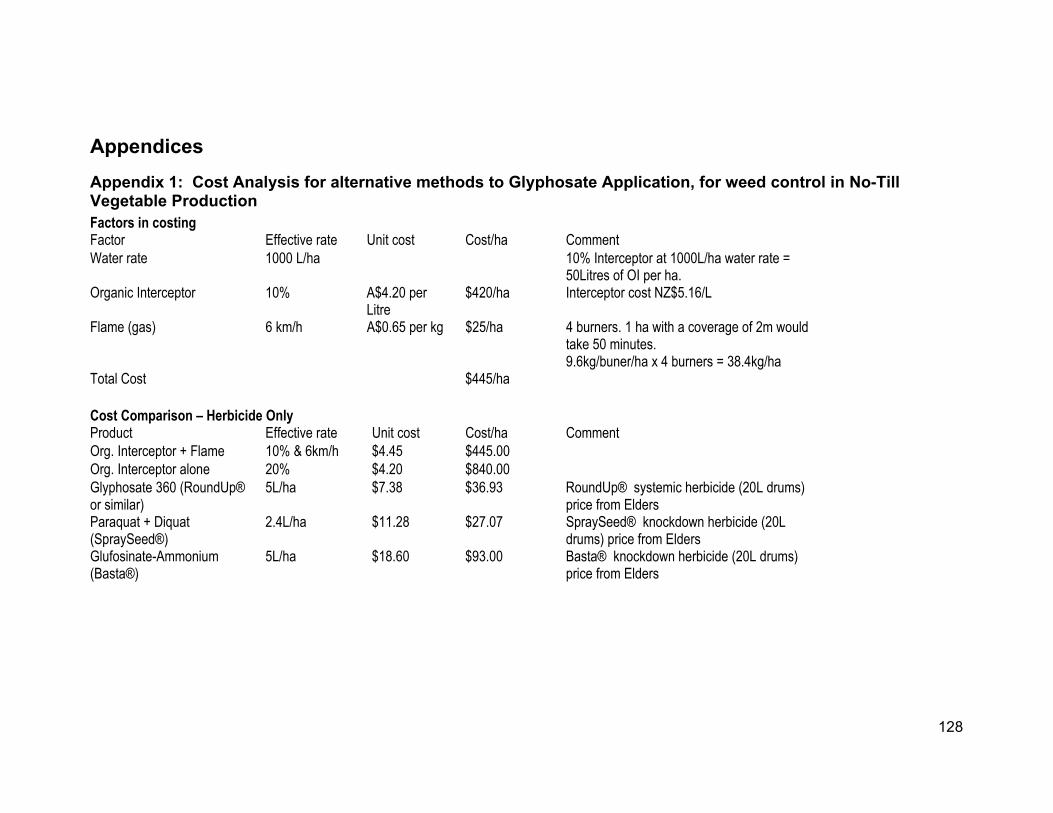
128
Appendices Appendix 1: Cost Analysis for alternative methods to Glyphosate Application, for weed control in No-Till Vegetable Production Factors in costing Factor Effective rate Unit cost Cost/ha Comment Water rate 1000 L/ha 10% Interceptor at 1000L/ha water rate =
50Litres of OI per ha. Organic Interceptor 10% A$4.20 per
Litre $420/ha Interceptor cost NZ$5.16/L
Flame (gas) 6 km/h A$0.65 per kg $25/ha 4 burners. 1 ha with a coverage of 2m would take 50 minutes. 9.6kg/buner/ha x 4 burners = 38.4kg/ha
Total Cost $445/ha Cost Comparison – Herbicide Only Product Effective rate Unit cost Cost/ha Comment Org. Interceptor + Flame 10% & 6km/h $4.45 $445.00 Org. Interceptor alone 20% $4.20 $840.00 Glyphosate 360 (RoundUp® or similar)
5L/ha $7.38 $36.93 RoundUp® systemic herbicide (20L drums) price from Elders
Paraquat + Diquat (SpraySeed®)
2.4L/ha $11.28 $27.07 SpraySeed® knockdown herbicide (20L drums) price from Elders
Glufosinate-Ammonium (Basta®)
5L/ha $18.60 $93.00 Basta® knockdown herbicide (20L drums) price from Elders
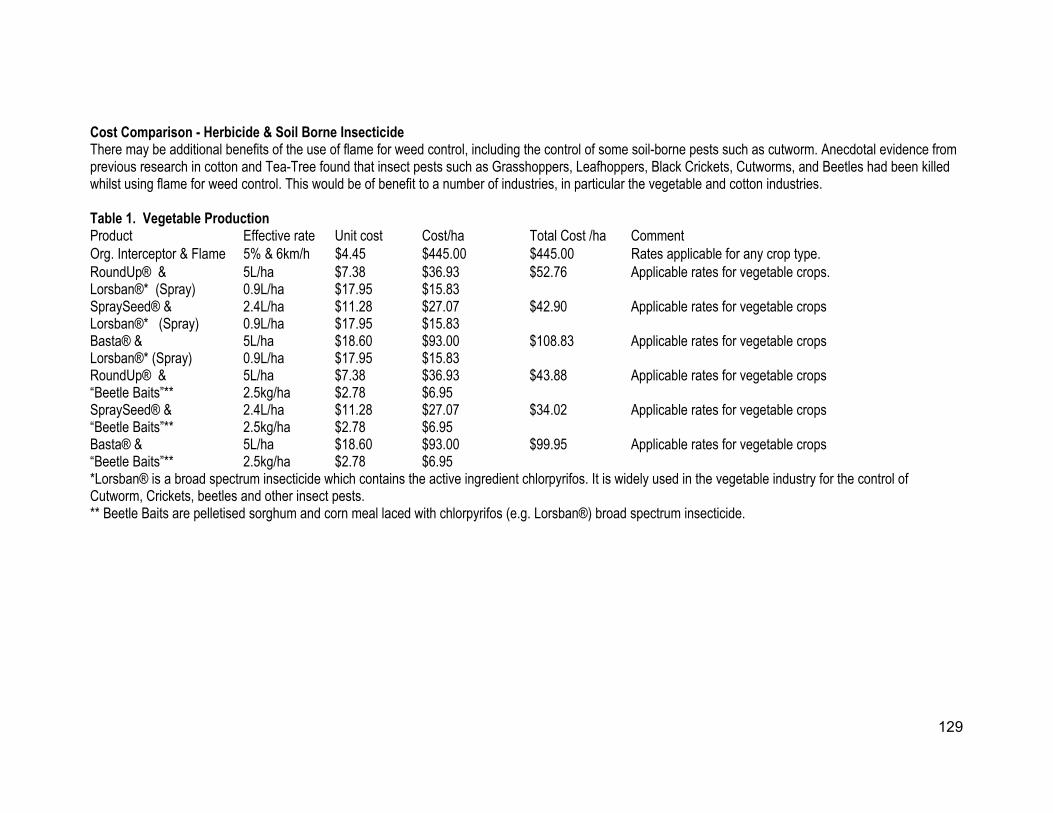
129
Cost Comparison - Herbicide & Soil Borne Insecticide There may be additional benefits of the use of flame for weed control, including the control of some soil-borne pests such as cutworm. Anecdotal evidence from previous research in cotton and Tea-Tree found that insect pests such as Grasshoppers, Leafhoppers, Black Crickets, Cutworms, and Beetles had been killed whilst using flame for weed control. This would be of benefit to a number of industries, in particular the vegetable and cotton industries. Table 1. Vegetable Production Product Effective rate Unit cost Cost/ha Total Cost /ha Comment Org. Interceptor & Flame 5% & 6km/h $4.45 $445.00 $445.00 Rates applicable for any crop type. RoundUp® & Lorsban®* (Spray)
5L/ha 0.9L/ha
$7.38 $17.95
$36.93 $15.83
$52.76 Applicable rates for vegetable crops.
SpraySeed® & Lorsban®* (Spray)
2.4L/ha 0.9L/ha
$11.28 $17.95
$27.07 $15.83
$42.90 Applicable rates for vegetable crops
Basta® & Lorsban®* (Spray)
5L/ha 0.9L/ha
$18.60 $17.95
$93.00 $15.83
$108.83 Applicable rates for vegetable crops
RoundUp® & “Beetle Baits”**
5L/ha 2.5kg/ha
$7.38 $2.78
$36.93 $6.95
$43.88 Applicable rates for vegetable crops
SpraySeed® & “Beetle Baits”**
2.4L/ha 2.5kg/ha
$11.28 $2.78
$27.07 $6.95
$34.02 Applicable rates for vegetable crops
Basta® & “Beetle Baits”**
5L/ha 2.5kg/ha
$18.60 $2.78
$93.00 $6.95
$99.95 Applicable rates for vegetable crops
*Lorsban® is a broad spectrum insecticide which contains the active ingredient chlorpyrifos. It is widely used in the vegetable industry for the control of Cutworm, Crickets, beetles and other insect pests. ** Beetle Baits are pelletised sorghum and corn meal laced with chlorpyrifos (e.g. Lorsban®) broad spectrum insecticide.
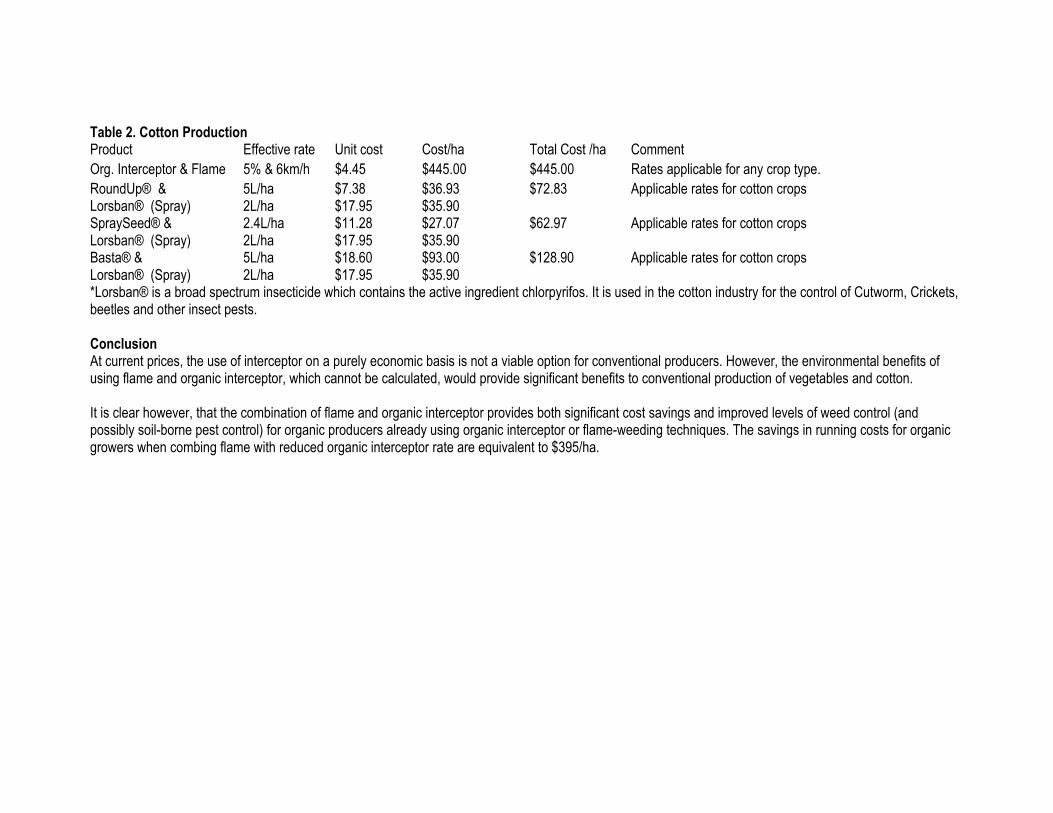
Table 2. Cotton Production Product Effective rate Unit cost Cost/ha Total Cost /ha Comment Org. Interceptor & Flame 5% & 6km/h $4.45 $445.00 $445.00 Rates applicable for any crop type. RoundUp® & Lorsban® (Spray)
5L/ha 2L/ha
$7.38 $17.95
$36.93 $35.90
$72.83 Applicable rates for cotton crops
SpraySeed® & Lorsban® (Spray)
2.4L/ha 2L/ha
$11.28 $17.95
$27.07 $35.90
$62.97 Applicable rates for cotton crops
Basta® & Lorsban® (Spray)
5L/ha 2L/ha
$18.60 $17.95
$93.00 $35.90
$128.90 Applicable rates for cotton crops
*Lorsban® is a broad spectrum insecticide which contains the active ingredient chlorpyrifos. It is used in the cotton industry for the control of Cutworm, Crickets, beetles and other insect pests. Conclusion At current prices, the use of interceptor on a purely economic basis is not a viable option for conventional producers. However, the environmental benefits of using flame and organic interceptor, which cannot be calculated, would provide significant benefits to conventional production of vegetables and cotton. It is clear however, that the combination of flame and organic interceptor provides both significant cost savings and improved levels of weed control (and possibly soil-borne pest control) for organic producers already using organic interceptor or flame-weeding techniques. The savings in running costs for organic growers when combing flame with reduced organic interceptor rate are equivalent to $395/ha.
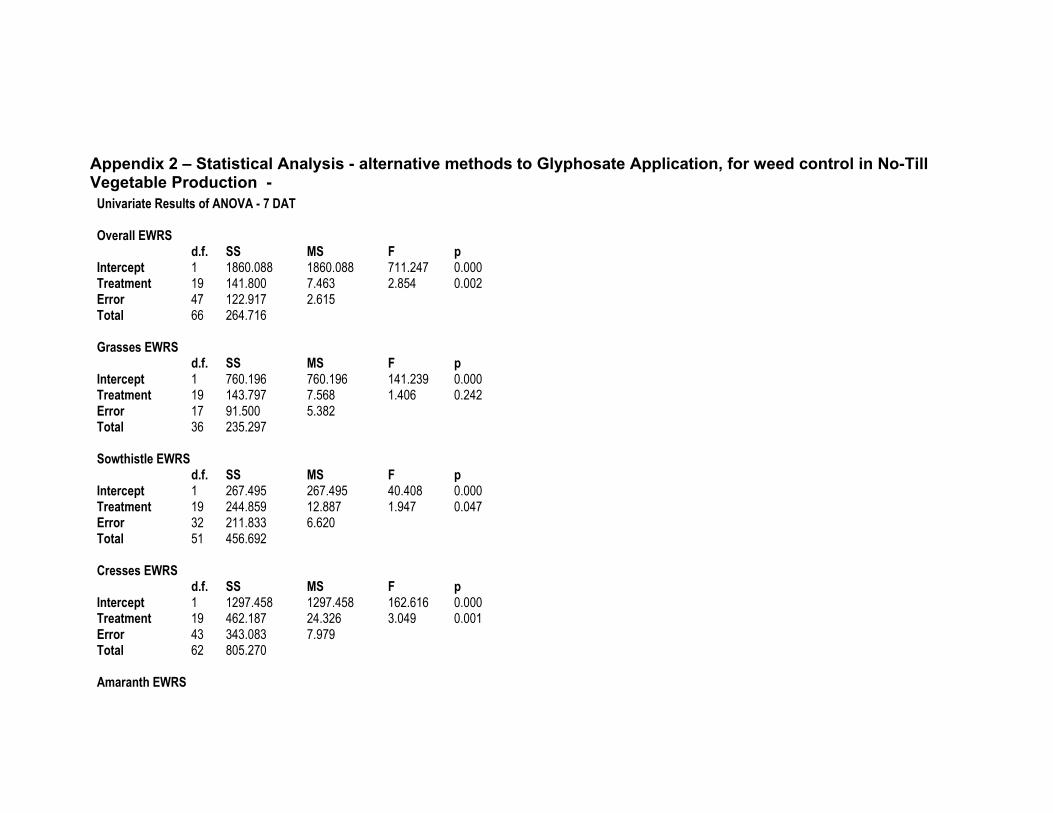
Appendix 2 – Statistical Analysis - alternative methods to Glyphosate Application, for weed control in No-Till Vegetable Production -
Univariate Results of ANOVA - 7 DAT Overall EWRS d.f. SS MS F p Intercept 1 1860.088 1860.088 711.247 0.000 Treatment 19 141.800 7.463 2.854 0.002 Error 47 122.917 2.615 Total 66 264.716 Grasses EWRS d.f. SS MS F p Intercept 1 760.196 760.196 141.239 0.000 Treatment 19 143.797 7.568 1.406 0.242 Error 17 91.500 5.382 Total 36 235.297 Sowthistle EWRS d.f. SS MS F p Intercept 1 267.495 267.495 40.408 0.000 Treatment 19 244.859 12.887 1.947 0.047 Error 32 211.833 6.620 Total 51 456.692 Cresses EWRS d.f. SS MS F p Intercept 1 1297.458 1297.458 162.616 0.000 Treatment 19 462.187 24.326 3.049 0.001 Error 43 343.083 7.979 Total 62 805.270 Amaranth EWRS
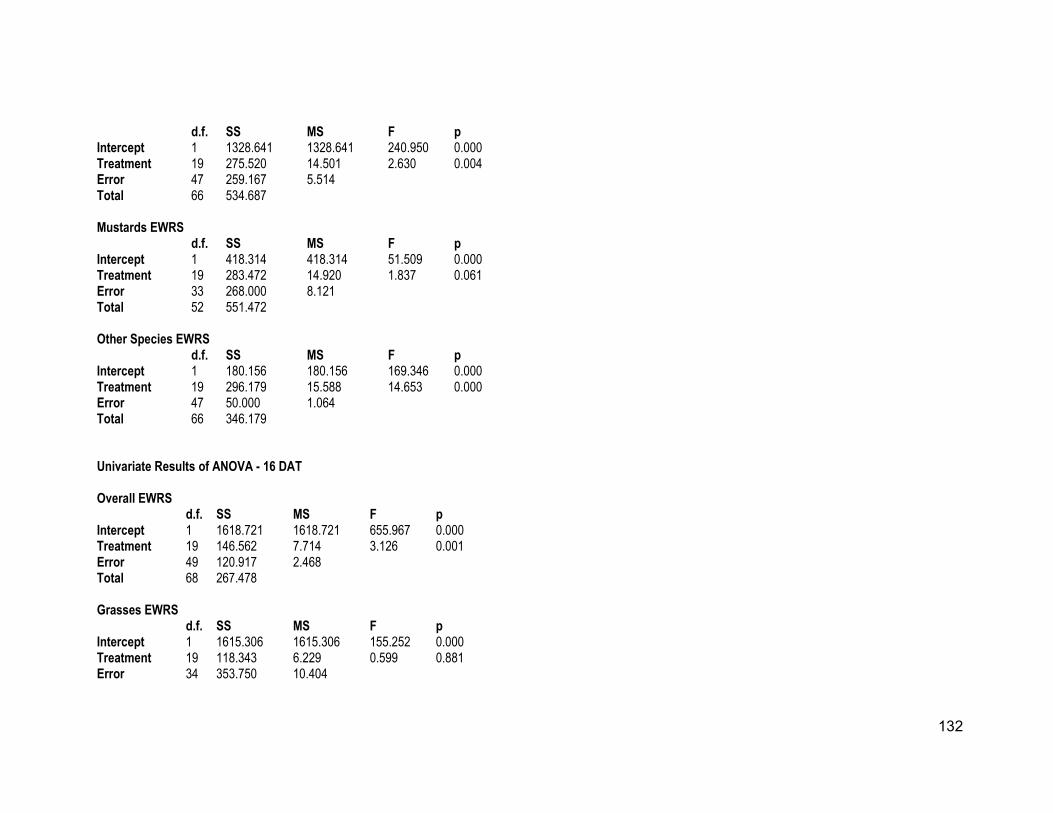
132
d.f. SS MS F p Intercept 1 1328.641 1328.641 240.950 0.000 Treatment 19 275.520 14.501 2.630 0.004 Error 47 259.167 5.514 Total 66 534.687 Mustards EWRS d.f. SS MS F p Intercept 1 418.314 418.314 51.509 0.000 Treatment 19 283.472 14.920 1.837 0.061 Error 33 268.000 8.121 Total 52 551.472 Other Species EWRS d.f. SS MS F p Intercept 1 180.156 180.156 169.346 0.000 Treatment 19 296.179 15.588 14.653 0.000 Error 47 50.000 1.064 Total 66 346.179 Univariate Results of ANOVA - 16 DAT Overall EWRS d.f. SS MS F p Intercept 1 1618.721 1618.721 655.967 0.000 Treatment 19 146.562 7.714 3.126 0.001 Error 49 120.917 2.468 Total 68 267.478 Grasses EWRS d.f. SS MS F p Intercept 1 1615.306 1615.306 155.252 0.000 Treatment 19 118.343 6.229 0.599 0.881 Error 34 353.750 10.404
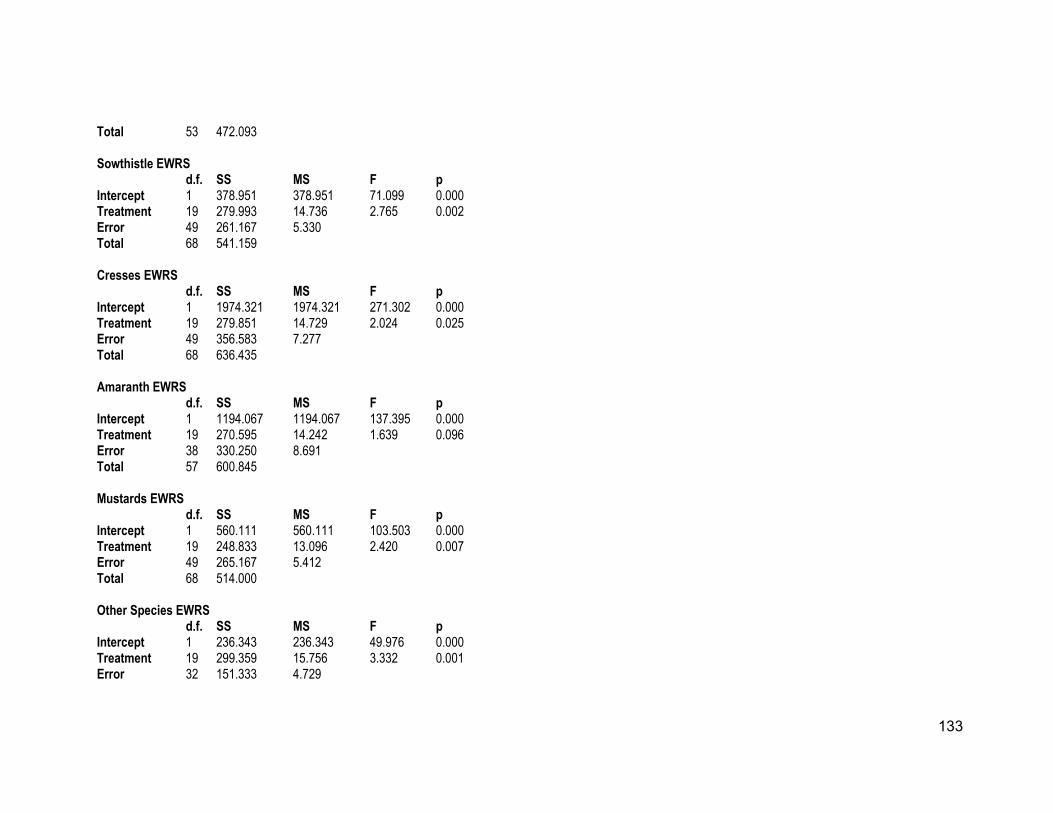
133
Total 53 472.093 Sowthistle EWRS d.f. SS MS F p Intercept 1 378.951 378.951 71.099 0.000 Treatment 19 279.993 14.736 2.765 0.002 Error 49 261.167 5.330 Total 68 541.159 Cresses EWRS d.f. SS MS F p Intercept 1 1974.321 1974.321 271.302 0.000 Treatment 19 279.851 14.729 2.024 0.025 Error 49 356.583 7.277 Total 68 636.435 Amaranth EWRS d.f. SS MS F p Intercept 1 1194.067 1194.067 137.395 0.000 Treatment 19 270.595 14.242 1.639 0.096 Error 38 330.250 8.691 Total 57 600.845 Mustards EWRS d.f. SS MS F p Intercept 1 560.111 560.111 103.503 0.000 Treatment 19 248.833 13.096 2.420 0.007 Error 49 265.167 5.412 Total 68 514.000 Other Species EWRS d.f. SS MS F p Intercept 1 236.343 236.343 49.976 0.000 Treatment 19 299.359 15.756 3.332 0.001 Error 32 151.333 4.729

134
Total 51 450.692
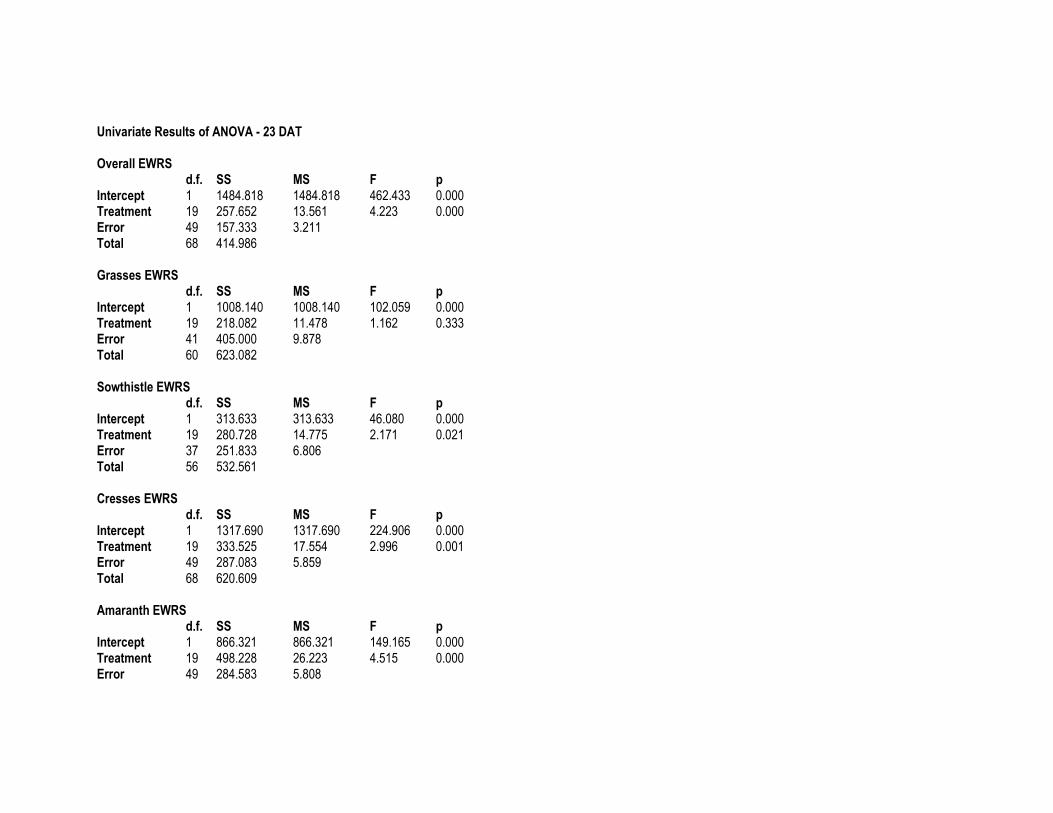
Univariate Results of ANOVA - 23 DAT Overall EWRS d.f. SS MS F p Intercept 1 1484.818 1484.818 462.433 0.000 Treatment 19 257.652 13.561 4.223 0.000 Error 49 157.333 3.211 Total 68 414.986 Grasses EWRS d.f. SS MS F p Intercept 1 1008.140 1008.140 102.059 0.000 Treatment 19 218.082 11.478 1.162 0.333 Error 41 405.000 9.878 Total 60 623.082 Sowthistle EWRS d.f. SS MS F p Intercept 1 313.633 313.633 46.080 0.000 Treatment 19 280.728 14.775 2.171 0.021 Error 37 251.833 6.806 Total 56 532.561 Cresses EWRS d.f. SS MS F p Intercept 1 1317.690 1317.690 224.906 0.000 Treatment 19 333.525 17.554 2.996 0.001 Error 49 287.083 5.859 Total 68 620.609 Amaranth EWRS d.f. SS MS F p Intercept 1 866.321 866.321 149.165 0.000 Treatment 19 498.228 26.223 4.515 0.000 Error 49 284.583 5.808
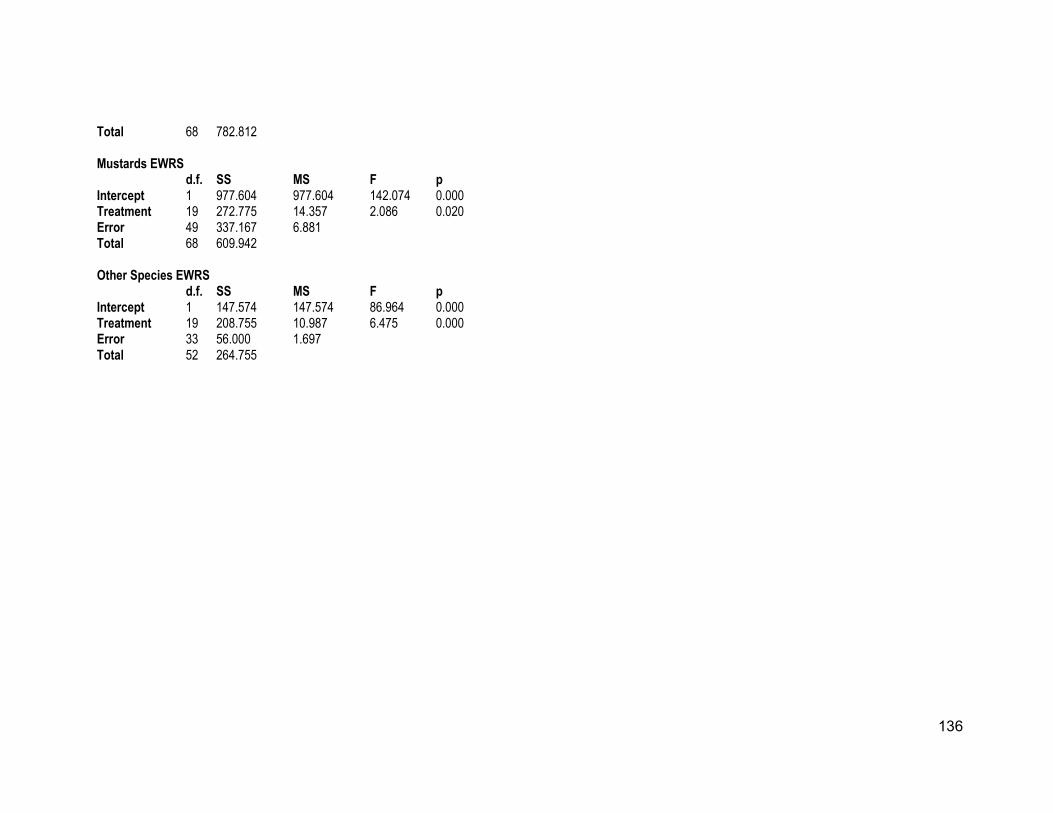
136
Total 68 782.812 Mustards EWRS d.f. SS MS F p Intercept 1 977.604 977.604 142.074 0.000 Treatment 19 272.775 14.357 2.086 0.020 Error 49 337.167 6.881 Total 68 609.942 Other Species EWRS d.f. SS MS F p Intercept 1 147.574 147.574 86.964 0.000 Treatment 19 208.755 10.987 6.475 0.000 Error 33 56.000 1.697 Total 52 264.755
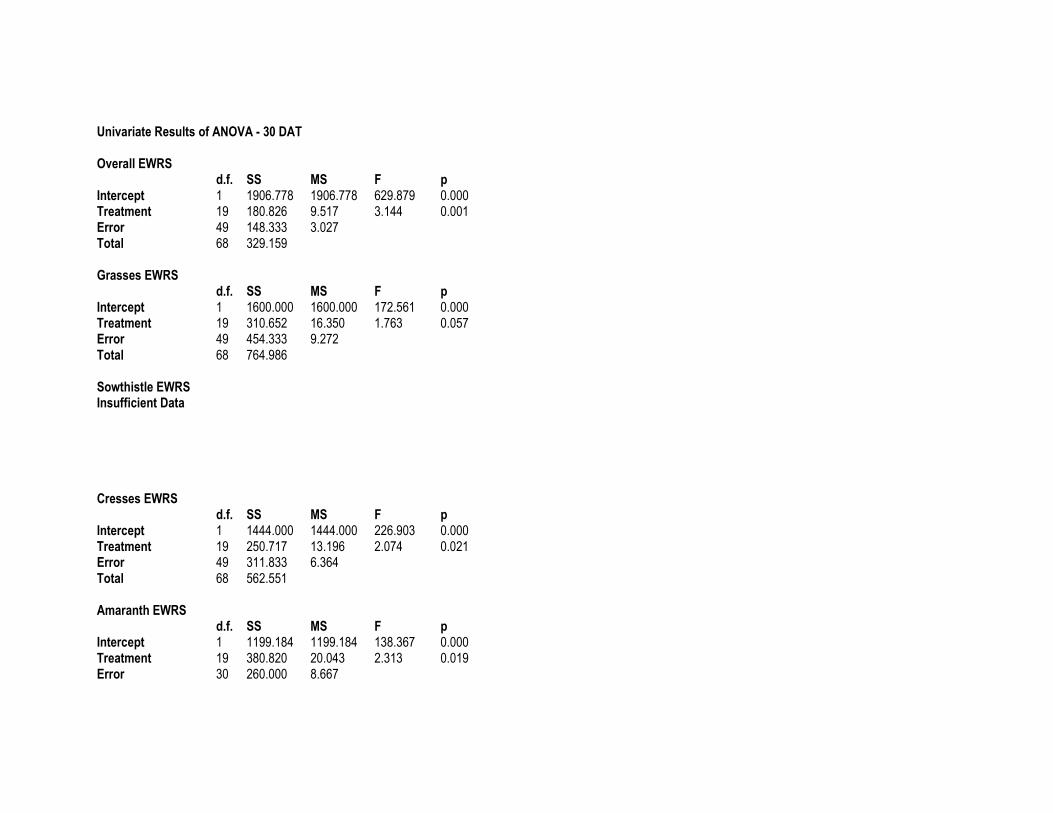
Univariate Results of ANOVA - 30 DAT Overall EWRS d.f. SS MS F p Intercept 1 1906.778 1906.778 629.879 0.000 Treatment 19 180.826 9.517 3.144 0.001 Error 49 148.333 3.027 Total 68 329.159 Grasses EWRS d.f. SS MS F p Intercept 1 1600.000 1600.000 172.561 0.000 Treatment 19 310.652 16.350 1.763 0.057 Error 49 454.333 9.272 Total 68 764.986 Sowthistle EWRS Insufficient Data Cresses EWRS d.f. SS MS F p Intercept 1 1444.000 1444.000 226.903 0.000 Treatment 19 250.717 13.196 2.074 0.021 Error 49 311.833 6.364 Total 68 562.551 Amaranth EWRS d.f. SS MS F p Intercept 1 1199.184 1199.184 138.367 0.000 Treatment 19 380.820 20.043 2.313 0.019 Error 30 260.000 8.667
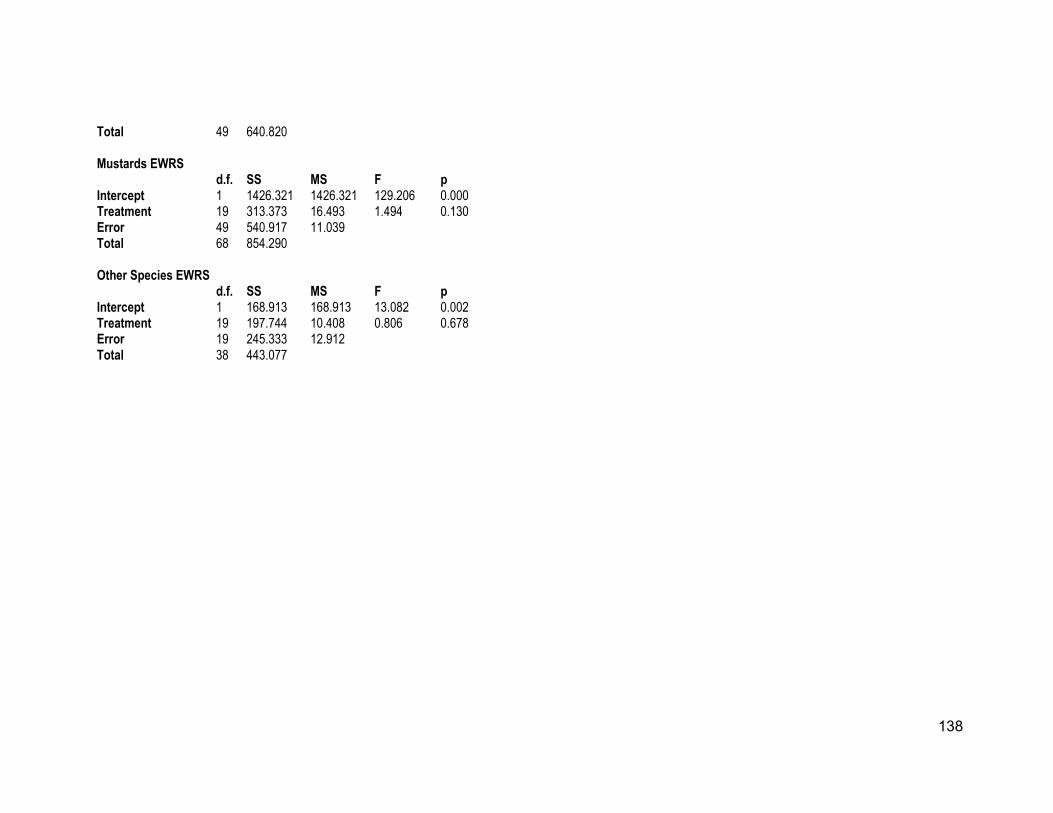
138
Total 49 640.820 Mustards EWRS d.f. SS MS F p Intercept 1 1426.321 1426.321 129.206 0.000 Treatment 19 313.373 16.493 1.494 0.130 Error 49 540.917 11.039 Total 68 854.290 Other Species EWRS d.f. SS MS F p Intercept 1 168.913 168.913 13.082 0.002 Treatment 19 197.744 10.408 0.806 0.678 Error 19 245.333 12.912 Total 38 443.077
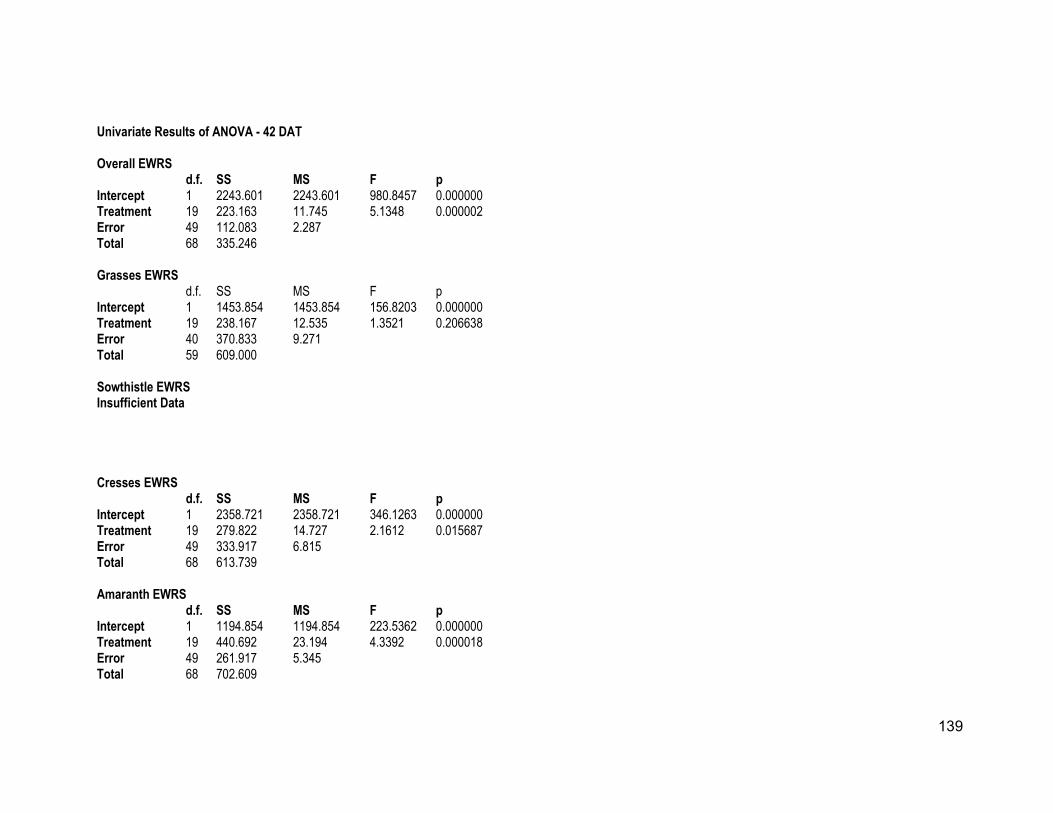
139
Univariate Results of ANOVA - 42 DAT Overall EWRS d.f. SS MS F p Intercept 1 2243.601 2243.601 980.8457 0.000000 Treatment 19 223.163 11.745 5.1348 0.000002 Error 49 112.083 2.287 Total 68 335.246 Grasses EWRS d.f. SS MS F p Intercept 1 1453.854 1453.854 156.8203 0.000000 Treatment 19 238.167 12.535 1.3521 0.206638 Error 40 370.833 9.271 Total 59 609.000 Sowthistle EWRS Insufficient Data Cresses EWRS d.f. SS MS F p Intercept 1 2358.721 2358.721 346.1263 0.000000 Treatment 19 279.822 14.727 2.1612 0.015687 Error 49 333.917 6.815 Total 68 613.739 Amaranth EWRS d.f. SS MS F p Intercept 1 1194.854 1194.854 223.5362 0.000000 Treatment 19 440.692 23.194 4.3392 0.000018 Error 49 261.917 5.345 Total 68 702.609
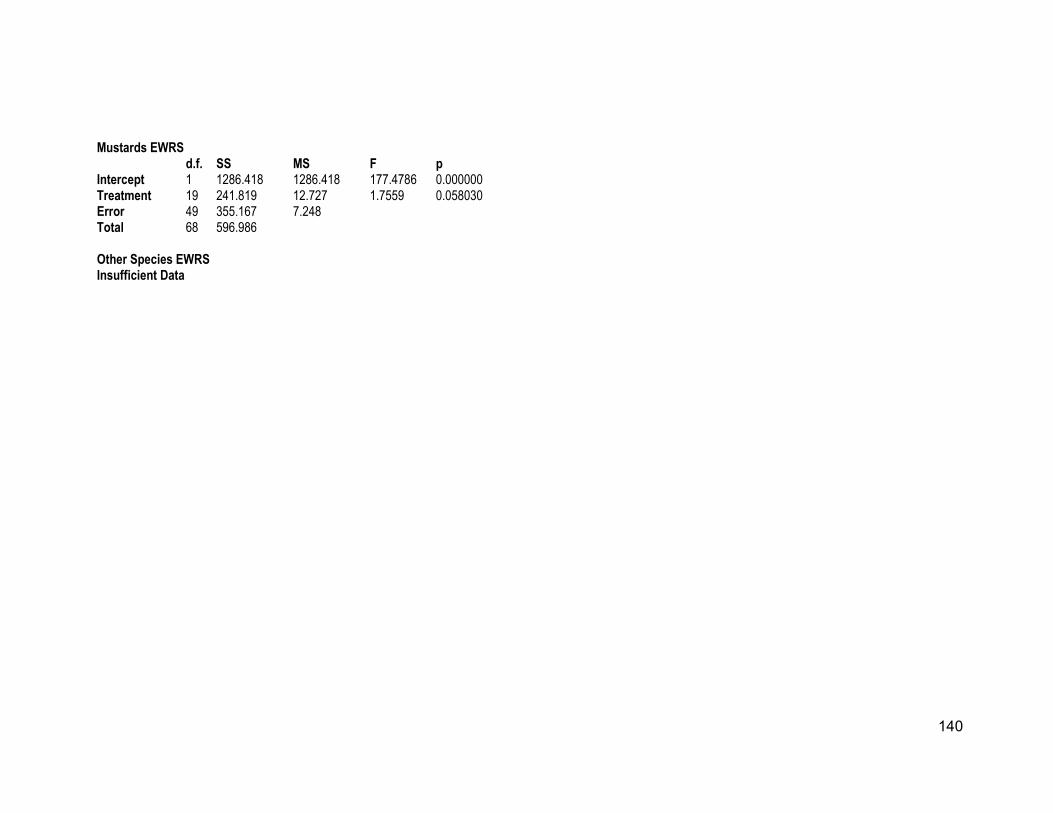
140
Mustards EWRS d.f. SS MS F p Intercept 1 1286.418 1286.418 177.4786 0.000000 Treatment 19 241.819 12.727 1.7559 0.058030 Error 49 355.167 7.248 Total 68 596.986 Other Species EWRS Insufficient Data