Embed Size (px)
Citation preview

International Institutefor Educational Planning
Smaller, Quicker, CheaperImproving Learning Assessments for Developing Countries
Daniel A. Wagner
Quality education for all

Smaller, Quicker, CheaperImproving Learning Assessments for Developing Countries
DANIEL A. WAGNER
Paris. UNESCO: International Institute of Educational PlanningWashington, DC. Education For All - Fast Track Initiative

The views and opinions expressed in this book are those of the author and do not necessarily represent the views of UNESCO or IIEP. The designations employed and the presentation of material throughout this book do not imply the expression of any opinion whatsoever on the part of UNESCO or IIEP concerning the legal status of any country, territory, city or area or its authorities, or concerning its frontiers or boundaries.
Published by: International Institute for Educational Planning7-9 rue Eugène Delacroix, 75116 Paris, [email protected]
Cover design: IIEPCover photo: UNESCO (Linda Shen) Typesetting: StudiographikPrinted in IIEP’s printshopISBN: 978-92-803-1361-1© UNESCO 2011

Smaller, Quicker, Cheaper / 3
Table of ContentsPreface 7Acknowledgements 8Abbreviations 9Executive Summary 10
1. Introduction 15 Initial Remarks 15 In Kahalé Village, Aminata’s Story 16 What Aminata’s Story Means 17 Structure of This Volume 18 Limitations 19 Purpose and Next Steps 20
2. Learning Outcomes and Policy Goals 21 EFA and Learning Achievement 21 The Promise of Improved Quality of Education 22 The Importance of Measurement 25 Concerns about Assessment 27
3. How Learning Indicators Can Make a Difference 29 Uses of Learning Indicators 29 Defining and Measuring Learning 30 Learning in and out of Schools 30 What Are My Options? An Education Minister’s Perspective 35
4. Assessments of learning in developing countries 37 Major Learning Assessments 37 How Deep, How Broad To Assess 44 Comparability of Assessments 53 Other Issues in Assessment Selection 57 Credibility of Assessment 67 Choosing an Assessment Design 69
5. Testing Reading in Children 70 Why Reading? 70 The Science of Reading Acquisition 71 Assessments of Reading 85
6. Problems and Prospects for Reading Tests 91 Some Questions Concerning Assessments of Beginning Reading 91 Pedagogical Implications of Assessments 94 Reading Assessment Methods: Some Additional Observations 99

4 / Smaller, Quicker, Cheaper
7. Cost of Assessments 108 Cost-benefit Analyses in Educational Assessment 109 Calculating the Costs 110 Cost Categories and Comparisons in Selected Assessments 111 Ways of Thinking about Costs 117 Adding up the Costs 119
8. Adult Literacy Assessment 121 Importance of Adult Literacy Today 121 Assessing Adult Literacy 123 Adult Learner Needs 126 Child and Adult Reading Acquisition 126 Literacy Relapse 127 Moving Forward on Adult Reading Assessments 129
9. Recommendations 130 There is no “Best” Reading Test 130 When in Doubt, go with Smaller Assessments 133 Quicker Results are Better Results 133 In Assessments, You Don’t Always Get What you Pay for 134 Learning Assessments Should Begin as Early as Possible (Within Limits) 135 Assessment Should be Designed to Improve Instruction 135 Cross-national Comparability is of Limited Value in Achieving Quality EFA 136 Cultural “Bias” in Assessment is not Always Bad 137 New Assessments can also Help in Adult Literacy Work 138 Accountability for Learning Impact Needs to be Widely Shared 138 Hybrid Assessments can Significantly Improve Policy Impact 139
10. Conclusions 141 Some Issues that Remain in Developing New Assessments 142 Use of Information and Communications Technologies 144 Moving Forward 145 Aminata’s Story: An Update 146
References 147
Annexes 175 Annex A: Description Of Reading Assessments 175 Annex B: Item Samples From Reading Assessments 184
About the Author 191

Smaller, Quicker, Cheaper / 5
Figures
Figure 2.1. Understanding education quality. 24
Figure 2.2. Mother’s literacy and schooling status in the Niger, the Lao PDR and Bolivia, 2000. 24
Figure 3.1. Literacy environment and reading achievement in PIRLS, in 2001. 32
Figure 4.1. Growth in use of national assessments of learning (1995-2006). 38
Figure 4.2. Assessment Continuum. Ranging from SQC hybrid assessments to LSEA and National Examinations. 45
Figure 4.3. PIRLS. Percentage of grade 4 pupils in the lowest quartile of the international reading literacy scale, 2001. 47
Figure 4.4. PISA. Percentage of 15-year-old students in five proficiency levels for reading, 2000-2002 (selected countries). 48
Figure 4.5. SACMEQ. Percentage of grade 6 pupils reaching proficiency levels in reading in seven African countries, 1995-1998. 50
Figure 4.6. Gender disparities in language and mathematics achievement in grade 6 based on national learning assessments. 51
Figure 4.7. Percent of selected language groups in the bottom 20% of the education distribution, selected countries. 52
Figure 4.8. Changes in literacy scores between SACMEQ I and SACMEQ II. 55
Figure 4.9. Rates of return on human capital investments initially setting investment to be equal across all ages. 60
Figure 4.10. Wealth-based gaps: Test scores across ages for the poorest and the fourth deciles in Ecuador, 2003–2004. 60
Figure 4.11. Background factors and reading literacy. 61
Figure 4.12. Grade 6 student reports of quantity of books in their homes in fifteen SACMEQ African education systems, 2000. 62
Figure 4.13. Percent of fourth grade students in PIRLS 2006. 66
Figure 5.1. A ‘distance theory’ approach to bilingual education programs. 80
Figure 5.2. The Gambia: Percentage of students who could not read a single word, 2007 and 2009. 89

6 / Smaller, Quicker, Cheaper
Figure 6.1. Histograms of Z scores in Oral Reading Fluency and Written (ECE) group-administered test, for Ashaninka students in Peru (N=40). 103
Figure 8.1. Illiteracy in selected developing countries, by region. 122
Figure 8.2. Adults with primary as their highest education level who report not being able to read. 124
Figure 8.3. Percentage of adults in each Basic Reading Skills level in the U.S. National Assessment of Adult Literacy. 128
Tables
Table 2.1. Impact of basic skills on income. 26
Table 3.1. Regional average yearly instructional time by grade level in 2000. 33
Table 4.1. EFA-FTI countries’ participation in international, regional and hybrid assessment studies, during the past decade. 41
Table 4.2. Indicators of participation in primary schooling. 56
Table 5.1. Estimates of adult illiterates and literacy rates (population aged 15+) by region, 1990 and 2000-2004. 74
Table 6.1. Class-wise percentage children by reading level, all schools 2010. 104
Table 7.1. Cost categories of the assessments used in selected studies. 113
Table 7.2. Cost studies of selected national, regional and cross-national assessments. 114
Table 7.3. Costs of assessment for national, regional, international and EGRA assessments. 115
Table 7.4. Costs by category, as percentages of total assessment expenditures. 117
Table 9.1. Summary of benefits and limitations of various assessments. 131
Smaller, Quicker, Cheaper / 7
Preface
More and more children are going to school in developing countries. In the years since the 2000 UN Education for All Summit in Dakar, the poorest nations have made the most gains in achieving improved educational access. This is a major achievement. Such success also comes with a realization that rapid growth in school en-rollments is not enough. Schooling must be of good quality for all children, and that has not been the case for too many children to date. The next push for educational development will surely focus on improving learning and educational quality. Learning assessments can play an important role to drive school reform in many countries, but many are not adaptable for developing country needs, or are not financially sustainable. Thus, it is imperative that we develop the ap-propriate tools that can provide better ways of measuring learning outcomes that nations wish to achieve. The present volume, entitled Smaller, Quicker, Cheaper: Improving Learning Assessments for Developing Countries, seeks to better understand the role and design of assessments in improving learning. This is a matter of vital concern to (and debate within) agencies such as those we represent, and amongst policy makers, specialists, and the public at large. The findings support the notion that effective use of educational assess-ments is fundamental to improving learning, and that having a mix of approaches, each one suited to a particular purpose, is useful. Furthermore, the document re-minds us that learning assessments are only as good as the uses that are made of them. Improved learning assessments can also help to focus attention on those most in need, as well as improve classroom instruction and overall performance of schools. Through work on this volume, the EFA-FTI and IIEP have had the op-portunity to work again in partnership toward the shared goals of improving edu-cation worldwide. This work is one outcome of the author’s role as a Visiting Fellow at IIEP, and in particular his leadership in a joint research project of our agencies. We are grateful to Dan Wagner for undertaking this thoughtful, comprehensive, and useful review that will be of value to all seeking to improve the quality of edu-cation, and its measurement, in developing countries. Robert Prouty, Head, Education For All - Fast Track InitiativeKhalil Mahshi, Director, IIEP-UNESCO

8 / Smaller, Quicker, Cheaper
Acknowledgements
This paper was commissioned by IIEP-UNESCO with support from the Education for All-Fast Track Initiative (EFA FTI), under the Quality Learning Indicators Project (QLIP). The author would like to acknowledge IIEP and its staff for their kind hospitality during which much of the QLIP work was undertaken in 2009, and especially to Mark Bray and Ken Ross at IIEP, for their support along the way, and to Alcyone Vasconcelos who managed the project while at FTI. Special thanks also to several specialists for their inputs and assistance on various chap-ters, as part of background work commissioned by IIEP: Nadir Altinok (Chapter 4 and Annex A), Scott Paris (Chapters 5 and 6), Liliane Sprenger-Charolles and Souhila Messaoud-Galusi (Chapter 5, and Annexes A and B), and Andrew Babson (Chapter 7)—parts of their work have been adapted for use in this volume. Many thanks as well to other colleagues who provided ideas and content that informed parts of this project or earlier drafts of this volume: Helen Abadzi, Gina Arnone, Samer Al-Samarrai, Aaron Benavot, Erik Bloom, Yuko Butler, Colette Chabott, Luis Crouch, Stephanie Dolata, Peggy Dubeck, Cesar Guadalupe, Amber Gove, Vincent Greaney, Robin Horn, Matthew Jukes, Anil Kanjee, Ann Kennedy, Ines Kudo, Marlaine Lockheed, Ana Luisa Machado, Paul McDermott, Ina Mullis, Benjamin Piper, Bob Prouty, Jake Ross, Carlos Ruano, Andreas Schleicher, Kathleen Trong, Pierre Varly, Larry Wolff, and others. Special thanks, also, are due to Koli Banik, Ryan Clennan, Carollyne Hutter, Amy Orr, and Estelle Zadra for their kind assistance in editing and document preparation. Naturally, all errors of fact and interpretation are the sole responsibility of the author, and are not intend-ed to represent the views of the above individuals or the EFA FTI, IIEP, UNESCO, or any other agency or organization.

Smaller, Quicker, Cheaper / 9
List of Abbreviations and Acronyms
CPL Cost Per Learner ECD Evidence-Centered DesignEFA Education For AllEGRA Early Grade Reading AssessmentFTI Fast Track Initiative (Education For All – Fast Track Initiative)GMR Global Monitoring Report (UNESCO)IALS International Adult Literacy SurveyICT Information and Communications TechnologyIEA International Association for the Evaluation of Educational AchievementIIEP International Institute for Educational Planning (UNESCO)IRI Informal Reading InventoriesIRT Item Response TheoryL1, L2 First Language (mother tongue), Second LanguageLAMP Literacy Assessment and Monitoring Program LAP Literacy Assessment Project LDC Less Developed CountryLLECE Latin American Laboratory for Assessment of the Quality of EducationLOI Language of InstructionLSEA Large-scale Educational Assessment MDG Millennium Development GoalsMLA Monitoring Learning AchievementMOE Ministry of EducationNFE Nonformal EducationNGO Nongovernmental OrganizationOECD Organisation for Economic Co-operation and DevelopmentORF Oral Reading FluencyOTL Opportunity to LearnPASEC Programme d’Analyse des Systèmes Eductifs des Pays de la CONFEMENPIRLS Progress in International Reading Literacy StudyPISA Program for International Student Assessment PSE Poorly-Supported Environment (for learning)RCT Randomized Control TrialsROI Return on InvestmentSACMEQ Southern and Eastern Africa Consortium for Monitoring Educational QualitySQC Small, Quicker, Cheaper (approaches to assessment)TIMSS Trends in International Mathematics and Science StudyUN United NationsUNESCO United Nations Educational, Scientific and Cultural OrganizationUIS UNESCO Institute for StatisticsUSAID United States Agency for International DevelopmentWSE Well-Supported Environment (for learning)

10 / Executive summary
EXECUTIVE SUMMARYEducators, policy makers, and others around the world are concerned about meet-ing the educational targets of the UN Millennium Development Goals (MDG) and Education For All (EFA) with the approaching deadline of 2015. More chil-dren than ever are in school, but some reports indicate that the quality of education in many developing countries has actually dropped in recent years. To understand these trends, educational specialists will need improved assessments of learning. The present volume provides a review of quality learning assessments, their status in terms of the empirical knowledge base, and some new ideas for improving their effectiveness, particularly for those children most in need. The main question addressed in this report may be summarized as fol-lows: Can the available research on the assessment of learning (particularly regarding learning to read) contribute to a more effective way to improve educational outcomes in developing countries? The key issues that respond to this broad question are provided in a series of ten chapters, as follows.
1. Introduction. The first chapter sets the context of the report by providing a vignette of a rural school in Africa in which a young girl and her teacher are in a dysfunctional learning situation, particularly regarding learning to read. The chapter suggests that assessment and monitoring can give voice to critical educational needs and point to proactive methods for remediation. It also lays out the structure of the report as well as some of its limitations.
2. Learning Outcomes and Policy Goals. This chapter describes the EFA goals, as well as their connection to learning achievement. How should models of educational quality be understood? How does a mother actually transmit skills, attitudes, and values to her children, even if she herself is poorly educated? The merits of better assessments and some inherent concerns are described. Also considered is the issue of assessment complexity, along with problems of stake-holders’ limited access to assessment results.
3. How Learning Indicators can Make a Difference. The chapter explores the uses of learning indicators, ranging from informing policy and creating standards to the correlates of learning and instructional design. Inputs can be measured in terms of the many experiences that children bring to school, along with the match or mismatch with children’s learning environments and their opportunity to learn. The chapter considers outputs from learning in two broad streams: the measurement of the skills and contents that are directly taught in schools (such as tests of curricular content); and the measurement of what society thinks learners should know and be able to do (such as reading a newspaper).

Smaller, Quicker, Cheaper / 11
4. Assessments of Learning in Developing Countries. This chapter describes three main types of assessments. (a) Large-scale educational assessments (LSEAs) are increasingly used by national and international agencies. Technological and methodological advances in assessment, combined with the political pressure to improve educational systems, have spurred this trend, including in less devel-oped countries (LDCs). Nonetheless, the increasing complexity of LSEAs has led some to question their necessity in LDCs. (b) Household-based educational surveys (HBES) employ sampling methods to gather specific types of informa-tion 0on target population groups at the household level, and stratified along certain desired demographic parameters. Finally, (c) more recent hybrid assess-ments pay close attention to a variety of factors such as: population diversity, linguistic and orthographic diversity, individual differences in learning, and timeliness of analysis. This hybrid approach is termed the “smaller, quicker, cheaper” (SQC) approach. The Early Grade Reading Assessment (EGRA), one recent hybrid assessment, has gained considerable attention in LDCs; it is de-scribed along with a number of regional and international LSEAs.
5. Testing Reading in Children. This chapter discusses reading, a core indicator of the quality of education and an essential part of the curriculum in schools across the world. In many LDCs, poor reading in primary school is among the most powerful predictors of future disadvantage and drop out. Some children live in poorly-supported (literacy) environments (PSE), as contrasted with those in well-supported (literacy) environments (WSE). The distinction is important in ways that help to better disaggregate factors that promote reading acquisition and its set of component skills. Among these skills are the alphabetic principle, phonemic awareness, oral reading fluency, vocabulary, reading comprehension, and automaticity. Other factors, such as first and second language reading, and orthography and spelling, are also reviewed. Various assessments are considered in light of current models of reading.
6. Problems and Prospects for Reading Tests. This chapter considers the inher-ent problems in tests and testing. For example, which skills should be assessed among children just learning to read? How does the orthography (writing sys-tem) affect assessment? In which language(s) should the child be tested? The chapter addresses these and related questions. Further, it has been found that “good” tests (from an empirical perspective) may not always be pedagogically “good” for the child. How can assessments respond to this challenge? Recent findings of international and regional assessments, several recent field studies using EGRA, and recent Fast Track Initiative (FTI) skill indicators are con-sidered in terms of the prospects for new assessments for addressing improved ways to assess quality of learning in developing countries.

12 / Executive summary
7. Cost of Assessments. This chapter considers the fiscal burden of assessments, an important issue for educational policy makers. One key consideration is cost of the technical expertise required of the national and international testing agency, as well as in-country human capacity. To compare the costs of LSEAs and smaller SQC style assessments, it is essential to consider the domains of scale, timeliness, and cost efficiency. Also, there is a trade-off be-tween time and money. While the cost per learner in EGRA appears similar to the larger LSEAs based on current data, the future costs will likely drop for EGRA as its tools become more familiar and enumerators become better trained. Furthermore, there are major opportunity costs to consider: LSEAs typically wait to assess children until fourth grade (or later) when children may be far behind in reading development. This can impose high costs in remediation that early assessment could avoid.
8. Adult Literacy Assessment. This chapter explores adult low-literacy and illit-eracy, a major international problem today. Indeed, a lack of useful assessments has led to confusion as to who is literate, what their skill levels are, and, there-fore, how to design appropriate policy responses. The chapter also explores the issue of adult learner needs (demand as contrasted to supply), the comparison of models of child and adult reading acquisition, and the notion of literacy re-lapse. Adult literacy is important for both human rights and economic growth. It is also a very important predictor of children’s reading. Improved adult read-ing assessment, building on children’s reading assessment tools, could signifi-cantly contribute to achieving EFA.
9. Recommendations. This chapter posits that there is a variety of tools for measurement and assessment from which to choose. Assessments need to be calibrated relative to specific policy goals, timeliness, and cost—what has been termed broadly as the SQC approach. The issues addressed in this review have resulted in a set of policy recommendations summarized below.
i. There is no “best” reading test. A reading test, as with any assessment tool, is only useful to the degree to which it responds to particular policy needs. Policy makers need to specify their goals before opting for one ap-proach or another.
ii. When in doubt, go with smaller assessments. SQC assessments have a clear, smaller-size advantage in that the human resources requirements can be better tailored to the human capacity realities of low-income societies.
iii. Quicker results are better results. LSEAs are undertaken every three or five or even 10 years. More time is needed for complex international com-parisons. By contrast, hybrid assessments have more focused aims and

Smaller, Quicker, Cheaper / 13
sample sizes as well as greater frequency. Real time analysis becomes pos-sible with substantial payoff.
iv. In assessments, you don’t always get what you pay for. There are trade-offs in costing processes, such that paying more does not necessarily guar-antee achievement of desired policy goals. Hybrid assessments can result in a substantially cheaper way of doing the business of assessment.
v. Learning assessments should begin as early as possible (within limits). There are many points at which one can usefully assess children’s (or adults’) skills, but the payoff is greatest when there is a practical way to measure towards the beginning of a long trajectory of learning.
vi. Assessment should be designed to improve instruction. Hybrid read-ing assessments can be conducted in time to make changes at the class-room (or individual) level before that child has left the school system. Assessment results should guide school leaders and instructors in helping children to learn.
vii. Cross-national comparability is often of limited value in achieving eduational quality in developing countries. International LSEAs are aimed at cross-national comparability, while hybrid assessments generally are not. Hybrids tend to be more focused, by design, on within-country comparison. Thus, hybrids offer some kinds of comparability that LSEAs do not. Which types of comparability are most important depends on the policy goals desired.
viii. Cultural bias in assessment is not always bad. Although many experts assume that cultural bias is a “bad” thing, the degree of concern with bias depends on one’s frame of reference. Hybrid SQC-type assessments have a relative advantage in this area as they are designed to be more adaptable to specific contexts.
ix. New assessments can also help in adult literacy work. While illiterate par-ents are likely to have children with reading acquisition problems or delays, new ways of assuring better accountability and effectiveness of adult literacy programs can help to ensure that early reading will be achieved.
x. Accountability for learning impact needs to be widely shared. Education specialists, policy makers, participants at high-level intergovernmental roundtables, ministers of education, community leaders in a rural village, teachers, and parents should all be held accountable for what and how children learn. SQC assessments have the potential to break new ground in accountability and local ownership of results.
xi. Hybrid assessments can significantly improve the impact of policy. SQC assessments can better track learning over time, can better adapt to local linguistic contexts, and can be better designed to understand children who are at the floor of typical learning scales. They will have an important role to play in education development policies over the years to come.

14 / Executive summary
10. Conclusions. The effective use of educational assessments is fundamental to improving learning. However, effective use does not only refer to the technical parameters or statistical methodologies. What is different today—in the context of today’s global education imperative—is the need to put a greater priority on near-term, stakeholder diverse, culturally sensitive, and high-in-local-impact assessments. Learning assessments—whether large-scale or household surveys or hybrid (SQC)—are only as good as the uses that are made of them. More research and development is needed, including in the rapidly developing domain of infor-mation and communications technologies.
Overall, SQC hybrid learning assessments have the potential to enhance educa-tional accountability, increase transparency, and support a greater engagement of stakeholders with an interest in improving learning. But, none of the above can happen without a sustained and significant policy and assessment focus on poor and marginalized populations. The current effort to broaden the ways that learning assessments are undertaken in developing countries is one very important way that real and lasting educational improvement will be possible.

Smaller, Quicker, Cheaper / 15
1. Introduction
Initial Remarks
The quest to achieve Education for All (EFA) is fundamentally about assuring that
children, youth and adults gain the knowledge and skills they need to better their
lives and to play a role in building more peaceful and equitable societies. This is
why focusing on quality is an imperative for achieving EFA. As many societies strive
to universalize basic education, they face the momentous challenge of providing
conditions where genuine learning can take place for each and every learner.1
In the complex terrain that is schooling and education worldwide, it is difficult to know how to interpret research that purports to explain education. How does one take into account the myriad variables and techniques that have been the staple of education re-searchers, such as student participation, funds spent, contact hours, motivation, meta-linguistic skills, problem-solving ability, and higher-order thinking? Currently, thou-sands of educational research studies have been done on these and other related topics. This review seeks to explore this question: Can the available research on the assessment of learning (and in learning to read, in particular) contribute to a more effective way to improve educational outcomes in developing countries? The answer is clearly “yes,” but getting to “yes” in a field such as learning (or reading) is not easy. This volume was produced to help the field move in promising new directions. The volume’s title—“Smaller, Quicker, Cheaper”—connects to an earlier paper published in 2003.2 That paper was mainly a complaint: Why was it that re-searchers often seem to do the exact opposite of the title, namely engaging in studies that were too big, too slow, and too costly to be relevant in an age where knowledge in real time can have real consequences. Furthermore, the earlier paper complained that assessments that are centered on the needs and requirements of industrialized and well-resourced countries might be less than suitable for use in developing coun-try contexts where the learning situation varies in important and discernable ways. What if researchers began with a focus on the actual learning needs of disadvantaged children in poor schools, and designed assessments from that vantage point?
1. UNESCO, 2004, p. v.2. Wagner, 2003. This was also based in part on earlier fieldwork in Morocco and Zimbabwe, Wagner (1990, 1993).

16 / Introduction
Fortunately, times have changed since that earlier paper was published. Today, more is known about what is needed in education assessment and develop-ment. This volume revisits these earlier criticisms and tries to fill in the blanks with new findings and new directions.
In Kahalé Village, Aminata’s Story
It is early morning in Kahalé village, about 45 kilometers from the capital city. It has been raining again, and the water has been flowing off the tin cor-rugated roof of the one-room schoolhouse at the center of the village. The rain makes it difficult for Monsieur Mamadou, a teacher, to get to his school on this Monday morning, as the rural taxi keeps getting stuck in the mud, forcing the six other passengers to help the driver get back on the road to the village. Once at school, Monsieur Mamadou waits for his school children to arrive. At 9 a.m., the room is only half-full, probably not a bad thing, as a full classroom would mean 65 children, and there are only benches enough to seat 50. Now about 35 students have arrived. Those with proper sandals and clean shirts that button are in the first row or two; those with no sandals and not-so-clean shirts sit further back. The children, all in second grade, range in age from 7 to 11 years. Monsieur Mamadou speaks first in Wolof, welcoming the children, telling them to quiet down and pay attention. He then begins to write a text on the blackboard in French, taking his time to get everything just so. The accuracy of the written text is important since only a few children (all in the front row) have school primers in front of them. Mamadou’s writing takes about 15 minutes, during which time the children are chatting, looking out the window, or have their heads bent down with eyes closed on their desks. Some are already tired and hungry as they have had nothing but a glass of hot tea and stale bread or mash in the morning. When Monsieur Mamadou finishes his writing, he turns around to address the class in French: “You are now to copy this text into your carnets (notebooks).” The children begin to work and Monsieur Mamadou steps outside to smoke a cigarette. Aminata, nine years old, sits in row three. She has her pencil out, and begins to work in her carnet, carefully writing down each word written on the blackboard. She is thankful to make it to school that day, since her little baby sister was going to need Aminata to be a caretaker at home—except that her Auntie was visiting, so Aminata could go to school after all. While going to school is better than staying home, Aminata has a sense that she is not making very good use of her time. She can copy the text, but doesn’t understand what it says. Aminata can only read a few French words on the street signs and wall ads in her village. Thus, even as the only “schooled” child in her family, she is not much help to her mother who wants to know what the writing on her

Smaller, Quicker, Cheaper / 17
prescription bottle of pills really says. Aminata feels bad about this, and wonders how it is that her classmates in the first row seem to already know some French. She also wonders why M. Mamadou seems only to call on those pupils to come to the front of the class and work on the blackboard, and not her. She’s heard that there is a school after primary school, but only the first-row kids seem to get to enroll there. What is the point of studying and staying in school, she wonders?
What Aminata’s Story Means
In the above story, there is nothing remarkable about Monsieur Mamadou or Aminata. The vignette tells an all too familiar tale that is repeated in countries around the world.3 Although dysfunctional classroom contexts exist in all nations, their consequences are exacerbated when resources for learning are so limited, as in the poorest countries in Africa. This vignette is about poverty, failing educational systems, and the communities that fail to notice what is wrong in their midst. The above vignette represents a story of learning assessment, and what needs to be done about it. It tells a story about non-learning, non-reading, and incipient school failure. Most children similar to Aminata will not be adequate-ly assessed for learning before they drop out of school. Many children similar to Aminata will not exist from a national statistical perspective. They will not make it to secondary school, will not go to university, and will not get a job in the global economy. This year or next will likely be Aminata’s last in school. She will likely marry around puberty and begin a similar cycle of non-education for her own chil-dren. This is not true of all children, but it is true of most children in poor parts of poor countries. This familiar story needs to be addressed and changed. This volume takes Aminata’s story as the heart of the education problem in the poorest developing countries. One may think of assessment and monitoring as statistical exercises, but this would be seriously incorrect. Assessment and moni-toring, if done with care, will give voice to the educational needs that Aminata’s story reveals, and, if done properly, can lead not only to accountability in educa-tion, but also point to proactive methods for remediation. The reader is asked to keep Aminata in mind — she is the raison d’etre for better learning indicators.
3. See another detailed description, in Kenya, by Commeyras & Inyega (2007).
18 / Introduction
Structure of This Volume Following the Introduction, Chapter 2 discusses how learning outcomes should be con-sidered in light of policy goals, especially including the improvement of educational quality, as well as some concerns about how assessments are, and are not, used today.
Chapter 3 describes the many ways in which learning indicators can be used and provides a definition of learning as well as the inputs and outputs to education that can be better understood through learning indicators. This chapter also suggests the types of options from which policy makers might wish to choose when thinking about improving educational quality.
Chapter 4 explores the main types of learning assessments, focusing on those most in use in developing countries, including large-scale assessments, household-based surveys and new hybrid assessments (such as EGRA). This chapter also delves into the issues of skills and population sampling, comparability of assessments, credibility of assessments, and a variety of other areas related to the measurement of learning.
Chapter 5 covers the topic of reading assessments. It begins with a rationale for a focus on the testing of reading, and discusses the science of reading acquisition, along with issues of first and second language reading, the role of orthographies and the types of tests currently in use.
Chapter 6 deals with the pedagogical implications of various reading tests, and why some reading tests are not so good for children.
Chapter 7 considers the important topic of cost. What are the overall costs, how much do different assessments really cost, and how cost-efficient are they?
Chapter 8 describes adult literacy assessments, including efforts to undertake household based surveys in developing countries. Chapter 9 provides a summary of the main findings and recommendations, includ-ing subsections on early detection systems of evaluation, the problem of testing in real time, and related issues.
Chapter 10, the conclusion, reconsiders the opening village story of Aminata in light of current developments in assessment.

Smaller, Quicker, Cheaper / 19
Limitations This review is designed to focus on the decision matrix by which a policy maker (typically, a minister of education or other senior decision maker) would consider using one or another type of assessment for purposes related to educational quality. Yet, to make a choice among assessment options one must take into account that the field of assessment is always in motion. New assessment tools (and data that test their utility) are under constant development, and, consequently, such assessments are adjusted and adapted on a continual basis. Thus, a first limitation of this review is that it is necessarily selective, and is designed primarily to give the reader a sense of the quality education assessment field, rather than a final summative statement on what to do tomorrow. A second limitation concerns the substance or content of what is tested. It is impossible to cover the numerous content issues as related to curricula designed by various government and nongovernmental agencies, nor is it possible to definitively say what “quality education” should or should not be. Rather, this report assumes that reading and reading achievement are on everyone’s list of basic elements of learning quality—an assumption that research or policy has not seriously challenged. Third, there are con-text limitations—this review is supported by the Fast Track Initiative and UNESCO, both of which focus on the poorest countries in the world. Yet, reading research has been to a great extent undertaken in high-income OECD countries and in European languages. To what extent can research derived from these countries and cultures be applied to non-OECD, poor, developing country settings? This classic question also serves as an important limitation. Fourth, there is diversity (by gender, language, ethnicity, and so on) within countries, whether OECD or developing, which makes it difficult to assume that multiple contexts can be fully understood by national level statistics. Fifth, disciplinary limitations exist: how much credence should one put in international, national, or local level explanations, or in case studies or large-scale surveys, or in brain-based conclusions, individual motivations, and socio-cultural factors? These matters are debated within and across the social sciences, and have bedeviled the field of reading and education for many years. Finally, there are limitations in simply trying to derive a clear set of gen-eral recommendations for use in poor countries when each context is diverse on many levels. Yet, without this analysis, good ideas for improving education for all may not be adopted.

20 / Introduction
Purpose and Next Steps This volume is inspired by current efforts to promote the use of quality learn-ing indicators in education, in the framework of Education for All and the UN Millennium Development Goals. It aims to provide a rigorous and scientific back-ground and context for these current efforts to create, implement, and use such indicators for policy development, and ultimately to improve learning, particularly emphasizing poor and disadvantaged contexts in developing countries. This review tries to be neutral in the sense that there were no preconceived notions as to what makes one test necessarily better than another. Indeed, there is no best test. It is desirable to have a set of assessments that can be mapped on to a series of policy questions and national contexts, such that the choice of testing instruments is made based on appropriateness to specific policy goals. Work on assessments of all kinds, including later iterations of nearly all of the assessments described in this volume, is ongoing. The results of these assess-ments will be debated, and the field of educational quality will be richer for such discussions. As the knowledge base on assessment continues to grow, the next steps will likely take the form of expanding and deepening the use of indicators as one very important avenue for improving learning and schooling worldwide.

Smaller, Quicker, Cheaper / 21
2. Learning Outcomes and Policy Goals
UNESCO promotes access to good-quality education as a human right and supports
a rights-based approach to all educational activities. … Within this approach, learning
is perceived to be affected at two levels. At the level of the learner, education needs to
seek out and acknowledge learners’ prior knowledge, to recognize formal and infor-
mal modes, to practice non-discrimination and to provide a safe and supportive learn-
ing environment. At the level of the learning system, a support structure is needed to
implement policies, enact legislation, and distribute resources and measure learning
outcomes, so as to have the best possible impact on learning for all.4
EFA and Learning Achievement
[B]asic education should be focused on] actual learning acquisition and out-
comes, rather than exclusively upon enrolment, continued participation in orga-
nized programs, and completion of certification requirements.5
Many in the education field consider the World Conference on Education for All in Jomtien in Thailand in 1990 to be a watershed moment in international educa-tion and development. Two key themes of this event were particularly significant: first, a focus on the education of children (and adults) in poor countries across several educational goals; and second, a cross-cutting effort to promote the quality of learning in education, not just counting who was or was not in school. In 2000, at an Education for All conference in Dakar, Senegal, these same two themes were reinforced in a more detailed list of six education targets.6 They were reinforced again in the UN Millennium Development Goals for 2015.7 With these goals and themes in place, the conference organizers realized that improved ways of measuring learning outcomes were going to be required, especially in the poorest developing country contexts. It was thought that with improved assessment methodologies and greater capacity for data collection and analysis, it would be possible to address the increased need for credible data on
4. UNESCO, 2004, p. 30.5. UNESCO, 1990, p. 5.6. The six goals of Dakar EFA Framework for Action were the following: early childhood care; compulsory primary school; ensuring learning needs for all; adult literacy; gender disparities; and quality of measurement of learning outcomes. UNESCO, 2004, p. 28.7. United Nations (2000).
22 / Learning outcomes and policy goals
learning achievement in a truly global perspective. In the years following Jomtien and Dakar, various initiatives began that devoted substantial new resources to learning achievement and its measurement.8 Educational quality is not, however, only a matter of international po-litical commitment, sufficient funding, technical expertise, and human resources. Rather, there are important choices to be made about which information (that is, data) will be sought and listened to, and for which stakeholders. One may consider the following types of stakeholder questions: • Attheinternationallevel.Adonoragencymightask:Howcanwe(theinterna-
tional or donor community) better judge the current status of learning across countries? Further, which countries should be compared? Or what kind of learn-ing is common enough across countries that would allow “fair” comparison?
• Atthenational(country)level.Aministerofeducationmightask:Howcanweimprove the flow of talent through the multiple levels of education, ensuring that all pupils at least attain some threshold amount of learning, while assuring that those with most talent rise as high as possible in the education system? How can we help our system do better?
• Atthelearner(individual)level.Astudentmightask:WhatamIgoingtogetout of participating in a school or nonformal education program? What does it mean for me to get a certificate, a degree, or a diploma? So many of my con-temporaries have diplomas and no jobs. What is this education really for?
Such questions will vary not only by type of stakeholder, but also by country, gen-der, ethnic and linguistic group, as well as by region within and across countries. This variation begins to point toward the inequalities that exist (and, importantly, are perceived by stakeholders to exist) across various group memberships. In other words, the assessment of learning begins to help shape policies that can drive edu-cational quality and educational change.
The Promise of Improved Quality of Education
[L]evel of cognitive skills is a crucial component of the long-run growth picture.
What has been missing is a focus on the quality, rather than quantity, of education
— ensuring that students actually learn. . . . Importantly, attending school affects
economic outcomes only insofar as it actually adds to students’ learning. School
attainment does not even have a significant relationship with economic growth
after one accounts for cognitive skills.9
8. UNESCO’s project on Monitoring Learning Achievement (MLA), the establishment of the UNESCO Institute for Statistics, and various international and regional assessments that are the focus of the present paper were all notable.9. Hanushek and Woessmann, 2009a. See also Hanushek and Woessmann, 2009b.

Smaller, Quicker, Cheaper / 23
Educational quality, the subject of the 2005 EFA Global Monitoring Report, has about as many different meanings as it has had specialists and policy makers who write about it. Nonetheless, there seems to be a consensus on several core compo-nents, including the following:• What learners should know—the goals of any education system as reflected in
missions/value statements and elaborated in the curriculum and performance standards
• Where learning occurs—the context in which learning occurs (such as class size, level of health and safety of the learning environment, availability of re-sources and facilities to support learning such as classrooms, books, or learning materials)
• How learning takes place—the characteristics of learner-teacher interactions (such as the roles learners play in their learning, teacher and learner attitudes towards learning, and other teacher practices)
• What is actually learned—the outcomes of education (such as the knowledge, skills, competencies, attitudes, and values that learners acquire)10
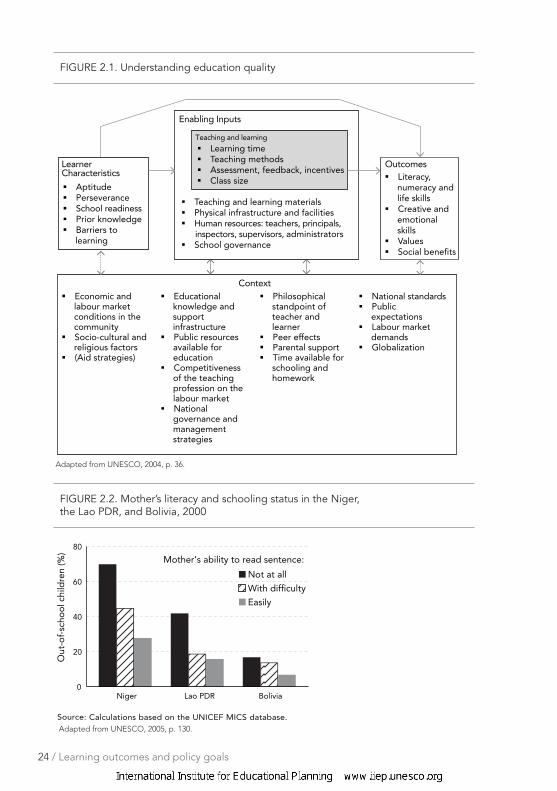
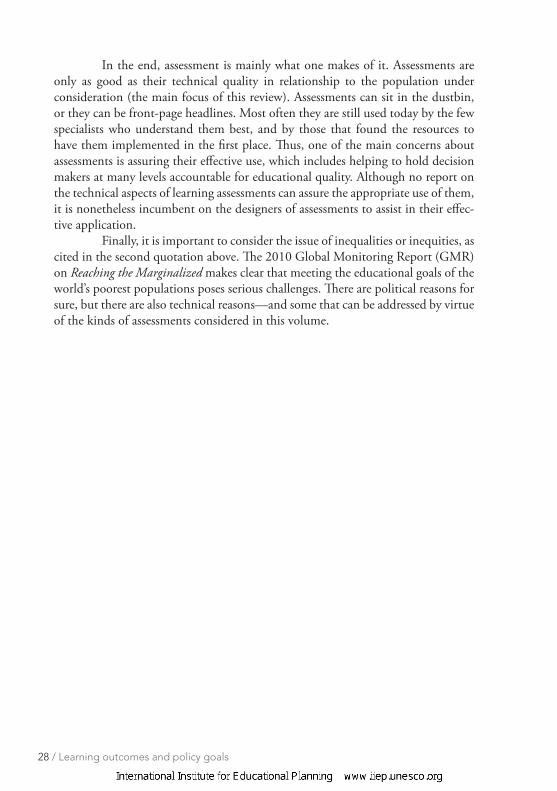
A second way that educational quality may be considered is through the use of input-output models, such as that shown in Figure 2.1, from UNESCO’s Global Monitoring Report on Quality. In this model, a number of key learner character-istics are taken into account, most particularly what a child has learned at home before arriving at school. The school provides a set of inputs that includes time, teaching methods, teacher feedback, learning materials and so forth. The outcomes of this process, in the learner, may be a set of cognitive skills learned (such as reading and writing), social attitudes and values, and more. This model points to the impor-tance of measuring a variety of outcomes, but leaves out which outcomes depend on which intermediate contextual variables, and how one might measure them. By understanding the component processes, a path toward improvement begins to come into focus. Take one example—the role of a mother’s education on the academic success of her children. Many claim that maternal education is one of the most powerful determinants of children’s staying in school and learning achievement (Figure 2.2).11 Yet, how does a model of quality of education work systematically? How does a mother actually transmit skills, attitudes, and values to her children, even if she herself is poorly educated? As discussed further in the following chapter, new research is beginning to answer such questions.
10. Adapted from Braun and Kanjee (2006), p. 5. In addition to quality, their framework also considered issues of access, equity, and efficiency.11. See Summers (1992) for a prominent World Bank statement on gender and education.
24 / Learning outcomes and policy goals
Economic and labour market conditions in the community Socio-cultural and religious factors (Aid strategies)
Educational knowledge and support infrastructure Public resources available for education Competitiveness of the teaching profession on the labour market National governance and management strategies
Philosophical standpoint of teacher and learner Peer effects Parental support Time available for schooling and homework
National standards Public expectations Labour market demands Globalization
Context
Enabling Inputs
Teaching and learning
OutcomesLearner Characteristics
Aptitude Perseverance School readiness Prior knowledge Barriers to learning
Literacy, numeracy and life skills Creative and emotional skills Values Social benefits
Learning time Teaching methods Assessment, feedback, incentives Class size
Teaching and learning materials Physical infrastructure and facilities Human resources: teachers, principals, inspectors, supervisors, administrators School governance
0
20
40
60
80
Out
-of-
scho
ol c
hild
ren
(%)
BoliviaLao PDRNiger
Mother’s ability to read sentence:
Not at all
With difficulty
Easily
Source: Calculations based on the UNICEF MICS database.
FIGURE 2.1. Understanding education quality
FIGURE 2.2. Mother’s literacy and schooling status in the Niger, the Lao PDR, and Bolivia, 2000
Adapted from UNESCO, 2004, p. 36.
Adapted from UNESCO, 2005, p. 130.

Smaller, Quicker, Cheaper / 25
A third way to consider the promise of improved quality of education is to consider how learning achievement has been linked to economic development. Numerous studies have demonstrated how the returns on investment (ROI) measure of investments in schooling (measured by basic skills learning) can be applied in de-veloping countries (Table 2.1). International and national government agencies use this measure to rationalize increases in the quantity and quality of education. Finally, the consequences of the improved quality of education may be seen clearly as a right to self-development.12 The presence of qualified teachers, well-pre-pared curricula and textbooks, supportive parents, and engaged communities are all factors that can and do affect children. The desire to improve the quality of learning, and the overall quality of education, is not in doubt.13 What is less than clear is how to come to agreement about how to determine empirically what quality is, and then to decide what implementation steps are needed to reinforce and expand quality. Improved measurement tools play an important part in this process.
The Importance of Measurement
The world of educational measurement intersects with a world of population varia-tion in ways that are often predictable, but also difficult to address. This is not only a matter of international comparability. Rather, variation in populations is endemic in each and every context where children are raised. Each household itself may also contain significant variation, especially if one considers how differently boys and girls may be treated in many cultures. If measurement (including all tests and assessments) is so difficult, and can be challenged on so many grounds, how can it be implemented in so many countries and in so many ways? The answer is “with care.” There are many criti-cisms of measurement, but it may be the best way we have to address complex problems on a platform of knowledge that can be understood, and debated, by groups that may hold widely divergent ideas of what is best for children.
12. Sen, 199913. See the important GMR on quality (UNESCO, 2004) for a policy perspective. Nonetheless, it must be also noted that there may be decision makers who seem to care more about the numbers (quantitative results) just noticed this. than the more difficult to measure qualitative results. Similarly, it would not be surprising to find teachers, school leaders, and ministry officials who are complacent about the status quo. Moving beyond such complacency is, in large part, what the current efforts toward SQC approaches are trying to achieve.

26 / Learning outcomes and policy goals
Table 2.1. Impact of basic skills on income
Study Country Estimated Effect1 Notes
Glewwe (1996) Ghana 0.21** to 0.3** (government) 0.14 to 0.17 (private)
Alternative estimation approaches yield some differences; mathematics effects shown to be generally more important than reading effects, and all hold even with Raven’s test for ability.
Jolliffe (1998) Ghana 0.05 to 0.07* Household income related to average math-ematics score with relatively small variation by estimation approach; effect from off-farm income with on-farm income unrelated to skills.
Vijverberg (1999) Ghana uncertain Income estimates for mathematics and reading with non-farm selfemployment; highly variable estimates (including both positive and negative effects) but effects not generally statistically significant.
Boissiere, Knight and Sabot (1985); Knight and Sabot (1990)
Kenya 0.19** to 0.22** Total sample estimates: small variation by primary and secondary school leavers.
Angrist and Lavy (1997)
Morocco uncertain Cannot convert to standardized scores be-cause use indexes of performance; French writ-ing skills appear most important for earnings, but results depend on estimation approach.
Alderman et al. (1996)
Pakistan 0.12 to 0.28* Variation by alternative approaches and by controls for ability and health; larger and more significant without ability and health controls.
Behrman, Ross and Sabot (forthcoming)
Pakistan uncertain Estimates of structural model with combined scores for cognitive skill; index significant at .01 level but cannot translate directly into estimated effect size.
Moll (1998) South Africa
0.34** to 0.48** Depending on estimation method, varying impact of computation; comprehension (not shown) generally insignificant.
Boissiere, Knight and Sabot (1985); Knight and Sabot (1990)
UR Tan-zania
0.07 to 0.13* Total sample estimates: smaller for primary than secondary school leavers.
Notes: *significant at .05 level; **significant at .01 level.1. Estimates indicate proportional increase in wages from an increase of one standard deviation in measured test scores.Source: Hanushek (2004)Adapted from UNESCO, 2004, p. 42.

Smaller, Quicker, Cheaper / 27
Concerns about Assessment
To some, assessment is a fair and objective way to set and maintain standards, to
spearhead reform at the levels of both policy and practice, and to establish a basis
for meaningful accountability. To others, it is an instrument for maintaining the
status quo, grossly unfair and educationally unproductive.14
Failure to address inequalities, stigmatization and discrimination linked to wealth,
gender, ethnicity, language, location and disability is holding back progress to-
wards Education for All.15
Assessment in education has never been uncontroversial, and it remains contro-versial today. Whenever an educational assessment is reported in the media, critics often challenge the results by claiming a contradictory bit of evidence, or that the assessment itself was flawed for a variety of technical reasons. Thus, when it was learned that French adults scored more poorly than adults in other European countries that participated in the International Adult Literacy Survey (IALS; see Chapter 8), French officials withdrew from the study, claiming technical flaws in the study itself. Similar stories can be told in nearly every country when educa-tional news is negative. Of course, what might be called “political defensiveness” is the other side of “policy sensitivity,” and simply shows that measurement can be an important source of change. Still, as in the quotation above, some see assessments not as a tool for change, but rather as reinforcement of the status quo. Another sensitive issue concerning assessment is statistics. The science of statistics in assessment of human skills has a long and rich history. With respect to current efforts of education, numerous complex techniques have been developed that allow corrections or adjustments to be made for different types of populations, numbers of items on a test, determination of the significance of differences between groups, and so forth. But there is not a single science to the choice of statistical methodologies—debate is robust amongst specialists. It is important to keep in mind that while some methodologies have undergone rigorous prior testing (such as in international assessments), which other more small-scale assessments may only be beginning. Moreover, the science of the former is not necessarily better than the sci-ence of the later. The scientific rigor, and level of confidence among both the public and specialists, must be maintained irrespective of the type of assessment chosen.
14. Braun & Kanjee, 2006, p. 2.15. UNESCO (2010), p. 2.
28 / Learning outcomes and policy goals
In the end, assessment is mainly what one makes of it. Assessments are only as good as their technical quality in relationship to the population under consideration (the main focus of this review). Assessments can sit in the dustbin, or they can be front-page headlines. Most often they are still used today by the few specialists who understand them best, and by those that found the resources to have them implemented in the first place. Thus, one of the main concerns about assessments is assuring their effective use, which includes helping to hold decision makers at many levels accountable for educational quality. Although no report on the technical aspects of learning assessments can assure the appropriate use of them, it is nonetheless incumbent on the designers of assessments to assist in their effec-tive application. Finally, it is important to consider the issue of inequalities or inequities, as cited in the second quotation above. The 2010 Global Monitoring Report (GMR) on Reaching the Marginalized makes clear that meeting the educational goals of the world’s poorest populations poses serious challenges. There are political reasons for sure, but there are also technical reasons—and some that can be addressed by virtue of the kinds of assessments considered in this volume.

Smaller, Quicker, Cheaper / 29
3. How Learning Indicators Can Make A Difference
Uses of Learning Indicators
Possible uses for learning (and educational) indicators include the following:16 • Informingpolicy.Ineverycountry,ministriesofeducationspendlargeportions
of national budgets on education. Indicators are one important way that policy makers determine if those funds are well spent.
• Monitoringstandardsandcreatingnewones.Mostcountrieshaveasetofedu-cational goals or targets embedded in curricular design. These are often based on, and monitored by, learning indicators. To the extent that national systems seek to change standards and curricula, indicators form an important basis for doing so.
• Identifyingcorrelatesoflearning.Whatarethecausesandeffectsoflearningin the classroom? How well do certain groups (by gender, language, or regions) succeed in mastering the specified curriculum? Indicators are essential for deter-mining levels of achievements, and for understanding the relationship between key factors.
• Promoting accountability. What factors are accountable for educationalchange in a country, a community, a school, a teacher, a parent or a student? Many different actors are (separately or collectively) accountable for learning achievement.
• Increasingpublicawareness.Howcanparentsandcommunitiesbecomemoreinvolved in supporting education? To the extent that indicators can be under-stood by the public, and disseminated by the media, learning measures are one way to establish outcomes in the minds of these potential consumers.17
• Informing political debate.Education is necessarily political.Aswith policydiscussions and accountability, the presence of indicators and learning results allow for a more reasoned discussion of the empirical results of any intervention in education. Learning indicators can and do (when available) play a key role in such debates. They can also begin to identify who may be accountable for improving learning.
16. This list is substantially adapted from Greaney & Kellaghan, 1996. Of course, the actual use of indicators for mak-ing educational policy changes varies widely across the world (see Kellaghan, et al., 2009, Chapter 1; also Abadzi, personal communication.)17. In fact, this dimension is often underestimated, especially in developing countries, where education has most often be a matter of state control. To the extent that education becomes more owned by parents and communities, it seems that the chances of improving education will increase.

30 / How learning indicators can make a difference
Defining and Measuring Learning
How knowledge, skills and values are transmitted is as important a part of the cur-
riculum as what is learned – because, in fact, the process is part of ‘what’ is learned.18
Many describe learning as the most essential enterprise of being human. Contemporary research has demonstrated that significant learning begins at birth (or before), and continues across the human lifespan. Since learning encompasses multiple diverse aspects, it has numerous disciplinary-based definitions. For ex-ample, psychologists have defined learning as any “measurable change in behavior,” while anthropologists define learning as enculturation whereby a child is socialized by others into the values and behaviors that are required by the culture. In discussions of learning, test scores serve as a proxy for education qual-ity. The use of learning indicators can provide solid information on how well items in the curriculum are being understood as a process (per the quotation above), a formative measure on teaching and learning policies, and a marker for how well learners have done at the main exit points from the school system. This latter type of summative assessment may be criterion- or norm-referenced,19 and may be used as a means of facilitating (and legitimizing) access to social and economic hierar-chies. In this way, tests may help to ensure that the intended curriculum is taught and learned, but they may bring detrimental effects, if they augment the pressure to succeed that leads to excessive attention to passing examinations.
Learning in and out of Schools Types of Inputs
Other things being equal, the success of teaching and learning is likely to be
strongly influenced by the resources made available to support the process and
the direct ways in which these resources are managed. It is obvious that schools
without teachers, textbooks or learning materials will not be able to do an effective
job. In that sense, resources are important for education quality—although how
and to what extent this is so has not yet been fully determined.20
18. Pigozzi, 2006, p. 45.19. Criterion-referenced (or standards-based) assessments are those that allow scores to be judged against some level of expected result. Norm-referenced assessments are those that provide a level of skill that is matched against the learners relative position among peers taking the same test.20. UNESCO, 2004, p. 36.

Smaller, Quicker, Cheaper / 31
In the quotation above, resources are highlighted that emanate from the school system itself. Yet, countless studies in the social sciences show that much (or even most) of the statistical variance associated with school success or failure results from inputs that are outside of the school walls, even far outside.21 Naturally, as implied in the psychological and anthropological definitions for learning mentioned at the outset of this chapter, there are a whole host of experiences that a child brings to school—experiences that in-volve not only learned facts about his or her life and community, but also attitudes and values, support structures that implicate language, cultural processes, and much more. For some children, these inputs are sometimes acknowledged when they finally arrive at the primary school door (such as language of instruction, if it matches what is spoken in the home). As more is learned about children’s lives at home, more is understood about a multitude of types of inputs, as well as mismatches between children and schools. This is not news. Ever since schools were invented as part of religious institutions over the centuries, the idea of schooling was to shape what children bring to school into some type of uniformity of knowledge with purpose. Since mass education and equity concerns were less an issue in those centuries, the known facts of frequent mismatch, resistance, and drop-out were not so important. In today’s world, where the MDGs try to guarantee universal basic edu-cation, it is no longer possible to ignore the personal, social, and ethno-linguistic characteristics that children bring to the classroom. Further, there is a growing recognition that reaching the most difficult to reach (what are sometimes called “marginalized”) populations will require special attention and financing in order to reach the EFA goals.22 While there are many examples of these types of external inputs to schooling, one oft-cited characteristic is the nature of the home literacy environment of the child. In Figure 3.1, home literacy environment was found to be strongly related to reading achievement for fourth grade students in a PIRLS23 international assessment, but, nonetheless, widely varied across countries.
21. Of course, there are many who have looked at the role of socio-economic status (SES) and in-school factors (such as textbooks, teacher training, management, and use of resources) for explanations of educational outcomes. See, for example, Heyneman & Loxley (1983) and a recent more review by Gamaron & Long (2006).22. See the recent GMR report entitled Reaching the marginalized, UNESCO (2010).23. Progress in International Reading Literacy Study.

32 / How learning indicators can make a difference
The Schooling Context and the Opportunity to Learn
While internationally the average intended instructional time in hours is about 800
hours per year, with little variation across regions, duration of compulsory school-
ing, or national income level, actual hours of instruction delivered can vary signifi-
cantly. Schools can be closed for unscheduled national or local holidays, elections,
or various special events. … For these and other reasons, the actual number of in-
structional hours can be fewer than 400 per year. Time for learning has been rarely
studied in depth in developing countries, but much informal evidence is available
to suggest significant time wastage.24
Schools vary tremendously from country to country, from region to region within countries, and indeed from school to school, even if within neighboring villages. This distinction makes clear why learning achievement can vary so much from child to child and from school to school.
24. Lockheed, 2004, p. 5.
FIGURE 3.1. Literacy environment and reading achievement in PIRLS, in 2001
0
10
20
30
40
50
60
70
80
90
100
300
350
400
450
500
550
600
Iran
, Isl
. Rep
.K
uwai
t
Ho
ng K
ong
SA
R, C
hina
Sing
apo
reN
ew Z
eala
nd
Bel
ize
Co
lom
bia
Arg
enti
na
Swed
enG
erm
any
No
rway
Icel
and
Net
herl
and
sFr
ance
Cyp
rus
Gre
ece
Ital
yC
anad
aU
nite
d K
ing
do
m (S
cotl
and
)U
nite
d K
ing
do
m (E
ngla
nd)
Turk
eyR
ep. M
old
ova
Lith
uani
aC
zech
Rep
.R
om
ania
Slo
veni
aLa
tvia
Hun
gar
y M
aced
oni
a, F
YR
Slo
vaki
aB
ulg
aria
% of pupils in high-level home literacy environmentAverage reading achievement score
South/West
Asia andArab
States
East Asia/
Pacific
Latin America/
Caribbean
North America and Western Europe Central and Eastern Europe
Perc
enta
ge
of p
upils
wit
h hi
gh
HLE
ind
ex Averag
e reading
achievement score
Note: The index of early home literacy activities used in the Progress in International Reading Literacy Study was constructed from parental reports on six activities: reading books, telling stories, singing songs, playing with alphabet toys, playing word games and reading aloud signs and labels.
Adapted from UNESCO, 2005, p. 208.
Smaller, Quicker, Cheaper / 33
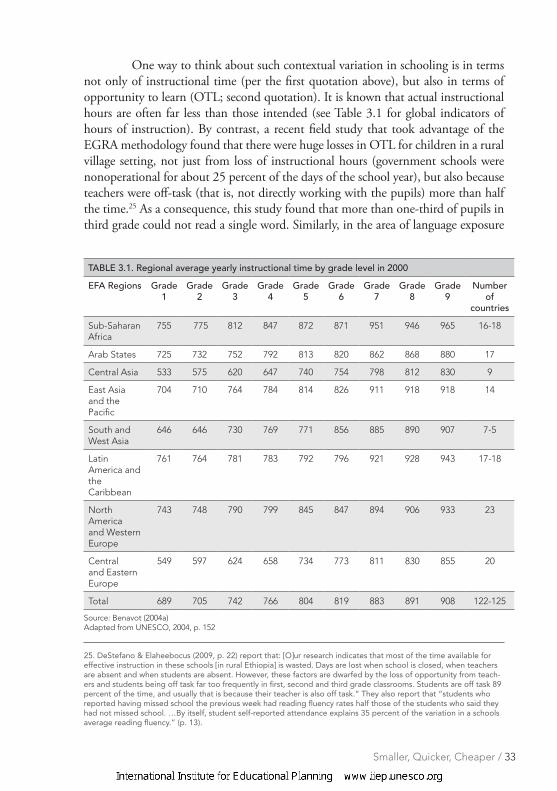
One way to think about such contextual variation in schooling is in terms not only of instructional time (per the first quotation above), but also in terms of opportunity to learn (OTL; second quotation). It is known that actual instructional hours are often far less than those intended (see Table 3.1 for global indicators of hours of instruction). By contrast, a recent field study that took advantage of the EGRA methodology found that there were huge losses in OTL for children in a rural village setting, not just from loss of instructional hours (government schools were nonoperational for about 25 percent of the days of the school year), but also because teachers were off-task (that is, not directly working with the pupils) more than half the time.25 As a consequence, this study found that more than one-third of pupils in third grade could not read a single word. Similarly, in the area of language exposure
25. DeStefano & Elaheebocus (2009, p. 22) report that: [O]ur research indicates that most of the time available for effective instruction in these schools [in rural Ethiopia] is wasted. Days are lost when school is closed, when teachers are absent and when students are absent. However, these factors are dwarfed by the loss of opportunity from teach-ers and students being off task far too frequently in first, second and third grade classrooms. Students are off task 89 percent of the time, and usually that is because their teacher is also off task.” They also report that “students who reported having missed school the previous week had reading fluency rates half those of the students who said they had not missed school. …By itself, student self-reported attendance explains 35 percent of the variation in a schools average reading fluency.” (p. 13).
TABLE 3.1. Regional average yearly instructional time by grade level in 2000
EFA Regions Grade 1
Grade 2
Grade 3
Grade 4
Grade 5
Grade 6
Grade 7
Grade 8
Grade 9
Number of
countries
Sub-Saharan Africa
755 775 812 847 872 871 951 946 965 16-18
Arab States 725 732 752 792 813 820 862 868 880 17
Central Asia 533 575 620 647 740 754 798 812 830 9
East Asia and the Pacific
704 710 764 784 814 826 911 918 918 14
South and West Asia
646 646 730 769 771 856 885 890 907 7-5
Latin America and the Caribbean
761 764 781 783 792 796 921 928 943 17-18
North America and Western Europe
743 748 790 799 845 847 894 906 933 23
Central and Eastern Europe
549 597 624 658 734 773 811 830 855 20
Total 689 705 742 766 804 819 883 891 908 122-125
Source: Benavot (2004a)Adapted from UNESCO, 2004, p. 152
34 / How learning indicators can make a difference
it has been found that, despite national policies, there is great variability in teachers’ actual use of the language of instruction (LOI) in classrooms, resulting in large differ-ences in children’s language mastery by region and instructor.26 These dramatic results have inspired an increased focus on the quality of early learning in LDCs.
Outputs from Learning
Other proxies for learner achievement and for broader social or economic gains
can be used; an example is labor market success. It is useful to distinguish be-
tween achievement, attainment and other outcome measures – which can include
broader benefits to society.27
[I]f students’ cognitive achievement is accepted as a legitimate criterion of the
quality of schooling, is it reasonable to base the assessment of that quality (and
a possible assigning of accountability) on a single measure of the performance of
students at one or two grade levels?28
If learning is the essential human enterprise, then schooling may be thought of as most nations’ view of how it can be best achieved. Schools are supposed to solve many soci-etal problems, ranging from caretaking when parents are not available to skills develop-ment for economic growth. They (and their curricula) are the most ubiquitous national answer to the question of what children should learn. And research has demonstrated many times over that schools can have a dramatic effect on learning, where learning in-cludes a variety of outputs—from language to literacy, to group behavior and cohesion, to nation building and political solidarity, to job skills and economic development. When the focus is on the basic skills taught largely in primary schools (and in nonformal and adult literacy programs), there are two general ways to look at the outputs: (1) measurement of the skills and contents that are directly taught in schools (for example, tests of curricular content learned); or (2) measurement of what society thinks learners should know and be able to do (for example, to be able to read a newspaper). Many of the international, regional and national assess-ments described in this review focus on the first dimension of measurement, trying to ascertain the degree to which children have acquired what they have been taught in schools. Other assessments, most notably the EGRA assessment (but also some parts of household assessments, such IALS), focus on the generic skills that learners
26. See Muthwii (2004), in Kenya and Uganda; also Commeyras & Inyega (2007). A recent field study comparing use of LOI in Kenya and Uganda found major differences in the actual adherence of teachers to national policy in LOI, with Ugandan teachers paying much more attention than Kenyan teachers to use of mother-tongue in the classroom (Piper & Miksec, in press). See Muthwii (2004), in Kenya and Uganda; also Commeyras & Inyega (2007). A recent field study comparing use of LOI in Kenya and Uganda found major differences in the actual adherence of teachers to national policy in LOI, with Ugandan teachers paying much more attention than Kenyan teachers to use of mother-tongue in the classroom (Piper & Miksec, in press).27. UNESCO, 2004, p. 37.28. Ladipo et al. 2009, p. 8.

Smaller, Quicker, Cheaper / 35
(young and older) may need to know generically, with less of a focus on the specific curriculum taught in school. There is no perfect separation between these two out-puts, both of which have merit, depending on the goals of the assessment. When consideration is given to outputs or consequences that are further downstream, then whichever assessment tool is used can be included in a larger analysis. For example, maternal education is often thought to significantly affect children’s education and life chances, as well as health and well-being. The trans-mission model for these consequences has been a key challenge. However, recent research seems to support a strong prediction model. There are a number of factors that come into play, such as the mother’s literacy and language skills; these then re-sult in increases in the same skills in her children, but only when verbal interaction is part of the statistical model.29 In this case, as in other such complex models, there may be no straight line between inputs and outputs. But being able to measure the learning components of the models gives hope that an intervention (such as school-ing or literacy) can make a real difference for policy development.
What are My Options? An Education Minister’s Perspective
[An] assessment team should ensure that systems and strategies are in place to
communicate its findings to institutions and agents who will have a role in imple-
menting policy...30
Every policy maker has to make choices. A good policy maker will want to decide among options that are based on the best data that money can buy. This means that the policy maker can know what “best” really is, and what it will “cost” (in terms of time, cash, human resources, and opportunity costs). Given that ministers of education (or equivalent) have both great responsibility and great pressure on some of the most difficult matters in society, they have a serious need for speedy, policy-relevant, and option-ready data on a frequent basis. Among the types of questions that a minister might ask, and for which assessments can help in providing policy options, are the following:• Howeffectiveisoureducationsystem?Inwhatwayscanwemeasuretheimpact
on learning achievement of changes in our policy decisions? For example, if we decide to teach mother-tongue language and literacy in the early grades, can we see the impact on reading in first or second language by third or fourth grade?
• Whereareourmostseriousproblems?IfwefocusonEFAorMDGgoals,suchas universal basic education, or gender equity, what are the ways that we can use learning measurement to help improve national responsiveness?
29. LeVine et al., in press. Also, Levine & LeVine (2001).30. Ladipo et al., 2009, p. 70.

36 / How learning indicators can make a difference
• Howdoesournationaleducation systemcompare toourneighbor’s system?Are we doing as well as they are doing with similar resources? What would make for a valid comparison?
• Where are the large discrepancies within our national system of education?Why are some regions, communities, or schools doing very well, while others are left far behind? How can we support a more equitable system, and raise the quality of learning for all children?
• Whenwillwebeablesolvesomeoftheseproblems?Assessmentstaketime.Ifwe are trying to meet long-term problems, such as having trained teachers for all pupils, then certain data collection methods that gather more information may be quite appropriate. If decisions need to be made by the beginning of the next school year, such as which textbooks or curricula to use, then short time-line assessments should be considered.
• Whatwillitcosttofixtheseproblems?Wehaverealbudgetconstraints.31
Answers to these types of questions will not reform or revamp an educational sys-tem, but they begin to show the ways that senior policy makers (our hypotheti-cal Minister, in this instance) can utilize more effectively the variety of tools that are available for policy decision making. Not all assessments are alike, however. Depending on the goals and the particular questions that need to be addressed, any minister would do well to carefully consider which assessment answers which set of questions best. For a policy maker, timing can be as important a variable as money. Assessments come in many varieties. Some take considerable preparation time, oth-ers considerable analysis time and still others are designed to gather more focused data in less time. What is most important is to try to know which goal needs to be addressed, and then look at the options that can achieve that goal. In the following sections, these types of assessments are described (par-ticularly in the area of reading/literacy), and their pros and cons are considered in the light of experiences to date.
31. Recurrent costs are those that are built into budgets on an annual basis, such as teacher salaries. Nonrecurrent costs, such as assessments, often have to be taken from more limited extrabudgetary line items.

Smaller, Quicker, Cheaper / 37
4.Assessments Of Learning In Developing Countries
Major Learning Assessments Educational assessments come in a wide variety of styles, contents, and purposes. They have been around at least since the beginning of national systems of public education that began in France in the 19th century.32 The French government re-quested Alfred Binet (also known as one of the fathers of intelligence testing) to develop an assessment instrument that could help predict which students would be most likely to succeed in public school. This element of predicting success in schooling was a watershed moment in the use of testing for policy making. Over the next century, educators and policy makers have endeavored to make similar decisions across time and space—hence, the growth in the use of assessment instru-ments in education.
Large-scale Educational Assessments
Beginning in the 1980s, national and international agencies have increasingly used large-scale educational assessments (LSEAs). Previously, only a small number of cross-national large-scale assessments had been conducted, mostly by the IEA.33 Technological and methodological advances in assessment, combined with the po-litical pressure to improve educational systems, have spurred this trend, including in LDCs.34 The 1990 Jomtien conference on “Education For All” demanded more accountability and systemic evaluation in LDCs, and LSEAs became increasingly a key tool for meeting this demand.35 In 2000, the UNESCO Dakar Framework for Action called for achieving “measurable” learning outcomes, and that such progress should be “monitored systematically.”36 This view has led to a substantial overall growth in the use of assessment instruments in educational planning (Figure 4.1).
32. Curriculum-derived tests originated from Imperial China. Yet, the Chinese examinations were not focused on universal public education (as was the case in post-revolutionary France), but rather on a version of meritocratic selection for public administration.33. See Chromy, 2002, p. 84 for a listing of the major studies, as well as Lockheed, 2008, p. 6.34. Chromy, 2002; Kelleghan & Greaney, 2001, p. 32.35. Lockheed & Verspoor, 1991.36. UNESCO, 2000a, p. 21.

38 / Assessments of learning in developing countries
Despite this momentum, the increasing complexity and expense of LSEAs have le some to question the utility of conducting LSEAs in LDCs.37 Although a number of agencies have carried out LSEAs in the OECD countries, it was not until the 1990s that the capacity to participate in LSEAs (and undertake complex national assessments) became more available to LDCs.38 The complexity of stake-holder interests and resource constraints have limited growth of LSEAs in LDCs. However, various agencies, such as the World Bank, have become increasingly im-portant funders of LSEAs, making it more affordable and more likely for these to be utilized even when national budgets are very constrained.39 Further, comparison and generalization from test data is difficult, and all the more so in politically or economically challenging circumstances and locations.40
37. Braun & Kanjee, 2006, p. 8.38. Greaney & Kelleghan, 2008, pp. 8-9.39. According to a survey of national policy makers, World Bank funding has been a key determinant of decision-making in LSEA adoption for low- and middle-income countries. See discussion in Gilmore, 2005, p. 45.40. Ross & Genevois, 2006.
FIGURE 4.1. Growth in use of national assessments of learning (1995-2006)
The number of countries worldwide having carried out at least one national learning assessment, by year
28
3641 43
49 51 4954 56 57
5357
0
20
40
60
1995 1996 1997 1998 1999 2000 2001 2002 2003 2004 2005 2006
Num
ber
of c
oun
trie
s w
orld
wid
e
Adapted from Benavot & Tanner, 2007, p. 6.

Smaller, Quicker, Cheaper / 39
International Assessments
[T]he value of international studies may lie more in their potential for generating
hypotheses about causal explanations than in their use for testing hypotheses.41
In the current world climate of economic competitiveness, and the new era of account-
ability in all things, developed country governments are now more anxious than ever
to evaluate their own educational systems through comparison with others, in terms
of output as well as input and process. One obvious comparative output measure is
pupils’ subject achievement, as evidenced in the test results produced in international
surveys such as those conducted by the IEA. In consequence, international rank orders
have become the first focus of interest when IEA survey results are published.42
International assessments focus on the measurement of learners in multiple coun-tries. Their aims are also multiple, including the following: (a) cross-national com-parisons that target a variety of educational policy issues; (b) provision of league tables that rank-order achievement scores by nation or region or other variables; (c) measurement of trends over time; and (d) within-country analyses that are then compared to how other countries operate at a subnational level. Such assessments gather data principally from learners, teachers, and educational systems – param-eters that help to provide better ways of interpreting test results. Various international organizations and agencies plan and implement such studies, many of which include reading tests. The IEA (International Association for the Evaluation of Educational Achievement) conducts the Progress in International Reading Literacy Study43 (PIRLS). The Organization for Economic Co-operation and Development (OECD) is responsible for the Program for International Student Achievement (PISA) studies. These assessments may be characterized by their at-tention to high quality instruments, rigorous fieldwork methodology, and sophis-ticated analyses of results. Each of these international assessments is now in use in dozens of countries, and is expanding well beyond the OECD country user base that formed the early core group of participation.44 International assessments often attract media attention, and thus provide an opportunity for greater focus and debate on the education sector and national outcomes relative to other countries. There are a number of problems that must be considered concerning such assessments, particularly in the areas of age of assess-ment and of comparability across countries.45
41. Porter and Gamoran, 2002, p. 15; cited in Braun & Kanjee, p. 33.42. Johnson, 1999, p. 63.43. While the emphasis is on reading studies, some reference is also made to the TIMMS and SISS math achievement studies, also undertaken by the IEA.44. In a recent review, Kamens and McNeely (2010) point out that increased globalization has been led to a dramatic increase in the number of countries now participating in international testing as well as in national assessments. They further claim that globalization has fostered a ‘world educational ideology’ as well as a ‘hegemony of science’—both of which have led to an acceptance of educational testing that is much greater than heretofore seen.45. For a useful discussion on such constraints and problems, see Greaney & Kelleghan, 2008, pp. 71–73.

40 / Assessments of learning in developing countries
Regional Assessments
As part of an effort to extend the use of LSEAs into developing countries, regional and international organizations have collaborated to create three major regional assessments: the Latin American Laboratory for Assessment of Quality in Education (LLECE), the Southern and Eastern African Consortium for the Monitoring of Education Quality (SACMEQ), and Program for the Analysis of Educational Systems of the CONFEMEN (Francophone Africa) countries (PASEC). Each of these is described in detail in Annex A. These regional assessments have much in common with the international assessments, but there are a number of important differences, including: the relative proximity in content between test and curriculum; normative scales that may or may not be tied to local (normed) skill levels; and attention to local policy concerns (such as the role of the French language in PASEC countries). The overlap in expertise between the specialists working on the international and regional levels has generally meant that these regional tests are given substantial credibility. An increasing number of developing countries have participated in regional assessments (Table 4.1).
National AssessmentsNational learning assessments, which have largely been overlooked in discussions
of education quality, can be extremely useful in two capacities. First, they can pro-
vide useful information to education policymakers on learning outcomes in national
education systems, which reflect national curricular emphases and priorities. Second,
given that monitoring and evaluation frameworks are an essential component of edu-
cational quality, national learning assessments can act as an important indicator of
such quality and, similarly, as a stepping stone to improve accountability and promote
reform. International agencies and non-governmental organizations should give
greater credence to national learning assessments for addressing quality issues, even
if such assessments provide a weak basis for comparing outcomes across countries.46
National assessments (sometimes called national or public examinations) focus on gen-erating information that evaluates students in a single educational system. Nearly all countries engage in some type of national assessment in order to ascertain whether desired and planned educational goals are achieved.47 The results can be used to modify curricula, train teachers, reorganize school access, and numerous other aspects of a na-tional educational system. The results also can be used for accountability purposes, to make resource allocation decisions, and to heighten public awareness of education is-sues. These assessments are often administered to an entire grade-related cohort (census-based testing) or to a statistically chosen group (population sample testing), and may also include background questionnaires for different participants (learners, teachers, or
46. Benavot & Tanner, 2007, p. 14.47. These tend to be high stakes exams, as with the ‘bac’ in France; see Greaney & Kellaghan (2008).

Smaller, Quicker, Cheaper / 41
TABLE 4.1. EFA-FTI countries’ participation in international, regional and hybrid assessment studies, during the past decade
Country International Regional Hybrid
AFRICA
Benin
Burkina Faso PASEC
Cameroon PASEC
Central African Rep. PASEC
Ethiopia
Gambia EGRA
Ghana TIMSS 2003, SISS EGRA
Guinea PASEC
Kenya SACMEQI & II EGRA
Lesotho SACMEQII
Liberia EGRA
Madagascar PASEC
Mali EGRA
Mozambique SACMEQII
Niger PASEC EGRA
Rwanda EGRA
São Tomé & Príncipe
Senegal PASEC EGRA
Sierra Leone
ARAB STATES
Djibouti TIMSS 2003, 2007 PASEC
Mauritania
Yemen TIMSS 2003, 2007
ASIA & PACIFIC
Cambodia EGRA
Mongolia TIMSS 2007
Tajikistan
Timor-Leste EGRA
VietNam EGRA
LATIN AMERICA & CARRIB.
Guyana EGRA
Haiti LLECE, SERCE EGRA
Honduras TIMSS 2007 EGRA
Nicaragua LLECE EGRA
Adapted from Encinas-Martin, M., 2008, p. 30-31; and from RTI, 2009.

42 / Assessments of learning in developing countries
administrators) to provide a meaningful context for interpreting test results. The utility of the data generated depends on the quality and relevance of the assessment, and the thoroughness of the associated fieldwork, as well as the expertise of those charged with the analysis, interpretation, reporting, and dissemination of results.48
Household-based Educational Surveys
Household-based educational surveys (HBES) have been used for decades, often em-ploying sampling methods to gather specific types of information on target population groups within countries or regions, and stratified along certain desired demographic parameters.49 In 2000, a multiyear effort was begun to improve data collection on literacy rates in LDCs.50 This effort took a pro-local approach to surveys, trying to situate data collection more toward meeting local and national needs, rather than international comparability. It also sought to focus more on program-based assess-ment tools that could be understood by laypersons, while at the same time reducing time and effort.51 The use of an HBES makes sense when the individuals assessed are no longer in an institutional setting, such as with adults or out-of-school youth. However, in schools, it is far easier to implement assessments when all the learners are grouped in one place. Thus, for children, it is relatively rare to find HBES assess-ments of reading.52 Some aspects of the HBES methodology, especially with respect to targeted sampling, may be seen in hybrid assessments in the next section.
Hybrid Assessments (Including EGRA)
The improvement of reading assessment in comparative context may affect local, national, and international interests in contrasting ways. National interests and do-mestic political considerations (for example, demographics and ethnic diversity) may be seen as nettlesome problems, or simply constraints, by planners concerned with international LSEAs. On the other hand, national considerations about population diversity, linguistic variations, and even orthographic diversity (for example, the role
48. Since national examinations tend to be developed through long-term political (and internal) national processes, they are less apt to be useful for the SQC approaches described in the present review. Also, they have been covered at length in other recent reports, such as Greaney & Kellaghan (2008) and Kellaghan et al. (2011), and hence do not require further detailed attention here.49. In the (adult) literacy field, one of the first household surveys was undertaken (by the present author) in Zim-babwe, in two local African languages, (UNSO, 1989), with others to follow (e.g., in Morocco, Lavy et al., 1996; in Bangladesh, Greaney et al., 1999; in Botswana, Commeyras & Chilisa, 2001). For a more recent summary on HBES in adult literacy, see UNESCO (2008).50. This effort, termed the Literacy Assessment Project (LAP) was a joint program of the International Literacy Institute and UNESCO. A number of reports results, including ILI/UNESCO 1998, 1999, 2002a, b. See also Chapter 8 of this volume.51. A summary of this approach may be seen in Wagner (2003). One prominent, though short-lived, effort in this regard was the project called “Monitoring Learning Achievement” (UNESCO, 2000b; Chinapah, 2003). Another UNICEF effort was the ABC approach (Chowdhury & Zieghan, 1994). Thanks to C. Chabbott for this observation.52. Demographic and Health Surveys (DHS) have been carried out widely across the world, and sometimes employ very simple measures of reading (such as “read this sentence”) in an attempt to provide evidence for linkages be-tween, say, literacy and health. Thanks to Luis Crouch for this observation.

Smaller, Quicker, Cheaper / 43
of Arabic script in Mali or Senegal) may be seen as having to be sacrificed to achieve a larger basis for international comparison. For these and other reasons, local programs and national-level policy makers hesitate to sacrifice local interests for those with an interest in regional or international comparisons, as described above. Another reason to focus on the local level has to do with skill levels. The international LSEAs typically involve group-level testing in schools, requiring stu-dents to be skilled enough to complete a written examination independently. In poor LDCs, especially in the early grades, this approach is extremely difficult, even if one simplifies the content (as is being done with pre-PIRLS53). If the purpose is to assess children (or adults) at the level of beginning reading (which is where many learners in poor countries remain, even after a two or more years in schooling), it is nearly impossible for LSEA methodology to achieve an adequate assessment. In recent years, a new approach to assessment has sought to focus more di-rectly on the needs of LDC contexts. Initially, this approach was conceptualized under the abbreviation for smaller, quicker, cheaper (SQC) methods of literacy assessment.54 The idea was to see whether LSEA and HBSE methodologies could be reshaped into hybrid55 methods that were just big enough, faster at capturing and analyzing data, and cheaper in terms of time and effort. The resulting methodology would be flexible enough to be adaptable to local contexts, and thus also able to deal with such problems as ethno-linguistic variation in many of the world’s poor countries. The Early Grade Reading Assessment (EGRA) contains a number of the above features. It is probably the best-known current example of a hybrid assess-ment in reading. EGRA (considered in depth in the next section) focuses on be-ginning reading and local contexts (rather than comparability across contexts), as well as on local linguistic and orthographic features in reading. As will be seen, the SQC concept does not necessarily make the assessment task easier; it simply puts the emphasis in different places. EGRA, as a hybrid assessment, has different goals than those put forward by LSEAs. One additional element of hybrid assessments like EGRA is the potential for greater transparency and thus the “shareability” of assessment tools.56 Tools developed for hybrid assessments tend to be more flexible and adaptable, since they do not neces-sarily have to lock into an internationally agreed model. They can and should be shared at various levels in an education system. Evidence for this sharing may already be seen in the varied uses to which the EGRA tools are already being put (see Chapter 6). Efficiencies, as well as economies of scale can be gained if the same or similar assessment tools are used to implement both national level surveys and local program evaluations.
53. See discussion of pre-PIRLS in Annex A.54. ILI/UNESCO (1998). Wagner (1990, 1997, 2003).55. Hybrid means a combination of two or more things. In this instance, hybrid refers to drawing together some of the elements of LSEAs, HBSEs, and national curricular asessments as well as tests that were initially designed of cogntive assessments of reading skills.56. The notion of “shareability” was first brought up in ILI/UNESCO, 1998; see also Chapter 8 on adult literacy.

44 / Assessments of learning in developing countries
How Deep, How Broad to Assess
Assessments take time and money. If the assessment needs to be representative of an entire population of a country, and for multiple countries in a comparative framework, then time and money will likely expand significantly. Costs can be controlled in two main ways: first, by delimiting the range of skills that needs to be assessed; and second, by constraining the population sample that needs to be included. These two forms of sampling need to be understood in terms of technical and statistical requirements, as well as policy requirements and outputs.
Skill Sampling
The resulting set of [IEA] test items is … deliberately engineered to represent com-
monality in national curricula in the subject concerned. Given the degree of cross-
national variety in curriculum content, this naturally and inevitably reduces the
extent to which the set of test items can fully represent the curriculum of any one
country, so that, despite all the well-meaning efforts to introduce fairness into the
system in terms of curriculum representation, the result could well be the reverse.57
The majority of LSEAs tend to deploy standardized tests in a particular domain, such as reading, math, or science. The approach relative to a domain can vary widely across tests, even if the same domain is tested in multiple different assessments. Evaluations such as PIRLS, LLECE, SACMEQ, and PASEC are essentially based on the school programs of the countries concerned. The assessments generally try to evaluate the match between what should have been taught (and learned), and what the student has actually learned (as demonstrated by the assessment). Below is provided a short summary of the differ-ent approaches of several major LSEAs that include reading tests. All except EGRA are administered in writing as group-administered tests in school settings. PIRLS assesses achievement in reading comprehension. Based on the Reading Literacy Study for which data were collected in 1990–91, PIRLS has been conducted twice (2001 and 2006). Four reading comprehension processes were included, involving ability in the following areas: locating and explaining particular items of information; drawing inferences from logical or chronological sequences and interrelated events; interpreting and integrating ideas and information; and examining and evaluating content, language and textual elements. In PISA, the Reading Literacy test assumes that students are already able to read, and attempts to assess their ability to understand and reflect on a range of writ-ten materials. The 2006 PISA assessment tested the following types of skills: knowledge and skills applied in personal, public, occupational, and educational settings; content or structure of texts (continuous, or in tables, charts or forms); and processes that need to be performed, such as retrieval, reflection, evaluation, and interpretation of written text.
57. Johnson, 1999, p. 65.

Smaller, Quicker, Cheaper / 45
SACMEQ adopted the definition of reading literacy used in the IEA Reading Literacy Study (1990): “The ability to understand and use those written language forms required by society and/or valued by the individual.”58 It also based the development of the test on the three domains identified in the IEA study: documents—structured information displays presented in the form of charts, tables, maps, graphs, lists, or sets of instruction; narrative prose—continuous text where the writer’s aim is to tell a story, whether fact or fiction; and expository prose—continuous text designed to describe, explain, or otherwise convey factual information or opinion. The PASEC assessment reading tests were constructed in French on the basis of elements that are common to curricula in Francophone countries in Africa. At second grade, the French tests assessed pupils’ reading vocabulary, comprehension of sentences and texts, and writing. In fifth grade, in addition to the items in second grade, the assessment also assessed spelling and various aspects of grammar.59 In LLECE, tests included both multiple choice and open-ended items. Language components included reading comprehension, meta-linguistic skill, and production of written text in Spanish. In Brazil, tests are given in Portuguese.60 EGRA contains a set of measures that are individually administered, and are primarily based on a number of reading fluency skills developed originally for diagnos-tic purposes in beginning reading. Details on EGRA are provided in Chapter 5. One way to consider the various types of skill sampling, as well as other parameters discussed below, is to think of such assessments as a continuum ranging from EGRA to national examinations, as shown in Figure 4.2.
58. Elley, 1992.59. CONFEMEN, 2008.60. UNESCO-LLECE, 2008.
Figure 4.2. Assessment Continuum. Ranging from SQC hybrid assessments to LSEA and National Examinations
Small Sample-based HBES LSEA National Examinations
SQC/EGRAindividual
testing
Stratified- samplesurvey
PISAPIRLS
SACMEQPASECLLECE
Matriculation A-levels
Promotion examsGroup testing
InformalLower costLess timeLow stakes
FormalHigher costMore time
High stakesLess time
Low stakes
Adapted from Kanjee, 2009.

46 / Assessments of learning in developing countries
Population Sampling
The representativeness of the sample of a population is a fundamental part of all assessments. But sampling procedures vary from one assessment to another in important ways. PIRLS employs two-stage sampling method. A sample of at least 150 schools is first chosen in a manner proportional to the number of students in the grade considered. The second stage consists of distinguishing fourth-grade students in each country. The sample may be very heterogeneous by age in some of the countries, particularly in developing countries where late school enrollment or grade repetition is frequent. Two additional criteria are important: the geographi-cal location where the school is situated and the status of the school (public school, private school, religious). In some countries, these status criteria are not always clear, thus raising questions about the possibility of comparing subpopulations within countries (see Chapter 6 on comparability). In 1991 and 2001, PIRLS evaluated fourth grade students (modal age about nine years old), as it is assumed (at least within OECD countries) that these children should be able to read and complete a written test (Figure 4.3).61 As of 2011, there will be a “pre-PIRLS” assessment for the same grade level, but it will be less difficult (easier vocabulary, shorter passages, and so on) in order to capture a greater range of data toward the lower end of the scale.62 In PISA, the main criterion for choosing students is their age (15 years old), independent of their schooling level and type of institution. This can result in substantially different situations of learning experiences between countries. For ex-ample, in France certain 15-year-old students are at the upper secondary level while others are at the lower secondary level (‘collège’ in Francophone countries). In this case, unlike in a number of other countries, a certain proportion of students must be chosen from more than one level of schooling.63 PISA utilizes five proficiency levels for reading (Figure 4.4). LLECE takes into account various stratification criteria: the type of geo-graphical area (metropolitan, urban area, rural area) and the type of school (public or private). About 4,000 students are chosen (40 per school), with half between
61. See Olson et al., 2008. See also PIRLS website: http://timssandpirls.bc.edu/isc/publications.html62. According to Mullis et al. (2009), pre-PIRLS will also gather more background information on home, schools, and classrooms, as well as opportunity to learn. Further, the authors state: “because pre-PIRLS isdesigned for students earlier in the process of learning to read, a larger percentage of items (50 percent of the assessment) is devoted to measuring the ability to focus on and retrieve explicitly stated information—the essential foundation of reading comprehension”(p. 14). Participation fees (per country) are fixed at $30,000 per year over each of five years (total $150,000). See also Chapter 7 on costs. In 2011, some countries can opt to test children in fifth or sixth grade, especially if they plan to use the pre-PIRLS in fourth grade.63. According to Postlethwaite (2004, p. 3), one could even be referring to “pseudo-teachers,” given that the sample would comprise a group of students educated in different grades, with a large number and variety of teachers. Nonetheless, one important goal is the ability to test for average intergrade improvements in skill around the most common grades children of age 15 happen to be in. This offers one of the very few means in existence to get a sense of how much children learn from grade to grade against a fixed standard of knowledge. See Filmer et al. (2006). Thanks to Luis Crouch for pointing this out.

Smaller, Quicker, Cheaper / 47
Students in the lowest quartile (%)
BelizeMorocco
Iran, Isl. RepColombiaArgentina
Macedonia, FYRTurkey
Rep. MoldovaRomaniaSloveniaSlovakiaBulgaria
Russian Fed.Czech Rep.
HungaryLithuania
Latvia
KuwaitCyprus
IsraelNorway
New ZealandIceland
SingaporeScotland, UK
GreeceUnited States
FranceEngland, UK
ItalyHong Kong SAR, China
GermanyCanadaSweden
Netherlands 24
7788
10101111
13151516
2021
2364
456789
1217
1921
4245
5455
5877
84
Middle- and low-income countries
High-income countries
00 1010 2020 3030 4040 5050 6060 7070 8080 9090
Note:The classification by income level is based on World Bank, 2003.Source:Mullis et al. (2003)
FIGURE 4.3. PIRLS. Percentage of grade 4 pupils in the lowest quartile of the international reading literacy scale, 2001
Adapted from UNESCO, 2004, p. 122.
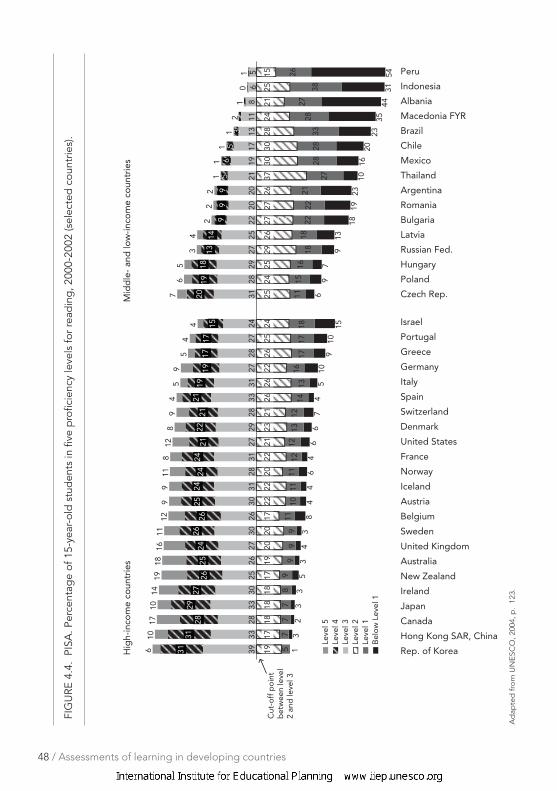
48 / Assessments of learning in developing countries
3933
2833
3025
2627
3031
2829
2725
2220
2021
1917 30
13
76
5
34
22
21
11
1
118
2630
3128
3127
2928
3331
2728
2724
1917
1818
1817
1920
2017
2222
2022
2123
2126
2622
2625
24
57
77
89
99
911
1011
1112
1213
1214
1316
1717
18
65
2524
2529
2627
2726
3730
2824
2125
15
28
1115
1618
1822
2221
2728
3328
27
38
261
32
33
53
43
84
46
46
67
45
109
1015
20
69
7
913
1819
2310
16
2335
4431
54
Bel
ow
Lev
el 1
Leve
l 1Le
vel 2
Leve
l 3Le
vel 4
Leve
l 5
610
1710
21
1419
1816
1112
99
118
128
94
59
54
4
01
Rep. of Korea
Hong Kong SAR, China
Canada
Japan
Ireland
New Zealand
Australia
United Kingdom
Sweden
Belgium
Austria
Iceland
Norway
France
United States
Denmark
Switzerland
Spain
Italy
Germany
Greece
Portugal
Israel
Czech Rep.
Poland
Hungary
Russian Fed.
Latvia
Bulgaria
Romania
Argentina
Thailand
Mexico
Chile
Brazil
Macedonia FYR
Albania
Indonesia
Peru
Hig
h-in
com
e co
untr
ies
Mid
dle
- an
d lo
w-in
com
e co
untr
ies
Cut
-off
po
int
bet
wee
n le
vel
2 an
d le
vel 3
3131
2829
2726
2524
2626
2524
2424
2122
2121
1919
1717
15
2019
1813
149
99
56
53
FIG
URE
4.4
. PI
SA. P
erce
ntag
e of
15-
year
-old
stu
den
ts in
five
pro
ficie
ncy
leve
ls fo
r re
adin
g, 2
000-
2002
(sel
ecte
d c
ount
ries)
.
Ad
apte
d f
rom
UN
ES
CO
, 200
4, p
. 12
3.

Smaller, Quicker, Cheaper / 49
the two grades tested (third grade and fourth grade). LLECE evaluates students in two adjacent grades (third and fourth grade) as part of data collection. Depending on the particular country, students were either eight or nine years old. The second LLECE64 evaluated third and sixth grades.65 PASEC focuses on children enrolled in the second and fifth grades of primary school. It seeks to identify the factors that affect the learning of students in francophone Africa.66 The sampling was carried out at two levels. First, a sample of schools is selected that is proportional to their weight in the number of students in each of the two grades. Second, schools are chosen by stratification, in such a way as to be representative of the national education system as a whole.67 PASEC evalu-ates two grades: CP2 (second year of primary) and CM1 (fourth year of primary). In addition, the students are tested at the beginning and the end of the school year for each of the two grades. Thus, it becomes possible to evaluate the variation of student achievement level over time within individual performance. PASEC is the only LSEA to engage in this kind of mini-longitudinal evaluation. SACMEQ evaluates students reading in sixth grade (Figure 4.5). This is partially because in SACMEQ countries students at lower grades transition be-tween the usage of local and national languages in classrooms in primary school. This language transition occurs generally around third grade 3 (or fourth grade), with the assumption that the national language has been learned sufficiently for most or all students by sixth grade.68 The sampling technique used is similar to that of PIRLS. EGRA has mainly focused on beginning reading, and thus its assessments are typically done orally, and during first to third grades. EGRA tends to have smaller sample sizes on average than the other LSEAs, but with a fairly wide range: from 800 children in Kenya to up to about 6,000 in Nicaragua.
Population Exclusions
It is a persistent irony that many of the populations most in need of better educa-tion are systematically excluded from measurement in LSEAs. As assessment spe-cialists say: “If you are not measured, you do not exist.” This seems to be both the result of, and indeed a cause of, exclusion from LSEAs of the most vulnerable populations. The rationales vary from test to test, and from one national policy to another, yet the result is the same—those least likely to succeed on tests, and
64. The second LLECE assessment is named SERCE.65. UNESCO-LLECE, 2008.66. For a broader description of schooling in Francophone Africa, see Jarousse & Mingat, 1993.67. Stratification is implemented by the type of school or the type of geographical area (such as rural or urban), but without differentiating the geographical area. When a school is chosen, PASEC proceeds by pooling a fixed number of student groups (15 students to a group) by each level tested. In all, a minimum of 150 schools is required.68. See Ross et al. (2005), pp.39–41. Of course, this assumption is quite variable from one location to another, and is one of the principal reasons why EGRA assessments in local languages have proven attractive.

50 / Assessments of learning in developing countries
those who are most disadvantaged, represent the group most often excluded from the sample population for assessment. To understand why this is so, it is useful to disaggregate what is meant by the term “exclusion.”
Exclusion by Gender and Geography Gender has been a leading factor in school nonparticipation in LDCs, although sig-nificant progress has been made in recent decades. Nonetheless, in the poorest coun-tries, girls continue to be less enrolled in school than boys, both at the point of prima-ry school entry and by about fifth grade. Systematic exclusion of girls in poor LDCs, as well as discrimination, usually results in lower participation in schooling among adolescent girls, as well as depressed scores on national assessments relative to boys (Figure 4.6). Similar trends show important differences in national assessments when comparing rural and urban areas in LDCs. In some LDCs, the difficulty of literally tracking down nomadic children can make their inclusion onerous to authorities.69
69. For example, according to Greaney and Kellaghan (2008, p. 71), various sampling problems for the TIMSS ap-peared in the Republic of Yemen, where a number schools did not have fourth grade classes and where nomadic children could not be located. The fact that there are inevitable exclusions does not mean that LSEAs are not aware of the problem. Indeed, PIRLS has made explicit all of its decision-making in technical reports, such as PIRLS 2006 International Report (Appendix A) and Technical Report (Chapter 4, Appendix B); (personal communication, A. Ken-nedy and K. Trong, 2010).
0 10 20 30 40 50 60 70
22
26
26
46
53
56
1
2
8
5
27
37
Students reaching proficiency levels in reading (%)
6523Kenya
Zimbabwe
Mauritius
Zanzibar (U. R. Tanzania)
Namibia
Zambia
Malawi
Desirable
Minimum
Note: Countries are ranked by proportion of pupils meeting minimum proficiency levels.Sources: Kulpoo (1998); Machingaidze, Pfukani and Shumba (1998); Milner et al. (2001); Nassor and Mohammed (1998); Nkamba and Kanyika (1998); Nzomo, Kariuki and Guantai (2001); Voigts (1998).
FIGURE 4.5. SACMEQ. Percentage of grade 6 pupils reaching proficiency levels in reading in seven African countries, 1995–1998
Adapted from UNESCO, 2004, p. 121.

Smaller, Quicker, Cheaper / 51
Disparities between the performance of year 6 boys and girls (girl/boy ratio) in language and mathematics in nine countries
1.37 1.21 1.15 1.11 1.05 1.00 .99 .95 .90 45.67.98.29.39.59.10.180.1 .1.00.25
0.50
0.75
1.00
1.25
1.50
Nicaragua Peru Mexico Haiti El Salvador Uganda Guatemala Niger Honduras
girl
/boy
per
form
ance
rat
io Language
Mathematics
FIGURE 4.6. Gender disparities in language and mathematics achievement in grade 6 based on national learning assessments
Exclusion by Language and Ethnicity
[L]anguage policy formulation is most frequently examined at the level of the nation-
state in respect of the way that governments structure the use of languages within
their borders. This results in giving languages a certain status, for instance as a na-
tional language, an official language, a provincial language or some other category.70
Language variation across ethnic groups exists in nearly all countries, for reasons of historical trends and more recent migrations. Many of these groups—sometimes termed ethno-linguistic minorities—are well integrated into a national mix (such as Switzerland), but at other times may result in civil strife (such as Rwanda). Often, social and political forces try to help resolve differences, usually including policy decisions that result in a hierarchy of acceptable languages to be used in schools and governance structures.71 In such situations, whether in OECD coun-tries or LDCs, it is not unusual for children who speak minority languages to be ex-cluded from assessments.72 This may be particularly accentuated in areas where civil conflict or economic distress leads to substantial cross-border migration, where immigrant groups (and their children) are treated as transients, and for groups that are provided with little or no schooling (Figure 4.7).
70. Robinson, 2004, p. 4.71. See Hornberger (2003). Of course, not all ethno-linguistic issues, whether inside education or out, are so easily resolved.72. In the United States, for example, in the 2003 National Assessment of Adult Literacy, only English and Spanish literacy were assessed, even though dozens of other languages are used by adult learners in American adult educa-tion classes. US Department of Education, 2009.
Adapted from Benavot & Tanner, 2007, p. 15.

52 / Assessments of learning in developing countries
Exclusion by Other Factors
PISA emphasizes describing which students qualify for exclusion from its national stratified samples. If they did not do so, it would be possible for any country to bias upward its national average by ignoring portions of the population from its assess-ment. The PISA rules for exclusion are the following: students with mental or phys-ical handicaps; students who are born in other countries (and therefore may have second language problems); and students that have been found to be dyslexic (with reading disabilities).73 Given the prominent issue of league tables, some countries still complain that others do not have fully representative population samples. In the case of SACMEQ, students in so-called small schools were ex-cluded, even if the definition of such schools changed across various participating countries. In Lesotho, for example, if a school had less than 10 students in sixth grade, it was excluded from the population sample. In Seychelles, Botswana and Tanzania, schools with fewer than 20 students were excluded. In Uganda, students were excluded if they were in zones where a civil conflict was in process.74 As may be seen, there are many practical reasons for exclusion, especially in LSEAs that need to efficiently assess large numbers of students. On the other hand, if the focus is on those most in need, even fair rules of exclusion will not be fair in making sure that all students are assessed.
73. This type of exclusion, because of dyslexia, is subject on a case-by-case basis to reviews by the consortium of national experts in PISA (OECD, 2009b). According to Wuttke (2008), Denmark, Finland, Ireland, Poland, and Spain excluded students for this reason in the PISA study of 2003. Denmark excluded students who had disabilities in math. Luxemburg excluded new immigrants.74. See Ross et al., 2005. See also the SACMEQ II report on Kenya (Onsumo et al., 2005).
FIGURE 4.7. Percent of selected language groups in the bottom 20 percent of the education distribution, selected countries
Gambia: Pulaar
Guinea-Bissau: Balante
Pakistan: Saraiki
Guatemala: Q’eqchi’
Mexico: Indigenous*
Nepal: Maithili
Turkey: Kurdish
Nigeria: Hausa
0% 20% 40% 60%
Proportionin population
Proportion inbottom 20%
Note:: The ‘bottom 20%’ is the 20% of 17- to 22-year-olds with the fewest years of education.* The indigenous language category in Mexico consists of those who speak indigenouslanguages only and do not speak SpanishSources:: UNESCO-DME (2009)
Adapted from UNESCO, 2010, p. 152.

Smaller, Quicker, Cheaper / 53
Finally, many children in poor countries are not in school, and therefore will go untested by LSEAs, which typically do not test before fourth grade. The “sur-vival rates” (net cohort completion rates) in poor countries may be quite low—as little as 20–30 percent in poor LDCs. LSEAs, such as PIRLS and PISA, simply miss many of the most vulnerable children in poor countries, because these children are no longer in school when such international assessments occur. The 2010 GMR on Reaching the Marginalized makes this a central issue of its argument, and may be one important rationale for SQC instruments to be adapted for nonschool settings.75
Comparability of Assessments
Among the potential pitfalls in using international data for this [comparison] purpose
is that because a test has to be administered in several countries, its content may not
adequately represent the curriculum of any individual participating country.76
[T]he populations and samples of students participating in international assessments
may not be strictly comparable. For example, differences in performance might arise
because countries differ in the extent to which categories of students are removed
from mainstream classes and so may be excluded from an assessment.77
EGRA should not be used to compare results across languages. As languag-
es have different levels of orthographic transparency, it would be unfair to say
that Country A (in which all children are reading with automaticity by grade 2)
is outperforming Country B (where children reach this level only by grade 3), if
Country A’s language has a far more transparent orthography than Country B’s
language. Nonetheless, finding out at which grade children are typically “break-
ing through” to reading in various countries, and comparing these grades, will
be a useful analytical and policy exercise, as long as it is not used for “rankings”
or “league tables” or for the establishment of a single universal standard for, say,
reading fluency or automaticity.78
The comparability of data is a major concern for policymakers and planning agencies. If definitions and classifications vary, then it can be difficult if not impossible to compare data collected through different surveys and assess-ments. Comparability and stability are necessarily the hallmarks of the UN data
75. UNESCO GMR 2010 (UNESCO, 2010). Testing out-of-school children would seem to be quite feasible with EGRA-like assessments, though this seems not to have been done recently; in the 1980s, Wagner (1993) used similar hybrid assessments to study the reading skills of children who attended Islamic schools in Morocco. Similar methods were also used to study low-literate or illiterate adults (Lavy et al., 1995).76. Ladipo et al., 2009, p 19.77. Greaney & Kellaghan, 2008, p. 71.78. RTI, 2009, p. 11, emphasis in the original.

54 / Assessments of learning in developing countries
collection, such as by the UNESCO Institute for Statistics (UIS). Nonetheless, if comparability becomes the primary goal, while less attention is paid to the (local and cultural) validity of the definitions and classifications of learning, then the data may become less meaningful and potentially less applicable at the ground level. This is a natural and essential tension between “emic” (within-culture) and “etic” (cross-culture) approaches to measurement.79 Comparative studies need not be only about league tables. Comparative studies may also provide ways of provoking discussion when variation is found within countries. For example, in a World Bank national household survey in Bangladesh, it was found that five years of primary schooling resulted in only about a first grade equivalent of learning achievement, and that three years of schooling had approximately zero value in terms of learning achievement.80 This study indi-cated that the kinds of investments that Bangladesh made in the area of basic skills were insufficient relative to their national goals. This and other studies were part of the inspiration for SQC-like hybrid assessments that sought to detect serious education problems at an early stage. Can both comparability and context sensitivity be appropriately balanced in assessments? Should countries with low average scores be tested on the same scales with countries that have much higher average scores? If there are countries (or groups of students) at the floor of a scale, some would say that the solution is to drop the scale to a lower level of difficulty. Others might say that the scale itself is flawed, and that there are different types of skills that could be better as-sessed, especially if the variables are evidently caused by race, ethnicity, language, and related variables that lead one to question the test as much as group tested. For some, having different scales for different groups (or nations) is an uncomfortable compromise of overall standards. To the extent that comparability can be achieved (and no assessment claims perfect comparability), the results allow policy makers to consider their own national (or regional) situation relative to others. This seems to have most merit when there are proximal (as opposed to distal) choices to make. For example, if a neighboring country in Africa has adopted a particular bilingual education pro-gram that appears to work better in primary school, and if the African minister of education believes that the case is similar enough to his or her own national situ-ation, then comparing the results of, say, primary school reading outcomes makes good sense. A more distal comparison might be to observe that a certain kind of bi-lingual education program in Canada seems to be effective, but there may be more
79. See Wagner, 2004, for example. “Emic” approaches are those that are consciously focused on local cultural relevance, such as local words or descriptors for an “intelligent” person. “Etic” approaches are those that define “intelligence” as a universal concept, and try to measure individuals across cultures on that single concept or defini-tion. Some also see this as one way to think of the boundary between the disciplines of anthropology (emic) versus psychology (etic). For earlier discussion, see Harris, 1976.80. Greaney et al., 1999.

Smaller, Quicker, Cheaper / 55
doubt about its application in Africa, a quite different context. Proximity is not al-ways the most pertinent feature: there are many cases (the United States and Japan, for example) where rivalries between educational outcomes and economic systems have been a matter of serious discussion and debate over the years.81 In another example, senior officials in Botswana were interested in knowing how Singapore came to be first in mathematics.82 A good example of regional comparison may be seen in the levels of literacy in SACMEQ (Figure 4.8), where countries may change their relative positions over time.83 The key issue here is the degree to which it is necessary to have full com-parability, with all individuals and all groups on the same measurement scale. Or, if a choice is made to not force the compromises needed for a single unified scale, what are the gains and losses in terms of comparability? Alternatively, one might ask whether the scales need to measure the same skills. For example, EGRA focuses on such cognitive pre-reading skills as phonemic awareness, while international LSEAs focus on reading comprehension. Can international statistics be main-tained as stable and reliable if localized approaches are chosen over international
81. Stevenson & Stigler, 1982.82. Gilmore, 2005, p. 26.83. The decline in literacy scores has been attributed to the increase of school enrollment in these countries, related to a concomitant decrease in instructional quality.
Mea
n sc
ore
s in
lite
racy
Mauritius
Zanzibar
Malawi
Kenya
Zambia
Namibia
(U. R. Tanzania)
420
440
460
480
500
520
540
560
SACMEQ I 1995-1996
SACMEQ II 2000-2001
Source: Postlethwaite (2004)
Figure 4.8. Changes in literacy scores between SACMEQ I and SACMEQ II
Adapted from UNESCO 2004, p. 46.

56 / Assessments of learning in developing countries
comparability? This has led to situations where some LDCs, while tempted to par-ticipate in international assessments, nevertheless hesitated due to the appearance of low results or the feeling that the expense of participation was not worth the value added to decision-making at the national level.84 Others may participate be-cause they do not want to be viewed as having inferior benchmarks to those used in OECD countries.85 In any case, LSEAs (international and regional) remain very useful in offering reliable comparisons on a range of important educational vari-ables, such as those shown in Table 4.2.
84. See Greaney & Kellaghan (1996) for a useful overview on this issue.85. It should be noted that donor agencies often play a role in this decision-making by supporting certain assess-ments as part of a ‘package’ of support for evaluation capacity building.
TABLE 4.2. Indicators of participation in primary schooling
Study Country Cohort
% ever enrolled
(ages 6-14)1
% that survived to
grade 52
% that achieved minimum mastery3
NER in primary for the period
before the test4
SACMEQ (1995) Grade 6 reading test
Malawi Mauritius Namibia U. R. Tanzania
100 100 100 100
91 99 97 87
31 (34) 98 (99) 74 (76) 70 (81)
7 (22) 52 (53) 19 (26) 18 (26)
69 99 84 54
PIRLS (2001) Grade 4 reading test
Colombia Morocco
100 100
98 99
60 (61) 77 (78)
27 (45) 59 (77)
87 81
PASEC (mid-1990s) Grade 5 French test
Burkina Faso Cameroon Côte d’Ivoire Guinea Madagascar Senegal Togo
100 100 100 100 100 100 100
35 88 65 48 78 48 82
25 (72) 45 (51) 45 (70) 32 (66) 31 (40) 42 (87) 49 (60)
21 (83) 33 (73) 38 (84) 21 (65) 20 (64) 25 (59) 40 (81)
28 73 49 36 63 51 66
Notes and sources:1. Data are for the year closest to the test year in each country. World Bank, 2004.2. The percentage of the cohort that survived to grade 5 is calculated by multiplying survival rates to grade 5 (in brack-ets) by the percentage of children ever enrolled. Survival rates are taken from the EFA Assessment 2000 CD-ROM for SACMEQ I and PASEC, for the year of the test or the closest to it, and the Statistical annex, Table 7, for PIRLS.3. The percentage that achieved mastery is calculated by multiplying the percentage of children in the study who achieved the minimum standards (in brackets) by the percentage of children who survived to grade 5. The criteria for considering a student to have achieved minimum standards is different in each study, so the results are not comparable (see Box 3.8). For SACMEQ I countries, data are from Kulpoo (1998), Machingaidze, Pfukani and Shumba (1998), Milner et al. (2001), Nassor and Mohammed (1998), Nkamba and Kanyika (1998), Nzomo, Kariuki and Guantai (2001) and Voigts (1998). For PASEC and PIRLS countries, data are from Bernard (2003) and Mullis et al. (2003), respectively.4. The averages were calculated for each country using the years available. For SACMEQ I and PASEC countries, data are from the EFA Assessment 2000 CD-ROM; for PIRLS countries, data are from the Statistical annex, Table 5.Adapted from UNESCO, 2004, p. 227.

Smaller, Quicker, Cheaper / 57
Other Issues in Assessment Selection
High Stakes Versus Low Stakes
Although some assessments serve learners, teachers, parents, and policymakers
by providing them with useful information, others focus educational efforts by vir-
tue of the consequences that are attached to learner performance. This dual role
leads to the paradox of “high-stakes” assessment as an instrument of change. In
the absence of serious consequences, it is difficult for assessment to exert much in-
fluence on an education system; however, if performance on an assessment entails
serious consequences, it can lead to activities that are educationally unproductive
and may actually undermine the integrity of the system.86
The psychology to testing varies by type of stakeholder—for learners, instructors, school officials and even national policy makers. This psychology revolves around the perception that the results have in the minds of each type of stakeholder. For the learner, any test may look like it is high stakes (that is, of critical importance), particularly so in LDCs where testing is less frequent, and national tests often have major consequences for the individual.87 This may lead to legitimate effort by some students, but question-able practices by others. For example, students’ anxiety and cheating often increases in proportion to the stakes of the test. Parental support and test preparation (and teacher tutoring) also increase as the stakes rise, but not equally among all students. For instructors, school officials, or national policy makers, tests can be a way that they are judged. Considerable evidence has been gathered on this topic, for all kinds of assessments.88 There is evidence for cross-national differences in high versus low stakes assessments. In PISA, for example, some evidence suggests that countries such as Norway and Denmark have many students who are no lon-ger motivated (or pressured) by such tests, while in Taiwan and Singapore, students remain very motivated.89 There is less information on the high-low stakes use of international assessments in LDCs, though in the context of the importance of na-tional qualification exams (for example, passing the Baccalaureate in Francophone African countries), it is likely that a high stakes psychology will play an important role.90 The EGRA documentation states: “EGRA should not be used for high-stakes
86. Braun & Kanjee, 2006, p. 2.87. Most African countries have nationwide tests at the end of secondary education managed by “examination boards.” These tend to be well funded, because they are high stakes for entrance into higher education. They also form a basis for technical capacity building. Thanks to L. Wolff for this observation.88. For a review, see Chapman and Snyder (2000).89. Sjoberg, 2007.90. The issue here is not whether high or low stakes is better (though most assessment specialists tend to prefer low stakes)—rather, for comparability purposes, it is important to know that there are no large systematic differences (that could skew the data) where stakes vary between countries or other comparison groups. See also earlier discus-sion of national ‘public’ examinations.

58 / Assessments of learning in developing countries
accountability, whether of a punitive, interventionist, or prize-giving variety.”91 Yet,as with most other forms of testing, especially in environments where testing is a relatively infrequent event, it is difficult to assure that such assessments are not going to be thought of as high stakes.92
Direct Versus Proxy Measures
[D]ue to the limited data availability on many of these dimensions [i.e., good
measures of learning outcomes], proxy indicators of educational quality (e.g., the
survival rate to grade 5 or the primary completion rate) have often become the
basis for evaluating substantive national progress (or the lack thereof).93
Proxy variables of learning have been around for a long time, probably since schooling began and people began to ask what went on inside the classroom. Reading and literacy rates have played an important part in this history. As part of colonial history, imperial governments were not hesitant to talk about so-called illiterate and uncivilized peoples who have never been to school. When UNESCO gathers data in developing countries on literacy, many countries determine illiteracy rates as a function of how many adults (over age 15) have not gone to school out of the adult population.94 Thus, school can be a proxy measure of literacy, and remains so in many countries today. Schooling is only one proxy measure for learning. As researchers have sought better ways to understand the types of variables that influence learning, or reading more specifically, they have focused more on the larger contexts for learn-ing (such as background variables, see next section) as well as measure of the sub-components of reading, such as those found in EGRA. As will be seen in Chapter 5, EGRA uses such measures as how many letters or words can be read aloud by a child in a specific time period. Some call this a measure that is only a proxy for reading, since few people actually engage in this type of task in ordinary reading ac-tivities, as either beginners or experts. While such measures in EGRA may serve an important purpose, many test items that are used to measure specific skill learning (such as letter naming) do not have the same face validity of measuring the ultimate outcome (such as reading a text with comprehension). They are proxy measures.95
91. RTI (2009), p. 10.92. Even if the test designers see these tests as low stakes, they may not be perceived as such on the ground. For exam-ple, it is not unreasonable for a teacher whose students do poorly on EGRA to feel that negative consequences may result.93. Benavot & Tanner, 2007, p. 4.94. Wagner, 1990, 200195. For many cognitive specialists, a skill such as letter naming might be considered to be a component skill of reading, and therefore not a proxy, but rather a precursor of later skills. See further discussion in Chapter 5. It might also be said that many tests (and test components) are proxy measures, with intelligence or I.Q. tests being a prime example.

Smaller, Quicker, Cheaper / 59
The Importance of When to Test
School-based assessments are typically carried out with two key parameters in mind. First, when are the break points when a student will leave one level of education for another more advanced stage. Thus, many countries hold national examinations at the end of primary, lower secondary, and upper secondary to de-termine who will be allowed into the next stage of the schooling system. Second, some exams view the level of competency as a more appropriate cognitive point in which students should be tested. As noted earlier, PIRLS tests children at the end of fourth grade (about age nine), the point at which most children should have learned the basics of reading, writing, and math; PASEC, LLECE and SACMEQ are similar clustered around the mid-end of primary school. On the other hand, PISA assesses at age 15 in order to capture competencies at the end of compulsory basic education in OECD countries. EGRA, by contrast, focuses mainly on the period from first to third grade so it can ascertain serious reading problems much earlier than the other tests con-sidered in this review. This aspect of early detection is made possible in part because of the one-on-one and largely oral assessments given to children. There is a very important policy rationale as well. In the field of early childhood education there is growing evidence of the impact of early interventions, such as those indicating that a dollar spent in the early years will pay off many times over in later life (Figure 4.9).96 Further, additional studies show that the wealth-based gaps in children’s cognitive development grow over time (Figure 4.10).97 Most educators agree that the earlier one can detect and remedy educational problems (much as in the health sector), the more effective and efficient can be the intervention.
Background Variables
Numerous factors can help to explain why a child is out of school and thus not in an assessment, or why children might perform better or worse on a set of mea-sures. These background variables—such as age, gender, socio-economic status (SES), ethnic origin, health status, home language, and geographical location—have always been central to social science explanations of educational outcomes. Of course, in most instances this form of explanation is really one of relationship, since data collected on such background variables are understood as correlational statis-tics. Naturally, SES has been a prominent variable, and has been used as one way to understand variation in LSEA scores, such as on LLECE and PISA (Figure 4.11).
96. Carneiro & Heckman, 2003; Heckman, 2006.97. UNESCO, 2010.

60 / Assessments of learning in developing countries
!
Rate of Return to Investment in Human Capital
Preschool Programs
Schooling
SchoolPreSchool Post School
Age
Rates of Return to Human Capital Investment Initially Setting Investment to be Equal Across all Ages
Job Training
Opportunity Cost of Funds
FIGURE 4.9. Rates of return on human capital investments initially setting investment to be equal across all ages
FIGURE 4.10. Wealth-based gaps: Test scores across ages for the poorest and the fourth deciles in Ecuador, 2003–2004
50
60
70
80
90
100
110
36 38 40 42 44 46 48 50 52 54 56 58 60 62 64 66 68 70
4th decile
1st (poorest) decile
3-year-olds 4-year-olds 5-year-olds
Age in months
Stan
dar
diz
ed t
est
sco
res
Notes: The test scores used are from the Test de Vocabulario en Imágenes Peabody, the Spanish version of the Peabody Picture Vocabulary Test. The figure presented here, a smoothed version of the original figure (which appears in the source document), has also been reproduced elsewhere (e.g. Fiszbein et al., 2009, and World Bank, 2006j).Source: Paxson and Schady (2005b).
Original from Carneiro & Heckman, 2003, p. 93; adapted from World Bank, 2011.
Adapted from UNESCO, 2010, p. 50.

Smaller, Quicker, Cheaper / 61
FIGURE 4.11. Background factors and reading literacy
Lite
racy
sco
res
0 1 2 3 4 5 6 7 8 9 10 11 12 13 14 15 16
200
220
240
260
280
300
320
340
360Cuba
Brazil ChileArgentina
Colombia
ParaguayBoliviaVenezuela
Peru
Dominican Rep.
Honduras
Mexico
Parents’ education (years of schooling)
Stud
ents
’ per
form
ance
on
com
bin
ed r
ead
ing
lite
racy
sca
le
Index of family SES Higher SESLower SES
250
300
350
400
450
500
550
600
-3.5 -3.0 -2.5 -2.0 -1.5 -1.0 -0.5 0 0.5 1 1.5 2
Peru
Albania
TFYR Macedonia
Indonesia
Brazil
Argentina
Thailand
Mexico
Latvia
Russian Federation
Poland
OECD
Czech Republic
Bulgaria
Chile
Hungary
a. LLECE, 1997
b. PISA, 2000
Adapted from UNESCO, 2004, p. 123.
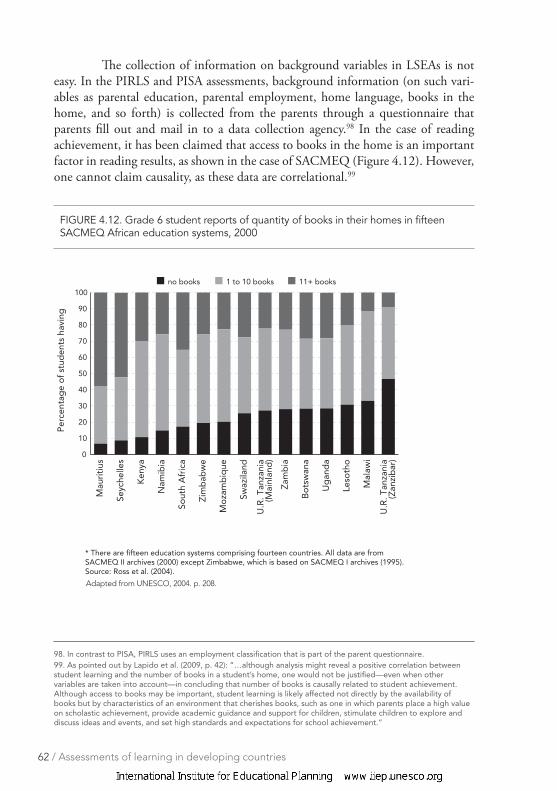
62 / Assessments of learning in developing countries
The collection of information on background variables in LSEAs is not easy. In the PIRLS and PISA assessments, background information (on such vari-ables as parental education, parental employment, home language, books in the home, and so forth) is collected from the parents through a questionnaire that parents fill out and mail in to a data collection agency.98 In the case of reading achievement, it has been claimed that access to books in the home is an important factor in reading results, as shown in the case of SACMEQ (Figure 4.12). However, one cannot claim causality, as these data are correlational.99
98. In contrast to PISA, PIRLS uses an employment classification that is part of the parent questionnaire.99. As pointed out by Lapido et al. (2009, p. 42): “…although analysis might reveal a positive correlation between student learning and the number of books in a student’s home, one would not be justified—even when other variables are taken into account—in concluding that number of books is causally related to student achievement. Although access to books may be important, student learning is likely affected not directly by the availability of books but by characteristics of an environment that cherishes books, such as one in which parents place a high value on scholastic achievement, provide academic guidance and support for children, stimulate children to explore and discuss ideas and events, and set high standards and expectations for school achievement.”
FIGURE 4.12. Grade 6 student reports of quantity of books in their homes in fifteen SACMEQ African education systems, 2000
0
10
20
30
40
50
60
70
80
90
100
Mau
riti
us
Seyc
helle
s
Ken
ya
Nam
ibia
Sout
h A
fric
a
Zim
bab
we
Mo
zam
biq
ue
Swaz
iland
Zam
bia
Bo
tsw
ana
Ug
and
a
Leso
tho
Mal
awi
U.R
. Tan
zani
a(M
ainl
and
)
U.R
. Tan
zani
a(Z
anzi
bar
)
Per
cent
age
of
stud
ents
hav
ing
1 to 10 books 11+ booksno books
* There are fifteen education systems comprising fourteen countries. All data are from SACMEQ II archives (2000) except Zimbabwe, which is based on SACMEQ I archives (1995).Source: Ross et al. (2004).
Adapted from UNESCO, 2004. p. 208.

Smaller, Quicker, Cheaper / 63
Data Collection Methodologies
One of the most difficult aspects of LSEAs is how much data, and of which kind, to collect. The idea that one collects just enough data is easier said than done. What some term ‘right-sizing’ data collection has been more recently called “evidence-centered design” (ECD).100 The idea, essential for the SQC framework described earlier, is to try to capture enough data so as to address the empirical challenge, but not so much that the costs in time and energy render less useful the information gathered. This approach has much in common with what is called ‘short-form’ test development wherein longer tests are reduced to smaller ones, with various statisti-cal risks to both validity and reliability.101 Some of the most common methods are briefly described below.
SurveysEach of the LSEAs described above is a survey that is undertaken at the school level. In addition, surveys are undertaken as part of a national census bureau’s work, with a focus on sampling households across demographic parameters, sometimes with the inclusion of psychometric tests and analytic techniques. Efforts to make such surveys comparable at an international level are at least as complex as LSEAs, if not more so, because of the need to visit individual homes. One good example in the field of reading is the International Adult Literacy Survey (IALS), undertaken by OECD in 1995.102 These surveys, as with LSEAs, require considerable care in terms of sample selection and time required for learning assessment.
Program EvaluationProgram evaluations probably constitute the most common, and most varied, type of data collection. Many agencies carry out evaluations at the local level, and they may cover national programs as well. Methodologies run the gamut from those that ascertain whether funds were spent properly, to those that measure learning outcomes, or to those that gauge community involvement. Unfortunately, most evaluations are stand alone in the sense that there is little or no effort to connect one program evaluation with another—hence, little in the way of cumulative sci-ence can take place, and relatively few of these program evaluations in LDCs have focused on testing of reading skills in either children or adults.103
100. “The basic idea of ECD is that designers should “work backwards,” by first determining the claims they would like users to make about the assessment and the evidence needed to support those claims. They can then develop the exercises (items, probes, performance challenges, etc.) to elicit desired learner responses, the scoring rubrics used to transform those responses into relevant evidence, and the measurement models that cumulate or summarize that evidence.” (Braun & Kanjee, 2006, p. 13).101. Smith, et al. (2000). This review describes how various well-known tests have been manipulated into shorter forms, and provides methodological suggestions on how to improve the short form versions.102. OECD/Statistics Canada, 1997. See further discussion of IALS in Chapter 8.103. In the adult literacy domain, there have been only a few substantive multi-program evaluations, such as Carron et al., 1989; Okech, et al, 2001; and Nordtveit, 2004.

64 / Assessments of learning in developing countries
Psychometrics and Item Response TheoryPsychometrics refers to the theory and technique of psychological or educational measurement. All LSEAs reviewed here utilize psychometrics to both collect and analyze data based on skill tests. In addition, most of the LSEAs utilize the statistical technique called “item response theory” (IRT).104 The IRT approach increases overall skill test coverage by allowing more total items in the assessment, but fewer for each individual student to take. In this way, it also allows the use of extended passages, such as a newspaper article, to assess reading comprehension. In assessments without IRT (such as PASEC and EGRA), all students respond to a full set of items, provid-ing a transparent comparison across identical sets of items, but also restricting the breadth and depth of what is assessed. There are disadvantages with IRT, especially for LDCs beginning an assessment program. Scoring, scaling of scores, and admin-istration (for example, printing and distribution) are more complex, while analyses involving individual students or school data can be problematic and require more so-phisticated personnel.105 As with all such statistical techniques, the IRT as employed in international assessments is not without its critics.106,107 Randomized Control Trials
Randomization has many potential pitfalls. It may be costly to conduct, it may re-
quire substantial and detailed oversight to ensure the integrity of the random-
ization, and it may require substantial time to yield meaningful conclusions. …
Because of the substantial time required to implement and evaluate some of the
most important interventions, researchers and policymakers must balance their de-
sire for quick results with their desire for comprehensive and important solutions.108
Over the past several decades, randomized control trials (RCT) have become in-creasingly popular in educational research. In part, this increase seems to be be-cause of the growing connection between the social sciences and medical sciences with education, and in part because of the frustration of policy makers with the myriad of complex (and sometimes contradictory) findings that form the basis of many important education questions. RCT-designed studies have only begun in the last few years to find their way into work in developing countries, yet their potential is high in situations where rapid and frequent testing become possible. In one such RCT study conducted in India, it was found that appointing a second
104. See Hambleton et al., 1991.105. See Greaney & Kelleghan, 2008, p. 42.106. See, for example, Goldstein (2004); Goldstein et al. (2007); and Mislevy and Verhelst (1990).107. The psychometric statistical IRT models assume that the learner’s response to an item does not depend on his or her responses to other items in the assessment instrument. However, all the LSEAs contain texts with multiple questions; thus, failure to comprehend a single text will affect multiple responses. While this approach is common for practical reasons, it makes independence impossible in the treatment of the results. See Dickes and Vrignaud, (1995); and Wainer & Thissen (1996) for discussions of these issues.108. Bettinger, 2006, p. 67.
Smaller, Quicker, Cheaper / 65
teacher to single-teacher schools increased females’ school participation but had little or no impact on student test scores. This experiment demonstrated fairly decisively that such inputs of poorly trained additional teachers were of little value from improving student outcomes in the context studied.109 With the advent of such credible and relatively rapid assessment tools as EGRA, more RCT designed studies will likely be done in the coming years (see Chapter 6 for a recent EGRA field study example).
Frequency of Testing
With progress monitoring [in reading], students are assessed a minimum of three
times a year, but typically more frequently (e.g., weekly, monthly, or quarterly) by
using alternate forms of a test. The purpose is to estimate rates of reading im-
provement, to identify children who are not demonstrating adequate progress and
will need supplementary instruction, and to compare the efficacy of different forms
of instruction for an individual student...110
The frequency with which a national assessment is carried out varies from country to country, ranging from every year to every 10 years. A temptation may exist to assess achievement in the same curriculum areas and in the same population every year, but this frequency is unnecessary, as well as very expensive...111 Most OECD countries, where fiscal and human resources are relatively plentiful, regularly assess students, as described in the first quotation above, in the case of reading development. In order to intervene in situations where the indi-vidual learner, or the school, shows signs of falling behind reading norms, addi-tional resources are brought to bear in a timely way, often through highly frequent assessments. In developing countries, as well as in non-affluent parts of OECD countries, this level of resources is often unavailable. If international, regional, and national assessments are not done on an annual or biennial basis, they will likely have a more limited policy impact. If the goal is for a tighter relationship between findings and policies that can be imple-mented during the annual school cycle, or within the mandate of a typical minister of education, then greater frequency is required. Achieving this latter aim will likely necessitate such instruments as SQC hybrid instruments whose turnaround time and lower cost would allow for greater frequency of implementation.
109. Banerjee & Kremer, 2002. Of course, generalizing from this experiment to other situations and contexts is a matter that would generate much debate, as happens in many RCT studies. But to the extent that the variables (inde-pendent and dependent) remain nearly constant or controlled, generalizability becomes stronger.110. Kame’enui et al., 2006, p. 6.111. Greaney & Kellaghan, 2008, p. 43.

66 / Assessments of learning in developing countries
Disparities across Countries
International statistical reports on education (such as those produced by UIS, UNICEF, or the World Bank) typically base their data sets on national reports, where data may have many different ways of being collected. In contrast, and one of the attractions of LSEAs is that nations may be rank-ordered in league tables (as in PISA and PIRLS). Yet, as noted above, there may be problems in applying a common skill sampling scale across widely differing populations. In the PIRLS 2006 study of reading achievement (Figure 4.13), for example, the median score of South African fourth grade students is below the “0” percentile of the high-income OECD nations. Such dramatic disparities raise considerable concern about the gap that will need to be closed for LDCs to catch up to high-income countries. In the upcoming 2011 Pre-PIRLS study, lower benchmarks will be used so that more explanatory (statistical power) will be available at the bottom end of the scale. Floor and ceiling effects are possible anytime when skill results vary significantly across population sampling. For example, the EGRA scores used in English in rural Tanzania would likely be con-siderably lower than for same-age (or grade) English-speaking students in suburban Washington, D.C. Overall, disparities can be powerful ways of showing difference, but they pose a continual problem of appropriate benchmarking across contexts.
OECD curve extrapolated to show the “0th” percentile
South African median is below the “0th” percentile in OECD
SA
SA, Morocco, Indonesia
Percentiles
00
20 40 60 80 100
100
200
300
400
500
600
700
FIGURE 4.13 Percent of fourth grade students in PIRLS 2006
Adapted from Crouch, 2009.

Smaller, Quicker, Cheaper / 67
Credibility of Assessment
There are various ways of thinking about the credibility of any assessment. Typically, the measurement community defines credibility as a combination of validity and reliability. Yet, it should be understood that credibility in the non-statistical sense implies more than the particular statistical tools available to test designers. This is so largely because many difficult decisions about credibility are made before statistical tests are employed. For example, is an assessment credible if many of the poorest children are excluded from participation? Is an assessment credible if the enumerator does not speak the child’s language? These are not merely choices that are internal to the test, but rather are related to the context in which the assessment is deployed. Assuming that most of the above challenges can be met in a reasonable way, it is possible to focus on the more traditional views of validity and reliability.
Validity
Validity is an integrated evaluative judgment of the degree to which empirical
evidence and theoretical rationales support the adequacy and appropriateness
of inferences and actions based on test scores or other modes of assessment.112
The validity of an assessment instrument is the degree to which items on a test can be credibly linked to the conceptual rationale for the testing instrument. Thus, do questions on a multiple-choice test really relate to a child’s ability to read, or to the ability to remember what he or she has read earlier? Validity can vary significantly by setting and by population, since a test that might be valid in London may have little validity in Lahore.113 A reading test used effectively for one language group of mother-tongue speakers may be quite inappropriate for children who are second language speakers of the same language. With respect to international LSEAs, there have been a number of critiques of content validity, around the choice and appropriateness of items in relation to local cultures and school systems.114 It seems that regional tests do somewhat better on this aspect of validity, as they have tended to use material from the stated national curricu-la as items in the test itself.115 Translation of international LSEAs remains a problem,
112. Messick, 1989, p. 13; cited in Braun & Kanjee, p. 15.113. Braun & Kanjee, 2006, p. 15.114. Sjoberg (2007) claimed that some test items deviated substantially from the stated PISA goal of evaluating com-petencies for the workforce. Howie and Hugues (2000) found that the TIMSS covered only a very small fraction (18 percent) of the curriculum of science in seventh grade in South Africa, while as much as 50 percent in eighth grade.115. Ross et al., 2005.

68 / Assessments of learning in developing countries
as it is never certain that an equivalent translated item will have the same statistical properties as an indigenous word chosen independently.116 This became evident with the OECD’s International Adult Literacy Survey (IALS), mentioned earlier, when France withdrew its results from the study, claiming a bias in translation.117
Reliability
Reliability is typically measured in two ways. Generically, reliability refers to the degree to which an individual’s score on a test is consistently related to addition-al times that the individual takes the same (or equivalent) test. High reliability typically means that the rank ordering of individuals taking a given test would, on a second occasion, produce a very similar rank ordering. In the psychometrics of assessment, it is not unusual to obtain relatively high test-retest reliability on LSEAs.118 This result stems in large part from the fact human cognitive function is highly stable, as has been known ever since the development of the earliest tests of intelligence. A second, and easier way to measure reliability is in terms of the internal function of the test items: Do the items in each part of an assessment have a strong association with one another? This is inter-item reliability (known as Cronbach’s alpha statistic). Reliability implies little about validity of the instrument, wherein agree-ment must be reached concerning the relevance of the instrument for educational outcomes. Nonetheless, reliability is crucial to achieve in any LSEA, and failure to achieve a relative high reliability often indicates serious ceiling or floor effects.119 As will be seen in Chapter 6, reading assessments (such as EGRA) tend to show sig-nificant ceiling and floor effects, especially in young children undergoing dramatic changes in individual learning curves. These effects can cause serious problems in both test development and the interpretation of findings.
116. See Hambleton and Kanjee (1995) for a discussion on translation issues in international assessments.117. Blum, et al., 2001. France participated in the 1995 and 1998 IALS. Apparently, there were also differences between the Swiss and French Francophone translations. See also Carey (2000), and further discussion in Chapter 8.118. Strong reliability correlation coeffients in psychometric assessments are not difficult to achieve on reasonably differentiated item set of, say, 20 or 30 items (or more) that is appropriate to the level of the learner. Individuals tend to be reliable test takers.119. Ceiling effects occur when a test is so easy that substantial numbers of learners get most or all of the items cor-rect, reducing the variance in the scores, and therefore driving down the correlation coefficient. Floor effects occur, similarly, if there are too many scores at zero or near-zero, again driving down the correlation coefficient.

Smaller, Quicker, Cheaper / 69
Choosing an Assessment Design
Any initiative undertaken to improve assessment practice must take account of the
formal assessments that are currently in use.120
All countries in today’s world are already using assessments in education. Most of these countries depend primarily on national forms of assessment. Can these national assessments be improved? Should other assessments be added to the mix of information and data that agencies seek to use? Given the growth of assessments worldwide, the answer as evidenced by the facts on the ground seems to be in the affirmative. How does an agency (local, national, or international) choose new assess-ments? There are many possible responses. One, as noted in the quotation above, should be to base any new initiative on assessments already in use, at least for reasons resulting from human resources capacity. However, as will become clearer in the next two sections, the reasons must be based on the specific goals of the as-sessment. For example, is it sufficient to know that there are reading problems in a population of fifth-graders in a given country or demographic group? Would the ministry like to know why, or when this problem began, or even how to begin to fix it? If so, then a closer look at new reading assessments will be required. Chapters 5 and 6 provide an in-depth review. Further, what about cost? Can a ministry afford to add new costs to already constrained budgets? Consideration of the full variety of costs, across a wider range of assess-ment options would seem essential. Chapter 7 helps to move in that direction. Choice is never easy, and the temptation to continue on in the footsteps of one’s predecessors is real, and at times efficacious. Yet, the alternatives can far outweigh simple maintenance of a previously used assessment regime, and may be both more informative and less costly in the process.
120. Braun & Kanjee, 2006, p. 25.

70 / Testing reading in children
5. Testing Reading In Children
Reading assessment is a vital part of successful learning because effective instruction needs to be calibrated as much as possible according to students’ knowledge, skills, and inter-ests. Successful teachers around the world use reading assessments for many purposes. Teachers might use high-stakes national examinations or norm-referenced achievement tests to identify students for promotion, scholarships, and recognition. They might use grade-level end-of-year examinations to determine placement and promotion in schools and classes. In high-achieving schools (most often in wealthy countries), teachers may use individualized informal assessments at the start of the school year to identify if and what students can read and write, as well as oral reading tasks to become familiar with students’ abilities to decode words and read quickly and with expression. They may use skill tests to diagnose strengths and weaknesses, and they might observe comprehension strategies dur-ing daily reading. In addition, they might design self-assessments so students can monitor their own progress. Some teachers use journals to assess changes in children’s handwriting, reading interests, and phonetic approximations to words. With many different kinds of assessments used for many different purposes, successful teachers in today’s schools, irrespective of country, need to be knowledge-able about when and why to use the various assessment tools and techniques.121
Why Reading?
The ability to read and understand a simple text is one of the most fundamental skills
a child can learn. Without basic literacy there is little chance that a child can escape
the intergenerational cycle of poverty. Yet in many countries, students enrolled in
school for as many as 6 years are unable to read and understand a simple text.122
Reading, a core indicator of the quality of education, is an essential and early part of the curriculum in schools the world over. In most countries, poor reading in primary school is among the most powerful predictors of future disadvantage in terms of edu-cational, social, and economic outcomes because literacy is the gateway to advance-ment and job opportunities. For example, analyses of job requirements in the United States between 1969 and 1998 showed a decrease in routine manual labor skills and
121. Shepard, 2000.122. RTI, 2009, p. 1.

Smaller, Quicker, Cheaper / 71
a corresponding increase in skills related to problem-solving and communication.123 The global shift toward knowledge-based economies requires more literate workforc-es, and reading provides a crucial foundation for further education, even though this trend may not be easily discernable in poor villages in LDCs.124
The Science of Reading Acquisition
“Science is built up of facts, as a house is built up of stones; but an accumulation
of facts is no more a science than a heap of stones is a house.”125
Most current theories about reading are based on the study of the English language in OECD countries.126 In recent decades, the debates within the field of reading science have focused on understanding how English language reading is acquired. Only a modicum of work has been done on other (mainly European) languages, with a dearth of research on non-European languages in developing countries. Thus, current theories of reading, mainly built on research in OECD countries, may not be fully appropriate or applicable for contexts in LDCs with distinctive, and often multiple, languages and orthographies. Some features of the theories about reading may be universal, but many researchers and educators believe that such theories need to be adapted to take into account the varieties of cultures, lan-guages, orthographies, experiences, family situations, and local school contexts.127 In the review that follows, this cultural and linguistic diversity must be acknowledged. At the same time, it is nonetheless possible to make reasonable sense of the global research on reading, even while acknowledging that the state of research is still formative and incomplete.
Well-supported and Poorly-supported Environments
Whether in a developing country or a wealthy country, children may grow up in widely different contexts, even in the same national boundary. There are chil-dren in urban Denver, Dusseldorf, Dhaka, and Delhi who have parents with little or no education, have few literacy resources available, have teachers who do not know much about teaching reading, or speak a language at home that is different from that taught in school. These children live in poorly-supported
123. Levy & Murnane, 2004.124. OECD, 1997.125. H. Poincaré, c. 1905.126. Share, 2008.127. For a useful review of issues of universality in reading, see Perfetti (2003).
72 / Testing reading in children
(literacy) environments (PSE).128 Most of these children reside in developing countries or in poverty. Similarly, in these same cities and countries, it is possible to find children who grow up in educated families, go to good schools with experienced teachers, and have a variety of text (and computer-based) materials in their homes. These children are from well-supported (literacy) environments (WSE). Most of these children live in higher income countries, such as in the OECD. Much variation can exist between PSEs and WSEs, but the distinction is important since the idea of less-developed versus industrialized countries does not describe adequately the variety of literacy (and educational) environments in which children grow up. PSEs and WSEs can be used to better determine why it is that some children learn to read well, while others do not. The broad point here is that some of the classic divisions in comparisons between poor and rich countries tend to mask the very large variations (and inequalities) in reading achievement that may exist within countries.
The Context of Early Acquisition
[In] Francophone Guinea, only one out of 10 students knew the entire alphabet
by the end of grade 2, and on average, students could read 4 of the 20 words
presented... Only 25 percent of children in grade 1 and 45 percent of grade 2 chil-
dren sampled in Peru were able to read a single word … Without fluent reading,
students cannot learn from textbooks or respond reliably to standardized achieve-
ment tests. Poorer children fall behind in grade 1 and usually cannot catch up.129
In the industrialized world (and in WSEs more generally), three and four year old children typically listen to stories that are read or told by adults, and parents and children often ask questions as they construct meaning together from books. Children also recognize environmental print in their surroundings, begin to scrib-ble and write, rhyme words, play language games, and recognize familiar words such as their own names—all by four to five years old.130 These precursors to literacy can be regarded as cognitive (or meta-cogni-tive131) concepts and skills (or ‘emergent’ literacy activities) that approximate con-
128. The term “literate environment” or “literacy environment” has been used in a variety of ways; see Easton (2010) for a recent review. As he points out, most such designations have been very poorly defined, if defined at all. In the present context, PSE and WSE contexts are mainly used to distinguish a whole array of factors that exist across and within countries. While listed as a dichotomous description, it should be understand that this is not only a continuous variable, but one the that must be a multivariate composite term. Here it is used as a rough estimate of the varying types of contexts that surround children across the world.129. Abadzi, 2008, p.4.130. Snow et al., 1998.131. Metacognitive strategies typically precede actual reading skills, because they can entail childrens’ understanding of reading and text. But there is sometimes confusion about the difference between skills and (metacognitive) strate-gies. In a recent review, Afflerbach et al. (2008) state that: “Reading strategies are deliberate, goal-directed attempts to control and modify the reader’s efforts to decode text, understand words, and construct meanings of text. Read-ing skills are automatic actions that result in decoding and comprehension with speed, efficiency, and fluency and usually occur without awareness of the components or control involved.” (p. 368).
Smaller, Quicker, Cheaper / 73
ventional reading and writing, but they are usually not taught directly to preschool-ers.132 In these contexts, children’s early approaches to literacy are embedded in parent-child interactions that are mainly social and affective experiences. Bedtime reading is common in some WSEs, but there are important cultural differences. For example, in many Asian countries parents engage more in didactic reading in-struction with their children.133 In the poorest countries of the world, where books are less available in the home, and where both parents are likely to be illiterate or low-literate (Table 5.1), young children are often deprived of these opportunities to learn using text.134 Nonetheless, it is the frequency and quality of literate interactions that es-tablish different pathways for children during the years prior to schooling—and these can vary widely in families the world over. Thus, when children begin school, there is a remarkable diversity in their skills and experiences, whether, in rich or poor countries, in PSEs or WSEs. In most industrialized countries, some children begin school know-ing the alphabet, writing familiar words, and reciting the text of well-known books, yet other children do not. Research has shown that children need a variety of skills, concepts, and experiences in order to begin reading. In general, children who have more literacy experiences early have a head start on their peers in learning to read.135
The Components of Reading Acquisition
The process of early reading development has been the subject of a wide array of the-ories, studies, and claims that have resulted in a confusing mixture of opinion and policy across the world. No one theory of reading can be said to be ascendant in this (sometimes hotly debated) territory, but there is a convergence of findings, especial-ly on the first steps toward reading acquisition. Over the past decade, meta-analyses have been undertaken (mainly in the United States136) that have found five essential components to reading acquisition: the alphabetic principle, phonemic awareness, oral
132. There are, of course, many other cognitive skills that develop naturally in normal young children. One of the most commonly cited is that of recognition memory skills, which develop in children from an early age (Wagner, 1980) and that are relatively invariant across cultures.133. Mee and Gan (1998) found that only 31 percent of Singaporean parents read aloud to their children, but 69 percent of parents try to teach their children how to read at home. Furthermore, 66 percent of parents bought mock examination materials to use with children who are learning to read.134. Of course, this is not to say that meta-cognitive skills are missing in children and families in PSEs. Story-telling through oral (non-print) recitations have a long history in nearly all cultures, and have (and have had) a particularly prominent place in non-literate (non-print) societies (see Vansina, 1965, for an early reference). Research on the role of text-based story-telling is substantial in the United States (for example, Heath, 1982), but less is available on the role of oral (non-print) story-telling as related to reading development in LDCs (or PSEs).135. See Adams, 1990, for a useful review.136. In the United States, under the auspices of the National Academy of Sciences, the U.S. National Reading Panel (2000) undertook a comprehensive review of a large body of research on skills and experiences that influence beginning reading. The authors identified three obstacles to skilled reading that influence young children: difficulty using and understanding the alphabetic principle, failure to transfer comprehension skills of spoken language to reading, and lack of motivation for reading. This national report was highly influential in shaping U.S. educational policies on reading.

74 / Testing reading in children
reading fluency, vocabulary, and comprehension.137 Each of these components is briefly described because consensus is building within the reading profession that these com-ponents (even globally138) comprise the foundation for instruction, interventions, and reforms in educational practices in curriculum, instruction, and assessment.
The Alphabetic Principle: Knowledge of Letter Names and SoundsIn OECD countries, most children learn to identify the names and sounds of some letters of the alphabet before they begin formal schooling. By the middle of first grade, these children already know the entire alphabet.139 They learn such skills
137. These five components may be thought of as necessary, but not sufficient. Clearly, as noted earlier, there are a wide variety of environmental (including informal and formal instructional) variables that impact reading acquisition. Thanks to A. Gove (personal communication) for pointing this out.138. There are some exceptions. As pointed out later in this section, orthographies can place very different empha-ses on the roles that these different components play. See also, August and Shanahan (2006), for research on learning to read in a non-native language.139. For example, Morris, et al. (2003) used a task of identifying 15 letters in upper and lower cases and reported that children knew about half of them at the beginning of kindergarten and all of them by the end of kindergarten.
TABLE 5.1. Estimates of adult illiterates and literacy rates (population aged 15+) by region, 1990 and 2000-2004
Change from 1990 to 2000–2004
Number of illiter-ates (thousands)
Literacy rates (%)
Number of illiterates
Literacy rates
1990 2000-2004
1990 2000-2004
(thousand) (%) (percent-age points)
World 871,750 771,129 75.4 81.9 -100,621 -12 6.4
Developing coun-tries
855,127 759,199 67.0 76.4 -95,928 -11 9.4
Developed countries 14,864 10,498 98.0 98.7 -4,365 -29 0.7
Countries in transition 1,759 1,431 99.2 99.4 -328 -19 0.2
Sub-Saharan Africa 128,980 140,544 49.9 59.7 11,564 9 9.8
Arab States 63,023 65,128 50.0 62.7 2,105 3 12.6
Central Asia 572 404 98.7 99.2 -168 -29 0.5
East Asia and the Pacific
232,255 129,922 81.8 91.4 -102,333 -44 9.6
South and West Asia 382,353 381,116 47.5 58.6 -1,237 -0.3 11.2
Latin America and the Caribbean
41,742 37,901 85.0 89.7 -3,841 -9 4.7
Central and Eastern Europe
11,500 8,374 96.2 97.4 -3,126 -27 1.2
North America and Western Europe
11,326 7,740 97.9 98.7 -3,585 -32 0.8
Note: Figures may not add to totals because of rounding.Source: Statistical annex, Table 2A.Adapted from UNESCO, 2005, p. 63.

Smaller, Quicker, Cheaper / 75
as visual discrimination of symbols, remembering letter names and sounds, and coordinating visual-auditory relations. These skills are incorporated into the alpha-betic principle as a foundation for beginning reading. Children’s knowledge about letters and letter-sound relations often predicts subsequent reading.140 However, most of the evidence for the predictive power of letter-naming and letter-sounding is correlational, rather than experimental, such that early mastery of the alphabetic principle also signals many other opportunities to learn. Initial differences may be temporary and because of faster initial learning, does not appear to directly facili-tate later reading comprehension.141
Phonemic AwarenessPhonemic awareness involves the ability to recognize and manipulate phonemes in spoken syllables and words. Understanding the relations among sounds (phonemes) and letters (graphemes) in print is a decoding skill,142 and clearly depends on phone-mic awareness. Knowing the sounds associated with letters helps children to iden-tify the distinct phonemes associated with printed text. By age five, most English-speaking children in OECD countries can identify onset-rime patterns—such as c-at, h-at, and f-at—that are the bases for initial rhyming. Later, they develop the ability to segment words into phonemes and to blend separate sounds into words. The same skills can be applied to printed or spoken words. These are the basic analytic and synthetic aspects of decoding that follow from phonemic awareness. Many research studies have found significant concurrent and predictive correla-tions between phonemic awareness and reading acquisition.143 The awareness that words can be divided up into phonemes (that is, phonemic awareness) is crucial for beginning readers. Nonetheless, there have been recent challenges to the direct causal role of phonemic awareness for improving reading.144
140. Lonigan, et al. (2000) state, “… knowledge of the alphabet (i.e., knowing the names of letters and the sounds they represent) at entry into school is one of the strongest single predictors of short- and long-term success in learn-ing to read …” (p. 597).141. See Paris (2005) for a research review, primarily based in OECD countries. Conversely, a failure to learn the alphabetic principle (and how to name letters) will remain a large barrier for children—most obviously in PSE contexts where the alphabet may not be learned completely.142. Decoding skill is also sometimes called “phonics.”143. See, e.g., Bradley & Bryant, 1983; Juel, et al., 1986; Rayner, et al., 2001.144. Some researchers suggest that the phonemic awareness link is mediated by letter knowledge (Blaiklock, 2004) while some maintain that no causal link has been demonstrated in previous research (Castles & Coltheart, 2004). The U.S. National Reading Panel (NRP; 2000) found nearly 2,000 citations to phonemic awareness but conducted their meta-analysis on only 52 studies that met their criteria. Those studies showed that training in phonemic awareness improved children’s reading and spelling. Furthermore, the NRP concluded that all varieties of systematic phonics training, including analogy phonics, analytic phonics, embedded phonics, phonics through spelling, and synthetic phonics produce significant benefits for elementary students who have difficulty reading. The NRP advocated the in-tegration of phonics instruction in a total reading program that also emphasizes the other four essential components. In contrast, Georgiou et al. (2008) reported that “phonological awareness either may not be an important predictor of reading … or may be important but only during the first 1 or 2 years of schooling.” Similarly, in an important review, Slavin et al. (2010) argued in the U.S. context that phonemic awareness is not “reading” per se, and may be an artifact unrelated to learning to read. Others (e.g., Berninger et al., 2010a) have argued that there are multiple kinds of linguistic awareness (also including orthographic and morphological, in addition to phonological), and that a focus on the latter can be misleading. Nevertheless, as with the alphabetic principle, in PSEs and in more transparent scripts, children who do not master phonemic awareness early in schooling may remain at a serious disadvantage.

76 / Testing reading in children
Oral Reading FluencyFluent oral reading, which is the coordination of several automated145 decoding skills, is developed through practice. Fluency includes reading a text quickly, accurately, and with intonation. Measuring children’s oral reading accuracy has a long history of practical use in informal reading inventories that collect miscues or running records of children’s oral reading.146 Reading rate is an indicator of automatic decoding, so children who can read faster often identify words more accurately and have more cognitive resources left over for reading with expression and comprehension. The use of reading rate as a measure of fluency also has a long tradition in special education under the name of curriculum-based measurement.147 A central measure in curriculum-based measurement is oral reading fluency (ORF), defined typically as the number of words read correctly in one-minute samples of text drawn from the student’s curriculum. The measure seeks to use text from the regular curricu-lum to provide outcome indicators that can be monitored over time for both diag-nostic and accountability functions. ORF is a main feature of the Dynamic Indicators of Basic Early Literacy Skills (DIBELS), a battery of early reading assessments.148 With the ORF measure, it appears relatively easy to assess how many words children read correctly in a minute and compare the rates to grade-level norms. Nonetheless, the data from ORF need to be interpreted cautiously because speed is only one index of reading proficiency. Moreover, the assessment itself poses some significant problems in settings where test administrators have limited experience.
VocabularyVocabulary skill includes understanding words in either oral or written form; knowledge in both modalities improves reading comprehension in any lan-guage. Because vocabulary is related developmentally to oral language skills, vocabulary growth during preschool years helps establish a pathway for read-ing during schooling.149 In addition, vocabulary (both receptive through un-derstanding, and expressive through speech production), predicts early read-ing skill150; the number of different words a child understands, as well as the number she or he speaks, helps with word decoding efforts and may facilitate growth of phonological awareness.151
145. See discussion further below on “automaticity” in the discussion of comprehension.146. Clay, 1991; Paris & Carpenter, 2003. Clay (2000) also did seminal work on a reading measure called Concepts about Print (CAP), which has been used in some EGRA studies.147. Deno, et al., 1982; Fuchs & Fuchs, 1999.148. In DIBELS, see Good & Kaminski, 2002; ; ORF is also in the EGRA toolkit (RTI, 2009).149. Hart & Risley, 2005.150. Storch & Whitehurst, 2002151. Dickinson et al., 2003. Also, the U.S. National Reading Panel (2000) reviewed 50 studies drawn from a potential pool of 20,000 citations on vocabulary, and they concluded that direct instruction in vocabulary facilitates reading comprehension.

Smaller, Quicker, Cheaper / 77
In WSE contexts, repetition, multiple exposures to words, computer tech-nology, and learning experiences help to enhance vocabulary acquisition. Naturally, the lack of such inputs severely constrains a child’s vocabulary competencies in any language. Research shows that initial instruction on vocabulary and related concep-tual content can facilitate children’s subsequent reading comprehension. Similarly, instruction based on word study can increase children’s understanding of orthogra-phy, spelling, and vocabulary.152
Reading ComprehensionThe development of comprehension skills is a long-term developmental process,
which depends on rich word, text, and language experiences from early in life;
learning how to decode; becoming fluent in decoding, in part, through the de-
velopment of an extensive repertoire of sight words; learning the meanings of
vocabulary words commonly encountered in texts; and learning how to abstract
meaning from text using the comprehension processes used by skilled readers.153
Understanding the meanings of printed words and texts, the core function of literacy, allows people to communicate messages across time and distance and express themselves beyond gestures. Making sense of printed words and commu-nicating through shared texts with interpretive, constructive, and critical think-ing is perhaps the central task of formal schooling around the world. Without comprehension, reading words is reduced to mimicking the sounds of language, while repeating text is nothing more than memorization and writing letters and characters is simply copying and scribbling.154 Comprehension, which involves many different levels of understanding, is difficult to define and reliably measure. This complex process is influenced by vo-cabulary knowledge and instruction, the thoughtful interaction between reader and text, and the abilities of teachers to equip students with appropriate reading strate-gies. The effective use of reading strategies becomes more important as texts become more complex and children’s goals for reading expand. Instruction in the early grades helps children learn to read mostly by decoding words in print, but by second grade (in WSE contexts, later in PSE contexts), they are taught to read to learn for a variety of purposes.155 Research has identified seven types of instruction that foster reading comprehension, especially if taught in combinations as multiple-strategy approaches:
152. Beck et al., 2002; Bear et al., 2004. There is almost no research on this dimension in LDCs.153. Pressley, 2000, p.556.154. Yet, in some PSE contexts, especially in developing countries, teachers may accept this form of reading behavior as a sufficient indicator of reading development. Indeed, the development of new hybrid assessment tools, such as EGRA, are important precisely, because they can and should disaggregate “mimikry” from comprehension at the individual level. Dubeck (personal communication) rightly points out that there are “writers” who do not compre-hend, but can be very good at accurate transcription of text from oral language. One example of this may be seen in Islamic education, where Arabic is sometimes transcribed without understanding (Wagner, 1993).155. See Chall (1967, 1996), on the stages of reading.

78 / Testing reading in children
comprehension monitoring, cooperative learning, use of graphic and semantic or-ganizers, question answering, question generation, story structure, and summariza-tion.156 When children use these strategies and skills, they can understand and re-member better the meaning of texts that they read.
Automaticity of Reading
Most theories of reading acquisition distinguish processes related to decod-ing print to sound from processes related to making sense of the meaning of text (comprehension). One link between these two general classes of process-es is the notion of automaticity. In simple terms, it denotes when readers can automatically (that is, quickly and effortlessly) recognize the sounds of letters and words, as well as automatically recognize familiar words so as to increase their reading speed and accuracy.157 This is fluent oral reading, which is impor-tant because after basic processes (such as decoding and word recognition) be-come automatic, readers have more mental capacity (such as, working memo-ry) and have time to focus more attention on the meaning of the text. When beginning readers spend excessive time and energy trying to figure out the sounds and words in text, they often do not recall or remember the words they have just read.158 Fluent readers commonly remark that they read nearly effortlessly and are unconscious of the various component processes that go into extracting meaning from print. Automaticity results mainly from a great deal of practice in reading, often measured in years, and thus it does not happen all in one moment or quick-ly.159 However, it can result from the application of simple rules and strategies for decoding. In English, young readers who can recognize onset-rime patterns such as d-og, l-og, f-og, can readily pronounce unfamiliar words such as c-og, or even nonsense words such as m-og. Assessments that measure how fast beginning
156. U.S. National Reading Panel (2000).157. An automatic process is typically judged by the speed with which it occurs. Thus, in order to determine whether written words are automatically accessed on a reading test, it is important to take processing speed into account. This has been done mainly in studies conducted in languages with more transparent orthographies, such as in Spanish, Ital-ian, German, or French, rather than in English. Automatic written word identification is a very fast process that requires only a few milliseconds in skilled readers. In studies that took into account the latency of vocal responses (that is, the delay between the appearance of the word on the computer screen and the start of its pronunciation by the participant) the differences between good and poor readers are about 200 milliseconds per word. Such a delay corresponds to about one minute of difference between poor and good readers for the reading of a text of 300 words. See Sprenger-Charolles et al. (2006) who suggest that this lack of automaticity is one of the main impediments in skilled reading.158. Of course, the notion of “excessive time” is a relative one. Indeed, this is one area where the research based on OECD countries, and mainly on English, may impact not only on theories of reading, but also on how reading should be assessed. There is some evidence gathered from recent EGRA studies that suggests that even “slow” readers can read with high comprehension, and that “fast” readers may read with low comprehension. This is most evident when young readers are learning to read in a second language. (A. Gove, personal communication, 2009).159. Some have suggested that riding a bicycle is (metaphorically) like reading with automaticity. While this makes sense given the relative sense that once you are riding, you can focus on other aspects of the ride (such as the wind or scenery). However, the metaphor gives the impression that automaticity comes easily and quickly, as in learning to ride a bike. It is here that the metaphor is less applicable. As Fuchs et al. (2001, p. 240) note: “Oral reading fluency develops gradually over the elementary school years…,” with similar implications about automaticity.

Smaller, Quicker, Cheaper / 79
readers can identify letter sounds, sight words, and nonsense words are, therefore, measures of automatic decoding skill. In general, measures of the relative mastery and automaticity of decoding among beginning readers are good predictors of early success at reading.160
First and Second Language Reading
…(L)iteracy development is multiply determined; successful reading and writing
in the later elementary and secondary grades is not possible without high levels
of language proficiency, access to large stores of knowledge, and control over the
local cultural norms of communication.161
For many decades, educators and others have debated the nature and acquisition of second language reading, similar to discussions about bilingualism. Such debates range from “linguistic confusion” in childhood learning if a child speaks more than one language in the home, to a similar controversy about whether learning to read in a second language should come earlier or later in the school curriculum. Added to the tension are the politics associated with language choice in countries where such matters may be intensely contested. Although these debates are beyond the scope of the present review, assessments of reading in a person’s first language (L1) and second language (L2) are very much part of the present discussion, because so many children in LDCs are confronted with this multilingual reality with far greater frequency than in most OECD countries.162 Beyond the politics of language choice and bilingual education, a growing science exists that encompasses both the social and cognitive dimensions of learn-ing—and learning to read—in more than one language. Among sociolinguists and historians, the conversation often revolves around respect and resistance. There is the respect that children (and parents) feel when their mother-tongue (L1) is used in school; and resistance (for some) when that L1 is not used in school.163 From a cognitive learning perspective, the conversation revolves largely around the concept of transfer. To what extent do skills acquired while learning a first language (orally or in written form) transfer to a second language? Over the years, the preponder-ance of research findings tend to support the “additive” or “interdependent” notion
160. See Stanovich (2000) on the importance of automaticity in reading. Even so, good reading predictors, such as automaticity, may be context and language dependent. More generally, research on cognition and automaticity pro-vides a mixed picture: the all-or-none conception of automaticity has been challenged by studies showing a lack of co-occurrence among central features of automatic processes. For example, reading researchers (such as Stanovich) have widely used the Stroop interference measure as a way to measure automaticity in laboratory experiments. Re-cent research suggests that automaticity is, in reality, not so automatic, and subject to numerous contextual factors. See Moors and De Houwer, 2006.161. Snow and Kang (2006), p. 76.162. The subfield of comparative reading acquisition is not new. Downing (1973), nearly three decades ago ago, published a major review on the acquisition of reading skills across wide variety of languages and orthographies.163. For reviews, see Hornberger (2003), and Snow and Kang (2006). On ethnographic perspectives, see Wagner, 2004.

80 / Testing reading in children
that L1 language and reading skills generally enhance L2 language and reading skills.164 Yet, there are many unresolved issues. When should teaching of L2 reading begin, and should that co-occur with curricular content in L2?165 One way to think about the transfer issue is to consider the distance be-tween the two languages and their contexts for learning.166 In Figure 5.1, three ge-neric types of contexts are shown. Model A (“ideal”) suggests harmony and balance among the home, child, and school. Model B suggests a relatively greater distance between home and school, indicating that perhaps an appropriate education policy would be to reduce the distance through a program of non-formal education or parent or adult literacy education. Model C describes a situation where the biggest distance is between the child and the school, indicating that a mother-tongue (or a bilingual) education program should be the focus. Although these models may not be so easily distinguished from one another, they provide one way to initiate discussion about how L1 and L2 should be approached in socio-political contexts.
164. See Cummins et al. (1994) on early work in this area, and more recently, Bialystok et al., 2005. Also see Koda & Reddy (2008) for a more nuanced approach that differentiates transfer by looking at specific components that appear most liable to transfer.165. Current debate in Sub-Saharan Africa is centered on whether pupils need three versus six (or other) years of pri-mary schooling in L1 to benefit from transfer to L2. See Alidou et al., 2006. There is little consensus on this issue as yet.166. Wagner, 2008.
FIGURE 5.1. A “distance theory” approach to bilingual education programs
Distance Theory: The ‘Reduction’ Approach
A. “Ideal” balanceB. Large School-Home distance
C. Large School-Child distance
Mother-tonguePrograms
Parent LiteracyPrograms
School SchoolSchool
Home HomeHomeChild ChildChild
From Wagner, 2009a.
Smaller, Quicker, Cheaper / 81
The measurement of L1 and L2 reading skills has its own challenges. The transfer issue is complex, and contains (at least) the following elements: L1 oral lan-guage skill, L1 reading skill; L2 oral language skill, L2 reading skill, background knowledge in both languages, processing strategies, and vocabulary skills. Further, cognate (and non-cognate) words in L1 and L2 will influence the process of L1 and L2 language and reading acquisition —a complex process indeed! In most situations children it seems that children can build on L1 (oral and written) skills, but also that there is great deal of variability associated with social and environmental variables.167 Research suggests that important differences depend on the whether the child has automatic word identification skills and adequate reading comprehen-sion: learners who start in L2 reading might catch up to L1 learners in word-level reading skills, but probably not in reading comprehension.168 Skilled reading com-prehension is quite dependent on oral language skills (and related knowledge and concepts), and this makes it difficult for L2 learners with modest oral L2 skills to catch up to L1 reading children. Conversely, well-developed oral proficiency in L2 has been found to be associated with strong reading comprehension in L2.169 Overall, the available evidence to date generally supports the notion that bilingualism and biliteracy can be additive, if the learner is allowed (via a good cur-riculum, an adequately trained teacher, and supportive environment) to build L2 skills upon an L1 foundation.170 In PSEs, these felicitous conditions are often not adequately met. Given that children in LDCs are often confronted with this com-plex learning situation, reading assessments need to measure both mother-tongue and second (or third) languages.
Orthographies, Reading and Spelling
Current international research on reading has begun to focus on the ‘transpar-ency’ versus ‘opacity’ of the orthography (writing system) as related to its relevant oral language.171 For example, Spanish is highly transparent because of due to the considerable consistency with which graphemes and phonemes are related. The grapheme ‘a’ systematically corresponds to the phoneme /a/. In contrast, English is relatively opaque since there are many inconsistencies in the grapheme-phoneme relationship. In English, the grapheme ‘a’, for example, corresponds to two different phonemes in the words cat and date. Interestingly, many (if not most) languages in
167. See discussion in Bernhardt, 2005.168. See Lesaux & Geva, 2006; Lesaux et al., 2006a; Wang & Koda (2007).169. See Crosson et al., 2008; Droop & Verhoeven, 1998. See also Crosson and Lesaux (2010) on the importnace of text-reading fluency for language minority (second language) learners reading in English, implying possible limits to the application of fluency measure when applying to second language learners.170. Good bilingual education programs can also result in cost efficiencies (e.g., Patrinos & Velez, 2009).171. See Sprenger-Charolles, 2003; Sprenger-Charolles et al., 2006; Ziegler & Goswami, 2006.

82 / Testing reading in children
developing countries use an orthography that is more transparent than English.172 Transparency is important in part because research indicates that reading skills are acquired at a faster pace in languages with a transparent orthography.173 Grapheme-phoneme correspondences (GPC) that are used to read are not always comparable to phoneme-grapheme correspondences (PGC) that are used to spell. In French, for example, GPC are more consistent than PGC: the ‘o’ as in “do” will always sound like the vowel /o/; however, there are multiple ways to write /o/: ‘eau’, ‘au’ and ‘o.’ The relation between GPC and PGC is asymmetric in the sense that reading a word is more straightforward than spelling a word. As a consequence, learning to read in French is relatively easier than learning to spell.174 In Sub-Saharan Africa, where English or French is frequently used as L2 in school, such variation in transparency (GPC or PGC) can create difficulties for early both reading and spelling (in English), and for spelling (in French). In sum, orthographies make a difference for children learning to read, especially at the inception of decoding skills in reading and for spelling acquisi-tion. These differences—based to date on research largely undertaken in OECD countries—are robust. What is missing is sufficient research that shows the im-pact of orthographies in indigenous languages in LDCs175 and evidence that the early advantages of transparent orthographies have a long-term impact. As not-ed, even though a useful predictor of precocious reading, early alphabet naming has little direct effect on learning to read.176 Similarly, variations in the apparent complexities of different languages have been found to have little impact on how
172. This may be due to the recency of the development of orthographies for most of the traditional Sub-Saharan African languages (for example, Swahili or Wolof); International Institute of African Languages and Cultures, 1930; see also Sebba, 2007.173. Seymour et al. (2003) compared early reading acquistion in 13 languages: English, Danish, French, German, Span-ish, and Portuguese, among others, and found that higher transparency led to more rapid decoding skill acquisition in L1 learners. See also a recent study in Spanish-speaking children in Spain where it is shown that the early master of de-coding leads to a regular progression in both the speed and accuracy of reading in children from kindergarten through grade 4. (Cuetos & Suarez-Coalla, 2009). Similar findings have been found for L2 learners (Geva & Siegel, 2000).174. Furthermore, regular words are read more accurately than pseudo-words, while they are not more easily written, particularly in French. See Alegria, & Mousty, 1996; Sprenger-Charolles et al., 2003.175. See, however, a recent study (Kim et al., 2008) on reading acquisition in Swahili (in Kenya), a relatively transpar-ent orthography, that used a number of reading subtests (similar to EGRA) to consider the role of reading fluency and other skills on reading comprehension. Generally, the results supported the importance of reading fluency (and decoding) in predicting reading comprehension skill.176. Such development differences in trajectory of learning based on orthographic differences are one of the reason why it is inappropriate to create benchmarks for early stages of reading across languages and orthographies.

Smaller, Quicker, Cheaper / 83
rapidly children master oral language across the world.177 Finally, in multilingual and multi-orthographic countries, there may be insufficient knowledge about which orthographies are used for languages in actual everyday usage.178
Developmental Trajectories: Predicting Failure and Success
Research suggests that the developmental trajectories of reading components fol-low different patterns and durations with some skills being more constrained in scope and time of mastery than others.179 For example, the alphabetic principle is acquired quickly compared to vocabulary and comprehension.180 Learning the names and sounds associated with letters in any alphabet is a small universe of knowledge when compared to learning new vocabulary words throughout one’s life.181 Phonemic awareness includes a larger knowledge base, but most children in WSEs learn the essential features of phonemic rhyming, segmenting, and blending in primary grades.
177. See Slobin (1986) and Snow (2006). In a recent study by Feng et al. (2009), it was shown that while there were some initial skill differences between beginning readers of English and Chinese (with very distinct and different orthog-raphies), nonetheless skilled (older) readers showed no differences in how fast they read. Feng and colleagues utilized sophisticated techniques to track eye movements (sacades) in order to study reading development and reading speed.178. In Senegal, the 2001 Constitution recognizes six national languages (Wolof, Seereer, Pulaar, Mandinka, Soninké, and Joola) in addition to French, the official language, while there are an estimated 30 languages in use in the country. The Ministry of Education has begun to elaborate curricula in these national languages and train pilot teachers for local language experimental projects at the primary school level. Even so, French continues to be the medium of instruc-tion in Senegalese schools at all levels. Wolof enjoys the status of a lingua franca in Senegal (spoken by more than 80 percent of the Senegalese, while only about 44 percent are ethnically Wolof; see McLaughlin, 2001). Senegalese primary school children provide an illustrative example of how a socio-linguistically complex environment and a lack of orthographic standardization present problems for literacy assessments in Wolof. In a series of government decrees (1968–77) the government mandated a written standard codification of Wolof based on a Latin orthography, the Ijjib Wolof, which was distinct in various ways from French spelling rules. This government decision elicited considerable debate, however, both from users of the Wolofal alphabet (based on Arabic script of the Wolof language; see Prinz, 1996) and scholars developing other indigenous Wolof alphabets. Even now, the government-mandated Ijjib Wolof orthography is seldom used within Senegalese popular culture and daily literacy practices (such as news publications, restaurant signs, religious pamphlets, comic books, and song lyrics), with some people preferring to write in Wolofal and others in the French orthography of Wolof. The coexistence in Senegal of various orthographies of Wolof (standard and French), alongside an Arabic script of Wolof, means that assessments aiming to use local languages face a complex task in creating reading assessments. Thanks to Cecile Evers (personal communication) for this helpful analysis.179. Paris, 2005. Constrained skills are also limited in variance, since the upper limit is fixed and is attained relatively quickly in WSEs.180. This relative speed is likely to be the case in both WSEs and PSEs, though confirmation is awaiting some of the new EGRA findings. Nonetheless, the learning of the alphabetic principle (and the alphabet) may be much slower in poor contexts in developing countries, as numerous EGRA studies have shown (RTI, 2009).181. Scarborough (1998) reviewed 61 beginning literacy studies (largely in the United States), and found that the strongest individual difference predictor of reading ability in first through third grade was letter name identification in kindergarten, across all 24 research samples measuring this variable. However, by first grade, letter name knowledge was no longer the strongest predictor of later reading ability, and was most often eclipsed by phonological process-ing skills, such as letter sound knowledge and phoneme synthesis and analysis tasks.

84 / Testing reading in children
Oral reading fluency is less constrained than alphabet knowledge but more constrained than vocabulary development because most children reach their asymptotic rate of accurate oral reading by fourth or fifth grade in WSEs. Thus, the component skills of reading vary in the universe of knowledge acquired and the duration of learning.182 What then predicts a child’s successful reading trajectory? For beginning readers (about four to six years old) in WSEs, the best predictors are knowledge of letter names and sounds and the ability to rhyme, segment, and blend phonemes. As children learn to decode text, their rate of ORF (that is, automatic word recognition) becomes a good predictor of later reading success. Among somewhat older children, reading comprehension scores predict achievement test scores.183 Thus, the predictive power of different reading component skills changes with respect to the outcome measures across time. Moreover, predictors of reading skill in primary grades (such as alphabet knowledge and oral reading fluency) are proxy measures for many learning experiences, such as exposure to print and language, early instruction from parents and teachers, and rich vocabularies. Thus, five-year-olds in WSEs who know the al-phabet better than their peers are likely to be better readers at seven or eight years of age, but the reason is not simply because of alphabet knowledge; it is a head start on many literacy experiences.184 Similarly, eight-year-olds (with two years of schooling) in PSEs in developing countries may still be learning the alphabet, a consequence that will make it difficult for them to master the other component skills of reading.
182. Fuchs & Fuchs, 1999.183. In the United States, for example, see Pearson & Hamm (2005).184. There appears to be a developmental disjunction between ORF and comprehension, because the relation is strongest for beginning and struggling readers (Paris, 2005). With increasing age and reading skill, older children and better readers exhibit more variable relations between ORF and comprehension. For example, Fuchs et al. (2001) noted a decline in the importance of ORF with increasing age. Some researchers claim, nonetheless, a strong relationship be-tween oral reading fluency and comprehension (for example, Abadzi, 2008; RTI, 2009; Good et al., 2001). It may be that the robust correlations between ORF and reading test scores reflect general developmental differences among good and poor readers, rather than a causal connection between ORF and comprehension. In this view, oral reading rate can be a very useful proxy measure for many concurrent developmental differences, including automatic word recognition, vocabulary knowledge, content knowledge, motivation, test-taking skills, intelligence, contextual factors, and so forth. Slow readers in first and second grade (especially in PSE contexts) may differ from fast readers on many dimensions, and their oral reading rate is only a proxy for the differences that actually mediate reading comprehension. Labored decoding among beginning readers (as found in PSEs by EGRA) may also overload working memory (Abadzi, 2008) and prevent skilled comprehension strategies. ORF measures should be used, in this perspective, as indicators of automatic decoding, rather than as measures of comprehension or instructional objectives. Indeed, some have suggested that ORF problems are caused by comprehension problems as well; “fluency problems [may] simply reflect… slowness in executing a task or reflects timing problems for coordinating multiple processes in the learner’s mind; dysfluency may be the result, not the cause, of a reading problem (Beringer et al., 2010b)

Smaller, Quicker, Cheaper / 85
Assessments of Reading
Two main types of reading assessments exist: those that can be taken in written form (LSEAs, for example) and are limited to those who already have mastered enough reading skill to read and understand instructions and fill in via writing a test form; and those that are designed for beginning readers who cannot take paper and pencil tests—that is, they must be tested orally. Each of these types of tests is described below, while illustrative examples are provided in Annex B. Written Reading Assessments
As described in Chapter 4, standardized tests produced by commercial publishers or na-tional and international agencies stand as the most accepted scientific and objective in-dicators of students’ reading skills.185 In WSE contexts, students who do poorly may be given special assistance during the school year or in a summer school. In PSE contexts, children who do poorly are most often retained in grade, or drop out from school, or fail to graduate from primary school. Thus, reading tests can significantly affect students because retention in grade and failure to graduate from school often have life-long nega-tive effects. On the other hand, high test scorers may advance to post-primary school, receive possible placement in advanced classes, or even receive financial scholarships. Oral Reading Assessments
More than 50 years ago, educators designed informal reading inventories (IRIs) to assess multiple aspects of young children’s oral reading skills in authentic situations—that is, children reading texts with teachers in classrooms. One form is called a run-ning record and involves a teacher recording the accuracy of a child’s oral reading.186 Miscue analysis187 is similar. In both situations, teachers analyze the kinds of difficul-ties children have during oral reading. Today, commercial publishers and education departments worldwide have created many IRIs. As children read text, teachers ob-serve children’s strengths and weaknesses, they ask questions to probe understand-ing and knowledge, and they record quantitative and qualitative information. The assessments are informal and diagnostic, because the IRI administration is tailored to each student and because the observations do not emphasize uniform or comparative
185. In the United States, the focus on testing includes all academic achievement tests that are used to make impor-tant decisions about the evaluation of primary and secondary students. Such tests are administered in every state and many states have created their own achievement tests. The state tests are nearly all criterion-referenced tests in contrast to norm-referenced commercial tests.186. Clay, 1991.187. Goodman & Burke, 1972.

86 / Testing reading in children
data. IRIs usually include assessments of oral reading accuracy,188 grade-level word lists (sight vocabulary), comprehension questions, retelling rubrics, and passages from pre-primary through middle-school levels. Some include procedures for assess-ing prior knowledge, listening comprehension, repeated readings, or silent reading. Some of the tasks in EGRA are similar to this long tradition, although EGRA is not intended for diagnostic use at the level of the individual learner.189,190 In industrialized countries, the most important reason for using IRIs with beginning readers is to detect children’s difficulties so that extra instruction can be directed to those skills. Too often, children’s early reading difficulties go undetected until second or third grades, a situation exacerbated historically by large classes in primary grades, little time for individual student assessment, and few available assessment tools for teachers. Early detection can lead to earlier remedial help (if and when such resources are available) for a variety of reading skills. A second main reason for using IRIs is to document growth in children’s reading. IRIs are quick, flexible, teacher-controlled, and student-centered—all positive characteristics of classroom assessments. IRIs can provide useful information to students about their progress, to parents about achievement and skills that need improvement, and to teachers about appropriate instruction and texts to provide—all positive conse-quences for stakeholders. A third reason for IRIs—and an original raison d’etre for EGRA—is the possibility that results can inform policy makers of school-wide (or even system-wide) problems in reading achievement at an early stage. EGRA Reading Assessment
OverviewThe Early Grade Reading Assessment (EGRA) was designed to provide a battery of assessments on basic reading skills for international use by developing countries to monitor the status of early reading in primary schools. As described by the authors, the EGRA toolkit is designed to be a “sample-based system diagnostic” measure, whose main purpose is to measure “student performance on early grade reading skills in order to inform ministries and donors regarding system needs for improving instruction.”191
188. Reading accuracy is a more salient factor in less transparent orthographies such as English. Use of reading accu-racy in transparent languages (such as Spanish or Swahili) would be less reliable since ceiling effects will occur earlier because of advantages in decoding.189. Some recent studies in Liberia and Kenya are using EGRA tools as part of diagnostic interventions at school and individual levels. (Gove, 2010).190. It also may be noted that there is an important distinction between tests where the “instructions are given orally vs. those in writing, rather than whether the child’s response is oral vs. written. We are successfully using a number of group tests with Grade 1 children [in East Africa] where they are given simple written responses (i.e., check or cross) after listening to oral instructions.” M. Jukes (personal communication, 2010).191. RTI, 2009, p. 6.
Smaller, Quicker, Cheaper / 87
The rationale, theory, and methods of the EGRA Toolkit are based largely on the same research as the well-known U.S. large-scale reviews on reading dis-cussed earlier. The toolkit reiterates the importance of five essential skills for begin-ning reading.192 The assessment tools in EGRA were initially based on those devel-oped in the DIBELS assessments, widely used in the United States. The emphasis on component skills in EGRA, such as alphabet knowledge and decoding, has allowed this assessment to be adapted to diverse languages in some of the world’s poorest countries. EGRA is currently being used in more than 35 developing countries.193 It includes multiple subtests of skills and knowledge that have been shown to predict reading achievement in primary grades.194 The EGRA battery seems most appro-priate for beginning readers (across an age range that is yet to be specified) with a variety of skills, and can provide useful initial information for policymakers who want to compare students and schools across regions or levels. Three sources of criticisms of EGRA are worth noting. One problem is the relative lack of attention in EGRA to early language skills (including vocabu-lary) and opportunity to learn (OTL) about language and literacy during early childhood. A second concern is the priority placed on decoding skills. Skills related to alphabet knowledge, concepts about print, phonemic awareness, and ORF are usually the main skills assessed in beginning reading, with much less emphasis on vocabulary and comprehension. A third concern is the lack of differentiation in the developmental trajectories among various reading skills. Most skills related to decoding are learned more rapidly and mastered to the same levels compared to slower developing vocabulary and comprehension skills. Thus, changes in short-time periods are more rapid because of learning or interventions on some skills related to decoding, rather than unconstrained skills such as vocabulary. As a con-sequence, some studies show serious floor and ceiling effects in the EGRA results and greater changes in decoding skills over brief interventions.195 A general problem with EGRA, as with other assessment batteries of begin-ning reading, is that the prescriptions for policies and interventions are derived from assessments of very basic and necessary precursors to reading. Children must learn the alphabet, phonics, and fluent decoding, but those skills alone do not assure pro-ficient reading. If these are the main benchmarks for evaluating reading in a school, region, or nation, they will yield some information about the minimum skills for
192. RTI, 2009; National Reading Report, 2000; Snow et al., 1998. Jukes et al. (2006) also has contributed to the development of EGRA-like assessments.193. While EGRA has been tried out in 35 countries, it has been adopted for more significant national use in about five countries as of this writing (2010). L. Crouch, personal communication.194. Data on prediction of subsequent reading achievement are mainly on studies on DIBELS undertaken in the United States and in English (Roehrig et al., 2007), and the value of ORF, in particular, has been confirmed in statisti-cal analyses. But there is also evidence, from English as a second language learners, that ORF is not a strong predic-tor (Riedel, 2007).195. See Chapter 6 for further discussion on ceiling and floor effects in EGRA studies. An initial EGRA study in Peru that discussed such issues was Abadzi et al., 2005.

88 / Testing reading in children
decoding text to sound, which is important. However, the educational prescriptions that follow would have teachers teach these skills first (or primarily), but may lead to a failure to promote language- and literacy-rich environments, the help of adults, and the opportunities to learn and practice literacy. It is important to acknowledge the narrow range of assessed skills in EGRA, and supplement these skills with broader measures, especially as children advance in age and competencies. EGRA users have begun to accommodate a larger array of measures in some countries by adding additional tasks such as “orientation to print” where the child is asked a number of questions related to his or her understanding of the ba-sic rules of print, including identifying where to begin reading on the page, where to read next, and where to read when at the end of a line.”196 Nearly all children learn these rules rather quickly once in school, so this variability occurs only for a limited time among beginning readers.197 Further studies are being conducted on the contexts with varying opportunities to learn.198
Purpose and Uses of EGRAThe use of EGRA in the cycle of early learning is sensible and analogous to the use of DIBELS in other countries (especially in English in the United States). However, a potential problem is the narrow range of skills assessed and the narrow range of sub-sequent instructional prescriptions. For example, there is a tendency to focus on ORF as a key benchmark of learning to read. It may provide useful information as children learn to decode, but once decoding reaches 80 to 100 wpm correct, the measure may be less useful at discriminating good and poor comprehenders.199 At present, EGRA is mainly useful for early skill detection and is relatively less useful for subsequent developmental interventions. Furthermore, a prominent focus on reading speed in both assessment and instruction may send an inappropriate message to beginning readers (and teachers and ministers of education) that fast reading is the main goal.200
Using EGRA to Identify System Needs The EGRA Toolkit indicates a rapid growth in ORF as children progress from reading 20 to 100 words per minute during first and second grades in a U.S. based study.201
196. RTI, 2009, p. 21.197. Similar instruments were developed for use with young Moroccan children, where print orientation (follow orthographic rules from right-to-left) was found to be an early predictor of reading in Arabic (Wagner, 1993). Also, see Clay (2000).198. See in Chapter 6 the work of DeStefano and Elaheebocus (2009).199. Fuchs, et al. (2000, cited in Fuchs, 2001, p. 247). Also, see Paris et al. (2005); and Paris & Hamilton (2009).200. There is also some concern with ORF that it may result in ‘barking at print’ (Samuels, 2007), in that children who are told to read a quickly as possible may read without understanding. Kudo and Bazan (2009) in a field study of EGRA in Peru caution as well: “[ORF] could have an adverse effect in the children, creating too much pressure to read fast and taking away the pleasure of reading. … And … the evidence that coaching in fluency is causally related to comprehen-sion is not strong enough, either based on this study or the literature, to encourage fluency coaching as single-minded strategy in improving reading.” (p. 9, emphasis in the original). The problem of ‘barking’ or ‘word calling’ is not a new one; see for example, Allington (1983, p. 556) on word calling and poor readers in the United States.201. RTI, 2009, Exhibit 3, p. 8.

Smaller, Quicker, Cheaper / 89
Sources: Sprenger-Charolles, 2008; Ministry of Basic and Secondary Education, 2009.
0 10 20 30 40 50 60 70 80 90 100
20092007
Grade 3
Grade 2
Grade 180%
70%
66%
54%
47%
27%
FIGURE 5.2. The Gambia: Percentage of students who could not read a single word, 2007 and 2009
ORF is most sensitive during this period. However, EGRA is likely to be less valid and useful before and after the time of rapid growth of automatic decoding, and may vary by context and language. Moreover, while slow reading/decoding may well interfere with comprehension, it is less clear that fast reading enables it. EGRA is accurately described as inappropriate for high-stakes assessments or for cross-language compari-sons. At present, it should be used carefully in languages other than English where transparent orthographies lead to rapidly acquired decoding skills and relatively higher accuracy in word identification levels.202 As may be seen in Figure 5.2, EGRA is espe-cially good at detecting large discrepancies in early reading, such as the large number of children in Gambia who could not read a single word, even in third grade.
Additional Uses of EGRAAccording to the EGRA Toolkit, EGRA could also be used (with modifications) for screening and progress monitoring. To date, there may be statistical problems with this approach. For example, using EGRA to evaluate interventions aimed at decod-ing skills in first and second grades when the skills are changing rapidly will reveal
202. Concerns about ORF and other reading subskills are mainly forward looking, especially in LDCs, since a solid research base has not as yet been established.
Adapted from Gove & Cvelich, 2010, p. 7.

90 / Testing reading in children
large variances of normally distributed skills, but assessing the same children on the same skills before or after the period of rapid growth will yield nonnormal distribu-tions and unequal variances as floor and ceiling effects become more likely. This means that the effects of interventions will depend entirely on the degree of skill mastery evident in the particular sample being measured. Thus, before broader ap-plication of the EGRA is made for either screening or progress monitoring, it will be important to establish developmental benchmarks for skills at different grade levels and in different contexts.203
EGRA and its Theory of Early ReadingThe EGRA Toolkit posits a theory of early reading and its phases, which emphasizes orthographic and logographic processes related to converting symbols to sounds and word meanings.204 This theory indicates that reading requires identification of letters, phonics, decoding, and pronunciation. Hearing words does not require those processes, but both listening and reading depend on memory of word mean-ings and sounds. This model, as with many others, is a description of several key relationships, but it does not provide causality, sequence, development, or relative weights or differences among the processes. In addition, while the assessment of beginning readers’ comprehension is more difficult, this direction should be given more attention by those using EGRA or similar instruments.205
203. Those working on the EGRA seem to be cognizant of this issue, and are currently gathering data in order to provide such broader sampling. This may also involve the use a criterion-referenced, rather than norm-referenced basis for comparing growth among skills.204. RTI, 2009, Exhibit 6, pps. 12-13.205. There is much debate about assessments of listening comprehension or picture comprehension, but this does not mean that the skills should not be assessed. In fact, research has shown that children’s comprehension of picture books without words (Paris & Paris, 2003) and comprehension of televised video episodes (van den Broek, et al., 2005) predicts reading comprehension scores several years later.
Smaller, Quicker, Cheaper / 91
6. Problems and Prospects for Reading Tests
Some Questions Concerning Assessments of Beginning Reading
Assessing beginning reading across different levels of skill, language development, and experiences in WSEs and PSEs raises a number of important questions, such as described below. a. Which skills should be assessed among children just learning to read? Most early
assessments focus on skills related to decoding, such as letter names and sounds, phonemic awareness, and concepts about print. These skills can be assessed fairly easily and quickly, but must be interpreted with caution because (as noted earlier) all skilled readers learn them to asymptotic levels in a few years. Thus, they indicate a relative developmental advantage on beginning reading rather than a stable, long-term difference in individual reading ability.206 Support for this concern may be found in recent research in the United States that showed only a modest contribu-tion of ORF in second grade to subsequent reading comprehension measures in sixth grade; and further that ORF (DIBELS measures) can create both false posi-tives (children are labeled as “at risk” when late tests show that they are not) and false negatives (they are not found “at risk” even though later test show that they were).207 In general, EGRA includes measures of children’s orientation to print, let-ter knowledge, phonemic awareness, and ORF that all show rapid learning and similar asymptotes in children making good progress in learning to read. Other skills not related to decoding, but which might be included in future assessments, would include expressive language, vocabulary, oral reading mistakes, and retelling.
206. The evidence on reading interventions that focus mainly on decoding is mixed. For example, in Germany, Landerl and Wimmer (2008, p. 159) state that: “[T]he findings of the current longitudinal study, which followed German-speaking children’s development of reading fluency and orthographic spelling from the beginning of Grade 1 until Grade 8, confirm once more that for children who start into literacy development with certain risk factors that can be identified easily, the long-term prognosis is strikingly poor.” Similarly, Paris and Paris (2006, p. 55) found that “explicit teaching of phonics leads to better alphabet knowledge and word recognition, and that is usually confined to children who have the least developed alphabet skills. Better word recognition may enable reading comprehen-sion for these children, but it is not the sufficient or causal link.” Of course, in FTI countries and other PSE contexts, a child who does not learn the basics of decoding, and has no access to supportive instruction or intervention, will likely not progress toward reading comprehension.207. See Valencia et al. (2010). This interesting developmental study in the United States showed the liabilities of reading tests, such as DIBELS, that focus on a relatively narrow bandwidth of assessment tools. The issue of false positives and false negatives is important. No test predicts perfectly, of course; but the Valencia study showed a mis-labelling of up to 25 percent of children in second to six gradesusing DIBELs tests—which means that nearly one in four children were misdiagnosed. An earlier study that found similar ‘false negatives’ was undertaken by Schilling et al. (2007).

92 / Problems and prospects for reading tests
b. How can comprehension be assessed? For children who cannot decode words, lis-tening comprehension (such as in EGRA) can be used instead of questions follow-ing independent reading. Both readers and nonreaders can be asked to retell text content or they can be asked standard questions. Questions should be based on explicit and implicit text information and must be constructed carefully to insure that they are based on text information and not prior knowledge. This measure may have low validity if there are only a few questions based on a single passage.208
c. Does the orthography of the language affect assessment? Since orthography strongly affects learning to read and spell, tests must take into account linguis-tic characteristics (such as GPC and PGC consistency209) when designing assess-ments for beginning readers or spellers. Further, reading measurement relying on written responses (such as LSEAs) should be employed with great caution, given the asymmetry between GPC (used to read) and PGC (used to spell). These issues are particularly important for students learning to read and spell in L2.210
d. What texts should be used in oral reading assessments? The texts used should in-clude a range of genres211 and a range of difficulty to establish a child’s oral reading fluency. Multiple passages with familiar content and vocabulary are appropriate. Rate and accuracy measures can be recorded during oral reading, but retelling and comprehension should be considered for inclusion in testing. If children cannot decode, then ORF measures themselves may not be appropriate.212
e. In which language(s) should the child be tested? As noted earlier, some coun-tries have an official curricula policy mandating a single national language that is different from the language(s) spoken by the child at home, while others promote a mix of home, local and national languages as curricular policy. At a purely policy level, some assessments (such as SACMEQ) have simply imple-mented government language policy. Yet, from a child-centered perspective, assessments (as well as teachers and parents) should build on the linguistic and other strengths of the child, for both cognitive and affective reasons. Since hy-brid assessments are especially effective in understanding reading in local con-text, it is appropriate that children should be assessed in any languages or or-thographies that are relevant for learning.213
208. Dubeck (personal communication) suggests that even with ORF of 45 words per minute many children in poor countries will not be able to comprehend text if they do not have sufficient oral comprehension abilities in the target language.209. Grapheme-phoneme correspondences, and phoneme-grapheme correspondences, respectively. See earlier discussion in Chapter 5.210. See Genesee et al., 2006.211. EGRA has used narrative text to date, but expects to be using nonnarrative text as well in the future (Gove, 2010).212. EGRA (RTI, 2009, page 21) recognized the serious problem of floor effects (scores of zero or near-zero) in ORF. In LDCs, floor effects are very likely in poor schools, so ORF measures may not yield normal distributions for data analyses, and thus may be flawed.213. From an empirical perspective, it is probably premature to define the term “relevant.” Relevancy will likely vary from context to context, but that does not mean that it cannot be defined by communities, regions, or even at a national level. When further hybrid EGRA-like research can be compiled, we will be closer to understanding which languages should be taught and when.

Smaller, Quicker, Cheaper / 93
f. Who assesses the children? Trained enumerators are needed to administer read-ing assessments because they must judge decoding skills (for example, correct rhyming, blending, and oral reading accuracy) as well as comprehension. Even in OECD countries, where it is usually possible to find skilled enumerators with university degrees, it remains a challenge to achieve high interrater reliabil-ity. In LDCs, achieving high quality data collection remains a major challenge because of training costs.214
g. Are the assessment techniques appropriate for the diversity of learners and enu-merators? Most assessments (whether LSEAs or EGRA) use materials that are designed and printed for use by local enumerators. Therefore, instructions need to be clear and followed as precisely as possible. In the case of IRIs, enumerators must have sufficient training to manage a time-sensitive task (with a stopwatch) that includes (for ORF) how many words a child can read, and whether the child can read with accuracy in a language that may not be the mother-tongue of the enumerator or the child. The articulation and language fluency of the enumerator are also important for listening comprehension and dicatation when the enumerator reads aloud to the child.215 Furthermore, a serious issue,
214. One might ask about the relative costs of training using different assessments, such as LSEAs, EGRA and others. Relatively little is known about actual training costs, though see Chapter 7; the available (very modest) evidence shows that the costs of training in PASEC (in terms of percent of overall costs) is roughly the same as in the two EGRA studies shown in the cost analysis. Further, there is also the issue of inter-enumerator (or inte-rater) reliability, for which relatively little current information is available. L. Crouch (personal communication) has indicated that such interrater reliability is strong in most EGRA work to date, but that training is quite substantial. Also, there may be a temptation, especially in LDCs, to use teachers as enumerators. However, teachers may know their own students too well to assess them objectively, and may also be subject to local socio-political biases. Also, while generally more educated than their local milieu, teachers may be assumed to be adequate enumerators when they are not. Further, teachers may have expectations of particular students, and these can significant influence the child’s performance. Overall, additional attention will be needed to better understand the training requirements of enumerators.215. It has long been argued that enumerators (as in EGRA) and others engaged in cross-cultural assessments may lack the requisite skills to make fair and unbiased judgements of children’s skills (for a recent example, see Jukes & Girgorenko, 2010). There is also the issue of interference—children saying English instead of Swahili letters, or spelling English words with Swahili endings. Another issue is how to assess developing competences in areas where children move from one language to another at a stage of development (for example, from Swahili to English). Thanks to M. Jukes (personal communication) for these insights. The issue of timed tests of reading has received surprisingly little attention among researchers, especially given well-known and major concerns about cross-cultural assessment techniques generally (see, for example, Brislin et al., 1971). One study (Lesaux, et al., 2006), focused on adult readers, examined the effect of extra time on the reading comprehension performance with or without reading disabilities (average and above-average readers versus poor and very poor readers). The participants were instructed to read at their own pace (untimed condition, but no more than 40 minutes) or in a timed condition (20 minutes). All of the reading disabled students benefited from extra time, but the normally achieving readers performed similarly under the timed and untimed conditions. In addition, very poor readers increased their scores in the untimed condi-tion, but that condition was not enough to enable them to perform at the same level as average readers, which is the case for the poor readers. While little can be directly applied from this study to LDCs and PSEs, it appears that the issue of timed tests is one that should receive some further attention in LDCs. All assessments (LSEAs and EGRA, for example) are timed, but it is EGRA that has put the greatest emphasis on timed response, with individual enumerators using stopwatches repeatedly for each tested child. EGRA instructions state that the enumerator states the following: “Respond as quickly and carefully as you can.” As in all such tests (especially with children, but even with adults), testing instructions can elicit very different interpretations. Given the strong presence of a stopwatch, it would not be surprising to have the pressure of time become the central feature of a child’s understanding of what is required.

94 / Problems and prospects for reading tests
not as yet fully understood, is whether time-sensitivity may add bias to the results,216 or even to negative pedagogical consequences (see next section).
h. How should assessment data be analyzed? The validity and interenumerator reliability of reading assessment data depend on uniform administration and scoring procedures. These, in turn, depend on the qualifications and training of the enumerators. The usual manner of analyzing data from test batteries is to use parametric statistics, such as Pearson correlations, factor analyses, regres-sions, analyses of variance, and multilevel modeling based on HLM, but the validity of these methods with constrained reading skills has been called into question.217 Nonparametric data analyses, or perhaps benchmarking systems based on specific criteria, such as those described in EGRA (Annex B), may be more appropriate.
i. How should data on early reading skills be interpreted? Prevailing views of early reading regard such skills as normative in a sample population, and thus make inferences only about those populations of children. For example, the frequent assertion that knowledge of letter names and sounds at kindergarten is the “best predictor” of reading achievement at second grade, reinforces the perception that letter knowledge has a stable and enduring relation with reading achieve-ment, which is not the case over extended time.218 The correlation also seems to invite causal interpretations that have led to calls for explicit instruction on letter sounds and letter knowledge, which may not be the most productive way to teach reading at this stage.
Pedagogical Implications of Assessments
Reading assessments serve many different purposes, including formative and summative functions. Summative reading tests are used to compare groups of students across schools, districts, or nations because they focus on mean levels
216. The issue of timed tests of reading has received surprisingly little attention among researchers, especially given well-known and major concerns about cross-cultural assessment techniques generally (see, for example, Brislin et al., 1971). One study (Lesaux, et al., 2006), focused on adult readers, examined the effect of extra time on the reading comprehension performance with or without reading disabilities (average and above-average readers versus poor and very poor readers). The participants were instructed to read at their own pace (untimed condition, but no more than 40 minutes) or in a timed condition (20 minutes). All of the reading disabled students benefited from extra time, but the normally achieving readers performed similarly under the timed and untimed conditions. In addition, very poor readers increased their scores in the untimed condition, but that condition was not enough to enable them to perform at the same level as average readers, which is the case for the poor readers. While little can be directly applied from this study to LDCs and PSEs, it appears that the issue of timed tests is one that should receive some further attention in LDCs. All assessments (LSEAs and EGRA, for example) are timed, but it is EGRA that has put the greatest emphasis on timed response, with individual enumerators using stopwatches repeatedly for each tested child. EGRA instructions state that the enumerator states the following: “Respond as quickly and carefully as you can.” As in all such tests (especially with children, but even with adults), testing instructions can elicit very different interpretations. Given the strong presence of a stopwatch, it would not be surprising to have the pressure of time become the central feature of a child’s understanding of what is required.217. Paris, 2005.218. Paris, 2005.

Smaller, Quicker, Cheaper / 95
of performance on norm-referenced or criterion-referenced tests. In contrast, the fundamental reason for assessing students’ reading with formative assessments is to provide appropriate instruction. For example, screening tests can be used to place students in the appropriate grade levels, reading groups, or leveled ma-terials. Progress monitoring tests can be used to gauge students’ responses to instruction and curricula that in turn can be adjusted as needed. Diagnostic tests examine specific skills or reading difficulties and they can be the basis for “dif-ferentiated instruction” for different students. The use of assessment to guide pedagogy is often termed (in contrast to the assessment of learning) “assessment for learning”219 and is gaining popularity. It is particularly relevant to develop-ing countries with large variations in literacy experiences of beginning readers, because it links assessment and instruction in real-time cycles of learning, a topic that is covered in Chapter 9. Of course, differentiated instruction requires skilled teachers, and ultimately greater resources put into training.220 Why “Good” Tests Are not Always Good for the Child
The “goodness” of a test is most often characterized by its statistical reliability and validity, as described in Chapter 4. However, serious concerns remain about ad-equate pedagogy for children that may exist in spite of statistical robustness.a. Tests must be developmentally appropriate for any sample of children. In LDCs,
with a wide heterogeneity in skills, one test may not be appropriate for every stu-dent, even in the same grade level. Educators may need a wider menu of assessments for students who cannot read, are beginning to read, or are skilled readers so that assessments can be matched to students’ development and the purpose of the test.
b. In line with the previous item, reading tests should include both decoding and comprehension skills at a range of levels of reading achievement so that teachers and students know they are both important, and so they both receive adequate instructional time.
c. Tests must have good consequential validity221 for the child, teacher, and par-ents (and system) so that the information derived from the assessment is di-rectly beneficial. The effects of the assessment may have long-term negative consequences, if tests narrow the curriculum, focus instructional time on test preparation, or assess only a narrow range of skills. Conversely, tests that are properly balanced and implemented have important implications for the ac-countability of results among stakeholders (see also Chapter 9).
219. Black & Wiliam, 1998.220. It may be noted here that SQC approaches cannot cover everything, and it is clear that complex diagnostic tools are unlikely to fall into the category of things that one can do in a slimmed-down assessment. Thus, reference here to more complex assessments is more to show the boundary conditions of what some people wish to do, rather than advocacy of what one should try to do in PSE contexts, for example, in FTI countries—at least in the near-term.221. Linn, 2000.

96 / Problems and prospects for reading tests
d. Educators need both formative and summative assessments of reading for stu-dents of different abilities and for different assessment purposes. Policy makers should design flexible assessment systems so that teachers have control of the assessment tasks in their classrooms and access to the data so that assessments can inform and improve instruction. Having these elements in place could lead to a classroom-level diagnostic of considerable value in improving outcomes.222 The pedagogical implications of assessment are, perhaps, the most important is-sue for policy makers, because good assessments promote learning and motivate both teachers and students, whereas poor assessments narrow the curriculum, de-skill, and de-motivate teachers, and frustrate students.
e. Timed testing and fast reading. In EGRA, in the ORF, and several other fluency subtests, the proctor uses a stopwatch to make sure that students are limited to 60 seconds maximum. This assures uniformity and improved speed of testing time, but it also may signal to the student, the teacher, and even the parents, that the speed of reading is a critical benchmark of good reading. Indeed, some policy makers who use EGRA have made claims that a given level of reading speed (such as 60 correct words per minute) constitutes a minimum threshold for good reading in LDCs.223 Although the merits of this conclusion may be debated,224 many agree that children who are urged to read beyond their com-fortable rate of comprehension (especially in a second language) would find themselves in a situation where they could repeat or say words in a text that they may not understand.225 Current fieldwork in Kenya provides support for this concern, in that children are able to read faster (higher ORF) in English (as L2) than in Kiswahili (as L1), but comprehension scores were higher in Kiswahili.226
222. Thanks to B. Prouty for this observation.223. Abadzi et al., 2005; Abadzi, 2008; RTI, 2009.224. It has long been argued that there are trade-offs (particularly in speed versus accuracy) in cognition in general, and in reading, in particular (in reading, see Stanovich, 1980). Those that are pushed to read more quickly may adopt inappropriate strategies leading to a decline in reading ability. “An alternative, more plausible, explanation of the re-sult is that the older readers adopt a more risky reading strategy than do the younger readers. That is, in an attempt to speed up their reading, older adults may rely more heavily on partial parafoveal information. This may allow them to move through text more quickly but may have the consequence that they may have to regress to earlier portions of the text more frequently to clarify text that was not correctly processed earlier.” (Rayner et al., 2006, p. 457.)225. See earlier reference to Samuels (2007). Also, there have been several studies of ORF and the impact of the push for speed of reading measures. Hudson et al. (2009, p. 15) reports that “the mental effort in the service of post-lexical comprehension is a major ingredient of reading fluency, meaning that the more time readers spend in processing the meaning of the text, the lower their reading fluency is in connected text.” Furthermore, Colon and Kranzler (2006) looked at the role of asking children to “read faster”, and found that: “When asked to read as fast as they can, on average, students read significantly more words correctly per minute, and made significantly more er-rors, than when asked to do their ‘best’ reading or simply to read aloud.” They further conclude that variation in the instructions (or interpretation) of instructions (a serious problem in PSEs) can lead to signficant variations in scores. Naturally, testing with time limits seems unavoidable in most school-based assessments, if only for efficiency. The is-sue here is that if a particular timed test (such as ORF) becomes associated strongly with a pedagogical intervention, then there is a risk that inappropriate instruction will be supported by various stakeholders, including the teachers.226. Piper et al., 2011. The authors also found that word identification and nonword decoding skills are more highly predictive of oral reading fluency and comprehension scores in the mother tongue Swahili than in English, which sug-gests that limited oral vocabulary skills may be responsible for low levels of comprehension.

Smaller, Quicker, Cheaper / 97
There is also the possibility that children would try to please the teacher or enu-merator by reading quickly at the risk of ignoring the text meaning or learning inappropriate strategies for effective reading.227 This matter needs to be given further attention as the use of ORF expands.
Response to Intervention and Teacher Training
A recent and rapidly growing approach to connect assessment and instruction is called Response to Intervention.228 In this three-tiered approach to instruction, stu-dents who struggle with the usual classroom instruction (Tier 1) are given extra tutoring, instruction, and support in the classroom daily, or weekly (Tier 2). Those students who fail to make progress with Tier 2 interventions then move into Tier 3, which is usually a ‘pull-out’ program of intensive tutoring. In principle, Response to Intervention is a good way to connect assessment and instruction, but it depends on the specific assessments used to evaluate progress. In DIBELS and EGRA, tasks such as ORF may become the benchmarks for success and, thus, the instructional targets. In LDCs, the issue of teacher training will become ever more important, if such individualized techniques are deployed, just as it will with any improvement in instructional design.229
227. Of course, there are those that argue that it is precisely the slowness of reading (in PSEs) that prevents children from grasping the meaning of text, as in the case of Malian school children (M. Keita-Diarra, personal communica-tion). As pointed out earlier, the speed of reading issue may also depend on whether the language of instruction in is the child’s L1 or L2.228. Justice, 2006.229. This review has not focused substantially on teacher training, although the implications of reading assessments on teacher training are significant. According to M. Jukes (personal communication) what is needed is an understand-ing of how to change teaching practices sustainably across an entire education system that is struggling with large class sizes, teacher absenteeism, and other issues. It is possible that any thoughtful intervention can improve the quality of instruction in support of children’s learning, but once the project leaves, things go back to normal.

98 / Problems and prospects for reading tests
Are there Brain Limitations on Beginning Reading?
It has been argued that one of the most important reasons for early intervention in reading is a set of neurological constraints that are imposed on the developing child who may not receive sufficient inputs from reading by a certain age.230 The evidence available does not suggest that normal children (or adults) are significantly im-peded by brain (or biological) limitations from learning to read (or from learning nearly any other cognitive task), if this is delayed by months or years.231 This should not be construed to mean that humans do not have cognitive constraints on learn-ing: they do. Yet, a delay in a learning trajectory, while not desirable (especially for school-aged children), does not imply that catching up is unlikely or impossible.232 Strong arguments about impaired brain function, for otherwise normal children, in reading, language, or other cognitive activities seem, at present, to be exaggerated and unsupported by the scientific literature. What can be said is that early learning is helpful in that there is more time to learn a skill and progresses within the norms typical of a WSE context.233 Another way to look at the brain argument is to consider the value added by neuroscience when compared to social and behavioral sciences. When working with normal children, it is simply more plausible to believe that social and cogni-tive inputs—such as books at home, parents who read to their children, and access to the language of school instruction—explain greater variance in the learning pro-cess than modest differences related to neural pathways.234
230. Abadzi, 2008; Shawitz, 2003. More recently, Shawitz and Shawitz (2008) argue that “pharmacotherapeutic agents” may be crucial in improving attention, and ultimately fluency, in dyslexic readers. It has also been suggested that adult illiterates face neurological limitations in learning to read (Abadzi, 2006).231. See Hruby and Hynd (2007) for a particularly insightful review of the neuro-scientific literature on reading. As they state: “Let us remember that models of the reading mind are basically visualizable descriptive analogies …They illuminate something that is not well understood by way of something that is. But this always implies identity of the phenomenon under investigation with something it is not. Such analogies can be inspiring for theory construction, but they are fundamentally false.” (p. 551; italics in the original). For a similar argument on early childhood education intervention programs, see Hirsch-Pasek & Bruer (2007). For a more indepth disaggregation of nativist (brain-based) versus nurture (social/experiential) claims about early behavior, see Kagan (2008), who concludes that “a construct purporting to explain a psychological competence as a process inherent in the infant’s brain organization need not have the same meaning as one that explains a process requiring extensive experience” (p. 1619).232. Naturally, this is not to say that delays in learning are good for children. Children in PSEs who may take three grades to learn the alphabet, and five grades to get to modest reading fluency will have missed much of what is taught in the curriculum, and therefore be so far behind that school failure is likely. These learning delays, it is argued here, are a function of social factors, and do not implicate neuroscientific explanations or constraints.233. Brain limitations across individual development (ontogeny) does not imply that there are no limitations to how human brains process information. As shown in the earlier discussion on ‘automaticity’ in reading, there are norms that describe how quickly a skilled reader can read, as well as the problems that readers with dyslexia have with read-ing. These findings simply show that there are norms for brain function, and that these can be determined in various samples of individuals. In the area of dyslexia (in contrast to the term ‘normal’ used above), there is ample evidence of a neurological impairment; see, for example, Eden and Moats (2002).234. For a useful review on accumulation delays in cognitive skill acquisition, see Stanovich (1986). For a broadbased neuroscience argument, see OECD (2002); more recent, and more broadbased OECD approach to learning may be seen in Dumont et al., 2010.

Smaller, Quicker, Cheaper / 99
Testing in Very Poor Contexts
Observers in PSE contexts in poor countries have a familiar story to tell, as described in the story about Aminata in Chapter 1. The average child (behind proverbial rows one and two in the classroom) receives little teacher attention, and is most often ill-prepared to be in the classroom because of inadequate preparation at home, poor nutrition, poor school materials, and a teacher who tends to focus (when not absent for other reasons) on those children most likely to learn, and those whose parents count in the community.235 Numerous problems conspire to assure that poor stu-dents get the least beneficial education. While this issue is well-known at a socio-cultural level, it may also be considered at the individual cognitive level. For example, many children in PSE contexts in developing countries exhibit fatigue, lethargy and inattention in the classroom. Some of this is due to malnutrition, chronic disease, fatigue, travel distances to school, and other factors. What has been less reported are the consequences for reading acquisition of such physiological challenges. Recent research suggests that in such PSE contexts, children may zone out—in the sense that they lose concentration on the reading task and become inattentive in the classroom. A consequence is that children may look like they are reading, but their comprehen-sion of text is very low or non-existent.236 Evidence of children who are in school but cannot read a single word has been gathered in a number of the EGRA field studies, as further described in Chapter 5 and below.
Reading Assessment Methods: Some Additional Observations International Assessements
PIRLS and PISA remain the best-known and most widely used international read-ing assessments. As described earlier, each of these tests has been rigorously de-signed, with solid theoretical bases, and highly capable technical and statistical support. As also noted, PIRLS and PISA differ by target population (age versus grade selection), which has been the subject of some debate over the years. In addi-tion, each test has come under scrutiny for use in developing countries for at least three reasons related to comparability. First, in the case of PISA, the proportions
235. See Samoff (2003) for a broader discussion of the policy implications of PSE contexts and material limitations in LDCs.236. Although the detrimental consequences of inattention—or “zoning out” as it is sometimes called—on model building seem straightforward, the cognitive or perceptual processes that control behavior when the mind wanders remain unclear. There are two explanations for “zone-out,” which leads to what is termed “mindless reading.” Ac-cording to Smallwood et al., (2008), “Mindless reading reflects a breakdown in the top-down control of comprehen-sion, and reading instead proceeds either through simple motor control or by reference to relatively low features of text alone.” In other words, in PSEs, it is not unusual, especially for poor readers, to find themselves going through the motions of reading, rather than engaging with a test for understanding. This is, of course, one of the rationales for SQC type assessments—so that quick indications of failure can be documented.

100 / Problems and prospects for reading tests
of students in post-primary schooling vary dramatically between most OECD countries and LDCs, leaving skewed and non-comparable samples of students.237 Second, each test is only able to approximate cultural adaptation, because there is much too much variability across the globe to achieve a fully comparable linguistic platform for testing. This is even more problematic in LDCs where many children have to take the test in their second or third language. Third, the test scores of LDC learners may be so low that they are no longer statistically reliable for the sample populations, as many children are at the statistical floor.238 In addition, it is difficult in such standardized tests to determine why a student fails to answer a question correctly. Was the student unable to read the entire text? Was the student unable to remember the text content once presented with the questions? Or was the student able to read the text but simply chose not to do so? Furthermore, since PIRLS and PISA do not include measures that assess the level of oral language comprehension, the results of other reading subtests (es-pecially in multilingual settings) are more difficult to understand. Another serious limitation on the educational use of PIRLS and PISA in developing countries is that these tests come too late in the child’s acquisition of reading. Both tests are given either near the end (PIRLS), or shortly after the end (PISA) of primary school, whereas the problems identified in PSE contexts show that children are failing much earlier in the educational cycle. It is of relatively little educational value to know that children are very poor readers in sixth grade (for those that make it to sixth grade, which may be low in many FTI countries), as the prob-lems occur much earlier. Furthermore, many children in LDCs will have dropped out from school by sixth grade. Even if detected, the diagnostic and early internvention methods available work far better with young children, often at the level of decoding.
Regional Assessments
SACMEQ has much in common with the reading assessments used in PIRLS and PISA. While a test designed for the complex societies and cultures of East and Southern Africa, SACMEQ coheres largely to the common concerns of minis-tries of education in terms of a focus on curricular achievement. As such, only the languages mandated by the national ministries are used (mainly English, but also Portuguese for Mozambique and Kiswahili for Tanzania and Zanzibar). It should also be noted that SACMEQ made a major effort to use the assessments as an op-portunity for capacity building. As noted in a recent review, “A particular feature of its approach was its ‘learning by doing’ training for planners, whom it sought to involve directly in the conduct of studies.”239 Local capacity building adds value
237. See UNESCO, 2004, p. 48.238. With the development of pre-PIRLS, the problem of scaling has been recognized, and will likely be addressed. The contested issue of linguistic and cultural comparability will likely remain, however.239. Ladipo et al., 2009, p. 87.

Smaller, Quicker, Cheaper / 101
to the region. As with PIRLS and PISA, the time required for implementation, analyses, and full reporting on the study takes up to five years.240 PASEC is geared towards measuring reading skills, as well as other lan-guage skills such as grammar and conjugation in French (Annex A). PASEC ap-pears to be the only assessment that requires a significant knowledge of grammar, an aspect which has been perceived to be of value in the Francophone educational tradition, even though little or no evidence exists that these skills are important to overall reading comprehenion in French. On the other hand, PASEC does not appear to directly assess grapheme-phoneme correspondences, or listening com-prehension. PASEC does include word/sentence-picture matching tasks and cloze tests used to assess comprehension at the level of words, sentences, and texts. These tests present some potential advantages, such as group administration and ease of use with young children, and the possibility of using the same picture across more than one language.241
EGRA Assessments: Field Research
[A]n approach to reading that is direct, simple, explicit, and intense … seems to
be welcomed by teachers, principals, and parents, and appears quite capable of
boosting performance, on some measures, quite quickly.242
In contrast to the international and regional comparative assessments, EGRA is an assessment that is aimed at measuring reading for those beginning to learn to read. As noted above, EGRA can be critiqued from several angles, and a number of field studies are underway that will provide opportunities for EGRA to be refined and im-proved. The main strengths of EGRA implementation in PSEs are the following: (a) designed to take the floor (lowest levels of learners) into account; (b) can be tailored to any language and orthography without the constraints of strict comparability; and (c) population samples can be smaller as EGRA is designed (at least at present) to be a monitoring device, rather than a national representative high-stakes assessment; and (d) the time taken between design and full reporting can be considerably less than the other major assessments, because of its smaller overall size. Nonetheless, there remain issues of how to properly scale the EGRA tests across the wide variety of contexts, languages, and orthographies in which it is currently being implemented. This means that there will be problems of both ceil-ing and floor effects across a number of subtests that will require adjustments as
240. See Ross et al. (2005) for comprehensive discussion of the 14 main phases of work in SAQMEC.241. See Wagner, 1993 (pp.88-92), where Moroccan children were tested in Arabic and French. See also the discus-sion of the Peabody Picture Vocabulary Test (PPVT), as discussed in the RTI (2009, p. 35); a main hesitation for use of the PPVT by EGRA appears to be copyright issues. Yet, PPVT is one of the best and simplest measures of vocabulary development across languages.242. Crouch, et al., 2009, p. 2.

102 / Problems and prospects for reading tests
EGRA continues to be implemented.243 Furthermore, on some tests (such as pho-nemic awareness) proper administration is difficult and subject to the difficulties of enumerator training in locations where this has many inherent difficulties—all of which may lead to low inter-rater reliability. Several recent field studies244 illustrate both the promise and problems as-sociated with the EGRA approach. Snapshots below of these studies provide useful directions for shaping future work with EGRA tools.• Ethiopia.245 This study was undertaken in a poor rural context, with a sample
of 24 schools, and about 450 children in third grade, divided about equally by gender. It focused on OTL variables, such as school days open, teacher pres-ence, the link between teacher tasks and student tasks, and, ultimately, the high frequency (36 percent) of students at floor of ORF (that is, zero CWPM). This research characterizes a learning context similar to that of Aminata’s story in the Introduction.
• Peru.246 A study was undertaken with 475 children, particularly to determine whether there were differences between the individually-administered EGRA and group-administered written comprehension tests. The results showed rela-tively high inter-correlations between both forms of testing. The authors con-clude that the two types of tests are “complementary,” rather than “irreconcil-able.” Yet, these results do not seem to hold up as well for ethno-linguistic minority children from the indigenous Ashaninka group (Figure 6.1), as the curves for discrimination are quite different, suggesting that at least one of the tests may be flawed with such populations.247
243. For example, Senegalese and Gambian students in EGRA could only read a small number of words, and the scores of a high proportion of first graders are at the floor level in the word reading task. Word reading levels were at floor (zero) for 80 percent, 50 percent, and 71 percent of respectively L2-English, L2-French, and L1-Wolof students. See Sprenger-Charolles, 2008a, b.244. Numerous other studies are currently in draft stage or underway, but not reviewed in this volume.245. DeStefano & Elaheebocus, 2009.246. Kudo & Bazan, 2009.247. Among the Ashaninka in this study in Peru, it cannot be determined whether the methodology of testing, or the test items themselves, were likely to have caused the contrasting response curves in Figure 6.1. The authors provide an interesting discussion of why the correlation between ORF and written comprehension is not very high, even if ORF is the strongest predictor among subtests; and that, in the population they assessed, the relationship between fluency and comprehension is “non-linear” (p. 47). This latter finding is not inconsistent with other parts of the present review. It is not surprising, in any case, that subtests in the Peru field study are correlated positively with one another. Since the beginning of research on cognitive testing, irrespective of the particular test, individuals who tend to score well on one type of cognitive test often test well on other types of cognitive tests. Interestingly, the authors also state (p. 50) that “we found that the [fluency – comprehension] relationship is stronger for Ashaninka students; an increase in reading fluency translates into a larger increase in comprehension than it does for non-Ashaninka students, even when holding other factors constant. This may indicate that for the most disadvantaged children – the Ashaninkas being one example – working on fluency early on is even more important than with advantaged students, as it appears to have greater impact on their ability to understand what they read.” In other words, there are multiple ways to interpret the results, especially among population subgroups, and these will need to be carefully examined in subsequent studies. This concern is similar to the cross-grade differences in the intercorrelations between ORF and comprehension found by Valencia et al. (2010), as discussed earlier.

Smaller, Quicker, Cheaper / 103
010
2030
4050
6070
80
Per
cent
-4 -3 -2 -1 0 1 2 3 4
Fluency standardized score
b. ECE test (Z of Rasch scores)
010
2030
4050
6070
80
Per
cent
-4 -3 -2 -1 0 1 2 3 4
ECE-06 standardized Rasch score
a. Oral Fluency test (Z scores)
FIGURE 6.1. Histograms of Z scores in Oral Reading Fluency and Written (ECE) group-administered test, for Ashaninka students in Peru (N=40)
Adapted from Kudo & Bazan, 2009, p. 33.

104 / Problems and prospects for reading tests
• India.248 In some ways similar to the above Peru study, researchers in India (Bihar and Uttarakhand) conducted several studies that compare the use of EGRA oral fluency measure with the previously used READ INDIA (written) assessments in Hindi, in first through eighth grade. While the substudies var-ied in size and content of assessments used, the researchers assessed more than 15,000 children in total. As in the Peru study, the India report found high levels of reliability across instruments.249 The authors rightly claim that there has been a “paucity” of reading assessments in Hindi, so that the provision of detailed analyses as in this study will likely open the way to further ways of measuring the learning trajectory of primary school children as well as their expected levels of achievement. An important dimension of the READ INDIA work is that of civil society involvement in policy advocacy, both at the national and regional levels within India, as well as at the community level to promote attention to early reading. In a recent national sample study of rural districts across Indian states, it was found that 30 percent of those children in third grade (Standard) could not read a single word in their mother tongue (see Table 6.1).
248. ASER (2009) and Abdul Latif Jameel Poverty Action Lab (J-PAL), et al., 2009.249. The report also claims that “support for convergent-discriminant validity [since] we found stronger correla-tions between the Fluency Battery and the ASER [READ]-reading test than each of their correlations with the math tests.” Nonetheless, other math and reading tests were highly correlated, more than between some reading tests. This finding lends support to a central conclusion of this volume—namely, that many useful tests (when floor and ceiling effects are eliminated or reduced) demonstrate strong intercorrelations. In itself, this is not a problem; but it is a problem when claims are made about the value of specific subtests in reading assessments (and for possible implementation), since so many testing instruments are related strongly to one another.
TABLE 6.1. Class-wise percentage children by reading level all schools 2010
Std. Nothing Letter WordLevel 1
(Std I Text)Level 2
(Std II Text) Total
I 34.0 41.1 17.0 4.4 3.4 100
II 12.1 32.4 32.4 13.9 9.1 100
III 6.0 18.8 29.6 25.7 20.0 100
IV 3.1 10.1 19.4 29.3 38.1 100
V 2.2 6.7 12.7 25.1 53.4 100
VI 1.3 4.0 7.6 19.7 67.5 100
VII 1.0 2.7 5.2 15.0 76.2 100
VIII 0.7 1.9 3.2 11.3 82.9 100
Total 8.3 15.9 16.8 18.2 40.9 100
How to read this table: Each cell shows the highest level of reading achieved by a child. For example, in Std III, 6.0% children cannot even read letters, 18.8% can read letters but not more, 29.6% can read words but not Std I text or higher, 25.7% can read Std I text but not Std II level text, and 20.0% can read Std II level text. For each class, the total of all these exclusive categories is 100%.Adapted from ASER (2009).

Smaller, Quicker, Cheaper / 105
• Kenya.250 This research was an experimental study whereby 40 schools (out of 120) were selected for an intervention that involved the training of first and second grade teachers, while the “control” schoolteachers received no such training. Training for teachers, which lasted over a one-year period, included weekly lessons on phonological awareness, alphabetic principle, vocabulary, flu-ency, and comprehension. EGRA tools (in English and Kiswahili) were used to measure reading progress over the same time period, in both intervention and control schools.251 In terms of direct consequences on reading results, the study found that the intervention was successful in reducing the number of non-readers in Kiswahili (but not in English).
• Liberia.252 In this study, an RCT experiment was undertaken in second and third grade, comparing three levels of intervention across 60 schools: control, “light” (informing the community about the importance of reading); and “full” with teachers and parents taking part in a reading intervention based on EGRA component model of reading (with English as the target language).253 Teachers had about three months to engage in the intervention before the first set of findings was reported. These mid-term findings compare a base-line assessment with three months of intervention support. It appears that the ORF measure was responsive to the full intervention more than the light intervention, and that both interventions had significant positive impact on this measure.254 However, the differences in impact on reading comprehension appear to be much smaller, which raises the question of whether interventions in beginning reading are tightly related to broader reading skills.
Taken together, these studies and others still in progress255 are indicative of the energy that the EGRA approach is generating in many countries. While there will always be differences of views about best assessment tools, knowledge about early reading in LDCs is proceeding at a productive and rapid pace.
250. Crouch, et al., 2009.251. In an unexpected finding, the Kenya study found significant (and indistinguishable) improvements in reading in both the intervention/experimental and control groups. The proffered explanation was that there were “spill-over” effects between the experimental and control groups, where teachers in the control sample schools found ways of including knowledge from the experimental group teachers. This explanation seems plausible, but it is also possible that there is a ‘Hawthorne’ effect in the study, whereby the simple presence of researchers, and the high-stakes as-sociated with being part (or not) of the study, had its own effect of causing teachers to pay more attention to reading instruction in those particular locations.252. Piper & Korda, 2009. The mid-term (draft) study does not as yet report on the significance of English language reading; it is assumed that many, if not most, of the sample likely speaks mother-tongue African languages.253. The “full” intervention is described as: teachers are trained “how to continually assess student performance, teachers are provided frequent school-based pedagogic support, resource materials and books, and, in addition, parents and communities are informed of student performance.” Piper & Korda, 2009, p. 5.254. In this interim Liberia report, there also seemed to be some significant interactions by gender and subtest that further data collection and analysis will likely be able to explain. Further, it appears that there were some baseline differences between the contol and intervention groups at the outset of the study; it is unclear as yet whether these differences will affect interpretation downstream.255. Abadzi (2010) has recently put together an updated summary of EGRA field studies, with a focus on reading flu-ency measures. According to this report, by September 2010, 29 of 71 FTI-eligible countries had one or more EGRA or similar studies done on early reading.

106 / Problems and prospects for reading tests
FTI Reading Skill Indicators
In October 2009, the FTI adopted two reading skills indicators for use in assessing school quality in participating countries.256 These two indicators are the following:• Proportionofstudentswhoaftertwoyearsofschoolingdemonstratesufficient
reading fluency and comprehension to “read to learn.”• Proportionofstudentswhoareabletoreadwithcomprehension,accordingto
their countries’ curricular goals, by the end of primary school. Several comments may be made concerning these two proposed learning indica-tors. First, the indicators seem to be derived from the EGRA model of focusing on early detection of reading problems, before completion of primary school. Second, these indicators also add comprehension further into the mix, and at an earlier stage than some early reading specialists, but more in line with the perspective of the present volume. Third, the notion of “read to learn” puts more emphasis on the quality of learning in the classroom, as contrasted implicitly with rote memo-rization that is commonly observed in poor LDC classrooms. Finally, these two indicators are also interesting by what they do not say, such as: which instruments might be used to establish these indicators, and, notably, the importance of first and second language issues in primary schooling.257
Prospects and Trends for Reading Assessment Measures By 2015, the target date of the MDGs, one of the gains in basic education goals will be improving the ability to set realistic goals and monitor their achievement. Within the next five years, governments and non-governmental agencies will have a larger set of assessment tools from which to study the onset and development of reading (and writing and math) as a way to respond to international and national goals, along with informing parents, students, and communities. A paradox does exist, however, in the development of reading assessments. The more complex the model of assessment is (such as in international and regional LSEAs), the less transparent the results are for effective use in schools, and thus ren-dering a pedagogical response more difficult. However, the more straightforward the assessment tool is (such as a test for ORF), the greater is the danger of simplistic pedagogical response, as if the measurement tool implies causality for learning.
256. http://www.educationfasttrack.org/themes/learning-outcomes/ (accessed on 1/31/11).257. The present volume was largely written before these indicators were posted by FTI, and there is little in the way of reporting on results available to provide further comment at present.

Smaller, Quicker, Cheaper / 107
The development of alternative (and SQC type) assessments is growing, as is the policy interest in deploying them. In 2011, the U.S. Agency for International Development (USAID) listed as its first goal for its next five-year strategy: “Improved reading skills for 100 million children in primary grades by 2015,” with a substantial part looking at improving measurement techniques. 258British devel-opment assistance is also emphasizing learning assessments.259 And field studies of basic skills learning have dramatically grown in developing country settings, with up to 70 countries conducting reading fluency studies as of 2010.260 Other varieties of early reading assessment have also gain momentum over the past several years, including mathematics learning,261 the use of volunteers as enumerators,262 cross-national collaborations,263 and further work on proactive reading interventions.264 In sum, SQC methods, in many varieties, are growing in use. They can be implemented earlier in the child’s development (and schooling) while offering new possibilities for detecting problems in learning to read. How to gauge the appropriate type of intervention program, based at least in part on the diagnostic instruments, remains a substantive problem for resolution in LDC contexts.
258. USAID (2011). See also, Gove & Cvelich, 2010.259. DIFD (2011).260. Abadzi, 2010, p. 18.261. Rubens & Crouch (2009).262. In India, Banerji & Wadhwa (2006); ASER (2010).263. See work of UWEZO (2010) in Kenya and Uganda, building on the work of Pratham/ASER.264. Dowd et al. (2010); Dubeck et al. (2010).

108 / Cost of assessments
7. Cost of Assessments
[T]he cost of active participation [in IEA studies] is high, too high for many devel-
oping countries to bear. Where developing countries have been able to finance
their participation, one might wonder whether the expense of that involvement
could possibly be fully justified, given what has been learned, and given alterna-
tive uses for the funds consumed. How useful is it for Thailand, South Africa and
Colombia to find themselves at or near the bottom of the international rank order
in science, while Korea and Japan appear at the top and European countries are
scattered throughout?265
With the growth of LSEAs in the global arena, and with the significant costs typi-cally associated with participation and management, the issue of the fiscal burden of assessments is receiving more attention. Since external agencies (governments and donor agencies) have typically picked up these costs, the fiscal costs of such investments in knowledge have been seen as minimal when compared to the large amounts spent on education itself.266 The view that such LSEA (and other) efforts may be modest fiscal decisions is a relative statement, at least until actual costs are considered.267 A handful of studies show that LSEAs take up a very small proportion of national education budgets.268 Yet, these studies are often in relatively wealthier countries with larger budgets, and do not appear to account for the limited amount of discretionary funds for such activities typically available to ministers of education in low-income countries. A successful international assessment requires high-level skills in design, planning, and management—skills in short supply globally, especially in LDCs. 269In addition to the relatively high cost and complexity of an LSEA, there is also a wide variety from which to choose. A minister of education must not only decide
265. Johnson, 1999, p. 70.266. Lockheed & Hanushek (1988); Porter & Gamoran, 2002; Wolff, 2008.267. Postlethwaite, one of the best-known experts in LSEAs, commented: “[I]t should also be mentioned that there is quite a gap between the various projects in terms of the amount of money needed to run them. It varies between an annual international expenditure of 200,000 US dollars for SACMEQ through about 3.6 million US dollars for PISA to about 7 million US dollars for IEA. This is without counting what the countries themselves have to pay for their own staff members working on the projects and the cost of data collections.” Postlethwaite, 2004, p. 17.268. See Hoxby (2002) for review. Also see Wolff (2008), p. 14, who states that, “testing in Latin America, as well as the USA, is not a significant financial burden—constituting 0.3 percent or lower of the total budget of the level of study tested.”269. Lockheed, 2008, p. 10.
Smaller, Quicker, Cheaper / 109
whether to participate in LSEAs, but also how to choose tests that are appropriate for students, languages, and educational systems.270 In the cost-benefit decision matrix, hybrid assessments should also be consid-ered. These assessments may be tailored to more specific policy goals within a country or even within a limited number of schools, with constrained sample sizes and reduced time to completion. Thus, they contain the potential to right-size an evaluation study to both policy and budget parameters, with less consideration to the comparative goals that may often drive the design of LSEAs, but greater attention to other parameters.
Cost-benefit Analyses in Educational Assessment
In general, one can argue that for those education systems that are at an early
developmental stage, less frequent assessments, following a baseline assessment,
should be sufficient because many of the issues that need to be addressed are
known and a number of years are required for substantial improvement. In this
case, scarce resources are better devoted to assessments directed at improving
learning and teaching, where the returns on investments are likely to be higher.271
In the early 1990s, a handful of cost studies examined the costs and to a lesser extent, benefits of LSEAs.272 The results supported the value of LSEAs for two main reasons: the fairly low overt costs (for which are explicitly budgeted and accounted) in relation to the overall education budget,273 and the high potential benefits of LSEAs to yield actionable results.274 These early studies also highlighted the financial and contextual complexity of assessment costing. A ministry of education in an LDC needs to con-sider the technical expertise of the test-making organization, as well as in-country expertise. Thus, efforts to provide custom-designed LSEAs can leverage the expertise of the implementing agency, but may also use up (or exceed) the national expertise available to the ministry.275 Thus, if cost analyses are not accomplished upfront, there will likely be wastage (or failure) down the road.276 Although more recent studies tend to support the view of low-fiscal costs of testing, LSEA cost is becoming more clearly recognized as a serious obstacle for LDCs.277 The term “low cost” should be seen as relative to available resources.278
270. As Braun and Kanjee (2006) note, “in educational systems that lack basic resources, decisions to fund national assessments are extremely difficult to make.” (p. 24)271. Braun & Kanjee, 2006, p. 8.272. Ilon, 1992, 1996; Koeffler 1991; Loxley, 1992; for historical perspective, see Lockheed, 2008, p. 3. Costrell & Peyser, 2004; Hoxby, 2002.273. Costrell & Peyser, 2004; Hoxby, 2002.274. Braun & Kanjee, 2006, p. 12; Hanushek & Woesmann, 2005.275. Greaney and Kelleghan, 2008, p. 49; Ilon, 1996; Wolff, 2007.276. Wolff, 2008, p. 5.277. Siniscalco, 2006; Ravela et al., 2008; Wolff, 1998.278. Wolff, 2008.

110 / Cost of assessments
Research shows that average LSEA costs within national educational budgets ap-pear modest (less than 1 percent generally per national budget, and as low as 0.3 percent), but such low percentages may not reflect the percentage of the available discretionary funds within a ministry budget.279
Calculating the Costs
To make a cost-based decision about assessment choice, one needs to bear in mind both overt and hidden costs in any assessment.280 An overview is provided below.
Overt Costs
Overt costs are those that are typically planned for in advance and are included in the accounting mechanisms of the agency in charge of the LSEA: staff costs of test management (such as test design and application) and training, travel, supplies, and equipment.281 These costs can vary by location: within-country costs (for exam-ple, roll out and management of the assessment process within country); in-kind costs (for example, non-cash contributions such as ministry staff, specialists, head-masters, and teachers); and international costs (for example, international agency overheads, international experts, and travel).
Hidden Costs
Although overt costs are clear in the project design, other costs may escape the attention of authorities that put together fiscal plans for assessments. These costs include the following items.• Indirect (or overhead) costs. The agencies themselves absorb these costs in
implementing the program. While often accounted for in wealthier countries, these costs sometimes escape the attention of ministries and other agencies in LDCs. Obvious examples include the cost of using infrastructure (for example, buildings, networks, computer maintenance, and so forth). Less obvious, but significant, costs may be associated with seconded staff in the ministry, and field workers who may be school inspectors or teachers.282
279. Coombs & Hallak, 1987, p. 50; Ilon, 1996, p. 86.280. Greaney and Kellaghan (2008, pps. 49-50).281. Lockheed (2008, p. 9) states: “National learning assessments in developing or transition countries rarely employ complex measurement instruments because such countries rarely have the requisite domestic capacity or can afford to purchase expertise from abroad.” Also, Topol et al. (2010) provide a recent review of efforts to measure the costs of complex assessments in the United States; they suggest, among other things, that improved technology can reduce costs of increased R&D. But since LDCs are, for the time being, hampered by technological constraints, the increased costs of R&D will likely end up as further bottom line expenditures.282.Ilon, 1992.

Smaller, Quicker, Cheaper / 111
• Opportunitycosts.Thesecostsarerelativetowhatdifferentstrategymayhavetaken place in lieu of the particular choice that is made. For example, by not do-ing an assessment in a particular year, the ministry might have more resources to do the assessment in a subsequent year. Or, choice of one type of assessment may preclude opting for a different choice.283 However, the cost of not partici-pating in an assessment—that is, foregoing the potential benefits (in terms of staff development, potential results, and so forth) of participation in an assess-ment—must also be considered as another type of opportunity cost.
Cost Categories and Comparisons in Selected Assessments
The cost categories in assessments from the previous discussion may be seen in summary form in Table 7.1. For purposes of comparison, a number of well-known assessment agencies were contacted for current information on expenditures (some in estimated form). The studies covered are listed in Table 7.2. Data collected from each of the selected studies at a national level are shown in Table 7.3, which indi-cates the variability of known assessment costs by assessment and national context across 13 recent assessments. Table 7.4 provides a summary of average percentages of total expenditures across the six main cost categories.284 Table 7.1 leads to a number of observations. First, the student popula-tions ranged from a modest 3,770 in EGRA-Liberia, to about 300,000 in SIMCE (Chile).285 Second, the total (listed) overt costs of undertaking the assessment ranged from a low of about $122,000 in PISA (Uruguay) to a high of $2.8 mil-lion in SIMCE (Chile). Third, one can calculate the “cost-per-learner” (CPL) by considering these first two parameters, a useful way of looking at costs irrespec-tive of size of the total enterprise. Results show that this parameter ranges from about $8 in the Uruguay national assessment to about $51 in the SACMEQ III study in Swaziland to about $171 in PISA in Chile. The average for this sample of studies is about $42 per learner assessed. In addition (see Table 7.2), certain costs figured more prominently than others, such as test application (50 percent) and
283. For example, such a choice occurred in South Africa when it was decided not to participate in the TIMSS, cit-ing the overall cost in time and resources (Greaney & Kelleghan, 2008, p. 75). Also on South Africa, see Braun and Kanjee (2006, p. 19).284. These data were acquired on behalf of the present project, and we thank the various agencies and their repre-sentatives for providing these data, some of which are estimates, as indicated in Table 7.3. Percentages are rounded to nearest whole number.285. Sample sizes of international assessments compiled across countries can yield much larger population totals, and numbers of participation countries continue to increase. For example, PISA (2006) had more than 400,000 stu-dents participating from 57 countries. For updated information on SIMCE, see Meckes & Carrasco (2010).

112 / Cost of assessments
institutional costs (23 percent), while processing and analysis (13 percent) and test preparation (11 percent) were substantially lower.286 The data show that at the field level, the average CPL levels are not dra-matically different when compared across types of tests. Some assessments are clearly more expensive, but that the larger national and international studies confer economies of scale that reduce per-unit assessment costs. At present, the smaller EGRA studies are not less expensive at the field level. Further, some countries may have significantly more resources in their evaluation departments (such as financial, intellectual, and infrastructural), which will likely affect a number of cost variables, such as in-house versus external consulting fees and travel expenses. Moreover, hy-brid assessments are still in the research phase (with inherent costs of trial and error), such that their costs may be expected to drop substantially downstream with scale-up In addition, specific in-country needs and requirements (for example, logistics in difficult terrain) may also play a major role in determining which types of assessment are chosen, and thus how much is ultimately spent on assessment. Much depends on whether estimates are correct and whether hidden costs are fully included. Not all teams collect and store cost data. Even if they do so, these data may not be complete or sufficiently detailed for comparative analyses. Inaccuracies and discrepancies are often the result of underfunding.287 Thus, these data should be considered a preliminary view of cost comparisons, and more needs to be done with full and reliable auditing in place.
286. It should be noted that not all the data were complete for each category, or reflective of full actual costs. For example, the only available PASEC data were those projected costs for the 2010 assessments; only three sources provided test fees data; and several sources provided no data for the processing and analysis or dissemination cat-egories. Further, noting the ranges above, some categories demonstrated more variability than others. For example, processing and analysis includes average expenditures from .02 percent to 24.8 percent, while apart from three assessments (Honduras national assessment 2004, PASEC 2010 and PISA Uruguay 2003), dissemination expenditures had a mean of 5.9 percent. In addition, analysis would also need to account for the hidden costs or even unspecified costs discussed above—for example, costs in the other category for PISA Chile 2009 was over 7 percent.287. Lockheed, 2008, p. 16.

Smaller, Quicker, Cheaper / 113
TABLE 7.1. Cost categories of the assessments used in selected studies
1. Test preparation a. Creation and editing of test itemsb. Pilot testingc. Training
2. Test applicationa. Test design and editing b. Test printingc. Printing of other materials d. Distribution to examinerse. Field testingf. Control and supervision
3. Processing and analysisa. Coding and digital inputb. Marking open-ended questionsc. Additional analysis
4. Disseminationa. Report to each schoolb. Report production and distributionc. Public relations retainer
5. Institutional costsa. Personnel- in project budget b. Personnel- contributed (e.g., consultants)c. Infrastructure- in project budget (physical space for personnel) d. Infrastructure- contributede. Equipment- in project budget (e.g., computers and related testing equipment)f. Equipment- contributedg. Other (e.g., telecommunications, electricity and office supplies)h. Test fees
6. Cost breakdowna. Cost of testing per student b. Cost of educating a student (at test-specific grade level)c. Cost of testing as % of total budget for one grade d. Cost of testing as % of total secondary education budget

114 / Cost of assessments
TABLE 7.2. Cost studies of selected national, regional, and cross-national assessments
• National assessments: o SIMCE/LLECE 2004 o Uruguay national assessment 2002 o Honduras national assessment 2002
• Regional assessments: o SACMEQ II
- Swaziland 2006 - Tanzania 2006 - Zambia 2006
o PASEC 2010
• International assessments: o PISA
- PISA Chile 2009 - PISA Mexico 2009 - PISA Panama 2009 - PISA Peru 2000 - PISA Peru 2009 - PISA Uruguay 2003
o PIRLS
• Hybrid assessments: o EGRA
- Liberia 2008 - Nicaragua 2008

Smaller, Quicker, Cheaper / 115
TABLE 7.3. Costs of assessment for national, regional, international, and EGRA assessments*Test monetary costs (USD) National Assessments Regional Assessments
SIMCE 2004a
Honduras 2004b
Uruguay 2003c
PASEC 2010d
SACMEQ III Swaziland 2007e
SACMEQ III Tanzania 2007f
Test preparation 258,236 174,275 21,528 34,164 12,561 12,666
Creation and editing of test items
184,515 7,895 1,000
Pilot testing 73,721 15,749 12,561 11,666
Training 10,520
Test application 1,163,764 435,717 57,289 91,705 170,732 89,900
Test design and editing 29,403 7,415 2,000
Test printing 324,712 9,744 15,488 12,000
Printing of other materials 236,076 3,049 4,200
Distribution to examiners 103,124 6,455 73,171 2,000
Field testing 406,103 68,091 79,024 56,700
Control and supervision 64,346 13,000
Processing and analysis 382,239 130,721 26,272 12,624 454 33,300
Coding and digital input 216,048 12,624 33,300
Marking open-ended questions
166,191 454
Additional analyses
Dissemination 100,567 130,721 531 32,193 4,195 2,000
School communication 100,567 4,195 2,000
Report production and distribution
Public relations retainer
Subtotal 1,904,806 871,434 105,620 170,686 187,942 137,866
Institutional costs 938,766 12,481 24,878 25,500
Personnel- in project budget
796,864 2,737 17,561 10,000
Personnel- contributed
Infrastructure- in project budget
35,369 5,000
Infrastructure- contributed
Equipment in - project budget
106,533 9,744 7,317 10,500
Equipment- contributed
Test Fees
Other 20,028 2,043
TOTAL 2,863,600 871,434 105,620 185,210 212,820 163,366
Total Students 300,000 45,657 12,993 5,400 4,155 3000m
Total Schools
Cost per student 10 19 8 34 51 55
Cost of educating a student 767 130 484 66
Cost of testing as % of total budget for one grade
0.83 2.63
Cost of testing as % of total secondary education budget
0.17 0.33 0.07

116 / Cost of assessments
TABLE 7.3. Costs of assessment for national, regional, international, and EGRA assessments*Test monetary costs (USD) International Assessments EGRA Assessmentsl
PISA Chile
2009g
PISA Mexico
2009h
PISA Panama
2009i
PISA Peru
2009J
PISA Uruguay
2003k
EGRA - Liberia
2008
EGRA - Nicaragua
2008
Test preparation 26,448 100,301 61,475 47,956 12,357 29,345 10,882
Creation and editing of test items 26,448 3,802 13,661
Pilot testing 96,499 47,814 16,031 4,756
Training 13,314 6,126
Test application 597,958 891,501 187,157 212,486 29,707 82,260 68,683
Test design and editing 8,976 13,661 2,590 8,800
Test printing 254,899 54,644 7,196 5,600 1,395
Printing of other materials 116,156 6,831
Distribution to examiners 123,845 6,831
Field testing 462,705 394,235 98,359 198,261 67,860 67,288
Control and supervision 126,277 2,366 6,831 4,439
Processing and analysis 167,782 128,414 22,838 13,533 5,734
Coding and digital input 56,899 114,753 13,533 5,734
Marking open-ended questions 110,883 13,661
Additional analyses
Dissemination 49,912 34,153 3,865 14,092 1,850
School communication 34,153 3,865 1,500
Report production and distribution 49,912 350
Public relations retainer
Subtotal 674,318 1,159,584 411,199 264,307 78,994 126,988 85,299
Institutional costs 179,233 490,203 94,261 20,473 103,520 87,157
Personnel- in project budget 179,233 321,246 73,769 9,324 101,858 83,675
Personnel- contributed 107,286 11,149 1,403 2,500
Infrastructure- in project budget 2,743 6,831
Infrastructure- contributed
Equipment- in project budget 58,928 13,661 259 982
Equipment- contributed
Test Fees 49,863 118,599 43,197
Other 72,494 13,661 2,000 10,619 6,958
TOTAL 975,908 1,768,386 519,121 286,780 122,191 241,127 179,414
Total Students 5700n 45,079 42,000 7,967 5,797 3,770 5,760
Total Schools 240 120
Cost per student 171 39 12 36 21 64 31
Cost of educating a student 9,439 1,023 396 479
Cost of testing as % of total budget for one grade
1.20838
Cost of testing as % of total sec-ondary education budget
0.001767 0.04419 0.08

Smaller, Quicker, Cheaper / 117
*Sources for Table 7.3 are as follows. a. Source: Wolff 2007, p. 6 (for 2004 SIMCE test). Original figures for all national assessment data above (namely SIMCE 2004, Honduras 2004 and Uruguay 2003) and PISA Uruguay 2003 were published in Wolff 2007 in local currencies. b.Source: Wolff, 2007, p. 13; 2004 17.68 Honduran Lempira to 1 USDc. Source: Wolff, 2007, p. 11; 2003 28.24279 Uruguayan Peso to 1 USDd. Source: PASEC 2010 technical report (personal communication, P. Varly, May 2009). Converted from Euros to USD, 2009 annual rate.e. Source: Personal communication, A. Mrutu, August 2009.f. Source: Personal communication, J. Shabalala, August 2009.g. Source: Personal communication, E. Lagos, September and October 2009.h. Source: Personal communication, M. A. Diaz, September 2009.i. Source: Personal communication, Z. Castillo, September 2009.j. Source: Personal communication, L. Molina, September 2009.k. Source: Wolff, 2007, p. 14; 28.24279 Uruguayan Peso to 1 USD (2003)l. Source: Personal communication, A. Gove, August 2009.m. Estimate, based on SACMEQ II sample of 2854n. Estimate, based on email of E. Lagos, October 2009
Table 7.4. Costs by category, as percentages of total assessment expenditures
Cost category Average Lowest Highest
Test preparation 11% 3% (PISA Chile, 2009)
20% (Uruguay, national assessment, 2003)
Test application 50% 24% (PISA Uruguay, 2003)
80% (SACMEQ III, Swaziland)
Processing and analysis 13% 1% (SACMEQ III, Swaziland)
25% (Uruguay, national assessment, 2003)
Dissemination 6% 1% (Uruguay national assessment, 2003)
17% (PASEC, 2010)
Institutional costs 23% 7% (PASEC 2010)
49% (Uruguay, national assessment, 2003)
Test fees 16% 5% (PISA Chile, 2009)
35% (PISA Uruguay, 2003)
Other 3% 1% (PISA Peru, 2009)
7% (PISA Chile, 2009)
Note. Above calculations based on data from 13 assessments (see Table 7.3 for costs included in each category and for each assessment)
Ways of Thinking about Costs
In developing countries, educational decision makers will find themselves with more choices than available resources. The cost-benefit picture remains insufficient, be-cause not enough reliable data have been collected on assessment costs per informa-tional quality output. Moreover, the current scientific, technological, and political dynamism in educational improvement strongly suggests that models of assessment will change in relation to testing advancements and increasing demand. The necessity for both clear testing choices and actionable indicators is likely to grow.

118 / Cost of assessments
Recent assessment innovations suggest momentum toward newer models of assessment that both emphasize a needs-centered and just enough approach to testing.288 This means that innovations (the EGRA tools being a good example) may help to grow the scale of test application, shrink upfront overt costs, such as translation and test preparation, and reduce turnaround time such that ministers can have actionable data sooner and, thus, with less staff and overhead.289 The three key parameters below summarize the cost issues of assessments that will need to be considered, especially in resource-constrained LDCs. Scale
Ministries of education in developing countries may need to consider which assess-ment would yield targeted and responsive educational data about a specific popula-tion (for example, rural girls or ethno-linguistic groups), a group of schools, or a particular subject at a specific grade level. LSEAs typically cannot respond flexibly to such requests because of the significant up-front preparation and pre-assessment exercises that constrain near-term changes and lock in comparability parameters. Further, most LSEAs are not designed to provide classroom-level indicators but rather systemic indicators.290 By contrast, limited sample household-based surveys, or EGRA style hy-brid assessments, can save money, because they can reduce the number of individu-als to be assessed in order to answer a more specific set of policy questions, and can be deployed and adjusted more frequently. Still, recent sampling innovations in LSEAs (such as PIRLS) suggest that such studies provide multi-level data291 and that enlarging a sample may be worth the marginal costs because of economies of scale.292 In other words, lower cost in CPL is a relative term. Timeliness
Two types of timeliness are crucial to the possible benefits of assessments: the time-liness of the testing cycle—from planning, rollout, and data collection to analysis and dissemination (and subsequent policy debates). Timeliness can also refer to the right time of information availability and use. For example, if timely information about a group of schools is ready in advance of major school finance decisions, then those data can show real-time sensitivity. Or a population of students may
288. Wagner, 2003.289. Braun and Kanjee suggest that if resources are limited, MOEs may do better to consider a partial participation in a regional or global assessment (2006, p. 36). This intermediate step may help to better discern the real benefits of conducting an LSEA.290. See Volante, 2006, p. 7.291. Porter & Gamoran, 2002; RTI, 2009, p. 76.292. Wolff ( 2008, p. 19) states: “…large samples can be expanded to censal testing at a low marginal cost, since the fixed costs of developing items and pilot testing can be amortized over a larger population.”

Smaller, Quicker, Cheaper / 119
need assistance to reach grade-level competence in reading, and data may confirm, disconfirm, or guide the decision-making process. In addition, as noted earlier, there is a need to consider the merits of early intervention in the learning trajec-tory of students, much as the arguments have been made in the medical field for early detection systems.293 In sum, credible assessment data needs to be gathered as quickly as possible in order to effectively shape policymaking, yet it also needs to be available at the right time. Moving toward timeliness can help to reduce overall costs of assessment and intervention.
Cost Efficiency
As mentioned above, some assessments are relatively expensive in terms of upfront cost outlays, with requirements of expensive professional staff and consultants, and trained field enumerators. These and other costs can be seen in terms either total costs, or the CPL. Either way, budgetary limits on discretionary funds in LDCs will require careful scrutiny as assessment choices are made. Given the paucity of credible data on costs in LDCs today, it is difficult to derive an evidence-based decision pathway for multiple contexts. There is a clear need to determine more precisely what expenditures are likely to reveal particular policy-relevant types of outcomes. For example: how much better training for enumerators will yield better inter-rater reliability? Or, as in a recent effort in India, can volunteers become low-cost, reliable, and sustainable enumerators with relatively little training at all?294 More research is needed is to better clarify the cost merits of different assessments.
Adding up the Costs
Costs are an inherent part of any social intervention, and the assessment of learn-ing – and its policy consequences – constitute a clear case in point. The issue is what does a ministry (or funding agency) get for the investments that are made. Gathering data on the comparative costs of assessments is not easy. However, some reference points are now available that can be considered. Perhaps most important is the trade-off between time and money. For example, a minister of education
293. Preventive medicine highlights the need for good and timely information. Timely information can make the difference between life and death or the spread of an epidemic or its curtailment. Proactive measures cost less and help avert the worst. Preventive medicine is encouraged not only to avert illness, but also to reduce costs of diag-nosing and treating that illness (Szucs, 1997). Similar arguments can be made in the education arena. For instance, absenteeism and drop-out are well-known problems in LDCs, incurring huge financial and social costs. Two measures have been highly successful against these difficulties: decreased grade repetition (Ndaruhutse, 2008) and increased bilingual education (Grin, 2005; Heugh, 2006). If tests could assist in both detecting and “diagnosing” schooling dif-ficulties earlier—from the cognitive to the socio-behavioral—they may assist in heading off costly student problems such as the rate of dropout. In other words, even if SQC style diagnostic tools cannot easily determine the ‘best’ remediation plan of action (which may be varied and complex), the early detection aspect will nearly inevitably be more cost effective in the long run.294. Banerji (2006).
120 / Cost of assessments
who may have up to five years to decide upon and implement policy. In this case, regional or international LSEAs such as SACMEQ or PASEC may provide some solid answers on key issues and offer a sense of comparison from one country to the next. Given the current economies of scale in countries that repeat international assessments, the actual CPL of such LSEAs is not much different from that of the EGRA and hybrid assessments that have much smaller sample sizes. On the other hand, if a minister does not have three to five years and if the focus is more on helping programs, schools and regional districts to improve their near-term learning achievement, then even a small-scale sample based assessment, such as EGRA, looks much cheaper.295 Although the CPL in EGRA appears similar to the larger international assessments at present, the future costs will likely drop as EGRA tools become more familiar and enumerators become better trained. The foreshortened time to analysis and dissemination will likely reduce recurrent costs in human resources. Finally, there are opportunity costs to consider. LSEAs wait to assess chil-dren until they are in fourth grade (or later), when children may be far behind in reading development. This can impose high costs in remediation that early assess-ment could prevent. Catching up is expensive and difficult—and this may lead to school failure, the most important cost that policy makers seek to avoid. In sum, learning assessments are fundamental to changing education in any country. But learning assessments entail costs that need to be evaluated and compared. Gone are the days when ministerial agencies can lend their staff to other agencies, or when outside donor agencies will fully pick up the tab for large scale assessments. It is now a time of fiscal constraints. It is also a time when understand-ing learning has to be balanced against what is learned, for what purposes, and at what cost. Determining assessment costs is likely to become an issue that will need greater attention in the coming years.
295. See also Chabott (2006, p. 24) who states: “Good reading programs will cost more per pupil than current read-ing textbooks and teacher education. They may also demand more time than is currently allocated in the curriculum. However, good reading programs may be more cost effective than weak ones.”

Smaller, Quicker, Cheaper / 121
8. Adult Literacy Assessment
Where formal education systems are flanked by programs of early learning and lit-
eracy and skills development, additional benefits accrue to the individual, the com-
munity, society, and formal education itself. Children who enjoyed early learning
opportunities learn better in formal education, while educated adults, as parents,
make bigger efforts to enroll their children and to support them when in school.296
Adult literacy has been the subject of a growing number of scholarly studies in recent years.297 Historical research indicates that literacy was often transmitted and practiced outside of schooling, and in that sense traditional literacy was conveyed as more of a social process, rather than strictly an educational one. This points to an important perspective: namely that literacy, a cultural phenomenon, is practiced in a complex variety of settings and contexts. While most children in today’s world are instructed to read in classroom settings, levels of skill acquisition for both chil-dren and adults may be determined significantly by the out-of-school determinants. Previous sections have focused primarily on reading assessment for chil-dren in school settings. In contrast, the present discussion of adult literacy assess-ment revolves more around literacy use as practiced outside of school contexts, and how such use is measured.
Importance of Adult Literacy Today
Literacy remains among the most neglected of all education goals. Progress towards
the 2015 target of halving illiteracy [EFA Goal 4] has been far too slow and uneven.298
At its founding in 1946, UNESCO put literacy at the top of its education and hu-man rights agenda. Considerable progress has been made over the past half-century. Levels of low-literacy and illiteracy are considered to be a significant problem in the 21st century across the world (Table 5.1), but in particular in developing countries (Figure 8.1).299 Over time, numerous rationales have put forward to justify invest-
296. UNESCO, 2004, p. 60.297. See Wagner et al., 1999, for an overview.298. UNESCO (2010), p. 94.299. UNESCO (2005). The GMR on Literacy for life takes up issues of child and adult literacy, as well as literacy statistics and assessment.

122 / Adult literacy assessment
IraqEgypt
Sudan*Yemen
MauritaniaMorocco
IndiaNepal
Pakistan*Bangladesh
Bhutan*Afghanistan*
Kenya*Uganda
U. R. TanzaniaNigeriaMalawi
Madagascar*Zambia
Cameroon*Angola*
Dem. Rep. Congo*Ghana
Rwanda*Eritrea
Burundi*LiberiaTogo*
Côte d’Ivoire*Central African Republic*
MozambiqueSenegal*
BeninSierra Leone
EthiopiaChad
Guinea*Burkina Faso*
Niger*Mali*
0 10 20 30 40 50 60 70 80
Arab States (19)
South and West Asia (9)
Sub-Saharan Africa (41)
Adult illiteracy rates (%)
Regionalaverage29%
Regionalaverage36%
Regionalaverage38%
Notes: For countries indicated with *, national observed literacy data are used. For all others, UIS literacy estimates are used. The estimates were generated using the UIS Global Age-specific Literacy Projections model. Figures in parentheses after region names indicate the number of countries with publishable data in the region.
Adult (15 and over) illiteracy rates in countries with rates of 25% or more in selected regions, 2000–2007
FIGURE 8.1. Illiteracy in selected developing countries, by region1
Adapted from UNESCO 2010, p. 96.

Smaller, Quicker, Cheaper / 123
ments in adult literacy: economics (higher skills lead to economic growth); social development (women’s empowerment); political science (growth of democracy, na-tional identity; and education (literate parents foster literate children).300 For the purposes herein, adult literacy acquisition is considered both as an EFA goal 4 in itself, as well as from the strong evidence supporting the role of parents’ literacy in helping their children become literate. In addition, the science of literacy acquisition can offer mutually reinforcing perspectives for children and adults. For example, adult literacy acquisition has much in common with children’s acquisition, much as second language acquisition in adults has fundamental simi-larities to the same processes in children. As such, it is important to think of literacy acquisition and its assessment as lifespan issues in education and development.301
Assessing Adult Literacy
Until the mid-1990s, most countries measured adult literacy by only a simple ques-tion: “Can you read, or not?” Usually this question was posed as part of a census ex-ercise, rather than through direct assessment of skills (Figure 8.2).302 As mentioned earlier, UNESCO solicits literacy data worldwide, where literacy has been provided by many countries (especially developing) in terms of the number of “literates” and “illiterates.”303 For most countries, this dichotomous type of classification presents few practical (or technical) problems and is relatively inexpensive to gather, while providing international agencies with a cross-national and time-series framework for analyzing literacy by geographic or economic world regions.304
300. See Wagner (1995) for an indepth review of each of these rationales.301. For more on a life-span approach to literacy, see Wagner (2010).302. For a review of adult literacy prepared for the Dakar EFA meetings, see Wagner, 2000.303. Indeed, for LDCs, some of the data on adult illiteracy in the GMR on literacy (UNESCO, 2005) remains such di-chotomous data sources. But there has been movement over recent decades. According to Smyth (2005, p. 12), data on literacy in (UNESCO, 1978) was based on the following: “In the projection exercise, school enrolment ratios for the 6-11 age group were utilized for estimating future illiteracy rates for the 15-19 age group, and these … were then utilized for estimating future illiteracy rates for the population aged 15 and over.” Furthermore (according to Smyth, p. 21), numerous countries gathered information via national censuses; but “at any given year during the 1980s and 1990s, up-to-date data would be available for only a limited number of countries; … others for which the most recent data were 10, 15, 20 or more years old...” In other words, even though census data became available, it was almost always based on self-enumerated “illiteracy,” without information on language of literacy, and with about half the countries using data that were at least one or more decades out of date.304. In a recent UIS report (Carr-Hill, 2008, p. 18), it was argued that the dichotomous census data definition should be maintained: “A problem with the multidimensional methods is that the various dimensions and the relations be-tween them are more likely to be understood in different ways over time and across cultures when compared to the simple dichotomous variable, “Can you read and write?”, which is more likely to be perceived and understood over time and across cultures in the same way. … The dichotomous variable is frequently used as an explanatory variable, and changes in the literacy level measured that way is taken, for example, as a predictor of likely fertility rates.” For a critical review of such ‘dichotomies’ in literacy statistics, see Wagner, 2001.

124 / Adult literacy assessment
Can
not
read
(%)
30
40
0
10
20
Lao
PD
R
Bo
livia
São
To
mé/
Prí
ncip
e
Bur
und
i
Co
mo
ros
Rw
and
a
Cam
ero
on
Eq
uat.
Gui
nea
Mad
agas
car
Uzb
ekis
tan
Cen
tral
Afr
ican
Rep
ublic
Tajik
ista
n
Sier
ra L
eone
Nig
er
Cha
d
33 3
911 11 13 13 14 14
19 20 22
29
34 35
Source: Calculations based on UNICEF MICS database.
Cô
te d
’Ivo
ire
FIGURE 8.2. Adults with primary as their highest education level who report not being able to read
Because such a self-report dichotomy is a blunt measurement instrument (of limited value either for policy or individual use), substantial efforts have been made, over the past two decades or so to gain a better sense of specific adult lit-eracy levels.305 The first major international effort at skills assessment was the 1995 International Adult Literacy Survey (IALS), which was mainly undertaken in indus-trialized countries.306 The IALS utilized a five-level categorization method for liter-acy, along three different scales: prose literacy, document literacy, and quantitative literacy (or numeracy). Critics have pointed at problems with these adult survey scales in terms of the degree of international comparability, population sampling differences across IALS countries, and item comparability.307,308
305. As pointed out in an earlier footnote (Chapter 4), one of the first attempts at moving beyond the dichotomous types of data collection was the use of a household adult literacy survey, undertaken in Zimbabwe, in two local African languages (UNSO, 1989).306. OECD/Statistics Canada, 1995, 1997, 2000. The IALS methodology is based in large part on a number of nation-al predecessors, such as the 1993 U.S. National Adult Literacy Survey (Kirsch et al., 1993), which invested significant resources in improving the technical and psychometric properties of literacy assessment instruments, using a variety of techniques, including methods for expanding the range of items used in a survey format, including IRT as well.307. See Kalton et al. (1998), and Levine (1998).308. In 2011, OECD will implement a follow up (after IALS) adult literacy study, Programme for the International As-sessment of Adult Competencies (PIAAC); see http://www.oecd.org/dataoecd/13/45/41690983.pdf
Adapted from UNESCO, 2005, p. 128.

Smaller, Quicker, Cheaper / 125
At about the same time, the International Literacy Institute (ILI)309 col-laborated with UNESCO on the Literacy Assessment Project (LAP) that focused on smaller scale and more flexible efforts at adult literacy assessment in LDCs. The goal was to provide better data on literacy rates and make these data available and more transparent for the primary end-users in terms of agencies and programs that teach adults, as well as to deliver results more quickly. The LAP reports focused on several types of assessment tools and sponsored several pilot efforts were spon-sored in developing countries.310 LAP also promoted the aforementioned notion of “shareability” between international agencies and local programs, through which an active attempt was made to utilize user-friendly methods and data storage tools. This idea was a response to the problems (evidenced in IALS and other LSEAs), where only a few select specialists could understand (and therefore challenge or re-use) the data gathered. The LAP work on smaller and quicker assessments helped to create the SQC model of hybrid assessments, and presaged the eventual work of EGRA with children.311 With the launch of the UN Literacy Decade in 2003, the UNESCO Institute for Statistics (UIS) began the Literacy Assessment and Monitoring Program (LAMP) that builds on some of the tools developed through the IALS, but was refocused on adult literacy assessment in developing countries.312 Over the past half-dozen years, LAMP has engaged in pilot testing various instruments designed to improve information on literacy rates in LDCs. LAMP has tried to blend an ap-proach that seeks international comparability but also takes into account cultural diversity, a goal (as discussed earlier) that poses inherent difficulties.313 As with SACMEQ, LAMP has stated that one of its primary contributions is to enhance capacity building in developing countries.314
309. The International Literacy Institute (at the University of Pennsylvania) was co-established by UNESCO in 1994.310. See ILI-UNESCO (1998, 1999, 2002) for basic documents on the LAP. These documents are downloadable at ILI’s website, www.literacy.org.311. Many of the principles of SQC (Wagner, 2003) that support the approach of EGRA were present in the LAP, such as early detection, validity with less dependency on large and time-consuming data collection, empirical rigor relative to some previous community-based methodologies, and the importance of timeliness.312. See UIS (2009). LAMP began in 2003 with major funding from the World Bank and UNESCO. Since that time, much of the focus has been on planning and design, with initial pilot testing in 5 countries: El Salvador, Mongolia, Morocco, Niger, and Palestinian Autonomous Territories.313. In LAMP, comparability is described as follows: “The comparison component is related to the need for common ground corresponding to the universality of the right to education, thereby preventing the establishment of differen-tiated procedures (or double standards) that might involve discrimination. If there are differentiated sets of literacy definitions for the poor versus the rich, women versus men, and indigenous versus non-indigenous populations, it would entail a potentially high discriminatory practice that might imply different entitlements in relation to the right to education.” LAMP (2009), p. 24. This explanation does not seem to be able to provide substantive direction on how cultural differences can meet the standard of international comparison.314. For a recent review of UNESCO’s efforts in literacy assessment, see Wagner (2011).

126 / Adult literacy assessment
Adult Learner Needs
One of the main distinguishing features of adult and nonformal education pro-grams is that they are nearly always voluntary (as contrasted to schooling) for par-ticipants.315 Thus, learners themselves make important choices in adult learning contexts. Many learners may ask themselves: What am I going to get out of partici-pation in this adult literacy program, especially in light of the work and life needs that I have in my own household or community?316 Drop-out rates in adult educa-tion worldwide are often around 50 percent within the first half of any substantive program of study. This is an oft-cited indicator that adult learners “vote with their feet” when it comes to programs that are poorly adapted to their interests.317 Countries concerned about overcoming inequalities will need to collect better information on both the learning trajectories of adult learners as well as their attitudinal dispositions for participation, particular purposes, and specific languag-es.318 Improved literacy measurement and data collection can provide better an-swers to programs for adult learners, as well as to the adults themselves. Hybrid assessments for adult learners (using SQC- and EGRA-like methods) are likely to appear more frequently in the future, at least in part because of the importance of providing timely feedback to agencies and program participants.
Child and Adult Reading Acquisition
Compared to basic process research on children, … basic research on [adult] read-
ing processes of low-literacy adults is impoverished.319
In what ways is beginning reading acquisition similar or different among children and adults? Since adults have a much more complete repertoire of cognitive and linguistic skills (as well as general knowledge) than most beginning readers of pri-mary school age, one might assume faster reading acquisition in adults, but perhaps along similar lines as described for children’s reading acquisition (in Chapters 5 and
315. Some literacy campaigns shortly after World War II were, in fact, compulsory (Arnove & Graff, 1987).316. Various ethnographic studies of adult literacy programs affirm the doubts of many adult learners’ interest in spending time in such programs. See, for example, Puchner (2001) and Robinson-Pant (2004).317. This perspective also connects with ethnographic approaches to adult literacy focused on adult uses and prac-tices in literacy. See, for example, Papen (2005) and Street (2001).318. (Robinson, 2004, p. 15-16) states: “Such is the prejudice of certain elites and groups that in some situations a language is defined as a language [only] because it is written, condemning unwritten languages to an inferior status – often not as languages, but as dialects. … There persists a myth in some quarters that acquiring literacy in one language reduces the chances of acquiring it satisfactorily in another: thus to acquire mother tongue literacy may be seen a brake on acquiring literacy in a more widely used language.” Further, in the area of adult language choice, it is important to bear in mind that many adults are situated in diglossic contexts, where more than a single language is used for communication. In numerous Arabic-speaking countries, for example, women (especially) spead colloquial Arabic, while mean are more likely to speak both colloquial and classical Arabic (Khachan, 2009). This can lead to considerable problems in the design and promotion of Arabic adult literacy programs.319. Venezky & Sabatini (2002), p. 217.

Smaller, Quicker, Cheaper / 127
6). Though conceptually persuasive, little empirical research has been undertaken on this topic, either in industrialized or developing countries. The available re-search to date suggests both some commonalities and differences between children’s and adults’ reading acquisition.320 A clear area of commonality is the language di-versity that both children and adults face in multilingual societies. The relationship between linguistic diversity and adult literacy is dramatic. One recent report, based on the earlier U.S. National Assessment of Adult Literacy, considered the profiles of what were termed the “least literate adults,” namely those adults at the lowest rung of the literacy ladder.321 It found that nearly 60 percent of such adults were below the United States’ poverty line, and that a sig-nificant number of these adults had been diagnosed with prior learning disabilities. In one interesting link to the present report, this study compared reading fluency across the different levels of adult reading, from “below basic” to “proficient.” As shown in Figure 8.3, adults at the lowest level were far more likely to show low reading fluency (below 75 correct words per minute) than adults at any of the three higher levels. Basic decoding skills were a problem for these adults, in ways similar to those found with children who are beginning readers. From the cognitive model provided in Chapter 5, this similarity seems straightforward.
Literacy Relapse
Children who do not attain a certain level of reading fluency in [grades one to three]
will likely relapse into illiteracy if they drop out of school in [fourth or fifth grade].322
As noted in Chapter 1, one of the most important global education policy issues today is how much schooling is necessary for children (or adults) to attain enough lit-eracy and other skills in order to impact social and economic life. Indeed, it is some-times claimed for developing countries that at least four to six years of primary school for children is the intellectual human resources foundation upon which national
320. Durgunolu and Öney (2002) tested a sample of Turkish women in an adult literacy program before and after 90 hours of literacy instruction on a number of cognitive skills. They compared the results with data obtained in earlier studies from children learning to read in Turkish. The authors conclude that key skills of literacy development are the same for both children and adults, but they also found that phonological awareness functioned differently as a pre-dictor of reading ability after the first grade for children, or the 90-hour learning course for adults. Further, in compar-ing these results with skills found for English-speaking children in the U.S., they found that the roles played by letter recognition, phonological awareness, and listening comprehension were highly dependent on the target language. In another study, Greenberg et al. (2002), in the United States matched English-speaking children and reading grade equivalent English-speaking adult learners (grade equivalents third through fifth) on gender, race, and residential area. They then examined their word recognition errors in both samples. They found that adults tend to use more visual/orthographic strategies when encountering word recognition problems, whereas children reading at the same grade equivalent use more decoding and other phonetic strategies for both word recognition and spelling.321. U.S. Department of Education, NCES, 2009.322. Chabbott, 2006, p. 25.

128 / Adult literacy assessment
economic growth is built.323 In addition, a similar argument could be made about how much instruction is required for skills to be retained by learners. The argument is that a threshold number of years of education is required for more-or-less permanent reading skills to be retained by the school-aged child or adolescent or adult. Within this line of reasoning, the concept of literacy retention (or con-versely, literacy “relapse” as it is often called) is central, since what children learn and retain from their school years—similarly for adults in nonformal and adult
323. As discussed in Chapter 5, similar arguments are made in terms of moving from L1 to L2, in order to reach a threshold of skill acquisition.
0
20
20
40
40
60
60
80
80
100
100
49
2211
1321
15
86
23
26
27
14
81
11
27
55
43
2
Percent reading 75 or more
words correct per minute
Percent reading fewer than 75 words correct
per minute
Below Basic Intermediate ProficientBasic
Prose literacy level
105 or more words correct per minute
90–104 wordscorrect per minute
75–89 wordscorrect per minute
Fewer than 60 words correct per minute
60–74 wordscorrect per minute
NOTE: Detail may not sum to totals because of rounding. Adults are defined as people 16 years ofage and older living in households or prisons. Adults who could not be interviewed because of languagespoken or cognitive or mental disabilities (3 percent in 2003) are excluded from this figure.Source: U.S. Department of Education, Institute of Education Sciences, National Center forEducation Statistics, 2003 National Assessment of Adult Literacy.
FIGURE 8.3. Percentage of adults in each Basic Reading Skills level in the U.S. National Assessment of Adult Literacy
Adapted from U.S. Department of Education, 2009, p. 23.

Smaller, Quicker, Cheaper / 129
literacy programs—is thought to be what can be used in productive economic activities later on in life. When learners fail to retain what is taught in an educa-tional program, educational wastage occurs. Those individuals (children or adults) will not reach the presumed threshold of minimum learning, which would ensure that what has been acquired will not be lost and for self-sustained learning to be maintained. Similar arguments have been made in other cognitive domains, such as foreign (and second) language acquisition. Only modest empirical research has dealt directly with literacy skill reten-tion in developing countries.324 Lack of appropriate assessment tools has limited solid conclusions in developing countries to date. Furthermore, longitudinal stud-ies are needed so that an individual’s school or literacy program achievement may be compared with his or her own performance in the years after leaving the instruc-tional context. The limited empirical research in this area has found little support for the notion of literacy relapse.325 More research is clearly needed, this should be more possible with the advent of new hybrid assessment tools.
Moving Forward on Adult Reading Assessments
Most assessments of reading skill acquisition have been done with children, in contrast to youth or adults. As noted earlier, the largest share of research has been done on few languages. There is, therefore, much to be done in providing a more complete picture of adult reading acquisition that parallels that of children’s acqui-sition, especially given the continuing importance of adult literacy in LDCs. The few studies that exist seem to indicate that skill learning in children and adults may follow a roughly similar course. Yet, important differences exist. Adults have larger working vocabularies than those of young children: What role does this play in adult reading acquisition? Other questions about adult literacy are the following. What roles do attitude and motivation play? Why should adults want to learn to read? How can policy makers and educators influence the response to the previous question? With improved assessment tools for adult literacy work in LDCs answers to these questions should become available in the near future.
324. The World Bank focused further attention on this matter in a recent evaluation overview (Abadzi, 2003). Earlier studies some from Comings (1995), Hartley & Swanson (1986); Roy & Kapoor (1975).325. In one of the few longitudinal studies carried out, Wagner et al., (1989) focused on the retention of literacy skills among adolescents in Morocco, all of whom dropped out of school before completing the fifth grade of their stud-ies and were followed into everyday settings over a two-year, post-schooling period. The skill retention outcomes showed that Arabic literacy skills were not lost two years after the termination of schooling. Indeed, depending on the nature of post-schooling experience (for example, work outside the home as contrasted with household chores mainly within the home), many adolescents actually increased their literacy skills.

130 / Recommendations
9. Recommendations
If you don’t know where you are going, any road will get you there.326
Assessments are here to stay, and increasingly will be used globally and locally for a variety of policy and practical purposes. This volume has presented some of the advantages and difficulties associated with the use of learning assessments, particu-larly focusing on poor and developing countries. There is not a single way to do an assessment, and countries may have very different purposes for their assessments. There is no ideal assessment—rather, there are a variety of scientific approaches that can and will provide solid and credible avenues towards improving the quality of education. One size does not fit all. Many varieties of tools for measurement and assessment are available. There is an urgent need to calibrate assessments relative to specific policy goals, timeliness, and cost. These issues and others have resulted in a set of policy rec-ommendations summarized below. For a quick reference to the pros and cons of assessment choices, see Table 9.1.
There is no “Best” Reading Test A reading test, as with any assessment tool, is only useful to the degree that it responds to particular policy needs. At one end of the range, one can note the rela-tively large LSEA designs (such as PIRLS and PISA) with resources that focus on assuring standards and international comparability, and within a time frame that takes at least several years to provide both international- and national-level results. The regional assessments (such as SACMEQ, PASEC, and LLECE) function in similar ways to the large LSEAs, but they assure that the regional curricular dimen-sions are given substantive attention. Hybrid assessments, such as EGRA (in several current variations), provide less standardization, limited cross-national comparability, but focus on the cognitive components that make up early reading development. EGRA can also be used as a guide to improved instruction, and several intervention studies are now underway. There is the issue of standards. If the goal is to better understand how top students learn (and thus be able to compare with top OECD performing
326. Carroll, 1865.

Smaller, Quicker, Cheaper / 131
TABLE 9.1. Summary of benefits and limitations of various assessments
Type of Assessment
Benefits Limitations
LSEA/International assessments
• Global credibility• Comparability across nations• Generalized claims about relation-
ships between variables• Statistical sophistication• Capacity building• Sample-based assessment• Secondary analyses possible from
stored databases
• Considerable effort to achieve comparability
• Compromises required to achieve technical comparability can lead to loss of local validity
• Compromises to achieve interna-tional samples can leave out im-portant groups (e.g., by language, ethnicity, citizenship)
• Time required to achieve results is usually at least 3-5 years
• Age of assessment, using group tests, begins only in fourth grade at earliest
• Typically requires high-level statisti-cal skills for processing (e.g., IRT, HLM)
• Data is often too complex or too late for local/national analyses
• Overall costs are significant, especially with personnel costs fully included
Regional Assessments
• Regional focus allows participating countries to work together toward common goals.
• Assessments can contain elements of national assessments, leading to greater validity with school systems
• Capacity building is important focus of effort, given the tie in with national ministries of education and their staff
• Regional focus connects neither with international nor SQC/EGRA style assessments.
• Time to completion seems to be as long (or longer) than better funded LSEAs
• Regional variation by earliest grade tested, and frequency of assess-ment is uncertain.
National Assessments
• Supports directly the mission of the Ministry of Education
• Uses Ministry of Education person-nel
• Assessment covers all students in school (census based)
• High concurrent validity with cur-ricular content
• Little relationship with data collec-tion in other countries
• Does not cover out-of-school children
• Is only available at end of school year or after.
• Data collected may be unrelated to underlying instructional variables
• High number of data collection personnel
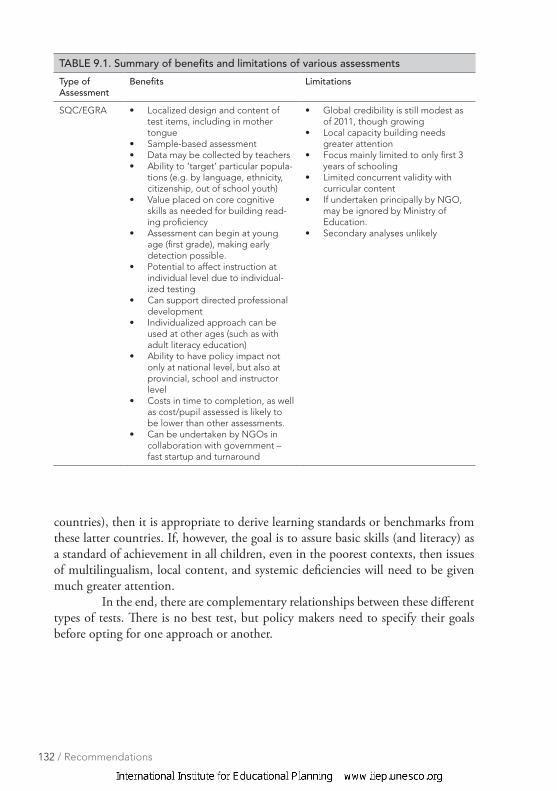
132 / Recommendations
TABLE 9.1. Summary of benefits and limitations of various assessments
Type of Assessment
Benefits Limitations
SQC/EGRA • Localized design and content of test items, including in mother tongue
• Sample-based assessment• Data may be collected by teachers• Ability to ‘target’ particular popula-
tions (e.g. by language, ethnicity, citizenship, out of school youth)
• Value placed on core cognitive skills as needed for building read-ing proficiency
• Assessment can begin at young age (first grade), making early detection possible.
• Potential to affect instruction at individual level due to individual-ized testing
• Can support directed professional development
• Individualized approach can be used at other ages (such as with adult literacy education)
• Ability to have policy impact not only at national level, but also at provincial, school and instructor level
• Costs in time to completion, as well as cost/pupil assessed is likely to be lower than other assessments.
• Can be undertaken by NGOs in collaboration with government – fast startup and turnaround
• Global credibility is still modest as of 2011, though growing
• Local capacity building needs greater attention
• Focus mainly limited to only first 3 years of schooling
• Limited concurrent validity with curricular content
• If undertaken principally by NGO, may be ignored by Ministry of Education.
• Secondary analyses unlikely
countries), then it is appropriate to derive learning standards or benchmarks from these latter countries. If, however, the goal is to assure basic skills (and literacy) as a standard of achievement in all children, even in the poorest contexts, then issues of multilingualism, local content, and systemic deficiencies will need to be given much greater attention. In the end, there are complementary relationships between these different types of tests. There is no best test, but policy makers need to specify their goals before opting for one approach or another.

Smaller, Quicker, Cheaper / 133
When in Doubt, Go with Smaller Assessments
LSEAs tend to be on the big side. The number of participating countries is large; population samples are large; testing instruments must be vetted by experts; overall cost is often in the millions of dollars; and it often takes multiple years to achieve closure. This model fits with the overall goal of most LSEAs—namely to provide a highly credible benchmarking methodology that can give a Minister of Education an update on national achievement levels in comparison to other countries (and other outcomes as well). In contrast, hybrid smaller assessments assume a set of national and local stakeholders that could include directors and teachers in programs, and possibly employers, communities and parents. Learners may be considered to be among the stakeholders, as they have a vested interest in the quality of the program they attend. Hybrid assessments can take advantage of their modest size by exploring more deeply the multiple (and often context-dependent) factors that affect learning outcomes, such as language of instruction, language of assessment, and opportu-nity to learn. Furthermore, the early engagement and involvement of this diverse set of stakeholders can be taken into consideration. That is what EGRA and similar assessments seek to achieve. Overall, SQC assessments have a distinct smaller-size advantage in that the human resource requirements can be better tailored to the human capacity realities of low-income societies. These assessments should be care-fully tailored to be “just big enough.”327
Quicker Results are Better Results Some assessments, especially at the international or regional levels, are undertaken ev-ery 3 or 5 or even 10 years. There are clear costs in time, money and lost opportunity associated with assessments that result in a relatively long turnaround time. As re-viewed here, the time taken to closure in most LSEAs can be a very serious limitation. Conversely, with the advent of hybrid quicker assessments—that have smaller and more focused aims and sample sizes—the frequency of assessment be-comes more possible within a smaller budget. Frequency is less important if one does not care very much about near-term interventions. But, if an important goal is early detection—so as to implement new policies that can be judged on their near-term impact—then frequency becomes one key way to assure goal-related results. Furthermore, with SQC hybrid assessments, it becomes possible to provide results in nearly real time—within a matter of months if need be—and most likely in time for
327. Abraham Lincoln, the U.S. President, is famously cited for stating: “How long should a man’s legs be in propor-tion to his body?” Lincoln replied: “I have not given the matter much consideration, but on first blush I should judge they ought to be long enough to reach from his body to the ground.” This was apparently made in his presidential campaign (1858), in response to the question: “How tall are you?” The response implied: Just tall enough.

134 / Recommendations
the policy maker who authorized the study to see its outcomes.328 Needless to say, as-sessments that can be conducted in real time can have enormous payoff for teachers, schools, and students, whose lives could be affected positively by the results.
In Assessments, You Don’t Always Get What You Pay for
[We must] cultivate among all stakeholders (politicians, policy-makers, education bu-
reaucrats, principals, teachers, and parents) a deeper appreciation of the power and
cost-effectiveness of assessment. This requires a comprehensive framework to struc-
ture discussions about assessment and assessment capacity, as well as case studies
that document the (favorable) returns on investment (ROI) yielded by well-planned
investments in assessment, often as part of a broader education reform initiative.329
There is an old saying: If you think knowledge is expensive, try ignorance. If the policies one is trying to apply are failing (such as universal basic education, with children’s literacy as a core component), then the cost of such failures should be compared to the cost of determining how to rectify inadequate policies. Surprisingly, the costs of relatively expensive versus cheaper assessments have only infrequently been the focus of policy attention. As described in Chapter 7, the costs of assessment studies of all kinds are quite variable. However, on a cost-per-person basis there is some similarity between LSEAs and hybrid assessments, because of the economies of scale in the former. However, the total costs of LSEAs can be quite considerable when taking into account the number of countries, the amount of high-level professional expertise, and the technical requirements of data collection and analyses. Naturally, there are trade-offs in costing processes: from limiting sample sizes, to the length of tests created, and to the degree of trained personnel required. Most of these trade-offs are more easily achieved in hybrid assessments, because the degree of comparability is limited, and the focus can be on a limited set of local or national policy goals. Hybrid assessments, especially in an era when frequency and timeliness become more important, will likely result in a cheaper way of doing the business of assessment.
328. With the ASER tests by Pratham in India, one goal has been to provide immediate feedback to the community as to early reading. Further details on this aspect of exceptional timeliness are not as yet available.329. Braun & Kanjee, 2006, p. 36.

Smaller, Quicker, Cheaper / 135
Learning Assessments Should Begin as Early as Possible (Within Limits)
As with many other kinds of investments, learning may be thought of as a function of capital growth. Chapter 4 shows that the return on investment (ROI) to educa-tion is substantially greater when investments are made at a younger age. In the area of assessment, the costs of treatment will be lower (and concomitant ROI higher) if detection of reading and other skills can be made earlier rather than later. Hybrid assessments (such as EGRA) can be administered to young children as early as first grade,330 well before they are able to take group-administered written tests (as in LSEAs). This is one way to achieve much earlier detection of individual level (as well as school level) problems in learning. There are many points at which one can usefully assess children’s (or adults’) skills, but the payoff is greatest when there is a practicable way to measure at the beginning of a long trajectory of learning.331
Assessment Should be Designed to Improve Instruction There is an increasing trend toward assessment for learning,332 in which assessment results guide instructors in helping children to learn. Nonetheless, LSEAs are limited in their ability to be effective for instruction because they happen after learning has taken place, and often after the student has completed his or her studies – far too late to help the students being evaluated. Yet, ample evidence shows that reading assess-ments, at an individual or group level, can be used to improve reading acquisition. In LDCs, this has been difficult to achieve because of the lack of localized instruments and limited human resources, such as few trained reading specialists. With the advent of hybrid reading assessments, it is now possible to engage in formative assessments that take place in time to make changes at the classroom (or individual) level before that child has left the school system. Taking advantage of this new type of assessment information for the purposes of teacher training will not be easy, but such informa-tion can help teachers to change how they teach. As the field moves forward, more attention will need to be given on how to design instruction and teacher professional development that can benefit from formative assessments.
330. As noted earlier, many children in PSEs in second and third grades (and higher) may be at the floor of EGRA measures. Therefore, either simpler measures must be found, or the assessments may be postponed until second or third grades.331. EGRA and similar instruments have, to date, been focused on first through third grades for in-school children. The rationale for this has been described earlier, and it makes good sense. And there will inevitably be some pressure to test children at younger ages than first grade. Indeed, in some high-income countries there are efforts to consider pre-reading skills at the front (easier) end of EGRA, including more tests of language and vocabulary. Still, given the current conditions of education in the lowest-income countries, it is likely that first grade will be the best focal point to begin the assessment process.332. See Chapter 6 on Response to Intervention, and assessments for learning.
136 / Recommendations
Cross-national Comparability is of Limited Value in Achieving Quality EFA One of the oft-cited strengths of international and regional assessments is their ability to provide some way of comparing across nations, regions and continents, using the best methodological tools available to generate national summative scores on international tests. As discussed earlier in Chapter 4, such comparative assess-ments as PISA and PIRLS establish a substantive basis for discussion and debate within and across educational systems. International comparisons have been the spark for debate in many rich and poor countries, thereby providing opportuni-ties for policy making and new research, as well as to enhance public awareness. Furthermore, UNESCO educational statistics (even though not based strictly on LSEAs) would be significantly hampered if comparability were not an important goal.333 Yet, international assessments have had to make a variety of compromises to achieve cross-national consensus, such as limiting population sampling (by ex-cluding marginalized groups and languages).334 “League tables” in LSEAs, while of value to some nations, may be less useful for LDCs that have scores so close to the floor that comparison with OECD countries is of limited policy value. In other words, international comparability, in terms of horse race type comparisons, may be of limited value to low-income countries. By contrast, hybrid assessments foster two other types of comparability. First, by focusing on classroom and context level assessments, hybrids can pro-vide a far more nuanced understanding of individual and classroom level variables. These relationships can then be compared (or contrasted) with other similar or different contexts. Second, it is possible to focus on generic benchmarks, rather than summative total scores on an international test. For example, as noted earlier, the indicators recently advocated by the FTI335 (based roughly on the EGRA ap-proach) suggest a school-based benchmark as the proportion of students who, after two years of schooling can “read to learn.” One could also use “read a short text in your first language” as a benchmark. Various reliable indicators (with high face
333. Of course, as noted in Chapter 8 on adult literacy, achieving comparability is not sufficient, especially if the unit of analysis is, as in literacy, the simple question: “Can you read?” Even with comparability, this is a very inadequate measure. Nonetheless, UIS statistics and international LSEAs are central to many conversations about international education, as may be seen by the many uses of those statistics in this report; thanks to C. Guadelupe (personal com-munication, 2010) for this helpful observation.334. For more discussion on marginalized populations and exclusion, see UNESCO (2010).335. See Chapter 6.

Smaller, Quicker, Cheaper / 137
and consequential validity) may be included in, or derived from, hybrid assess-ments, and these may avoid some of the difficulties of cross-national comparability in LSEAs.336 Even so, various kinds of comparison need to be a part of any good hybrid assessment, such as comparability across students in a defined sample, in a linguistic context, and over time (that is, in longitudinal studies).337 In the end, all assessments seek comparability, but in different ways. International and regional LSEAs are aimed at cross-national comparability, while hybrid assessments are more focused on local contexts and increased validity. Hybrids offer some kinds of comparability that LSEAs do not, such as with mar-ginalized populations or younger children. Which types of comparability are most important depends on the policy goals desired, as well as timing and cost consider-ations. As in comparative education more generally, cultural context will determine whether and when empirical interpretations are deemed credible.338 Overall, hy-brid assessments put a premium on local validity over international comparability.
Cultural “Bias” in Assessment is not Always Bad Educational assessments are often accused of cultural biases, and this may be un-avoidable. Assessments are designed to compare individuals and groups of indi-viduals. Social scientists, including assessment specialists, work to limit cultural biases by focusing on better back-translations, vetoing of items that are aberrant in one language or culture, assuring common goals, and so forth. Methods for reduc-ing cultural bias are essentially compromises, as there are no known methods that reduce bias to zero. Thus, while cultural bias is assumed by many experts to be a bad thing, the degree of concern with bias depends on one’s frame of reference. It follows then that the larger and more diverse the overall sample, the greater the need is for compromises. Conversely, if the goal is to consider basic read-ing skills in a single ethno-linguistic group (for example, as done by Pratham in Bihar, India; see Chapter 6), then with some inevitable diversity in Bihar, there is less concern with how Bihar results might compare with results from Andhra Pradesh or Los Angeles. The point here is that bias is omnipresent. If the requirement for com-parisons (often driven by external forces such as intergovernmental agencies) can be reduced, then there may be less need and less expense in trying to eliminate cultural variation. Hybrid SQC-type assessments have a relative advantage in this area, as they are designed to be more adaptable to specific contexts. In other words, when bias is
336. As discussed in Chapter 4, there are large differences in learning achievement across the world, both across and within countries. This leads inevitably to the question of whether the benchmarks set by hybrids like EGRA or READ In-dia may be ‘too low,’ and that children will not be able to compete if the standards are not raised above modest levels of reading fluency. The responses to this question are many, but the main rational is to provide some concrete mecha-nisms to help all children get to the point of reading to learn, and that is what these assessments are trying to achieve.337. See Wagner (2010).338. See Steiner-Khamsi (2010).

138 / Recommendations
unknown and unintended, every effort should be made to reduce it. But if there is a need to focus attention within a particular context or ethno-linguistic group, then this form of assessment bias may be desirable.339
New Assessments can also Help in Adult Literacy Work Adult literacy has benefitted from far less research and funding than primary school reading. One consequence is that the most-cited data on adult literacy rates in developing countries (as shown in Chapter 8) are likely to be highly inaccurate.340 Furthermore, the same problems that primary schools face also hamper adult liter-acy, such as poorly trained teachers, inadequate materials development, pedagogies that may fail to build on specific language competencies in multi-lingual societies, and poor instructional design. To make progress on assessment and instruction in early reading, it is important to reduce the barriers between those who work on early reading with children and those who focus on adults. There is the obvious synergy that can be achieved when parents become literate and can motivate their children to do the same thing, can follow their children’s work in school, and can raise their expectations for their children’s future success. Because illiterate parents are relatively more likely to have children with reading acquisition problems or delays, new ways of assuring better accountability and effectiveness of adult literacy programs will help to ensure that early reading will be achieved.
Accountability for Learning Impact Needs to be Widely Shared Education specialists, policy makers, participants at high-level intergovernmental roundtables, ministers of education, community leaders in a rural village, teachers, and parents should be held to account for what and how children learn. All are consumers of knowledge about learning. Until today, educational specialists and statisticians in most countries (and especially in LDCs) were the primary guardians of learning assessment results. This restricted access to knowledge about learning achievement is due, at least in part, to the complexities of carrying out large-scale assessments, but also perhaps to a reticence among some policy makers who are
339. Not all assessment bias is about culture. For example, there are sampling parameters of variation that systemi-cally denote differences between groups and contexts. One of the important distinctions that has been described in this volume is between well-supported environments (WSE) as contrasted with poorly-supported environments (PSE). There is ample evidence that WSEs and PSEs may vary in important ways across and within national boundaries, and may include component variables, such as books in the home, maternal literacy, trained reading teachers, and so forth. If these parameters are not effectively measured, they can also also add bias to results.340. See two recent GMRs—UNESCO (2005) and UNESCO (2010)—as well as discussion of literacy statistics in Chapter 8.
Smaller, Quicker, Cheaper / 139
worried about publicized assessment differences between groups of children (such as between ethno-linguistic groups, or private and public schools). Today, the importance of involving multiple stakeholders in education decision-making is more widely recognized. Consumer interest in children’s learn-ing has become centrally important, whether because of increased transparency by governments, influence of international agencies, efforts of NGOs, greater com-munity activism, or parental involvement. The response to this growing interest will require both better focused and real time data, which is understandable, trans-parent and locally owned by politicians, communities, parents, and the children themselves. With multiple stakeholders, there will be greater awareness of both the benefits and deficiencies in schooling. As noted in Chapter 6 (in the EGRA field studies in Kenya and in Liberia), community engagement could literally not be stopped, even when the investigators were hoping for clean experimental compari-sons. The “giving away” of professional “secrets” may be a problem for experimental science in those studies, but it also points to improved community engagement in social change. This type of multi-level information exchange is another way of speak-ing about accountability and expectation. Whose problem is it if a child, teacher, school, district, or nation is not performing to a given level of learning? Indeed, how are such expectations even built? Whose expectations should be taken into account? SQC assessments—though in the emerging stage341—have the potential of breaking new ground in accountability and local ownership, largely by having as a clear policy goal the provision of information that matters to specific groups in a timely manner, such that change is possible, negotiable, and expected.
Hybrid Assessments can Significantly Improve Policy Impact LSEAs, such as PISA and PIRLS, as well as SACMEQ, LLECE and PASEC, re-ceive considerable media and policy attention, which has led at times to significant international and national educational policy debates and shifts. This is an impor-tant strength, and one that the assessment field needs to protect and build upon. Today’s knowledge societies require sober and credible studies in which people and the press can believe. Many intergovernmental and regional agencies and donors have been the benefactors of LSEA reports. Yet, such heavyweight studies do not represent the full spectrum of useful assessment possibilities.
341. See Clarke (2010) for a useful discussion of emerging, established and mature stages of assessment system development.

140 / Recommendations
As argued here, the range of goals, from international to national to local, implicate new types of hybrid assessments. These hybrid assessments can signifi-cantly contribute to Aminata’s story, to the poor and marginalized, and to those at the bottom end of the education spectrum. SQC assessments can better track learning over time, can better adapt to local linguistic contexts, and can be better designed to understand children who are at the floor of the learning scales. These children are no less capable of learning, but they have more barriers in the way. If such children are not an integral part of assessment methods, they will have little influence on the policy making that follows. To address and overcome these bar-riers will require formative (assessment for learning) measurement tools that are as sober and credible as LSEAs, that meet the requisite scientific requirements of validity and reliability, and that are focused on policy goals that meet community, national and international needs. There is little doubt that SQC assessments will have an important role to play in education development policies over the years to come as they simply do some things better. In the end, educational assessments can have quite varied purposes and goals. They are inherently complementary to one another, as each collects differ-ent data on cognitive performance and social context, and each requires different amounts and types of expenditures. What is needed is greater clarity of purpose, and a range of options for assessment that can effectively deliver educational change and improved learning.

Smaller, Quicker, Cheaper / 141
10. Conclusions
Monitoring and measurement are critical in combating marginalization. They
should be an integral part of strategies aimed at identifying social groups and
regions that are being left behind, raising their visibility, and identifying what works
in terms of policy intervention. Effective monitoring and disaggregated data are
needed for assessing progress towards equity-based targets. Too often, national
statistical surveys fail to adequately capture the circumstances and conditions of
those being left behind, reinforcing their marginalization. Timely data for monitor-
ing equity gaps in learning are even harder to come by.342
This volume began with a question: Can the available research on the assessment of learning (and in learning to read, in particular) contribute to a more effective way to improve educational outcomes in developing countries? It has been widely assumed that the answer is “yes.” But, it has not been clear which types of assessments ought to be used for which purposes. Up until fairly recently, most national and interna-tional policy makers relied on highly technical international comparative studies to determine how things are going. In contrast, local leaders, school headmasters, and teachers often relied on school-leaving national examinations in order to determine how “their” students were learning. As described herein, both of these approaches misses the child as a learner. Rather than deal with how a child is learning to read, most policy makers have known only the summative individual or average score, with very little information on how that score came to be what it is, and what should be done in terms of improved instructional design. With the advent of SQC hybrid assessments, it is now possible to pinpoint the nature of children’s difficulties and to do so with a precision and timing that will allow for potential intervention before it is too late. This change from the macro-view to the micro-view is not trivial. It is also not complete. Much work still needs to be done to anchor new SQC approaches into future education decision-making.
342. UNESCO (2010), p. 272.

142 / Conclusions
Some Issues that Remain in Developing New Assessments
Choices of, and results from, learning assessments likely will be debated for years to come, and these discussions will make the field of educational quality richer. As the knowledge base on assessment continues to grow, the next steps will likely take the form of expanding and deepening the use of indicators as one essential avenue for improving learning, teaching, and schooling worldwide, and in particular for those most in need in developing countries. This review has raised many issues. Some of these seem to have clear paths to improvement based on reasonably solid research. For example, hybrid assess-ments can address policy issues around basic learning skills in efficacious ways that are more focused, time-sensitive, and generally less expensive. They can also be tailored according to linguistic and orthographic variation with both validity and reliability. Furthermore, they can be designed to effectively address the interests of an expanded set of stakeholders. At the same time, hybrid SQC assessments are only beginning to be understood conceptually, empirically and in practice, in part because knowledge about their use is still at an early stage relative to LSEAs. To refine and extend the use of hybrid assessments, a number of key questions require further research based on field trials in PSEs in low-income countries. These include the following.a. Reading comprehension. Component skills have been the main focus of hy-
brid studies to date. More needs to be known about the consequential relation-ship between these skills and reading comprehension.
b. Longitudinal studies. To improve the predictive power of hybrid studies, it will be crucial to follow students from first grade through the end of primary school, or through overlapping short-term longitudinal studies. This will be especially important for intervention studies (see next point).
c. Intervention studies. Research has recently begun to determine how reading component skills can be introduced into the curriculum (see Chapter 5, on the Liberia Plus project). More interventions that look at a wider range of variables will be required to better understand the variety of interventions that can be effective across different contexts and languages.
d. Instructional design. The ultimate goal of research on student learning is to de-sign better ways of instruction, where instruction involves all the different fac-tors that relate to learning (such as teacher preparation, materials development, pre-school skills, and parental support). Hybrid assessments need to be able to inform and improve instructional design, without overburdening teachers.
e. Timed testing. ORF rates can be benchmarked in terms of words per minute and various rates have been suggested as necessary to read with comprehension. Nonetheless, some questions have been raised about the pedagogical consequenc-es of timed tests in PSEs. Is the intensive timing approach a problem? Are there effective alternatives to strict time pressure? These questions need further research.

Smaller, Quicker, Cheaper / 143
f. Individual versus group testing. To date, nearly all EGRA and similar testing has been done on an individual basis. There are good reasons for this, especially with very young children. Even so, given the cost in time and resources to engage each child in individualized testing, further research should consider ways of obtaining similar high-quality data from group-style testing, where appropriate.
g. L1 and L2 reading. Most of the knowledge base on first and second language literacy is derived from studies in OECD countries, particularly with the L2 be-ing English. The variety of languages and orthographies in use in LDCs should provide opportunities to better understand first and second language reading acquisition, and ways to assure smoother and more effective transitions in both oral and written modes.
h. Child and adult reading acquisition. Most research to date has generally treated adults as different from children when it comes to learning to read. A life-span understanding of reading acquisition is needed, followed by assess-ments built upon this model. Instructional reading programs for children and adults could benefit from a closer understanding and interaction.
i. Reading, math, and other cognitive skills. Hybrid reading assessments have made progress in recent years, and some work has begun on math as well.343 Future hybrid assessment methods, conducted during the primary school years, could provide similar value to that of hybrid reading assessments.
j. System-wide EGRA. To what extent should education systems collect data on early literacy skills? At present, large-scale systemic assessment using EGRA or EGRA-like tools is being done to date only in India (through Pratham), while most other countries participating in EGRA have focused on smaller samples in limited regions. It will be important to better understand the pros and cons of using hybrid assessments for larger systemic education purposes.344
k. Individualized diagnostics. Schools in OECD countries usually have a read-ing specialist who can assist children who exhibit problems in early reading. Such specialists are rare in PSEs in developing countries. Hybrid assessments may be one way for teachers or assistants to give children special help with learning to read that they would not otherwise receive. Research will need to clarify the possibilities of individualized interventions.
l. Psychometrics of SQC assessments. What are the statistical characteristics of using SQC assessments? How large do assessments need to be in item sampling and population sampling to be statistically reliable, and how much depends on the particular context and population sample in which the assessment is undertaken? More work needs to be done on these and related empirical and psychometric issues as the use of hybrid assessments expands.
343. See the work of the Research Triangle Institute on EGMA (Early Grade Math Assessment). See https://www.ed-dataglobal.org/documents/index.cfm?fuseaction=showdir&ruid=5&statusID=3. (accessed March 14, 2010).344. Thanks to M. Jukes for this helpful observation.

144 / Conclusions
Use of Information and Communications Technologies
Given the many complexities of developing appropriate assessments, especially in very poor contexts, it may seem a step too far to consider adding technology to the mix of issues to consider. Yet, technology is rapidly changing all lives in our era of increasing globalization, and must be considered where possible in this discussion as well. Information and communications technologies (ICTs) can and will provide support for the kinds of recommendations made in this review: whether in multi-lingual instructional support, data collection in the field, or use of communications for more real-time implementation of interventions.345 It is variously estimated that only a tiny fraction (less than 5 percent) of ICT investments globally have been made that focus on poor and low-literate populations.346 Many of the current ICT for education (ICT4E) efforts, even if deemed to have been successful in terms of overall impact, have not included a sufficiently pro-poor perspective. For example, the vast majority of software/web content (mainly in major languages such as English, Chinese, French, Spanish) is of little use to the many millions of marginalized people for reasons of literacy, language or culture. It is increasingly clear that user-friendly and multi-lingual ICT-based products can satisfy the needs of the poor to a much greater extent than heretofore believed. Providing such tools and developing the human resources ca-pacity to support the local development and distribution of relevant content is one important way to help initiate a positive spiral of sustainable development. How can SQC assessments help this situation? First, there are new op-portunities to provide ICT-based instructional environments that build on what we are learning from assessments of reading. Can we, for example, provide indi-vidualized instruction in multiple languages that build on childrens’ skill levels in each language? Data coming from recent work in India and South Africa is gives some reason to be optimistic.347 Second, ICTs can also be used to collect data using hybrid assessment instruments. When implemented properly, such tools (based most likely on mobile phone platforms) will be able to provide not only more reliable data at the point of collection, but also far greater possibilities reducing the time needed for data transfer and analysis, a major priority for SQC approaches to assessment.348
345. For a broad review of the domain of monitoring and evaluation using ICTs in education, see Wagner, 2005; and in support of literacy work, see Wagner & Kozma, 2005.346. Wagner & Kozma, 2005.347. In a project undertaken in Andhra Pradesh (India), Wagner (2009b) and Wagner et al. (2010) found positive results from a short-term intervention using local language (Telugu-based) multimedia to support literacy learning among primary school children and out-of-school youth, using SQC-type assessment tools. This study also showed the power of ICTs in supporting multilingual learning environments among very poor populations who had little or no previous experience with computers. Moving ahead, important gains in SQC assessments will likely use ICTs (mobile devices especially) to provide more timely and credible data collection.348. The International Literacy Institute has recently developed just such a tool, based on an Android operating system for collecting EGRA data in the field. Application of this tool has yet to take place.

Smaller, Quicker, Cheaper / 145
Moving Forward
The effective use of educational assessments to improve learning is fundamental. However, effective use does not only refer to the technical parameters of, say, reliability and validity. What is different today is putting a greater priority on near-term, stakeholder diverse, culturally sensitive, and high-in-local-impact assessments. Learning assessments—whether large-scale, household surveys, or hybrid (smaller, quicker, cheaper)—are only as good as the uses that are made of them. Most are being constantly improved and refined. Globalization, and efforts by the wealthier countries to compete for the latest set of “global skills” will continue, and these countries will no doubt benefit as a function of such investments. But the globalization of assessments, if narrowly de-fined around the fulcrum of skills used in industrialized nations, will necessarily keep the poorest children at the floor of any global scale, making it difficult to understand the factors that lead poor children to stay inadequately served. Current efforts to broaden the ways that assessments are undertaken in developing countries will grow as an important part of solutions that aim at quality improvement in education. Learning assessments can break new ground in educational accountabil-ity, largely by having as a policy goal the provision of information that matters to specific groups in a timely manner, such that change becomes an expectation. Current efforts to broaden the ways that assessments are undertaken in developing countries will enhance accountability, and it is only through improved accountabil-ity that real and lasting change is possible. Finally, and crucially, there is a need to sustain a significant policy and assessment focus on poor and marginalized popula-tions—those who are the main target of the MDG and EFA goals. They are poor children in poor contexts. They are those at the bottom of the learning ladder.

146 / Conclusions
Aminata’s Story: An Update
It’s two years later, and Aminata is now 11 years old, and is still in school. Her instructor, Monsieur Mamadou, was able to participate in a training about how to make his school better, and how to help his learners read better—a first for the school. Instead of being left out of the teaching and learning, Aminata has found herself called upon in class, as have all the children, even in the back rows. There is now a community spirit, ever since Monsieur Mamadou said that if all the children learn how to read, the school will win a prize. Aminata didn’t think much of this until the whole class received new primers, one for each child. Each primer was written in her home language, with the later part of the primer in French. There are colored drawings inside the book, and lots of fun exercises on how to pronounce letters and syllables and words. Aminata practices these outside of class with her cousin, and has finally figured out how to break the code, so that she can now read lots of words. She can also help her mother with her medicine prescriptions, as well as her sister who has just entered first grade in school.
Could this updated story happen? For many who work in the field of international education, such a revisionist story seems unlikely. Furthermore, it would seem dif-ficult to include such a story in a review of the technical aspects of learning assess-ments. Nonetheless, it is likely to be the only way this story will come to fruition. Aminata’s story will not be revised because of increased willpower, friendlier teach-ers, benefactors from abroad, more textbooks, better lighting and more latrines—though all such factors can and do play a role in learning and schooling. Only through a revision of expectations and concomitant accountability with multiple stakeholders will Aminata’s updated story become a reality.

Smaller, Quicker, Cheaper / 147
References
Abadzi, H. 2003. Adult Literacy: A Review of Implementation Experience. Operations Evaluation Department, World Bank. Washington, DC: World Bank.
————. 2006. “Adult Illiteracy, Brain Architecture, and Empowerment of the Poor.” Adult Education and Development, 65, 19–34.
————. 2008. “Efficient Learning for the Poor: New Insight into Literacy Acquisition for Children.” International Review of Education, 54, 5, 581-605.
————. 2010. Reading Fluency Measurements in FTI Countries: Outcomes and Improvement Prospects. Draft, Working Paper Series. Washington, DC: Fast Track Initiative.
Abadzi, H., Crouch, L., Echegaray, M., Pasco, C. & Sampe, J. 2005. “Monitoring Basic Skills Acquisition through Rapid Learning Assessments: A Case Study from Peru.” Prospects, vol. 35, 2, 137-156.
Abdul Latif Jameel Poverty Action Lab (J-PAL), Pratham, & ASER. 2009. Evaluating READ INDIA: The Development of Tools for Assessing Hindi Reading and Writing Ability and Math Skills of Rural Indian Children in Grades 1-5. Unpubl. Draft. Chennai, India: J-PAL.
Adams, M.J. 1990. Beginning to Read: Thinking and Learning about Print. Cambridge, MA: MIT Press.
Afflerbach, P., Pearson, P. D. & Paris, S. G. 2008. “Clarifying Differences between Reading Skills and Reading Strategies.” The Reading Teacher, 61, 5, 364-373.
Alegria, J., & Mousty, P. 1996. “The Development of Spelling Procedures in French-Speaking, Normal and Reading-Disabled Children: Effects of Frequency and Lexicality.” Journal of Experimental Child Psychology, 63 (2), 312-338.
Alidou, H. Boly, A., Brock-Utne, B., Diallo, Y. S., Heugh, K., & Wolff, H.E. 2006. Optimising Learning And Education In Africa: The Language Factor. Paris: ADEA, GTZ, Commonwealth Secretariat.

148 / References
Allington, R. L. 1983. “The Reading Instruction Provided Readers of Differing Reading Abilities.” The Elementary School Journal, 83, 548-559.
Altinok, N. 2009. A Technical Analysis of Skills and Tests of Performance in the Context of the Quality Learning Indicators Project. Unpublished background work-ing document. Paris: Project QLIP.
Arnove, R. F. & Graff, H. J. (Eds.). 1987. National Literacy Campaigns: Historical and Comparative Perspectives. New York: Plenum.
ASER. 2009. Evaluating the Reliability and Validity of the ASER Testing Tools. Unpubl. Draft. New Delhi: (www.asercentre.org).
————. 2010. Enrollment and Learning Report Card: India Rural. New Delhi: (www.asercentre.org).
August, D. & Shanahan, T. (Eds.) 2006. Developing Literacy in Second Language Learners. Report of the National Reading Panel on Language Minority and Youth. Mahwah (NJ): Lawrence Erlbaum Associates.
Babson, A. 2009. Costs of Large Scale Educational Assessments. Unpublished back-ground working document. Paris: Project QLIP.
Banerji, R. & Wadhwa, W. 2006. “Between Outlays and Outcomes.” Times of India. Accessed on February 28, 2011 at http://images2.asercentre.org/Resources/Articles/Between__outlays_-_outcomes.pdf.
Bear, D. R., Invernizzi, M., Templeton, S., & Johnston, F. 2004. Words their Way. Upper Saddle River, NJ: Pearson.
Beck, I. L., McKeown, M. G., & Kucan, L. 2002. Bringing Words to Life: Robust Vocabulary Instruction. New York: Guilford.
Benavot, A. & Tanner, E. 2007. The Growth of National Learning Assessments in the World, 1995-2006. Background paper prepared for the EFA Global Monitoring Report 2008. Paris: UNESCO.
Bernhardt, E. 2005. “Progress and Procrastination in Second Language Reading.” Annual Review of Applied Linguistics, 25, 133–150.

Smaller, Quicker, Cheaper / 149
Berninger, V. W., Abbott, R. D., Nagy, W. & Carlisle, J. 2010. “Growth in Phonological, Orthographic, and Morphological Awareness in Grades 1 to 6.” Journal of Psycholinguistic Research, 39,141–163.
Berninger, V. W., Abbott, R. D., Trivedi, P., Olson, E. Gould, L. Hiramatsu, S., Holsinger, M., McShane, M., Murphy, H., Norton, J., Boyd, A. S. & Westhaggen, S. Y. 2010b. “Applying the Multiple Dimensions of Reading Fluency to Assessment and Instruction.” Journal of Psychoeducational Assessment, 28, 3-18.
Bettinger, E. (2006). “Evaluating Educational Interventions in Developing Countries. Using Assessment to Improve Education in Developing Nations.” In Braun et al., (eds.), Improving education through assessment, innovation and evalua-tion, pp. 1-46. Cambridge, MA: American Academy of Arts and Sciences.
Bialystok, E., Luk G., Kwan, E. 2005. “Bilingualism, Biliteracy, and Learning to Read: Interactions among Languages and Writing Systems.” Scientific Studies of Reading, 9 (1), 43–61.
Black, P. & Wiliam, D. 1998. “Assessment and Classroom Learning.” Assessment in Education, 5(1), 7–74.
Blaiklock, K. E. 2004. “The Importance of Letter Knowledge in the Relationship between Phonological Awareness and Reading. Journal of Research in Reading, 27 (1), 36–57.
Blum, A., Goldstein, H., & Guérin-Pace, F. 2001. “International Adult Literacy Survey (IALS): An Analysis of Adult Literacy”, Assessment in Education, Vol. 8, No. 2, pp. 225-246.
Bradley, L. & Bryant, P.E. 1983. “Categorizing Sounds and Learning to Read: A Causal Connection.” Nature, 301 (5899), 419-421.
Braun, H. & Kanjee, A. 2006. “Using Assessment to Improve Education in Developing Nations.” In Cohen, J. E., Bloom, D. E., & Malin, M. (Eds). Improving Education through Assessment, Innovation, and Evaluation. Cambridge, MA: American Academy of Arts and Sciences. Pps. 1-46.
Brislin, R. W., Lonner, W. J., & Thorndike, R. M. 1973. Cross-cultural Research Methods. NY: J. Wiley.
Carey, S. (Ed.). 2000. Measuring Adult Literacy – the International Adult Literacy Survey in the European Context. London: Office for National Statistics.

150 / References
Carneiro, P. & Heckman, J. J. 2003. Human Capital Policy. Cambridge, MA: NBER Working Paper 9495.
Carr-Hill, R. 2008. International Literacy Statistics: A Review of Concepts, Methodology and Current Data. Montreal: UNESCO Institute for Statistics.
Carroll, L. 1865/2006. Alice in Wonderland. NY: Firefly Books.
Carron, G., Mwiria, K., & Righa, G. 1989. The Functioning and Effects of the Kenyan Literacy Program. IIEP Research Report No. 76. Paris: IIEP-UNESCO.
Castles, A., & Coltheart, M. 2004. “Is There a Causal Link from Phonological Awareness to Success in Learning to Read?” Cognition, 91, 77-111.
Chabbott, C. 2006. Accelerating Early Grades Reading in High Priority EFA Countries: A Desk Review. from http://www.equip123.net/docs/E1EGRinEFACountriesDeskStudy.pdf.
Chall, J.S. 1967. Learning to Read: The Great Debate. New York: McGraw Hill.
————. 1996. Stages of Reading Development, 2nd edition. Orlando, FL: Harcourt Brace & Company.
Chapman, D. W. & Snyder, C. W. 2000. “Can High Stakes National Testing Improve Instruction: Reexamining Conventional Wisdom.” International Journal of Educational Development, 20, 457–474.
Chinapah, V. 2003. Monitoring Learning Achievement (MLA) Project in Africa. Association for the Development of Education in Africa (ADEA). Working docu-ment. Paris: ADEA.
Chowdhury, A. M. R. & Zieghan, L. 1994. “Assessing Basic Competencies: A Practical Methodology.” International Review of Education, 40, 437-454.
Chromy, J.R. 2002. “Sampling Issues in Design, Conduct, and Interpretation of International Comparative Studies of School Achievement.” In A.C. Porter, & A. Gamoran (Eds.), Methodological advances in cross-national surveys of educational achievement (pps. 80- 116). Washington, DC: The National Academies Press.
Clarke, M. 2010. Roadmap for Building an Effective Assessment System. Unpublished draft. Washington, DC: World Bank.

Smaller, Quicker, Cheaper / 151
Clay, M. M. 1991. Becoming Literate: The Construction of Inner Control. Auckland, NZ: Heinemann.
————. 2000. Concepts about Print: What Have Children Learned About The Way We Print Language? Portsmouth, NH: Heinemann.
Colón, E., & Kranzler, J. H. 2006. “Effect of Instructions on Curriculum-Based Measurement of Reading.” Journal of Psychoeducational Assessment, 24, 318-328.
Comings, J. 1995. “Lieracy Skill Retention in Adult Students in Developing Countries.” International Journal of Educational Development, 15, 37-46.
Commeyras, M. & Chilisa, B. 2001. “Assessing Botswana’s First National Survey on Literacy with Wagner’s Proposed Schema for Surveying Literacy in the ‘Third World’.” International Journal of Educational Development, 21, 433-446.
Commeyras, M. & Inyega, H. N. 2007. “An Integrative Review of Teaching Reading in Kenyan Primary Schools.” Reading Research Quarterly, Vol. 42, No. 2, 258-281.
CONFEMEN. 2008. Vers la scolarisation universelle de qualité pour 2015. Evaluation diagnostique. GABON. Programme d’analyse des systèmes éducatifs de la CONFEMEN (PASEC). Dakar : CONFEMEN.
Coombs, P. H. & Hallak, J. 1972. Managing Educational Costs. New York: Oxford University Press.
Crosson, A. C., Lesaux, N. K., & Martiniello, M. 2008. “Factors that Influence Comprehension of Connectives Among Language Minority Children from Spanish-Speaking Backgrounds.” Applied Psycholinguistics, 29, 603-625.
Crosson, A. C., Lesaux, N. K. 2010. “Revisiting Assumptions about the Relationship of Fluent Reading to Comprehension: Spanish-Speakers’ Text-Reading Fluency in English.” Reading and Writing, 23, 475–494.
Crouch, L. 2009. Literacy, Quality Education, and Socioeconomic Development. Powerpoint presentation, Washington, D.C.: USAID.
Crouch, L., Korda, M. & Mumo, D. 2009. Improvements in Reading Skills in Kenya: An Experiment in the Malindi District. Report prepared for USAID. Research Triangle Institute/Aga Khan Foundation.

152 / References
Crouch, L. & Winkler, D. 2008. Governance, Management and Financing of Education For All: Basic Frameworks and Case Studies. Paper commissioned for the EFA Global Monitoring Report 2009, Overcoming Inequality: why governance matters. Paris: UNESCO.
Cuetos, F. & Suarez-Coalla, P. 2009. “From Grapheme to Word in Reading Acquisition in Spanish.” Applied Psycholinguistics, 30, 583–601
Cummins, J., M. Swain, K. Nakajima, J. Handscombe, D. Green, & C. Tran. 1984. “Linguistic Interdependence among Japanese and Vietnamese Immigrant Students.” In: Communicative competence approaches to language proficiency as-sessment: Research and application, ed. by C. Rivera, 60–81. Clevedon, England: Multilingual Matters.
Deno, S. L., Mirkin, P., & Chiang, B. 1982. Identifying valid measures of reading. Exceptional Children, 49, 36–45.
DeStefano, J. & Elaheebocus, N. 2009. School Effectiveness in Woliso, Ethiopia: Measuring Opportunity to Learn and Early Grade Reading Fluency. Unpubl. Draft, Save The Children.
Department for International Development. 2011. National and International Assessments of Student Achievement. Guidance Note. London: DFID.
Dickes, P. & Vrignaud, P. 1995. Rapport sur les traitements des données françaises de l’enquête internationale sur la littéracie. Rapport pour le Ministère de l’Education Nationale. Direction de l’Evaluation et de la Prospective.
Dickinson, D. K., McCabe, A., & Anastasopoulos, L. 2003. “The Comprehensive Language Approach to Early Literacy: The Interrelationships among Vocabulary, Phonological Sensitivity, and Print Knowledge among Preschool-Aged Children.” Journal of Educational Psychology, 95(3), 465-481.
Dowd, A. J., Wiener, K., & Mabeti, F. 2010. Malawi Literacy Boost. Annual Report, 2009. Westport, CT: Save the Children.
Downing, J. 1973. Comparative Reading. New York: Macmillan.
Droop, M., & Verhoeven, L. 1998. Background Knowledge, Linguistic Complexity, and Second-Language Reading Comprehension. Journal of Literacy Research, 30, 253-271.

Smaller, Quicker, Cheaper / 153
Dubeck, M. M., Jukes, M. C. H. & Okello, G. 2010. Early Primary Literacy Instruction in Kenya. Unpublished manuscript. Cambridge, MA: Harvard University, Graduate School of Education.
Dumont, H., Istance, D. & Benavides, F. (Eds.) 2010. The Nature of Learning. Using Research to Inspire Practice. Paris: OECD.
Durgunolu, A. Y., & Öney, B. 2002. “Phonological Awareness in Literacy Acquisition: It’s Not Only for Children.” Scientific Studies of Reading, 6, 245–266.
Easton, P. 2010. Defining Literate Environments. Unpublished manuscript. Tallahassee: Florida State University.
Eden, G. F. & Moats, L. 2002. “The Role of Neuroscience in the Remediation of Students with Dyslexia.” Nature Neuroscience, 5, 1080 – 1084.
Ehri, L. 2005. “Learning to Read Words: Theory, Findings, and Issues.” Scientific Studies of Reading, 9(2), 167–188.
Elley, W.1992: How in the World Do Students Read? The International Association for the Evaluation of Educational Achievement. The Hague: IEA.
Encinas-Martin, M. 2008. Overview of Approaches to Understanding, Assessing and Improving the Quality of Learning For All. Paris: UNESCO.
Feng, G., Miller, K., Shu, H., & Zhang, H. 2009. “Orthography and the Development of Reading Processes: An Eye-Movement Study of Chinese and English.” Child Development, Volume 80, Number 3, Pages 736–749.
Filmer, D., Hasan, A. & Pritchett, L. 2006. A Millenium Learning Goal: Measuring Real Progress in Education. Working Paper Number 97. Washington, DC: Center for Global Development.
Fuchs, L.S., & Fuchs, D. 1999. “Monitoring Student Progress Toward the Development of Reading Competence: A Review of Three Forms of Classroom-Based Assessment.” School Psychology Review, 28, 659-671.
Fuchs, L. S., Fuchs, D., Eaton, S., & Hamlett, C. L. 2000. “Relation Between Reading Fluency and Reading Comprehension as a Function of Silent Versus Oral Reading Mode.” Unpublished data. Nashville: Vanderbilt University.

154 / References
Fuchs, L., Fuchs, D., Hosp, M. K., & Jenkins, J. 2001. “Oral Reading Fluency as an Indicator of Reading Competence: A Theoretical, Empirical, and Historical Analysis.” Scientific Studies of Reading, 5(3), 239-256.
Gameron, A. & Long, D. A. 2006. Equality of Educational Opportunity: A 40-Year Retrospective. WCER Working Paper No. 2006-9. Madison, WI: WCER
Genesee, F., Geva, E., Dresler, C. & Kamil, M.L. 2006. “Synthesis: Cross Linguistic Relationships.” In D. August & T. Shanahan (Eds.) Developing literacy in lecond language learners. Report of the National Reading Panel on language minority and youth. Pps.153-173. Lawrence Erlbaum associates.
Georgiou, G K. Parrila, R., & Papadopoulos, T. C. 2008. “Predictors of Word Decoding and Reading Fluency Across Languages Varying in Orthographic Consistency.” Journal of Educational Psychology Vol 100 (3), 566-580.
Geva, E., & Siegel, L. S. 2000. “Orthographic and Cognitive Factors in the Concurrent Development of Basic Reading Skills in Two Languages.” Reading and Writing: An Interdisciplinary Journal, 12, 1-30.
Gilmore, A. 2005. The Impact of PIRLS (2001) and TIMMS (2003) in Low- and Middle-Income Countries: An Evaluation of the Value of World Bank Support for International Surveys of Reading Literacy (PIRLS) and Mathematics and Science (TIMSS). New Zealand: IEA.
Goldstein, H. 2004. “International Comparisons of Student Attainment: Some Issues Arising from the PISA Study.” Assessment in Education, 11, 3, 319-330.
Goldstein, H., Bonnet, G. & Rocher, T. 2007. “Multilevel Stuctural Equation Models for the Analysis of Comparative Data on Educational Performance.” Journal of Educational and behavioral Statistics, 32, 3, 252-286.
Good, R. H., & Kaminski, R. A. (Eds.). 2002. Dynamic Indicators of Basic Early Literacy Skills (6th ed.). Eugene, OR: Institute for the Development of Educational Achievement.
Good, R. H., III, Simmons, D. C., & Kame’enui, E. J. 2001. “The Importance and Decision-Making Utility of a Continuum of Fluency-Based Indicators of Foundational Reading Skills for Third Grade High-Stakes Outcomes.” Scientific Study of Reading, 5, 257–288.

Smaller, Quicker, Cheaper / 155
Goodman, Y.M., & Burke, C.L. 1972. Reading Miscue Inventory. New York: Robert C. Owen.
Gove, A. 2010. Early Grade Reading Assessments: Evolution and Implementation to Date. Annual meetings of the Comparative and International Education Society, Chicago, March.
Gove, A. & Cvelich, P. 2010. Early Reading: Igniting Education for All. A report by the Early Grade Learning Community of Practice. Washington, DC.: RTI.
Greaney, V., Khandker, S. R. & Alam, M. 1999. Bangladesh: Assessing Basic Learning Skills. Washington, DC/Dhaka: World Bank.
Greaney, V. & Kellaghan, T. 1996. Monitoring the Learning Outcomes of Education Systems. World Bank: Washington.
Greaney, V. & Kellaghan, T. 2008. Assessing National Achievement Levels in Education. In series on National Assessments of Educational Achievement, Vol. 1. World Bank: Washington.
Greenberg, D., Ehri, L. C., & Perin, D. 2002. “Do Adult Literacy Students Make the Same Word-Reading and Spelling Errors as Children Matched for Word-Reading Age?” Scientific Studies of Reading, 6, 221–243.
Grin, F. 2005. “The Economics of Language Policy Implementation: Identifying and Measuring Costs.” In Mother Tongue-Based Bilingual Education in Southern Africa: the Dynamics of Implementation. Proceedings of a Symposium held at the University of Cape Town, 16-19 October 2003, ed. by Neville Alexander. Cape Town: Volkswagen Foundation & PRAESA.
Hambleton, R. K. & Kanjee, A. 1995. “Increasing the Validity of Cross-Cultural Assessments: Use of Improved Methods for Test Adaptation.” European Journal of Psychological Assessment, Vol. 11, No. 3, 147–157.
Hambleton, R. K., Swaminathan, R., & Rogers, H. J. 1991. Fundamentals of Item Response Theory. Newbury Park, CA: Sage.
Hanushek, E. & Woessmann, L. 2009a. “Poor Student Learning Explains the Latin American Growth Puzzle.” VOX: Research-based policy analysis and commentary from lead-ing economists. http://www.voxeu.org/index.php?q=node/3869 (accessed 11/21/09).

156 / References
Hanushek, E. & Woessmann, L. 2009b. Do Better Schools Lead to More Growth? Cognitive Skills, Economic Outcomes, and Causation. National Bureau of Economic Research Working Paper 14633. Washington, DC: NBER.
Harris, M. 1976. “History and Significance of the Emic/Etic Distinction.” Annual Review of Anthropology, 5, 329-350.
Hart, B. & Risley, T. R. 2003. “The Early Catastrophe: The 30 Million Word Gap by Age 3.” American Educator, Spring, 4-9.
Hartley, M. J., & Swanson, E. V. 1986. Retention of Basic Skills among Dropouts from Egyptian Primary Schools (Education and Training Series, Report No. EDT40). Washington, DC: World Bank.
Hasbrouck, J. & Tindal, G.A. 2006. Oral Reading Fluency Norms: A Valuable Assessment Tool for Reading Teachers. The Reading Teacher, 59, 636–644.
Heath, S. B. 1982. “What No Bedtime Story Means: Narrative Skills at Home and School.” Language and Society, 11, 49-76.
Heckman, J. J. 2006. “Skill Formation and the Economics of Investing in Disadvantaged Children.” Science, Vol. 312. no. 5782, pp. 1900-1902.
Heugh, K. 2006b. “Cost Implications of the Provision of Mother Tongue and Strong Bilingual Models of Education in Africa.” In Alidou, H., Boly, A., Brock-Utne, B., Diallo, Y., Heugh, K. & Wolff, H. (2006). Optimizing Learning and Education in Africa –The Language Factor: A Stock-Taking Research On Mother Tongue and Bilingual Education in Sub-Saharan Africa. Paris: IIEP/ADEA.
Heyneman, S. P. & Loxley, W. A. 1983. “The Effect of Primary-School Quality on Academic Achievement Across Twenty-Nine High- and Low-Income Countries.” American Journal of Sociology, Vol. 88, No. 6, pp. 1162-1194.
Hirsh-Pasek, K. & Bruer, J. T. 2007. “The Brain/Education Barrier.” Science, Vol. 317, 5843, p. 1293.
Hornberger, N. H., 2003(Ed.). Continua of Biliteracy: An Ecological Framework for Educational Policy, Research and Practice in Multilingual Settings. Clevedon, UK: Multilingual Matters.

Smaller, Quicker, Cheaper / 157
Howie, S. & Hughes, C. 2000. “South Africa.” In Robitaille, D., Beaton, A., Plomb, T. (Eds.). The Impact of TIMSS on the Teaching and Learning of Mathematics and Science, pp. 139-145. Vancouver, BC: Pacific Educational Press.
Hoxby, C. 2002. The Cost of Accountability. Working Paper 8855, National Board of Economic Research, Cambridge, MA.
Hruby, G. G. & Hynd, G. W. 2006. “Decoding Shaywitz: The Modular Brain and its Discontents.” Reading Research Quarterly, Vol. 41, No. 4, 544–556.
Hudson, R. F., Pullen, P. C., Lane, H. B. and Torgesen, J. K. 2009. “The Complex Nature of Reading Fluency: A Multidimensional View.” Reading & Writing Quarterly, 25, 1, 4-32
ILI/UNESCO. 1998. Literacy Assessment for Out-of-school Youth and Adults. (ILI/UNESCO Technical Report from Expert Seminar, Paris, June 1998.) Philadelphia: International Literacy Institute, University of Pennsylvania.
————. 1999. Assessing Basic Learning Competencies in Youth and Adults in Developing Countries: Analytic Survey Framework and Implementation Guidelines. ILI/UNESCO Technical Report. Philadelphia: International Literacy Institute, University of Pennsylvania.
————. 2002a. Towards Guidelines for the Improvement of Literacy Assessment in Developing Countries: Conceptual Dimensions Based on the LAP Project. Philadelphia: International Literacy Institute, University of Pennsylvania.
————. 2002b. Analytic Review of Four LAP Country Case Studies. Philadelphia: International Literacy Institute, University of Pennsylvania.
Ilon, L. 1992. A Framework for Costing Tests in Third World Countries. PHREE/92/65. Washington, DC: World Bank.
————. 1996. Considerations for Costing National Assessments. In P. Murphy et al. (eds.) National Assessments: Testing the System. Washington, DC: World Bank, pp. 69-88.
Jesson, D., Mayston, D. & Smith, P. 1987. “Performance Assessment in the Education Sector: Educational and Economic Perspectives.” Oxford Review of Education, 13(3): 249-66.

158 / References
International Institute of African Languages and Cultures (IIALC). 1930. Practical Orthography of African Languages. London, Oxford University Press
Jarousse, J. P. & Mingat, A. 1993. L’école primaire en Afrique. Paris: Harmattan.
Johansson, E. 1987. “Literacy Campaigns in Sweden.” In Arnove, R.F. & Graff, H.J. (Eds.). National Literacy Campaigns. New York: Plenum.
Johnson, S. 1999. “International Association for the Evaluation of EducationalAchievement Science Assessment in Developing Countries.” Assessment in Education 6 (1): 57–73.
Juel, C., Griffith, P.L., & Gough, P.B. 1986. “Acquisition of Literacy: A Longitudinal Study of Children in First and Second Grade.” Journal of Educational Psychology, 78, 243-255.
Jukes, M. C. H., Vagh, S. B. & Kim, Y.S. 2006. Development of Assessments of Reading Ability and Classroom Behavior. Unpub. report., Cambridge: Harvard Graduate School of Education.
Jukes, M. C. H. & Grigorenko, E. L. 2010. “Assessment of Cognitive Abilities in Multiethnic Countries: The Case of the Wolof and Mandinka in the Gambia.” British Journal of Educational Psychology, 80, 77–97.
Justice, L. “Evidence-based Practice, Response to Intervention, and the Prevention of Reading Difficuties.” Language, Speech and Hearing Services in Schools, 37, 284-297.
Kagan, J. 2008. “In Defense of Qualitative Changes in Development.” Child Development, 79, , 1606 – 1624.
Kalton, G., Lyberg, L., & Rempp, J.-M. 1998. Review of Methodology. In T. S. Murray, I. S. Kirsch, & L. B. Jenkins (Eds.), Adult Literacy in OECD Countries: Technical Report on the First International Adult Literacy Survey. Report NCES 98-053. Washington, DC: US Department of Education (Appendix A).
Kame’enui, E. J., Fuchs, L., Francis, D. J., Good, R. H., III, O’Connor, R. E., Simmons, D. C., et al. 2006. The Adequacy of Tools for Assessing Reading Competence: A Framework and Review. Educational Researcher, 35(4), 3-11.
Kamens, D. H. & McNeely, C. L. 2010. Globalization and the Growth of International Educational Testing and National Assessment. Comparative Education Review, 54, 1, , pps 5-25.
Smaller, Quicker, Cheaper / 159
Kanjee, A. 2009. Assessment Overview. Presentation at the First READ Global Conference. Moscow, October 2009.
Kellaghan, T., Bethell, G. & Ross, J. 2011. National and International Assessments of Student Achievement. Guidance Note: A DFID Practice Paper. London: DFID.
Kellaghan, T. & Greaney, V. 2001. Using Assessment to Improve the Quality of Education. Paris: International Institute for Educational Planning.
Kellaghan, T., Greaney, V., & Murray, T. S. 2009. National Assessments of Educational Achievement, Volume 5: Using the Results of a National Assessment. Washington, D. C.: World Bank.
Khachan, V. A. 2009. “Diglossic Needs of Illiterate Adult Women in Egypt: A Needs Assessment.” International Journal of Lifelong Education, 28, 5, 649–660.
Kim, Y-S., Vagh, S. B., & Jukes, M. 2008. The Relationship Between Fluency in Various Reading Sublevels and Reading Comprehension in the Transparent Orthography of Swahili. Unpublished manuscript. Tallahassee, FL: Florida State University.
Kirsch, I. S., Jungeblut, A., Jenkins, L., & Kolstad, A. 1993. Adult Literacy in America: A First Look at the Results of the National Adult Literacy Survey. Washington, DC: National Center for Educational Statistics, U.S. Department of Education.
Koda, K. & Reddy, P. 2008. “Cross-linguistic Transfer in Second Language Reading.” Language Teacher, 41, 4, 497–508.
Kudo, I. & Bazan, J. 2009. Measuring Beginner Reading Skills. An Empirical Evaluation of Alternative Instruments and Their Potential Use for Policymaking and Accountability in Peru. World Bank Policy Research Working Paper, No. 4812, Washington: World Bank.
LaBerge, D., & Samuels, S.J., 1974. “Toward a Theory of Automatic Information Processing in Reading.” Cognitive Psychology, 6, 293-323.
Landerl, K. & Wimmer, H. 2008. “Development of Word Reading Fluency and Spelling in a Consistent Orthography: An 8-Year follow-up.” Journal of Educational Psychology, 100, 1, 150–161.
Ladipo, O., Murray, T. S. & Greaney, V. 2009. Using the Results of a National Assessment of Educational Achievement, Vol. 5., World Bank: Washington.

160 / References
Lavy, V., Spratt, J., & Leboucher, N. 1995. Changing Patterns of Illiteracy in Morocco: Assessment Methods Compared. LSMS Paper 115. Washington, DC: The World Bank.
Lesaux, N.K. & Geva, E. 2006a. “Synthesis: Development of Literacy in Language Minority Students.” In D. August & T. Shanahan (Eds.) Developing Literacy in Second Language Learners. Report of the National Reading Panel on Language Minority and Youth (Chapter 3, pp.53-74). Lawrence Erlbaum associates.
Lesaux, N.K., Pearson, M.R., & Siegel, L.S. 2006b. “The Effects of Timed and Untimed Testing Conditions on the Reading Comprehension Performance of Adults with Reading Disabilities.” Reading and Writing, 19 (1), 21-48.
Levine, K. 1998. “Definitional and Methodological Problems in the Cross-National Measurement of Adult Literacy: The Case of the IALS.” Written Language and Literacy, 1 (1), 41–61.
Levine, R., Lloyd, C., Greene, M. & Grown, C. 2008. Girls Count: A Global Investment and Action Agenda. Washington, D.C.: Center for Global Development.
LeVine, R. A. & LeVine, S. E. 2001. “The Schooling of Women: Maternal Behavior and Child Environments.” Ethos, 29, 259-270.
LeVine, R. A., LeVine, S. E., Schnell-Anzola, B., Rowe, M. L., & Dexter, E. (in press). Literacy and Mothering: How Women’s Schooling Changes the Lives of the World’s Children. Oxford University Press.
Levy, F., & Murnane, R.J. 2004. “Education and the Changing Job Market.” Educational Leadership, 62(2), 82.
Lewis, M. & Lockheed, M. (Eds.). March 2007. Inexcusable Absence:Why 60 Million Girls Still Aren’t in School and What to Do About It. CGD Brief. Washington, DC: Center for Global Development.
Linn, R.L. 2000. “Assessments and Accountability.” Educational Researcher, 29(2), 4-16.
Lockheed, M. 2004. The Purpose of Good Quality Education. Paper commissioned for the EFA Global Monitoring Report 2005, The Quality Imperative. Paris: UNESCO.

Smaller, Quicker, Cheaper / 161
————. 2008. Measuring Progress with Tests of Learning: Pros and Cons for “Cash On Delivery Aid” in Education. Working Paper Number 147. Washington, DC: Center for Global Development.
Lockheed, M. & Hanushek, E. 1988. “Improving Educational Efficiency in Developing Countries: What Do We Know?” Compare, 18(1), 21-38.
Lockheed, M. & Verspoor, A. 1991. Improving Primary Education in Developing Countries. Oxford: Oxford University Press.
Lonigan, C. J., Burgess, S. R., & Anthony, J. L. 2000. “Development of Emergent Literacy and Early Reading Skills in Preschool Children: Evidence from a Latent-Variable Longitudinal Study.” Developmental Psychology, 36 (5), 596 – 613.
McClaughlin, F. 2001. “Dakar Wolof and the Configuration of an Urban Identity. Journal of African Cultural Studies,” Vol.14: 2, pp. 153-172. Meckes, L. & Carrasco, R. 2010. “Two Decades of SIMCE: An Overview of the National Assessment System in Chile.” Assessment in Education: Principles, Policy & Practice, 17, 2, pp. 233-248.
Mee, C.Y., & Gan, L. 1998. “Reading Practices in Singapore Homes.” Early Child Development and Care, 144(1), 13-20.
Messick, S. J. 1989. “Validity.” In R. L. Linn (Ed.). Educational Measurement, 3rd edition. New York: American Council on Education & Macmillan. Pp. 13–103.
Mislevy, R. J. 2003. “On the Structure of Educational Assessments.” Measurement: Interdisciplinary Research and Perspectives. 1, 3-62.
Mislevy, R.J. & Verhelst, N. 1990. “Modeling Item Responses when Different Subjects Employ Different Solution Strategies.” Psychometrika, 55, 2, 195-215.
Moors, A. & De Houwer, J. 2006. “Automaticity: A Theoretical and Conceptual Analysis.” Psychological Bulletin. Vol 132(2), 297-326.
Morris, D., Bloodgood, J.W., Lomax, R.G., & Perney, J. 2003. “Developmental Steps in Learning to Read: A Longitudinal Study in Kindergarten and First Grade.” Reading Research Quarterly, 38(3), 302-328.

162 / References
Mullis, I., Martin, M. and Foy, P. 2008. TIMSS 2007. International Mathematics Report: Findings from IEA’s Trends in International Mathematics and Science Study at the Fourth and Eighth Grades. Chestnut Hill, Mass., Boston College, Lynch School of Education, TIMSS & PIRLS International Study Center.
Mullis, I. V. S., Martin, M. O., Kennedy, A. M., Trong, K. L., & Sains, M. 2009. PIRLS 2011 Assessment Framework. Boston: Boston College, TIMSS & PIRLS International Study Center.
Muthwii, M. 2004. “Language of Instruction: A Qualitative Analysis of the Perception of Parents, Pupils, And Teachers among the Kalenjin in Kenya.” Language, Culture, and Curriculum, 17, 15-32.
National Reading Panel 2000. Teaching Children to Read: An Evidence-Based Assessment of the Scientific Research Literature on Reading and its Implications for Reading Instruction. Bethesda, MD: NICHD.
Ndaruhutse, S. 2008. Grade Repetition in Primary Schools in Sub-Saharan Africa: An Evidence Base for Change. London: CfBT Education Trust.
Nordveit, B. H. 2004. Managing Public-Private Partnership. Lessons from Literacy Education in Senegal. Africa Region Human Development, Working Paper Series, No. 72. Washington, DC: World Bank.
OECD. 2002. Understanding the Brain - Towards a New Learning Science. Paris: OECD.
————. 2006. PISA 2006, Executive Summary. Paris: OECD.
————. 2009a. PISA 2006, Science Competencies for Tomorrow’s World, Volume 2. Paris: OECD.
————. 2009b. PISA 2006, Technical Report. Paris: OECD.
————. 2009c. PISA 2006. Take the Test: Sample Questions from OECD’s PISA Assessments. Paris: OECD.
OECD/Statistics Canada. 1995. Literacy, Economy and Society. Paris: OECD.
————. 1997. Literacy Skills for the Knowledge Society: Further Results from the International Adult Literacy Survey. Paris: OECD.
————. 2000. Literacy in the Information Age. Paris: OECD.

Smaller, Quicker, Cheaper / 163
Olson, J.F., Martin, M.O., Mullis, I.V.S. 2008. TIMSS 2007 Technical Report. International Association for the Evaluation of Educational Achievement (IEA), TIMSS & PIRLS International Study Center, Boston College.
Okech, A., Carr-Hill, R. A., Kataboire, A. R., Kakooza, T., & Ndidde, A. N. 1999. Evaluation of the Functional Literacy Program in Uganda. Kampala: Ministry of Gender, Labour and Social Development/World Bank.
Onsumu, E., Nzomo, J., & Obiero, C. 2005. The SACMEQ II Project in Kenya: A study of the Conditions of Schooling and the Quality of Education. Harare: SACMEQ.
Papen, U. 2005. Literacy and Development: What Works for Whom? Or, How Relevant is the Social Practices View of Literacy for Literacy Education in Developing Countries? International Journal of Educational Development, 25, 5–17.
Paris, A. H., & Paris, S.G. 2003. “Assessing Narrative Comprehension in Young Children.” Reading Research Quarterly, 38(1), 36–76.
Paris, S.G. 2002. “Measuring Children’s Reading Development Using Leveled Texts.” The Reading Teacher, 56(2), 168-170.
————. 2005. “Reinterpreting the Development of Reading Skills.” Reading Research Quarterly. Vol. 40, No. 2.184–202.
Paris, S. G., & Carpenter, R. D. 2003. “FAQs about IRIs.” The Reading Teacher, 56(6), 578-580.
Paris, S.G., Carpenter, R.D., Paris, A.H., & Hamilton, E.E. 2005. “Spurious and Genuine Correlates of Children’s Reading Comprehension.” In S.G. Paris & S.A. Stahl (Eds.), Children’s Reading Comprehension and Assessment (pp. 131-160). Mahwah, NJ: Lawrence Erlbaum Associates.
Paris, S. G., & Hamilton, E.E. 2009. “The Development of Reading Comprehension.” In S. Israel & G. Duffy (Eds.). Handbook of Reading Comprehension (pp.32-53). Routledge: NY.
Paris, S. G., & Paris, A. H. 2006. “The Influence of Developmental Skill Trajectories on Assessments of Children’s Early Reading.” In W. Damon, R. Lerner, K. A. Renninger, & I. E. Siegel (Eds.), Handbook of Child Psychology: Vol. 4. Child Psychology in Practice (6th ed., pp. 48-74). Hoboken, NJ: Wiley.

164 / References
Paris, S. G., Paris, A. H., & Carpenter, R. D. 2002. “Effective Practices for Assessing Young Readers.” In B. Taylor & P.D. Pearson (Eds.), Teaching Reading: Effective Schools and Accomplished Teachers (pp.141-160). Mahwah, NJ: Lawrence Erlbaum Associates.
Paris, S. G., Morrison, F. J., & Miller, K. F. 2006. “Academic Pathways from Preschool Through Elementary School.” In P. Alexander & P. Winne (Eds.), Handbook of Research in Educational Psychology (Second edition, pp. 61-85). Mahwah, NJ: Lawrence Erlbaum Associates.
Patrinos, H. A. & Velez, E. 2009. “Costs and Benefits of Bilingual Education in Guatemala: A Partial Analysis.” International Journal of Educational Development, 29, 594–598.
Pearson, P. D., & Hamm, D. N. 2005. “The Assessment of Reading Comprehension: A Review of Practices – Past, Present, and Future” (pp. 13-69). In S. Paris & S.Stahl (Eds.), Children’s Reading Comprehension and Assessment. Mahwah, NJ: Lawrence Erlbaum Associates.
Perfetti, C. A. 2003. “The Universal Grammar of Reading.” Scientific Studies of Reading, 7, 3–24.
Perfetti, C. A., Landi, N., & Oakhill, J. 2005. “The Acquisition of Reading Comprehension Skill.” In M. J. Snowling & C. Hulme (Eds.), The Science of Reading: A Handbook. (pp. 227-247). Oxford: Blackwell.
Pigozzi, M. J. 2006. “Cross-national Studies of the Quality of Education.” In Ross, K. N. & Genevois, I. J. (Eds.). Cross-national Studies of the Quality of Education: Planning Their Design and Managing Their Impact. Paris: IIEP-UNESCO.
Piper, B. & Korda, M. 2009. EGRA Plus: Liberia. Data Analytic Report. Unpublished technical report. Washington: RTI & Liberian Education Trust.
Piper, B. and Miksic, E. (2011, in press). “Mother Tongue and Reading: Using Early Grade Reading Assessments to Investigate Language-of-Instruction Policy in East Africa.” In A. Gove and A. Wetterberg (Eds.). The Early Grade Reading Assessment: Application and intervention to Improve Basic Literacy. Research Triangle Park, NC: RTI Press.
Piper, B., Schroeder, L. & Trudell, B. 2011. Oral Reading Fluency and Comprehension in Kenya: Reading Acquisition in a Multilingual Environment. Unpublished paper.

Smaller, Quicker, Cheaper / 165
Porter, A. C., & Gamoran, A. 2002. “Progress and Challenges for Large-Scale Studies.” in A.C. Porter & A. Gamoran (eds). Methodological Advances in Cross-national Surveys of Educational Achievement. Board of International Comparative Studies in Education. Washington, DC: National Academies Press. Pp. 3–23.
Postlethwaite , T. N. 2004. What Do International Assessment Studies Tell Us About the Quality of School Systems? Background paper prepared for the Education for All Global Monitoring Report 2005. The Quality Imperative. 2005/ED/EFA/MRT/PI/40. Paris: UNESCO.
Pressley, M. 2000. “What Should Comprehension Instruction Be the Instruction of?” In M. Kamil, P. Mosenthal, P.D. Pearson, & R. Barr (Eds.), Handbook of Reading Research, vol.III (pp. 545-561). Mahwah, NJ: Lawrence Erlbaum Associates.
Prinz, M. 1996. L’Alphabétisation au Sénégal. Paris: Édition L’Harmattan.
Puchner, L. 2001. “Researching Women’s Literacy in Mali: A Case Study of Dialogue Among Researchers, Practitioners and Policy Makers.” Comparative Education Review, 45 (2), 242-256.
Ravela, P., Arregui, P., Valverde, G., Wolfe, R., Ferrer, G., Martínez, F., Aylwin, M. & Wolff, L. 2008. The Educational Assessment Latin America Needs (Working Paper Series No. 40). Washington, DC: PREAL.
Rayner, K., Foorman, B. R., Perfetti, C. A., Pesetsky, D. & Seidenberg, M. S. 2001. “How Psychological Science Informs the Teaching of Reading.” Psychological Science in the Public Interest, 2, 31-74.
Rayner, K., Reichle, E. D., Stroud, M. J., Williams, C. C. & Pollatsek, A. 2006. “The Effect of Word Frequency, Word Predictability, and Font Difficulty on the Eye Movements of Young and Older Readers.” Psychology and Aging, Volume 21, Issue 3, Pages 448-465.
Research Triangle Institute (RTI). 2009. Early Grade Reading Assessment Toolkit. Washington, DC.: RTI International.
Riedel, B. 2007. “The Relation Between DIBELS, Reading Comprehension, and Vocabulary in Urban First-Grade Students.” Reading Research Quarterly. 42 (4), 546-567.
Robinson-Pant, A. (Ed.) 2004. Women, Literacy and Development: Alternative Perspectives. New York: Routledge.

166 / References
Robinson, C. 2005. Languages and Literacies. Paper commissioned for the EFA Global Monitoring Report 2006, Literacy for Life. Paris: UNESCO.
Roehrig, A. D., Petscher, Y., Nettles, S.M., Hudson, R. F., & Torgesen, J. K. 2007. “Accuracy of the DIBELS Oral Reading Fluency Measure for Predicting Third Grade Reading Comprehension Outcomes.” Journal of School Psychology, 46, 343-366.
Ross, K. N. & Genevois, I. J. 2006. Cross-national Studies of the Quality of Education: Planning Their Design and Managing Their Impact. Paris: IIEP-UNESCO.
Ross, K.N. & Postlethwaite, T.N. 1991. Indicators of the Quality of Education: A Study of Zimbabwean Primary Schools. Harare: Ministry of Education and Culture; Paris: IIEP-UNESCO
Ross, K. R., Saito, M., Dolata, S., Ikeda, M., Zuze, L., Murimba, S., Postlethwaite, T.N., & Griffin, P. 2005. “The Conduct of the SACMEQ II Project.” In Onsomu, E., Nzomo, J. & Obiero, C. (Eds.) The SACMEQ II Project in Kenya: A Study of the Conditions of Schooling and the Quality of Education. Paris: SACMEQ/IIEP.
Roy, P., & Kapoor, J. M. 1975. The Retention of Literacy. Delhi: Macmillan of India.
Rubens, A. & Crouch, L. 2009. Early Grade Mathematics Assessment (EGMA): A Conceptual Framework Based on Mathematics Skills Development in Children. EdDataII Technical Report. Washington, DC: USAID.
Samoff, J. 2003. “No Teacher Guide, No Textbooks, No Chairs: Contending with Crisis in African Education.” In R. F. Arnove & C. A. Torres (eds.). Comparative Education: The Dialectic of the Global and the Local, pps. 509–545. Boulder: Rowman & Littlefield.
Samuels, S. J. 2007. “The DIBELS tests: Is Speed of Barking at Print What We Mean By Reading Fluency?” Reading Research Quarterly, 42, 546-567.
Scarborough, H. S. 1998. “Early Identification of Children at Risk For Reading Disabilities: Phonological Awareness and Some Other Promising Predictors.” In P. Accardo, A. Capute, & B. Shapiro (Eds.), Specific Reading Disability: A View of the Spectrum. Timonium, MD: York Press.
Schilling, S. G., Carlisle, J. F., Scott, S. E. & Zeng, J. 2007. “Are Fluency Measures Accurate Predictors of Reading Achievement?” The Elementary School Journal, 107, 5, pps. 429-448.

Smaller, Quicker, Cheaper / 167
Scribner, S., & Cole, M. 1981. The Psychology Of Literacy. Cambridge: Harvard University Press.
Sebba, M. 2007. Spelling and Society: The Culture and Politics of Orthography Around the World. Cambirdge University Press.
Sen, A. 1999. Development as Freedom. NY: Anchor books.
Share, D. L. 2008. “On the Anglocentricities of Current Reading Research and Practice: The Perils Of Overreliance On An “Outlier” Orthography.” Psychological Bulletin, Vol. 134, No. 4, 584–615.
Shaywitz, S. 2003. Overcoming Dyslexia: A New and Complete Science-Based Program for Reading Problems at Any Level. NY: A. Knopf.
Shaywitz, S. & Shawitz, B. 2008. “Paying Attention to Reading: The Neurobiologyof Reading and Dyslexia.” Development and Psychopathology, 20, 1329–1349 Shepard, L. A. 2000. “The Role Of Assessment In A Learning Culture.” Educational Researcher, 29(7), 4-14.
Sjoberg, S. 2007. “PISA and ‘Real Life Challenges’: Mission Impossible?” In S.T. Hopmann, G. Brinek and M. Retzl (eds.), PISA According to PISA. Does PISA Keep What It Promises? Vienna: LIT Verlag. Downloadable at http://folk.uio.no/sveinsj/Sjoberg-PISA-book-2007.pdf. (Accessed October 23, 2010).
Siniscalco, M. T. 2006. “What are the National Costs For A Cross-National Study?” In K. Ross & I. J. Genevois, (Eds.), Cross-national Studies of the Quality of Education: Planning Their Design and Managing Their Impact (pp. 185-209). Paris: IIEP-UNESCO.
Slavin, R. E., Lake, C., Chambers, B., Cheung, A. & Davis, S. 2009. Effective Beginning Reading Programs: A Best-Evidence Synthesis. Best Evidence Encyclopedia. Baltimore: Johns Hopkins University.
Slobin, D. I. 1986. The Cross-Linguistic Study of Language Acquisition. Hillsdale, NJ: L. Erlbaum.
Smallwood, J., McSpadden, M., Schooler, J. W. 2008. “When Attention Matters: The Curious Incident of the Wandering Mind.” Memory & Cognition, 36, 1144-1151.

168 / References
Smith, G. T., McCarthy, D. M. & Anderson, K. G. 2000. “On the Sins of Short-Form Development.” Psychological Assessment, 12, 102-111.
Smyth, J. A. 2005. UNESCO’s International Literacy Statistics 1950-2000. Background paper prepared for the Education for All Global Monitoring Report 2006. Literacy for Life. Document number: 2006/ED/EFA/MRT/PI/90. Paris: UNESCO.
Snow, C. 2006. Cross Cutting Themes and Future Research Directions. In D. August & T. Shanahan (Eds.) Developing Literacy in Second Language Learners. Report of the National Reading Panel on Language Minority and Youth (Chapter 21, pp.631-651). Hillsdale, NJ: L. Erlbaum.
Snow, C.E., Burns, M.S., & Griffin, P. 1998. Preventing Reading Difficulties in Young Children. Washington, DC: National Academy Press.
Snow, C. E. & Kang, J. Y. 2006. Becoming Bilingual, Biliterate, and Bicultural. In W. Damon, R. M. Lerner, A. Renninger, & I. E. Sigel (Eds.), Handbook of Child Psychology, Volume 4, Child Psychology In Practice (pp. 75-102). Hoboken, NJ: John Wiley & Sons.
Sprenger-Charolles, L. 2003. “Linguistic Processes in Reading and Spelling. The Case of Alphabetic Writing Systems: English, French, German and Spanish.” In T. Nunes, & P. Bryant (Eds). Handbook of Children’s Literacy. (pp. 43-65). Dordrecht: Kluwer Academic.
————. 2008a. EGRA (Early Grade Reading Assessment): Results from Primary School Students Learning to Read in French and in Wolof. http://pdf.usaid.gov/pdf_docs/PNADL691.pdf
————.. 2008b. EGRA (Early Grade Reading Assessment): Results of 1200 Gambian Children Learning to Read in English. http://pdf.usaid.gov/pdf_docs/PNADL690.pdf
Sprenger-Charolles, L., Colé, P., & Serniclaes, W. 2006. Reading Acquisition and Developmental Dyslexia. New York, NY: Psychology Press.
Sprenger-Charolles, L. & Messaoud-Galusi, S. 2009. Review of Research on Reading Acquisition and Analyses of the Main International Reading Assessment Tools. Unpublished background working document. Paris: Project QLIP.

Smaller, Quicker, Cheaper / 169
Stanovich, K. E. 1980. “Toward an Interactive-Compensatory Model of Individual Differences in the Development of Reading Fluency.” Reading Research Quarterly, 16, 32–71.
————. 1986. “Matthew Effects In Reading: Some Consequences of Individual Differences in the Acquisition Of Literacy.” Reading Research Quarterly, 21(4), 360-407.
————. 2000. Progress in Understanding Reading: Scientific Foundations and New Frontiers. New York: Guilford.
Stevenson, H. W. & Stigler, J. W. 1982. The Learning Gap: Why Our Schools Are Failing and What We Can Learn From Japanese and Chinese Education. NY: Summit.
Steiner-Khamsi, G. 2010. “The Politics and Economics of Comparison.” Comparative Education Review, 54, 323-342.
Storch, S. A., & Whitehurst, G. J. 2002. “Oral Language and Code-Related Precursors to Reading: Evidence from a Longitudinal Structural Model.” Developmental Psychology, 38 (6), 934-947.
Street, B. V. 2001. Literacy and Development: Ethnographic Perspectives. London: Routledge.
Summers, L. H. 1992. “The Most Influential Investment.” Scientific American. p. 132.
Szucs, T., Belisari, A. & Mantovani, L. 1997. “Is Preventive Medical Care Worth the Cost?” Biologicals, 25: 247-252.
Topol, B., Olson, J., & Roeber, E. 2010. The Cost of New Higher Quality Assessments: A Comprehensive Analysis of the Potential Costs for Future State Assessments. Stanford, CA: Stanford University, Stanford Center for Opportunity Policy in Education.
UNESCO. 1978. Towards a Methodology for Projecting Rates of Literacy and Educational Attainment. Paris: UNESCO. (Current Surveys and Research in Statistics, No. 28.).
————. 1990. Final Report on the World Conference on Education For All: Meeting Basic Learning Needs, Jomtien, Thailand. Paris: UNESCO.
————. 2000a. Dakar Framework For Action. Education For All: Meeting Our Collective Commitments. Dakar/Paris: UNESCO.

170 / References
————. 2000b. Assessing Learning Achievement. World Education Forum, Dakar, Senegal, UNESCO.
————. 2004. EFA Global Monitoring Report 2005. The Quality Imperative. Paris : UNESCO.
————. 2005. EFA Global Monitoring Report 2006. Literacy for Life. Paris: UNESCO.
————. 2008. Using a Literacy Module in Household Surveys: A Guidebook. Bangkok: UNESCO.
————. 2010. EFA Global Monitoring Report 2010. Reaching the Marginalized. Paris: UNESCO.
UNESCO Institute for Statistics (UIS). 2009. The Next Generation of Literacy Statistics: Implementing the Literacy Assessment and Monitoring Programme (LAMP). Technical Report #1. Montreal: UIS.
UNESCO-LLECE. 2008. Student Achievement in Latin America and the Caribbean. Results of the Second Regional Comparative and Explanatory Study (SERCE). Santiago, Chile: Laboratorio Latinoamericano de la Evaluación de la Calidad de la Educación (LLECE), UNESCO Regional Bureau of Education in Latin America and the Caribbean. Also: http://unesdoc.unesco.org/images/0016/001610/161045e.pdf (accessed October 23, 2010).
United Nations Statistical Office (UNSO) (Wagner, D. A., & Srivastava, A. B. L., principal authors). 1989. Measuring Literacy Through Household Surveys. Doc. No. DP/UN/INT-88-X01/10E. New York: United Nations Statistical Office.
United Nations. 2000. United Nations Millennium Declaration. Resolution adopt-ed by the General Assembly. (United Nations A/RES/55/2). (www.un.org/millen-nium/declaration/ares552e.htm; (accessed October 23, 2010)
U.S. Department of Education, NCES. 2009. Basic Reading Skills and the Literacy of America’s Least Literate Adults: Results from the 2003 National Assessment of Adult Literacy (NAAL) Supplemental Studies. Report NCES 2009-481. Washington, DC: U.S. Department of Education.
USAID. 2011. Education: Opportunity through Learning. USAID Education Strategy, 2011-2015. Washington, DC: USAID.

Smaller, Quicker, Cheaper / 171
Valencia, S. W., Smith, A. T., Reece, A. M., Li, M., Wixson, K. K., & Newman, H. 2010. Oral Reading Fluency Assessment: Issues of Construct, Criterion, and Consequential Validity. Reading Research Quarterly, 45, 270-295.
Uwezo. 2010. Are Our Children Learning: Annual Learning Assessment Report, Uganda 2010. Kampala: www.Uwezo.net.
van den Broek, P., Kendeou, P., Kremer, K., Lynch, J., Butler, J., White, M.J., & Lorch, E.P. 2005. Assessment of Comprehension Abilities in Young Children. In S.G. Paris & S.A. Stahl (Eds.), Current Issues in Reading Comprehension and Assessment. Mahwah, NJ: Lawrence Erlbaum Associates.
Vansina, J. 1965. Oral Tradition. A Study in Historical Methodology (Translated from the French by H. M. Wright). London: Routledge & Kegan Paul.
Venezky, R. L. & Sabatini, J. P. 2002. Introduction to this Special Issue: Reading Development in Adults. Scientific Studies of Reading, 6(3), 217–220.
Volante, L. 2006. An Alternative for Large-Scale Assessment in Canada. Journal of Learning and Teaching, 4(1), 1-14.
Wagner, D. A. 1980. Culture and Memory Development. In Triandis, H. & Heron, A. (Eds.), Handbook of Cross-Cultural Psychology, Vol. 4, New York: Allyn & Bacon.
————. 1990. Literacy Assessment in the Third World: An Overview and Proposed Schema for Survey Use. Comparative Education Review, 33, 1, 112 - 138.
————. 1993. Literacy, Culture and Development: Becoming Literate in Morocco. New York: Cambridge University Press.
————. 1994. Use it or Lose it?: The Problem of Adult Literacy Skill Retention. NCAL Technical Report TR94-07, Philadelphia: University of Pennsylvania.
————. 1995. Literacy and Development: Rationales, Myths, Innovations, and Future Directions. International Journal of Educational Development, 15, 341-362.
————. 1997. Adult Literacy Assessment in Comparative Contexts. In Tuijnman, A., Kirsch, I. & Wagner, D. A. (Eds.). Adult Basic Skills: Innovations in Measurement and Policy Analysis. Cresskill, NJ: Hampton Press.

172 / References
————. 1998. “Literacy Retention: Comparisons Across Age, Time and Culture.” In S. G. Paris & H. Wellman, (Eds.). Global Prospects for Education: Development, Culture and Schooling. Washington, D.C.: American Psychological Association. pps. 229-251.
————. 2000. Literacy and Adult Education. Global Thematic Review prepared for the U.N. World Education Forum, Dakar, Senegal. Paris: UNESCO.
————. 2001. “Conceptual Dichotomies and the Future of Literacy Work Across Cultures.” In C. Snow & L. Verhoeven (Ed.). Literacy and Motivation: Reading Engagement In Individuals And Groups. NJ: L. Erlbaum.
————. 2003. “Smaller, Quicker, Cheaper: Alternative Strategies For Literacy Assessment in the UN Literacy Decade.” International Journal of Educational Research, 39, 3, 293-309.
————. 2004. “Literacy(ies), Culture(s) and Development(s): The Ethnographic Challenge.” Reading Research Quarterly, 39, 2, 234-241.
————. (Editor). 2005. Monitoring and Evaluation of ICT in Education Projects: A Handbook for Developing Countries. Washington, DC: World Bank.
————. 2008. Educational Equity in a Multi-Lingual World. Paper presented at the Annual Meetings of the Comparative and International Education Society. New York, April 2008.
————. 2009a. Mother Tongue and Other Tongue: A Fundamental Problem of the Home-School Connection. Paper presented at the Annual Meetings of the Comparative and International Education Society, Charleston, SC.
————. 2009b. Pro-Poor Approaches to Using Technology for Human Development: Monitoring and Evaluation Perspectives.” In Bekman, S. & Aksu-Koç, A. (Eds.). Perspectives on human development, family and culture: Essays in honor of Cigdem Kagiticibasi. London: Cambridge University Press.
————. 2010. “Literacy.” In M. Bornstein (Ed.). Handbook of Cultural Developmental Science. NY: Taylor & Francis. Pps. 161-173.
————. 2010. Quality of Education, Comparability, and Assessment Choice in Developing Countries. COMPARE: A Journal of Comparative and International Education, 40, 6, 741-760.

Smaller, Quicker, Cheaper / 173
————. 2011. What Happened to Literacy? Historical and Conceptual Perspectives on Literacy In UNESCO. International Journal of Educational Development. 31, 319–323.
Wagner, D.A., Daswani, C.J., & Karnati, R. 2010. “Technology and Mother-Tongue Literacy in Southern India: Impact Studies among Young Children and Out-of-School Youth.” Information Technology and International Development, 6, 4, 23-43.
Wagner, D. A. & Kozma, R. 2005. New Technologies for Literacy and Adult Education: A Global Perspective. Paris: UNESCO.
Wagner, D. A., Spratt, J. E. & Ezzaki, A. 1989. “Does Learning to Read an a Second Language Always Put the Child at a Disadvantage? Some Counter-Evidence from Morocco.” Applied Psycholinguistics, 10, 31-48.
Wagner, D. A., Spratt, J. E., Klein, G. & Ezzaki, A. 1989. “The Myth of Literacy Relapse: Literacy Retention Among Fifth-Grade Moroccan School Leavers.” International Journal of Educational Development, 9, 307-315.
Wagner, D. A., Venezky, R. L., & Street, B. V. (Eds.). 1999. Literacy: An International Handbook. Boulder, CO: Westview Press.
Wang, M. & K. Koda. 2007. “Commonalities and Differences in Word Identification Skills Among Learners of English as a Second Language.” Language Learning, 5, Supplement 1, 201–222.
Wainer, H. & Thissen, D. 1996. “How is Reliability Related to the Quality of Test Scores? What is the Effect of Local Dependence on Reliability?” Educational Measurement: Issues and Practice, 15, pp.22-29.
Wolff. L. 2007. The Costs of Student Assessments in Latin America. Working Paper Series No. 38. Washington, DC: PREAL.
————. 2008. Costs and Financial Implications for Implementing National Student Assessments: Lessons for South Africa. Unpubl. Paper. Wolff , L. & Gurria, M. 2005. Money Counts? Inter-American Development Bank, UIS working Paper No. 3.

174 / References
World Bank. (2011). Why Invest in Early Child Development (ECD). Web-based document. http://web.worldbank.org/WBSITE/EXTERNAL/TOPICS/EXTCY/EXTECD/0,,contentMDK:20207747~menuPK:527098~pagePK:148956~piPK:216618~theSitePK:344939,00.html. Retrieved, June 10, 2011.
Wuttke, J. 2008. “Uncertainties and Bias in PISA.” In S.T. Hopmann, G. Brinek and M. Retzl (eds.), PISA According to PISA. Does PISA Keep What it Promises? pp.241-264. http://www.univie.ac.at/pisaaccordingtopisa/pisazufolgepisa.pdf.
Ziegler, J. C., & Goswami, U. 2006. “Becoming Literate in Different Languages: Similar Problems, Different Solutions.” Developmental Science, 9, 429-436.

Smaller, Quicker, Cheaper / 175
Annexes
Annex A: Description of Reading Assessments
Prefatory note: This annex contains a series of brief descriptions of the major assess-ment instruments discussed in this report, with a focus on reading. For each instru-ment, the report provides a short background summary, target population of the in-strument, basic methods and content, and the design of materials. Although most of the organizations that are undertaking these assessments focus on learning that goes well beyond reading, the present descriptions provide detail mainly on this domain.
Progress in International Reading Literacy Study (PIRLS)
a. Background. The International Association for the Evaluation of Educational Achievement (IEA), which began in the early 1960s, was the first body to mea-sure individual learning achievement for international comparative purposes. The Progress in International Reading Literacy Study (PIRLS) constitutes the main LSEA of reading in primary education. To date, PIRLS has been conduct-ed twice (2001 and 2006, and is anticipated in 2011).349 Fourth grade learners, nine years old on average, are typically assessed. The last assessment cycle, which was conducted in 2006, took place in 35 countries; more countries are expected to participate in 2011.
PIRLS is based on the theoretical model of reading that focuses mainly on reading comprehension processes.350 PIRLS does not assess decoding and word identifica-tion operations, or the relationship between written and oral language comprehen-sion. It is geared towards measuring reading comprehension, defined in terms of four components abilities: • Focusingandretrievingexplicitlystatedinformation• Makinginferencesfromlogicalandinterrelatedevents• Interpretingandintegratingideasandinformation• Examiningandevaluatingcontent,language,andtextualelements
These four processes account for reading for literary experience, as well as to acquire and use information that is assumed to summarize the type of reading activity ex-perienced by fourth graders across the world.
349. For an updated description of PIRLS, see Mullis et al., 2009.350. See Kintsch and Van Dijk, 1978; and Spiro, Bruce & Brewer, 1980.

176 / Annexes
b. Target population. Fourth grade was chosen, because it represents an impor-tant stage of reading acquisition at which students are supposed to have ac-quired basic decoding skills, as well as have the ability to take a test that has written instructions and written responses.
c. Method of assessment and test content. The PIRLS testing battery is admin-istered collectively over a limited time period of 80 minutes. The entire set of texts is composed of ten reading passages, containing literary and informational passages. However, each examinee is only assessed over one of each passage type (one story and one informational text on average). Reading comprehen-sion for each passage is assessed by a series of about 12 questions, half of which provide multiple-choice responses and the remaining half requires constructed answers. Students read the passages silently and respond individually and in writing to the questions. An additional 15–30 minutes is allotted to a student questionnaire.
d. Design of the material. National Research Coordinators (NRC), with rep-resentatives from each participating country, submit passages that a Reading Development Group approves once a “general agreement” is met. Text passages are required to comply with the following guidelines: • Suitableforfourth-gradestudentsincontent,interest,andreadingability• Well-written in terms of depth and complexity to allow questioning
across the processes and strategies defined in the PIRLS 2006 framework• Sensitivetoculturalgroupstoavoidspecificculturalreferences,wher-
ever possible
The PIRLS instruments were prepared in English and then translated into 45 lan-guages following a careful verification process. Each country was allowed some free-dom in translating passages when it was necessary to accommodate cultural and lin-guistic specificity. The NRC also created a set of questions for each text passage. In designing the question, NRCs were instructed to pay particular attention to match-ing the question with the purpose of the passage, and to covering PIRLS component processes while considering timing, potential sources of bias, and ease of translation.
e. Pre-PIRLS. An easier version of PIRLS that assesses reading comprehension in children still in the process of learning to read is currently under develop-ment, and planned for 2011. Pre-PIRLS relies on the same principles as PIRLS and employs a similar methodology, however, reading passages are shorter than those used in PIRLS (around 400 words, as opposed to 800 in PIRLS), with easier vocabulary and syntax. There is also a greater emphasis on the process-es of retrieving information and making straightforward inferences, and less weight placed on integrating ideas and evaluating content in pre-PIRLS than in PIRLS. The methodology for assessing comprehension relies on questions in contrast to PIRLS (in which questions are presented after reading the passage).

Smaller, Quicker, Cheaper / 177
Some of the questions in pre-PIRLS are also interspersed throughout the text (students have, thus, less text to recall to find answers and can answer some items, even if they do not finish the entire passage).
12.1.2 Programme for International Student Assessment (PISA)
a. Background. OECD launched its Programme for International Student Assessment (PISA) in 1997 to meet the need for data on student performance that would be readily comparable at the international level. PISA should also collect policy-relevant information that will help policy makers to explain dif-ferences in the performance of schools and countries.351 Since 2000, PISA has assessed the skills of 15-year-olds every three years, first mainly in OECD coun-tries, and now in a total of 57 countries. PISA concentrates on three key areas: mathematics, science, and reading literacy. Each PISA cycle focuses on one of these areas.
The PISA reading test is based on similar but not identical theoretical premises as PIRLS. The PISA seeks to go beyond simple decoding and literal interpretation of written information by assessing literacy in real life situations. PISA reading assess-ment defines five processes associated with achieving a full understanding of a text. • Retrievinginformation• Formingabroadgeneralunderstanding• Developinganinterpretation• Reflectingonandevaluatingthecontentofatext• Reflectingonandevaluatingtheformofatext
b. Target population. PISA’s reading subtest aims at assessing abilities in 15 year-old students (irrespective of grade) approaching the end of compulsory educa-tion in order to measure how well they are prepared to face challenges of today’s society by measuring what they can do with what they learned at school. In this way, PISA is more an assessment of potential proficiency for the workplace than an evaluation of schooling processes.
c. Method of assessment and test content. PISA tries to assess the kinds of read-ing that occur both within and outside the classroom, so that texts are selected within four types of reading contexts: reading for private or public use, read-ing for work; and reading for education. Reading passages are also composed of continuous texts (such as narration and reports), as well as non-continuous texts (charts, maps, advertisements, and so forth). About half the questions that mea-sure written comprehension of the passages are open questions (which required a productive answer), while the remaining consisted in closed questions (yes/no
351. Postlethwaite, 2004, p. 3.

178 / Annexes
responses or multiple-choice).352 Each student is assessed over two hours of which testing dedicated to reading occupied from 60 to 90 minutes of the total testing time. Different combinations of passages are grouped in nine different assess-ments booklets to ensure that a representative sample of students answers each.
d. Design of the material. Participating countries responded to a call for submission for sample texts. They were provided with guidelines outlining the purpose of the project and a number of variables, such as text types and formats as well as response formats and context. The selection of authentic material was encouraged, prefer-ably from the news media or original published texts. Once the development team reviewed the documents submitted, a set of items was validated for the assessment. Test developers also created several texts and items from scratch. Following the de-velopment team decision, items were selected, and were provided in French or in English to translation teams, who also worked to solve any particular problems that arose, and helped to ensure the appropriateness of translation in each country.353
Southern and Eastern Africa Consortium for Monitoring Educational Quality (SACMEQ)
a. Background. The Southern and Eastern Africa Consortium for Monitoring Educational Quality (SACMEQ) grew out of an extensive national investigation into the quality of primary education in Zimbabwe in 1991, supported by the UNESCO International Institute for Educational Planning (IIEP).354 The first study, SACMEQ I, took place between 1995 and 1999. SACMEQ I covered seven countries and assessed performance in reading at sixth grade. The partici-pating countries were Kenya, Malawi, Mauritius, Namibia, United Republic of Tanzania (Zanzibar), Zambia, and Zimbabwe. The second study, SACMEQ II, was held between 2000 and 2002 and covered 14 countries and one territory (Zanzibar). It assessed performance in both reading and mathematics. The third study, SACMEQ III, which was implemented in 2007, covered the same coun-tries as in 2002. SACMEQ III is still in the data analysis stage.
352. In addition, members of the reading expert group and test developers identified processes that were likely to have an effect on the difficulty of a reading test. These processes included: making a simple connection between pieces of information; hypothesizing about the text; deciding the amount of information to retrieve; selecting the number of criteria which the information must satisfy; picking sequencing of the information to be retrieved; select-ing the amount of text to be assimilated; specifying the knowledge that must be drawn out from the text; and select-ing prominence of the information (how explicitly the reader is directed towards it).353. Cross-language translation issues cannot be fully solved even by well-meaning multi-national teams of experts. As Greaney and Kellaghan (2008, p. 42) state: “If comparisons are to be made between performances assessed in different languages, analysis must take into account the possibility that differences that may emerge may be attribut-able to language-related differences in the difficulty of assessment tasks. The issue is partly addressed by changing words. For example, in an international assessment carried out in South Africa, words such as ‘gasoline’ (‘petrol’) and ‘flashlight’ (‘torch’) were changed. Ghana replaced the word ‘snow’ with ‘rain.’ If language differences co-vary with cultural and economic factors, the problem is compounded because it may be difficult to ensure the equivalence of the way questions are phrased and the cultural appropriateness of content in all language versions of a test. For example, material that is context-appropriate for students in rural areas—covering hunting, the local marketplace, agricultural pursuits, and local games—might be unfamiliar to students in urban areas.”354. See Ross and Postlethwaite, 1991.
Smaller, Quicker, Cheaper / 179
The SACMEQ II and III assessments include the measurement of read-ing and mathematics performance levels for both pupils and teachers.355 In SACMEQ II, reading literacy was defined as “the ability to understand and use those written language forms required by society and/or valued by the indi-vidual,” the same as used in PIRLS.
b. Target population. The target population for both the SACMEQ studies was the sixth grade level.
c. Method of assessment and test content. In SACMEQ, an initial detailed cur-riculum analysis was undertaken across all countries in order to define the read-ing skills that were considered by each country to be the most important. This was done after exhaustive discussion of the most important skills contained within the reading curricula at sixth grade level. It was decided to adopt the three broad content domains for reading literacy as used in PIRLS. Intensive examination of curricula was also conducted to identify descriptive skill levels that would define a recognizable and meaningful dimension: • Level 1: Pupils at this level should be able to linkwords and pictures
where the pictures depict common objects of a “concrete” nature. • Level2:Pupilsatthislevelshouldbeabletolinkwordstomoreabstract
concepts, such as propositions of place and direction, and, perhaps, ideas and concepts, such as comparatives and superlatives (happiest, biggest, below, and so on).
• Level3:Pupilsatthislevelshouldbeabletolinkwords(suchasaphraseor short sentence) from one setting to words in another setting where there is a word match between the two settings.
• Level4:Pupilsatthis levelshouldbeabletodealwithlongerpassagesof text that contain a sequence of ideas and content, and that require understanding derived from an accumulation of information gathered by reading forward.
• Level5:Pupilsatthislevelshouldbeabletoreadthroughatextinorderto confirm understanding, link new information with a piece of informa-tion encountered previously, link ideas from separate parts of a text, or demonstrate the capacity to infer an author’s intention. These dimen-sions, taken in combination with the three domains of reading, formed a framework (or blueprint) for the construction of suitable test items.
d. Design of the material. An initial detailed curriculum analysis was undertaken across all participating countries in order to define the reading skills that were considered by all countries to be the most important in sixth grade.
355. The assessment of teachers, while not uncommon in OECD countries, is unusual in LSEAs in developing countries.

180 / Annexes
Programme d’analyse des systèmes éducatifs de la CONFEMEN (PASEC)
a. Background. Surveys for Programme d’analyse des systèmes éducatifs de la CONFEMEN 356, or PASEC, have been conducted in the Francophone countries of Sub-Saharan Africa. In 1990, at the 42nd CONFEMEN conference in Bamako, Francophone Africa decided to take up the challenge of EFA that was announced in Jomtien that same year. The ministers decided to undertake a joint evaluation pro-gram, and PASEC was adopted at the 43rd CONFEMEN conference in Djibouti in 1991. PASEC seeks to measure the basic educational level of reading (in French) and math, in children enrolled in primary school in African Francophone countries.
b. The target population. The target population includes second and fifth grades (one pretest at the beginning of each grade, and one post-test at the end of each grade).
c. Method of assessment and test content. In contrast with the other LSEAs, PASEC is largely focused on grammar, especially for fifth grade children, with 10 subtests). Written comprehension is assessed at the level of words, sentences, and texts with cloze tests and with word/sentence-picture matching tasks (five subtests at the end of second grade). Other tests involve phonemic discrimina-tion (three subtests at the end of second grade).
d. Design of the material. The test content was based on common core of the school programs in the participating countries.
Latin American Laboratory for Assessment of the Quality of Education (LLECE)
a. Background. The network of national education systems in Latin American and Caribbean countries, known as the Latin American Laboratory for Assessment of the Quality of Education (LLECE), was formed in 1994 and is coordinated by the UNESCO Regional Bureau for Education in Latin America and the Caribbean. Assessments conducted by the LLECE focus on learning achievement in read-ing and mathematics in third and fourth grades in 13 countries of the subcon-tinent, namely Argentina, Bolivia, Brazil, Chile, Columbia, Costa Rica, Cuba, Dominican Republic, Honduras, Mexico, Paraguay, Peru, and the Bolivarian Republic of Venezuela. LLECE seeks to provide information that would be useful in the formulation and execution of education policies within countries. It does so by assessing the achievements of primary-school populations.357
b. The target population. In each participating country, samples of approximate-ly 4,000 students in third grade (eight- and nine-year-olds) and in fourth grade (nine- and ten-year-olds) were assessed.
356. Conférence des Ministres de l’Education des pays ayant le français en partage.357. This description is adapted from Greeney and Kellaghan, 2008.

Smaller, Quicker, Cheaper / 181
c. Method of assessment and test content. Achievement tests (two forms) in language (reading) and in mathematics were developed, including the curricu-lum content of each participating country. Tests were multiple choice and open ended (in language only). Language components included reading comprehen-sion, metalinguistic practice, and production of text in Spanish, except in Brazil where students were tested in Portuguese.
d. Design of the material. Extensive information was collected in questionnaires (completed by students, teachers, principals, and parents or guardians) on factors that were considered likely to be associated with student achievement (for example, school location and type, educational level of parents or guardians, and teachers’ and students’ perceptions of the availability of learning resources in the school).
Early Grade Reading Assessment (EGRA)
a. Background. Early Grade Reading Assessment (EGRA) is designed to measure beginning reading skills in primary school children in developing countries. The subtests of EGRA are similar to those included in existing test batteries, such as DIBELS (used largely in the United States), both of which aim at assess-ing emergent literacy skills known to be correlated with reading achievement.
b. Target population. EGRA focuses on reading assessment at the beginning of reading instruction, mainly in first through fourth grades in developing countries.
c. Method of assessment and test content. Most subtests require students to read aloud and, therefore, require the intervention of an enumerator. The reading aloud tasks involve fluency (that is, accuracy and speed) measured by the mean of correct items processed in one minute. The different subtasks358 are the following:1. Engagement and relationship to print. Indicate where to begin reading
and the direction of reading within a line and a page.2. Letter name knowledge (one minute test). Provide the name (and sometimes
the sound) of upper- and lower-case letters distributed in random order.3. Phonemic awareness. Segment words into phonemes (pronunciation of
the different phonemes of a word containing from two to five phonemes), by identifying the initial sounds in different words.
4. Familiar word reading (one minute test). Read simple and common one-and two-syllable words.
5. Unfamiliar nonword (or pseudo-word) reading (one minute test). Use of grapheme-phoneme correspondences to read simple nonsense words.
6. Oral reading fluency (ORF) in text reading (one minute test). Read a short text with accuracy.
7. Reading comprehension. Respond correctly to different type of questions (literal and inferential) about the text they have read (above).
358. Adapted from EGRA Toolkit (2009), pps. 21–22.

182 / Annexes
8. Listening comprehension. Respond to different type of questions (similar to those used to assess reading comprehension) about a story told by an adult enumerator.
9. Dictation. Write, spell, and use grammar properly through a dictation exercise.
d. Design of material. Adaptations of the test may be made following the EGRA Toolkit guidelines, which suggest designing subtests that respect lan-guage-specific letter, grapheme, and word frequency, syllabic structure, and letter position in the language. The Toolkit also suggests that comprehension subtests should be designed following examples narratives amongst children’s textbooks, that subtests cohere with local culture, and that questions should be fact-based and require inference (avoiding yes/no answers). EGRA is not based on a straight translation, rather it seeks to account for local linguistic specificity and written language constraints.
READ India (Pratham)
a. Background. READ INDIA359 seeks to promote a basic level of proficiency in reading and math. A recent evaluation of the testing tools was based on the baseline data where about 15,000 children were initially tested.360
b. Target population. This program targets children from first grade to fifth grade. Language of instruction is Hindi.
c. Method of assessment and test content. Read India campaign was active in 350 districts across India. The program involves two components: assessing ba-sic reading and math and assessing higher order skills in reading, writing, and math. It made use of an already existing test (www.asercentre.org) whose con-tent is aligned to first grade and second grade level state textbooks for language. The tests assess basic reading and arithmetic each year. Every year some new subjects/skills are also assessed, such as English, comprehension, and problem solving. For reading, it assesses whether students can perform the following:• Cancorrectlyidentifyfourofanyfiverandomlyselectedletters• Cancorrectlyreadfourofanyfiverandomlyselectedcommonwords• Canreadshortfoursentencepassagesofapproximately19wordsatfirst
grade level that the child reads “like she is reading a sentence, rather than a string of words”
359. READ INDIA is a project of Pratham, an Indian NGO. See www.pratham.org. “Read India in collaboration with state governments to ensure that all Indian children in grades 1-5 read and do basic mathematics within a three year-period. … In the academic year 2008-2009 the Read India campaign was active in 350 districts across India. The evaluation of the Read India program is underway in two districts in each of two Indian states, Bihar and Uttara-khand.” (Abdul Latif Jameel Poverty Action Lab, et al., 2009, p. 1).360. Abdul Latif Jameel Poverty Action Lab, et al. (2009).
Smaller, Quicker, Cheaper / 183
• Canreadaseventotensentencestoryofapproximately60wordsatsec-ond grade level “fluently with ease”
• Canorallyanswertwoquestionsafterreadingatext
In addition, READ INDIA uses the following subtests from EGRA battery:• Characterrecognitionnamingfluency• Fluencyinwordreading• Fluencyinnonwordreading• Fluencyintextreading• Readingcomprehension
Written language tests were also developed to assess:• Letterknowledge:letterdictation• Wordknowledge:matchpicturewithword,selectantonym,labelpicture• Sentencecomprehension(lexicaldecisiontask)• Clozesentence—selectcorrectwordtocompletesentence• Passagecomprehension(factual&inferential):readtwopassagesandan-
swer questions• Writingability:worddictation(spelling);labelpictures;constructasen-
tence; read passages and answer comprehension questions.d. Design of the material. The test content was designed using some of the ap-
proaches found in the EGRA procedures. Special attention was given to the Hindi orthography.361 The tests were designed using following principles362:(a) The test should cover a range of content so that there are items on the tests
that are appropriate for first through fifth grade(b) The content of the test should be appropriate for the context, language, and
the curriculum of the target population and the test content should map onto the skills and competencies targeted by the intervention program
(c) The tests should draw upon reading research to assess skills identified as important for reading ability
(d) The test formats should have demonstrable feasibility for use in large-scale testing
(e) The tests should capture diverse ability levels in order to capture the full spectrum of achievement levels
(f ) The test items should discriminate between children of high and low ability levels
361. “Hindi has a relatively shallow orthography. However the transparency of spelling-to-sound representation in Hindi comes with the challenge of learning a large number of characters – primary and secondary forms of vowels, consonant-vowel (CV) units, conjoint consonants and consonant clusters. Hindi has no upper and lower case akshars and a string of akshars forming a word is connected by a headline. These specific features of the Hindi script were considered in designing the assessment tools.” Abdul Latif Jameel Poverty Action Lab, et al. (2009), p. 2.362. Abdul Latif Jameel Poverty Action Lab, et al. (2009), p. 2.

184 / Annexes
(g) The test format should be easy to understand and be familiar to the target population
(h) The tests should have a mix of oral and written (pencil-paper) test formats to capture diverse skills
(i) The tests should have a mix of multiple-choice and open-ended formats on the written test format to capture diverse skills
(j) The tests should be easy to administer and easy to score so that adminis-tration and scoring can be standardized.
Annex B: Item Samples From Reading Assessments
PISA, Sample Item363
ACOL Voluntary Flu Immunisation ProgramAs you are no doubt aware the flu can strike rapidly and extensively during winter. It can leave its victims ill for weeks. The best way to fight the virus is to have a fit and healthy body. Daily exercise and a diet including plenty of fruit and vegetables are highly recommended to assist the immune system to fight this invading virus. ACOL has decided to offer staff the opportunity to be immunised against the flu as an additional way to prevent this insidious virus from spreading amongst us. ACOL has arranged for a nurse to administer the immunisations at ACOL, during a half-day session in work hours in the week of May 17. This program is free and available to all members of staff. Participation is voluntary. Staff taking up the option will be asked to sign a consent form indicating that they do not have any allergies, and that they un-derstand they may experience minor side effects. Medical advice indicates that the immunisation does not produce influenza. However, it may cause some side effects such as fatigue, mild fever and tenderness of the arm.
Who should be immunised?Anyone interested in being protected against the virus. This immunisation is es-pecially recommended for people over the age of 65. But regardless of age, anyone who has a chronic debilitating disease, especially cardiac, pulmonary, bronchial or diabetic conditions. In an office environment all staff is at risk of catching the flu.
363. Adapted and abbreviated from PISA (2009c, pps 19-20). Downloaded (June 24, 2010) http://www.oecd.org/dataoecd/47/23/41943106.pdf

Smaller, Quicker, Cheaper / 185
Who should not be immunised?
Individuals hypersensitive to eggs, people suffering from an acute feverish illness and pregnant women. Check with your doctor if you are taking any medication or have had a previous reaction to a flu injection. If you would like to be immunised in the week of May 17 please advise the personnel officer, Fiona McSweeney, by Friday May 7. The date and time will be set according to the availability of the nurse, the number of participants and the time convenient for most staff. If you would like to be im-munised for this winter but cannot attend at the arranged time please let Fiona know. An alternative session may be arranged if there are sufficient numbers.
For further information please contact Fiona on ext. 5577.
Questions
Question 2.1Which one of the following describes a feature of the ACOL flu immunisation program?
A. Daily exercise classes will be run during the winter. B. Immunisations will be given during working hours. C. A small bonus will be offered to participants.D. A doctor will give the injections.
Question 2.2We can talk about the content of a piece of writing (what it says). We can talk about its style (the way it is presented). Fiona wanted the style of this information sheet to be friendly and encouraging. Do you think she succeeded? Explain your answer by referring in detail to the layout, style of writing, pictures or other graphics.
Question 2.3This information sheet suggests that if you want to protect yourself against the flu virus, a flu injection is
A. more effective than exercise and a healthy diet, but more risky. B. a good idea, but not a substitute for exercise and a healthy diet. C. as effective as exercise and a healthy diet, and less troublesome.D. not worth considering if you have plenty of exercise and a healthy diet.

186 / Annexes
SACMEQ, Reading Test Design
Skill Level Narrative Expository Document
Level 1 Word/picture as-sociation involving positional or directional prepositions requiring the linkage of a picture to a position or a direc-tion in order to answer the question
Word/picture as-sociation involving positional or directional prepositions requiring the linkage of a picture to a position or a direc-tion in order to answer the question
Word/picture as-sociation involving positional or directional prepositions requiring the linkage of a picture to a position or a direc-tion in order to answer the question
Items 2 2 2 6
Level 2 Recognising the meaning of a single word and being able to express it as a synonym in order to answer the question
Recognising the meaning of a single word and being able to express it as a synonym in order to answer the question
Linking simple piece of information to item or instruction
Items 7 6 9 22
Level 3 Linking information portrayed in sequences of ideas and content, when reading forward
Linking information portrayed in sequences of ideas and content, when reading forward
Systematic search for information when read-ing forward
Items 8 10 8 26
Level 4 Seeking and confirm-ing information when reading backwards through text
Seeking and confirm-ing information when reading backwards through text
Linking more than one piece of information in different parts of a document
Items 9 5 4 18
Level 5 Linking ideas from different parts of text. Making inferences from text or beyond text, to infer author’s values and beliefs
Linking ideas from different parts of text. Making inferences from text or beyond text.
Use of embedded lists and even subtle advertisements where the message is not explicitly stated
Items 6 3 2 11
Total Items 32 26 25 83

Smaller, Quicker, Cheaper / 187
PASEC, Goals and Items
Tableau synthétique Début 2ème année
Exercices Domaines Objectifs
5 Compréhension de mots (vocabulaire)
Identifier parmi 3 mots celui qui correspond à l’image
2 Compréhension de phrase
Ecrire une phrase à partir de 4-5 mots donnés dans le désordre
8-9 Identifier la phrase (parmi 3) qui correspond à l’image (2 sous-tests)
1-6 Lecture / déchiffrement
Identifier une syllabe dans une série de mots (‘pi’ dans ‘épine, pipe, pilon’)Reconnaître un mot identique au mot test parmi 4 mots proches visuellement ou se prononçant de la même façon (‘sot’: ‘saut, seau, pot, sot’).
7 Copie: Ecrire le mot qui manque dans une phrase incomplète, la phrase complète étant présentée au dessus de celle qui est à compléter
3-4 Ecriture Ecrire une syllabe (3) ou un mot (4) à partir d’une lettre (2 sous-tests)
Tableau synthétique Fin 2ème année
Exercices Domaines Objectifs
1 Compréhension de mots (vocabulaire)
Identifier parmi 4 images celle qui correspond au mot écrit présenté
4 Compréhension de phrases
Identifier le mot qui donne du sens à la phrase (‘Il prend le train à la …’ [gare-oiseau-école])
6 Ecrire une phrase à partir de 4-5 mots donnés dans le désordre
9 A l’aide d’une image, identifier la préposition donnant du sens à la phrase (‘Sidi est [à-de-dans] la voiture’).
10 Compréhension de texte
Compléter un texte comportant des mots qui manquent (don-nés, mais dans le désordre).
2-3-8 Lecture – Ecriture: discrimination de sons proches (t-d; f-v;br-pr.. )
Ecrire après écoute la lettre (ou le groupe de lettre) qui manque (par exemple: ‘t ou d’ dans ‘maXame’ et ‘paXate’; ‘f ou v’ dans ‘Xarine’ et ‘Xie’; ‘pr ou br’ dans ‘XXépare’ et ‘XXanche, 3 sous-tests)
5 Grammaire (Conju-gaison)
Identifier le pronom personnel qui va avec le verbe conjugué (‘… parles trop’ [tu-nous-vous])
7 Grammaire Distinguer le singulier et le pluriel des noms (‘Il porte des [cahiers, livre, mètre])

188 / Annexes
Tableau synthétique Début 5ème année
Exercices Domaines Objectifs
1 Compréhension de mots et de phrases
Identifier le sens d’un mot dans une phrase: ‘la grande soeur a discuté avec son frère’ signifie: ‘elle a travaillé avec lui’, ‘elle a joué avec lui’, ‘elle a parlé avec lui’, ‘elle a mangé avec lui’
2 Identifier la préposition correcte (‘le chavel trotte [contre-sous-dans] la rue’)
15-16 Compréhension de textes
Répondre à des questions dont la réponse se trouve explicite-ment dans le texte (lecture d’une notice de médicament)Lire un text à trou et le compéter avec des mots donnés, dont 1 en trop.
3 Grammaire 1 Accorder le participe passé: ‘Ma mère prépare mon plat… [préféré-préférée-préférés-préférer]’
4 Accorder le verbe avec le sujet: ‘Mon père et moi [allons-va-vont] à la foire’
5-6-7 Grammaire 2 (Con-jugaison)
Identifier le temps d’un verbe (indicatif présent, imparfait, passé composé, et futur simple)Identifier une phrase écrite sans erreur orthographique dans le verbe
8 Grammaire 3 (Forme de la phrase)
Transformer une phrase affirmative en une phrase interrogative
9-10-11-13
Grammaire 4 Entourer le complement d’objet indirect ou le sujet d’une phrase (2 sous-tests)Entourer le pronom qui peut remplacer le groupe souligné (par exemple, ‘la fête aura lieu dimanche’ [elles-bous-elle])Compléter la phrase: ‘C’est l’école de Mady et de Kassi: c’est........ école’
12-14 Orthographe Identifier le nom qui se termine par ‘x’ au pluriel (bleu, cha-peau, jupe): - Orthographier correctement des homophones (‘il [s’est-ces-ses-c’est] blessé’
364. Data missing on sample size, where not listed.365. Information missing on other languages.366. An additional reading comprehension task was added (cloze test).

Smaller, Quicker, Cheaper / 189
EGRA: Field Studies and Subtests Used
Language(s) of assessment, grade(s) tested, numbers of children assessed; subtests are numbered accordingly to the list presented above in Annex A. An X in “in-tervention” indicates that EGRA has been implemented to monitor progress in a reading intervention program. Sample sizes are in parentheses. The present list of countries is representative, not comprehensive.
Country Language of assessment
Grade tested (number of students assessed)
Subtests employed Intervention
Liberia Grade 2 (429 ) Grade 3 (407)
1, 2, 3,4, 5, 6, 7, 8 X
Kenya English, Kiswahili
Grade 2364 2, 3 (in English only, 5, 6, 7
X
Gambia English Grade 1, 2 and 3 (1200) 1, 2, 3,4, 5, 6, 7, 8, 9
Senegal FrenchWolof
French: Grade 1 to 3 (502)Wolof: Grade 1 and 3 (186)
1, 2, 3,4, 5, 6, 7, 8, 9
Egypt Arabic (100) 1, 2, 3,4, 5, 6, 7, 8, 9 X
Guatemala Spanish and mother tongue365 Spanish, Mam, K’iche, Ixil
Grade 2 and 3Grade 3
2, 3,4, 5, 6, 7, 8, 91, 6, 7
Haiti Haitian Creole, French
Grade 2 to Grade 4 (3000) 2, 3, 4, 5, 6, 7, 8, 9 + an extra vocabulary task
Honduras Spanish Grade 2 to 4 (2226) 1, 6, 7
Mali French, Arabic Bamanankan, Bomu, Songhoi, Fulfulde
French in grades 2, 4 and 6; Arabic in grades 2 and 4, Grade 1 to 3 in remain-ing 4 languages366
1, 2, 3,4, 5, 6, 7, 8, 9
Ethiopia Ofo Aromo Grade 3 1, 6, 7
Guyana English Grade 1 to 3 (2699) 2, 3,4, 5, 6, 7, 8, 9
Uganda English, Lu-ganda, Lango
2, 3,4, 5, 6, 7
367. Adapted from Abdul Latif Jameel Poverty Action Lab, et al., 2009, p. 10.

190 / Smaller, Quicker, Cheaper
READ India (Pratham) Literacy Test Content367
Overview of test content and item description for the RI Literacy test in the written format for grades 1-2 and grades 3-5
Content Area Description of Item Grades 1-2
Grades 3-5
Akshar Knowledge Akshar dictation Y Y
Reading Vocabulary Match picture with word Select antonym (Opposite)
Y Y
Y Y
Word and Sentence Complete word to match picture Write word that describes the picture Listen and write word Use words in sentences
Y YYY
Y YYY
Sentence Comprehension (lexical decision task)
Select correct word to complete sentence from the given options (Maze task) Provide correct word to complete sentence (Cloze task)
Y
N
Y
Y
Passage Comprehension Read passage 1 and answer literal questions (to understand what is read)
Read passage and answer questions that require synthesizing information and interpreting ideas
Y (multiple-
choice format)
N
Y (open-ended format)
Y
Note: This overview is based on the final version of the text developed after the second round of piloting.

Smaller, Quicker, Cheaper / 191
About the Author
Dan Wagner holds the UNESCO Chair in Learning and Literacy, and Professor of Education at the University of Pennsylvania. He is Director of the International Literacy Institute, co-founded by UNESCO and the University of Pennsylvania (www.literacy.org), and Director of its National Center on Adult Literacy. Dr. Wagner is also Director of Penn’s International Educational Development Program (IEDP) in graduate study. After an undergraduate degree in Engineering at Cornell University, and voluntary service in the Peace Corps (Morocco), he received his Ph.D. in Psychology at the University of Michigan, was a two-year postdoctoral fellow at Harvard University, a Visiting Fellow (twice) at the International Institute of Education Planning in Paris, a Visiting Professor at the University of Geneva (Switzerland), and a Fulbright Scholar at the University of Paris. Dr. Wagner has extensive experience in national and international educational issues, and has served as an advisor to UNESCO, UNICEF, World Bank, USAID, DFID, and others on international development issues. His most recent multi-year projects have been in India, South Africa, and Morocco. In addition to many professional publications, Dr. Wagner has written/edited over 20 books, including: Literacy: Developing the future (in 5 languages); Literacy: An International Handbook; Learning to Bridge the Digital Divide; New Technologies for Literacy and Adult Education: A Global Review; Monitoring and Evaluation of ICT for Education in Developing Countries.

The effective use of educational assessments is fundamental to improving learning. However, effective use does not refer only to the technical parameters or
statistical methodologies. Learning assessments in use today—whether large-scale or household surveys or hybrid (‘smaller, quicker, cheaper’ or SQC)—have varied uses and purposes. The present volume provides a review of learning assessments, their status in terms of the empirical knowledge base, and some new ideas for improving their effectiveness, particularly for those children most in need.
It is argued here that SQC learning assessments have the potential to enhance educational accountability, increase transparency, and support a greater engagement of stakeholders with an interest in improving learning. In addition, countries need a sustained policy to guide assessment choices, including a focus on poor and marginalized populations. The current effort to broaden the ways that learning assessments are undertaken in developing countries is vital to making real and lasting educational improvements.
The Author Daniel A. Wagner holds the UNESCO Chair in Learning and Literacy, and is Professor of Education at the University of Pennsylvania. He is Director of the International Literacy Institute, co-founded by UNESCO and the University of Pennsylvania (www.literacy.org), and Director of its National Center on Adult Literacy. Dr. Wagner is also Director of Penn’s International Educational Development Program (IEDP) in graduate study. He has extensive experience in national and international educational issues, and has served as an advisor on international development issues to UNESCO, UNICEF, the World Bank, the U.S. Agency for International Development (USAID), and other organizations.
ISBN: 978-92-803-1361-1
International Institutefor Educational Planning
International Institutefor Educational Planning
Smaller, Quicker, CheaperImproving Learning Assessments for Developing Countries
Smaller, Q
uick
er, Ch
eaper:
Imp
roving
Learn
ing
Assessm
ents fo
r Develo
pin
g C
ou
ntries
Daniel A. Wagner
Quality education for all
Dan
iel A. W
agn
er