Embed Size (px)
Citation preview
Policy Research Working Paper 7203
What Really Works to Improve Learning in Developing Countries ?
An Analysis of Divergent Findings in Systematic Reviews
David K. EvansAnna Popova
Africa RegionOffice of the Chief EconomistFebruary 2015
WPS7203P
ublic
Dis
clos
ure
Aut
horiz
edP
ublic
Dis
clos
ure
Aut
horiz
edP
ublic
Dis
clos
ure
Aut
horiz
edP
ublic
Dis
clos
ure
Aut
horiz
ed
Produced by the Research Support Team
Abstract
The Policy Research Working Paper Series disseminates the findings of work in progress to encourage the exchange of ideas about development issues. An objective of the series is to get the findings out quickly, even if the presentations are less than fully polished. The papers carry the names of the authors and should be cited accordingly. The findings, interpretations, and conclusions expressed in this paper are entirely those of the authors. They do not necessarily represent the views of the International Bank for Reconstruction and Development/World Bank and its affiliated organizations, or those of the Executive Directors of the World Bank or the governments they represent.
Policy Research Working Paper 7203
This paper is a product of the Office of the Chief Economist, Africa Region. It is part of a larger effort by the World Bank to provide open access to its research and make a contribution to development policy discussions around the world. Policy Research Working Papers are also posted on the Web at http://econ.worldbank.org. The authors may be contacted at [email protected] and [email protected].
In the past two years alone, at least six systematic reviews or meta-analyses have examined the interventions that improve learning outcomes in low- and middle-income countries. However, these reviews have sometimes reached starkly different conclusions: reviews, in turn, recommend information technology, interventions that provide infor-mation about school quality, or even basic infrastructure (such as desks) to achieve the greatest improvements in student learning. This paper demonstrates that these diver-gent conclusions are largely driven by differences in the samples of research incorporated by each review. The top recommendations in a given review are often driven by the results of evaluations not included in other reviews. Of 227
studies with student learning results, the most inclusive review incorporates less than half of the total studies. Vari-ance in classification also plays a role. Across the reviews, the three classes of programs that are recommended with some consistency (albeit under different names) are pedagogical interventions (including computer-assisted learning) that tailor teaching to student skills; repeated teacher training interventions, often linked to another pedagogical interven-tion; and improving accountability through contracts or performance incentives, at least in certain contexts. Future reviews will be most useful if they combine narrative review with meta-analysis, conduct more exhaustive searches, and maintain low aggregation of intervention categories.
What Really Works to Improve Learning in Developing Countries?
An Analysis of Divergent Findings in Systematic Reviews
David K. Evans World Bank
Anna Popova World Bank
JEL Codes: O15, I21, I28, J13
Keywords: Education, Impact Evaluation, Human Capital
Acknowledgments: The authors are grateful for comments from Jacobus Cilliers, Katharine Conn, Deon Filmer,
Alejandro Ganimian, Peter Holland, Howard White, Jeffery Tanner, and Viticia Thames, and for background materials
provided by Katharine Conn, Alejandro Ganimian, and Paul Glewwe. The authors can be contacted at David K. Evans
([email protected]) and Anna Popova ([email protected]).
2
1. Introduction Education quality remains an elusive goal in many developing countries. While countries around the world
have made great strides in increasing access to education, much of this education is still of low quality,
with low learning outcomes reported in Africa, Latin America, and elsewhere (Bruns & Luque 2014; Filmer
& Fox 2014; UNESCO 2014). At the same time, evidence suggests – unsurprisingly – that additional years
of schooling have little impact on economic growth in the absence of learning, which is a function of
education quality (Hanushek & Woessman 2007). At the same time that governments seek to increase
the quality of education, the use of experimental and quasi-experimental methods to measure the
effectiveness of education interventions in developing countries has become increasingly common. This
has resulted in hundreds of studies from around the world demonstrating the effectiveness (or
ineffectiveness) of various interventions at improving student learning. These interventions range from
providing information about the quality of schools to parents, to training teachers in scripted literacy
instruction, to dropping laptops off for students.
To make sense of all this evidence, various researchers have undertaken systematic reviews of these
impact evaluation studies. In 2013 and 2014 alone, at least six reviews of studies seeking to improve
student learning in primary schools in developing countries were published in journals or released as
working papers. These include Conn 2014, Glewwe et al. 2014, Kremer, Brannen, & Glennerster 2013,
Krishnaratne, White, & Carpenter 2013, McEwan 2014, and Murnane & Ganimian 2014.1 Between them,
they review 301 studies from across the developing world: 227 of those studies report learning outcomes,
and 152 report enrollment or attendance outcomes. There are differences in the scope of the reviews:
Some focus only on primary education whereas others explore both primary and secondary, some only
look at learning impacts while others also consider enrollment or attendance, one has a regional focus
(Sub-Saharan Africa), two include only randomized controlled trials (RCTs), and three have a well-defined
time frame. Yet, as the common denominator, all of these reviews include RCTs implemented in Sub-
Saharan Africa with learning outcomes at the primary school level, published roughly between 1990 and
2010, so the expected overlap is substantial.
Despite that, the main results they highlight for improving learning appear inconsistent. For example,
using a subset of the conclusions for each review, Conn (2014) highlights pedagogical interventions as
most effective, while McEwan (2014) finds the largest effects for interventions involving computers and
technology. Kremer, Brannen, & Glennerster (2013) highlight pedagogical reforms that match teaching to
student learning levels as well as the incentives associated with hiring teachers on short-term contracts.
Glewwe et al. (2014) emphasize the impact of teacher knowledge, teacher absenteeism and the
availability of student desks on student learning. Krishnaratne, White, & Carpenter (2013) underline the
importance of learning materials. And Murnane and Ganimian (2014) emphasize providing information
about school quality and returns to schooling, among other findings.
1 Murnane & Ganimian was published in July 2014 as a National Bureau of Economic Research working paper (Murnane & Ganimian 2014a). For this study, we draw on an updated, unpublished version provided by the authors dated November 18, 2014. Although the sample of studies varies across the two versions, the conclusions are exactly the same.
3
Given the massive array of evidence, and the apparent divergence in conclusions from the reviews of the
evidence, how is one to understand what actually works best to improve learning in developing countries?
In this paper, we critically examine these recent reviews to understand the underlying reasons for the
observed divergence in conclusions. We also characterize the heterogeneity of effectiveness within
categories of interventions. Finally, we highlight the common themes across the reviews – sometimes
obscured by differences in categorization – in terms of what kinds of interventions are more and less
effective.
We find that much of the divergence in conclusions is driven by strikingly different compositions of studies
across the reviews: Of the 227 studies that look at learning outcomes, only three are included in all six
systematic reviews, whereas almost three-quarters (159) are included in only one of the reviews. While
some of these compositional differences are driven by explicit exclusion rules (e.g., some reviews include
only randomized trials and one focuses only on evidence from Sub-Saharan Africa), many are not. This
divergence does not mean that reviews are incorrect in characterizing what works well: The main
conclusions of each review are supported by evidence from papers that attempt to explicitly establish a
counterfactual. Indeed, the strongest positive results in each review are driven by randomized controlled
trials. However, each review incorporates different evidence, leading to different ultimate conclusions.
We also observe that much of the variation in outcomes across educational interventions is captured
within categories of interventions rather than across them. Highlighting the average effectiveness of a
given category of intervention may be less useful than characterizing the narrower types of interventions
within that category that drive high returns: For example, saying that computer interventions are most
effective may be less useful and less accurate than saying that computer-assisted learning programs which
are tailored to each student’s level of knowledge, tied to the curriculum, and that provide teachers with
training on how to integrate the technology into their instruction are most effective.
Finally, we find that there is indeed some intersection in recommendations across the reviews, although
that intersection is masked with different labels. Even given the small degree of overlap in the composition
of review samples, we find broad support across the reviews for (i) pedagogical interventions that match
teaching to students’ learning, including through the use of computers or technology; (ii) individualized,
long-term teacher training; and (iii) accountability-boosting interventions, such as teacher performance
incentives and contract teachers.
2. Methods This paper takes as its population the set of reviews of impact evaluation evidence on improving student
learning in developing countries identified in 2013 and 2014. We restrict this analysis to reviews of
evidence on how to improve learning, as opposed to increasing access (although many of the reviews also
include evidence on the latter).2 Note the caution that test scores, even when converted into standard
2 For the purposes of this paper, student learning is measured by test scores in math, language, science, or cognitive assessments, as determined by the inclusion criteria of the six systematic reviews. Specifically, the meta-analyses (three of the reviews) use standard deviations of test scores to measure learning impacts so as to allow comparison across different tests administered in different contexts.
4
deviations, are not necessarily comparable. For example, literacy tests focusing on different skills (e.g.,
narrower versus broader measures of literacy) may deliver different average effect sizes (Hollands et al.
2013). Likewise, an intervention may seem ineffective if it is evaluated using a very difficult test which
virtually no students could pass even after the intervention (i.e., the floor effect).
We include systematic reviews that examine heterogeneous interventions with a common goal, improving
student learning. An alternative approach, employed in other systematic reviews, is to select a single
intervention or class of interventions and examine their effectiveness across one or more goals. For
example, Bruns, Filmer, & Patrinos (2011) take the latter approach for accountability reforms in education;
Baird et al. (2014) do the same for cash transfers. If the goal is to identify the best interventions to improve
student learning, then the first approach makes the most sense. If the goal is to identify the best model
within a class of interventions or whether a class of interventions is effective overall, then the second
approach may be more appropriate.
We also include only reviews that examine the effectiveness of improving learning at the primary level,
although they need not exclusively examine the primary level. Some reviews, such as Petrosino (2012),
focus on enrollment rather than learning and so are not included; one review that is included,
Krishnaratne (2013), employs the sample of studies developed in Petrosino (2012). Likewise, Banerjee et
al. (2013) is excluded because it focuses exclusively on post-primary education; note, though, that
Banerjee et al. (2013) uses the subset of studies from Glewwe et al. (2014) which report post-primary
education outcomes as its universe, adding only a handful of additional studies exclusively focused on
post-primary education.
In examining the eligible reviews, we examine (i) the main conclusions; (ii) the exclusion rules; (iii) the
variation in the composition and categorization of included studies for at least one key conclusion area
(e.g., pedagogical interventions, additional school resources) from each review; 3 and (iv) the
heterogeneity across results within intervention category. We then use the studies at the intersection of
conclusions across reviews to discuss the implications for education policy.
3. Results
3.1 The Reviews and the Studies beneath the Reviews We discuss six reviews in this study: Conn (2014), Glewwe et al. (2014), Kremer, Brannen, & Glennerster
(2013), Krishnaratne, White, & Carpenter (2013), McEwan (2014), and Murnane & Ganimian (2014). These
include, fundamentally, three types of review: The first of these, meta-analysis, converts the results of all
the included studies to standardized point estimates and then pools the estimates within a category of
interventions (e.g., all the studies on providing school meals) to estimate the average effect of that
category of intervention with greater statistical power. 4 Second, the narrative review examines the
3 We examine the variation in the categorization of included studies for one key conclusion area for each review except Glewwe et al. (2014), which does not identify which of the studies it reviews fall into which category. 4 Meta-analysis consists of a weighted average of regression results across individual studies and can be carried out with any number of studies. Meta-regression analysis is a subset of meta-analysis which incorporates these results
5
evidence qualitatively, usually discussing study by study, and then infers conclusions. Third, the vote
counting review shows the pattern of significant and insignificant positive and negative impacts across
studies and draws inferences from that. Across these types, reviews vary in how systematically they define
the strategy used to identify the papers reviewed.5
Each method has its advantages and disadvantages (Koricheva & Gurevitch 2013), as summarized in Table
1. Narrative reviews are often written by recognized experts in the field, who may have broad familiarity
with the topic. These reviews provide the ability to reflect on nuances across studies and their underlying
interventions, and to draw conclusions from these. This is particularly valuable where there is variation in
the effectiveness at improving student learning within a given intervention category, which there often is.
In other words, when not all technology-based interventions are equally good at improving learning, for
example, narrative reviews are well suited to discussing which elements of such interventions are more
or less effective. Narrative reviews may also be more effective than other reviews at exploring the
mechanisms behind the effectiveness of interventions using economic theory and intuition. However,
these reviews rely on a subjective weighting of the evidence by the reviewer, which may become less
reliable as the number of studies reviewed increases. Also, because the weighting is qualitative, it may
not be completely transparent to the reader, especially if not all reviewed studies are reported.
Vote counting has the appeal of simplicity, but it ignores sample size, statistical precision (except for
significance cut-offs), and effect size, and so may overemphasize small significant effects at the expense
of large effects that narrowly miss a significance cut-off. 6 Meta-analysis is more labor-intensive to
implement, but since it aggregates results across studies into a single meta-result, it incorporates the data
that vote counting excludes (e.g., effect size) while potentially increasing statistical power by pooling
across smaller studies. Meta-analysis also permits controlling for the quality of studies or other
moderating factors, as Conn (2014) and McEwan (2014) do in their meta-analyses. However, because
meta-analysis requires pooling estimates across studies, studies that fail to report certain elements of the
underlying data may be excluded, despite the studies being of high quality in other respects (e.g., internal
validity). Meta-analyses also tend to use higher levels of aggregation (e.g., “pedagogical interventions”)
than narrative reviews, which can be less helpful if there is a great deal of variation within the broad class
of intervention.
Of the six reviews considered here, three are meta-analyses – Conn (2014), McEwan (2014), and
Krishnaratne, White, & Carpenter (2013); two are narrative reviews – Kremer, Brannen, & Glennerster
(2013) and Murnane and Ganimian (2014); and one is a vote count – Glewwe et al. (2014), as shown in
Table 2. However, several of the reviews have elements that cross categories. Kremer, Brannen, &
Glennerster (2013), while a narrative review, does present standardized coefficients across many of the
in a regression, permits controlling for moderating factors (such as study quality or implementing agency), and requires a minimal sample size. Conn (2014) and McEwan (2014) both include meta-regression. Krishnaratne et al. (2013) is a meta-analysis but does not report meta-regression results. 5 All reviews except Kremer, Brannen, & Glennerster (2013) document an explicit search strategy, including the keywords used and literature databases searched. 6 Ziliak & McCloskey (2014) discuss the policy cost of focusing on narrowly defined statistical significance at the expense of effect size.
6
studies considered. Krishnaratne, White, & Carpenter (2013) reports meta-analysis results in the appendix
but is written in the format of a narrative review. Conn (2014) presents detailed meta-analysis but also a
detailed narrative discussion of individual studies.
The reviews vary extensively in the number of studies incorporated and the official inclusion criteria (Table
3). The median number of learning studies reviewed is 61, with a minimum of 30 (Kremer, Brannen, &
Glennerster 2013)7 and a maximum of 92 (Murnane & Ganimian 2014). The total number of learning
studies, across the six reviews, is 227. These are drawn from across the world, with more than 20 studies
in each of China, India, and Kenya (Table 4 and Figure 1). The total number of learning studies available
has grown significantly over time (Figure 2), from 30 cumulative studies in 2000 to 32 studies coming out
in 2013 alone.8 Taken together, this collection of studies likely reflects a close approximation of the total
impact evaluation evidence on learning in developing countries over the last 25 years.
The reviews differ somewhat in geographical focus (Table 5). On average across the reviews, 34 percent
of studies assess the effectiveness of learning interventions in Sub-Saharan Africa, 25 percent in Latin
America and the Caribbean, 19 percent in East Asia and the Pacific, 16 percent in South Asia, and almost
no studies in the Middle East and North Africa or Europe and Central Asia. While most reviews reflect this
pattern, there is some divergence from the mean, most notably in Conn (2014) and Kremer, Brannen, &
Glennerster (2013). By design, all of the studies included in Conn (2014) evaluate learning interventions
in Sub-Saharan Africa, although 4 percent of these also provide results for countries in South Asia. Kremer,
Brannen, & Glennerster (2013) include a high proportion of studies from Sub-Saharan Africa (40 percent)
and South Asia (33 percent), with other regions under-represented relative to the average.
Two reviews include only randomized controlled trials, Kremer, Brannen, & Glennerster (2013) and
McEwan (2014). The others include RCTs as well as quasi-experimental methods, with slightly differing
criteria for which methods qualify. One review has a geographic focus: Conn (2014) reviews only studies
from Sub-Saharan Africa. Two examine primary school only (Kremer, Brannen, & Glennerster 2013 and
McEwan 2014), while the others include secondary school or other levels in addition to primary school.
Only three impose an explicit criterion for study publication date, Glewwe et al. (2014) and Krishnaratne,
White, & Carpenter (2013), both roughly 1990-2010, and Conn (2014), 1980-2013. All the reviews include
RCTs, primary school outcomes, studies in Sub-Saharan Africa, and studies released between 1990 and
2010.
The learning studies included in the reviews fall broadly into three publication categories: published
journal articles, unpublished working papers, and reports. Table 6 presents the distribution of learning
studies across these categories for each review. Across the reviews, a slight majority of the learning
studies included are journal articles (63 percent). This suggests there may be some degree of publication
bias driving the studies included, but the proportion of published articles is not overwhelming and could
7 We arrive at Kremer, Brannen, & Glennerster (2013)’s sample of 30 studies by including all those studies for which they provide a point estimate of the evaluated program’s impact on test scores (18 studies), as well as those whose impacts (positive or negative) are explicitly discussed in the text. 8 Similarly, the total number of studies evaluating either learning or access outcomes (or both) has grown significantly from 35 cumulative studies in 2000 to 301 studies by 2014, with more than 40 studies in 2013 alone.
7
merely reflect reviewers’ preferences for the inclusion of high quality studies. The second most prominent
category of studies is working papers, which accounts for 32 percent of learning studies on average. This
proportion ranges from 7 percent of learning studies for Glewwe et al. (2014) to 50 percent for McEwan
(2014), suggesting substantial variation in reviewers’ inclusion of unpublished work. Lastly, only 5 percent
of all learning studies reviewed are reports, with less variation across reviews.
As they are reported in the reviews, the main conclusions recommend somewhat different categories of
interventions (Table 7). Conn (2014) finds the best results for pedagogical interventions as well as for
student incentives.9 She also finds positive results for extending the length of the school day, but only
based on one study. Glewwe et al. (2014) find evidence that desks, chairs, and tables improve student
learning, as well as teacher subject knowledge and teacher presence. Kremer, Brannen, & Glennerster
(2013) identify pedagogical interventions to match teaching to students’ learning, school accountability,
and incentives as being highly effective. Krishnaratne, White, & Carpenter (2013) identify the provision of
school materials as effective. McEwan (2014) identifies several effective classes of interventions, including
– in descending order of mean effect size – computers or instructional technology, teacher training,
smaller classes, smaller learning groups within classes, or ability grouping, contract or volunteer teachers,
student and teacher performance incentives, and instructional materials. Finally, Murnane and Ganimian
(2014) recommend providing information about school quality and returns to schooling, teacher
incentives (in very low performance settings), and providing specific guidance for low-skilled teachers to
help them reach minimally acceptable levels of instruction.
There seems to be more agreement on what is not effective in increasing student learning: three reviews
demonstrate that school health interventions, including deworming, do not improve test scores, although
one of those reviews – Conn (2014) – at the same time shows that health interventions do improve direct
cognitive tests (of attention and memory) but not school language and math tests. Three reviews also
argue that reductions in school fees do not improve student learning, although these clearly may improve
student access to school.
3.2 Variation in Composition and Categorization How much of this variation in conclusions is driven by the composition of the studies included, and how
much is driven by differing categorization of similar studies? In terms of composition, the reviews include
227 learning studies between them, and the most inclusive single review (Murnane & Ganimian 2014)
includes just over 40 percent of the total sample of papers. The least inclusive review (Kremer, Brannen,
& Glennerster 2013) includes 13 percent of the total sample (Table 8).
The overlap across these reviews is surprisingly limited. Almost three-quarters of all the learning studies
across the six reviews (159 studies) are included in only one of the six reviews. Only 3 studies (1 percent
of the total) are included in all of the reviews (Figure 3): A study of textbook provision (Glewwe et al.
9 Conn’s (2014) estimate for student incentives is based on only two studies, however, containing four treatment arms in total.
8
2009), a study of flipchart provision (Glewwe et al. 2004), and a study of student incentives (Kremer,
Miguel, & Thornton 2009), all in Kenya.
One natural explanation for the difference in composition is the inclusion rules of the reviews. Conn (2014)
only includes studies in Sub-Saharan Africa, for example. However, if one looks at the studies that are
included in all but one of the reviews, allowing for the possibility that many studies may be included in all
reviews except Conn (2014), one finds only 4 studies (again, out of a total of 227). If one expands the field
to studies included in most reviews (4, 5, or all 6), a total of only 13 studies achieve this (6 percent of the
sample). Some of this exclusion may also be based on measures of quality, whether subjective or based
on explicit criteria – e.g., Murnane and Ganimian (2014) exclude studies that rely exclusively on fixed
effects or matching methods. While some exclusions are justified by explicit search restrictions, many are
not. To illustrate this point we contrast two studies. The first, Angrist & Lavy (2001), is an evaluation of a
teacher training intervention in Israel, evaluated using a matching strategy. The second, Gee (2010) is an
RCT of an anti-malarial program with learning outcomes in Kenya. We can easily see why Angrist & Lavy
(2001) would be excluded from Conn (2014) and Murnane and Ganimian (2014); the former focuses on
Sub-Saharan Africa and the latter explicitly excludes matching studies. Gee (2010), however, falls into the
common denominator of inclusion criteria across almost all reviews: it is an RCT with learning outcomes
at the primary school level, in Sub-Saharan Africa, published between 1990 and 2010. According to the
stated search strategies of the reviews therefore, there is no reason why it should be excluded from any
review except Krishnarate, White, & Carpenter (2013), who cut off their search in 2009. In practice,
however, it is only included in Conn (2010).
Other distinguishing inclusion criteria include that two reviews only include RCTs, whereas the other four
include RCTs and studies using quasi-experimental methods. However, even with randomized trials the
overlap in studies is limited (Table 8 and Figure 4). Of 134 learning RCTs, over half (74 studies) are included
in only one review. As with the wider collection of learning studies, only 13 studies are included in most
(4, 5, or 6) of the reviews. The largely non-overlapping collection of studies is apparently driven neither
by geography nor by methodology.
While there are differences in the scope of each review, we consider each inclusion criterion common to
all reviews, successively - learning outcomes, primary school, RCTs, the 1990-2010 time frame, and
implementation in Sub-Saharan Africa – to examine how much of the variation in composition is driven
by inclusion criteria (Table 8). Across the overall sample of 301 studies, 227 look at learning outcomes.
Coverage of these learning studies in any single review is low, ranging from 30 studies (13 percent) in
Kremer, Brannen, & Glennerster (2013) to 92 studies (41 percent) in Murnane & Ganimian (2014). To
account for the fact that this might be driven by inclusion restrictions on methodology, we next consider
the 134 RCTs with learning outcomes. Among these, coverage in any single review is even lower, ranging
from 12 studies (9 percent) in Glewwe et al. (2014) to 68 studies (51 percent) in Murnane & Ganimian
(2014). We next add restrictions for studies which include primary level outcomes and which were
published between 1990 and 2010. Of the 107 studies fulfilling all of the above requirements, only
between 11 percent and 60 percent of studies are included in any single review.
9
Finally, we consider the common denominator of inclusion criteria across all reviews: RCTs with learning
outcomes at the primary school level, published between 1990 and 2010, in Sub-Saharan Africa. Of the
42 studies fulfilling all five of these requirements, still only between 10 percent and 79 percent of studies
are included in any single review. This suggests that variation in composition is not remotely explained by
the inclusion criteria of the reviews; if it were, we would expect the coverage of studies at the common
denominator level to be much closer to 100 percent for each review. While there are differences across
reviews in the proportion of studies that are published papers (i.e., a publication bias in inclusion), as
shown in Table 6, there is no clear pattern between publication bias and coverage. This suggests that
there is more behind variation in composition than systematic inclusion decisions.
At the same time, the reviews sometimes categorize studies in different ways. Many interventions fall
into multiple categories, and studies tend not to provide sufficient information for reviewers to apply a
systematic rule for allocating interventions to categories. Thus these discrepancies are not due to any
error on the part of the reviewers; rather the allocation of interventions to categories is inherently
subjective. Table 9 shows the 12 studies included in most or all of the reviews and how they are
categorized in each review. Two of the three studies cited in all six reviews are variously characterized as
“school supplies,” “instructional materials,” “materials,” etc., all reasonably interpreted as similar
categories. At the same time, the third study included in all six reviews (a study of merit-based
scholarships for students) is categorized in four reviews as student incentives or merit scholarships,
whereas two reviews categorize it as school fees or cash transfers. This is a fundamental difference in
categorization: the former focuses on the incentive element of the intervention, whereas the latter
focuses on the cost reduction element. In general, Krishnaratne, White, & Carpenter (2013) tends to
categorize studies that most other reviews put into some sort of “computer” category simply as
“materials”, those that most others consider “teacher training” also as “materials”, and studies that most
reviews characterize as teacher incentives simply as “additional teaching resources”.
Another notable difference in categorization is that of Conn’s (2014) “Pedagogical interventions” and
McEwan’s (2014) “Computers or instructional technology”, which are responsible for each review’s
strongest conclusion. While the labels of these two groups are quite different, the samples overlap greatly
since a significant subset of Conn’s pedagogical interventions are computer-assisted learning programs.
This and the Krishnaratne, White, & Carpenter (2013) examples illustrate that much of the difference in
categorization across the reviews is explained by the various reviews either (1) opting for different levels
of disaggregation in their analyses (e.g., pedagogy versus computer-based pedagogy) or (2) focusing on a
different element of the intervention.10 Beyond these examples, however, many of the reviews have
categories that are easily recognizable as synonymous or at least widely overlapping. Thus, categorization
– especially for Krishnaratne, White, & Carpenter (2013) – can be an additional driver of at least apparently
divergent conclusions.
What is the role of composition and categorization in driving the different conclusions? We selected a
primary conclusion from each review and then analyzed which studies drive that conclusion and whether
those studies are included in the other reviews. For the five reviews for which we conducted this analysis,
10 McEwan is the only paper with explicitly overlapping categories.
10
we selected the primary conclusions of each review by choosing: (1) for the meta-analyses, the category
with the largest significant pooled effect size or most prominent result as defined by the review (for
Krishnaratne, White, & Carpenter (2013) this is the category with the biggest significant effect when 6 or
more studies are pooled together); and (2) for the other reviews, the first positive conclusion mentioned.
(This analysis was not possible for Glewwe et al. 2014 because it does not identify which studies fall into
which category.) The results of this analysis are summarized in Table 10. Considering Conn’s (2014) finding
that pedagogical interventions are the most effective, a tiny fraction of all of Conn’s pedagogical studies
are incorporated in any other study (6 percent in three other reviews, none in Kremer, Brannen, &
Glennerster 2013, and 18 percent in Murnane & Ganimian 2014). Likewise, for McEwan’s “computers or
instructional technology” category, fewer than half of his studies are included in any other review except
Murnane & Ganimian (2014), which includes 70 percent of McEwan’s studies. Table 11 repeats this
analysis for RCTs only and demonstrates, again, large variation in composition. Notably, the composition
analysis of the samples driving the main conclusions for RCTs only is almost identical to that which includes
all studies, suggesting that the main conclusions of each review are driven by evidence from RCTs.
In Tables 11 through 15, we analyze the recommendations of each review in detail. For example, in Table
12, we see that although Conn has 17 studies in the “pedagogical interventions” category, few are
included in other studies. The three studies with the largest effect sizes are not included in any other
review. When considering Kremer, Brannen, & Glennerster’s recommendation of pedagogical
interventions that match teaching to students’ learning (Table 13), there is more but still limited coverage:
one of the two studies driving this conclusion is in four of the other five reviews, whereas the other study
is in three of the other five. (As a result, this conclusion, in some form, makes it into multiple reviews, as
discussed in the next section.)
For Krishnaratne, White, & Carpenter’s finding supporting “materials provision” (Table 14), the three
studies that seem to be driving this result are included in some other reviews (one of the studies is in four
other reviews, whereas the other two are in just one or two). But most other reviews categorize those
three studies as computer-assisted learning. In that case, categorization may be driving some of the result.
With McEwan’s (2014) finding of the effectiveness of computing interventions, many of the driving
positive studies are excluded from other reviews (Table 15). Finally, in Murnane and Ganimian (Table 16),
the finding on information provision is driven by studies that are often not included in other reviews but
– when they are – they are categorized similarly.
Thus, differences in composition seem much more likely to drive variation in conclusions than differences
in categorization, although categorization also plays a role. No review includes even half of the total
sample of studies. As a result, it may be unwise to rely on a single review to derive a conclusion about the
most effective interventions to improve student learning. But each review relies on clear empirical
evidence to determine what works well in some settings. So these reviews may be more effective at
providing ideas for what works well to improve learning rather than definitively characterizing what works
best.
11
3.3 Variation within Intervention Categories As some of the reviews highlight, much of the variation in learning results across studies is driven by
variation within categories. Just because a given intervention falls into a category which is effective at
improving student learning on average, this does not mean that it will perform per the mean of that
category; it is the specific details of the intervention which determine its effectiveness. When Conn (2014)
concludes that pedagogical interventions are most effective, or when McEwan (2014) concludes that
computer interventions are most effective, this can mask the massive heterogeneity within the category.
Both reviews discuss this. It is important to note that many pedagogical interventions have been
ineffective, as have many computer interventions.
For example, while McEwan (2014) finds computer-based interventions to be by far the most effective
category, the One Laptop Per Child (OLPC) program in Peru had little or even negative effects on student
learning, apparently because it distributed computers without any additional training (Cristia et al. 2012).
Even within the sub-category of OLPC programs there is great heterogeneity; a recent program which
distributed laptops installed with remedial tutoring software to migrant children in Beijing and trained
them in their use, produced large increases in standardized math scores (Mo et al. 2012). Similar
heterogeneity also exists within low performing intervention categories. Conn (2014) finds interventions
providing school supplies to have a low average effect (0.022 standard deviations), for example, yet
unanticipated school grants for textbooks in Zambia (Das et al. 2013) are roughly five times more effective
than the mean of this category.
Table 17 demonstrates this more systematically for the sample in McEwan (2014). For each of his
intervention categories, we summarize the variation within category and in the total sample. In five out
of eleven categories, the standard deviation of effects is larger within the category than for the overall
sample of studies. And for five of the remaining six categories, the standard deviation of effects within
the category is at least half that of the whole sample. In all cases, there is a great deal of heterogeneity
within the category. As a result, it is crucial to examine not just which categories of interventions are most
effective, but rather which specific interventions have been effective within that category, and the
elements particular to those interventions.
4. What Works Well: Intersections across Reviews of Improving Learning Despite differing conclusions from each review (Table 7), is there any intersection in what works? At first
glance, there is no convenient overlap in the categories of interventions deemed most effective. But upon
closer analysis, despite the differing samples and some degree of different characterization, there is some
agreement. We examine the specific studies driving the conclusions of each paper and highlight the
programs most often identified to be effective as well as those consistently found to be ineffective. In this
discussion we group interventions using the lowest possible level of aggregation so as to highlight the
specific elements driving the relative effectiveness or ineffectiveness of certain types of programs.
12
4.1 Pedagogical interventions that match teaching to students’ learning Across the six reviews, the intervention category which most commonly produces large improvements in
student learning is pedagogical interventions that match teaching to students’ learning, including through
the use of computers or technology. This comes out particularly strongly in Conn (2014), Kremer, Brannen,
& Glennerster (2013), and McEwan (2014), all of whom give this category a slightly different name
(“Pedagogical interventions”, “Pedagogical interventions to match teaching to students’ learning”, and
“Computers or instructional technology”, respectively) but are essentially referring to the same group of
driving interventions.
Conn (2014) finds that, across her sample of African studies, pedagogical interventions (which she defines
as those that change instructional techniques) are more effective at improving student learning than all
other types of interventions combined. Within the category of pedagogical interventions, she finds that
studies that employ adaptive instruction and teacher coaching techniques are particularly effective.11
Among these interventions, the pooled effect size associated with adaptive instruction is 0.42 standard
deviation, while that of programs with non-adaptive instruction is about one-quarter that, at only 0.12
standard deviation.12 All three studies in Conn’s sample which evaluate adaptive instruction interventions
report positive, statistically significant effects on student literacy scores (Korsah et al. 2010; Piper and
Korda 2011; Spratt et al. 2013).
Programs with adaptive instruction fall into two categories: (i) computer-assisted learning (CAL) programs
which adapt to the student’s learning level or (ii) teacher-led methods that emphasize formative
assessment and individualized and targeted instruction. While Conn finds both computer-assisted and
teacher-led methods to produce a significant improvement in student performance (at the 10 percent
level), the effect of the former is twice as large as the latter. One example of teacher-led adaptive
instruction is the Early Grade Reading Assessment program in Liberia evaluated by Piper and Korda (2011),
in which students’ reading levels were evaluated using a diagnostic exam, and teachers were then trained
in how to continually assess student progress. Another example, categorized differently by Conn but
argued to help teachers adapt instruction in Kremer, Brannen, & Glennerster (2013) and included in four
of the six reviews, assigned students in Kenya to classes on the basis of initial preparedness so that
teachers could focus instruction at the level of learning of the students (Kremer, Duflo, and Dupas 2011).
This increased test scores at all levels of initial preparedness.
Along the same lines, McEwan (2014) finds computer-assisted learning programs to have a greater impact
than other kinds of interventions, with a mean effect size of 0.15 (significant with 99 percent confidence),
which he finds is not driven by overlapping treatments. A successful example included in McEwan (2014)
but also highlighted by Kremer, Brannen, & Glennerster (2013) is a CAL program in India, which – using
math software that allowed children to learn at their own pace – increased math scores by 0.48 standard
deviation, significant with 99 percent confidence (Banerjee et al. 2007). Moreover, the latter program was
11 For this sub-group analysis, Conn limits the sample to what she rates as high quality studies. 12 The samples are small (3 studies in adaptive instruction and 5 studies in non-adaptive instruction), so Conn does not report p-values.
13
extremely cost-effective, producing an increase of 3.01 standard deviations in test scores per $100 spent
(Kremer, Brannen, & Glennerster 2013).
However, as Murnane & Ganimian (2014) highlight, such programs do not improve student achievement
unless they change children’s daily experiences at school. Computer-assisted learning programs are
ineffective when instruction is not tailored to each student’s level of knowledge, when technology
distribution is unaccompanied by parent or student training as was the case in Peru’s One Laptop Per Child
program (Cristia et al., 2012), when computers substitute away from useful instructional time during
school hours (He, Linden, & MacLeod 2008) or home study (Malamud & Pop-Eleches 2011), or when the
treatment is not tied to the curriculum or integrated by teachers into their classroom instruction (Barrera-
Osorio & Linden, 2009).13
Taken together, there is significant overlap in these recommendations: Computer-assisted learning or
teacher-led interventions that individualize instruction can be highly effective. But pedagogical
interventions or computing interventions generally are not inherently more effective than others; they
have to be well implemented and affect students’ learning experience.
4.2 Individualized, repeated teacher training, associated with a specific
method or task The category of interventions found to produce the second largest effects in two of the meta-analyses
and that is also highlighted in one of the narrative reviews is teacher training. McEwan (2014) finds teacher
training to produce a 0.12 standard deviation improvement in learning (significant with 99 percent
confidence), for example.14 Again, examining the specific programs is crucial: Providing teachers with
general guidance tends not to improve student learning, but Murnane & Ganimian (2014) find that
detailed support tailored to the skill levels of teachers can be effective. For example, an Indian program
giving teachers diagnostic information about student performance with general tips on how to help them
improve had little impact on student learning (Muralidharan & Sundararaman 2010). In contrast, training
that provides detailed guidance on what and how teachers should teach has proven to be effective in
enhancing the skills of low-performing students (Murnane & Ganimian 2014). For example, a scripted
literacy program in Mumbai which provided storybooks, flashcards and a child library, as well as
instructions for teachers specifying the activities in which these should be used and when, had positive
effects on child literacy (He, Linden, & MacLeod 2009).
This highlights the fact that the large improvements in student learning produced by appropriate teacher
training may be in part driven by a large degree of overlap with other interventions, because many of the
13 Here effectiveness is defined in terms of improving student test scores in math and language. Several of these
programs were found to improve children’s computing skills, but without improvements in school achievement. Moreover, while these programs may improve computing skills for the specific computers or laptops provided, evidence from Peru suggests that this may not transfer to an improvement in more general computing skills (Beuermann et al. 2013; Murnane & Ganimian 2014).
14 McEwan and Conn may not have precisely comparable standardized estimates since they control for different moderators in their regressions.
14
successful instructional interventions were coupled with teacher training in how to employ the new
method in the classroom (McEwan 2014). For example, a related intervention providing flashcards to
teach children English in India improved test scores by much more when it was implemented through a
teacher training program than when it was introduced externally without preparing teachers (He, Linden,
& MacLeod 2008).
Moreover, with regards to variation within the category of teacher training, one-time in-service trainings
at a central location, typical of many teacher training interventions, are not those found to be highly
effective. However, Conn (2014) finds pedagogical interventions involving long-term teacher mentoring
or in-school teacher coaching to produce a sizeable (albeit not always significant) effect on student
learning, at 0.25 standard deviations.15 An example is the “Read, Educate, and Develop” (or READ)
program in rural South Africa evaluated by Sailors et al. (2010), which provides students with high quality
books relevant to their lives, and teachers with training on strategies to integrate these books into their
lesson plans. This training includes demonstration lessons by READ mentors, monthly coaching and
monitoring visits followed by one-on-one reflection sessions, and after-school workshops for both
teachers and school administrators. The program had highly significant impacts on a range of reading
measures, albeit with a quasi-experimental design. Overall, of the evaluations of programs with ongoing
teacher training elements which Conn reviews, all four show statistically significant improvements in
student literacy (Brooker et al. 2013; Lucas et al. 2014; Sailors et al. 2010; Spratt et al. 2013), as well as
numeracy when it is tested (Lucas et al. 2014).
Other examples of interventions combining instructional methods with teacher training include a
combination of student reading groups and in-school supervisors to provide guidance to group leaders in
Chile (Cabezas, Cuesta, & Gallego 2012); a remedial education program in India, which gives local contract
teachers two weeks of initial training followed by reinforcement throughout the school year (Banerjee et
al. 2007); a program targeting early reading skills in Mali, which offers lesson plans and accompanying
instruction materials, together with training, support visits, and grading of teacher guides and student
workbooks (Friedman, Gerard, & Ralaingita 2010); and an early grade reading instruction program in
Kenya and Uganda which provides schools with materials and trains teachers in the use of the instructional
method (local-language materials) and in learning assessment, as well as providing them with regular
mentoring (Lucas et al. 2014).
Glewwe et al.’s (2014) finding that teachers’ knowledge of the subjects they teach increases student
learning also implicitly supports teacher training interventions which effectively boost such knowledge.
Kremer, Brannen, & Glennerster (2013) and Krishnaratne, White, & Carpenter (2013) have less to say
about teacher training. This is explained in part by composition and in part by categorization. Some of the
studies driving the large (and significant) positive effect for teacher training interventions in McEwan’s
sample appear in only one or two of the other reviews, and in one case in none of the others. 16
15 As Conn reports, with 4 studies the sample size does not allow estimation of a reliable p-value. But as suggestive evidence, the coefficient divided by the standard error yields a t-statistic of 1.87, which is normally considered significant with between 90 and 95 percent confidence. 16 This is an early reading program in Mali (Friedman, Gerard, & Ralaingita 2010).
15
Furthermore, Krishnaratne, White, & Carpenter (2013) review a number of training interventions, but
they have no specific category for teacher training and instead code all interventions that have training
along with pedagogical materials (e.g., guides) under the broad umbrella of materials provision.
4.3 Accountability-boosting interventions The intervention category with the third highest degree of overlap in support across the sample of reviews
is that which we broadly term accountability-boosting interventions. These include two intervention sub-
categories: (i) teacher performance incentives and (ii) contract teachers. McEwan (2014) estimates a
mean effect of performance incentives of 0.09 (significant with 95 percent confidence), driven mostly by
teachers, but the effectiveness of several approaches to improving such incentives varies greatly across
studies (Kremer, Brannen, & Glennerster 2013). While two experiments in India (Muralidharan &
Sundararaman 2011; Duflo, Hanna, & Ryan 2012) have shown teacher performance incentives to increase
student learning, teachers in a Kenyan program responded primarily by teaching to the test (Glewwe et
al., 2010). This confirms that teachers adjust their behavior in response to incentives, and it also raises
questions about how best to design such incentives so as to maximize learning while minimizing strategic
responses (McEwan 2014). McEwan (2014) also finds a mean effect size of employing contract or
volunteer teachers of 0.10 standard deviations (significant with 99 percent confidence), highlighting that
treatments that rely on contracted local teachers rather than volunteers are more likely to improve
learning, presumably due to the relative accountability benefits that this provides. Studies in Kenya (Duflo,
Dupas, & Kremer 2012) and India (Banerjee et al. 2007) both found improvements in test scores from
supplementing civil-service teachers with locally hired teachers on short-term contracts. McEwan (2014)
notes that the effective use of contract teachers is often accompanied by smaller class sizes (Bold et al.,
2013; Duflo, Dupas, & Kremer 2012; Muralidharan & Sundararaman, 2010), and that the effects of the
two cannot always be separated easily.
Murnane & Ganimian (2014) further explain some of the variation in the success of these interventions
by their observation that low-skilled teachers need specific guidance – or “scaffolding” – to reach
minimally acceptable levels of instruction. Because performance incentives improve effort, teachers need
basic skills in order for greater effort to result in increased learning.
16
4.4 What does not work to improve student learning?
Having accounted for different definitions of intervention categories, we also observe overlap in
conclusions regarding what does not work. Three of the six reviews explicitly highlight that health
interventions (such as deworming or nutritional supplements) and cost-reducing interventions (such as
fee reductions or monetary grants) are the least effective programs at improving student learning
outcomes as measured by test scores, and none of the other reviews find them to be effective. There is
substantial evidence that these interventions can effectively increase school enrollment and attendance,
but not reading and math scores; as such, an integral education improvement program may couple these
kinds of programs to boost access with the kinds of programs proven to improve learning. Note again that
this conclusion is in part driven by the definition of learning as test scores in language and math in some
of the reviews; Conn (2014) finds that health interventions do significantly improve students’ attention
and memory.17 However, if children are more attentive to or better at remembering material that is poorly
taught or poorly targeted to their learning level, the cognitive improvements may not translate into
academic learning gains. Thus, if the goal is to improve student test scores, these programs are less likely
to be effective.
5. Discussion This paper demonstrates that systematic reviews may in fact fall far short of exhaustive coverage and –
as a result – reach varying and sometimes divergent conclusions. Authors also make judgments as to how
to characterize the studies they include, which may further drive differing conclusions. The least
systematic form of analysis, the narrative review, can incorporate the largest number of studies but
requires non-scientific tallying and weighting across studies, and is the most susceptible to influence by
authors’ prior beliefs. The most systematic form of analysis, the meta-analysis, may limit the included
studies because of stringent requirements on the data reported in order compute strictly comparable
effect sizes, and it may fail to illuminate the mechanisms behind the most effective interventions. Each
method has flaws which keep it from being both systematic and exhaustive.
Nonetheless, these systematic reviews can effectively identify interventions that work well, even if they
cannot convincingly identify what works best. For example, one of the key lessons from Murnane &
Ganimian (2014) is that providing information about school quality and returns to schooling generally
improves student attainment and achievement. This finding is mentioned in some of the other reviews,
but it is not highlighted because of positive but lower average effect size. 18 Likewise, Glewwe et al. (2014)
recommend investments in desks, tables, and chairs. In both the case of Murnane & Ganimian and the
case of Glewwe et al., these recommendations are based on studies demonstrating positive, significant
17 Ozier (2014) – not included in any of the reviews – finds that a large-scale deworming intervention in Kenya significantly increased reasoning test scores among the younger siblings of program participants ten years after implementation, with the effect equaling between 0.5 and 0.8 years of schooling. 18 Despite a lower effect size, providing information on the returns to schooling in Madagascar (Nguyen 2009) is one of the most cost-effective education interventions that has been evaluated using an RCT (Kremer, Brannen, & Glennerster 2013).
17
impact. They may be a good investment in some school systems; but given the partial coverage of each
review, it would be difficult to claim conclusively that they are the very best investments.
A further limitation of these reviews extends from a limitation of most underlying studies: The reviews
focus on effectiveness but say less about the cost-effectiveness of various intervention types, due to the
fact that most of the studies they review do not report sufficiently detailed and comparable cost data
(Evans and Popova 2014; McEwan 2014). Varying costs can lead certain interventions to have lower
benefits but much higher benefit-per-dollar than others, and policy makers make investment decisions
based on costs as well as impacts. Kremer, Brannen, & Glennerster (2013) do provide cost-effectiveness
results for a subsample of 18 studies. They find pedagogical interventions that match teaching to students’
learning levels, contract teachers, and the provision of earnings information to be the most cost-effective.
Informing the expensive end of the spectrum, McEwan (2014) combines his effect sizes with Kremer,
Brannen, & Glennerster’s (2013) cost estimates for intersecting studies to find that interventions focusing
on computer-assisted learning and class size reduction may be less cost-effective than others. However,
these are based on a small sample (less than ten percent) of the 227 learning studies included in this
review; much additional work is needed.
Similarly, the reviewers acknowledge that – due again to the underlying studies - these reviews focus
largely on short-term learning impacts. For example, McEwan (2014) highlights that for his sample of
studies, the average follow-up is conducted after 9-13 months of program exposure, with only about 10
percent of follow-ups occurring at least one month after the conclusion of the intervention. Across low-
and high-income countries, it has been observed that educational gains are sometimes not sustained over
time (Andrabi et al. 2011; Jacob, Lefgren, & Sims 2010; Evans, Kremer, & Ngatia 2014). Thus, a clear
shortcoming of this literature is its inability to inform the trajectory of longer-term learning impacts.
Future reviews will benefit from combining methodologies, for example performing meta-analysis – which
allows a highly systematic analysis – accompanied with narrative review – which can explore
heterogeneity within categories and the apparent mechanisms behind effective programs. Furthermore,
using narrative review will allow the inclusion of studies that are excluded from meta-analyses. Given the
high observed level of heterogeneity within classes of interventions, the most useful reviews are likely to
use low levels of aggregation, identifying specific characteristics of interventions that are effective rather
than broad classes of interventions. Future reviews will also be most useful if they are careful to search
out unpublished studies: Less than two-thirds of studies included in the six reviews were published journal
articles.
Taken together, the reviews do identify certain key messages: Both student learning interventions and
teacher training interventions will be most effective when tailored to the student or teacher involved.
Pedagogical interventions must change students’ learning experiences and be adapted to individual
student learning levels. Teacher training may be most effective when it is repeated and linked to a specific
pedagogical method or tool. Increasing accountability can also improve student learning.
18
Works Cited Abdu-Raheem, B.O. (2012). “Effects of Problem-Solving Method on Secondary School Students’
Achievement and Retention in Social Studies in Ekiti State, Nigeria.” Journal of International Education
Research, 8(1), First Quarter.
Ajaja, O. Patrick & Ochuko Urhievwejire Eravwoke. (2010). “Effects of Cooperative Learning Strategy on
Junior Secondary School Students Achievement in Integrated Science.” Electronic Journal of Science
Education, 14(1), 1-18.
Andrabi, T., Das, J. & Khwaja, A. (2009). “Report Cards: The Impact of Providing School and Child Test-
scores on Educational Markets.” BREAD Working Paper No. 226, Bureau for Research and Economic
Analysis of Development.
Andrabi, T., Das, J., Khwaja, A., & Zajonc, T. (2011). “Do Value-Added Estimates Add Value? Accounting for
Learning Dynamics.” American Economic Journal: Applied Economics, 3(3), 29-54.
Angrist, J., & Lavy, V. (2001). “Does Teacher Training Affect Pupil Learning? Evidence from Matched
Comparisons in Jerusalem Public Schools.” Journal of Labor Economics 19(2).
Baird, S., Ferreira, F., Özler, B., & Woolcock, M. (2014). “Conditional, Unconditional and Everything in
Between: A Systematic Review of the Effects of Cash Transfer Programmes on Schooling Outcomes.”
Journal of Development Effectiveness 6(1), 1-43.
Banerjee, A., Glewwe, P., Powers, S., & Wasserman, M. (2013). “Expanding Access and Increasing Student
Learning in Post-Primary Education in Developing Countries: A Review of the Evidence.” Post-Primary
Education Initiative Review Paper, Abdul Latif Jameel Poverty Action Lab, Cambridge, MA.
Banerjee, A., Cole, S., Duflo, E., & Linden, L. (2007). “Remedying Education: Evidence from Two
Randomized Experiments in India.” The Quarterly Journal of Economics 122(3), 1235-1264.
Barrera-Osorio, F., & Linden, L. (2009). “The Use and Misuse of Computers in Education: Evidence from a
Randomized Experiment in Colombia.” Policy Research Working Paper No. 4836, World Bank, Washington
DC.
Beuermann, D.W., Cristia, J.P., Cruz-Agayo, Y., Cueto, S., & Malamud, O. (2013). “Home Computers and
Child Outcomes: Short-Term Impacts from a Randomized Experiment in Peru.” NBER Working Paper
18818. National Bureau of Economic Research, Cambridge, MA.
Bold, T., Kimenyi, M., Mwabu, G., Ng’ang’a, A., & Sandefur, J. (2013). “Scaling Up What Works:
Experimental Evidence on External Validity in Kenyan Education.” Working Paper No. 321, Center for
Global Development, Washington, DC.
Bimbola, O., & Daniel, O. I. (2010). “Effect of constructivist-based teaching strategy on academic
performance of students in integrated science at the junior secondary school level.” Educational Research
and Reviews, 5(7), 347-353.
19
Brooker, S., Inyega, H., Estambale, B., Njagi, K., Juma, E., Jones, C., Goodman, C., & Jukes, M. (2013).
Impact of Malaria Control and Enhanced Literacy Instruction on Educational Outcomes among Kenyan
School Children: A Multi-sectoral, Prospective, Randomized Evaluation. 3ie Draft Grantee Final Report. The
International Initiative for Impact Evaluation.
Bruns, B., & Luque, J. (2015). Great Teachers: How to Raise Student Learning in Latin America and the
Caribbean. World Bank, Washington, DC.
Bruns, B., Filmer, D., & Patrinos, H. (2011). Making Schools Work: New Evidence on Accountability
Reforms. World Bank, Washington, DC.
Cabezas, V., Cuesta, J. I., & Gallego, F. A. (2011). “Effects of Short-term Tutoring on Cognitive and Non-
cognitive Skills: Evidence from a Randomized Evaluation in Chile.” Unpublished manuscript, Pontificia
Universidad Católica de Chile, Santiago.
Camargo, B., Camelo, R., Firpo, S., & Ponczek, V. (2011). “Test Score Disclosure and School Performance.”
Sao Paulo School of Economics Working Paper, Center for Applied Economics, Sao Paulo, Brazil.
Carillo, P., Onofa, M., & Ponce, J. (2010). “Information technology and student achievement: Evidence
from a randomized experiment in Ecuador.” IDB Working Paper No. 223, Inter-American Development
Bank, Washington, DC.
Conn, K. (2014). “Identifying Effective Education Interventions in Sub-Saharan Africa: A meta-analysis of
rigorous impact evaluations.” Unpublished manuscript, Columbia University, New York, NY.
Cristia, J., Ibarrarán, P., Cueto, S., Santiago, A., and Severín, E. (2012). “Technology and child development:
Evidence from the One Laptop per Child program” IZA Discussion Paper No. 6401, Forschungsinstitut zur
Zukunft der Arbeit GmbH, Bonn, Germany.
Dinkelman, T., & Martínez, A. C. (2013). “Investing in Schooling in Chile: The Role of Information about
Financial Aid for Higher Education.” Review of Economics and Statistics, 96, 244-257.
Duflo, E., Dupas, P., & Kremer, M. (2012). “School Governance, Teacher Incentives, and Pupil-Teacher
Ratios: Experimental Evidence from Kenyan Primary Schools.” NBER Working Paper No. 17939. National
Bureau of Economic Research.
Duflo, E., Hanna, R., & Ryan, S. P. (2012). “Incentives Work: Getting Teachers to Come to School.”
American Economic Review, 102(4), 1241–1278.
Evans, D., Kremer, M., & Ngatia, M. (2014). “Schooling Costs, School Participation, and Long-Run
Outcomes: Evidence from Kenya.” Unpublished working paper.
Filmer, D., & Fox, L. (2014). Youth Employment in Sub-Saharan Africa. Africa Development Series. World
Bank, Washington, DC.
20
Friedman, W., Gerard, F., & Ralaingita, W. (2010). International Independent Evaluation of the
Effectiveness of Institut pour l'Education Populaire's "Read - Learn - Lead" (RLL) Program in Mali: Mid-term
Report. RTI International, North Carolina.
Gee, K. (2010). “The Impact of School-Based Anti-Malarial Treatment on Adolescents' Cognition: Evidence
from a Cluster-Randomized Intervention in Kenya.” Doctoral Dissertation. Harvard University, Graduate
School of Education.
Githau, B. N., & Nyabwa, R. A. (2008). “Effects of Advance Organiser Strategy during Instruction on
Secondary School Students’ Mathematics Achievement in Kenya’s Nakuru District.” International Journal
of Science and Mathematics Education, 6, 439-457.
Glewwe, P. W., Hanushek, E. A., Humpage, S. D., & Ravina, R. (2014). “School resources and educational
outcomes in developing countries: a review of the literature from 1990 to 2010.” in Education Policy in
Developing Countries, ed. Glewwe, P. University of Chicago Press: Chicago and London.
Glewwe, P., Kremer, M., and Moulin, S. (2009). “Many Children Left Behind? Textbooks and Test Scores
in Kenya.” American Economic Journal: Applied Economics, 1(1), 112–135.
Glewwe, P., Kremer, M., and Moulin, S., & Zitzewitz, E. (2004). “Retrospective vs. prospective analyses of
school inputs: the case of flip charts in Kenya.” Journal of Development Economics, 74, 251– 268.
Hanushek, E. A., & Wößmann, L. (2007). “The role of School Improvement in Economic Development.”
NBER Working Paper No. 12832, National Bureau of Economic Research.
He, F., Linden, L. L., & MacLeod, M. (2008). “How to Teach English in India: Testing the Relative Productivity
of Instruction Methods with Pratham English Language Education Program.” Unpublished manuscript,
Columbia University, New York, NY.
Hicks, J. H., Kremer, M., Mbiti, I., & Miguel, E. (2013). “Vocational Education in Kenya: Evidence from a
Randomized Evaluation Among Youth.” Unpublished manuscript, Vanderbilt University, Nashville, TN.
Hollands, F. M., Pan, Y., Shand, R., Levin, H. M., Belfield, C., R., Kieffer, M., Bowden, A. B., & Hanisch-Cerda,
B. (2013). Improving early literacy: cost-effectiveness analysis of effective reading programs. Research
report, Center for Benefit-Cost Studies of Education, Teachers College, Columbia University.
Jacob, B. A., Lefgren, L., and Sims, D. P. (2010). “The Persistence of Teacher-Induced Learning.” Journal of
Human Resources, 45:915-943.
Jensen, R. (2010). “The (Perceived) Returns to Education and the Demand for Schooling.” The Quarterly
Journal of Economics, 125(2), 515-548.
Jensen, R. T. (2010a). “Economic Opportunities and Gender Differences in Human Capital: Experimental
Evidence for India.” NBER Working Paper No. 16021. National Bureau of Economic Research.
21
Kiboss, J. K. (2012). “Effect of Special E-Learning Program on Hearing-Impaired Learners’ Achievement and
Perception of Basic Geometry in Lower Primary Mathematics.” Journal of Educational Computing
Research, 46(1), 31-59.
Koricheva, J., & Gurevitch, J. (2013). “Place of meta-analysis among other methods of research synthesis.”
in Handbook of meta-analysis in ecology and evolution, ed. Koricheva, J., Gurevitch, J., & Mengersen, K.,
3-13. Princeton University Press.
Korsah, G. A., Jack Mostow, Dias, M. B., Sweet, T. M., Belousov, S. M., Dias, M. F., & Gong, H. (2010).
“Improving Child Literacy in Africa: Experiments with an Automated Reading Tutor.” Information
Technologies & International Development, 6(2), 1–19.
Kremer, M., Brannen, C., & Glennerster, R. (2013). “The challenge of education and learning in the developing world.” Science, 340(6130), 297-300. Kremer, M., Duflo, E. & Dupas, P. (2011). "Peer Effects, Teacher Incentives, and the Impact of Tracking." American Economic Review 101 (5): 1739 -1774 Kremer, M., Miguel, E., & Thornton, R. (2009). “Incentives to Learn.” The Review of Economics and Statistics, 91(3) 437-456. Krishnaratne, S., White, H., & Carpenter, E. “Quality education for all children? What works in education
in developing countries.” 3ie Working Paper 20, International Initiative for Impact Evaluation.
Lai, F., Luo, R., Zhang, L., Huang, X., & Rozelle, S. (2012) “Does Computer-Assisted Learning Improve
Learning Outcomes? Evidence from a Randomized Experiment in Migrant Schools in Beijing.” Rural
Education Action Project Working Paper, Stanford, CA.
Lai, F., Zhang, L., Qu, Q., Hu, X., Shi, Y., Boswell, M., & Rozelle, S. (2012). “Does Computer-Assisted Learning
Improve Learning Outcomes? Evidence from a Randomized Experiment in Public Schools in Rural Minority
Areas in Qinghai.” Rural Education Action Project, Working Paper No. 237, Stanford, CA.
Linden, L. L. (2008). “Complement or substitute? The Effect of Technology on Student Achievement in
India.” J-PAL Working Paper, Abdul Latif Jameel Poverty Action Lab, Cambridge, MA.
Louw, J., Muller, J., & Tredoux, C. (2008). “Time-on-task, Technology and Mathematics Achievement.”
Evaluation and Program Planning, 31 (1) (Feb): 41-50.
Loyalka, P., Liu, C., Song, Y., Yi, H., Huang, X., Wei, J., Zhang, L., Shi, Y., Chu, J., & Rozelle, S. (2013). “Can information and counseling help students from poor rural areas go to high school? Evidence from China.” Journal of Comparative Economics, 41(4), 1012-1025. Lucas, A. M., McEwan, P. J., Ngware, M., & Oketch, M. (2014). “Improving early grade literacy in East Africa: Experimental evidence from Kenya and Uganda.” Journal of Policy Analysis and Management, 33, 950–976.
22
Lucas, A. M., & Mbiti, I. M. (2012). “Access, Sorting, and Achievement: The Short-Run Effects of Free
Primary Education in Kenya.” American Economic Journal: Applied Economics, 4(4), 226–225.
Malamud, O., & Pop-Eleches, C. (2011). “Home Computer Use and the Development of Human Capital.”
Quarterly Journal of Economics, 126, 987-1027.
McEwan, P. (2012). “Improving Learning in Primary Schools of Developing Countries: A Meta-Analysis of
Randomized Experiments.” Review of Educational Research 20 (10): 1 –42.
Mizala, A., & Urquiola, M. (2013). “School Markets: The Impact of Information Approximating Schools’
Effectiveness.” Journal of Development Economics, 103, 313-335.
Mo, D., Swinnen, J., Zhang, L., Yi, H., Qu, Q., Boswell, M., & Rozelle, S. (2012). “Can One Laptop per Child
Reduce the Digital Divide and Educational Gap? Evidence from a Randomized Experiment in Migrant
Schools in Bejing.” Rural Education Action Project Working Paper 233, Stanford, CA.
Mo, D., Zhang, L., Lui, R., Qu, Q., Huang, W., Wang, J., Qiao, Y., Boswell, M, & Rozelle, S. (2013). “Integrating Computer-assisted Learning into a Regular Curriculum: Evidence from a Randomized Experiment in Rural Schools in Shaanxi.” Rural Education Action Project Working Paper 248, Stanford, CA.
Muralidharan, K., & Sundararaman, V. (2011). “Teacher Performance Pay: Experimental Evidence from
India.” The Journal of Political Economy, 119, 39-77.
Muralidharan, K., & Sundararaman, V. (2010). "The Impact of Diagnostic Feedback to Teachers on Student
Learning: Experimental Evidence from India." The Economic Journal, 120, no. 546: F187-F203.
Murnane, R. J., & Ganimian, A.J. (2014). “Improving Educational Outcomes in Developing Countries:
Lessons from Rigorous Evaluations.” Unpublished manuscript.
Murnane, R. J., & Ganimian, A.J. (2014a). “Improving Educational Outcomes in Developing Countries:
Lessons from Rigorous Evaluations.” NBER Working Paper No. 20284, National Bureau of Economic
Research, Cambridge, MA.
Nguyen, T. (2009). “Information, Role Models and Perceived Returns to Education: Experimental Evidence
from Madagascar.” MIT Working Paper, Massachusetts Institute of Technology, Cambridge, MA.
Nwagbo, C. (2006). “Effects of Two Teaching Methods on the Achievement in and Attitude to Biology of
Students of Different Levels of Scientific Literacy.” International Journal of Educational Research, 45, 216–
229.
Ozier, O. (2014). “Exploiting Externalities to Estimate the Long-term Effects of Early Childhood
Deworming.” World Bank Policy Research Working Paper 7052, World Bank.
Petrosino, A., Morgan, C., Fronius, T. A., Tanner-Smith, E. E., & Boruch, R. F. (2012). “Interventions in
Developing Nations for Improving Primary and Secondary School Enrollment of Children: A Systematic
Review.” Campbell Systematic Reviews 2012:19.
23
Piper, B., & Korda, M. (2011). EGRA Plus: Liberia, Program Evaluation Report. Produced for review by the
United States Agency for International Development. Prepared by RTI International and the Liberian
Education Trust.
Piper, B. (2009). Integrated Education Program: Impact Study of SMRS Using Early Grade Reading
Assessment in Three Provinces in South Africa. Produced for review by the United States Agency for
International Development. Prepared by RTI International, North Carolina.
Sailors, M., Hoffman, J. V., Pearson, P. D., Beretvas, S. N., & Matthee, B. (2010). “The Effects of First- and
Second-Language Instruction in Rural South African Schools.” Bilingual Research Journal, 33, 21–41.
Spratt, J., King, S., & Bulat, J. (2013). Independent Evaluation of the Effectiveness of Institut pour
l’Education Populaire’s “Read-Learn-Lead” (RLL) Program in Mali: Endline Report. RTI International, North
Carolina.
Tan, J., Lane, J., & Lassibille, G. (1999). “Student Outcomes in Philippine Elementary Schools: An Evaluation
of Four Experiments.” World Bank Economic Review, 13 (3): 493-508.
UNESCO. (2014). EFA Global Monitoring Report 2013/4: Teaching and Learning: Achieving Quality for All.
United Nations Educational, Scientific, and Cultural Organization, Paris, France.
Van Staden, A. (2011). “Put Reading First: Positive Effects of Direct Instruction and Scaffolding for ESL
Learners Struggling with Reading.” Perspectives in Education, 29(4), 10-21.
Wachanga, S. W., & Mwangi, J. G. (2004). “Effects of the Cooperative Class Experiment Teaching Method
on Secondary School Students’ Chemistry Achievement in Kenya’s Nakuru District.” International
Education Journal, 5(1).
Ziliak, S. T., & McCloskey, D. N. (2014). “Lady Justice v. Cult of Statistical Significance: Oomph-less Science
and the New Rule of Law.” In the forthcoming Oxford Handbook on Professional Economic Ethics, ed.
DeMartino, G., & McCloskey, D. N.
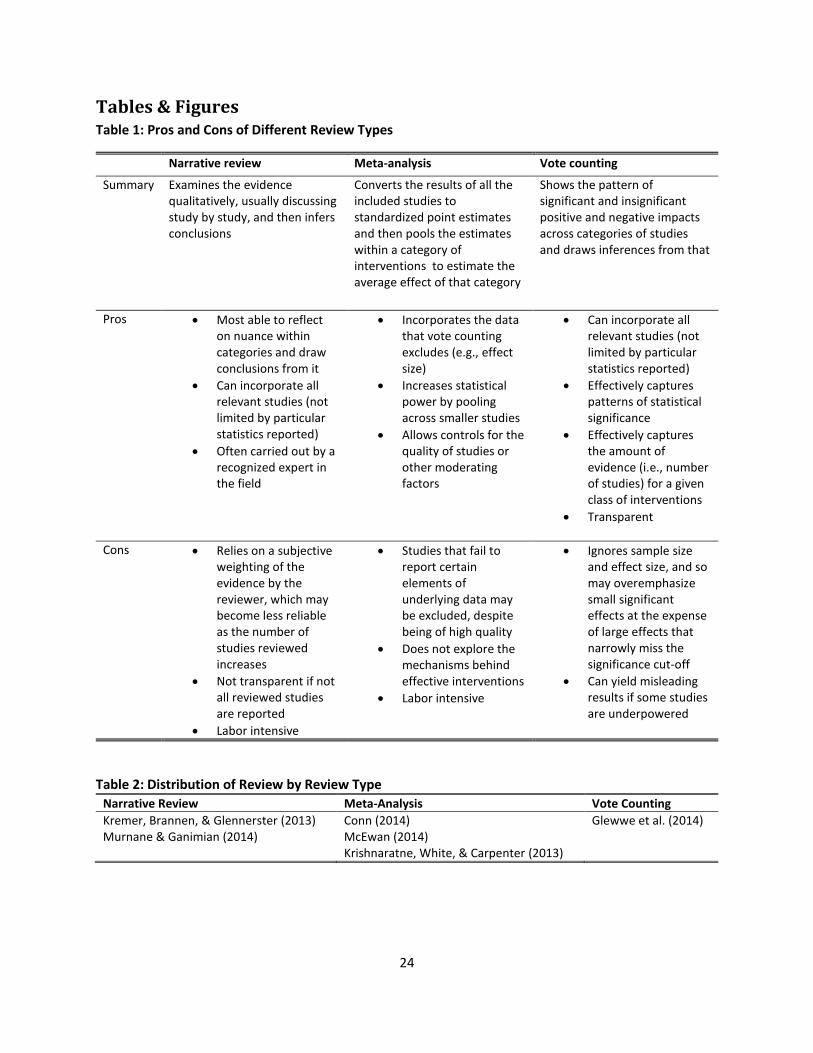
24
Tables & Figures Table 1: Pros and Cons of Different Review Types
Narrative review Meta-analysis Vote counting
Summary Examines the evidence qualitatively, usually discussing study by study, and then infers conclusions
Converts the results of all the included studies to standardized point estimates and then pools the estimates within a category of interventions to estimate the average effect of that category
Shows the pattern of significant and insignificant positive and negative impacts across categories of studies and draws inferences from that
Pros Most able to reflect on nuance within categories and draw conclusions from it
Can incorporate all relevant studies (not limited by particular statistics reported)
Often carried out by a recognized expert in the field
Incorporates the data that vote counting excludes (e.g., effect size)
Increases statistical power by pooling across smaller studies
Allows controls for the quality of studies or other moderating factors
Can incorporate all relevant studies (not limited by particular statistics reported)
Effectively captures patterns of statistical significance
Effectively captures the amount of evidence (i.e., number of studies) for a given class of interventions
Transparent
Cons Relies on a subjective weighting of the evidence by the reviewer, which may become less reliable as the number of studies reviewed increases
Not transparent if not all reviewed studies are reported
Labor intensive
Studies that fail to report certain elements of underlying data may be excluded, despite being of high quality
Does not explore the mechanisms behind effective interventions
Labor intensive
Ignores sample size and effect size, and so may overemphasize small significant effects at the expense of large effects that narrowly miss the significance cut-off
Can yield misleading results if some studies are underpowered
Table 2: Distribution of Review by Review Type
Narrative Review Meta-Analysis Vote Counting
Kremer, Brannen, & Glennerster (2013) Conn (2014) Glewwe et al. (2014) Murnane & Ganimian (2014) McEwan (2014) Krishnaratne, White, & Carpenter (2013)
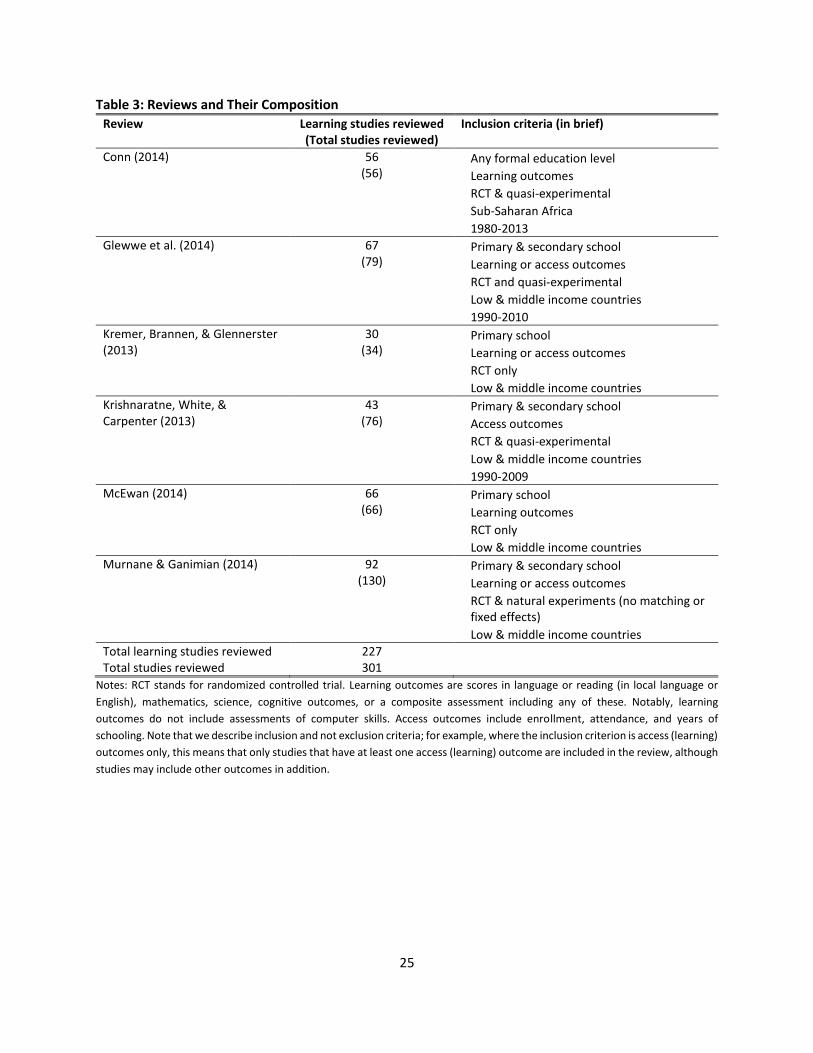
25
Table 3: Reviews and Their Composition
Review Learning studies reviewed (Total studies reviewed)
Inclusion criteria (in brief)
Conn (2014) 56 (56)
Any formal education level
Learning outcomes
RCT & quasi-experimental
Sub-Saharan Africa
1980-2013
Glewwe et al. (2014) 67 (79)
Primary & secondary school
Learning or access outcomes
RCT and quasi-experimental
Low & middle income countries
1990-2010
Kremer, Brannen, & Glennerster (2013)
30 (34)
Primary school
Learning or access outcomes
RCT only
Low & middle income countries
Krishnaratne, White, & Carpenter (2013)
43 (76)
Primary & secondary school
Access outcomes
RCT & quasi-experimental
Low & middle income countries
1990-2009
McEwan (2014) 66 (66)
Primary school
Learning outcomes
RCT only
Low & middle income countries
Murnane & Ganimian (2014) 92 (130)
Primary & secondary school
Learning or access outcomes
RCT & natural experiments (no matching or fixed effects)
Low & middle income countries
Total learning studies reviewed Total studies reviewed
227 301
Notes: RCT stands for randomized controlled trial. Learning outcomes are scores in language or reading (in local language or
English), mathematics, science, cognitive outcomes, or a composite assessment including any of these. Notably, learning
outcomes do not include assessments of computer skills. Access outcomes include enrollment, attendance, and years of
schooling. Note that we describe inclusion and not exclusion criteria; for example, where the inclusion criterion is access (learning)
outcomes only, this means that only studies that have at least one access (learning) outcome are included in the review, although
studies may include other outcomes in addition.
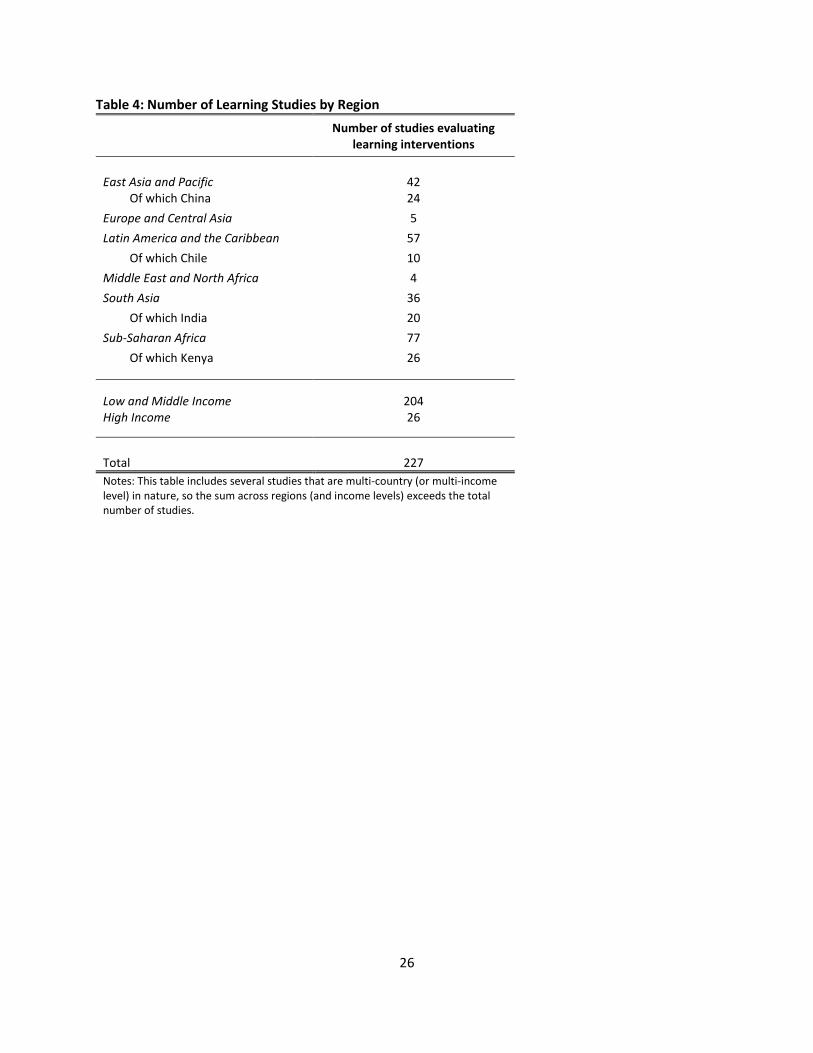
26
Table 4: Number of Learning Studies by Region
Number of studies evaluating learning interventions
East Asia and Pacific 42 Of which China 24
Europe and Central Asia 5
Latin America and the Caribbean 57
Of which Chile 10
Middle East and North Africa 4
South Asia 36
Of which India 20
Sub-Saharan Africa 77
Of which Kenya 26
Low and Middle Income 204 High Income 26
Total 227
Notes: This table includes several studies that are multi-country (or multi-income level) in nature, so the sum across regions (and income levels) exceeds the total number of studies.
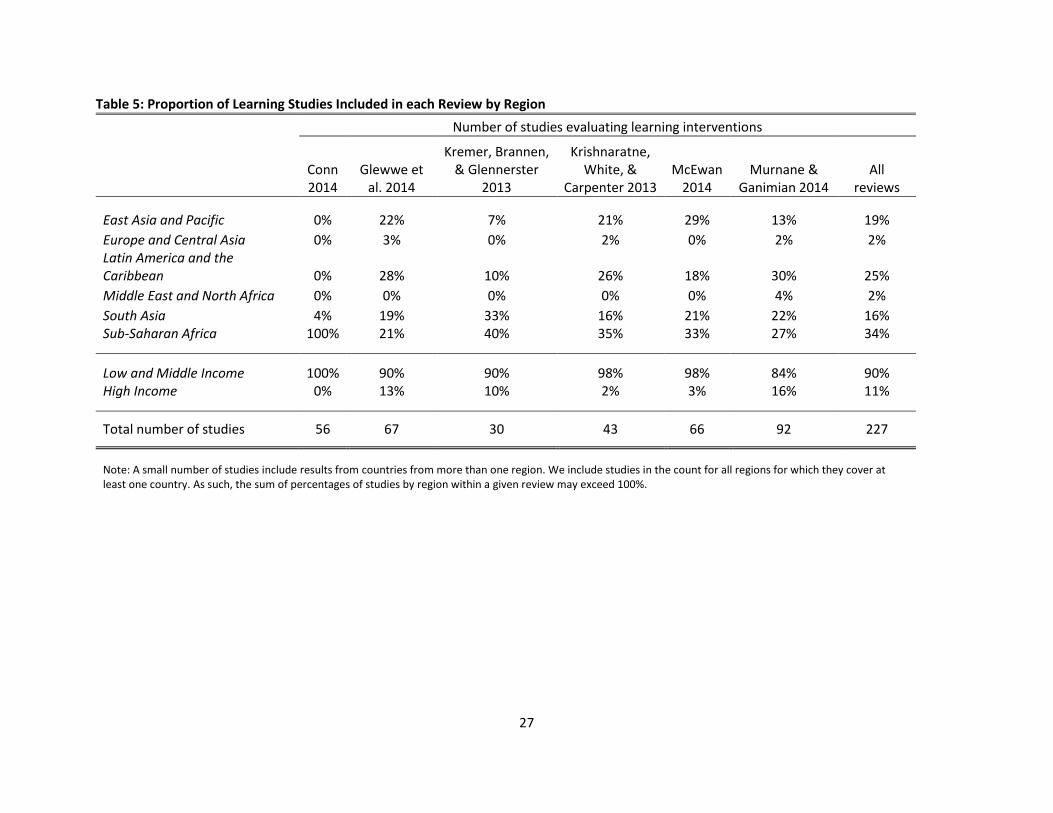
27
Table 5: Proportion of Learning Studies Included in each Review by Region
Number of studies evaluating learning interventions
Conn 2014
Glewwe et al. 2014
Kremer, Brannen, & Glennerster
2013
Krishnaratne, White, &
Carpenter 2013 McEwan
2014 Murnane &
Ganimian 2014 All
reviews
East Asia and Pacific 0% 22% 7% 21% 29% 13% 19%
Europe and Central Asia 0% 3% 0% 2% 0% 2% 2% Latin America and the Caribbean 0% 28% 10% 26% 18% 30% 25%
Middle East and North Africa 0% 0% 0% 0% 0% 4% 2%
South Asia 4% 19% 33% 16% 21% 22% 16% Sub-Saharan Africa 100% 21% 40% 35% 33% 27% 34%
Low and Middle Income 100% 90% 90% 98% 98% 84% 90% High Income 0% 13% 10% 2% 3% 16% 11%
Total number of studies 56 67 30 43 66 92 227
Note: A small number of studies include results from countries from more than one region. We include studies in the count for all regions for which they cover at least one country. As such, the sum of percentages of studies by region within a given review may exceed 100%.
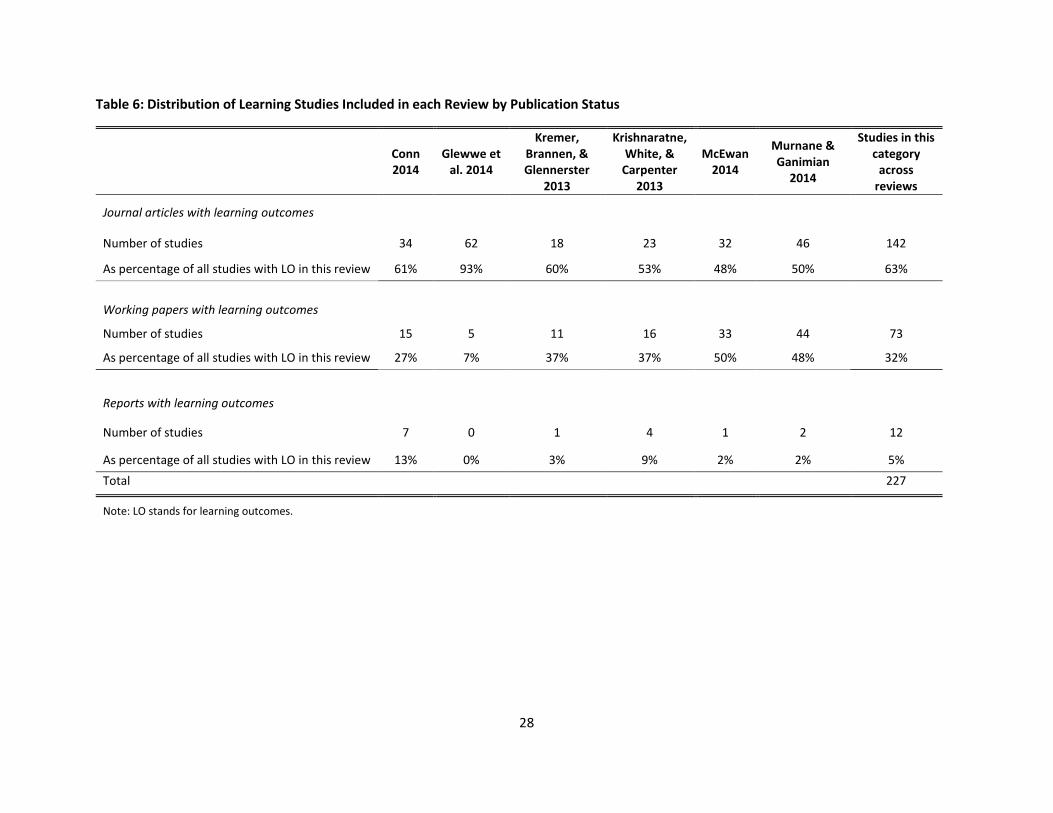
28
Table 6: Distribution of Learning Studies Included in each Review by Publication Status
Conn 2014
Glewwe et al. 2014
Kremer, Brannen, & Glennerster
2013
Krishnaratne, White, &
Carpenter 2013
McEwan 2014
Murnane & Ganimian
2014
Studies in this category
across reviews
Journal articles with learning outcomes
Number of studies 34 62 18 23 32 46 142
As percentage of all studies with LO in this review 61% 93% 60% 53% 48% 50% 63%
Working papers with learning outcomes
Number of studies 15 5 11 16 33 44 73
As percentage of all studies with LO in this review 27% 7% 37% 37% 50% 48% 32%
Reports with learning outcomes
Number of studies 7 0 1 4 1 2 12
As percentage of all studies with LO in this review 13% 0% 3% 9% 2% 2% 5%
Total 227
Note: LO stands for learning outcomes.
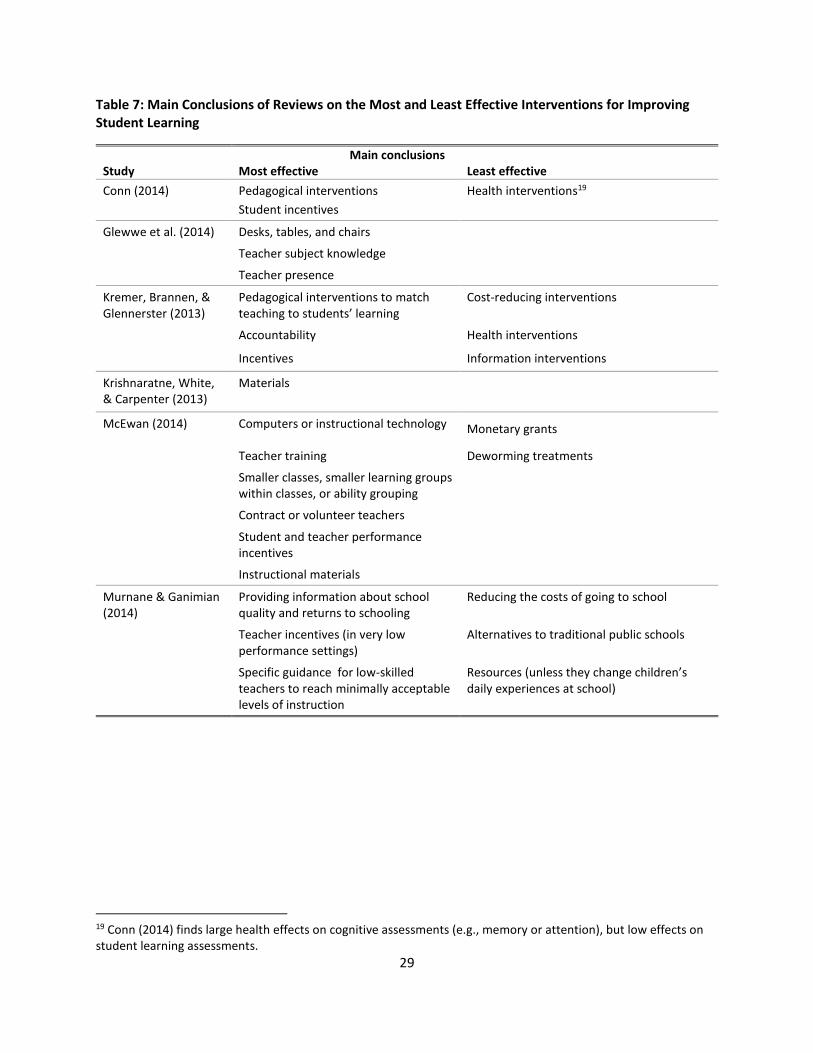
29
Table 7: Main Conclusions of Reviews on the Most and Least Effective Interventions for Improving Student Learning
Main conclusions Study Most effective Least effective
Conn (2014) Pedagogical interventions
Student incentives
Health interventions19
Glewwe et al. (2014) Desks, tables, and chairs
Teacher subject knowledge
Teacher presence
Kremer, Brannen, & Glennerster (2013)
Pedagogical interventions to match teaching to students’ learning
Cost-reducing interventions
Accountability Health interventions
Incentives Information interventions
Krishnaratne, White, & Carpenter (2013)
Materials
McEwan (2014) Computers or instructional technology Monetary grants
Teacher training Deworming treatments
Smaller classes, smaller learning groups within classes, or ability grouping
Contract or volunteer teachers
Student and teacher performance incentives
Instructional materials
Murnane & Ganimian (2014)
Providing information about school quality and returns to schooling
Reducing the costs of going to school
Teacher incentives (in very low performance settings)
Alternatives to traditional public schools
Specific guidance for low-skilled teachers to reach minimally acceptable levels of instruction
Resources (unless they change children’s daily experiences at school)
19 Conn (2014) finds large health effects on cognitive assessments (e.g., memory or attention), but low effects on student learning assessments.
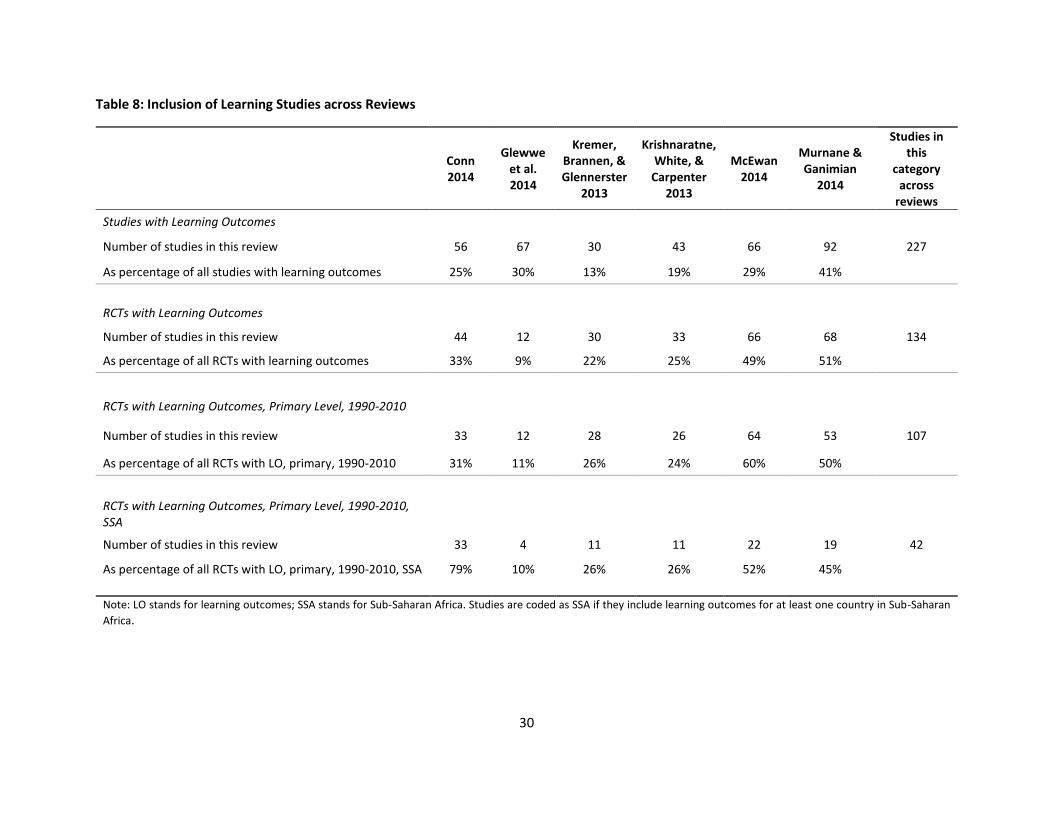
30
Table 8: Inclusion of Learning Studies across Reviews
Conn 2014
Glewwe et al. 2014
Kremer, Brannen, & Glennerster
2013
Krishnaratne, White, &
Carpenter 2013
McEwan 2014
Murnane & Ganimian
2014
Studies in this
category across
reviews
Studies with Learning Outcomes
Number of studies in this review 56 67 30 43 66 92 227
As percentage of all studies with learning outcomes 25% 30% 13% 19% 29% 41%
RCTs with Learning Outcomes
Number of studies in this review 44 12 30 33 66 68 134
As percentage of all RCTs with learning outcomes 33% 9% 22% 25% 49% 51%
RCTs with Learning Outcomes, Primary Level, 1990-2010
Number of studies in this review 33 12 28 26 64 53 107
As percentage of all RCTs with LO, primary, 1990-2010 31% 11% 26% 24% 60% 50%
RCTs with Learning Outcomes, Primary Level, 1990-2010, SSA
Number of studies in this review 33 4 11 11 22 19 42
As percentage of all RCTs with LO, primary, 1990-2010, SSA 79% 10% 26% 26% 52% 45%
Note: LO stands for learning outcomes; SSA stands for Sub-Saharan Africa. Studies are coded as SSA if they include learning outcomes for at least one country in Sub-Saharan
Africa.
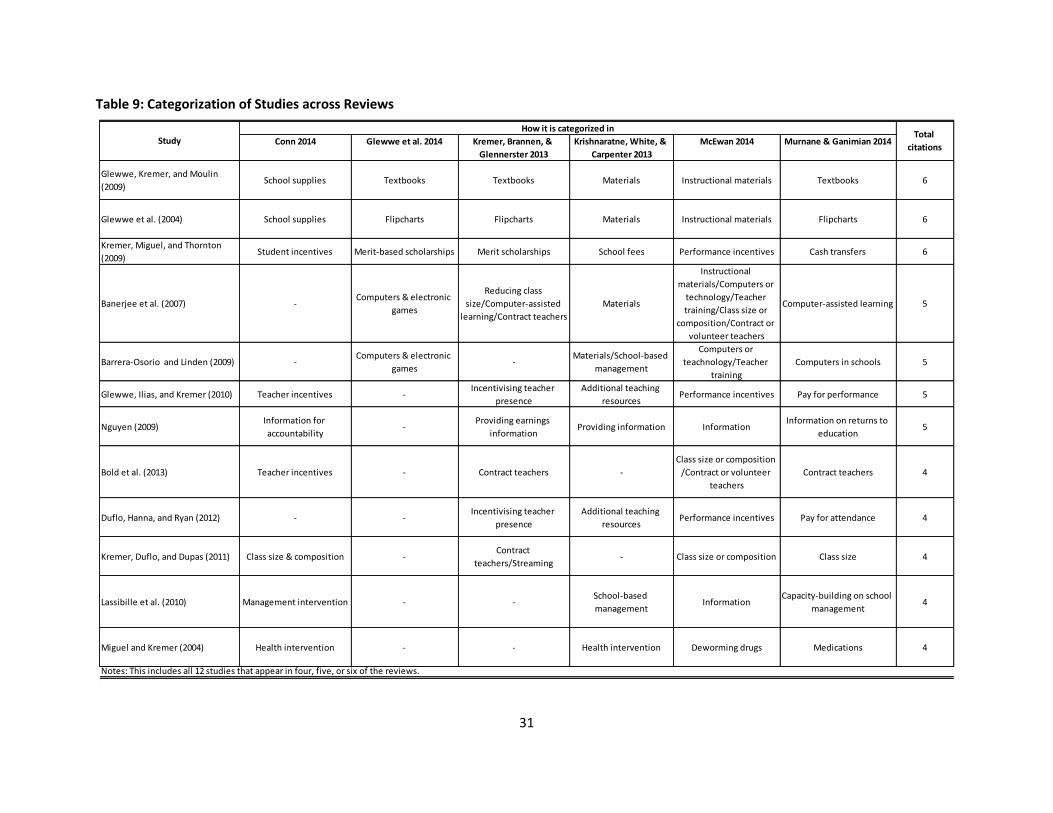
31
Table 9: Categorization of Studies across Reviews
Conn 2014 Glewwe et al. 2014 Kremer, Brannen, &
Glennerster 2013
Krishnaratne, White, &
Carpenter 2013
McEwan 2014 Murnane & Ganimian 2014
Glewwe, Kremer, and Moulin
(2009)School supplies Textbooks Textbooks Materials Instructional materials Textbooks 6
Glewwe et al. (2004) School supplies Flipcharts Flipcharts Materials Instructional materials Flipcharts 6
Kremer, Miguel, and Thornton
(2009)Student incentives Merit-based scholarships Merit scholarships School fees Performance incentives Cash transfers 6
Banerjee et al. (2007) -Computers & electronic
games
Reducing class
size/Computer-assisted
learning/Contract teachers
Materials
Instructional
materials/Computers or
technology/Teacher
training/Class size or
composition/Contract or
volunteer teachers
Computer-assisted learning 5
Barrera-Osorio and Linden (2009) -Computers & electronic
games-
Materials/School-based
management
Computers or
teachnology/Teacher
training
Computers in schools 5
Glewwe, Ilias, and Kremer (2010) Teacher incentives -Incentivising teacher
presence
Additional teaching
resourcesPerformance incentives Pay for performance 5
Nguyen (2009)Information for
accountability-
Providing earnings
informationProviding information Information
Information on returns to
education5
Bold et al. (2013) Teacher incentives - Contract teachers -
Class size or composition
/Contract or volunteer
teachers
Contract teachers 4
Duflo, Hanna, and Ryan (2012) - -Incentivising teacher
presence
Additional teaching
resourcesPerformance incentives Pay for attendance 4
Kremer, Duflo, and Dupas (2011) Class size & composition -Contract
teachers/Streaming- Class size or composition Class size 4
Lassibille et al. (2010) Management intervention - -School-based
managementInformation
Capacity-building on school
management4
Miguel and Kremer (2004) Health intervention - - Health intervention Deworming drugs Medications 4
How it is categorized in
Notes: This includes all 12 studies that appear in four, five, or six of the reviews.
Total
citationsStudy
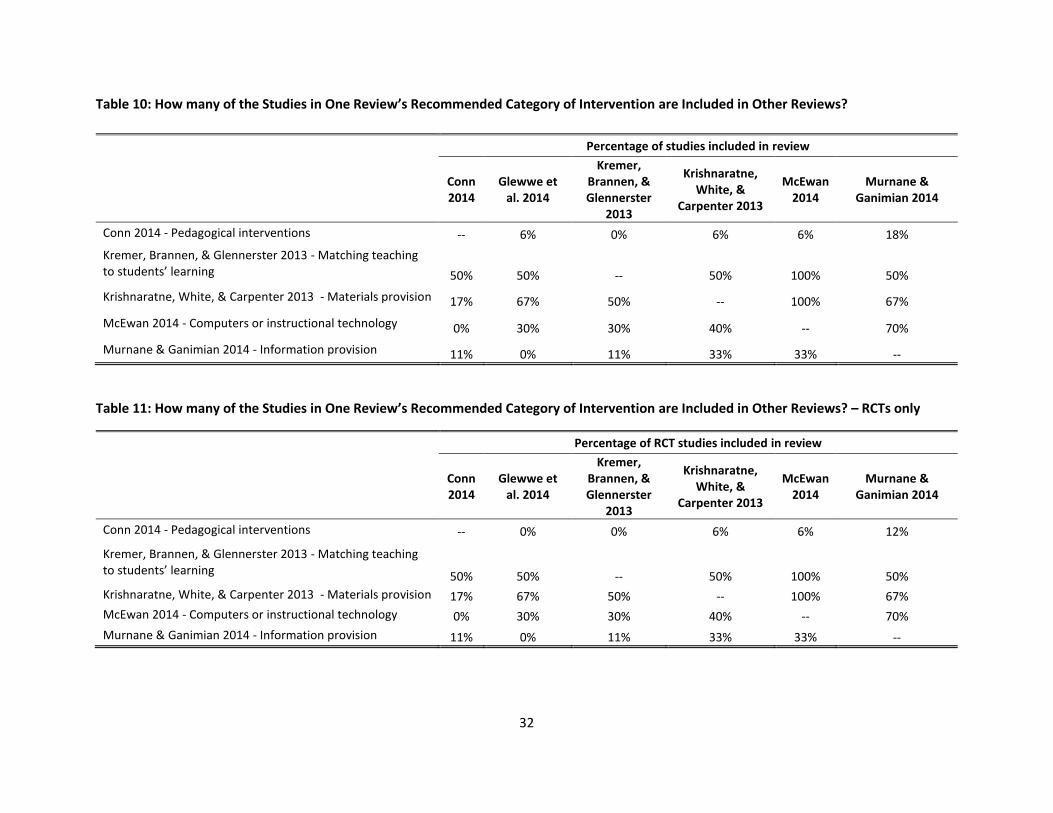
32
Table 10: How many of the Studies in One Review’s Recommended Category of Intervention are Included in Other Reviews?
Percentage of studies included in review
Conn 2014
Glewwe et al. 2014
Kremer, Brannen, & Glennerster
2013
Krishnaratne, White, &
Carpenter 2013
McEwan 2014
Murnane & Ganimian 2014
Conn 2014 - Pedagogical interventions -- 6% 0% 6% 6% 18%
Kremer, Brannen, & Glennerster 2013 - Matching teaching to students’ learning 50% 50% -- 50% 100% 50%
Krishnaratne, White, & Carpenter 2013 - Materials provision 17% 67% 50% -- 100% 67%
McEwan 2014 - Computers or instructional technology 0% 30% 30% 40% -- 70%
Murnane & Ganimian 2014 - Information provision 11% 0% 11% 33% 33% --
Table 11: How many of the Studies in One Review’s Recommended Category of Intervention are Included in Other Reviews? – RCTs only
Percentage of RCT studies included in review
Conn 2014
Glewwe et al. 2014
Kremer, Brannen, & Glennerster
2013
Krishnaratne, White, &
Carpenter 2013
McEwan 2014
Murnane & Ganimian 2014
Conn 2014 - Pedagogical interventions -- 0% 0% 6% 6% 12%
Kremer, Brannen, & Glennerster 2013 - Matching teaching to students’ learning 50% 50% -- 50% 100% 50%
Krishnaratne, White, & Carpenter 2013 - Materials provision 17% 67% 50% -- 100% 67%
McEwan 2014 - Computers or instructional technology 0% 30% 30% 40% -- 70%
Murnane & Ganimian 2014 - Information provision 11% 0% 11% 33% 33% --
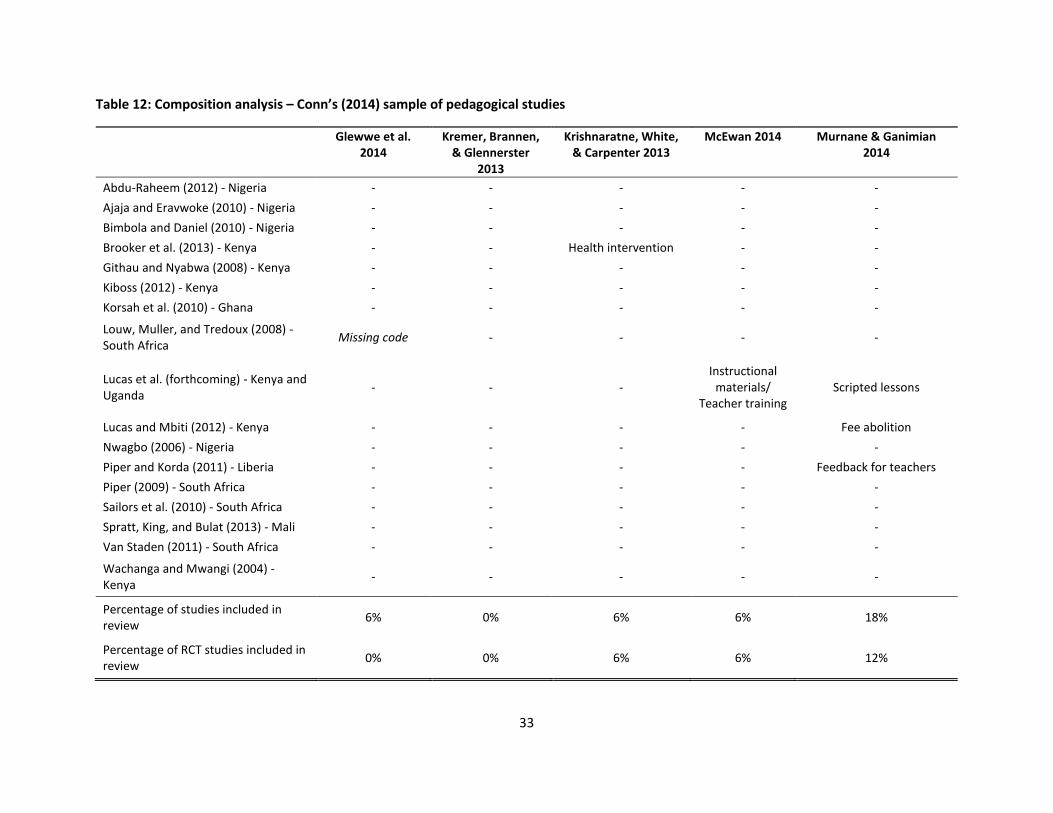
33
Table 12: Composition analysis – Conn’s (2014) sample of pedagogical studies
Glewwe et al. 2014
Kremer, Brannen, & Glennerster
2013
Krishnaratne, White, & Carpenter 2013
McEwan 2014 Murnane & Ganimian 2014
Abdu-Raheem (2012) - Nigeria - - - - -
Ajaja and Eravwoke (2010) - Nigeria - - - - -
Bimbola and Daniel (2010) - Nigeria - - - - -
Brooker et al. (2013) - Kenya - - Health intervention - -
Githau and Nyabwa (2008) - Kenya - - - - -
Kiboss (2012) - Kenya - - - - -
Korsah et al. (2010) - Ghana - - - - -
Louw, Muller, and Tredoux (2008) - South Africa
Missing code - - - -
Lucas et al. (forthcoming) - Kenya and Uganda
- - - Instructional
materials/ Teacher training
Scripted lessons
Lucas and Mbiti (2012) - Kenya - - - - Fee abolition
Nwagbo (2006) - Nigeria - - - - -
Piper and Korda (2011) - Liberia - - - - Feedback for teachers
Piper (2009) - South Africa - - - - -
Sailors et al. (2010) - South Africa - - - - -
Spratt, King, and Bulat (2013) - Mali - - - - -
Van Staden (2011) - South Africa - - - - -
Wachanga and Mwangi (2004) - Kenya
- - - - -
Percentage of studies included in review
6% 0% 6% 6% 18%
Percentage of RCT studies included in review
0% 0% 6% 6% 12%
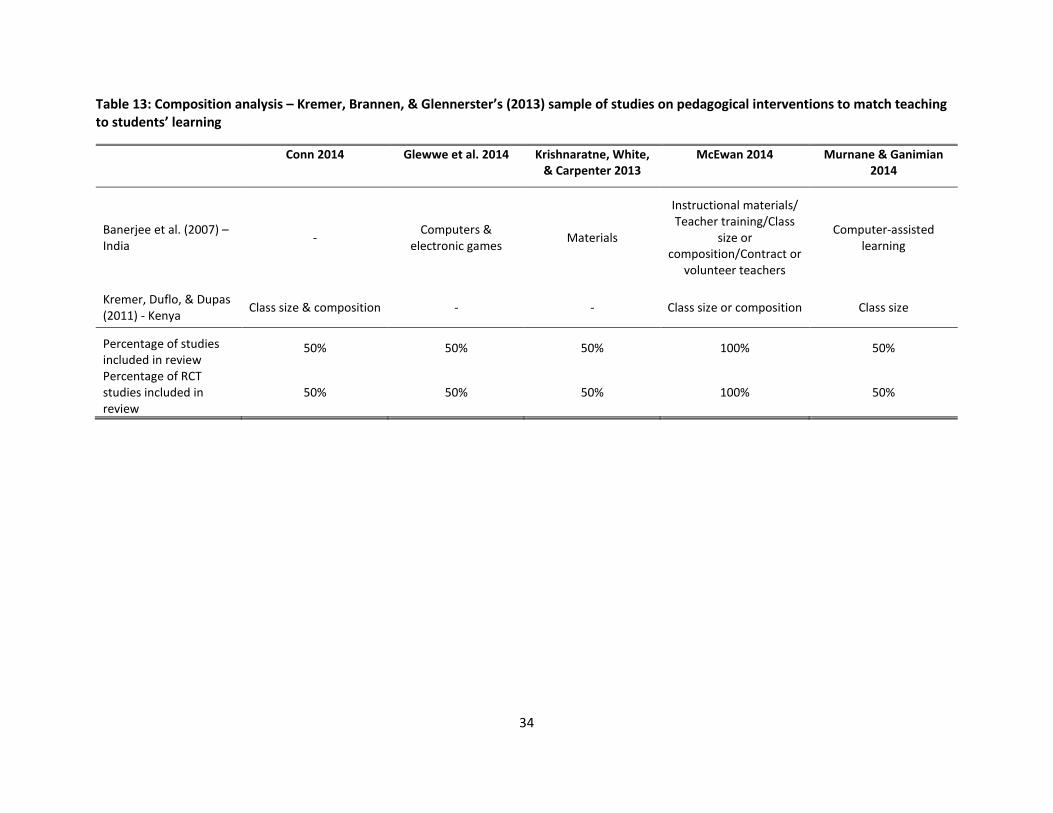
34
Table 13: Composition analysis – Kremer, Brannen, & Glennerster’s (2013) sample of studies on pedagogical interventions to match teaching to students’ learning
Conn 2014 Glewwe et al. 2014 Krishnaratne, White, & Carpenter 2013
McEwan 2014 Murnane & Ganimian 2014
Banerjee et al. (2007) – India
- Computers &
electronic games Materials
Instructional materials/ Teacher training/Class
size or composition/Contract or
volunteer teachers
Computer-assisted learning
Kremer, Duflo, & Dupas (2011) - Kenya
Class size & composition - - Class size or composition Class size
Percentage of studies included in review
50% 50% 50% 100% 50%
Percentage of RCT studies included in review
50% 50% 50% 100% 50%
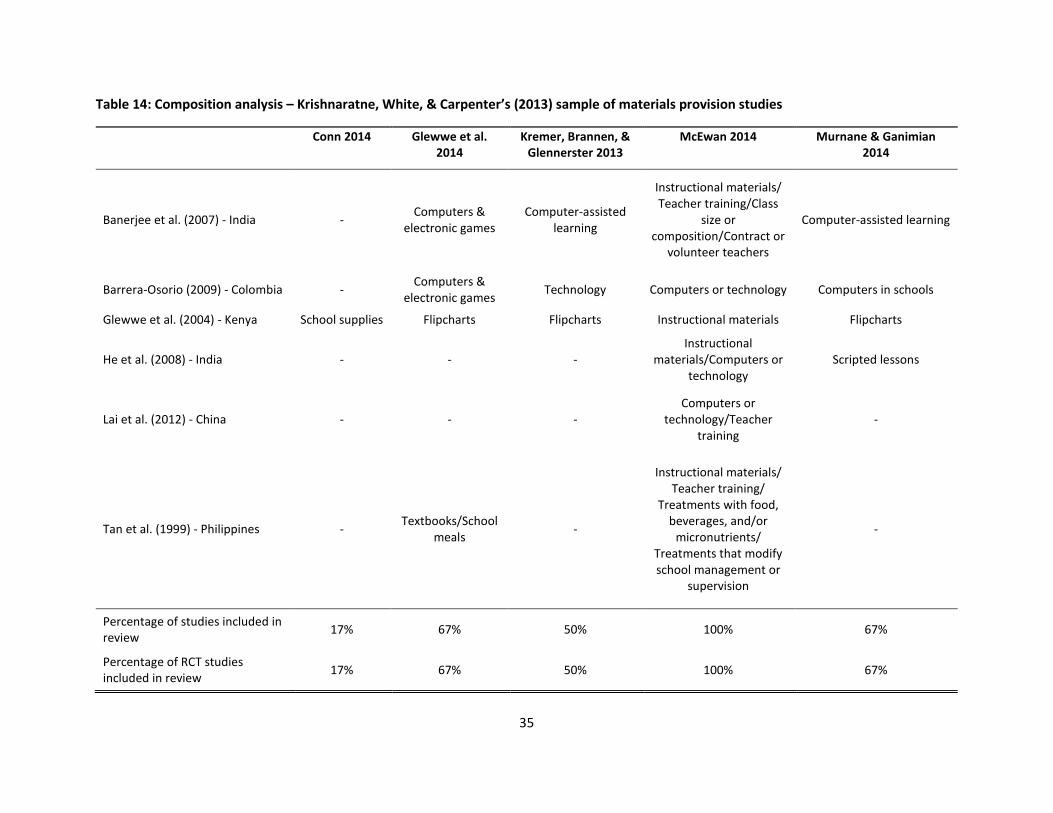
35
Table 14: Composition analysis – Krishnaratne, White, & Carpenter’s (2013) sample of materials provision studies
Conn 2014 Glewwe et al.
2014 Kremer, Brannen, &
Glennerster 2013 McEwan 2014 Murnane & Ganimian
2014
Banerjee et al. (2007) - India - Computers &
electronic games Computer-assisted
learning
Instructional materials/ Teacher training/Class
size or composition/Contract or
volunteer teachers
Computer-assisted learning
Barrera-Osorio (2009) - Colombia - Computers &
electronic games Technology Computers or technology Computers in schools
Glewwe et al. (2004) - Kenya School supplies Flipcharts Flipcharts Instructional materials Flipcharts
He et al. (2008) - India - - - Instructional
materials/Computers or technology
Scripted lessons
Lai et al. (2012) - China - - - Computers or
technology/Teacher training
-
Tan et al. (1999) - Philippines - Textbooks/School
meals -
Instructional materials/ Teacher training/
Treatments with food, beverages, and/or
micronutrients/ Treatments that modify school management or
supervision
-
Percentage of studies included in review
17% 67% 50% 100% 67%
Percentage of RCT studies included in review
17% 67% 50% 100% 67%
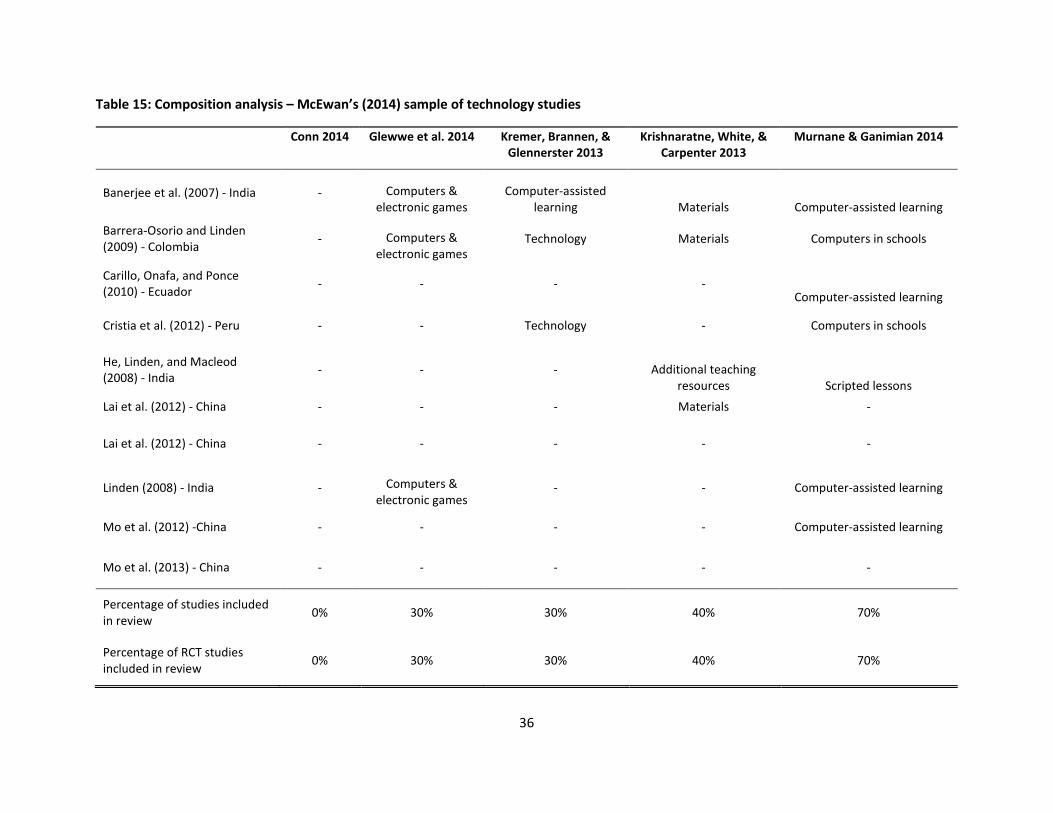
36
Table 15: Composition analysis – McEwan’s (2014) sample of technology studies
Conn 2014 Glewwe et al. 2014 Kremer, Brannen, & Glennerster 2013
Krishnaratne, White, & Carpenter 2013
Murnane & Ganimian 2014
Banerjee et al. (2007) - India - Computers & electronic games
Computer-assisted learning Materials Computer-assisted learning
Barrera-Osorio and Linden (2009) - Colombia
- Computers & electronic games
Technology Materials Computers in schools
Carillo, Onafa, and Ponce (2010) - Ecuador
- - - - Computer-assisted learning
Cristia et al. (2012) - Peru - - Technology - Computers in schools
He, Linden, and Macleod (2008) - India
- - - Additional teaching resources Scripted lessons
Lai et al. (2012) - China - - - Materials -
Lai et al. (2012) - China - - - - -
Linden (2008) - India - Computers & electronic games
- - Computer-assisted learning
Mo et al. (2012) -China - - - - Computer-assisted learning
Mo et al. (2013) - China - - - - -
Percentage of studies included in review
0% 30% 30% 40% 70%
Percentage of RCT studies included in review
0% 30% 30% 40% 70%
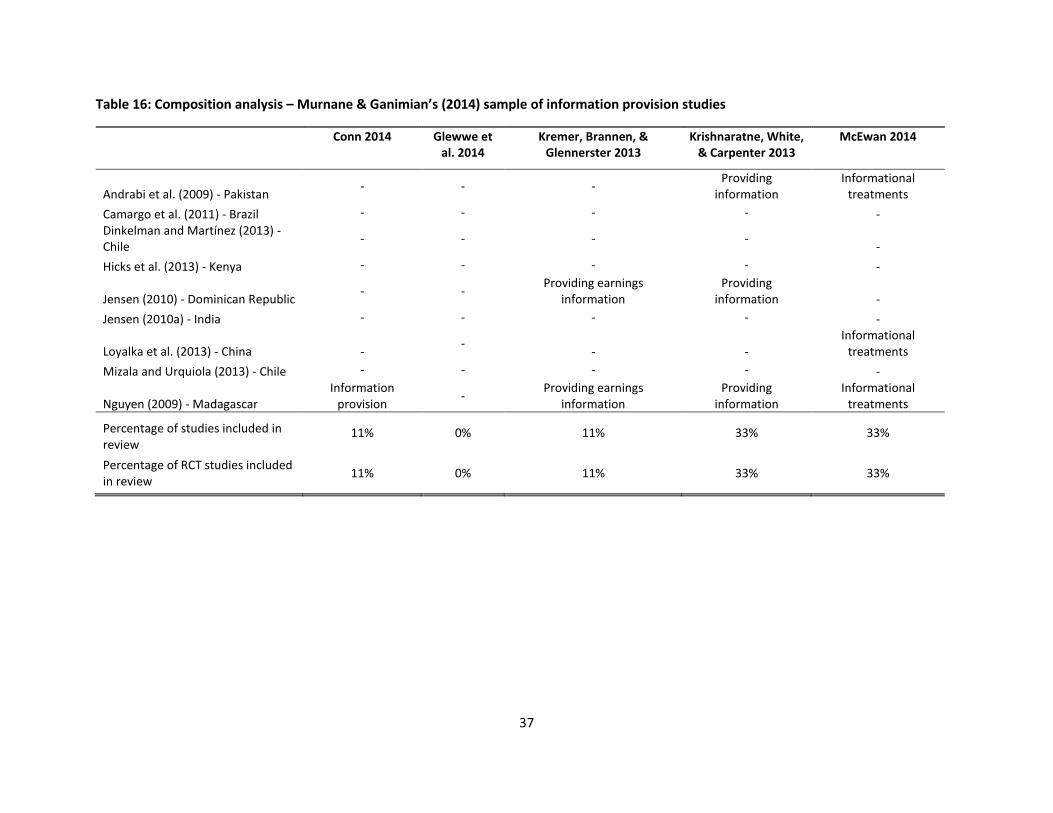
37
Table 16: Composition analysis – Murnane & Ganimian’s (2014) sample of information provision studies
Conn 2014 Glewwe et al. 2014
Kremer, Brannen, & Glennerster 2013
Krishnaratne, White, & Carpenter 2013
McEwan 2014
Andrabi et al. (2009) - Pakistan - - -
Providing information
Informational treatments
Camargo et al. (2011) - Brazil - - - - - Dinkelman and Martínez (2013) - Chile
- - - - -
Hicks et al. (2013) - Kenya - - - - -
Jensen (2010) - Dominican Republic - -
Providing earnings information
Providing information -
Jensen (2010a) - India - - - - -
Loyalka et al. (2013) - China - -
- - Informational
treatments
Mizala and Urquiola (2013) - Chile - - - - -
Nguyen (2009) - Madagascar Information
provision -
Providing earnings information
Providing information
Informational treatments
Percentage of studies included in review
11% 0% 11% 33% 33%
Percentage of RCT studies included in review
11% 0% 11% 33% 33%
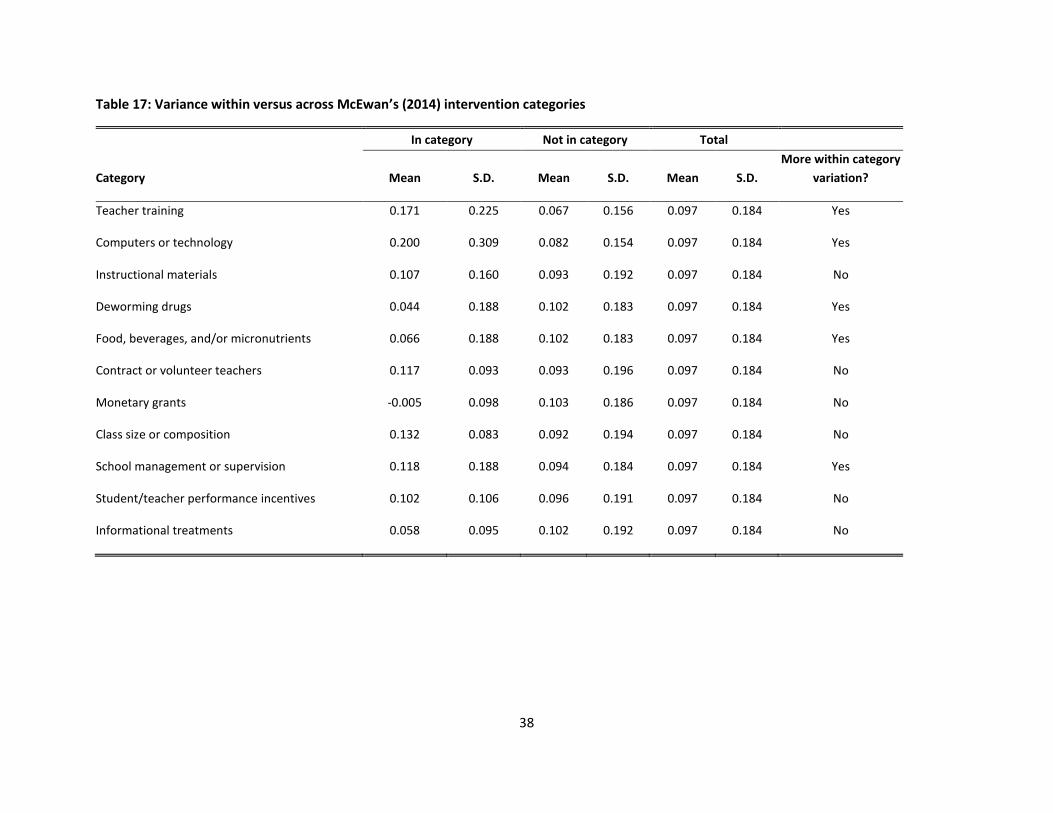
38
Table 17: Variance within versus across McEwan’s (2014) intervention categories
In category Not in category Total
Category Mean S.D. Mean S.D. Mean S.D.
More within category
variation?
Teacher training 0.171 0.225 0.067 0.156 0.097 0.184 Yes
Computers or technology 0.200 0.309 0.082 0.154 0.097 0.184 Yes
Instructional materials 0.107 0.160 0.093 0.192 0.097 0.184 No
Deworming drugs 0.044 0.188 0.102 0.183 0.097 0.184 Yes
Food, beverages, and/or micronutrients 0.066 0.188 0.102 0.183 0.097 0.184 Yes
Contract or volunteer teachers 0.117 0.093 0.093 0.196 0.097 0.184 No
Monetary grants -0.005 0.098 0.103 0.186 0.097 0.184 No
Class size or composition 0.132 0.083 0.092 0.194 0.097 0.184 No
School management or supervision 0.118 0.188 0.094 0.184 0.097 0.184 Yes
Student/teacher performance incentives 0.102 0.106 0.096 0.191 0.097 0.184 No
Informational treatments 0.058 0.095 0.102 0.192 0.097 0.184 No
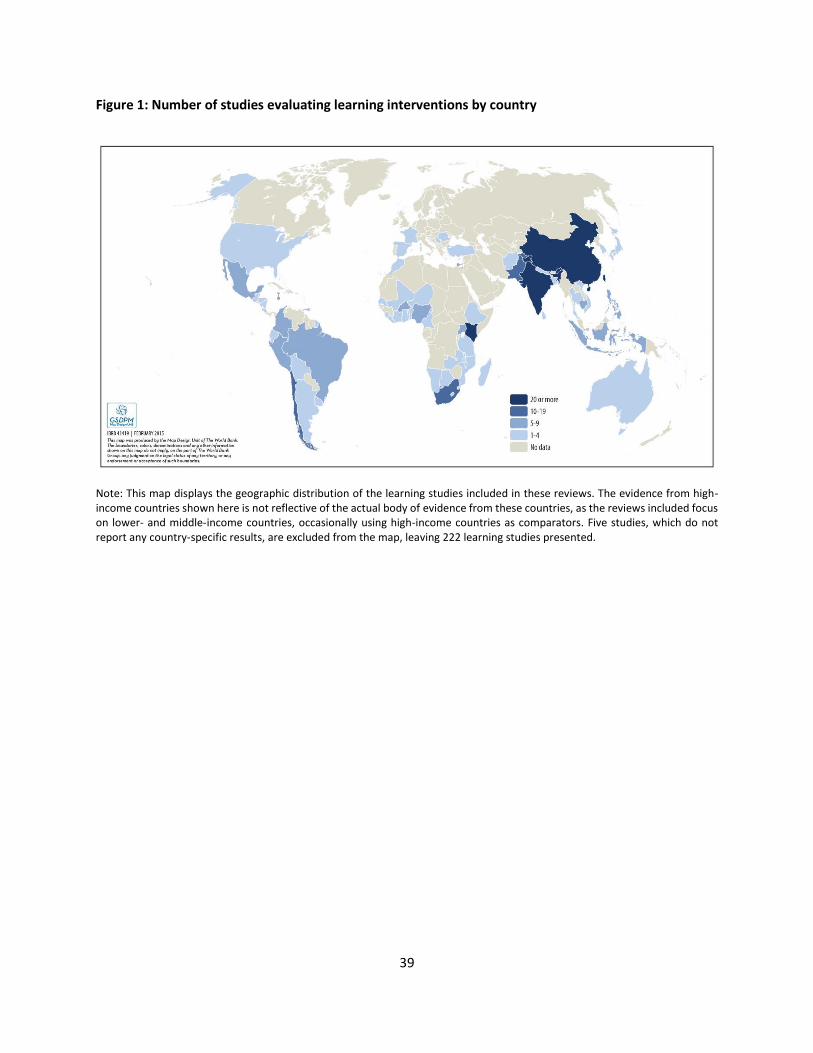
39
Figure 1: Number of studies evaluating learning interventions by country
Note: This map displays the geographic distribution of the learning studies included in these reviews. The evidence from high-income countries shown here is not reflective of the actual body of evidence from these countries, as the reviews included focus on lower- and middle-income countries, occasionally using high-income countries as comparators. Five studies, which do not report any country-specific results, are excluded from the map, leaving 222 learning studies presented.
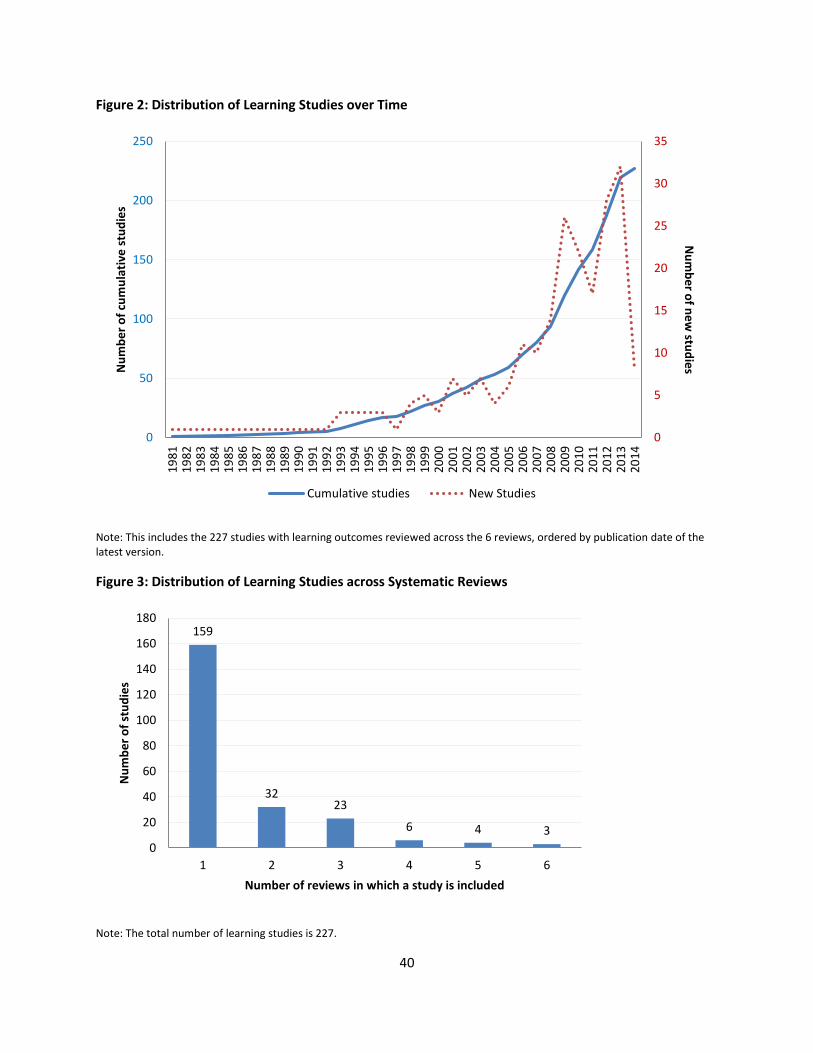
40
Figure 2: Distribution of Learning Studies over Time
Note: This includes the 227 studies with learning outcomes reviewed across the 6 reviews, ordered by publication date of the latest version.
Figure 3: Distribution of Learning Studies across Systematic Reviews
Note: The total number of learning studies is 227.
0
5
10
15
20
25
30
35
0
50
100
150
200
250
19
81
19
82
19
83
19
84
19
85
19
86
19
87
19
88
19
89
19
90
19
91
19
92
19
93
19
94
19
95
19
96
19
97
19
98
19
99
20
00
20
01
20
02
20
03
20
04
20
05
20
06
20
07
20
08
20
09
20
10
20
11
20
12
20
13
20
14
Nu
mb
er o
f ne
w stu
die
sNu
mb
er
of
cum
ula
tive
stu
die
s
Cumulative studies New Studies
159
3223
6 4 3
0
20
40
60
80
100
120
140
160
180
1 2 3 4 5 6
Nu
mb
er
of
stu
die
s
Number of reviews in which a study is included
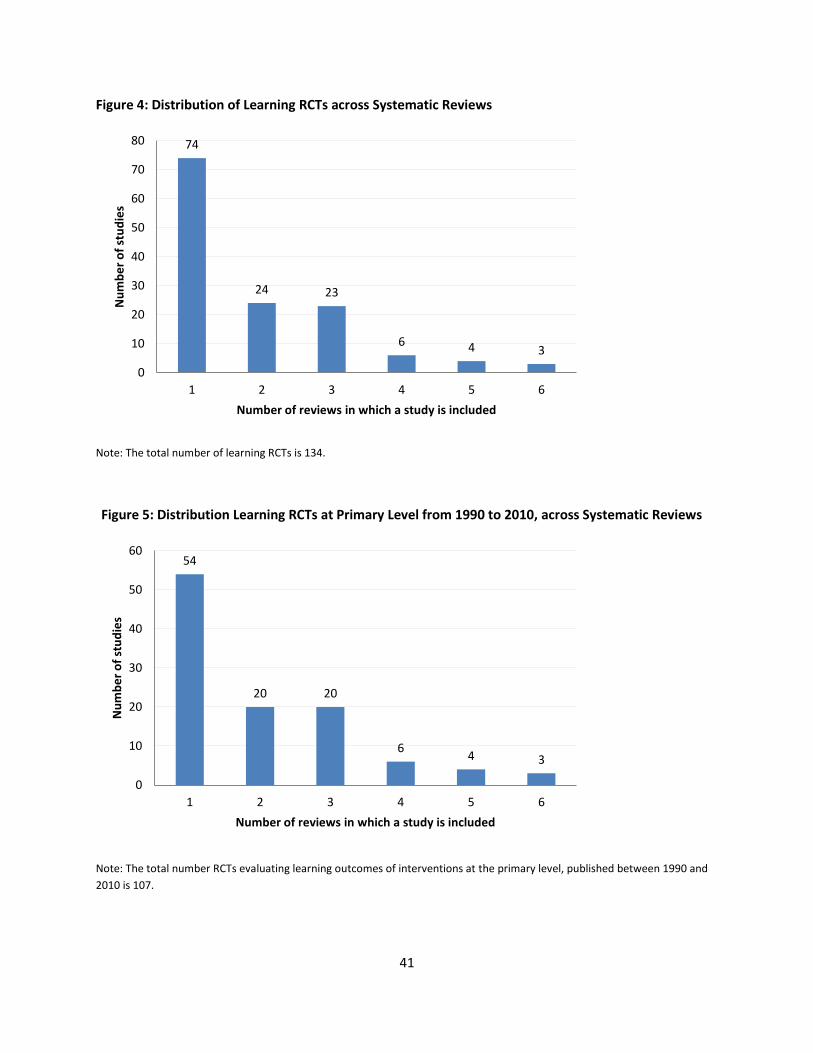
41
Figure 4: Distribution of Learning RCTs across Systematic Reviews
Note: The total number of learning RCTs is 134.
Figure 5: Distribution Learning RCTs at Primary Level from 1990 to 2010, across Systematic Reviews
Note: The total number RCTs evaluating learning outcomes of interventions at the primary level, published between 1990 and
2010 is 107.
74
24 23
6 4 3
0
10
20
30
40
50
60
70
80
1 2 3 4 5 6
Nu
mb
er
of
stu
die
s
Number of reviews in which a study is included
54
20 20
64 3
0
10
20
30
40
50
60
1 2 3 4 5 6
Nu
mb
er
of
stu
die
s
Number of reviews in which a study is included