Embed Size (px)
Citation preview

Tiruvadi Krishnan et al. Journal of Biological Engineering (2015) 9:11 DOI 10.1186/s13036-015-0008-x
METHODOLOGY Open Access
Essential validation methods for E. coli strainscreated by chromosome engineering
Sriram Tiruvadi Krishnan, M. Charl Moolman, Theo van Laar, Anne S. Meyer and Nynke H. Dekker*Abstract
Background: Chromosome engineering encompasses a collection of homologous recombination-based techniquesthat are employed to modify the genome of a model organism in a controlled fashion. Such techniques are widelyused in both fundamental and industrial research to introduce multiple insertions in the same Escherichia coli strain.To date, λ-Red recombination (also known as recombineering) and P1 phage transduction are the most successfullyimplemented chromosome engineering techniques in E. coli. However, due to errors that can occur during thestrain creation process, reliable validation methods are essential upon alteration of a strain’s chromosome.
Results and discussion: Polymerase chain reaction (PCR)-based methods and DNA sequence analysis are rapid andpowerful methods to verify successful integration of DNA sequences into a chromosome. Even though theseverification methods are necessary, they may not be sufficient in detecting all errors, imposing the requirement ofadditional validation methods. For example, as extraneous insertions may occur during recombineering, wehighlight the use of Southern blotting to detect their presence. These unwanted mutations can be removed viatransducing the region of interest into the wild type chromosome using P1 phages. However, in doing so onemust verify that both the P1 lysate and the strains utilized are free from contamination with temperate phages, asthese can lysogenize inside a cell as a large plasmid. Thus, we illustrate various methods to probe for temperatephage contamination, including cross-streak agar and Evans Blue-Uranine (EBU) plate assays, whereby the latter is anewly reported technique for this purpose in E. coli. Lastly, we discuss methodologies for detecting defects in cellgrowth and shape characteristics, which should be employed as an additional check.
Conclusion: The simple, yet crucial validation techniques discussed here can be used to reliably verify anychromosomally engineered E. coli strains for errors such as non-specific insertions in the chromosome, temperatephage contamination, and defects in growth and cell shape. While techniques such as PCR and DNA sequenceverification should standardly be performed, we illustrate the necessity of performing these additional assays. Thediscussed techniques are highly generic and can be easily applied to any type of chromosome engineering.
Keywords: Chromosome engineering, Escherichia coli, Recombineering, P1 phage transduction, Strain validation,EBU plate assay, Growth curve analysis, Cell shape analysis
BackgroundModification of an organism’s phenotypes by altering itschromosomal DNA sequence in a controlled mannerprovides the fundamental motivation for chromosomeengineering [1]. This engineering comprises a collectionof techniques that can be applied to insert foreign DNAsequences at a specific locus, delete the native sequence,or alter the bases in the chromosomal DNA of a model
* Correspondence: [email protected] of Bionanoscience, Kavli Institute of Nanoscience, Faculty ofApplied Sciences, Delft University of Technology, Lorentzweg 1, Delft 2628CJ, The Netherlands
© 2015 Tiruvadi Krishnan et al. This is an OpenLicense (http://creativecommons.org/licenses/medium, provided the original work is propercreativecommons.org/publicdomain/zero/1.0/
organism. One such key model organism is the bacter-ium Escherichia coli (E. coli), used for many fundamentalstudies in molecular and cell biology, and it is also uti-lized for expressing novel proteins. The single, circularchromosome of E. coli has been fully sequenced andamply annotated, paving the way for researchers to pre-cisely engineer its chromosome using a variety of methods[2]. Most chromosome engineering techniques in E. coliharness the properties of the recombinase family of en-zymes, expressed by plasmids or bacteriophages, which re-combine homologous linear DNA fragments into the hostchromosome [3].
Access article distributed under the terms of the Creative Commons Attributionby/4.0), which permits unrestricted use, distribution, and reproduction in anyly credited. The Creative Commons Public Domain Dedication waiver (http://) applies to the data made available in this article, unless otherwise stated.

Table 1 Chromosome engineering techniques widely used inE.coli
λ-Red recombination
The λ-Red recombination (or recombineering) approach has beensuccessfully implemented in many studies to engineer specific sites inthe E. coli chromosome [17]. In this approach, chromosomal sequencesare replaced by a linear DNA fragment (flanked with sequenceshomologous to the region of interest) through the use of a temperature-sensitive plasmid that expresses either the Red recombinase genes (bet,gam and exo) from λ-phage [17] or the RecET proteins from Rac prophage[18] upon induction. The linear DNA fragment of interest is usuallysynthesized via PCR, in which case the homologous sequences (~50 bases)are introduced through the employed primers. The recombined strainis selected using a constitutively expressed antibiotic marker that isintegrated into the chromosome along with the insert of interest. Thistechnique may also be combined with FLP/FRT-based recombination,in which the antibiotic marker is flanked by FRT sites that allow it to berecombined out using the flippase (FLP) enzyme [19]. In this way, thecreated strain may be employed in multiple rounds of chromosomeengineering using the same antibiotic marker [17, 20].
Generalized P1 phage transduction
Generalized P1 phage transduction is widely used to transfer mutationsfrom one E. coli strain to another with the same genetic background[26, 27]. This approach is based on the fact that virulent P1 phagescommit errors while packaging their DNA into coat proteins: instead ofpackaging their own genome, they package lysed host chromosomal DNAfragments [28–30]. Such mis-packaged phages form approximately ~5 %of the total phage population in a lysate. When they are transduced intoa different host, the chromosome fragment may be inserted precisely ata homologous site using the RecA-dependent system [26]. Using thisapproach, multiple insertions can be made into the ~4.6 Mb chromosomeof same E. coli strain, provided that they are separated by ~100 kb [31]. Acombination of λ-Red recombination, FLP/FRT recombination, and P1phage transduction methods can also be used to introduce multipleinsertions into a single E. coli strain [6, 15].
Tiruvadi Krishnan et al. Journal of Biological Engineering (2015) 9:11 Page 2 of 14
In the past decade, numerous studies have successfullyemployed chromosome engineering tools in E. coli re-search. The ability to fuse a fluorescent protein genewith native genes [4] is an example that has opened upthe possibility of live cell imaging to visualize the dynam-ics and stoichiometry of native proteins involved in keybiochemical processes such as DNA replication [5, 6],transcription [7, 8], translation [7], chromosome segrega-tion [9], cell signaling [10], and flagellar motor dynamics[11]. Similarly, a high throughput study in which singlegenes were systematically deleted from the E. coli chromo-some has shed light on the (non)-essential character ofindividual genes, and hence on the possibilities of creatinga minimal cell containing only the most essential genes[12, 13]. In addition to such studies into fundamental as-pects of molecular and cellular biology, chromosome engin-eering is also used in industrial research to produce essentialbio-chemicals, bio-fuels, and precursors for pharmaceuti-#cals on a large scale by engineering all necessary genesinto a single E. coli strain [14–16]. In industrial research,chromosome engineering is typically preferred to conven-tional cloning in plasmids, as it obviates the need for anti-biotics to maintain gene presence [15].For any research in which the chromosome is engi-
neered, it is essential to reliably verify that the processhas not inadvertently introduced anomalies into the gen-ome. For example, the use of λ-Red recombination orrecombineering [17–20] (Table 1) may result in inser-tions at undesired locations in the chromosome, a resultof sequence heterogeneities introduced during synthesisof the requisite long primers [17, 21], the presence of anunstable genomic region [22], or the occurrence of par-tial gene duplication in the chromosome during thestrain creation process [23]. The latter is illustrated bythe gene duplication errors that occurred in 0.6 % of the3864 single-gene deletion mutants of E. coli K12 strainsin the Keio collection [23]. Together with the intendedinsertion which usually occurs at a probability of ~10−4
to 10−5 [24] non-specific mutations may occur and, theyare not detected easily using standard PCR techniques[22]. When such errors occur, P1 phage transduction(Table 1) can be performed to recover the strain of inter-est, as the region of interest can be specifically transducedinto a clean wild type strain following recombineering[25–31]. However, P1 phage transduction comes with itsown challenges, such as the potential contamination oftemperate phages in the phage stock that can lysogenizeas a large plasmid in the created strain. Hence, appropri-ate validation of the chromosomally engineered strain re-mains a critical step in the strain creation process.Here, we describe in detail a number of general
methods for the validation of strains with altered chro-mosomes, and accompany this description with experi-mental results. We note that several of the techniques
described here are individually well known to the scien-tific community; however, frequently only the morestandard verification procedures for chromosome engin-eering, PCR and DNA sequence analysis, are typicallyreported. Grouping together the description of thesetechniques, we bring to the increased attention of re-searchers the most common defects that can arise duringstrain creation, together with the appropriate methods toverify them. In doing so, we hope to make these tech-niques more readily accessible to a wider community, fa-cilitating access to them by new researchers and/or thoseengaged in cross-disciplinary study. We have organizedour description of these essential validation methods alongthe lines of the irregularities that may occur: (i) non-specific insertions in the chromosome; (ii) the contamin-ation of temperate P1 phage in the engineered E. colistrains; and (iii) defects in phenotypes such as cell growthand morphology. The latter physiological aspect must betaken into account if the results obtained from an engi-neered E. coli strain are to be generalized to wild type E.coli. Within each of these categories, we illustrate thedefects that can arise from errors in chromosome engin-eering and describe various methods to detect them, usingas examples the creation of two E.coli AB1157 strains:
Tiruvadi Krishnan et al. Journal of Biological Engineering (2015) 9:11 Page 3 of 14
non-motile ΔmotAB for use in live-cell fluorescencemicroscopy [32] and pBad-DnaG in which an inducibleprimase gene is inserted into the non-essential galKchromosomal locus.
Results and discussionVerification of an engineered sequence in thechromosomePCR and DNA sequence analysis are the techniques thatare widely performed and reported to verify whether achromosome engineering technique has successfullymodified the chromosomal DNA sequence. We per-formed these well-known techniques as a first pass inthe validation process of strains created via λ-Red re-combination. Specifically, we performed λ-Red recom-bination to knock out the genes expressing the flagellarmotor proteins (ΔmotAB) in the E. coli AB1157 strain(Methods section IA). The targeted gene was replacedwith the chloramphenicol resistance gene (CmR), whichwas used as a selection marker to isolate the successfullyengineered colonies. To verify whether the insert (FRT-CmR-FRT) was located at the intended site, we designedprimers that flank the region of interest (Fig. 1a, Table 2).The positive results of a PCR reaction performed on the16 selected colonies using flanking primers indicatedthat the motAB genes in the chromosome were replacedwith the CmR gene (Fig. 1b). DNA sequence analysiswas performed to verify the recombineered region of thechromosome (Methods section IIA). The quality of se-quencing results also provides insights on the integratedDNA sequence in chromosome. For example, if theDNA sequence results show a double signal (i.e. signalsfor two bases at the same position), it indicates sequenceheterogeneity of the integrated DNA amongst the cellsof a colony [33]. In our experiments, the DNA sequenceand its alignment with the template sequence revealedthat the motAB genes were successfully knocked outwithout sequence errors in 9 out of 16 colonies (Table 3).A representative DNA sequencing result of the Δmo-tAB10 strain at the sites of integration and the corre-sponding alignment with the expected template DNAsequence are shown (Fig. 1c).Multiple copies of the insert sequence (CmR) could
have recombined elsewhere in addition to the intendedsite on the chromosome, and such extraneous insertionscan be detected using Southern blotting (Methods sec-tion IIB) [22, 24, 34]. We performed this technique onnine ΔmotAB strains and AB1157 strain as a negativecontrol, all of which were initially verified by PCR andDNA sequence analysis. For this specific experiment, thechromosomal DNA samples isolated from the strainswere first digested with two high fidelity restriction en-zymes: EcoRI-HF and BamHI-HF, selected based on thecriteria detailed in Methods section IIB. The digested
DNA fragments were separated via agarose gel electro-phoresis and were then transferred to a blotting mem-brane to probe for the CmR gene. The DNA sequencethat serves as a probe was obtained by PCR-based amp-lification of a 650 bp fragment obtained from the CmRgene of template plasmid pKD3 (Table 2, Fig. 1d). Thissingle-stranded probe DNA was labelled directly withthermo-stable alkaline phosphatase enzyme. Followinghybridization on the blotting membrane, this enzymecatalyzes a chemi-luminescence reaction, thereby allow-ing target DNA fragments complementary to the probeto be detected on a CCD detector. Using this approach,we observed that in two of the nine strains (ΔmotAB11and ΔmotAB14) the CmR gene had recombined not onlyat the intended region, but also at another non-essentialunknown region of the chromosome.A comparison of the blotting results for ΔmotAB10
strain with single intended CmR insertion and Δmo-tAB14 strain with extraneous insertion is shown (Fig. 1e).We also verified that the ΔmotAB14 strain showedincreased chloramphenicol tolerance compared to theΔmotAB10 strain as a result of this additional insertion.To do so, both strains were grown under constant shak-ing at 37 °C and 350 rpm in 96 well plates containing LBmedia with different concentrations of chloramphenicol,and the optical density was measured at regular inter-vals. While no growth was observed for the ΔmotAB10strain in LB medium including an increased concentra-tion of chloramphenicol (51 μg/mL compared to a nor-mal dosage of 34 μg/mL), the growth of ΔmotAB14strain remained unaffected (Fig. 1f ). These results dem-onstrate that extraneous mutations may occur when per-forming recombineering techniques [24], supporting theneed for strain verification steps like Southern blot ana-lysis in addition to the standard methods of PCR andDNA sequence analysis. The properly verified Δmo-tAB10 strain generated in these experiments will be re-ferred as ΔmotAB in what follows.
Detection of temperate phage contamination in a phagelysate or a transduced strainIn a phage-transduced strain, temperate P1 bacteriophagecan lysogenize as a large plasmid and can replicate forgenerations along with chromosome of the strain. Todemonstrate detection techniques for this phenomenon,we first performed a sample P1 phage transduction experi-ment. In this experiment, we employed a donor strain inwhich the β-clamp gene (dnaN) is fused with the gene fora yellow fluorescent protein adjacent to a kanamycinmarker (kanR), as reported in a recent study on DNA rep-lication (Ypet-DnaN) [5]. Transduction of such a DNA se-quence into the non-motile ΔmotAB strain can provide ageneral approach for live cell imaging studies, whose focuson the visualization of internal cellular dynamics benefits
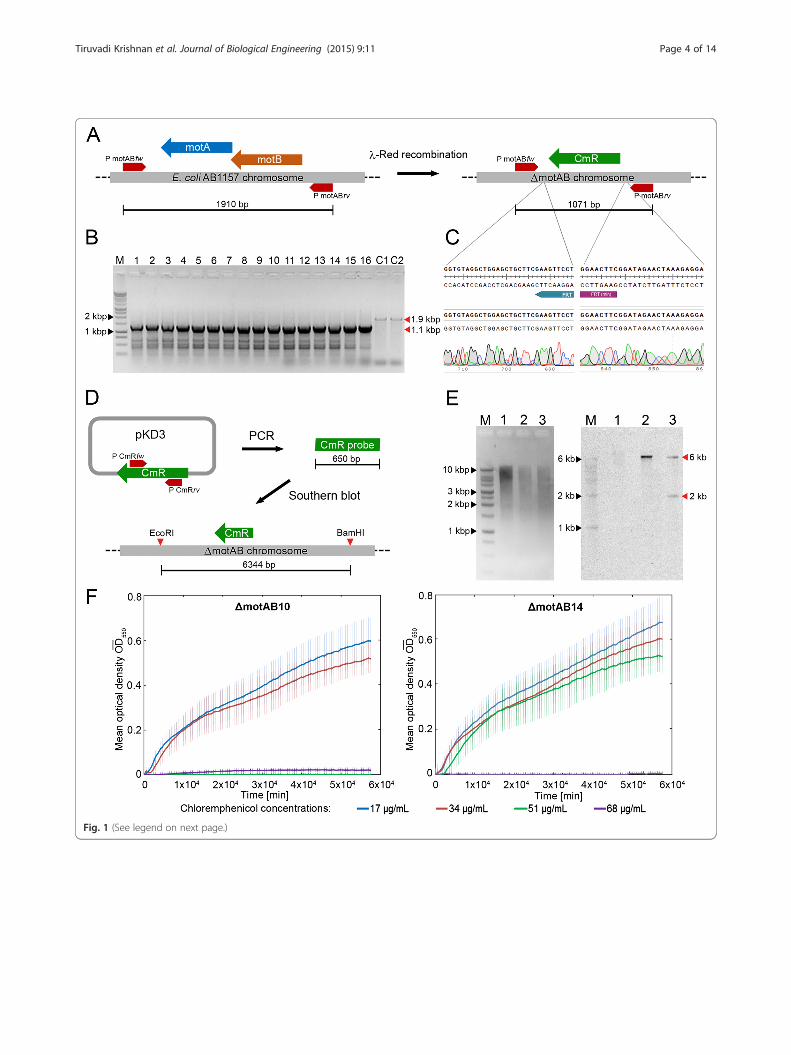
Fig. 1 (See legend on next page.)
Tiruvadi Krishnan et al. Journal of Biological Engineering (2015) 9:11 Page 4 of 14

(See figure on previous page.)Fig. 1 Verification of an engineered sequence in the chromosome. a The scheme depicts the changes at the recombineering site to create themotAB gene knockout strain (ΔmotAB) using a chloramphenicol resistance gene (CmR). The positions of the flanking primers for the motABregion (PmotABfw and PmotABrv) are marked, and the corresponding product lengths from PCR are indicated at the bottom. b PCR results of thecolonies obtained through recombineering. In lane M, 10 μL of DNA ladder was loaded. In lanes 1–16, 10 μL of PCR products from selected,individual ΔmotAB colonies were loaded (ΔmotAB1 to ΔmotAB16). The PCR products of the control AB1157 strain were added in wells C1 and C2.PCR products of the intended sizes are visible for all 16 selected colonies (~1.1 kbp marked with red arrow) as well as the AB1157 colonies(~1.9 kbp). c A representative DNA sequencing result of the ΔmotAB10 strain at the sites of integration and the corresponding alignment withthe expected template DNA sequence are shown. d The important steps of making the Southern blot probes are illustrated. A 650 bp PCRproduct is amplified from the template plasmid pKD3 and is then labelled with alkaline phosphatase to probe the CmR region (expected size:6 kbp). e The ethidium bromide stained gel containing the DNA ladder (lane M), the restriction-digested AB1157 genome (lane 1), restriction-digested genomes of two ΔmotAB colonies (lane 2: ΔmotAB10 and lane 3: ΔmotAB14 which were verified by PCR and DNA sequencing). TheSouthern blot results show that the AB1157 sample in lane 1 has no insert, as expected; lane 2 with ΔmotAB10 has one band (6 kbp) at theright fragment size showing that the integration was successful at the predicted site; lane 3 with ΔmotAB14 has two bands (6 kbp and 2 kbp).f The growth of ΔmotAB10 and ΔmotAB14 strains in 96 well-plate reader containing LB medium with various concentrations of chloramphenicol(17 μg/mL to 68 μg/mL). The results show that ΔmotAB14 strain containing the extraneous insertion grew at a higher concentration ofchloramphenicol (51 μg/mL) than the normal concentration (34 μg/mL), while the ΔmotAB10 did not grow at 51 μg/mL of chloramphenicol
Tiruvadi Krishnan et al. Journal of Biological Engineering (2015) 9:11 Page 5 of 14
from the use of immobilized cells [32]. As a proof-of-principle for our validation techniques, however, weemployed E. coli AB1157 strain as the recipient strain.Prior to phage transduction in E. coli, P1 lysate stock
should be tested to determine both the infectivity of theP1 phages in the stock as well as the sensitivity of the E.coli strain used for transduction. To visualize plaque for-mation and determine the infection titer value of the P1stock, we performed a spot agar assay [25, 31]. In thisassay, different dilutions of P1 lysate stock are spottedonto a lawn of cells grown on a soft LB agar (0.75 %).The titer values are determined in terms of plaque form-ing units per mL (pfu mL−1). We performed a spot agarassay on the E. coli AB1157 strain (Methods section IIC)and, by counting the plaques formed during the assay,determined the titer of the tested P1 lysate to be ~7 ×10⁹ pfu mL−1 (Fig. 2a). The observed titer value wasfound to be in the optimal range for successful transduc-tion (109 to 1010 pfu mL−1) [25]. Phage transduction wasperformed using the characterized lysate on Ypet-DnaNas the donor strain and AB1157 as the recipient strain(Methods section IB).One must carefully ensure that phage-transduced cells
do not harbor temperate phages, which can result forinstance from the use of a P1 lysate contaminated withtemperate phages. This phenomenon can yield undesir-able results, such as slow growth or abnormal physiology,in the created strains [25]. Cells carrying temperate P1
Table 2 Primer names and sequences used
Primer name Primer sequence
PmotABfw 5′- GCTGAAGCCAAAAGTTCCTG-3′
PmotABrv 5′- TGCCTGCAGCTTATGTCAAC-3′
PcmRfw 5′- ATCACAAACGGCATGATGAA-3′
PcmRrv 5′- TCACTACCGGGCGTATTTTT-3′
PgalKfw 5′- TCCATCAGCGTGACTACCATC-3′
PgalKrv 5′- CAGAACAGGCAGCAGAGCGT-3′
phage DNA as a large plasmid are also prevented fromfurther P1 phage infection. This principle is used in cross-streak agar assays to detect the presence of temperatephages in the sample. In this technique, the colonies to betested are streaked across a ‘P1 lysate layer’ on a LB agarplate, and the plate is incubated. If colony growth is notobserved on the streak beyond the lysate layer, then itconfirms the absence of temperate P1 phages from thesample. However, if growth is observed beyond the lysatelayer, this indicates either the presence of temperate P1phages or immunity of the strain to P1 phage infection(Fig. 2b) [25]. We used the cross-streak agar assay to testthe colonies obtained from the phage transduction experi-ment as well as control strains (Methods section IID). Weobserved that 14 out of the 18 tested colonies from thephage transduction experiment grew across the P1 lysatestreak, thereby demonstrating the presence of temperatebacteriophages in these transduced colonies (Fig. 2c). Theremaining 4 colonies that were verified to be devoid oftemperate phages can be used for further experiments.The best practice to avoid contamination by temperate
bacteriophages is to employ a verified virulent P1 lysatein P1 phage transduction experiments. To facilitate thisverification of the P1 lysate, we have developed a rapid,easily applicable assay to detect the presence of temper-ate phages in the P1 lysate or in the employed strains.This assay is derived from Evans Blue-Uranine (EBU)plate assays, which are commonly used to verify pseudo-lysogeny in P22 phage transduction experiments ofSalmonella strains [35]. We demonstrate here its firstuse in P1 phage transduction experiments using E. colicells. When temperate phages are present in cells, a col-ony formed from these cells will have a pH that differsfrom that of uninfected cells as a result of pH loweringthrough the lysis of pseudo-lysogenic cells [36]. Thisproperty has been exploited in the EBU plate assay todirectly visualize colonies containing Evans blue stainedpseudo-lysogenic cells (Fig. 2d).

Table 3 Summary of DNA sequence analysis results for variousΔmotAB colonies
Colony id Summary of DNA sequence analysis results
ΔmotAB1 Positive (Good signal at both the integration sitesand insert)
ΔmotAB2 Positive (Good signal at both the integration sitesand insert)
ΔmotAB3 Negative (Double signal at the end)
ΔmotAB4 Positive (Good signal at both the integration sitesand insert)
ΔmotAB5 Positive (Good signal at both the integration sitesand insert)
ΔmotAB6 Negative (Low signal)
ΔmotAB7 Negative (Double signal at the end)
ΔmotAB8 Negative (Double signal at the beginning)
ΔmotAB9 Negative (Low signal)
ΔmotAB10 Positive (Good signal at both the integration sitesand insert)
ΔmotAB11 Positive (Good signal at both the integration sitesand insert)
ΔmotAB12 Negative (Low signal with broad peaks)
ΔmotAB13 Negative (Low signal)
ΔmotAB14 Positive (Good signal at both the integration sitesand insert)
ΔmotAB15 Positive (Good signal at both the integration sitesand insert)
ΔmotAB16 Positive (Good signal at both the integration sitesand insert)
Tiruvadi Krishnan et al. Journal of Biological Engineering (2015) 9:11 Page 6 of 14
The temperate phage-infected cells verified by thecross-streak agar experiment were tested using the EBUplate assay (Methods section IIE): they exhibited exclu-sively dark green colonies (Fig. 2e), which we associatewith infection by temperate phages that results in achange in cellular pH [36]. Conversely, the cells verifiedto be free of phages displayed exclusively pale greencolonies (Fig. 2f ). To demonstrate that even minute con-tamination of temperate phages in P1 lysate could be de-tected, we mixed the contaminated lysate with a verifiedvirulent P1 stock of the Ypet-DnaN strain at a ratio of1:100. We performed a P1 phage transduction experi-ment as described above, and inspected 20 randomcolonies using EBU plate assay. The results showed that3 of the inspected 20 EBU plates contain few colonieswhich are dark green in color, whereas neighboring paleyellowish green-colored colonies are free of phages(Fig. 2g), confirming the detectability of low-level tem-perate phage contaminants in P1 lysate. We find thatthe EBU plate assay is more convenient and reliable thanthe cross-streak agar assay for the detection of temper-ate phage contamination in transduced colonies and P1lysates, and the phage-free colonies can be used for fur-ther research.
Evaluation of E. coli strains based on cellular growth ormorphology characteristicsBacterial growth curve analysis provides an overview ofthe growth behavior of the chromosomally engineered E.coli strains. A typical bacterial growth curve starts with alag phase as the bacteria adapt to the fresh growthmedium, followed by a log phase in which growth is ex-ponential. The final phase of the growth curve displaysstationary growth as a result of nutrient scarcity, afterwhich cells eventually die (Fig. 3a) [37]. Two importantparameters that can be determined using the techniqueof growth curve analysis are the log-phase growth rate(μ) and the duration of lag phase (τl) [38]. The log phasedoubling time (generation time, τd) is calculated from μ.If growth defects are introduced during the strain cre-ation process, they can be detected by comparing thegeneration times of the parental strain with those of thecreated strain. The literature suggests numerous modelsand tools with which to perform this analysis [37, 38].As an example, we have performed growth curvevalidation for the AB1157 and ΔmotAB strains (Fig. 3a,Methods section IIF). The critical step is to determinewhich time points of the growth curve fall in the logphase; fortunately, this is easily achieved by determiningthe linear region of the semi-log plot of the same curve(Fig. 3b). By fitting the log phase portion of the curvewith an exponential function, we calculated the growthrates for each sample (Fig.3c). From the growth rates,the mean generation times with standard deviation (SD)for the AB1157 and ΔmotAB were found to be 39.2 ±2.1 min and 38.7 ± 1.9 min, respectively. To determinethe statistical significance of this difference, we employedt-test statistics for two independent sample means [39].From the observed p-value of 0.68 (Table 4), we concludewith 95 % confidence intervals that no significant differ-ence in generation times can be attributed to the motABdeletion genotype.Cell morphology can be examined using numerous
methods including flow cytometry [40], atomic force mi-croscopy [41], among others, and this essential pheno-type can reveal the overall fitness of the chromosomallymodified strain. Here we describe an approach that em-ploys phase contrast microscopy and automated imageanalysis software MicrobeTracker (Methods section IIG)[42]. Using this open-source software, numerous indica-tors of cellular physiology such as cell volume and celllength can be determined simultaneously in an auto-mated fashion from phase contrast images of cells(Fig. 3d). To illustrate this approach, we acquired imagesof AB1157 and ΔmotAB cells grown in LB medium at37 °C, and for each strain we analyzed approximately350 cells. The mean cell volume (with SD) of AB1157was found to be 5.5 ± 1.8 μm3 while that of ΔmotAB was5.3 ± 1.6 μm3. In the same analysis, the mean cell length
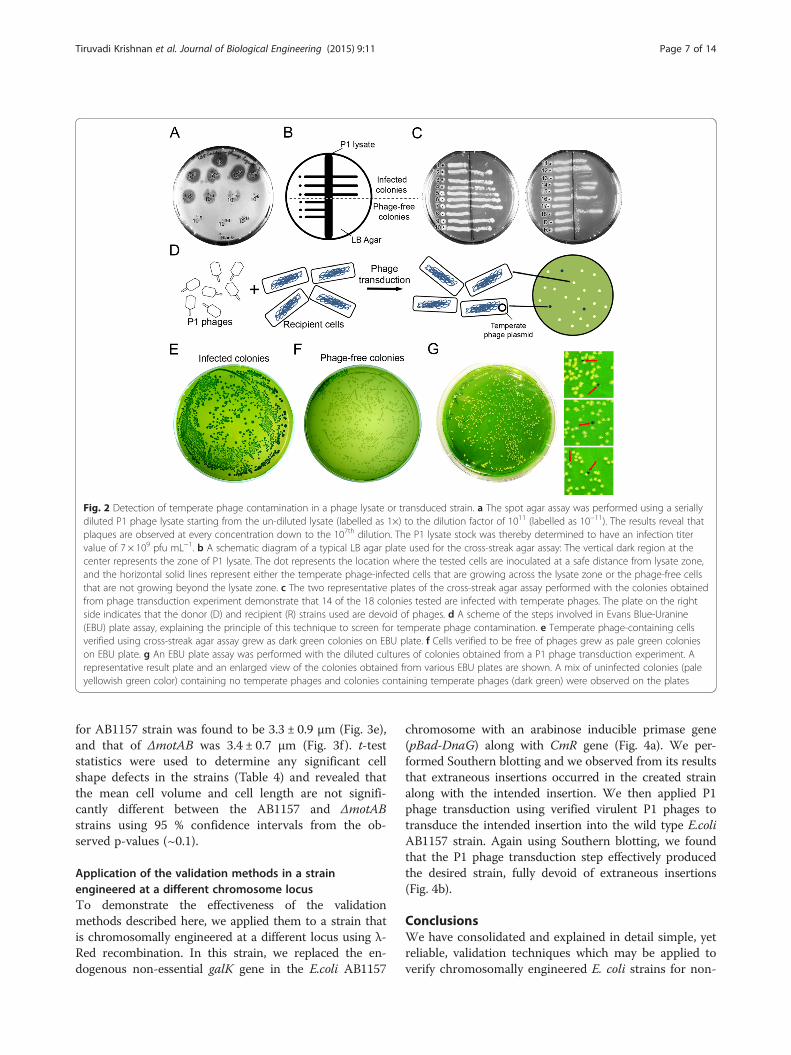
Fig. 2 Detection of temperate phage contamination in a phage lysate or transduced strain. a The spot agar assay was performed using a seriallydiluted P1 phage lysate starting from the un-diluted lysate (labelled as 1×) to the dilution factor of 1011 (labelled as 10−11). The results reveal thatplaques are observed at every concentration down to the 107th dilution. The P1 lysate stock was thereby determined to have an infection titervalue of 7 × 10⁹ pfu mL−1. b A schematic diagram of a typical LB agar plate used for the cross-streak agar assay: The vertical dark region at thecenter represents the zone of P1 lysate. The dot represents the location where the tested cells are inoculated at a safe distance from lysate zone,and the horizontal solid lines represent either the temperate phage-infected cells that are growing across the lysate zone or the phage-free cellsthat are not growing beyond the lysate zone. c The two representative plates of the cross-streak agar assay performed with the colonies obtainedfrom phage transduction experiment demonstrate that 14 of the 18 colonies tested are infected with temperate phages. The plate on the rightside indicates that the donor (D) and recipient (R) strains used are devoid of phages. d A scheme of the steps involved in Evans Blue-Uranine(EBU) plate assay, explaining the principle of this technique to screen for temperate phage contamination. e Temperate phage-containing cellsverified using cross-streak agar assay grew as dark green colonies on EBU plate. f Cells verified to be free of phages grew as pale green colonieson EBU plate. g An EBU plate assay was performed with the diluted cultures of colonies obtained from a P1 phage transduction experiment. Arepresentative result plate and an enlarged view of the colonies obtained from various EBU plates are shown. A mix of uninfected colonies (paleyellowish green color) containing no temperate phages and colonies containing temperate phages (dark green) were observed on the plates
Tiruvadi Krishnan et al. Journal of Biological Engineering (2015) 9:11 Page 7 of 14
for AB1157 strain was found to be 3.3 ± 0.9 μm (Fig. 3e),and that of ΔmotAB was 3.4 ± 0.7 μm (Fig. 3f ). t-teststatistics were used to determine any significant cellshape defects in the strains (Table 4) and revealed thatthe mean cell volume and cell length are not signifi-cantly different between the AB1157 and ΔmotABstrains using 95 % confidence intervals from the ob-served p-values (~0.1).
Application of the validation methods in a strainengineered at a different chromosome locusTo demonstrate the effectiveness of the validationmethods described here, we applied them to a strain thatis chromosomally engineered at a different locus using λ-Red recombination. In this strain, we replaced the en-dogenous non-essential galK gene in the E.coli AB1157
chromosome with an arabinose inducible primase gene(pBad-DnaG) along with CmR gene (Fig. 4a). We per-formed Southern blotting and we observed from its resultsthat extraneous insertions occurred in the created strainalong with the intended insertion. We then applied P1phage transduction using verified virulent P1 phages totransduce the intended insertion into the wild type E.coliAB1157 strain. Again using Southern blotting, we foundthat the P1 phage transduction step effectively producedthe desired strain, fully devoid of extraneous insertions(Fig. 4b).
ConclusionsWe have consolidated and explained in detail simple, yetreliable, validation techniques which may be applied toverify chromosomally engineered E. coli strains for non-

Fig. 3 Evaluation of E. coli strains based on cellular growth or morphology characteristics. a Growth curves of the AB1157 (black) and recombineeredΔmotAB cells (red) in shake flasks containing LB medium at 37 °C and 250 rpm. b A simple method using semi-log plot to find the log phase of thegrowth curve for AB1157 (black) and ΔmotAB (red) strains. The linear region of the semilog plot is the log phase of the growth curve. c The exponentialfitting of the selected log phase of the growth curve for AB1157 (black) and ΔmotAB (red) strains. From the fit (dotted lines), the growth rates (μ)are determined as 1.11 h−1 and 1.13 h−1 for one sample of AB1157 and ΔmotAB strains repectively. d A sample phase contrast image of AB1157 cellswhich were grown in LB medium at 37 °C and 250 rpm is shown. Such images were analyzed by MicrobeTracker software to calculate precisely thecell length and volume for each cell. e & f The data of cell length and cell volume of ~350 cells for each strain are plotted using a Box and Whiskersplot. The line within the box corresponds to the median value, the borders show the upper and lower quartiles (75 % and 25 %), and the whiskersrepresent the maximum and minimum values
Tiruvadi Krishnan et al. Journal of Biological Engineering (2015) 9:11 Page 8 of 14
specific insertions in the chromosome, temperate phagecontamination and general phenotype defects in growthand cell-shape. We have described the aspects of strainverification that common approaches such as PCR andDNA sequence analysis do not report on, such as thepresence of extraneous insertions verified by Southernblot analysis after recombineering. Additionally, we havealso adapted and described in detail the EBU plate assayfor the validation of E. coli strains created by the com-monly used approach for chromosomal insertion, P1phage transduction. In comparison to the cross-streakagar assay, we find the EBU plate assay to be more con-venient and reliable. The validation methods discussedhere are of widespread utility and can be applied to anychromosome engineering technique. A summary of thesuggested workflow for the various validation steps that
Table 4 “t-test” statistics for two independent samples of AB1157 an
Parameter Mean Sta
Sample AB1157 ΔmotAB AB
Generation time [min] 39.2 38.7 2.1
Cell volume [μm3] 5.5 5.3 1.8
Cell length [μm] 3.3 3.4 0.9
should be performed prior to using an E.coli strain forfurther experiments is shown in Fig. 4c.
MethodsAll the chemicals and biological reagents used in thisstudy were ordered from Life Technologies (Europe).The E. coli strains used in this research are the AB1157strain [43] and its derivatives. Optical density measure-ments were performed using the cell density meterUltraspec 10™ from GE Healthcare Europe GmBH (TheNetherlands). For each of the techniques described inthe main text, brief and specific descriptions are pro-vided below, together with a detailed, step-wise protocol.Our adaptations or improvements to standardized pro-tocols are indicated in italics.
d ΔmotAB strains’ generation time, cell volume and cell length
ndard deviation (σMean) t-value p-value
1157 ΔmotAB
1.9 0.43 0.68
1.6 1.55 0.12
0.7 −1.64 0.1

Fig. 4 Application of the validation methods in a strain engineered at a different chromosome locus. a The scheme depicts the replacementof the endogenous non-essential galK gene with an arabinose inducible primase gene (pBad-DnaG) along with a CmR gene through λ-Redrecombination. The positions of the flanking primers for the galK gene (PgalKfw and PgalKrv) are marked, and the corresponding product lengthsfrom PCR are indicated, along with the probed region in chromosome and the expected band size from Southern blot analysis. b The Southernblot results for the different experiments. Lane 1: the AB1157 sample in lane 1 has no insert, as expected. Lane 2: the pBad-DnaG strain obtainedthrough recombineering has multiple bands (mainly at ~9 kbp, 7 kbp, 6.5 kbp, and 2.5 kbp). Lane 3: the pBad-DnaG strain after P1 phagetransduction of the intended locus into the wild type AB1157 strain displays one band (~9 kbp) at the right fragment size, showing that theextraneous insertions can be removed in the final strain using this approach. c A flow diagram summarizing the sequence of the variousvalidation techniques that should be performed prior to subsequent usage of the chromosomally engineered E.coli strain
Tiruvadi Krishnan et al. Journal of Biological Engineering (2015) 9:11 Page 9 of 14
Strain creation methodsIn this study we performed λ-Red recombination [17]and P1 phage transduction [31] for the strain creationusing the following protocols.
λ-Red recombination (or recombineering)This protocol is adapted from the literature [17, 24].
1. Perform PCR using a high fidelity polymerase (e.g.Phusion polymerase from New England Biolabs® Inc)from a linear or linearized DNA template containingan antibiotic resistance gene (e.g. chloramphenicolresistance (CmR)) by specially designed primers(~70 bp) for generating homologous regions atthe ends.
2. Gel-purify the PCR product.3. Transform a competent strain of interest with a
temperature sensitive plasmid coding for λ phage’s
Red recombinase proteins (e.g. pKD46 [17]) asdescribed [44] and grow the cells overnight on aagar plate at 30 °C in the presence of thecorresponding antibiotic.
4. Pick a colony from this plate and grow the cellsovernight in 5 mL LB medium containing respectiveantibiotics at 30 °C, while shaking at 250 rpm.
5. Prepare three samples of 1.4 mL LB medium withantibiotics, 50 μL of the overnight culture of cellscontaining the pKD46 plasmid, 0.2 % arabinose (orappropriate inducer used) along with one samplewithout arabinose in separate microfuge tubes.
6. Incubate the cultures for 1.5 to 2 h at 37 °C, shakingat 750 rpm, with the lids punctured.
7. Centrifuge the samples for 30 s at 12,000× g.8. Discard the supernatant, and place the samples on ice.9. Re-suspend the pellet with 1 mL chilled and sterile
double distilled water.
Tiruvadi Krishnan et al. Journal of Biological Engineering (2015) 9:11 Page 10 of 14
10. Repeat the centrifugation and re-suspend the pelletagain in double distilled water 3 times more.
11. Centrifuge the samples for 30 s at 12,000× g, andremove the supernatant until ~50 μL is left inthe tubes.
12. Re-suspend the pellet in remaining volume, andkeep it on ice.
13. Add 1–3 μg of purified PCR product with a volumenot more than 5 μL from step 2 to the sampleson ice.
14. Include the following controls: a plasmid with sameantibiotic selection marker as a positive control andsterile water as negative control.
15. Pipette the entire volume from a sample to anelectroporation cuvette, and electroporate the cellsat 1250 Volts using an electroporator (Eppendorf®).
16. Re-suspend the cells in the cuvette with 1 mL ofSOC medium by pipetting up and down, andtransfer them to a new sterile microfuge tube.
17. Incubate the samples in lid-punctured microfugetubes for 70 min at 37 °C while shaking at 750 rpm,in order for the recombination to occur.
18. Pour LB agar plates containing an appropriateconcentration of the selection antibiotic. Do notadd the antibiotics required for the temperaturesensitive plasmid since the plasmid will be lostduring the culture.
19. Centrifuge the samples at 12,000× g for 30 s, andremove 900 μL of the supernatant.
20. Re-suspend the cells in remaining volume, andplate them onto LB agar plates.
21. Incubate the plates overnight at 37 °C.22. Re-streak 10 colonies on a plate with the selection
antibiotic, and incubate the plate overnight at 37 °C.
P1 phage transductionThe protocol of P1 phage transduction that we adaptedfrom the literature is explained here [31]. The protocolconsists of two steps: (i) P1 lysate preparation fromdonor strain and (ii) Phage transduction to recipientstrain. However, the infectivity of the source P1 lysatestock should be determined first by using spot agar assay(Methods section IIC).
i. P1 Lysate preparation
1. Inoculate the recipient strain and the donorstrain from the LB agar plates (e.g. from Methodssection IA step 22) in 5 mL of LB medium withrespective antibiotics, and grow the cells overnightat 37 °C with shaking at 250 rpm.
2. Dilute in duplicate 0.5 mL of the overnight donorculture into 4.5 mL of LB medium containing60 μL of 1 M CaCl2 and 120 μL of 1 M MgSO4.
3. Incubate the cultures at 37 °C for 45 min.
4. Add 100 μL of the P1 phage lysate stock that hasbeen prepared by infecting the wild type E.colistrain. The volume of P1 lysate used may varydepending on its infectivity (For example, if theinfectivity value of P1 lysate is 109 pfu mL−1, thenuse 100 μL lysate).
5. Continue the incubation until the culture is lysedor cell clumps are visible (usually around 3 to4 h). The control culture without phages shouldshow normal growth.
6. Add 4 to 5 drops of chloroform to the lysedculture, and stir the mixture well using avortex mixer.
7. After leaving the mixture to clarify for 5 min,transfer the upper liquid layer to a new steriletube, and centrifuge the liquid for 20 min at4200× g, 4 °C.
8. Pass the upper lysate layer further through a0.45 μm filter to remove any viable donor cells.
9. Store the P1 lysate devoid of chloroform at 4 °Cfor future use.
ii. Transduction1. Dilute 100 μL of the overnight recipient culture
in 900 μL LB medium containing 75 mM CaCl2and 150 mM MgSO4 in 5 microfuge tubes.
2. Add 5 μL, 50 μL, 100 μL or 200 μL of P1 lysateboth to the 4 tubes and, as a control, to the onetube without lysate. The volumes of P1 lysate usedmay vary depending on its infectivity. (Forexample, if the infectivity value of P1 lysate is 109
pfu mL−1, then use the volumes mentioned here).3. Incubate the cultures at 37 °C while shaking at
250 rpm for 30 min. Infection of recipient cellsoccurs in this step.
4. Centrifuge the cells at 12,000× g for 3 min, anddiscard the supernatant.
5. Re-suspend the pellet in 1 mL of LB mediumcontaining 20 mM sodium citrate (pH 5.5) toreduce the infectivity of the adsorbed P1 phagesby chelating the divalent ions. The transductionoccurs during this step.
6. Incubate the cells for 1.5 to 2 h at 37 °C withsufficient aeration and shaking at 250 rpm.
7. Centrifuge the cells and discard the supernatant.8. Repeat step 6 and 7 twice to remove the phages as
much as possible.9. Re-suspend the pellet in 100 μL LB medium
containing 20 mM sodium citrate (pH5.5).10. Plate the cultures onto LB agar plates containing
20 mM sodium citrate with respectiveantibiotics for selection.
11. Re-streak ~16 colonies onto LB agar platescontaining 20 mM sodium citrate and selectionantibiotics.

Tiruvadi Krishnan et al. Journal of Biological Engineering (2015) 9:11 Page 11 of 14
Strain verification methodsHere we describe the step-by-step methodology of thegeneral validation techniques for chromosomal engi-neered E. coli strains.
PCR and DNA sequencingFor the high throughput verification of the individualcolonies that are obtained from the strain creationmethods described above, a simple analytical PCR andDNA sequencing are the widely used verification steps.The accompanying steps are described below.
1. Design primers for PCR in such a way that thesequence flanks the region of interest in thechromosome, and the primer binding sites are notfarther than 100 bases from the recombination site.
2. Re-suspend each colony to be verified by PCR in50 μL of sterile water, and streak 10 μL on LB agarplates containing antibiotics.
3. Extract the DNA from the remaining cells into waterby boiling the samples for 5 min and centrifugingthem at 12,000× g for 1 min.
4. Perform a PCR reaction on this DNA using theprimers designed in step 1.
5. Verify the length of the PCR products using agarosegel electrophoresis, and select colonies with properinsert length for DNA sequence analysis of thecorresponding PCR product using the same flankingprimers. If necessary, use specific internal sequencingprimers to verify the correct insertion in thechromosome.
6. Compare the DNA sequences by aligning it with thecorresponding theoretical sequences to check forany point mutation or deletion introduced duringthe strain creation process.
Southern blottingThe copy number of the recombined DNA in thechromosome can be easily verified by using Southernblotting [34]. In this study, we used the AlkPhos®Direct labelling and detection system manufacturedby Amersham™ (GE healthcare Europe GmbH, TheNetherlands) because it is specially developed and welloptimized for blotting experiments. DNA extraction wasperformed using Qiagen™ DNA isolation kit. We used highfidelity restriction enzymes manufactured by New EnglandBiolabs® Inc.
1. Extract the genomic DNA from the strains to beverified. Include the genomic DNA wild type strainas control.
2. Select two or three restriction enzymes usingfollowing criteria. The restriction sites must flank theregion of interest and should not be contained within
the region itself. Since it is difficult to resolve DNAfragments larger than 10 kb through gel electrophoresisand to achieve the best resolution, it is a good practiceto make sure the size difference between the restrictedfragment and the region of interest (usually < 2 kb)does not exceed 7 kb.
3. Perform the restriction digestion of ~10 μg genomicDNA samples overnight preferably using the highfidelity restriction enzymes to avoid star activity [45].
4. Separate the digested DNA samples in a 0.8 %agarose gel by running electrophoresis overnight at aconstant current of 15 mA.
5. Depurinate the DNA fragments by incubating thegel for 15 min in 0.1 M HCl solution on a plateshaker, and wash subsequently four times withdouble distilled water.
6. Denature the fragments in denaturing buffer (1.5 MNaCl and 0.5 M NaOH) on a plate shaker for 15 min,and wash four times with double distilled water.
7. Incubate the gel for 15 min in neutralizing buffer(1.5 M NaCl and 0.5 M Tris base, pH 7.5) whileshaking, and wash four times with doubledistilled water.
8. Transfer the DNA fragments by capillary action to apre-soaked Hybond-N+ membrane (GE Healthcare)using 20 × SSC buffer (3 M NaCl and 0.3 Mtri-sodium citrate).
9. Pre-hybridize the blot with hybridization mix(35 mL AlkPhos® Direct hybridization buffer, 1 gNaCl and 1.4 g blocking agent-GE Healthcare) for30 min at 55 °C in a rotary mixer.
10. Amplify the region of interest using specific PCRprimers from the source DNA (usually a templateplasmid or wild type chromosome). The optimal sizeof the PCR product is ~200 to 1000 bp.
11. Denature the PCR product by boiling for 5 min,chill it on ice, and label it using appropriatereporters (e.g. thermo-stable alkaline phosphatase)that can catalyze non-luminescent substrates andyield luminescent products. The labeled PCRproduct can then be used as a DNA probe.
12. Add the DNA probe to the membrane in thehybridization buffer, and hybridize the probe in arotary mixer at 55 °C overnight.
13. Wash the membrane in rotary shaker at 55 °C with100 mL wash buffer 1 for 10 min (pH: 7; 2 M Urea,0.1 % SDS, 0.15 M NaCl, 0.05 M NaH2PO4, 1 mMMgCl2, and 1 g Blocking reagent)
14. Wash the membrane twice with 100 mL washbuffer 2 (pH: 10; 3 g Tris base, 2.8 g NaCl and0.2 M MgCl2) in plate shaker at room temperaturefor 10 min.
15. Incubate the membrane, with 3 mL non-luminescentsubstrate for 5 min and dry the membrane.
Tiruvadi Krishnan et al. Journal of Biological Engineering (2015) 9:11 Page 12 of 14
16.Wrap the membrane using Saran™ wrap, and detectchemi-luminescence on the blot using appropriatedetectors. The resulting number of bands obtained isindicative for the copy number of the recombinedDNA in the chromosome.
Spot agar assayThe infectivity of the phages in a P1 lysate can be deter-mined by a spot agar assay. This method is adapted fromRef. [31].
1. Add CaCl2 to the overnight culture of the recipientstrain from the phage transduction step such thatthe final concentration is 5 mM.
2. Serially dilute the P1 lysate to the order of 10−10
using LB medium containing 75 mM CaCl2 and150 mM MgSO4. Make sure to change the pipettetips during the dilution step.
3. Mix 0.25 mL of cell culture with 2.5 mL of moltenLB top agar (0.75 %) containing 2.5 mM CaCl2.
4. Pour the mixture onto LB agar (1.5 %) platescontaining 2.5 mM CaCl2 and let it solidify.
5. Spot 10 μL of each phage stock dilution onto thelawn of cells.
6. Keep the plates upright, and after the spots are dry,incubate them at 37 °C overnight.
7. Calculate the titer value in pfu mL−1 by counting thenumber of plaques in the lowest concentration spot,then multiplying it with the order of dilution (e.g.107) and finally by the factor 100 (to account for10 μL volume used).
Cross-streak agar assayThe presence of temperate phages in phage-transducedcolonies can be tested by a cross-streak agar assay. Thismethod is adapted from Ref. [25].
1. Prepare a LB agar plate containing 2.5 mM CaCl2.2. Draw a straight line on the back of plate across the
middle and well-spaced dots on one side (Fig. 2b).3. Holding the plate in a slanting position, pour 50 μL
of phage lysate on the LB agar from one end of thestraight line.
4. Tilt the plate back to uniformly distribute the lysatearound the straight line.
5. Take a colony or liquid overnight culture to betested for temperate phages with the broad side ofthe inoculation needle.
6. Place a dot of the colony or culture at the markedlocation and leaving a few millimeters space streakthe colony or culture perpendicularly across thephage lysate.
7. Transfer the plate carefully to incubator, andincubate overnight at 37 °C.
Evans Blue-Uranine (EBU) plate assayThe phage-transduced colonies can be tested for tem-perate phage contamination and can be cured of phagesusing EBU plate assay described below. The method isadapted from Ref. [46] for E. coli strains.
1. Make agar plates from 1 L of molten LB agarcontaining 40 mL of 12.5 % K2HPO4, 1.25 mL of 1 %Evans Blue stain solution, 250 μL of 10 % uraninesolution and if necessary antibiotics.
2. Store the plates in dark at 4 °C. Since Evans Bluestain is carcinogenic the plates must be handledcarefully with gloves, and it is usually a good practiceto autoclave and dispose in the carcinogenic waste.
3. Inoculate the colonies obtained from a phagetransduction experiment in LB medium, and growthem for 3 h at 37 °C with shaking at 250 rpm.
4. Dilute the exponentially growing LB cultures 100times, and spread 50 μL of the culture uniformlyacross the EBU plates.
5. Incubate overnight at 37 °C in the dark.6. Analyze the colonies. The colonies without temperate
phages appear pale yellow in color while those withtemperate phages are colored dark green.
Growth curve analysisGrowth curve analysis of the E. coli strains can beperformed using shake flasks as described below. Inthis study, we used MS Excel and MATLAB toanalyze the data.
1. Dilute in triplicate overnight cultures of the wild typeand the strain to be verified to an OD550nm of 0.01 in50 mL fresh medium.
2. Grow the cells at 37 °C in a shaking incubator(250 rpm).
3. Use sterile disposable cuvettes and aseptic conditionsto note the OD550nm of 1 mL aliquot from eachculture sample using a cell-density meter.
4. Add back the culture aliquot to the sample after themeasurement in order to keep the culture volumeconstant.
5. Steps 3 and 4 are repeated at an interval of 15 minuntil the OD550nm is a constant value.
6. Plot the OD550nm values against time in min to get asigmoidal curve in this plot.
7. Plot the OD550nm values in logarithmic scale, theexponential phase of the growth curve can beidentified as the distinct linear part (Fig. 3b,c), andperform an exponential fit only on the OD550nm
values of this phase in the growth curve for eachsample to find the growth rate (μ) [38].
8. Calculate the generation time (τd) from μ using theformula: τd = ln (2)/μ.
Tiruvadi Krishnan et al. Journal of Biological Engineering (2015) 9:11 Page 13 of 14
9. To test the reproducibility of results, repeat theexperiment, and average the generation times for 6samples of the strain to be verified. The result canthen be compared to the average generation time ofthe wild type strain using t-test for two independentsample means [39].
Detection for cell-shape defects by microscopyPhase-contrast microscopy is a powerful technique todetermine the cell-shape characteristics of a bacterium.In this study, it was performed using a Nikon Ti™ micro-scope with a 100× objective and an Andor iXon™ Ultra897 EMCCD camera.
1. Grow the LB culture of the strain to be verified untilit reaches the exponential phase OD550nm is ~ 0.3to 0.4.
2. Centrifuge 1 mL of the culture at 12,000× g for1 min, and remove the supernatant.
3. Re-suspend in 250 μL of fresh medium, and pipette5 μL of concentrated culture on a pad of agarose(1.5 %) flattened on a microscopic slide. Let the fluidevaporate.
4. Place a sterile and clean cover-glass on top of thecells, and press gently using tweezers.
5. Analyze the cells on a phase contrast microscopeusing an objective with a magnification >60× and adigital camera.
6. For a robust analysis, acquire the images with atleast ~100 separate cells within a field of view.
7. Store the images in greyscale tiff format, and analyzethem using MicrobeTracker software to accuratelydetermine the cell shape defects [42].
8. Export the analyzed data from the software in CSVformat for further analysis e.g. t-test statistics andrepresentation of data, e.g. a Box and Whiskers plot.
Competing interestsThe authors declare that they have no competing interests.
Authors’ contributionsSTK carried out the experiments detailed in this research and drafted themanuscript; MCM aided in the conception of the study, design of microscopyexperiments, and manuscript writing; TL aided in the trouble-shooting ofexperiments; ASM provided suggestions in the conception of the study, designof P1 phage related experiments, and manuscript writing; and NHD contributedin the conception of the study, general design of experiments, and manuscriptwriting. All authors read and approved the final manuscript.
AcknowledgmentsWe thank Prof. David Sherratt for providing the AB1157 strain, beta-clamplabelled strain and P1 lysates for the experiments, Dr. Richard Janissen forhelping in the data analysis and presentation, and Nienke Blokker forcontributing to the growth curve analysis. This work was supported by theNetherlands Organisation for Scientific Research (NWO) through a Vici grantto NHD, Delft University of Technology, and the European Community’sSeventh Framework Program FP7/2007–2013 under grant agreementsn° 241548 (MitoSys).
Received: 11 February 2015 Accepted: 2 June 2015
References1. Lee EC, Yu D, Martinez de Velasco J, Tessarollo L, Swing DA, Court DL, et al.
A Highly Efficient Escherichia coli-Based Chromosome Engineering SystemAdapted for Recombinogenic Targeting and Subcloning of BAC DNA.Genomics. 2001;73(1):56–65. doi:10.1006/geno.2000.6451.
2. Blattner FR, Plunkett G, Bloch CA, Perna NT, Burland V, Riley M, et al. TheComplete Genome Sequence of Escherichia coli K-12. Science.1997;277(5331):1453–62. doi:10.1126/science.277.5331.1453.
3. Ellis HM, Yu D, DiTizio T, Court DL. High efficiency mutagenesis, repair, andengineering of chromosomal DNA using single-stranded oligonucleotides.Proceedings of the National Academy of Sciences. 2001;98(12):6742–6.doi:10.1073/pnas.121164898.
4. Boyd D, Weiss DS, Chen JC, Beckwith J. Towards Single-Copy GeneExpression Systems Making Gene Cloning Physiologically Relevant: LambdaInCh, a Simple Escherichia coli Plasmid-Chromosome Shuttle System.Journal of Bacteriology. 2000;182(3):842–7.
5. Reyes-Lamothe R, Sherratt DJ, Leake MC. Stoichiometry and Architecture ofActive DNA Replication Machinery in Escherichia coli. Science.2010;328(5977):498–501. doi:10.1126/science.1185757.
6. Reyes-Lamothe R, Possoz C, Danilova O, Sherratt DJ. IndependentPositioning and Action of Escherichia coli Replisomes in Live Cells. Cell.2008;133(1):90–102. doi:10.1016/j.cell.2008.01.044.
7. Bakshi S, Siryaporn A, Goulian M, Weisshaar JC. Superresolution imaging ofribosomes and RNA polymerase in live Escherichia coli cells. MolecularMicrobiology. 2012;85(1):21–38. doi:10.1111/j.1365-2958.2012.08081.x.
8. Kitagawa M, Ara T, Arifuzzaman M, Ioka-Nakamichi T, Inamoto E, ToyonagaH, et al. Complete set of ORF clones of Escherichia coli ASKA library (AComplete Set of E. coli K-12 ORF Archive): Unique Resources for BiologicalResearch. DNA Research. 2006;12(5):291–9. doi:10.1093/dnares/dsi012.
9. Lau IF, Filipe SR, Søballe B, Økstad O-A, Barre F-X, Sherratt DJ. Spatialand temporal organization of replicating Escherichia coli chromosomes.Molecular Microbiology. 2003;49(3):731–43. doi:10.1046/j.1365-2958.2003.03640.x.
10. Greenfield D, McEvoy AL, Shroff H, Crooks GE, Wingreen NS, Betzig E, et al.Self-Organization of the Escherichia coli Chemotaxis Network Imaged withSuper-Resolution Light Microscopy. PLoS Biol. 2009;7(6):e1000137.doi:10.1371/journal.pbio.1000137.
11. Delalez NJ, Berry RM, Armitage JP. Stoichiometry and Turnover of theBacterial Flagellar Switch Protein FliN. mBio. 2014;5(4). doi:10.1128/mBio.01216-14
12. Baba T, Ara T, Hasegawa M, Takai Y, Okumura Y, Baba M et al. Constructionof Escherichia coli K‐12 in‐frame, single‐gene knockout mutants: the Keiocollection. Molecular Systems Biology. 2006;2(1). doi:10.1038/msb4100050
13. Juhas M, Reuß D, Zhu B, Commichau FM. Bacillus subtilis and Escherichiacoli essential genes and minimal cell factories after one decade of genomeengineering. Microbiology. 2014. doi:10.1099/mic.0.079376-0.
14. Jarboe LR, Zhang X, Wang X, Moore JC, Shanmugam KT, Ingram LO.Metabolic Engineering for Production of Biorenewable Fuels and Chemicals:Contributions of Synthetic Biology. Journal of Biomedicine andBiotechnology. 2010;2010:18. doi:10.1155/2010/761042.
15. Koma D, Yamanaka H, Moriyoshi K, Ohmoto T, Sakai K. A convenientmethod for multiple insertions of desired genes into target loci on theEscherichia coli chromosome. Appl Microbiol Biotechnol. 2012;93(2):815–29.doi:10.1007/s00253-011-3735-z.
16. Maeda T, Sanchez-Torres V, Wood TK. Hydrogen production by recombinantEscherichia coli strains. Microbial Biotechnology. 2012;5(2):214–25.doi:10.1111/j.1751-7915.2011.00282.x.
17. Datsenko KA, Wanner BL. One-step inactivation of chromosomal genes inEscherichia coli K-12 using PCR products. Proceedings of the NationalAcademy of Sciences. 2000;97(12):6640–5. doi:10.1073/pnas.120163297.
18. Zhang Y, Buchholz F, Muyrers JPP, Stewart AF. A new logic for DNAengineering using recombination in Escherichia coli. Nat Genet.1998;20(2):123–8.
19. Martinez-Morales F, Borges AC, Martinez A, Shanmugam KT, Ingram LO.Chromosomal Integration of Heterologous DNA in Escherichia coli withPrecise Removal of Markers and Replicons Used during Construction.Journal of Bacteriology. 1999;181(22):7143–8.

Tiruvadi Krishnan et al. Journal of Biological Engineering (2015) 9:11 Page 14 of 14
20. Kuhlman TE, Cox EC. Site-specific chromosomal integration of largesynthetic constructs. Nucleic Acids Research. 2010;38(6):e92.doi:10.1093/nar/gkp1193.
21. Chen D, Yan Z, Cole DL, Srivatsa GS. Analysis of internal (n-1)mer deletionsequences in synthetic oligodeoxyribonucleotides by hybridization to animmobilized probe array. Nucleic Acids Research. 1999;27(2):389–95.doi:10.1093/nar/27.2.389.
22. Hobman JL, Patel MD, Hidalgo-Arroyo GA, Cariss SJL, Avison MB, Penn CW,et al. Comparative Genomic Hybridization Detects Secondary ChromosomalDeletions in Escherichia coli K-12 MG1655 Mutants and Highlights Instabilityin the flhDC Region. Journal of Bacteriology. 2007;189(24):8786–92.doi:10.1128/jb.00977-07.
23. Yamamoto N, Nakahigashi K, Nakamichi T, Yoshino M, Takai Y, Touda Y et al.Update on the Keio collection of Escherichia coli single‐gene deletionmutants. vol 1. 2009.
24. Sharan SK, Thomason LC, Kuznetsov SG, Court DL. Recombineering: ahomologous recombination-based method of genetic engineering.Nat Protocols. 2009;4(2):206–23.
25. Moore SD. Assembling New Escherichia coli Strains by Transduction UsingPhage P1. In: Williams JA, editor. Strain Engineering. Methods in MolecularBiology. New York (USA): Humana Press; 2011. p. 155–69.
26. Lennox ES. Transduction of linked genetic characters of the host bybacteriophage P1. Virology. 1955;1(2):190–206.doi:10.1016/0042-6822(55)90016-7.
27. Ikeda H, Tomizawa JI. Transducing fragments in generalized transduction byphage P1. 3. Studies with small phage particles. J Mol Biol. 1965;14(1):120–9.
28. Tyler BM, Goldberg RB. Transduction of chromosomal genes betweenenteric bacteria by bacteriophage P1. J Bacteriol. 1976;125(3):1105–11.
29. Sternberg N, Hoess R. The molecular genetics of bacteriophage P1. AnnuRev Genet. 1983;17:123–54.
30. Satta G, Debbia E, Pruzzo C, Calegari L. The peculiar behaviour of coliphageP1vir mutants on restricting hosts. Microbios. 1978;22(88):93–102.
31. Thomason LC, Costantino N, Court DL. E. coli Genome Manipulation by P1Transduction. Current Protocols in Molecular Biology. New York (USA): JohnWiley & Sons, Inc.; 2001.
32. Manson MD. Dynamic motors for bacterial flagella. Proceedings of theNational Academy of Sciences. 2010;107(25):11151–2.doi:10.1073/pnas.1006365107.
33. Sanger F, Nicklen S, Coulson AR. DNA sequencing with chain-terminatinginhibitors. Proceedings of the National Academy of Sciences. 1977;74(12):5463–7.
34. Southern EM. Detection of specific sequences among DNA fragmentsseparated by gel electrophoresis. Journal of Molecular Biology.1975;98(3):503–17. doi:10.1016/S0022-2836(75)80083-0.
35. Zinder ND, Lederberg J. Genetic exchange in Salmonella. J Bacteriol.1952;64(5):679–99.
36. Bochner BR. Curing bacterial cells of lysogenic viruses by using UCBindicator plates. Biotechniques. 1984:234-40
37. Zwietering MH, Jongenburger I, Rombouts FM, van't Riet K. Modeling of theBacterial Growth Curve. Applied and Environmental Microbiology.1990;56(6):1875–81.
38. Hall BG, Acar H, Nandipati A, Barlow M. Growth Rates Made Easy. MolecularBiology and Evolution. 2014;31(1):232–8. doi:10.1093/molbev/mst187.
39. McDonald JH. Handbook of Biological statistics. Baltimore: Sparky HousePublishing; 2008.
40. Konokhova AI, Gelash AA, Yurkin MA, Chernyshev AV, Maltsev VP.High-precision characterization of individual E. coli cell morphology byscanning flow cytometry. Cytometry Part A. 2013;83A(6):568–75.doi:10.1002/cyto.a.22294.
41. Osiro D, Bernardes Filho R, Assis OBG, Jorge LAC, Colnago LA. Measuringbacterial cells size with AFM. Brazilian Journal of Microbiology. 2012;43:341–7.
42. Sliusarenko O, Heinritz J, Emonet T, Jacobs-Wagner C. High-throughput,subpixel precision analysis of bacterial morphogenesis and intracellularspatio-temporal dynamics. Molecular Microbiology. 2011;80(3):612–27.doi:10.1111/j.1365-2958.2011.07579.x.
43. DeWitt SK, Adelberg EA. The occurrence of a genetic transposition in astrain of Escherichia coli. Genetics. 1962;47(5):577–85.
44. Woodall CA. Electroporation of E. coli. Methods in Molecular Biology. 2003.p. 55-9.
45. Kamps-Hughes N, Quimby A, Zhu Z, Johnson EA. Massively parallelcharacterization of restriction endonucleases. Nucleic Acids Research.2013;41(11):e119-e. doi:10.1093/nar/gkt257.
46. Maloy SR, Stewart VJ, Taylor RK. Genetic analysis of pathogenic bacteria.Cold Spring Harbor, NY: Cold Spring Harbor Laboratory Press; 1996.
Submit your next manuscript to BioMed Centraland take full advantage of:
• Convenient online submission
• Thorough peer review
• No space constraints or color figure charges
• Immediate publication on acceptance
• Inclusion in PubMed, CAS, Scopus and Google Scholar
• Research which is freely available for redistribution
Submit your manuscript at www.biomedcentral.com/submit


![Eschevichia coli infection - Innocua.net · 100 serotypes of E. coli can produce VTs [6]. The most frequently isolated VT-producing E. coli (VTEC) serotype, 0357:H7, and strains which](https://img.pdfslide.us/doc/110x75/5f085d667e708231d421a5cd/eschevichia-coli-infection-100-serotypes-of-e-coli-can-produce-vts-6-the-most.jpg)