Embed Size (px)
Citation preview
i
Essays on the analysis of performance and
competitive condition in the Chinese banking
industry
Yong Tan
PhD
December 2013
The thesis is submitted in partial fulfilment of the requirements for the award of
degree of Doctor of Philosophy of the University of Portsmouth

ii
Declaration
„Whilst registered as a candidate for the above degree, I have not been
registered for any other research award. The results and conclusions embodied
in this thesis are the work of the named candidate and have not been submitted
for any other academic award.‟

iii
Acknowledgements
First and foremost, I would like to express my sincere gratitude to my first PhD supervisor,
Dr. Christos Floros, for his consistent encouragement, guidance, invaluable help and support
through the period of my PhD studies.
Also, I am grateful to all members of staffs at the Department of Economics for their
recommendations and support.
Last but not least, I would like to give my deep appreciation to my parents for their consistent
patience, tolerance, care, encouragement and help.
iv
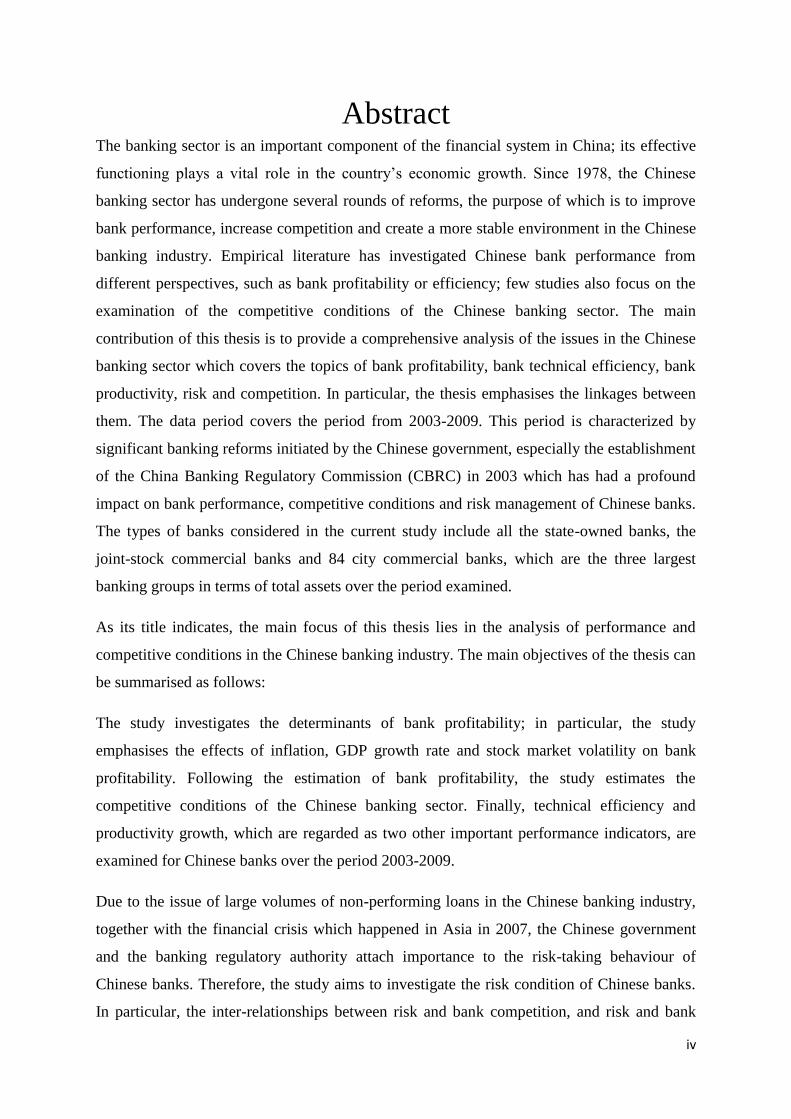
Abstract The banking sector is an important component of the financial system in China; its effective
functioning plays a vital role in the country‟s economic growth. Since 1978, the Chinese
banking sector has undergone several rounds of reforms, the purpose of which is to improve
bank performance, increase competition and create a more stable environment in the Chinese
banking industry. Empirical literature has investigated Chinese bank performance from
different perspectives, such as bank profitability or efficiency; few studies also focus on the
examination of the competitive conditions of the Chinese banking sector. The main
contribution of this thesis is to provide a comprehensive analysis of the issues in the Chinese
banking sector which covers the topics of bank profitability, bank technical efficiency, bank
productivity, risk and competition. In particular, the thesis emphasises the linkages between
them. The data period covers the period from 2003-2009. This period is characterized by
significant banking reforms initiated by the Chinese government, especially the establishment
of the China Banking Regulatory Commission (CBRC) in 2003 which has had a profound
impact on bank performance, competitive conditions and risk management of Chinese banks.
The types of banks considered in the current study include all the state-owned banks, the
joint-stock commercial banks and 84 city commercial banks, which are the three largest
banking groups in terms of total assets over the period examined.
As its title indicates, the main focus of this thesis lies in the analysis of performance and
competitive conditions in the Chinese banking industry. The main objectives of the thesis can
be summarised as follows:
The study investigates the determinants of bank profitability; in particular, the study
emphasises the effects of inflation, GDP growth rate and stock market volatility on bank
profitability. Following the estimation of bank profitability, the study estimates the
competitive conditions of the Chinese banking sector. Finally, technical efficiency and
productivity growth, which are regarded as two other important performance indicators, are
examined for Chinese banks over the period 2003-2009.
Due to the issue of large volumes of non-performing loans in the Chinese banking industry,
together with the financial crisis which happened in Asia in 2007, the Chinese government
and the banking regulatory authority attach importance to the risk-taking behaviour of
Chinese banks. Therefore, the study aims to investigate the risk condition of Chinese banks.
In particular, the inter-relationships between risk and bank competition, and risk and bank
v
performance are examined. To be more specific, the study 1) examines the effect of
competition on banks‟ risk-taking behaviour; 2) assesses the inter-relationships between bank
risk, competition and profitability; 3) investigates the inter-relationships between bank risk
and technical efficiency; and 4) evaluates the relationships between risk, capitalization and
efficiency. Since the last round of banking reform after China joined the WTO encouraged
Chinese banks to be listed on the stock exchange, the share performance is paid great
attention by bank managers; thus, this thesis tests the impacts of share return and risk on
efficiency and productivity. The inter-relationships between bank competition and bank
performance are also investigated. In particular, this study 1) evaluates the impacts of
efficiency and concentration on bank competition; 2) investigates the impacts of competition
and profitability on technical efficiency; 3) test the impacts of competition and efficiency on
bank profitability; 4) assesses the impacts of technical efficiency and risk on bank
competition.
The empirical findings suggest that inflation has a significant and positive impact on Chinese
bank profitability in terms of Return on Assets (ROA) and Net Interest Margin (NIM).
Furthermore, Chinese banks have lower profitability in relation to ROA and NIM during
periods of economic boom (higher GDP growth). In addition, the results suggest that higher
levels of stock market volatility can translate into higher profitability of Chinese banks in
terms of Return on Equity (ROE) and Excess Return on Equity (EROE). Finally, we report
that Chinese bank profitability (ROA and NIM) is significantly and positively affected by
overhead cost, banking sector development, stock market development, while it is negatively
affected by taxation. We find that Chinese banks with higher labour productivity have lower
profitability in terms of Economic Value Added (EVA).
Our results suggest that, over the examined period 2003-2009, the Chinese banking sector is
in a state of monopolistic competition as examined by Panzar-Rosse‟s H statistic. When using
the Lerner index as the competition indicator, the findings suggest that joint-stock
commercial banks have the highest level of competition over the period examined. With
regards to the efficiency of Chinese banks, the findings suggest that state-owned commercial
banks have the highest technical efficiency, followed by joint-stock commercial banks with
the city commercial banks being the least technically efficient. The results indicate further
that scale efficiency contributes more than pure technical efficiency to the overall efficiency
of Chinese banks and that Chinese banks are faced with a misallocation of inputs and outputs
in banking operations. The productivity of three types of Chinese commercial banks (state-
vi
owned, joint-stock and city commercial banks) is quite stable over the period examined; these
three types of banks show productivity growth in 2005 and 2009. The empirical results show
that, in a more highly concentrated market competition (measured by the Panzar-Rosse H
statistic) is lower. We further find that in a more highly competitive environment (measured
by the Lerner index), bank profitability is still lower. We do not find any robust relationships
between risk and profitability, or risk and competition.
Although we do not find any significant impacts of competition and efficiency on bank
profitability, our results suggest that Chinese banks with lower levels of liquidity and more
diversified activities have higher technical efficiency. Furthermore, it is found that in a more
developed but less competitive banking sector, Chinese banks are more technically efficient.
Chinese banks with higher share returns have more stable efficiency, while the stability of
efficiency and productivity in the Chinese banking sector is affected significantly by bank
size, capitalization, banking sector development, inflation and GDP growth rate. In terms of
the relationships between risk, capital and efficiency, the results suggest that the levels of
capitalization are significantly and positively related to technical and pure technical
efficiencies of Chinese banks, while Chinese banks with higher technical and pure technical
efficiencies have higher levels of capitalization. We do not find any robust relationships
between risk and technical efficiency in the Chinese banking sector; in addition, there is no
clear evidence for the impacts of competition and technical efficiency on bank profitability in
China. Finally, we report that there is a negative impact of technical efficiency on bank
competition. In other words, Chinese banks with higher technical efficiency have greater
market power.
In conclusion, this study provides a comprehensive analysis of several empirical issues in the
Chinese banking sector including bank profitability, technical efficiency, bank productivity,
competitive and risk conditions and potential linkages among them over the period 2003-
2009. The results provide important policy implications for the Chinese government: 1)
Chinese banks should increase further the capital levels in order to improve technical
efficiency; 2) Chinese bank managers should allocate the inputs and outputs in banking
operations more appropriately, thereby contributing to technical efficiency improvement; 3)
Chinese banks should provide more training and professional opportunities for staff
,especially in the areas of non-traditional activities; this leads to the improvement of technical
efficiency; 4) with a more improved risk management system, Chinese banks should be
encouraged to engage in more loan business, which precedes an increase in bank efficiency.
vii
TABLE OF CONTENTS
DECLARATION ...................................................................................................................... II
ACKNOWLEDGEMENTS .......................................................................................... III
ABSTRACT .............................................................................................................. IV
ABBREVIATIONS .................................................................................................. XIV
DISSEMINATION ............................................................................................................... XVI
CHAPTER 1 ................................................................................................................ 1
INTRODUCTION ........................................................................................................ 1
1.1 INTRODUCTION .................................................................................................. 1
1.2 OBJECTIVES AND MOTIVES OF THE THESIS ............................................................. 2
1.3 THEORY OF BANK PROFITABILITY, COMPETITION AND EFFICIENCY ............................ 8
1.3.1 Theory of bank profitability ................................................................................... 8
1.3.2 Theory of bank competition..........................................................................10
1.3.3 Theory of bank efficiency .................................................................................... 15
1.4 RESEARCH METHODOLOGY AND DATA ................................................................. 17
1.5 STRUCTURE OF THE THESIS .......................................................................................... 18
CHAPTER 2 ............................................................................................................... 21
CHINA‟S BANKING SYSTEM AND REFORMS ......................................................... 21
2.1 INTRODUCTION ............................................................................................................ 21
2.2 CHINA‟S BANKING REFORMS ....................................................................................... 21
2.3 STRUCTURE OF CHINESE BANKING SECTOR .................................................................. 28
2.3.1 The banking authority ........................................................................................... 28
2.3.2 Five Large-scale Commercial Banks .................................................................... 29
2.3.3 Joint-stock Commercial Banks ............................................................................. 33
2.3.4 Policy Banks………………………………………………………………….....33
2.3.5 City commercial banks…………………………………………………………..34
2.4 The overview of Chinese banking sector over 2003-2009…………………………35
2.5 Challenge faced by Chinese banking industry………………………………………40
2.6 SUMMARY AND CONCLUSION…………………………………………………………43
CHAPTER 3 ............................................................................................................................ 46
LITERATURE REVIEW ON BANK PROFITABILITY, COMPETITION AND
EFFICIENCY ............................................................................................................. 46
3.1 INTRODUCTION ................................................................................................. 46
viii
3.2 LITERATURE REVIEW ON BANK PROFITABILITY ..................................................... 46
3.3 LITERATURE REVIEW ON BANK COMPETITION........................................................ 52
3. 4 LITERATURE REVIEW ON BANK EFFICIENCY .......................................................... 57
3.4.1 Investigation of bank efficiency and its determinants .......................................... 57
3.4.2 Bank performance and share return ...................................................................... 59
3.4.3 The inter-relationship between risk, capital and efficiency .................................. 60
3.5 SUMMARY AND CONCLUSION ............................................................................. 63
CHAPTER 4 ............................................................................................................................ 65
DATA AND METHODOLOGY ............................................................................................. 65
4.1 INTRODUCTION ................................................................................................. 65
4.2 DATA AND METHODOLOGY ON THE ESTIMATION OF BANK PROFITABILITY ... 65
4.2.1 Data ....................................................................................................................... 65
4.2.2 Methodology ......................................................................................................... 67
4.3 DATA AND METHODOLOGY ON THE ESTIMATION OF BANK COMPETITION
…………………………………………………………………………………………78
4.3.1 Data ....................................................................................................................... 78
4.3.2 Methodology ......................................................................................................... 78
4.3.3 Modelling the impact of competition on risk/stability .......................................... 81
4.3.4 The inter-relationship between risk, competition and profitability ....................... 84
4.4 DATA AND METHODOLOGY ON THE ESITIMATION OF BANK EFFICIENCY ...... 86
4.4.1 The measurement of technical efficiency ............................................................. 86
4.4.2 Determinants of H-statistic: test of SCP and efficiency hypotheses .................... 88
4.4.3 The impact of competition and profitability on technical efficiency ................... 88
4.4.4 Risk, share return and performance ...................................................................... 92
4.4.5 Risk, efficiency and capital in Chinese banking .................................................. 94
4.4.6 Modelling the bank efficiency and risk……………………………………….97
4.47 The impact of efficiency and competition on bank profitability………………...98
4.48 Market power, stability and bank performance………………………………100
4.5 SUNMAMRY AND CONCLUSION ……………………………............................103
CHAPTER 5 .......................................................................................................................... 106
EMPIRICAL RESULTS ON BANK PROFITABILITY ................................................ 106
5.1 INTRODUCTION ............................................................................................... 106
5.2 EMPIRICAL RESULTS ON BANK PROFITABILITY ..................................................... 106
ix
5.2.1 Bank profitability and inflation (two-step system GMM estimator) .................. 106
5.2.2 Bank profitability and GDP growth (one-step system GMM estimator) ........... 112
5.2.3 Bank profitability (performance) and stock market volatility ............................ 114
5.3 SUNMAMRY AND CONCLUSION ……………………………………………126
CHAPTER 6………………………………………………………………………………...128
EMPIRICAL RESULTS ON BANK COMPETITION…………………………………….128
6.1 INTRODUCTION ............................................................................................... 128
6.2 EMPIRICAL RESULTS ON BANK COMPETITION…………………………………..128
6.2.1 The estimation of Panzar-Rosse H statistic ......................................................... 128
6.2.2 The impact of competition on risk-taking behaviour of Chinese banks ............. 133
6.2.3 The inter-relationship between risk, competition and profitability……………139
6.3 SUMMARY AND CONCLUSION ..............................................................................147
CHAPTER 7………………………………………………………………………………...148
EMPIRICAL RESULTS ON BANK EFFICIENCY……………………………………………….148
7.1 INTRODUCTION ............................................................................................ 147
7.2 EMPIRICAL RESULTS ON BANK EFFICIENCY……………………………………...148
7.2.1 The impacts of efficiency and concentration on bank competition .................... 148
7.2.2 The impact of competition and profitability on technical efficiency .................153
7.2.3 Risk, share return and performance in Chinese banking industry…………….157
7.2.4 Risk, efficiency and capital in Chinese banking ............................................... 163
7.2.5 Modelling the bank efficiency and risk .............................................................. 172
7.2.6 The impact of efficiency and competition on bank profitability ........................ 175
7.2.7 Market power, stability and performance in Chinese banking industry ............ 183
7.3 SUMMARY AND CONCLUSION ............................................................................ 189
CHAPTER 8 ............................................................................................................. 192
CONCLUSIONS AND LIMITATIONS ...................................................................... 192
8.1 INTRODUCTION AND SUMMARY OF FINDINGS....................................................... 192
8.2 POLICY IMPLICATIONS ..................................................................................... 201
8.3 LIMITATIONS OF THE STUDY AND FURTHER RESEARCH ......................................... 204
BIBLIOGRAPHY .................................................................................................................. 206
x
List of tables
Table 1.1 Discriminatory power of H statistic………………………………………………15
Table 2.1 Progress in meeting capital adequacy…………………………………………….39
Table 2.2 Pre-tax profit of commercial banks (RMB Billion)………………………………40
Table 4.1 Variables considered in the studies………………………………………………66
Table 4.2 Definition of variables considered in this study…………………………………85
Table 4.3 Expectations on the impacts of bank-specific, industry-specific and macroeconomic
variables on bank risk, competition and profitability………………………………………86
Table 4.4 Description of the variables used in the OLS regression model………………….90
Table 4.5 Description of variables used in the study………………………………………..96
Table 4.6 Expectation of the impacts of comprehensive variables on risk-capital-efficiency.96
Table 4.7 Description of variables used in the study………………………………………102
Table 5.1 Descriptive statistics of all variables……………………………………………..107
Table 5.2 Empirical results (two-step system GMM estimation)…………………………..112
Table 5.3 Descriptive statistics of all variables……………………………………………113
Table 5.4 Empirical results (one-step system GMM estimation)…………………………114
Table 5.5 Definition and descriptive statistics of the variables……………………………115
Table 5.6 Empirical results (difference GMM)……………………………………………119
Table 5.7 Empirical results (system GMM)………………………………………………120
Table 5.8 Empirical results for state-owned banks (difference GMM)………………….122
Table 5.9 Empirical results for joint-stock commercial banks (difference GMM)………123
Table 5.10 Empirical results for state-owned banks (system GMM)……………………125
Table 5.11 Empirical results for joint-stock commercial banks (system GMM)………...126
Table 6.1 Descriptive statistics of the variables used in the study………………………131
Table 6.2 Panzar-Rosse H statistic over the period 2003-2009………………………..132
xi
Table 6.3 The impact of competition on risk (Lerner index)……………………………137
Table 6.4 The impact of competition on risk (Panzar-Rosse H statistic)……………….139
Table 6.5 Empirical result (ROA as the profitability indicator)…………………………145
Table 6.6 Empirical result (ROE as the profitability indicator)…………………………146
Table 7.1 Summary statistics of inputs used to estimate the efficiency scores…………….149
Table 7.2 Mean values of technical efficiency, pure technical efficiency and scale efficiency
of all Chinese commercial banks: 2003-2009………………………………………………150
Table 7.3 Determinants of H statistic (3-bank concentration ratio)……………………….152
Table 7.4 Determinants of H statistic (5-bank concentration ratio)……………………….153
Table 7.5 Descriptive statistics of all variables considered in this study………………..153
Table 7.6 Results of regression on the determinants of bank efficiency (OLS)…………..156
Table 7.7 Results of regression on the determinants of bank efficiency (Tobit)………..156
Table 7.8 Results of regression on the determinants of bank efficiency (Bootstrap
Truncated)………………………………………………………………………………….157
Table 7.9 The Malmquist productivity index of Chinese state-owned, joint-stock and city
commercial banks: 2003-2009………………………………………………………….....158
Table 7.10 Descriptive statistics of all variables used in this study……………………….159
Table 7.11a Results (Dependent variables: DEA efficiency change and LLPTL)……….160
Table 7.11b Results (Dependent variables: DEA efficiency change and volatility of
ROA)………………………………………………………………………………………160
Table 7.11c Results (Dependent variables: DEA efficiency change and volatility of
ROE)………………………………………………………………………………………...161
Table 7.11d Results (Dependent variables: DEA efficiency change and Z-score)…………161
Table 7.12a Results (Dependent variables: productivity change and LLPTL)……………..162
Table 7.12b Results (Dependent variables: productivity change and volatility of ROA)….162
Table 7.12c Results (Dependent variables: productivity change and volatility of ROE)…..163
Table 7.12d Results (Dependent variables: productivity change and Z-score)……………163
Table 7.13 Descriptive statistics of all variables…………………………………………164
xii
Table 7.14 Seemingly unrelated regression for the relationship among bank capital, pure
technical efficiency and risk-taking……………………………………………………….168
Table 7.15 Seemingly unrelated regress for the relationship among bank capital, pure
technical efficiency and risk-taking……………………………………………………169
Table 7.16 Seeming unrelated regression for the relationship among bank capital, scale
efficiency and risk-taking………………………………………………………………170
Table 7.17 Seemingly unrelated regression for the relationship among bank capital,
productivity and risk-taking………………………………………………………………171
Table 7.18 Mean values of technical efficiency, risk (measured by both the LLPTL and the Z-
score) over the period 2003-2009……………………………………………………….172
Table 7.19 Does efficiency Granger-cause risk?..............................................................174
Table 7.20 Does risk granger-cause efficiency? ..................................................................175
Table 7.21 Descriptive statistics for profitability measures (ROA, ROE, NIM and PBT)...176
Table 7.22 Summary statistics: explanatory variables…………………………………….177
Table 7.23 Empirical results: Determinants of bank profitability (the Lerner index as
competition measure)……………………………………………………………………..181
Table 7.24 Empirical results: Determinants of bank profitability (Panzar-Rosse H statistic as
competition indicator)…………………………………………………………………..182
Table 7.25 Descriptive statistics of variables used in this study………………………..183
Table 7.26 Empirical results on the impact of efficiency on market power……………187
Table 7.27 Empirical results on the impact of productivity on market power…………..188
xiii
List of figures
Figure 1.1 The Structure-Conduct-Performance model…………………………………..12
Figure 1.2 The measurement of technical efficiency………………………………………16
Figure 1.3 The measurement of pure technical efficiency and scale efficiency……………17
Figure 2.1 Total assets of Chinese banking sector over 2003-2009 (RMB Billion)………36
Figure 2.2 Market share of state-owned, joint-stock, city and foreign banks in total banking
assets over 2003-2009(%)…………………………………………………………………..36
Figure 2.3 volume of non-performing loans in Chinese banking over 2003-2009 (RMB
Billion)……………………………………………………………………………………….38
Figure 2.4 non-performing loan ratios in Chinese banking sector over 2003-2009……….39
Figure 4.1 The annual inflation and GDP growth rate 2003-2009………………………….67
Figure 4.2 Profitability of Chinese commercial banks over 2003-2009 (ROA)……………69
Figure 4.3 Profitability of Chinese commercial banks over 2003-2009 (NIM)…………..70
Figure 6.1 Evolution of bank risk: 2003-2009……………………………………….133
a Risk measured by the ratio of Loan loss provision over total loans…………….....133
b Risk measured by the Z-score………………………………………………………….134
Figure 6.2 The competitive condition in Chinese banking industry: 2003-2009………….135
a. The competitive condition is measured by the Lerner index…………………….135
b. The competitive condition measured by the Panzar-Rosse H statistic………………….135
Figure 7.1 Technical, pure technical and scale efficiency scores of state-owned, joint-stock
and city banks (2003-2009)…………………………………………………………………150
Figure 7.2 Productivity, efficiency and Lerner index over the period 2003-2009…………184
Figure 7.3 Risk undertaken by different ownership of Chinese banks……………………..184
xiv
Abbreviations
ABC -Agricultural Bank of China
ADBC-Agricultural Development Bank of China
AMCs-Assets Management Companies
BOC-Bank of China
BOCOM-Bank of Communication
CAPM-Capital Asset pricing model
CAR-Capital Adequacy Ratio
CBRC-China Banking Regulatory Commission
CCB-China Construction Bank
CCBs-City Commercial Banks
CDB-China Development Bank
CRS-Constant Return to Scale
DEA-Data Envelopment Analysis
ESH-Efficient-Structure hypothesis
EROE-Excess Return on Equity
EVA-Economic Value Added
EXIM-Export-Import Bank of China
GLS-General Least Square
GMM-Generalized Method of Moments
ICBC-Industrial and Commercial Bank of China
IPO-Initial Public Offering
JSCBs-Joint-stock Commercial Banks
NEIO-New Empirical Industrial Organization
NIM-Net Interest Margin
OLS-Ordinary Least Square
xv
PBC-People‟s Bank of China
PBT-Profit Margin
PTE-Pure technical efficiency
RCCs-Rural Credit Cooperatives
ROA-Return on Assets
ROAA-Return on Average Assets
ROE-Return on Equity
SCP-Structure-Conduct-Performance
SE-Scale efficiency
SFA-Stochastic Frontier Approach
SMEs-Small and medium size Enterprises
SOCBs-State-owned Commercial Bank
SOEs-State-owned enterprises
SUR-Seeming Unrelated Regression
TFP-Total Factor Productivity
UCCs-Urban Credit Cooperatives
VRS-Variable Return to Scale
WTO-World Trade Organization
xvi
Dissemination
Articles published:
Tan, Y. & Floros, C. (2012). Bank profitability and inflation: the case of China. Journal of
Economic Studies, 39(6), 1-32.
Tan, Y. & Floros, C. (2012). Bank profitability and GDP growth: a note. Journal of Chinese
Economics and Business Studies, 10(3), 267-273.
Tan, Y. & Floros, C. (2012).Stock market volatility and bank performance in China. Studies
in Economics and Finance, 29(3), 221-228.
Floros, C. & Tan, Y. (2013). Moon Phases, Mood and Stock Market Return: International
Evidence. Journal of Emerging Market Finance, 12(1), 107-127.
Tan, Y. & Floros, C. (2013). Market power, stability and performance in the Chinese banking
industry. Economic Issues, 18(2), 65-90.
Tan, Y. & Floros, C. (2013). Risk, profitability and competition: evidence from the Chinese
banking industry. Journal of Developing Areas, forthcoming
Tan, Y. & Floros, C. (2013). Risk, capital and efficiency in Chinese banking. Journal of
International Financial Markets, Institutions and Money, 26, 378-393
Articles under review:
Tan, Y. & Floros, C. (2013). Examining the effects of technical efficiency and competition
on bank profitability: The case of China. Journal: Journal of Economic Studies.
Conferences
Tan, Y. & Floros, C. (2011). Bank profitability and inflation: the case of China. The 22nd
CEA (UK) and 3rd
CEA Europe Annual Conference. University College Dublin, Ireland
1
Chapter 1
Introduction
1.1 Introduction
The financial system around the world has undergone significant changes over the last three
decades. The banking output, in terms of providing various financial services, can be
produced using fewer inputs due to deregulation, globalization, financial innovation and
technological progress. In other words, the technical efficiency has been improved
significantly in the banking sector. However, the banking sector in the developing countries,
especially in China, has the characteristic of higher level of government control, which in
turn leads to lower bank competition and inefficient allocation of resources. Furthermore, as
argued by Garcia-Herrero et al. (2009), the Chinese banking sector remained
undercapitalized, saddled with non-performing loans and also the profitability was below the
international standards. The Chinese government has implemented several rounds of banking
reforms in order to create a more competitive environment and improve the efficiency and
stability in the banking sector.
The reform of the economy started in China since 1979 with the purpose of transferring the
planned economy to the socialist market economy. As the most important component of the
country‟s economy, the banking sector in China has undergone a number of reforms which
include among others: Creating a two-tier banking system; Establishing three policy banks
which separate the state-owned commercial banks (SOCBs) from policy lending;
Encouraging banks to be listed on stock exchange to obtain external monitoring; Relaxing the
requirement for foreign banks to enter into the Chinese markets. The objectives of these
measurements taken by the Chinese government are to improve the performance of Chinese
banks in terms of profitability, efficiency and productivity, and also create a more
competitive environment and strengthen the stability in the banking sector. Assessing the
profitability, efficiency, competition and their determinants will provide policy implications
to the government and banking regulatory authority with regards to further reforms need to be
initiated. With this in mind, we outline the objectives of the present study.
2
1.2 Objectives and motives of the thesis
There is extensive empirical literature investigating issues in the European banking sector,
including bank profitability, efficiency/productivity, competition and risk. However, research
on the Chinese banking sector is relatively scarce. Therefore, this study aims to examine the
above issues for the Chinese banking sector with focus on the following topics: 1) the
impacts of inflation, GDP growth rate and stock market volatility on bank profitability; 2) the
competitive condition in the Chinese banking sector and its effect on the risk-taking
behaviour of Chinese banks; 3) the technical efficiencies of three different ownerships of
Chinese banks and its inter-relationships with bank risk; 4) the effects of efficiency and
concentration on bank competition; 5) the inter-relationships between risk, capital and
efficiency; 6) the impacts of competition and technical efficiency on bank profitability; 7) the
impacts of share return on the efficiency/productivity change of Chinese banks; 8) the effects
of competition and bank profitability on technical efficiency of Chinese banks; 9) the effects
of technical efficiency/productivity and risk on the competitive condition of Chinese banks.
There is considerable empirical research examining the impact of inflation on bank
profitability. Kosmidou (2008) argues that inflation is significantly and negatively related to
bank profitability in Greece over the period 1990-2002. However, inflation is found to be
significantly and positively related to bank profitability in Malaysia over the period 1986-
1995. This result is supported by Sufian (2009a) for the Chinese banking sector over the
period 2000-2007. Perry (1992) argues that the impact of inflation on bank profitability
depends on whether inflation is anticipated or not. If the inflation is anticipated and the
interest rates are adjusted accordingly, there will be a positive impact of inflation on bank
profitability. On the other hand, if the inflation is not fully anticipated, the bank faces cash
flow difficulties, which further lead to accumulation of loan losses. In other words, if the
interest rates cannot be adjusted promptly, the costs increase faster than the revenue, which
precedes a decline in bank profitability. Similar opinion is held by Hoggarth et al. (1998)
who argue that it is difficult to plan and negotiate loans in a higher inflationary environment.
Due to the fact that Chinese banks have close links with government, the government‟s
anticipation on the inflation rates (according to the economic situation) gives banks
opportunity to adjust the interest rate, which leads to higher bank profitability. So the first
research hypothesis of this study is: "inflation is significantly and positively related to
Chinese bank profitability".
3
Not only inflation, but also the impact of GDP growth on bank profitability is investigated by
empirical literature. Liu and Wilson (2010) argue that GDP growth rate has had a significant
impact on bank profitability in Japan over the period 2000-2007. The same finding is also
obtained by Heffernan and Fu (2010) for the Chinese banking industry. GDP growth lowers
the banking entry requirement; the resulted increased in competition leads to a decline in
bank profitability. So our second research hypothesis is "higher GDP growth leads to lower
bank profitability in China".
As one important part of the country‟s economy, the stock market plays an important role in
bank profitability; hence, several studies investigate the impact of stock market volatility on
bank profitability. However, these studies mainly focus on the European banking sector.
Albertazzi and Gambacorta (2009) argue that stock market volatility is significantly and
negatively related to bank profitability for the main industrialized countries over the period
1981-2003. Strong volatility in stock markets increases the risk of investors, and the resulted
decrease in the funds provided from investors makes it more difficult for the companies to
obtain money from the stock market, as an alternative source of funds. The subsequent
increased demand on bank loans from companies leads to higher volumes of loan services
and higher profitability. So, our third research hypothesis is "higher stock market volatility in
China leads to higher bank profitability".
There is some research examining the competitive condition in the Chinese banking sector.
Yuan (2006) argues that the Chinese banking sector is operated near the state of perfect
competition over the period 1996-2000. In addition, Masood and Sergi (2011) suggest that
the Chinese banking sector is in a state of monopolistic competition over the period 2004-
2007. This finding is also supported by Fu (2009) for the Chinese banking sector over the
period 1997-2007. Our study examines the competitive condition of the Chinese banking
sector over the period 2003-2009. Notice that 2008 is an important year for China: when
Beijing successfully held the Olympic Games, they attracted more foreign firms and financial
institutions to enter the Chinese market. It is supposed to have increased the competitive
condition in Chinese banking sector. So our fourth research hypothesis is "the Chinese
banking sector is in a state of perfect competition over the period 2003-2009".
There is extensive literature investigating efficiency in the Chinese banking sector (see Ariff
and Can, 2008; Fu and Heffernan, 2007; Berger et al., 2009; Sufian and Majid, 2009; Sufian,
2009b; Laurenceson and Zhao, 2008; Cao, 2007; Hu et al., 2009; Jiang et al., 2009; Yao and
4
Jiang, 2010). Most of the studies focus on the examination of cost efficiency of Chinese
banks, except Sufian and Majid (2009) who evaluate the technical efficiency of Chinese
banks over the period 1997-2006. They argue that large banks have higher technical
efficiency than medium and small banks. Large banks, such as state-owned commercial
banks, have the ability to reduce their costs from economies of scale and scope and the
comprehensive branches all over the country increase the bank outputs. So our fifth research
hypothesis is "state-owned commercial banks have highest technical efficiency over the
period 2003-2009".
There is one empirical study examining productivity growth in the Chinese banking sector.
Kumbhakar and Wang (2007) argue that the joint-stock commercial banks have higher
productivity growth than state-owned commercial banks. Chinese state-owned commercial
banks are fully supported by the Chinese government; the staffs and managers in the banks
have little incentive to increase their productivity, while the city commercial banks operate
within the city level, they face much less competition than state-owned and joint-stock
commercial banks which does not help them to improve productivity. On the other hand, the
joint-stock commercial banks are mainly made up of big companies; they are more concerned
with the firm‟s performance, while the listings of joint-stock commercial banks not only give
them extra opportunities to obtain funds externally, but also increase the monitoring and
improve the corporate governance. All these factors lead to a higher productivity growth. So
our sixth research hypothesis is "joint-stock commercial banks have higher productivity
growth than state-owned and city commercial banks over the examined period".
It is expected that concentration and efficiency have impacts on bank competition. On the one
hand, increased concentration induces banks to collude with each other to obtain higher
market power and profitability, which leads to lower bank competition. This is in line with
the Structure-Conduct-Performance (SCP) hypothesis. On the other hand, the efficient-
structure hypothesis proposed by Demsetz (1973) argues that firms with higher efficiency
have lower costs, which results in higher profits. Thus, the firms with higher efficiency have
the ability to increase their market share, which further leads to higher concentration. As
discussed earlier that higher concentration reduces the degree of competition, the efficient-
structure hypothesis suggests that there is a negative relationship between competition and
efficiency. So our seventh hypothesis is "there is a negative impact of concentration on bank
competition and the effect of efficiency and competition is significant and negative".
5
One purpose of several rounds of banking reforms in China is to increase competition among
different types of banks; however, increased competition is supposed to have significant
impact on the risk-taking behaviour. There are two main views regarding the impact of
competition on bank risk, which are competition fragility hypothesis and competition stability
hypothesis. The former argues that banks have the ability to withstand shocks and decrease
the risk taking behaviour due to the fact that higher profitability can be earned through
monopoly rents in a less competitive environment (Allen and Gale, 2000, 2004; Carletti,
2008; Boyd and De Nicole, 2005). The competition stability view suggests that in a less
competitive banking market, banks normally charge higher interest rates, which will increase
the probability of default on a loan repayment. In a stronger competition environment,
Chinese banks are supposed to lower the credit requirement especially for state-owned
commercial banks. The government will inject capital and write-off non-performing loans for
them, which gives the managers less incentive and they are less concerned with the loan
quality, which leads to higher risk. So our eighth research hypothesis is "the risk of Chinese
banks is higher in a more competitive environment".
Not only does the competition impact on the risk-taking behaviour, but it is also expected that
the risk has significant impact on bank competition. Banks with higher risk have lower
margins, which may in turn lead to lower market share and concentration; the less
concentrated market increases the degree of competition. So our ninth research hypothesis is
“higher risk leads to higher competition in the Chinese banking sector”.
With regards to the inter-relationships between competition and profitability, banks with
higher profitability accumulate larger market share, which increases their market power and
decreases the degree of competition. So our tenth research hypothesis is “the impact of
profitability on bank competition is significant and negative”.
The SCP hypothesis indicates that there is a negative impact of competition on bank
profitability. Higher bank risk is expected to reduce bank profitability (Duca and Mclaughlin,
1990; Miller and Noulas, 1997). So our eleventh research hypothesis is “there is a significant
and negative impact of competition on bank profitability and risk significantly and negatively
affects the bank profitability.
Banks with higher profitability have good risk monitoring and management systems, which
lead to lower risk exposure. So our twelfth research hypothesis is “banks with higher
profitability normally have lower risk”.
6
With regards to the impacts of competition and profitability on technical efficiency, it is
expected that banks with lower profitability normally have more incentive to reduce costs and
generate larger amount of outputs which leads to higher technical efficiency. It is also
expected that in a higher competitive environment, bank managers have more incentive to
reduce costs in order to sustain their profitability which leads to efficiency improvement. So
our research hypotheses are "higher competition leads to higher technical efficiency of
Chinese banks"; "there is a significant and negative impact of profitability on technical
efficiency".
There is a growing amount of research focussed on the examination of the impact of stock
price/return on efficiency (change) (see Beccalli et al. 2006; Liadaki and Gaganis, 2010;
Ioannidis et al. 2008; Sufian and Majid, 2007; Pasiouras et al. 2008; Erdem and Erdem, 2008,
among others). All of them find that banks with higher stock price (return) normally have
higher efficiency or stable efficiency. Here, we investigate the effect of share return on
efficiency/productivity change; we expect that banks with higher share return will have more
stable efficiency/productivity.
In this study, we also investigate the inter-relationships between risk and technical efficiency.
Bad management hypothesis is proposed by Berger and DeYoung (1997) and William
(2004); suggesting that higher costs will be incurred for the banks with lower levels of
efficiency due to the fact that credit is inadequately monitored and operating expenses are
inefficiently controlled. Because of the credit, operational, market and reputation problems,
declines in efficiency will temporarily lead to increases in banks‟ risk. The bank luck
hypothesis states that the increases in problem loans for the banks is attributed to external
events rather than managers‟ skills or their risk-taking appetite (see Berger and DeYoung,
1997). The increases in risk incur additional costs and managerial efforts. So our hypotheses
are "there is a significant and negative impact of efficiency on bank risk"; "the impact of risk
on efficiency is significant and negative".
Moral hazard hypothesis is suggested by Jeitschko and Jeung (2005); it states that bank
managers tend to take on higher risk when the banks have lower levels of capital or the banks
are less efficient. The moral hazard problem arising from the presence of information friction
and the existence of agency problem will make bank managers take on higher risk. In
contrast, cost reducing practices will be adopted for the banks with higher levels of capital
and less moral hazard incentives.
7
Banks are forced by the regulators to hold higher levels of capital when risk undertaken by
banks increases. This is due to the fact that the cost for issuing fresh equity at short notice can
be avoided by holding additional capital above the regulatory minimum (Peura and Keppo,
2006). With regards to the impact of efficiency on the levels of capitalization, Hugeses and
Moon (1995) and Hughes and Mester (1998), among others, argue that from the regulatory
perspectives, banks with higher efficiency will be given more room by government for
leverage. So in terms of the relationships between risk and capital, efficiency and capital, we
have the following research hypotheses: "the levels of capitalization are significantly and
positively related to bank efficiency"; "Chinese banks with higher efficiency have lower
levels of capital"; "the effect of capital on bank risk is significant and positive, while there is
a significant and negative impact of capital on bank risk".
Managers in the banks with higher efficiency allocate the inputs and outputs very well in the
banking operation; also, they have higher ability to control the costs, which leads to higher
bank profitability. So, we expect that there is "a significant and positive impact of technical
efficiency on bank profitability".
This investigation of the Chinese banking industry is important for a number of reasons. First
and foremost, this is the first empirical study that provides a comprehensive analysis of the
Chinese banking sector, including bank performance, bank competition and bank risk.
Although the banking sector profitability is reported in the annual statement from China
Banking regulatory commission, the situation of bank efficiency/productivity and banking
sector competitive condition are not available. Furthermore, the estimations on the
determinants of bank performance, bank competitive condition and inter-relationships
between bank performance, bank competition and risk-taking behaviour of Chinese banks
provide useful information to the Chinese government and banking regulatory authorities.
Second, as far as the author is aware, this study is the only one in the empirical literature
which examines the competitive conditions of the Chinese banking sector using both the
Lerner index and the Panzar-Rosse H statistic. The estimation of Lerner index provides the
competitive conditions of three different ownerships of Chinese banks, which is helpful for
the government and banking regulatory commission to make policies tailored to different
types of banks. Moreover, because of the financial crisis that happened in Asia and around
the world in 2007-2008, the banking sector risk or the stability of the banking sector is
focused on by the government officials, banking regulatory authority and academic
8
researchers as well. This study provides the first empirical research on the risk conditions of
the Chinese banking sector. Besides the traditional risk measurement widely used by the
literature, which is the ratio of loan-loss provision over total loans, three alternative indicators
are applied in this study in order to check the robustness of the results; these are the volatility
of Return on Assets, the volatility of Return on Equity and the Z-score. The China banking
regulatory commission (CBRC) is established in 2003, the main purpose of which is to
increase stability in the Chinese banking sector and decrease the risk-taking behaviour of
Chinese banks. The estimation of risk conditions in Chinese banking sector will give a
reflection to the government with regards to the effectiveness of relevant policies.
Finally, one key contribution to the existing literature lies in the fact that this study focuses
on the examinations of various relationships between (1) risk, capital and efficiency, (2)
competition, efficiency and profitability, (3) competition and risk, and (4) risk, competition
and profitability. The investigations of these relationships are useful for the government to
make relevant policies with regards to regulating the competitive condition of the Chinese
banking sector, improving the performance of Chinese banks and reducing the risk-taking
behaviour of Chinese banks.
1.3 Theory of bank profitability, competition and efficiency
1.3.1 Theory of bank profitability
Banks are able to have higher profitability through earning more money than they pay in
expenses. There are mainly two sources of bank income: the fees a bank charges for the
services it provides, and the interest it earns on its assets. On the other hand, the main source
of expenses is the interest it pays on its liabilities and other non-interest expenses, such as
personnel expenses and other operating expenses. The major assets of the bank include the
loans to individuals, business and other organizations, as well as the securities it holds, while
the major bank liabilities are its deposits and money that it borrows, either from other banks
or from selling commercial paper in the money market.
Recent empirical literature uses different measurements as the profitability indicators which
mainly include the Return on Assets (ROA), Return on Equity (ROE) and Net Interest
Margin (NIM).
9
Return on Assets (ROA) is defined as the ratio of net income over total assets. It reflects a
bank‟s ability to utilize the assets to gain net profit. A lower ratio indicates that a bank has
consecutive lending and investment policies or excessive operating expenses. The ROE, on
the other hand, reflects a bank‟s ability to generate income using shareholders‟ funds. It is
calculated by dividing bank‟s net income over shareholders‟ equity. The higher ratio reflects
the bank‟s efficient utilization of shareholders‟ funds. Although ROE is commonly used in
the financial literature, it is not the best profitability indicator for the following reasons. First,
banks with higher levels of equity (lower leverage) have a higher ROA and a lower ROE.
Second, ROE disregards the higher risk that is associated with a higher leverage and the
effect of regulation on leverage (Dietrich and Wanzenried, 2011). Net Interest Margin (NIM)
reflects how successful a bank‟s investment decisions are relative to its interest expenses. It is
expressed by using the difference between the interest income generated and the amount of
interest paid out divided by the interest earning assets. A negative value indicates that the
bank does not make optimal decisions on investment, due to the fact that interest expenses are
more than the interest income generated through the loans.
Besides the widely used profitability indicators mentioned above, some research uses other
profitability indicators. Profit margin is used by few empirical studies to measure bank
profitability (see Demirguc-Kunt and Huizinga, 1999; Bashir, 2003; Aburime, 2009; and
Amba and Almukharreq, 2013; among others). It is defined as the ratio of bank‟s earnings
before tax over total assets. It is an indicator of how efficient a bank is in using its assets to
generate earnings before contractual obligations must be paid. A higher ratio indicates that
the bank is more efficient in utilising the assets to generate earnings.
Heffernan and Fu (2008) use Economic Value Added (EVA) as the performance indicator in
the Chinese banking sector. A global consulting firm called Stern Stewart and Co. invented
EVA in 1989 and it is calculated as a company‟s net operating profit after taxes minus a
dollar cost for the equity capital employed by the company. The dollar cost of equity capital
employed by a company is equal to the company‟s equity capital multiplied by a percentage
return that the company‟s shareholders‟ require on their investment. The figure of this
indicator can be either positive or negative. A positive figure indicates that the company is
increasing its value to its shareholders while a negative figure suggests that it is diminishing
its values to its shareholders. EVA is considered to be a better performance indicator than
most other popular accounting ratios such as ROA, ROE and NIM due to the fact that the
latter set of indicators do not consider the cost of equity capital employed. As a result, higher
10
figures of ROA, ROE and NIM suggest that a bank performs very well, but it neglects the
possibility that it may be diminishing its value to the shareholders.
1.3.2 Theory of bank competition
Similar to other industries, the types of competition in the banking sector can be mainly
classified into the following categories: perfect competition, monopolistic competition,
oligopoly and monopoly.
The perfect competitive environment in the banking sector has the following characteristics
(see Mankiw and Taylor 2011): 1) There are a large number of banks in the market; 2) Banks
offer a homogenous product with regards to the cost and attribute of the product; 3) the cost
for new banks to enter the market is very low. In a perfectly competitive environment, banks
are price-takers rather than price-makers. The price of a product offered by banks will be
determined by the industry supply or demand, while they have no ability to influence the
volumes of demand and supply in the market. Another type of competition is called
monopolistic competition. Under this competitive environment, there are lots of banks in the
market, but unlike perfectly competitive markets, these banks offer differentiated products to
customers. The cost of entry and exit to the banking market is low. Banks have a degree of
control over the price of the product offered. In other words, they are price-makers rather
than price takers to some extent. The third type of competition is called oligopoly. Under this
competitive environment, there are a small number of banks in the markets, while all of them
provide either homogenous or heterogeneous products in the market; the entry or exit to the
market is quite expensive. The banks operating in the oligopoly market have power to set the
price in the market. The degree of price control by banks in oligopoly is higher than in the
monopolistic competition. One special characteristic of oligopoly over monopolistic
competition and perfect competition is the interdependence among banking firms. The market
in the condition of oligopoly is made up of a few large banks; because the size of the banks is
very large, its actions will affect the market conditions due to the fact that in the oligopoly
market, there are a small number of banks and each bank is large enough that its actions will
affect the market conditions. Thus, other banks will be aware of one bank‟s action and
respond appropriately in order to keep their competitive position in the market. Finally, the
market in the condition of monopoly has only one bank, due to the fact that this bank is the
only firm that provides financial services to the market, there is no competition and this bank
has absolute power in setting the price in the market. Furthermore, other potential banks are
11
unable to enter the market. They also have the ability to charge a different price to different
markets, i.e. they may charge a lower price in a very elastic market in order to increase the
quantity sold, while a higher price would be charged to the consumers in the market with
relatively inelastic market in order to maximize the profit.
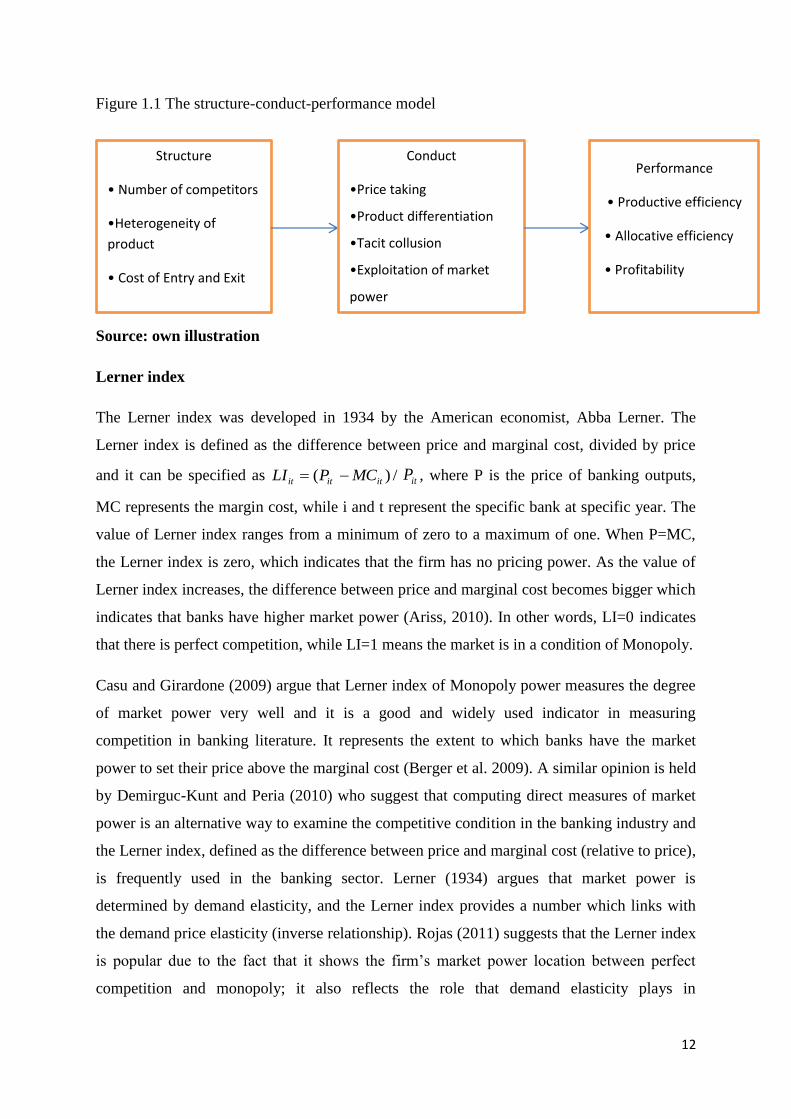
Structure-Conduct-Performance theory
The structure-conduct-performance (SCP) paradigm states that market structure would
determine firm conduct which would determine performance. Market structure can be
measured by a number of factors, such as the number of competitors in an industry, the
heterogeneity of product and the cost of entry and exit. Conduct refers to a number of specific
actions taken by a firm, which include price taking, product differentiation, tacit collusion
and exploitation of market power. The performance of the firm can be measured from a
number of indicators such as productive efficiency, allocative efficiency and profitability.
The range of options and constraints facing a firm is defined by the attributes of the industry
within which a firm operates. In some industries with higher competition, very few options
are available to the firms and the firms have lots of constraints. Firms in these industries
generate maximized social welfare and in the long run, the returns earned by the firms can
only cover the cost of capital. In summary, the industry structure determines the firm‟s
conduct and long-run firm performance. On the other hand, the firms operating in a lower
competitive industry environment have a greater range of conduct options and the number of
constraints faced by the firms is limited. Firms can make use of the available options to
obtain the competitive advantage. For instance, the firms in these industries can use the
market power to set prices that generate significant economic value. However, the
sustainability of their advantages is determined by one of the attributes of industry structure-
barriers to entry. If there are no barriers to entry, the competitive advantages of the firms in
the industry will disappear when new competitors enter the market. Therefore, industry
structure has an important effect on firm conduct and firm performance even though firms in
these industries can sometimes have competitive advantages (Barney and Clark, 2007). The
structure-conduct-performance model is summarized in the following figure.
12
Figure 1.1 The structure-conduct-performance model
Source: own illustration
Lerner index
The Lerner index was developed in 1934 by the American economist, Abba Lerner. The
Lerner index is defined as the difference between price and marginal cost, divided by price
and it can be specified as /)( ititit MCPLI itP , where P is the price of banking outputs,
MC represents the margin cost, while i and t represent the specific bank at specific year. The
value of Lerner index ranges from a minimum of zero to a maximum of one. When P=MC,
the Lerner index is zero, which indicates that the firm has no pricing power. As the value of
Lerner index increases, the difference between price and marginal cost becomes bigger which
indicates that banks have higher market power (Ariss, 2010). In other words, LI=0 indicates
that there is perfect competition, while LI=1 means the market is in a condition of Monopoly.
Casu and Girardone (2009) argue that Lerner index of Monopoly power measures the degree
of market power very well and it is a good and widely used indicator in measuring
competition in banking literature. It represents the extent to which banks have the market
power to set their price above the marginal cost (Berger et al. 2009). A similar opinion is held
by Demirguc-Kunt and Peria (2010) who suggest that computing direct measures of market
power is an alternative way to examine the competitive condition in the banking industry and
the Lerner index, defined as the difference between price and marginal cost (relative to price),
is frequently used in the banking sector. Lerner (1934) argues that market power is
determined by demand elasticity, and the Lerner index provides a number which links with
the demand price elasticity (inverse relationship). Rojas (2011) suggests that the Lerner index
is popular due to the fact that it shows the firm‟s market power location between perfect
competition and monopoly; it also reflects the role that demand elasticity plays in
Structure
• Number of competitors
•Heterogeneity of
product
• Cost of Entry and Exit
Conduct
•Price taking
•Product differentiation
•Tacit collusion
•Exploitation of market
power
Performance
• Productive efficiency
• Allocative efficiency
• Profitability
13
determining a firm‟s mark up. Compared to the traditional concentration ratio, the Lerner
index provides a more accurate measurement of bank market power, while the advantage of
Lerner index over Panzar-Rosse H statistic (which will be discussed below) lies in the fact
that the former is not a long-run equilibrium measure of competition, and it can be calculated
at each point in time (Demirguc-Kunt and Peria, 2010).
There are also some arguments relating to the disadvantages of the Lerner index. Fernandez
de Guevara et al. (2005) argue that there are several problems with regards to the estimation
of the Lerner index. Firstly, the value of the Lerner index changes according to different
revenues used by study. It is frequent practice that only interest revenue and costs are
considered while other non-interest revenues and expenses are omitted. The consideration of
traditional loan-deposit services as the revenue ignores the banking activities of providing
other services which has grown substantially during recent years. This will lead to an
inaccurate result regarding the competitive condition in the banking sector. Secondly, the cost
of risk, which is very important in the profit and loss account of banking system, is not
considered in general practice. The ignorance of the cost of risk can be attributed to reasons
such as data insufficient and calculation difficulties. If the cost of risk in not included in the
estimation of cost function, it will lead to wrong interpretation of the Lerner index due to the
fact that the margin is over-estimated. Thirdly, Bikker et al. (2007) argue that the weakness of
the Lerner index is attributed to the fact that the prices and costs required to calculate the
index are not clearly identified by the available bank balance-sheet data, so that prices and
costs can be proxied by many debatable choices.
Panzar-Rosse (1987) H statistic
An empirical test is developed by John C. Panzar and James N. Rosse to discriminate
between Monopoly, oligopolistic, monopolistically competitive and perfectly competitive
markets. A concise indicator (so-called H statistic) is provided by them, which is based on the
static properties of reduced-form revenue equation. The H-statistic can be interpreted as a
continuous and increasing measure of the overall level of competition in a specific market.
This method makes the assumption that different pricing strategies will be employed in
reaction to changes in input costs. In other words, market power is measured by the extent to
which changes in factor prices (unit price of funds, capital and labour) are reflected in
revenue.
14
The H statistic ranges from minus infinity to unity (see Table 1.1). A negative H arises when
the competitive structure is a monopoly, a perfect colluding oligopoly or a conjectural
variation of short run oligopoly. In all the cases, an increase in input prices will translate into
higher marginal costs, a reduction of equilibrium output and subsequently, a fall in total
revenue (Vesala, 1995). If H lies between zero and unity, the market structure is
characterized by monopolistic competition. Under monopolistic competition, potential entry
leads to contestable market equilibrium and revenue increases less than proportionally to the
changes in input prices, as the demand for banking products facing individual banks is
inelastic (Triole, 1987). Under perfect competition, the H statistic equals to unity. In this
particular situation, a proportional increase in factor input prices raises both marginal and
average costs and induces an equi-proportional change in revenues without distorting the
optimal output of any firm. The H-statistic would also equal to 1 if there is a contestable
market. Baumol et al. (1982), who put forward the contestability theory, argue that under
very restrictive circumstances, such as free entry and exit to the market and higher price
elastic demand for industry‟s output, the competition in a highly concentrated market still
exists. Due to the existence of these features, larger firms in the market need to take
competitive measures to price their outputs.
One assumption of PR H-statistic is that the test can only be applied to firms which produce a
single output. Therefore, banks are regarded as providers of traditional loan-deposit services
as well as non-traditional activities using factor inputs such as labour, funds and capital. In
other words, all the activities should be considered in order to estimate the competitive
condition of the specific market. Nevertheless, supposing the above assumption is omitted,
the competitive conditions of separate segments cannot be analysed due to the fact that there
is no detailed data available for the estimation of the reduced-form revenue equations.
The advantages of using Panzar-Rosse H statistic to measure the competition are: 1) It works
well with firm-specific data on revenues and factor prices; 2) It does not require information
about equilibrium output prices and quantities for the firm and/or industry; 3)This method
can generate concise competitive condition if the sample size is small (Matthews et al.,
2007). Due to the fact that H statistic was developed on the basis of a static model, there are
no predictions on the H-value which is one of the weaknesses of this test. In addition, the
overall market equilibrium required by the test cannot be fulfilled because of market entry
and exit, which leads to further limits on the interpretation of such analysis.
15
Due to the fact that the H-statistics is a static approach, one character of the implementation
is that the test needs to be undertaken on observations that are in long-run equilibrium. In
other words, in the equilibrium test, the dependent variable will be replaced by the
profitability measure, such as return on assets (ROA) or return on equity (ROE) rather than
the revenues. In equilibrium, the resulting H statistic will be significantly equal to zero.
However, the significant and negative H statistic indicates that the test is not in long-run
equilibrium. The purpose of the test is to justify on the ground that competitive markets will
equalize risk-adjusted return across firms such that, in equilibrium, rate of return should not
be correlated with factor input prices.
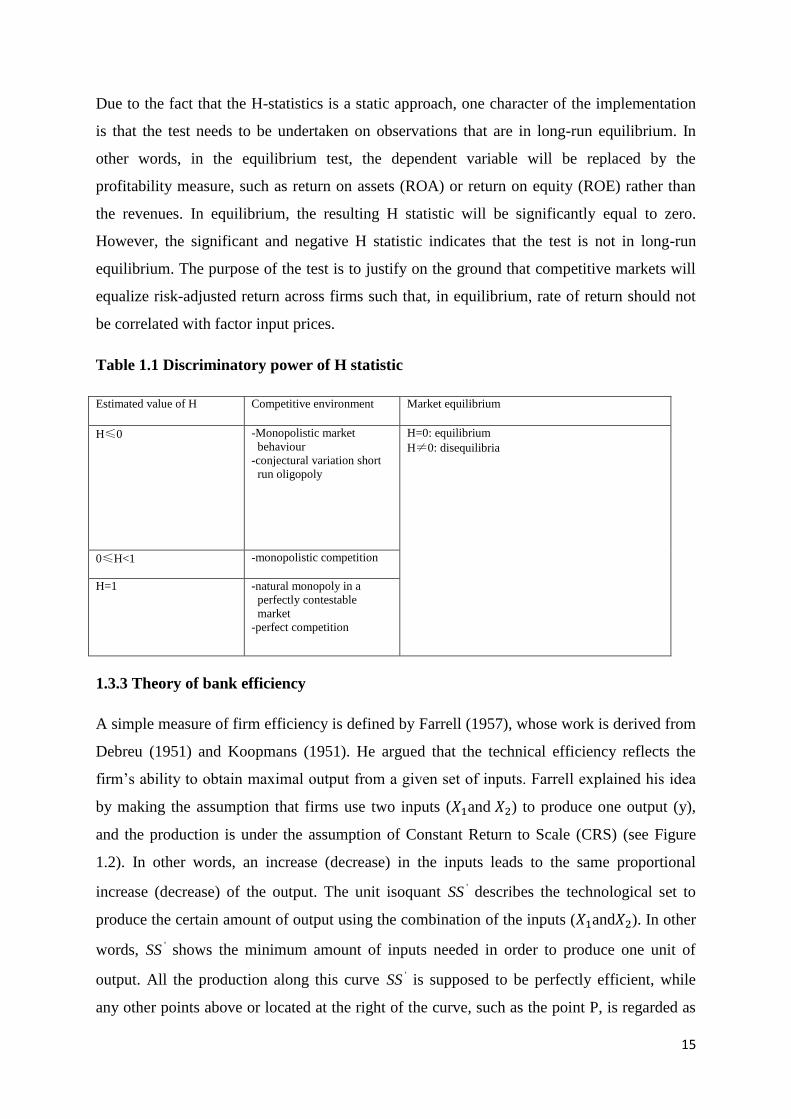
Table 1.1 Discriminatory power of H statistic
Estimated value of H Competitive environment Market equilibrium
H≤0 -Monopolistic market
behaviour
-conjectural variation short
run oligopoly
H=0: equilibrium
H≠0: disequilibria
0≤H<1 -monopolistic competition
H=1 -natural monopoly in a
perfectly contestable
market
-perfect competition
1.3.3 Theory of bank efficiency
A simple measure of firm efficiency is defined by Farrell (1957), whose work is derived from
Debreu (1951) and Koopmans (1951). He argued that the technical efficiency reflects the
firm‟s ability to obtain maximal output from a given set of inputs. Farrell explained his idea
by making the assumption that firms use two inputs ( and ) to produce one output (y),
and the production is under the assumption of Constant Return to Scale (CRS) (see Figure
1.2). In other words, an increase (decrease) in the inputs leads to the same proportional
increase (decrease) of the output. The unit isoquant 'SS describes the technological set to
produce the certain amount of output using the combination of the inputs ( and ). In other
words, 'SS shows the minimum amount of inputs needed in order to produce one unit of
output. All the production along this curve 'SS is supposed to be perfectly efficient, while
any other points above or located at the right of the curve, such as the point P, is regarded as
16
inefficient production due to the fact that the amount of inputs used in the production to
produce one unit of output is more than the efficient production.
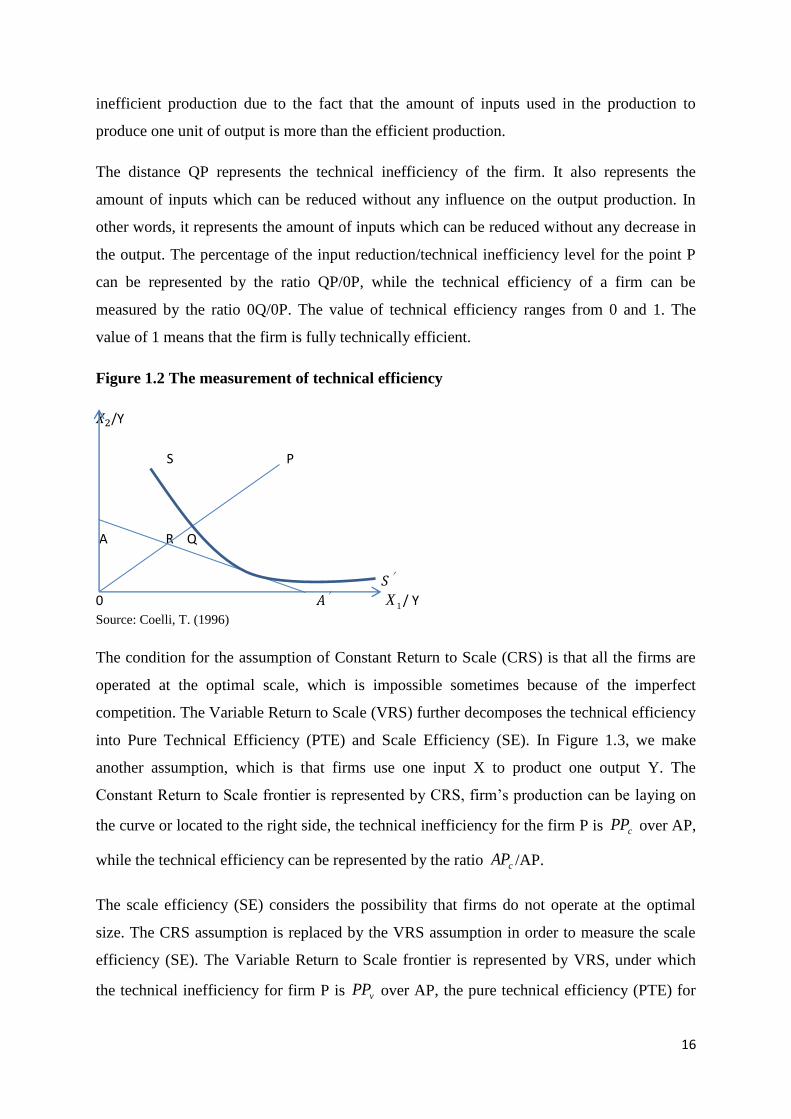
The distance QP represents the technical inefficiency of the firm. It also represents the
amount of inputs which can be reduced without any influence on the output production. In
other words, it represents the amount of inputs which can be reduced without any decrease in
the output. The percentage of the input reduction/technical inefficiency level for the point P
can be represented by the ratio QP/0P, while the technical efficiency of a firm can be
measured by the ratio 0Q/0P. The value of technical efficiency ranges from 0 and 1. The
value of 1 means that the firm is fully technically efficient.
Figure 1.2 The measurement of technical efficiency
/Y
S P
A R Q
0 1X / Y
Source: Coelli, T. (1996)
The condition for the assumption of Constant Return to Scale (CRS) is that all the firms are
operated at the optimal scale, which is impossible sometimes because of the imperfect
competition. The Variable Return to Scale (VRS) further decomposes the technical efficiency
into Pure Technical Efficiency (PTE) and Scale Efficiency (SE). In Figure 1.3, we make
another assumption, which is that firms use one input X to product one output Y. The
Constant Return to Scale frontier is represented by CRS, firm‟s production can be laying on
the curve or located to the right side, the technical inefficiency for the firm P is cPP over AP,
while the technical efficiency can be represented by the ratio cAP /AP.
The scale efficiency (SE) considers the possibility that firms do not operate at the optimal
size. The CRS assumption is replaced by the VRS assumption in order to measure the scale
efficiency (SE). The Variable Return to Scale frontier is represented by VRS, under which
the technical inefficiency for firm P is vPP over AP, the pure technical efficiency (PTE) for
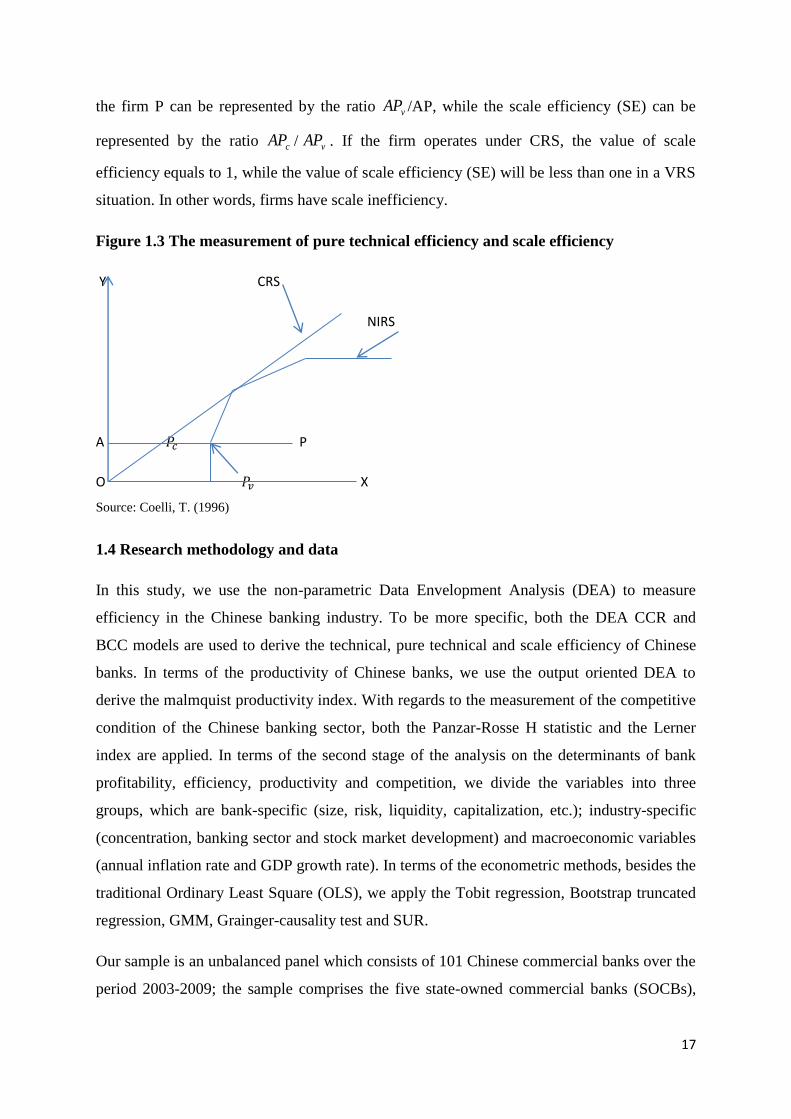
17
the firm P can be represented by the ratio vAP /AP, while the scale efficiency (SE) can be
represented by the ratio cAP / vAP . If the firm operates under CRS, the value of scale
efficiency equals to 1, while the value of scale efficiency (SE) will be less than one in a VRS
situation. In other words, firms have scale inefficiency.
Figure 1.3 The measurement of pure technical efficiency and scale efficiency
Y CRS
NIRS
A P
O X
Source: Coelli, T. (1996)
1.4 Research methodology and data
In this study, we use the non-parametric Data Envelopment Analysis (DEA) to measure
efficiency in the Chinese banking industry. To be more specific, both the DEA CCR and
BCC models are used to derive the technical, pure technical and scale efficiency of Chinese
banks. In terms of the productivity of Chinese banks, we use the output oriented DEA to
derive the malmquist productivity index. With regards to the measurement of the competitive
condition of the Chinese banking sector, both the Panzar-Rosse H statistic and the Lerner
index are applied. In terms of the second stage of the analysis on the determinants of bank
profitability, efficiency, productivity and competition, we divide the variables into three
groups, which are bank-specific (size, risk, liquidity, capitalization, etc.); industry-specific
(concentration, banking sector and stock market development) and macroeconomic variables
(annual inflation rate and GDP growth rate). In terms of the econometric methods, besides the
traditional Ordinary Least Square (OLS), we apply the Tobit regression, Bootstrap truncated
regression, GMM, Grainger-causality test and SUR.
Our sample is an unbalanced panel which consists of 101 Chinese commercial banks over the
period 2003-2009; the sample comprises the five state-owned commercial banks (SOCBs),
18
twelve joint-stock commercial banks (JSCBs) and eighty four city commercial banks (CCBs).
In terms of the data resources, they are mainly from the Bankscope database, China Banking
Regulatory Commission (CBRC) and the World Bank database.
1.5 Structure of the Thesis
The structure of the thesis can be organized as follows:
Chapter 2: China’s banking system and reforms
This chapter outlines the structure of the banking system as well as the reforms undertaken by
the Chinese government over the past 30 years. To be more specific, different categories of
Chinese banks are explained in detail in terms of their history, business scope and
performance during recent years. As one of the most important components of the Chinese
banking sector, the establishment and development of each of the five state-owned
commercial banks (SOCBs) is explained. With regards to the banking reforms implemented
by the Chinese government, this chapter divides the reforms into three periods. We provide
the background information which is necessary for discussion of the empirical results
obtained from subsequent chapters in terms of Chinese bank performance and competition.
Chapter 3: Literature review on bank profitability, competition and efficiency
This chapter first reviews the literature on the investigation of profitability and its
determinants in the European banking sector, US banking sector, Emerging market banking
sector and the Chinese banking sector. Furthermore, we review the relevant literature using
Panzar-Rosse H statistic to measure the competitive condition in the banking sector. In
addition, the literature linking competition with efficiency and concentration and the
literature regarding the relationship between risk, competition and profitability are also
reviewed.
With regards bank efficiency, we review the literature on the investigation of bank efficiency
in European countries and South Africa, and then we focus on reviewing the empirical
research using different methods to examine the bank efficiency and its determinants in
Chinese banking sector. The second part of the literature reviews the empirical research
linking the efficiency with the share prices/performance, which is followed by the third part
reviewing the literature assessing the inter-relationship between risk, capital and efficiency.
Chapter 4: Data and methodology
19
This chapter provides the methodologies used to investigate the profitability, competition and
efficiency in the Chinese banking industry. We first define the variables used as the
profitability indicator, and then three groups of bank-specific, industry-specific and
macroeconomic determinants of bank profitability are described. We then explain the
Generalized Method of Moments (GMM) in order to investigate the determinants of bank
profitability. With regards to the estimation of bank competition and efficiency, the reduce-
form function used to derive the Panzar-Rosse H statistic is well explained with definition of
dependent variable, input prices and bank-specific covariates, the process to derive technical,
pure technical and scale efficiency using DEA CCR and BCC models is presented. In
addition, various econometric estimation techniques employed are explained.
Chapter 5: Empirical Results on bank profitability
This chapter provides the results on the analysis of profitability in the Chinese banking
sector. To be more specific, the following issues are examined and discussed: 1) The impact
of inflation on bank profitability; 2) The impact of GDP growth rate on bank profitability; 3)
The impact of stock market volatility on bank profitability.
Chapter 6: Empirical results on bank competition
In this chapter, we first provide the empirical results on the competitive condition of the
Chinese banking sector using two non-structural indicators, which are Panzar-Rosse H
statistic and Lerner index, while we also report the results of the risk condition in the Chinese
banking sector under two indicators, which include the ratio loan loss provision over total
loans and Z-score. Finally, we report the results regarding the investigation of the impact of
competition on the risk-taking behaviour of Chinese banks, and we also report the results of
the inter-relationship between risk, competition and profitability in Chinese banking system.
Chapter 7: Empirical results on bank efficiency
This chapter first provides the empirical results of efficiency scores of different ownerships
of Chinese banks, and then we report the results regarding the impacts of efficiency and
concentration on bank competition. Results are also presented regarding the impacts of
competition and profitability on bank efficiency. Furthermore, we also discuss the impact of
share return and risk on bank efficiency/productivity change, which is followed by the
explanation of the inter-relationships between risk, capital and efficiency. We also present the
results in terms of the inter-relationships between risk and efficiency. The results regarding

20
the impacts of competition and efficiency on bank profitability are also explained. Finally, we
provide the results regarding the effects of risk and efficiency/productivity on bank
competition (market power).
Chapter 8: Conclusions and Limitations
This chapter summarizes the main findings from the previous chapters. The policy
implications are also discussed. Finally, attention is drawn to the limitations of this study and
the areas for future research identified.
21
Chapter 2
China’s banking system and reforms
2.1 Introduction
Since the late 1970, a series of banking reforms have been implemented by the Chinese
government to improve the performance, enhance the stability and create a more competitive
environment in the banking sector. This chapter reviews the banking reforms since 1979.
Furthermore, it provides the structure of the Chinese banking sector, and then gives an
overview of the Chinese banking sector over the period 2003-2009; emphasis is given to
different indicators, including the market share of assets, volume of non-performing loan and
non-performing loan ratio, capital adequacy and profitability of different ownerships of
commercial banks. Finally, we discuss the challenges faced by the Chinese banking sector.
This chapter is structured as follows: section 2.2 reviews the evolution of Chinese banking
reforms that have taken place over the last three decades. Section 2.3 provides the structure of
the Chinese banking sector, mainly focusing on the introduction of the banking regulatory
authority and different ownerships of commercial banks. Section 2.4 overviews the Chinese
banking sector over the period 2003-2009. Section 2.5 discusses the challenges faced by the
Chinese banking industry. Section 2.6 provides the conclusion of this chapter.
2.2 China’s banking reforms
As one important component of the financial system, China's banking sector plays an
important role in the development of the country‟s economy. In order to have a healthy and
well-developed banking sector, the Chinese government has implemented a series of reforms
which can be mainly divided in to three periods, as follows: (a) from 1979 to 1994, (b) from
1994 to 2001, and (c) after 2001 when China joined the WTO.
The Chinese socialist banking system was established in the late 1940s following the system
in the former Soviet Union. The central bank, the People‟s Bank of China (PBC), was
founded in 1948 through the consolidation of the former HuaBei Bank, Beihai Bank and
XiBei Peasant Bank. PBC was stripped of its central bank functions during the Cultural
Revolution (1966-1976), but later regained responsibility for currency issue and monetary
control.
22
Prior to the economic reform in 1978, the Chinese banking industry was a mono-banking
system, and PBC combined the roles of central and commercial banking. The banks - which
were either taken over/restructured into the PBC or under administration by PBC or the
Ministry of Finance - were just part of the hierarchy to ensure that national production plans
would be fulfilled, and they had no incentive to compete with one another. Since 1978, a
number of reforms have been gradually implemented by the Chinese government in order to
improve performance and create a more competitive environment in the banking sector (Yao
et al. 2007).
The two-tier banking system was established during the first reform period starting from
1979-1984 with the purpose of improving the service to state-owned enterprise and
increasing bank productivity. The first tier of the banking system is the Peoples‟ Bank of
China, which is also the central bank of China, the responsibility of which is to supervise the
operation of various financial institutions, such as all specialized banks, non-bank financial
institutions and insurance companies. While on the other hand, the second tier of the banking
system mainly comprises four newly established stated owned commercial banks, namely
Bank of China (BOC, established in 1912), China Construction Bank (CCB, established in
1954), Agricultural Bank of China (ABC, established in 1979), and Industrial and
Commercial Bank of China (ICBC, established in 1984). During this period, all these four
state-owned commercial banks serve as the lending arms of the government; they make loans
to state-owned enterprises in order to fulfil the state plan under government directions. To be
more specific, each of these four state-owned commercial banks is responsible for credit
allocation in specific economic sections. For instance, ABC mainly provides the financial
services to the agricultural sector, while CCB makes loans to infrastructure projects and
urban housing development. ICBC provides financial support with regards to commercial and
industrial activities in urban areas, and further, BOC focuses its business on foreign exchange
and foreign business transactions. In order to make it more convenient for the local
enterprises to obtain credits, various branches and local offices are established in different
provinces around the country. The operation of these branches is governed by the local
authorities rather than the central bank. Due to the fact that the function of these
branches/offices is to help local government to fulfil their production plan, they mainly make
loans to state-owned enterprises without consideration of profitability.
Due to the fact that during this period of time, the state-owned enterprises in China are highly
inefficient and they make huge amount of losses every year from their operation, the loan
23
provisions of state-owned commercial banks to these enterprises increase the bank risk. Also,
the higher rate of loan default rate accumulates the volume of non-performing loans.
Furthermore, as discussed earlier, each of these four state-owned commercial banks provides
loan services to the specific economic sector; they have strong market power in the
designated area which leads to no competition among these four banks. In order to increase
the competition among these four banks, which is also in line with the goal of establishing a
market-oriented economy, the four state-owned commercial banks have been allowed to
make loans to any economic sector without any restriction since 1985. They compete with
each other in various areas, such as loan and deposit services, fund raising and capital
allocation. Hence, the competition at this stage is very limited due to the fact that no foreign
banks exist within the Chinese banking industry, and more importantly, the central and local
government still have strong intervention in the banks‟ operation (Yao et al., 2007).
In order to ameliorate the problem of large volume of non-performing loans in the Chinese
banking sector, especially in the state-owned commercial banks, three policy banks were
established in 1994 by the Chinese government to take over the policy leading
responsibilities: the China Development Bank (CDB); China Export-Import Bank of China
(CEIB) and Agriculture Development Bank of China (ADBC). They are funded by issuing
bonds and accepting few deposits and they are wholly owned by the government. They aim to
accomplish the policy of the country for industrial and regional development. Unlike other
institutions mentioned above, they are not organizations for profitability. To be more specific,
CDB mainly provides loans to government-invested projects related to infrastructure
construction and pillar industry; while CEIB mainly supports government in terms of
providing loans to export and import of capital goods; finally ADBC mainly funds state-
invested projects with regards to agricultural development in rural areas.
Two important banking laws were enacted in 1995: The Law of the People‟s Bank of China,
and The Commercial Bank Law. The Law of the People‟s Bank of China was enacted in
order to (a) define the status and functions of the People‟s Bank of China, (b) ensure the
correct formulation and implementation of monetary policy, and (c) establish and improve
the macroeconomic management system of the central bank and maintain financial stability.
Furthermore, it stipulates that the People‟s Bank of China shall be under the leadership of the
State Council and is free from intervention by local governments, government departments at
various levels, non-governmental organizations and individuals. The Commercial Bank Law
was formulated to protect the legitimate rights and interests of commercial banks, depositors
24
and other clients, but also to standardize the behaviour of commercial banks, and improve the
quality of funds, strengthen supervision and administration, ensure safety and soundness of
commercial banks, and maintain a normal financial order and promote the development of the
socialist market economy. The establishment of these two laws not only formalizes the
operation of Chinese commercial banks, but gives commercial banks more autonomy in
terms of credit allocation. Although the policy lending activities of state-owned commercial
banks was taken over by policy banks, the central and local government still allocate the
policy lending tasks to state-owned commercial banks.
The barriers to entry for new banks were relaxed by the PBC since the mid-1980s, the
purpose of which is to increase competition in the banking sector. Joint-stock commercial
banks (JSCBs) started to be set up and operated nationwide, the aim of which is to maximize
the profit. In 1987, the Bank of Communication (BOCOM) was established and became the
first joint-stock commercial bank in China. Several other joint-stock commercial banks
(JSCBs) were established in the late 1980s and early 1990s, including CITIC Bank; China
Merchant Bank; Shenzhen Development Bank; China Everbright Bank; Industrial Bank;
Guangdong Development Bank; Huaxia Bank and Shanghai Pudong Development Bank;
while two joint-stock commercial banks (JSCBs) were established in 1996 which are Bohai
Bank and Minsheng Bank; the last two joint-stock commercial banks (JSCBs) in China
include Evergrowing Bank and Shanghai Pudong Development Bank, which were established
in 2003 and 2004, respectively. As distinct from the big four state-owned commercial banks
(SOCBs), which are mainly owned by the Chinese government, the joint-stock commercial
banks (JSCBs) in China are made up by the shares of three parties; one is from the local
government; and the other one is from the large size enterprises, while the third shareholder is
attributed to the contribution from foreign banks. Due to the fact that when compared to the
state-owned commercial banks, the joint-stock commercial banks have relatively more
freedom and less government intervention, it is supposed that joint-stock commercial banks
have healthier asset quality, higher profitability and a lower volume of non-performing loans.
Besides the joint-stock commercial banks, a number of urban credit cooperatives and rural
credit cooperatives were also established at the beginning of 1990s, which finance small and
medium-sized rural and urban enterprises and individuals. Because of the fact that the local
government invests the funds to establish the cooperatives, government officials have
absolute control over the operations of the cooperatives. Bribery from various high risk
25
firms/companies induces government officials to put pressure on the cooperatives to make
loans to them which leads to the accumulation of non-performing loans.
Four assets management companies (AMCs) were established by the Chinese government in
1999 with the purpose of reducing the non-performing loans of the Big Four SOCBs. These
are: Cinda AMC; Oriental AMC; Great Wall AMC; and Huarong AMC. The original idea is
to assign one AMC to each state-owned commercial bank, with Cinda to the China
Construction Bank; Oriental to the Bank of China; Great Wall to the Agricultural Bank of
China and Huarong to the Industrial and Commercial Bank of China. The volume of non-
performing loans from the four SOCBs written-off by the AMCs reached RMB 1.4 trillion in
1999-2000, which reduced the non-performing loan ratio by 10% for the SOCBs. In other
words, the non-performing loan ratio decreased from 35% to 25%. There were another two
non-performing loan write-offs by the four AMCs, which happened in 2004 and 2005,
respectively. In 2004, the non-performing loans valued at RMB 278.7 billion from Bank of
China and China Construction Bank were purchased by Cinda AMC and finally, in 2005, the
non-performing loans worth 142.4 billion of RMB from Bank of China, RMB 56.9 billion
from China Construction Bank and RMB 64 billion from Bank of Communication were
purchased by Oriental and Cinda AMCs. These purchases reduced the volumes of non-
performing loans of Chinese state-owned banks. According to the regulations for the
Financial Assets Management Corporations, the AMCs are supervised by the PBC, the
Ministry of Finance and the State Securities Supervisory Committee of China.
China‟s entry into the WTO marks the Chinese banking industry‟s entering a new era with
more fierce competition with foreign banks. In order to comply with the WTO commitment,
the Chinese banking sector has gradually opened up to face higher competition from foreign
financial institutions and the restriction to foreign banks to offer currency business in China
has been gradually removed. To be more specific, by the end of 2001, foreign banks were
allowed to offer foreign currency business to Chinese and foreign enterprises and individuals
all over the country, while in terms of local currency business, they are only allowed to offer
to foreign enterprises and overseas citizens in specific cities, such as Shanghai, Shenzhen,
Dalian and Tianjin. By the end of 2002, the restriction had been released to a certain extent
such that besides the above mentioned cities, foreign financial institutions could offer local
currency business to Guangzhou, Nanjing, Qingdao, Wuhan and Zhuhai. By the end of 2003,
more cities were allowed to be offered local currency business by foreign financial
institutions including Ji‟nan, Fuzhou, Chengdu and Chongqing. Furthermore, the local
26
currency business can be offered to all Chinese and foreign enterprises and overseas citizens.
By the end of 2004, the number of cities expanded further to include Beijing, Xiamen,
Kunming, Shengyang and Xi‟an. Besides the above mentioned cities, Ningbo, Shantou,
Harbin, Changchun, Lanzhou, Yinchuan and Nanning were added by the end of 2005. The
foreign financial institutions were treated exactly the same as domestic banks with regards to
providing local currency business by the end of 2006.
The China Banking Regulatory Commission (CBRC) was established in March 2003 with the
purpose of increasing the efficiency of the regulatory and supervisory functions of the
banking sector. The establishment of CBRC makes the central bank of China - the People‟s
Bank of China (PBC) free to focus on its role in China‟s macroeconomic management. The
CBRC is under control by the State Council. Furthermore, two laws took effect in 2005: the
Law of the People‟s Republic of China on the People‟s Bank of China and the Law of the
People‟s Republic of China on Commercial Banks, both of which aim to improve
performance and stability in the Chinese banking sector.
“Regulations Governing Capital Adequacy of Commercial Bank”, the new rule regarding the
capital adequacy level of Chinese commercial banks, was promulgated by the CBRC in
February 2004 in order to improve the risk management and enhance stability in the Chinese
banking sector. The formulation of the rule was based on the combination of 1998 Basel
Capital Accord (Basel I) and 2002 Basel Capital Accord (Basel II). Commercial Bank Law
enacted in 2005 had the clause requiring the commercial banks to keep the minimum capital
adequacy ratio at 8%, while the new rule complemented the law by providing the mechanism
for calculating the capital ratio of commercial banks. The new rule further stipulated that all
the commercial banks needed to meet the minimum capital adequacy ratio at 8% before 1st
January 2007. The computation procedure implemented by the new rule increased the Capital
Adequacy Ratio (CAR) of commercial banks by on average 2%, compared to the old rule
(Basel I). In other words, the new rule imposed stricter requirements on the capital adequacy
level of Chinese commercial banks. A requirement was also made by the regulatory
authorities asking Chinese banks to establish the risk management structures and rating
system. As a consequence, based on the new Basel Capital Accord (Basel II), the new
internal rating and credit risk management systems were developed by three state-owned
commercial banks, namely the Bank of China (BOC), the China Construction Bank (CCB)
and the Industrial and Commercial Bank of China (ICBC).
27
According to the Finance and Insurance Enterprise Financial Regulation established by the
Ministry of Finance in 1993, the Chinese commercial banks classified the loans into four
categories before 1998. These are normal loan, past due loan, doubtful loan and bad loan,
respectively. According to this system, the non-performing loans consist of past due loan,
doubtful loan and bad loan. This classification places emphasis on the payment status of
loans rather than the risk assessment. On May 1998, with reference to international practice
combined with China‟s national conditions, the PBC formulated the loan classification
guidelines which require the Chinese commercial banks to classify the loans into five
categories according to borrowers‟ capabilities of repaying the loans: normal, special
attention, sub-standard, doubtful and loss. The sub-standard, doubtful and loss are non-
performing loans. Although this new loan classification was introduced in 1998, it was only
fully implemented by Chinese commercial banks in 2003. Compared to the four-category
loan system, the new classification emphasises the risk assessment. The normal and special
attention belongs to performing loans, while the non-performing loans include sub-standard,
doubtful and loss.
The pilot state-owned bank-overhaul program was initiated by the state council in 2003, as
indicated by the title of the program, it is mainly oriented to the state-owned commercial
banks and the purpose is to inject fresh capital, resolve the issue of non-performing loans and
improve the corporate governance. The first two state-owned banks in this program are Bank
of China and China Construction Bank, respectively, which has been injected capital worth of
USD 22.5 billion in December 2003. The second group of banks which obtained capital
injections from the government is Bank of Communication and Industrial and Commercial
Bank of China. To be more specific, the Chinese government injected capital worth of RMB
3 billion to the Bank of Communication in 2004 and capital worth of USD 15 billion was
injected to Industrial and Commercial Bank of China in 2005. The capital injections
substantially write-off the non-performing loans for these banks.
In order to improve the risk management and acquire fresh capital, all the Chinese banks are
encouraged to attract foreign strategic investment. In other words, the Chinese government
welcomes the investment from foreign investors to the domestic Chinese banks. The
regulation regarding foreign equity investment in Chinese financial institutions was issued by
the CBRC in December 2003. The regulation stipulates that a single foreign investor cannot
hold more than 20% ownership stake in a local bank, while the total foreign investments can
hold up to 25% of total equity in one domestic Chinese bank. Thus, the foreign investors are
28
allowed to take a minority ownership in Chinese financial institutions and through this little
involvement in the bank‟s operation, Chinese banks can obtain more experience in terms of
risk management. From 2003 to 2007, during the restructuring of the major Chinese banks,
there was a boom for foreign investment in China, until by the end of 2008, 21 Chinese
banks, including 3 big state-owned commercial banks, 10 joint-stock commercial banks and 8
city commercial banks, had introduced 29 foreign strategic investors (Hasan and Xie 2012).
In order to improve the efficiency and corporate governance of the Chinese banks, all the
banks are encouraged to be listed on the stock exchange. The first bank offering its initial
public offering (IPO) is the ShenZhen Development Bank, which was listed on the ShenZhen
Stock Exchange in 1991. In October 2005, the China Construction Bank (CCB) successfully
offered its initial public offering (IPO) on the Hong Kong Stock Exchange, becoming the first
listed state-owned commercial bank in China. Another two state-owned commercial banks,
BOC and ICBC, offered their initial public offerings on the Hong Kong Stock Exchange on
June and October 2006, respectively. The offshore markets are preferred by the Chinese
government due to the consideration that overseas markets are stricter than the domestic
market in terms of information disclosure which is supposed to promote the structural reform
and efficiency improvement of Chinese banks. In order for the domestic banks to obtain more
capital from the domestic investors, BOC, ICBC and CCB were listed on the Shanghai Stock
Exchange as well on July 2006, Oct 2006 and September 2007, respectively. By the end of
2009, there were a total of thirteen Chinese commercial banks listed on stock exchanges.
2.3 Structure of Chinese banking sector
2.3.1 The Banking Authority
There are two regulatory authorities in China‟s banking system: the People‟s Bank of China
(PBC) and the China Banking Regulatory Commission (CBRC). Both of these authorities are
governed by the State Council of the People‟s Republic of China. The PBC was established
on December 1st 1948 and the State Council decided to have the PBC function as the central
bank on September 1983. The main functions performed by the PBC are as follows: 1)
formulate and implement monetary policy in accordance with law; 2) issue the Reminbi and
administrate its circulation; 3) regulate financial markets, including the inter-bank lending
markets, the inter-bank bond market, foreign exchange market and gold market; 4) prevent
and mitigate system financial risks to safeguard financial stability; 5) maintain the Renminbi
29
exchange rate at adaptive and equilibrium level, hold and manage the state foreign exchange
and gold reserves.
In order that the PBC can concentrate on the monetary policy issues, its banking regulation
and supervision function was taken over by the China Banking Regulatory Commission
(CBRC), which was established in 2003. The main functions of the CBRC include: 1)
formulate supervisory rules and regulations governing the banking institutions; 2) authorize
the establishment, changes, termination and business scope of the banking institutions; 3)
conduct on-site examination and off-site surveillance of the banking institutions and take
enforcement actions against rule-breaking behaviours. The regulatory objectives of the
CBRC include: 1) protect the interests of depositors and consumers and maintain market
confidence through prudential and effective supervision; 2) promote the financial stability
and enhance the international competitiveness of the Chinese banking sector.
2.3.2 Five Large-scale Commercial Banks
The Big Four state-owned commercial banks (SOCBs) are the Agricultural Bank of China
(ABC), the China Construction Bank (CCB), the Industrial and Commercial Bank of China
(ICBC) and the Bank of China (BOC). They are commonly known as Big Four, which are
initially the lending arms of the government and they mainly make loans to the state-owned
enterprises (SOEs) in specific sectors of the economy. However, in 1994, on the
establishment of three policy banks in China to conduct policy lending responsibilities
directed by the Chinese government, the state-owned commercial banks (SOCBs) started
engaging in the consumer and commercial businesses. Due to the fact that the state-owned
commercial banks (SOCBs) have provided credits to the state-owned enterprises (SOEs) for
quite a long time and most of the state-owned enterprises (SOEs) at that time were not
profitable, the accumulation of non-performing loans in the state-owned commercial banks
(SOCBs) constrains their earnings and profitability. In 2006, Bank of Communication
(BOCOM) was officially defined as a state-owned commercial bank by the CBRC, together
with the Big Four; there are five state-owned commercial banks (SOCBs) in China‟s banking
sector. A special supervision department was set up by the CBRC to oversee the operation of
these five state-owned commercial banks (SOCBs). At the end of 2009, the total assets of the
five state-owned commercial banks (SOCBs) reached RMB 40089.03 Billion, which is 26%
higher than the figure in 2008. However, the five state-owned commercial banks‟ assets as a
proportion of total banking industry assets have fallen to 50.9% from 53% and 51% in 2007
30
and 2008, respectively. In spite of this, these five state-owned commercial banks (SOCBs) do
and will still continue to dominate China‟s banking system.
Agricultural Bank of China
The predecessor of the Agricultural Bank of China (ABC) is the Agricultural Cooperative
Bank, established in 1951. On 15th
January 2009, the bank was restructured into a joint-stock
limited liability company. Capitalizing on the comprehensive business portfolio, extensive
distribution and advanced IT platform, the bank provides various corporate and retail banking
products and services for a broad range of customers. At the end of 2009, it had 441,144
employees across 23624 branches and banking offices in the Mainland China, two overseas
branches in Hong Kong and Singapore and five representative offices in New York, London,
Tokyo, Frankfort and Seoul. According to the annual statement, the total assets of the bank
reached RMB 8.8 trillion at the end of 2009. Its total deposits and total loans reached RMB
7.5 and 4.1 trillion in 2009, respectively. In addition, the operating profit achieved in 2009
was RMB 65 billion with a growth rate of 26.3% compared to the previous year. In 2009,
ABC ranked 155 among “Fortune‟s Global 500”, and 8th
among the “Top 100 Banks” in the
Banker.
China Construction Bank
The China Construction Bank (CCB) was originally established in 1954 and aimed to be in
charge of the administration and allocation of government funds for construction and
infrastructure related projects. CCB became a fully commercial bank in 1994. Its business
scope mainly includes providing corporate banking, personal banking, treasury operations
and various products and services (such as infrastructure loans, residential mortgages and
banking card business). Furthermore, on 27th
October 2005, the bank offered its initial public
offering (IPO) on the Hong Kong Stock Exchange and on 25th
of September 2007; it was
successfully listed on the Shanghai Stock Exchange. At the end of 2009, it had 300,000
employees across 13384 branches and banking offices in the Mainland China, 8 overseas
branches located in Hong Kong, Singapore, Frankfort, Tokyo, Seoul, New York,
Johannesburg and Ho Chi Minh City. The value of the bank reached USD 201 billion at the
end of 2009 which is ranked as the second among all the listed banks around the world.
According to the information released from the bank, its total assets reached RMB 9.6 trillion
31
at the end of 2009 while the total deposits and total loans reached 8 and 4.8 trillion in 2009,
respectively. In addition, the operating profit achieved in 2009 was RMB 107 billion with a
growth rate of 15.32% comparing to the previous year. It ranked 125 among “Fortune‟s
Global 500”, and 12th
among “Top 100 Bank” in the Banker.
Bank of China
Bank of China (BOC) was established in February 1912 and it is the oldest bank in China.
After the founding of the People‟s Republic of China, the Bank of China became a
specialized foreign exchange and international trade bank, making significant contributions to
the development of China‟s foreign economy and trade as well as its domestic economy. In
August 2004, Bank of China Limited was established and then listed on Hong Kong and
Shanghai Stock Exchange in June and July 2006, respectively, becoming the first Chinese
commercial bank listed in both the mainland and Hong Kong. As the most internationalized
and diversified bank in China, Bank of China provides a full range of financial services in
China‟s mainland, Hong Kong, Macau and other 31 countries. It mainly provides the
commercial banking businesses, including corporate banking, personal banking and financial
market business. It also conducts investment banking as well as insurance services, fund
management services, direct investment, investment management and aircraft leasing
services. At the end of 2009, the total assets of the bank reached RMB 8.7 trillion, while the
total loans were RMB 4.9 trillion with a growth rate of 48.97% as compared to the previous
year. The total deposits of the bank reached RMB 6.6 trillion with an annual growth rate of
29.22% as compared to the previous year. In terms of the operating profit, it increased by
27.2% with a figure of RMB 80.8 billion in 2009 as compared to 2008. The Banker awarded
Bank of China the “Bank of the year in China” in 2009.
Industrial and Commercial Bank of China
The Industrial and Commercial Bank of China (ICBC) was established on the 1st of January
1984 and it was restructured into a limited liability company on the 28th
of October 2005. On
the 27th
of October 2006, ICBC successfully offered its initial public offering (IPO) in both
the Shanghai and Hong Kong Stock Exchange. It was the world‟s largest IPO at that time,
valued at US$21.9 billion.
32
Through staffs‟ consistent efforts and stable development, ICBC has become the listed bank
in the world with highest value and profitability and it is also the number one bank in the
world in terms of the amount of deposits. It had 16232 outlets in the mainland China, 162
overseas subsidiaries and 1504 representative offices. At the end of 2009, it achieved the net
profit of RMB 129.35 billion with a growth rate of 16.4% as compared to the previous year.
The total loan of the ICBC at the end of 2009 reached RMB 5728.6 billion with a growth rate
of 25.3% as compared to 2008, while the total deposits of the bank were RMB 9771.2 billion
with a growth rate of 21.6% as compared to the previous year. The total assets of the bank at
the end of 2009 achieved RMB 11785 billion with a growth rate of 20.8% as compared to
2008. It was awarded the “Best Bank in China” by the “Global Finance” and the “Best Large-
Scale Retail Bank in China” by “Asian Banker”.
Bank of Communication
Bank of Communication Co., Ltd was found in 1908 and it is one of the oldest bank in China
and one of the note-issuing banks in the Modern China. On June 2005 and May 2007, it was
listed on the Hong Kong and Shanghai Stock Exchange, respectively.
The bank provides a range of financial services, including commercial banking, brokerage
services, trust services, finance leases, fund management, insurance and offshore financial
services. It has three wholly-owned subsidiaries, which are Bank of Communication
International, Bank of Communication Insurance and Bank of Communication Leasing, while
it also has controlling interests in a number of subsidiaries, including Bank of
Communication Schroder, Bank of Communication International Trust, BoCommnLife
Insurance Company Limited and Dayi Bocom Xingming Rural Bank. At the end of 2009, the
total assets of the bank achieved RMB 3.3 trillion and the net profit was over RMB 30
billion, with a growth rate of 23.56% and 5.81%, respectively, while the total deposits and
loans reached RMB 2372 and 1839.3 billion, with a growth rate of 27.13% and 38.44%,
respectively as compared to the previous year. At the end of 2009, the bank had 113 domestic
branches and 2648 outlets in more than 190 major cities in the mainland China. The bank
also had 9 overseas institutions in Hong Kong, New York, Tokyo, Singapore, Seoul,
Frankfurt and Macau, and 2 representative offices in London and Sydney. According to the
ranking of the “Top 100 world banks 2009” published by the British Magazine, “The
Banker”, the bank‟s total assets ranked 56.
33
2.3.3 Joint-stock Commercial Banks
There are 12 joint-stock commercial banks (JSCBs) at the moment: CITIC Bank; Industrial
Bank; China Merchants Bank; Shanghai Pudong Development Bank; Huaxia Bank; China
Minsheng Bank; Shenzhen Development Bank; China Everbright Bank; Guangdong
Development Bank; Evergrowing Bank; China Zheshang Bank and Bohai Bank. According
to the 2009 annual statement from the China Banking Regulatory Commission (CBRC), the
total assets of Joint-Stock Commercial Banks were RMB 117 billion by the end of 2009,
accounting for 15% of total assets in Chinese banking sector, which was 1% higher than
2008.
A wide range of banking services is allowed to be engaged by the joint-stock commercial
banks, which include accepting deposits, extending loans and providing foreign exchange and
international transaction services. Rather than making loans to the large enterprises, the joint-
stock commercial banks (JSCBs) mainly provide credits to the Small and Medium size
Enterprises (SMEs). In order to obtain additional external monitoring and improve the bank‟s
management, all the JSCBs are encouraged to be listed on the stock exchange. Following
Shenzhen Development Bank, which offered its initial public offering (IPO) in 1997, there
are six other JSCBs listed on the stock exchange, including Industrial Bank, China Merchants
Bank, Shanghai Pudong Development Bank, Huaxia Bank, China CITIC Bank and China
Minsheng Bank.
2.3.4 Policy Banks
The policy lending obligations undertaken by the Big Four state-owned commercial banks
(SOCBs) were taken over by the three policy banks established in 1994. Each of these three
policy banks is responsible for providing credits to different sectors of the economy. The
Agricultural Development Bank of China (ADBC) mainly promotes development of
agriculture and rural areas through the following activities: 1) raise the funds for agricultural
policy businesses on the state creditability in accordance with the laws, regulations and
policies; 2) undertake the agriculture policy credit businesses specified by the central
government, agriculture-related commercial businesses approved by the regulators; 3) serve
as an agent for the state treasury to allocate the special funds for supporting agriculture.
China Development Bank (CDB) supports the development of national infrastructure, basic
industry, key emerging sectors and national priority projects; promotes coordinated regional
34
development and urbanisation by financing small business, education, healthcare,
agricultural/rural investment, low-income housing, and environmental initiatives; facilitates
China‟s cross-border investment and global business cooperation. The establishment of the
Export-Import Bank of China (EXIM) is to facilitate the export and import of Chinese
mechanical and electronic products, complete sets of equipment and new-and high-tech
products; assist Chinese companies with comparative advantages in their offshore contract
projects and outbound investment, and promote Sino-foreign relationship and international
economic and trade cooperation. The total assets of the three policy banks at the end of 2009
reached RMB 6945.6 billion with a growth rate of 23% as compared to 2008, while the after-
tax profit of the policy banks at the end of 2009 reached 35.25 billion with a growth rate of
53% as compared to 2008.
2.3.5 City Commercial Banks (CCBs)
The city commercial banks (CCBs) have been created through the restructuration and
consolidation of urban credit cooperatives (UCCs) since the mid 1990s. They have the
characteristic of small size in terms of the market share. By the end of 2009, there were 143
city commercial banks, with total assets of RMB 5680.01 billion, accounting for 7.2% of total
banking institution assets in China with a growth rate of 4.9% comparing to the previous
year. The ownership of city commercial banks consists of local governments and urban
enterprises with the former holding substantially larger shares. Thus, the local government
has direct control over the operation of CCBs, and the CCBs have little power in terms of
allocating credits and making lending decisions. The stronger intervention from the local
government leads to the accumulation of non-performing loans in CCBs.
The city commercial bank‟s business scope is limited in the city where it was found. Unlike
the joint-stock commercial banks (JSCBs), the city commercial banks (CCBs) were not
allowed to operate at the national regional level which restricts their potential for expansion.
However, the limitation to the city commercial banks on their business scope was gradually
relaxed by the regulatory authorities and CCBs, with sound management and good
performance, are allowed to engage in business in other cities. The first city commercial bank
to receive approval was the Bank of Shanghai, which opened its branch in Ningbo in 2005.
Because of the unequal economic development among different cities, the trans-regional
operation for CCBs will reduce the influence of economic fluctuation on the bank
performance to the minimum level and it also increases the competitive power of CCBs. In
35
order to promote diversification of investment, accelerate the improvement of corporate
governance structure and increase the capital adequacy ratio, the foreign strategic investment
started in the Chinese banking sector in 2001, when the international financial corporation
took 7% stakes in the Bank of Shanghai. By the end of 2008, 8 city commercial banks had
introduced the foreign strategic investors.
2.4 The overview of Chinese banking sector over the period 2003-2009
Figure 2.1 shows the total assets of the Chinese banking sector over the period 2003 to 2009.
As the figure indicates, the assets of the Chinese banking sector keep increasing to the highest
point in 2009. This growth of assets in the banking sector suggests that there is an increasing
demand for banking services in China, and also indicates that the banking sector still plays a
dominant role in providing financial services in China. Furthermore, the figure shows the
total assets of different ownerships of Chinese banks (state-owned commercial banks, joint-
stock commercial banks, city commercial banks and foreign banks). We can see that the
assets of all groups of commercial banks keep increasing to 2009; this indicates that different
ownerships of Chinese banks have undergone good development over the examined period.
Figure 2.2 shows the market share of total assets for different ownerships of Chinese
commercial banks over the period 2003-2009. In terms of the state-owned commercial banks,
the market share keeps declining to the lowest point in 2009, while on the other hand, the
market shares of joint-stock and city commercial banks keep increasing over the period. This
figure indicates that although the state-owned commercial banks still dominate in the Chinese
banking market, their competition with other groups of Chinese banks has been improved. On
the other hand, the market shares of joint-stock and city commercial banks in China keep
increasing. This figure shows that, although Chinese state-owned commercial banks are the
biggest banking group in China, its market power has slightly decreased and that competition
in the Chinese banking sector is growing. We further notice that the market share of foreign
banks in China keeps increasing over the period 2003-2007, attributable to the fact that China
gradually opened up its banking sector after its entry into WTO at the end of 2001, as
discussed in the section of China‟s banking reform. By the end of 2006, the foreign banks
were treated exactly the same as domestic banks, which resulted in an increasing volume of
business engaged by foreign banks and further led to an increase in the market share.
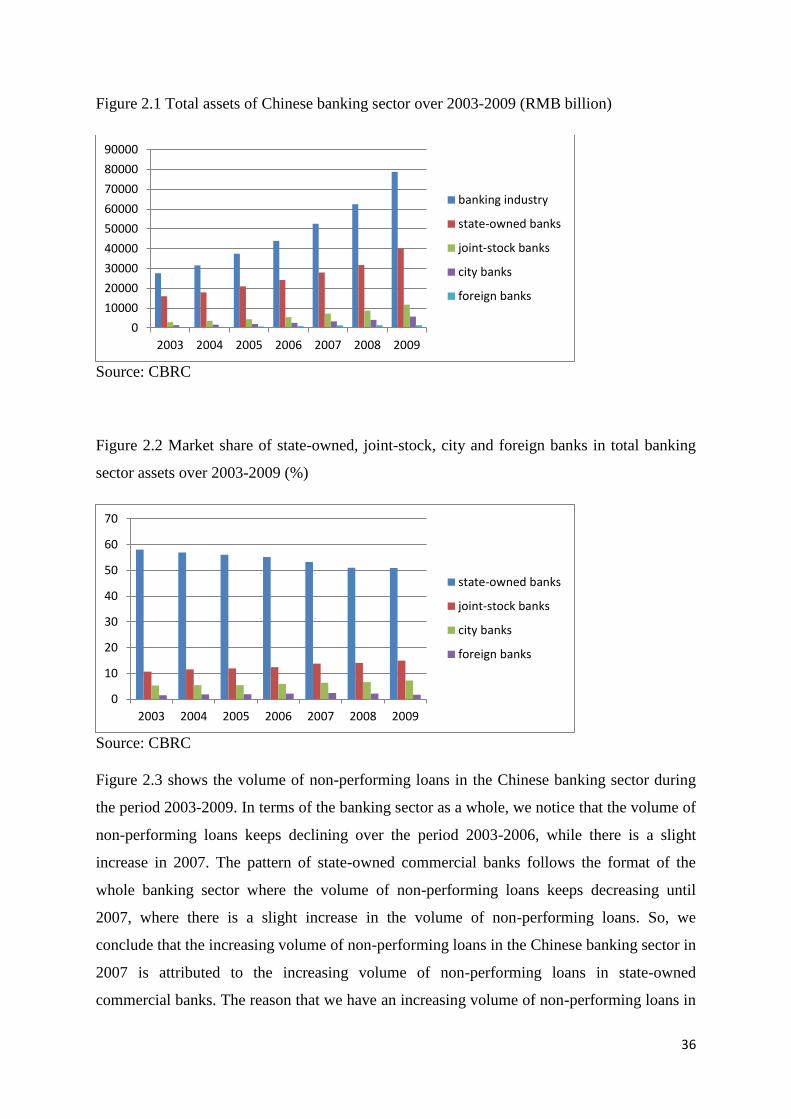
36
Figure 2.1 Total assets of Chinese banking sector over 2003-2009 (RMB billion)
Source: CBRC
Figure 2.2 Market share of state-owned, joint-stock, city and foreign banks in total banking
sector assets over 2003-2009 (%)
Source: CBRC
Figure 2.3 shows the volume of non-performing loans in the Chinese banking sector during
the period 2003-2009. In terms of the banking sector as a whole, we notice that the volume of
non-performing loans keeps declining over the period 2003-2006, while there is a slight
increase in 2007. The pattern of state-owned commercial banks follows the format of the
whole banking sector where the volume of non-performing loans keeps decreasing until
2007, where there is a slight increase in the volume of non-performing loans. So, we
conclude that the increasing volume of non-performing loans in the Chinese banking sector in
2007 is attributed to the increasing volume of non-performing loans in state-owned
commercial banks. The reason that we have an increasing volume of non-performing loans in
0
10000
20000
30000
40000
50000
60000
70000
80000
90000
2003 2004 2005 2006 2007 2008 2009
banking industry
state-owned banks
joint-stock banks
city banks
foreign banks
0
10
20
30
40
50
60
70
2003 2004 2005 2006 2007 2008 2009
state-owned banks
joint-stock banks
city banks
foreign banks
37
state-owned commercial banks in 2007 can be explained by the fact that, by the end of 2006,
there was no restriction on the business engaged by foreign banks and there are no
geographic restrictions either. The increase in competition induces the state-owned banks to
take higher risk. Furthermore, because the state-owned banks are fully supported by the
government, the managers have less incentive in relation to credit checking and risk
management. These two reasons contribute to the increase in the volume of non-performing
loans in state-owned banks. Comparing to an increase in the volume of non-performing loans
in state-owned commercial banks, there is a slight decrease in the volume of non-performing
loans in foreign banks, which is attributed to the greater experience of risk management of
foreign banks.
We further notice that there is a dramatic decrease in the volume of non-performing loans in
2008 for state-owned commercial banks; this can be attributed to the Olympic Games, held in
Beijing in the same year, which not only stimulated investment but also further reduces the
default rate which precedes a decline in the volume of non-performing loans. We further
notice that rather than experience a decline in the volume of non-performing loans, it can be
seen that the foreign banks in China have an increase in the volume of non-performing loans.
This can be possibly explained by the fact that the 2008 Olympic Games attracted more
foreign banks to enter the Chinese market, and the increased competition among foreign
banks induces them to take higher risk, which further precedes an increase in the volume of
non-performing loans. It is clearly reflected in figure 2.3 that the volume of non-performing
loans in state-owned commercial banks is substantially higher than joint-stock and city
commercial banks. We explain this finding by the following reasons: first, state-owned
commercial banks normally make loans to state-owned enterprises; the poorer performance
of state-owned enterprises increases the default rate and further precedes an increase in the
volume of non-performing loan. Secondly, as indicated in Chinese banking reform, Chinese
government provide different schemes to write-off the non-performing loans for state-owned
banks such as capital injection and using assets management companies which induce the
managers in state-owned banks to be less careful in credit monitoring, Therefore, it leads to
an increase in the volume of non-performing loans.
Figure 2.4 shows the non-performing loan ratios of the Chinese banking sector over the
period 2003-2009. We notice that the banking sector in China as a whole has experienced a
decrease in its non-performing loan ratio over the period, while the same pattern has been
noticed for state-owned, joint-stock and city commercial banks in China. In terms of the
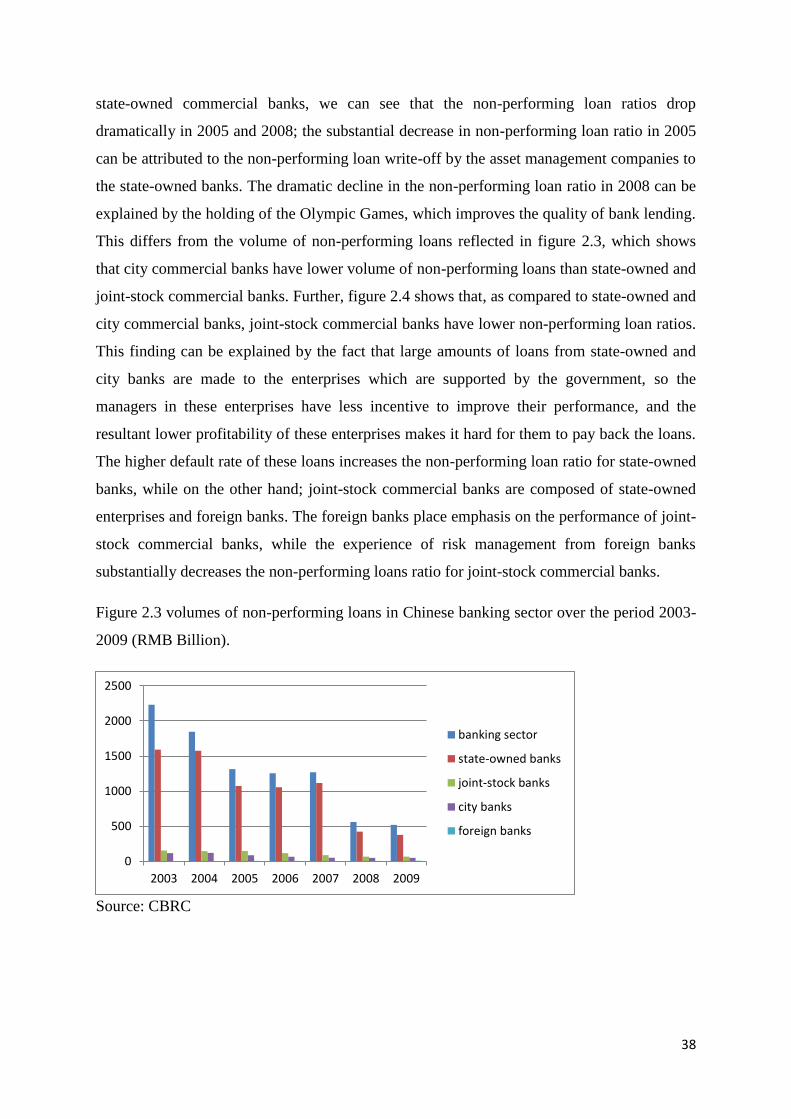
38
state-owned commercial banks, we can see that the non-performing loan ratios drop
dramatically in 2005 and 2008; the substantial decrease in non-performing loan ratio in 2005
can be attributed to the non-performing loan write-off by the asset management companies to
the state-owned banks. The dramatic decline in the non-performing loan ratio in 2008 can be
explained by the holding of the Olympic Games, which improves the quality of bank lending.
This differs from the volume of non-performing loans reflected in figure 2.3, which shows
that city commercial banks have lower volume of non-performing loans than state-owned and
joint-stock commercial banks. Further, figure 2.4 shows that, as compared to state-owned and
city commercial banks, joint-stock commercial banks have lower non-performing loan ratios.
This finding can be explained by the fact that large amounts of loans from state-owned and
city banks are made to the enterprises which are supported by the government, so the
managers in these enterprises have less incentive to improve their performance, and the
resultant lower profitability of these enterprises makes it hard for them to pay back the loans.
The higher default rate of these loans increases the non-performing loan ratio for state-owned
banks, while on the other hand; joint-stock commercial banks are composed of state-owned
enterprises and foreign banks. The foreign banks place emphasis on the performance of joint-
stock commercial banks, while the experience of risk management from foreign banks
substantially decreases the non-performing loans ratio for joint-stock commercial banks.
Figure 2.3 volumes of non-performing loans in Chinese banking sector over the period 2003-
2009 (RMB Billion).
Source: CBRC
0
500
1000
1500
2000
2500
2003 2004 2005 2006 2007 2008 2009
banking sector
state-owned banks
joint-stock banks
city banks
foreign banks
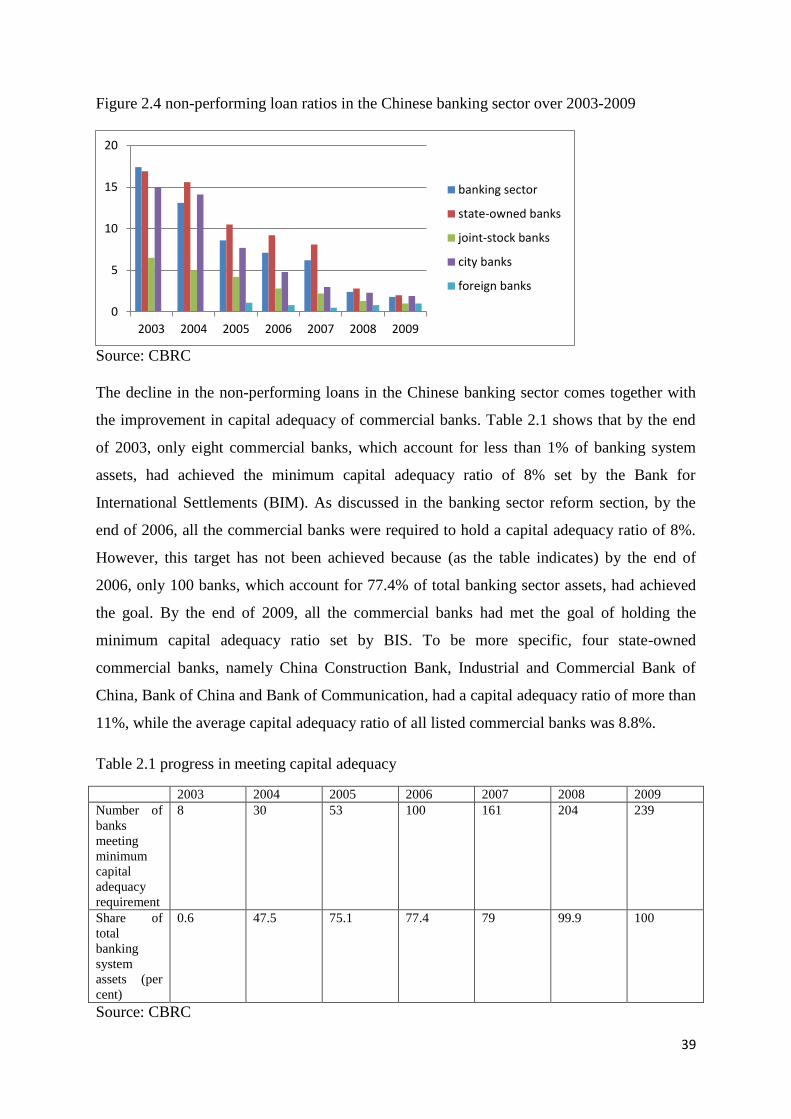
39
Figure 2.4 non-performing loan ratios in the Chinese banking sector over 2003-2009
Source: CBRC
The decline in the non-performing loans in the Chinese banking sector comes together with
the improvement in capital adequacy of commercial banks. Table 2.1 shows that by the end
of 2003, only eight commercial banks, which account for less than 1% of banking system
assets, had achieved the minimum capital adequacy ratio of 8% set by the Bank for
International Settlements (BIM). As discussed in the banking sector reform section, by the
end of 2006, all the commercial banks were required to hold a capital adequacy ratio of 8%.
However, this target has not been achieved because (as the table indicates) by the end of
2006, only 100 banks, which account for 77.4% of total banking sector assets, had achieved
the goal. By the end of 2009, all the commercial banks had met the goal of holding the
minimum capital adequacy ratio set by BIS. To be more specific, four state-owned
commercial banks, namely China Construction Bank, Industrial and Commercial Bank of
China, Bank of China and Bank of Communication, had a capital adequacy ratio of more than
11%, while the average capital adequacy ratio of all listed commercial banks was 8.8%.
Table 2.1 progress in meeting capital adequacy
2003 2004 2005 2006 2007 2008 2009
Number of
banks
meeting
minimum
capital
adequacy
requirement
8 30 53 100 161 204 239
Share of
total
banking
system
assets (per
cent)
0.6 47.5 75.1 77.4 79 99.9 100
Source: CBRC
0
5
10
15
20
2003 2004 2005 2006 2007 2008 2009
banking sector
state-owned banks
joint-stock banks
city banks
foreign banks
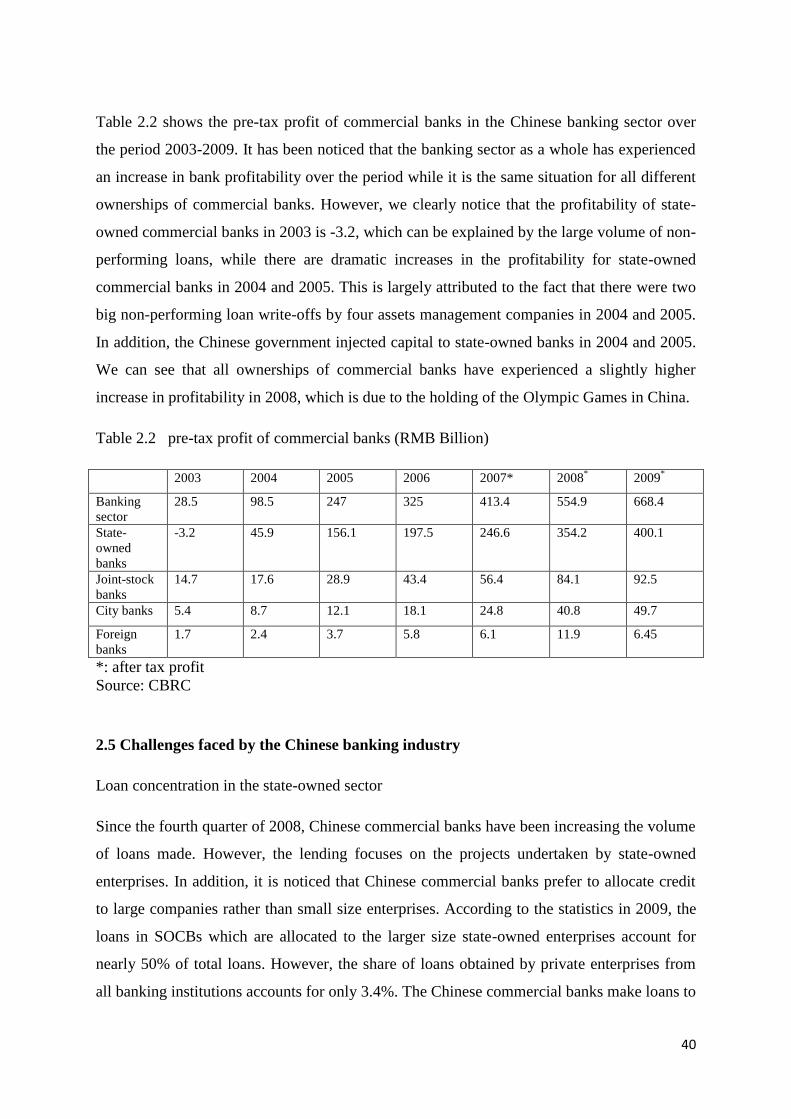
40
Table 2.2 shows the pre-tax profit of commercial banks in the Chinese banking sector over
the period 2003-2009. It has been noticed that the banking sector as a whole has experienced
an increase in bank profitability over the period while it is the same situation for all different
ownerships of commercial banks. However, we clearly notice that the profitability of state-
owned commercial banks in 2003 is -3.2, which can be explained by the large volume of non-
performing loans, while there are dramatic increases in the profitability for state-owned
commercial banks in 2004 and 2005. This is largely attributed to the fact that there were two
big non-performing loan write-offs by four assets management companies in 2004 and 2005.
In addition, the Chinese government injected capital to state-owned banks in 2004 and 2005.
We can see that all ownerships of commercial banks have experienced a slightly higher
increase in profitability in 2008, which is due to the holding of the Olympic Games in China.
Table 2.2 pre-tax profit of commercial banks (RMB Billion)
2003 2004 2005 2006 2007* 2008*
2009*
Banking
sector
28.5 98.5 247 325 413.4 554.9 668.4
State-
owned
banks
-3.2 45.9 156.1 197.5 246.6 354.2 400.1
Joint-stock
banks
14.7 17.6 28.9 43.4 56.4 84.1 92.5
City banks 5.4 8.7 12.1 18.1 24.8 40.8 49.7
Foreign
banks
1.7 2.4 3.7 5.8 6.1 11.9 6.45
*: after tax profit
Source: CBRC
2.5 Challenges faced by the Chinese banking industry
Loan concentration in the state-owned sector
Since the fourth quarter of 2008, Chinese commercial banks have been increasing the volume
of loans made. However, the lending focuses on the projects undertaken by state-owned
enterprises. In addition, it is noticed that Chinese commercial banks prefer to allocate credit
to large companies rather than small size enterprises. According to the statistics in 2009, the
loans in SOCBs which are allocated to the larger size state-owned enterprises account for
nearly 50% of total loans. However, the share of loans obtained by private enterprises from
all banking institutions accounts for only 3.4%. The Chinese commercial banks make loans to
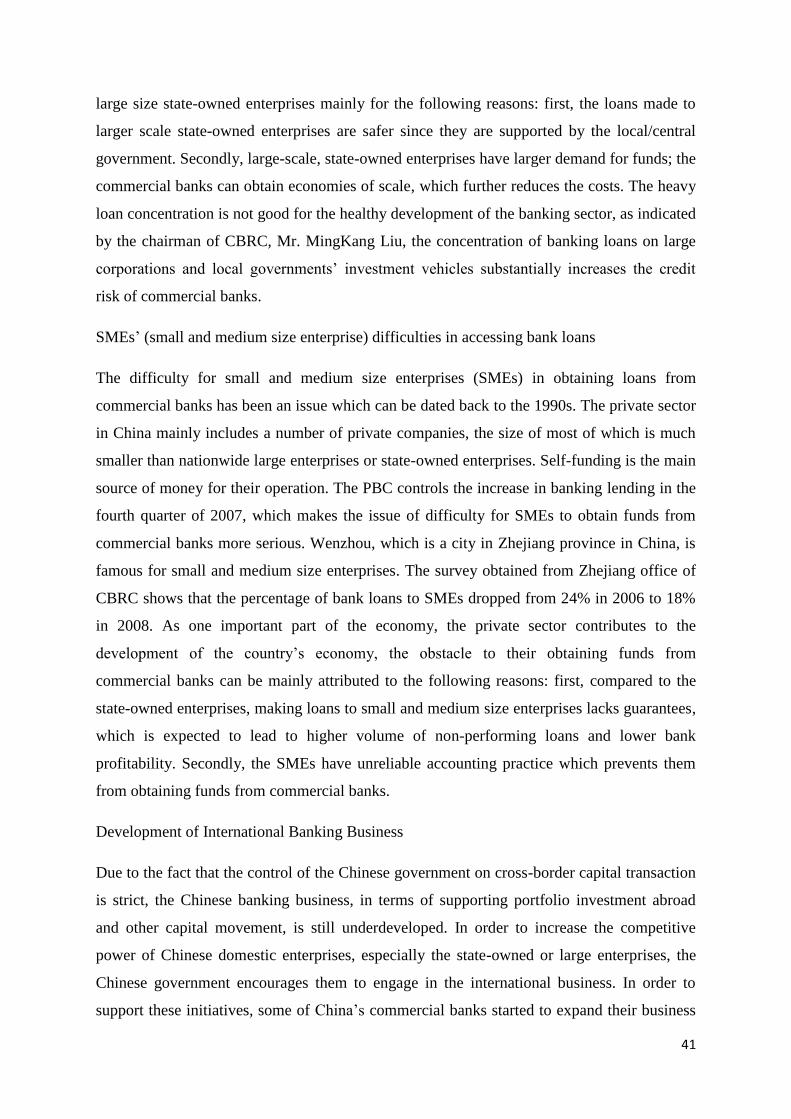
41
large size state-owned enterprises mainly for the following reasons: first, the loans made to
larger scale state-owned enterprises are safer since they are supported by the local/central
government. Secondly, large-scale, state-owned enterprises have larger demand for funds; the
commercial banks can obtain economies of scale, which further reduces the costs. The heavy
loan concentration is not good for the healthy development of the banking sector, as indicated
by the chairman of CBRC, Mr. MingKang Liu, the concentration of banking loans on large
corporations and local governments‟ investment vehicles substantially increases the credit
risk of commercial banks.
SMEs‟ (small and medium size enterprise) difficulties in accessing bank loans
The difficulty for small and medium size enterprises (SMEs) in obtaining loans from
commercial banks has been an issue which can be dated back to the 1990s. The private sector
in China mainly includes a number of private companies, the size of most of which is much
smaller than nationwide large enterprises or state-owned enterprises. Self-funding is the main
source of money for their operation. The PBC controls the increase in banking lending in the
fourth quarter of 2007, which makes the issue of difficulty for SMEs to obtain funds from
commercial banks more serious. Wenzhou, which is a city in Zhejiang province in China, is
famous for small and medium size enterprises. The survey obtained from Zhejiang office of
CBRC shows that the percentage of bank loans to SMEs dropped from 24% in 2006 to 18%
in 2008. As one important part of the economy, the private sector contributes to the
development of the country‟s economy, the obstacle to their obtaining funds from
commercial banks can be mainly attributed to the following reasons: first, compared to the
state-owned enterprises, making loans to small and medium size enterprises lacks guarantees,
which is expected to lead to higher volume of non-performing loans and lower bank
profitability. Secondly, the SMEs have unreliable accounting practice which prevents them
from obtaining funds from commercial banks.
Development of International Banking Business
Due to the fact that the control of the Chinese government on cross-border capital transaction
is strict, the Chinese banking business, in terms of supporting portfolio investment abroad
and other capital movement, is still underdeveloped. In order to increase the competitive
power of Chinese domestic enterprises, especially the state-owned or large enterprises, the
Chinese government encourages them to engage in the international business. In order to
support these initiatives, some of China‟s commercial banks started to expand their business
42
from 2009. For instance, 70% stake in Citic International in Hong Kong was agreed to be
purchased by Citic Bank, In June 2009, 70% stake in Bank East Asia (Canada) Ltd. was
agreed to be purchased by ICBC and at the same time, CCB New York branch and CCB
(London) Ltd. were opened. Finally, stake in ACL Bank public company Ltd. in Thailand
was agreed to be purchased by ICBC on September 2009.
A number of pilot projects aiming to improve the internationalization of the RMB were
initiated by the Chinese government during recent years. The projects mainly focus on two
areas: first to provide the offshore and onshore settlements of RMB payments related to
international trade and the second one focuses on the offshore insurance of bond denominated
in RMB. The achievement of these initiatives is not straightforward due to the fact that the
Chinese government still has relative strict control over the foreign exchange regulations.
However, the banks should be reformed to improve their international business to support the
increasing degree of globalization of the Chinese economy.
Nowadays, Hong Kong plays a vital role in the reform of the Chinese financial system,
especially in the process of development of international business of Chinese commercial
banks. The benefit it brings to the Chinese banking sector can be summarized by the
following points: first, there are quite a few Hong Kong commercial banks owning branches
in the mainland China; these branches benefit Chinese commercial banks with regards to
increasing the capital level and transferring management skills and experience. Secondly, as a
city with a higher degree of internationalization, Hong Kong has the ability to help the
Chinese government increase the usage of RMB around the world and because of its better
developed financial system; Hong Kong can increase the circulation of RMB in its
international business (Chen, 2010). Both of the two pilot projects as mentioned above seem
to be developing in Hong Kong, which is supposed to stimulate the process of deregulation of
financial markets in mainland China.
As discussed above, some of the Chinese banks have already started to engage in
international business; the managers in major Chinese banks still need to be encouraged to
promote the international business. The offshore financial service is the essential part of the
Chinese domestic enterprises in their process of “Go global.” If Chinese domestic banks do
not have the ability to offer this service, the enterprises will change to other international
banks, such as HSBC, Citi, Santander, etc.
43
Local investment companies‟ expansion
Since 2009, the Chinese central government has been placing much attention on the issue of
bank lending to local investment companies. These companies are established through being
allocated land and shares from local government, and they are mainly engaged in funding the
construction projects undertaken by the local government. By the end of 2009, there were
more than 8 thousand local investment companies around the country. At the beginning of
2008, the total debt of local investment companies around the whole country reached more
than RMB 1 trillion, while by the end of May 2009, the total assets of local investment
companies was nearly RMB 9 trillion with debt growing to RMB 5.26 trillion, most of the
debt being bank loans. The average profit rate was lower than 1.3% and some of the local
investment companies did not even have any profits at all.
It is noticed by both CBRC and PBC that the risk regarding the bank lending to the local
investment companies is increasing and all the banks are required to review the financial
condition of local investment companies in detail. The first stage review process was
completed on October 2010, and according to the statistics, the amount of loans made by
commercial banks to the local investment companies reached RMB 7.66 trillion by the end of
June 2010 It is suspected that 26% of them (i.e. RMB 2 trillion) are likely to become non-
performing loans.
2.6 Summary and conclusion
This chapter first reviews the banking reforms since 1979, which is followed by a brief
introduction on the structure of the Chinese banking sector, including the presentation of
Chinese banking regulatory authorities and different ownerships of Chinese financial
institutions. We further overview the development of the Chinese banking sector over the
period 2003-2009. This section focuses on the analysis of different indicators in banking
operation, such as banking sector assets, banking capital adequacy ratio, banking
profitability, the non-performing loans in the Chinese banking sector. More importantly, we
analyse the above mentioned indicators by ownership types (i.e. state-owned banks, joint-
stock commercial banks, city commercial banks and foreign banks), and we explain the
indicators are clearly link with relevant policies initiated by the Chinese government.
Finally, we discuss the challenges faced by the Chinese banking sector.

44
In conclusion, we argue that the Chinese banking reforms over the period 2003-2009 have
impacts on creating the competitive environment, reducing the volume of non-performing
loans and increasing the profitability in the Chinese banking sector. For instance, the removal
of restrictions on business engaged by foreign banks in China helps the Chinese banking
sector to create a more competitive environment, while the four assets management
companies, together with the capital injections by the Chinese government substantially
reduces the volume of non-performing loans in Chinese state-owned banks and further
increase their profitability. Although the first target with regards to capital adequacy ratio set
by the Chinese government that all the commercial banks need to hold a capital adequacy
ratio of 8% was not achieved by the end of 2006, by the end of 2009, all the commercial
banks had met the requirement. Furthermore, four state-owned commercial banks have held a
capital adequacy ratio of 11%, while the average capital adequacy ratio of 14 listed
commercial banks was 8.8%, which is higher than 8% set by the BIS.
Through several rounds of banking reforms in China, China‟s banking sector seems to be
becoming more competitive due to the fact that the market share of state-owned commercial
banks kept decreasing over the period 2003-2009 (although the decreasing rate is very small),
while on the other hand, the market shares of joint-stock and city commercial banks keep
increasing over the period. It is noticed that state-owned commercial banks at the end of
2009, held more than 50% of total banking sector assets, which indicates that state-owned
commercial banks still dominated in the Chinese banking system. We notice that both the
volume of non-performing loans and non-performing loan ratios in the Chinese banking
sector keep decreasing over the period 2003-2009; however, the state-owned commercial
banks still have a substantially higher volume of non-performing loans and non-performing
loan ratios than joint-stock and city commercial banks. The higher non-performing loans in
the Chinese banking sector gives rise to the first challenge discussed earlier, which is loan
concentration in state-owned sector. Chinese commercial banks should be encouraged to
increase the credit allocation to medium and small size enterprise due to the fact that these
types of enterprises are important parts of the country‟s economy. In addition, careful credit
check and risk monitoring, as well as allocating credits to these enterprises, can help Chinese
commercial banks to reduce the volume of non-performing loans and non-performing loan
ratio. Besides the non-performing loan issue, Chinese commercial banks should be
encouraged to engage in more international business due to the fact that it is essential to help
45
Chinese enterprises which have the strategy of “Go global”; also, it is vital for the Chinese
commercial banks to increase their competitiveness around the world.
With regards to research in Chinese banking industry, besides the bank profitability, there are
a number of studies investigating the efficiency of Chinese banking sector, which is another
aspect of bank performance. Most research studies show that joint-stock commercial banks
have higher efficiency and the efficiency of state-owned commercial banks is the lowest1.
Our research will build upon the previous research in the Chinese banking sector mainly by
the following ways: 1) investigation of comprehensive aspects of bank performance in China,
including bank profitability, efficiency and productivity; 2) in terms of risk in the Chinese
banking sector, this research uses different indicators and investigates its relationships with
bank performance and competitive condition; 3) as discussed in the overview of Chinese
banking sector, the market share of assets is regarded as the competition condition in Chinese
banking sector. In this research study, different non-structural indicators are used and its
inter-relationships with risk and performance are examined. Besides contributing to
contemporary research in Chinese banking sector, this study fills the gaps of previous studies
in banking research in general by mainly the following ways: 1) it is the first study
investigating the joint-impacts of efficiency/productivity and risk on bank competition; 2) it
is the first empirical study investigating the effects of efficiency and competition on bank
profitability (competition is measured by non-structural indicator); 3) This study examines
the effects of share return and risk on efficiency/productivity change; 4) it also examines the
effects of competition and profitability on efficiency (competition is measured by non-
structural indicator); 5) it is the first study evaluating the inter-relationships between risk,
profitability and competition.
1 See later chapter for detail
46
Chapter 3
Literature review on bank profitability, competition and
efficiency
3.1 Introduction
This chapter mainly reviews the literature on the investigation of bank profitability and its
determinants. Furthermore, studies on the evaluation of bank competition are also reviewed.
Finally, the empirical research examining the efficiency in banking sector is reviewed.
Section 3.2 reviews the relevant literature on the determinants of bank profitability, which is
followed by section 3.3 reviewing the relevant literature on the competitive condition in
banking industry; the impact of concentration and efficiency on bank competition; the impact
of competition on risk-taking behaviour of banks and the relationship between risk,
profitability and competition. Section 3.4 reviews the empirical research on bank efficiency
with focus on the following issues: 1) the evaluation of bank efficiency and its determinants
in China; 2) bank efficiency and share return; 3) the inter-relationship between risk, capital
and efficiency.
3.2 Literature Review on bank profitability
There is a large volume of literature that examines the role of different factors in determining
bank performance. The determinants of European bank profitability are first evaluated by
Molyneux and Thornton (1992) for the period 1986-1989. The results show that liquidity is
negatively related to bank profitability. The performance of European banks across six
countries is investigated by Goddard et al. (2004). They find a relatively weak relationship
between size and profitability. The significant and positive relationship between off-balance
business and profitability is shown only in the UK. Further, the determinants of foreign banks
profitability based in Australia are considered by Williams (2003) for the period of 1989-
1993. He finds that GDP growth of a foreign bank‟s home country and non-interest income
are positively and significantly related to bank profitability. The determinants of bank
profitability in Greece during the period of EU financial integration are investigated by
Kosmidou (2008). The findings reveal that higher capitalization fosters bank‟s Return on
47
Average Assets (ROAA), while the efficient expense management is one of the most
significant factors in explaining low bank‟s Return on Average Assets (ROAA). In terms of
the macroeconomic indicators, higher GDP is associated with higher bank‟s Return on
Average Assets (ROAA), while inflation is found to have a negative effect on bank‟s Return
on Average Assets (ROAA). Finally, Staikouras and Wood (2011) examine the determinants
of bank profitability in the EU for the period 1994-1998. Using OLS and fixed effects
models, the empirical findings show that the profitability of European banks may be
influenced by factors related to changes in the external macroeconomic environment.
There are large numbers of studies on profitability of US banks (Smirlock, 1985; Rhoades,
1985; Berger, 1995a; Goddard et al., 2001). Firstly, Rhoades (1985) uses data from 1969-
1978, and reports that there is a positive relationship between risk and bank profitability in
the US. Smirlock (1985) examines the profitability of US banks during the period 1973-1978;
the empirical findings suggest that size is negatively related to bank profitability. Berger
(1995a) uses data from 1980s, and reports that profitability is positively related to market
power and x-efficiency. The profitability of US banks is also investigated by Goddard et al.
(2001). Using data for the period 1989-1996, the empirical results show that scale economies
and productive efficiency are positively related to profitability, while bank size has negative
impact on profitability.
Few studies have looked at bank performance in emerging countries. The performance of
domestic and foreign banks in Thailand during the period of 1995-2000 is investigated by
Chantapong (2005). He finds that the profitability of foreign banks is higher than the
domestic banks.
Guru et al. (2002) examine bank profitability for Malaysia during 1986-1995. The results
show that efficient expense management is one of the most significant factors in determining
bank profitability. In terms of the macroeconomic variables, inflation is found to have a
positive relationship with bank profitability while the negative relationship is obtained
between interest rate and bank profitability.
The impact of bank characteristics, financial structure and macroeconomic conditions on
Tunisian banks‟ profitability is examined by Ben Naceur and Goaied (2008) for the period
1980 to 2000. The results suggest that capitalization and overhead expenses are positively
related to profitability, while bank size exhibits the negative effect. There is a positive
48
relationship between stock market development and bank profitability while no effect is
found in terms of the macroeconomic conditions.
The determinants of Bank Margin of Islamic and conventional banks in Indonesia are
evaluated by Hutapea and Kasri (2010). The result exhibits that interest rate volatility has a
significant and positive effect on conventional Bank Margin, but a negative impact on Islamic
Bank Margin.
The studies investigating the profitability of the Chinese banking sector are relatively scarce.
The impact of financial development and bank characteristics on the operational performance
of 14 Chinese commercial banks is investigated by Wu et al. (2007). The result shows that
the ROA of small share holding commercial banks is found to be superior to that of larger
banks. Chinese banks‟ efforts to develop the non-traditional activities actually have a
negative impact on the ROA. They argue that the longer a bank has been in existence, the
worse its ROA.
The performance of the Big Four, joint-stock and city commercial banks in China is
compared by Shih et al. (2007) using the principle components analysis. The results indicate
that joint-stock commercial banks perform better than state-owned and city commercial
banks. They argue that there is no relationship between bank size and performance. Shen and
Lu (2008) use 49 observations to investigate the effect of ownership on Chinese bank
profitability and risk. The result shows that the profitability of joint-stock commercial banks
and city commercial banks are higher than state-owned and policy banks. Further, Sufian
(2009a) examines the determinants of profitability of four state-owned and twelve joint-stock
commercial banks during the period of 2000-2007. The empirical findings suggest that size,
credit risk and capitalization are positively related to profitability, while liquidity, overhead
cost and network embededness have negative effects. The results also show that there are
positive impacts of economic growth and inflation on bank profitability.
Sufian and Habibullah (2009) investigate the profitability determinants of all state-owned,
joint-stock and city commercial banks in China over the period 2000-2005. The empirical
results suggest that the profitability of state-owned commercial banks is significantly and
positively affected by bank liquidity, credit risk and bank capitalization. With regards to the
joint-stock commercial banks, the findings suggest that banks with higher credit risk are
normally more profitable, while banks with higher cost normally have lower profitability. In
terms of city commercial banks, the results suggest that banks with more diversified business
49
and higher levels of capital normally have higher profitability, while size and cost have
negative effects. The results finally report that during periods of economic boom (higher
GDP growth rate), the profitability of Chinese banks is higher.
Garcia-Herrero et al. (2009) explain the low profitability of Chinese banks for the period
1997-2004. The results suggest that capitalization, share of deposits and x-efficiency are
positively related to bank profitability, while there is a negative effect of concentration on
bank profitability. Furthermore, the empirical findings indicate that state-owned commercial
banks are the main drag of bank profitability in China, whereas joint-stock commercial banks
tend to be more profitable.
Heffernan and Fu (2010) use Economic Value Added (EVA) and Net Interest Margin (NIM)
to examine the determinants of performance for four different types of banks (state-owned,
joint-stock, city commercial and rural commercial banks). The empirical findings suggest that
bank listing and efficiency exert significant and positive influences on bank performance.
Real GDP growth rate and unemployment are found to be significantly related to bank
profitability. There are no effects of bank size and off-balance-sheet activities on bank
profitability. Finally, rural commercial banks outperform state-owned, joint-stock and city
commercial banks.
Few studies investigate the relationship between stock market volatility and bank
performance. Albertazzi and Gambacorta (2009) use several performance indicators (Net
Interest Income, Non-Interest Income, Operating Cost, Provisions, Profit before Tax, and
Return on Equity) to investigate the influence of stock market volatility on bank performance
for the main industrialized countries (Austria, Belgium, France, Germany, Italy, Netherlands,
Spain, United Kingdom and United States) during the period 1981-2003. They report that Net
Interest Income, Non-Interest Income, Provision and Return on Equity are positively related
to stock market volatility, while the stock market volatility is negatively related to Profit
before Tax. Further, no relationship between stock market volatility and Provisions is
reported. They conduct similar research in which the taxation variable is considered, and
instead of Return on Equity, they use Profit after Tax. The results show that Profit after
Taxes, Non-Interest Income and Provisions are positively related to stock market volatility.
However, Net Interest Income is significantly and negatively related to stock market
volatility.
50
Due to the fact that this research focuses on the investigation of profitability in the Chinese
banking industry, the contributions of existing research on Chinese banking profitability
mentioned above will be discussed and the gaps of previous studies identified. The main
contribution of Wu et al. (2007) lies in the fact that it is the first empirical study focusing on
the investigation of the relationship between financial development (and the special
characteristics of Chinese banks) and the operational performance of banks in China at that
time. In their study, the traditional accounting measurement of profitability, Return on Assets
(ROA) is used as dependent variable. It is regressed against a number of banking and
macroeconomic determinants of bank profitability, such as bank age, bank size, non-
traditional activity, GDP per capita and changes in property right system. The sample
comprises 14 Chinese banks including 4 state-owned banks and 10 joint-stock commercial
banks over the period 1996-2004. In terms of econometric estimation, both fixed and random
effects estimators are used. Shi et al. (2007) investigate and compare the performance of three
different ownerships of Chinese banks (state-owned, joint-stock and city commercial banks)
under the principal component analysis. Four performance indicators are derived, which are
overall performance, liquidity management, capital profitability, and credit risk management.
This is supposed to be the only study in the Chinese banking system using this method. The
disadvantage of this approach compared to Wu et al. (2007) is that it does not provide any
relationship between bank performance and specific bank characteristics and the
macroeconomic environment.
Shen and Lu (2008) contribute to the empirical research by extending the study of Wu et al.
(2007) through including extra bank-specific determinants of profitability in the regression
analysis. In other words, they use ROA as the profitability indicator to examine whether
levels of bank capitalization, bank liquidity, cost management, as well as GDP growth rate
have impacts on bank profitability. The cost management, bank capital and liquidity are
important determinants of bank profitability which are ignored by previous research. The
limitation of this study lies in the fact that the number of observations is very few, i.e. only 49
observations, and the results derived are not sufficiently precise.
Sufian (2009a) extends the study of Shen and Lu (2008) by including more bank-specific and
macroeconomic determinants of bank profitability. To be more specific, Return on Assets is
regressed against a number of bank-specific determinants, such as bank size, liquidity, risk,
non-traditional activity, capitalization and branch network, while both GDP and inflation are
controlled as the macroeconomic determinants, and the regression is estimated using fixed
51
effects estimator using all state-owned and joint-stock commercial banks over the period
2000-2007.
Sufian and Habibullah (2009) contribute to the empirical research on Chinese bank
profitability mainly in the following two ways: first, comparing to the study of Sufian
(2009a), their study further expands the bank-specific and macroeconomic determinants of
bank profitability. To be more specific, bank size, liquidity, risk, non-traditional activity,
capitalization, cost management are included as bank-specific determinants while GDP,
inflation and growth of money supply are controlled as macroeconomic determinants.
Secondly (and more importantly), Sufian and Habibullah (2009) investigate the determinants
of profitability by ownership types (state-owned, joint-stock and city commercial banks).
Garcia-Herrero et al. (2009) contribute to the previous research on bank profitability in China
mainly in the following ways: first, rather than using the traditional return on assets as the
profitability indicator, they use pre-prevision profit as an alternative profitability
measurement. In addition, with regards to the econometric estimation method used by
previous studies, which mainly focuses on Ordinary Least Square, fixed effects estimator and
random effects estimator, Garcia-Herrero et al. (2009) apply a system Generalized Method of
Moments (GMM) estimator. Finally, some of the factors related to Chinese banking reforms
are considered in the analysis of Chinese banking profitability, such as foreign capital, bank
listing, bank recapitalized and NPL disposal.
Heffernan and Fu (2010) contribute to the empirical literature and build upon previous
studies mentioned above on Chinese bank profitability in the following ways: they include
four performance indicators in the estimation, which are the Economic value added, Return
on Average Assets, Return on Average Equity and Net Interest Margin. Further, they use
both fixed effects estimator and GMM system estimator to examine the determinants of
Chinese bank profitability.
Although there are quite a few studies investigating the Chinese bank profitability, however,
there are a few gaps that need to be filled: first, although there are relatively comprehensive
bank-specific determinants of bank profitability examined by previous studies, there are still
some important variables missing by the empirical studies such as taxation and labour
productivity. Taxation is expected to be negatively related to bank profitability (Bashir,
2003), while labour productivity is expected to be positively related to bank profitability
(Athanasoglou et al. 2008). Furthermore, all the studies mentioned above mainly divide the
52
determinants of bank profitability into two groups: bank-specific determinants and
macroeconomic determinants, while the industry-specific determinants are missing in the
empirical literature. Banking sector development, as one of the industry-specific
determinants, is supposed to affect bank profitability. Demirguc-Kunt and Huizinga (1999)
argue that banks operating in a higher development banking sector normally have lower
profitability. Stock market development, as a second industry-specific determinant of bank
profitability, is supposed to be positively and significantly related to bank profitability
(Demirguc-Kunt and Huizinga, 1999). Finally, as mentioned in the earlier part of this section,
the impact of stock market volatility on bank performance is analysed in main industrialized
countries (see Albertazzi and Gambacorta, 2009); however, there is no study to examine this
issue in the Chinese banking sector.
3.3 Literature review on bank competition
Panzar-Rosse H statistic has been used by several banking studies for a number of countries
and regions, (see Bikker and Groeneveld (2000), Gelos and Roldos (2004), De Bandt and
Davis (2000), Bikker and Haaf (2002), Coccorese (2004), Perera et al. (2006),Staikouras and
koutsomanoli-Fillipaki (2006), Al-Muharrami et al. (2006), Yildirim and Philippatos (2007),
and Matthew et al. (2007)). For example, Bikker and Groeneveld (2000) evaluate the bank
competition of 15 EU countries during the period of 1989-1996. They find that all countries
are in a state of monopolistic competition except for Belgium and Greece, which are in a state
of perfect competition. De Bandt and Davis (2000) analyse the bank competition in France,
Germany, Italy and US for the period from 1992 to 1996. They conclude that large banks are
in a state of monopolistic competition, while small banks are in a state of monopoly. Bikker
and Haaf(2002) assess the competition of banking industries in 23 countries; they summarize
that the sample used is in a state of monopolistic competition. Coccorese (2004) assesses the
competitive condition of Italian banking industry over the period 1997-1999 and the results
indicate that Italian banks earn revenue as if they were under the condition of monopolistic
competition. Yildirim and Philippatos (2007) examine the competitive conditions in the
banking industries of 14 Central and Eastern European transition Economies (CEE) for the
period 1993-2000. The results suggest that the banks earn their revenues as if under the
condition of monopolistic competition. Staikouras and Koutsomanoli-Pillipaki (2006)
investigate the competitive condition of the European banking industry over the period 1980-
2004. The findings indicate that European Banks were operated under the condition of
53
monopolistic competition. Using a sample of 12 banks over the period 1980-2004, Matthew
et al. (2007) assess the competitive condition in the British banking industry. The results
show that British banks are under monopolistic competition over the examined period. The
competitive conditions of Arab GCC banking industry during the years of 1993-2002 are
examined by Al-Muharram et al. (2006). The results indicate that banks in Kuwait, Saudi
Arabia and the UAE operate under perfect competition, while banks in Bahrain and Qatar
operate under condition of monopolistic competition. The competitive conditions for a
sample of emerging banking markets over the period 1994-1999 are investigated by Gelos
and Roldos (2004). The findings suggest that the banking systems in all the investigated
countries, except Argentina and Hungary, were operated under the condition of monopolistic
competition. Perera et al. (2006) examine the competition of the South Asian banking
industry over the period 1995-2003. Their findings show that the competition in the
traditional interest-based product market is greater in the Bangladesh and Pakistani banking
industry, while the fee-based product market in Indian and Sri Lanka banking sector is more
competitive.
There is limited research examining the competitive condition in the Chinese banking
industry. Yuan (2006) analyses the competitive condition of Chinese banking industry over
the period 1996-2000. The results suggest that China‟s banking sector is already near a state
of perfect competition (that is before foreign banks began to enter China‟s financial market).
The competitive condition of 16 Chinese banks for the period 2004-2007 is also evaluated by
Masood and Sergi (2011). The results show that Chinese banking sector was monopolistically
competitive over the examined period.
Fu (2009) examines the competitive condition for a panel of 76 Chinese banks over the
period 1997-2007. The results indicate that there is a monopolistic competition in the Chinese
banking sector. She suggests that, after China‟s accession to WTO, the competition in the
core market for bank lending increased, while the off-balance-sheet market seemed to
become less competitive.
Not only the competitive conditions are examined using the Panzar-Rosse H statistic, several
pieces of empirical research investigate the effects of concentration and efficiency on bank
competition. The competitive conditions of a sample of European banks are investigated by
Casu and Girardone (2006) over the period 1997-2003. Their results indicate the degree of
concentration is not necessarily related to the degree of competition and they find little
54
evidence that more efficient banking systems are more efficient. Bikker and Haaf (2002)
evaluate the competitive conditions of banking systems in 23 industrialized countries over the
period 1988-1998. The findings suggest that concentration impairs competitiveness. The
competitive conditions of banking systems of 50 countries over the period 1994-2001 are
evaluated by Claessens and Laeven (2004). The results indicate that there is no empirical
evidence that competitiveness relates negatively to the banking system concentration.
The impact of risk on profitability has been extensively investigated by several studies.
Changes in credit risk may reflect changes in the heath of a bank‟s portfolio (Cooper et al.,
2003), which affects the performance of the US bank holding companies over the period
1986-1999. Duca and Mclaughlin (1990), among others, conclude that variations in bank
profitability are largely attributable to variations in credit risk, since inverse exposure to
credit risk is normally associated with decrease in profitability. Miller and Noulas (1997)
suggest that financial institutions being more exposed to high risk loans increases the
accumulation of unpaid loans and decreases the profitability in the US banking industry over
the period 1984-1990.
Sufian and Chong (2008) find that there is a negative relationship between credit risk and
bank profitability in the Philippine banking industry over the period 1990-2005; this is in line
with Liu and Wilson (2010) for Japanese banks over the period 2000-2007. However, a
positive relationship is reported by Sufian (2009a) for China over the period 2000-2007.
There are mainly two approaches used by the empirical literature to investigate the
relationship between competition and performance in the banking sector. One is a structural
approach and the other one is a non-structural approach. There are two hypotheses included
in the structural approach, which are Structure-Conduct-Performance (SCP) hypothesis and
the Efficient-Structure (ES) hypothesis. These hypotheses investigate whether superior
performance in the banking sector is obtained through the collusive behaviour among the
large banks in the concentrated market, and whether it is the higher efficiency that leads to
better bank performance. On the other hand, the non-structural approaches, which derived
from the development in the New Empirical Industrial Organization (NEIO) literature, stress
the analysis of banks‟ competitive conducts in the absence of structural measures.
The SCP hypothesis is partly supported within the context of the NEIO literature by Bikker
and Bos (2005). It argues that collusion among banks has the ability to obtain higher profit in
a more concentrated market through charging higher loan rates and offering lower deposit
55
rates. The more concentrated bank market leads to a smaller degree of competition, while the
smaller number of firms makes it more probable for them to collude together. In other words,
banks in a more concentrated market achieve higher profit. On the other hand, the efficient
structure hypothesis (ESH) states that low cost of production by relatively efficient firms
enables them to compete more aggressively, capture a bigger market share and earn higher
profits (Fu and Heffernan, 2009). So the higher profit achieved by banks is attributable to the
lower cost through superior management or production process rather than the concentrated
market. Because the efficient banks have the ability to obtain higher market share, one way to
distinguish between the two hypotheses is to include both the market share and concentration
in the profitability equation. If the concentration is insignificant or the market share is
positively related to profitability, then it is in line with the Efficient Structure hypothesis.
There are mainly two different views with regards to the relationship between competition
and risk. These are: competition-fragility and competition-stability. The former argues that
banks have the ability to withstand shocks and decrease the risk-taking behaviour due to the
fact that higher profitability can be earned through monopoly rents in a less competitive
market (see Allen and Gale, 2000, 2004; Carletti, 2008; Boyd and De Nicole, 2005).
The competition-stability view suggests that, in a less competitive banking market, banks
normally charge higher interest rates which will increase the probability of default on the loan
repayment. By allowing for imperfect correlation across individual firms‟ default
probabilities, Martinez-Miera and Repullo (2010) indicate that there is a U-shape relationship
between competition and risk; therefore, as the number of banks increases, the probability of
bank default first declines but then increases beyond a certain point. Overall, the issue of
whether competition precedes bank stability or fragility has still been unsolved.
As discussed in the earlier part of this section, there is an extensive literature on the
investigation of competitive condition in the banking sector; however, most of them focus on
the European countries, US, Arabic and emerging market economies. There are only three
existing studies examining competition in the Chinese banking sector. The contribution of
Yuan (2006) is supposed to be the first volunteer in evaluating the bank competition in China.
The competition is measured by Panzar-Rosse H statistic on 15 banks over the period 1996-
2000. In the reduced form equation to estimate the competition, the operating revenue is used
as dependent variable, while price of labour, price of capital, price of funds, bank size is
controlled as the variable which influences the revenue of Chinese banks. Fu (2009)
56
contributes to the empirical research and builds on the study of Yuan (2006) in estimating
Chinese bank competition by the following ways: first, rather than using the operating
revenue as the dependent variable in the reduced-form equation, she uses two different
reduced-form equations with the first one applies total revenue as dependent variable, which
considers both the traditional loan-deposit services and non-traditional activities, while in the
second the reduced-form equation focuses just the interest revenue earned by banks.
Secondly, besides controlling for price of labour, price of capital, price of funds and bank size
as independent variables, Fu (2009) includes bank risk and GDP growth as the determinants
which are supposed to influence the bank revenue. Comparing to Yuan (2006) and Fu (2009),
Masood and Sergi (2011) contribute to the empirical literature on Chinese bank competition
by the following ways: first, their study includes more bank-specific determinants in the
reduced-form revenue equation form. To be more specific, they control for price of labour,
funds, capital as well as bank liquidity, bank capital and bank size as independent variables.
Furthermore, their study has a second stage analysis to investigate the determinants of bank
competition. In other words, the competition derived from Panzar-Rosse H statistic is
regressed against a number of variables, such as efficiency, profitability, capitalization,
concentration and foreign ownership.
Through reviewing the literature, especially the studies in Chinese banking sector
competition, there are a few gaps need to be filled which can be summarized as follows: first,
all the studies apply the Panzar-Rosse H statistic to evaluate the competitive condition, which
is applicable to the whole period investigated or on a year by year basis. The competitive
conditions of different ownerships of Chinese banks have not been examined by the empirical
literature. This is a very important issue for the government to have a general view of
banking environment in different banking groups and further make relevant policies on them.
Secondly, due to the fact that the financial crisis started in Asia from 2007, the government
and banking regulatory authorities focus on the banks‟ risk-taking behaviour. There are
several pieces of research investigating the impact of competition on bank risk, and this
relationship is argued by the empirical studies through competition-stability and competition-
fragility hypotheses. There appears to be no study investigating this issue in the Chinese
banking sector. Thirdly, Structure-Conduct-Performance (SCP) hypothesis states that in a
higher concentrated banking market, competition is lower, which induces banks to collude
with each other to obtain higher profit. Empirical studies in the Chinese banking sector use
concentration as a competition measurement, while no studies use the non-structural
57
measurement (i.e. Panzar-Rosse H statistic), which is supposed to provide more accurate and
robust results, to investigate the impact of competition on bank profitability in China.
3. 4 Literature review on bank efficiency
3.4.1 Investigation of bank efficiency and its determinants
There is a large volume of literature on the investigation of bank efficiency (see Casu and
Girardone, 2006; Weill, 2004; Turati, 2003 among others). Further, the effects of
specialization on the cost efficiency of a set of banking systems of the European Union over
the period 1992-1998 are analysed by Pastor and Serrano (2006). They report that the
inefficiencies of the European banking systems are much smaller when the effect of
productive composition is discounted. The production efficiency of 61 bank branches in nine
provinces of the Republic of South Africa is assessed by Okeahelam (2006). The results show
that every branch is operating at increasing return to scale, and the level of production
efficiency of bank branches is lower than expected.
Furthermore, there are empirical studies published on efficiency in the Chinese banking
sector. Using a non-parametric approach, Ariff and Can (2008) investigate the cost and profit
efficiency of 28 Chinese commercial banks from 1995-2004. The findings suggest that joint-
stock banks are more efficient than state-owned banks. The results also indicate that speedier
reform to open the banking market and improving risk management are helpful in increasing
the efficiency of Chinese banks. The stochastic frontier approach (SFA) is employed by Fu
and Heffernan (2007) to examine the cost X-efficiency in China's banking sector from 1985-
2002. They report that: 1) joint-stock banks are more X-efficient than state-owned banks; and
2) the cost x-efficiency of Chinese banks can be improved by increased privatization, greater
foreign bank participation and liberalized interest rate.
SFA is used by Berger et al. (2009) to analyse the cost and profit efficiency of 38 Chinese
commercial banks with different ownership over the period 1994-2003. The empirical
findings suggest that, reducing state-ownership and increasing foreign participation have
favourable effects on bank efficiency in China. They report that the Big Four state-owned
commercial banks are by far the least efficient due to the accumulation of non-performing
loans, while the foreign banks in China are more efficient. One-step SFA approach is
employed by Yao and Jiang (2010) to investigate bank efficiency in China over 1995-2008.
The results are summarized as follows: first, bank efficiency has improved over the data
58
period 1995-2008. Secondly, Chinese joint-stock commercial banks and city commercial
banks outperform state-owned commercial banks. Finally, foreign ownership participation
has a negative effect on profit efficiency in the long-term, while initial public offerings
(IPOs) improve bank efficiency in the short-term.
DEA windows analysis is used by Sufian and Majid (2009) to examine Chinese bank
efficiency over the period 1997-2006. The study then investigates the relationship between
efficiency and share price performance while controlling for other bank specific factors. The
empirical findings show that the technical and pure technical efficiencies of large banks are
higher than medium and small banks, but in terms of the scale efficiency, the medium banks
are higher. The study suggests that share price performance is positively and significantly
correlated with Chinese bank efficiency scores. Further, Sufian (2009b) employs the non-
parametric DEA method to examine the impact of non-traditional activities on the technical,
pure technical and scale efficiencies of the banking sector in China (all state-owned and joint-
stock commercial banks) during the period 2000-2005. Parametric (t-test) and non-parametric
(Mann-Whitney [Wilcoxon] and Kruskal-Wallis) tests are performed to examine the
difference in the efficiency levels under the traditional and alternative DEA models. The
empirical results indicate that Chinese state-owned commercial banks‟ technical efficiency
enhances with the inclusion of non-traditional activities attributed to improvement in scale
efficiency, while the joint-stock commercial banks‟ technical efficiency is higher attributed to
improvement in pure technical efficiency.
The management efficiency of 4 Chinese state-owned commercial banks and 10 shareholding
commercial banks over the period 2001-2003 is evaluated by Cao (2007) using DEA CCR
and super efficiency models. The empirical results show that the super efficiency model can
make full evaluation and ranking for all DMUs and supply more comprehensive information
for the decision maker. The findings also show that, the management efficiency of Chinese
commercial banks is being improved, and the efficiency of state-owned commercial banks is
far behind the share-holding commercial banks.
The efficiency level of 11 Chinese banks is further examined by Laurenceson and Zhao
(2008) using DEA over the period 2003-2007. The empirical results suggest that the
differences in the efficiency levels among the banks examined are quite small. The findings
also indicate that few of China‟s major banks lag behind the pack, although efficiency levels
certainly do lag in China‟s less prominent banks.
59
Using an input distance function, Kumbhakar and Wang (2007) analyse the effect of banking
reforms on efficiency and total factor productivity change on the Chinese banking industry
over the period 1993-2002. The results show that joint-stock banks are more efficient than
state-owned banks, and the productivity growth of joint-stock banks is higher than state-
owned banks.
Recently, four-stage DEA is applied by Hu et al. (2009) to study the operational
environmental-adjusted efficiency of 11 nationwide banks in China over the period 1995-
2004. The results imply that ownership reform is helpful in increasing the efficiency of
Chinese state-owned banks.
Finally, a stochastic distance function is employed by Jiang et al. (2009) to examine the bank
technical efficiency and differentiate the static, selection, and dynamic governance effects on
bank efficiency over the period 1995-2005. They find that the efficiency gains can be
obtained by domestic banks through foreign acquisition, while listing has the short-term
effect on the improvement of bank efficiency in China.
3.4.2 Bank performance and share return
In recent years, there has been a growing interest in estimating the relationship between bank
performance and share return across different regions and countries. The relationship between
share performance and bank efficiency of all banks publicly listed in France, Germany, Italy,
Spain and UK is investigated by Beccalli et al. (2006). The results suggest that changes in
efficiency are reflected by changes in stock price, and more cost efficient banks have stock
which outperforms their inefficient counterparts. The relationship between stock performance
and efficiency for 171 banks operating in 15 EU markets over the period 2002-2006 is
examined by Lidaki and Gaganis (2010). Their findings suggest that there is a significant and
positive relationship between profit efficiency and stock prices, while the relationship
between cost efficiency and stock returns seems to be insignificant. The impact of share
return on cost and profit efficiency for Asian and Latin American listed banks over the period
2000-2006 is investigated by Ioannidis et al. (2008). Their findings suggest that there is a
positive relationship between profit efficiency change and stock return, while there seems to
be no relationship in terms of cost efficiency. The relationship between share price
performance and cost efficiency for banks from Singapore over the period 1993-2003 is
examined by Sufian and Majid (2007). The results suggest that stock of cost efficient banks
60
outperforms the inefficient counterparts. Further, they investigate the link of X-efficiency,
profit efficiency with share prices of listed Malaysian banks over the period of 2002-2003.
The results indicate that there is a strong relationship between profit efficiency and share
price, while the relationship between the cost efficiency and share price is weak. Moreover,
the relationship between annual share price return and change of efficiency of Greek banks is
investigated by Pasiouras et al. (2008). They show that the relationship between annual
change in technical efficiency and stock return is significant and positive, while there is no
impact of scale efficiency on stock return. Finally, the economic efficiency of Turkish banks
over the period 1998-2004 is evaluated by Erdem and Erdem (2008). They link the economic
efficiency scores to the stock prices; their findings show that the change in efficiency is not
significant in explaining the stock price return movements in the Turkish banking industry.
Although, there is extensive literature focusing on the estimation of this relationship, no study
examines this issue in Chinese banking sector.
3.4.3 The inter-relationship between risk, capital and efficiency
The examinations of the effect of bank capital regulations on bank behaviour are focused on
the US according to the early line of the empirical research2. These early studies mainly
concern the issue whether the existence of flat-rate deposit insurance induces banks to take on
excessive risk. The empirical findings of these studies are doubtful about the effectiveness of
banking capital regulation on banks‟ target capital ratios. They emphasise the importance of
controlling other factors to limit risk-taking, such as the deposit insurance flat fee rate or the
level of nominal interest rate3.
The new wave of studies on the effect of bank capital regulations on banks‟ risk-taking
behaviour started after the introduction of the 1988‟s Basle Accord on international bank
capital. These studies mainly focus on the US banking sector4. The findings indicate that the
financing decisions made by a significant subset of banks are influenced by the regulatory
minimum capital constraints5.
The recent empirical studies from Shrieves and Dahl (1992), Editz et al. (1998) and Rime
(2001) suggest that capital regulation in banking has been effective in increasing capital
ratios without shifting their portfolio and OBS exposure towards riskier assets. Demsetz et al.
2 See Peltzman, 1970; Mayne, 1972.
8 See Marcus, 1983.
4 For non-US countries see Barrios and Blanco (2003).
5See Wall and Peterson (1988) and Shrieves and Dahl (1990).
61
(1996) and Salas and Saurina (2003) report a negative effect of capital on the levels of credit
risk taken by banks; this is in line with the moral hazard hypothesis. However, Haq and
Heaney (2012) argue that there is evidence of a U-shape relationship between bank capital
and credit risk. Overall, there is no consensus on the issue whether the overall banking risk
can be reduced by increasing the capital ratio.
The empirical studies concerning the effects of bank capital regulations on bank-risk taking
behaviour and the literature dealing with bank efficiency are linked by Kwan and Eisenbeis
(1997) using a simultaneous equation framework. They provide evidence that efficiency and
capital are relevant determinants of bank risk. According to Hughes and Moon (1995),
efficiency is an important variable when evaluating the relationship between risk and capital.
For instance, the efficient banks are more flexible in terms of their capital levels and overall
risk profile, while the less efficient banks normally are more likely to take on extra risk to
compensate for the loss returns because of the moral hazard considerations.
The Granger-causality method is employed by Berger and De Young (1997) to investigate
the problem loans-cost efficiency-capital relationship for a sample of US banks over the
period 1985-1994. The empirical findings suggest that declines in cost efficiency precede
increases in problem loans, especially for the banks with lower levels of capital; in addition, a
higher level of problem loans leads to a decrease in cost efficiency.
Recent studies have been conducted by Williams (2004), Altunbas et al. (2007) and Fiordelisi
et al. (2011b). Granger-causality technique is used by Williams (2004) to examine the inter-
relationship among problem loans, cost efficiency and capital for a sample of European
saving banks over the period 1990-1998. He finds that the quality of loans is poor for the
banks which are not well-managed (i.e. banks with lower efficiency). Further, the seemingly
unrelated regression (SUR) is used by Altunbas et al. (2007) to investigate the inter-
relationship among capital, loan loss provision and cost efficiency for a sample of European
banks over the period 1992-2000. In contrast to William (2004), they report that banks with
higher efficiency tend to take on higher risk, while less efficient banks seem to have higher
capital levels and lower levels of credit risk. Fiordelisi et al. (2011b) use Granger-causality
technique to assess the inter-relationship between capital, efficiency and risk for a sample of
European commercial banks over the period 1995-2007. The results indicate that inefficient
banks typically have higher risk levels and higher capital levels increase the bank efficiency.
62
Overall, there is no empirical research investigating the inter-relationship between risk,
efficiency and capital in the Chinese banking industry.
The main contributions of previous bank efficiency studies in China are attributed to the fact
that they use different methods to measure efficiency, such as SFA, DEA, input distance
function, stochastic distance function. Furthermore, they focus on different aspects of bank
efficiency, such as profit efficiency, cost efficiency and technical efficiency.
Through reviewing the empirical literature, there are a few gaps that need to be filled which
can be summarized as follows: first, there are empirical studies investigating the impacts of
efficiency and concentration on bank competition which focus on European countries. As
discussed earlier, Masood and Sergi (2011) examine the impact of efficiency on bank
competition in China; the efficiency is proxied by the ratio of non-interest expense to the sum
of net interest income and non-interest revenue. There is no study using the parametric/non-
parametric method, which is supposed to provide more precise results, to measure efficiency
and further investigate its impact on bank competition in China. Secondly, there is no study
investigating the impact of competition on bank efficiency in China. In the empirical
literature, there are mainly two arguments with regards to the impact of competition on bank
efficiency; they are competition-inefficiency hypothesis and competition-efficiency
hypothesis. Competition-inefficiency hypothesis suggests that competition leads to a decline
in bank efficiency for the following reasons: 1) as argued by Boot and Schmeits (2005), the
relationships between customers and banks are less stable and shorter in a higher competitive
environment. 2) Higher bank competition increases customers‟ propensity to switch to other
providers. The information asymmetries will be amplified by this phenomenon and additional
resources for screening and monitoring borrowers are required. 3) Chan et al. (1986) argue
that a shorter duration of bank relationships can be expected in a competitive environment,
the reduction of relationship-building activities inhibits the reusability and value of
information. The negative impact of competition on efficiency is supported by the empirical
studies of Evanoff and Ors (2002), DeYoung et al. (1998) and Kumbhakar et al. (2001). The
competition-efficiency hypothesis is derived from the “Efficient Structure hypothesis” and
suggests that there is a positive impact of competition on efficiency. This effect can be
explained by Zarutskie (2013), who argues that higher competition induces banks to
specialize and focus on certain types of loans or particular groups of borrowers. It also
induces bank managers to adjust their lending technologies. The cost of processing and
originating loans can be lowered and the borrowers can be better monitored. This positive
63
impact can also be explained by the “Quiet Life hypothesis,” which states that managers with
monopoly power enjoy a share of monopoly rents, they are careless in the expense
management and the working effort will be reduced, which leads to a decline in efficiency.
The positive impact of competition on efficiency is also supported by Chen (2007), and Dick
and Lehnert (2010).
Further, there are two main sources of bank profitability, which are (1) efficiency and (2)
concentration (competition); these two sources of profitability are supported by efficient-
structure hypothesis and structure-conduct-performance hypothesis, as suggested by the
literature. These two variables should both be included in the empirical analysis of
determinants of bank profitability. As an example, Garcia-Herrero et al. (2009) use stochastic
frontier approach to investigate the efficiency and further examine its impact on bank
profitability in China. They include concentration as key competition variable. However,
there is no empirical study using the non-parametric DEA as a measurement of bank
efficiency in China to evaluate its impact on bank profitability; further, no study uses non-
structural measurement of bank competition. The results from Garcia-Herrero et al. (2009)
can be cross checked through using non-parametric method to measure efficiency and
Panzar-Rosse H statistic (non-structural indicators) as the measurement of bank competition.
Finally, as discussed earlier in the bank competition section, all the banking studies use
Panzar-Rosse H statistic as a measurement of bank competition. In other words, the Lerner
index is missing in the literature. In addition, when estimating the impact of efficiency on
bank competition, risk should be taken into consideration. Due to the fact that banks tend to
compensate greater risk with higher margins, it is expected that higher risk leads to higher
market power (lower bank competition). The non-parametric estimation of bank efficiency
together with Lerner index as competition indicator, as well as consideration of risk
condition, will provide precise results regarding the impact of efficiency on competition.
3.5 Summary and Conclusion
This chapter reviews the relevant literature related to the investigation of bank profitability,
competition and efficiency. Furthermore, it identifies the contributions of existing research
and discusses the gaps in the literature.
Bank profitability: most research reports that liquidity has a negative impact on bank
profitability, while there is a positive relationship between capitalization, credit risk and bank
64
profitability. There are mixed findings in terms of the impacts of size and cost management
on bank profitability. Finally, with regards to the macroeconomic determinants, most research
finds that GDP growth rate has a positive impact on bank profitability. The gaps are filled by
this study through considering taxation and labour productivity as bank-specific determinants
of profitability. Also, the industry-specific determinants of profitability, such as banking
sector development and stock market development, are examined. Finally, the impact of
stock market volatility on bank profitability is also investigated.
Bank competition: most of the research papers use the Panzar-Rosse H statistic to evaluate
the competitive condition of the banking sector in different countries and nearly all of them
find that the banking sectors they investigated are operated under the condition of
monopolistic competition. A number of studies support the Structure-Conduct-Performance
(SCP) hypothesis and indicate that in a lower degree of competition, banks will collude to
obtain higher profit. Furthermore, two different views are held by researchers suggesting that
competition has significant impact on banks‟ risk-taking behaviour as reflected by the
competition-fragility or the competition-stability hypothesis. In terms of the Chinese banking
sector, this study fills the gaps of the empirical literature by investigating the competitive
conditions of different ownerships of Chinese banks; also the issue regarding the impact of
competition on bank risk is investigated. Finally, more precise indicator (non-structural
indictor) rather than structural indicator is used to examine the impact of competition on bank
profitability.
Bank efficiency: The majority of studies investigating the efficiency in the Chinese banking
sector report that the efficiency of joint-stock commercial banks is higher than state-owned
commercial banks. Furthermore, there is no clear evidence found by empirical literature that
concentration and efficiency significantly affect bank competition. In addition, most of the
research papers assessing the link between share price/share return on bank efficiency find
that banks with higher efficiency normally have stocks outperform their inefficient
counterparts. With regards to the inter-relationship between risk, efficiency and capital, most
of the studies report that higher risk precedes a decline in efficiency and higher capital levels
increase bank efficiency. The gaps of the empirical literature are filled mainly by examining
the following impacts/effects: 1) efficiency and concentration on bank competition; 2) bank
competition on bank efficiency; 3) competition and efficiency on bank profitability; 4)
efficiency and risk on bank competition; 5) share return on bank efficiency; and 6) the
relationships between risk, capital and efficiency.
65
Chapter 4
Data and Methodology
4.1 Introduction
This chapter outlines the data used in the investigation of bank profitability, competition and
efficiency in the Chinese banking sector. To be more specific, we explain the profitability
indicators and variables used as the profitability determinants, while with regards to bank
competition, we define the input price variables and bank-specific covariates used in the
reduced-form function. In terms of the estimation of bank efficiency, we present the inputs
and outputs used in the DEA CCR and BCC models. In addition, we explain the econometric
methods used to measure the determinants of bank efficiency, competition, profitability and
their inter-relationships. The chapter is structured as follows: 4.2 outlines the data and
methodology used in our study to measure the bank profitability and its determinants while
4.3 presents the data and methodology employed to derive the competitive condition and
efficiency of Chinese banking. To be more specific, we present the methods in terms of the
measurements of bank competition and efficiency first and then the econometric methods
used to investigate the determinants of competition and efficiency are explained.
4.2 Data and methodology on the estimation of bank profitability
4.2.1 Data
In terms of the first two researches focusing on bank profitability and inflation, bank
profitability and GDP, the banking data is composed of annual figures from 101 Chinese
banks over the period 2003-2009. The banks used in these two studies are five state-owned
commercial banks (SOCBs), twelve joint stock commercial banks (JSCBs) and eighty four
city commercial banks (CCBs). Furthermore, thirteen of them have already been listed on the
stock exchange in China; hence the profitability of these banks is highly important for the
shareholders. Since not all banks have available information for all years, we opt for an
unbalanced panel not to lose degrees of freedom (i.e. the number of time series responses for
each unit is different; hence, the panel is unbalanced). In total, our sample contains 197
observations. The bank specific information is mainly obtained from Bankscope database
maintained by Fitch/IBCA/Bureau Van Dijk, which is considered as the most comprehensive
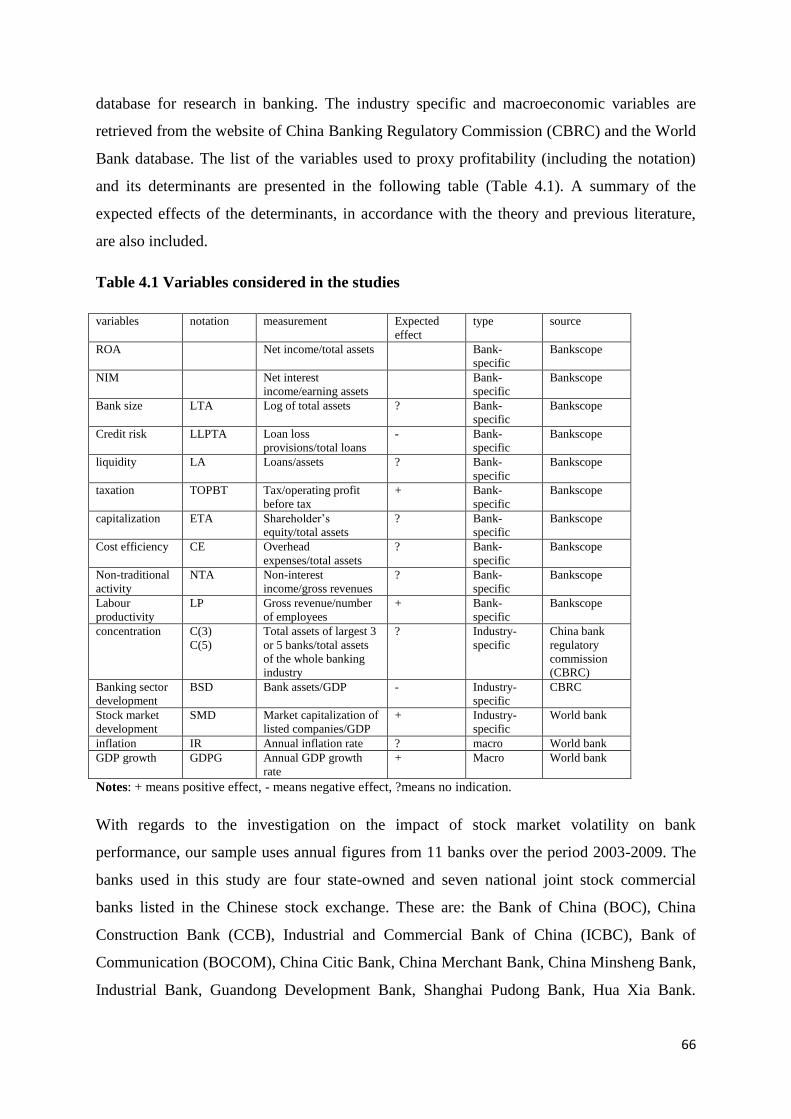
66
database for research in banking. The industry specific and macroeconomic variables are
retrieved from the website of China Banking Regulatory Commission (CBRC) and the World
Bank database. The list of the variables used to proxy profitability (including the notation)
and its determinants are presented in the following table (Table 4.1). A summary of the
expected effects of the determinants, in accordance with the theory and previous literature,
are also included.
Table 4.1 Variables considered in the studies
variables notation measurement Expected
effect
type source
ROA Net income/total assets Bank-
specific
Bankscope
NIM Net interest
income/earning assets
Bank-
specific
Bankscope
Bank size LTA Log of total assets ? Bank-
specific
Bankscope
Credit risk LLPTA Loan loss
provisions/total loans
- Bank-
specific
Bankscope
liquidity LA Loans/assets ? Bank-
specific
Bankscope
taxation TOPBT Tax/operating profit
before tax
+ Bank-
specific
Bankscope
capitalization ETA Shareholder‟s
equity/total assets
? Bank-
specific
Bankscope
Cost efficiency CE Overhead
expenses/total assets
? Bank-
specific
Bankscope
Non-traditional
activity
NTA Non-interest
income/gross revenues
? Bank-
specific
Bankscope
Labour
productivity
LP Gross revenue/number
of employees
+ Bank-
specific
Bankscope
concentration C(3)
C(5)
Total assets of largest 3
or 5 banks/total assets
of the whole banking
industry
? Industry-
specific
China bank
regulatory
commission
(CBRC)
Banking sector
development
BSD Bank assets/GDP - Industry-
specific
CBRC
Stock market
development
SMD Market capitalization of
listed companies/GDP
+ Industry-
specific
World bank
inflation IR Annual inflation rate ? macro World bank
GDP growth GDPG Annual GDP growth
rate
+ Macro World bank
Notes: + means positive effect, - means negative effect, ?means no indication.
With regards to the investigation on the impact of stock market volatility on bank
performance, our sample uses annual figures from 11 banks over the period 2003-2009. The
banks used in this study are four state-owned and seven national joint stock commercial
banks listed in the Chinese stock exchange. These are: the Bank of China (BOC), China
Construction Bank (CCB), Industrial and Commercial Bank of China (ICBC), Bank of
Communication (BOCOM), China Citic Bank, China Merchant Bank, China Minsheng Bank,
Industrial Bank, Guandong Development Bank, Shanghai Pudong Bank, Hua Xia Bank.
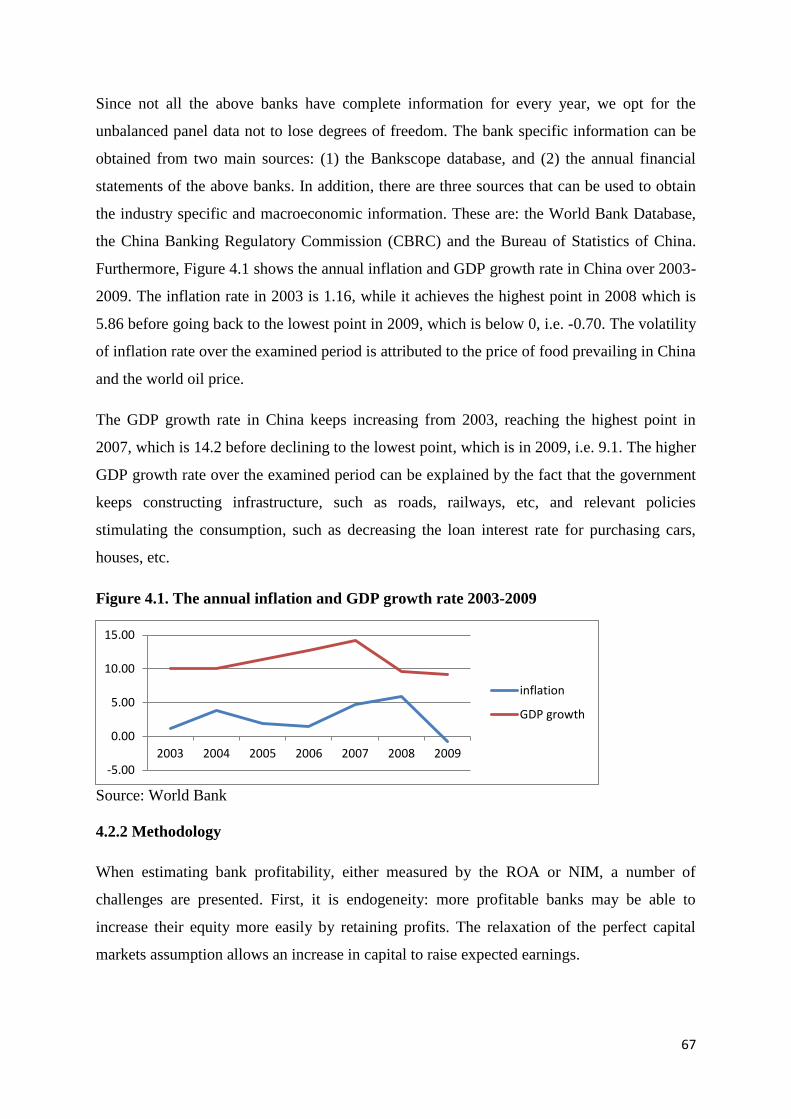
67
Since not all the above banks have complete information for every year, we opt for the
unbalanced panel data not to lose degrees of freedom. The bank specific information can be
obtained from two main sources: (1) the Bankscope database, and (2) the annual financial
statements of the above banks. In addition, there are three sources that can be used to obtain
the industry specific and macroeconomic information. These are: the World Bank Database,
the China Banking Regulatory Commission (CBRC) and the Bureau of Statistics of China.
Furthermore, Figure 4.1 shows the annual inflation and GDP growth rate in China over 2003-
2009. The inflation rate in 2003 is 1.16, while it achieves the highest point in 2008 which is
5.86 before going back to the lowest point in 2009, which is below 0, i.e. -0.70. The volatility
of inflation rate over the examined period is attributed to the price of food prevailing in China
and the world oil price.
The GDP growth rate in China keeps increasing from 2003, reaching the highest point in
2007, which is 14.2 before declining to the lowest point, which is in 2009, i.e. 9.1. The higher
GDP growth rate over the examined period can be explained by the fact that the government
keeps constructing infrastructure, such as roads, railways, etc, and relevant policies
stimulating the consumption, such as decreasing the loan interest rate for purchasing cars,
houses, etc.
Figure 4.1. The annual inflation and GDP growth rate 2003-2009
Source: World Bank
4.2.2 Methodology
When estimating bank profitability, either measured by the ROA or NIM, a number of
challenges are presented. First, it is endogeneity: more profitable banks may be able to
increase their equity more easily by retaining profits. The relaxation of the perfect capital
markets assumption allows an increase in capital to raise expected earnings.
-5.00
0.00
5.00
10.00
15.00
2003 2004 2005 2006 2007 2008 2009
inflation
GDP growth
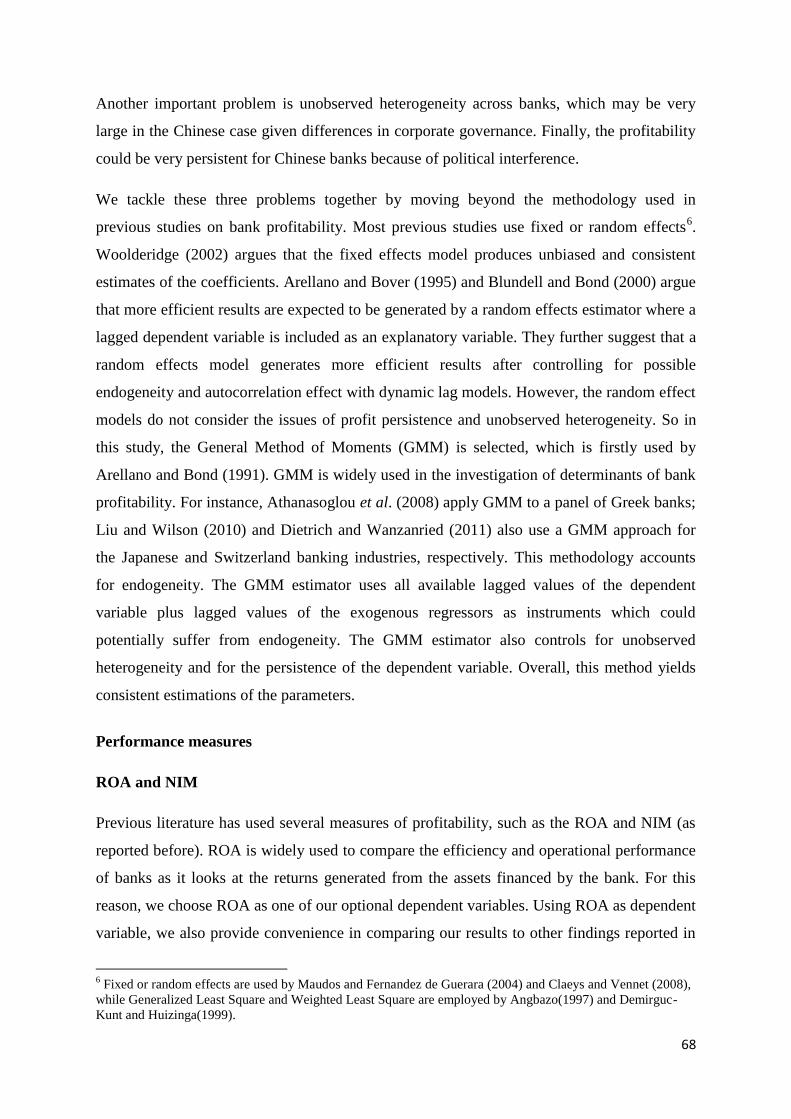
68
Another important problem is unobserved heterogeneity across banks, which may be very
large in the Chinese case given differences in corporate governance. Finally, the profitability
could be very persistent for Chinese banks because of political interference.
We tackle these three problems together by moving beyond the methodology used in
previous studies on bank profitability. Most previous studies use fixed or random effects6.
Woolderidge (2002) argues that the fixed effects model produces unbiased and consistent
estimates of the coefficients. Arellano and Bover (1995) and Blundell and Bond (2000) argue
that more efficient results are expected to be generated by a random effects estimator where a
lagged dependent variable is included as an explanatory variable. They further suggest that a
random effects model generates more efficient results after controlling for possible
endogeneity and autocorrelation effect with dynamic lag models. However, the random effect
models do not consider the issues of profit persistence and unobserved heterogeneity. So in
this study, the General Method of Moments (GMM) is selected, which is firstly used by
Arellano and Bond (1991). GMM is widely used in the investigation of determinants of bank
profitability. For instance, Athanasoglou et al. (2008) apply GMM to a panel of Greek banks;
Liu and Wilson (2010) and Dietrich and Wanzanried (2011) also use a GMM approach for
the Japanese and Switzerland banking industries, respectively. This methodology accounts
for endogeneity. The GMM estimator uses all available lagged values of the dependent
variable plus lagged values of the exogenous regressors as instruments which could
potentially suffer from endogeneity. The GMM estimator also controls for unobserved
heterogeneity and for the persistence of the dependent variable. Overall, this method yields
consistent estimations of the parameters.
Performance measures
ROA and NIM
Previous literature has used several measures of profitability, such as the ROA and NIM (as
reported before). ROA is widely used to compare the efficiency and operational performance
of banks as it looks at the returns generated from the assets financed by the bank. For this
reason, we choose ROA as one of our optional dependent variables. Using ROA as dependent
variable, we also provide convenience in comparing our results to other findings reported in
6 Fixed or random effects are used by Maudos and Fernandez de Guerara (2004) and Claeys and Vennet (2008),
while Generalized Least Square and Weighted Least Square are employed by Angbazo(1997) and Demirguc-
Kunt and Huizinga(1999).
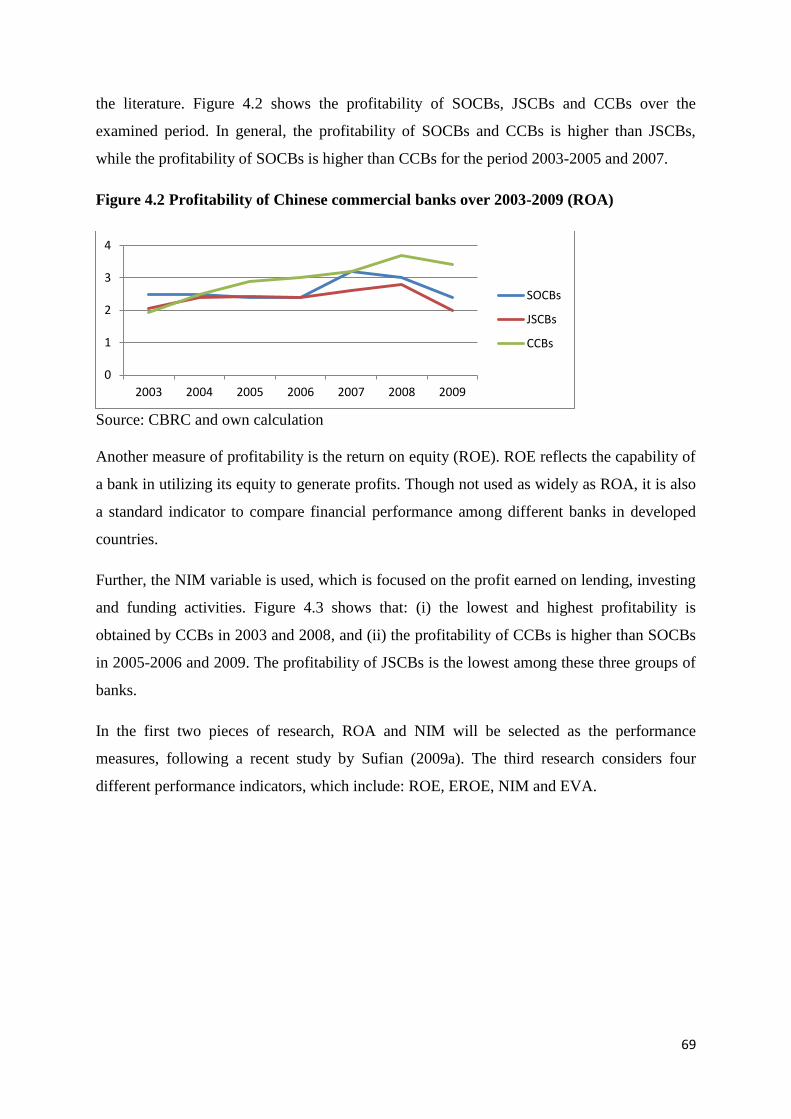
69
the literature. Figure 4.2 shows the profitability of SOCBs, JSCBs and CCBs over the
examined period. In general, the profitability of SOCBs and CCBs is higher than JSCBs,
while the profitability of SOCBs is higher than CCBs for the period 2003-2005 and 2007.
Figure 4.2 Profitability of Chinese commercial banks over 2003-2009 (ROA)
Source: CBRC and own calculation
Another measure of profitability is the return on equity (ROE). ROE reflects the capability of
a bank in utilizing its equity to generate profits. Though not used as widely as ROA, it is also
a standard indicator to compare financial performance among different banks in developed
countries.
Further, the NIM variable is used, which is focused on the profit earned on lending, investing
and funding activities. Figure 4.3 shows that: (i) the lowest and highest profitability is
obtained by CCBs in 2003 and 2008, and (ii) the profitability of CCBs is higher than SOCBs
in 2005-2006 and 2009. The profitability of JSCBs is the lowest among these three groups of
banks.
In the first two pieces of research, ROA and NIM will be selected as the performance
measures, following a recent study by Sufian (2009a). The third research considers four
different performance indicators, which include: ROE, EROE, NIM and EVA.
0
1
2
3
4
2003 2004 2005 2006 2007 2008 2009
SOCBs
JSCBs
CCBs
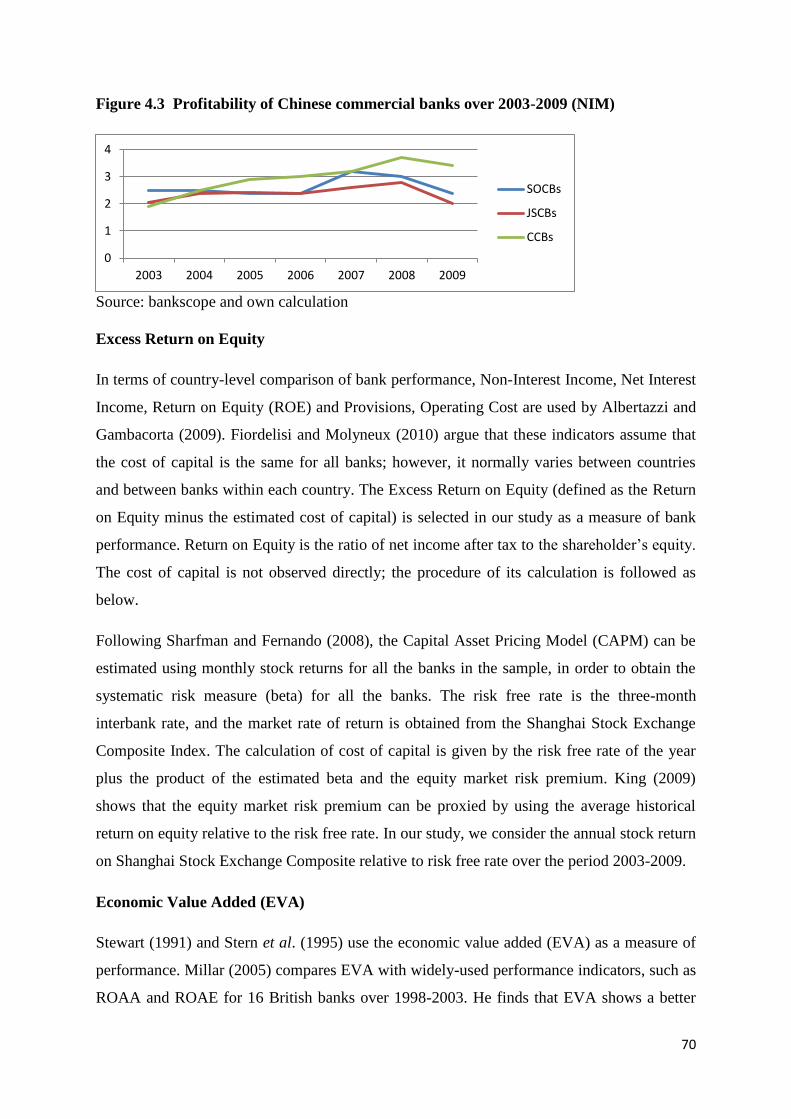
70
Figure 4.3 Profitability of Chinese commercial banks over 2003-2009 (NIM)
Source: bankscope and own calculation
Excess Return on Equity
In terms of country-level comparison of bank performance, Non-Interest Income, Net Interest
Income, Return on Equity (ROE) and Provisions, Operating Cost are used by Albertazzi and
Gambacorta (2009). Fiordelisi and Molyneux (2010) argue that these indicators assume that
the cost of capital is the same for all banks; however, it normally varies between countries
and between banks within each country. The Excess Return on Equity (defined as the Return
on Equity minus the estimated cost of capital) is selected in our study as a measure of bank
performance. Return on Equity is the ratio of net income after tax to the shareholder‟s equity.
The cost of capital is not observed directly; the procedure of its calculation is followed as
below.
Following Sharfman and Fernando (2008), the Capital Asset Pricing Model (CAPM) can be
estimated using monthly stock returns for all the banks in the sample, in order to obtain the
systematic risk measure (beta) for all the banks. The risk free rate is the three-month
interbank rate, and the market rate of return is obtained from the Shanghai Stock Exchange
Composite Index. The calculation of cost of capital is given by the risk free rate of the year
plus the product of the estimated beta and the equity market risk premium. King (2009)
shows that the equity market risk premium can be proxied by using the average historical
return on equity relative to the risk free rate. In our study, we consider the annual stock return
on Shanghai Stock Exchange Composite relative to risk free rate over the period 2003-2009.
Economic Value Added (EVA)
Stewart (1991) and Stern et al. (1995) use the economic value added (EVA) as a measure of
performance. Millar (2005) compares EVA with widely-used performance indicators, such as
ROAA and ROAE for 16 British banks over 1998-2003. He finds that EVA shows a better
0
1
2
3
4
2003 2004 2005 2006 2007 2008 2009
SOCBs
JSCBs
CCBs
71
performance than ROAA and ROAE (as dependent variable). The calculation of the EVA,
following the method by Uyemura et al. (1996), can be expressed as follows:
itEVA =( ititit tsfactorinpuecapitalchtaxrofitafteroperatingp /)arg
Where = itit tofcapitalcapital cos*
= itit tersrttoperating cosintcos
Where itEVA is the performance of bank i at time t, which i=1.......N; t=1.......T.EVA is
adjusted for factor prices, the aim of which is to minimize the possible heteroscedasticity and
scale effects in the model. In terms of the calculation of cost of capital, Heffernan and Fu
(2010) combine the LBS-First Consulting (as reported in the Economist in 1992) and Wang
(2006) index; this study selects CAPM7
to calculate the cost of capital (as reported
previously).
Bank-specific variables
The bank-specific variables included in our empirical analysis are LNTA(log of total assets),
PL(loan loss provision/total loans), LA(loans/assets), TOPBT(tax/operating profit before
tax), ETA(shareholder‟s equity/total assets), OETA(overhead expenses/total assets),
NIITA(non-interest income/total assets), and TRNE(total revenue/number of employees).
Capitalization (ETA) has been demonstrated to be an important factor in explaining the
performance of financial institutions. Its impact on bank profitability is ambiguous. A lower
capital ratio suggests a relatively risky position; one might expect a negative coefficient on
this variable (Berger, 1995). However, there are five reasons to believe that higher
capitalization should foster profitability. First, banks with higher capital ratio engage in
prudent lending. Secondly, banks with more capital should be able to lower their funding cost
(Molyneux, 1993) because a large share of capital is an important signal of creditworthiness.
Thirdly, a well-capitalized bank needs to borrow less in order to support a given level of
assets. This can be important in emerging countries when the ability to borrow is more
subject to stops. Fourth, capital can be considered a cushion to raise the share of risky assets,
7The expression of the Capital Asset Pricing Model (CAPM) used in our study is as follows:
bankreturnnstockretur
itecapitalch arg
ittsfactorinpu
72
such as loans. When market conditions allow a bank to make additional loans with a
beneficial return, this should imply higher profitability. Finally, an increase in capital may
raise expected earnings by reducing the expected cost of financial distress, including
bankruptcy (Berger, 1995).
Bank size (LNTA) is generally used to capture potential economies or diseconomies of scale
in the banking sector. This variable controls for cost differences, product and risk
diversification. There is no consensus on the direction of the influence. On the one hand, a
bank of large size should reduce cost because of economies of scale and scope (see Akhavein
et al., 1997; Bourke, 1989; Molyneux and Thornton, 1992; Bikker and Hu, 2002). In fact,
more diversification opportunities should allow returns to maintained (or even increased)
while lowering risk. On the other hand, large size can also imply that the bank is harder to
manage or it could be the consequence of a bank‟s aggressive growth strategy. Eichengreen
and Gibson (2001) suggest that the effect of bank size on its profitability may be positive up
to a certain limit. Beyond this point, the impact of its size could be negative due to
bureaucratic and other factors. Hence, the size-profitability relationship may be expected to
be non-linear.
Furthermore, the literature argues that reduced expenses (OETA) improve the efficiency, and
hence, raise the profitability of a financial institution, implying a negative relationship
between the operating expenses ratio and profitability (Bourke, 1989; Jiang et al., 2003).
However, Molyneux and Thornton (1992) find that the expense variable affects European
banking profitability positively. They argue that high profits earned by firms in a regulated
industry may be appropriate in the form of higher salary and wage expenditures. Their
findings support the efficiency wage theory, which states that the productivity of employees
increases with the wage rate. This positive relationship between profitability and expense is
also observed in the Tunisian case study (Naceur, 2003) and Malaysian study (Guru et al.,
2002). The proponents argue that these banks are able to pass their overheads to depositors
and borrowers in terms of lower deposit rates and/or larger lending rates.
Changes in credit risk (PL) may reflect changes in the health of a bank‟s portfolio (Cooper et
al., 2003), which may affect the performance of the institution. Duca and McLaughlin (1990),
among others, conclude that variations in bank profitability are largely attributable to
variations in credit risk since inverse exposure to credit risk is normally associated with
decreased firm profitability. This triggers discussion concerning not the volume but the
73
quality of loans made. In this direction, Miller and Noulas (1997) suggest that the financial
institutions being more exposed to high risk loans increases the accumulation of unpaid loans
and decreases the profitability.
Banks are also subject to direct taxation (TOPBT) through corporate tax and other taxes.
Although the tax rate on corporate profit is not a choice for banks, yet, the bank management
should be able to allocate its portfolio to minimise its tax. Since consumers face an inelastic
demand for banking services, most banks are able to pass the tax burden to the consumers.
Such a positive relationship between the tax variable and profitability is confirmed by
Demirguc-Kunt and Huizinga (1999), Bashir (2000) for banks in Middle East and Jiang et al.
(2003) for banks in Hong Kong.
Liquidity (LA), arising from the possible inability of banks to accommodate decreases in
liabilities or to fund increases on the assets‟ side of the balance sheet, is considered an
important determinant of bank profitability. A larger share of loans to total asset should imply
more interest revenue because of higher risk. Thus one would expect a positive relationship
between liquidity and profitability (Bourke, 1989). Graham and Bordeleau (2010) argue that
profitability is improved for banks that hold some liquid assets, however, there is a point at
which holding further liquid assets diminishes a bank‟s profitability.
Empirical evidence from Athanasoglou et al. (2008) for banks in Greece shows that there is a
positive and significant relationship between labour productivity (TRNE) and bank
profitability. This suggests that higher productivity growth generates income that is partly
channelled to bank profits. Banks target high levels of labour productivity growth through
various strategies that include keeping the labour force steady, ensuring high quality of newly
hired labour, reducing the total number of employees, and increasing overall output via
increasing investment in fixed assets which incorporate new technology.
Another important determinant, which is supposed to influence the bank profitability, is the
non-interest income ratio (NIITA). When banks are more diversified, they can generate more
income resources, thereby reducing their dependency on interest income, which is easily
affected by the adverse macroeconomic environment. The results of Jiang et al. (2003) show
that diversified banks in Hong Kong appear to be more profitable. However, fee-income
generating businesses actually exert a negative impact on banks‟ profitability (Demirguc and
Huizinga, 1999). They attribute such a finding to the fact that those fee-income generating
businesses, such as trades in currencies and derivatives, credit cards provisions, are more
74
subject to more intense competition, especially on an international basis than those traditional
interest income activities.
Industry-specific variables
Studies by Smirlock(1985), Bourke (1989), and Staikouras and Wood (2011) suggest that
industry concentration has a positive impact on banking performance. The more concentrated
the industry is, the greater the monopolistic power of the firms will be. This, in turn,
improves profit margins of banks. However, there are also some studies that report
conflicting results. For example, Naceur (2003) reports a negative coefficient between
concentration and bank profitability in Tunisia. Also, Karasulu (2001) finds that the
increasing concentration does not necessarily contribute to the profitability of the banking
sector in Korea.
Many studies in the banking literature investigate whether financial structure plays a role in
determining banking performance8. In general, a high bank asset-to GDP ratio implies that
financial development plays an important role in the economy. This relative importance may
reflect a higher demand for banking services, which in turn, attracts more potential
competitors to enter the market. When the market becomes more competitive, banks need to
adopt different strategies in order to sustain their profitability.
Demirguc-Kunt and Huizinga (1999) present evidence that financial development and
structure variables are very important. Their results show that banks in countries with more
competitive banking sectors, where bank assets constitute a large portion of GDP, generally
have smaller margins and are less profitable. Also, they notice that countries with
underdeveloped financial system tend to be less efficient and adopt less-than-competitive
pricing behaviours. In fact, for these countries, greater financial development can help to
improve the efficiency of the banking sector.
The stock market becomes larger, more active and more efficient as countries become richer.
Hence, developing countries generally have less developed stock markets. A substantial body
of literature (e.g. King and Levine, 1993a; King and Levine, 1993b; Demirgüç-Kunt and
Maksimovic, 1998; Levine and Zervos, 1998; Rajan and Zingales, 1998; Demirgüç-Kunt and
Huizinga, 1999; and Demirhuc-Kunt and Huizinga, 2001) have shown that stock market
development leads to higher growth of the firm, industry and country. Specifically,
8See Hassan and Bashir(2003), Demirguc-Kunt and Huizinga (2000).
75
Demirguc-Kunt and Maksimovic (1998) show that firms in countries with an active stock
market grow faster.
Empirical evidence from Demirguc-Kunt and Huizinga (1999) and Bashir (2000) shows that
banks have greater profit opportunities in countries with well-developed stock markets. They
argue that the larger equity markets in these countries give the banks operating therein greater
opportunities to expand their profits. Stock market development leading to increased
profitability for banks indicates complementarities between bank and stock market finance,
growth and development. This is because stock market development and resulting improved
availability of equity finance to firms reduce their risks of loan default, increase their
borrowing capacities and allow them to be better capitalized. Also as stock markets develop,
improved information availability on publicly traded firms makes it easier for banks to
evaluate and monitor credit risks associated with them; simply put developed stock markets
generate more information about firms that is also useful for banks. This tends to increase the
volume and decrease the risk of business for banks, making higher profit possible.
Alternatively, the legal and regulatory environment that makes stock market development
possible may also improve the functions of banks.
Macroeconomic variables
To measure the relationship between economic conditions and bank profitability, the annual
inflation rate is controlled. Inflation is an important determinant of banking performance. In
general, high inflation rates are associated with high loan interest rates and high income.
Perry (1992), however, asserts that the effect of inflation on banking performance depends on
whether inflation is anticipated or unanticipated. If inflation is fully anticipated and interest
rates are adjusted accordingly, a positive impact on profitability will be exerted.
Alternatively, unexpected raises in inflation cause cash flow difficulties for borrowers, which
can lead to premature termination of loan arrangements and precipitate loan losses. Indeed, if
the banks are sluggish in adjusting their interest rates, there is a possibility that banks‟ costs
may increase faster than bank revenue. Hoggarth et al. (1998) also conclude that high and
variable inflation may cause difficulties in planning and negotiating loans.
The findings of the relationship between inflation and profitability are mixed. Empirical
studies of Guru et al. (2002) for Malaysia and Jiang et al. (2003) for Hong Kong show that
high inflation rates lead to higher bank profitability. Demirguc-Kunt and Huizinga (1999)
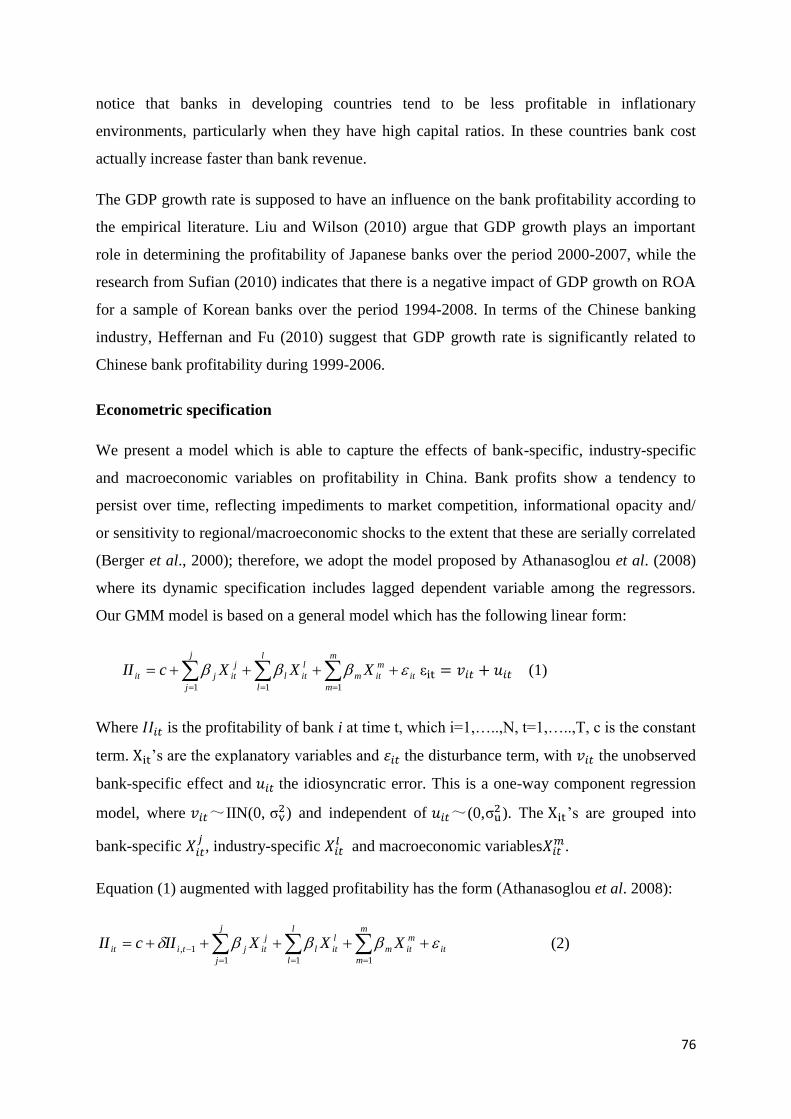
76
notice that banks in developing countries tend to be less profitable in inflationary
environments, particularly when they have high capital ratios. In these countries bank cost
actually increase faster than bank revenue.
The GDP growth rate is supposed to have an influence on the bank profitability according to
the empirical literature. Liu and Wilson (2010) argue that GDP growth plays an important
role in determining the profitability of Japanese banks over the period 2000-2007, while the
research from Sufian (2010) indicates that there is a negative impact of GDP growth on ROA
for a sample of Korean banks over the period 1994-2008. In terms of the Chinese banking
industry, Heffernan and Fu (2010) suggest that GDP growth rate is significantly related to
Chinese bank profitability during 1999-2006.
Econometric specification
We present a model which is able to capture the effects of bank-specific, industry-specific
and macroeconomic variables on profitability in China. Bank profits show a tendency to
persist over time, reflecting impediments to market competition, informational opacity and/
or sensitivity to regional/macroeconomic shocks to the extent that these are serially correlated
(Berger et al., 2000); therefore, we adopt the model proposed by Athanasoglou et al. (2008)
where its dynamic specification includes lagged dependent variable among the regressors.
Our GMM model is based on a general model which has the following linear form:
j
j
l
l
m
m
it
m
itm
l
itl
j
itjit XXXcII1 1 1
(1)
Where is the profitability of bank i at time t, which i=1,…..,N, t=1,…..,T, c is the constant
term. ‟s are the explanatory variables and the disturbance term, with the unobserved
bank-specific effect and the idiosyncratic error. This is a one-way component regression
model, where ~IIN(0, ) and independent of ~(0,
). The ‟s are grouped into
bank-specific
, industry-specific and macroeconomic variables
.
Equation (1) augmented with lagged profitability has the form (Athanasoglou et al. 2008):
j
j
l
l
m
m
it
m
itm
l
itl
j
itjtiit XXXIIcII1 1 1
1, (2)
77
Where is the one-period lagged profitability and the speed of adjustment to
equilibrium. A value of between 0 and 1 implies that profit persists, but will eventually
return to their normal level. A value close to 0 means that the industry is fairly competitive
(high speed of adjustment), while a value of close to 1 implies less competitive structure
(very low adjustment).
Endogeneity, unobserved heterogeneity and correlation between regressors and lagged
dependent variables make fixed or random effects not suitable for the estimation. Arellano
and Bond (1991) derive a consistent GMM estimation for this model. It is a single left hand
side variable that is dynamic, depending on its own past realizations. The Arellano and Bond
(1991) estimation uses all available lagged values of the dependent variable and lagged
values of the exogenous regressors as instruments; it is called difference GMM. This method
is criticized by Arellano and Bover (1995) and Blundell and Bond (1998), who argue that the
GMM difference estimator is inefficient if the instruments are weak. Hence, they develop a
new method, which is called GMM system estimator and includes lagged levels as well as
lagged differences. Roodman (2006) argues that GMM difference and system estimation can
solve the problems of endogeneity, unobserved heterogeneity, autocorrelation and profit
persistence. Bond (2002), however, argues that the unit root property makes the difference
GMM estimator bias while the system GMM estimator yields a greater precision result. In the
two separate pieces of research, we use the two-step system GMM system estimator to
investigate the impact of inflation on bank profitability, while one-step system GMM system
estimator is used to examine the effect of GDP growth on Chinese bank profitability. Two
different estimators are used to compare whether our results are robust in terms of the
significance of the covariates. Comparing between two-step and one-step GMM system
estimators, Erickson and Whited (2002) argue that the advantage of the two-step approach is
that the number of equations and parameters does not grow with the number of perfectly
measured regressors, conferring a computational simplicity not shared by the one-step system
estimator. Further, Judson and Owen (1999) argue that Monte Carlo studies show that the
one-step estimator outperforms the two-step estimator both in terms of producing a smaller
bias and a smaller standard deviation of the estimates. In terms of the estimation on the
impact of stock market volatility on bank profitability, we use both the one-step difference
and one-step system estimators for different profitability indicators.
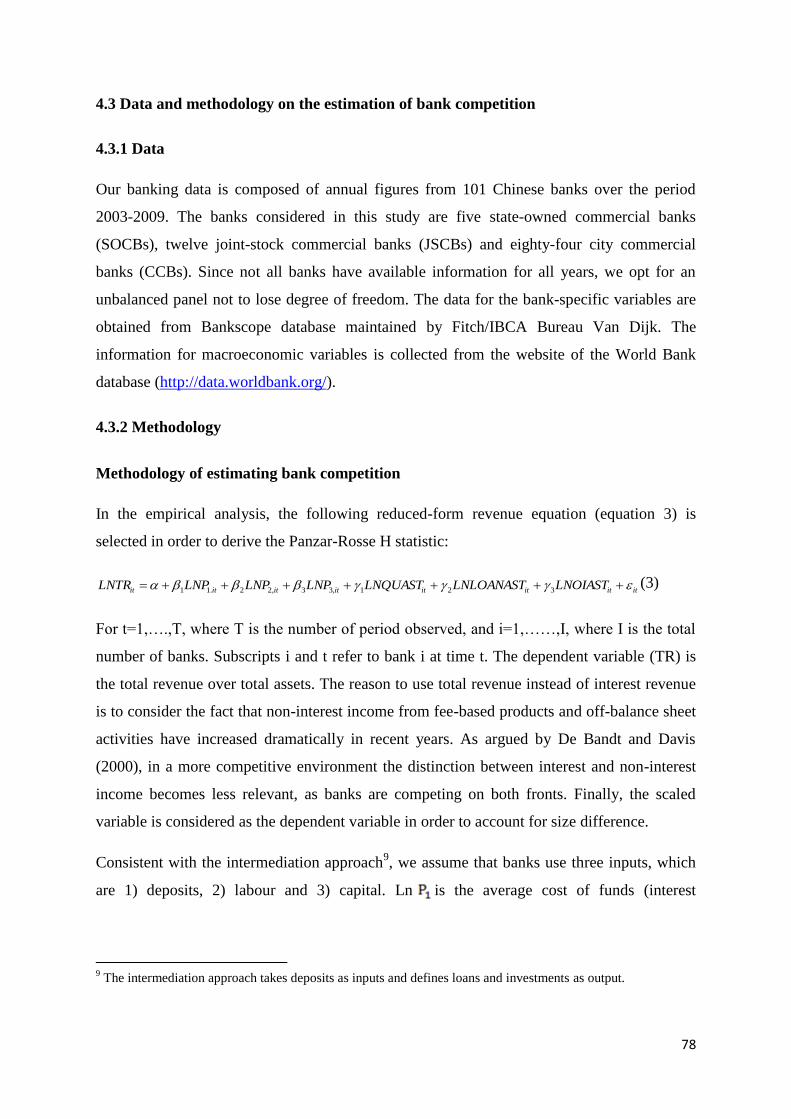
78
4.3 Data and methodology on the estimation of bank competition
4.3.1 Data
Our banking data is composed of annual figures from 101 Chinese banks over the period
2003-2009. The banks considered in this study are five state-owned commercial banks
(SOCBs), twelve joint-stock commercial banks (JSCBs) and eighty-four city commercial
banks (CCBs). Since not all banks have available information for all years, we opt for an
unbalanced panel not to lose degree of freedom. The data for the bank-specific variables are
obtained from Bankscope database maintained by Fitch/IBCA Bureau Van Dijk. The
information for macroeconomic variables is collected from the website of the World Bank
database (http://data.worldbank.org/).
4.3.2 Methodology
Methodology of estimating bank competition
In the empirical analysis, the following reduced-form revenue equation (equation 3) is
selected in order to derive the Panzar-Rosse H statistic:
itititititititit LNOIASTLNLOANASTLNQUASTLNPLNPLNPLNTR 321,33,22.11(3)
For t=1,….,T, where T is the number of period observed, and i=1,……,I, where I is the total
number of banks. Subscripts i and t refer to bank i at time t. The dependent variable (TR) is
the total revenue over total assets. The reason to use total revenue instead of interest revenue
is to consider the fact that non-interest income from fee-based products and off-balance sheet
activities have increased dramatically in recent years. As argued by De Bandt and Davis
(2000), in a more competitive environment the distinction between interest and non-interest
income becomes less relevant, as banks are competing on both fronts. Finally, the scaled
variable is considered as the dependent variable in order to account for size difference.
Consistent with the intermediation approach9, we assume that banks use three inputs, which
are 1) deposits, 2) labour and 3) capital. Ln is the average cost of funds (interest
9 The intermediation approach takes deposits as inputs and defines loans and investments as output.
79
expenses/total funds), Ln is the average cost of labour (personnel expenses/total assets), Ln
is the average cost of capital (other operating expenses/fixed assets).
The equation of our specification includes on the right hand side a set of bank-specific
variables that reflect differences in capitalization (EQAST), liquidity (LOANAST), and
product mix (OIAST), to allow for bank heterogeneity. These variables are the ratio of equity
to total assets, the ratio of loans to total assets and the ratio of other income to total assets.
The ratio of other income to total assets (OIAST) is included as an explanatory variable to
account for the influence of the generation of other income on the model‟s underlying
marginal revenue and cost functions. The coefficient of capitalization is expected to be
negative due to the fact that lower capital ratios should lead to higher bank revenue
(Molyneux et al., 1994). However, a higher capital ratio may suggest a higher risky loan
portfolio, which results in higher bank revenue. This positive effect is supported by
Coccorese (2004). The ratio of loans to total assets is used to control for bank liquidity. The
coefficient is expected to be positive because higher proportions of loans in bank‟s total
assets normally lead to higher bank revenue. The ratio of other income to total assets is used
to control for the differences in business mix. A positive coefficient is expected because
higher volume of non-interest income contributes to greater bank revenue. An important
feature of Panzar-Rosse H statistic is that the test must be undertaken on data that represents
the market in long run equilibrium. This suggests that competitive capital markets will
equalise risk-adjusted rate of return across banks such that, in equilibrium, rates of return
should be uncorrelated with input prices (Molyneux et al., 1994). In addition, the long-run
equilibrium test will be carried out using H statistic, in which case it measures the sum of
elasticity of return on assets with respect to input prices, as shown in the equation below
(equation 4). The resulting H statistic is expected to be significantly equal to zero in
equilibrium and significantly negative in case of disequilibrium (see Shaffer, 1982; Molyneux
et al. 1994; Claessens and Laeven, 2004).
itititititititit LNOIASTLNLOANASTLNQUASTLNPLNPLNPLNROA 321,33,22.11(4)
Taking into consideration the fact that there are small negative values of ROA for some
banks in a specific year, the measurement of ROA in the equation above is given by
Ln(1+ROA). The equilibrium statistics resulting from the above equation is tested using the F
test.
80
Measurement of bank competition(Lerner index)
The price is considered by estimating the average price of bank production (proxied by total
assets) as the ratio of total revenue to total assets following Fernandez de Guevara et al.
(2005), Carbo-Valverde et al. (2009) among others. The marginal cost is estimated on the
basis of a translog cost function with one output (total assets) and three input prices (price of
labour, price of capital and price of funds). Symmetry and linear homogeneity restrictions in
input prices will be imposed. The cost function is specified as:
3
1
3
1
3
1
3
1
2
210 )(2
1
j k j
jjkjjk
j
jj LNYLNWLNWLNWLNWLNYLNYLNTC (5)
TC denotes total cost, Y represents the total assets, W1 is the price of funds (ratio of interest
expenses to total funding), W2 indicates the price of capital (ratio of other non-interest
expenses to fixed assets), W3 stands for the price of labour (ratio of personnel expenses to
total assets). The indices for each bank and time have been dropped from the presentation for
the sake of simplicity. The estimated coefficients of the cost function will then be used to
compute the marginal cost (MC):
3
1
21 )(j
jj LNWLNYY
TCMC
(6)
Once the marginal cost is estimated and the price of output computed, we calculate the Lerner
index for each bank and obtain a direct measure of bank competition.
Comparing the two methods used to measure bank competition as mentioned above, both of
them have their advantages and disadvantages. To be more specific, the Panzar-Rosse H
statistic has the following advantages: first, data availability becomes much less of a
constraint. It does not require the price of production and data on quantities, these data are not
often available. We make the assumption that the input and revenue data which are required
on the estimation of Panzar-Rosse H statistic is easy to obtain (Hempell, 2002). Secondly,
Mensi (2010) argues that in the Panzar-Rosse H statistic model, we can include the specific
bank factors in the production function and the difference arising from bank size and
ownership can also be examined by the model. Thirdly, the market does not need to be
detected and the notion of a local market does not need to be specifically defined when
Panzar-Rosse H statistic is used. This advantage relieves us from the consequences of
inaccurate specification. Negrin et al. (2006) argue that the Panzar-Rosse H statistic has the
81
advantage of simplicity and transparency without losing efficiency. However, one
disadvantage of Panzar-Rosse H statistic is that the banking industry investigated is assumed
to be in a situation of long-run equilibrium. In other words, a separate test needs to be
conducted to make sure this condition is satisfied.
With regards to the Lerner index, Degryse et al. (2009) argue that one advantage of Lerner
index lies to the fact that it nests different models of competition, and it yields a measure at
the level of an individual bank, while Lerner index has advantage over Panzar-Rosse H
statistic due to the fact that it can be computed for each individual bank as well as for each
year. However, the Panzar-Rosse H statistic is only available for the estimation of
competitive condition of a whole market. On the other hand, Lerner index has a number of
drawbacks: First, there are two different views with regards to the estimation of price, one
considers both traditional and non-traditional activities (Casu and Girardone, 2006), while the
other suggests that only traditional loan-deposit services should be considered (Molyneux et
al., 1994; Bikker and Haaf, 2002). Different arguments lead to variation of Lerner index.
Second, the risk is not considered in the estimation of Lerner index, which is a very important
part of banking cost; ignoring of bank risk leads to an inflation of Lerner index.
4.3.3 Modelling the impact of competition on risk/stability
Following Liu and Wilson (2013a), the estimable model is outlined to capture the impact of
competition on risk in the Chinese banking industry while controlling for a range of bank-
specific and macroeconomic covariates which have been widely used to examine the drivers
of bank stability. The model can be expressed as:
2
0 , 1 1 2 3 4 5 6it i t it it it t i itcompetition competiiton X M DSO DJS (7)
where the subscript i and t denote bank i at the year t. it is the bank stability/risk measure,
which is either the ratio of loan loss provision over total loans (LLPTL) or the Z-score. 1, ti is
the one period lag bank stability measure. itcompetition is the bank competition measure,
which is either the Panzar-Rosse H statistics or the Lerner index. 2
itcompetiiton is the
quadratic term of bank competition which addresses the non-linear relationship between
competition and risk found by Martinez-Miera and Repullo (2010). itX is a vector of
exogenous bank-specific variables while the tM is a vector of macroeconomic variables.
82
DSO and DJS represent the dummy variables for state-owned banks and joint-stock banks.
i is a fixed effect, it is the random disturbance.
Arellano and Bover (1995) and Blundell and Bond (1998) one step system General Method
of Moments (GMM) estimator is selected to estimate the equation. Compared to the two-step
GMM system estimator employed by Liu and Wilson (2013a), we use the one step GMM
system estimator due to the fact that one-step estimator outperforms the two-step estimator
both in terms of producing a smaller bias and a smaller standard deviation of the estimates
(Judson and Owen, 1999). The lagged of the dependent variable is included in the regression.
In addition, second and higher order lags and differences of the dependent variable are used
as the instrument in order to solve the endogeneity problem. The Sargan test of over-
identifying restrictions and the first and second order autocorrelation in the error term is
reported from the results.
In order to address the endogeneity issues, lagged values for the covariates are considered for
the equation. Technical efficiency, derived from the non-parametric Data Envelopment
Analysis CCR model, is expected to be negatively related to banks risk. Boyd et al. (2006),
Agoraki et al. (2009) argue that in order to improve the performance, less efficient banks are
likely to take on higher risk to generate return.
Liquidity (LTA), which is measured by the ratio between loans and assets, is supposed to be
negatively related to bank risk due to the fact that the lower figure of this ratio indicates that
banks have greater loan exposure, which leads to higher default risk and lower bank stability.
Bank size (LNTA), which is measured by the natural logarithm of total assets, is expected to
be negatively related to bank risk. Berger (1995) argues that the higher stability (lower risks)
can be achieved by the larger banks from the economies of scale and market power.
However, the higher returns generated from higher risk projects induces the managers of
larger banks to take on higher risk, because of the consideration of “Too big to fail”, the
government would like to bail out the large distressed institutions (Stern and Feldman, 2004;
Herring and Carmassi, 2010; Demirguc-Kunt and Huizinga, 2010). Thus, the relationship
between bank size and risk is unclear.
Diversification (NTA), which is measured by the ratio between non-interest income and gross
revenue, is expected to be negatively related to bank risk. Stiroh (2010) argues that the
idiosyncratic risk can be reduced from the realization of efficiency gain via economies of
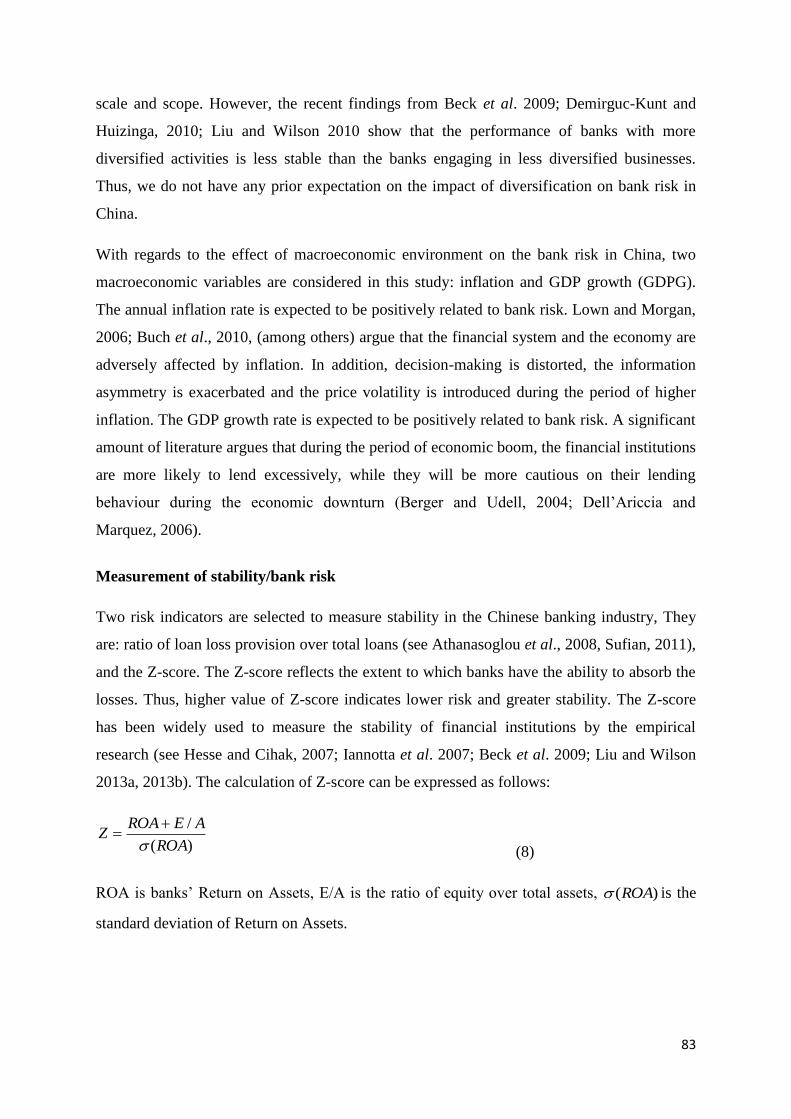
83
scale and scope. However, the recent findings from Beck et al. 2009; Demirguc-Kunt and
Huizinga, 2010; Liu and Wilson 2010 show that the performance of banks with more
diversified activities is less stable than the banks engaging in less diversified businesses.
Thus, we do not have any prior expectation on the impact of diversification on bank risk in
China.
With regards to the effect of macroeconomic environment on the bank risk in China, two
macroeconomic variables are considered in this study: inflation and GDP growth (GDPG).
The annual inflation rate is expected to be positively related to bank risk. Lown and Morgan,
2006; Buch et al., 2010, (among others) argue that the financial system and the economy are
adversely affected by inflation. In addition, decision-making is distorted, the information
asymmetry is exacerbated and the price volatility is introduced during the period of higher
inflation. The GDP growth rate is expected to be positively related to bank risk. A significant
amount of literature argues that during the period of economic boom, the financial institutions
are more likely to lend excessively, while they will be more cautious on their lending
behaviour during the economic downturn (Berger and Udell, 2004; Dell‟Ariccia and
Marquez, 2006).
Measurement of stability/bank risk
Two risk indicators are selected to measure stability in the Chinese banking industry, They
are: ratio of loan loss provision over total loans (see Athanasoglou et al., 2008, Sufian, 2011),
and the Z-score. The Z-score reflects the extent to which banks have the ability to absorb the
losses. Thus, higher value of Z-score indicates lower risk and greater stability. The Z-score
has been widely used to measure the stability of financial institutions by the empirical
research (see Hesse and Cihak, 2007; Iannotta et al. 2007; Beck et al. 2009; Liu and Wilson
2013a, 2013b). The calculation of Z-score can be expressed as follows:
)(
/
ROA
AEROAZ
(8)
ROA is banks‟ Return on Assets, E/A is the ratio of equity over total assets, )(ROA is the
standard deviation of Return on Assets.
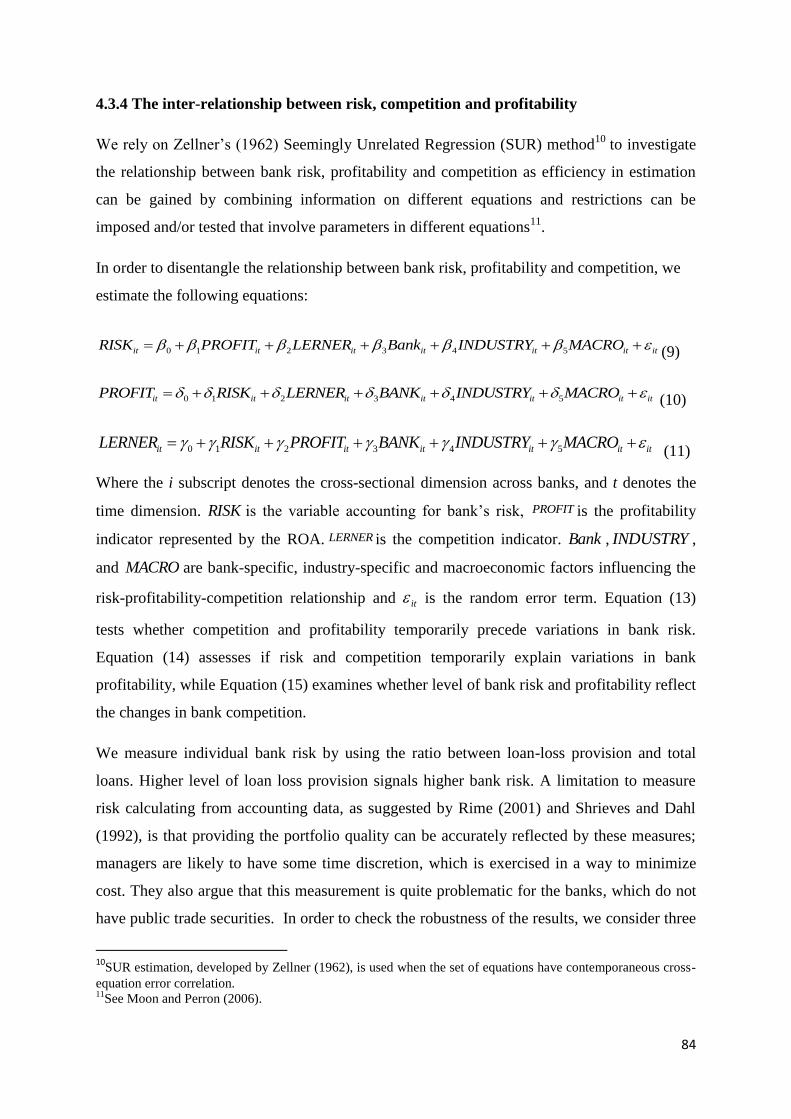
84
4.3.4 The inter-relationship between risk, competition and profitability
We rely on Zellner‟s (1962) Seemingly Unrelated Regression (SUR) method10
to investigate
the relationship between bank risk, profitability and competition as efficiency in estimation
can be gained by combining information on different equations and restrictions can be
imposed and/or tested that involve parameters in different equations11
.
In order to disentangle the relationship between bank risk, profitability and competition, we
estimate the following equations:
0 1 2 3 4 5it it it it it it itRISK PROFIT LERNER Bank INDUSTRY MACRO (9)
0 1 2 3 4 5it it it it it it itPROFIT RISK LERNER BANK INDUSTRY MACRO (10)
0 1 2 3 4 5it it it it it it itLERNER RISK PROFIT BANK INDUSTRY MACRO (11)
Where the i subscript denotes the cross-sectional dimension across banks, and t denotes the
time dimension. RISK is the variable accounting for bank‟s risk, is the profitability
indicator represented by the ROA. is the competition indicator. Bank , INDUSTRY ,
and MACRO are bank-specific, industry-specific and macroeconomic factors influencing the
risk-profitability-competition relationship and it is the random error term. Equation (13)
tests whether competition and profitability temporarily precede variations in bank risk.
Equation (14) assesses if risk and competition temporarily explain variations in bank
profitability, while Equation (15) examines whether level of bank risk and profitability reflect
the changes in bank competition.
We measure individual bank risk by using the ratio between loan-loss provision and total
loans. Higher level of loan loss provision signals higher bank risk. A limitation to measure
risk calculating from accounting data, as suggested by Rime (2001) and Shrieves and Dahl
(1992), is that providing the portfolio quality can be accurately reflected by these measures;
managers are likely to have some time discretion, which is exercised in a way to minimize
cost. They also argue that this measurement is quite problematic for the banks, which do not
have public trade securities. In order to check the robustness of the results, we consider three
10
SUR estimation, developed by Zellner (1962), is used when the set of equations have contemporaneous cross-
equation error correlation. 11
See Moon and Perron (2006).
PROFIT
LERNER
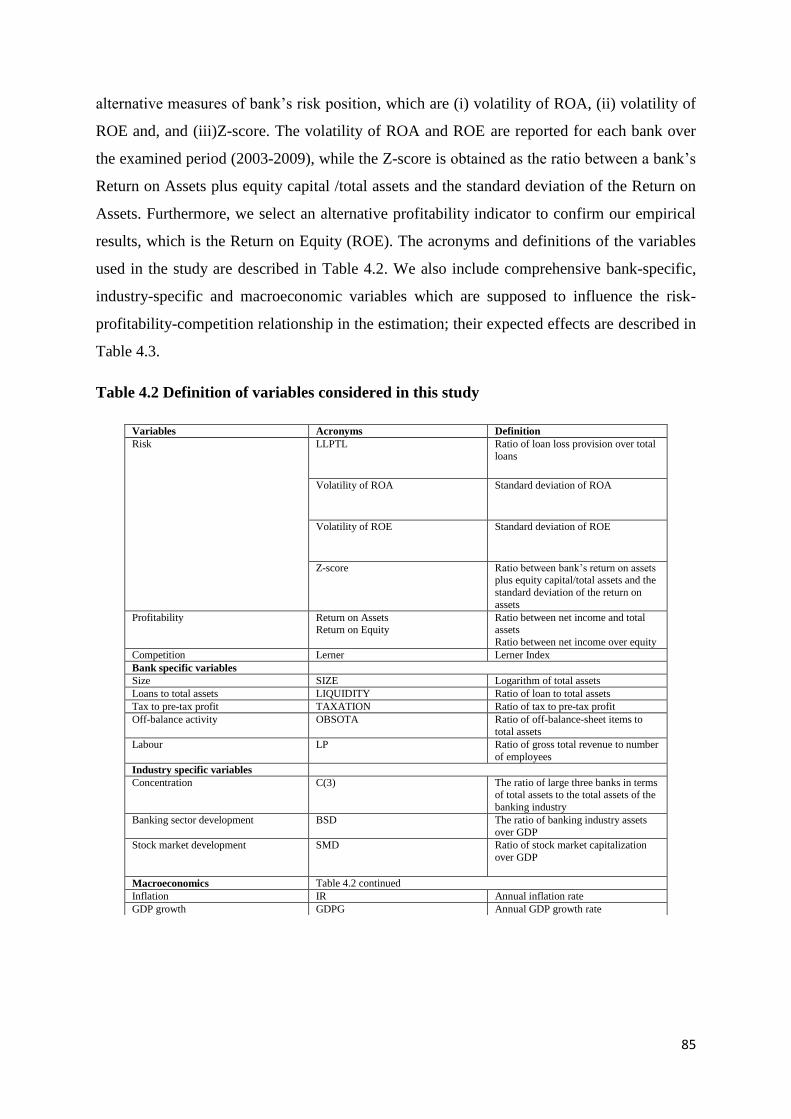
85
alternative measures of bank‟s risk position, which are (i) volatility of ROA, (ii) volatility of
ROE and, and (iii)Z-score. The volatility of ROA and ROE are reported for each bank over
the examined period (2003-2009), while the Z-score is obtained as the ratio between a bank‟s
Return on Assets plus equity capital /total assets and the standard deviation of the Return on
Assets. Furthermore, we select an alternative profitability indicator to confirm our empirical
results, which is the Return on Equity (ROE). The acronyms and definitions of the variables
used in the study are described in Table 4.2. We also include comprehensive bank-specific,
industry-specific and macroeconomic variables which are supposed to influence the risk-
profitability-competition relationship in the estimation; their expected effects are described in
Table 4.3.
Table 4.2 Definition of variables considered in this study
Variables Acronyms Definition
Risk LLPTL Ratio of loan loss provision over total
loans
Volatility of ROA Standard deviation of ROA
Volatility of ROE Standard deviation of ROE
Z-score Ratio between bank‟s return on assets plus equity capital/total assets and the
standard deviation of the return on
assets
Profitability Return on Assets Return on Equity
Ratio between net income and total assets
Ratio between net income over equity
Competition Lerner Lerner Index
Bank specific variables
Size SIZE Logarithm of total assets
Loans to total assets LIQUIDITY Ratio of loan to total assets
Tax to pre-tax profit TAXATION Ratio of tax to pre-tax profit
Off-balance activity OBSOTA Ratio of off-balance-sheet items to
total assets
Labour LP Ratio of gross total revenue to number
of employees
Industry specific variables
Concentration C(3) The ratio of large three banks in terms of total assets to the total assets of the
banking industry
Banking sector development BSD The ratio of banking industry assets
over GDP
Stock market development SMD Ratio of stock market capitalization
over GDP
Macroeconomics Table 4.2 continued
Inflation IR Annual inflation rate
GDP growth GDPG Annual GDP growth rate
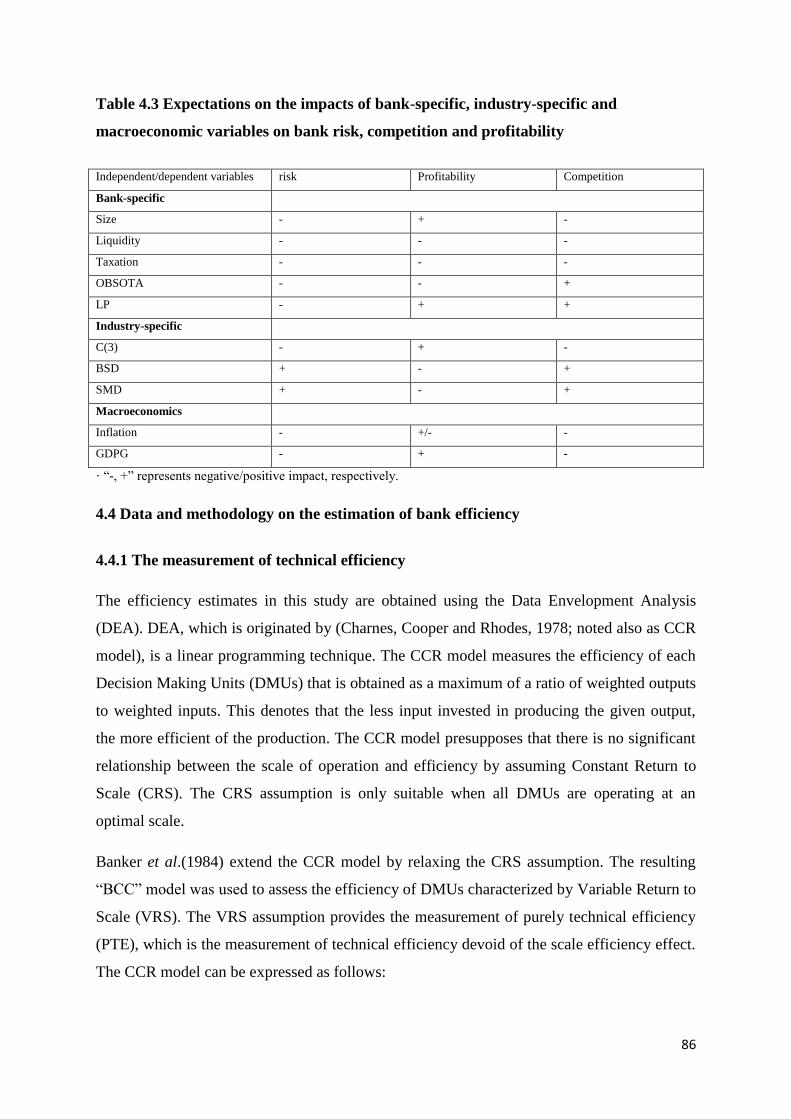
86
Table 4.3 Expectations on the impacts of bank-specific, industry-specific and
macroeconomic variables on bank risk, competition and profitability
· “-, +” represents negative/positive impact, respectively.
4.4 Data and methodology on the estimation of bank efficiency
4.4.1 The measurement of technical efficiency
The efficiency estimates in this study are obtained using the Data Envelopment Analysis
(DEA). DEA, which is originated by (Charnes, Cooper and Rhodes, 1978; noted also as CCR
model), is a linear programming technique. The CCR model measures the efficiency of each
Decision Making Units (DMUs) that is obtained as a maximum of a ratio of weighted outputs
to weighted inputs. This denotes that the less input invested in producing the given output,
the more efficient of the production. The CCR model presupposes that there is no significant
relationship between the scale of operation and efficiency by assuming Constant Return to
Scale (CRS). The CRS assumption is only suitable when all DMUs are operating at an
optimal scale.
Banker et al.(1984) extend the CCR model by relaxing the CRS assumption. The resulting
“BCC” model was used to assess the efficiency of DMUs characterized by Variable Return to
Scale (VRS). The VRS assumption provides the measurement of purely technical efficiency
(PTE), which is the measurement of technical efficiency devoid of the scale efficiency effect.
The CCR model can be expressed as follows:
Independent/dependent variables risk Profitability Competition
Bank-specific
Size - + -
Liquidity - - -
Taxation - - -
OBSOTA - - +
LP - + +
Industry-specific
C(3) - + -
BSD + - +
SMD + - +
Macroeconomics
Inflation - +/- -
GDPG - + -
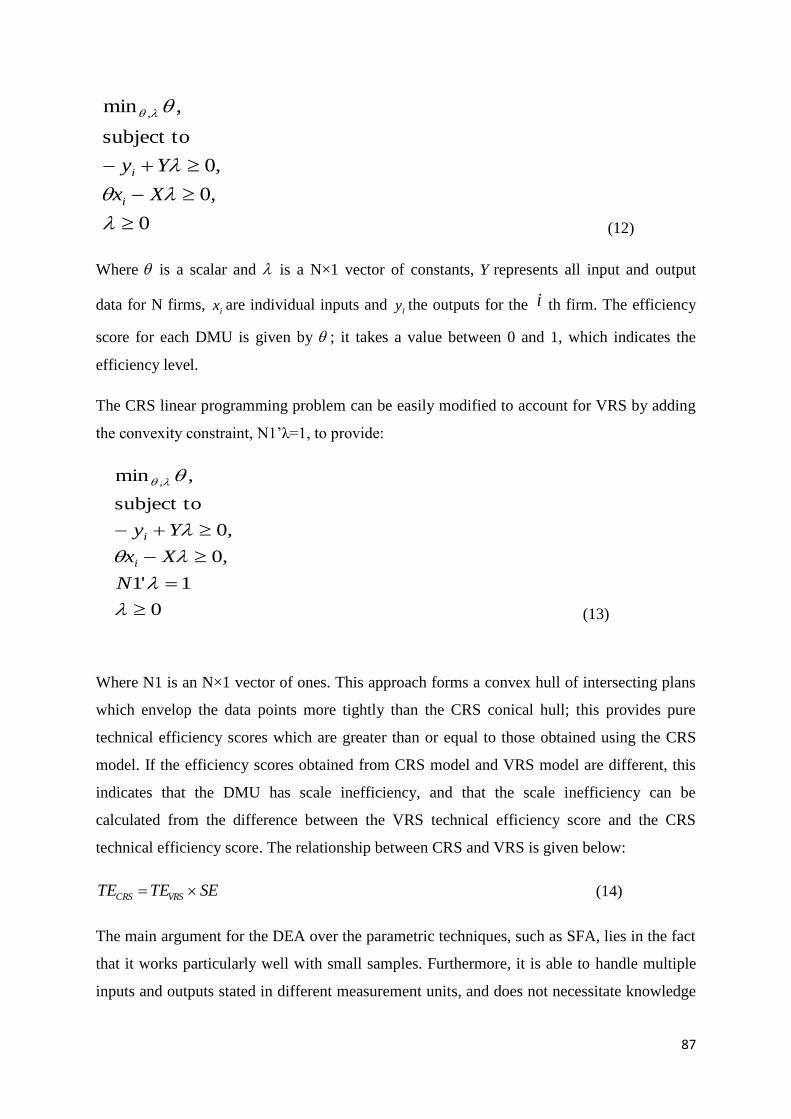
87
0
,0
,0
subject to
,min ,
Xx
Yy
i
i
(12)
Where is a scalar and is a N×1 vector of constants, Y represents all input and output
data for N firms, ix are individual inputs and
iy the outputs for the i th firm. The efficiency
score for each DMU is given by ; it takes a value between 0 and 1, which indicates the
efficiency level.
The CRS linear programming problem can be easily modified to account for VRS by adding
the convexity constraint, N1‟λ=1, to provide:
0
1'1
,0
,0
subject to
,min ,
N
Xx
Yy
i
i
(13)
Where N1 is an N×1 vector of ones. This approach forms a convex hull of intersecting plans
which envelop the data points more tightly than the CRS conical hull; this provides pure
technical efficiency scores which are greater than or equal to those obtained using the CRS
model. If the efficiency scores obtained from CRS model and VRS model are different, this
indicates that the DMU has scale inefficiency, and that the scale inefficiency can be
calculated from the difference between the VRS technical efficiency score and the CRS
technical efficiency score. The relationship between CRS and VRS is given below:
SETETE VRSCRS
(14)
The main argument for the DEA over the parametric techniques, such as SFA, lies in the fact
that it works particularly well with small samples. Furthermore, it is able to handle multiple
inputs and outputs stated in different measurement units, and does not necessitate knowledge
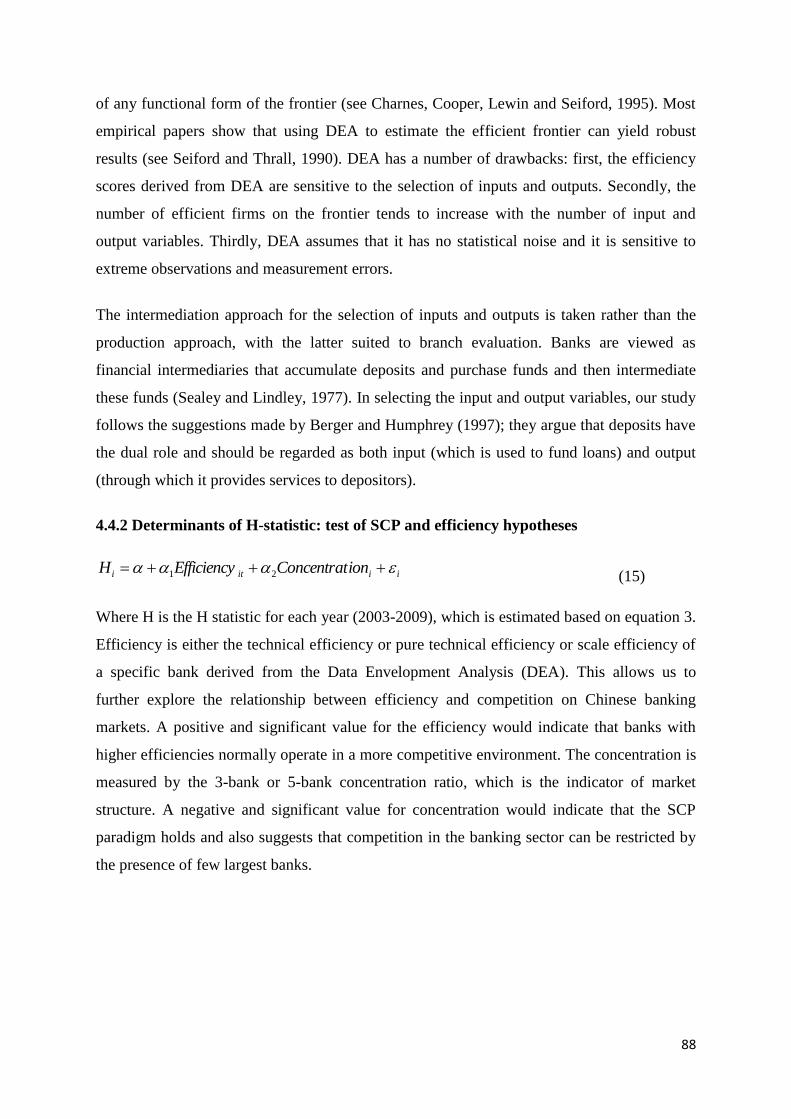
88
of any functional form of the frontier (see Charnes, Cooper, Lewin and Seiford, 1995). Most
empirical papers show that using DEA to estimate the efficient frontier can yield robust
results (see Seiford and Thrall, 1990). DEA has a number of drawbacks: first, the efficiency
scores derived from DEA are sensitive to the selection of inputs and outputs. Secondly, the
number of efficient firms on the frontier tends to increase with the number of input and
output variables. Thirdly, DEA assumes that it has no statistical noise and it is sensitive to
extreme observations and measurement errors.
The intermediation approach for the selection of inputs and outputs is taken rather than the
production approach, with the latter suited to branch evaluation. Banks are viewed as
financial intermediaries that accumulate deposits and purchase funds and then intermediate
these funds (Sealey and Lindley, 1977). In selecting the input and output variables, our study
follows the suggestions made by Berger and Humphrey (1997); they argue that deposits have
the dual role and should be regarded as both input (which is used to fund loans) and output
(through which it provides services to depositors).
4.4.2 Determinants of H-statistic: test of SCP and efficiency hypotheses
iiiti ionConcentratEfficiencyH 21 (15)
Where H is the H statistic for each year (2003-2009), which is estimated based on equation 3.
Efficiency is either the technical efficiency or pure technical efficiency or scale efficiency of
a specific bank derived from the Data Envelopment Analysis (DEA). This allows us to
further explore the relationship between efficiency and competition on Chinese banking
markets. A positive and significant value for the efficiency would indicate that banks with
higher efficiencies normally operate in a more competitive environment. The concentration is
measured by the 3-bank or 5-bank concentration ratio, which is the indicator of market
structure. A negative and significant value for concentration would indicate that the SCP
paradigm holds and also suggests that competition in the banking sector can be restricted by
the presence of few largest banks.
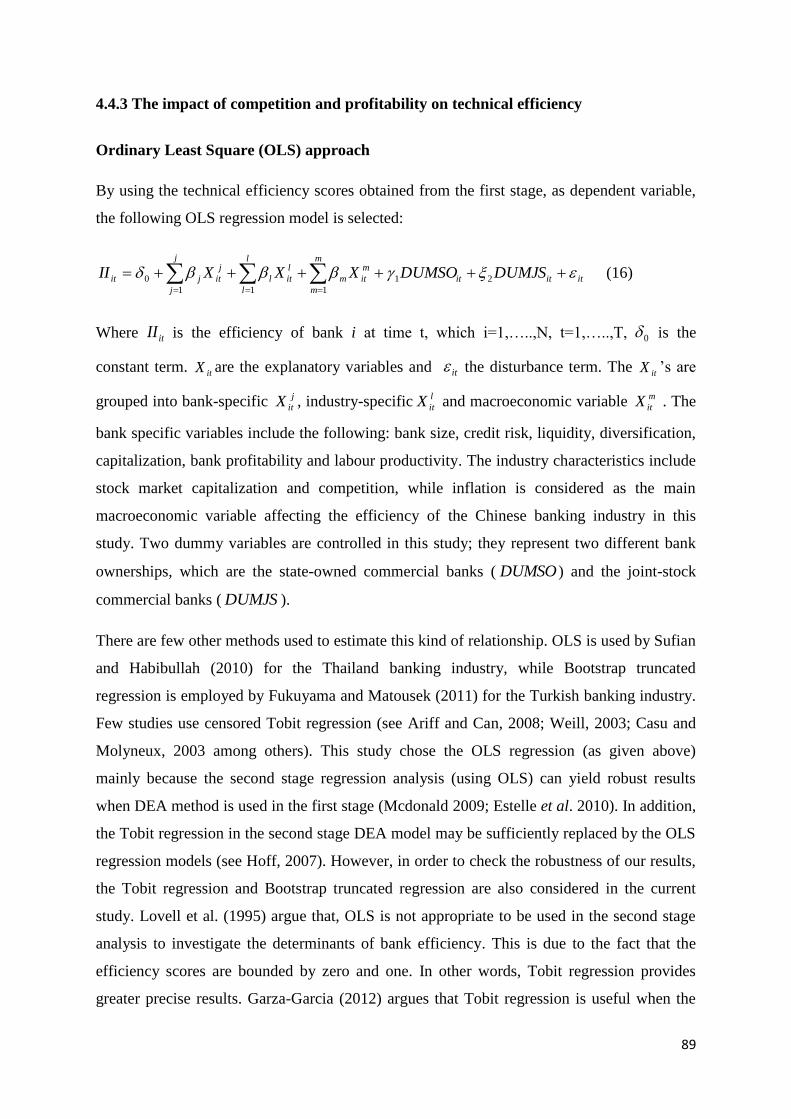
89
4.4.3 The impact of competition and profitability on technical efficiency
Ordinary Least Square (OLS) approach
By using the technical efficiency scores obtained from the first stage, as dependent variable,
the following OLS regression model is selected:
ititit
m
it
m
m
m
j
j
l
it
l
l
l
j
itjit DUMJSDUMSOXXXII
21
11 1
0 (16)
Where itII is the efficiency of bank i at time t, which i=1,…..,N, t=1,…..,T, 0 is the
constant term. itX are the explanatory variables and it the disturbance term. The
itX ‟s are
grouped into bank-specific j
itX , industry-specific l
itX and macroeconomic variable m
itX . The
bank specific variables include the following: bank size, credit risk, liquidity, diversification,
capitalization, bank profitability and labour productivity. The industry characteristics include
stock market capitalization and competition, while inflation is considered as the main
macroeconomic variable affecting the efficiency of the Chinese banking industry in this
study. Two dummy variables are controlled in this study; they represent two different bank
ownerships, which are the state-owned commercial banks ( DUMSO ) and the joint-stock
commercial banks ( DUMJS ).
There are few other methods used to estimate this kind of relationship. OLS is used by Sufian
and Habibullah (2010) for the Thailand banking industry, while Bootstrap truncated
regression is employed by Fukuyama and Matousek (2011) for the Turkish banking industry.
Few studies use censored Tobit regression (see Ariff and Can, 2008; Weill, 2003; Casu and
Molyneux, 2003 among others). This study chose the OLS regression (as given above)
mainly because the second stage regression analysis (using OLS) can yield robust results
when DEA method is used in the first stage (Mcdonald 2009; Estelle et al. 2010). In addition,
the Tobit regression in the second stage DEA model may be sufficiently replaced by the OLS
regression models (see Hoff, 2007). However, in order to check the robustness of our results,
the Tobit regression and Bootstrap truncated regression are also considered in the current
study. Lovell et al. (1995) argue that, OLS is not appropriate to be used in the second stage
analysis to investigate the determinants of bank efficiency. This is due to the fact that the
efficiency scores are bounded by zero and one. In other words, Tobit regression provides
greater precise results. Garza-Garcia (2012) argues that Tobit regression is useful when the
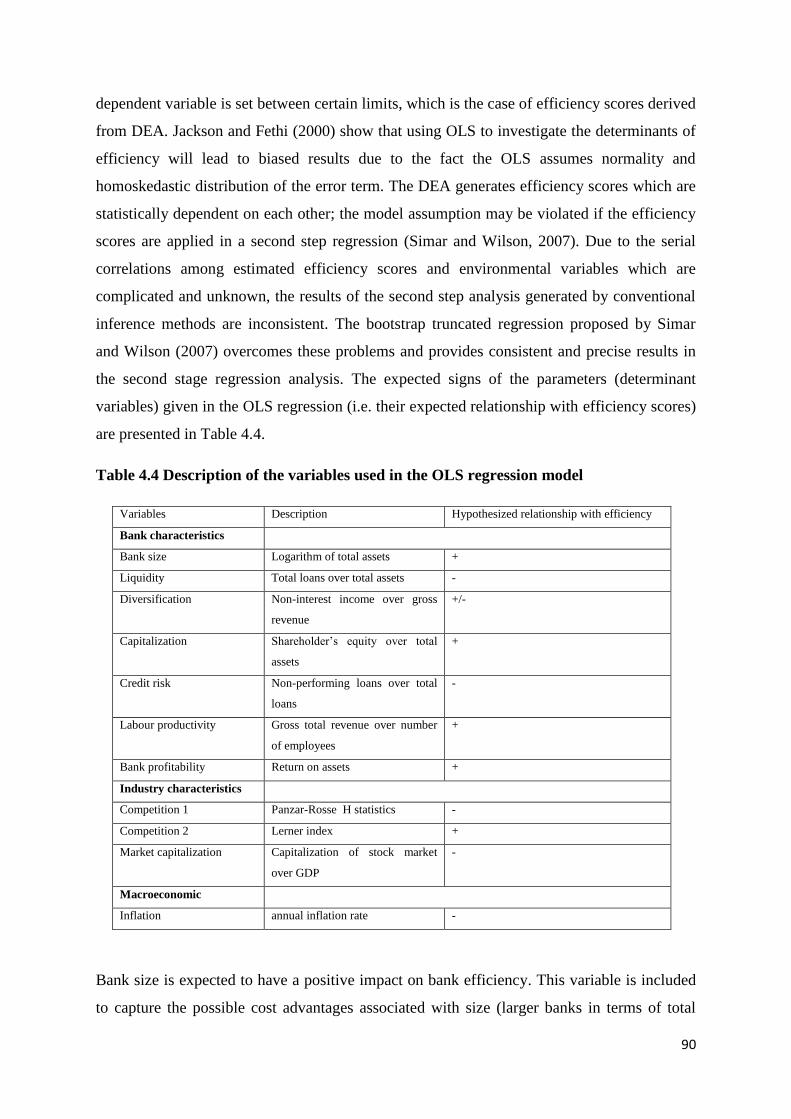
90
dependent variable is set between certain limits, which is the case of efficiency scores derived
from DEA. Jackson and Fethi (2000) show that using OLS to investigate the determinants of
efficiency will lead to biased results due to the fact the OLS assumes normality and
homoskedastic distribution of the error term. The DEA generates efficiency scores which are
statistically dependent on each other; the model assumption may be violated if the efficiency
scores are applied in a second step regression (Simar and Wilson, 2007). Due to the serial
correlations among estimated efficiency scores and environmental variables which are
complicated and unknown, the results of the second step analysis generated by conventional
inference methods are inconsistent. The bootstrap truncated regression proposed by Simar
and Wilson (2007) overcomes these problems and provides consistent and precise results in
the second stage regression analysis. The expected signs of the parameters (determinant
variables) given in the OLS regression (i.e. their expected relationship with efficiency scores)
are presented in Table 4.4.
Table 4.4 Description of the variables used in the OLS regression model
Variables Description Hypothesized relationship with efficiency
Bank characteristics
Bank size Logarithm of total assets +
Liquidity Total loans over total assets -
Diversification Non-interest income over gross
revenue
+/-
Capitalization Shareholder‟s equity over total
assets
+
Credit risk Non-performing loans over total
loans
-
Labour productivity Gross total revenue over number
of employees
+
Bank profitability Return on assets +
Industry characteristics
Competition 1 Panzar-Rosse H statistics -
Competition 2 Lerner index +
Market capitalization Capitalization of stock market
over GDP
-
Macroeconomic
Inflation annual inflation rate -
Bank size is expected to have a positive impact on bank efficiency. This variable is included
to capture the possible cost advantages associated with size (larger banks in terms of total
91
assets can decrease the cost from economies of scale which leads to an increase of
efficiency). The “bad luck” hypothesis states that an increase in risk leads to additional cost
and managerial effort, so we expect that there is a negative impact of risk on bank efficiency.
Liquidity is an indicator of bank‟s ability to meet its customers‟ daily cash needs and respond
to the sudden withdrawals. The higher ability (lower figures) decreases the bankruptcy cost,
so this variable is expected to be negatively related to bank efficiency. We do not have a prior
expectation on the impact of diversification on bank efficiency in China. Further, an increase
in the variety of businesses engaged by banks can benefit and decrease the operational cost
from the economies of scope, however, on the other hand, Chinese banks lack the experience
of engaging in the non-traditional activities, which leads to a loss on these transactions and
increase the cost of banks, thus, we do not have any expectation on this variable.
Capitalization is expected to have a positive impact on bank efficiency. As argued by
Jeitschko and Jeung (2005), better capitalised banks have less moral hazard incentives and
are more prone to adopt careful practices to reduce cost. Labour productivity measures the
quantity of bank output per unit of labour. Because labour is regarded as one input in our
study, the higher value of this variable means higher ratio of outputs to inputs; so, this
variable is expected to affect bank efficiency positively. Profitability is also expected to affect
bank efficiency positively. The profitable banks are more able to control all aspects of cost,
which leads to higher efficiency (Girardone et al., 2004).
Bank competition not only induces banks to take on higher risk to generate return, but also
increases the cost for screening and monitoring the risk, thus, this variable is expected to be
negatively correlated with bank efficiency. The stock market development is expected to be
significantly and negatively related to bank efficiency. As the stock market is expanded, more
businesses/companies will raise funds from the stock market rather than banks; this decreases
bank output, so efficiency will be negatively affected. Inflation is expected to affect bank
efficiency negatively due to the fact that under inflationary conditions banks might feel less
pressure to control their input and therefore become less efficient (Akmal and Saleem, 2008).
Bootstrap truncated regression
Simar and Wilson (2007) investigate the determinants of bank efficiency using the bootstrap
technique. Before illustrating the estimation procedure, the following model is given:
iii Z ˆ (17)
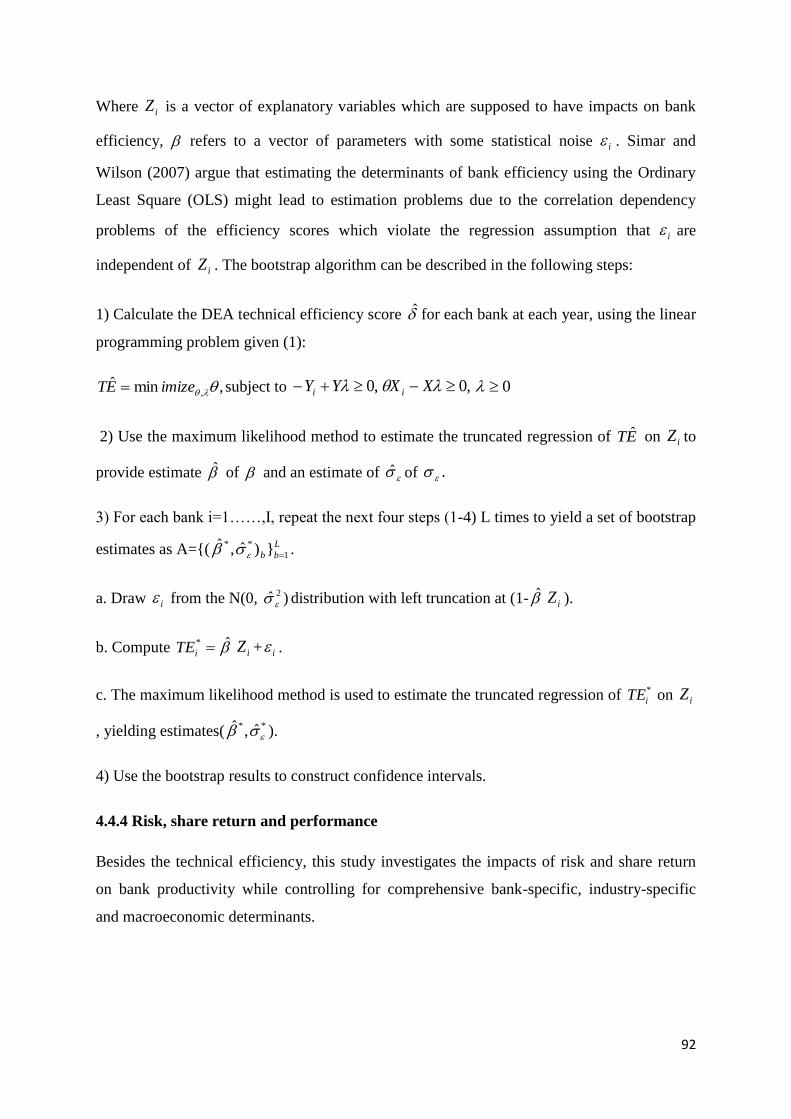
92
Where iZ is a vector of explanatory variables which are supposed to have impacts on bank
efficiency, refers to a vector of parameters with some statistical noise i . Simar and
Wilson (2007) argue that estimating the determinants of bank efficiency using the Ordinary
Least Square (OLS) might lead to estimation problems due to the correlation dependency
problems of the efficiency scores which violate the regression assumption that i are
independent of iZ . The bootstrap algorithm can be described in the following steps:
1) Calculate the DEA technical efficiency score ̂ for each bank at each year, using the linear
programming problem given (1):
,minˆ, imizeET subject to ,0 YYi ,0 XX i 0
2) Use the maximum likelihood method to estimate the truncated regression of ET ˆ on iZ to
provide estimate ̂ of and an estimate of ̂ of .
3) For each bank i=1……,I, repeat the next four steps (1-4) L times to yield a set of bootstrap
estimates as A={( L
bb 1
** })ˆ,ˆ .
a. Draw i from the N(0, )ˆ 2
distribution with left truncation at (1- ̂ iZ ).
b. Compute *
iTE ̂ iZ + i .
c. The maximum likelihood method is used to estimate the truncated regression of *
iTE on iZ
, yielding estimates(** ˆ,ˆ ).
4) Use the bootstrap results to construct confidence intervals.
4.4.4 Risk, share return and performance
Besides the technical efficiency, this study investigates the impacts of risk and share return
on bank productivity while controlling for comprehensive bank-specific, industry-specific
and macroeconomic determinants.
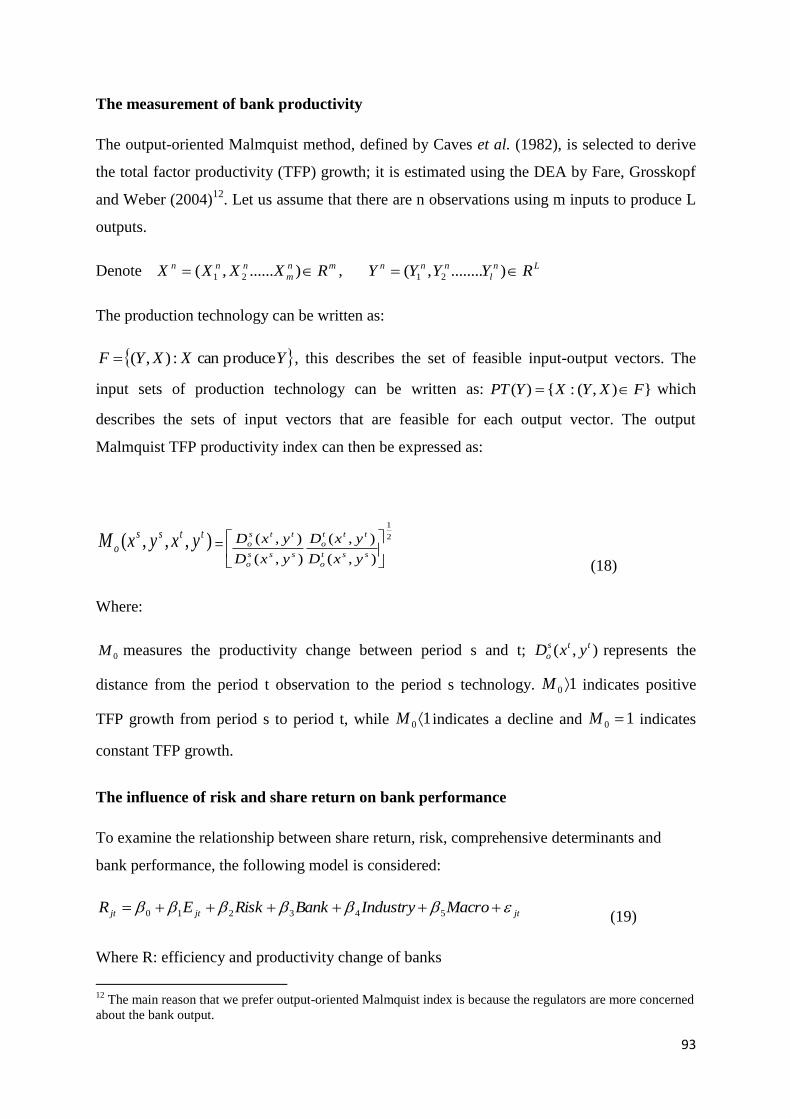
93
The measurement of bank productivity
The output-oriented Malmquist method, defined by Caves et al. (1982), is selected to derive
the total factor productivity (TFP) growth; it is estimated using the DEA by Fare, Grosskopf
and Weber (2004)12
. Let us assume that there are n observations using m inputs to produce L
outputs.
Denote mn
m
nnn RXXXX )......,( 21 , Ln
l
nnn RYYYY )........,( 21
The production technology can be written as:
YXXYF producecan :),( , this describes the set of feasible input-output vectors. The
input sets of production technology can be written as: }),(:{)( FXYXYPT which
describes the sets of input vectors that are feasible for each output vector. The output
Malmquist TFP productivity index can then be expressed as:
),,,( ttss
o yxyxM =2
1
),(
),(
),(
),(
sst
o
ttt
o
sss
o
tts
o
yxD
yxD
yxD
yxD
(18)
Where:
0M measures the productivity change between period s and t; ),( tts
o yxD represents the
distance from the period t observation to the period s technology. 10 M indicates positive
TFP growth from period s to period t, while 10 M indicates a decline and 10 M indicates
constant TFP growth.
The influence of risk and share return on bank performance
To examine the relationship between share return, risk, comprehensive determinants and
bank performance, the following model is considered:
jtjtjt MacroIndustryBankRiskER 543210 (19)
Where R: efficiency and productivity change of banks
12
The main reason that we prefer output-oriented Malmquist index is because the regulators are more concerned
about the bank output.
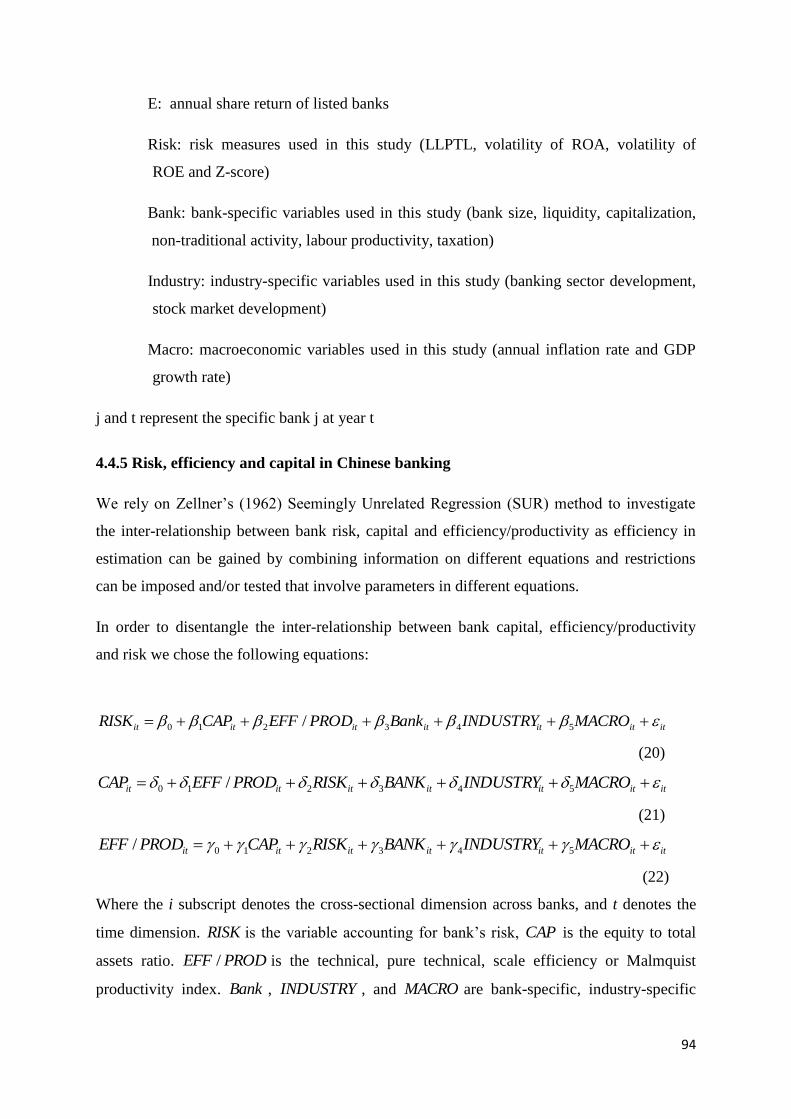
94
E: annual share return of listed banks
Risk: risk measures used in this study (LLPTL, volatility of ROA, volatility of
ROE and Z-score)
Bank: bank-specific variables used in this study (bank size, liquidity, capitalization,
non-traditional activity, labour productivity, taxation)
Industry: industry-specific variables used in this study (banking sector development,
stock market development)
Macro: macroeconomic variables used in this study (annual inflation rate and GDP
growth rate)
j and t represent the specific bank j at year t
4.4.5 Risk, efficiency and capital in Chinese banking
We rely on Zellner‟s (1962) Seemingly Unrelated Regression (SUR) method to investigate
the inter-relationship between bank risk, capital and efficiency/productivity as efficiency in
estimation can be gained by combining information on different equations and restrictions
can be imposed and/or tested that involve parameters in different equations.
In order to disentangle the inter-relationship between bank capital, efficiency/productivity
and risk we chose the following equations:
ititititititit MACROINDUSTRYBankPRODEFFCAPRISK 543210 /
(20)
ititititititit MACROINDUSTRYBANKRISKPRODEFFCAP 543210 /
(21)
ititititititit MACROINDUSTRYBANKRISKCAPPRODEFF 543210/
(22)
Where the i subscript denotes the cross-sectional dimension across banks, and t denotes the
time dimension. RISK is the variable accounting for bank‟s risk, CAP is the equity to total
assets ratio. PRODEFF / is the technical, pure technical, scale efficiency or Malmquist
productivity index. Bank , INDUSTRY , and MACRO are bank-specific, industry-specific
95
and macroeconomic factors influencing the efficiency/productivity-capital-risk relationship
and it is the random error term.
Eq. (20) tests whether efficiency or productivity and capital temporarily precede variations in
bank risk. Eq. (21) assesses if efficiency or productivity and risk temporarily precede
variations in bank capital, while Eq. (22) examines whether level of capital together with
bank risk reflect the changes in bank efficiency or productivity.
We measure the individual bank risk by using the ratio between loan-loss provision and total
loans. Higher level of this ratio indicates higher bank risk. In order to check the robustness of
the results, we select three alternative measures of banks‟ risk positions which are: (i)
volatility of ROA, (ii) volatility of ROE and (iii) Z-score. A higher figure of volatility of
ROA or ROE represents higher risk, while a higher figure of Z-score indicates that risk is
low.
Capital is calculated as the ratio of book value of equity to total assets. The individual bank
technical efficiency is reported as a maximum of a ratio of weighted outputs to weighted
inputs, and it is calculated using the non-parametric Data Envelopment Analysis (DEA) CCR
model, while the pure technical and scale efficiency are derived from the DEA BCC model
and the productivity is measured by the Malmquist productivity index. Besides capital, risk
and efficiency/productivity, we also control for comprehensive bank-specific, industry-
specific and macroeconomic variables; these variables are important in explaining the capital-
risk-efficiency/productivity relationship. Table 4.5 describes the variables used in this study.
Furthermore, the expected impacts of comprehensive variables on risk, capital,
efficiency/productivity are described in Table 4.6.
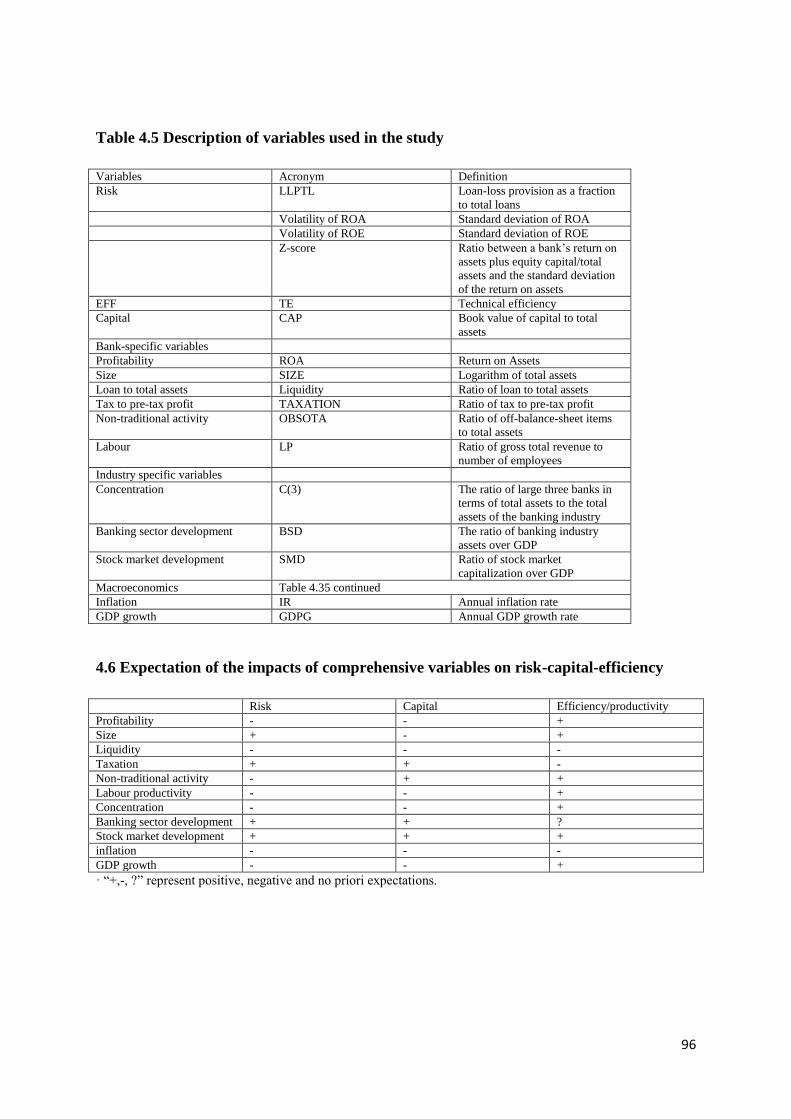
96
Table 4.5 Description of variables used in the study
Variables Acronym Definition
Risk LLPTL Loan-loss provision as a fraction
to total loans
Volatility of ROA Standard deviation of ROA
Volatility of ROE Standard deviation of ROE
Z-score Ratio between a bank‟s return on
assets plus equity capital/total
assets and the standard deviation
of the return on assets
EFF TE Technical efficiency
Capital CAP Book value of capital to total
assets
Bank-specific variables
Profitability ROA Return on Assets
Size SIZE Logarithm of total assets
Loan to total assets Liquidity Ratio of loan to total assets
Tax to pre-tax profit TAXATION Ratio of tax to pre-tax profit
Non-traditional activity OBSOTA Ratio of off-balance-sheet items
to total assets
Labour LP Ratio of gross total revenue to
number of employees
Industry specific variables
Concentration C(3) The ratio of large three banks in
terms of total assets to the total
assets of the banking industry
Banking sector development BSD The ratio of banking industry
assets over GDP
Stock market development SMD Ratio of stock market
capitalization over GDP
Macroeconomics Table 4.35 continued
Inflation IR Annual inflation rate
GDP growth GDPG Annual GDP growth rate
4.6 Expectation of the impacts of comprehensive variables on risk-capital-efficiency
Risk Capital Efficiency/productivity
Profitability - - +
Size + - +
Liquidity - - -
Taxation + + -
Non-traditional activity - + +
Labour productivity - - +
Concentration - - +
Banking sector development + + ?
Stock market development + + +
inflation - - -
GDP growth - - +
· “+,-, ?” represent positive, negative and no priori expectations.
97
4.4.6 Modelling the bank efficiency and risk
The autoregressive-distributed linear specification is selected to test the relationship between
efficiency and risk:
(23)
Where itY and itX are represented by the measure of efficiency and risk. The former is
estimated using the non-parametric DEA, while the risk is measured by the LLPTL and the
Z-score. 0 denotes the intercept, j and j are parameters to be estimated, is a common
time effect, i is the individual bank specific effect, and it is a disturbance term. Compared
to Johansen‟s co-integration technique, the autoregressive distributed lag model has a number
of advantages: first, Ghatak and Siddiki (2001) argue that the autoregressive distributed lag
model is more suitable for small samples with regards to the investigation of co-integration
relations, while the Johansen co integration technique provides more precise result for large
samples. Secondly, all of the regressors are required to be integrated of the same order by
other cointegration techniques while the autoregressive-distributed lag model can be applied
whether the regressors are I(1) and/or I(0). In other words, the pre-testing problems
associated with standard cointegration can be avoided by the autoregressive distributed lag
approach. Thirdly, the autoregressive distributed lag model is more appropriate for the data
where the unit root properties are not clear. Finally, the autoregressive distributed lag
regression permits different variables to have a different optimal number of lags, while this is
not the case for Johansen‟s cointegration test. The main disadvantage of distributed lag model
is related to the issue of multicollinearity. Even if X is stationary, it may be highly
autocorreated. In other words, it means X and one period lagged value of X are strongly
correlated. Higher levels of correlation among regressors lead to multicollinearity. Therefore,
it results in unreliable coefficient estimates with large variances and standard errors. We first
run the ordinary least square (OLS) estimator (under fixed effect and random effect), and
then the Arrelano and Bond (1991) one step difference Generalized Method of Moments
(GMM). Further, Arrelano and Bond (1995) and Blundell and Bond (1998) one and two step
GMM estimators are also selected. The difference GMM uses all available lagged values of
the dependent variable and lagged values of exogenous regressors as instruments, while the
0 1 , 1 2 , 2 1 , 1 2 , 2it i t i t i t i t t i itY Y Y X X
t
98
system GMM includes lagged levels as well as lagged differences13
. The validity of
additional moment restrictions is tested as required by the system GMM through an
incremental Sargan/Hansen test as follows: the Sargan statistics obtained under stronger
assumptions and weaker assumptions are represented by S and S‟ respectively, in which the
difference between S and S‟ is asymptotically distributed as2 .
The panel data applies in the AR (2) model described in Eq. (23), and the Granger causality is
tested for the joint null hypothesis 1 2 0 which is distributed as 2 with two degrees of
freedom14
. The sum of the jointly significant coefficients determines the casual relationship.
A positive (negative) sum indicates that the casual relationship is positive (negative); in other
words, an increase (decrease) in X in the past will increase (decrease) Y in the present. The
stability of the model is checked by testing the restriction 1 2 0 to see whether there is a
long-run effect of X on Y. The long-run effect exists if the restriction is rejected, which
means that the change in X rather than its level has impact on Y.
4.4.7 The impact of efficiency and competition on bank profitability
There are several methods that can be used to examine the determinants of bank profitability,
see Kousmidou et al. (2003); Hassan and Banshir (2003); Arellano and Bond (1991);
Arellano and Bover (1995); Roodman (2006); and Bond (2002).
The GMM specification proposed by Athanasoglou et al. (2008) is selected for the empirical
analysis of this study. The rationale for the method being chosen, the discussion of the
advantages and limitations of present method and comparison between the current method
and other methods are provided in the earlier section. We empirically examine to what extent
the profits of Chinese banks are influenced by internal factors (e.g. bank‟s specific
characteristics) as well as by external factors (e.g. macroeconomic, financial industry
structure) using the following GMM model:
(24)
13
Bond (2002) argues that the unit root property makes the difference GMM estimator bias, while the system
GMM estimator yields a greater precision results. 14
Greene (2003) argues that the extension of the original Granger methodology to panel data has the potential to improve upon the conventional Granger analysis for all the reasons that panel analysis is generally preferable to cross-sectional or traditional time series analysis.
itit
j
j
l
l
m
m
m
itm
l
itl
j
itjtiit uxxxIICII
1 1 1
1,
99
Where
: Bank I‟s profitability measure in year t, namely ROA (Return on Assets), ROE (Return
on Equity), NIM (Net Interest Margin) and PBT (Profit Margin)
: Bank I‟s profitability in year t-1
: Bank specific determinants which affect the profitability
: Industry specific determinants which affect the profitability
: Macroeconomic variables which affect the profitability
: A disturbance term which is independent across banks
: An unobserved bank-specific time-invariant effect
Our study considers the dynamic profit specification, which is motivated by the theory of
persistence of profit, and assumes that incumbent firms are capable of preventing imitation
(Goddard et al., 2013). The above model (as given in equation 24) is selected to test whether
the profitability of Chinese banks persists over time. Note that, the General Least Square
(GLS) and fixed effect estimators are not suitable for this dynamic model.
The bank-specific determinants of profitability include credit risk, liquidity, taxation,
capitalization, overhead cost, non-traditional activity, and labour productivity. The industry
specific variables include competition, concentration15
, banking sector development and
stock market development, while there is one macroeconomic variable considered in this
study, which is the annual inflation rate.
Banks with higher efficiency are able to use the loanable resources effectively, thus fostering
profitability (Garcia-Herrero et al. 2009). Using a rough measure of bank efficiency,
Demirguc-Kunt and Huizinga (1999) point out that 17% of banks‟ overhead costs are passed
on to depositors and lenders while the rest reduces profitability. Berger (1995b) uses X-
efficiency as a measurement of efficiency, and suggests that banks with higher X-efficiency
15
The concentration is measured by the 3-bank concentration ratio; however, we also select the Herfindahl-Hirschman index (HHI) to measure the concentration. The results from HHI are qualitatively similar with the results reported from the three bank concentration ratio.
itII
1, tiII
j
itx
l
itx
m
itx
it
itu
it
100
normally have higher profits. Further, using a sample of Portuguese banks, Portela and
Thanassoulis (2005) argue that in the short run most of the profit gain can be realized through
higher technical efficiency.
Few empirical studies examine the impact of competition on bank profitability. The
Structure-Conduct-Performance (SCP) paradigm uses concentration as a measure of
competition. The theory states that a higher concentrated market would favour some form of
collusion among banks, which would be able to exploit their market power through the
interest rate spreads, thus, gaining higher than normal profits (Giustiniani and Ross, 2008).
However, the Chicago Revisionist School posits that it is not the collusive behaviour but the
superior efficiency that leads to higher bank profitability (Liu et al., 2012a). Not only the
profitability-competition relationship, but also the impact of competition on the profit-
persistence is investigated by Berger et al. (2000), Goddard et al. (2004a, b), and Goddard et
al. (2011, 2013). They show that banks have higher levels of profit persistence in a more
competitive environment (for a detailed discussion on theories of banking profitability,
competition and efficiency, see Bikker and Bos, 2005).
4.4.8 Market power, stability and bank performance
In order to investigate the joint-effects of efficiency, productivity and risk on market power in
the Chinese banking industry, the ordinary least square (OLS) estimation of the following
form is considered comparing this with the individual fixed effect employed by a similar
study of Fernandez de Guevara and Maudos (2007) to see whether we can obtain similar
results. The advantage of fixed effects estimation over OLS is that the latter does not consider
the unobservable factors that are correlated with the variables included in the regression. The
omitted variable bias would result, while the fixed effects estimator has the ability to
eliminate the omitted variable bias if the unobservable factors are time-invariant. Both of
these two methods do not assume endogeneity of explanatory variables:
ititititititjt ownershipmacroindustrybankRiskefficiencyR 6543210 (25)
Where R denotes the bank market power measured by the Lerner index, is a constant
term, efficiency denotes the technical efficiency scores derived from the non-parametric Data
Envelopment Analysis (DEA), and Risk is measured by the ratio of loan loss provision over
the total loans. The risk indicator is cross-checked by three alternative measurements, which
0
101
are the volatility of ROA, the volatility of ROE and the Z-score, respectively. Furthermore,
the efficiency score is complemented by the Malmquist productivity index to check the
impact of productivity on market power in Chinese banking industry.
The bank-specific variables used in the current study include: market power (the Lerner
index), technical efficiency, productivity, bank size, credit risk, liquidity, taxation,
capitalization, non-traditional activity, and labour productivity. The bank concentration and
stock market development are the industry-specific variables; further, two macroeconomic
variables are considered in this study, which are inflation and GDP growth. The definitions of
the variables are given in Table 4.7.
Bank size is expected to have a positive impact on market power in the Chinese banking
industry due to the fact that large banks are likely to be in a better position to collude with
other banks. Not only can they benefit from their more established reputation, but also they
are more successful in creating fully or partly new banking products and services than their
smaller counterparts (Bikker et al., 2006). Taking into consideration that banks tend to
compensate greater risk with higher margins; we expect a positive influence of this variable.
The level of bank capitalization is expected to have a positive influence on market power.
Banks which have higher capital level normally face lower bankruptcy and funding cost,
which leads to higher relative margins (Lerner index). The efficient-structure hypothesis
(ESH) argues that more efficient banks are supposed to gain market shares and larger banking
margins; thus, the efficiency is expected to be positively related to market power. The
increasing competition in traditional bank activity (loan-deposit services) obliges banks to
engage in non-traditional activity, we anticipate there is a positive influence of non-
traditional activity on bank market power. The higher productivity in terms of the labour or
the banks as a whole increases the volume of businesses engaged by banks from which the
economies of scale can be gained and higher banking margins can be achieved, so the
positive impact of (labour) productivity is expected. Taxation burden undertaken by banks
incurs higher cost; a negative influence of this variable on market power is expected. There is
no prior expectation on the impact of liquidity on market power. On the one hand, the lower
liquidity indicates that banks are engaged in higher volume of loan businesses which will
enlarge the banking margins. However, on the other hand, because Chinese banks lack ability
to monitor and manage the risk, which not only increases the credit risk but also decreases the
banking margins, so the impact of this variable on market power is not clear.
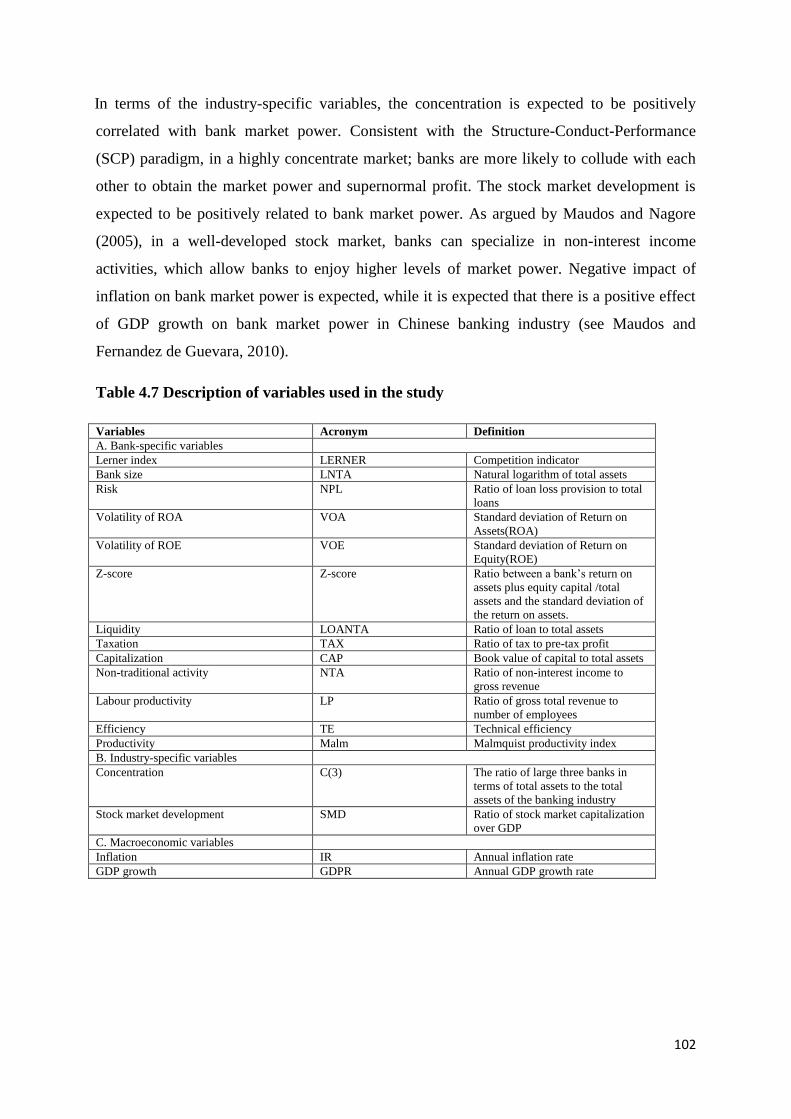
102
In terms of the industry-specific variables, the concentration is expected to be positively
correlated with bank market power. Consistent with the Structure-Conduct-Performance
(SCP) paradigm, in a highly concentrate market; banks are more likely to collude with each
other to obtain the market power and supernormal profit. The stock market development is
expected to be positively related to bank market power. As argued by Maudos and Nagore
(2005), in a well-developed stock market, banks can specialize in non-interest income
activities, which allow banks to enjoy higher levels of market power. Negative impact of
inflation on bank market power is expected, while it is expected that there is a positive effect
of GDP growth on bank market power in Chinese banking industry (see Maudos and
Fernandez de Guevara, 2010).
Table 4.7 Description of variables used in the study
Variables Acronym Definition
A. Bank-specific variables
Lerner index LERNER Competition indicator
Bank size LNTA Natural logarithm of total assets
Risk NPL Ratio of loan loss provision to total
loans
Volatility of ROA VOA Standard deviation of Return on
Assets(ROA)
Volatility of ROE VOE Standard deviation of Return on
Equity(ROE)
Z-score Z-score Ratio between a bank‟s return on
assets plus equity capital /total
assets and the standard deviation of
the return on assets.
Liquidity LOANTA Ratio of loan to total assets
Taxation TAX Ratio of tax to pre-tax profit
Capitalization CAP Book value of capital to total assets
Non-traditional activity NTA Ratio of non-interest income to
gross revenue
Labour productivity LP Ratio of gross total revenue to
number of employees
Efficiency TE Technical efficiency
Productivity Malm Malmquist productivity index
B. Industry-specific variables
Concentration C(3) The ratio of large three banks in
terms of total assets to the total
assets of the banking industry
Stock market development SMD Ratio of stock market capitalization
over GDP
C. Macroeconomic variables
Inflation IR Annual inflation rate
GDP growth GDPR Annual GDP growth rate
103
4.5 Summary and conclusion
This chapter describes the data and methodology used in investigating the profitability,
competition and efficiency in the Chinese banking sector. In general, we select 101 Chinese
commercial banks (5 state-owned, 12 joint-stock and 84 city commercial banks) over the
period 2003-2009. There are mainly three data resources namely the bankscope database, the
China Banking Regulatory Commission (CBRC) and the World Bank database.
With regards to bank profitability, we choose various profitability indicators such as Return
on Assets (ROA), Return on Equity (ROE), Net Interest Margin (NIM), Excess Return on
Equity (EROE) and Economic Value Added (EVA) as dependent variable, while the
independent variables considered in the studies can be divided into three groups: bank-
specific, industry-specific and macroeconomic determinants. To be more specific, the bank-
specific determinants mainly include bank size, risk, liquidity, taxation, capitalization, cost
efficiency, non-traditional activity and labour productivity, while three industry-specific
variables are controlled which are concentration ratio, banking sector development, stock
market development and stock market volatility, we consider various macroeconomic
determinants (annual GDP growth rate, annual inflation rate, money market rate) in three
separate studies. Both the Generalized Method of Moments (GMM) difference and system
estimators are considered in our studies.
In terms of estimation of bank competition, the reduced-form revenue equation is considered
to derive the Panzar-Rosse H statistic. To be more specific, in order to account for the size
difference, we select the ratio of total revenue over total assets as dependent variable, while
three input prices are considered which are price of fund, price of capital and price of labour,
in the reduced-form function, we control for three bank-specific variables which are
capitalization, liquidity and product mix.
Both the Data Envelopment Analysis (DEA) CCR and BCC models are considered to derive
the technical, pure technical and scale efficiency in the Chinese banking sector. We consider
three inputs (price of funds, price of labour, price of capital) and four outputs (total loans,
securities, non-interest income and total deposits). In order to investigate whether the
technical efficiency and concentration have impact on bank competition in China, we present
the Ordinary Least Square (OLS) estimator and the efficiency is cross-checked by technical,
pure technical and scale efficiency, while the concentration is proxied by both the 3-bank and
104
5-bank concentration ratio. We also choose the Generalized Method of Moments (GMM) one
step system estimate in order to examine the impact of competition on the stability of banking
industry in China. The competition is measured by both the Lerner index and the Panzar-
Rosse H statistic, while the stability/bank risk is gauged by the ratio of loan loss provision
over total loans and the Z-score, in this estimation, we also control for various bank specific
and macroeconomic determinants such as technical efficiency, liquidity, size, diversification,
annual GDP growth rate and inflation. Finally, we select the seemingly unrelated regression
(SUR) to evaluate the inter-relationship between risk, profitability and competition in the
Chinese banking sector. The banking risk is cross-checked by four different indicators
namely the ratio of loan loss provision over total loans, volatility of ROA, volatility of ROE
and the Z-score, the Lerner index is selected as the competition indicator, while both the
Return on Assets (ROA) and Return on Equity (ROE) are selected to measure the bank
profitability in China. In the seemingly unrelated regression (SUR), we control for several
bank-specific, industry-specific and macroeconomic covariates which include bank size,
liquidity, taxation, off-balance-sheet activity, labour productivity, concentration, banking
sector development, stock market development, annual GDP growth rate and inflation.
Besides the estimation of efficiency in Chinese banking industry, we also investigate the
determinants of bank efficiency in China. The determinants can be mainly classified into
three groups: bank-specific characteristics, industry-specific characteristics and
macroeconomic characteristics. To be more specific, bank size, liquidity, diversification,
capitalization, credit risk, labour productivity and profitability are considered as bank-specific
determinants, both the competition and stock market capitalization are controlled for the
industry-specific covariates, inflation is considered as the macroeconomic determinant. In
terms of the econometric techniques, we choose the Ordinary Least Square (OLS) estimator,
Tobit regression and Bootstrap truncated regression to check the robustness of the results.
Four different risk indicators namely the ratio of loan loss provision over total loans,
volatility of ROA, volatility of ROE, Z-score and share return of listed banks are selected to
assess the joint impacts of risk and share return on efficiency and productivity change in the
Chinese banking sector. The productivity is measured by the Malmquist productivity index.
While we control for various bank-specific, industry-specific and macroeconomic
determinants which include bank size, liquidity, capitalization, non-traditional activity, labour
productivity, taxation, banks sector development, stock market development, annual inflation
rate and GDP growth rate.
105
We select the seemingly unrelated regression (SUR) to estimate the inter-relationship
between risk, capital and efficiency in Chinese banking industry. The risk is cross-checked by
the ratio of loan loss provision over total loans, volatility of ROA, volatility of ROE and the
Z-score, we control for bank profitability, liquidity, taxation, non-traditional activity, labour
productivity as the bank-specific covariates; concentration, banking sector development,
stock market development as the industry-specific covariates and annual inflation rate and
GDP growth rate as the macroeconomic determinants.
In order to test the inter-relationship between efficiency and risk in Chinese banking industry,
the autoregressive-distributed linear specification is selected. In terms of the econometric
estimation, we choose the Ordinary Least Square (OLS) estimator (under fixed and random
effects), Generalized Method of Moments (GMM) one step difference estimator and GMM
one and two step system estimators. In order to check the robustness of the results, both the
ratio of loan loss provision over total loans and the Z-score are selected to measure the bank
risk.
We apply the GMM one step system estimator to evaluate the joint effects of technical
efficiency and competition on bank profitability in China. The competition is measured by
both the Lerner index and the Panzar-Rosse H statistic. The technical efficiency is derived
from the DEA CCR model, we control for various bank-specific, industry-specific and
macroeconomic covariates including risk, liquidity, capitalization, taxation, non-traditional
activity, overhead cost, labour productivity, banking sector development, stock market
development, and annual inflation rate.
Finally, we select the Ordinary Least Square estimator (OLS) to examine the joint impacts of
efficiency/productivity and risk on market power (competition) in Chinese banking industry.
The technical efficiency is derived from the DEA CCR model and the productivity is
measured by the Malmquist productivity index. The risk is cross-checked by the ratio of loan
loss provision over total loans, volatility of ROA, volatility of ROE and the Z-score. Bank
size, liquidity, taxation, capitalization, non-traditional activity, and labour productivity is
considered to be the bank-specific variables influencing the market power of Chinese banks;
the concentration ratio, banking sector development and stock market development are
industry-specific variables which are supposed to have impacts on market power of Chinese
banks, we control for annual inflation rate and GDP growth rate as the macroeconomic
determinants of market power.
106
Chapter 5
Empirical results on bank profitability
5.1 Introduction
This chapter provides the empirical results on our investigation of bank profitability with
focus on the following three issues: 1) the impact of inflation on bank profitability; 2) the
impact of GDP growth on bank profitability; 3) the impact of stock market volatility on bank
profitability.
This chapter can be structured as follows: 5.2.1 report the results regarding the effect of
inflation on bank profitability which is followed by 5.2.2 which discuss the effect of GDP
growth on bank profitability, while 5.2.3 presents and discusses the results regarding the
effect of stock market volatility on bank profitability. Finally 5.3 provides the summary and
conclusion for this chapter.
5.2 Empirical results on bank profitability
5.2.1 Bank profitability and inflation (Two step system GMM estimator)
This section mainly tests the first hypothesis of the thesis: inflation is significantly and
positively related to Chinese bank profitability. Table 5.1 shows the summary statistics of the
variables used in the study. We find that ROA is lower than NIM. There is a small difference
in terms of bank size, cost efficiency and liquidity comparing with other bank-specific
variables (as seen from the Min and Max values). The maximum amount of non-traditional
business engaged by the banks achieved is found to be 128.42, while the minimum amount is
of -34.22. This statistic shows that Chinese banks have different abilities in engaging the non-
traditional activities. It is supposed that state-owned commercial banks have relatively more
experience while for small banks such as city commercial banks, because they lack the ability
to engage in these transactions which precedes losses on these services. The standard
deviation shows that inflation is more stable than the banking and stock market development
over the examined period.
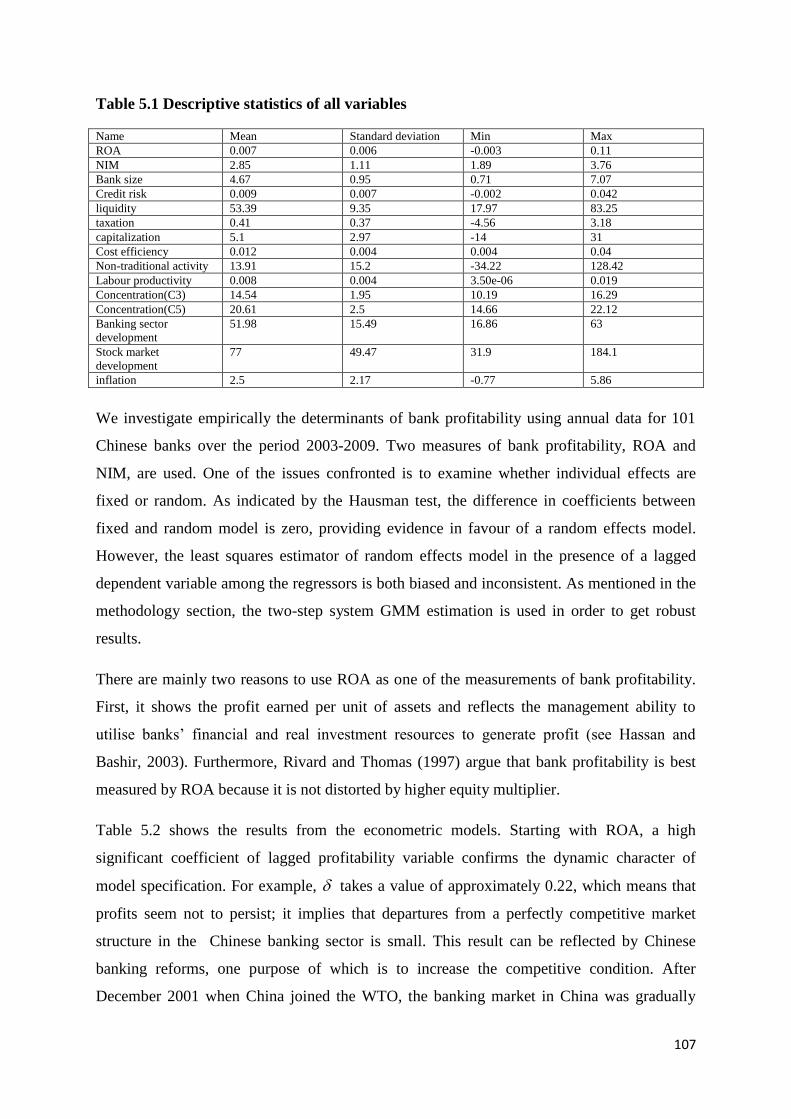
107
Table 5.1 Descriptive statistics of all variables
Name Mean Standard deviation Min Max
ROA 0.007 0.006 -0.003 0.11
NIM 2.85 1.11 1.89 3.76
Bank size 4.67 0.95 0.71 7.07
Credit risk 0.009 0.007 -0.002 0.042
liquidity 53.39 9.35 17.97 83.25
taxation 0.41 0.37 -4.56 3.18
capitalization 5.1 2.97 -14 31
Cost efficiency 0.012 0.004 0.004 0.04
Non-traditional activity 13.91 15.2 -34.22 128.42
Labour productivity 0.008 0.004 3.50e-06 0.019
Concentration(C3) 14.54 1.95 10.19 16.29
Concentration(C5) 20.61 2.5 14.66 22.12
Banking sector
development
51.98 15.49 16.86 63
Stock market
development
77 49.47 31.9 184.1
inflation 2.5 2.17 -0.77 5.86
We investigate empirically the determinants of bank profitability using annual data for 101
Chinese banks over the period 2003-2009. Two measures of bank profitability, ROA and
NIM, are used. One of the issues confronted is to examine whether individual effects are
fixed or random. As indicated by the Hausman test, the difference in coefficients between
fixed and random model is zero, providing evidence in favour of a random effects model.
However, the least squares estimator of random effects model in the presence of a lagged
dependent variable among the regressors is both biased and inconsistent. As mentioned in the
methodology section, the two-step system GMM estimation is used in order to get robust
results.
There are mainly two reasons to use ROA as one of the measurements of bank profitability.
First, it shows the profit earned per unit of assets and reflects the management ability to
utilise banks‟ financial and real investment resources to generate profit (see Hassan and
Bashir, 2003). Furthermore, Rivard and Thomas (1997) argue that bank profitability is best
measured by ROA because it is not distorted by higher equity multiplier.
Table 5.2 shows the results from the econometric models. Starting with ROA, a high
significant coefficient of lagged profitability variable confirms the dynamic character of
model specification. For example, takes a value of approximately 0.22, which means that
profits seem not to persist; it implies that departures from a perfectly competitive market
structure in the Chinese banking sector is small. This result can be reflected by Chinese
banking reforms, one purpose of which is to increase the competitive condition. After
December 2001 when China joined the WTO, the banking market in China was gradually
108
opened to foreign countries and there is a growing number of foreign banks enter Chinese
banking industry, while the restrictions on banking services provided by foreign banks were
completely removed in 2006. In other words, the foreign banks are treated exactly the same
as domestic banks. More importantly, the last round of banking reform after 2001 encourages
banks to be listed on stock exchange which is another measurement for improving
competition among banks. In contrast, Garcia-Herrero et al. (2009) find that the statistical
evidence for profit persistence in the Chinese banking sector is stronger.
In terms of taxation, the variable is negatively related to the profitability of Chinese banks,
indicating a negative relationship between taxation and bank profitability. The more taxes
paid by the bank, the higher cost incurred by the bank, thus decrease the profitability. There
are mainly two kinds of taxes paid by Chinese banks which are business tax and corporate
income tax. The tax rate is set by Chinese government. The business tax paid by Chinese
banks over the period 2003-2008 is 5% while the corporate income tax is 33%. It is
recommended to Chinese government to reduce the business tax to 2%-3%. Furthermore,
Chinese banks normally pay taxes on the interest revenue they earned; this policy needs to be
adjusted to levy taxes on the interest income which deducts the interest expenses from
interest revenue. The result is supported by Hameed and Bashir (2003) for Islamic banks
from Middle East.
The coefficient of credit risk entered the regression model with a negative sign and
statistically significant indicating a negative relationship between credit risk and bank
profitability. In order to prevent and control the risks in the banking sector, the Chinese
commercial banks normally set aside certain proportion of funds out of total loans to cover
the potential losses according to the regulation by China Banking Regulatory Commission.
Our results indicate that the volume of loan loss provision set aside by commercial banks
normally becomes non-performing loans at the end of year which precedes a decline in bank
profitability. This finding to some extent reflects the correct policy made by China banking
regulatory authority with regards to the percentage of loan loss provision set aside by
commercial banks. Sufian and Chong (2008) find the same result in terms of Philippine
banking industry. This result is also supported by Liu and Wilson (2010) for Japanese banks.
Millar and Noulas (1997) suggest that as the exposure of the financial institutions to high risk
loan increases, the accumulation of unpaid loans would increase and profitability would
decrease. However, the result of positive relationship is found in Chinese banking industry by
Sufian (2009a).
109
We find that cost efficiency is highly significant and positively related to ROA; this is in line
with Athanasoglou et al. (2008) for a sample of Greek banks over the period 1985-2001.
Overhead cost mainly indicates the non-interest expenses incurred by banks. As an important
part, the advertising expenses accounts for a large proportion of non-interest expenses. This
result suggests that the banks should take more effort in advertising their products and
services in order to attract more customers; the profit gain derived from larger number of
customers and transactions is more than the advertisement expenditure. It is also a testimony
that banks have the ability to pass the overhead expenses on customers through increasing
lending rate and decreasing deposit rate.
The negative and significant relationship between non-traditional activity and ROA implies
that financial institutions that derive a higher proportion of their income from non-interest
sources, such as fee-based services, tend to report a lower level of profitability. The empirical
findings are not in line with those reported by Canals (1993); he suggests that revenues
generated from new business units have significantly contributed to improve bank
performance. However, this result is in line with Wu et al. (2007) for Chinese banks. One
explanation is that the main motivation for Chinese banks to develop non-traditional activities
is to attract new customers rather than boost the profit; as a result, the fee charged for the
non-traditional services is very low, in some cases; this leads to a decrease in profitability.
Furthermore, the staffs in the Chinese banking sector have little experience in engaging in the
non-traditional activities which precedes losses on these transactions and further leads to
decreases in bank profitability.
Concerning the impact of labour productivity, it is positively related to profitability of
Chinese banks, indicating a positive relationship between bank profitability and labour
productivity. This is in line with Athanasoglou et al. (2008) for Greek banks. This result
suggests that higher productivity growth generates income that is partly channelled to bank
profits. Banks target high levels of labour productivity growth through various strategies that
include keeping the labour force steady, ensuring high quality of newly hired labour
(reducing the total number of employees) and increasing overall output via increasing
investment in fixed assets which incorporate new technology. Labour productivity is
measured by the amount of revenue generated by a member of staff. This variable focuses on
the amount of customers served by a member of staff. In other words, it attaches importance
in staffs‟ ability to establish relationships with potential customers and attract more customers
in banking operation. Relevant training and professional opportunities should be provided to
110
staffs especially in terms of improving the communication skills and establishing
relationships with retail customers and business companies. The Chinese banks are also
recommended to recruit some experienced staffs with established networks which will
increase the number of customers and further precede an improvement in bank revenue and
profitability.
We also report a positive and significant effect of banking sector development on bank
profitability in China. A large proportion of bank assets in GDP indicates that there is a high
demand of bank services. According to the circumstance of banking industry in China, the
establishment of a new bank involves a very complicated procedure, and the requirement and
decision made by the government to open a new bank is very strict. This makes a potential
competitor difficult to enter the market, because the demand is increasing which makes the
profitability of existing bank increase.
The sign of stock market development is positive and this variable is significant at 1% level
indicating there is a positive relationship between stock market development and bank
profitability. This finding confirms the empirical results of Ben Naceur (2003) for Tunisian
banks who suggests that as stock market enlarges, more information becomes available. This
leads to an increase number of customers to banks by making easier the process of
identification and monitoring of borrowers. Consequently, this will contribute to a higher
profitability. The positive relationship between stock market development and bank
profitability shows that there are complementaries between stock market and banking
development in China (this is in line with the theory). In the case of China, the stock market
provides credit information of listed companies to banks, which reduces banks‟ cost of
monitoring the risk; in addition, the lower default rate of the companies increases banks‟
capacity of borrowing which precedes an improvement in bank profitability.
Turing into the macroeconomic variable, inflation is found to be significantly and positively
related to bank profitability. This implies that during the period of our study inflation is
anticipated which gives banks the opportunity to adjust the interest rates accordingly,
resulting in revenues that increase faster than costs, with a positive impact on profitability.
This result is consistent with the findings by Pasiouras and Kosmidou (2007) for EU as well
as Sufian (2009) and Garcia-Herrero et al. (2009) for Chinese banks. This is also in line with
our hypothesis. Central bank of China-Peoples‟ Bank of China is in charge of setting the loan
and deposit interest rates for commercial banks, while the commercial banks can adjust the
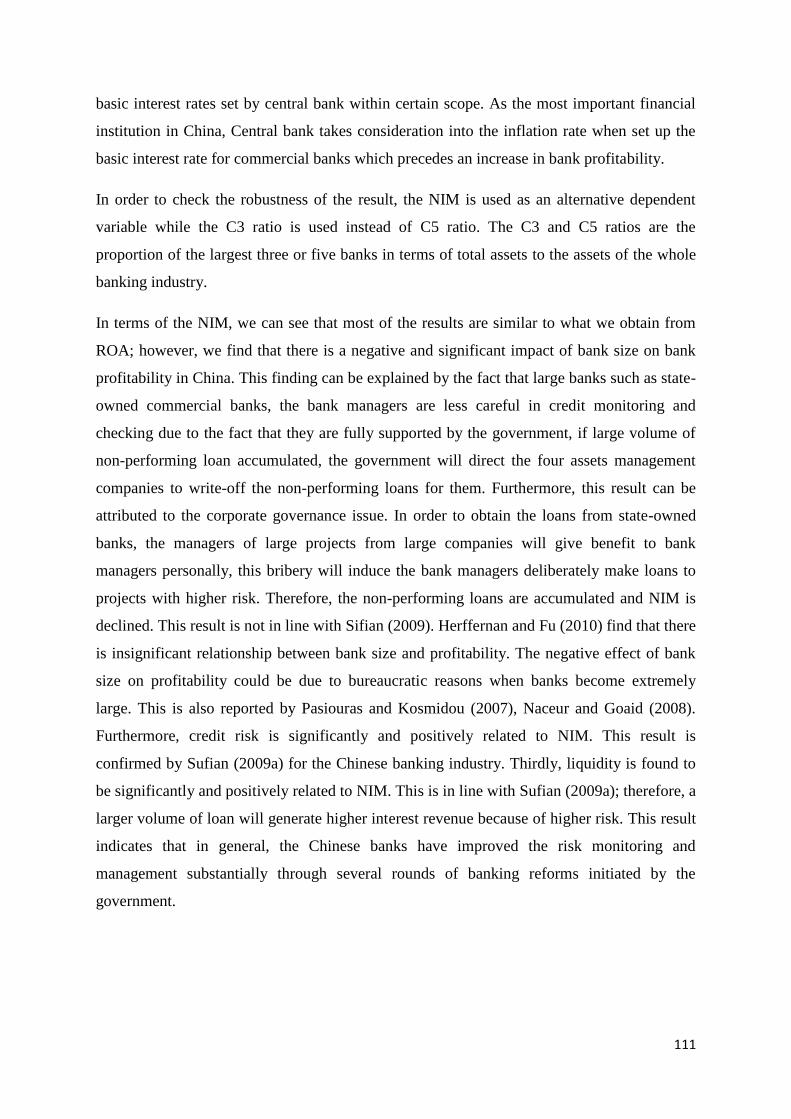
111
basic interest rates set by central bank within certain scope. As the most important financial
institution in China, Central bank takes consideration into the inflation rate when set up the
basic interest rate for commercial banks which precedes an increase in bank profitability.
In order to check the robustness of the result, the NIM is used as an alternative dependent
variable while the C3 ratio is used instead of C5 ratio. The C3 and C5 ratios are the
proportion of the largest three or five banks in terms of total assets to the assets of the whole
banking industry.
In terms of the NIM, we can see that most of the results are similar to what we obtain from
ROA; however, we find that there is a negative and significant impact of bank size on bank
profitability in China. This finding can be explained by the fact that large banks such as state-
owned commercial banks, the bank managers are less careful in credit monitoring and
checking due to the fact that they are fully supported by the government, if large volume of
non-performing loan accumulated, the government will direct the four assets management
companies to write-off the non-performing loans for them. Furthermore, this result can be
attributed to the corporate governance issue. In order to obtain the loans from state-owned
banks, the managers of large projects from large companies will give benefit to bank
managers personally, this bribery will induce the bank managers deliberately make loans to
projects with higher risk. Therefore, the non-performing loans are accumulated and NIM is
declined. This result is not in line with Sifian (2009). Herffernan and Fu (2010) find that there
is insignificant relationship between bank size and profitability. The negative effect of bank
size on profitability could be due to bureaucratic reasons when banks become extremely
large. This is also reported by Pasiouras and Kosmidou (2007), Naceur and Goaid (2008).
Furthermore, credit risk is significantly and positively related to NIM. This result is
confirmed by Sufian (2009a) for the Chinese banking industry. Thirdly, liquidity is found to
be significantly and positively related to NIM. This is in line with Sufian (2009a); therefore, a
larger volume of loan will generate higher interest revenue because of higher risk. This result
indicates that in general, the Chinese banks have improved the risk monitoring and
management substantially through several rounds of banking reforms initiated by the
government.
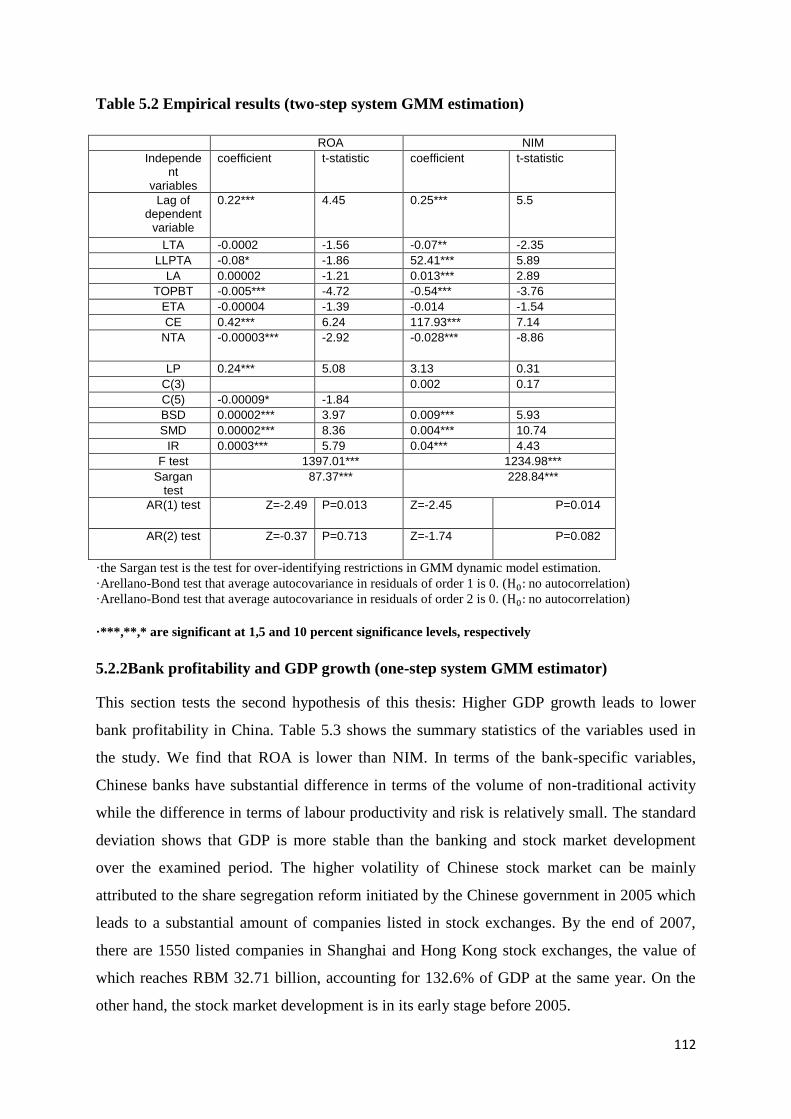
112
Table 5.2 Empirical results (two-step system GMM estimation)
ROA NIM
Independent
variables
coefficient t-statistic coefficient t-statistic
Lag of dependent
variable
0.22*** 4.45 0.25*** 5.5
LTA -0.0002 -1.56 -0.07** -2.35
LLPTA -0.08* -1.86 52.41*** 5.89
LA 0.00002 -1.21 0.013*** 2.89
TOPBT -0.005*** -4.72 -0.54*** -3.76
ETA -0.00004 -1.39 -0.014 -1.54
CE 0.42*** 6.24 117.93*** 7.14
NTA -0.00003*** -2.92 -0.028*** -8.86
LP 0.24*** 5.08 3.13 0.31
C(3) 0.002 0.17
C(5) -0.00009* -1.84
BSD 0.00002*** 3.97 0.009*** 5.93
SMD 0.00002*** 8.36 0.004*** 10.74
IR 0.0003*** 5.79 0.04*** 4.43
F test 1397.01*** 1234.98***
Sargan test
87.37*** 228.84***
AR(1) test Z=-2.49 P=0.013 Z=-2.45 P=0.014
AR(2) test Z=-0.37 P=0.713 Z=-1.74 P=0.082
·the Sargan test is the test for over-identifying restrictions in GMM dynamic model estimation.
·Arellano-Bond test that average autocovariance in residuals of order 1 is 0. ( no autocorrelation)
·Arellano-Bond test that average autocovariance in residuals of order 2 is 0. ( no autocorrelation)
·***,**,* are significant at 1,5 and 10 percent significance levels, respectively
5.2.2Bank profitability and GDP growth (one-step system GMM estimator)
This section tests the second hypothesis of this thesis: Higher GDP growth leads to lower
bank profitability in China. Table 5.3 shows the summary statistics of the variables used in
the study. We find that ROA is lower than NIM. In terms of the bank-specific variables,
Chinese banks have substantial difference in terms of the volume of non-traditional activity
while the difference in terms of labour productivity and risk is relatively small. The standard
deviation shows that GDP is more stable than the banking and stock market development
over the examined period. The higher volatility of Chinese stock market can be mainly
attributed to the share segregation reform initiated by the Chinese government in 2005 which
leads to a substantial amount of companies listed in stock exchanges. By the end of 2007,
there are 1550 listed companies in Shanghai and Hong Kong stock exchanges, the value of
which reaches RBM 32.71 billion, accounting for 132.6% of GDP at the same year. On the
other hand, the stock market development is in its early stage before 2005.
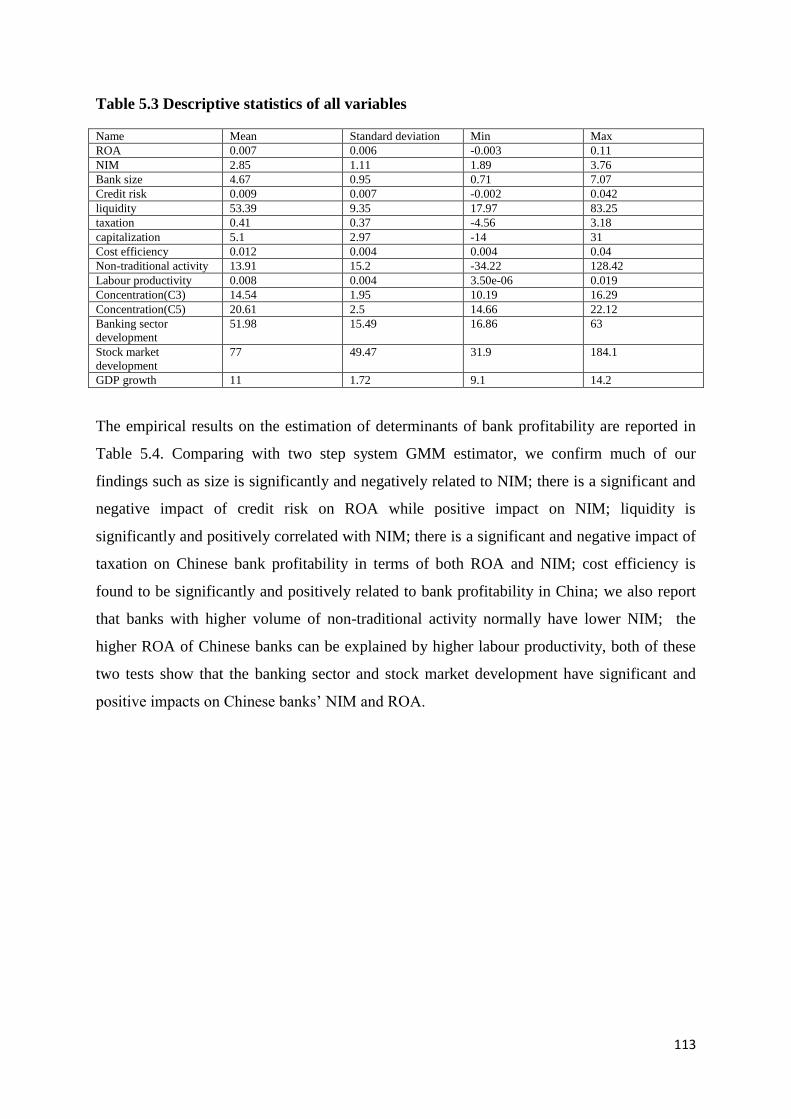
113
Table 5.3 Descriptive statistics of all variables
Name Mean Standard deviation Min Max
ROA 0.007 0.006 -0.003 0.11
NIM 2.85 1.11 1.89 3.76
Bank size 4.67 0.95 0.71 7.07
Credit risk 0.009 0.007 -0.002 0.042
liquidity 53.39 9.35 17.97 83.25
taxation 0.41 0.37 -4.56 3.18
capitalization 5.1 2.97 -14 31
Cost efficiency 0.012 0.004 0.004 0.04
Non-traditional activity 13.91 15.2 -34.22 128.42
Labour productivity 0.008 0.004 3.50e-06 0.019
Concentration(C3) 14.54 1.95 10.19 16.29
Concentration(C5) 20.61 2.5 14.66 22.12
Banking sector
development
51.98 15.49 16.86 63
Stock market
development
77 49.47 31.9 184.1
GDP growth 11 1.72 9.1 14.2
The empirical results on the estimation of determinants of bank profitability are reported in
Table 5.4. Comparing with two step system GMM estimator, we confirm much of our
findings such as size is significantly and negatively related to NIM; there is a significant and
negative impact of credit risk on ROA while positive impact on NIM; liquidity is
significantly and positively correlated with NIM; there is a significant and negative impact of
taxation on Chinese bank profitability in terms of both ROA and NIM; cost efficiency is
found to be significantly and positively related to bank profitability in China; we also report
that banks with higher volume of non-traditional activity normally have lower NIM; the
higher ROA of Chinese banks can be explained by higher labour productivity, both of these
two tests show that the banking sector and stock market development have significant and
positive impacts on Chinese banks‟ NIM and ROA.
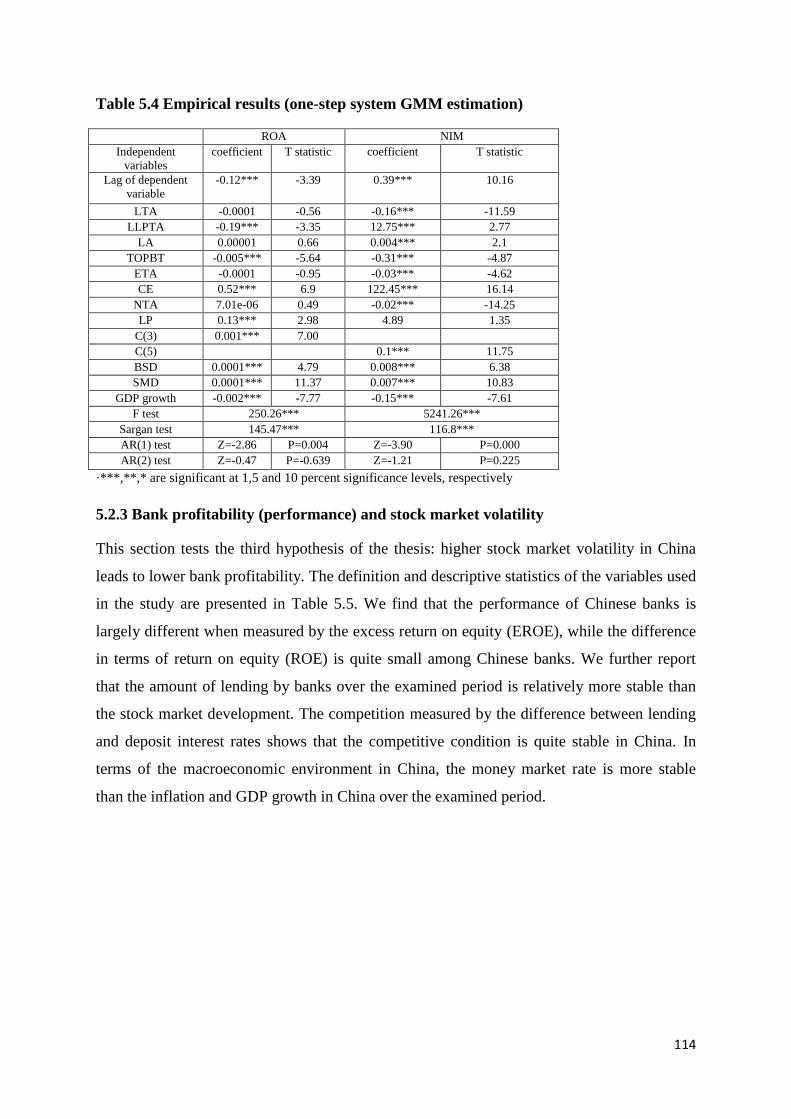
114
Table 5.4 Empirical results (one-step system GMM estimation)
ROA NIM
Independent
variables
coefficient T statistic coefficient T statistic
Lag of dependent
variable
-0.12*** -3.39 0.39*** 10.16
LTA -0.0001 -0.56 -0.16*** -11.59
LLPTA -0.19*** -3.35 12.75*** 2.77
LA 0.00001 0.66 0.004*** 2.1
TOPBT -0.005*** -5.64 -0.31*** -4.87
ETA -0.0001 -0.95 -0.03*** -4.62
CE 0.52*** 6.9 122.45*** 16.14
NTA 7.01e-06 0.49 -0.02*** -14.25
LP 0.13*** 2.98 4.89 1.35
C(3) 0.001*** 7.00
C(5) 0.1*** 11.75
BSD 0.0001*** 4.79 0.008*** 6.38
SMD 0.0001*** 11.37 0.007*** 10.83
GDP growth -0.002*** -7.77 -0.15*** -7.61
F test 250.26*** 5241.26***
Sargan test 145.47*** 116.8***
AR(1) test Z=-2.86 P=0.004 Z=-3.90 P=0.000
AR(2) test Z=-0.47 P=-0.639 Z=-1.21 P=0.225
·***,**,* are significant at 1,5 and 10 percent significance levels, respectively
5.2.3 Bank profitability (performance) and stock market volatility
This section tests the third hypothesis of the thesis: higher stock market volatility in China
leads to lower bank profitability. The definition and descriptive statistics of the variables used
in the study are presented in Table 5.5. We find that the performance of Chinese banks is
largely different when measured by the excess return on equity (EROE), while the difference
in terms of return on equity (ROE) is quite small among Chinese banks. We further report
that the amount of lending by banks over the examined period is relatively more stable than
the stock market development. The competition measured by the difference between lending
and deposit interest rates shows that the competitive condition is quite stable in China. In
terms of the macroeconomic environment in China, the money market rate is more stable
than the inflation and GDP growth in China over the examined period.
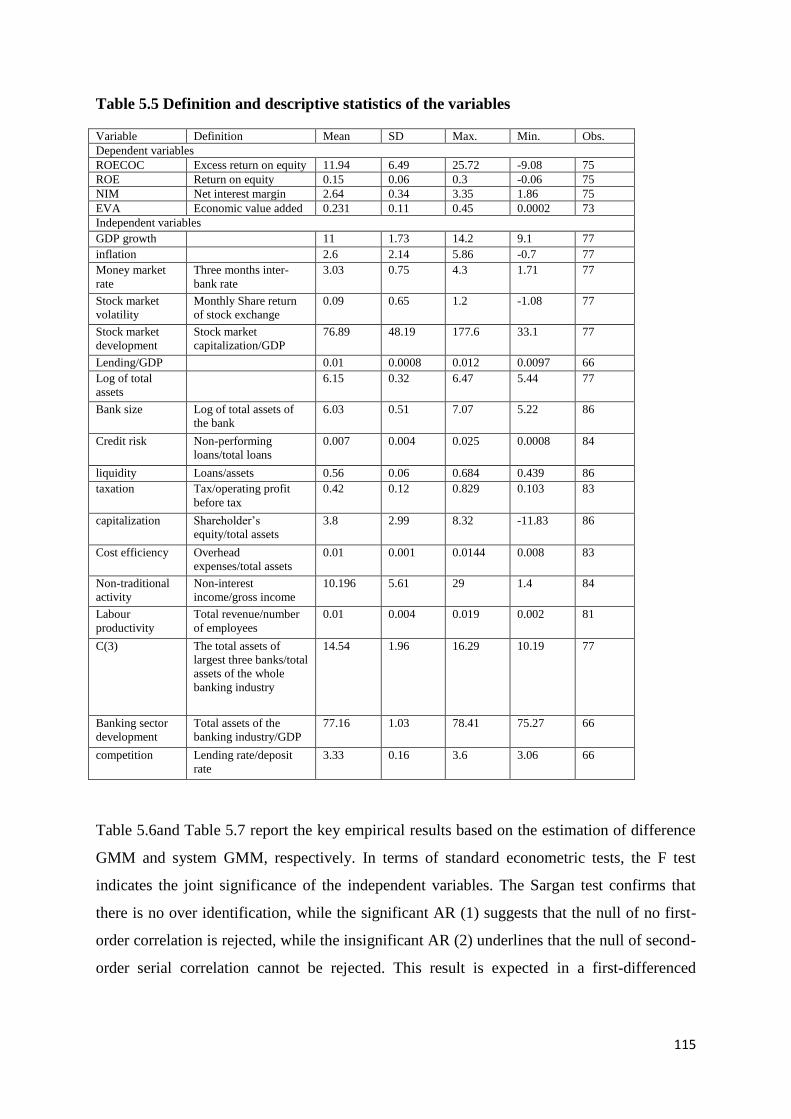
115
Table 5.5 Definition and descriptive statistics of the variables
Variable Definition Mean SD Max. Min. Obs.
Dependent variables
ROECOC Excess return on equity 11.94 6.49 25.72 -9.08 75
ROE Return on equity 0.15 0.06 0.3 -0.06 75
NIM Net interest margin 2.64 0.34 3.35 1.86 75
EVA Economic value added 0.231 0.11 0.45 0.0002 73
Independent variables
GDP growth 11 1.73 14.2 9.1 77
inflation 2.6 2.14 5.86 -0.7 77
Money market
rate
Three months inter-
bank rate
3.03 0.75 4.3 1.71 77
Stock market
volatility
Monthly Share return
of stock exchange
0.09 0.65 1.2 -1.08 77
Stock market
development
Stock market
capitalization/GDP
76.89 48.19 177.6 33.1 77
Lending/GDP 0.01 0.0008 0.012 0.0097 66
Log of total
assets
6.15 0.32 6.47 5.44 77
Bank size Log of total assets of
the bank
6.03 0.51 7.07 5.22 86
Credit risk Non-performing
loans/total loans
0.007 0.004 0.025 0.0008 84
liquidity Loans/assets 0.56 0.06 0.684 0.439 86
taxation Tax/operating profit
before tax
0.42 0.12 0.829 0.103 83
capitalization Shareholder‟s
equity/total assets
3.8 2.99 8.32 -11.83 86
Cost efficiency Overhead
expenses/total assets
0.01 0.001 0.0144 0.008 83
Non-traditional
activity
Non-interest
income/gross income
10.196 5.61 29 1.4 84
Labour
productivity
Total revenue/number
of employees
0.01 0.004 0.019 0.002 81
C(3) The total assets of
largest three banks/total
assets of the whole
banking industry
14.54 1.96 16.29 10.19 77
Banking sector
development
Total assets of the
banking industry/GDP
77.16 1.03 78.41 75.27 66
competition Lending rate/deposit
rate
3.33 0.16 3.6 3.06 66
Table 5.6and Table 5.7 report the key empirical results based on the estimation of difference
GMM and system GMM, respectively. In terms of standard econometric tests, the F test
indicates the joint significance of the independent variables. The Sargan test confirms that
there is no over identification, while the significant AR (1) suggests that the null of no first-
order correlation is rejected, while the insignificant AR (2) underlines that the null of second-
order serial correlation cannot be rejected. This result is expected in a first-differenced
116
equation, the assumption of which is that the original disturbance terms are not serially
correlated.
Table 5.6 shows the results obtained from the difference GMM estimation, which uses the
Return on Equity (ROE) and Excess Return on Equity (EROE) as dependent variables. We
find that higher credit risk is a significant indicator in explaining the poorer bank
performance in China. This is in line with Liu and Wilson (2010) for Japanese banking
industry. The coefficient of taxation has a negative sign which implies that lower taxation
paid by the bank leads to a better bank performancein China. This is in accordance with Vong
and Chan (2009) for the Macau banking sector. Capitalization is found to be positively
related to bank performance, which underlines that poor performance of banks in China is
associated with low capitalization. This is not in line with Hasan and Bashir (2003) for the
Islamic banking industry. Furthermore, using Average Return on Equity as the dependent
variable, Heffernan and Fu (2010) find that the relationship between capitalization and bank
performanceis not significant. There are several reasons for this finding. First, banks with
more capital need to borrow less in order to support a given level of assets, which is very
important in emerging countries where the ability to borrow is more subject to sudden stops.
Second, a well capitalized bank is an important signal of good creditworthiness. Third, capital
can be regarded as a cushion to raise the share of risky assets, such as loans. Banks are able to
make additional loans with a higher beneficial return which leads to better performance. This
result is different from previous findings in terms of the first two researches mainly due to the
different performance indicators used.
Further, we find that there is a negative relationship between bank competition and bank
performance in Chinese banking industry. The Structure-Conduct-Performance (SCP)
hypothesis assumes that, in the highly concentrated market which has lower competition, the
large firms tend to collude with each other to get high profits. Our result is in line with
Athanasoglou et al. (2008) who use ROA to investigate its relationship with competition in
South Eastern Europe banking industry. In the case of the Chinese banking sector, lower
competition to some extent can be reflected by the fact that different ownerships of banks
serve different types of companies, i.e. the state-owned commercial banks mainly provide
services to large enterprises while the joint-stock commercial banks mainly make loans to
medium size enterprises, the city commercial banks orient their services to the local small
enterprises in the city where they were found. This clear classification makes each group of
banks focus on their services to the specific type of companies without any potential
117
competitors; this precedes an improvement in bank profitability for all groups of banks and
the banking industry as a whole. Log of total assets, which can be regarded as the indicator of
banking sector development, is found to be positively and significantly related to bank
performance. In other words, we confirm that the higher level of maturity of the Chinese
banking sector will lead to significant improvement in bank performance in China. This is in
line with Albertazzi and Gambacorta (2009) for main industrialized countries (Austria,
Belgium, France, Germany, Italy, Netherlands, Spain, United Kingdom and United States).
There are several items included in the total assets such as loans, derivatives, other securities,
fixed assets, etc. In the case of the Chinese banking sector, the main business still focuses on
the loan services, even though they may engage in non-traditional activities. The loan
business is supposed to be the dominant force in improving the profitability in the Chinese
banking sector.
Furthermore, lending/GDP is significantly and positively related to bank performance, which
indicates that the increasing loan made by banks each year makes them have better
performance. This result is in line with Albertazzi and Gambacorta (2010) for the main
industrialized countries (Austria, Belgium, France, Germany, Italy, Netherlands, Spain,
United Kingdom and United States). They find that there is a positive relationship between
lending/GDP and Profit before Taxes, Profit after Taxes, Net Interest Margin and Operating
Cost for the banks they examine. Higher volume of loans made by Chinese banking industry
precedes an improvement in bank performance; this result reflects that through several rounds
of banking reforms in China. Hence, Chinese banks have established a good system in risk
checking, monitoring and management. In our study, we find that stock market volatility is
significantly and positively related to bank performancein China. Hence, the more volatile the
stock market is, the better performance the Chinese banks have. Using different performance
measures, Albertazzi and Gambacorta (2010) report similar results. One explanation of this
result is that consumers are more likely to deposit the money into banks than investing to the
stock market which makes banks have better performance. This is due to the fluctuation of
the stock market volatility. Investigating the annual Federal Reserve System‟s report of
conditions for commercial banks, Angbazo (1997) argues that the influence of stock market
volatility on interest rate on loans is more effective than that on deposit which makes banks
perform better in terms of the traditional loan-deposit services. Albertazzi and Gambacorta
(2009) argue that the demand for financial derivatives increases during the period of
uncertainty (high volatility) which leads to better performance in non-traditional businesses
118
provided by Chinese banks. The sign of stock market development is negative and
significant, indicating that there is a negative relationship between stock market development
and bank performance in China. This finding is in contrast to the empirical results reported by
Ben Naceur (2003) for Tunisian banks. However, our finding is in line with Liu and Wilson
(2010) for the Japanese banks. A high market capitalization ratio means economic expansion,
while the easy access for firms to finance through stock markets reduces bank‟s business
opportunities which results in a deterioration of performance.
In terms of the macroeconomic variables, we find that there is a negative relationship
between bank performance and money market rate; however, Albertazzi and Gambacorta
(2009) find that the money market rate is positively related to Provisions and negatively
related to Profit before Taxes. In our case when the money market rate rises, which indicates
that the banks are short of money to make loans, this lends to a deterioration of bank
performance. Furthermore, inflation is found to be significantly and positively related to bank
performance in China, possibly due to the ability of Chinese banks‟ to forecast future
inflation, which in turn implies that interest rate has been appropriately adjusted to achieve
better performance. This may also be viewed as a result of bank customers‟ failure to
anticipate inflation; banks can gain abnormal profit from asymmetric information. This result
is consistent with the findings reported by Pasiouras and Kosmidou (2007) for EU as well as
Sufian (2009a) and Garcia-Herrero et al. (2009) for Chinese banks. Further, The GDP growth
is found to be significantly and negatively related to bank performance in China. This result
is consistent with Liu and Wilson (2010) for the Japanese banking industry. This result
partially supports the view that high economic growth improves business environment and
lowers bank entry barriers. The consequently increased competition dampens bank‟s
performance.
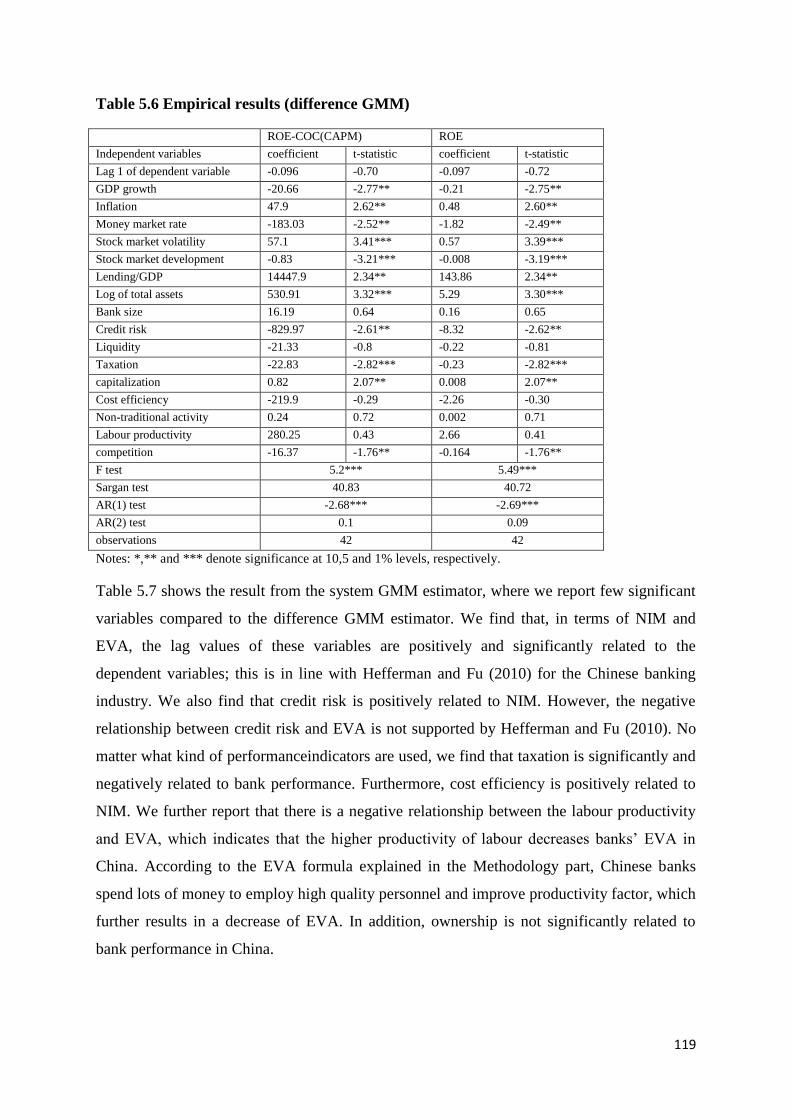
119
Table 5.6 Empirical results (difference GMM)
ROE-COC(CAPM) ROE
Independent variables coefficient t-statistic coefficient t-statistic
Lag 1 of dependent variable -0.096 -0.70 -0.097 -0.72
GDP growth -20.66 -2.77** -0.21 -2.75**
Inflation 47.9 2.62** 0.48 2.60**
Money market rate -183.03 -2.52** -1.82 -2.49**
Stock market volatility 57.1 3.41*** 0.57 3.39***
Stock market development -0.83 -3.21*** -0.008 -3.19***
Lending/GDP 14447.9 2.34** 143.86 2.34**
Log of total assets 530.91 3.32*** 5.29 3.30***
Bank size 16.19 0.64 0.16 0.65
Credit risk -829.97 -2.61** -8.32 -2.62**
Liquidity -21.33 -0.8 -0.22 -0.81
Taxation -22.83 -2.82*** -0.23 -2.82***
capitalization 0.82 2.07** 0.008 2.07**
Cost efficiency -219.9 -0.29 -2.26 -0.30
Non-traditional activity 0.24 0.72 0.002 0.71
Labour productivity 280.25 0.43 2.66 0.41
competition -16.37 -1.76** -0.164 -1.76**
F test 5.2*** 5.49***
Sargan test 40.83 40.72
AR(1) test -2.68*** -2.69***
AR(2) test 0.1 0.09
observations 42 42
Notes: *,** and *** denote significance at 10,5 and 1% levels, respectively.
Table 5.7 shows the result from the system GMM estimator, where we report few significant
variables compared to the difference GMM estimator. We find that, in terms of NIM and
EVA, the lag values of these variables are positively and significantly related to the
dependent variables; this is in line with Hefferman and Fu (2010) for the Chinese banking
industry. We also find that credit risk is positively related to NIM. However, the negative
relationship between credit risk and EVA is not supported by Hefferman and Fu (2010). No
matter what kind of performanceindicators are used, we find that taxation is significantly and
negatively related to bank performance. Furthermore, cost efficiency is positively related to
NIM. We further report that there is a negative relationship between the labour productivity
and EVA, which indicates that the higher productivity of labour decreases banks‟ EVA in
China. According to the EVA formula explained in the Methodology part, Chinese banks
spend lots of money to employ high quality personnel and improve productivity factor, which
further results in a decrease of EVA. In addition, ownership is not significantly related to
bank performance in China.
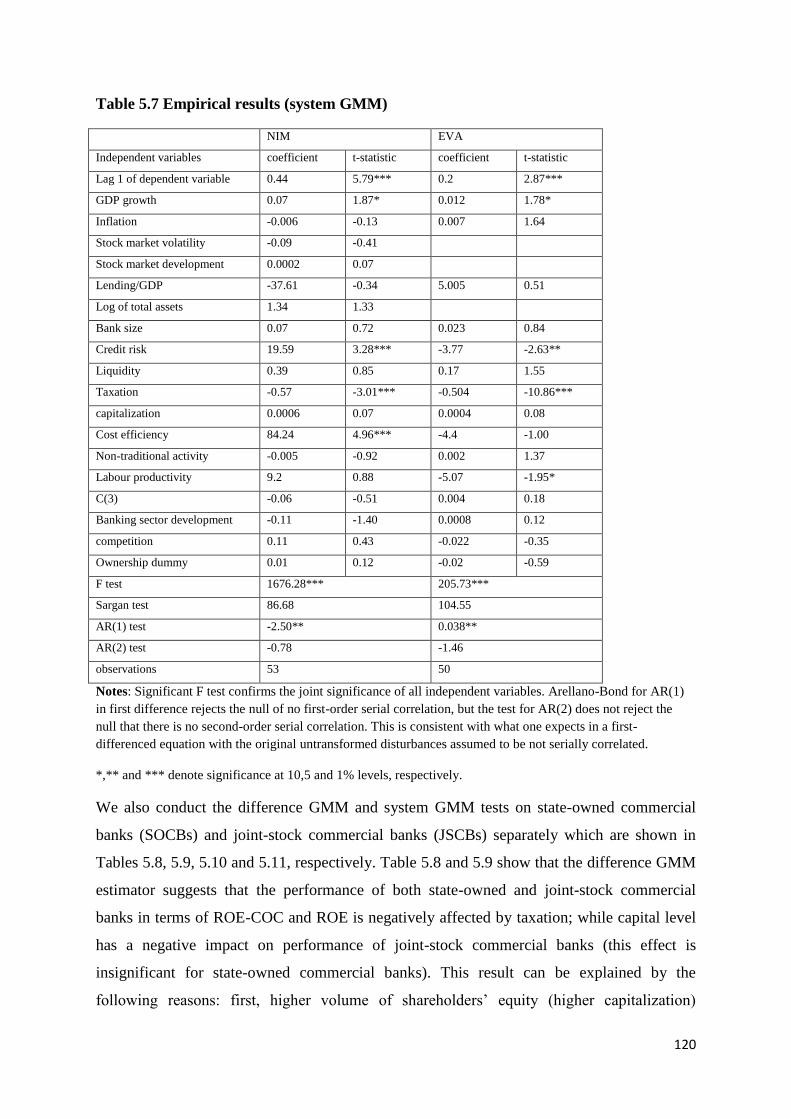
120
Table 5.7 Empirical results (system GMM)
NIM EVA
Independent variables coefficient t-statistic coefficient t-statistic
Lag 1 of dependent variable 0.44 5.79*** 0.2 2.87***
GDP growth 0.07 1.87* 0.012 1.78*
Inflation -0.006 -0.13 0.007 1.64
Stock market volatility -0.09 -0.41
Stock market development 0.0002 0.07
Lending/GDP -37.61 -0.34 5.005 0.51
Log of total assets 1.34 1.33
Bank size 0.07 0.72 0.023 0.84
Credit risk 19.59 3.28*** -3.77 -2.63**
Liquidity 0.39 0.85 0.17 1.55
Taxation -0.57 -3.01*** -0.504 -10.86***
capitalization 0.0006 0.07 0.0004 0.08
Cost efficiency 84.24 4.96*** -4.4 -1.00
Non-traditional activity -0.005 -0.92 0.002 1.37
Labour productivity 9.2 0.88 -5.07 -1.95*
C(3) -0.06 -0.51 0.004 0.18
Banking sector development -0.11 -1.40 0.0008 0.12
competition 0.11 0.43 -0.022 -0.35
Ownership dummy 0.01 0.12 -0.02 -0.59
F test 1676.28*** 205.73***
Sargan test 86.68 104.55
AR(1) test -2.50** 0.038**
AR(2) test -0.78 -1.46
observations 53 50
Notes: Significant F test confirms the joint significance of all independent variables. Arellano-Bond for AR(1)
in first difference rejects the null of no first-order serial correlation, but the test for AR(2) does not reject the
null that there is no second-order serial correlation. This is consistent with what one expects in a first-
differenced equation with the original untransformed disturbances assumed to be not serially correlated.
*,** and *** denote significance at 10,5 and 1% levels, respectively.
We also conduct the difference GMM and system GMM tests on state-owned commercial
banks (SOCBs) and joint-stock commercial banks (JSCBs) separately which are shown in
Tables 5.8, 5.9, 5.10 and 5.11, respectively. Table 5.8 and 5.9 show that the difference GMM
estimator suggests that the performance of both state-owned and joint-stock commercial
banks in terms of ROE-COC and ROE is negatively affected by taxation; while capital level
has a negative impact on performance of joint-stock commercial banks (this effect is
insignificant for state-owned commercial banks). This result can be explained by the
following reasons: first, higher volume of shareholders‟ equity (higher capitalization)
121
indicates that the bank is in a safer position which reduces the degree of incentives for the
bank managers to boost the profit. Second, if the shareholders‟ equity accounts for a larger
proportion of total assets of the bank, the liabilities will be relatively smaller. As one
important component of liabilities, the deposits provide the sources of loans made by banks;
the reduction in the volume of loans because of the smaller amount of deposits precedes a
decline in bank performance. Table 5.8 also indicates that there is a positive effect of
inflation on performance of state-owned commercial banks (SOCBs) in terms of ROE-COC
and ROE, whereas it suggests that money market rate exerts a negative influence on
performance of state-owned commercial banks (SOCBs) over the examined period. The
money market rate is proxied by the three month inter-bank lending rate; the higher lending
rate indicates that the demand for funds increases, due to the fact that state-owned
commercial banks mainly deal with the larger enterprises nationwide. The volume of funds
demanded by state-owned commercial banks will be large, the higher lending rate
substantially increases the cost incurred by the banks which further leads to a decline in bank
performance.
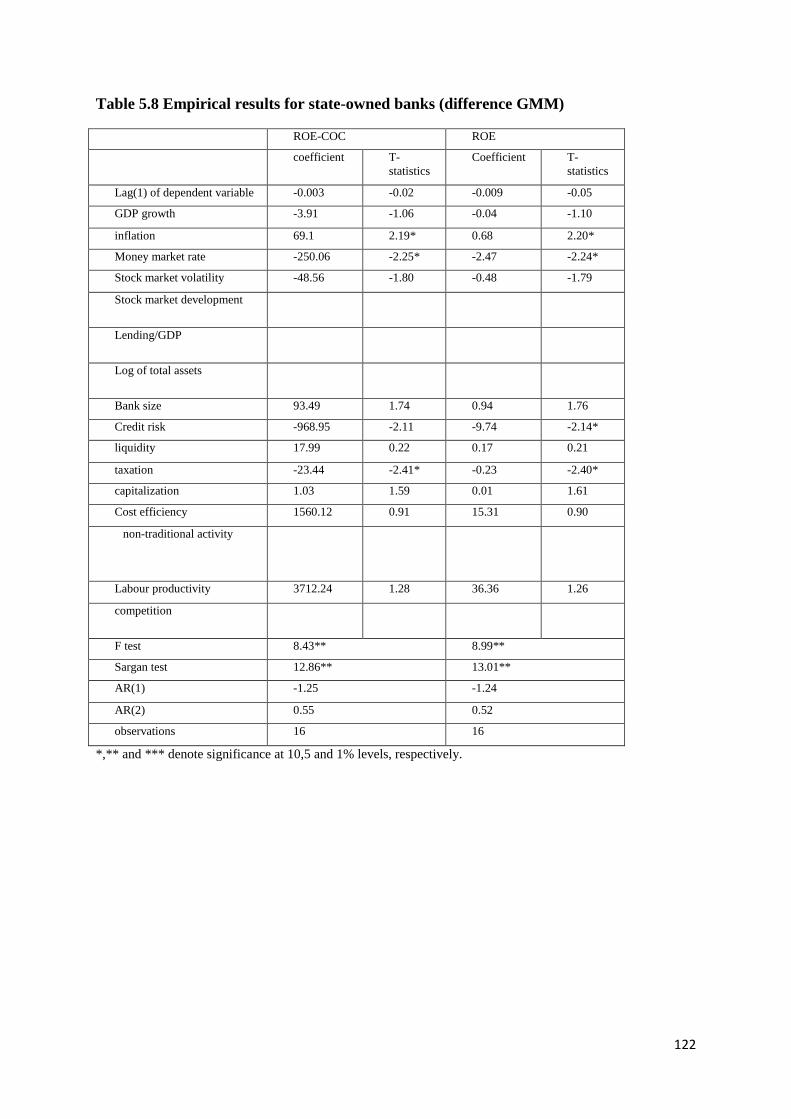
122
Table 5.8 Empirical results for state-owned banks (difference GMM)
ROE-COC ROE
coefficient T-
statistics
Coefficient T-
statistics
Lag(1) of dependent variable -0.003 -0.02 -0.009 -0.05
GDP growth -3.91 -1.06 -0.04 -1.10
inflation 69.1 2.19* 0.68 2.20*
Money market rate -250.06 -2.25* -2.47 -2.24*
Stock market volatility -48.56 -1.80 -0.48 -1.79
Stock market development
Lending/GDP
Log of total assets
Bank size 93.49 1.74 0.94 1.76
Credit risk -968.95 -2.11 -9.74 -2.14*
liquidity 17.99 0.22 0.17 0.21
taxation -23.44 -2.41* -0.23 -2.40*
capitalization 1.03 1.59 0.01 1.61
Cost efficiency 1560.12 0.91 15.31 0.90
non-traditional activity
Labour productivity 3712.24 1.28 36.36 1.26
competition
F test 8.43** 8.99**
Sargan test 12.86** 13.01**
AR(1) -1.25 -1.24
AR(2) 0.55 0.52
observations 16 16
*,** and *** denote significance at 10,5 and 1% levels, respectively.
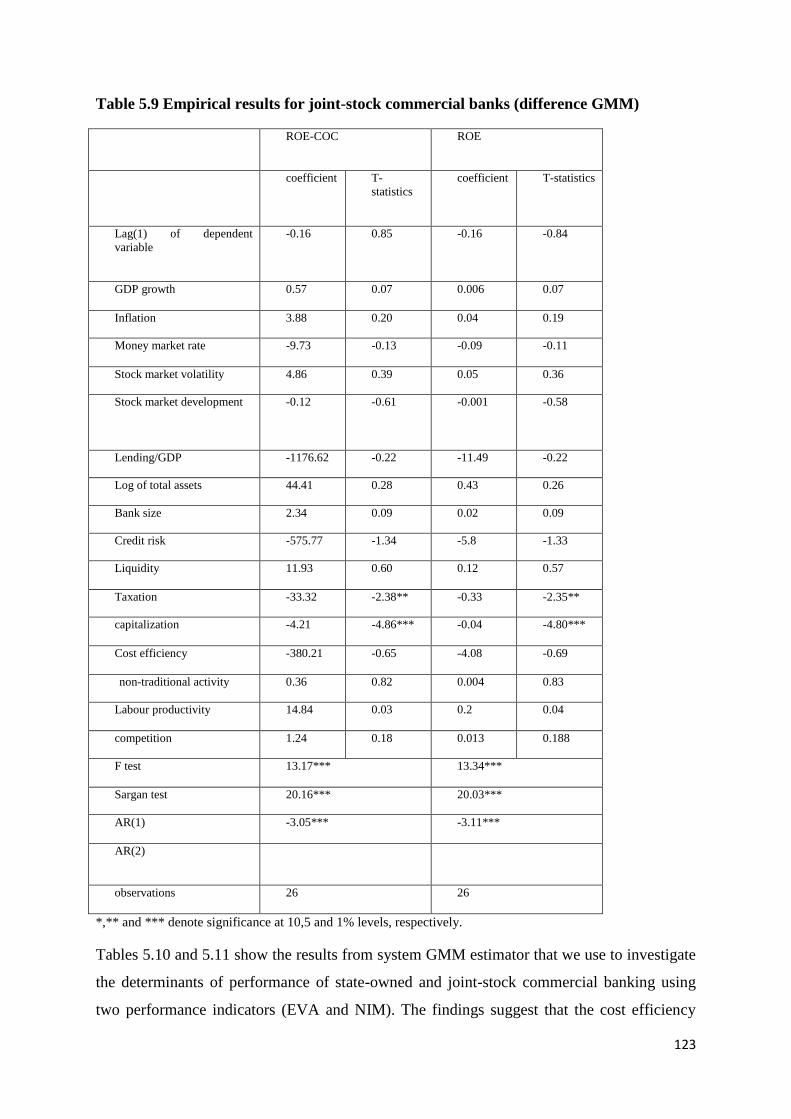
123
Table 5.9 Empirical results for joint-stock commercial banks (difference GMM)
ROE-COC ROE
coefficient T-
statistics
coefficient T-statistics
Lag(1) of dependent
variable
-0.16 0.85 -0.16 -0.84
GDP growth 0.57 0.07 0.006 0.07
Inflation 3.88 0.20 0.04 0.19
Money market rate -9.73 -0.13 -0.09 -0.11
Stock market volatility 4.86 0.39 0.05 0.36
Stock market development -0.12 -0.61 -0.001 -0.58
Lending/GDP -1176.62 -0.22 -11.49 -0.22
Log of total assets 44.41 0.28 0.43 0.26
Bank size 2.34 0.09 0.02 0.09
Credit risk -575.77 -1.34 -5.8 -1.33
Liquidity 11.93 0.60 0.12 0.57
Taxation -33.32 -2.38** -0.33 -2.35**
capitalization -4.21 -4.86*** -0.04 -4.80***
Cost efficiency -380.21 -0.65 -4.08 -0.69
non-traditional activity 0.36 0.82 0.004 0.83
Labour productivity 14.84 0.03 0.2 0.04
competition 1.24 0.18 0.013 0.188
F test 13.17*** 13.34***
Sargan test 20.16*** 20.03***
AR(1) -3.05*** -3.11***
AR(2)
observations 26 26
*,** and *** denote significance at 10,5 and 1% levels, respectively.
Tables 5.10 and 5.11 show the results from system GMM estimator that we use to investigate
the determinants of performance of state-owned and joint-stock commercial banking using
two performance indicators (EVA and NIM). The findings suggest that the cost efficiency
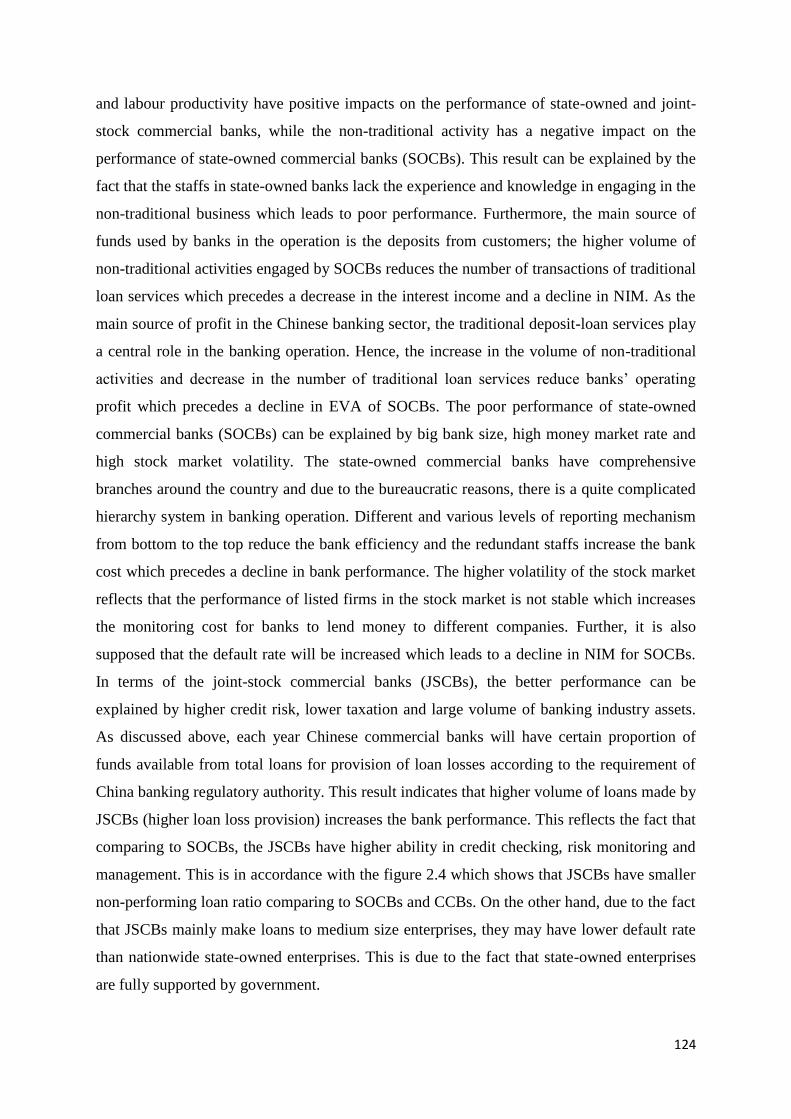
124
and labour productivity have positive impacts on the performance of state-owned and joint-
stock commercial banks, while the non-traditional activity has a negative impact on the
performance of state-owned commercial banks (SOCBs). This result can be explained by the
fact that the staffs in state-owned banks lack the experience and knowledge in engaging in the
non-traditional business which leads to poor performance. Furthermore, the main source of
funds used by banks in the operation is the deposits from customers; the higher volume of
non-traditional activities engaged by SOCBs reduces the number of transactions of traditional
loan services which precedes a decrease in the interest income and a decline in NIM. As the
main source of profit in the Chinese banking sector, the traditional deposit-loan services play
a central role in the banking operation. Hence, the increase in the volume of non-traditional
activities and decrease in the number of traditional loan services reduce banks‟ operating
profit which precedes a decline in EVA of SOCBs. The poor performance of state-owned
commercial banks (SOCBs) can be explained by big bank size, high money market rate and
high stock market volatility. The state-owned commercial banks have comprehensive
branches around the country and due to the bureaucratic reasons, there is a quite complicated
hierarchy system in banking operation. Different and various levels of reporting mechanism
from bottom to the top reduce the bank efficiency and the redundant staffs increase the bank
cost which precedes a decline in bank performance. The higher volatility of the stock market
reflects that the performance of listed firms in the stock market is not stable which increases
the monitoring cost for banks to lend money to different companies. Further, it is also
supposed that the default rate will be increased which leads to a decline in NIM for SOCBs.
In terms of the joint-stock commercial banks (JSCBs), the better performance can be
explained by higher credit risk, lower taxation and large volume of banking industry assets.
As discussed above, each year Chinese commercial banks will have certain proportion of
funds available from total loans for provision of loan losses according to the requirement of
China banking regulatory authority. This result indicates that higher volume of loans made by
JSCBs (higher loan loss provision) increases the bank performance. This reflects the fact that
comparing to SOCBs, the JSCBs have higher ability in credit checking, risk monitoring and
management. This is in accordance with the figure 2.4 which shows that JSCBs have smaller
non-performing loan ratio comparing to SOCBs and CCBs. On the other hand, due to the fact
that JSCBs mainly make loans to medium size enterprises, they may have lower default rate
than nationwide state-owned enterprises. This is due to the fact that state-owned enterprises
are fully supported by government.
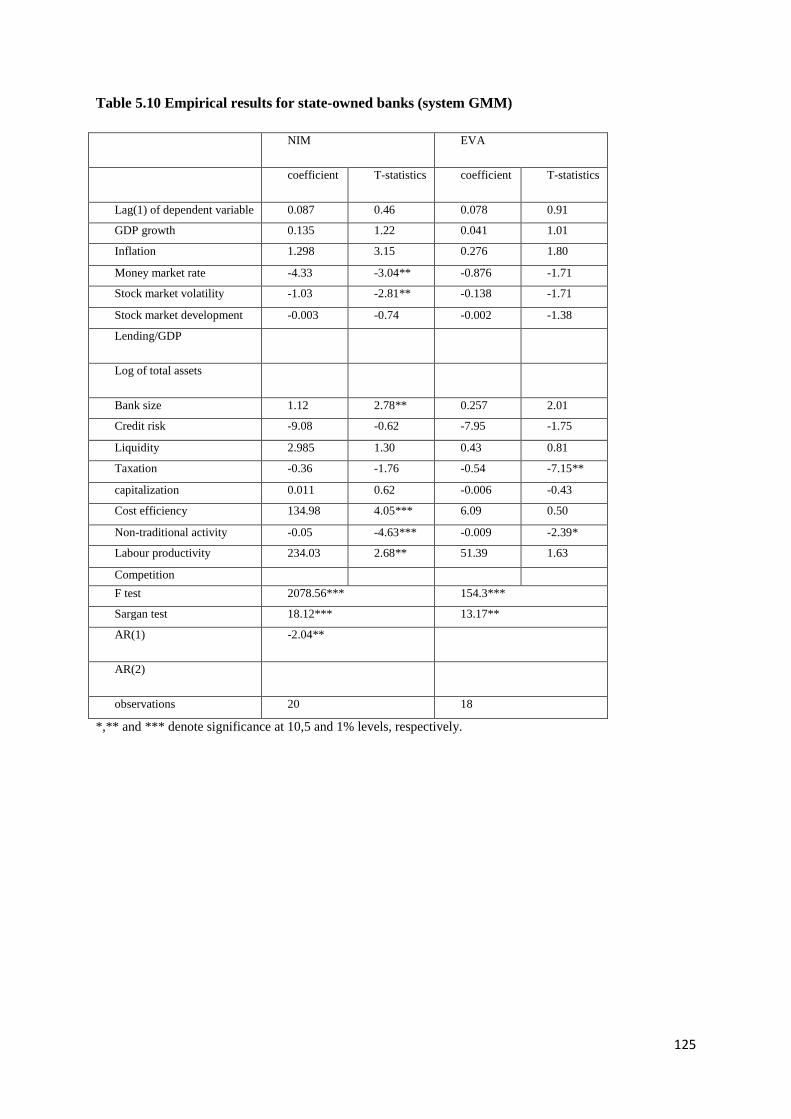
125
Table 5.10 Empirical results for state-owned banks (system GMM)
NIM EVA
coefficient T-statistics coefficient T-statistics
Lag(1) of dependent variable 0.087 0.46 0.078 0.91
GDP growth 0.135 1.22 0.041 1.01
Inflation 1.298 3.15 0.276 1.80
Money market rate -4.33 -3.04** -0.876 -1.71
Stock market volatility -1.03 -2.81** -0.138 -1.71
Stock market development -0.003 -0.74 -0.002 -1.38
Lending/GDP
Log of total assets
Bank size 1.12 2.78** 0.257 2.01
Credit risk -9.08 -0.62 -7.95 -1.75
Liquidity 2.985 1.30 0.43 0.81
Taxation -0.36 -1.76 -0.54 -7.15**
capitalization 0.011 0.62 -0.006 -0.43
Cost efficiency 134.98 4.05*** 6.09 0.50
Non-traditional activity -0.05 -4.63*** -0.009 -2.39*
Labour productivity 234.03 2.68** 51.39 1.63
Competition
F test 2078.56*** 154.3***
Sargan test 18.12*** 13.17**
AR(1) -2.04**
AR(2)
observations 20 18
*,** and *** denote significance at 10,5 and 1% levels, respectively.
126
Table 5.11 Empirical results for joint-stock commercial banks (system GMM)
NIM EVA
coefficient T-statistics coefficient T-statistics
Lag(1) of dependent variable 0.48 3.67*** 0.35 2.07*
GDP growth 0.22 0.02 -0.04 -0.22
inflation -0.36 -0.02 0.18 0.47
Money market rate 0.89 0.01 -0.68 -0.47
Stock market volatility -0.11 -0.40 -0.06 -1.01
Stock market development -0.001 -0.17 -0.00002 -0.02
Lending/GDP -8.51 -0.07 3.05 0.10
Log of total assets 3.39 2.18** 0.4 1.17
Bank size 0.103 0.42 -0.02 -0.21
Credit risk 34.31 2.47** -9.68 -2.11*
liquidity -0.6 -0.84 -0.39 -2.15**
Taxation -1.18 -2.68** -0.2 -1.24
capitalization -0.05 -1.75 -0.02 -2.40**
Cost efficiency 125.56 4.46*** 2.18 0.31
Non-traditional activity 0.02 1.41 0.014 4.67***
Labour productivity 38.62 2.86** 3.67 0.88
Competition 0.28 1.01 0.005 0.951
Banking sector development -0.26 -0.15
Concentration -0.41 -0.04 0.004 0.02
F test 1341.84*** 77.89***
Sargan test 35.28*** 36.52***
AR(1)
AR(2) -0.50
observations 33 32
*,** and *** denote significance at 10,5 and 1% levels, respectively.
5.3 Summary and conclusion
In this Chapter, two important issues are examined in terms of bank profitability in China
which are: 1) the impact of macroeconomic environment (GDP growth/ inflation) on Chinese
bank profitability; 2) the effect of stock market volatility on bank profitability (performance)
in China. The former is divided into two pieces of researches; one focuses on the effect of
inflation, while the other one mainly concerns the impact of GDP growth rate. Furthermore,
these two pieces of researches applied one-step and two-step GMM system estimators to
check the robustness of our results. In terms of the data of the first issue, we use 101 Chinese
commercial banks over the period of 2003-2009.
127
The empirical findings suggest that higher cost efficiency, lower volume of non-traditional
activity, higher banking sector and stock market development tend to increase profitability of
Chinese banks. There are mixed findings about the effect of risk on Chinese banking
profitability in terms of ROA and NIM; in particular, small bank size seems to have higher
NIM , while higher NIM can also be explained by the higher liquidity of Chinese banks.
Higher labour productivity leads to higher ROA of Chinese banks. The positive relationship
found between inflation and profitability in the Chinese banking sector reflects the fact that
the inflation in China can be fully anticipated and the interest rates are adjusted accordingly.
This further implies that revenues increased faster than costs. This result is in line with
Pasiouras and Kosmidou (2007) for the European banks, Sufian (2009a) and Garcia-Herrero
et al. (2009) for Chinese banks.
The third piece of the research focuses on the investigation on the impact of stock market
volatility on bank performance. To be more specific, we use four performance indicators
which are Excess Return on Equity, Return on Equity, Economic Value Added and the Net
Interest Margin. We apply both the GMM difference and system estimators on 11
commercial banks in China (4 state-owned and 7 joint-stock) and we also controls for
comprehensive bank-specific, industry-specific and macroeconomic determinants of bank
profitability. Our results suggest that stock market volatility has a positive impact on bank
performance in China.
128
Chapter 6
Empirical results on bank competition
6.1 Introduction
This chapter provides the empirical results on the estimation of bank competition in China.
Firstly, we report the results on the competitive conditions of the Chinese banking sector
derived from the Panzar-Rosse H statistic, and then we discuss the risk conditions of Chinese
banks measured by the ratio of loan loss provision over total loans and z-score. Furthermore,
we present and discuss the empirical results regarding the impact of competition on the risk-
taking behaviour of Chinese banks. Finally, we present and explain the findings regarding the
inter-relationships between risk, profitability and competition in Chinese banking system.
This chapter is structured as follows: Section 6.2.1 presents the results of Panzar-Rosse H
statistic which is followed by section 6.2.2 discusses the impact of competition on risk of
Chinese banks, while section 6.2.3 explains the inter-relationships between risk, profitability
and competition in the Chinese banking sector. Finally section 6.23 provides the summary
and conclusion for this chapter.
6.2 Empirical results on bank competition
6.2.1 The estimation of Panzar-Rosse H statistic
The descriptive statistics of the variables used in this study are presented in Table 6.1. It
shows that the cost of funds, cost of labour and cost of capital of the Chinese banking sector
are highest in 2008 with figures of 1.36, 1.71 and 1.36, respectively, the highest cost of funds
can be explained by the fact that the successful holding of 2008 Olympic Games in Beijing
attracts more foreign financial institutions to establish offices in China, in order to compete
with the foreign counterparts. The Chinese banking sector increases the deposit interest rate
which leads to higher interest expenses and higher cost of funds, while the establishment of
foreign institutions attracts more experienced staffs due to the fact that they provide more
training opportunities and salaries are much higher than domestic banks. In order to retain the
experienced staffs and recruit more high quality staffs, Chinese banks increase staffs‟ salaries
to compete with the foreign counterparts which precedes an increase in the cost of labour.
Lastly, as one of the main strategies to attract more customers, Chinese banks spend more
money on advertisement campaign which results in a substantial increase in the operating
129
expenses, Thus, it leads to an increase in the cost of capital, while the ability to earn revenue
per assets is highest in 2008 which is 0.033, the successful holding of 2008 Olympic Games
in China not only attracts international financial institutions to launch their offices in China,
more importantly, there is a substantial growing in the number of foreign companies to open
their business in China. This gives more opportunities to Chinese banks to provide loan
business to these companies which precedes an increase in revenue. The Chinese banking
sector has highest level of capitalization, liquidity and off-balance sheet activity in 2009,
2004 and 2003 with figures of 6.55, 56.05, and 20.34 respectively.
The reduced-form revenue equation is estimated using a panel data framework. The
regression model is estimated using the random effects estimator. Our choice of the fixed
effects versus random effects is also confirmed by the implementation of the Hausman test.
Table 6.2 shows the Panzar-Rosse H statistic of the Chinese banking sector over the period
2003-2009. The findings suggest that over the whole period, the H statistic of Chinese banks
is 0.75 which indicates that the Chinese banking sector is in a state of monopolistic
competition which is near to perfect competition. Furthermore, the competitive condition of
Chinese banks for every year over the examined period is also evaluated. The results suggest
that the competition in the Chinese banking sector is weakest in 2003 with a Panzar-Rosse H
statistic of -2.06, this result is partly attributed to the fact that in 2003 Chinese government
injects capital to two state-owned commercial banks (BOC and CCB).The protection of
government to these banks hinders the competition improvement in the Chinese banking
sector. While the Panzar-Rosse H statistic of 0.95 indicates that the Chinese banking sector in
2005 is under the strongest competition which is followed by the year 2009. The strongest
competition in the Chinese banking sector in 2005 can be explained by the following reasons:
first, three large scale commercial banks listed on Hong Kong stock exchange which are
Bank of Communication, China Construction Bank and Bank of China. The listings of these
banks encourage the managers to boost the performance in order to attract more potential
shareholders which lead to an increase in competition. Furthermore, there is a growing
number of foreign investors investing their funds in Chinese banks. These investments are not
only helpful for Chinese banks in terms of obtaining higher technology, improving the
corporate government, enhancing the risk management, but creating a more competitive
environment in banking operation. For instance, China Construction Bank introduces foreign
investment from Bank of America and Asia Financial Holdings. Ltd; China Merchant bank
introduces investment from Asia Financial Holdings, Ltd; Shenzhen development bank
130
introduces investment from Newbridge Asia AIV III L.P; Jinan city commercial bank
introduces foreign investment from commonwealth bank. The relative stronger competition
in 2009 than other years is supposed to be attributed to the aftermath of 2008 Olympic
Games.
Our results also report that capitalization is significantly and positively related to the revenue
of Chinese banks. In other words, Chinese banks with higher level of capitalization normally
have higher ability to generate revenue from assets. This can be explained by the fact that
with the support by the higher level of capitalization, Chinese banks are able to engage in
higher risk projects which leads to higher revenue. The liquidity which is measured by the
ratio between total loans and total assets are significantly and positively related to bank
revenue in most of the cases which is in line with our expectation. This result reflects the fact
that in general, the Chinese banking sector has improved the capability of credit checking,
risk monitoring and management; higher volume of loans made by Chinese banks under
proper risk management will increase the bank revenue.
Finally, to assess the long-run equilibrium, the natural logarithm of 1+ROA is used as the
dependent variable in the reduce-form function rather than the ratio between total revenue
and total assets. The results show that the H statistic value is significantly equal to zero
during the period of 2003-2009, which means that the banking system is in a long-run
equilibrium.
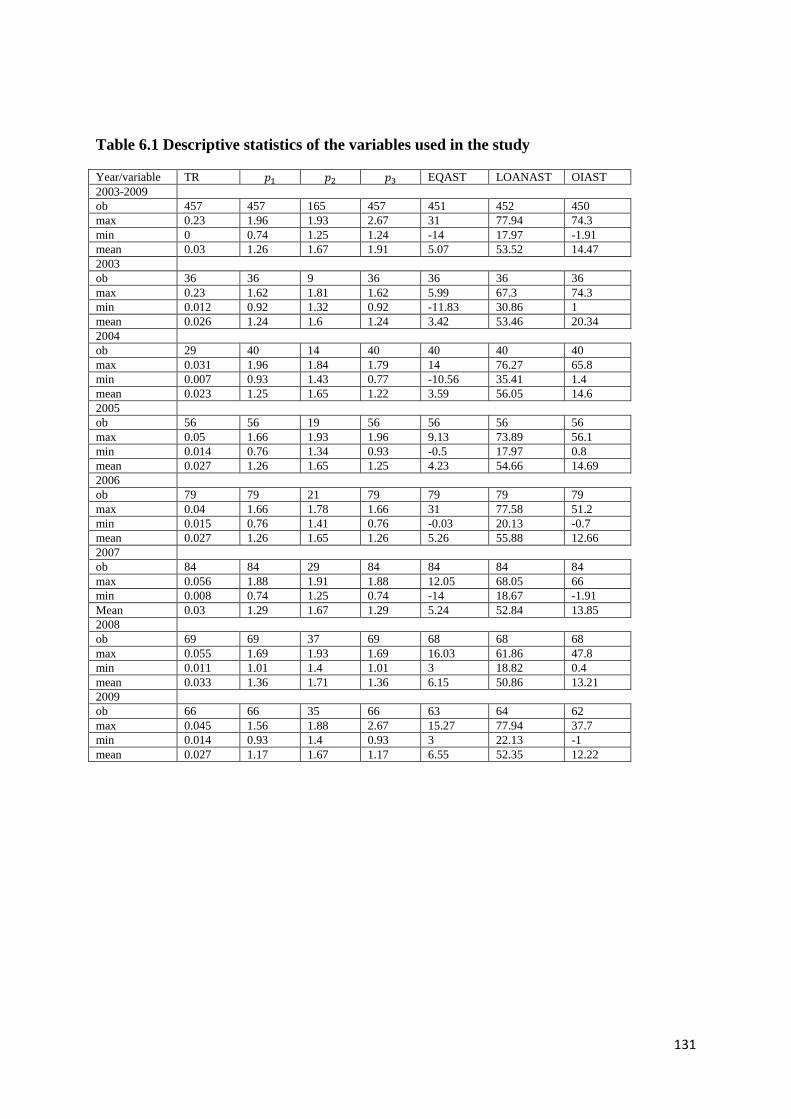
131
Table 6.1 Descriptive statistics of the variables used in the study
Year/variable TR EQAST LOANAST OIAST
2003-2009
ob 457 457 165 457 451 452 450
max 0.23 1.96 1.93 2.67 31 77.94 74.3
min 0 0.74 1.25 1.24 -14 17.97 -1.91
mean 0.03 1.26 1.67 1.91 5.07 53.52 14.47
2003
ob 36 36 9 36 36 36 36
max 0.23 1.62 1.81 1.62 5.99 67.3 74.3
min 0.012 0.92 1.32 0.92 -11.83 30.86 1
mean 0.026 1.24 1.6 1.24 3.42 53.46 20.34
2004
ob 29 40 14 40 40 40 40
max 0.031 1.96 1.84 1.79 14 76.27 65.8
min 0.007 0.93 1.43 0.77 -10.56 35.41 1.4
mean 0.023 1.25 1.65 1.22 3.59 56.05 14.6
2005
ob 56 56 19 56 56 56 56
max 0.05 1.66 1.93 1.96 9.13 73.89 56.1
min 0.014 0.76 1.34 0.93 -0.5 17.97 0.8
mean 0.027 1.26 1.65 1.25 4.23 54.66 14.69
2006
ob 79 79 21 79 79 79 79
max 0.04 1.66 1.78 1.66 31 77.58 51.2
min 0.015 0.76 1.41 0.76 -0.03 20.13 -0.7
mean 0.027 1.26 1.65 1.26 5.26 55.88 12.66
2007
ob 84 84 29 84 84 84 84
max 0.056 1.88 1.91 1.88 12.05 68.05 66
min 0.008 0.74 1.25 0.74 -14 18.67 -1.91
Mean 0.03 1.29 1.67 1.29 5.24 52.84 13.85
2008
ob 69 69 37 69 68 68 68
max 0.055 1.69 1.93 1.69 16.03 61.86 47.8
min 0.011 1.01 1.4 1.01 3 18.82 0.4
mean 0.033 1.36 1.71 1.36 6.15 50.86 13.21
2009
ob 66 66 35 66 63 64 62
max 0.045 1.56 1.88 2.67 15.27 77.94 37.7
min 0.014 0.93 1.4 0.93 3 22.13 -1
mean 0.027 1.17 1.67 1.17 6.55 52.35 12.22
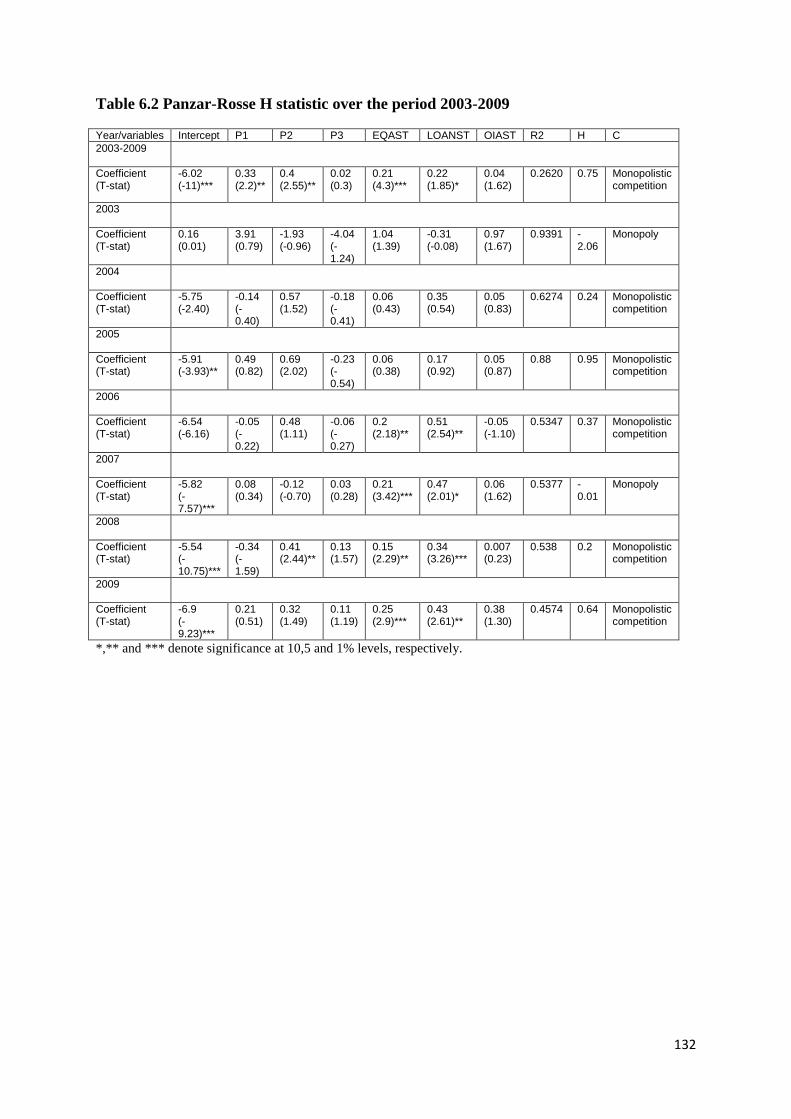
132
Table 6.2 Panzar-Rosse H statistic over the period 2003-2009
Year/variables Intercept P1 P2 P3 EQAST LOANST OIAST R2 H C
2003-2009
Coefficient (T-stat)
-6.02 (-11)***
0.33 (2.2)**
0.4 (2.55)**
0.02 (0.3)
0.21 (4.3)***
0.22 (1.85)*
0.04 (1.62)
0.2620 0.75 Monopolistic competition
2003
Coefficient (T-stat)
0.16 (0.01)
3.91 (0.79)
-1.93 (-0.96)
-4.04 (-1.24)
1.04 (1.39)
-0.31 (-0.08)
0.97 (1.67)
0.9391 -2.06
Monopoly
2004
Coefficient (T-stat)
-5.75 (-2.40)
-0.14 (-0.40)
0.57 (1.52)
-0.18 (-0.41)
0.06 (0.43)
0.35 (0.54)
0.05 (0.83)
0.6274 0.24 Monopolistic competition
2005
Coefficient (T-stat)
-5.91 (-3.93)**
0.49 (0.82)
0.69 (2.02)
-0.23 (-0.54)
0.06 (0.38)
0.17 (0.92)
0.05 (0.87)
0.88 0.95 Monopolistic competition
2006
Coefficient (T-stat)
-6.54 (-6.16)
-0.05 (-0.22)
0.48 (1.11)
-0.06 (-0.27)
0.2 (2.18)**
0.51 (2.54)**
-0.05 (-1.10)
0.5347 0.37 Monopolistic competition
2007
Coefficient (T-stat)
-5.82 (-7.57)***
0.08 (0.34)
-0.12 (-0.70)
0.03 (0.28)
0.21 (3.42)***
0.47 (2.01)*
0.06 (1.62)
0.5377 -0.01
Monopoly
2008
Coefficient (T-stat)
-5.54 (-10.75)***
-0.34 (-1.59)
0.41 (2.44)**
0.13 (1.57)
0.15 (2.29)**
0.34 (3.26)***
0.007 (0.23)
0.538 0.2 Monopolistic competition
2009
Coefficient (T-stat)
-6.9 (-9.23)***
0.21 (0.51)
0.32 (1.49)
0.11 (1.19)
0.25 (2.9)***
0.43 (2.61)**
0.38 (1.30)
0.4574 0.64 Monopolistic competition
*,** and *** denote significance at 10,5 and 1% levels, respectively.
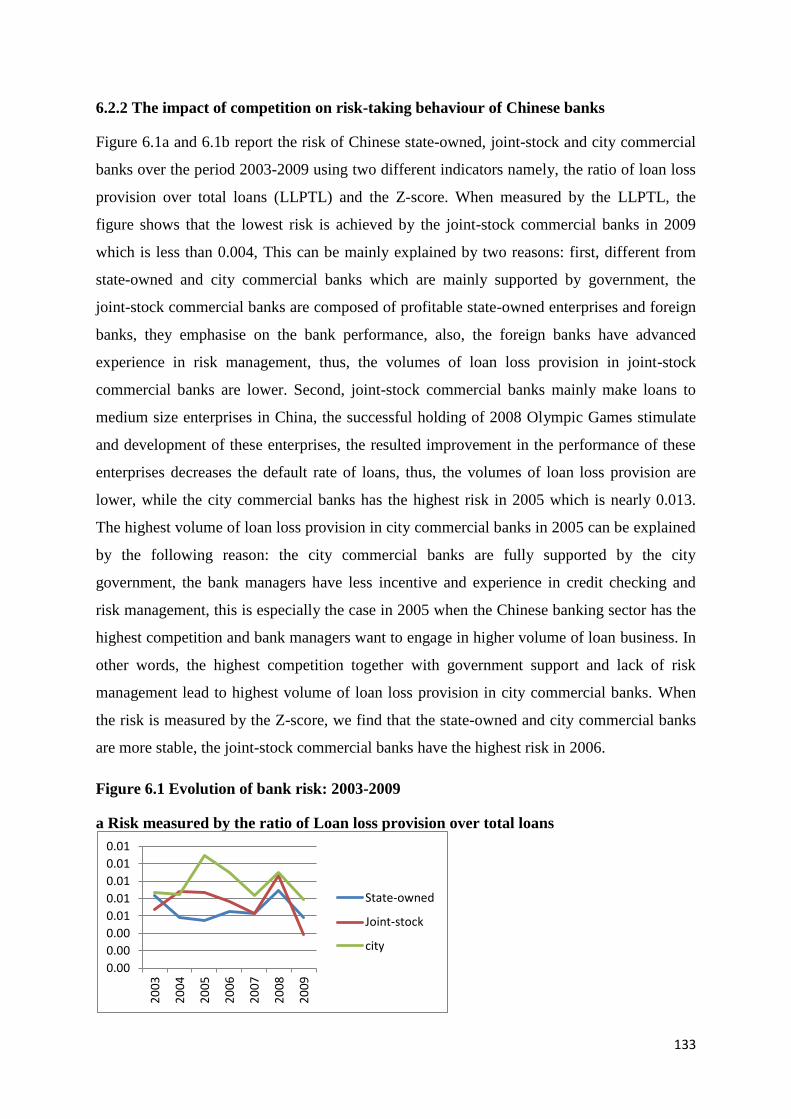
133
6.2.2 The impact of competition on risk-taking behaviour of Chinese banks
Figure 6.1a and 6.1b report the risk of Chinese state-owned, joint-stock and city commercial
banks over the period 2003-2009 using two different indicators namely, the ratio of loan loss
provision over total loans (LLPTL) and the Z-score. When measured by the LLPTL, the
figure shows that the lowest risk is achieved by the joint-stock commercial banks in 2009
which is less than 0.004, This can be mainly explained by two reasons: first, different from
state-owned and city commercial banks which are mainly supported by government, the
joint-stock commercial banks are composed of profitable state-owned enterprises and foreign
banks, they emphasise on the bank performance, also, the foreign banks have advanced
experience in risk management, thus, the volumes of loan loss provision in joint-stock
commercial banks are lower. Second, joint-stock commercial banks mainly make loans to
medium size enterprises in China, the successful holding of 2008 Olympic Games stimulate
and development of these enterprises, the resulted improvement in the performance of these
enterprises decreases the default rate of loans, thus, the volumes of loan loss provision are
lower, while the city commercial banks has the highest risk in 2005 which is nearly 0.013.
The highest volume of loan loss provision in city commercial banks in 2005 can be explained
by the following reason: the city commercial banks are fully supported by the city
government, the bank managers have less incentive and experience in credit checking and
risk management, this is especially the case in 2005 when the Chinese banking sector has the
highest competition and bank managers want to engage in higher volume of loan business. In
other words, the highest competition together with government support and lack of risk
management lead to highest volume of loan loss provision in city commercial banks. When
the risk is measured by the Z-score, we find that the state-owned and city commercial banks
are more stable, the joint-stock commercial banks have the highest risk in 2006.
Figure 6.1 Evolution of bank risk: 2003-2009
a Risk measured by the ratio of Loan loss provision over total loans
0.00
0.00
0.00
0.01
0.01
0.01
0.01
0.01
20
03
20
04
20
05
20
06
20
07
20
08
20
09
State-owned
Joint-stock
city
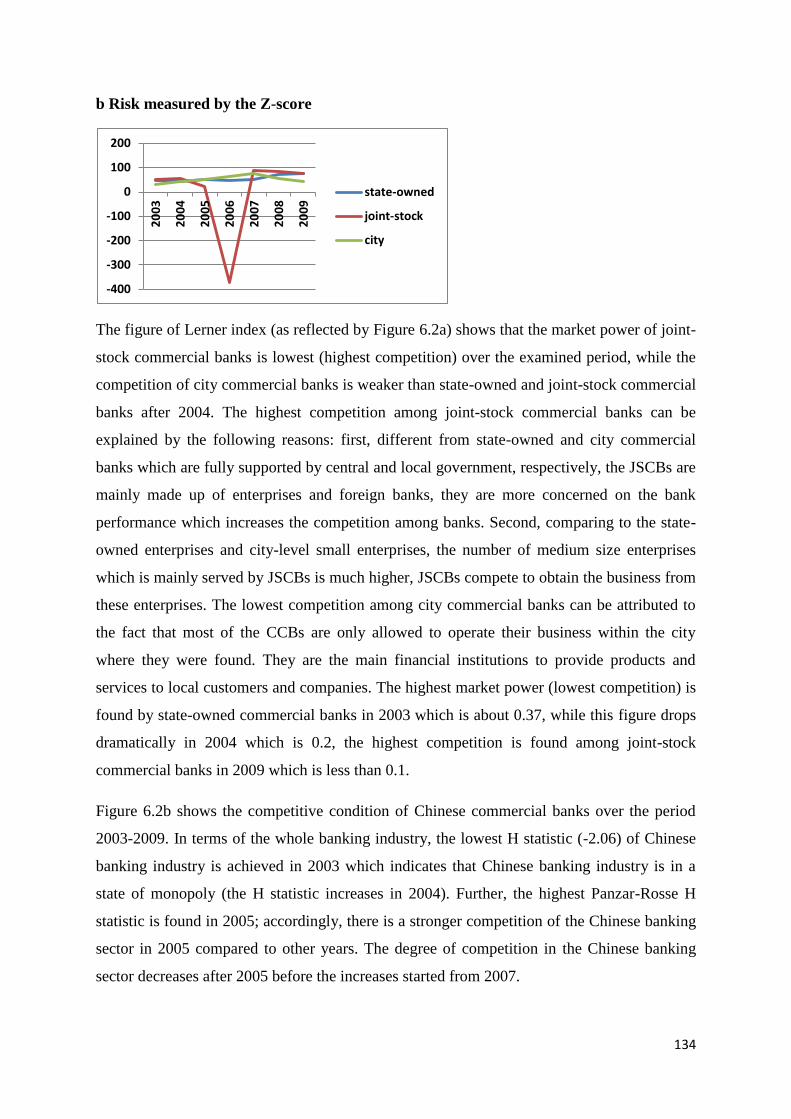
134
b Risk measured by the Z-score
The figure of Lerner index (as reflected by Figure 6.2a) shows that the market power of joint-
stock commercial banks is lowest (highest competition) over the examined period, while the
competition of city commercial banks is weaker than state-owned and joint-stock commercial
banks after 2004. The highest competition among joint-stock commercial banks can be
explained by the following reasons: first, different from state-owned and city commercial
banks which are fully supported by central and local government, respectively, the JSCBs are
mainly made up of enterprises and foreign banks, they are more concerned on the bank
performance which increases the competition among banks. Second, comparing to the state-
owned enterprises and city-level small enterprises, the number of medium size enterprises
which is mainly served by JSCBs is much higher, JSCBs compete to obtain the business from
these enterprises. The lowest competition among city commercial banks can be attributed to
the fact that most of the CCBs are only allowed to operate their business within the city
where they were found. They are the main financial institutions to provide products and
services to local customers and companies. The highest market power (lowest competition) is
found by state-owned commercial banks in 2003 which is about 0.37, while this figure drops
dramatically in 2004 which is 0.2, the highest competition is found among joint-stock
commercial banks in 2009 which is less than 0.1.
Figure 6.2b shows the competitive condition of Chinese commercial banks over the period
2003-2009. In terms of the whole banking industry, the lowest H statistic (-2.06) of Chinese
banking industry is achieved in 2003 which indicates that Chinese banking industry is in a
state of monopoly (the H statistic increases in 2004). Further, the highest Panzar-Rosse H
statistic is found in 2005; accordingly, there is a stronger competition of the Chinese banking
sector in 2005 compared to other years. The degree of competition in the Chinese banking
sector decreases after 2005 before the increases started from 2007.
-400
-300
-200
-100
0
100
2002
00
3
20
04
20
05
20
06
20
07
20
08
20
09
state-owned
joint-stock
city
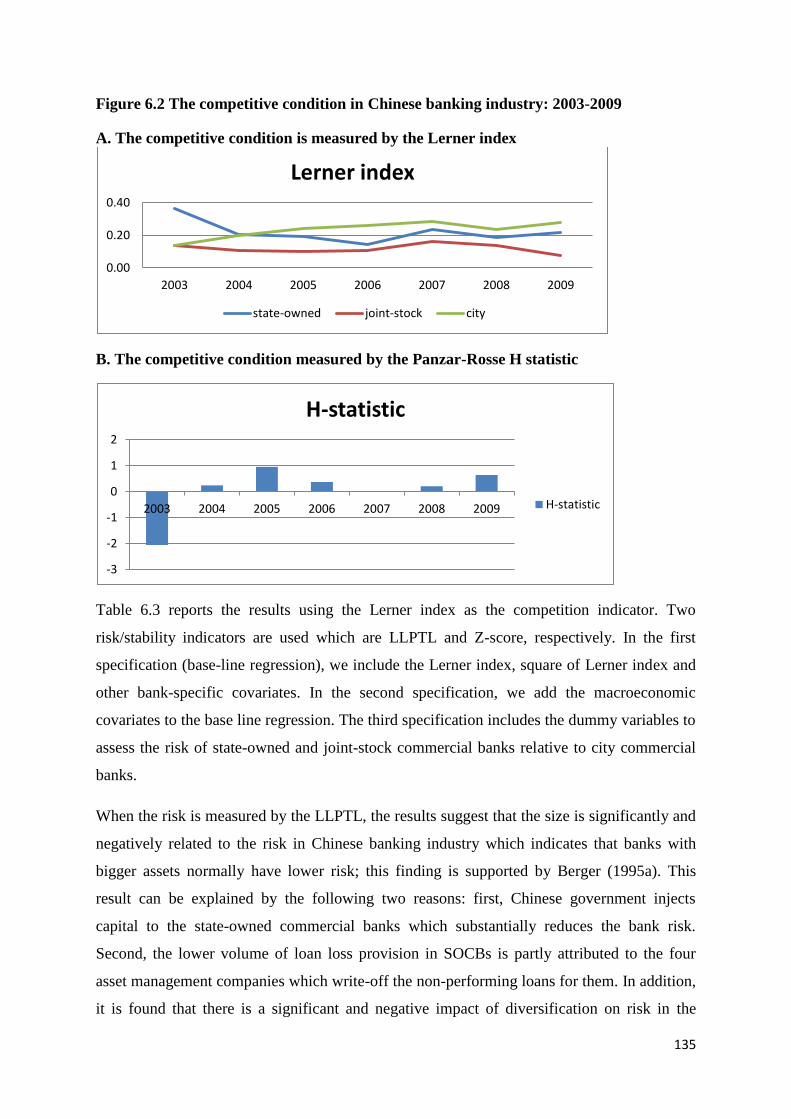
135
Figure 6.2 The competitive condition in Chinese banking industry: 2003-2009
A. The competitive condition is measured by the Lerner index
B. The competitive condition measured by the Panzar-Rosse H statistic
Table 6.3 reports the results using the Lerner index as the competition indicator. Two
risk/stability indicators are used which are LLPTL and Z-score, respectively. In the first
specification (base-line regression), we include the Lerner index, square of Lerner index and
other bank-specific covariates. In the second specification, we add the macroeconomic
covariates to the base line regression. The third specification includes the dummy variables to
assess the risk of state-owned and joint-stock commercial banks relative to city commercial
banks.
When the risk is measured by the LLPTL, the results suggest that the size is significantly and
negatively related to the risk in Chinese banking industry which indicates that banks with
bigger assets normally have lower risk; this finding is supported by Berger (1995a). This
result can be explained by the following two reasons: first, Chinese government injects
capital to the state-owned commercial banks which substantially reduces the bank risk.
Second, the lower volume of loan loss provision in SOCBs is partly attributed to the four
asset management companies which write-off the non-performing loans for them. In addition,
it is found that there is a significant and negative impact of diversification on risk in the
0.00
0.20
0.40
2003 2004 2005 2006 2007 2008 2009
Lerner index
state-owned joint-stock city
-3
-2
-1
0
1
2
2003 2004 2005 2006 2007 2008 2009
H-statistic
H-statistic
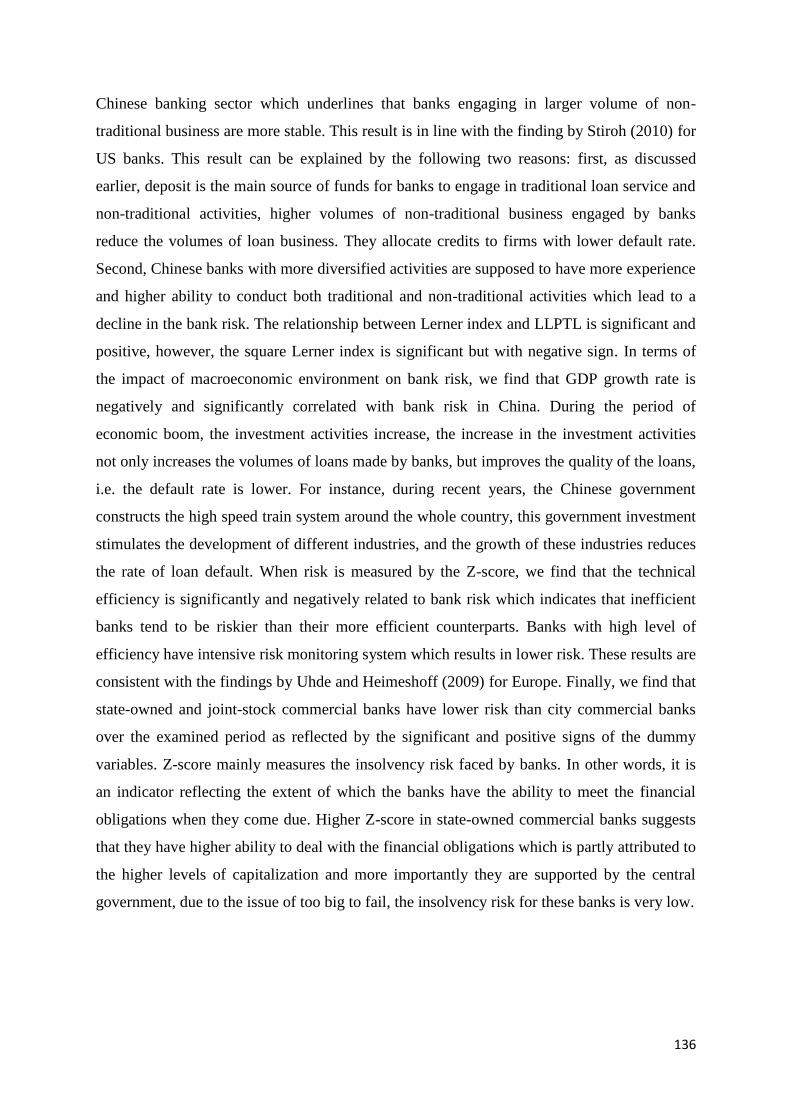
136
Chinese banking sector which underlines that banks engaging in larger volume of non-
traditional business are more stable. This result is in line with the finding by Stiroh (2010) for
US banks. This result can be explained by the following two reasons: first, as discussed
earlier, deposit is the main source of funds for banks to engage in traditional loan service and
non-traditional activities, higher volumes of non-traditional business engaged by banks
reduce the volumes of loan business. They allocate credits to firms with lower default rate.
Second, Chinese banks with more diversified activities are supposed to have more experience
and higher ability to conduct both traditional and non-traditional activities which lead to a
decline in the bank risk. The relationship between Lerner index and LLPTL is significant and
positive, however, the square Lerner index is significant but with negative sign. In terms of
the impact of macroeconomic environment on bank risk, we find that GDP growth rate is
negatively and significantly correlated with bank risk in China. During the period of
economic boom, the investment activities increase, the increase in the investment activities
not only increases the volumes of loans made by banks, but improves the quality of the loans,
i.e. the default rate is lower. For instance, during recent years, the Chinese government
constructs the high speed train system around the whole country, this government investment
stimulates the development of different industries, and the growth of these industries reduces
the rate of loan default. When risk is measured by the Z-score, we find that the technical
efficiency is significantly and negatively related to bank risk which indicates that inefficient
banks tend to be riskier than their more efficient counterparts. Banks with high level of
efficiency have intensive risk monitoring system which results in lower risk. These results are
consistent with the findings by Uhde and Heimeshoff (2009) for Europe. Finally, we find that
state-owned and joint-stock commercial banks have lower risk than city commercial banks
over the examined period as reflected by the significant and positive signs of the dummy
variables. Z-score mainly measures the insolvency risk faced by banks. In other words, it is
an indicator reflecting the extent of which the banks have the ability to meet the financial
obligations when they come due. Higher Z-score in state-owned commercial banks suggests
that they have higher ability to deal with the financial obligations which is partly attributed to
the higher levels of capitalization and more importantly they are supported by the central
government, due to the issue of too big to fail, the insolvency risk for these banks is very low.
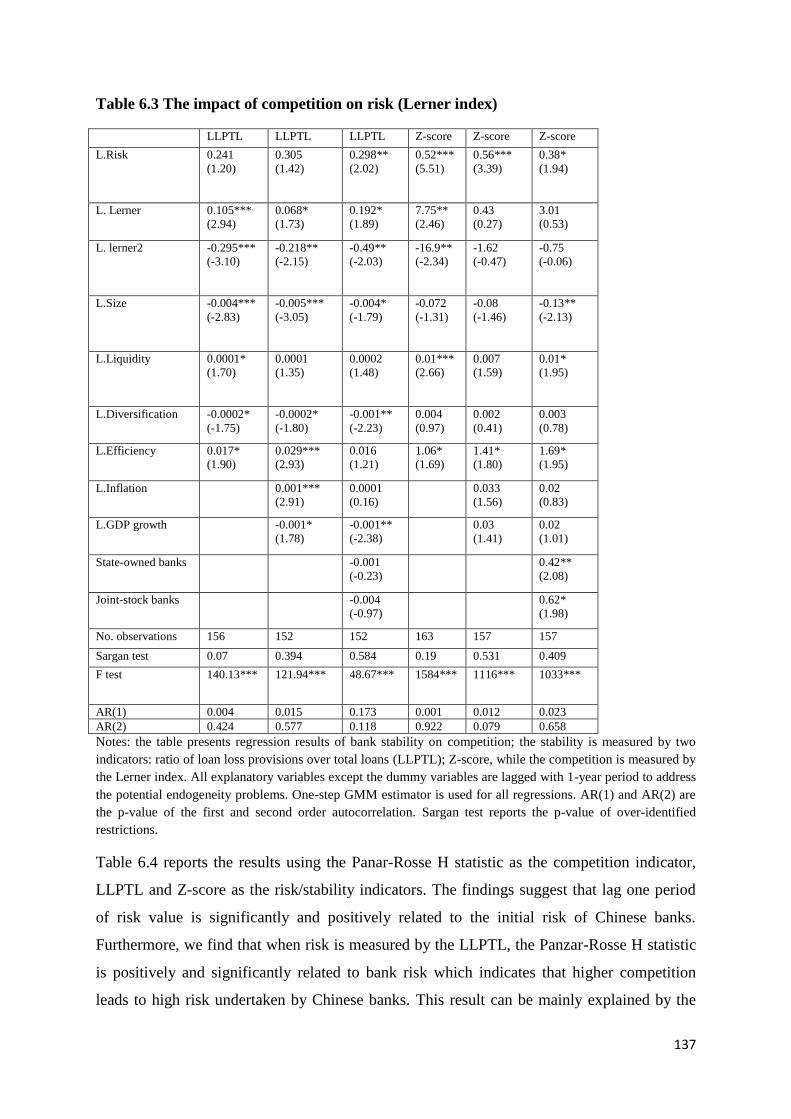
137
Table 6.3 The impact of competition on risk (Lerner index)
LLPTL LLPTL LLPTL Z-score Z-score Z-score
L.Risk 0.241
(1.20)
0.305
(1.42)
0.298**
(2.02)
0.52***
(5.51)
0.56***
(3.39)
0.38*
(1.94)
L. Lerner 0.105***
(2.94)
0.068*
(1.73)
0.192*
(1.89)
7.75**
(2.46)
0.43
(0.27)
3.01
(0.53)
L. lerner2 -0.295***
(-3.10)
-0.218**
(-2.15)
-0.49**
(-2.03)
-16.9**
(-2.34)
-1.62
(-0.47)
-0.75
(-0.06)
L.Size -0.004***
(-2.83)
-0.005***
(-3.05)
-0.004*
(-1.79)
-0.072
(-1.31)
-0.08
(-1.46)
-0.13**
(-2.13)
L.Liquidity 0.0001*
(1.70)
0.0001
(1.35)
0.0002
(1.48)
0.01***
(2.66)
0.007
(1.59)
0.01*
(1.95)
L.Diversification -0.0002*
(-1.75)
-0.0002*
(-1.80)
-0.001**
(-2.23)
0.004
(0.97)
0.002
(0.41)
0.003
(0.78)
L.Efficiency 0.017*
(1.90)
0.029***
(2.93)
0.016
(1.21)
1.06*
(1.69)
1.41*
(1.80)
1.69*
(1.95)
L.Inflation 0.001***
(2.91)
0.0001
(0.16)
0.033
(1.56)
0.02
(0.83)
L.GDP growth -0.001*
(1.78)
-0.001**
(-2.38)
0.03
(1.41)
0.02
(1.01)
State-owned banks -0.001
(-0.23)
0.42**
(2.08)
Joint-stock banks -0.004
(-0.97)
0.62*
(1.98)
No. observations 156 152 152 163 157 157
Sargan test 0.07 0.394 0.584 0.19 0.531 0.409
F test 140.13*** 121.94*** 48.67*** 1584*** 1116*** 1033***
AR(1) 0.004 0.015 0.173 0.001 0.012 0.023
AR(2) 0.424 0.577 0.118 0.922 0.079 0.658
Notes: the table presents regression results of bank stability on competition; the stability is measured by two
indicators: ratio of loan loss provisions over total loans (LLPTL); Z-score, while the competition is measured by
the Lerner index. All explanatory variables except the dummy variables are lagged with 1-year period to address
the potential endogeneity problems. One-step GMM estimator is used for all regressions. AR(1) and AR(2) are
the p-value of the first and second order autocorrelation. Sargan test reports the p-value of over-identified
restrictions.
Table 6.4 reports the results using the Panar-Rosse H statistic as the competition indicator,
LLPTL and Z-score as the risk/stability indicators. The findings suggest that lag one period
of risk value is significantly and positively related to the initial risk of Chinese banks.
Furthermore, we find that when risk is measured by the LLPTL, the Panzar-Rosse H statistic
is positively and significantly related to bank risk which indicates that higher competition
leads to high risk undertaken by Chinese banks. This result can be mainly explained by the
138
following two reasons: first, Chinese banks tend to lend to the projects with higher risk with
the expectation that higher risk comes with higher return. Furthermore, in a higher
competitive banking environment, in order to attract more customers and increase the
volumes of loan business, the Chinese banks normally are less careful in terms of credit
checking which precedes increases in the volumes of loan loss provision. However, two cases
of square term of H statistic (the first and third specification) are significant with positive
sign. Similar to table 6.3, we find that GDP growth rate is significantly and negatively related
to bank risk in China.
The significant value of F statistic confirms the joint-significance of the variables used in this
study, while the p-value of Sargan test indicates that we cannot reject the hypothesis that the
instrumental variables are uncorrelated to some set of residuals, in other word, it means that
the instruments are acceptable and valid. Even some of the P-value of AR(1) suggest that we
cannot reject the hypothesis of first-order autocorrelation. However, the p-values of AR(2)
suggest that we can reject the hypothesis of second order autocorrelation.
Further, we conduct a number of additional tests to check the robustness of our results. First,
we use the Herfindal index (the sum of the square of the share of each bank‟s assets over the
total assets of the banking industry) as an alternative competitive measure. The main results
hold. Secondly, we use two alternative risk indicators, which are volatility of ROA and
volatility of ROE, and the principle results are unaffected.
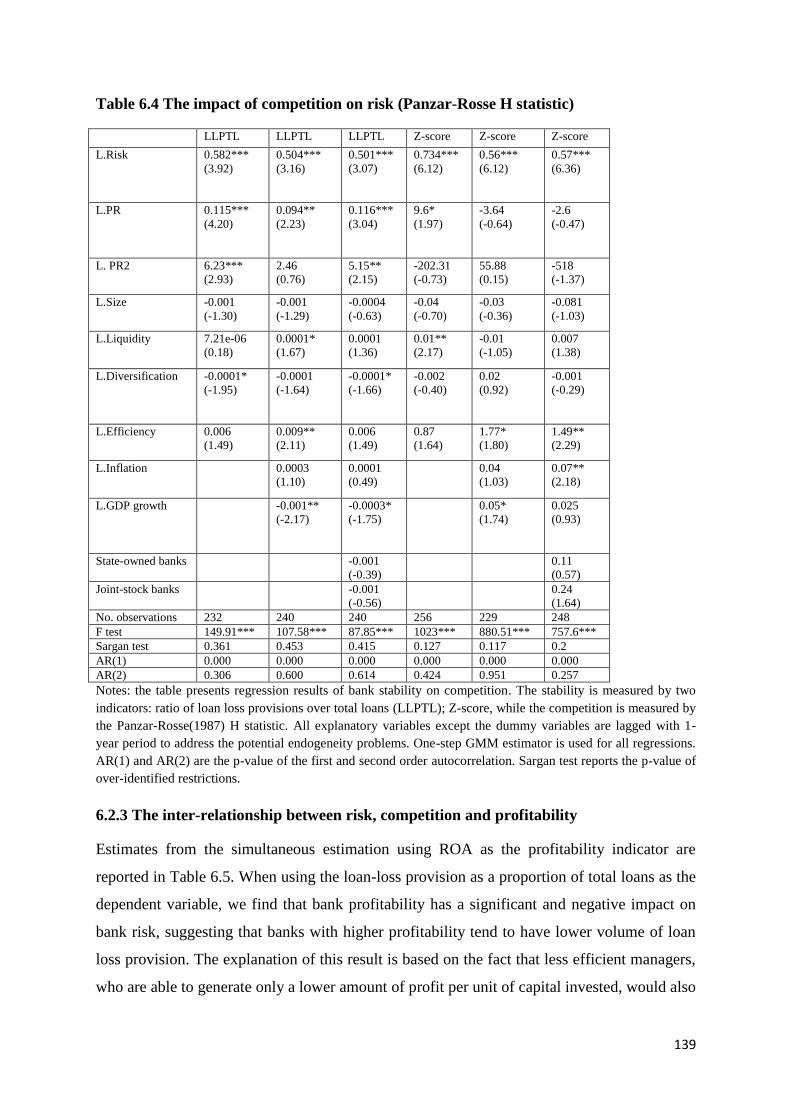
139
Table 6.4 The impact of competition on risk (Panzar-Rosse H statistic)
LLPTL LLPTL LLPTL Z-score Z-score Z-score
L.Risk 0.582***
(3.92)
0.504***
(3.16)
0.501***
(3.07)
0.734***
(6.12)
0.56***
(6.12)
0.57***
(6.36)
L.PR 0.115***
(4.20)
0.094**
(2.23)
0.116***
(3.04)
9.6*
(1.97)
-3.64
(-0.64)
-2.6
(-0.47)
L. PR2 6.23***
(2.93)
2.46
(0.76)
5.15**
(2.15)
-202.31
(-0.73)
55.88
(0.15)
-518
(-1.37)
L.Size -0.001
(-1.30)
-0.001
(-1.29)
-0.0004
(-0.63)
-0.04
(-0.70)
-0.03
(-0.36)
-0.081
(-1.03)
L.Liquidity 7.21e-06
(0.18)
0.0001*
(1.67)
0.0001
(1.36)
0.01**
(2.17)
-0.01
(-1.05)
0.007
(1.38)
L.Diversification -0.0001*
(-1.95)
-0.0001
(-1.64)
-0.0001*
(-1.66)
-0.002
(-0.40)
0.02
(0.92)
-0.001
(-0.29)
L.Efficiency 0.006
(1.49)
0.009**
(2.11)
0.006
(1.49)
0.87
(1.64)
1.77*
(1.80)
1.49**
(2.29)
L.Inflation 0.0003
(1.10)
0.0001
(0.49)
0.04
(1.03)
0.07**
(2.18)
L.GDP growth -0.001**
(-2.17)
-0.0003*
(-1.75)
0.05*
(1.74)
0.025
(0.93)
State-owned banks -0.001
(-0.39)
0.11
(0.57)
Joint-stock banks -0.001
(-0.56)
0.24
(1.64)
No. observations 232 240 240 256 229 248
F test 149.91*** 107.58*** 87.85*** 1023*** 880.51*** 757.6***
Sargan test 0.361 0.453 0.415 0.127 0.117 0.2
AR(1) 0.000 0.000 0.000 0.000 0.000 0.000
AR(2) 0.306 0.600 0.614 0.424 0.951 0.257
Notes: the table presents regression results of bank stability on competition. The stability is measured by two
indicators: ratio of loan loss provisions over total loans (LLPTL); Z-score, while the competition is measured by
the Panzar-Rosse(1987) H statistic. All explanatory variables except the dummy variables are lagged with 1-
year period to address the potential endogeneity problems. One-step GMM estimator is used for all regressions.
AR(1) and AR(2) are the p-value of the first and second order autocorrelation. Sargan test reports the p-value of
over-identified restrictions.
6.2.3 The inter-relationship between risk, competition and profitability
Estimates from the simultaneous estimation using ROA as the profitability indicator are
reported in Table 6.5. When using the loan-loss provision as a proportion of total loans as the
dependent variable, we find that bank profitability has a significant and negative impact on
bank risk, suggesting that banks with higher profitability tend to have lower volume of loan
loss provision. The explanation of this result is based on the fact that less efficient managers,
who are able to generate only a lower amount of profit per unit of capital invested, would also
140
be responsible for a deterioration in credit quality. The significant and positive relationship
between Lerner index and bank risk indicates that lower competition (higher market power)
induces the bank to take higher risk. This result supports the competition-stability
assumption. This is different from the results reported when competition is measured by
Panzar-Rosse H statistic. The different findings can be attributed to the following two
reasons: first, two different competition measurements are used; second, the econometric
methods applied in these two studies are different with former applied the GMM estimation
while the latter used the SUR. In terms of the bank-specific variables, the significant and
negative impact of bank size on bank risk suggests that bigger banks tend to have a lower
volume of loan loss provision. Hughes et al. (2001) argue that there are potential
diversification benefits associated with bank size. The taxation and off-balance-sheet activity
have negative impacts on loan-loss provision, which underlines that banks with lower
taxation and off-balance sheet activity normally have a higher volume of loan loss provision.
Tax is paid from the profit made by the banks; lower taxation reflects the fact the amount of
profit made by the banks is smaller, as discussed earlier, the loan-deposit business is the main
service provided by the banks and it is the main resource of their income. The lower profit
achieved by the banks can be attributed to the loss on the traditional loan-deposit services. In
other words, there is a larger volume of loan-loss provision. A lower volume of off-balance
sheet activity indicates that banks use most of their funds in providing loans to different firms
or companies, and the lack of risk monitoring and management leads to accumulation of bad
loans. Furthermore, we find in our study that labour productivity is positively and
significantly related to bank risk. This finding can be explained by the fact that in order to
stimulate the staffs to increase their work efforts, efficiency and productivity, the Chinese
banks have the policy that the staffs‟ income is linked with the number of loan business they
provide. In other words, the more loan transactions they make, the more salary they will earn.
In this case, the banking staffs will focus on the number of transactions they have rather than
emphasizing on the quality of the transactions, which leads to higher bank risk.
In terms of the industry-specific variables, the empirical results show that banks operating in
a market with higher concentration, higher development of banking and stock markets
typically have higher volume of loan loss provision; the results in terms of the impacts of the
development of the banking sector and stock market are in line with our expectation. In a
higher developed banking market where the banking sector assets account for a large
proportion of the country‟s GDP, the demand for banking services is very large, as discussed
141
earlier that the higher demand for banking services in China attracts more potential
competitors enter the market. However, the fact that the application and requirement of
establishing a new bank is very strict makes the competition among existing banks increase.
The increase in the competition leads to an increase in the volume of non-performing loans.
Furthermore, as discussed earlier, the higher developed stock market provides more credit
information for banks regarding the listed firms, which further reduces the default risk.
However, the higher developed stock market makes more firms obtain funds through the
stock market, the decrease in the volumes of banks‟ loan business induce managers to take
higher risk, which precedes increases in the volumes of loan loss provision. However, the
finding of concentration on risk is in direct contrast with our expectation. The possible reason
is that the concentrated banking market in China indicates that the market share is occupied
by the state-owned commercial banks. The support from government to the state-owned
commercial banks reduces the incentive for the mangers to increase their efforts to engage in
prudential lending, which leads to accumulation of bad loans. Banks operating in higher
inflation and GDP growth environment have lower levels of loan-loss provision, as shown by
the negative and significant signs of these two variables; this is in line with our expectation.
The impact of GDP growth rate on the volume of loan loss provision has already been
explained in the earlier section. Further, the impact of inflation on the volume of loan loss
provision can be explained by the following reasons: during the period of inflation, the
amount of money circulated in the market is much more than the quantity of goods, which
leads to a rise in the general level of price. The government will take different measurements
to deal with this issue. The first one is to increase the deposit interest rate to collect a certain
amount of currency back; the alternative way is to reduce the loan interest rate to stimulate
investment. The reduction in the loan interest rate decreases the borrowing cost for firms,
which is supposed to reduce the default rate and further lead to a decline in the volume of
loan loss provision. The risk is also cross-checked by three alternative indicators: Volatility
of ROA, Volatility of ROE and Z-score. ROA is significantly and positively correlated with
volatility of ROA. This result may be explained by the fact that the higher profit obtained by
the bank induces the manager to be careless in the future transactions, which leads to more
volatility of the return. Further, the signs of coefficients of all the industry-specific variables
turn to be negative when volatility of ROA is used as the risk measure. This finding indicates
that although the volume of loan loss provision is high, the gain from the relative inelastic
demand from consumers can offset the loan losses made by the banks, which results in
relatively more stable returns. The results show that the off-balance-sheet activity in the
142
Chinese banking industry has a significant and positive influence on the volatility of ROA.
These results confirm that the Chinese banks still lack the knowledge, experience and staffs
to engage in the non-traditional business, which leads to more volatility of the return. Further,
liquidity is significantly and inversely correlated with volatility of ROA suggesting that loan
growth is inextricably linked to loan loss provision levels, which reflects that the degree of
risk on different projects or degree of risk from different firms in China is well-diversified.
Finally, the results from the ownership dummy variables show that both the state-owned and
joint-stock commercial banks have higher volumes of loan loss provision.
Moreover, the empirical results show that LLPTL has a negative impact on ROA in the
Chinese banking industry, indicating that banks with a higher level of loan loss provision
normally have lower profitability ratios. This result is in line with the findings of Fadzlan and
Royfaized (2008). In addition, we find that the Lerner index has a significant and positive
impact on ROA. This result is in line with the SCP theory, as explained above.
In terms of the bank-specific variables, taxation is found to be negatively related to
profitability of Chinese banks, indicating a negative relationship between taxation and bank
profitability. One could argue that the more taxes paid by the banks, the higher cost incurred
by the banks; this decreases profitability. The result is supported by Bashir (2000) for Islamic
banks from the Middle East and Tan and Floros (2012a) for Chinese banks. Labour
productivity is found to have a positive and significant relationship with Chinese bank
profitability, which is in accordance with Athanasoglou et al. (2008).
Turning to the industry specific factors, the concentration is significant at 1% level and the
sign of the coefficient is positive, indicating that there is a positive relationship between
concentration and bank profitability (ROA). This result is supported by Demirguc-Kunt and
Huizinga (1999) and Hassan and Bashir (2003). However, this result is conflicted with
Garcia-Herrero et al. (2009) for Chinese banks, who find that there is a negative relationship
between bank profitability and concentration. This is mainly because a different period is
examined and different methods are used in our study.
Further, we find that there is a positive and significant relationship between banking sector
development and bank profitability (ROA); this result is not in line with previous findings
(e.g. Demirguc-Kunt and Huizinga, 1999). However, this is consistent with the finding of Tan
and Floros (2012b) for Chinese banks. A large proportion of bank assets in GDP indicates
that there is a high demand for bank services. According to the circumstance of the banking
143
industry in China, the establishment of a new bank involves a very complicated procedure,
and the requirement made by the government to open a new bank is very strict. This makes it
difficult for a potential competitor to enter the market, because the demand is increasing,
which makes the profitability of existing banks increase.
The sign of stock market development is positive and this variable is significant at 10% level,
indicating that there is a positive relationship between stock market development and bank
profitability (ROA). This finding confirms the empirical results of Ben Naceur (2003) for
Tunisian banks. He suggests that as the stock market enlarges, more information becomes
available. This leads to an increased number of customers to banks by making easier the
process of identification and monitoring of borrowers. Consequently, this will contribute to a
higher profitability. The positive relationship between stock market development and bank
profitability shows that there are complementarities between the stock market and banking
development in China (this is in line with the theory).The GDP growth is found to be
significantly and negatively related to bank profitability in China. This result is consistent
with Liu and Wilson (2010) for the Japanese banking industry. This result partially supports
the view that high economic growth improves business environment and lowers bank entry
barriers. The consequently increased competition dampens bank‟s profitability.
In terms of the determinants of the Lerner index, we find that profitability has a significant
and positive relationship with market power, suggesting that banks with higher profitability
ratio normally have higher market power (i.e. lower level of competition). Higher
profitability is obtained through larger market share, which dampens the competition.
Taxation is found to be significantly and positively correlated with the Lerner index,
suggesting that higher taxation reduces competition in the Chinese banking industry, which is
in line with our expectation. Labour productivity has a significant and negative impact on the
Lerner index indicating that higher labour productivity increases the degree of competition in
Chinese banking industry. Staffs with higher productivity are being paid by higher salaries;
the higher salaries paid by Chinese banks increase banks‟ cost and further decrease the banks‟
margins, which leads to declines in the Lerner index and higher competition. We further
report that concentration, banking sector development and stock market development are
significantly and negatively correlated with market power which underlines that higher
concentrated banking market, higher developed banking and stock market precede
competition improvement in the Chinese banking industry. The positive impact of
concentration on competition is reported, which is different from previous results when we
144
regress the competition against efficiency and concentration where we suggest that higher
concentration decreases the bank competition. The different findings are due to the different
methods used in the empirical investigation with the former applying the Panzar-Rosse H
statistic as the competition indicator while the latter employs the Lerner index. The positive
impact of banking sector development on bank competition can be explained as follows:
higher developed banking sector indicates that the demand for banking services is large,
different ownerships of banks compete with each other to obtain more customers and engage
in higher volumes of business. While the positive impact of stock market development on
bank competition can be explained by the fact that higher developed stock market induces
firms to obtain funds through listing on the stock exchange rather than taking loans from
banks, the resultant decrease in the volumes of bank business induce bank managers to
compete with each other.
Our previous result is cross-checked by using ROE as the profitability indicator; the findings
are reported in Table 6.6. We find qualitatively similar results to ROA, i.e. LLPTL has a
negative impact on ROE, while ROE is significantly and negatively correlated with LLPTL.
We further report that bank size, taxation and off-balance-sheet activity negatively affect the
risk (LLPTL) of Chinese banks. Off-balance-sheet activity has a positive impact on volatility
of ROA, while negative impact is exerted on the Z-score. Liquidity is found to have a
negative impact on volatility of ROA. The finding confirms that both the state-owned and
joint-stock commercial banks have higher volume of loan loss provision. In terms of the
determinants of ROE, the findings show that taxation has a significant and negative impact
on ROE, while there is a positive impact of labour productivity on ROE. We report that the
higher development of the banking sector in China increases the degree of competition (as
reported in table 6.6).
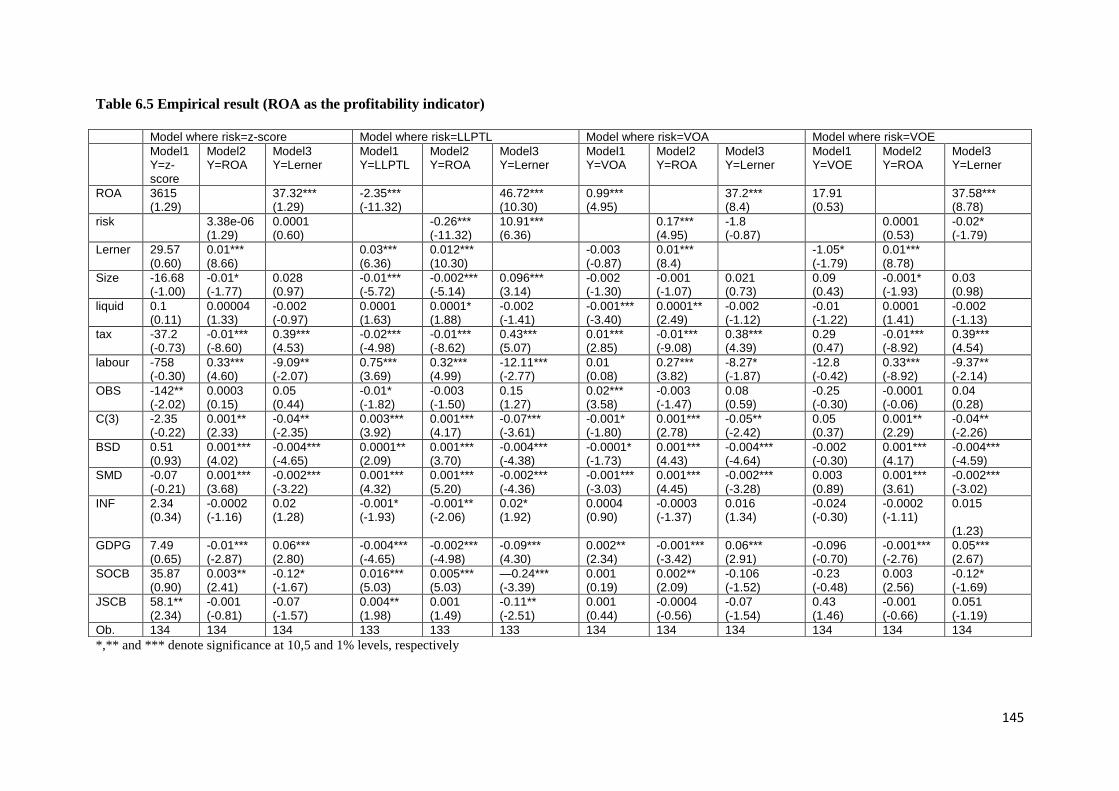
145
Table 6.5 Empirical result (ROA as the profitability indicator)
*,** and *** denote significance at 10,5 and 1% levels, respectively
Model where risk=z-score Model where risk=LLPTL Model where risk=VOA Model where risk=VOE
Model1 Y=z-score
Model2 Y=ROA
Model3 Y=Lerner
Model1 Y=LLPTL
Model2 Y=ROA
Model3 Y=Lerner
Model1 Y=VOA
Model2 Y=ROA
Model3 Y=Lerner
Model1 Y=VOE
Model2 Y=ROA
Model3 Y=Lerner
ROA 3615 (1.29)
37.32*** (1.29)
-2.35*** (-11.32)
46.72*** (10.30)
0.99*** (4.95)
37.2*** (8.4)
17.91 (0.53)
37.58*** (8.78)
risk 3.38e-06 (1.29)
0.0001 (0.60)
-0.26*** (-11.32)
10.91*** (6.36)
0.17*** (4.95)
-1.8 (-0.87)
0.0001 (0.53)
-0.02* (-1.79)
Lerner 29.57 (0.60)
0.01*** (8.66)
0.03*** (6.36)
0.012*** (10.30)
-0.003 (-0.87)
0.01*** (8.4)
-1.05* (-1.79)
0.01*** (8.78)
Size -16.68 (-1.00)
-0.01* (-1.77)
0.028 (0.97)
-0.01*** (-5.72)
-0.002*** (-5.14)
0.096*** (3.14)
-0.002 (-1.30)
-0.001 (-1.07)
0.021 (0.73)
0.09 (0.43)
-0.001* (-1.93)
0.03 (0.98)
liquid 0.1 (0.11)
0.00004 (1.33)
-0.002 (-0.97)
0.0001 (1.63)
0.0001* (1.88)
-0.002 (-1.41)
-0.001*** (-3.40)
0.0001** (2.49)
-0.002 (-1.12)
-0.01 (-1.22)
0.0001 (1.41)
-0.002 (-1.13)
tax -37.2 (-0.73)
-0.01*** (-8.60)
0.39*** (4.53)
-0.02*** (-4.98)
-0.01*** (-8.62)
0.43*** (5.07)
0.01*** (2.85)
-0.01*** (-9.08)
0.38*** (4.39)
0.29 (0.47)
-0.01*** (-8.92)
0.39*** (4.54)
labour -758 (-0.30)
0.33*** (4.60)
-9.09** (-2.07)
0.75*** (3.69)
0.32*** (4.99)
-12.11*** (-2.77)
0.01 (0.08)
0.27*** (3.82)
-8.27* (-1.87)
-12.8 (-0.42)
0.33*** (-8.92)
-9.37** (-2.14)
OBS -142** (-2.02)
0.0003 (0.15)
0.05 (0.44)
-0.01* (-1.82)
-0.003 (-1.50)
0.15 (1.27)
0.02*** (3.58)
-0.003 (-1.47)
0.08 (0.59)
-0.25 (-0.30)
-0.0001 (-0.06)
0.04 (0.28)
C(3) -2.35 (-0.22)
0.001** (2.33)
-0.04** (-2.35)
0.003*** (3.92)
0.001*** (4.17)
-0.07*** (-3.61)
-0.001* (-1.80)
0.001*** (2.78)
-0.05** (-2.42)
0.05 (0.37)
0.001** (2.29)
-0.04** (-2.26)
BSD 0.51 (0.93)
0.001*** (4.02)
-0.004*** (-4.65)
0.0001** (2.09)
0.001*** (3.70)
-0.004*** (-4.38)
-0.0001* (-1.73)
0.001*** (4.43)
-0.004*** (-4.64)
-0.002 (-0.30)
0.001*** (4.17)
-0.004*** (-4.59)
SMD -0.07 (-0.21)
0.001*** (3.68)
-0.002*** (-3.22)
0.001*** (4.32)
0.001*** (5.20)
-0.002*** (-4.36)
-0.001*** (-3.03)
0.001*** (4.45)
-0.002*** (-3.28)
0.003 (0.89)
0.001*** (3.61)
-0.002*** (-3.02)
INF 2.34 (0.34)
-0.0002 (-1.16)
0.02 (1.28)
-0.001* (-1.93)
-0.001** (-2.06)
0.02* (1.92)
0.0004 (0.90)
-0.0003 (-1.37)
0.016 (1.34)
-0.024 (-0.30)
-0.0002 (-1.11)
0.015 (1.23)
GDPG 7.49 (0.65)
-0.01*** (-2.87)
0.06*** (2.80)
-0.004*** (-4.65)
-0.002*** (-4.98)
-0.09*** (4.30)
0.002** (2.34)
-0.001*** (-3.42)
0.06*** (2.91)
-0.096 (-0.70)
-0.001*** (-2.76)
0.05*** (2.67)
SOCB 35.87 (0.90)
0.003** (2.41)
-0.12* (-1.67)
0.016*** (5.03)
0.005*** (5.03)
—0.24*** (-3.39)
0.001 (0.19)
0.002** (2.09)
-0.106 (-1.52)
-0.23 (-0.48)
0.003 (2.56)
-0.12* (-1.69)
JSCB 58.1** (2.34)
-0.001 (-0.81)
-0.07 (-1.57)
0.004** (1.98)
0.001 (1.49)
-0.11** (-2.51)
0.001 (0.44)
-0.0004 (-0.56)
-0.07 (-1.54)
0.43 (1.46)
-0.001 (-0.66)
0.051 (-1.19)
Ob. 134 134 134 133 133 133 134 134 134 134 134 134
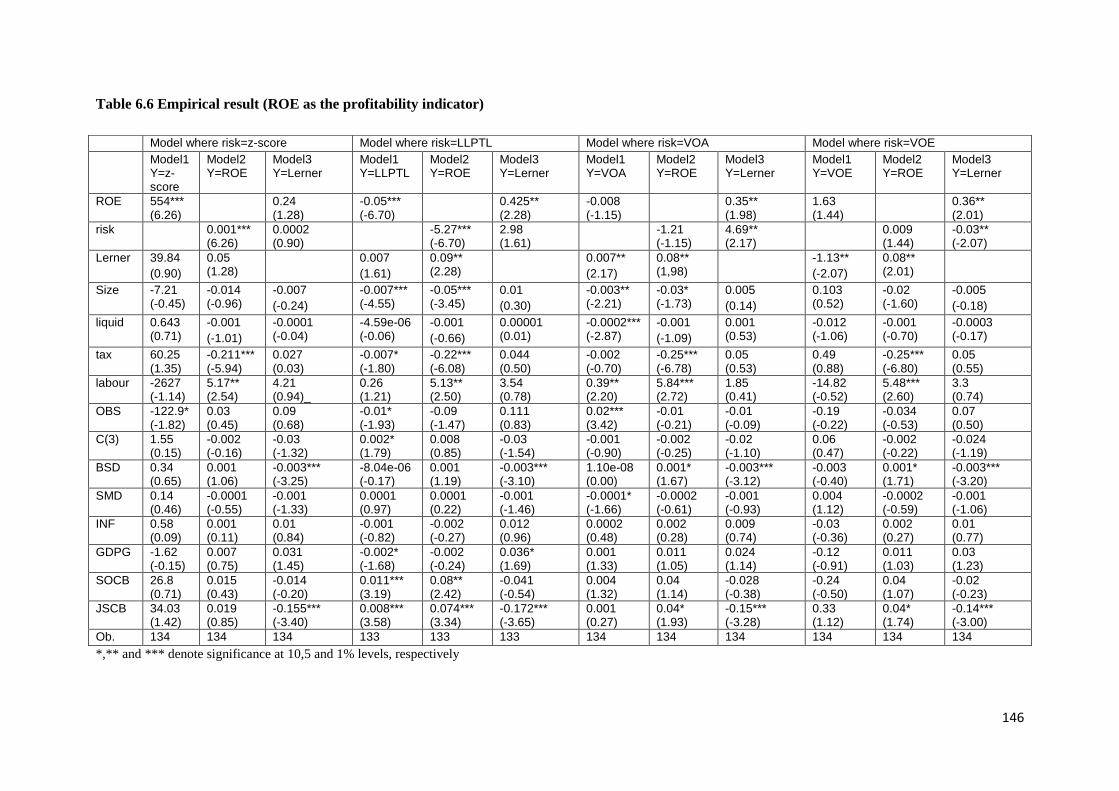
146
Table 6.6 Empirical result (ROE as the profitability indicator)
*,** and *** denote significance at 10,5 and 1% levels, respectively
Model where risk=z-score Model where risk=LLPTL Model where risk=VOA Model where risk=VOE
Model1 Y=z-score
Model2 Y=ROE
Model3 Y=Lerner
Model1 Y=LLPTL
Model2 Y=ROE
Model3 Y=Lerner
Model1 Y=VOA
Model2 Y=ROE
Model3 Y=Lerner
Model1 Y=VOE
Model2 Y=ROE
Model3 Y=Lerner
ROE 554*** (6.26)
0.24 (1.28)
-0.05*** (-6.70)
0.425** (2.28)
-0.008 (-1.15)
0.35** (1.98)
1.63 (1.44)
0.36** (2.01)
risk 0.001*** (6.26)
0.0002 (0.90)
-5.27*** (-6.70)
2.98 (1.61)
-1.21 (-1.15)
4.69** (2.17)
0.009 (1.44)
-0.03** (-2.07)
Lerner 39.84
(0.90)
0.05 (1.28)
0.007
(1.61)
0.09** (2.28)
0.007**
(2.17)
0.08** (1,98)
-1.13**
(-2.07)
0.08** (2.01)
Size -7.21 (-0.45)
-0.014 (-0.96)
-0.007
(-0.24)
-0.007*** (-4.55)
-0.05*** (-3.45)
0.01
(0.30)
-0.003** (-2.21)
-0.03* (-1.73)
0.005
(0.14)
0.103 (0.52)
-0.02 (-1.60)
-0.005
(-0.18)
liquid 0.643 (0.71)
-0.001
(-1.01)
-0.0001 (-0.04)
-4.59e-06 (-0.06)
-0.001
(-0.66)
0.00001 (0.01)
-0.0002*** (-2.87)
-0.001
(-1.09)
0.001 (0.53)
-0.012 (-1.06)
-0.001 (-0.70)
-0.0003 (-0.17)
tax 60.25 (1.35)
-0.211*** (-5.94)
0.027 (0.03)
-0.007* (-1.80)
-0.22*** (-6.08)
0.044 (0.50)
-0.002 (-0.70)
-0.25*** (-6.78)
0.05 (0.53)
0.49 (0.88)
-0.25*** (-6.80)
0.05 (0.55)
labour -2627 (-1.14)
5.17** (2.54)
4.21 (0.94)_
0.26 (1.21)
5.13** (2.50)
3.54 (0.78)
0.39** (2.20)
5.84*** (2.72)
1.85 (0.41)
-14.82 (-0.52)
5.48*** (2.60)
3.3 (0.74)
OBS -122.9* (-1.82)
0.03 (0.45)
0.09 (0.68)
-0.01* (-1.93)
-0.09 (-1.47)
0.111 (0.83)
0.02*** (3.42)
-0.01 (-0.21)
-0.01 (-0.09)
-0.19 (-0.22)
-0.034 (-0.53)
0.07 (0.50)
C(3) 1.55 (0.15)
-0.002 (-0.16)
-0.03 (-1.32)
0.002* (1.79)
0.008 (0.85)
-0.03 (-1.54)
-0.001 (-0.90)
-0.002 (-0.25)
-0.02 (-1.10)
0.06 (0.47)
-0.002 (-0.22)
-0.024 (-1.19)
BSD 0.34 (0.65)
0.001 (1.06)
-0.003*** (-3.25)
-8.04e-06 (-0.17)
0.001 (1.19)
-0.003*** (-3.10)
1.10e-08 (0.00)
0.001* (1.67)
-0.003*** (-3.12)
-0.003 (-0.40)
0.001* (1.71)
-0.003*** (-3.20)
SMD 0.14 (0.46)
-0.0001 (-0.55)
-0.001 (-1.33)
0.0001 (0.97)
0.0001 (0.22)
-0.001 (-1.46)
-0.0001* (-1.66)
-0.0002 (-0.61)
-0.001 (-0.93)
0.004 (1.12)
-0.0002 (-0.59)
-0.001 (-1.06)
INF 0.58 (0.09)
0.001 (0.11)
0.01 (0.84)
-0.001 (-0.82)
-0.002 (-0.27)
0.012 (0.96)
0.0002 (0.48)
0.002 (0.28)
0.009 (0.74)
-0.03 (-0.36)
0.002 (0.27)
0.01 (0.77)
GDPG -1.62 (-0.15)
0.007 (0.75)
0.031 (1.45)
-0.002* (-1.68)
-0.002 (-0.24)
0.036* (1.69)
0.001 (1.33)
0.011 (1.05)
0.024 (1.14)
-0.12 (-0.91)
0.011 (1.03)
0.03 (1.23)
SOCB 26.8 (0.71)
0.015 (0.43)
-0.014 (-0.20)
0.011*** (3.19)
0.08** (2.42)
-0.041 (-0.54)
0.004 (1.32)
0.04 (1.14)
-0.028 (-0.38)
-0.24 (-0.50)
0.04 (1.07)
-0.02 (-0.23)
JSCB 34.03 (1.42)
0.019 (0.85)
-0.155*** (-3.40)
0.008*** (3.58)
0.074*** (3.34)
-0.172*** (-3.65)
0.001 (0.27)
0.04* (1.93)
-0.15*** (-3.28)
0.33 (1.12)
0.04* (1.74)
-0.14*** (-3.00)
Ob. 134 134 134 133 133 133 134 134 134 134 134 134
147
6.3 Summary and conclusion
This chapter provides the empirical results in terms of the competitive condition in the
Chinese banking sector. First, we present the results regarding the competitive condition
derived from Panzar-Rosse H statistic, which is followed by the explanation of risk condition
of the Chinese banking sector measured by ratio of loan-loss provisions over total loans and
Z-score, and we further discuss the impact of competition on risk-taking behaviour of
Chinese banks. Finally, we provide the results and discussion on the inter-relationships
between risk, profitability and competition in the Chinese banking system.
The results indicates the Panzar-Rosse H statistic over the examined period is 0.75, which
indicates that the Chinese banking sector is in a state of monopolistic competition which is
very near to perfect competition. While in terms of the competitive condition of Chinese
banks in the specific year between 2003-2009, the findings suggest that the Chinese banking
industry is in a state of monopolistic competition in all the years expect 2003 and 2007, and
the strongest competition is found in 2005 (the Panzar-Rosse H statistic is 0.95), which is
followed by 2009, the H statistic of which is 0.64. The lowest competition is found in 2003 as
indicated by the minus H statistic, which is -2.06. This figure means that the competition
condition of the Chinese banking sector in 2003 is monopoly.
With regards to the impact of competition on risk in the Chinese banking sector, the results
form GMM system estimator shows that there is not any clear evidence for the impact of
competition on risk in the Chinese banking sector.
Employing the seemingly unrelated regression (SUR) under a panel data framework to
examine the inter-relationship between profitability, competition and risk in the Chinese
banking sector, the results indicate that there is a significant and negative impact of
competition on bank profitability, which is in line with the Structure-Conduct-Performance
(SCP) hypothesis, while we also find that banks with higher profitability normally operate in
a less competitive environment.
148
Chapter 7
Empirical results on bank efficiency
7.1 Introduction
This chapter presents the empirical results on bank efficiency in China. In other words, the
following issues are investigated: 1) the technical, pure technical and scale efficiencies of
different ownerships of Chinese banks; 2) the impacts of concentration and efficiency on
bank competition; 3) the impacts of competition and profitability on bank efficiency; 4) risk,
share return and performance; 5) the inter-relationship between risk, capital and efficiency; 6)
the relationship between risk and efficiency; 7) the joint-effects of efficiency and competition
on bank profitability; 8) the impacts of stability/bank risk and efficiency/productivity on
market power (competition) of Chinese banks.
This chapter is structured as follows: 7.2.1 presents the results regarding the impacts of
efficiency and concentration on bank competition, which is followed by 7.2.2, which
discusses the impacts of competition and profitability on bank efficiency. 7.2.3 focuses on the
explanation of the impacts of share return and risk on bank efficiency/productivity; 7.2.4
provides the results regarding the inter-relationship between risk, capital and efficiency in the
Chinese banking sector. 7.2.5 presents and discusses the inter-relationships between risk and
efficiency; 7.2.6 presents and explains the effects of efficiency and competition on bank
profitability while 7.2.7 provides the results regarding the impact of risk and
efficiency/productivity on bank competition. Finally, 7.3 gives the summary and conclusion
of this chapter.
7.2 Empirical results on bank efficiency
7.2.1 The impacts of efficiency and concentration on bank competition
The inputs and outputs used in the estimation of bank efficiency and their statistics are shown
in Table 7.1. Starting from the inputs, seen from the standard deviation of the three input
variables, we can conclude that the difference of cost of capital among Chinese banks is
larger than the differences of cost of funds and cost of labour. As one important part of non-
interest operating expenses, some Chinese banks use advertisement to promote their image
and reputation on TV, internet, some banks also sponsor different activities in order to
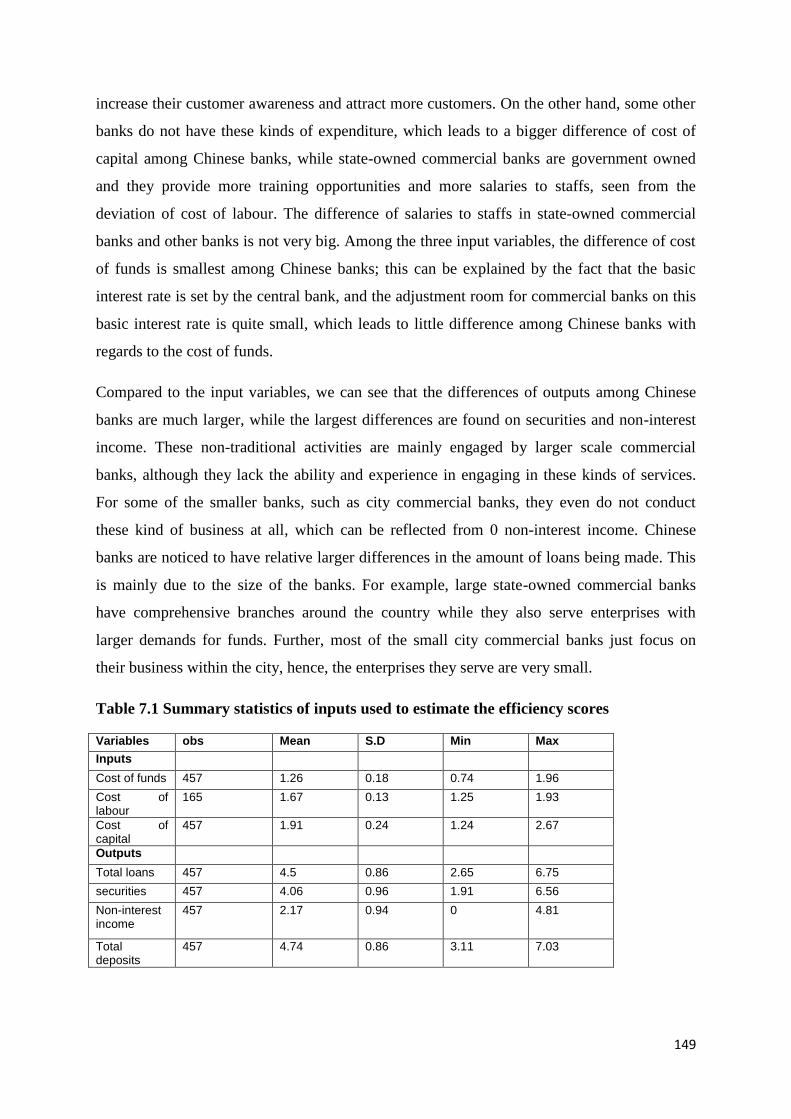
149
increase their customer awareness and attract more customers. On the other hand, some other
banks do not have these kinds of expenditure, which leads to a bigger difference of cost of
capital among Chinese banks, while state-owned commercial banks are government owned
and they provide more training opportunities and more salaries to staffs, seen from the
deviation of cost of labour. The difference of salaries to staffs in state-owned commercial
banks and other banks is not very big. Among the three input variables, the difference of cost
of funds is smallest among Chinese banks; this can be explained by the fact that the basic
interest rate is set by the central bank, and the adjustment room for commercial banks on this
basic interest rate is quite small, which leads to little difference among Chinese banks with
regards to the cost of funds.
Compared to the input variables, we can see that the differences of outputs among Chinese
banks are much larger, while the largest differences are found on securities and non-interest
income. These non-traditional activities are mainly engaged by larger scale commercial
banks, although they lack the ability and experience in engaging in these kinds of services.
For some of the smaller banks, such as city commercial banks, they even do not conduct
these kind of business at all, which can be reflected from 0 non-interest income. Chinese
banks are noticed to have relative larger differences in the amount of loans being made. This
is mainly due to the size of the banks. For example, large state-owned commercial banks
have comprehensive branches around the country while they also serve enterprises with
larger demands for funds. Further, most of the small city commercial banks just focus on
their business within the city, hence, the enterprises they serve are very small.
Table 7.1 Summary statistics of inputs used to estimate the efficiency scores
Variables obs Mean S.D Min Max
Inputs
Cost of funds 457 1.26 0.18 0.74 1.96
Cost of labour
165 1.67 0.13 1.25 1.93
Cost of capital
457 1.91 0.24 1.24 2.67
Outputs
Total loans 457 4.5 0.86 2.65 6.75
securities 457 4.06 0.96 1.91 6.56
Non-interest income
457 2.17 0.94 0 4.81
Total deposits
457 4.74 0.86 3.11 7.03
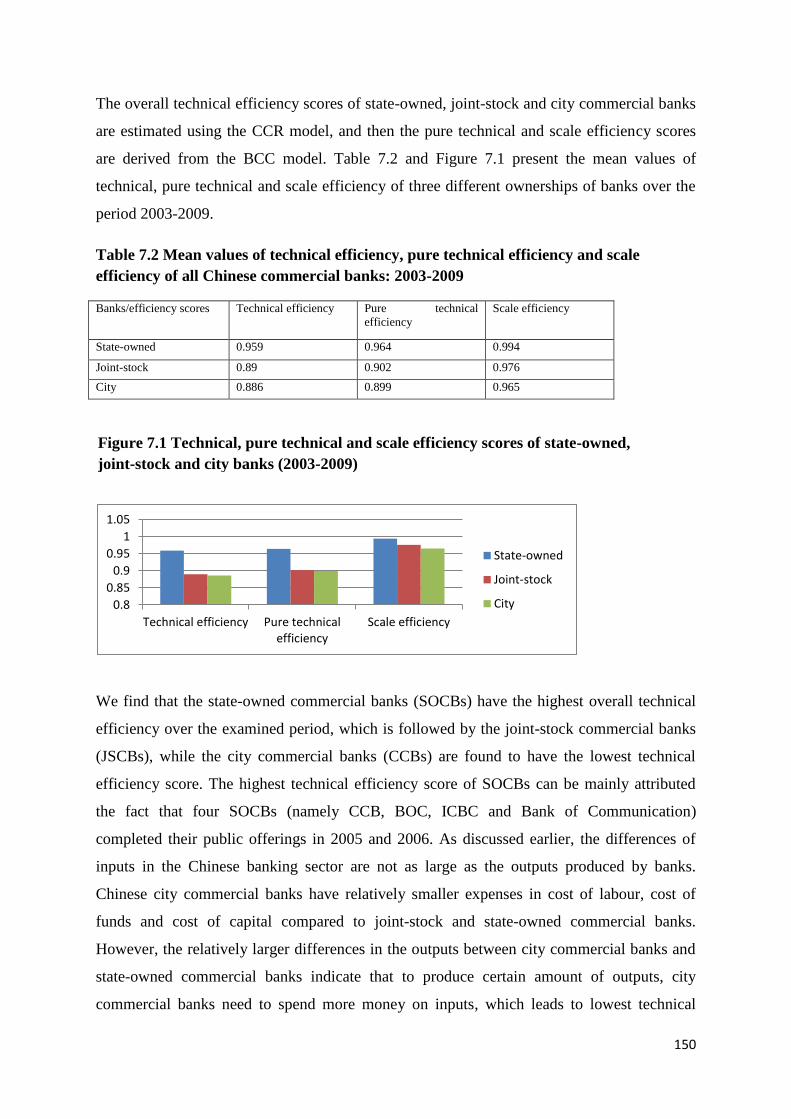
150
The overall technical efficiency scores of state-owned, joint-stock and city commercial banks
are estimated using the CCR model, and then the pure technical and scale efficiency scores
are derived from the BCC model. Table 7.2 and Figure 7.1 present the mean values of
technical, pure technical and scale efficiency of three different ownerships of banks over the
period 2003-2009.
Table 7.2 Mean values of technical efficiency, pure technical efficiency and scale
efficiency of all Chinese commercial banks: 2003-2009
Banks/efficiency scores Technical efficiency Pure technical
efficiency
Scale efficiency
State-owned 0.959 0.964 0.994
Joint-stock 0.89 0.902 0.976
City 0.886 0.899 0.965
We find that the state-owned commercial banks (SOCBs) have the highest overall technical
efficiency over the examined period, which is followed by the joint-stock commercial banks
(JSCBs), while the city commercial banks (CCBs) are found to have the lowest technical
efficiency score. The highest technical efficiency score of SOCBs can be mainly attributed
the fact that four SOCBs (namely CCB, BOC, ICBC and Bank of Communication)
completed their public offerings in 2005 and 2006. As discussed earlier, the differences of
inputs in the Chinese banking sector are not as large as the outputs produced by banks.
Chinese city commercial banks have relatively smaller expenses in cost of labour, cost of
funds and cost of capital compared to joint-stock and state-owned commercial banks.
However, the relatively larger differences in the outputs between city commercial banks and
state-owned commercial banks indicate that to produce certain amount of outputs, city
commercial banks need to spend more money on inputs, which leads to lowest technical
0.8
0.85
0.9
0.95
1
1.05
Technical efficiency Pure technicalefficiency
Scale efficiency
State-owned
Joint-stock
City
Figure 7.1 Technical, pure technical and scale efficiency scores of state-owned,
joint-stock and city banks (2003-2009)
151
efficiency of CCBs. The city commercial banks have disadvantages in both traditional
deposit-loan services and non-traditional activities. The number of loans they make is very
small compared to SOCBs and JSCBs because they only serve the customers within the city
area and amount of loans demanded is quite small as well. In addition, city commercial banks
have little or no engagement in the non-traditional activities, which leads to substantial
differences of outputs between city commercial banks and SOCBs. However, the difference
of efficiency scores between the city commercial banks and joint-stock commercial banks is
smaller than state-owned commercial banks and joint-stock commercial banks. The overall
technical efficiency scores of state-owned, joint-stock and city commercial banks in China
are 0.959, 0.89 and 0.886, respectively; these figures indicate that, on average, the state-
owned commercial banks are relatively inefficient and they can further reduce their factors of
production by 4.1% by maintaining the same output level. In other words, in terms of the
joint-stock and city commercial banks in China, they can further reduce their factors of
production by 11% and 11.4%, respectively.
Based on the decomposition of technical efficiency into pure technical efficiency and scale
efficiency, the results show that the state-owned commercial banks have the highest pure
technical efficiency score, followed by the joint-stock commercial banks, while the city
commercial banks are least pure technically efficient. Compared with the pure technical
efficiency, the scale efficiency of Chinese commercial banks is higher; this indicates that the
scale efficiency contributes more than the pure technical efficiency to the overall efficiency
in the Chinese banking industry. In other words, the inefficiency of Chinese commercial
banks is attributed to the pure technical inefficiency rather than the scale inefficiency. The
results also suggest that Chinese commercial banks are pure technically inefficient and faced
with misallocation of inputs and outputs in banking operation. In other words, the Chinese
banks can improve their technical efficiency by the following ways: first, the demand of
banking services in China is large; the Chinese banking sector can decrease the deposit
interest rate, which will reduce the interest expenses and further reduce the cost of funds.
Furthermore, it is a fact that reduction of the staffs‟ salary will decrease staffs‟ working
efforts and further precede a decrease in efficiency. However, the main problem in the
Chinese banking sector is the complicated reporting system; the accumulation of redundant
staffs is the main source of higher personal expenses. In addition, the Chinese banking sector
should make relevant policy to reduce the salaries for management staffs as the salary/bonus
difference between working staff and management staff is huge in the Chinese banking
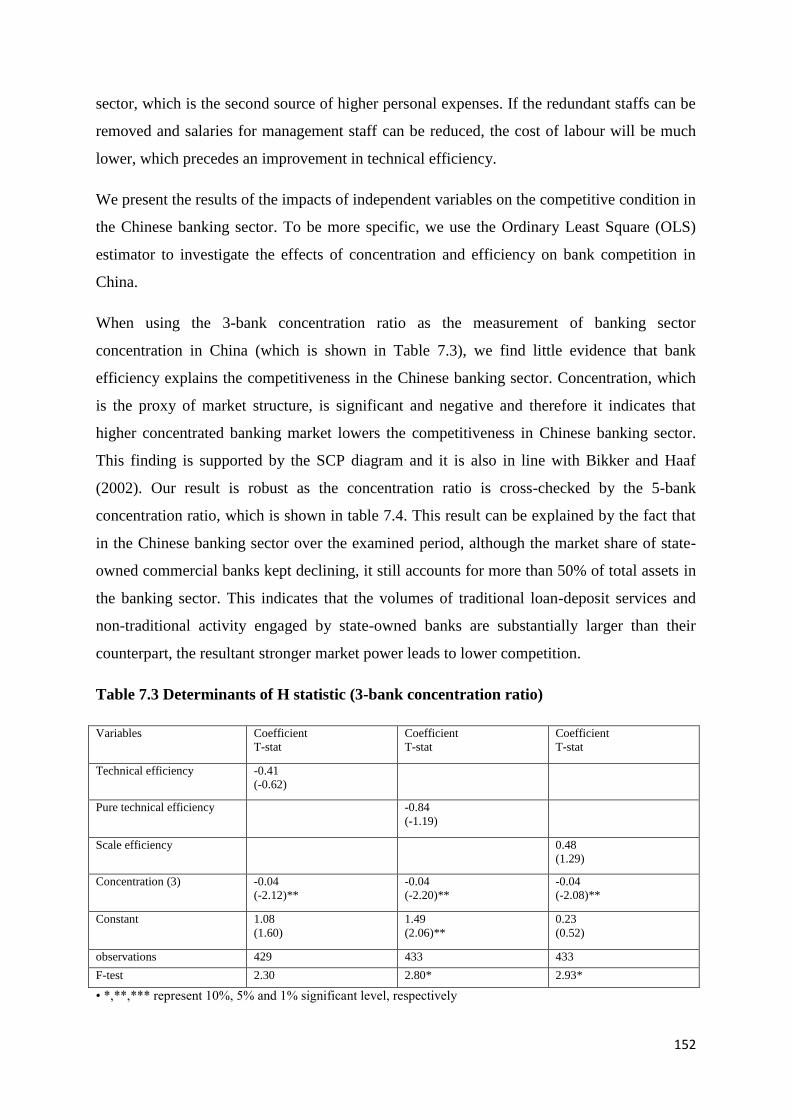
152
sector, which is the second source of higher personal expenses. If the redundant staffs can be
removed and salaries for management staff can be reduced, the cost of labour will be much
lower, which precedes an improvement in technical efficiency.
We present the results of the impacts of independent variables on the competitive condition in
the Chinese banking sector. To be more specific, we use the Ordinary Least Square (OLS)
estimator to investigate the effects of concentration and efficiency on bank competition in
China.
When using the 3-bank concentration ratio as the measurement of banking sector
concentration in China (which is shown in Table 7.3), we find little evidence that bank
efficiency explains the competitiveness in the Chinese banking sector. Concentration, which
is the proxy of market structure, is significant and negative and therefore it indicates that
higher concentrated banking market lowers the competitiveness in Chinese banking sector.
This finding is supported by the SCP diagram and it is also in line with Bikker and Haaf
(2002). Our result is robust as the concentration ratio is cross-checked by the 5-bank
concentration ratio, which is shown in table 7.4. This result can be explained by the fact that
in the Chinese banking sector over the examined period, although the market share of state-
owned commercial banks kept declining, it still accounts for more than 50% of total assets in
the banking sector. This indicates that the volumes of traditional loan-deposit services and
non-traditional activity engaged by state-owned banks are substantially larger than their
counterpart, the resultant stronger market power leads to lower competition.
Table 7.3 Determinants of H statistic (3-bank concentration ratio)
Variables Coefficient
T-stat
Coefficient
T-stat
Coefficient
T-stat
Technical efficiency -0.41
(-0.62)
Pure technical efficiency -0.84
(-1.19)
Scale efficiency 0.48
(1.29)
Concentration (3) -0.04
(-2.12)**
-0.04
(-2.20)**
-0.04
(-2.08)**
Constant 1.08
(1.60)
1.49
(2.06)**
0.23
(0.52)
observations 429 433 433
F-test 2.30 2.80* 2.93*
• *,**,*** represent 10%, 5% and 1% significant level, respectively
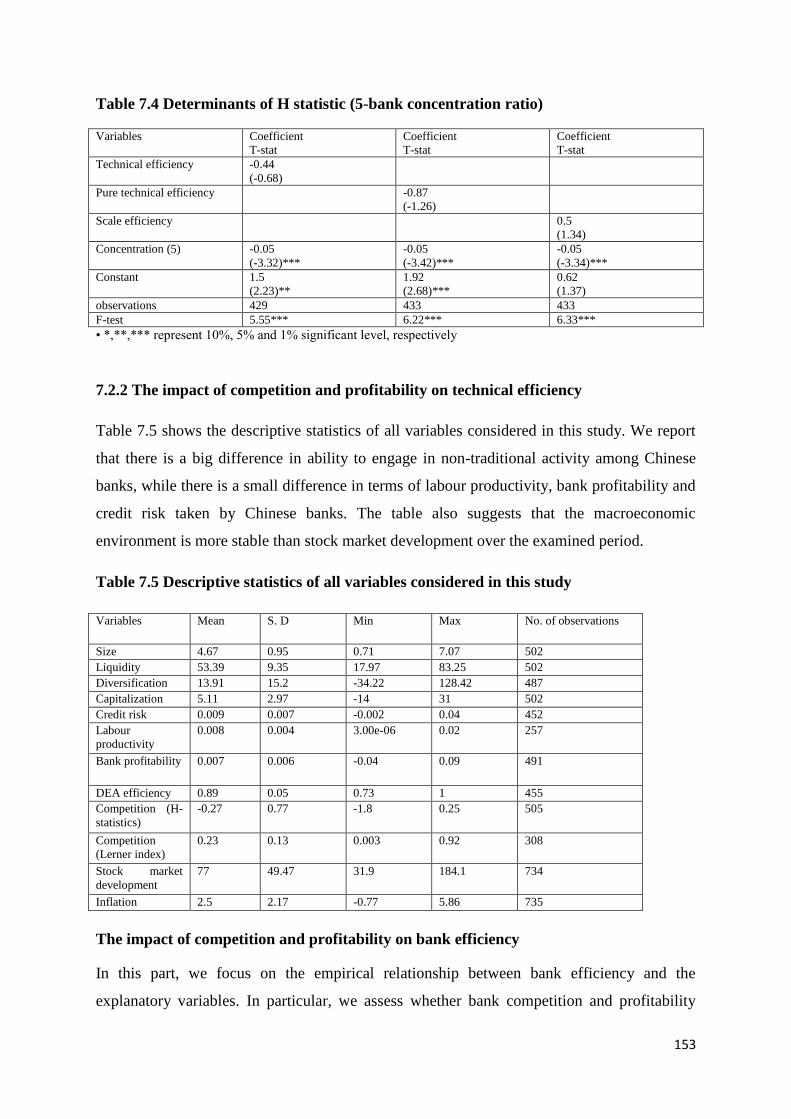
153
Table 7.4 Determinants of H statistic (5-bank concentration ratio)
Variables Coefficient
T-stat
Coefficient
T-stat
Coefficient
T-stat
Technical efficiency -0.44
(-0.68)
Pure technical efficiency -0.87
(-1.26)
Scale efficiency 0.5
(1.34)
Concentration (5) -0.05
(-3.32)***
-0.05
(-3.42)***
-0.05
(-3.34)***
Constant 1.5
(2.23)**
1.92
(2.68)***
0.62
(1.37)
observations 429 433 433
F-test 5.55*** 6.22*** 6.33***
• *,**,*** represent 10%, 5% and 1% significant level, respectively
7.2.2 The impact of competition and profitability on technical efficiency
Table 7.5 shows the descriptive statistics of all variables considered in this study. We report
that there is a big difference in ability to engage in non-traditional activity among Chinese
banks, while there is a small difference in terms of labour productivity, bank profitability and
credit risk taken by Chinese banks. The table also suggests that the macroeconomic
environment is more stable than stock market development over the examined period.
Table 7.5 Descriptive statistics of all variables considered in this study
Variables Mean S. D Min Max No. of observations
Size 4.67 0.95 0.71 7.07 502
Liquidity 53.39 9.35 17.97 83.25 502
Diversification 13.91 15.2 -34.22 128.42 487
Capitalization 5.11 2.97 -14 31 502
Credit risk 0.009 0.007 -0.002 0.04 452
Labour
productivity
0.008 0.004 3.00e-06 0.02 257
Bank profitability 0.007 0.006 -0.04 0.09 491
DEA efficiency 0.89 0.05 0.73 1 455
Competition (H-
statistics)
-0.27 0.77 -1.8 0.25 505
Competition
(Lerner index)
0.23 0.13 0.003 0.92 308
Stock market
development
77 49.47 31.9 184.1 734
Inflation 2.5 2.17 -0.77 5.86 735
The impact of competition and profitability on bank efficiency
In this part, we focus on the empirical relationship between bank efficiency and the
explanatory variables. In particular, we assess whether bank competition and profitability
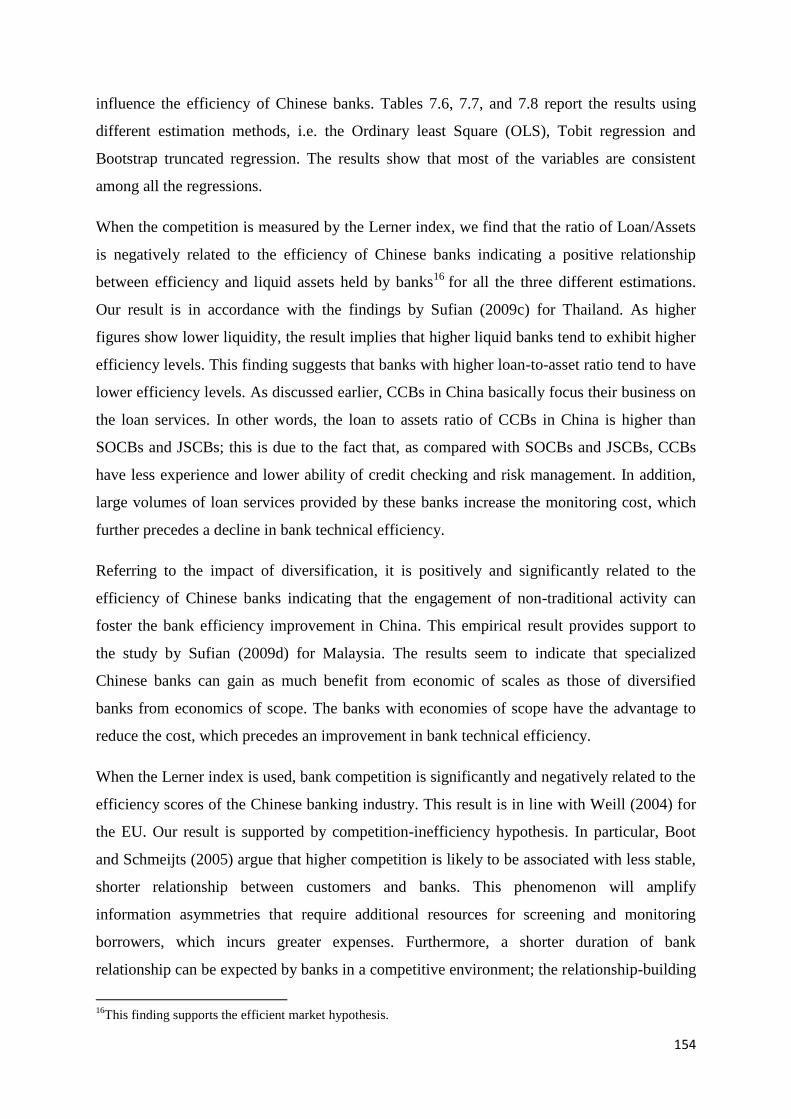
154
influence the efficiency of Chinese banks. Tables 7.6, 7.7, and 7.8 report the results using
different estimation methods, i.e. the Ordinary least Square (OLS), Tobit regression and
Bootstrap truncated regression. The results show that most of the variables are consistent
among all the regressions.
When the competition is measured by the Lerner index, we find that the ratio of Loan/Assets
is negatively related to the efficiency of Chinese banks indicating a positive relationship
between efficiency and liquid assets held by banks16
for all the three different estimations.
Our result is in accordance with the findings by Sufian (2009c) for Thailand. As higher
figures show lower liquidity, the result implies that higher liquid banks tend to exhibit higher
efficiency levels. This finding suggests that banks with higher loan-to-asset ratio tend to have
lower efficiency levels. As discussed earlier, CCBs in China basically focus their business on
the loan services. In other words, the loan to assets ratio of CCBs in China is higher than
SOCBs and JSCBs; this is due to the fact that, as compared with SOCBs and JSCBs, CCBs
have less experience and lower ability of credit checking and risk management. In addition,
large volumes of loan services provided by these banks increase the monitoring cost, which
further precedes a decline in bank technical efficiency.
Referring to the impact of diversification, it is positively and significantly related to the
efficiency of Chinese banks indicating that the engagement of non-traditional activity can
foster the bank efficiency improvement in China. This empirical result provides support to
the study by Sufian (2009d) for Malaysia. The results seem to indicate that specialized
Chinese banks can gain as much benefit from economic of scales as those of diversified
banks from economics of scope. The banks with economies of scope have the advantage to
reduce the cost, which precedes an improvement in bank technical efficiency.
When the Lerner index is used, bank competition is significantly and negatively related to the
efficiency scores of the Chinese banking industry. This result is in line with Weill (2004) for
the EU. Our result is supported by competition-inefficiency hypothesis. In particular, Boot
and Schmeijts (2005) argue that higher competition is likely to be associated with less stable,
shorter relationship between customers and banks. This phenomenon will amplify
information asymmetries that require additional resources for screening and monitoring
borrowers, which incurs greater expenses. Furthermore, a shorter duration of bank
relationship can be expected by banks in a competitive environment; the relationship-building
16
This finding supports the efficient market hypothesis.
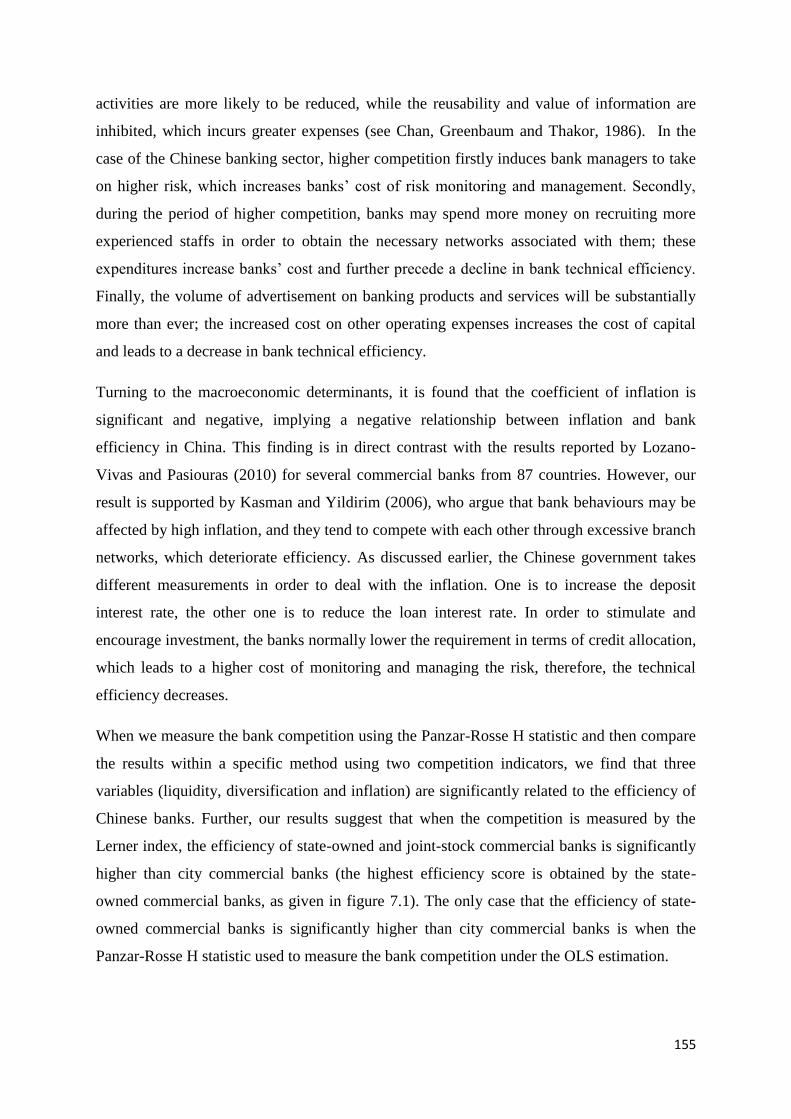
155
activities are more likely to be reduced, while the reusability and value of information are
inhibited, which incurs greater expenses (see Chan, Greenbaum and Thakor, 1986). In the
case of the Chinese banking sector, higher competition firstly induces bank managers to take
on higher risk, which increases banks‟ cost of risk monitoring and management. Secondly,
during the period of higher competition, banks may spend more money on recruiting more
experienced staffs in order to obtain the necessary networks associated with them; these
expenditures increase banks‟ cost and further precede a decline in bank technical efficiency.
Finally, the volume of advertisement on banking products and services will be substantially
more than ever; the increased cost on other operating expenses increases the cost of capital
and leads to a decrease in bank technical efficiency.
Turning to the macroeconomic determinants, it is found that the coefficient of inflation is
significant and negative, implying a negative relationship between inflation and bank
efficiency in China. This finding is in direct contrast with the results reported by Lozano-
Vivas and Pasiouras (2010) for several commercial banks from 87 countries. However, our
result is supported by Kasman and Yildirim (2006), who argue that bank behaviours may be
affected by high inflation, and they tend to compete with each other through excessive branch
networks, which deteriorate efficiency. As discussed earlier, the Chinese government takes
different measurements in order to deal with the inflation. One is to increase the deposit
interest rate, the other one is to reduce the loan interest rate. In order to stimulate and
encourage investment, the banks normally lower the requirement in terms of credit allocation,
which leads to a higher cost of monitoring and managing the risk, therefore, the technical
efficiency decreases.
When we measure the bank competition using the Panzar-Rosse H statistic and then compare
the results within a specific method using two competition indicators, we find that three
variables (liquidity, diversification and inflation) are significantly related to the efficiency of
Chinese banks. Further, our results suggest that when the competition is measured by the
Lerner index, the efficiency of state-owned and joint-stock commercial banks is significantly
higher than city commercial banks (the highest efficiency score is obtained by the state-
owned commercial banks, as given in figure 7.1). The only case that the efficiency of state-
owned commercial banks is significantly higher than city commercial banks is when the
Panzar-Rosse H statistic used to measure the bank competition under the OLS estimation.
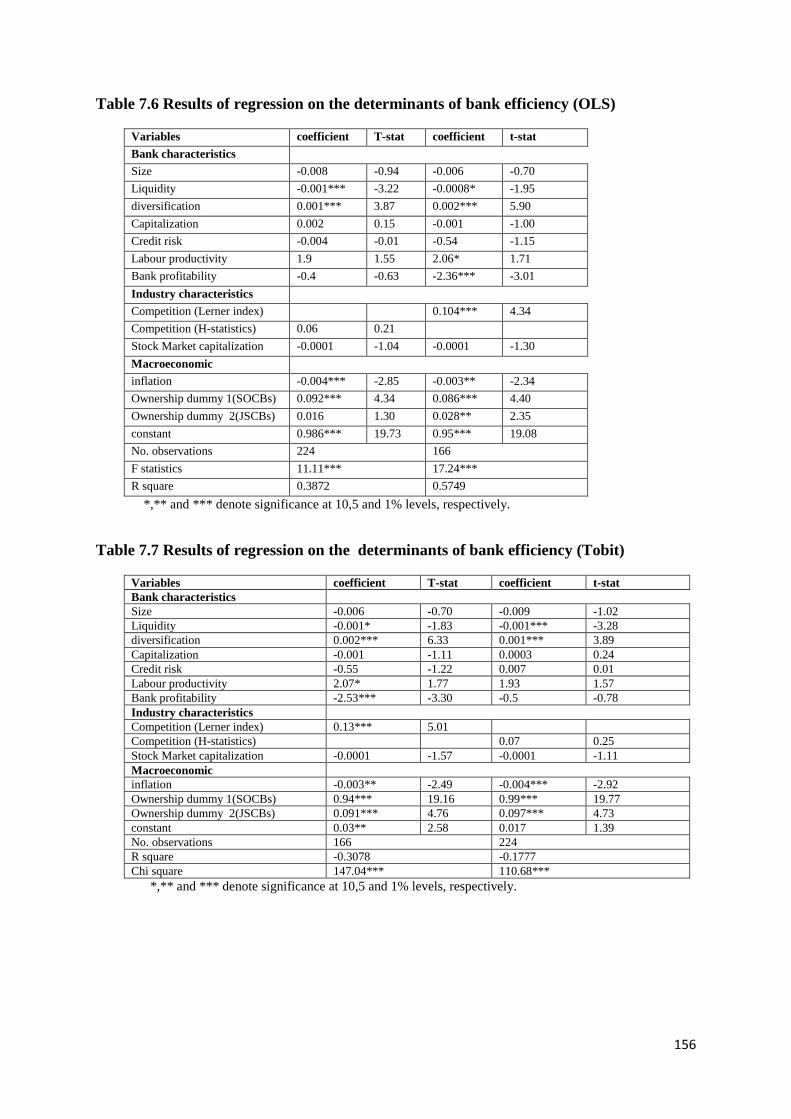
156
Table 7.6 Results of regression on the determinants of bank efficiency (OLS)
Variables coefficient T-stat coefficient t-stat
Bank characteristics
Size -0.008 -0.94 -0.006 -0.70
Liquidity -0.001*** -3.22 -0.0008* -1.95
diversification 0.001*** 3.87 0.002*** 5.90
Capitalization 0.002 0.15 -0.001 -1.00
Credit risk -0.004 -0.01 -0.54 -1.15
Labour productivity 1.9 1.55 2.06* 1.71
Bank profitability -0.4 -0.63 -2.36*** -3.01
Industry characteristics
Competition (Lerner index) 0.104*** 4.34
Competition (H-statistics) 0.06 0.21
Stock Market capitalization -0.0001 -1.04 -0.0001 -1.30
Macroeconomic
inflation -0.004*** -2.85 -0.003** -2.34
Ownership dummy 1(SOCBs) 0.092*** 4.34 0.086*** 4.40
Ownership dummy 2(JSCBs) 0.016 1.30 0.028** 2.35
constant 0.986*** 19.73 0.95*** 19.08
No. observations 224 166
F statistics 11.11*** 17.24***
R square 0.3872 0.5749
*,** and *** denote significance at 10,5 and 1% levels, respectively.
Table 7.7 Results of regression on the determinants of bank efficiency (Tobit)
Variables coefficient T-stat coefficient t-stat
Bank characteristics
Size -0.006 -0.70 -0.009 -1.02
Liquidity -0.001* -1.83 -0.001*** -3.28
diversification 0.002*** 6.33 0.001*** 3.89
Capitalization -0.001 -1.11 0.0003 0.24
Credit risk -0.55 -1.22 0.007 0.01
Labour productivity 2.07* 1.77 1.93 1.57
Bank profitability -2.53*** -3.30 -0.5 -0.78
Industry characteristics
Competition (Lerner index) 0.13*** 5.01
Competition (H-statistics) 0.07 0.25
Stock Market capitalization -0.0001 -1.57 -0.0001 -1.11
Macroeconomic
inflation -0.003** -2.49 -0.004*** -2.92
Ownership dummy 1(SOCBs) 0.94*** 19.16 0.99*** 19.77
Ownership dummy 2(JSCBs) 0.091*** 4.76 0.097*** 4.73
constant 0.03** 2.58 0.017 1.39
No. observations 166 224
R square -0.3078 -0.1777
Chi square 147.04*** 110.68***
*,** and *** denote significance at 10,5 and 1% levels, respectively.
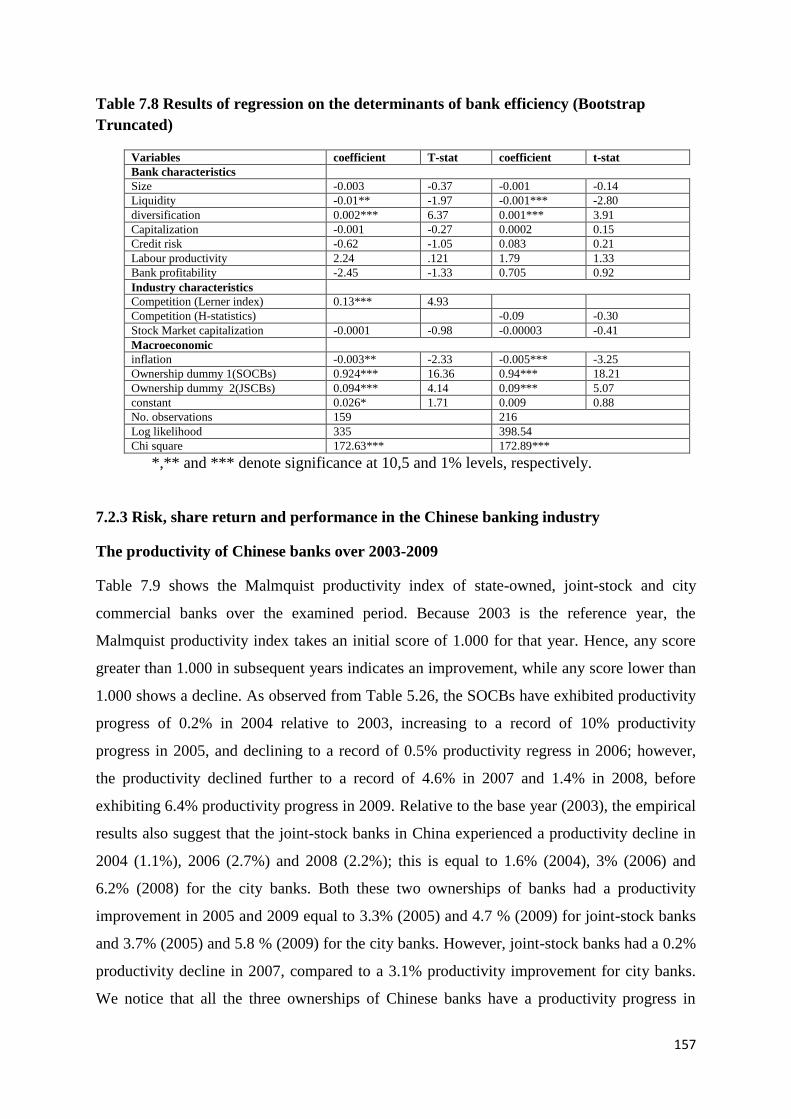
157
Table 7.8 Results of regression on the determinants of bank efficiency (Bootstrap
Truncated)
Variables coefficient T-stat coefficient t-stat
Bank characteristics
Size -0.003 -0.37 -0.001 -0.14
Liquidity -0.01** -1.97 -0.001*** -2.80
diversification 0.002*** 6.37 0.001*** 3.91
Capitalization -0.001 -0.27 0.0002 0.15
Credit risk -0.62 -1.05 0.083 0.21
Labour productivity 2.24 .121 1.79 1.33
Bank profitability -2.45 -1.33 0.705 0.92
Industry characteristics
Competition (Lerner index) 0.13*** 4.93
Competition (H-statistics) -0.09 -0.30
Stock Market capitalization -0.0001 -0.98 -0.00003 -0.41
Macroeconomic
inflation -0.003** -2.33 -0.005*** -3.25
Ownership dummy 1(SOCBs) 0.924*** 16.36 0.94*** 18.21
Ownership dummy 2(JSCBs) 0.094*** 4.14 0.09*** 5.07
constant 0.026* 1.71 0.009 0.88
No. observations 159 216
Log likelihood 335 398.54
Chi square 172.63*** 172.89***
*,** and *** denote significance at 10,5 and 1% levels, respectively.
7.2.3 Risk, share return and performance in the Chinese banking industry
The productivity of Chinese banks over 2003-2009
Table 7.9 shows the Malmquist productivity index of state-owned, joint-stock and city
commercial banks over the examined period. Because 2003 is the reference year, the
Malmquist productivity index takes an initial score of 1.000 for that year. Hence, any score
greater than 1.000 in subsequent years indicates an improvement, while any score lower than
1.000 shows a decline. As observed from Table 5.26, the SOCBs have exhibited productivity
progress of 0.2% in 2004 relative to 2003, increasing to a record of 10% productivity
progress in 2005, and declining to a record of 0.5% productivity regress in 2006; however,
the productivity declined further to a record of 4.6% in 2007 and 1.4% in 2008, before
exhibiting 6.4% productivity progress in 2009. Relative to the base year (2003), the empirical
results also suggest that the joint-stock banks in China experienced a productivity decline in
2004 (1.1%), 2006 (2.7%) and 2008 (2.2%); this is equal to 1.6% (2004), 3% (2006) and
6.2% (2008) for the city banks. Both these two ownerships of banks had a productivity
improvement in 2005 and 2009 equal to 3.3% (2005) and 4.7 % (2009) for joint-stock banks
and 3.7% (2005) and 5.8 % (2009) for the city banks. However, joint-stock banks had a 0.2%
productivity decline in 2007, compared to a 3.1% productivity improvement for city banks.
We notice that all the three ownerships of Chinese banks have a productivity progress in
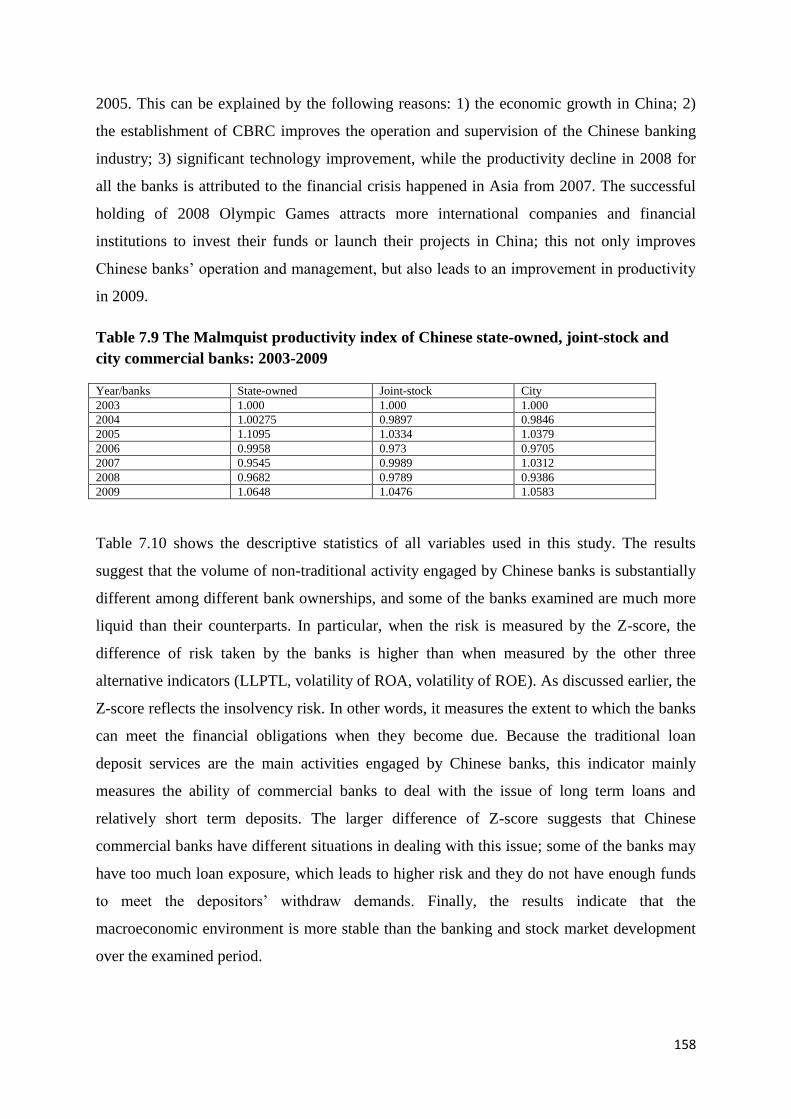
158
2005. This can be explained by the following reasons: 1) the economic growth in China; 2)
the establishment of CBRC improves the operation and supervision of the Chinese banking
industry; 3) significant technology improvement, while the productivity decline in 2008 for
all the banks is attributed to the financial crisis happened in Asia from 2007. The successful
holding of 2008 Olympic Games attracts more international companies and financial
institutions to invest their funds or launch their projects in China; this not only improves
Chinese banks‟ operation and management, but also leads to an improvement in productivity
in 2009.
Table 7.9 The Malmquist productivity index of Chinese state-owned, joint-stock and
city commercial banks: 2003-2009
Year/banks State-owned Joint-stock City
2003 1.000 1.000 1.000
2004 1.00275 0.9897 0.9846
2005 1.1095 1.0334 1.0379
2006 0.9958 0.973 0.9705
2007 0.9545 0.9989 1.0312
2008 0.9682 0.9789 0.9386
2009 1.0648 1.0476 1.0583
Table 7.10 shows the descriptive statistics of all variables used in this study. The results
suggest that the volume of non-traditional activity engaged by Chinese banks is substantially
different among different bank ownerships, and some of the banks examined are much more
liquid than their counterparts. In particular, when the risk is measured by the Z-score, the
difference of risk taken by the banks is higher than when measured by the other three
alternative indicators (LLPTL, volatility of ROA, volatility of ROE). As discussed earlier, the
Z-score reflects the insolvency risk. In other words, it measures the extent to which the banks
can meet the financial obligations when they become due. Because the traditional loan
deposit services are the main activities engaged by Chinese banks, this indicator mainly
measures the ability of commercial banks to deal with the issue of long term loans and
relatively short term deposits. The larger difference of Z-score suggests that Chinese
commercial banks have different situations in dealing with this issue; some of the banks may
have too much loan exposure, which leads to higher risk and they do not have enough funds
to meet the depositors‟ withdraw demands. Finally, the results indicate that the
macroeconomic environment is more stable than the banking and stock market development
over the examined period.
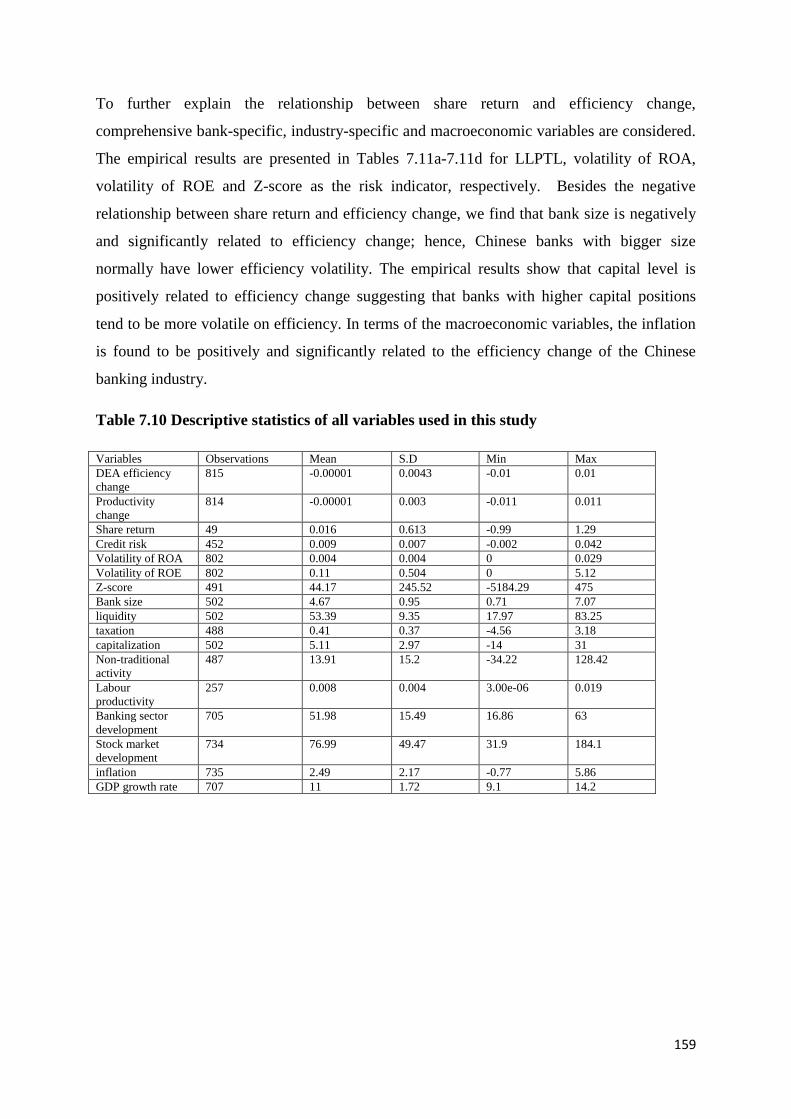
159
To further explain the relationship between share return and efficiency change,
comprehensive bank-specific, industry-specific and macroeconomic variables are considered.
The empirical results are presented in Tables 7.11a-7.11d for LLPTL, volatility of ROA,
volatility of ROE and Z-score as the risk indicator, respectively. Besides the negative
relationship between share return and efficiency change, we find that bank size is negatively
and significantly related to efficiency change; hence, Chinese banks with bigger size
normally have lower efficiency volatility. The empirical results show that capital level is
positively related to efficiency change suggesting that banks with higher capital positions
tend to be more volatile on efficiency. In terms of the macroeconomic variables, the inflation
is found to be positively and significantly related to the efficiency change of the Chinese
banking industry.
Table 7.10 Descriptive statistics of all variables used in this study
Variables Observations Mean S.D Min Max
DEA efficiency
change
815 -0.00001 0.0043 -0.01 0.01
Productivity
change
814 -0.00001 0.003 -0.011 0.011
Share return 49 0.016 0.613 -0.99 1.29
Credit risk 452 0.009 0.007 -0.002 0.042
Volatility of ROA 802 0.004 0.004 0 0.029
Volatility of ROE 802 0.11 0.504 0 5.12
Z-score 491 44.17 245.52 -5184.29 475
Bank size 502 4.67 0.95 0.71 7.07
liquidity 502 53.39 9.35 17.97 83.25
taxation 488 0.41 0.37 -4.56 3.18
capitalization 502 5.11 2.97 -14 31
Non-traditional
activity
487 13.91 15.2 -34.22 128.42
Labour
productivity
257 0.008 0.004 3.00e-06 0.019
Banking sector
development
705 51.98 15.49 16.86 63
Stock market
development
734 76.99 49.47 31.9 184.1
inflation 735 2.49 2.17 -0.77 5.86
GDP growth rate 707 11 1.72 9.1 14.2
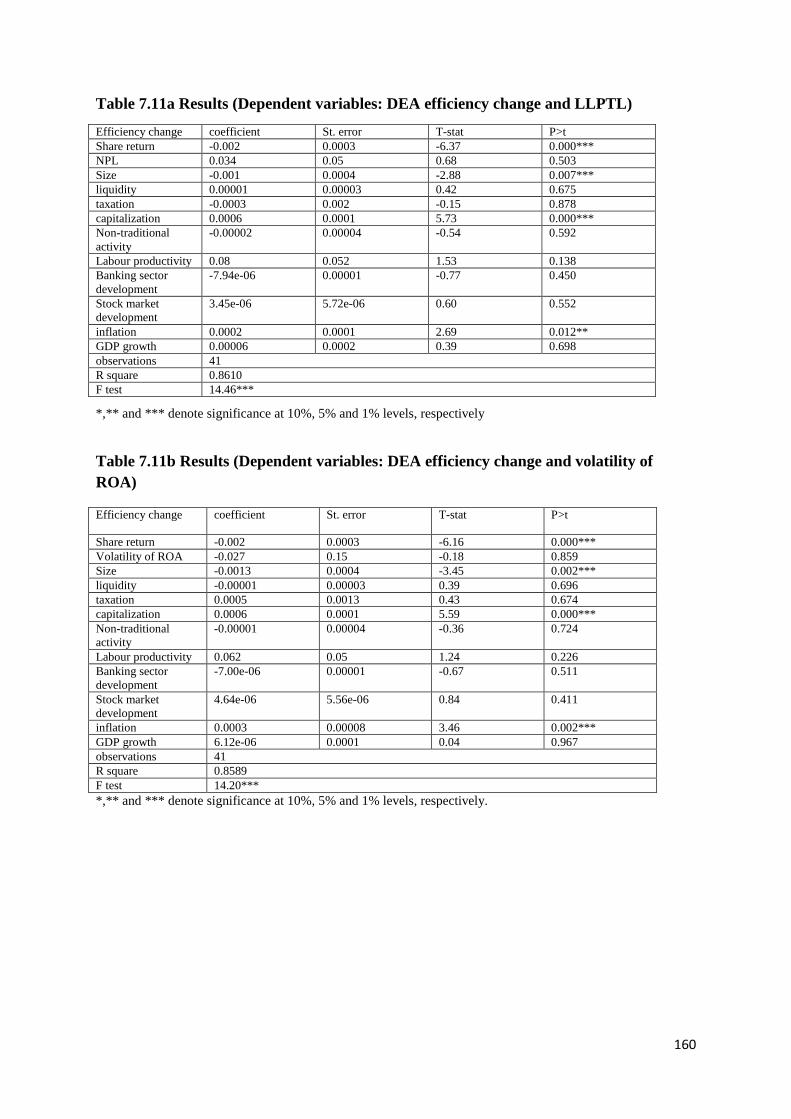
160
Table 7.11a Results (Dependent variables: DEA efficiency change and LLPTL)
*,** and *** denote significance at 10%, 5% and 1% levels, respectively
Table 7.11b Results (Dependent variables: DEA efficiency change and volatility of
ROA)
Efficiency change coefficient St. error T-stat P>t
Share return -0.002 0.0003 -6.16 0.000***
Volatility of ROA -0.027 0.15 -0.18 0.859
Size -0.0013 0.0004 -3.45 0.002***
liquidity -0.00001 0.00003 0.39 0.696
taxation 0.0005 0.0013 0.43 0.674
capitalization 0.0006 0.0001 5.59 0.000***
Non-traditional
activity
-0.00001 0.00004 -0.36 0.724
Labour productivity 0.062 0.05 1.24 0.226
Banking sector
development
-7.00e-06 0.00001 -0.67 0.511
Stock market
development
4.64e-06 5.56e-06 0.84 0.411
inflation 0.0003 0.00008 3.46 0.002***
GDP growth 6.12e-06 0.0001 0.04 0.967
observations 41
R square 0.8589
F test 14.20***
*,** and *** denote significance at 10%, 5% and 1% levels, respectively.
Efficiency change coefficient St. error T-stat P>t
Share return -0.002 0.0003 -6.37 0.000***
NPL 0.034 0.05 0.68 0.503
Size -0.001 0.0004 -2.88 0.007***
liquidity 0.00001 0.00003 0.42 0.675
taxation -0.0003 0.002 -0.15 0.878
capitalization 0.0006 0.0001 5.73 0.000***
Non-traditional
activity
-0.00002 0.00004 -0.54 0.592
Labour productivity 0.08 0.052 1.53 0.138
Banking sector
development
-7.94e-06 0.00001 -0.77 0.450
Stock market
development
3.45e-06 5.72e-06 0.60 0.552
inflation 0.0002 0.0001 2.69 0.012**
GDP growth 0.00006 0.0002 0.39 0.698
observations 41
R square 0.8610
F test 14.46***
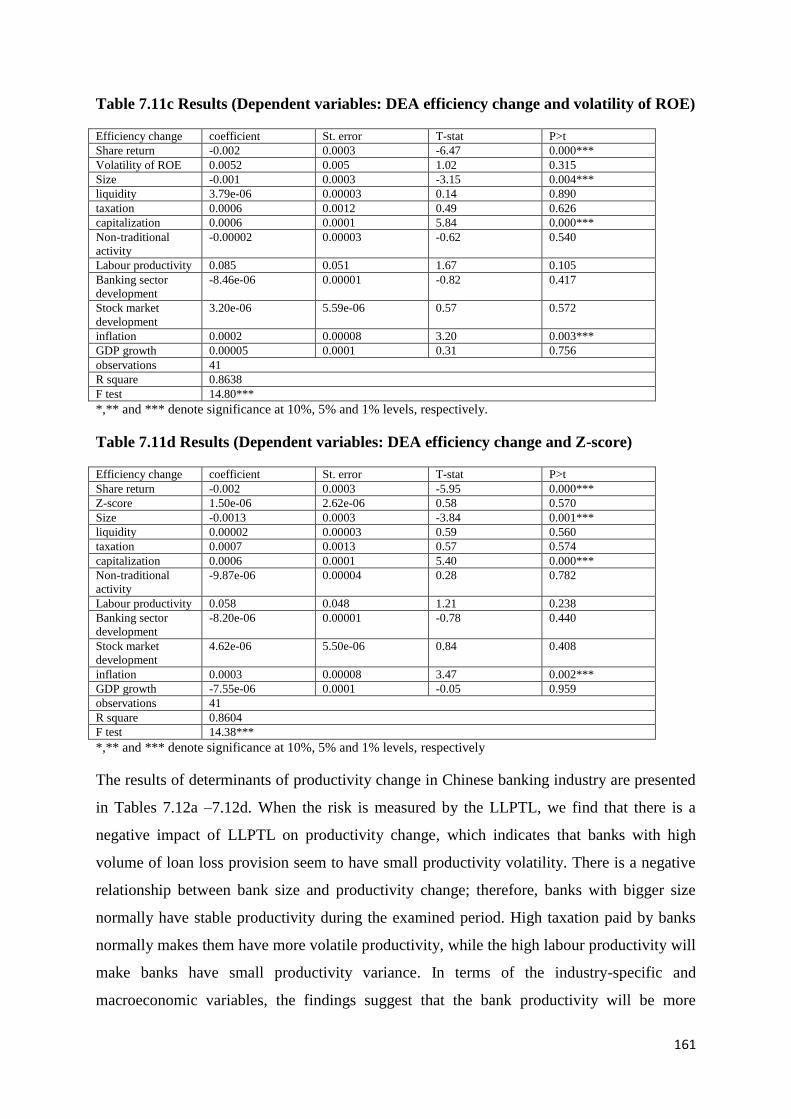
161
Table 7.11c Results (Dependent variables: DEA efficiency change and volatility of ROE)
Efficiency change coefficient St. error T-stat P>t
Share return -0.002 0.0003 -6.47 0.000***
Volatility of ROE 0.0052 0.005 1.02 0.315
Size -0.001 0.0003 -3.15 0.004***
liquidity 3.79e-06 0.00003 0.14 0.890
taxation 0.0006 0.0012 0.49 0.626
capitalization 0.0006 0.0001 5.84 0.000***
Non-traditional
activity
-0.00002 0.00003 -0.62 0.540
Labour productivity 0.085 0.051 1.67 0.105
Banking sector
development
-8.46e-06 0.00001 -0.82 0.417
Stock market
development
3.20e-06 5.59e-06 0.57 0.572
inflation 0.0002 0.00008 3.20 0.003***
GDP growth 0.00005 0.0001 0.31 0.756
observations 41
R square 0.8638
F test 14.80***
*,** and *** denote significance at 10%, 5% and 1% levels, respectively.
Table 7.11d Results (Dependent variables: DEA efficiency change and Z-score)
Efficiency change coefficient St. error T-stat P>t
Share return -0.002 0.0003 -5.95 0.000***
Z-score 1.50e-06 2.62e-06 0.58 0.570
Size -0.0013 0.0003 -3.84 0.001***
liquidity 0.00002 0.00003 0.59 0.560
taxation 0.0007 0.0013 0.57 0.574
capitalization 0.0006 0.0001 5.40 0.000***
Non-traditional
activity
-9.87e-06 0.00004 0.28 0.782
Labour productivity 0.058 0.048 1.21 0.238
Banking sector
development
-8.20e-06 0.00001 -0.78 0.440
Stock market
development
4.62e-06 5.50e-06 0.84 0.408
inflation 0.0003 0.00008 3.47 0.002***
GDP growth -7.55e-06 0.0001 -0.05 0.959
observations 41
R square 0.8604
F test 14.38***
*,** and *** denote significance at 10%, 5% and 1% levels, respectively
The results of determinants of productivity change in Chinese banking industry are presented
in Tables 7.12a –7.12d. When the risk is measured by the LLPTL, we find that there is a
negative impact of LLPTL on productivity change, which indicates that banks with high
volume of loan loss provision seem to have small productivity volatility. There is a negative
relationship between bank size and productivity change; therefore, banks with bigger size
normally have stable productivity during the examined period. High taxation paid by banks
normally makes them have more volatile productivity, while the high labour productivity will
make banks have small productivity variance. In terms of the industry-specific and
macroeconomic variables, the findings suggest that the bank productivity will be more
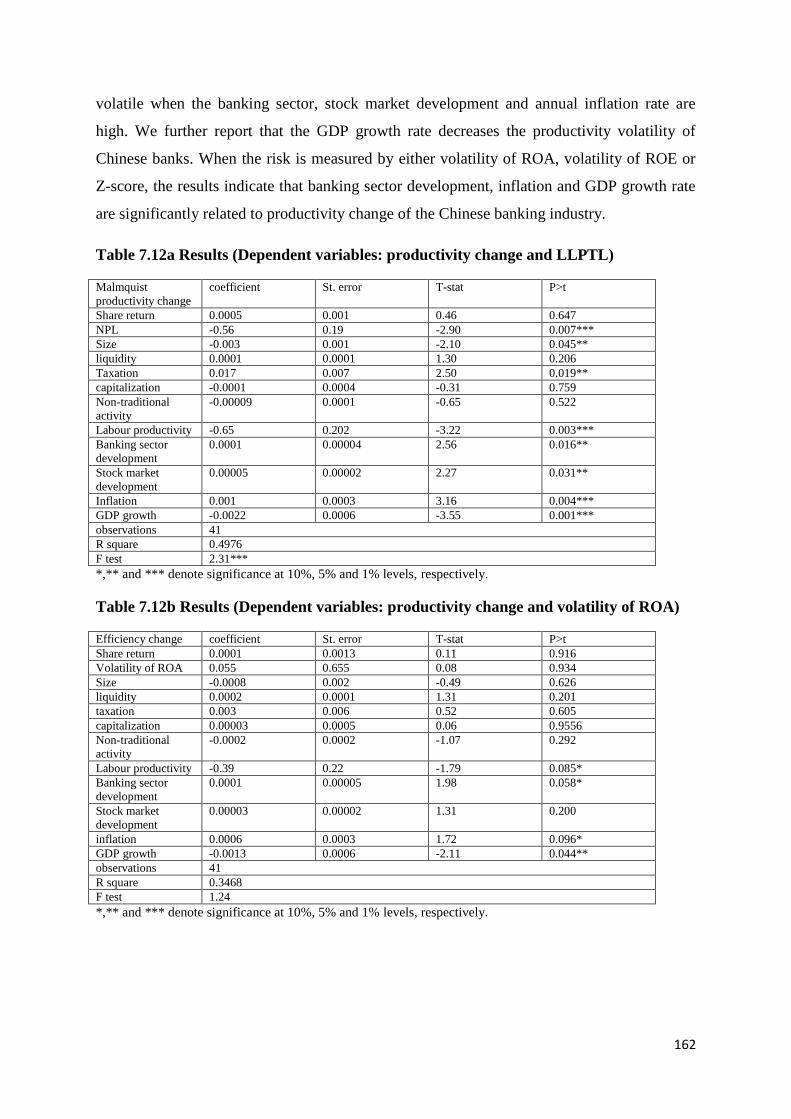
162
volatile when the banking sector, stock market development and annual inflation rate are
high. We further report that the GDP growth rate decreases the productivity volatility of
Chinese banks. When the risk is measured by either volatility of ROA, volatility of ROE or
Z-score, the results indicate that banking sector development, inflation and GDP growth rate
are significantly related to productivity change of the Chinese banking industry.
Table 7.12a Results (Dependent variables: productivity change and LLPTL)
Malmquist
productivity change
coefficient St. error T-stat P>t
Share return 0.0005 0.001 0.46 0.647
NPL -0.56 0.19 -2.90 0.007***
Size -0.003 0.001 -2.10 0.045**
liquidity 0.0001 0.0001 1.30 0.206
Taxation 0.017 0.007 2.50 0.019**
capitalization -0.0001 0.0004 -0.31 0.759
Non-traditional
activity
-0.00009 0.0001 -0.65 0.522
Labour productivity -0.65 0.202 -3.22 0.003***
Banking sector
development
0.0001 0.00004 2.56 0.016**
Stock market
development
0.00005 0.00002 2.27 0.031**
Inflation 0.001 0.0003 3.16 0.004***
GDP growth -0.0022 0.0006 -3.55 0.001***
observations 41
R square 0.4976
F test 2.31***
*,** and *** denote significance at 10%, 5% and 1% levels, respectively.
Table 7.12b Results (Dependent variables: productivity change and volatility of ROA)
Efficiency change coefficient St. error T-stat P>t
Share return 0.0001 0.0013 0.11 0.916
Volatility of ROA 0.055 0.655 0.08 0.934
Size -0.0008 0.002 -0.49 0.626
liquidity 0.0002 0.0001 1.31 0.201
taxation 0.003 0.006 0.52 0.605
capitalization 0.00003 0.0005 0.06 0.9556
Non-traditional
activity
-0.0002 0.0002 -1.07 0.292
Labour productivity -0.39 0.22 -1.79 0.085*
Banking sector
development
0.0001 0.00005 1.98 0.058*
Stock market
development
0.00003 0.00002 1.31 0.200
inflation 0.0006 0.0003 1.72 0.096*
GDP growth -0.0013 0.0006 -2.11 0.044**
observations 41
R square 0.3468
F test 1.24
*,** and *** denote significance at 10%, 5% and 1% levels, respectively.
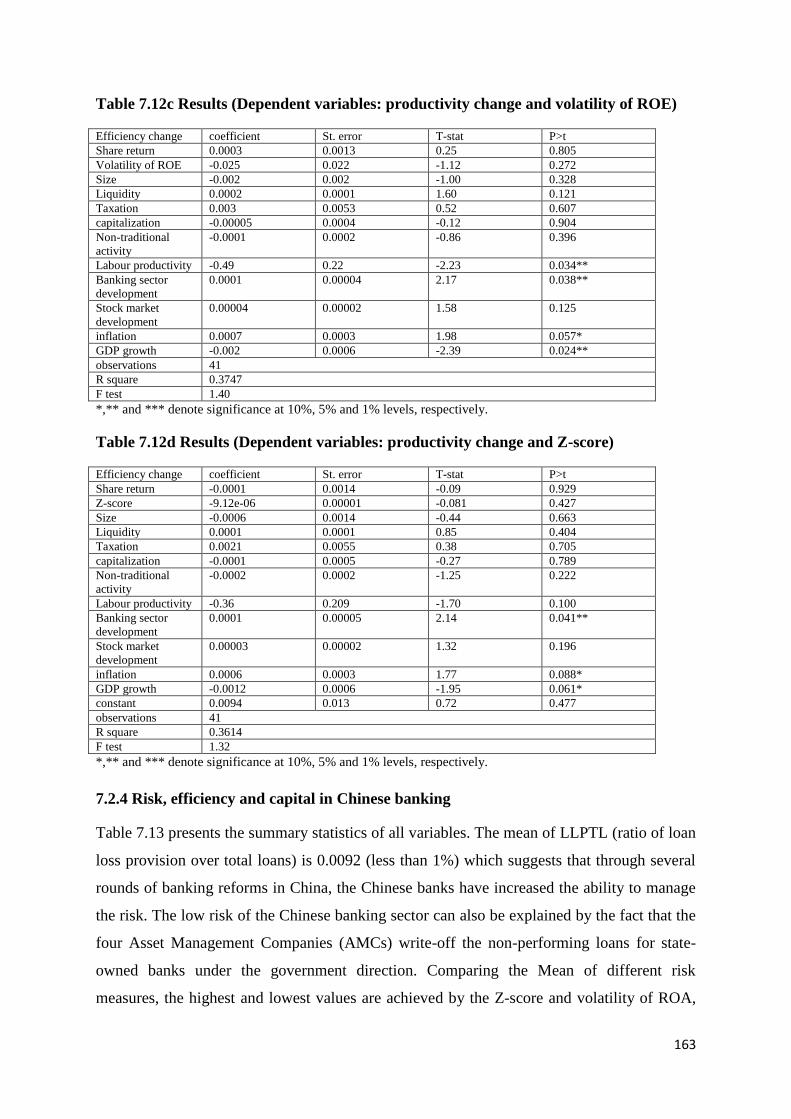
163
Table 7.12c Results (Dependent variables: productivity change and volatility of ROE)
Efficiency change coefficient St. error T-stat P>t
Share return 0.0003 0.0013 0.25 0.805
Volatility of ROE -0.025 0.022 -1.12 0.272
Size -0.002 0.002 -1.00 0.328
Liquidity 0.0002 0.0001 1.60 0.121
Taxation 0.003 0.0053 0.52 0.607
capitalization -0.00005 0.0004 -0.12 0.904
Non-traditional
activity
-0.0001 0.0002 -0.86 0.396
Labour productivity -0.49 0.22 -2.23 0.034**
Banking sector
development
0.0001 0.00004 2.17 0.038**
Stock market
development
0.00004 0.00002 1.58 0.125
inflation 0.0007 0.0003 1.98 0.057*
GDP growth -0.002 0.0006 -2.39 0.024**
observations 41
R square 0.3747
F test 1.40
*,** and *** denote significance at 10%, 5% and 1% levels, respectively.
Table 7.12d Results (Dependent variables: productivity change and Z-score)
Efficiency change coefficient St. error T-stat P>t
Share return -0.0001 0.0014 -0.09 0.929
Z-score -9.12e-06 0.00001 -0.081 0.427
Size -0.0006 0.0014 -0.44 0.663
Liquidity 0.0001 0.0001 0.85 0.404
Taxation 0.0021 0.0055 0.38 0.705
capitalization -0.0001 0.0005 -0.27 0.789
Non-traditional
activity
-0.0002 0.0002 -1.25 0.222
Labour productivity -0.36 0.209 -1.70 0.100
Banking sector
development
0.0001 0.00005 2.14 0.041**
Stock market
development
0.00003 0.00002 1.32 0.196
inflation 0.0006 0.0003 1.77 0.088*
GDP growth -0.0012 0.0006 -1.95 0.061*
constant 0.0094 0.013 0.72 0.477
observations 41
R square 0.3614
F test 1.32
*,** and *** denote significance at 10%, 5% and 1% levels, respectively.
7.2.4 Risk, efficiency and capital in Chinese banking
Table 7.13 presents the summary statistics of all variables. The mean of LLPTL (ratio of loan
loss provision over total loans) is 0.0092 (less than 1%) which suggests that through several
rounds of banking reforms in China, the Chinese banks have increased the ability to manage
the risk. The low risk of the Chinese banking sector can also be explained by the fact that the
four Asset Management Companies (AMCs) write-off the non-performing loans for state-
owned banks under the government direction. Comparing the Mean of different risk
measures, the highest and lowest values are achieved by the Z-score and volatility of ROA,
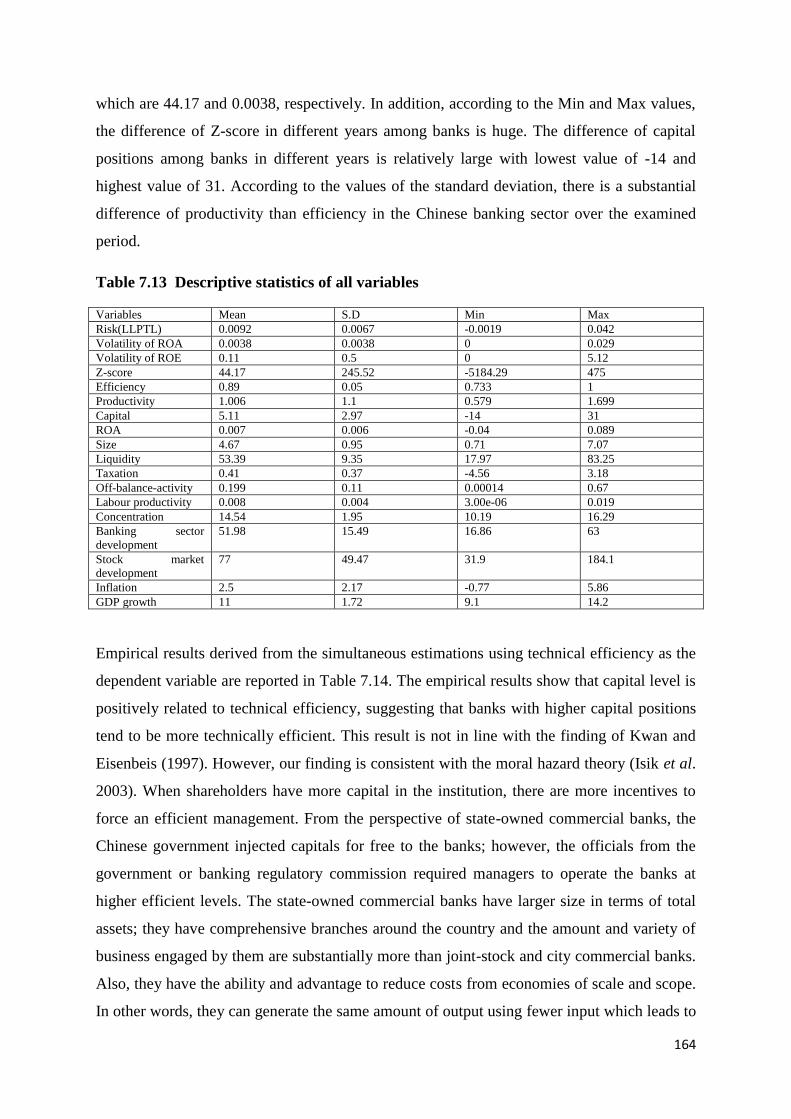
164
which are 44.17 and 0.0038, respectively. In addition, according to the Min and Max values,
the difference of Z-score in different years among banks is huge. The difference of capital
positions among banks in different years is relatively large with lowest value of -14 and
highest value of 31. According to the values of the standard deviation, there is a substantial
difference of productivity than efficiency in the Chinese banking sector over the examined
period.
Table 7.13 Descriptive statistics of all variables
Variables Mean S.D Min Max
Risk(LLPTL) 0.0092 0.0067 -0.0019 0.042
Volatility of ROA 0.0038 0.0038 0 0.029
Volatility of ROE 0.11 0.5 0 5.12
Z-score 44.17 245.52 -5184.29 475
Efficiency 0.89 0.05 0.733 1
Productivity 1.006 1.1 0.579 1.699
Capital 5.11 2.97 -14 31
ROA 0.007 0.006 -0.04 0.089
Size 4.67 0.95 0.71 7.07
Liquidity 53.39 9.35 17.97 83.25
Taxation 0.41 0.37 -4.56 3.18
Off-balance-activity 0.199 0.11 0.00014 0.67
Labour productivity 0.008 0.004 3.00e-06 0.019
Concentration 14.54 1.95 10.19 16.29
Banking sector
development
51.98 15.49 16.86 63
Stock market
development
77 49.47 31.9 184.1
Inflation 2.5 2.17 -0.77 5.86
GDP growth 11 1.72 9.1 14.2
Empirical results derived from the simultaneous estimations using technical efficiency as the
dependent variable are reported in Table 7.14. The empirical results show that capital level is
positively related to technical efficiency, suggesting that banks with higher capital positions
tend to be more technically efficient. This result is not in line with the finding of Kwan and
Eisenbeis (1997). However, our finding is consistent with the moral hazard theory (Isik et al.
2003). When shareholders have more capital in the institution, there are more incentives to
force an efficient management. From the perspective of state-owned commercial banks, the
Chinese government injected capitals for free to the banks; however, the officials from the
government or banking regulatory commission required managers to operate the banks at
higher efficient levels. The state-owned commercial banks have larger size in terms of total
assets; they have comprehensive branches around the country and the amount and variety of
business engaged by them are substantially more than joint-stock and city commercial banks.
Also, they have the ability and advantage to reduce costs from economies of scale and scope.
In other words, they can generate the same amount of output using fewer input which leads to
165
higher efficiency. In terms of the industry-specific variables, the results indicate that more
concentrated banking market as well as developed banking sector precedes a decrease in
technical efficiency of Chinese banking industry. That is, in a highly concentrated market,
bank managers have less incentive to improve efficiency. Further, in a more developed
banking sector in which there is an inelastic demand for banking products, bank managers
contribute less efforts in increasing the efficiency. The positive relationship between GDP
growth and efficiency is confirmed by Fiordelisi et al. (2011b) for Europe. The positive
impact of GDP growth rate on efficiency can be explained by the following reasons: first,
during the period of economic boom, investment is growing substantially and the increased
volumes of traditional and non-traditional activities give banks opportunities to obtain
economies of scale and economies of scope. The cost reduction leads to an improvement in
technical efficiency. Furthermore, as discussed earlier, the economic boom not only increases
the volume of loan business, but improves the quality of borrowers; the reduction in the
default rate leads to a decrease in the cost of monitoring the risk, therefore, the technical
efficiency is improved. Finally, higher inflation leads to higher technical efficiency in the
Chinese banking industry. This can be explained by the fact that in the inflation environment,
the amount of depositors will decrease because of the erosion on the value of money. In order
to engage in more activities to obtain higher profit and have stronger competitive power, the
bank managers tend to contribute more effort to increase the bank efficiency.
We find that banks with higher efficiency normally have higher capital levels, which is in line
with the finding of Fiordelisi et al. (2011b). In the Chinese banking sector, banks with higher
efficiency normally produce higher outputs due to the fact that the differences of inputs
among Chinese banks are not as big as outputs. Furthermore, as the most important
component of banking output, Chinese banks with higher efficiency normally have higher
loan exposure, which leads to a higher degree of risk, capital works as a cushion to absorb the
potential risk. Furthermore, the results indicate that banks with larger size (in terms of total
assets) have lower capital positions. This result can be explained by the fact that large banks
(state-owned commercial banks) have the ability to reduce the cost from the economies of
scale; the resulted reduction in cost leads to better performance and lower risk. This is due to
the fact that the capital is used to absorb the potential risk; therefore, the banks with lower
risk do not need higher levels of capital, while banks in a highly concentrated and developed
banking sector are normally better capitalized. As reported previously, the higher
concentrated banking market and development of banking sector lead to a decline in bank
166
efficiency. Hence, bank managers normally balance the higher cost with higher level of
capitalization. In terms of the macroeconomic determinants of bank capital, inflation is found
to be negatively related to the level of capitalization in the Chinese banking sector, which is
in line with Hortlund (2005).
Table 7.15 reports the results of the relationship among bank capital, pure technical
efficiency and risk of Chinese banking. The results show that most of the variables are
consistent with the findings in Table 5.31. However, when the relationship between capital,
risk and scale efficiency is examined (Table 7.16), the findings show that bank size and
liquidity have negative impacts on the levels of capitalization of Chinese banks, while off-
balance sheet activity, bank concentration, development of banking and stock market are
positively related to bank capital. The impact of size on the level of capitalization has been
explained; while the negative impact liquidity on capitalization can be explained by the fact
that higher volumes of loans made by Chinese banks increases the possibility of loan default
(the capital works as a cushion to absorb the risk). In a higher concentrated banking market
(and higher developed stock markets), the Chinese banks should take on higher risk in order
to obtain higher profits, which is in line with the competition-stability hypothesis; the
Chinese government will inject capital to the banks to counterbalance the risk. Further,
Chinese banks still lack the ability and experience in engaging in the off-balance-sheet
activities; the higher volume of off-balance-sheet activity involves higher risk, capital plays
an important role in absorbing the risk. We further report that banks with larger size normally
have higher scale efficiency and higher liquidity levels of Chinese banks precede declines in
scale efficiency. This result indicates that the SOCBs are operated in a more optimal scale
and Chinese banks are encouraged to increase the volumes of loan business under proper risk
management.
In addition, Table 7.17 shows the results using the Malmquist productivity index, instead of
the efficiency, as an explanatory variable. The banking sector and stock market development
are significantly and negatively related to bank productivity; this implies that more developed
banking and stock markets precede decreases in banks‟ productivity in China. The higher
developed banking sector increases the demand for bank products and services, supposing
that the supply of banking products and services, does not change. This may increase the
price for banks to provide products and services, hence, the profit will be higher. The higher
profitability earned by banks induces managers to have less incentive in increasing
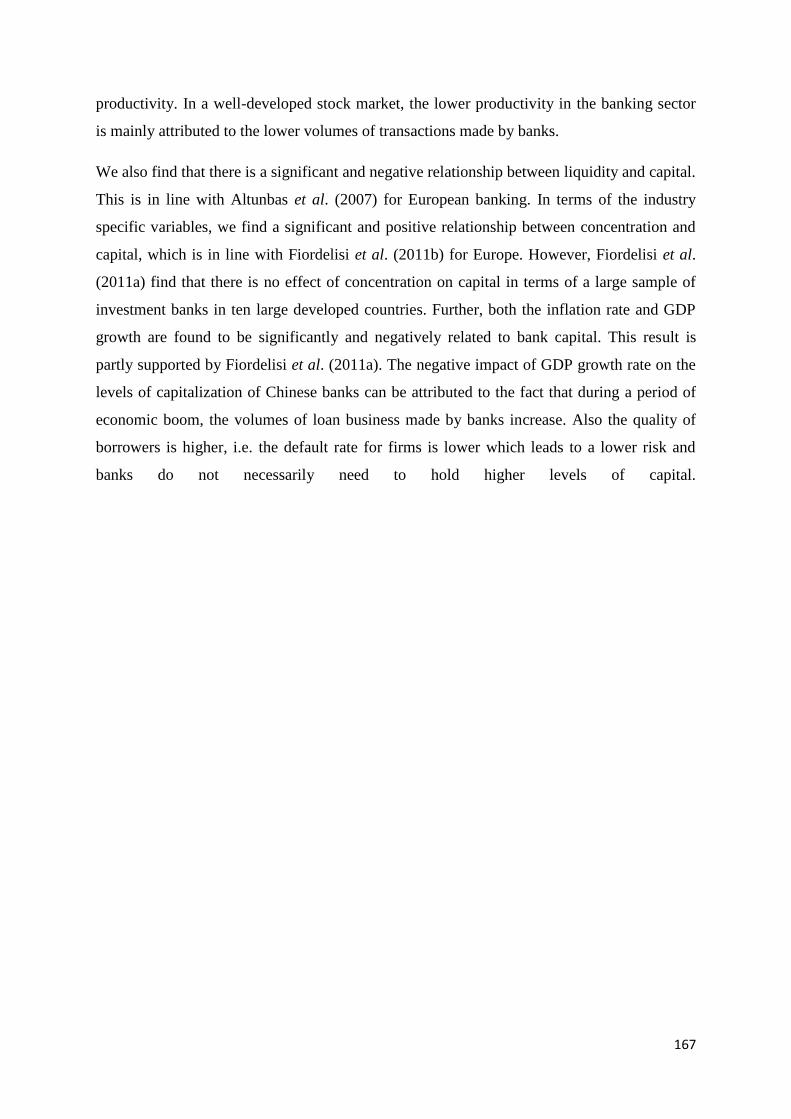
167
productivity. In a well-developed stock market, the lower productivity in the banking sector
is mainly attributed to the lower volumes of transactions made by banks.
We also find that there is a significant and negative relationship between liquidity and capital.
This is in line with Altunbas et al. (2007) for European banking. In terms of the industry
specific variables, we find a significant and positive relationship between concentration and
capital, which is in line with Fiordelisi et al. (2011b) for Europe. However, Fiordelisi et al.
(2011a) find that there is no effect of concentration on capital in terms of a large sample of
investment banks in ten large developed countries. Further, both the inflation rate and GDP
growth are found to be significantly and negatively related to bank capital. This result is
partly supported by Fiordelisi et al. (2011a). The negative impact of GDP growth rate on the
levels of capitalization of Chinese banks can be attributed to the fact that during a period of
economic boom, the volumes of loan business made by banks increase. Also the quality of
borrowers is higher, i.e. the default rate for firms is lower which leads to a lower risk and
banks do not necessarily need to hold higher levels of capital.
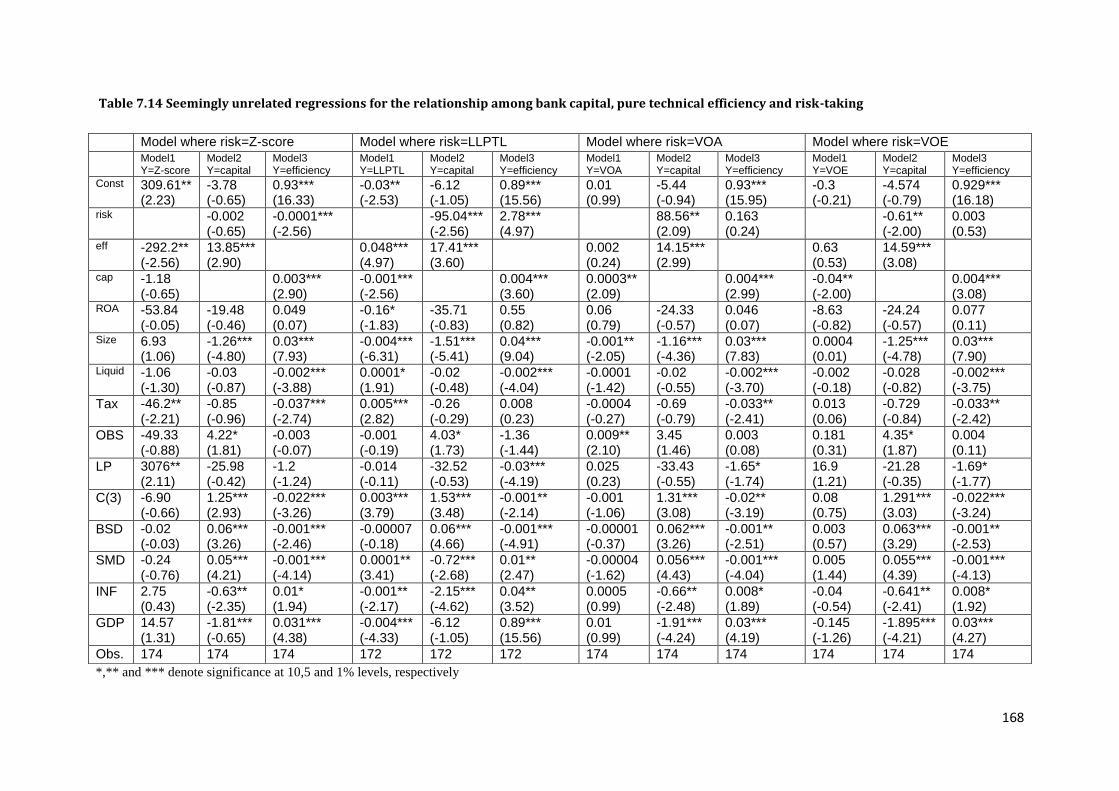
168
Table 7.14 Seemingly unrelated regressions for the relationship among bank capital, pure technical efficiency and risk-taking
*,** and *** denote significance at 10,5 and 1% levels, respectively
Model where risk=Z-score Model where risk=LLPTL Model where risk=VOA Model where risk=VOE
Model1 Y=Z-score
Model2 Y=capital
Model3 Y=efficiency
Model1 Y=LLPTL
Model2 Y=capital
Model3 Y=efficiency
Model1 Y=VOA
Model2 Y=capital
Model3 Y=efficiency
Model1 Y=VOE
Model2 Y=capital
Model3 Y=efficiency
Const 309.61** (2.23)
-3.78 (-0.65)
0.93*** (16.33)
-0.03** (-2.53)
-6.12 (-1.05)
0.89*** (15.56)
0.01 (0.99)
-5.44 (-0.94)
0.93*** (15.95)
-0.3 (-0.21)
-4.574 (-0.79)
0.929*** (16.18)
risk -0.002 (-0.65)
-0.0001*** (-2.56)
-95.04*** (-2.56)
2.78*** (4.97)
88.56** (2.09)
0.163 (0.24)
-0.61** (-2.00)
0.003 (0.53)
eff -292.2** (-2.56)
13.85*** (2.90)
0.048*** (4.97)
17.41*** (3.60)
0.002 (0.24)
14.15*** (2.99)
0.63 (0.53)
14.59*** (3.08)
cap -1.18 (-0.65)
0.003*** (2.90)
-0.001*** (-2.56)
0.004*** (3.60)
0.0003** (2.09)
0.004*** (2.99)
-0.04** (-2.00)
0.004*** (3.08)
ROA -53.84 (-0.05)
-19.48 (-0.46)
0.049 (0.07)
-0.16* (-1.83)
-35.71 (-0.83)
0.55 (0.82)
0.06 (0.79)
-24.33 (-0.57)
0.046 (0.07)
-8.63 (-0.82)
-24.24 (-0.57)
0.077 (0.11)
Size 6.93 (1.06)
-1.26*** (-4.80)
0.03*** (7.93)
-0.004*** (-6.31)
-1.51*** (-5.41)
0.04*** (9.04)
-0.001** (-2.05)
-1.16*** (-4.36)
0.03*** (7.83)
0.0004 (0.01)
-1.25*** (-4.78)
0.03*** (7.90)
Liquid -1.06 (-1.30)
-0.03 (-0.87)
-0.002*** (-3.88)
0.0001* (1.91)
-0.02 (-0.48)
-0.002*** (-4.04)
-0.0001 (-1.42)
-0.02 (-0.55)
-0.002*** (-3.70)
-0.002 (-0.18)
-0.028 (-0.82)
-0.002*** (-3.75)
Tax -46.2** (-2.21)
-0.85 (-0.96)
-0.037*** (-2.74)
0.005*** (2.82)
-0.26 (-0.29)
0.008 (0.23)
-0.0004 (-0.27)
-0.69 (-0.79)
-0.033** (-2.41)
0.013 (0.06)
-0.729 (-0.84)
-0.033** (-2.42)
OBS -49.33 (-0.88)
4.22* (1.81)
-0.003 (-0.07)
-0.001 (-0.19)
4.03* (1.73)
-1.36 (-1.44)
0.009** (2.10)
3.45 (1.46)
0.003 (0.08)
0.181 (0.31)
4.35* (1.87)
0.004 (0.11)
LP 3076** (2.11)
-25.98 (-0.42)
-1.2 (-1.24)
-0.014 (-0.11)
-32.52 (-0.53)
-0.03*** (-4.19)
0.025 (0.23)
-33.43 (-0.55)
-1.65* (-1.74)
16.9 (1.21)
-21.28 (-0.35)
-1.69* (-1.77)
C(3) -6.90 (-0.66)
1.25*** (2.93)
-0.022*** (-3.26)
0.003*** (3.79)
1.53*** (3.48)
-0.001** (-2.14)
-0.001 (-1.06)
1.31*** (3.08)
-0.02** (-3.19)
0.08 (0.75)
1.291*** (3.03)
-0.022*** (-3.24)
BSD -0.02 (-0.03)
0.06*** (3.26)
-0.001*** (-2.46)
-0.00007 (-0.18)
0.06*** (4.66)
-0.001*** (-4.91)
-0.00001 (-0.37)
0.062*** (3.26)
-0.001** (-2.51)
0.003 (0.57)
0.063*** (3.29)
-0.001** (-2.53)
SMD -0.24 (-0.76)
0.05*** (4.21)
-0.001*** (-4.14)
0.0001** (3.41)
-0.72*** (-2.68)
0.01** (2.47)
-0.00004 (-1.62)
0.056*** (4.43)
-0.001*** (-4.04)
0.005 (1.44)
0.055*** (4.39)
-0.001*** (-4.13)
INF 2.75 (0.43)
-0.63** (-2.35)
0.01* (1.94)
-0.001** (-2.17)
-2.15*** (-4.62)
0.04** (3.52)
0.0005 (0.99)
-0.66** (-2.48)
0.008* (1.89)
-0.04 (-0.54)
-0.641** (-2.41)
0.008* (1.92)
GDP 14.57 (1.31)
-1.81*** (-0.65)
0.031*** (4.38)
-0.004*** (-4.33)
-6.12 (-1.05)
0.89*** (15.56)
0.01 (0.99)
-1.91*** (-4.24)
0.03*** (4.19)
-0.145 (-1.26)
-1.895*** (-4.21)
0.03*** (4.27)
Obs. 174 174 174 172 172 172 174 174 174 174 174 174
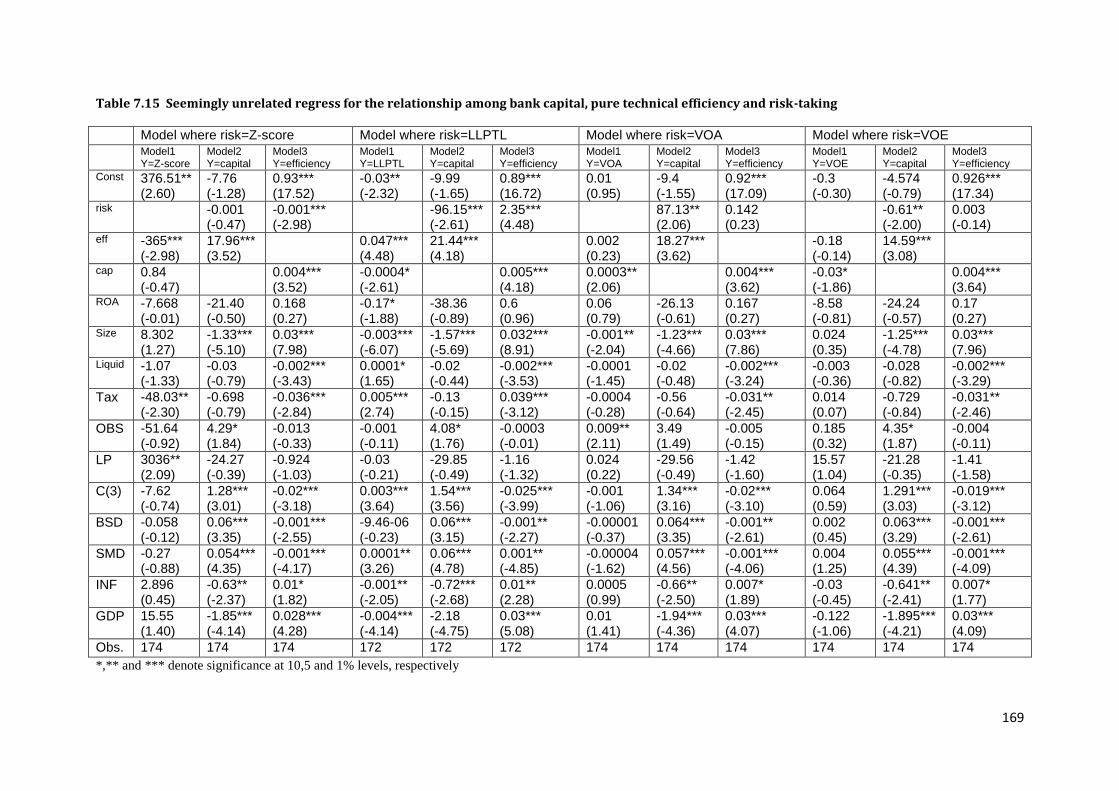
169
Table 7.15 Seemingly unrelated regress for the relationship among bank capital, pure technical efficiency and risk-taking
Model where risk=Z-score Model where risk=LLPTL Model where risk=VOA Model where risk=VOE
Model1 Y=Z-score
Model2 Y=capital
Model3 Y=efficiency
Model1 Y=LLPTL
Model2 Y=capital
Model3 Y=efficiency
Model1 Y=VOA
Model2 Y=capital
Model3 Y=efficiency
Model1 Y=VOE
Model2 Y=capital
Model3 Y=efficiency
Const 376.51** (2.60)
-7.76 (-1.28)
0.93*** (17.52)
-0.03** (-2.32)
-9.99 (-1.65)
0.89*** (16.72)
0.01 (0.95)
-9.4 (-1.55)
0.92*** (17.09)
-0.3 (-0.30)
-4.574 (-0.79)
0.926*** (17.34)
risk -0.001 (-0.47)
-0.001*** (-2.98)
-96.15*** (-2.61)
2.35*** (4.48)
87.13** (2.06)
0.142 (0.23)
-0.61** (-2.00)
0.003 (-0.14)
eff -365*** (-2.98)
17.96*** (3.52)
0.047*** (4.48)
21.44*** (4.18)
0.002 (0.23)
18.27*** (3.62)
-0.18 (-0.14)
14.59*** (3.08)
cap 0.84 (-0.47)
0.004*** (3.52)
-0.0004* (-2.61)
0.005*** (4.18)
0.0003** (2.06)
0.004*** (3.62)
-0.03* (-1.86)
0.004*** (3.64)
ROA -7.668 (-0.01)
-21.40 (-0.50)
0.168 (0.27)
-0.17* (-1.88)
-38.36 (-0.89)
0.6 (0.96)
0.06 (0.79)
-26.13 (-0.61)
0.167 (0.27)
-8.58 (-0.81)
-24.24 (-0.57)
0.17 (0.27)
Size 8.302 (1.27)
-1.33*** (-5.10)
0.03*** (7.98)
-0.003*** (-6.07)
-1.57*** (-5.69)
0.032*** (8.91)
-0.001** (-2.04)
-1.23*** (-4.66)
0.03*** (7.86)
0.024 (0.35)
-1.25*** (-4.78)
0.03*** (7.96)
Liquid -1.07 (-1.33)
-0.03 (-0.79)
-0.002*** (-3.43)
0.0001* (1.65)
-0.02 (-0.44)
-0.002*** (-3.53)
-0.0001 (-1.45)
-0.02 (-0.48)
-0.002*** (-3.24)
-0.003 (-0.36)
-0.028 (-0.82)
-0.002*** (-3.29)
Tax -48.03** (-2.30)
-0.698 (-0.79)
-0.036*** (-2.84)
0.005*** (2.74)
-0.13 (-0.15)
0.039*** (-3.12)
-0.0004 (-0.28)
-0.56 (-0.64)
-0.031** (-2.45)
0.014 (0.07)
-0.729 (-0.84)
-0.031** (-2.46)
OBS -51.64 (-0.92)
4.29* (1.84)
-0.013 (-0.33)
-0.001 (-0.11)
4.08* (1.76)
-0.0003 (-0.01)
0.009** (2.11)
3.49 (1.49)
-0.005 (-0.15)
0.185 (0.32)
4.35* (1.87)
-0.004 (-0.11)
LP 3036** (2.09)
-24.27 (-0.39)
-0.924 (-1.03)
-0.03 (-0.21)
-29.85 (-0.49)
-1.16 (-1.32)
0.024 (0.22)
-29.56 (-0.49)
-1.42 (-1.60)
15.57 (1.04)
-21.28 (-0.35)
-1.41 (-1.58)
C(3) -7.62 (-0.74)
1.28*** (3.01)
-0.02*** (-3.18)
0.003*** (3.64)
1.54*** (3.56)
-0.025*** (-3.99)
-0.001 (-1.06)
1.34*** (3.16)
-0.02*** (-3.10)
0.064 (0.59)
1.291*** (3.03)
-0.019*** (-3.12)
BSD -0.058 (-0.12)
0.06*** (3.35)
-0.001*** (-2.55)
-9.46-06 (-0.23)
0.06*** (3.15)
-0.001** (-2.27)
-0.00001 (-0.37)
0.064*** (3.35)
-0.001** (-2.61)
0.002 (0.45)
0.063*** (3.29)
-0.001*** (-2.61)
SMD -0.27 (-0.88)
0.054*** (4.35)
-0.001*** (-4.17)
0.0001** (3.26)
0.06*** (4.78)
0.001** (-4.85)
-0.00004 (-1.62)
0.057*** (4.56)
-0.001*** (-4.06)
0.004 (1.25)
0.055*** (4.39)
-0.001*** (-4.09)
INF 2.896 (0.45)
-0.63** (-2.37)
0.01* (1.82)
-0.001** (-2.05)
-0.72*** (-2.68)
0.01** (2.28)
0.0005 (0.99)
-0.66** (-2.50)
0.007* (1.89)
-0.03 (-0.45)
-0.641** (-2.41)
0.007* (1.77)
GDP 15.55 (1.40)
-1.85*** (-4.14)
0.028*** (4.28)
-0.004*** (-4.14)
-2.18 (-4.75)
0.03*** (5.08)
0.01 (1.41)
-1.94*** (-4.36)
0.03*** (4.07)
-0.122 (-1.06)
-1.895*** (-4.21)
0.03*** (4.09)
Obs. 174 174 174 172 172 172 174 174 174 174 174 174
*,** and *** denote significance at 10,5 and 1% levels, respectively
170
Table 7.16 Seeming unrelated regression for the relationship among bank capital, scale efficiency and risk-taking
Model where risk=Z-score Model where risk=LLPTL Model where risk=VOA Model where risk=VOE
Model1 Y=Z-score
Model2 Y=capital
Model3 Y=efficiency
Model1 Y=LLPTL
Model2 Y=capital
Model3 Y=efficiency
Model1 Y=VOA
Model2 Y=capital
Model3 Y=efficiency
Model1 Y=VOE
Model2 Y=capital
Model3 Y=efficiency
Const -339.27 (-0.75)
36.82 (1.95)
1.006*** (67.06)
-0.113*** (-2.92)
31.83* (1.67)
0.99*** (66.12)
0.005 (0.14)
-36.51* (1.94)
1.006*** (66.21)
-12.57*** (-2.74)
32* (1.69)
1.006*** (67.42
risk -0.0033 (-1.03)
-0.0001 (0.85)
-53.33*** (-1.43)
0.51*** (3.38)
93.09** (2.19)
0.039 (0.22)
-0.53* (-1.71)
0.004*** (2.85)
eff 372.96 (0.85)
-27.18 (-1.47)
0.13*** (3.38)
-21.65 (-1.16)
0.007 (0.22)
-28.31 (-1.54)
12.79*** (2.85)
-22.45 (-1.21)
cap -1.86 (-1.03)
0.005 (-1.47)
-0.0004 (-1.43)
-0.0004 (-1.16)
0.0003** (2.19)
-0.005 (-1.54)
-0.03* (-1.71)
-0.0004 (-1.21)
ROA -26.3 (-0.03)
-22.38 (-0.52)
-0.168 (-0.61)
-0.14 (-1.61)
-30.66 (-0.70)
-0.024 (-0.14)
0.061 (0.80)
-27.46 (-0.64)
-0.11 (-0.62)
-7.27 (-0.69)
-26.01 (-0.61)
-0.08 (-0.44)
Size -2.52 (-0.43)
-0.81*** (-3.44)
0.02** (2.47)
-0.003*** (-4.91)
-0.91*** (-3.63)
0.034*** (3.33)
-0.001** (-2.20)
-0.7*** (-2.90)
0.003** (2.46)
-0.014 (-0.24)
-0.8*** (-3.39)
0.008** (2.38)
Liquid -0.32 (-0.39)
-0.07** (-0.79)
-0.004*** (-3.16)
0.0001 (1.32)
-0.065* (-1.93)
-0.005*** (-3.35)
-0.0001 (-1.46)
-0.06* (-1.79)
-0.004*** (-3.14)
0.003 (0.32)
-0.068** (-2.04)
-0.0004*** (-3.16)
Tax -35.58* (-1.72)
-1.45* (-1.67)
-0.002 (-0.47)
0.004** (2.06)
-1.11 (-1.26)
0.004 (-1.08)
-0.0005 (-0.31)
-1.26 (-1.47)
-0.002 (-0.58)
0.016 (0.07)
-1.31 (-1.53)
-0.002 (-0.59)
OBS -55.06 (-0.98)
4.64** (1.98)
-0.011 (1.06)
-0.002 (-0.33)
4.67** (1.99)
0.01 (1.05)
0.009** (2.08)
3.91* (1.65)
0.009 (0.95)
0.071 (0.12)
4.82** (2.06)
0.009 (0.95)
LP 3363** (2.52)
-53.42 (-0.86)
-0.291 (-1.15)
-0.063 (-0.50)
-65.72 (-1.07)
-0.21 (-0.82)
0.023 (0.22)
-66.16 (-1.09)
-0.25 (-1.01)
18.93 (1.28)
-54.98 (-0.90)
-0.31 (-1.25)
C(3) 0.25 (0.02)
0.912** (2.14)
-0.003 (-1.56)
0.003*** (3.10)
1.05** (2.42)
-0.004** (-2.21)
-0.001 (-1.11)
0.97*** (2.29)
-0.003 (-1.55)
0.105 (0.99)
0.953** (2.78)
-0.003* (-1.70)
BSD 0.216 (0.46)
0.06*** (2.76)
-0.00005 (-0.59)
-0.00004 (-0.88)
0.05* (2.59)
-0.0002 (-0.29)
-0.00001 (-0.41)
0.052*** (2.74)
0.00005 (-0.57)
0.003 (0.63)
0.053*** (2.78)
-0.0001 (-0.66)
SMD 0.02 (0.07)
0.041*** (3.33)
-0.0001 (-1.41)
0.0001** (2.43)
0.05*** (3.51)
-0.0001** (-1.92)
-0.0001* (-1.72)
0.044*** (3.54)
-0.00008 (-1.38)
0.005* (1.67)
0.043*** (3.50)
-0.0001* (-1.68)
INF -0.028 (-0.00)
-0.495* (-1.85)
0.01013 (1.25)
-0.001* (-1.83)
-0.549** (-2.03)
0.002 (1.62)
0.0005 (1.00)
-0.53** (-1.98)
0.0014* (1.24)
-0.05 (-0.75)
-0.51* (-1.92)
0.001 (1.35)
GDP 4.68 (0.43)
-1.33*** (-3.01)
0.037** (1.98)
-0.004*** (-3.46)
-1.52*** (-3.33)
0.05*** (2.72)
0.001 (1.48)
-1.44*** (-3.23)
0.037** (1.99)
-0.18 (-159)
-1.43*** (1.69)
0.004** (2.26)
Obs. 174 174 174 172 172 172 174 174 174 174 174 174
*,** and *** denote significance at 10,5 and 1% levels, respectively
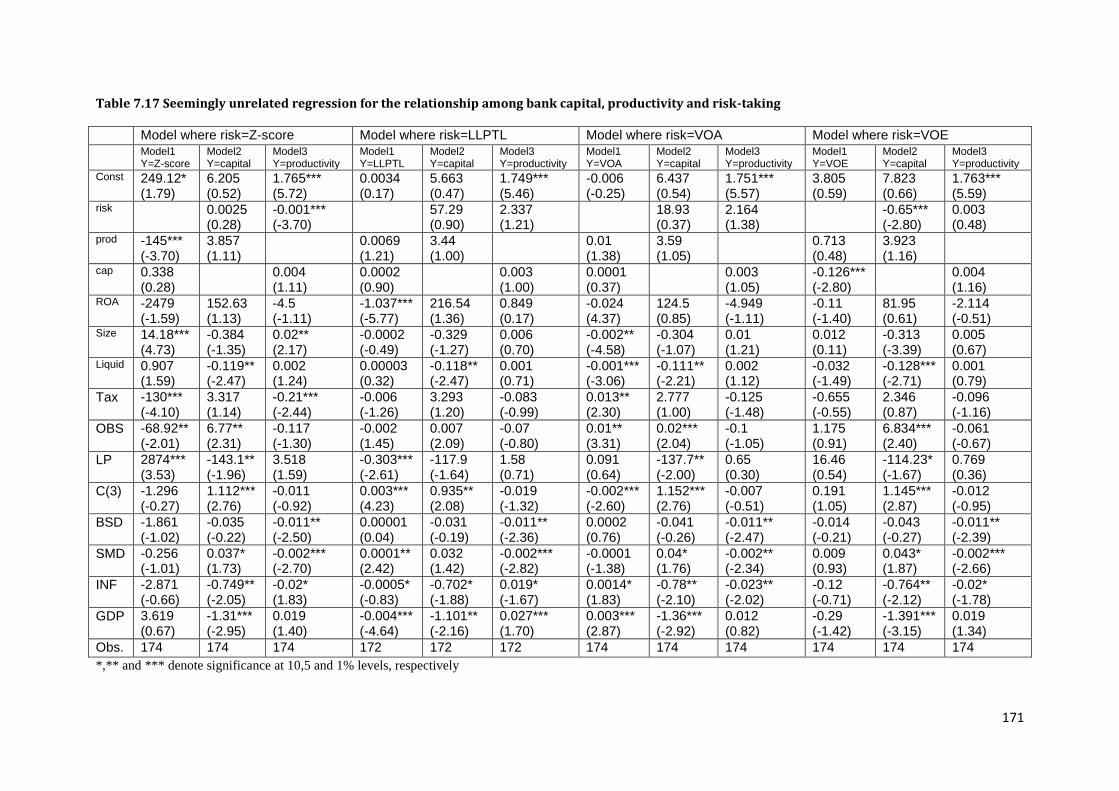
171
Table 7.17 Seemingly unrelated regression for the relationship among bank capital, productivity and risk-taking
Model where risk=Z-score Model where risk=LLPTL Model where risk=VOA Model where risk=VOE
Model1 Y=Z-score
Model2 Y=capital
Model3 Y=productivity
Model1 Y=LLPTL
Model2 Y=capital
Model3 Y=productivity
Model1 Y=VOA
Model2 Y=capital
Model3 Y=productivity
Model1 Y=VOE
Model2 Y=capital
Model3 Y=productivity
Const 249.12* (1.79)
6.205 (0.52)
1.765*** (5.72)
0.0034 (0.17)
5.663 (0.47)
1.749*** (5.46)
-0.006 (-0.25)
6.437 (0.54)
1.751*** (5.57)
3.805 (0.59)
7.823 (0.66)
1.763*** (5.59)
risk 0.0025 (0.28)
-0.001*** (-3.70)
57.29 (0.90)
2.337 (1.21)
18.93 (0.37)
2.164 (1.38)
-0.65*** (-2.80)
0.003 (0.48)
prod -145*** (-3.70)
3.857 (1.11)
0.0069 (1.21)
3.44 (1.00)
0.01 (1.38)
3.59 (1.05)
0.713 (0.48)
3.923 (1.16)
cap 0.338 (0.28)
0.004 (1.11)
0.0002 (0.90)
0.003 (1.00)
0.0001 (0.37)
0.003 (1.05)
-0.126*** (-2.80)
0.004 (1.16)
ROA -2479 (-1.59)
152.63 (1.13)
-4.5 (-1.11)
-1.037*** (-5.77)
216.54 (1.36)
0.849 (0.17)
-0.024 (4.37)
124.5 (0.85)
-4.949 (-1.11)
-0.11 (-1.40)
81.95 (0.61)
-2.114 (-0.51)
Size 14.18*** (4.73)
-0.384 (-1.35)
0.02** (2.17)
-0.0002 (-0.49)
-0.329 (-1.27)
0.006 (0.70)
-0.002** (-4.58)
-0.304 (-1.07)
0.01 (1.21)
0.012 (0.11)
-0.313 (-3.39)
0.005 (0.67)
Liquid 0.907 (1.59)
-0.119** (-2.47)
0.002 (1.24)
0.00003 (0.32)
-0.118** (-2.47)
0.001 (0.71)
-0.001*** (-3.06)
-0.111** (-2.21)
0.002 (1.12)
-0.032 (-1.49)
-0.128*** (-2.71)
0.001 (0.79)
Tax -130*** (-4.10)
3.317 (1.14)
-0.21*** (-2.44)
-0.006 (-1.26)
3.293 (1.20)
-0.083 (-0.99)
0.013** (2.30)
2.777 (1.00)
-0.125 (-1.48)
-0.655 (-0.55)
2.346 (0.87)
-0.096 (-1.16)
OBS -68.92** (-2.01)
6.77** (2.31)
-0.117 (-1.30)
-0.002 (1.45)
0.007 (2.09)
-0.07 (-0.80)
0.01** (3.31)
0.02*** (2.04)
-0.1 (-1.05)
1.175 (0.91)
6.834*** (2.40)
-0.061 (-0.67)
LP 2874*** (3.53)
-143.1** (-1.96)
3.518 (1.59)
-0.303*** (-2.61)
-117.9 (-1.64)
1.58 (0.71)
0.091 (0.64)
-137.7** (-2.00)
0.65 (0.30)
16.46 (0.54)
-114.23* (-1.67)
0.769 (0.36)
C(3) -1.296 (-0.27)
1.112*** (2.76)
-0.011 (-0.92)
0.003*** (4.23)
0.935** (2.08)
-0.019 (-1.32)
-0.002*** (-2.60)
1.152*** (2.76)
-0.007 (-0.51)
0.191 (1.05)
1.145*** (2.87)
-0.012 (-0.95)
BSD -1.861 (-1.02)
-0.035 (-0.22)
-0.011** (-2.50)
0.00001 (0.04)
-0.031 (-0.19)
-0.011** (-2.36)
0.0002 (0.76)
-0.041 (-0.26)
-0.011** (-2.47)
-0.014 (-0.21)
-0.043 (-0.27)
-0.011** (-2.39)
SMD -0.256 (-1.01)
0.037* (1.73)
-0.002*** (-2.70)
0.0001** (2.42)
0.032 (1.42)
-0.002*** (-2.82)
-0.0001 (-1.38)
0.04* (1.76)
-0.002** (-2.34)
0.009 (0.93)
0.043* (1.87)
-0.002*** (-2.66)
INF -2.871 (-0.66)
-0.749** (-2.05)
-0.02* (1.83)
-0.0005* (-0.83)
-0.702* (-1.88)
0.019* (-1.67)
0.0014* (1.83)
-0.78** (-2.10)
-0.023** (-2.02)
-0.12 (-0.71)
-0.764** (-2.12)
-0.02* (-1.78)
GDP 3.619 (0.67)
-1.31*** (-2.95)
0.019 (1.40)
-0.004*** (-4.64)
-1.101** (-2.16)
0.027*** (1.70)
0.003*** (2.87)
-1.36*** (-2.92)
0.012 (0.82)
-0.29 (-1.42)
-1.391*** (-3.15)
0.019 (1.34)
Obs. 174 174 174 172 172 172 174 174 174 174 174 174
*,** and *** denote significance at 10,5 and 1% levels, respectively
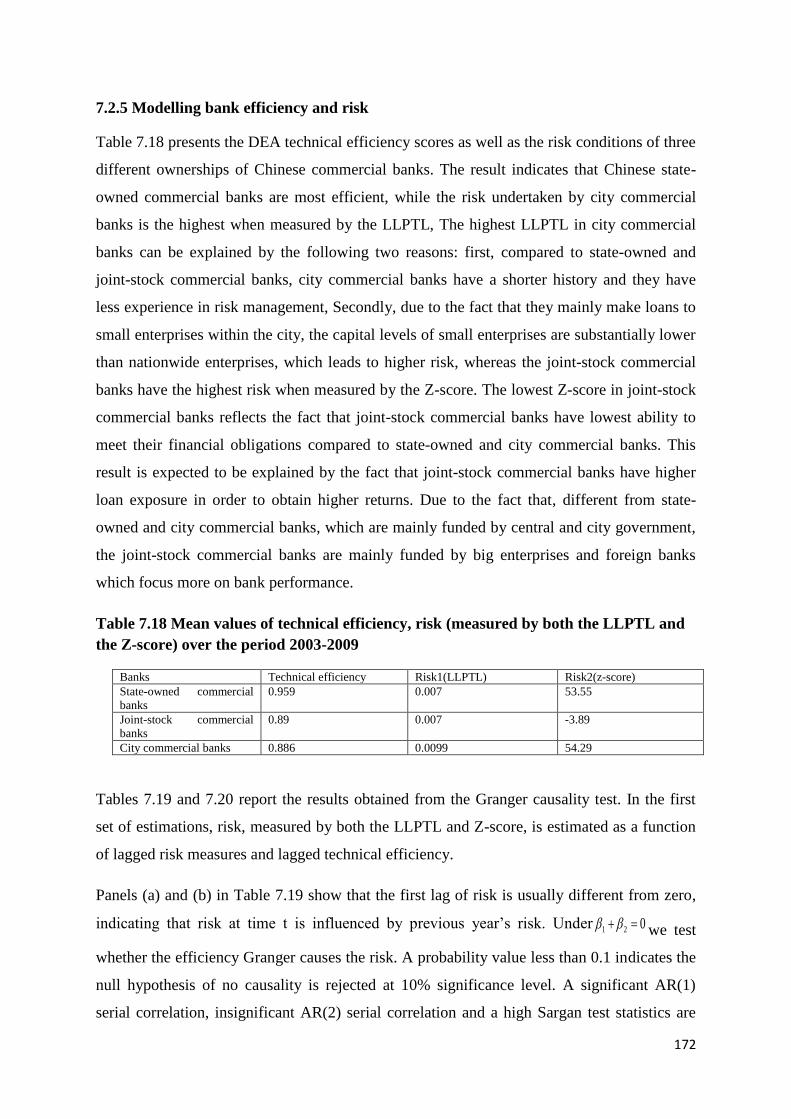
172
7.2.5 Modelling bank efficiency and risk
Table 7.18 presents the DEA technical efficiency scores as well as the risk conditions of three
different ownerships of Chinese commercial banks. The result indicates that Chinese state-
owned commercial banks are most efficient, while the risk undertaken by city commercial
banks is the highest when measured by the LLPTL, The highest LLPTL in city commercial
banks can be explained by the following two reasons: first, compared to state-owned and
joint-stock commercial banks, city commercial banks have a shorter history and they have
less experience in risk management, Secondly, due to the fact that they mainly make loans to
small enterprises within the city, the capital levels of small enterprises are substantially lower
than nationwide enterprises, which leads to higher risk, whereas the joint-stock commercial
banks have the highest risk when measured by the Z-score. The lowest Z-score in joint-stock
commercial banks reflects the fact that joint-stock commercial banks have lowest ability to
meet their financial obligations compared to state-owned and city commercial banks. This
result is expected to be explained by the fact that joint-stock commercial banks have higher
loan exposure in order to obtain higher returns. Due to the fact that, different from state-
owned and city commercial banks, which are mainly funded by central and city government,
the joint-stock commercial banks are mainly funded by big enterprises and foreign banks
which focus more on bank performance.
Table 7.18 Mean values of technical efficiency, risk (measured by both the LLPTL and
the Z-score) over the period 2003-2009
Banks Technical efficiency Risk1(LLPTL) Risk2(z-score)
State-owned commercial
banks
0.959 0.007 53.55
Joint-stock commercial
banks
0.89 0.007 -3.89
City commercial banks 0.886 0.0099 54.29
Tables 7.19 and 7.20 report the results obtained from the Granger causality test. In the first
set of estimations, risk, measured by both the LLPTL and Z-score, is estimated as a function
of lagged risk measures and lagged technical efficiency.
Panels (a) and (b) in Table 7.19 show that the first lag of risk is usually different from zero,
indicating that risk at time t is influenced by previous year‟s risk. Under 021 we test
whether the efficiency Granger causes the risk. A probability value less than 0.1 indicates the
null hypothesis of no causality is rejected at 10% significance level. A significant AR(1)
serial correlation, insignificant AR(2) serial correlation and a high Sargan test statistics are
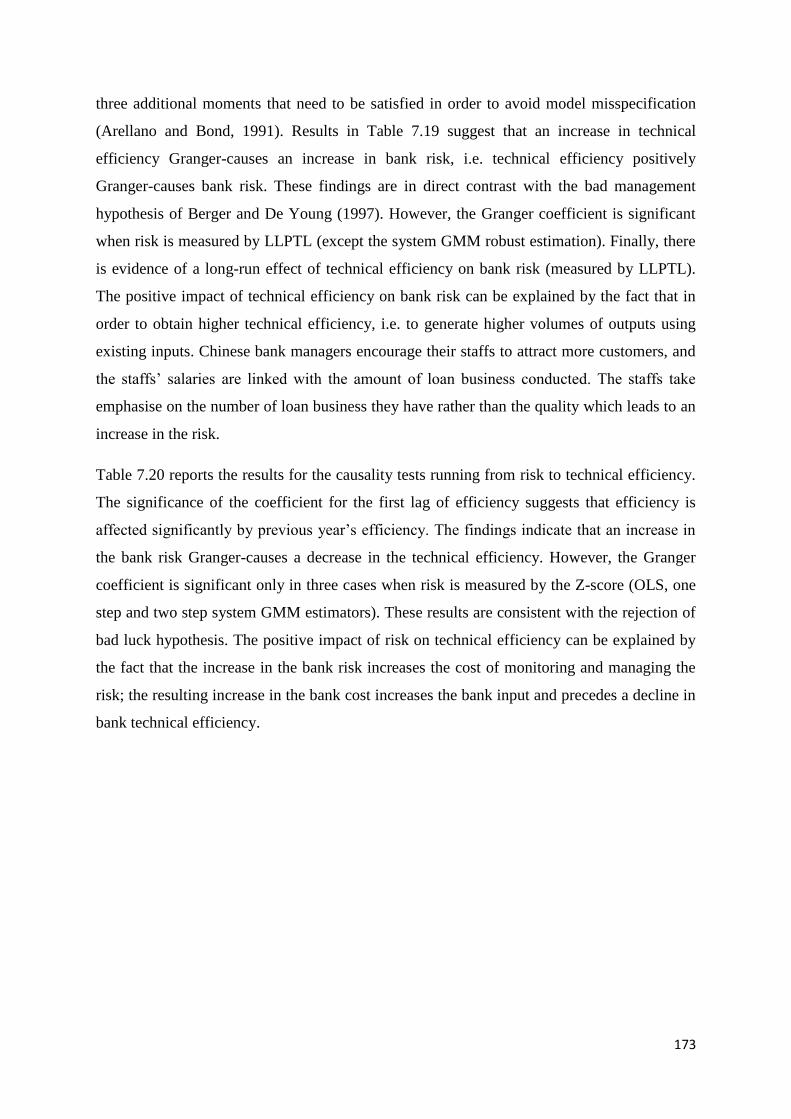
173
three additional moments that need to be satisfied in order to avoid model misspecification
(Arellano and Bond, 1991). Results in Table 7.19 suggest that an increase in technical
efficiency Granger-causes an increase in bank risk, i.e. technical efficiency positively
Granger-causes bank risk. These findings are in direct contrast with the bad management
hypothesis of Berger and De Young (1997). However, the Granger coefficient is significant
when risk is measured by LLPTL (except the system GMM robust estimation). Finally, there
is evidence of a long-run effect of technical efficiency on bank risk (measured by LLPTL).
The positive impact of technical efficiency on bank risk can be explained by the fact that in
order to obtain higher technical efficiency, i.e. to generate higher volumes of outputs using
existing inputs. Chinese bank managers encourage their staffs to attract more customers, and
the staffs‟ salaries are linked with the amount of loan business conducted. The staffs take
emphasise on the number of loan business they have rather than the quality which leads to an
increase in the risk.
Table 7.20 reports the results for the causality tests running from risk to technical efficiency.
The significance of the coefficient for the first lag of efficiency suggests that efficiency is
affected significantly by previous year‟s efficiency. The findings indicate that an increase in
the bank risk Granger-causes a decrease in the technical efficiency. However, the Granger
coefficient is significant only in three cases when risk is measured by the Z-score (OLS, one
step and two step system GMM estimators). These results are consistent with the rejection of
bad luck hypothesis. The positive impact of risk on technical efficiency can be explained by
the fact that the increase in the bank risk increases the cost of monitoring and managing the
risk; the resulting increase in the bank cost increases the bank input and precedes a decline in
bank technical efficiency.
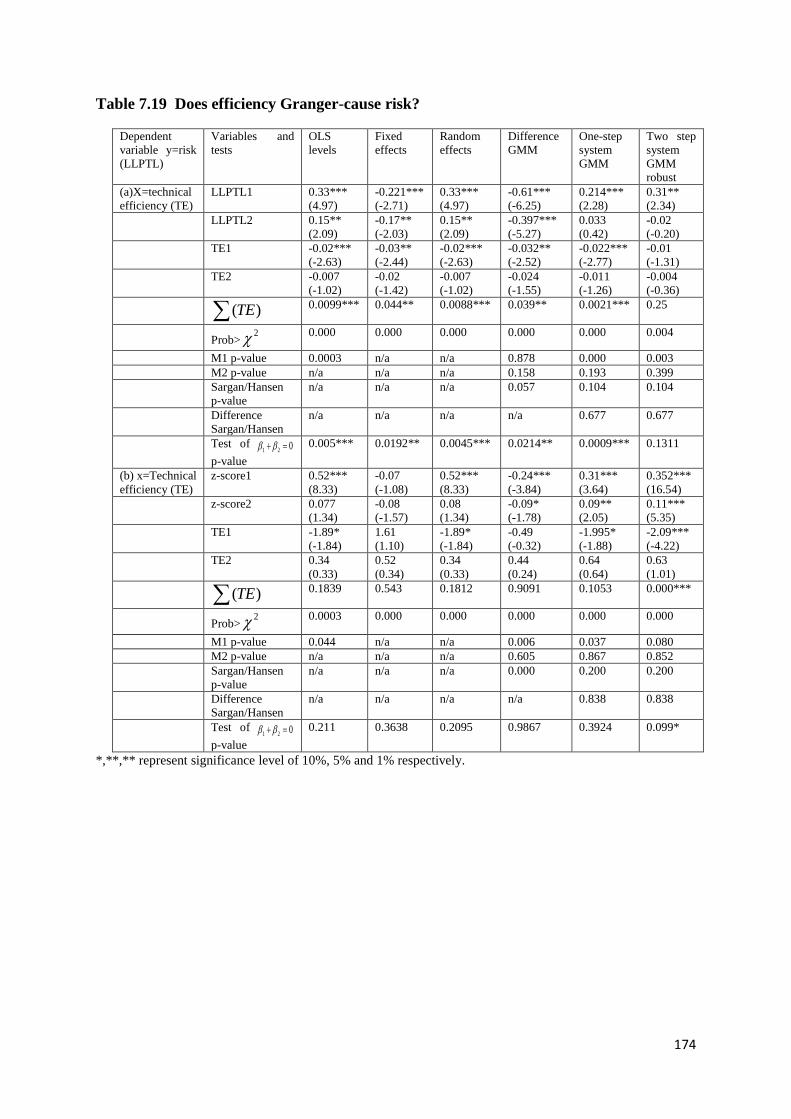
174
Table 7.19 Does efficiency Granger-cause risk?
Dependent
variable y=risk
(LLPTL)
Variables and
tests
OLS
levels
Fixed
effects
Random
effects
Difference
GMM
One-step
system
GMM
Two step
system
GMM
robust
(a)X=technical
efficiency (TE)
LLPTL1 0.33***
(4.97)
-0.221***
(-2.71)
0.33***
(4.97)
-0.61***
(-6.25)
0.214***
(2.28)
0.31**
(2.34)
LLPTL2 0.15**
(2.09)
-0.17**
(-2.03)
0.15**
(2.09)
-0.397***
(-5.27)
0.033
(0.42)
-0.02
(-0.20)
TE1 -0.02***
(-2.63)
-0.03**
(-2.44)
-0.02***
(-2.63)
-0.032**
(-2.52)
-0.022***
(-2.77)
-0.01
(-1.31)
TE2 -0.007
(-1.02)
-0.02
(-1.42)
-0.007
(-1.02)
-0.024
(-1.55)
-0.011
(-1.26)
-0.004
(-0.36)
( )TE 0.0099*** 0.044** 0.0088*** 0.039** 0.0021*** 0.25
Prob>
2 0.000 0.000 0.000 0.000 0.000 0.004
M1 p-value 0.0003 n/a n/a 0.878 0.000 0.003
M2 p-value n/a n/a n/a 0.158 0.193 0.399
Sargan/Hansen
p-value
n/a n/a n/a 0.057 0.104 0.104
Difference
Sargan/Hansen
n/a n/a n/a n/a 0.677 0.677
Test of 021
p-value
0.005*** 0.0192** 0.0045*** 0.0214** 0.0009*** 0.1311
(b) x=Technical
efficiency (TE)
z-score1 0.52***
(8.33)
-0.07
(-1.08)
0.52***
(8.33)
-0.24***
(-3.84)
0.31***
(3.64)
0.352***
(16.54)
z-score2 0.077
(1.34)
-0.08
(-1.57)
0.08
(1.34)
-0.09*
(-1.78)
0.09**
(2.05)
0.11***
(5.35)
TE1 -1.89*
(-1.84)
1.61
(1.10)
-1.89*
(-1.84)
-0.49
(-0.32)
-1.995*
(-1.88)
-2.09***
(-4.22)
TE2 0.34
(0.33)
0.52
(0.34)
0.34
(0.33)
0.44
(0.24)
0.64
(0.64)
0.63
(1.01)
( )TE 0.1839 0.543 0.1812 0.9091 0.1053 0.000***
Prob>
2 0.0003 0.000 0.000 0.000 0.000 0.000
M1 p-value 0.044 n/a n/a 0.006 0.037 0.080
M2 p-value n/a n/a n/a 0.605 0.867 0.852
Sargan/Hansen
p-value
n/a n/a n/a 0.000 0.200 0.200
Difference
Sargan/Hansen
n/a n/a n/a n/a 0.838 0.838
Test of 021
p-value
0.211 0.3638 0.2095 0.9867 0.3924 0.099*
*,**,** represent significance level of 10%, 5% and 1% respectively.
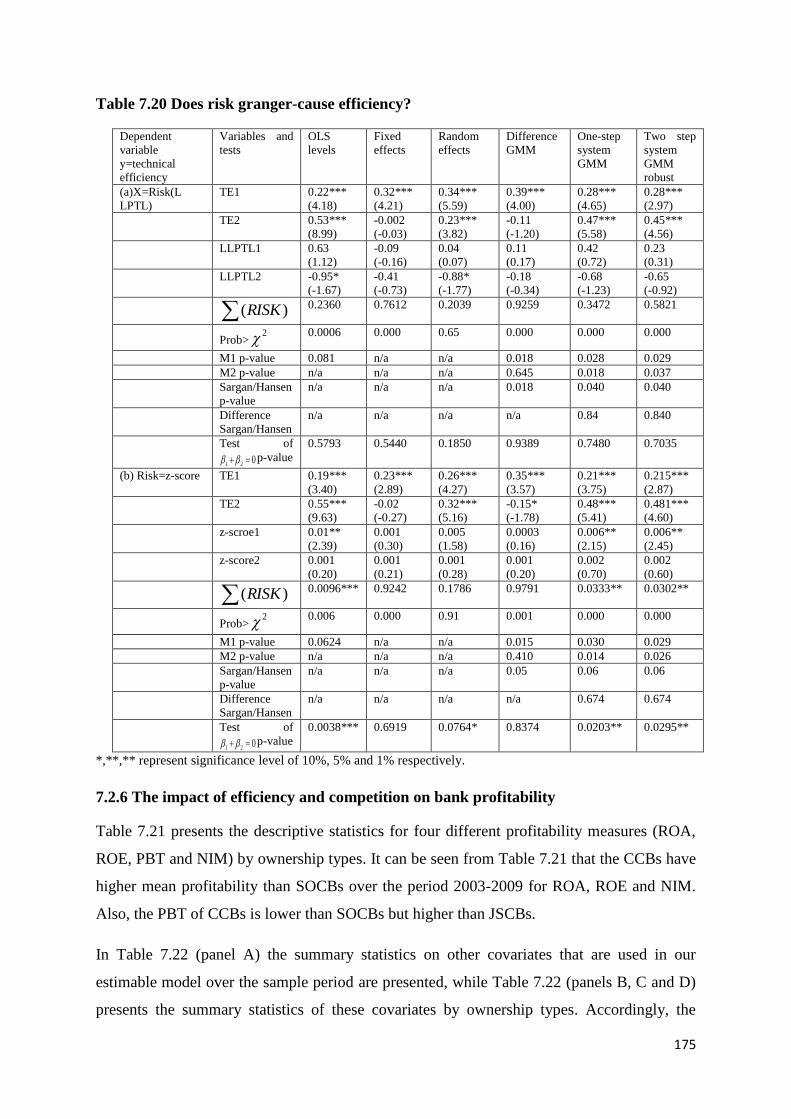
175
Table 7.20 Does risk granger-cause efficiency?
Dependent
variable
y=technical
efficiency
Variables and
tests
OLS
levels
Fixed
effects
Random
effects
Difference
GMM
One-step
system
GMM
Two step
system
GMM
robust
(a)X=Risk(L
LPTL)
TE1 0.22***
(4.18)
0.32***
(4.21)
0.34***
(5.59)
0.39***
(4.00)
0.28***
(4.65)
0.28***
(2.97)
TE2 0.53***
(8.99)
-0.002
(-0.03)
0.23***
(3.82)
-0.11
(-1.20)
0.47***
(5.58)
0.45***
(4.56)
LLPTL1 0.63
(1.12)
-0.09
(-0.16)
0.04
(0.07)
0.11
(0.17)
0.42
(0.72)
0.23
(0.31)
LLPTL2 -0.95*
(-1.67)
-0.41
(-0.73)
-0.88*
(-1.77)
-0.18
(-0.34)
-0.68
(-1.23)
-0.65
(-0.92)
)(RISK 0.2360 0.7612 0.2039 0.9259 0.3472 0.5821
Prob>
2 0.0006 0.000 0.65 0.000 0.000 0.000
M1 p-value 0.081 n/a n/a 0.018 0.028 0.029
M2 p-value n/a n/a n/a 0.645 0.018 0.037
Sargan/Hansen
p-value
n/a n/a n/a 0.018 0.040 0.040
Difference
Sargan/Hansen
n/a n/a n/a n/a 0.84 0.840
Test of
021 p-value
0.5793 0.5440 0.1850 0.9389 0.7480 0.7035
(b) Risk=z-score TE1 0.19***
(3.40)
0.23***
(2.89)
0.26***
(4.27)
0.35***
(3.57)
0.21***
(3.75)
0.215***
(2.87)
TE2 0.55***
(9.63)
-0.02
(-0.27)
0.32***
(5.16)
-0.15*
(-1.78)
0.48***
(5.41)
0.481***
(4.60)
z-scroe1 0.01**
(2.39)
0.001
(0.30)
0.005
(1.58)
0.0003
(0.16)
0.006**
(2.15)
0.006**
(2.45)
z-score2 0.001
(0.20)
0.001
(0.21)
0.001
(0.28)
0.001
(0.20)
0.002
(0.70)
0.002
(0.60)
)(RISK 0.0096*** 0.9242 0.1786 0.9791 0.0333** 0.0302**
Prob>
2 0.006 0.000 0.91 0.001 0.000 0.000
M1 p-value 0.0624 n/a n/a 0.015 0.030 0.029
M2 p-value n/a n/a n/a 0.410 0.014 0.026
Sargan/Hansen
p-value
n/a n/a n/a 0.05 0.06 0.06
Difference
Sargan/Hansen
n/a n/a n/a n/a 0.674 0.674
Test of
021 p-value
0.0038*** 0.6919 0.0764* 0.8374 0.0203** 0.0295**
*,**,** represent significance level of 10%, 5% and 1% respectively.
7.2.6 The impact of efficiency and competition on bank profitability
Table 7.21 presents the descriptive statistics for four different profitability measures (ROA,
ROE, PBT and NIM) by ownership types. It can be seen from Table 7.21 that the CCBs have
higher mean profitability than SOCBs over the period 2003-2009 for ROA, ROE and NIM.
Also, the PBT of CCBs is lower than SOCBs but higher than JSCBs.
In Table 7.22 (panel A) the summary statistics on other covariates that are used in our
estimable model over the sample period are presented, while Table 7.22 (panels B, C and D)
presents the summary statistics of these covariates by ownership types. Accordingly, the
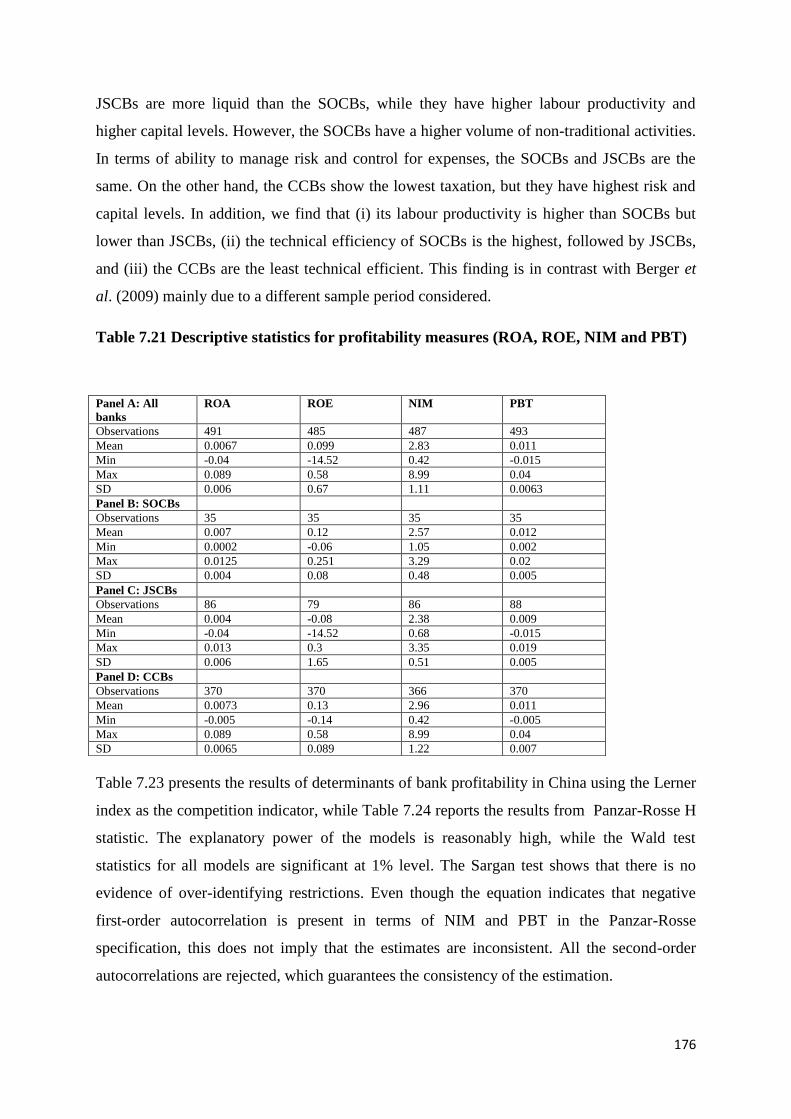
176
JSCBs are more liquid than the SOCBs, while they have higher labour productivity and
higher capital levels. However, the SOCBs have a higher volume of non-traditional activities.
In terms of ability to manage risk and control for expenses, the SOCBs and JSCBs are the
same. On the other hand, the CCBs show the lowest taxation, but they have highest risk and
capital levels. In addition, we find that (i) its labour productivity is higher than SOCBs but
lower than JSCBs, (ii) the technical efficiency of SOCBs is the highest, followed by JSCBs,
and (iii) the CCBs are the least technical efficient. This finding is in contrast with Berger et
al. (2009) mainly due to a different sample period considered.
Table 7.21 Descriptive statistics for profitability measures (ROA, ROE, NIM and PBT)
Table 7.23 presents the results of determinants of bank profitability in China using the Lerner
index as the competition indicator, while Table 7.24 reports the results from Panzar-Rosse H
statistic. The explanatory power of the models is reasonably high, while the Wald test
statistics for all models are significant at 1% level. The Sargan test shows that there is no
evidence of over-identifying restrictions. Even though the equation indicates that negative
first-order autocorrelation is present in terms of NIM and PBT in the Panzar-Rosse
specification, this does not imply that the estimates are inconsistent. All the second-order
autocorrelations are rejected, which guarantees the consistency of the estimation.
Panel A: All
banks
ROA ROE NIM PBT
Observations 491 485 487 493
Mean 0.0067 0.099 2.83 0.011
Min -0.04 -14.52 0.42 -0.015
Max 0.089 0.58 8.99 0.04
SD 0.006 0.67 1.11 0.0063
Panel B: SOCBs
Observations 35 35 35 35
Mean 0.007 0.12 2.57 0.012
Min 0.0002 -0.06 1.05 0.002
Max 0.0125 0.251 3.29 0.02
SD 0.004 0.08 0.48 0.005
Panel C: JSCBs
Observations 86 79 86 88
Mean 0.004 -0.08 2.38 0.009
Min -0.04 -14.52 0.68 -0.015
Max 0.013 0.3 3.35 0.019
SD 0.006 1.65 0.51 0.005
Panel D: CCBs
Observations 370 370 366 370
Mean 0.0073 0.13 2.96 0.011
Min -0.005 -0.14 0.42 -0.005
Max 0.089 0.58 8.99 0.04
SD 0.0065 0.089 1.22 0.007
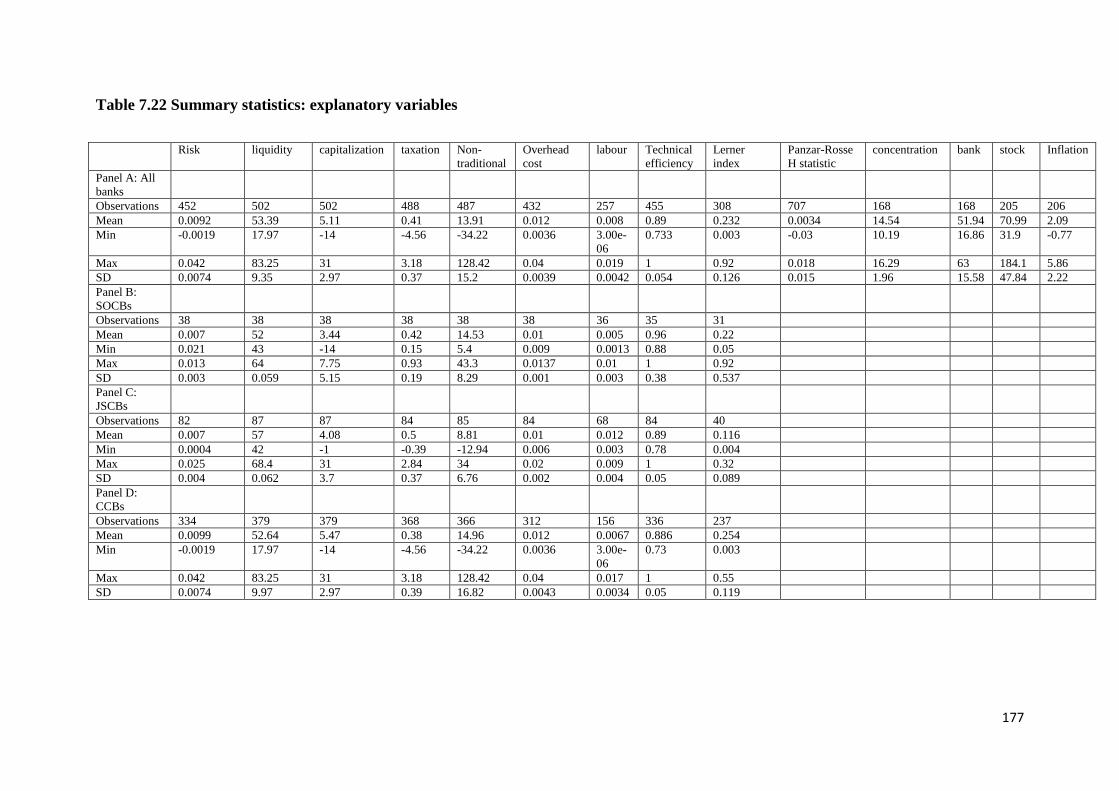
177
Table 7.22 Summary statistics: explanatory variables
Risk liquidity capitalization taxation Non-
traditional
Overhead
cost
labour Technical
efficiency
Lerner
index
Panzar-Rosse
H statistic
concentration bank stock Inflation
Panel A: All
banks
Observations 452 502 502 488 487 432 257 455 308 707 168 168 205 206
Mean 0.0092 53.39 5.11 0.41 13.91 0.012 0.008 0.89 0.232 0.0034 14.54 51.94 70.99 2.09
Min -0.0019 17.97 -14 -4.56 -34.22 0.0036 3.00e-
06
0.733 0.003 -0.03 10.19 16.86 31.9 -0.77
Max 0.042 83.25 31 3.18 128.42 0.04 0.019 1 0.92 0.018 16.29 63 184.1 5.86
SD 0.0074 9.35 2.97 0.37 15.2 0.0039 0.0042 0.054 0.126 0.015 1.96 15.58 47.84 2.22
Panel B:
SOCBs
Observations 38 38 38 38 38 38 36 35 31
Mean 0.007 52 3.44 0.42 14.53 0.01 0.005 0.96 0.22
Min 0.021 43 -14 0.15 5.4 0.009 0.0013 0.88 0.05
Max 0.013 64 7.75 0.93 43.3 0.0137 0.01 1 0.92
SD 0.003 0.059 5.15 0.19 8.29 0.001 0.003 0.38 0.537
Panel C:
JSCBs
Observations 82 87 87 84 85 84 68 84 40
Mean 0.007 57 4.08 0.5 8.81 0.01 0.012 0.89 0.116
Min 0.0004 42 -1 -0.39 -12.94 0.006 0.003 0.78 0.004
Max 0.025 68.4 31 2.84 34 0.02 0.009 1 0.32
SD 0.004 0.062 3.7 0.37 6.76 0.002 0.004 0.05 0.089
Panel D:
CCBs
Observations 334 379 379 368 366 312 156 336 237
Mean 0.0099 52.64 5.47 0.38 14.96 0.012 0.0067 0.886 0.254
Min -0.0019 17.97 -14 -4.56 -34.22 0.0036 3.00e-
06
0.73 0.003
Max 0.042 83.25 31 3.18 128.42 0.04 0.017 1 0.55
SD 0.0074 9.97 2.97 0.39 16.82 0.0043 0.0034 0.05 0.119
178
The coefficient of risk entered the regression model with a negative sign, indicating a
negative relationship between risk and bank profitability (ROE and PBT) in China. This
result is in direct contrast with the findings by Sufian (2009a) for a sample of Chinese banks.
However, this result is in line with Sufian and Chong (2008) for Philippine banking industry
and Liu and Wilson (2010) for Japanese banks. A plausible reason relates to the fact that as
the exposure of the financial institutions to high risk loan increases, the accumulation of
unpaid loans would increase and profitability would decrease (see Millar and Noulas , 1997).
Liquidity is found to be significantly and positively related to NIM and PBT in the Chinese
banking industry. This is in line with Sufian (2009a) for China. It is also supported by Bourke
(1989), who argued that a larger share of loan to total assets should imply more interest
revenue because of higher risk.
In terms of taxation, the variable is negatively related to the profitability of the Chinese
banks, indicating a negative relationship between taxation and bank profitability. Therefore,
the more taxes paid by the bank, the higher cost incurred by the bank, thus a decrease in the
profitability. The result is in line with Hameed and Bashir (2003) for Islamic banks from the
Middle East.
Capitalization is negatively and significantly related to bank profitability (PBT) (It is in direct
contrast to the finding reported by Ben Naceur and Goaied (2008) for the Tunisian banking
industry, Kosmidou (2008) for the Greek banking industry and Hassan and Bashir (2003) for
the Islamic banking industry. This underlines lower profitability in China comes hand in hand
with higher capitalization. One explanation of our results is that banks holding large amounts
of capital cannot engage in more traditional loan-deposit services and non-traditional
activities, which decreases banks' profitability. The negative relationship can also be
explained by the fact that "the more the equity providers to a bank, the higher the claim from
the bank's retained earnings in the form of dividends". This leads to less retained funds
available to the bank for growth purposes, hence less funds available to boost profits.
We also find that overhead cost is significantly and positively related to ROA, NIM and PBT
for Chinese banks; this is in line with Abreu and Mendes (2001) for several European banks.
It is also a testimony that Chinese banks have the ability to pass the overhead expenses on to
customers through increasing lending rate and decreasing the deposit rate.
179
Non-traditional activity is significantly and negatively related to bank profitability in China in
terms of NIM. This result is in line with Wu et al. (2007) for Chinese banks. In other words,
the main motivation for Chinese banks to develop non-traditional activities is to attract new
customers rather than boost the profits; as a result, the fees charged for the non-traditional
services are very low, in some cases, free of charge, which leads to a decrease in profitability.
Concerning the impact of labour productivity, it is positively related to profitability of
Chinese banks, indicating a positive relationship between bank profitability and labour
productivity. This is in line with Athanasoglou et al. (2008) for Greece. This result suggests
that higher productivity growth generates income that is partly channelled to bank profits.
The efficiency has significant and negative signs when ROA, NIM and PBT are used as
profitability indicators, which implies that there is a negative impact of efficiency on
profitability in the Chinese banking industry. The result is in direct contrast with the efficient
structure hypothesis which argues that higher profitability, higher market share and higher
market concentration are all the outcomes of higher efficiency. However, when the
competition is measured by the Panzar-Rosse H statistic, we find that the efficiency is
significantly and positively related to bank profitability in China (NIM).
In terms of the industry-specific variables, the sign of concentration is positive when ROE is
used as dependent variable, indicating that there is a positive relationship between
concentration and bank profitability, which reflects the oligopolistic structure of the Chinese
banking sector; this is supported by the Structure-Conduct-Performance (SCP) hypothesis
and the empirical results of Demirguc-Kunt and Huizinga (1999) and Hassan and Bashir
(2003). However, this result is conflicted with Garcia-Herrero et al. (2009) for Chinese banks
who find that there is a negative relationship between bank profitability and concentration.
Further, we find that there is a positive and significant relationship between banking sector
development and bank profitability (ROA) which is not in line with previous findings (e.g.
Demirguc-Kunt and Huizinga, 1999).
The sign of stock market development is positive (and significant at 1% level) indicating that
there is a positive relationship between stock market development and bank profitability
(ROA, NIM and PBT). This finding confirms the empirical results of Ben Naceur (2003) for
Tunisian banks. He suggests that as stock markets enlarge, more information becomes
available. This leads to an increased number of customers to banks by making easier the
180
process of identification and monitoring of borrowers. Consequently, this will contribute to a
higher profitability. The positive relationship between stock market development and bank
profitability shows that there are complementarities between stock market and banking
development in China (this is in line with the theory).
Further, we find that there is a negative relationship between bank competition and
profitability in the Chinese banking industry when the Lerner index is used to measure bank
competition. The Structure-Conduct-Performance (SCP) hypothesis assumes that, in the
higher concentrated market which has lower competition, the large firms tend to collude with
each other to get high profits. Our result is not in line with Hassan and Bashir (2003) for
Islamic banking industry. However, we support the findings presented by Athanasoglou et al.
(2008) for the Greek banking industry. We also find that when bank competition is measured
by Panzar-Rosse H statistic, the competition is significantly and positively related to a bank‟s
NIM.
Turning to macroeconomic determinants, inflation is found to be significantly and positively
related to bank profitability (ROA, NIM and PBT) in China, possibly due to the ability of
Chinese banks‟ to forecast future inflation, which in turn implies that interest rate has been
appropriately adjusted to achieve higher profits. This may also be viewed as a result of bank
customers‟ failure to anticipate inflation; banks can gain abnormal profit from asymmetric
information. This result is consistent with the findings reported by Pasiouras and Kosmidou
(2007) for EU as well as Sufian (2009a) and Garcia-Herrero et al. (2009) for Chinese banks.
The significant and negative signs of dummy variables representing JSCBs indicate that the
joint-stock commercial banks have low profitability over the examined period. This result is
not in line with Garcia-Herrero et al. (2009) for Chinese banks.
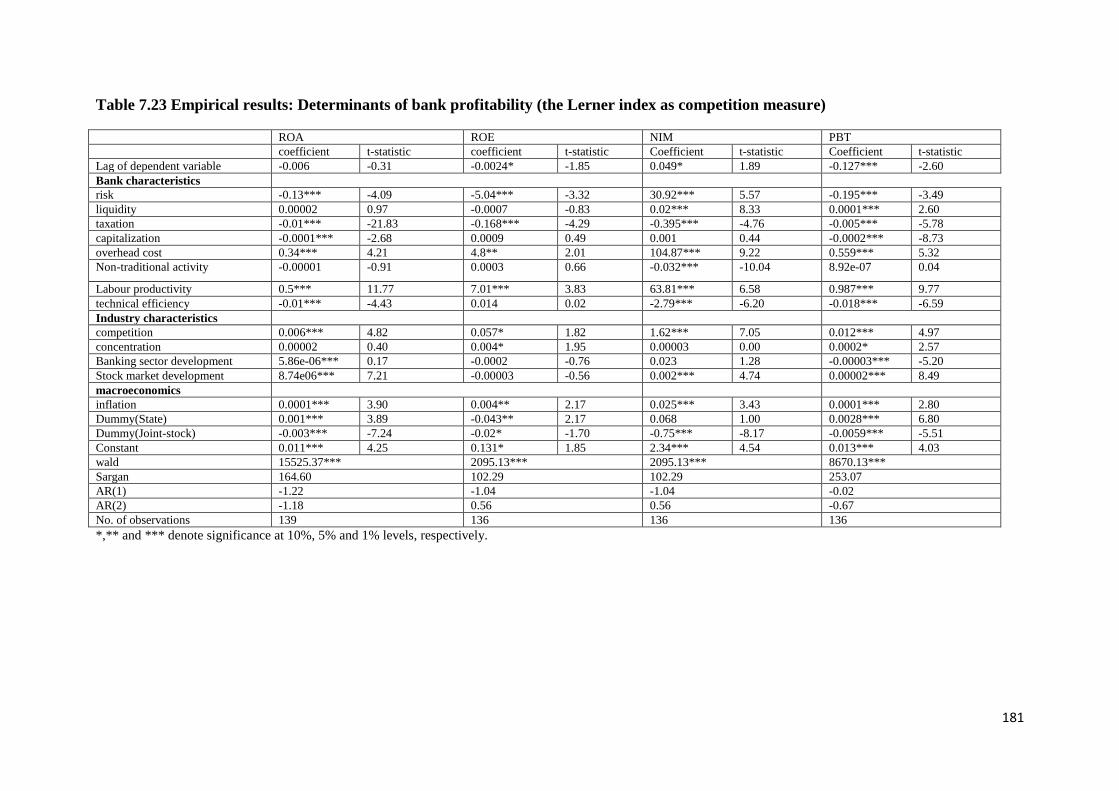
181
Table 7.23 Empirical results: Determinants of bank profitability (the Lerner index as competition measure)
ROA ROE NIM PBT
coefficient t-statistic coefficient t-statistic Coefficient t-statistic Coefficient t-statistic
Lag of dependent variable -0.006 -0.31 -0.0024* -1.85 0.049* 1.89 -0.127*** -2.60
Bank characteristics
risk -0.13*** -4.09 -5.04*** -3.32 30.92*** 5.57 -0.195*** -3.49
liquidity 0.00002 0.97 -0.0007 -0.83 0.02*** 8.33 0.0001*** 2.60
taxation -0.01*** -21.83 -0.168*** -4.29 -0.395*** -4.76 -0.005*** -5.78
capitalization -0.0001*** -2.68 0.0009 0.49 0.001 0.44 -0.0002*** -8.73
overhead cost 0.34*** 4.21 4.8** 2.01 104.87*** 9.22 0.559*** 5.32
Non-traditional activity -0.00001 -0.91 0.0003 0.66 -0.032*** -10.04 8.92e-07 0.04
Labour productivity 0.5*** 11.77 7.01*** 3.83 63.81*** 6.58 0.987*** 9.77
technical efficiency -0.01*** -4.43 0.014 0.02 -2.79*** -6.20 -0.018*** -6.59
Industry characteristics
competition 0.006*** 4.82 0.057* 1.82 1.62*** 7.05 0.012*** 4.97
concentration 0.00002 0.40 0.004* 1.95 0.00003 0.00 0.0002* 2.57
Banking sector development 5.86e-06*** 0.17 -0.0002 -0.76 0.023 1.28 -0.00003*** -5.20
Stock market development 8.74e06*** 7.21 -0.00003 -0.56 0.002*** 4.74 0.00002*** 8.49
macroeconomics
inflation 0.0001*** 3.90 0.004** 2.17 0.025*** 3.43 0.0001*** 2.80
Dummy(State) 0.001*** 3.89 -0.043** 2.17 0.068 1.00 0.0028*** 6.80
Dummy(Joint-stock) -0.003*** -7.24 -0.02* -1.70 -0.75*** -8.17 -0.0059*** -5.51
Constant 0.011*** 4.25 0.131* 1.85 2.34*** 4.54 0.013*** 4.03
wald 15525.37*** 2095.13*** 2095.13*** 8670.13***
Sargan 164.60 102.29 102.29 253.07
AR(1) -1.22 -1.04 -1.04 -0.02
AR(2) -1.18 0.56 0.56 -0.67
No. of observations 139 136 136 136
*,** and *** denote significance at 10%, 5% and 1% levels, respectively.
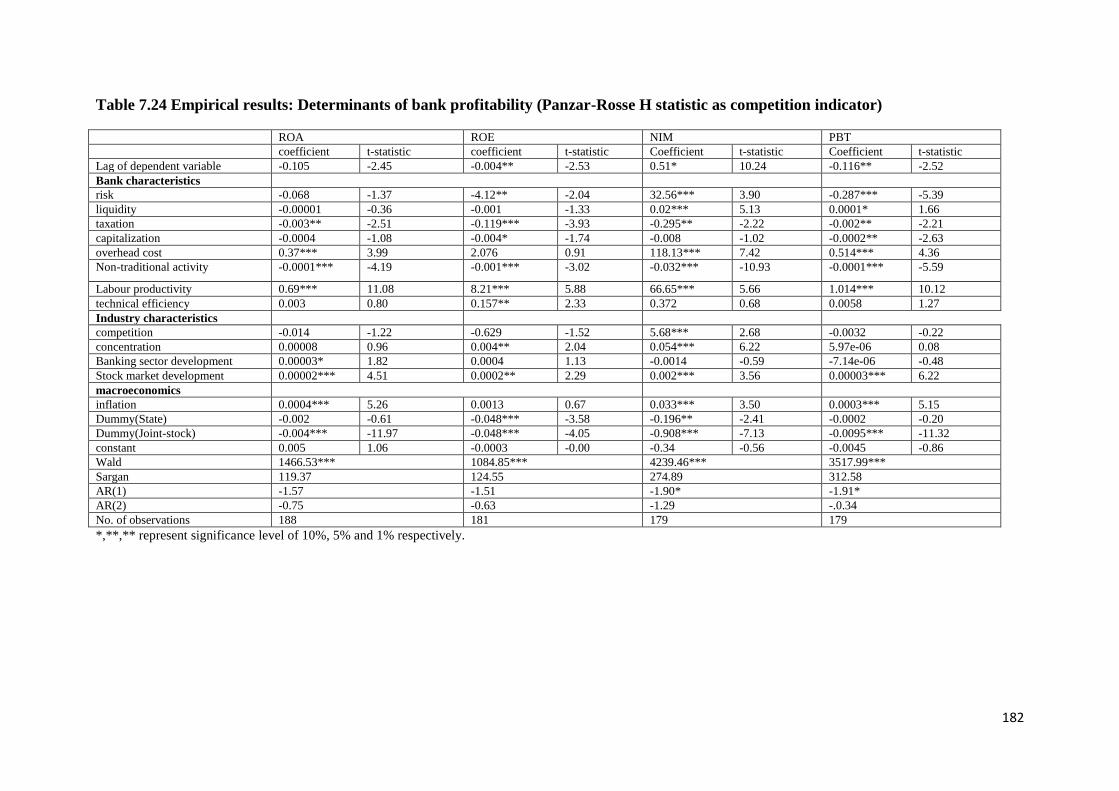
182
Table 7.24 Empirical results: Determinants of bank profitability (Panzar-Rosse H statistic as competition indicator)
ROA ROE NIM PBT
coefficient t-statistic coefficient t-statistic Coefficient t-statistic Coefficient t-statistic
Lag of dependent variable -0.105 -2.45 -0.004** -2.53 0.51* 10.24 -0.116** -2.52
Bank characteristics
risk -0.068 -1.37 -4.12** -2.04 32.56*** 3.90 -0.287*** -5.39
liquidity -0.00001 -0.36 -0.001 -1.33 0.02*** 5.13 0.0001* 1.66
taxation -0.003** -2.51 -0.119*** -3.93 -0.295** -2.22 -0.002** -2.21
capitalization -0.0004 -1.08 -0.004* -1.74 -0.008 -1.02 -0.0002** -2.63
overhead cost 0.37*** 3.99 2.076 0.91 118.13*** 7.42 0.514*** 4.36
Non-traditional activity -0.0001*** -4.19 -0.001*** -3.02 -0.032*** -10.93 -0.0001*** -5.59
Labour productivity 0.69*** 11.08 8.21*** 5.88 66.65*** 5.66 1.014*** 10.12
technical efficiency 0.003 0.80 0.157** 2.33 0.372 0.68 0.0058 1.27
Industry characteristics
competition -0.014 -1.22 -0.629 -1.52 5.68*** 2.68 -0.0032 -0.22
concentration 0.00008 0.96 0.004** 2.04 0.054*** 6.22 5.97e-06 0.08
Banking sector development 0.00003* 1.82 0.0004 1.13 -0.0014 -0.59 -7.14e-06 -0.48
Stock market development 0.00002*** 4.51 0.0002** 2.29 0.002*** 3.56 0.00003*** 6.22
macroeconomics
inflation 0.0004*** 5.26 0.0013 0.67 0.033*** 3.50 0.0003*** 5.15
Dummy(State) -0.002 -0.61 -0.048*** -3.58 -0.196** -2.41 -0.0002 -0.20
Dummy(Joint-stock) -0.004*** -11.97 -0.048*** -4.05 -0.908*** -7.13 -0.0095*** -11.32
constant 0.005 1.06 -0.0003 -0.00 -0.34 -0.56 -0.0045 -0.86
Wald 1466.53*** 1084.85*** 4239.46*** 3517.99***
Sargan 119.37 124.55 274.89 312.58
AR(1) -1.57 -1.51 -1.90* -1.91*
AR(2) -0.75 -0.63 -1.29 -.0.34
No. of observations 188 181 179 179
*,**,** represent significance level of 10%, 5% and 1% respectively.
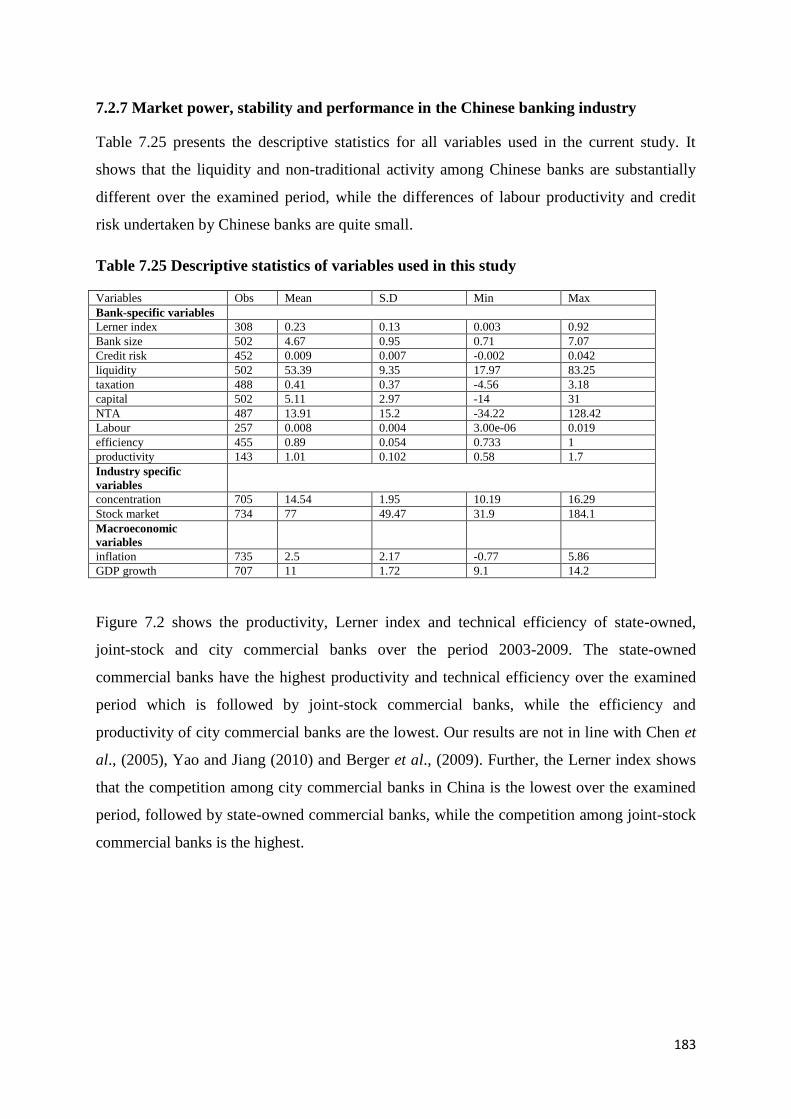
183
7.2.7 Market power, stability and performance in the Chinese banking industry
Table 7.25 presents the descriptive statistics for all variables used in the current study. It
shows that the liquidity and non-traditional activity among Chinese banks are substantially
different over the examined period, while the differences of labour productivity and credit
risk undertaken by Chinese banks are quite small.
Table 7.25 Descriptive statistics of variables used in this study
Variables Obs Mean S.D Min Max
Bank-specific variables
Lerner index 308 0.23 0.13 0.003 0.92
Bank size 502 4.67 0.95 0.71 7.07
Credit risk 452 0.009 0.007 -0.002 0.042
liquidity 502 53.39 9.35 17.97 83.25
taxation 488 0.41 0.37 -4.56 3.18
capital 502 5.11 2.97 -14 31
NTA 487 13.91 15.2 -34.22 128.42
Labour 257 0.008 0.004 3.00e-06 0.019
efficiency 455 0.89 0.054 0.733 1
productivity 143 1.01 0.102 0.58 1.7
Industry specific
variables
concentration 705 14.54 1.95 10.19 16.29
Stock market 734 77 49.47 31.9 184.1
Macroeconomic
variables
inflation 735 2.5 2.17 -0.77 5.86
GDP growth 707 11 1.72 9.1 14.2
Figure 7.2 shows the productivity, Lerner index and technical efficiency of state-owned,
joint-stock and city commercial banks over the period 2003-2009. The state-owned
commercial banks have the highest productivity and technical efficiency over the examined
period which is followed by joint-stock commercial banks, while the efficiency and
productivity of city commercial banks are the lowest. Our results are not in line with Chen et
al., (2005), Yao and Jiang (2010) and Berger et al., (2009). Further, the Lerner index shows
that the competition among city commercial banks in China is the lowest over the examined
period, followed by state-owned commercial banks, while the competition among joint-stock
commercial banks is the highest.
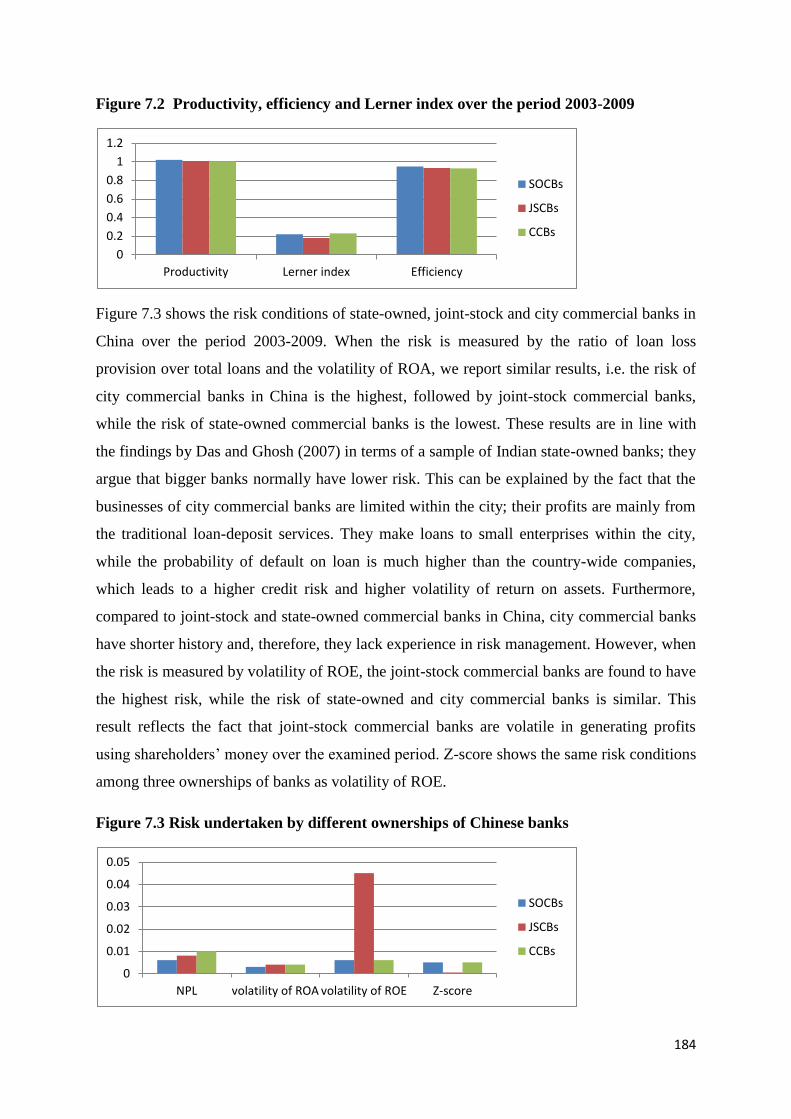
184
Figure 7.2 Productivity, efficiency and Lerner index over the period 2003-2009
Figure 7.3 shows the risk conditions of state-owned, joint-stock and city commercial banks in
China over the period 2003-2009. When the risk is measured by the ratio of loan loss
provision over total loans and the volatility of ROA, we report similar results, i.e. the risk of
city commercial banks in China is the highest, followed by joint-stock commercial banks,
while the risk of state-owned commercial banks is the lowest. These results are in line with
the findings by Das and Ghosh (2007) in terms of a sample of Indian state-owned banks; they
argue that bigger banks normally have lower risk. This can be explained by the fact that the
businesses of city commercial banks are limited within the city; their profits are mainly from
the traditional loan-deposit services. They make loans to small enterprises within the city,
while the probability of default on loan is much higher than the country-wide companies,
which leads to a higher credit risk and higher volatility of return on assets. Furthermore,
compared to joint-stock and state-owned commercial banks in China, city commercial banks
have shorter history and, therefore, they lack experience in risk management. However, when
the risk is measured by volatility of ROE, the joint-stock commercial banks are found to have
the highest risk, while the risk of state-owned and city commercial banks is similar. This
result reflects the fact that joint-stock commercial banks are volatile in generating profits
using shareholders‟ money over the examined period. Z-score shows the same risk conditions
among three ownerships of banks as volatility of ROE.
Figure 7.3 Risk undertaken by different ownerships of Chinese banks
0
0.2
0.4
0.6
0.8
1
1.2
Productivity Lerner index Efficiency
SOCBs
JSCBs
CCBs
0
0.01
0.02
0.03
0.04
0.05
NPL volatility of ROA volatility of ROE Z-score
SOCBs
JSCBs
CCBs
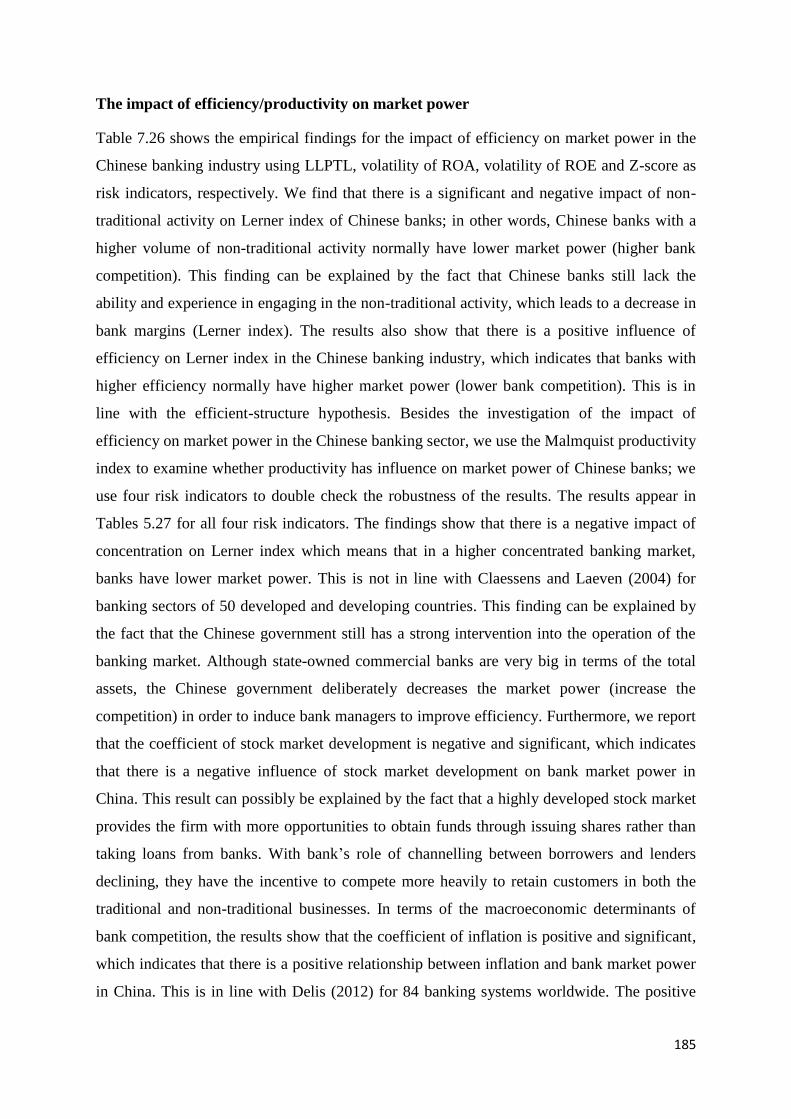
185
The impact of efficiency/productivity on market power
Table 7.26 shows the empirical findings for the impact of efficiency on market power in the
Chinese banking industry using LLPTL, volatility of ROA, volatility of ROE and Z-score as
risk indicators, respectively. We find that there is a significant and negative impact of non-
traditional activity on Lerner index of Chinese banks; in other words, Chinese banks with a
higher volume of non-traditional activity normally have lower market power (higher bank
competition). This finding can be explained by the fact that Chinese banks still lack the
ability and experience in engaging in the non-traditional activity, which leads to a decrease in
bank margins (Lerner index). The results also show that there is a positive influence of
efficiency on Lerner index in the Chinese banking industry, which indicates that banks with
higher efficiency normally have higher market power (lower bank competition). This is in
line with the efficient-structure hypothesis. Besides the investigation of the impact of
efficiency on market power in the Chinese banking sector, we use the Malmquist productivity
index to examine whether productivity has influence on market power of Chinese banks; we
use four risk indicators to double check the robustness of the results. The results appear in
Tables 5.27 for all four risk indicators. The findings show that there is a negative impact of
concentration on Lerner index which means that in a higher concentrated banking market,
banks have lower market power. This is not in line with Claessens and Laeven (2004) for
banking sectors of 50 developed and developing countries. This finding can be explained by
the fact that the Chinese government still has a strong intervention into the operation of the
banking market. Although state-owned commercial banks are very big in terms of the total
assets, the Chinese government deliberately decreases the market power (increase the
competition) in order to induce bank managers to improve efficiency. Furthermore, we report
that the coefficient of stock market development is negative and significant, which indicates
that there is a negative influence of stock market development on bank market power in
China. This result can possibly be explained by the fact that a highly developed stock market
provides the firm with more opportunities to obtain funds through issuing shares rather than
taking loans from banks. With bank‟s role of channelling between borrowers and lenders
declining, they have the incentive to compete more heavily to retain customers in both the
traditional and non-traditional businesses. In terms of the macroeconomic determinants of
bank competition, the results show that the coefficient of inflation is positive and significant,
which indicates that there is a positive relationship between inflation and bank market power
in China. This is in line with Delis (2012) for 84 banking systems worldwide. The positive
186
impact of inflation on market power reflects the fact that the inflation is anticipated by
Chinese banks. They adjust the interest rate accordingly, which makes the revenue increase
faster than costs. The resultant higher revenue increases bank margins, which precede
increases in market power. The positive and significant impact of GDP growth rate on bank
market power is in accordance with the finding by Maudos and Fernandez de Guevara (2010)
for a sample of banks from Europe, Canada, United States and Japan. As discussed earlier,
during periods of economic boom, not only the volumes of loan business engaged by Chinese
banks increased, but the quality of loan business improved. Hence, the resultant decrease in
risk reduces the bank‟s cost and increases the bank‟s margin, which leads to an increase in
market power. When risk is measured by volatility of ROA and Z-score (as shown in Tables
7.27), the results show that the risk is significantly related to market power in Chinese banks.
The finding suggests that bank risk (measured by volatility of ROA and Z-score) has a
positive impact on bank market power. However, the impact of risk on bank market power is
insignificant when volatility of ROE and NPL are used as the risk indicators.
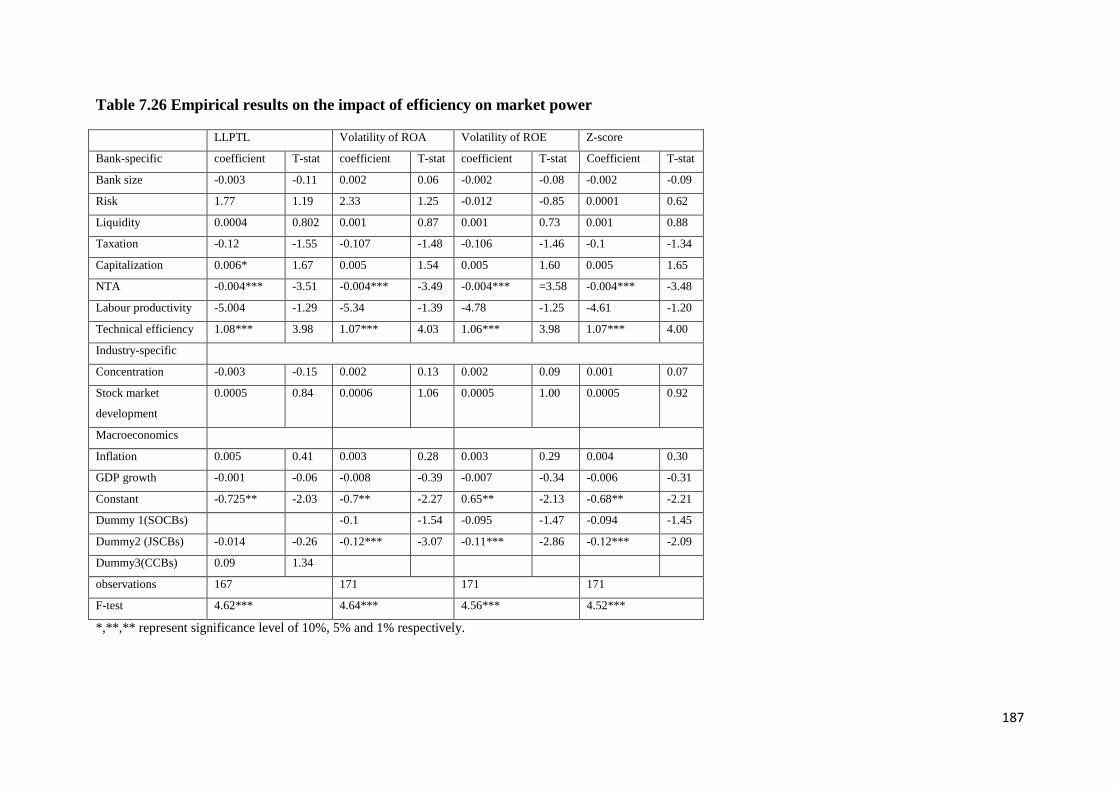
187
Table 7.26 Empirical results on the impact of efficiency on market power
LLPTL Volatility of ROA Volatility of ROE Z-score
Bank-specific coefficient T-stat coefficient T-stat coefficient T-stat Coefficient T-stat
Bank size -0.003 -0.11 0.002 0.06 -0.002 -0.08 -0.002 -0.09
Risk 1.77 1.19 2.33 1.25 -0.012 -0.85 0.0001 0.62
Liquidity 0.0004 0.802 0.001 0.87 0.001 0.73 0.001 0.88
Taxation -0.12 -1.55 -0.107 -1.48 -0.106 -1.46 -0.1 -1.34
Capitalization 0.006* 1.67 0.005 1.54 0.005 1.60 0.005 1.65
NTA -0.004*** -3.51 -0.004*** -3.49 -0.004*** =3.58 -0.004*** -3.48
Labour productivity -5.004 -1.29 -5.34 -1.39 -4.78 -1.25 -4.61 -1.20
Technical efficiency 1.08*** 3.98 1.07*** 4.03 1.06*** 3.98 1.07*** 4.00
Industry-specific
Concentration -0.003 -0.15 0.002 0.13 0.002 0.09 0.001 0.07
Stock market
development
0.0005 0.84 0.0006 1.06 0.0005 1.00 0.0005 0.92
Macroeconomics
Inflation 0.005 0.41 0.003 0.28 0.003 0.29 0.004 0.30
GDP growth -0.001 -0.06 -0.008 -0.39 -0.007 -0.34 -0.006 -0.31
Constant -0.725** -2.03 -0.7** -2.27 0.65** -2.13 -0.68** -2.21
Dummy 1(SOCBs) -0.1 -1.54 -0.095 -1.47 -0.094 -1.45
Dummy2 (JSCBs) -0.014 -0.26 -0.12*** -3.07 -0.11*** -2.86 -0.12*** -2.09
Dummy3(CCBs) 0.09 1.34
observations 167 171 171 171
F-test 4.62*** 4.64*** 4.56*** 4.52***
*,**,** represent significance level of 10%, 5% and 1% respectively.
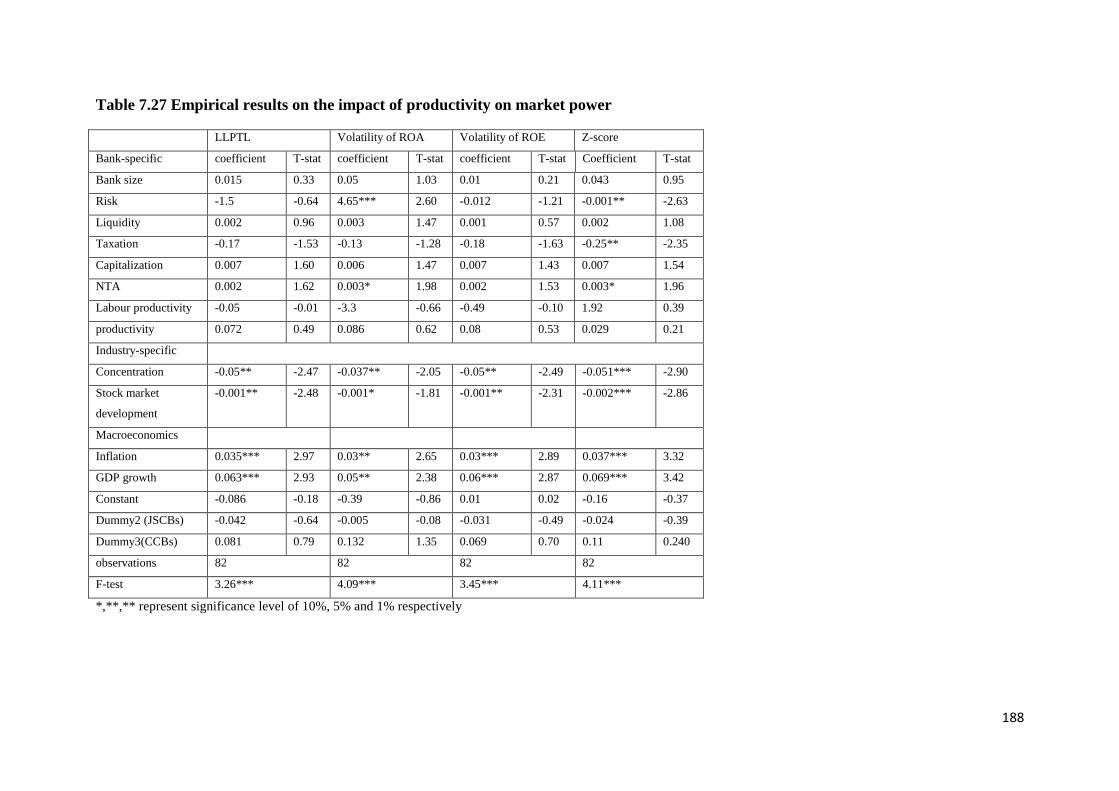
188
Table 7.27 Empirical results on the impact of productivity on market power
LLPTL Volatility of ROA Volatility of ROE Z-score
Bank-specific coefficient T-stat coefficient T-stat coefficient T-stat Coefficient T-stat
Bank size 0.015 0.33 0.05 1.03 0.01 0.21 0.043 0.95
Risk -1.5 -0.64 4.65*** 2.60 -0.012 -1.21 -0.001** -2.63
Liquidity 0.002 0.96 0.003 1.47 0.001 0.57 0.002 1.08
Taxation -0.17 -1.53 -0.13 -1.28 -0.18 -1.63 -0.25** -2.35
Capitalization 0.007 1.60 0.006 1.47 0.007 1.43 0.007 1.54
NTA 0.002 1.62 0.003* 1.98 0.002 1.53 0.003* 1.96
Labour productivity -0.05 -0.01 -3.3 -0.66 -0.49 -0.10 1.92 0.39
productivity 0.072 0.49 0.086 0.62 0.08 0.53 0.029 0.21
Industry-specific
Concentration -0.05** -2.47 -0.037** -2.05 -0.05** -2.49 -0.051*** -2.90
Stock market
development
-0.001** -2.48 -0.001* -1.81 -0.001** -2.31 -0.002*** -2.86
Macroeconomics
Inflation 0.035*** 2.97 0.03** 2.65 0.03*** 2.89 0.037*** 3.32
GDP growth 0.063*** 2.93 0.05** 2.38 0.06*** 2.87 0.069*** 3.42
Constant -0.086 -0.18 -0.39 -0.86 0.01 0.02 -0.16 -0.37
Dummy2 (JSCBs) -0.042 -0.64 -0.005 -0.08 -0.031 -0.49 -0.024 -0.39
Dummy3(CCBs) 0.081 0.79 0.132 1.35 0.069 0.70 0.11 0.240
observations 82 82 82 82
F-test 3.26*** 4.09*** 3.45*** 4.11***
*,**,** represent significance level of 10%, 5% and 1% respectively
189
Robustness check
In order to check the robustness of our results, we have conducted a number of alternative
tests. First, instead of using three-bank ratio as the measurement of concentration, we also use
the Herfindahl-Hirschman index and five-bank ratio as key alternative measurements of bank
concentration. Second, we re-estimate the equation 25 by using an instrumental variables
estimator and individual fixed effect estimator as suggested by Fernandez de Guevara and
Maudos (2007). To be more specific, technical efficiency was instrumented using its lagged
value. The results show that most of the variables are consistent for all the alternative
estimations, which show that our results are robust.
7.3 Summary and conclusion
This chapter provides the empirical results on the estimation of bank efficiency in China.
First, we estimate the efficiency of Chinese banks over the period 2003-2009. To be more
specific, we use the DEA CCR model to evaluate the technical efficiency of state-owned,
joint-stock and city commercial banks in China. Furthermore, we also use the DEA BCC
model to derive the pure technical and scale efficiencies of Chinese banks. The results
indicate that state-owned commercial banks have the highest overall technical efficiency over
the examined period, followed by the joint-stock commercial banks, while the city
commercial banks are found to have the lowest technical efficiency score. Based on the
decomposition of technical efficiency into pure technical efficiency and scale efficiency, the
results show that the state-owned commercial banks have the highest pure technical
efficiency score, followed by the joint-stock commercial banks, while the city commercial
banks are least pure technical efficient. We analyse that scale efficiency contributes more
than pure technical efficiency to the overall efficiency in the Chinese banking industry. In
other words, the inefficiency of Chinese commercial banks is attributed to pure technical
190
inefficiency rather than scale inefficiency. The results also suggest that Chinese commercial
banks are pure technically inefficient and faced with misallocation of inputs and outputs in
banking operation.
In the second stage of the analysis, we regress competition against the efficiency and
concentration in the Chinese banking sector. The results indicate that there is no evidence in
terms of the impact of efficiency on bank competition in China; while using the three bank
and five bank concentration ratios (as a measurement of concentration), the findings suggest
that in a higher concentrated banking market, the competition of the Chinese banking sector
is relatively lower.
Using different econometric methods, which include the OLS, Tobit regression and Bootstrap
truncated regression, we investigate the determinants of bank efficiency in China. The finding
suggests that liquidity negatively affects the bank efficiency and Chinese banks engaging in
more diversified activities are found to be more technically efficient. Furthermore, we find
that lower banking sector competition (measured by the Lerner index) encourages banks to
improve their efficiency.
When investigating the joint-effects of share return and risk on bank efficiency/ productivity
change in China, we find that larger banks in terms of total assets normally have a lower
volatility of efficiency during the examined period and banks with higher share return
normally have more stable efficiency. We also report that there is a significant and positive
impact of capitalization on efficiency change of Chinese banks. Furthermore, the results
suggest that Chinese bank efficiency/productivity tends to be more stable over the period
when operated in a lower inflationary environment, while the more developed of the banking
sector contributes to the higher productivity volatility of Chinese banks. Finally, the results
191
indicate that higher GDP growth contributes to the stability of productivity in the Chinese
banking sector.
The results from the seemingly unrelated regression in terms of the inter-relationship between
efficiency, capital and risk in the Chinese banking sector suggest that Chinese banks with
higher levels of capital normally have higher levels of technical and pure technical
efficiencies, while the technical and pure technical efficiencies of Chinese banks have
significant and positive impact on bank capitalization in China. The results did not show any
robust relationship between capital and risk, risk and efficiency in the Chinese banking
sector. This result is confirmed when we use the Grainger-Causality test to examine the
relationship between efficiency and risk in the Chinese banking sector. Although the results
show that there is a Grainger-causality between these two variables, however, it is also
significant for few cases.
Using GMM one step system estimator, we also investigate the joint impacts of efficiency
and competition on bank profitability in China. Both Lerner index and Panzar-Rosse H
statistic are used as the competition indicators while four profitability indicators are used as
the dependent variables, which include ROA, ROE, NIM and PBT. The results do not find
any robust impact of efficiency and competition on bank profitability in China.
In terms of the impact of efficiency and risk on bank competition in China, we report that
banks with higher technical efficiency normally operated in a lower competitive banking
environment as indicated by higher Lerner index. Using different risk indicators while
controlling for comprehensive bank-specific, industry-specific and macroeconomic
determinants of bank competition, we did not find any impact of risk on bank competition in
China.
192
Chapter 8
Conclusions and Limitations
8.1 Introduction and summary of findings
The banking sector in China plays an important role in the country‟s economic development.
Over the last thirty years, the Chinese government initiated several rounds of banking reforms
and the banking sector in China has experienced significant changes. The purposes of the
reforms are to improve the performance, increase the competition and enhance the stability in
the banking sector. Therefore, this research study seeks to investigate the performance,
competition conditions and risk conditions over the period 2003-2009. To be more specific,
we focus on various aspects of bank performance including bank technical
efficiency/productivity and bank profitability. More importantly, we empirically test the
inter-relationships between bank performance and bank competition.
A series of banking reforms were initiated by the Chinese government from late 1970s in
order to improve the performance, increase the competitive condition and build a safe and
stable banking sector. Before 1979, the Chinese banking sector followed the Soviet banking
model. The Peoples‟ Bank of China has the dual role of central bank as well as engaging in
commercial banking activities. The first round of banking reform was initiated by the
government over the period 1979-1992. A two-tier banking system was established during
this period, with PBC free to serve as central bank and four state-owned commercial banks
mainly engaging in commercial banking activities. Not only the state-owned commercial
banks, but also a number of joint-stock commercial banks, rural and urban credit cooperatives
were gradually established during this period. The second round of banking reform was
initiated by the Chinese government from 1993, the main purposes of which are to reduce
193
government intervention in banks‟ operation and enhance the stability in the banking sector.
Before 1993, four state-owned banks were under direct control of central government; they
had no power in terms of credit and lending decisions. State-owned commercial banks made
loans to large state-owned enterprises under government directions, while most of the state-
owned enterprises did not perform very well, which led to higher probability of default and
higher volume of non-performing loans accumulated by state-owned banks. In order to
alleviate this problem, three policy banks were established to undertake the policy lending
activities directed by the Chinese government. Therefore, the state-owned banks have more
freedom with regards to credit allocation. The Asian financial crisis happened in 1997 and
made the government more concerned with reducing the risk-taking behaviour and enhancing
stability in the Chinese banking sector. Since this time, four assets management companies
were established by government to write-off the non-performing loans for state-owned
commercial banks, and also the Chinese government injected equity capital to state-owned
commercial banks in order to reduce the level of risk and increase the competitive power.
The third round of banking reform was initiated by the Chinese government after China
joined the World Trade Organization (WTO) in December 2001. There are quite a few
measurements undertaken by Chinese government in this reform. To be more specific, the
new banking regulatory authority, China Banking Regulatory Commission, was established,
the restrictions of entry and operation of foreign banks were removed; Chinese banks
introduced foreign investors in banks‟ operation and banks were publically listed on the stock
exchange. By the end of 2009, the Chinese banking sector consisted of 5 state-owned (large
scale) commercial banks, 12 joint-stock commercial banks, a large number of city
commercial banks, etc. Although the proportion of assets of state-owned banks in total
banking sector assets decreases from 2003, the state-owned commercial banks still dominate
194
in the Chinese banking sector. By the end of 2009, the assets of 5 state-owned commercial
banks account for more than 50% of total banking sector assets.
Using 101 Chinese banks, we investigate the determinants of bank profitability with focus on
the impacts of inflation and GDP growth rates. Two profitability measures (Return on Assets
(ROA) and Net Interest Margin (NIM)) are used, which are widely applied in banking
profitability literature. While in order to deal with the issues of profit persistence,
endogeneity, unobserved heterogeneity, Generalized Method of Moments (GMM) two-step
system estimator is used to investigate the impact of inflation on bank profitability, while
GMM one-step system estimator is used to test the effect of GDP growth rate on bank
profitability. There are quite a few pieces of empirical research investigating the determinants
of bank profitability; our study contributes to the existing research by controlling for most
comprehensive determinants. To be more specific, we divide the determinants into three
groups, namely bank-specific determinants (bank size, liquidity, risk, capitalization, taxation,
non-traditional activity, labour productivity, overhead cost); and industry-specific variables
(banking sector concentration, banking sector development and stock market development).
The empirical results suggest that Chinese banks with higher volumes of overhead costs and
lower levels of taxation normally have higher profitability, while higher developed banking
market and higher developed stock market contribute to the profitability improvement of
Chinese banks. In addition, there is a significant and positive impact of inflation on Chinese
bank profitability while Chinese banks have higher profitability during the periods of
economic boom (higher GDP growth rate). Besides the examination of the impacts of
macroeconomic environment (inflation and GDP growth) on bank profitability, our study fills
the gap of empirical literature by testing the impact of stock market volatility on bank
profitability in China. Besides the traditional profitability indicators, such as Return on
Equity, Net Interest Margin (NIM) and Economic Value Added (EVA), our research builds
195
on the empirical study by firstly using the excess return on equity as one of the profitability
indicators. Under both the system and difference GMM estimators, the empirical results
suggest that Chinese state-owned and joint-stock commercial banks with higher volumes of
taxation normally have lower profitability in terms of Excess Return on Equity and Return on
Equity; further, there is a significant and negative impact of capital on Excess Return on
Equity and Return on Equity for joint-stock commercial banks. In addition, the findings
suggest that higher labour productivity and overhead cost lead to NIM improvement for both
state-owned and joint-stock commercial banks. It is reported that state-owned commercial
banks with higher volumes of non-traditional activity normally have lower NIM and EVA.
Finally, the results indicate that there is a significant and positive impact of stock market
volatility on bank performance.
Not only profitability is examined by our study, but the technical efficiency is also
investigated. Using non-parametric Data Envelopment Analysis (DEA) CCR model, we
examine the technical efficiency of 101 Chinese banks over the period 2003-2009. The
results indicate that state-owned commercial banks are most technically efficient, followed by
joint-stock commercial banks, while the city commercial banks are least technically efficient.
Furthermore, in order to find the sources of technical inefficiency, the DEA BCC model is
used to investigate the pure technical efficiency and scale efficiency. The findings suggest
that state-owned commercial banks have the highest pure technical efficiency, while the pure
technical efficiency of joint-stock commercial banks is higher than city commercial banks. In
addition, the efficiency scores derived from DEA BCC model show that Chinese banks have
higher scale efficiency than pure technical efficiency, which reflects that Chinese commercial
banks are pure technical inefficient and faced with misallocation of input and output in
banking operation.
196
One focus of the current thesis is to investigate the competitive condition in the Chinese
banking sector. Using 101 Chinese commercial banks under the Panzar-Rosse (1987) H
statistic, we find that Chinese commercial banks are operated under the condition of
monopolistic competition over the period 2003-2009. There are three other pieces of
empirical research investigating the competitive condition in the Chinese banking sector (as
mentioned in the literature review), however, there is no empirical study examining the
competitive conditions of different ownerships of Chinese banks. Our study fills this gap by
employing the Lerner index to assess the competitive conditions of state-owned, joint-stock
and city commercial banks over the period 2003-2009. The results suggest that joint-stock
commercial banks have the highest competition, while the city commercial banks have the
weakest competition over the examined period in general. The lowest competition is found
among state-owned commercial banks in 2003, while the highest competition is found among
joint-stock commercial banks in 2009.
Besides the investigations of bank profitability, technical efficiency and competition as
mentioned above, our study also investigates their inter-relationships. To be more specific,
using Panzar-Rosse H statistic as the key competition indicator, we investigate the joint-
effects of technical efficiency and concentration on bank competition, the concentration being
cross-checked by three and five bank concentration ratios. The results indicate that Chinese
banks operating in a higher concentrated market normally have lower competition, which is
in line with the traditional Structure-Conduct-Performance (SCP) hypothesis, while there is
no clear evidence with regards to the impact of technical efficiency on bank competition in
China. As far as we are concerned, it is the first empirical study to investigate the effects of
technical efficiency and concentration on bank competition in China.
The Chinese banking sector has undergone several rounds of reforms since 1979, the purpose
being to increase the competitive condition and further improve the performance of Chinese
197
banks. However, the competition fragility hypothesis argues that banks will undertake higher
risk in a more competitive banking environment; the higher risk-taking behaviour has a
negative impact on the banking sector stability. There are extensive studies investigating the
impact of competition on bank risk-taking behaviour in the European banking sector;
however, there is no study examining this issue in the Chinese banking sector. Using 101
Chinese banks over the period 2003-2001 under the GMM framework, we investigate the
impact of competition on risk of Chinese banks. The competition is measured by both Lerner
index and Panzar-Rosse H statistic, while the risk is cross-checked by the ratio of loan-loss
provision over total loans and Z-score. The empirical results suggest that there is no
significant impact of competitive condition on the risk-taking behaviour of Chinese banks.
Higher risk accumulates non-performing loans, which is supposed to negatively affect bank
profitability, while banks with higher profitability have better risk monitor and management
systems, which is helpful to reduce the risk. Higher competition induces banks to take on
higher risk, while banks with higher risk lower the bank margins and bank market power,
which leads to an increase in bank competition. The negative impact of competition on bank
profitability is documented by SCP hypothesis, while banks with higher profitability have
larger margins and market power, which is supposed to precede a decline in bank
competition. The next contribution of our research is to test the inter-relationships between
risk, competition and profitability in the Chinese banking sector. As far as we are aware, this
is the first study investigating this issue in this banking sector. The profitability is cross-
checked by Return on Assets and Return on Equity while Lerner index is used as the
competition indicator. With regards to the risk conditions, we use four different
measurements to check the robustness of the results, which are the ratio of loan loss provision
over total loans, volatility of ROA, volatility of ROE and Z-score. The seemingly unrelated
regression is used. The empirical findings suggest that there is a negative impact of
198
competition on bank profitability in China, while the impact of profitability on competition is
significant and negative.
Chinese banks with higher profitability normally have a good management system, which is
helpful in controlling and reducing costs and the cost reduction is supposed to increase the
technical efficiency of Chinese banks. Furthermore, higher competitive environment induces
bank mangers to increase the technical efficiency, which is argued by the competition-
efficiency hypothesis. Our study is the first empirical research investigating the effects of
profitability and competition on bank technical efficiency for China. The profitability is
measured by Return on Assets, while the competition is cross-checked by Lerner index and
Panzar-Rosse H statistic. We also control for comprehensive bank-specific, industry-specific
and macroeconomic determinants of bank technical efficiency. The bank-specific
determinants of technical efficiency mainly include bank size, credit risk, liquidity,
diversification, capitalization and labour productivity, while stock market development is
included as the industry-specific determinant. Also, inflation is considered as the
macroeconomic determinant of technical efficiency. In terms of the econometric methods, we
use ordinary least square estimator, Tobit regression and Bootstrap truncated regression. The
empirical results suggest that competition has a significant and negative impact on technical
efficiency of Chinese banks. Moreover, Chinese banks with higher volumes of diversified
business and lower levels of liquidity normally are more technical efficient. Finally, in a
higher inflationary environment, Chinese banks normally have higher technical efficiency.
There is an increasing volume of literature investigating the inter-relationships between risk,
efficiency and capitalization in banking sector; however, most of the studies focus on
European banking sector. There is no study examining this issue in Chinese banking industry.
We evaluate the inter-relationships between risk, capital and technical efficiency in the
Chinese banking sector over the period 2003-2009 under the seemingly unrelated regression
199
framework. The efficiencies used in the study include technical, pure technical and scale
efficiencies derived from DEA CCR and BCC models while four risk indicators are
considered, which are ratio of loan loss provision over total loans, volatility of ROA,
volatility of ROE and Z-score. The empirical findings suggest that Chinese banks with higher
levels of technical and pure technical efficiencies normally have higher levels of
capitalization while Chinese banks with higher levels of capitalization normally are more
technical and pure technical efficient.
The bad management hypothesis states that declines in efficiency will lead to increases in
banks‟ risk, while the bad luck hypothesis indicates that increases in banks‟ risk precede
technical efficiency declines. Our study contributes to Chinese banking literature by firstly
investigating the inter-relationships between technical efficiency and bank risk. The technical
efficiency is derived from the DEA CCR model, while the risk of Chinese banks is measured
by the ratio of loan loss provision over total loans and z-score. Various econometric methods
are used to check the robustness of the results, which include ordinary least square, fixed
effects estimator, random effects estimator, Generalized Method of Moments (GMM)
difference estimator, and one-step and two-step GMM system estimators. The empirical
results suggest that there is no clear evidence in terms of the inter-relationships between risk
and technical efficiency in the Chinese banking sector.
There is an extensive literature during recent years investigating the impact of share
return/price on efficiency/productivity changes, most of which focuses on the banking sectors
in developed countries, while no empirical research examines this issue in the Chinese
banking sector. The last round of banking reform in China encourages the banks to be listed
on the stock exchange to improve the performance, which makes this investigation the hot
issue in the Chinese banking sector. In this study, we investigate the effects of risk and share
return on technical efficiency change while controlling for comprehensive determinants such
200
as bank size, liquidity, taxation, capitalization, non-traditional activity, labour productivity,
banking sector development, stock market development, inflation and GDP growth rate. The
risk is cross checked by the ratio of loan loss provision over total loans, volatility of ROA,
volatility of ROE and Z-score. Besides changes of technical efficiency, our study also
considers the productivity changes. The empirical findings suggest that Chinese banks with
higher share returns normally have more stable efficiency while it is found that Chinese
banks normally have more stable productivity during periods of economic boom (higher GDP
growth rate).
Banks with higher efficiency have the ability to obtain higher market share, which further
leads to higher market power (lower competition), while higher risk reduces the bank margins
and market power, which is supposed to precede an increase in bank competition. Our study
contributes to the existing literature by testing the impacts of technical efficiency and risk on
competition in the Chinese banking sector under the ordinary least square estimator.
Technical efficiency is derived from the DEA CCR model while the competition is measured
by Lerner index, and the risk is cross checked by the ratio of loan loss provision over total
loans, volatility of ROA, volatility of ROE and z-score. We also control for comprehensive
determinants of bank market power (competition), which include bank size, liquidity,
taxation, capitalization, non-traditional activity, labour productivity, banking sector
concentration, stock market development, inflation and GDP growth rate. Furthermore, we
test the impact of productivity on competition in the Chinese banking sector. In order to
check the robustness of the results, fixed effects estimation is applied as an alternative test
and also three-bank concentration ratio is replaced by five bank concentration ratio. The
empirical findings suggest that the impact of efficiency on competition in the Chinese
banking sector is significant and negative, and also the competition is significantly affected
by the volume of non-traditional activity, banking sector concentration, stock market
201
development, inflation and GDP growth rate. We do not find any robust impact of risk on
bank competition in China.
Banks with higher efficiency have higher ability to reduce costs, which is supposed to
increase the bank profitability, while the traditional Structure-Conduct-Performance (SCP)
hypothesis argues that in a lower competitive environment, the bank profitability is higher.
Our study is the first piece of research investigating the joint-effects of competition and
technical efficiency on Chinese bank profitability. The profitability is measured by four
different indicators namely: return on assets, return on equity, net interest margin and profit
margin. Technical efficiency is derived from DEA CCR model, while the competitive
condition is cross-checked by Lerner index and Panzar-Rosse H statistic. We also control for
comprehensive bank-specific, industry-specific and macroeconomic determinants of bank
profitability such as bank risk, liquidity, taxation, capitalization, overhead cost, non-
traditional activity, labour productivity, banking sector concentration, stock market
development and annual inflation rate. We apply one-step system GMM technique for the
estimation. The empirical results show mixed findings in terms of the impacts of competition
and technical efficiency on profitability in the Chinese banking sector.
8.2 Policy implications
The empirical findings from this study give the directions of the future reforms in the Chinese
banking sector; also we propose policy implications to the government and banking
regulatory authority in terms of how to improve bank performance in China. The policy
implications from this study can be summarized as follows:
Chinese banks should provide more professional and training opportunities to staffs in the
area of non-traditional activities. Although the Chinese banking sector has undergone several
rounds of reforms over the last 30 years, the banking structure has experienced significant
202
changes; however, the banking business is still underdeveloped. The Chinese banking sector
still focuses their business on traditional loan-deposit services, while the non-interest income
derived from non-traditional activities accounts for a minor role in banking operation. The
Chinese banks should gradually develop their non-traditional activities due to the fact that the
interest income is greatly influenced by the macroeconomic environment, while the
development of non-traditional activities will reduce the degree of banks‟ dependency on
interest-earning activities. Also, the improvement of non-traditional activities will increase
the competitive power of Chinese banks internationally. Finally, the well-developed interest-
earning activities and non-traditional activities will give bank opportunities to obtain profits
from economies of scope.
Chinese banks should provide more opportunities to staffs in order to improve their
productivity. The demand for banking services in China is huge and the higher labour
productivity indicates that each employee generates higher volume of revenue for the bank
which precedes an improvement in bank profitability. In other words, the banking staffs in
China should be trained to have higher communication skills through which the staffs can
establish and maintain the network and attract more customers and business for the banks.
Another way to improve labour productivity is to improve the technology in banking
operation. As mentioned earlier, the demand for banking services in China is huge and it is a
common phenomenon that some of the banks have a queue to the door; some of the
customers do not want to wait and prefer to go to a bank with higher efficiency. In other
words, Chinese banks are recommended to deal with this issue. One measurement that can be
considered is to further develop e-banking services, which will substantially improve the
speed of services provided by banks. Besides providing training opportunities and further
developing e-banking, the banks can provide higher salaries to recruit/attract more staffs with
higher productivity. The higher socialised skills and good networks will produce substantial
203
amount of business for the bank; the revenue increase from the business will be greater than
the salaries they receive.
Chinese government should further develop the stock market. The last round of banking
reform in China focuses on the public listings of banks on the stock exchange, while the
Chinese government should encourage other firms from other industries to be listed on stock
exchanges. Because the stock market development is measured by the ratio of market
capitalization of listed firms over GDP, the increasing number of listed firms will contribute
to the market capitalization, and higher market capitalization promotes the development of
stock market. The stock exchange provides more valuable information to banks regarding the
credit information on the listed firms, which will reduce the banks‟ cost of credit monitoring;
also, the default rate on loans will decline. Furthermore, the reduction of bank cost and
decline in bank risk will increase banks‟ borrowing capacity, which precedes an increase in
bank profitability.
There are quite a few measurements that can be taken by Chinese bank managers and
government in order to improve Chinese bank efficiency. First, the Chinese government
should gradually reduce the degree of competition in the banking sector. Higher competition
in banking sector induces bank managers to adopt strategies to attract more customers, which
will involve increases in the sources of screening and monitoring borrowers. The increases in
the sources lead to increases in bank costs, which further precede a decline in bank
efficiency.
Chinese banks should be encouraged to engage in more loan business. During several rounds
of banking reforms in China, Chinese banks have improved their capability of risk
management. To be more specific, Chinese banks‟ improvement in the risk management
ability is partly attributed to the establishment of China Banking Regulatory Commission
204
which supervises the banking operation and makes relevant policies and establishes relevant
mechanisms of risk monitoring. More importantly, Chinese banks have attracted a number of
foreign investors in operation, from which they obtain more experience in risk checking,
monitoring and management. Large volume of loans made by banks under proper risk
management will enlarge the banking output, which precedes a further improvement in bank
efficiency.
Relevant policies can be made by the Chinese banking regulatory authority to increase the
capital levels of Chinese banks. Although, as mentioned above, through several rounds of
banking reforms in China, Chinese banks have increased the capacity of risk management,
the risk still persists in the banking sector. Higher levels of capital work as a cushion to
absorb the risk and the banks with higher levels of capitalization can make larger amount of
loans, which precedes an increase in banking output and improvement in bank efficiency.
Furthermore, banks with higher levels of capital have higher reputation and higher trust from
customers, which leads to an increasing volume of customers and transactions; the resulting
increases in output lead to an improvement in bank efficiency. Finally, Chinese banks with
higher levels of capital have higher ability to reduce the volume of borrowing funds,
therefore, the borrowing cost is reduced, which results in an improvement in bank efficiency.
8.3 Limitations of the study and further research
Our study has some limitations and we have some potential directions for future work. First,
we should use different inputs and outputs in DEA to see whether it influences the efficiency
scores of Chinese banks. The second shortcoming for the present study is that we only
estimate the technical, pure technical and scale efficiencies of Chinese banks. Technical
efficiency is the effectiveness with which a given set of inputs is used to produce an output,
which emphasises on the cost of the production. However, besides the fact that the bank
205
managers consider the banking cost, they will also emphasise on the profit efficiency which
captures the inefficiencies on both the output and input sides. Thus, the further research
should investigate the profit efficiency of the Chinese banking sector which will be valuable
for the empirical literature in the Chinese banking industry.
In terms of the methodology on several measures of technical efficiency in the Chinese
banking sector, we use the non-parametric Data Envelopment Analysis (DEA) in our study.
However, there are another three non-parametric methods to measure the efficiency, which
are the distribution free approach, the thick frontier approach and the free disposal hull
approach. Applying these methods in examining the Chinese banking efficiency will be
valuable to researchers and policy makers in terms of obtaining new estimations on the
situation of bank efficiency in China. In the current study, we use the Panzar-Rosse H
statistic and the Lerner index to measure the competitive condition of the Chinese banking
sector. Future research should consider the Boone indicator, which has the advantage of
measuring competition for several specific product markets. We should use this indicator to
measure the competition in the Chinese banking sector in terms of deposit and loan markets;
also we can further examine the competition for state-owned commercial banks, joint-stock
commercial banks and city commercial banks separately and comparing it with the Lerner
index.
In terms of stability/risk in the Chinese banking sector, we use the ratio of loan-loss provision
over total loans as the indicator, complemented by three alternative measurements, which are
the volatility of ROA, volatility of ROE and the Z-score. Further research should apply
“stability inefficiency,” which considers the deviation of the bank‟s current stability from the
maximum stability given the economic and regulatory conditions.
206
Bibliography
Abreu M. & Mendes, V. (2001). Commercial Bank Interest Margins and Profitability:
Evidence for Some EU Countries. Paper presented on the 50th International Atlantic
Economic Conference, 17 May-20 May 2001, Thessaloniki, Greece.
Aburime, U. T. (2009). Impact of Political Affiliation on Bank Profitability in Nigeria.
African Journal of Accounting, Economics, Finance and Banking Research, 4, 61-75.
Agoraki, M.E., Delis, M.D. & Pasiouras, F. (2009). Regulations, competition and bank risk-
taking in transition countries. Journal of Financial Risk, 71(3), 38-48.
Akhavein, J., Berger, A. N. & Humphrey, D. B. (1997). The effects of megamergers on
efficiency and prices: Evidence from a bank profit function. Review of Industrial
Organization, 12(1), 95–139.
Akmal, M. & Saleem, M. (2008). Technical efficiency of banking sector in Pakistan, SBP
Research Bulletin, 4, 61-79.
Albertazzi, U. & Gambacorta, L. (2009). Bank profitability and the business cycle. Journal of
Financial Stability, 5(4), 393-409.
207
Albertazzi, U. & Gambacorta, L. (2010). Bank profitability and taxation. Journal of Banking
and Finance, 34, 2801-2810.
Allen, F. & Gale, D. (2000). Comparing financial systems. Cambridge: The MIT Press.
Allen, F. & Gale, D. (2004).Competition and financial stability. Journal of Money, Credit and
Banking, 36,433-480.
Al-Muharrami, S., Matthews, K. & Khabari, Y. (2006). Market structure and competitive
conditions in the Arab GCC banking system. Journal of Banking and Finance, 30, 3487-3501.
Altunbas, Y., Carbo, S., Gardener, E.P.M. & Molyneux, P. (2007). Examining the
relationships between capital, risk and efficiency in European Banking. European Financial
Management, 13, 49-70.
Amba, M. S. & Almukharreq, F. (2013). Impact of the Financial Crisis on Profitability of the
Islamic Banks vs. Conventional Banks-Evidence from GCC. International Journal of
Financial Research, 4, 84-93.
Angbazo, L. (1997). Commercial bank net interest margin, default risk, interest-rate risk and
off-balance sheet banking. Journal of Banking and Finance, 21, 55-87.
208
Arellano, M. & Bond, S.R. (1991). Some tests of specification for panel data: Monte Carlo
evidence and an application to employment equations. Review of Economic Studies, 58,
277–297.
Arellano, M. & Bover, O. (1995). Another look at the instrumental-variable estimation of
error-components models. Journal of Econometrics, 68, 29–52.
Ariff, M. & Can, L. (2008). Cost and profit efficiency of Chinese banks: a non- parametric
analysis. China Economic Review, 19, 260-273.
Ariss, R. T. (2010). On the implications of market power in banking: evidence from
developing countries. Journal of Banking and Finance, 34, 765-775.
Athanasoglou, P.P., Brissimis, S.N. & Delis, M.D. (2008). Bank-Specific, Industry-Specific
and Macroeconomic Determinants of Bank Profitability. Journal of International Financial
Markets, Institutions and Money, 18(2), 121-136.
Bain, J. S. (1951). Relation of profit rate to industry concentration. Quarterly Journal of
Economics, 65, 293-324.
Banker, R. D., Charnes, A. & Cooper, W.W. (1984). Some models for estimating technical
and scale inefficiencies in Data Envelopment Analysis. Management Science, 30, 1078-1092.
209
Barney, J. B., and Clark, D. N. (2007). Resource-Based Theory: Creating and Sustaining
Competitive Advantage. Oxford: Oxford University Press.
Barrios, V.E. & Blanco, J. M. (2003). The effectiveness of bank capital adequacy regulations:
an empirical approach. Journal of Banking and Finance, 27, 1935-1958.
Bashir, A. (2000). Determinants of Profitability and Rates of Return Margins in Islamic
Banks: Some Evidence from the Middle East. Islamic Economic Studies, 11(1), 31-57.
Baumol, W. J., Panzar, J. C. & Willig, R. D. (1982). Contestable markets and the theory of
industry structure, Harcourt Brace Jovanovich, San Diego, CA.
Beccalli, E., Casu, B. & Girardone, C. (2006). Efficiency and stock performance in European
banking. Journal of Business Finance and Accounting, 33(1-2), 245-262.
Beck, T., Hesse, H., Kick, T. & Westernhagen, N. V. (2009). Bank ownership and stability:
evidence from Germany. VOX working paper 2009.
Ben Naceur, S. (2003). The Determinants of the Tunisian Banking Industry Profitability:
Panel Evidence, Paper presented at the Economic Research Forum (ERF) 10th
Annual
Conference, Marrakesh, Morocco.
210
Ben Naceur, S. & Goaied, M. (2008). The determinants of commercial bank interest margin
and profitability: evidence from Tunisia. Frontier in Finance and Economics, 5, 1, 106-130.
Berger, A. N. (1995a). The relationship between capital and earnings in banking. Journal of
Money, Credit and Banking, 27, 432–456.
Berger, A. N. (1995b).The Profit-Structure Relationship in Banking: Test of Market power
and Efficient Structure Hypothesis. Journal of Money, Credit and Banking, 27(2), 404-431.
Berger, A. N., Bonime, S. D., Covitz, D. M. & Hancock, D. (2000).Why are bank profits so
persistent? The roles of product market competition, informational opacity, and
regional/macroeconomic shocks. Journal of Banking and Finance, 24, 1203–1235.
Berger, A.N. & DeYoung, R. (1997). Problem loans and cost efficiency in commercial
banking. Journal of Banking and Finance, 21, 849-870.
Berger, A. N. & Udell, G. (2004).The institutional memory hypothesis and the procyclicality
of bank lending behaviour. Journal of Financial Intermediation, 13(4), 458-495.
Berger, A. N., Hasan, I. & Zhou, M. (2009). Bank ownership and efficiency in China: what
will happen in the world‟s largest nation? Journal of Banking and Finance, 33,113-130.
211
Berger, A. N., Klapper, L. F. &Turk-Ariss, R. (2009). Bank Competition and Financial
Stability. Journal of Financial Services Research, 35, 99-118.
Berger, A. N. & Humphrey, D, B. (1997). Efficiency of financial institutions: international
survey and directions for future research. European Journal of Operation Research, 98,175–
212.
Bikker, J. A. & Bos, J. (2005). Trends in competition and profitability in the banking
industry: A Basic Framework. SUERF-The European Money and Finance Forum, 2005/2.
Bikker, J.A. & Groeneveld, J.M. (2000).Competition and concentration in the EU banking
industry. Kredit und Kapital, 33, 62–98.
Bikker, J.A. & Haaf, K. (2002). Competition, concentration and their relationship: an
empirical analysis of the banking industry. Journal of Banking and Finance, 26, 2191–2214.
Bikker, J. & Hu, H. (2002). Cyclical patterns in profits, provisioning and lending of banks
and procyclicality of the new Basel capital requirements. BNL Quarterly Review, 221, 143–
175.
Bikker, J., Spierdijk, L. & Finnie, P. (2006). The impact of bank risk on market power.
Working paper No. 120/2006, De Nederlandsche Bank.
212
Bikker, J. A., Spierdijk, L. & Finnie, P. (2007). The Impact of Market Structure,
Contestability and Institutional Environment on Bank Competition. DNB working paper No.
156.
Blaug, M. (2010). Is competition such a good thing? Static efficiency versus dynamic
efficiency. Review of Industrial Organization, 19, 37-48.
Blundell, R. & Bond, S. (1998). Initial conditions and moment restrictions in dynamic panel
data model. Journal of Econometrics, 87, 115-143.
Blundell, R. & Bond, S. (2000). GMM estimation with persistent panel data: an application to
production functions. Econometric Reviews, 19, 321-340.
Bond, S. (2002). Dynamic panel data models: a guide to micro data methods and practice.
Portuguese Economic Journal, 1(2), 141-62.
Boot. A. W. & Schmeits, A. (2005). The competitive challenge in banking. Working paper
2005-08, Amsterdam Centre for Law and Economics, Universiteit Van Amsterdam.
Bourke, P. (1989). Concentration and other determinants of bank profitability in Europe,
North America and Australia. Journal of Banking and Finance, 13, 65–79.
213
Boyd, J. H. & De Nicolo, G. (2005). The theory of bank risk taking and competition
revisited. Journal of Finance, 60, 1329-1343.
Boyd, J. H., De Nicolo, G. & Jalal, A.M. (2006). Bank risk taking and competition revisited:
new theory and evidence, Working Paper No 06/29.International Monetary Fund.
Brean, D. J. S. (2007). Bank Reform in China: What It Means for the World. Asia Pacific
Foundation of Canada.
Buch, C. M., Eickmeier, S. & Prieto, E. (2010). Macroeconomic factors and micro-level bank
risk, Discussion Paper No 20/2010. Deutsche Bundesbank.
Canals, J. (1993). Competitive Strategies in European Banking. Oxford: Clarendon Press.
Cao, L. (2007). Efficiency evaluation of China‟s commercial bank based on super-efficiency
model. Paper presented at the 6th
Wuhan International conference on E-business, 26-27 May,
Wuhan, China.
Carbo-Valverde, S., Humphrey, D., Mandos, J. & Molyneux, P. (2009).Cross-country
comparisons of competition and pricing power in European Banking. Journal of International
Money and Finance, 28, 115-134.
214
Carletti, E. (2008). Competition and regulation in Banking. In: Anjan V. Thakor and Arnoud
W. A. Boot (Ed.), Handbook of Financial Intermediation and Banking (pp.441-447).
Amsterdam: Elsevier.
Casu, B. & Girardone, C. (2009). Competition issues in European Banking. Journal of
Financial Regulation and Compliance, 17, 119-133.
Casu, B. & Girardone, C. (2006). Bank competition, concentration and efficiency in the
single European market. The Manchester School, 74(4), 441-468.
Casu, B. & Molyneux, P. (2003).A comparative study of efficiency in European banking.
Applied Economics, 35, 1865-1876.
Cave, D. W., Christensen, L. R. & Diewert, W. E. (1982). The Economic Theory of Index
Numbers and the measurement of input, output and productivity. Econometrica, 50(6), 1393-
1414.
Chan, Y. S., Greenbaum, S. I. & Thakor, A. V. (1986).Information reusability, competition
and bank asset quality. Journal of Banking and Finance, 10, 255-276.
Chantapong, S. (2005). Comparative study of domestic and foreign bank performance in
Thailand: The regression analysis. Economic Change and Restructuring, 38(1), 63–83.
215
Charnes, A., Cooper, W.W.& Rhodes, E. (1978).Measuring the efficiency of decision making
units, European Journal of Operation Research, 2, 429-444.
Charnes, A., Cooper, W. W., Lewin, A. Y. & Seiford, L. M. (1995).Data envelopment
analysis: Theory methodology and applications. Boston: Kluwer.
Chen, Y. (2010). Development Finance and Urbanization Development in China. Economics
Studies, Vol. 7.
Chen, X., Skully, M. & Brown, K. (2005). Bank efficiency in China: application of DEA to
pre- and post-deregulation eras: 1993-2000.China Economic Review, 16, 229-245.
Chen, X. (2007). Banking deregulation and credit risk: evidence from the EU. Journal of
Financial Stability, 2, 356-290.
Chen, J. & Shi, H. (2004). Banking and insurance in the New China: competition and the
challenge of accession to the WTO. Cornwall: Edward Elgra.
Claeys, S. & Vennet, R. V. (2008). Determinants of bank interest margin in Central and
Eastern Europe: a comparison with the west. Economic Systems, 32(2), 197-216.
216
Claessens, S. & Laeven, L. (2004). What drives bank competition? Some international
evidence. Journal of Money, Credit and Banking, 36,563-584.
Coccorese, P. (2004). Banking competition and macroeconomic conditions: a disaggregate
analysis. International Journal of Financial Markets, Institutions and Money, 14, 203-219.
Coelli, T. (1996). A Guide to DEAP version 2.1: a data envelopment analysis (computer)
program. CEPA working paper, 1996/08.
Cooper, M., Jackson, W. & Patterson, G. (2003). Evidence of predictability in the cross
section of bank stock returns. Journal of Banking and Finance, 27, 817–850.
Das, A. & Ghosh, S. (2007). Determinants of credit risk in Indian state-owned banks: An
Empirical Investigation. Economic Issues, 12, 27-46.
De Bandt, O. & Davis, E.P. (2000). Competition, contestability and market structure in
European banking sectors on the eve of EMU. Journal of Banking and Finance, 24, 1045–
1066.
Debreu, G. (1951). The coefficient of resource utilization. Econometrica, 19, 273-292.
217
Degryse, H., Kim, M. & Ongena, S. (2009). Micreoconometrics of Banking. Oxford: Oxford
University Press.
Delis, M. D. (2012). Bank competition, financial reform and institutions: the importance of
being developed. Journal of Development Economics, 97, 450-465.
Dell‟Ariccia, G. & Marquez, R. (2006). Lending booms and lending standards. Journal of
Finance, 61(5), 2511-2546.
Demirgüç-Kunt, A. & Maksimovic, V. (1998). Law, Finance and Firm Growth.
Journal of Finance, 53(6), 2107-2137.
Demirguc-Kunt, A. & Huizinga, H. (1999). Determinants of Commercial Bank
Interest Margins and Profitability: Some International Evidence. World Bank
Economic Review, 13(2), 379-408.
Demirguc-Kunt, A. & Huizinga, H. (2000). Financial Structure and Bank profitability. Policy
Research Working Paper No. 2430, World Bank.
Demirguc-Kunt, A. & Huizinga, H. (2001). Financial structure and bank profitability,
Financial Structure and Economic Growth: A cross-country comparison of banks, markets
and development. Cambridge: MIT press.
218
Demirguc-Kunt, A. & Huizinga, H. (2010). Bank activity and funding strategies: the impact
on risk and return. Journal of Financial Economics, 98(3), 626-650.
Demirguc-Kunt, A. & Peria, M. S. M. (2010). A Framework for Analysing Competition in
the Banking Sector: An Application to the Case of Jordan. Policy Research working paper
No. 5499, 1-24.
Demsetz, H. (1973). Industry Structure, Market Rivalry and Public Policy. Journal of Law
and Economics, 16, 1-10.
Demsetz, R.S., Saindenberg, M.R. & Strahan, P.E. (1996). Banks with something to lose: the
disciplinary role of franchise value. Federal Reserve Bank of New York Economic Policy
Review, 2, 1-14.
DeYoung, R., Hasan, I. & Kirchhoff, B. (1998). The Impact of out-of-state entry on the cost
efficiency of local commercial banks. Journal of Economics and Business, 50, 191-203.
Dick, A. & Lehnert, A. (2010). Personal bankruptcy and credit market competition. Journal
of Finance, 65, 655-686.
Dietrich, A. & Wanzenried, G. (2011).Determinants of bank profitability before and during
the crisis: evidence from Switzerland. Journal of International Financial Markets, Institutions
and Money, 21(3), 307-327.
219
Duca, J. & McLaughlin, M. (1990). Developments affecting the profitability of commercial
banks. Federal Reserve Bulletin, July, 477–499.
Economist (1992). Wish you hadn‟t asked? The Economist, 8 August, pp.77-8.
Editz, T., Michael, I. & Perraudin, W. (1998). The impact of capital requirements on U.K.
bank behaviour. Reserve Bank of New York Policy Review, 4, 15-22.
Eichengreen, B. & Gibson, H. D. (2001). Greek banking at the dawn of the new millennium,
CEPR Discussion Paper No 2791, London.
Erdem, C. & Erdem, M. S. (2008). Turkish banking efficiency and its relation to stock
performance. Applied Economic Letters, 15(3), 207-211.
Erickson, T. & Whited, T. (2002).Two-step GMM estimation of the Errors-In-Variables
Model Using High-Order Moments. Econometric Theory, 18, 776-799.
Estelle, S.M., Johnson, A.C. & Ruggiero, J. (2010).Three-stage DEA models for
incorporating exogenous inputs, Computers and Operations Research, 37, 1087-1090.
Evanoff, D. & Ors, E. (1988). Local Market Consolidation and Bank Productive Efficiency.
Federal Reserve Bank of Chicago Working Paper No. 2002-25.
220
Fare, R., Grosskopf, S. &Weber, W. L. (2004). The effect of risk-based capital requirements
in profit efficiency in banking. Applied Economics, 36(15), 1731-1743.
Farrell, M. J. (1957). The measurement of productive efficiency. Journal of the Royal
Statistical Society, 120 (3), 253-290.
Fernandez de Guevara, J., Mandos, J. & Perez, F. (2005). Market power in European
Banking. Journal of Financial Services Research, 27, 109-137.
Fernandez de Guevara, J. & Maudos, J. (2007). Explanatory factors of market power in the
banking system. The Manchester School, 75(3), 275-296.
Fiordelesi, F. & Molyneux, P. (2010), Total factor productivity and shareholder returns in
banking. OMEGA: The International Journal of Banking and Finance, 38, 241-253.
Fiordelisi, F., Girardone, C. & Radic, N. (2011a). Price competition, efficiency and riskiness
in investment banking. Available at SSRN: http://ssrn.com/abstract=1786753.
Fiordelisi, F., Marques-lbanez, D. & Molyneux, P. (2011b). Efficiency and risk in European
banking. Journal of Banking and Finance, 35, 1315-1326.
221
Fu, M. &Heffernan, S. (2007). Cost X-efficiency in China‟s banking sector. China Economic
Review, 18, 35-53.
Fu, M. (2009). Competition in Chinese commercial banking. Banking and Finance Review, 1,
1-16.
Fu, M. & Heffernan, S. (2009). The effects of reform on China‟s bank structure and
performance. Journal of Banking and Finance, 33, 39-52.
Fukuyama, H. & Matousek, R. (2011). Efficiency of Turkish banking: two-stage network
system. Variable returns to scale model. Journal of International Financial Markets,
Institutions and Money, 21, 75-91.
Garcia-Herrero, A., Gavila, S. & Santabarbara, D. (2006). China‟s Banking Reform: An
Assessment of its Evolution and Possible Impact. CESifo Economic Studies, 52, 304-363.
Garcia-Herrero, A., Gavila, S. & Santabarbara, D. (2009). What explains the low profitability
of Chinese banks? Journal of Banking and Finance, 33, 2080-2092.
Garza-Garcia, J. G. (2012). Determinants of bank efficiency in Mexico: a two-stage analysis.
Applied Economics Letters, 19, 1679-1682.
222
Gelos, R. G. & Roldos, J. (2004). Consolidation and market structure in emerging market
banking system. Emerging Market Review, 5, 1, 39-59.
Ghatak, S. & Siddiki, J. (2001). The use of ARDL approach in estimating virtual exchange
rates in India. Journal of Applied Statistics, 11, 573-583.
Girardone, C., Molyneux, P. & Gardener, E.P.M. (2004).Analysing the determinants of bank
efficiency: the case of Italian banks. Applied Economics, 36, 215-227.
Giustiniani, A. & Ross, K. (2008). Bank competition and efficiency in the Fry Macedonia.
South-Eastern Europe. Journal of Economics, 2,145-167.
Goddard, J. A., Molyneux, P. M. &Wilson, J.O.S. (2001). European banking: efficiency,
technology and growth. Chichester: Wiley.
Goddard, J., Molyneux, P. & Wilson, J. (2004a). Dynamic of growth and profitability
in banking. Journal of Money, Credit and Banking, 36(6), 1069–1090.
Goddard, J., Molyneux, P. &Wilson, J. (2004b). The profitability of European banks: a cross-
sectional and dynamic panel analysis. The Manchester School, 72, 363-381.
223
Goddard, J., Molyneux, P., Liu, H. & Wilson, J. (2013). Do bank profits converge? European
Financial Management, 19(2), 345-365.
Goddard, J., Molyneux, P., Liu, H. & Wilson, J. (2011). The persistence of bank profit.
Journal of Banking and Finance, 35, 2881-2890.
Graham, C. & Bordelean, E. (2010). The impact of liquidity on bank profitability, Working
paper No2010-38. Canada: Bank of Canada.
Greene, W. H. (2003). Econometric Analysis, 5th
Ed. New York: Prentice Hall.
Guru B., Staunton, J. & Balashanmugam, B. (2002). Determinants of Commercial
Bank Profitability in Malaysia. Paper presented at the 12th
Annual Australian Finance and
Banking Conference, Sydney, Australian.
Hameed, A. & Bashir, M. (2003). Determinants of profitability in Islamic banks: some
evidence from the Middle East. Islamic economic studies, 11(1), 31-57.
Haq, M. & Heaney, R. (2012). Factors determining European bank risk. Journal of
International Financial Markets, Institutions and Money 22, 696-718.
Hasan, I. & Xie, R. (2012). A note on foreign bank entry and bank corporate governance in
China. BOFIT Discussion Paper No.8/2012, Bank of Finland, BOFIT.
224
Hassan, M. K. & Bashir, A. H. M. (2003). Determinants of Islamic banking profitability.
Paper presented at the 10th ERF Annual Conference, Morocco.
Heffernan, S. & Fu, M. (2010). Determinants of financial performance in Chinese banking.
Applied Financial Economics, 20, 1585-1600.
Hempell, H. S. (2002). Testing for competition among German Banks. Economic Research
Centre, Deutsche Bundesbank, Discussion Paper 04/02.
Herring, R. J. & Carmassi, J. (2010). The corporate structure of International Financial
Conglomerates: complexity and its implications for safety and soundness. In A.N. Berger, P.
Molyneux and J.O.S. Wilson (ed.), Oxford Handbook of Banking. Oxford: Oxford University
Press.
Hesse, H. & Cihak, M. (2007). Competitive banks and financial stability, Working paper No.
07/02, International Monetary Fund.
Hicks, J. (1935). The theory of Monopoly. Econometrica, 3, 1-20.
Hoff, A. (2007). Second stage DEA: Comparison of approaches for modelling the DEA
score. European Journal of Operational Research, 1 8, 425-435.
225
Hoggarth, G., Milne, A. & Wood, G. (1998). Alternative Routes to Banking Stability:
A Comparison of UK and German Banking Systems. Bank of England Financial Stability
Review, 5, 55-68.
Hortlund, P. (2005). Do inflation and high taxes increase bank leverage? SSE/EFI working
paper series, no. 612.
Hu, J. L., Chu, W. K., Hu, X. L. & Lee, C. Y. (2009).Operational environment-adjusted
nationwide bank efficiency in China. Journal of Management Research, 9, 142-158.
Hughes, J.P. & Moon, C. (1995). Measuring bank efficiency when managers trade return for
reduced risk. Working Paper No. 199520.Department of Economics, Rutgers University.
Hughes, Joseph P., Mester, Lorreta J. & Moon, Choon-Geol. (2001). Are scale economies in
banking elusive or illusive? Evidence obtained by incorporating capital structure and risk-
taking into models of bank production. Journal of Banking and Finance, 25, 2169-2208.
Hutapea, E.G. & Kasri, R.A. (2010). Bank margin determination: a comparison between
Islamic and conventional banks in Indonesia. International Journal of Islamic and Middle
Eastern Finance and Management, 3(1), 65-82.
Iannotta, G., Nocera, G. & Sirono, A. (2007).Ownership structure, risk and performance in
the European banking industry. Journal of Banking and Finance, 31, 2127-2149.
226
Ioannidis, C., Molyneux, P. & Pasiouras, F. (2008). The relationship between bank efficiency
and stock return: evidence from Asia and Latin American, Working paper series No 2008/10,
School of Management, University of Bath.
Isik, I. & Hassan, M. (2003). Efficiency, ownership and market structure, corporate control
and governance in the Turkish banking industry. Journal of Business Finance and
Accounting, 30, 1363-1421.
Jackson, P. M. & Fethi, M. D. (2000). Evaluating the technical efficiency of Turkish
commercial banks: An application of DEA and Tobit Analysis. Paper presented at the
International DEA symposium, University of Queensland, Brisbane, Australia, 2-4 July.
Jeitschko, T. D. & Jeung, S. D. (2005). Incentives for risk-taking in banking-A unified
approach. Journal of Banking and Finance, 29, 759-777.
Jiang, G., Tang, N., Law, E. & Size, A. (2003). Determinants of Bank Profitability in
Hong Kong. Hong Kong Monetary Authority Quarterly Bulletin, September, 5-14.
Jiang, C. X., Yao, S. J. & Zhang, Z. Y. (2009). The effects of governance changes on bank
efficiency in China: a stochastic distance function approach. China Economic Review, 20,
717-731.
227
Judson, R. A., & Owen, A. L. (1999).Estimating dynamic panel data models: a guide for
macroeconomics. Economics Letters, 65, 9-15.
Karasulu, M. (2001). The Profitability of the Banking Sector in Korea. IMF Country Report,
July.
Kasman, A. and Yildirim, C. (2006). Cost and profit efficiency in transition banking: the
case of new EU members. Applied Economics, 38, 1079-1090.
King, R.G. & Levine, R. (1993a). Finance and Growth, Schumpeter might be Right.
Quarterly Journal of Economics, 108, 717-738.
King, R.G. & Levine, R. (1993b). Finance, Entrepreneurship and Growth: Theory and
Evidence. Journal of Monetary Economics, 35, 513-542.
King, M. R. (2009). The cost of equity for global banks: a CAPM perspective from 1990 to
2009. Bank of International Settlements Quarterly Review, September, 59-73.
Koopmans, T. C. (1951). An analysis of production as an efficient combination of activities,
in T. C. Koopmans, (Ed.), Activity Analysis of Production and Allocation. New York: Wiley.
228
Kosmidou, K., Pasiouras, F., Doumpos, M. & Zopounidis, C.(2003). Assessing performance
factors in the UK banking sector: a multi criteria methodology. Paper presented at the 4th
conference of International Economics and Finance Society on “Finance and the International
Economy”, London.
Kosmidou, K. (2008). The determinants of banks‟ profits in Greece during the period of EU
financial integration. Managerial Finance, 34(3), 146-159.
Kumbhakar, S.C. & Wang D. (2007). Economic reforms, efficiency and productivity in
Chinese banking. Journal of Regulatory Economics, 32, 105-129.
Kumbhakar, S. C., Lozano-Vivas, A., Lovell, C. A. K. & Hasan, I. (2001). The Effects of
Deregulation on the Performance of Financial Institutions: The case of Spanish Saving
Banks. Journal of Money, Credit and Banking, 33, 101-120.
Kwan, S. & Eisenbeis, R. (1997).Bank risk, capitalization and operating efficiency. Journal
of Financial Services Research, 12, 117-31.
Laurenceson, J. & Zhao, Y. (2008). Efficiency amongst China‟s banks: a DEA analysis five
years after WTO entry. China Economic Journal, 1, 275-285.
Lerner, A. P. (1934). The Concept of Monopoly and the Measurement of Monopoly Power.
The Review of Economic Studies, 1, 157-175.
229
Levine, R. & Zervos, S. (1998). Stock Markets, Banks, and Economic Growth.
American Economic Review, 88, 537-558.
Liadaki, A. & Gaganis, C. (2010). Efficiency and stock performance of EU banks: is there a
relationship? Omega, 38(5), 254-259.
Liu, H. & Wilson, J. (2010). The profitability of banks in Japan. Applied Financial
Economics, 20(24), 1851-1866.
Liu, H. & Wilson, J. O. S. (2013a). Competition and risk in Japanese banking. The European
Journal of Finance, 19(1), 1-18.
Liu, H. & Wilson, J. O. S. (2013b). Competition and stability in European Banking: a
regional analysis. The Manchester School, 81(2), 176-201.
Lown, C. & Morgan, D. P. (2006). The credit cycle and the business cycle: new findings
using the loan officer opinion survey. Journal of Money, Credit and Banking, 38(6), 1575-
1597.
Lovell, C. A. K., Wallers, L. C. & Wood, L. L. (1995).Stratified models of education
production using modified DEA and regression analysis. In. Charnes, A., Cooper, W. W.,
Lewin, A, Y. and Seiford, L. M. (eds.). Data envelopment analysis: Theory, methodology and
application. (pp. 329-352). Boston: Kluwer Academic Publishers (6th
).
230
Lozano-Vivas, A. & Pasiouras, F. (2010). The impact of non-traditional activities on the
estimation of bank efficiency: international evidence. Journal of Banking and Finance, 34,
1436-1449.
Mankiw, N. G. & Taylor, M. (2006). Economics, London: Cengage Learning EMEA.
Marcus, A. J. (1983). The bank capital decision: a time series-cross section analysis. Journal
of Finance, 38, 1216-32.
Martinez-Miera, D. & Repullo, R. (2010). Does competition reduce the risk of bank failure?
Review of Financial Studies, 23, 3638-3664
Masood, O. & Sergi, B. S. (2011). China‟s banking system, market structure and competitive
conditions. Frontiers of Economics in China, 6(1), 22-35.
Matthews, K., Murinde, V. & Zhao, T. (2007). Competitive conditions among the major
British Banks. Journal of Banking and Finance, 31, 2025-2042.
Maudos, J. & Fernandez de Guevara, J. (2004).Factors explaining the evolution of the interest
margin in the banking sectors of the European Union. Journal of Banking and Finance, 28(9),
2259-2281.
Maudos, J. & Nagore, A. (2005).Explaining market power differences in banking: a cross-
country study, Working paper No 2005-20, European Commission.
231
Maudos, J. & Fernandez de Guevara, J. (2010). Bank size, market power and financial
stability, Paper presented at the conference European Association of University Teachers of
Banking and Finance, Bangor, UK.
Mayne, L.S. (1972). Supervisory influence on bank capital. Journal of Finance, 27, 637-51.
Mensi, S. (2010). Measurement of Competitiveness Degree in Tunisian Deposit Banks: An
Application of the Panzar and Rosse Model. PANOECONOMICUS, 2, 189-207.
Mcdonald, J. (2009). Using least square and Tobit in second stage DEA efficiency analyses.
European Journal of Operational Research, 197, 792-798.
Miller, S. M. & Noulas, A. (1997). Portfolio mix and large bank profitability in the USA.
Applied Economics, 29, 505–512.
Millar, L. (2005). The measurement and determinants of UK bank‟s performance, Cass
Business School Past Dissertation, Cyril Kleinwort Learning Resource Centre, Cass Business
School, UK.
Molyneux, P. & Thornton, J. (1992). Determinants of European bank profitability: A Note.
Journal of Banking and Finance, 16(6), 1173-1178.
232
Molyneux, P. (1993). Structure and performance in European Banking. Doctoral Dissertation,
University of Wales, Bangor.
Molyneux, P., Lloyd-Williams, D.M. & Thornton, J. (1994). Competitive conditions in
European Banking. Journal of Banking and Finance, 18, 445-459.
Moon, H.R. & Perron, B. (2006). Seemingly unrelated regressions, Available at:
http://www.mapageweb.umontreal.ca/perrob/palgrave.pdf [accessed on 28th September
2012].
Negrin, J. L., Enrique, B., Diadelfa, O. & Pedro, S. (2006). Competition in the Mexican
Banking System 2000-2005: A Disaggregated Analysis. Paper presented at the Meetings of
Latin American and Caribbean Economic Association (LACEA) and Latin American
Meeting of the Econometric Society (LAMES), 2-4 November.
Okeahalam, C. C. (2006). Production cost and efficiency in the South African banking sector:
a stochastic analysis. International Review of Applied Economics, 20, 103-123.
Pasiouras, F. & Kosmidou, K. (2007). Factors influencing the profitability of domestic and
foreign commercial banks in the European Union. Research in International Business and
Finance, 21(2), 222–237.
233
Pasiouras, F., Liadaki, A. & Zopounidis, C. (2008). Bank efficiency and share performance:
evidence from Greece. Applied Financial Economics, 18(14), 1121-1130.
Pastor, J. M. & Serrano, L. (2006). The effect of specialisation on banks‟ efficiency: an
international comparison. International Review of Applied Economics, 20, 125-149.
Panzar, J.C. & Rosse, J.N. (1987). Testing for „monopoly‟ equilibrium. Journal of Industrial
Economics, 35, 443–456.
Peltzman, S. (1970). Capital investment in commercial banking and its relationship to
portfolio regulation. Journal of Political Economy, 78(1), 1-26.
Perera, S., Skully, M. & Wickramanayake, J. (2006). Competition and structure of South
Asian banking: a revenue behaviour approach. Applied Financial Economics, 16, 789-801.
Perry, P. (1992). Do Banks Gain or Lose from Inflation? Journal of Retail Banking,
14(2), 25-30.
Peura, S. & Keppo, J. (2006). Optimal Bank Capital with Costly Recapitalization. Journal of
Business, 79, 2163-2201.
234
Portela, M.C.A.S. & Thanassoulis, E. (2005). Profitability of a sample of Portuguese bank
branches and its decomposition into technical and locative components. European Journal of
Operational Research, 162, 850-866.
Rajan, R. & Zingales, L. (1998). Financial Dependence and Growth. American Economic
Review, 88, 559-586.
Rhoades, S. A. (1985). Market share as a source of market power: Implications and some
evidence. Journal of Economics and Business, 37(4), 343-363.
Rime, B. (2001).Capital requirements and bank behaviour: empirical evidence for
Switzerland. Journal of Banking and Finance, 24,789-805.
Rivard, R. J. & Thomas, C. R. (1997). The effect of interstate banking on large bank holding
company profitability and risk. Journal of Economics and Business, 49, 61–76.
Rojas, C. (2011). Market Power and the Lerner Index: A Classroom Experiment. Journal of
Industrial Organization Education, 5, 1-19.
Roodman, D. (2006). How to do xtabond2: an introduction to difference and system GMM in
Stata, Working Paper No.103, Centre for Global Development.
235
Salas, V. & Saurina, J. (2003). Deregulation, market power and risk behaviour in Spanish
banks. European Economic Review, 47, 1061-1075.
Sealey, C. & Lindley, J. (1977). Inputs, outputs, and a theory of production and cost at
depository financial institutions, Journal of Finance,32, 1251– 1266.
Seiford, L. M. & Thrall, R. M. (1990). Recent developments in DEA: the mathematical
programming approach to frontier analysis. Journal of Econometrics, 46, 7-38.
Shaffer, S. (1982). Non-structural test for competition in financial markets, proceedings of a
conference on bank structure and competition, Chicago, 1982, Federal Reserve Bank of
Chicago, pp.225-233.
Shaffer, S. (1993). A test of competition in Canadian banking. Journal of Money, Credit and
Banking, 25, 49-61.
Shaffer, S. (2004). Patterns of competition in banking. Journal of Economics and Business,
56, 287-313.
Sharfman, M. P. & Fernando, C. S. (2008). Environmental risk management and the cost of
capital. Strategic Management Journal, 29, 569-592.
236
Shen, C.H. & Lu, C.H. (2008). Is there a silver lining in the cloudy performance of Chinese
banks? - an empirical investigation into the determinants of profitability and risk. In Fuchs,
E.J. and Braun, F., Emerging Topics in Banking and Finance (pp.9-26), New York: Nova
Science Publisher.
Shih, V., Zhang, Q. & Liu, M. (2007). Comparing the performance of Chinese banks: a
principle component approach. China Economic Review, 18, 15–34.
Shrieves, R.E. & Dahl, D. (1990).The impact of regulation on bank equity infusions. Journal
of Banking and Finance, 14, 1920-28.
Shrieves, R. E. & Dahl, D. (1992).The relationship between risk and capital in commercial
banks. Journal of Banking and Finance, 16, 439-57.
Simar, L. & Wilson, P. W. (2007). Estimation and inference in two-state, semi-parametric
models of production process. Journal of Econometrics, 136(1), 31-64.
Smirlock, M. (1985). Evidence on the (non) relationship between concentration and
profitability in banking. Journal of Money, Credit, and Banking, 17, 69–83.
Staikouras, C. & Wood, G. (2011). The determinants of bank profitability in Europe.
International Business and Economic Research Journal, 3(6), 57-68.
237
Staikouras, C. & Koutsomanoli-Fillipaki, A. (2006). Competition and concentration in the
New European Banking landscape. European Financial management, 12, 3, 443-482.
Stern, G. H. & Feldman, R. J. (2004).Too big to fail: the hazards of bank bailouts.
Washington: Brooking Institution Press.
Stern, J. M., Stewart, G. B. and Chew, D. H. (1995). The EVA financial management system.
Journal of Applied Corporate Finance, 8, 32-46.
Stewart, G. B. (1991). The Quest for value, Harper Business, New York.
Stiroh, K. J. (2010). Diversification in banking. In A. Berger, P. Molynuex and J.O.S. Wilson
(ed.), Oxford handbook of banking. Oxford: Oxford University Press.
Sufian, F. (2009a). Determinants of Bank profitability in a Developing Economy: Empirical
evidence from the China Banking Sector. Journal of Asia-Pacific Business, 10(4), 201-307.
Sufian, F. (2009b). Analysis of the Relevance of Non-Traditional Activities Items Upon the
Efficiency of Chinese Banks: A Non-Stochastic Frontier DEA Approach. Review of
Economic and Business Studies, 4, 83-102.
238
Sufian, F. (2009c). Bank-specific, Industry-specific and Macroeconomic Determinants of
Bank Efficiency: Empirical Evidence from the Thai Banking Sector. The Journal of Applied
Economic Research, 4, 427-461
Sufian, F. (2009d). Determinants of bank efficiency during unstable macroeconomic
environment: Empirical evidence from Malaysia. Research in International Business and
Finance, 23, 54-57.
Sufian, F. (2010). Financial depression and the profitability of the banking sector of the
Republic of Korea: Panel Evidence on Bank-specific and Macroeconomic Determinants.
Asia-Pacific Development Journal, 17(2), 65-92.
Sufian, F. (2011). Profitability of the Korean Banking sector: Panel evidence on bank-
specific and macroeconomic determinants. Journal of Economic and Management, 7(1), 43-
72.
Sufian, S. & Chong, R. R. (2008). Determinants of Bank Profitability in a Developing
Economy: empirical evidence from Philippines. Asian Academy of management Journal of
Accounting and Finance, 4(2), 91-112.
Sufian, F. & Habibullah, M. S. (2010). Bank specific, industry-specific and macroeconomic
determinants of bank efficiency: empirical evidence from the Thai banking sector. Journal of
Applied Economic Research, 4, 427-261.
239
Sufian, F. & Habibullah, M. S. (2009). Bank specific and macroeconomic determinants of
bank profitability: Empirical evidence from the China Banking Sector. Frontier of Economics
in China, 4, 274-291.
Sufian, F. & Majid, M. A. (2007). Singapore banking efficiency and its relation to stock
return: a DEA windows approach. International Journal of Business Studies, 15, (1), 83-106.
Sufian, F. & Majid, M. A. Z. (2009). Bank efficiency and share prices in China: empirical
evidence from a three-stage model. International Journal of Computational Economics and
Econometrics, 1, 23-45.
Suominen, M. (1994). Measuring competition in banking: a two product model. Scandinavian
Journal of Economics, 96, 95-110.
Tan, Y. & Floros, C. (2012a). Bank profitability and inflation: the case of China. Journal of
Economic Studies, 39, 675-696.
Tan, Y. & Floros, C. (2012b). Bank profitability and GDP growth in China: a note. Journal
of Chinese Economic and Business Studies, 10, 267-273.
Triole, J. (1987). The Theory of industrial Organization, Cambridge: MIT Press.
240
Turati, G. (2003). Cost efficiency and profitability in European commercial banking:
implications for antitrust analysis. PhD dissertation, University of Torino.
Uhde, A. & Heimeshoff, U. (2009). Consolidation in banking and financial stability in
Europe: empirical evidence. Journal of Banking and Finance, 33, 1299-1311.
Uyemura, D. G., Kantor, C.C. & Pettit, J. M. (1996). EVA for banks: value creation, risk
management, and profitability management. Journal of Applied Corporate Finance, 9, 94-
115.
Vesala, J. (1995). Testing for competition in Banking: behavioral evidence from Finland.
Bank of Finland studies, E1.
Vong, A. P. I. & Chan, S. H. (2009). Determinants of bank profitability in Macau. Working
paper series, University of Macau, Macau.
Wang, S. (2006). Report on competitiveness of China‟s commercial banks 2006, Social
Science Academic Press, Beijing.
Weill, L. (2003).Banking efficiency in transition economies: the role of foreign ownership.
Economics of Transition, 11, 569-592.
241
Weill, L. (2004). On the relationship between competition and efficiency in the EU banking
sector. Kredit and Kapital, 37, 329-252.
Williams, B. (2003). Domestic and international determinants of bank profits: Foreign
banks in Australia. Journal of Banking and Finance, 27(6), 1185–1210.
Williams, J. (2004). Determining management behaviour in European banking. Journal of
Banking and Finance, 28, 2427-2460.
Wooldridge, J. M. (2002). Econometric Analysis of Cross Section and Panel Data. MIT
Press: Cambridge, MA.
Wu, H.L., Chen, C.H. & Shiu, F. Y. (2007). The impact of financial development and bank
characteristics on the operational performance of commercial banks in the Chinese economy.
Journal of Economic Studies, 34(5), 401-414.
Yao, S. J. & Jiang, C. X. (2010) Banking reform and efficiency in China: 1995-2008,
Research Paper Series 2010-11, University of Nottingham, UK.
Yuan, Y. (2006). The state of competition of Chinese banking industry. Journal of Asian
Economics, 17, 519–534.
242
Yildirim, H.S. & Philippatos, G.C. (2007). Competition and contestability in Central and
Eastern European banking market. Managerial Finance, 33(3), 195-209.
Zarutskie, R. (2013). Competition, financial innovation and commercial bank loan portfolio.
Journal of Financial Intermediation, 22, 373-396.
Zellner, A. (1962). An efficient method of estimating seemingly unrelated regression and
tests for aggregation bias. Journal of the American Statistical Association, 57, 348-68.