Embed Size (px)
Citation preview

University of Rhode Island University of Rhode Island
DigitalCommons@URI DigitalCommons@URI
Open Access Dissertations
2014
ESSAYS ON SOCIAL MEDIA AND BRANDING ESSAYS ON SOCIAL MEDIA AND BRANDING
Gema Vinuales University of Rhode Island, [email protected]
Follow this and additional works at: https://digitalcommons.uri.edu/oa_diss
Recommended Citation Recommended Citation Vinuales, Gema, "ESSAYS ON SOCIAL MEDIA AND BRANDING" (2014). Open Access Dissertations. Paper 250. https://digitalcommons.uri.edu/oa_diss/250
This Dissertation is brought to you for free and open access by DigitalCommons@URI. It has been accepted for inclusion in Open Access Dissertations by an authorized administrator of DigitalCommons@URI. For more information, please contact [email protected].

ESSAYS ON SOCIAL MEDIA AND BRANDING
BY
GEMA VINUALES
A DISSERTATION SUBMITTED IN PARTIAL FULFILLMENT OF THE
REQUIREMENTS FOR THE DEGREE OF
DOCTOR OF PHILOSOPHY
IN
BUSINESS ADMINISTRATION
UNIVERSITY OF RHODE ISLAND
2014

DOCTOR OF PHILOSOPHY DISSERTATION
OF
GEMA VINUALES
APPROVED:
Dissertation Committee:
Major Professor Daniel A. Sheinin
Deborah E. Rosen
Norbert Mundorf
Nasser H. Zawia
DEAN OF THE GRADUATE SCHOOL
UNIVERSITY OF RHODE ISLAND
2014

ABSTRACT
Social media have changed the way individuals interact with each other, with
corporations and with brands; and thus, the context for brand management.
Recognizing the potential of social media to reach massive audiences, brands have
become more “social” and embraced the new media; however, many are still
struggling to effectively harness their potential. Research has aimed to offer some
insights into the emerging social media challenges and have established some
differentiated streams of research that serve as a general framework for these
dissertation manuscripts. Specifically, we identify WOM communications, online
reviews, media channels comparisons, online community influence, and co-creation as
research areas within the social media literature.
The two manuscripts in this dissertation investigate distinct aspects of social
media and contribute to the emerging literature in the field. Manuscript I contributes to
the evolving “Media channel comparisons” stream of research by investigating the
diagnosticity of traditional and social media channels. Manuscript II expands the
current social media research framework to the visual communication context.
Specifically, it investigates how visuals characteristics and the responses they generate
(i.e. ‘shares’) influence brand interpretation.
A current challenge is to understand how media channel influences consumer’s
judgments about brands. The first manuscript addresses this research gap and explores
the diagnosticty of traditional media versus social media as a function of corporate
message type. In two studies, we show that social media are more diagnostic than

traditional media in forming attitudes and intentions towards corporate brands,
independently of corporate message type. Media credibility is identified as the driver
of these results. On the other hand, we find that social and traditional media are not
distinctively diagnostic in forming beliefs about corporate brands. Changes in brand
beliefs are dependent on the content of a message but independent from the
communication channel.
Another challenge is to understand how users interpret images in social media
and make judgments about brands. In three studies in the second manuscript, we show
that social media users integrate associations from multiple images when making
sense of a brand. The weight given to each image when integrating multiple visual
stimuli varies as a function of the online community opinion. That is, the interpretation
of a brand is anchored on the most popular image in the social media profile.

iv
ACKNOWLEDGMENTS
I would like to thank the University of Rhode Island, the College of Business
Administration, and the University of Rhode Island Transportation Center for this
incredible journey. I would like to express my gratitude to the Marketing and Supply
Chain Management faculty. Thank you Ruby Dholakia and Nik Dholakia for starting
what I finish up today. Thank you Hillary Leonard, Douglas Hales and Steve Atlas for
sharing this enjoyable journey with me. Thank you Albert Della Bitta, Norbert
Mundorf and Wayne Velicer for assisting as dissertation committee members. Thank
you all for your guidance, friendly advice, and support.
Special thanks to Daniel Sheinin and Deborah Rosen. Thank you, Dan for your
support with this dissertation, for not giving up when nothing worked, for celebrating
when something did. Thank you for your advice, for knowing that you would respond
at 10 pm at night. Thank you Deb because I can’t imagine these 7 years at URI
without you. Because I could count on you, because you are the go-to person, because
I look at you when I do not know what to do. THANK YOU.
Thank you to my family. Thank you all for believing in me, because I know that
you are there when I need you.

v
PREFACE
This dissertation follows the Manuscript Format. It is written as two separate
manuscripts that explore research questions at the intersection of social media and
branding.
The first manuscript - Media Channel Diagnosticity: Does Social Media Make
Me Like Corporate Brands Better? - investigates how different communication
channels (social media versus traditional media) influence the formation of
consumer’s attitudes, intentions and beliefs about corporations.
The second manuscript - Visual Social Media and Image Associations Transfer to
the Brand - investigates how consumers process visual information in social media
and make judgments about brands.

vi
TABLE OF CONTENTS
ABSTRACT ....................................................................................................................... ii
ACKNOWLEDGMENTS ............................................................................................... iv
PREFACE ...........................................................................................................................v
TABLE OF CONTENTS ................................................................................................ vi
LIST OF TABLES ........................................................................................................... ix
LIST OF FIGURES ...........................................................................................................x
INTRODUCTION..............................................................................................................1
Social media literature review .............................................................................................2
Dissertation manuscripts in the context of the social media research framework ...............7
References ............................................................................................................................9
MANUSCRIPT – I ...........................................................................................................15
Abstract ..............................................................................................................................16
Introduction ........................................................................................................................16
Conceptual framework .......................................................................................................20
Communication channels .......................................................................................... 20
Corporate associations: Corporate ability (CA) and corporate social responsibility
(CSR) ......................................................................................................................... 24
Source effects and message type ............................................................................... 26
Method ...............................................................................................................................28
Study 1 ...................................................................................................................... 28
Design and sample ..................................................................................................... 28
Pretest ........................................................................................................................ 29
Procedure and stimuli ................................................................................................ 30
Measures .................................................................................................................... 31

vii
Results ....................................................................................................................... 34
Discussion .................................................................................................................. 38
Study 2 ...................................................................................................................... 39
Design and sample ..................................................................................................... 39
Pretest ........................................................................................................................ 39
Procedure and stimuli ................................................................................................ 41
Measures .................................................................................................................... 41
Results ....................................................................................................................... 42
Discussion .................................................................................................................. 46
Discussion, limitations, and ideas for future research .......................................................47
References ..........................................................................................................................49
MANUSCRIPT – II .........................................................................................................56
Abstract ..............................................................................................................................57
Introduction ........................................................................................................................57
Conceptual framework .......................................................................................................61
Visual communication ............................................................................................... 61
Museums, exhibitions, and curators .......................................................................... 62
Social nature of museum visiting .............................................................................. 65
Self-construal ............................................................................................................. 66
Method ...............................................................................................................................68
Pretests ...................................................................................................................... 68
Pretest 1: Image identification ................................................................................... 68
Pretest 2: Testing associations with selected images. Sophistication versus
ruggedness. ................................................................................................................ 70
Study 1 ...................................................................................................................... 72
Design and sample ..................................................................................................... 72
Procedure and Stimuli ............................................................................................... 73
Measures .................................................................................................................... 73
Results ....................................................................................................................... 74

viii
Discussion .................................................................................................................. 77
Study 2 ...................................................................................................................... 78
Design and sample ..................................................................................................... 78
Procedure and stimuli ................................................................................................ 79
Measures .................................................................................................................... 81
Results ....................................................................................................................... 82
Discussion .................................................................................................................. 85
Study 3 ...................................................................................................................... 86
Design and sample ..................................................................................................... 86
Pretest ........................................................................................................................ 87
Procedure and stimuli ................................................................................................ 88
Measures .................................................................................................................... 89
Results ....................................................................................................................... 90
Discussion .................................................................................................................. 93
Discussion, limitations, and ideas for future research .......................................................93
References ..........................................................................................................................96
APPENDIX 1 ..................................................................................................................103
Study 1 stimuli .................................................................................................................103
Study 2 stimuli .................................................................................................................105
APPENDIX 2 ..................................................................................................................108
Study 1 stimuli .................................................................................................................108
Study 2 stimuli .................................................................................................................109
Study 3 stimuli .................................................................................................................112

ix
LIST OF TABLES
Table 1. Media channels differences .................................................................................22
Table 2. CA and CSR associations summary description..................................................25
Table 3. Images based on personality traits .......................................................................69
Table 4. Study 2 design ......................................................................................................80

x
LIST OF FIGURES
Figure 1. Social media research framework. .................................................................2
Figure 2. Manuscript 1 Contribution to the Social Media Literature ............................7
Figure 3. Manuscript 2 Contribution to the Social Media Literature ............................8
Figure 4. Mediation model ...........................................................................................37
Figure 5. Images. Sophisticated & Upper Class and Rugged &Tough conditions ......70
Figure 6. Word clouds. Bow tie versus Trailer truck personality associations............71
Figure 7. Cognitive responses. Bow tie, Trailer Truck, and Bow tie-Trailer truck
associations ..................................................................................................................75
Figure 8. Experimental condition interpretation. .........................................................80

1
INTRODUCTION
Social media have changed the way individuals interact with each other, with
corporations and with brands, and are ubiquitous and embedded in consumer’s daily
routines. In 2013 about 1.7 billion people worldwide accessed a social media site. In
2014 the number of worldwide social network users is predicted to reach almost 2 billion.
That is, social media reach nearly one in four people in the world (eMarketer 2013), and
it is a major Internet destination. In the U.S., Internet users spend between 20 and 30% of
their time online on social networks (Nielsen 2012). Recognizing the potential of social
media to reach massive audiences, brands have become more “social” and embraced the
new media. Harvard Business Review Analytic Services found that 79% of a sample of
2,100 organizations were using or planning to use social media in 2012; however, many
are still struggling to effectively harness the power of the new media and integrate them
in their marketing strategies.
In the last few years, researchers have aimed to offer some insights into the
emerging marketing social media challenges, advance knowledge, and provide some
guidelines for corporate practice. Although social media can still be considered an under-
researched field of study, the emerging but rapidly evolving social media literature has
established some differentiated streams of research that serve as a general framework for
these dissertation manuscripts.

2
Social media literature review
The social media streams of research can be categorized as follows: 1) WOM; 2) co-
creation; 3) media channel comparisons; 4) online reviews; and 5) community influence
(see Figure 1).
Figure 1. Social media research framework.
The phenomenon of word-of-mouth communication (WOM) has been extensively
researched in the marketing literature; however, traditional face-to-face WOM theory
does not flawlessly transfer to the online context (Brown, Broderick and Lee 2007;
Berger and Iyengar 2013). The literature in social media has conceptualized and
compared WOM communications in online and offline contexts (Brown, Broderick and
Lee 2007) and explored the effect of WOM marketing in online communities (Kozinets,
de Valck, Wojnicki and Wilner 2010) as it compares to traditional marketing (Trusov,
Bucklin and Pauwels 2009). The WOM stream of research has sought to understand the

3
information diffusion process in online social networks based on member’s networks of
connections (Katona, Zubcsek and Sarvary 2011), and member and content
characteristics (Liu-Thompkins and Rogerson 2012). Taking a psychological approach to
understanding diffusion, Berger and Milkman (2012) show that content that evokes high-
arousal emotions is more viral. However, in the promotional context, the success of viral
marketing messages is moderated by product type (Schulze, Schöler and Skiera 2014),
and attitude towards the advertisement and the brand (Huang, Su, Zhou and Liu 2013).
Diffusion processes are enhanced by identifying influential users in Internet social
networks. McQuarrie, Miller and Phillips (2013) show that, in the online context, some
ordinary consumers are able to acquire huge audiences and highly influence their
opinions. The highly-valued content that these members generate help explain their social
networks’ growth (Dwyer 2007). Given the managerial importance to identify these
online community members, Trusov, Bodapati and Bucklin (2010) develop a model that
help identify opinion leaders. On average, only twenty percent of a member’s
connections influence his/her activity level on the site.
A second stream of research within the social media context is online reviews. The
information consumers discuss online is widely available in the public domain and
becomes a valuable source of information for the Internet community (Chen, Liu and
Zhang 2012). Research has explored how online consumer reviews evolve (Chen, Fay
and Wang 2011), how much they can be trusted (Pan and Chiou 2011) and how valuable
they are in forecasting sales (Dellarocas, Zhang and Awad 2007). Research shows that
the valence of an online review has a differential effect on WOM (Chen, Wang and Xie
2011; Chen, Liu and Zhang 2012; Chen and Lurie 2013), and influences attitudes and

4
intentions (Purnawirawan, De Pelsmacker and Dens 2012), beliefs (Chen and Lurie
2013), purchase intent (Park and Lee 2009; Chen and Lurie 2013), conversion rates
(Ludwig, de Ruyter, Friedman, Brüggen, Wetzels and Pfann 2013), and sales (Dhar and
Chang 2009).
In addition, online reviews have been shown to affect firms’ financial performance
and investors’ decisions. Luo, Raithel and Wiles (2013) show that the variance of brand
ratings affects stock prices and argue that brand dispersion ratings should be consider a
critical brand management metric. Social tags, user-generated keywords that help
categorize online content, are proxy measures for brand performance. Nam and Kannan
(2014) find that social tags can predict the financial value of a firm and can explain
unanticipated stock returns. In addition, Chen, Liu and Zhang (2012) show that third-
party product reviews are leading indicators of product sales and influence investors’
expectations about a product’s potential.
The third social media stream of research is co-creation. This stream explores the
value of collaborative user-generated content (Ransbotham, Kane and Lurie 2012) and
how it affects consumer perceptions, intentions (Hautz, Füller, Hutter and Thürridl 2014),
and persuasion (Thompson and Malaviya 2013), as well as how it differs across social
media channels (Smith, Fischer and Yongjian 2012).
Social media channels are known to differentially influence consumers. The fourth
category of social media research explores how it compares to traditional media. Media
channel shapes the message and the types of information consumers discuss (Berger and
Iyengar 2013). Not surprisingly, Schweidel and Moe (2014) show that brand-sentiment
metrics are dependent on the channel online conversations are monitored, and argue that

5
aggregated data across online channels may lead to mislead inferences. Understanding
how media channels compare and complement each other has become critical for
marketing communications success. Research in this domain has shown that on Internet
social network sites WOM referrals have longer carryover effects than traditional
marketing (Trusov, Bucklin and Pauwels 2009), and that media channel influences sales
(Stephen and Galack 2012) and advertising effectiveness (Danaher and Dagger 2013).
Research advocates for creating media synergies since it facilitates content exploration
(Goldenberg, Oestreicher-Singer and Reichman 2012) and drives activity in
complementary media (Stephen and Galack 2012).
Lastly, social media research has investigated the formation of online communities,
their influence on individual member’s behavior, and their potential for marketing and
brands. Ansari, Koenigsberg and Stahl (2011) develop a framework to model relationship
formation that helps predict community members’ interaction levels. The size of these
online communities has been shown to influence what people share (Barasch and Berger
2014), as well as brand-related outcomes such as brand affect and loyalty (Scarpi 2010).
In addition, the strength of the relationships among members affects consumer behavior.
Wilcox and Stephen (2013) find that social network users who focus on close friends
while browsing the site have heightened self-esteem feelings but decreased levels of self-
control that affect consumer choice and ultimately well-being. Brands are increasingly
joining social network sites, becoming regular community members, and interacting with
consumers across the new media. Social media allows for consumer-brand relationships
that lead to positive relationship outcomes such as loyalty intentions and willingness to
provide information to the brand (Labrecque 2014).

6
Seraj (2012) investigates the online community characteristics from which members
derive value and incite engagement. Quality content, and an interactive and self-governed
environment, are identified as drivers of value that lead to loyalty and sustainability of
Internet communities. In the ongoing debate about the value of a ‘like,’ ‘share,’ or
comment on a brand social media page, engagement and interaction are identified as
meaningful brand performance metrics and have gained attention in the academic
community (Hollebeek, Glynn and Brodie 2014; Blazevic, Wiertz, Cotte, de Ruyter and
Keeling 2014; Malthouse, Haenlein, Skiera, Wege and Zhang 2013; Deighton and
Kornfeld 2009). Engagement with the media context has been shown to increase
advertising effectiveness (Calder, Malthouse and Schaedel 2009); however, given the
rising concerns over online privacy, perception of control over personal information is
seen to play an important role in how likely members of a social network are to click on
an online advertisement (Tucker 2014).
Value from social media can also be derived from social commerce sites (Stephen
and Toubia 2010; Yadav, de Valck, Hennig-Thurau, Hoffman and Spann 2013) and
recommendation systems (Hennig-Thurau, Marchand and Marx 2012) that help
consumers make better choices. Multidirectional communications across social media are
known to affect purchase intention (Wang, Yu and Wei 2012). Even the mere virtual
presence of other community members impacts brand evaluations and purchase intentions
in social media settings (Naylor, Lamberton and West 2012).
7
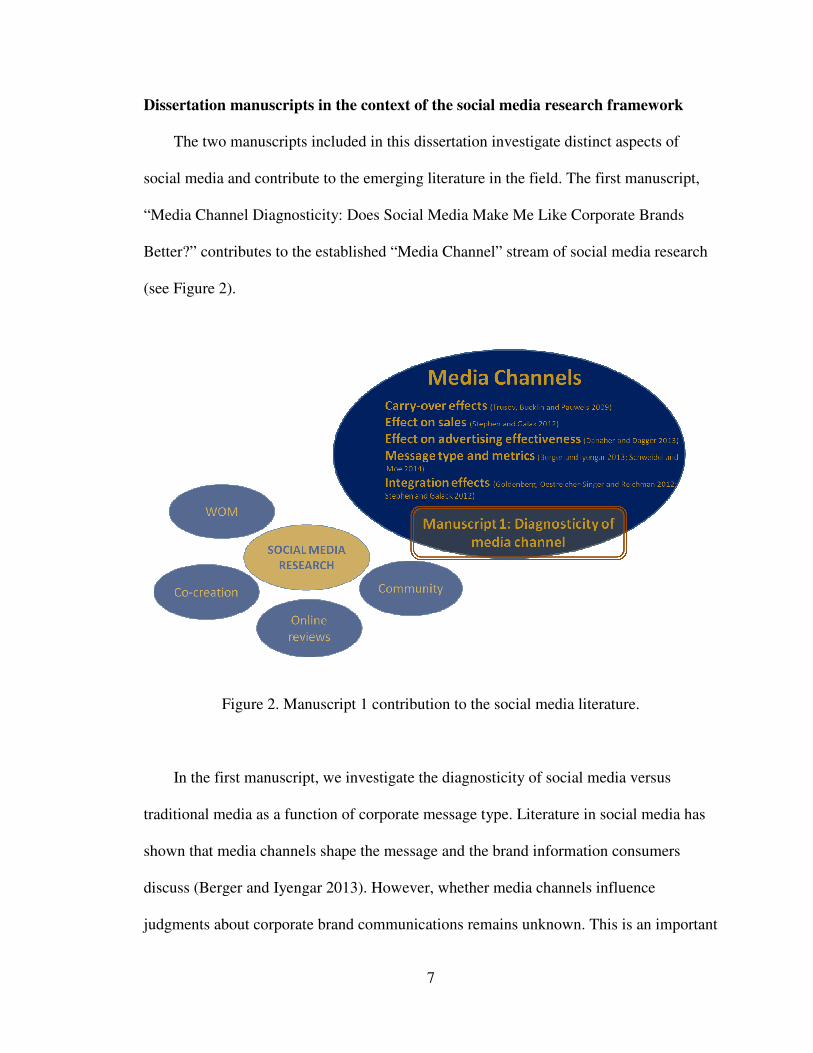
Dissertation manuscripts in the context of the social media research framework
The two manuscripts included in this dissertation investigate distinct aspects of
social media and contribute to the emerging literature in the field. The first manuscript,
“Media Channel Diagnosticity: Does Social Media Make Me Like Corporate Brands
Better?” contributes to the established “Media Channel” stream of social media research
(see Figure 2).
Figure 2. Manuscript 1 contribution to the social media literature.
In the first manuscript, we investigate the diagnosticity of social media versus
traditional media as a function of corporate message type. Literature in social media has
shown that media channels shape the message and the brand information consumers
discuss (Berger and Iyengar 2013). However, whether media channels influence
judgments about corporate brand communications remains unknown. This is an important

8
topic because brands now operate in complex media contexts. A variety of sources of
information reach consumers daily; understanding how user and marketer created brand
communications influence the formation of consumer’s beliefs, attitudes and intentions is
critical for brands to succeed in the cluttered markets in which they compete. Literature
in corporate branding has shown that corporate messages are not equally diagnostic for
forming corporate beliefs (i.e. Biehal and Sheinin 2007). However, the potential
differential effect of media remains a significant research gap.
The second manuscript, “Visual Social Media and Image Associations Transfer to
the Brand,” expands the current social media research framework by creating a new
stream of research labeled “Visual Communication” (see Figure 3).
Figure 3. Manuscript 2 contribution to the social media literature.

9
In the second manuscript, we investigate image processing effects in the social
media context. Although visual imagery is critical in digital media, research is limited on
which factors influence how visual information is processed in this environment.
Literature in social media has shown that online communities influence behavior (i.e.
Wilcox and Stephen 2013). However, how user-generated social media responses (i.e.
‘shares’) interact with visual content posted in social media and what brand associations
are derived remain unknown. In addition, literature in branding shows that brand
associations are drivers of brand equity (Keller 1993); however, how these associations
are formed in the social media context remains another significant research gap.
References
Ansari, Asim, Oded Koenigsberg and Florian Stahl (2011), “Modeling Multiple
Relationships in Social Networks,” Journal of Marketing Research, 48 (4), 713-
728.
Barasch, Alixandra and Jonah Berger (2014), “Broadcasting and Narrowcasting: How
Audience Size Affects What People Share,” Journal of Marketing Research: 51
(3), 286-299.
Berger, Jonah and Katherine L. Milkman (2012), “What Makes Online Content Viral?,”
Journal of Marketing Research, 49 (2), 192-205.
Berger, Jonah and Raghuram Iyengar (2013), “Communication Channels and Word of
Mouth: How the Medium Shapes the Message Contains supplements,” Journal of
Consumer Research, 40 (3), 567-579.
Biehal, Gabriel J. and Daniel A. Sheinin (2007), “The Influence of Corporate Messages
on the Product Portfolio,” Journal of Marketing, 71 (2), 12- 25.
Blazevic, Vera , Caroline Wiertz, June Cotte, Ko de Ruyter and Debbie Isobel Keeling
(2014), “GOSIP in Cyberspace: Conceptualization and Scale Development for
General Online Social Interaction Propensity,” Journal of Interactive Marketing,
28 (2), 87-100.

10
Brown, Jo, Amanda J. Broderick and Nick Lee (2007), “Word of Mouth Communication
within Online Communities: Conceptualizing the Online Social Network,”
Journal of Interactive Marketing, 21 (3), 2-20.
Calder, Bobby J., Edward C. Malthouse and Ute Schaedel (2009), “An Experimental
Study of the Relationship between Online Engagement and Advertising
Effectiveness,” Journal of Interactive Marketing, 23 (4), 321-331.
Chen, Yubo, Qi Wang and Jinhong Xie (2011), “Online Social Interactions: A Natural
Experiment on Word of Mouth Versus Observational Learning,” Journal of
Marketing Research, 48 (2), 238-254.
Chen, Yubo, Scott Fay and Qi Wang (2011), “The Role of Marketing in Social Media:
How Online Consumer Reviews Evolve,” Journal of Interactive Marketing, 25
(2), 85-94.
Chen, Yubo, Yong Liu and Jurui Zhang (2012), “When Do Third-Party Product Reviews
Affect Firm Value and What Can Firms Do? The Case of Media Critics and
Professional Movie Reviews,” Journal of Marketing, 76 (2), 116-134.
Chen, Zoey and Nicholas H. Lurie (2013), “Temporal Contiguity and Negativity Bias in
the Impact of Online Word of Mouth,” Journal of Marketing Research, 50 (4),
463-476.
Danaher, Peter J. and Tracey S. Dagger (2013), “Comparing the Relative Effectiveness of
Advertising Channels: a Case Study of a Multimedia Blitz Campaign,” Journal of
Marketing Research, 50 (4), 517-534.
Deighton, John and Leora Kornfeld (2009), “Interactivity's Unanticipated Consequences
for Marketers and Marketing,” Journal of Interactive Marketing, 23 (1), 4-10.
Dellarocas, Chrysanthos, Xiaoquan (Michael) Zhang and Neveen F. Awad (2007),
“Exploring the Value of Online Product Reviews in Forecasting Sales: The Case
of Motion Pictures,” Journal of Interactive Marketing, 21 (4), 23-45.
Dhar, Vasant and Elaine A. Chang (2009), “Does Chatter Matter? The Impact of User-
Generated Content on Music Sales,” Journal of Interactive Marketing, 23 (4),
300-307.
Dwyer, Paul (2007), “Measuring the Value of Electronic Word of mouth and its Impact
in Consumer Communities,” Journal of Interactive Marketing, 21 (2), 63-79.
eMarketer (2013), Social Networking Reaches Nearly One in Four Around the World.
Available at http://www.emarketer.com/Article/Social-Networking-Reaches-
Nearly-One-Four-Around-World/1009976#sthash.sfUjQiC1.dpuf. Accessed
5/20/2014.

11
Goldenberg, Jacob, Gal Oestreicher-Singer and Shachar Reichman (2012), “The Quest
for Content: How User-Generated Links Can Facilitate Online Exploration,”
Journal of Marketing Research, 49 (4), 452-468.
Hautz, Julia, Johann Füller, Katja Hutter and Carina Thürridl (2014), “Let Users Generate
Your Video Ads? The Impact of Video Source and Quality on Consumers'
Perceptions and Intended Behaviors,” Journal of Interactive Marketing, 28 (1), 1-
15.
Hennig-Thurau, Thorsten, André Marchand and Paul Marx (2012), “Can Automated
Group Recommender Systems Help Consumers Make Better Choices?,” Journal
of Marketing, 76 (5), 89-109.
Hollebeek, Linda D., Mark S. Glynn and Roderick J. Brodie (2014), “Consumer Brand
Engagement in Social Media: Conceptualization, Scale Development and
Validation,” Journal of Interactive Marketing, 28 (2), 149-165.
Hovland, Carl I., Irving L. Janis and Harold H. Kelley (1953), Communication and
persuasion: Psychological studies of opinion and change. New Haven, CT: Yale
University Press.
Huang, Jinsong, Song Su, Liuning Zhou and Xi Liu (2013), “Attitude Toward the Viral
Ad: Expanding Traditional Advertising Models to Interactive Advertising,”
Journal of Interactive Marketing, 27 (1), 36-46.
Katona, Zsolt, Peter Pal Zubcsek and Miklos Sarvary (2011), “Network Effects and
Personal Influences: The Diffusion of an Online Social Network,” Journal of
Marketing Research, 48 (3), 425-443.
Keller, Kevin L. (1993), “Conceptualizing, Measuring, and Managing Customer-Based
Brand Equity, Journal of Marketing, 57 (1), 1-22.
Kozinets, Robert V., Kristine de Valck, Andrea C. Wojnicki and Sarah J.S. Wilner
(2010), “Networked Narratives: Understanding Word-of-Mouth Marketing in
Online Communities,” Journal of Marketing, 74 (2), 71-89.
Labrecque, Lauren I (2014), “Fostering Consumer–Brand Relationships in Social Media
Environments: The Role of Parasocial Interaction,” Journal of Interactive
Marketing, 28 (2), 134-148.
Liu-Thompkins, Yuping and Michelle Rogerson (2012), “Rising to Stardom: An
Empirical Investigation of the Diffusion of User-Generated Content,” Journal of
Interactive Marketing, 26 (2), 71-82.
Ludwig, Stephan, Ko de Ruyter, Mike Friedman, Elisabeth C. Brüggen, Martin Wetzels
and Gerard Pfann (2013), “More Than Words: The Influence of Affective Content

12
and Linguistic Style Matches in Online Reviews on Conversion Rates,” Journal
of Marketing: 77(1), 87-103.
Luo, Xueming, Sascha Raithel, and Michael A. Wiles (2013), “The Impact of Brand
Rating Dispersion on Firm Value,” Journal of Marketing Research, 50 (3), 399-
415.
Malthouse, Edward C., Michael Haenlein, Bernd Skiera, Egbert Wege and Michael
Zhang (2013), “Managing Customer Relationships in the Social Media Era:
Introducing the Social CRM House,” Journal of Interactive Marketing, 27 (4),
270-280.
McQuarrie, Edward F., Jessica Miller and Barbara J. Phillips (2013), “The Megaphone
Effect: Taste and Audience in Fashion Blogging,” Journal of Consumer Research,
40 (1), 136-158.
Nam, Hyoryung and P.K. Kannan (2014), “The Informational Value of Social Tagging
Networks,” Journal of Marketing In-Press.
Naylor, Rebecca W., Cait Poynor Lamberton and Patricia M. West (2012), “Beyond the
‘Like’ Button: Exploring the Effects of Mere Virtual Presence on Brand
Evaluation,” Journal of Marketing, 76 (6), 105- 120.
Nielsen (2012), State of the Social Media. The Social Media Report 2012. Available at
http://blog.nielsen.com/nielsenwire/social/2012/. Accessed 2/10/2013.
Pan, Lee-Yun and Jyh-Shen Chiou (2011), “How Much Can You Trust Online
Information? Cues for Perceived Trustworthiness of Consumer-generated Online
Information,” Journal of Interactive Marketing, 25 (2), 67-74.
Park, Cheol and Thae Min Lee (2009), “Antecedents of Online Reviews' Usage and
Purchase Influence: An Empirical Comparison of U.S. and Korean Consumers,”
Journal of Interactive Marketing, 23 (4), 332-340.
Purnawirawan, Nathalia, Patrick De Pelsmacker and Nathalie Dens (2012), “Balance and
Sequence in Online Reviews: How Perceived Usefulness Affects Attitudes and
Intentions,” Journal of Interactive Marketing, 26 (4), 244-255.
Ransbotham, Sam, Gerald C. Kane and Nicholas H. Lurie (2012), “Network
Characteristics and the Value of Collaborative User-Generated Content,”
Marketing Science, 31 (3), 387-405.
Scarpi, Daniele (2009), “Does Size Matter? An Examination of Small and Large Web-
Based Brand Communities,” Journal of Interactive Marketing, 24 (1), 14-21.

13
Schulze, Christian , Lisa Schöler and Bernd Skiera (2014), “Not All Fun and Games:
Viral Marketing for Utilitarian Products,” Journal of Marketing, 78 (1), 1-19.
Schweidel, David A. and Wendy W. Moe (2014), "Listening in on Social Media: A Joint
Model of Sentiment and Venue Format Choice," Journal of Marketing Research
In-Press.
Seraj, Mina (2012), “We Create, We Connect, We Respect, Therefore We Are:
Intellectual, Social, and Cultural Value in Online Communities,” Journal of
Interactive Marketing, 26 (4), 209-222.
Smith, Andrew N., Eileen Fischer andChen Yongjian (2012), “How Does Brand-related
User-generated Content Differ across YouTube, Facebook, and Twitter?,”
Journal of Interactive Marketing, 26 (2), 102-113.
Stephen, Andrew T. and Jeff Galak (2012), "The Effects of Traditional and Social Earned
Media on Sales: A Study of a Microlending Marketplace," Journal of Marketing
Research, 49 (5), 624- 639.
Stephen, Andrew T. and Olivier Toubia (2010), “Deriving Value from Social Commerce
Networks,” Journal of Marketing Research, 47 (2), 215-228.
Thompson, Debora V. and Prashant Malaviya (2013), “Consumer-Generated Ads: Does
Awareness of Advertising Co-Creation Help or Hurt Persuasion?,” Journal of
Marketing, 77 (3), 33- 47.
Trusov, Michael, Anand V. Bodapati and Randolph E. Bucklin (2010), “Determining
Influential Users in Internet Social Networks,” Journal of Marketing Research, 47
(4), 643-658.
Trusov, Michael, Randolph E. Bucklin and Koen Pauwels (2009), “Effects of Word-of-
Mouth versus Traditional Marketing: Findings from and Internet Social
Networking Site,” Journal of Marketing, 73 (5), 90-102.
Tucker, Catherine (2014), “Social Networks, Personalized Advertising and Privacy
Controls,” Journal of Marketing Research In-Press.
Wang, Xia, Chunling Yu and Yujie Wei (2012), “Social Media Peer Communication and
Impacts on Purchase Intentions: A Consumer Socialization Framework,” Journal
of Interactive Marketing, 26 (4) 198-208.
Wilcox, Keith and Andrew T. Stephen (2013), “Are Close Friends the Enemy? Online
Social Networks, Self-Esteem, and Self-Control,” Journal of Consumer Research,
40 (1), 90-103.

14
Yadav, Manjit S., Kristine de Valck, Thorsten Hennig-Thurau, Donna L. Hoffman and
Martin Spann (2013), “Social Commerce: A Contingency Framework for
Assessing Marketing Potential,” Journal of Interactive Marketing, 27 (4), 311-
323.

15
MANUSCRIPT – I
Target Publication: Journal of Advertising or Journal of Interactive Marketing
Media Channel Diagnosticity: Does Social Media Make Me Like Corporate
Brands Better?
Gema Vinuales
College of Business Administration, University of Rhode Island, Kingston, RI, USA
Corresponding Author: Gema Vinuales
College of Business Administration
University of Rhode Island
7 Lippitt Rd. Room 216
Kingston, RI 02906
Phone: +1 (401) 874 5064
Email address: [email protected]

16
Abstract
Social media have changed the context for brand management by becoming user-
generated sources of corporate brand information that coexist with traditional marketing
communications. A current challenge is to understand how media channels influence the
formation of consumer’s attitudes, intentions and beliefs about corporations. In two
studies, we show that social media are more diagnostic than traditional media for
consumers in forming attitudes and intentions about corporate brands. Media credibility
is identified as the driver of these results. On the other hand, social media are not
relatively more diagnostic than traditional media in forming beliefs about corporate
brands. Corporate beliefs do not change as a function of media channel but as a function
of message type.
Introduction
Corporate brands are strategic as well as essential for business success (Barich and
Kotler 1991; Fombrun 1996; Brown and Dacin 1997) since they are sources of
differentiation and competitive advantage (Aaker 1996, Ghemawat 1986; Brown and
Dacin 1997). To raise corporate brand accessibility, equity, trust, and credibility levels,
corporations design marketing communications that convey consistent messages across
multiple channels. Historically, firms exerted strong control over corporate
communications. However, at present, many corporate claimants – shareholders, business
partners, competitive users, consumers – are utilizing social media outlets to
communicate about companies (Gensler, Völcknerb, Liu-Thompkinsc and Wiertz 2013).
Social media are gaining relevance as information outlets (Nielsen 2011, 2012) and have

17
become a source of corporate brand information that coexists with corporate-initiated
communications. Social media are easily accessible to a massive number of consumers
and allow for many-to-many multidirectional communications of co-produced content
(Kozinets, de Valk, Wojnicki and Wilner 2010) that has changed the context for brand
management (Gensler, Völcknerb, Liu-Thompkinsc and Wiertz 2013). A current
challenge is to understand how different communication channels influence the formation
of consumer’s attitudes, intentions and beliefs about corporations.
Understanding the effectiveness of different media channels has become a priority
(MSI 2010). Trusov, Bucklin, and Pauwels (2009) investigate how WOM compares with
traditional marketing communications and find that WOM communication has longer
carryover effects than traditional marketing actions. Berger and Iyengar (2013) explore
whether the communication channel influences what consumers talk about and find that
oral versus text WOM affect the type of products and brands consumers discuss. Stephen
and Galak (2012) investigate the effect of traditional and social media on sales and find
that both channels affect purchase outcomes. Danaher and Dagger (2013) develop a
model that lets firms compare the relative effectiveness of online and offline advertising
channels on purchase outcomes and that help determine the optimal budget allocation.
Research advocates for creating media channel synergies since it facilitates content
exploration (Goldenberg, Oestreicher-Singer and Reichman 2012). Stephen and Galak
(2012) show that social media are a driver of traditional media activity. Similarly, Dinner,
van Heerde and Neslin (2014) find that that online and offline advertising influence sales
within and across channels. Even across different social media channels, research has
shown that content relates to outlet; that is, the content that users post is dependent on the

18
outlet where it is posted. Scheweidel and Moe (2014) argue that focusing on single social
media outlets or aggregating data across social media channels can lead to misleading
inferences about brand sentiment. Jointly modeling brand sentiment as a function of the
‘where’ and the ‘what’ consumers post, Scheweidel and Moe (2014) show that the
integrated measure outperforms other currently used social media metrics. A significant
research gap that remains unexplored is the relative diagnosticity of media channel. To
the best of our knowledge, the literature has not yet investigated how media channel
influences consumer’s judgments about brands. The purpose of this manuscript is to
understand the diagnosticity of traditional media versus social media – that is, corporate-
initiated versus consumer-initiated communications – in forming attitudes, intentions and
beliefs about corporate brands. The accessibility-diagnosticity theory (Feldman and
Lynch 1988) proposes that when consumers make a judgment, they use information that
is accessible in memory, diagnostic for decision making, and relatively more accessible
and diagnostic than other information available. The goal of a marketer is to make
corporate branding communications accessible and diagnostic so they influence
consumer behavior.
Using source credibility theory (Hovland and Weiss 1953), we explore how media
channel and message content influence consumer’s judgments about corporate brands.
Specifically, we investigate whether a corporate advertisement message (traditional
media) or a specialized blog posting (social media) differentially affect the diagnosticity
of corporate messages. Leveraging corporate brands have become increasingly important
since they help differentiate, energize and add credibility to product brands (Aaker 2004).
Corporate brand impressions are more elaborated and confidently held than product

19
brands (Berens, van Riel and van Bruggen 2005) and highly influence consumer product
responses. Corporate messages can be classified as they relate to a firm’s core
competency (CA associations) or to a firm’s social responsibility practices (CSR
associations) (Brown and Dacin 1997). Literature in corporate branding shows that
corporate messages are not equally diagnostic for forming corporate beliefs (Biehal and
Sheinin 2007). However, whether the diagnosticity of the CA and CSR message remains
unchanged across different media channels is unknown. Given the current crowded media
and marketing environments, identifying effective communication channels to deliver
corporate messages is critical for success in the marketplace.
In two experiments we show that social media are more diagnostic than traditional
media in forming attitudes and behaviors towards corporate brands. Attitudes towards a
company, WOM, and purchase intentions were rated significantly higher when
participants read a message from a social media versus a traditional media outlet. In
addition, we find that media credibility mediates the relationship between media channel
and consumer attitudes and intentions. When compared with traditional media channels,
social media are considered to be significantly more credible sources of information. We
replicate these results using different messages and different industry contexts. However,
traditional media are not found to be more diagnostic than social media in forming
corporate beliefs. Corporate beliefs about company’s ability (CA) and social
responsibility practices (CSR) were found to be similarly diagnostic across media
channels.
Contributions from this manuscript are twofold: First, findings from these
experiments contribute to social media literature by providing further evidence of the

20
distinct nature of media channels and their relative diagnosticty in forming corporate
attitudes and intentions. Second, this manuscript contributes to the corporate branding
literature showing that while in traditional media contexts CA messages are more
diagnostic than CSR messages in forming product beliefs; in social media contexts, CA
and CSR messages are equally diagnostic for forming brand judgments. In addition, these
findings have sound implications for corporate brand management. Based on the
experimental results, we argue that brand management has become a firm-consumer
shared process. Even though sharing control over corporate communications with
consumers may entail risks, it is potentially a source of competitive advantage.
Considering the credibility levels of social media channels and the influence of user-
generated content on other online users’ attitudes and intentions, we encourage
companies to incentive informal WOM communications since they transmit influential
messages to consumers.
The rest of the manuscript is structured as follows: First, the conceptual framework
and hypotheses are presented. Then, study 1 presents results about media channel
diagnosticity and the process responsible for the results. Study 2 replicates findings from
study one using a different industry context and using alternative corporate messages.
Finally, conclusions and ideas for future research are provided.
Conceptual framework
Communication channels
Communication channels can be categorized as traditional or social media.
Corporate-generated messages tend to be the exclusive means of communication through

21
traditional media channels. On the other hand, corporate- and consumer-generated
messages may be used as means of communication through social media outlets. In this
manuscript, we focus on social media channels that exclusively transmit consumer-
generated content. Specifically, we operationalize traditional media through corporate
advertisements and social media through non-corporate owned specialized blog websites.
While media channels are subject to categorization attending different criteria, in the
context of this manuscript, media channels are categorized based on the source of the
communications.
The degree of corporate control over a brand-related message is dependent on the
source of the communication. While corporations craft marketing messages to create
specific brand knowledge structures in consumer’s minds, they lack control over user-
generated messages distributed through social media. Social media allows and empowers
consumers to share their views, preferences, and experiences with brands (Trusov,
Bucklin and Pauwels 2009). WOM communications are considered to be one of the most
effective marketing communication strategies (Misner 1999). WOM communications via
social media overcome consumer resistance (Trusov, Bucklin and Pauwels 2009) since
social media users are not considered to seek self-interested economic benefits from
sharing their opinions about brands (Arndt 1967; Silverman, 1997). On the other hand,
communications through traditional media generate consumer skepticism (Trusov,
Bucklin and Pauwels 2009) since the goal of the communication is to persuade potential
customers. People develop beliefs about the tactics marketers use to persuade them
(Wright 1986). Therefore, while social media communications are considered to be
reliable and trustworthy, traditional media communications are considered to be biased

22
(Hennig-Thurau, Gwinner, Walsh, and Gremler 2004; Brown, Broderick and Lee 2007).
Du, Bhattacharya, and Sen (2010) argue that there is a tradeoff between the
controllability and credibility of a communication source: the less controllable a source
is, the more credible it becomes. Consequently, we argue that compared to traditional
media, consumers consider social media to be a more credible source of information (see
Table 1).
Table 1. Media channel differences.
Consumers assess the source of a communication before they accept its claims
(Percy and Rossiter 1980; Schlegelmilch and Pollach 2010). Research shows that the
source of a communication is often used as heuristic to appraise the validity and
relevance of a message (Petty and Cacioppo 1986; Eagly and Chaiken 1984). When
consumers cannot, or lack the motivation to, use cognitive resources, they use heuristics
to solve problems and make decisions (Bettman, Johnson and Payne 1991). Heuristics are
defined as mechanisms that “simplify decision making by limiting the amount of
information that is processed and/or by making how that information is processed easy”
Media Channels
Traditional media Social media
Communication
Control
Corporations exert control over
communication. Corporate
controlled message
Consumers freely express
opinions. Non corporate
controlled message
Consumer’s
Perception
Considered biased Considered reliable and
trustworthy
Persuasion Generates consumer skepticism WOM overcomes consumer
resistance

23
(Bettman, Johnson, and Payne 1991, pp. 58-59). We argue that media channel is used as a
heuristic to make judgments about corporate brands.
Based on the Wood and Eagly (1981) attribution model of persuasion, the source of
a communication shapes expectancies about the message and influences the effectiveness
of the communication (Hovland and Weiss 1951). Obermiller and Spangenberg (1998,
2000) argue that consumers are socialized to be skeptical towards advertisements, and
therefore they discount ad claims. Consistently, correction research shows that when
consumers encounter a source of unwanted bias, mental processes and behaviors correct
for its potential influence (Petty, Wegner and White 1998; William, Fitzsimmons, and
Block 2004). We contend that consumers use media channel as a heuristic when making
judgments based on brand-related messages. Since media channel is an easy heuristic to
use, we argue that media channel will influence the formation of attitudes and intentions
towards brands.
Formally, we hypothesize that:
H1: Social media are more diagnostic than traditional media in forming attitudes,
and intentions towards a corporate brand.
While consumers are socialized to be skeptical about ads (Obermiller and
Spangenberg 1998, 2000), that is not the case for blogs. Some specialized blogs (i.e.
Mashable or Engadget) are leading sources for news and information and strong
resources for credible product evaluations. The fact that millions of unique engaged
social media followers visit the sites each month bears this claim. Literature on source
credibility supports the relationship between credibility and persuasion effects. Based on
source credibility theory (Hovland and Weiss 1951), messages are more persuasive when

24
the source of the communication is perceived to be more credible. Therefore, we
hypothesize that:
H2: Perceived media credibility mediates the relationship between media channel
and attitudes and intentions to engage with a corporate brand.
Corporate associations: Corporate ability (CA) and corporate social responsibility
(CSR)
Brown and Dacin (1997) define corporate associations as a “generic label for all the
information about a company a person holds” (pp. 69). The corporate branding literature
shows that corporate associations affect consumer’s responses towards products and
services (Brown and Dacin 1997; Duncan and Moriarty 1998; Gurhan-Canli and Batra
2004; Hatch and Schultz 2001; Raju and Dhar 1999; Biehal and Sheinin 2007).
Specifically, corporate messages have been shown to influence product beliefs and
attitudes (Brown and Dacin 1997; Creyer and Ross 1996; Goldberg and Hartwick 1990;
Sheinin and Biehal 1999), purchase intentions (Sen and Bhattacharya 2001), product
choice (Creyer and Ross 1996), and customer satisfaction (Luo and Bhattacharya 2006).
Individual-difference variables such as processing mindsets affect the interpretation of
corporate messages (Torelli, Monga, and Kaikati 2012). In addition, the corporate
associations literature has bridged to the B2B and financial literature. Homburg, Stierl
and Bornemann (2013) argue that CSR engagement fosters customer’s trust and
strengthens customer-company identification in organizational contexts. In financial
terms, corporate associations have been shown to affect a company’s market value (Luo
and Bhattacharya 2006, 2009), and shareholders wealth (Bharadwaj, Tuli, Bonfrer 2011).

25
To the best of our knowledge, the corporate associations literature has not been explored
within the social media context.
Brown and Dacin (1997) show that “not all corporate associations are alike” (p. 70)
and distinguish between corporate ability (CA) and corporate social responsibility (CSR)
associations. CA associations refer to a firm’s core competency and are positioned on
product-relevant dimensions such as quality or performance. CA strategies focus on
industry leadership, strength of R&D initiatives, or employee expertise. On the other
hand, CSR associations refer to a firm’s societal obligations and are positioned on less
product-relevant dimensions such as commitment to diversity or environmental
friendliness. CSR strategies focus on sponsorships, corporate philanthropy, or community
involvement (Brown and Dacin, 1997; Sen and Bhattacharya, 2001; Biehal and Sheinin,
2007) (see Table 2).
Corporate Associations
CA associations CSR associations
Focus
Associations reflect company’s
expertise in producing and
delivering outputs
Associations reflect
organization’s status and activities
with respect to its perceived
societal obligations
Positioning
CA messages are positioned on
product-relevant dimensions (i.e.
quality, service orientation)
CSR messages are positioned on
less product-relevant dimensions
(i.e. social responsibility, ethical
orientation)
Strategies
CA strategies focus on the
expertise of the employees,
superiority of internal R&D and the
resulting technological innovation,
manufacturing expertise, customer
orientation, industry leadership
CSR strategies focus on
environmental friendliness,
commitment to diversity,
community involvement,
sponsorship, corporate
philanthropy
Table 2. CA and CSR associations summary description.

26
Biehal and Sheinin (2007) argue that all corporate messages are not equally
diagnostic. After exposing participants to CA and CSR corporate advertisements, Biehal
and Sheinin (2007) find that participants in the CA condition rated product beliefs higher
than participants in the CSR condition. In turn, they conclude that CA messages are more
diagnostic than CSR messages in forming product beliefs. A significant research gap is
whether this difference in message diagnosticity remains constant across media channels.
The internet provides ample opportunities for consumers to share and seek others’
opinions and experiences with products and brands. Exploring the relative diagnosticity
of social media and traditional media channels is critical to understand how consumers
form judgments about company brands.
Source effects and message type
Firms’ core competencies tend to be clear in consumer minds. However, in general,
consumers are not aware of corporate social responsibility initiatives (Alsop 2005; Du,
Bhattacharya and Sen 2010). For example, while most consumers know that Volvo
manufactures safe cars, few consumers are aware of Volvo’s partnerships with Oxfam
and WWF or Toyota community involvement. In addition, while consumers are deemed
competent to evaluate product attributes or brand performance, estimating corporate
ethical practices remains challenging. CSR associations are more abstract and intangible
than CA associations (Pomering and Johnson 2009). Since CSR associations lack search
and experience characteristics, they are not easily verifiable (Nelson 1970, Pomering and
Johnson 2009).

27
We previously argued that the lack of corporate control over user-generated brand-
related messages distributed through social media makes them trustworthy and influential
for consumer behavior. However, source trustworthiness effects may be mitigated by
source expertise effects (Wiener and Mowen 1986). Compared to non-expert sources,
experts are perceived to deliver more compelling, and in turn, more persuasive messages
(Hovland, Janis and Kelley 1953; Hovland and Weiss 1951; Kelman and Hovland 1953;
Petty, Cacioppo and Schumann 1983).
Based on source expertise research, user-generated communications about corporate
social media practices may cause skepticism. Social media users may be regarded as non-
experts as their ability to evaluate corporate societal engagements is likely to be limited.
As a result, the lack of source credibility effects will hinder persuasion. On the contrary,
user-generated communications about corporate core competencies are likely to be
trusted. In this context, consumers are generally regarded as experts since they are
deemed capable to evaluate product-relevant features. As a result, source credibility
effects will not be mitigated. This is consistent with literature on persuasion knowledge.
Friestad and Wright (1994) argue that consumers draw from persuasion knowledge to
evaluate and respond to persuasive claims. Ertimur and Gilly (2012) find that when
consumers evaluate unsolicited user-generated ads, they are skeptical of the ads’
persuasiveness. That is, they are not considered experts to create professional
advertisements. Similarly, Thompson and Malaviya (2013) show that disclosing that an
ad was created by a consumer triggers skepticism and negatively influence brand
evaluations, unless the audience identifies with the creator of the ad. Based on source

28
credibility and expertise effects, we hypothesize that message type moderates the
diagnosticity of media channel. Formally,
H3: Social media are more diagnostic than traditional media for consumers’
formation of beliefs about corporate core competencies (CA associations)
H4: Social media and traditional media are equally diagnostic for consumers’
formation of beliefs about corporate social responsibility practices (CSR
associations)
Method
Study 1
Study 1 investigates the diagnosticity of social media versus traditional media and
whether media channel is differentially diagnostic for corporate ability and corporate
social responsibility messages. In addition, study 1 investigates the underlying process
that explains the diagnosticity differences across media channels. That is, study 1 is
designed to test H1, H2, H3 and H4.
Design and sample
Study 1 is a 2 (Media channel: social media versus traditional media) X 2 (Message
type: CA message versus CSR message) between subjects experimental design. Media
channel was manipulated by asking participants to imagine that they were reading from a
specialized blog website (social media condition) or from a corporate advertisement
(traditional media condition). The message type manipulation was adapted from Biehal
and Sheinin (2007). Participants in the CA condition read information about a company’s

29
quality and innovative offerings; participants in the CSR condition read information
about a company social responsibility practices.
Members of an online panel (n=128) participated in this study in exchange for a
nominal fee. Participants were randomly assigned to one of the four experimental
conditions.
Pretest
To confirm that participants interpreted the messages as corporate ability or
corporate social responsibility a pretest was conducted. Participants (n= 44) were
recruited from the same online panel.
Participants read a corporate ability or a corporate social responsibility message
from a fictitious crowdsourcing company (Atlantic Crowdsourcing), and completed a
corporate beliefs measure adapted from Biehal and Sheinin (2007). On 7-point Likert
scales with “Disagree” and “Agree” endpoints, participants assessed the following
statements about Atlantic Crowdsourcing: 1) algorithms optimize the presentation of the
tasks so they are relevant and interesting, 2) investments in R&D exceed the industry
average, 3) IT administrators diagnose and immediately fix performance issues in the
site, 4) employees and requesters pass strict standards of integrity, 5) employees have the
flexibility to volunteer in their communities, and 6) support charities such as the
LaborNet group. In addition, on a similar 7-point Likert scale, participants indicated how
they thought Atlantic Crowdsourcing was positioned in the market: 1) Competence, 2)
Innovation, 3) Ethics, and 4) Social responsibility.

30
Both measures were subjected to confirmatory factor analysis (CFA) and reliability
analysis. Although the CFA for the corporate beliefs measure did not show an expected
two factor structure, the second eigenvalue equaled 0.92. Given the small sample size
used for the pretest, we assumed λ2 acceptably close to 1 and averaged the first three
items of the scale to form a CA beliefs index (α= 0.93), and the second three items to
form a CSR beliefs index (α= 0.94). The CFA for the corporate positioning measure
showed a two-factor structure. The first two items loaded on one factor and were
averaged to form a CA positioning index (α= 0.77); the other two items loaded on a
second factor and were averaged to form a CSR positioning index (α= 0.88).
An independent sample t-test analysis shows the anticipated results. Participants in
the CA condition rated CA beliefs (MCA = 6.43 > MCSR = 4.15; t(42) = 6.65, p < .001) and
CA positioning (MCA = 6.60 > MCSR = 5.98; t(42) = 2.65, p= .01) significantly higher
than participants in the CSR condition. Also, participants in the CSR condition rated CSR
beliefs (MCA = 2.95 < MCSR = 6.22; t(42) = -8.29, p < .001) and CSR positioning (MCA =
3.97 < MCSR = 6.30; t(42) = -6.14, p < .001) significantly higher than participants in the
CA condition.
Procedure and stimuli
Panel members were invited to participate in an online survey about crowdsourcing
companies that took 5-10 minutes to complete. Participants were asked to imagine that
they were looking for information on the Internet about crowdsourcing websites similar
to MTurk and that they run into a specialized blog website (social media condition) in
which a blogger talked about Atlantic Crowdsourcing, or a corporate advertisement

31
(traditional media condition) from Atlantic Crowdsourcing. To make sure participants
were familiar with the media channel we provided the definition. We described a
specialized blog website as a non-company sponsored site where consumers share
opinions and information without being paid. We described a corporate advertisement as
an ad paid by a company. Participants were told that they would see the information
included in the blog posting or corporate advertisement in the next window.
Then, participants were exposed to either the CA or CSR message. Biehal and
Sheinin (2007) developed two corporate messages that are adapted to the current research
context. In the traditional media condition, we used formal-language CA and CSR
messages. In the social media condition, we maintained the CA and CSR information
consistent but replaced the pronouns (i.e., instead of ‘our products’ we used ‘their
products’) and added personal opinion expressions (i.e., ‘I think’) to add realism to the
specialized blog postings (see Appendix 1 for stimuli details).
Immediately after the participants read the stimulus information, they responded to
dependent measures, covariate measures, and manipulation checks and provided general
demographic information. Then, participants were thanked for completing the survey and
received a validation code to be entered on the Amazon’s Mechanical Turk site.
Measures
Unless the contrary is noted, dependent variables, covariates, and manipulation
checks are all measured using 7-point Likert scales that have “Disagree/Agree” end
points. We assessed the psychometric characteristics and reliability for all measures.

32
Dependent measures: Corporate beliefs, attitude towards the company, word of
mouth and intention to engage with the company. Corporate beliefs were measured as in
the pretest. The measure was adapted from Biehal and Sheinin (2007) and included three
items that captured CA beliefs (α= .92) and three items that captured CSR beliefs (α=
.92). The corporate beliefs measure showed a two-factor structure. The attitude (α= .88),
statements were: 1) Atlantic Crowdsourcing is a good company, 2) I feel positive about
Atlantic Crowdsourcing, and 3) I do not like Atlantic Crowdsourcing. WOM was
measured (α= .90) using I would: 1) likely share information about Atlantic
Crowdsourcing with my friends, 2) likely spread positive word of mouth about Atlantic
Crowdsourcing, 3) not likely recommend Atlantic Crowdsourcing to my friends
(Maxham and Netemeyer 2003). To measure intention to engage with the company (α=
.74), participants stated the extent to which they would: 1) like to learn more about
Atlantic Crowdsourcing, 2) be motivated to respond to Atlantic Crowdsourcing’s future
communications, and 3) not be interested in following Atlantic Crowdsourcing in social
media.
Covariates: Familiarity with crowdsourcing companies and support for CSR. To
capture familiarity with crowdsourcing companies (α= .93), participants stated to what
extent they were 1) familiar, 2) knowledgeable, and 3) not experienced with
crowdsourcing websites (Kent and Allen 1994). In addition, personal support for CSR
(α= .74) has previously been identify as moderator of consumer’s responses to CSR
activities (Sen and Bhattacharya 2001) and is captured using: I support 1) corporate
social responsibility programs, 2) donations to charities that support ethical labor

33
practices, and 3) charities that assist technology development for all (reversed item)
(Adapted from Sen and Bhattacharya 2001).
Other measures: Credibility of the media channel and the message. Credibility of
the media channel (α= .91) was adapted from Meyer (1988). Participants indicated to
what extent corporate advertisements (traditional media condition) or specialized blog
websites (social media condition) were: 1) credible, 2) reliable, 3) can be trusted, 4) fair,
5) biased, 6) accurate, and 7) objective. To capture credibility of the communication (α=
.82), participants showed their agreement with the message being 1) credible and 2)
believable.
Manipulation checks: Media channel and message type. The media channel
manipulation was assessed by asking participants to choose from: 1) corporate
advertisement, 2) specialized blog website, and 3) other as the source of the information
that was presented to them. In addition, to capture perceived corporate control over the
communication (α= .95), participants responded to: Atlantic Crowdsourcing 1) paid to
make the information you read available to consumers, 2) came up with the information
you read, and 3) did not have control over the information you read, on 7-point Likert
scales anchored “Disagree/Agree.”
The effectiveness of the message type manipulation was assessed as in the pretest.
The corporate positioning measure included two items that captured a corporate
positioning on CA (α= .71) and two items that captured a corporate positioning on CSR
(α= .95). The corporate positioning measure showed a two-factor structure.

34
Results
Manipulation checks. The media channel and message manipulations worked as
intended. Survey participants were screened based on the media channel manipulation
check. Participants who failed to select the correct option were excluded from the sample.
The final sample comprised 61 participants in the traditional media condition (48% of the
population) and 67 participants in the social media condition (52% of the population). As
expected, participants in the traditional media condition perceived the corporation as
exerting more control over the communication than did participants in the social media
condition (Mtrad = 5.83, Msoc = 2.36; t(126)= 13.66, p < .001). Perceived corporate control
did not change as a function of message type (MCA = 4.15, MCSR = 3.88; t(126)= .68, p >
.05).
As anticipated, participants in the CA condition perceived Atlantic Crowdsourcing
to be more strongly positioned on competence and innovation than on ethics and social
responsibility (MCA = 6.49 > MCSR = 5.61; t(126) = 5.30, p < .001). Consistently,
participants in the CSR condition perceived Atlantic Crowdsourcing to be more strongly
positioned on ethics and social responsibility than on competence and innovation (MCA =
4.73 < MCSR = 6.65; t(126) = -8.40, p < .001).
Media diagnosticity in forming beliefs, attitudes, and intentions towards a corporate
brand. Consistent with hypothesis 1 (H1), social media are more diagnostic than tradition
media in forming attitudes and intentions towards a corporate brand. A 2 (Media channel)
X 2 (Message) ANOVA using attitude towards the company, intention to engage, and
WOM as the dependent measures, revealed two of the three predicted significant main
effects. Participants in the social media condition showed a more positive attitude

35
towards Atlantic Crowdsourcing than participants in the traditional media condition did
(Mtrad = 5.08, Msoc = 5.85; F (1, 126) = 14.74, p < .001). Similarly, compared to
participants who read the message from a corporate ad, participants who read the
message from a specialized blog website indicated higher intentions to engage with the
company (Mtrad = 4.87, Msoc = 5.52; F (1, 126) = 8.70, p < .01). Participants in the social
media condition indicated higher WOM intentions than participants in the social media
conditions; however, this effect was only close to significance (Mtrad = 4.93, Msoc = 5.41;
F (1, 126) = 3.33, p = .07). Results show that the size of the effect of media channel on
WOM intentions is small to medium (η2= .03), and therefore, even if the difference
between the means is not significant the effect of media channel on WOM should not be
considered insignificant. Familiarity with crowdsourcing websites was initially included
as a covariate but dropped from the analyses since it did not reach significance levels.
The main effect of media channel was the only significant effect in the analyses.
The same 2 (Media channel) X 2 (Message type) ANOVA with CA beliefs as a
dependent variable did not show the predicted effect and, thus H3 is not supported.
Participants in the social media condition did not rate CA beliefs higher than participants
in the traditional media condition (Mtrad = 5.30, Msoc = 5.08; F (1, 126) = .30, p > .05).
Therefore, these results do not suggest that traditional and social media are differentially
diagnostic for forming corporate beliefs about corporate ability practices. Results show a
significant main effect of message type, providing further validity to our manipulation
(MCA = 6.35 > MCSR = 4.01; F(1, 126) = 129.05, p < .001).
The 2 (Media channel) X 2 (Message type) ANCOVA with CSR beliefs as the
dependent variable and support for corporate social responsibility practices as the

36
covariate (F (1, 126) = 4.20, p < .05) supports H4. The analysis shows that social and
traditional media are equally diagnostic for forming beliefs about corporate social
responsibility practices. Participants rated CSR beliefs similarly in the corporate
advertisement and blog conditions (p > .05). Results show a main effect of message type,
providing further validity to our CSR manipulation (MCA = 3.87 < MCSR = 6.45; F(1, 126)
= 186.12, p < .001).
Based on these results, we conclude that social media are more diagnostic than
traditional media in forming attitudes and intentions towards a corporate brand; however,
media channel is not differentially diagnostic for forming beliefs towards corporate
brands. While participants’ attitudes and intentions were influenced by media channel
and independent of message type, their beliefs about corporate brands were influenced by
message type but independent from communication outlet. Thus, the analyses indicate
that while changes in the formation of attitudes and intentions are driven by media
channel, the formation of corporate brand beliefs is driven by message type.
Mediation analysis. To examine the possibility that the results are driven by distinct
levels of message credibility, we perform a 2 (Media channel: traditional vs. social
media) X 2 (Message: CA vs. CSR) ANOVA with message credibility as the dependent
variable. Familiarity with crowdsourcing websites was initially included as a covariate
but dropped from the analysis since it failed to reach significance (F (1, 126) = .03, p >
.05). The ANOVA test did not reveal main effects of media channel (Mtrad = 5.44, Msoc =
5.36; F (1, 126) = .21, p > .05) or message type (MCA = 5.40 < MCSR = 5.40; F (1, 126) =
.00, p > .05). There was no two-way interaction effect (F (3, 124) = .04, p > .05). In

37
addition, the analysis shows that message credibility levels were high (M = 5.40). Thus,
we rule out message credibility as the driver of the results.
The same 2 (Media channel) X 2 (Message type) ANOVA with media credibility as
the dependent measure shows a main effect of media channel. Compared to corporate
advertisements, participants considered specialized blog websites to be significantly more
credible sources of information (Mtrad = 3.72, Msoc = 4.71; F (1, 126) = 29.37, p < .001).
No other main effect (MCA = 4.21, MCSR = 4.26; F (1, 126) = .00, p > .05) or interaction
effect was significant (F (3, 124) = .63, p > .05). Our conceptualization posited that
perceived media credibility mediates the relationship between media channel and
attitudes and intentions towards a corporate brand (see Figure 4).
Figure 4. Mediation model.
To test H2, we use a bootstrapping method (Preacher and Hayes 2008; Zhao, Lynch,
and Chen 2010). A confidence interval (CI) that excludes zero for the indirect effect
would reveal that media credibility mediates the relationship between media channel and
attitudes and intentions towards the corporate brand. Using attitude as the dependent
measure, the confidence interval for the indirect effect excludes zero (95% CI [.23, .72]).
Media Channel:
Traditional media
vs. Social media
Media Channel
Credibility
Attitude and
Intentions towards
the Corporate
brand

38
Similarly, the confidence interval for the indirect effect excludes zero (95% CI [.32, .98])
when WOM is used as the dependent variable. However, when intention to engage is
used as the dependent variable, the confidence interval for the indirect effect includes
zero (95% CI [- .02, .46]). Nevertheless, the lower bound of this CI is close to zero. The
confidence interval for the direct effect includes zero as well (95% CI [- .03, .94]). Based
on the criteria for establishing mediation and its type presented by Zhao, Lynch Jr., and
Zhen (2010), the lack of significance of the direct and indirect effects means no
mediation or direct effects. Given the significant relationship between media channel and
intention to engage (r = .25, p < .01), we argue that mediation requires further
investigation in study 2. Therefore, we do not yet make a conclusion about hypothesis 2.
Discussion
Study 1 finds that social media are more diagnostic than traditional media in forming
attitudes and intentions towards a corporate brand; however, they are equally diagnostic
for forming beliefs about a corporation. While changes in attitudes and intentions are
driven by the media channel and independent of the content of the communication, the
differences in corporate beliefs are driven by the content of the message and independent
of the media outlet used to transmit the information. Although the effect of media
channel in WOM intention was only close to significance, the reported small to medium
effect size indicates that the effect is not negligible. Given that WOM is considered one
of the most effective marketing strategies and the cost of incentivizing it reasonable, we
make a strong case for the importance of this result.
39
In addition, study 1 tentatively identifies the process underlying the media channel
effects. A bootstrapping mediation analysis shows that media credibility mediates the
relationship between media channel and attitudes and WOM intentions towards the
corporate brand. The CI of the indirect effect included zero when intention to engage was
used as the dependent measure. However, the lower bound of the interval was close to
zero. Mediation effects will be further investigated in study 2.
Study 2
The purpose of study 2 is to replicate the findings of study 1 in another industry
context and using different corporate messages. Study 2 is designed to provide external
validity to the results found in study 1. Thus, study 2 is designed to test H1, H2, H3, and
H4.
Design and sample
One hundred and twenty one (n=121) members of the same online panel participated
in this study in exchange for a nominal fee. A 2 (Media channel: social media versus
traditional media) X 2 (Message type: CA message versus CSR message) between
subjects experimental design was used. Media channel and message type were
manipulated as in study 1.
Pretest
To confirm that participants interpreted the new messages as corporate ability or
corporate social responsibility related; and that we created a strong CA and CSR

40
positioning statements, a pretest was conducted. Fifty-two (n= 52) participants were
recruited from the same online panel.
Similarly as in study 1, participants read a corporate ability or a corporate social
responsibility message from a fictitious financial company (Atlantic Finance Company),
and responded to corporate beliefs and corporate positioning measures. On 7-point Likert
scales with “Disagree” and “Agree” endpoints participants showed the extent to which
they agree or disagreed with: Atlantic Finance Company (AFC) 1) provides extraordinary
advice because it invests in the latest technology to construct complex financial models,
2) mutual funds outperform Fidelity Investments and the Dow Jones Index, 3)
profitability exceeds the industry average, 4) is a leader in ethical business and labor
practices, 5) employees pass strict standards of integrity before joining the company, and
6) employees take a few hours off of their work week to contribute to the community. In
addition, on a similar 7-point Likert scale participants indicated how they thought AFC
was positioned in the market: 1) Competence, 2) Quality, 3) Ethics, and 4) Social
Responsibility.
The corporate beliefs and corporate positioning measures both showed the expected
two factor structure. The first three items of the corporate beliefs measure were averaged
to form the CA beliefs index (α= .86), and the second three items to form a CSR beliefs
index (α= .77). The first two items of the corporate positioning measure were averaged to
form a CA positioning index (α= .88); the other two to form a CSR positioning index (α=
.90).
An independent sample t-test analysis supports the effectiveness of the
manipulations. Participants in the CA condition rated CA beliefs (MCA = 5.89 > MCSR =

41
3.97; t(50) = 8.23, p < .001) and CA positioning (MCA = 6.56 > MCSR = 5.26; t(50) = 4.02,
p < .001) significantly higher than participants in the CSR condition. Also, participants in
the CSR condition rated CSR beliefs (MCA = 4.28 < MCSR = 6.04; t(50) = -5.54, p < .001)
and CSR positioning (MCA = 3.98 < MCSR = 6.46; t(50) = -6.43, p < .001) higher than
participants in the CA condition.
Procedure and stimuli
The procedure was similar to the one used in study 1, except that participants were
asked to imagine that they were looking for information about financial companies
instead of crowdsourcing websites. The CA and CSR messages were different from study
1 but highlighted corporate CA or CSR associations (adapted from Biehal and Sheinin
2007) (see Appendix 1 for stimuli details). After participants read the stimulus
information from an advertisement or a blog, they responded to dependent measures,
covariate measures, and manipulation checks and provided general demographic
information. Then, they were thanked and provided with an MTurk code to validate the
results.
Measures
All measures are captured on 7-point Likert scales anchored “Disagree/Agree” and
subjected to CFA and reliability analyses. Alpha levels are reported for each measure.
Dependent measures: Corporate beliefs, attitude towards the company, word of
mouth and intention to engage with the company. Corporate beliefs were captured as in
the pretest. The measure shows two orthogonal factors: CA beliefs (α= .90) and CSR

42
beliefs (α= .81). Attitude (α= .92), WOM (α= .91) and intention to engage with Atlantic
Finance (α= .82) were measured using the same scales as in study 1.
Covariates: Familiarity with financial companies and support for CSR. Familiarity
with financial companies (α= .95) and personal support for CSR (α= .81) were captured
as in study 1.
Other measures: Credibility of the media channel and the message. Credibility of
the media channel (α= .90) was captured as in the previous study. To capture credibility
of the communication (α= .83) we borrowed a scale from Kirmani and Zhu (2007),
which they used as a measure of skepticism about an advertisement. Participants showed
the extent of their agreement/disagreement with the message being 1) truthful, 2)
believable, and 3) deceptive.
Manipulation checks: Media channel and message type. Media channel and message
manipulations were captured using the same measures as in study 1: communication
source identification, corporate control over the communication (α= .94), and corporate
positioning. Corporate positioning showed a two-factor structure (CA_positioning: α=
.92. CSR_positioning: α= .93).
Results
Manipulation checks. The media channel and message manipulations worked as
intended. In this study, participants were not screened based on the media channel
manipulation but a Chi-square test showed a significant effect (χ2(1) = 117. 03, p < .001).
Less than 1% of the sample failed to select the appropriate option. As expected,
participants in the traditional media condition perceived the corporation to exert more

43
control over the communication than participants in the social media condition did (Mtrad
= 5.93, Msoc = 2.75; t(119)= 11.90, p < .001). Perceived corporate control did not change
as a function of message type (MCA = 4.19, MCSR = 4.19; t(119)= .00, p > .05).
As anticipated, participants in the CA condition perceived Atlantic Finance (AFC) to
be more strongly positioned on competence and quality than on ethics and social
responsibility (MCA = 6.31 > MCSR = 5.67; t(119) = 3.37, p < .05). Consistently,
participants in the CSR condition perceived Atlantic Finance (AFC) to be more strongly
positioned on ethics and social responsibility than on competence and innovation (MCA =
5.18 < MCSR = 6.56; t(119) = -7.36, p < .001).
Media diagnosticity in forming beliefs, attitudes, and intentions towards a corporate
brand. Consistent with hypothesis 1 (H1), social media are more diagnostic than tradition
media in forming attitudes and intentions towards a corporate brand. A 2 (Media channel:
traditional vs. social media) X 2 (Message: CA vs. CSR) ANOVA using attitude towards
the company, intention to engage, and WOM as the dependent measures, revealed the
predicted significant main effect. Participants in the social media condition showed a
more positive attitude towards AFC than participants in the traditional media condition
did (Mtrad = 5.67, Msoc = 6.14; F (1, 119) = 6.67, p < .05). Similarly, compared to
participants who read the message from a corporate ad, participants who read the
message from a specialized blog website indicated higher intentions to engage with the
company (Mtrad = 5.24, Msoc = 5.83; F (1, 119) = 7.71, p < .01). Consistently, participants
in the social media condition indicated higher WOM intentions than participants in the
social media conditions; however, this effect was only close to significance (Mtrad = 5.08,
Msoc = 5.55; F (1, 119) = 3.69, p = .06). However, the effect of media channel on WOM is

44
not negligible. Results show that the effect size of media channel is small to medium (η2=
.03). Familiarity with financial companies was initially included as a covariate but
dropped from the analysis since it did not reach significance levels. This was the only
main effect in the analyses.
The same 2 (Media channel) X 2 (Message type) ANOVA with CA beliefs as the
dependent variable did not show the predicted effect and thus, H3 is not supported.
Participants in the social media condition did not rate CA beliefs higher than participants
in the traditional media condition (Mtrad = 4.87, Msoc = 4.99; F (1, 119) = .68, p > .05).
Therefore, these results suggest that traditional and social media are equally diagnostic
for forming corporate beliefs about corporate ability practices. The results show a main
effect of message type, providing further validity to our manipulation (MCA = 5.99 >
MCSR = 3.97; F(1, 119) = 125.53, p < .001).
The 2 (Media channel) X 2 (Message type) ANCOVA with CSR beliefs as the
dependent variable and support for corporate social responsibility practices as the
covariate (F (1, 119) = .177, p < .05) supports H4. The analysis shows that social and
traditional media are equally diagnostic for forming beliefs about corporate social
responsibility practices. Participants rated CSR beliefs similarly in the corporate
advertisement and blog conditions (Mtrad = 5.27, Msoc = 5.40; F (1, 119) = .18, p > .05).
Results also show a main effect of message type, providing further validity to our
manipulation (MCA = 4.34 < MCSR = 6.26; F(1, 119) = 122.20, p < .001).
Consistent with study 1, we argue that social media are more diagnostic than
traditional media in forming attitudes and intentions towards a corporate brand; however,
media channel is not differently diagnostic for forming beliefs towards corporate brands.

45
While participants’ attitudes and intentions were influenced by media channel and
independent of message type, participants’ beliefs about corporate brands were
influenced by message type, but independent of communication outlet. Thus, we replicate
the results of study 1 in a distinct industry context and using different CA and CSR
messages. Similarly as in study 1, we make a strong case for the importance of the media
channel effect in WOM even if the result did not reach significance.
Mediation analysis. To examine the possibility that results were driven by distinct
levels of message credibility, we conducted a 2 (Media channel: traditional vs. social
media) X 2 (Message: CA vs. CSR) ANOVA with message credibility as the dependent
variable. Familiarity with financial companies was initially included as a covariate but
dropped from the analysis since it failed to reach significance (F (1, 119) = .04, p > .05).
The ANOVA test did not reveal main effects of media channel (Mtrad = 5.06, Msoc = 5.34;
F (1, 119) = 2.55, p > .05) or message type (MCA = 5.18, MCSR = 5.24; F (1, 119) = .06, p
> .05); the two-way interaction effect also was not significant (F (3, 117) = .46, p > .05).
In addition, the analysis showed that perceived message credibility levels were high.
Thus, we rule out message credibility as the driver of the results.
The same 2 (Media channel) X 2 (Message type) ANOVA with media credibility as
the dependent measure shows a main effect of media channel. Compared to corporate
advertisements, participants consider specialized blog websites to be significantly more
credible sources of information (Mtrad = 3.89, Msoc = 4.56; F (1, 119) = 15.74, p < .001).
No other main effect (MCA = 4.32, MCSR = 4.19; F (1, 119) = .68, p > .05) or interaction
effect was significant (F (3, 117) = .49, p > .05). Our conceptualization posits that media

46
credibility mediates the relationship between media channel and attitudes and intentions
towards a corporate brand
Using the bootstrapping methodology (Preacher and Hayes 2008; Zhao, Lynch, and
Chen 2010) we seek evidence regarding H2. Using attitude towards the company as a
dependent measure, the confidence interval for the indirect effect excludes zero (95% CI
[.13, .52]). Similarly, the confidence interval for the indirect effect excludes zero (95% CI
[.13, .74]) when WOM is used as a dependent variable. Consistently, when intention to
engage is used as the dependent variable, the confidence interval for the indirect effect
excludes zero as well (95% CI [.07, .43]). Based on the criteria for establishing mediation
and its type presented by Zhao, Lynch Jr., and Zhen (2010), these findings support a full
mediation effect, supporting hypothesis two.
Discussion
Study 2 replicates findings from study1 and finds support for H1, H2 and H4, and
rejects H3. In study 1, we argued that although results did not show a full mediation
effect for intentions to engage with the company, the CI was close to excluding zero. In
study 2, we find support for the full mediation model, providing support to our previous
claims.
A possible explanation for the lack of support for hypothesis three may be lack of
differences in perceived source expertise. Unfortunately, we failed to capture perceived
source expertise and we cannot further elaborate on this potential explanation. In a
follow-up experiment we plan to measure perceived communicator expertise and assess
whether perceived expertise changes as a function of message type. Participants rated the

47
credibility of the messages high independently of channel and message type. While no
differences in credibility makes for a strong case that the media diagnosticity results are
driven by media credibility effects and not message effects, this may be an indication of a
lack of source expertise variation as a function of message type.
An alternative explanation is the informational power of media channel as a
heuristic. Consumers are known to reach satisfactory rather than optimal conclusions
(Bettman 1979; Newell and Simon 1972). Consumers do not process all the information
that is available but the information needed to feel comfortable with a decision. In the
context of this study, the diagnostic power of media channel may have been enough to
reach a satisfactory conclusion about the corporate brand. In that case, the use of
alternative heuristics such as source expertise may have been avoided.
Discussion, limitations, and ideas for future research
It may sound counterintuitive, but giving up some control over business
communications may bring benefits to a corporation’s bottom line. While corporate-
controlled communications generate consumer skepticism, non-corporate controlled
communications enjoy credibility. Studies 1 and 2 indicate that social media are more
diagnostic than traditional media in forming attitudes and intentions towards corporate
brands, and that media credibility is responsible for these results. These findings are in
line with research that claims that self-governance is a driver of value in online
communities (Seraj 2012). Studies 1 and 2 also show that social and traditional media are
equally diagnostic in forming beliefs about corporate brands. Although Biehal and
Sheinin (2007) show that CA messages are more diagnostic than CSR messages in

48
forming product beliefs, our studies indicate that this is not the case for corporate brands.
Potential explanations for the lack of significant effects are included in the discussion
section of study 2.
From a managerial perspective, we argue that although social media do not replace
traditional media, they bring a credibility and trustworthiness dimension to corporate
communications that is otherwise difficult to achieve. Consistent with Goldenberg,
Oestreicher-Singer and Reichman (2012), Stephen and Galak (2012), and Dinner, van
Heerde, and Neslin (2014) we encourage corporations to create synergies across channels
and incentive eWOM. Research shows that individual media channels offer distinct
contributions to an overall brand management strategy.
From a theoretical perspective, this paper contributes to the social media and
corporate branding literatures. Specifically, this paper expands the “media channel”
stream of research of the social media research framework presented at the beginning of
the dissertation. Although efforts have been made to understand how social media
compares to traditional media (Berger and Iyengar 2013; Schweidel and Moe 2014;
Trusov, Bucklin and Pauwels 2009; Stephen and Galack 2012; Danaher and Dagger
2013; Goldenberg, Oestreicher-Singer and Reichman 2012), to the best of our
knowledge, media diagnosticity effects had not yet been explored in the social media
literature. This paper also contributes to the corporate branding literature by expanding
the CA-CSR research framework to the new media context. Research in corporate
branding has shown that CA and CSR messages are differentially diagnostic for
consumers’ formation of beliefs about products (Brown and Dacin 1997, Biehal and
Sheinin 2007); however, this is the first attempt to understand media channel

49
diagnosticity effects as a function of message type. Our experiments indicate that
message type does not have an effect on the relative diagnosticity of social and traditional
media. These findings however are not without limitations. The purpose of this paper was
to explore causality; however, consumers base their decisions on multiple sources of
information. A future research idea is to simultaneously present multiple messages from
multiple sources (i.e. a CA message from social media and a CSR message from a
corporate ad) and explore the relative diagnosticity of the media and the message type. In
addition, message framing has been shown to influence consumer behavior (e.g. Grewal,
Gotlieb and Marmorstein 1994; Maheswaran, Meyers-Levy 1990; Shiv, Edell Britton,
and Payne 2004) and they may as well change the diagnosticity of the communication
channel.
We operationalize social media through specialized blog websites. We may have
enhanced blog credibility by using the word “specialized.” A potential research idea is to
explore the effect of the blog name (i.e. WSJ blog versus SingleMom & Money blog
versus Susan blog) on its credibility, and in turn, its diagnosticity. In addition, social
network sites are also considered social media channels. To generalize the findings of this
manuscript to the entire social media context, future research could explore alternative
operationalizations of new media (ie. Facebook).
References
Aaker, David A. (1996), Building Strong Brands. New York: The Free Press.
Aaker, David A. (2004), “Leveraging the Corporate Brand,” California Management
Review, 46 (3), 6-18.

50
Alsop, Ronald J. (2005), Communicating Corporate Citizenship. Leading Perspectives by
Business for Social Responsibility, Summer, 4- 5.
Arndt, Johan (1967), “Role of Product-Related Conversations in the Diffusion of a New
Product,” Journal of Marketing Research, 4 (3), 291- 295.
Barich, Howard and Philip Kotler (1991), “A Framework for Marketing Image
Management,” Sloan Management Review, Winter, 94-104.
Berens, Guido, Cees B.M. van Riel and Gerrit H. van Bruggen (2005), “Corporate
Associations and Consumer Product Responses: The Moderating Role of
Corporate Brand Dominance,” Journal of Marketing, 69 (July), 35-48.
Berger, Jonah and Raghuram Iyengar (2013), “Communication Channels and Word of
Mouth: How the Medium Shapes the Message Contains supplements,” Journal of
Consumer Research, 40 (3), 567-579.
Bettman, James R. (1979), An Information ProcessingTheory of Consumer Choice,
Reading, MA: Addison-Wesley.
Bettman, James, Eric J. Johnson, & John W. Payne (1991), “Consumer Decision
Making.” In Handbook of Consumer Behavior, 50-84, New Jersey: Prentice Hall.
Bharadwaj, Sundar G., Kapil R. Tuli, and Andre Bonfrer (2011), “The Impact of Brand
Quality on Shareholder Wealth,” Journal of Marketing, 75 (5), 88- 104.
Biehal, Gabriel J. and Daniel A. Sheinin (2007), “The Influence of Corporate Messages
on the Product Portfolio,” Journal of Marketing, 71 (2), 12- 25.
Brown, Jo, Amanda J. Broderick and Nick Lee (2007), “Word of Mouth Communication
within Online Communities: Conceptualizing the Online Social Network,”
Journal of Interactive Marketing, 21 (3), 2-20.
Brown, Tom J. and Peter A. Dacin (1997), “The Company and the Product: Corporate
Associations and Consumer Product Responses,” Journal of Marketing, 61 (1),
68- 84.
Creyer, Elizabeth H. and William T. Ross (1996), “The Impact of Corporate Behavior on
Perceived Product Value,” Marketing Letters, 7 (2), 173-185.
Danaher, Peter J. and Tracey S. Dagger (2013), “Comparing the Relative Effectiveness of
Advertising Channels: a Case Study of a Multimedia Blitz Campaign,” Journal of
Marketing Research, 50 (4), 517-534.

51
Dinner, Issac M., Harald J. Van Heerde and Scott Neslin, (2014), “Driving Online and
Offline Sales: The Cross-Channel Effects of Digital versus Traditional
Advertising,” Journal of Marketing Research In-Press.
Du, Shuili, C. B. Bhattacharya and Sankar Sen (2010), “Maximizing Business Returns to
Corporate Social Responsibility (CSR): The Role of CSR Communication,”
International Journal of Management Reviews, 12 (1), 8- 19.
Duncan, Tom and Sandra E. Moriarty (1998), “A Communication-Based Marketing
Model for Managing Relationships,” Journal of Marketing, 62 (April), 1- 13.
Eagly, Alice H. and Shelly Chaiken (1984), “Cognitive Theories of Persuasion.” In L.
Berkowitz (ed.) Advances in Experimental Social Psychology, 17, New York:
Academic Press.
Ertimur, Burçak and Mary C. Gilly (2012), “So Whaddya Think? Consumers Create Ads
and Other Consumers Critique Them,” Journal of Interactive Marketing, 26 (3),
115- 130.
Feldman, Jack M. and John G. Lynch Jr. (1988), “Self-Generated Validity and Other
Effects of Measurement on Belief, Attitude, Intention, and Behavior,” Journal of
Applied Psychology, 73 (3), 421-35.
Fombrun, Charles J. (1996), “Reputation: Realizing Value from the Corporate Image,”
Cambridge, MA: Harvard Business School Press.
Friestad, Marian and Peter Wright (1994), “The Persuasion Knowledge Model: How
People Cope with Persuasion Attempts,” Journal of Consumer Research, 21
(June), 1- 31.
Gensler, Sonja, Franziska Völckner, Yuping Liu-Thompkins and Caroline Wiertz (2013),
“Managing Brands in the Social Media Environment,” Journal of Interactive
Marketing, 27 (4), 242-256.
Ghemawat, Pankaj (1986), Sustainable advantage. Harvard Business Review, 64 (5), 53-
58.
Goldberg, Marvin E. and Jon Hartwick (1990), “The Effects of Advertiser Reputation
and Extremity of Advertising Claim on Advertising Effectiveness,” Journal of
Consumer Research, 17 (September), 172- 179.
Goldenberg, Jacob, Gal Oestreicher-Singer and Shachar Reichman (2012), “The Quest
for Content: How User-Generated Links Can Facilitate Online Exploration,”
Journal of Marketing Research, 49 (4), 452-468.

52
Grewal, Dhruv, Jerry Gotlieb, and Howard Marmorstein (1994), “The Moderating Effects
of Message Framing and SourceCredibility on the Price-Perceived Risk
Relationship,” Journal of Consumer Research, 21, (June), 145-53.
Gürhan-Canli, Zeynep and Rajeev Batra (2004), “When Corporate Image Affects Product
Evaluations: The Moderating Role of Perceived Risk,” Journal of Marketing
Research, 41 (2), 197- 205.
Hatch, Mary Jo and Majken Schultz (2001), “Are the Strategic Stars Aligned for Your
Corporate Brand?,” Harvard Business Review (February), 128- 134.
Hennig-Thurau, Thorsten, Kevin P. Gwinner, Gianfranco Walsh and Dwayne D. Gremler
(2004), “Electronic Word-of-Mouth Via Consumer- Opinion Platforms: What
Motivates Consumers to Articulate Themselves on the Internet?,” Journal of
Interactive Marketing, 18 (1), 38- 52.
Homburg, Christian, Marcel Stierl, and Torsten Bornemann (2013), “Corporate Social
Responsibility in Business-to-Business Markets: How Organizational Customers
Account for Supplier Corporate Social Responsibility Engagement,” Journal of
Marketing, 77 (6), 54-72.
Hovland, Carl I. and Walter Weiss (1951), “The Influence of Source Credibility on
Communication Effectiveness,” Public Opinion Quarterly, 15, 635-650.
Hovland, Carl I., Irving L. Janis and Harold H. Kelley (1953), Communication and
persuasion: Psychological studies of opinion and change. New Haven, CT: Yale
University Press.
Kelman, Herbert C. and Carl I. Hovland, (1953), ““Reinstatement” of the Communicator
in Delayed Measurement of Opinion Change,” Journal of Abnormal and Social
Psychology, 48, 327-335.
Kent, Robert J. and Chris T. Allen (1994), "Competitive Interference Effects in
Consumer Memory for Advertising: The Role of Brand Familiarity," Journal of
Marketing, 58 (July), 97-105.
Kirmani, Amna and Rui (Juliet) Zhu (2007), “Vigilant Against Manipulation: The Effect
of Regulatory Focus on the Use of Persuasion Knowledge,” Journal of Marketing
Research, 44 (4), 688-701.
Kozinets, Robert V., Kristine de Valck, Andrea C. Wojnicki and Sarah J.S. Wilner
(2010), “Networked Narratives: Understanding Word-of-Mouth Marketing in
Online Communities,” Journal of Marketing, 74 (2), 71-89.

53
Luo, Xueming and C.B. Bhattacharya (2006), “Corporate Social Responsibility,
Customer Satisfaction, and Market Value,” Journal of Marketing, 70 (October),
1- 18.
Luo, Xueming and C.B. Bhattacharya (2009), “The Debate over Doing Good: Corporate
Social Performance, Strategic Marketing Levers, and Firm-idiosyncratic Risk,”
Journal of Marketing, 73 (6), 198-213.
Maheswaran, Durairaj and Joan Meyers-Levy (1990), “The Influence of Message
Framing and Issue Involvement,” Journal of Marketing Research, 27, 361–367.
Maxham, James G., III and Richard G. Netemeyer (2003), “Firms Reap What They Sow:
The Effects of Shared Values and Perceived Organizational Justice on Customer
Evaluations of Complaint Handling,” Journal of Marketing, 67 (1), 46-62.
Meyer, P. (1988), “Defining and measuring credibility of newspapers: Developing an
Index,” Journalism Quarterly, 65 (3), 567-574.
Misner, Ivan R. (1999), The World’s Best Known Marketing Secret: Building Your
Business with Word-of-Mouth Marketing, 2d ed. Austin: Bard Press.
MSI (2010), “Delivering Value Through Enhanced Media and Channels,” 2010- 2012
Research Priorities. Available at
http://www.msi.org/research/index.cfm?id=271#RP5. Accessed 7/22/2013.
Nelson, Phillip (1970), “Information and Consumer Behavior,” Journal of Political
Economy, 78 (2), 45- 57
Newell, Allen, and Herbert A. Simon: Human Problem Solving, Prentice-Hall,
Englewood Cliffs, NJ, 1972.
Nielsen (2011), State of the Social Media. The Social Media Report 2012. Available at
http://cn.nielsen.com/documents/Nielsen-Social-Media-
Report_FINAL_090911.pdf. Accessed 2/10/2013.
Nielsen (2012), State of the Social Media. The Social Media Report 2012. Available at
http://blog.nielsen.com/nielsenwire/social/2012/. Accessed 2/10/2013.
Obermiller, C. and Eric R. Spangenberg (1998), “Development of a Scale to Measure
Consumer Skepticism toward Advertising,” Journal of Consumer Psychology, 7
(2), 159-186.
Obermiller, C. and Eric R. Spangenberg (2000), “On the Origin and Distinctiveness of
Skepticism Toward Advertising,” Marketing Letters, 11, 311-322.

54
Percy, Larry and John R. Rossiter (1980), Advertising Strategy: A Communication
Theory Approach. New York: Praeger Publications.
Petty, Richard E. and John T. Cacioppo (1986), Communication and Persuasion: Central
and Peripheral Routes to Attitude Change. New York: Springer-Verlag.
Petty, Richard E., Duane T. Wegener, and Paul White (1998), "Flexible Correction
Processes in Social Judgment: Implications for Persuasion," Social Cognition, 16
(1), 93- 113.
Petty, Richard E., John T. Cacioppo and David Schumann (1983), “Central and
Peripheral Routes to Advertising Effectiveness: The Moderating Role of
Involvement,” Journal of Consumer Research, 10 (September), 135- 146.
Pomering, Alan and Lester W. Johnson (2009), “Advertising Corporate Social
Responsibility Initiatives to Communicate Corporate Image. Inhibiting Scepticism
to Enhance Persuasion,” Corporate Communications: An International Journal,
14 (4), 420- 439.
Preacher, Kristopher and Andrew F. Hayes (2008), “Contemporary Approaches to
Assessing Mediation in Communication Research”, Sage Sourcebook of
Advanced Data Analysis Methods for Communication Research, 13-54, Thousand
Oaks, CA: Sage.
Raju, Jagmohan S. and Sanjay K. Dhar (1999), “A Note on the Relationship between
Firm Diversification and Corporate Advertising Expenditures,” Marketing
Letters, 10 (1), 33-47.
Schlegelmilch, Bodo B. and Irene Pollach (2010), “The Perils and Opportunities of
Communicating Corporate Ethics,” Journal of Marketing Management, 21 (3-4),
267-90.
Schweidel, David A. and Wendy W. Moe (2014), "Listening in on Social Media: A Joint
Model of Sentiment and Venue Format Choice," Journal of Marketing Research
In-Press.
Sen, Sankar and C.B. Bhattacharya (2001), “Does Doing Good Always Lead to Doing
Better? Consumer Reactions to Corporate Social Responsibility,” Journal of
Marketing Research, 38 (2), 225-243.
Seraj, Mina (2012), “We Create, We Connect, We Respect, Therefore We Are:
Intellectual, Social, and Cultural Value in Online Communities,” Journal of
Interactive Marketing, 26 (4), 209-222.
Sheinin, Daniel A. and Gabriel J. Biehal (1999), “Corporate Advertising Pass-Through
onto the Brand: Some Experimental Evidence,” Marketing Letters, 10 (1), 63- 73.

55
Shiv, Baba, Julie A. Edell Britton and John W. Payne (2004), “Does Elaboration Increase
or Decrease the Effectiveness of Negatively versus Positively Framed Messages?”
Journal of Consumer Research, 31(June), 199-208.
Silverman, George (1997), “How to Harness the Awesome Power of Word of Mouth,”
Direct Marketing, November, 32- 37.
Stephen, Andrew T. and Jeff Galak (2012), "The Effects of Traditional and Social Earned
Media on Sales: A Study of a Microlending Marketplace," Journal of Marketing
Research, 49 (5), 624- 639.
Thompson, Debora V. and Prashant Malaviya (2013), “Consumer-Generated Ads: Does
Awareness of Advertising Co-Creation Help or Hurt Persuasion?,” Journal of
Marketing, 77 (3), 33- 47.
Torelli, Carlos J., Alokparna Basu Monga, and Andrew M. Kaikati (2012), “Doing
Poorly by Doing Poorly by Doing Good: Corporate Social Responsibility and
Brand Concepts,” Journal of Consumer Research, 38 (February), 948- 963.
Trusov, Michael, Randolph E. Bucklin and Koen Pauwels (2009), “Effects of Word-of-
Mouth versus Traditional Marketing: Findings from and Internet Social
Networking Site,” Journal of Marketing, 73 (5), 90-102.
Wiener, Joshua L. and John C. Mowen (1986), “Source Credibility: on the Independent
Effects of Trust and Expertise,” Advances in Consumer Research, 13, eds.
Richard J. Lutz, Provo, UT: Association for Consumer Research, 306- 310.
Williams, P., Gavan J. Fitzsimons and Lauren G. Block (2004), “When Consumers Do
Not Recognize ‘Benign’ Intention Questions as Persuasion Attempts ,” Journal of
Consumer Research, 31 (December), 540-550.
Wood, Wendy and Alice H. Eagly (1981), “Stages in the Analysis of Persuasive
Messages: The Role of Causal Inferences and Message Comprehension,” Journal
of Personality and Social Psychology, 40, 246- 259.
Wright, P. L. (1986), “Consumers Intuitive Theories about Marketers' Influence Tactics,
Advances in Consumer Research, 13, 1-3. Provo, UT: Association for Consumer
Research.
Zhao, Xinshu, John G. Lynch and Qimei Chen (2010), “Reconsidering Baron and Kenny:
Myths and Truths about Mediation Analysis,” Journal of Consumer Research, 37
(August), 197-206

56
MANUSCRIPT – II
Target Publication: Journal of Product and Brand Management
Visual Social Media and Image Associations Transfer to the Brand
Gema Vinuales
College of Business Administration, University of Rhode Island, Kingston, RI, USA
Corresponding Author: Gema Vinuales
College of Business Administration
University of Rhode Island
7 Lippitt Rd. Room 216
Kingston, RI 02906
Phone: +1 (401) 874 5064
Email address: [email protected]

57
Abstract
Current social media trends highlight the importance of strategizing visual
content plans. Visuals are prevalent in new media and research is limited on how
social media users interpret images and make judgments about brands. Given the
similarities between the image curation process undertaken by brands in their visual
social media profiles and the art curation process undertaken by museum professionals
in their exhibitions, we develop a conceptual framework based on theories of curation
developed within the traditional museum literature. In three studies we show that
social media users integrate associations from multiple images when making sense of
a brand. In addition we identify ‘curatorial’ artifacts that change the weight given to
each image unique associations when combining multiple visual stimuli. Specifically,
social media users anchor the interpretation of a brand on the most popular image on a
visual social media profile. The effect of self construal in the interpretation of brand
profiles is explored. A discussion section and future research ideas are discussed at the
end of the manuscript.
Introduction
Current social media trends highlight the need to strategize visual content plans.
Images are considered pillars of solid content strategies (Forbes 2013) since visually-
based content drives engagement (Huffingtonpost 2014; Foxbusiness 2014), enhances
click-through rates (Mashable 2014), generates customer interest
(Socialmediaexaminer 2014), and effectively communicates brand stories
(Entrepreneur 2014). However, visual imagery research in the social media context is

58
very limited. Social media has facilitated the collection, display (Davison 2009;
Warren and Vince 2012), exchange, and sharing of visual materials, and have lead to
the creation of some virtual spaces characterized by carefully selected and curated
images (Branthwaite 2002; Schroeder 2004). Some argue that curatorship is a natural
propensity in the new media (Potter and Banaji 2012), and although the tenets of
curation are rooted in museums and museological science, the activity of curatorship
has expanded into new content and media domains and is now undertaken by new
actors (Feinberg, Geisler, Whitworth and Clark 2012). Research in traditional museum
science argues that curation involves structuring relationships and imposing
organizational frameworks on works displayed in an exhibition (Chandler 2009).
Similarly, in the digital realm the activity of curatorship entails the selection,
organization, and presentation of physically intangible objects (i.e., images, videos)
that result in digital collections that become part of visual and virtual ‘museums’.
Therefore, we argue that digital-visual social media sites can be studied using concepts
of curatorship applied in the traditional museum context.
Visual imagery is critical in social media since visual consumption takes a central
stage on the web (Schroeder 2004). In addition, the ‘sharability’ of the images is
considered a critical driver of social media content marketing strategies success
(Forbes 2013). However, research is limited on how visual information is processed in
this context and whether visuals associations transfer to the brand. The purpose of this
manuscript is to understand whether the characteristics of the visuals (i.e. vividness) –
a marketer controlled variable – and the social media responses they generate (i.e.,
number of ‘shares’) – a user controlled variable – influence brand judgments. A

59
raising challenge in marketing is to understand how to operate in an environment in
which marketers and consumers share the task of creating brand images in consumer’s
minds. Specifically, this manuscript addresses the diagnosticity of user and marketer
actions in the formation of brand judgments.
Research in social media has investigated phenomena such as WOM (Kozinets,
de Valck, Wojnicki, and Wilner 2010; Berger and Milkman 2012; Berger and
Schwartz 2011; Berger and Iyengar 2013), co-creation (Ransbotham, Kane and Lurie
2012; Smith, Fischer and Yongjian 2012 Thompson and Malaviya 2013; Hautz,
Füller, Hutter and Thürridl 2014), media channel comparisons (Trusov, Bucklin and
Pauwels 2009; Stephen and Galak 2012; Danaher and Dagger 2013; Schweidel and
Moe 2014; Goldenberg, Oestreicher-Singer and Reichman 2012) online reviews (Luo,
Raithel and Wiles 2013; Chen, Liu and Zhang 2012; Ludwig, Ruyter, Friedman,
Brüggen, Wetzels and Pfann 2013); and community influence (Ansari, Koenigsberg
and Stahl 2011; Naylor, Lamberton and West 2012; Wilcox and Stephen 2013;
Barasch and Berger 2014). However, to the best of our knowledge, no research has
explored the phenomenon of visual social media communication. Naylor, Lamberton
and West (2012) provide anecdotal evidence of the power of images in social media.
Nevertheless, the focus of the paper is not on image processing effects but on their
mere presence influence in consumer behavior. Given that visual media are known to
communicate differently than verbal media (Spencer 2011; Bell and Davison 2012),
that the contemporary society is saturated with images (Davison 2009; Mitchell 2005;
Warren and Vince 2012) and that consumers and professionals communicate visually

60
more than ever before (Kenney 2009), understanding how social media users process
visual information is deemed extremely relevant for marketing theory and practice.
Corporate visual social media sites contain images that represent or relate to some
aspects of the brand; visual assemblages are the result of a curation process undertaken
by the brand. Visual-digital sites are composed by several ‘pieces of art.’ Popular
‘pieces’ are hypothesized to attract user attention, and in turn, influence judgments
about the brand. Drawing from theories of visual attention (Bundesent 1990) and
social influence (Turner, Hogg, Oakes, Reicher and Wetherell 1987), we argue that
image characteristics and the responses (i.e. number of shares) they generate attract
social media users’ attention, and anchor the interpretation and judgments of the
brand.
In three studies, we show that visual social media profiles influence brand
interpretation. That is, the associations derived from visual social media profiles
transfer to the brand. Specifically, the personality represented by an image defines the
personality of the brand. When collections of images are presented together, they
interact so the brand personality becomes hybrid. The hybrid personality is anchored
on the most popular image in a social media profile.
We organize the reminder of this manuscript as follows: we begin by
summarizing previous research on visual communication, museum studies and self-
construal to build our conceptual framework, and then we describe our method and
hypotheses. Next, we present the empirical analysis and results. Lastly, we offer
implications for theory and practice.

61
Conceptual framework
Visual communication
Visual media are known to communicate differently than verbal media; they
trigger cognitions and emotions (Bell and Davison 2012; Spencer 2011), and
communicate in more concrete and telling ways than abstract narratives do (Cochoy
2012). Pictures are more easily recalled and recognized than words (Lutz and Lutz
1978), and since they tend to be vivid, they are more impactful and convey more
information than words alone (Kenney 2009). In addition, as social media users
consume visual information as a form of entertainment, they acquire knowledge by
decoding the meaning of the signs (Cochoy 2012). While social media users glance at
images, some associations are assimilated subliminally (Gabriel 2012). In the context
of this manuscript, we argue that while browsing over brand-curated collections of
visuals, some of the image associations are used as a basis for brand judgments.
Frequently, visuals are not integrated into stories or narratives, but operate as
emotional triggers that prompt associations with other images (Gabriel 2012).
Research in psychology and marketing supports the strong potential of visuals to
influence consumer behavior (Davison 2009); consumers often make brand decisions
just on the basis of aesthetics (Patrick and Hagtvedt 2011), and images are known to
affect perceptions, beliefs, and feelings (Branthwaite 2002). While image processing
effects have been explored in the traditional marketing communications context, social
media present unique aspects for the study of visual communication. In the traditional
media context, visual and text communications interact; however, social media allows
for fully visual profiles. Interestingly, emerging social media platforms such as

62
Pinterest, Instagram, Vine, Tumblr, or Snapchat make use of visuals as the exclusive
means of communication. In addition, while marketers used to select and establish
relationships among visuals to create well crafted brand images, social media allows
for image sharing and rearrangement in brand and user’s profiles. Also, in traditional
media, visuals are not subject to public opinion; however, social media allows for
user’s support to the aesthetical value of the images (i.e. “share”).
Given the limited understanding of visual communications in the social media
context, and the close analogy that can be traced between museum exhibitions and
visual social media profiles, we argue that theories of curation from the traditional
museum literature are a strong base to develop our conceptual framework. Literature
in museum studies argues that the goal of a museum exhibition is to stimulate new
attitudes and interests on visitors, which in turn lead to WOM (Lord and Lord 2001).
Similarly, visual social media profiles aim to generate user’s interest and engagement,
and in turn WOM in the form of image sharing.
Museums, exhibitions, and curators
Museums are considered temples of learning and spaces for entertainment
(McLean 1999; Falk, Moussouri, Coulson 1998; Lord and Lord 2001). Museums
transmit ideas and stories (Moser 2010) and allow visitors to explore collections for
inspiration, learning, and enjoyment.
Exhibitions are unique to museums, their main attraction, and their instrument for
communication (McLean 1999; Lord and Lord 2001; Hong, Chen and Hung 2004).
Exhibitions are spaces that allow free movements; spaces visitors can leave and return

63
as many times as they like. Visitors linger on the art of their interest and skip those
pieces that seem unattractive (Belcher 1991). If the exhibition meets visitors’
expectations, they may eventually return. A visit is an opportunity for the curator and
the spectator to connect and establish a relationship.
Museum curators structure relationships and impose organizational frameworks
on the pieces of art. Curators are active producers of meaning (Accord 2010; Puwar
and Sharma 2012) through their judgment, selection, and organization of aesthetic
artifacts that are displayed in an exhibition. That is, they make sense on the art
(Chandler 2009). Meaning-making is a function of the selected art and the subtle
nuances that come from the exhibition plan, the lighting, and the color (Chandler
2009; Patience 2010), among other curatorial tactics.
Similarly, in the visual social media context, brands design profiles that through
images communicate stories that create strong image and knowledge structures in
consumer’s minds. Research in marketing has shown that stories provide meaning to
brands (Singh and Sonnenburg 2012), are an effective way to communicate with
consumers (Woodside 2010) and can strengthen consumer-brand relationships
(Escalas 2004). In visual social media contexts, collections of images provide a
multifaceted brand image reinforced by thematically organized visuals. Brands aim for
users to engage with their postings and re-visit the site. As museum curators make
sense of the art, social media content strategists produce meaning through selected
images and the artistic artifacts that social media platforms provide. Museums visitors
are considered active interpreters and meaning-makers (Macdonald 2007), and we
argue that social media users are as well. Therefore, we hypothesize that:
64
H1: Social media users integrate associations from multiple images in the process
of understanding a brand
Consumers have the ability to sort visual information, decode the meaning of
signs, and discern relevant content (Gabriel 2012). Given the vast amount of images
available in social media and the limitations on human brain processing capabilities,
selecting visual information is a must.
Attention has been described as the mechanism that turns looking into seeing.
Selective visual attention allows consumers to focus on relevant information (Carrasco
2011) and avoid overloading cognitive resources. According to visual attention
research, spatial attention enhances processing of visual stimuli within a focus area
(Carrasco 2011) and reduces processing efforts outside (Smith, Singh and Greenlee
2000). Attention tends to be directed towards salient visual features such as lighting
and colors (Carrasco 2011). Traditional museum literature argues that light is a key
interpretative tool and has significant effects in defining pieces of art as important or
aesthetic master pieces (Moser 2010). We argue that what lighting and color is to a
museum piece of art, vividness is to an image in a social media profile. We
hypothesize that the vividness of an image serves as a prompt for social media user
attention. In turn, that image anchors the interpretation of the entire visual social
media profile. Associations derived from that image serve as a basis for judgments
about the brand. Therefore, vividness is considered a ‘curatorial’ artifact that changes
the weight given to an image’s unique associations in the process of integrating
multiple visuals. Therefore:

65
H2: Image vividness enhances the weight given to the associations derived from
that picture in the process of integrating multiple visual stimuli to make sense of a
brand.
Social nature of museum visiting
Museum visiting is a social event (Macdonald 2007) and interactions with others
are crucial for visitors to notice particular exhibitions or understand them in particular
ways. Museum visiting is part of a shared and collaborative experience (Heath and
vom Lehn 2004). The story, the message, and the opportunity for social groups to
experience a museum together is what make museums unique (Gurian 1999).
Visual social media sites become spaces for aesthetic co-creation. Collective
interactions through commenting, liking, and sharing motivate social media users to
develop, realize, propagate, and promote ideas (Kozinets, Hemetsberger, and Jensen
Schau 2008). Some visuals receive more attention and are more popular than others, as
indicated by the social media responses they generate. That is, the number of times a
visual has been shared is a proxy for image popularity within the social media
community. Based on social influence theory (Turner, Hogg, Oakes, Reicher and
Wetherell 1987) the actions of social group members have a powerful effect on a
given member’s behavior. Consumers conform to social influence from peers they
know, they do not know (Darley and Latane 1967), and abstract reference groups
(Cohen 2003; Naylor, Lamberton and West 2012).
We argue that the social media responses – that is, the number of ‘shares’ a visual
receives – capture social media users attention and make them notice particular images

66
within a brand profile. Social media users anchor the interpretation of brand on the
most popular image on a visual social media profile. That is, the number of shares an
image receives is diagnostic to form judgments about the brand. Given that consumers
experience conformity pressures from community members (Sridhar and Srinivasan
2012), we hypothesize that the associations derived from popular images are more
heavily weighted in the process of integrating multiple visual stimuli when making
sense of a brand. Formally,
H3: Image popularity enhances the weight an individual gives to the associations
derived from that picture in the process of integrating multiple visual stimuli to
make sense of a brand.
Self-construal
Literature in self-construal distinguishes between independent and interdependent
self concepts. These two self-concepts coexist across cultures and within each
individual. Self-construal can be activated through situational changes (Trafimow,
Triandis, and Goto 1991; Ybarra and Trafimow 1998) and is known to influence social
perceptions and behaviors (Lee, Aaker and Gardner 2000; Mandel 2003; Zhang and
Shrum 2009). Priming and individual’s independent or interdependent self-concept
influences judgments (Herr 1989; Krishna, Zhou, and Zhang 2008), information
processing (Aaker and Lee 2001; Krishna, Zhou, and Zhang 2008, Kuhnen, Hannover,
and Schubert 2001; Ahluwalia 2008), decision making (Mandel 2003), and choice
(Bettman and Sujan 1987; Mandel and Johnson 2002).

67
Independent self-construals are characterized as distinct from the group, unique,
and autonomous, and interdependent self-construal as part of a group, interconnected,
and relationship focused (Markus and Kitayama 1991). While the principal goal of
interdependents is to maintain harmony with the group, the main objective of
independents is to stand out from the group (Markus and Kitayama 1991, 1994).
Social media have allowed individuals to freely express their opinions through
textual comments as well as built-in platform mechanisms such as ‘likes’ or ‘shares.’
We argue that the number of times an image has been shared is a proxy for image
popularity; it is a social community sign of approval for the aesthetical value of the
visual stimuli posted by the brand. While the actions social group members have a
powerful effect on a given member’s behavior (Turner, Hogg, Oakes, Reicher and
Wetherell 1987), they distinctively affect different self-concepts. Considering the
distinct motivations of independent and interdependent individuals to maintain
harmony or be distinct from the group, we hypothesize that self-construal will
moderate the influence of the social media community behavior on the interpretation
of a brand. Specifically, we hypothesize that:
H4: Interdependent social media users will weigh more heavily the associations
from an image in the process of making sense of a brand when the image has
generated a high number of shares (versus a low number of shares)
H5: Independent social media users will weigh more heavily the associations
from an image in the process of making sense of a brand when the image has
generated a low number of shares (versus a high number of shares)

68
Method
Pretests
The purpose of the pretests is to identify images that let us trace the transfer of
associations from the images to the brand. Therefore, each image must generate
unique and distinct associations. Aaker (1997) shows that brand personality is a multi-
dimensional construct and identifies five orthogonal brand personality dimensions:
sincere, excitement, competence, sophistication, and ruggedness. The goal of the
pretests is to identify images that generate strong brand personality associations.
Pretest 1: Image identification
Members of an online panel (n=50) participated in this study in exchange for a
nominal fee. The pretest was designed as a 5 (Brand personality) X 1 between-subjects
study. Participants were asked to indicate the first object or image that came to mind
when they read: honest and sincere, or exciting and spirited, or competent and reliable,
or sophisticated and upper class, or rugged and tough. That is, an image or an object
that could be defined using one set of words. Then, they received a validation code to
be entered on the MTurk website.
Participants’ responses are listed in Table 3. On the sophisticated & upper class
and rugged & tough categories it seems to be some consensus on the images that come
to mind when participants are asked to identify an object defined by the personality-
related words. In the sophistication condition, black top hat, monocle and wine are
common themes. In the rugged conditions, trucks and off-road vehicles seem to be
strongly associated.

69
Honest &
Sincere
Exciting &
Spirited
Competent &
Reliable
Sophisticated
& Upper Class
Rugged &
Tough
Hand-written
letter
Monkey with
cymbals
A washing
machine
The monopoly
guy Boots
Charlie Brown
People
dancing Teacher Money Truck
A diary Loudspeaker My car Monocle boots
Greeting card Balloons Person
Suit and a glass
of wine
A large truck,
like a Ford F-
250
Science Lamp A pumpkin Crown Tank
Donation plate Word Computer
The monopoly
man My truck
Friend Horse Vehicle Pampered
Off-road
Vehicle
Pencil
New Years
Eve Manager Rolls Royce car Truck tires
My best
friend Money Carpet
HP laser
printer Wine glass Atv
Monocle Boot
A British man
wearing a black
top hat,
monocle,
dressed in a
black suit.
A man with
scars and a
unkept beard
Table 3. Images based on personality traits.
In addition, sophisticated and rugged personalities can be argued to be quite
unique and distinct from each other, characteristics we were looking for to trace the
transfer of associations from the images to the brand.
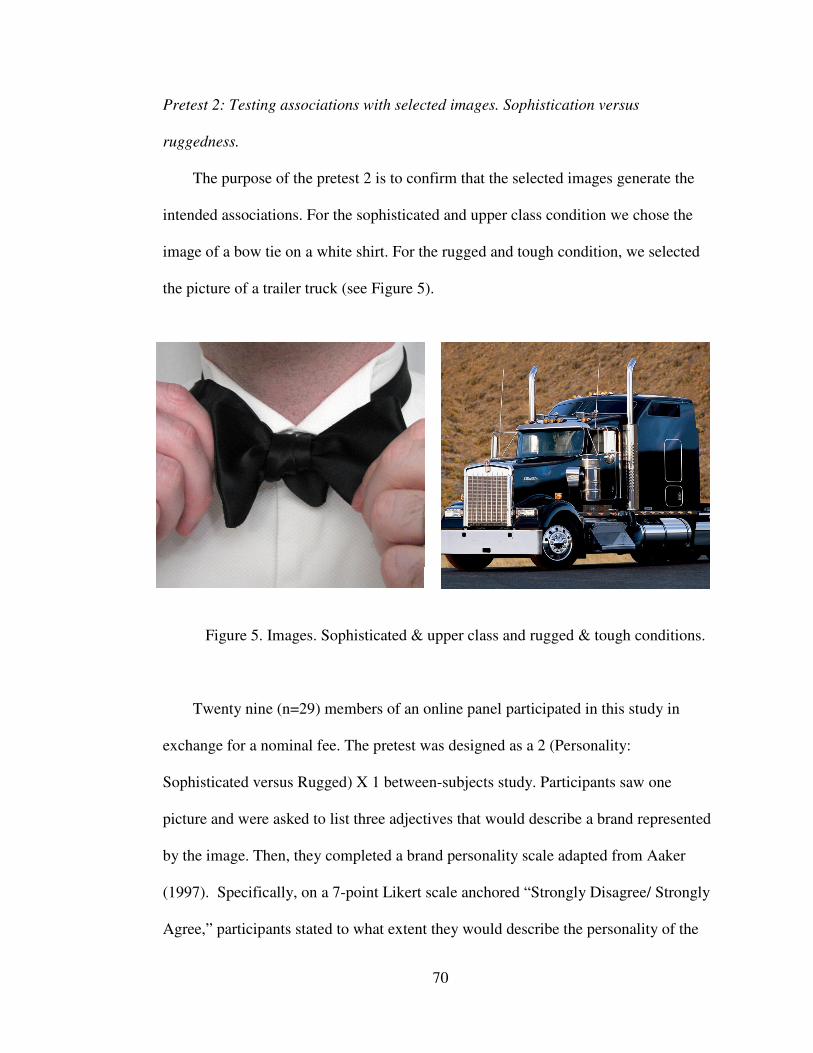
70
Pretest 2: Testing associations with selected images. Sophistication versus
ruggedness.
The purpose of the pretest 2 is to confirm that the selected images generate the
intended associations. For the sophisticated and upper class condition we chose the
image of a bow tie on a white shirt. For the rugged and tough condition, we selected
the picture of a trailer truck (see Figure 5).
Figure 5. Images. Sophisticated & upper class and rugged & tough conditions.
Twenty nine (n=29) members of an online panel participated in this study in
exchange for a nominal fee. The pretest was designed as a 2 (Personality:
Sophisticated versus Rugged) X 1 between-subjects study. Participants saw one
picture and were asked to list three adjectives that would describe a brand represented
by the image. Then, they completed a brand personality scale adapted from Aaker
(1997). Specifically, on a 7-point Likert scale anchored “Strongly Disagree/ Strongly
Agree,” participants stated to what extent they would describe the personality of the

71
brand as: 1) sophisticated, 2) charming, 3) upper class, 4) rugged, 5) tough and 6)
outdoorsy. Then, they provided demographic information and received a validation
code.
Analysis of the cognitive responses supports that the bow tie and the trailer truck
images represent sophisticated and rugged brands respectively. Participants who saw
the bow tie picture described the brand as sophisticated, elegant, dashing, fancy, and
formal. Participants who were presented with the trailer truck described the brand as
tough, strong, durable, and powerful (see Figure 6).
Figure 6. Word clouds. Bow tie versus trailer truck personality associations.
The CFA analysis on the brand personality scale did not show a two-factor
structure. This is not surprising given the small sample size used in the pretest. We
averaged the first three items on the scale to form a Sophistication index (α = .90) and
the other three items to form a Rugged index (α = .91). An independent sample t-test
confirms that participants who saw the bow tie picture described the brand as more
sophisticated than participants who saw the truck image (Mbow tie = 5.93, Mtruck = 2.98;

72
t(27) = 7.01, p < .001). On the other hand, participants who were presented the trailer
truck picture described the brand as more rugged than participants who were presented
the bow tie image (Mbow tie = 2.13, SD = 1.08; Mtruck = 6.19, SD = .48, t(19.6) = -13.10,
p < .001). A t-test conducted on the individual brand personality items shows that
participants rated sophisticated items significantly higher in the bow tie than in the
truck condition, and that participants rated rugged items significantly higher in the
truck than in the bow tie condition. Consequently, we conclude that the selected
images generate the anticipated distinct and unique brand personality associations.
Study 1
The purpose of study 1 is to investigate how social media users interpret
collections of images. That is, whether the unique associations derived from each
visual interact to create a hybrid brand personality. Study 1 aims to find evidence
regarding hypothesis 1 (H1).
Design and sample
Members of an online panel (n=99) participated in a one-factor, between subjects
experiment in exchange for a nominal fee. Specifically, study 1 is designed as a 3
(Image: Bow tie, Truck, Bow tie & Truck) X 1 experiment. Consistent with the
pretests, the bow tie image represents a sophisticated brand personality, the trailer
truck a rugged personality, and the bow tie and the truck together, a sophisticated-
rugged hybrid brand personality.

73
Procedure and Stimuli
Panel members were invited to participate in an online survey about brands that
took approximately 5 minutes to complete. Participants were introduced to the survey
by reading the following paragraph:
“Many companies use pictures in their social media marketing communications.
These pictures may directly represent the products or services the company offers.
However, the pictures may also not be linked to products or services at all. Instead,
pictures may be used to help create other types of brand beliefs, such as emotions,
feelings, or images. For example, Red Bull does not manufacture skateboards but uses
pictures and videos of skateboarders to communicate a young, cool, and exciting
brand personality.”
Participants saw one of the image conditions (see Appendix 2 for stimuli details).
Then, participants responded to cognitive responses, dependent variables,
manipulation checks, and demographics. Lastly, they were thanked for participating in
the survey and received a validation code to be entered in the MTurk website.
Measures
Dependent measures: Brand personality and attitude towards the brand.
Dependent variables are captured on 7-point Likert scales that have “Disagree/Agree”
end points. All measures are subjected to CFA and reliability analyses. The brand
personality measure was adapted from Aaker (1997). Participants stated to what extent
they thought the personality of the brand was 1) sophisticated, 2) upper class, 3)
glamorous, 4) charming, 5) rugged, 6) tough, 7) sturdy, and 8) outdoorsy. As
74
anticipated, the brand personality measure shows a two-factor structure. The first four
items load in one factor and are averaged to form a Sophistication index (α = .95). The
other four items load on a second factor and are averaged to form a Rugged index (α =
.94).
To capture attitude towards the brand (α = .84), participants showed their degree
of agreement or disagreement with the following statements: 1) This brand is good, 2)
I like this brand, and 3) I feel negative about this brand.
Manipulation check. In the single picture conditions, participants selected the
picture they saw from 1) bow tie, 2) trailer truck, 3) hand-written letter, or 4)
fireworks.
Results
Manipulation check. The manipulation check confirms that participants identified
the picture they saw correctly (χ2(1) = 62.00, p < .001).
Image processing and associations transfer. Consistent with hypothesis 1 (H1),
associations derived from an image transfer to the brand. When multiple pictures are
presented together, the associations of both pictures interact to provide a hybrid
personality that transfers to the brand. At the beginning of the survey, right after
seeing the picture(s), participants were asked to list three adjectives that would
describe the personality of a brand represented by the image(s). Consistent with our
hypothesis, the analysis of the cognitive responses indicates that participants who saw
the bow tie picture perceived the brand to be sophisticated, classy, professional,
upscale, and stylish. On the other hand, participants who saw the trailer truck

75
described the brand as rugged, tough, strong, manly, and powerful. Participants who
were presented with the bow tie picture and the trailer truck at the same time indicated
that the brand was sophisticated, rugged, classy, tough, upscale and strong (see Figure
7).
Figure 7. Cognitive responses. Bow tie, trailer truck, and bow tie-trailer truck assoc.
This analysis provides evidence that when multiple pictures are presented
together, unique associations from different images are pooled together to form a
hybrid interpretation of the brand.
A one-way ANOVA test with the Sophistication index as the dependent variable
shows a significant effect (F(2, 96) = 105.33, p <.001). The results of the post-hoc
Tukey HSD tests show that all the group mean differences are significant at the .05
level. Participants in the bow tie condition rated the personality of the brand to be
76
more sophisticated than participants in the bow tie & truck condition (MBow tie = 6.04,
MBow tie/ Truck = 4.71, p < .001), and than participants in the truck condition (MBow tie =
6.04, MTruck = 2.39, p < .001). In addition, participants in the bow tie & truck condition
rated the personality of the brand to be more sophisticated than participants in the
truck condition (MBow tie/ Truck = 4.71, MTruck = 2.39, p < .001). Therefore, we show the
following relationship in terms of brand sophistication associations: SophBow tie >
SophBow tie + Trailer Truck > SophTruck.
Similarly, the results of a one-way ANOVA test with Rugged_index as the
dependent measure shows a significant effect (F(2, 96) = 127.72, p <.001). The results
of the post-hoc Tukey HSD tests show that all the group mean differences are
significant at the .05 level. Participants in the truck condition rated the personality of
the brand to be more rugged than participants in the bow tie & truck condition (MTruck
= 6.00, MBow tie/ Truck = 4.92, p < .001), and than participants in the bow tie condition
(MTruck = 6.00, MBow tie = 2.38, p < .001). In addition, participants in the bow tie &
truck condition rated the personality of the brand to be more rugged than participants
in the bow tie condition (MBow tie/ Truck = 4.92, MBow tie = 2.38, p < .001). Therefore, we
show the following relationship in terms of brand ruggedness associations:
RuggedTruck > RuggedBow tie + Trailer Truck > RuggedBow tie.
When presented with single images, participants interpreted the brand within a
single personality dimension. That is, participants who saw the bow tie image rated the
personality of the bran to be highly sophisticated (MSoph= 6.04) but not at all rugged
(MRugg= 2.38, t(32) = 18.22, p < .001). Similarly, participants who saw the trailer truck
image rated the personality of the brand to be highly rugged (MRugg = 6.00) but not at

77
all sophisticated (MSoph = 2.39, t(29) = -14.75, p < .001). However, when participants
saw the bow tie and the trailer truck images concurrently, they interpreted the brand
similarly in both personality dimensions (MSoph= 4.71, MRugg= 4.92, t(35) = -.72, p >
.05). Consequently, it is critical to understand how to organize visual content so it
transmits the desired brand image.
Attitude towards the brand. A one-way ANOVA test with attitude towards the
brand as the dependent measure does not show a significant effect (MBow tie = 4.87,
MTruck = 4.89, MBow tie/ Truck = 5.13; F(2, 96) = .73, p > .05). Therefore, we rule out the
possibility that the interpretation of the brand personality interferes with participant’s
attitude towards the brand.
Discussion
Study 1 shows that social media users interpret collections of images curated by
brands and used them to form brand judgments. The results of study 1 show that social
media users integrate associations from multiple images in the process of making
sense of the brand. It follows, that a critical question is what social media
characteristics can change the interpretation of a brand. We have established that
social media users integrate associations from multiple images when making
sense/understanding a brand. But do the vividness of an image or the number of
responses it generates change the weight given to each image unique associations?

78
Study 2
The purpose of study 2 is to replicate and extend the findings of study 1.
Specifically, study 2 investigates whether some ‘curatorial’ artifacts change the weight
given to image unique associations in the process of integrating multiple visuals when
making sense of a brand. That is, whether the vividness of an image or the number of
times it has been shared make the personality of that image more salient in the hybrid
personality of a brand. Study 2 seeks support for H1, H2 and H3.
Design and sample
Study 2 is designed as a 2 (Vividness: Low, High) X 3 (Shares: No shares, High
shares, Low shares) between subjects experiment. The vividness of the images is
manipulated by changing the color and the brightness of the pictures. In the low
vividness condition, the image is presented in black and white. In the high vividness
condition, the color and brightness are enhanced. The number of shares is manipulated
using an indicator of the number of times an image has been shared below each image.
In the low shares condition, the ‘# shares’ counter equals 7; in the high shares
condition, the counter equals 1,407; in the no shares condition, participants did not see
an indicator. The no shares condition is considered a control.
Members of an online panel (n = 201) participated in the study in exchange of a
nominal fee and were randomly assigned to one of the six experimental conditions.

79
Procedure and stimuli
Panel members were invited to participate in an online survey about brands and
social media that took approximately 5- 7 minutes to complete. Participants first read
the following introduction:
“Brands are increasingly creating profiles in social media websites. Brands post
pictures that they believe represent their products or that communicate some types of
brand beliefs, such as emotions or feelings. For example, Red Bull does not
manufacture skateboards but uses images of skateboarders to communicate a young,
cool, and exciting brand personality.
Users often 'like' or 'share' pictures posted in social media sites. A "Shares" tag
underneath a picture indicates the number of times that image has been shared. The
number of shares is considered an indicator of image popularity.
An anonymous brand set up a social media profile and is now running a market
test to understand how people just like you react. In the next page, you will see a
sample of the images the brand posted two weeks ago, and the number of shares
generated to date (if any). If there is no "Shares" indicator it means that the picture has
not been shared. Both pictures were posted at the same time.”
Then, participants saw a collection of two images. As an example, in the two
control conditions participants did not see ‘# of shares indicators’, but in the low
vividness condition they saw a B/W bow tie image and a vivid truck picture; in the
high vividness condition, participants saw a vivid bow tie image and a B/W truck (see
Appendix 2 for stimuli details). Categorizing by image, the experimental conditions
can be organized as follows:

80
Bow tie Truck
Shares Shares
No Low High No Low High
Vivid Low
Cond
2
Cond
5
Cond
6 Vivid
Low
Cond
1
Cond
3
Cond
4
High
Cond
1
Cond
4
Cond
3 High
Cond
2
Cond
6
Cond
5
Table 4. Study 2 design.
For example, the collection of images below represents condition 5 (see Figure
8). If we focus on the bow tie picture, this condition represents a low vivid, low shares
condition. If on the contrary, we focus on the truck image, this condition represents a
high vivid, high shares condition.
Figure 8. Experimental condition interpretation.
Shares: 1,407Shares: 7

81
Immediately after participants were exposed to the collection of images, they
responded to dependent variables, covariates and manipulation checks, and provided
general demographic information. Then, they were thanked for their participation and
received a validation code to be entered on the MTurk site.
Measures
Dependent measures: Brand personality and attitude towards the brand. Brand
personality and Attitude towards the brand (α = .85) were captured as in study 1. The
brand personality measure was adapted from Aaker (1997) and included four items
that described a sophisticated personality (α = .90), and four items that captured a
rugged personality (α = .87). The brand personality measure showed a two-factor
structure.
Covariate: Familiarity with social media. To capture familiarity with social
media websites (α= .87), participants stated to what extent they were 1) familiar, 2)
knowledgeable, and 3) not experienced with social media (Kent and Allen 1994).
Manipulation checks: Vividness and number of shares. The vividness
manipulation was assessed by asking participants to indicate what picture looked
brighter from the two images they saw. They chose one of the two options: bow tie or
trailer truck. The effectiveness of the ‘# shares’ manipulation was assessed by asking
participants to indicate what picture had been shared more times, the bow tie or the
trailer truck. Participants in the control condition (no shares condition) did not see this
question.

82
Results
Manipulation checks. The vividness manipulation worked as intended. A Chi-
Square test between the six experimental conditions and the choice of the perceived
brighter image shows a significant effect (χ2 (5) = 178.29, p < .001). Only 3% of the
sample did not select the correct option. None of the participants were eliminated from
the sample. The shares manipulation worked as expected as well. A Chi-Square test
between the low/high shares experimental conditions and the choice of the image that
had been shared more times shows a significant effect (χ2 (1) = 127.23, p < .001). Less
than 2% of the sample failed to select the right option. Consequently, we conclude that
the manipulations worked as intended.
Image processing and associations transfer. Consistent with hypothesis three
(H3) the social media community influences the interpretation of visual brand profiles.
The number of times and image has been shared anchors social media user’s
judgments about the brand. When integrating associations derived from multiple
images in the process of forming a brand personality, the associations from the image
that has been shared more times are more heavily weighted in the formation of the
hybrid personality of the brand. On the other hand, vividness did not enhance the
associations derived from an image when integrating the personality traits of the
resulting brand. Therefore, hypothesis two (H2) is not supported. Focusing the
analysis according to the bow tie image categorization (see Table 4), a 2 (Vividness:
Low, High) X 3 (Shares: No shares, High shares, Low shares) ANOVA using
sophisticated personality as the dependent variable revealed a main effect of ‘Shares’
(F(2, 198) = 3.15, p < .05). Pairwise comparisons show that participants in the high

83
shares condition perceived the brand to be more sophisticated than participants in the
low shares condition (MLShares = 4.40, MHShares = 4.93; t(133) = -2.32, p < .05).
However, participants in the high and no shares conditions perceived the brand to be
equally sophisticated (MNoShares = 4.84, MHShares = 4.93; t(129) = -.42, p > .05).
Interestingly, participants in the no shares condition perceived the brand to be more
sophisticated than participants in the low shares condition (MNoShares = 4.84, MLShares =
4.40; t(134) = 1.95, p = .05; d= .33). Therefore, participants’ perceived levels of
sophistication of the hybrid brand show the following relationship: SophHigh Shares =
Soph No Shares > SophLow Shares. These results seem to identify an anchoring effect. While
in the no shares conditions participants don’t have a reference level, participants in the
low shares condition are able to compare the limited popularity of an image with the
rest of the visuals in the profile. The main effect of vividness (F(1, 199) = 2.85, p
>.05) or the interaction effect (F(5, 195) = .23, p >.05) were not significant.
Familiarity with social media was initially included as a covariate but dropped from
the analysis since it failed to reach significance (F(1, 199) = .62, p > .05).
The same 2 (Vividness: Low, High) X 3 (Shares: No shares, High shares, Low
shares) ANCOVA using rugged personality as the dependent variable and familiarity
with social media websites as the covariate revealed a close to significance main effect
of ‘Shares’ (F(2, 198) = 2.73, p = .07). Results show that the size of the effect of
‘Shares’ on the perceived brand personality is small to medium (η2= .03). Therefore,
even if the difference between the means is not significant, the effect of shares on the
perceived brand personality should not be considered insignificant. Pairwise
comparisons show that participants in the low and no shares conditions perceived the

84
brand to be equally rugged (MNoShares = 4.81, MLShares = 4.90; t(134) = -.41, p > .05).
However, participants in the high shares condition perceived the brand to be less
rugged than participants in the low shares condition (MLShares = 4.90, MHShares = 4.36;
t(133) = 2.48, p < .05) and in the no shares condition (MNoShares = 4.81, MHShares = 4.36;
t(129) = 1.89, p = .06; d= .34). Although the difference between the means in the no
shares and high shares conditions is only close to significant, the effect size is
considered small to medium. We make a strong case for the diagnostic value of shares.
Since the conditions are categorized based on the bow tie picture, the low shares
condition means that underneath the bow tie image the counter equaled 7 shares and
underneath the truck image the counted equaled 1,407 shares. Therefore, consistent
with our hypothesis three (H3), participants in the high shares condition perceived the
personality of the brand to be less rugged than participants in the low shares condition.
Participants’ perceived levels of ruggedness of the hybrid brand show the following
relationship: RuggedHigh Shares < RuggedLow Shares = SophNoShares. Neither the main effect
of Vividness (F(1, 199) = 2.17, p >.05) or the interaction effect (F(5, 196) = 1.19, p
>.05) were significant. Again, these results identify an anchoring effect when social
media users have a reference number of shares to compare the popularity of an image
with.
In study 1, we found that when participants saw the bow tie and the trailer truck
images concurrently, they interpreted the brand similarly in both personality
dimensions (MSoph= 4.71, MRugg= 4.92; t(35) = -.72, p > .05). In study 2, we find that
in the no shares condition, participants interpreted the brand similarly in both
personality dimensions (MSoph= 4.84, MRugg= 4.81; t(65) = .13, p > .05). However, in
85
the low shares condition, participants interpreted the brand to be more rugged than
sophisticated (MSoph= 4.40, MRugg= 4.90; t(69) = -2.20, p < .05), and in the high shares
condition, more sophisticated than rugged (MSoph= 4.93, MRugg= 4.36, t(64) = 2.21, p <
.05).
Attitude towards the brand. A 2 (Vividness) X 3 (Shares) ANOVA test with
attitude towards the brand as the dependent measure did not show a significant effect
of vividness (MLow= 5.00, MHigh = 5.01; F(1, 199) = .01, p > .05), shares (MNoShares=
5.01, MLowShares = 5.05, MHighShares= 4.95; F(2, 198) = .12, p > .05), or an interaction
effect (F(5, 195) = .03, p > .05).
Discussion
Study 2 shows that the number of shares an image receives is diagnostic to form
judgments about the personality of a brand. Independently of the vividness of an
image (which could be argued to be an indicator of image quality), social media users
anchor the interpretation of brand on the most popular image on a visual social media
profile.
Study 2 provides further support for H1, showing that when social media users
interpret collections of images they integrate associations from multiple stimuli. In
addition, study 2 identifies a ‘curatorial’ artifact that changes the weight that social
media users place on image associations when making sense of a brand: the number of
times an image has been shared. That is, the popularity of an image among online
community members.

86
Study 3
Study 3 is a replication and extension study. The purpose of study 3 is to
investigate how individual-difference variables influence the interpretation of brands
based on their visual social media profiles. Specifically, we explore how self-construal
influences the processing of visual stimuli in the social media context. In study 2, we
found that the popularity of an image influences how heavily it is weighted in the
formation of a general hybrid brand personality. The popularity of an image is the
result of the online community evaluation of the image. Research in self-construal
argues that people perceive themselves in relation to the community; as independent
and autonomous, or interdependent and connected to the group (Markus and Kitayama
1991). Therefore, self-construal may moderate the effect of the social media responses
to an image. Study 3 is designed to test H3, H4 and H5.
Design and sample
Study 3 is designed as an extension study. Specifically, study 3 is designed as a 2
(Self-Construal: Independent, Interdependent) X 2 (Vividness: Low, High) X 2
(Shares: High, Low) between-subjects experiment. Vividness and Shares are
manipulated as in study 2. The self-construal manipulation was borrowed from Aaker
and Lee (2001). Participants read a stimulus about a tennis tournament that described a
situation focused on the individual (independent condition) or the team
(interdependent condition).

87
Two hundred and fifty (n = 251) undergraduate students from a U.S. University
were invited to participate in an online survey in exchange of extra credit. Participants
were randomly assigned to one of the eight experimental conditions.
Pretest
To confirm that the tennis tournament stimuli were still relevant and effective to
manipulate self-construal, we conducted a pretest. Twenty nine (n = 29) participants
were recruited from an online panel to participate in a short survey.
Participants read the independent or interdependent scenario and were asked to
describe the situation facing in the tennis tournament by showing the extent to which:
their thoughts1) on the situation were focused on themselves, 2) were focused on just
them, 3) on the situation were focused on them and their teammates, and 4) were
focused on them and their teammates. Participants responded on a 7-point Likert scale
with “Disagree/ Agree” end points. Consistent with Aaker and Lee (2001), the first
two items were averaged to form a Self-Thoughts index (α = .84) and the remaining
two items were averaged to form an Other-Thoughts index (α = .95). In addition,
participants reported how the weather was like and what was the reward for winning
the championship based on the information they read on the tennis tournament
scenario.
An independent t-test analysis shows the expected results. Participants in the
independent self-construal condition rated SelfThoughts index higher than participants
in the interdependent self-construal condition (MIndep = 6.23, MInter = 3.93; t(27) =
4.84, p < .001). Also, participants in the interdependent self-construal condition rated

88
OtherThoughts index higher than participants in the independent self-construal
condition (MIndep = 2.40, MInter = 5.86; t(27) = -6.30, p < .001). An analysis of the
manipulation checks indicates that participants identified the weather to be sunny and
the reward for winning the game the trophy and the championship. Therefore, we
conclude that participants carefully read the stimulus.
Procedure and stimuli
Participants were invited to participate in an online survey that took about 10
minutes to complete. Participants were told that they would be completing two
unrelated tasks. The first task was the self-construal manipulation. Participants were
asked to read a short scenario and put themselves in that situation (see stimuli details
on Appendix 2). Immediately after reading the scenario, participants were asked to
explain how they would feel if they (independent condition)/ their team
(interdependent condition) won the game and the championship (Aaker and Lee
2001). Afterwards, they were introduced to the second task, about brands. Participants
read the following introduction:
“An anonymous brand has set up a social media profile and is now running a
market test to understand how people just like you react. In the next page, you will see
a sample of the images the brand posted two weeks ago, and the number of times each
picture has been shared to date. Both pictures were posted at the same time.
The number of shares is considered an indicator of image popularity.”
Immediately after reading this introduction, participants were exposed to the
vividness- shares manipulation. The vividness- shares manipulation was the same used

89
in study 2, except for the control conditions. That is, participants were exposed to one
condition from the conditions labeled 3, 4, 5, or 6 in study 2 (see Appendix 2 for
details). Then, they responded to dependent variables, covariates, and manipulation
checks. Lastly, they provided general demographic information and were thanked for
their participation in the study.
Measures
Dependent measures: Brand personality and attitude towards the brand. Brand
personality (Soph: α = .82; Rugg: α = .77) and attitude towards the brand (α = .75)
were measured as in study 2.
Covariates: Familiarity with social media. To capture familiarity with social
media websites (α = .80) participants stated to what extent they were: 1) familiar and
2) knowledgeable with social media. We dropped the third item in the scale since it
made the measure not reliable (α = .69).
Manipulation checks: Self- construal, vividness and shares. The vividness and the
shares manipulation checks were captured as in study 2. Participants indicated what
image looked brighter and what image had been shared more times in two multiple
choice questions. The self-construal manipulation check was captured as in the study 3
pretest. The two self-related items were averaged to form a SelfThoughts index (α =
.87) and the two team-related items were averaged to form an OtherThoughts index (α
= .94).

90
Results
Manipulation checks. The vividness, shares, and self-construal manipulations all
worked as expected. A Chi-Square test between the four experimental conditions and
the choice of the perceived brighter image shows a significant effect (χ2 (3) = 228.69,
p < .001). Less than 1% of the sample failed to select the bow tie when the bow tie
image was brighter; less than 3% of the sample failed to select the truck when the
truck image was brighter. A Chi-Square test between the low/high shares experimental
conditions and the choice of the image that had been shared more times shows a
significant effect (χ2 (3) = 235.62, p < .001). Less than 2% of the sample failed to
select the correct option. As anticipated, in the independent self-construal condition
participants had more self-related thoughts (MIndep = 5.26, SD = 1.21; MInter = 3.47, SD
= 1.37, t(235.29) = 10.95, p < .001) than participants in the interdependent self-
construal condition. Participants in the interdependent self-construal condition had
more other-related thoughts (MIndep = 3.91, SD = 1.52; MInter = 5.69, SD = .92,
t(219.34) = -11.30, p < .001) than participants in the independent self-construal
condition.
Image processing and associations transfer. A 2 (Self-Construal: Independent,
Interdependent) X 2 (Vividness: Low, High) X 2 (Shares: High, Low) ANOVA with
sophisticated personality as the dependent variable shows a main effect of shares (F(1,
249) = 16.92, p < .001) and a close to significance self-construal X shares interaction
effect (F (3, 246) = 3.89, p = .06; η2 = .02). Participants perceived the brand to be
more sophisticated when the number of shares was higher (MLow = 4.59, MHigh = 5.11).
That is, the popularity of a picture among the social media community members

91
heightens the associations of an image when it is interpreted in a multi-stimuli context.
This result replicates the findings from study 2, making a strong case for the
diagnostic value of the community opinions on the interpretation of a brand. This main
effect is qualified by the self-construal by shares interaction. Consistent with
hypothesis four (H4), participants primed with an interdependent self construal
perceived the brand to be more sophisticated in the high shares than in the low shares
condition (MLow = 4.41, MHigh = 5.18; t(117) = -3.80, p < .001). However, we don’t
find support for hypothesis five (H5). Participants primed with an independent self-
construal did not perceive the brand to be more sophisticated in the low shares versus
the high shares condition. Independents rated the sophistication of the brand similarly
in the low and high shares conditions (MLow = 4.76, MHigh = 5.04; t(130) = -1.61, p >
.05). A potential explanation for the lack of support for hypothesis five (H5) is the
effect of self-construal priming in modes of thinking. Literature shows that self-
defintions influence thinking style (Kuhnen, Hannover, and Schubert 2001; Krishna,
Zhou, and Zhang 2008; Ahluwalia 2008). Specifically, individuals primed with an
independent self-construal are more likely to focus on the central aspects of the stimuli
and ignore the context. On the other hand individuals prime with an interdependent
self-construal are more likely to attend to all aspects of the stimuli. Therefore, we
argue that the lack of evidence for independent self-construals to weigh more heavily
the associations coming from the less popular brand in the process of integrating
multiple stimuli may be due to the lack of attention to all the contextual and
background information. That is, they noticed the most popular image (focal aspect of

92
the stimulus), but they failed to compare the low and high number of shares among
images.
A 2 (Self-Construal: Independent, Interdependent) X 2 (Vividness: Low, High) X
2 (Shares: High, Low) ANOVA with rugged personality as the dependent variable
shows a main effect of vividness (F(1, 249) = 5.21, p < .05), a main effect of shares
(F(1, 249) = 8.18, p < .05) and a three way interaction effect (F (7, 243) = 4.90, p <
.05). The main effect of shares is consistent the results we find when we use
sophistication as a dependent variable and with study 2. The main effect of vividness
supports hypothesis two (H2). Participants rated the personality of a brand to be more
rugged when they saw a vivid truck than when the truck was in black and white (MLow
= 4.26, MHigh = 4.57; t(249) = -2.30, p < .05). In this case, vividness becomes an
artifact that enhances the weight given to the associations coming from a picture when
the image is interpreted in the presence of multiple visual stimuli. Finally, the
ANOVA test shows a 3-way interaction. However, these results are not interpretable
in the context of our conceptual framework and we propose further studies as a future
research idea.
Attitude towards the brand. A 2 (Self-Construal) X 2 (Vividness) X 2 (Shares)
ANOVA test with attitude towards the brand as the dependent measure did not show a
significant main effect of self-construal (F(1, 199) = .47, p > .05), vividness (F(1, 199)
= .00, p > .05), or shares (F(1, 199) = .58, p > .05), neither any combination of two-
way ( p >. 05) or three-way interaction effect (F(5, 195) = 1.28, p > .05).

93
Discussion
Study 3 replicates the strong effect of shares on the weight given to the
associations of a picture in the process of integrating multiple visual stimuli. The
influence of the social community is a strong ‘curatorial’ artifact that can be used to
change the interpretation of brand visual profiles.
In addition, study 3 shows that self-construal moderates the influence of the social
media community behavior on the interpretation of a brand. In the case of the
sophisticated brand personalities, interdependent self-construals are shown to weight
more heavily the influence of the social community opinion than independent self-
construals do. When focusing on the rugged personality, the results are challenging to
interpret. Although we replicate the main effect of shares, we find a main effect of
vividness and a 3-way interaction effect that are not interpretable in the context of our
conceptual framework and previous studies. A more detailed analysis of these results
is proposed as a future research idea.
Discussion, limitations, and ideas for future research
Visual content is popular in social media; however, our understanding of how
social media users interpret images and integrate and transfer their associations to the
brand that created the content is not well understood. In three studies we show that
social media users integrate the associations of images to form a hybrid interpretation
of a brand. In study 1, we show that while social media users interpret a brand on an
individual brand personality dimension when exposed to one picture, they integrate
the associations from multiple images when two pictures are presented together. In

94
addition, study 1 shows that the weight given to the associations derived from each
picture are equally weighted in the formation of an overall brand personality, a
personality that we refer to as hybrid. Study 2 replicates the findings from study 1
showing that social media users indeed integrate multiple image personality
associations to form a hybrid brand personality. In addition, study 2 shows that the
weight given to the image associations vary as a result of the social media community
opinion, operationalized here by the popularity of the image. That is, study 2 shows
that the number of times an image has been shared anchors the interpretation of a
brand personality. Compared to an image with lower number of shares, associations
from images that show high number of shares are more heavily weighted in the
interpretation of the overall brand. These results are consistent with Naylor,
Lamberton, andWest (2012) findings on the effect of social media users’ mere visual
presence. They find that passively experiencing the presence of brand supporters in
social media can influence brand evaluations and purchase intent. Study 3 shows that
individual difference variables - such as self-construal - moderate the effect of social
media responses (i.e. shares). Study 3 shows that the effect of the social media
community is more pronounced in interdependent users; that is, social media users that
place strong value in community harmony and connectedness.
This manuscript contributes to the research in social media by expanding its reach
to the visual communication context. To the best of our knowledge, research has not
yet explored how visual communication and social media variables interact in the
formation of brand judgments. From a managerial perspective, this paper contributes
to the practice of brand management. Although brands control the images they share

95
in social media, non brand-controlled variables such as the popularity of an image
enhances the impact of a specific image and may alter the interpretation of the overall
brand. That is, social media users’ actions are more diagnostic than marketers’ actions
in the interpretation of brands. Therefore, we argue that the creation of visual content
should be the result of a well strategized process. Based on literature on fit effects,
perceived inconsistencies between brand personality and the type of products or
services it offers may lead to negative product or brand evaluations. We propose as a
potential future research idea the investigation of the influence of visual social media
profiles in brand and product evaluations.
We also acknowledge some limitations to our results. Some of the results
obtained in study 3 are not interpretable within our conceptual framework and we
propose a more in depth analysis of the effect of individual-difference variables in the
processing of visual information. In addition, the images used in this manuscript are
strongly positioned in two personality dimensions. For the sake of generalizability, we
propose follow up experiments that use visuals strongly position in alternative brand
personality dimensions (Aaker 1997). In addition, visual profiles tend to integrate a
greater number of visuals. Although the purpose of this study was to establish the
interaction of visual and social media variables, future studies should explore these
effects is a more complex visual social media context. Lastly, visual social media
websites tend to allow users to comment. A future research project should explore
how social media users form judgments about brands when visuals and text interact.
96
References
Aaker, Jennifer L. (1997), “Dimensions of Brand Personality,” Journal of Marketing
Research, 34 (August), 347- 356.
Aaker, Jennifer L. and Angela Y. Lee (2001), “‘I’ Seek Pleasures and ‘We’ Avoid
Pains: The Role of Self‐Regulatory Goals in Information Processing and
Persuasion,” Journal of Consumer Research, 28 (June), 33–39.
Acord, Sophia Krzys (2010), “Beyond the Head: The Practical Work of Curating
Contemporary Art,” Qualitative Sociology, 33, 447- 467.
Ahluwalia, Rohini (2008), “How Far Can a Brand Stretch? Understanding the Role of
Self-Construal,” Journal of Marketing Research, 45 (3), 337- 350.
Ansari, Asim, Oded Koenigsberg and Florian Stahl (2011), “Modeling Multiple
Relationships in Social Networks,” Journal of Marketing Research, 48 (4),
713-728.
Barasch, Alixandra and Jonah Berger (2014), “Broadcasting and Narrowcasting: How
Audience Size Affects What People Share,” Journal of Marketing Research:
51 (3), 286-299.
Belcher, Michael (1991), Exhibitions in Museums. Leicester University Press.
Bell, Emma and Jane Davison (2012), “Visual Management Studies: Empirical and
Theoretical Approaches,” International Journal of Management Reviews, 15
(2), 1-18.
Berger, Jonah and Eric M. Schwartz (2011), “What Drives Immediate and Ongoing
Word of Mouth?,” Journal of Marketing Research, 48 (5), 869- 880.
Berger, Jonah and Katherine L. Milkman (2012), “What Makes Online Content
Viral?,” Journal of Marketing Research, 49 (2), 192- 205.
Berger, Jonah and Raghuram Iyengar (2013), Communication Channels and Word of
Mouth: How the Medium Shapes the Message, Journal of Consumer Research,
40 (3), 567- 579.
Bettman, James R. and Mita Sujan (1987), “Effects of Framing on Evaluation of
Comparable and Noncomparable Alternatives by Expert and Novice
Consumers,” Journal of Consumer Research, 14 (September), 141- 154.
Branthwaite, Alan (2002), “Investigating the Power of Imaginary in Marketing
Communication: Evidence-Based Techniques,” Qualitative Market Research,
5 (3), 164-171.

97
Bundesen, Claus (1990), “A Theory of Visual Attention,” Psychological Review, 97
(4), 523- 547.
Carrasco, Marisa (2011), “Visual Attention: The Past 25 Years,” Vision Research, 51,
1484- 1525.
Chandler, Lisa (2009), “‘Journey without Maps’: Unsettling Curatorship in Cross-
cultural Contexts,” Museum and Society, 7 (2), 74- 91.
Chen, Yubo, Yong Liu and Jurui Zhang (2012), “When Do Third-Party Product
Reviews Affect Firm Value and What Can Firms Do? The Case of Media
Critics and Professional Movie Reviews,” Journal of Marketing, 76 (2), 116-
134.
Cochoy, Franck (2012), “Modernizing the Grocery Trade with Cartoons in Wartimes.
Humor as Marketing Weapon (Progressive Grocer, 1939- 1945),” in Imagining
Organizations. Performative Imagery in Business and Beyond, ed. by
Francois-Regis Puyou, Paolo Quattrone, Chris Mclean, and Nigel Thrift.
Routledge
Cohen, Geoffrey L. (2003), “Party over Policy: The Dominating Impact of Group
Influence on Political Beliefs,” Journal of Personality and Social Psychology,
85 (5), 808- 822.
Danaher, Peter J. and Tracey S. Dagger (2013), “Comparing the Relative
Effectiveness of Advertising Channels: a Case Study of a Multimedia Blitz
Campaign,” Journal of Marketing Research, 50 (4), 517-534.
Darley, John M. and Bibb Latane (1967), “Bystander Intervention in Emergencies:
Diffusion of Responsibility,” Journal of Personality and Social Psychology, 8
(4, Part 1), 377- 383.
Davison, Jane (2009), "Icon, Iconography, Iconology: Visual branding, Banking and
the Case of the Bowler Hat", Accounting, Auditing & Accountability Journal,
22 (6), 883-906.
Entrepreneur (2014), “The Year Ahead: 5 Social Media Trends Every Entrepreneur
Needs to Know,” Available at http://www.entrepreneur.com/article/232738.
Accessed 6/2/2014
Escalas, Jennifer E. (2004), “Narrative Processing: Building Consumer Connections to
Brands,” Journal of Consumer Psychology, 14 (1- 2), 168-180.
Falk, John H., Theano Moussouri and Douglas Coulson (1998), “The Effect of
Visitors’ Agendas on Museum Learning, Curator: The Museum Journal, 41
(2), 106-120.

98
Feinberg, Melanie, Gary Geisler, Eryn Whitworth, and Emily Clark (2012),
“Understanding Personal Digital Collections: An Interdisciplinary
Exploration,” DIS '12: Proceedings of the Designing Interactive Systems
Conference, 200-209.
Forbes (2013), “The Top 7 Social Media Marketing Trends That Will Dominate
2014,” Available at
http://www.forbes.com/sites/jaysondemers/2013/09/24/the-top-7-social-media-
marketing-trends-that-will-dominate-2014/. Accessed 6/2/2014
Foxbusiness (2014), “Don't Ignore These 4 Hot Social Media Trends,” Available at
http://smallbusiness.foxbusiness.com/marketing-sales/2014/05/29/4-hot-social-
media-trends-shouldnt-ignore/. Accessed 6/2/2014
Gabriel, Yiannis (2012), “A Picture Tells more than a Thousand Words.” Losing the
Plot in the Era of the Image, in Imagining Organizations. Performative
Imagery in Business and Beyond, ed. by Francois-Regis Puyou, Paolo
Quattrone, Chris Mclean, and Nigel Thrift. Routledge.
Goldenberg, Jacob, Gal Oestreicher-Singer and Shachar Reichman (2012), “The Quest
for Content: How User-Generated Links Can Facilitate Online Exploration,”
Journal of Marketing Research, 49 (4), 452-468.
Gurian, Elaine H. (1999), “What is the Object of this Exercise? A Meandaring
Exploration of the Many Meanings of Objects in Museums,” Deadalus, 128
(3), 163- 183.
Hautz, Julia, Johann Füller, Katja Hutter and Carina Thürridl (2014), “Let Users
Generate Your Video Ads? The Impact of Video Source and Quality on
Consumers' Perceptions and Intended Behaviors,” Journal of Interactive
Marketing, 28 (1), 1-15.
Heath, Christian and Dirk vom Lehn (2004), “Configuring Reception: (Dis-)Regarding
the ‘Spectator’ in Museums and Galleries,” Theory, Culture & Society, 21 (6),
43- 65.
Herr, Paul M. (1989), “Priming Price: Prior Knowledge and Context Effects,” Journal
of Consumer Research, 16 (June), 67–75.
Hong, Jen-Shin, Bai-Hsuan Chen and Sheng-Hao Hung (2004), “Toward Intelligent
Styling for Digital Museum Exhibitions: Modularization Framework for
Aesthetic Hypermedia Presentations,” International Journal on Digital
Libraries, 4 (1), 64- 68.
Huffingtonpost (2014), “Social Media Marketing World 2014 - 5 Trends You want to
Jump on NOW!,” Available at http://www.huffingtonpost.com/kim-
garst/social-media-marketing-wo_b_5110966.html. Accessed 6/2/2014

99
Kenney, Keith (2009), Visual Communication Research Designs. Rutledge: NY.
Kent, Robert J. and Chris T. Allen (1994), "Competitive Interference Effects in
Consumer Memory for Advertising: The Role of Brand Familiarity," Journal
of Marketing, 58 (July), 97- 105.
Kozinets, Robert V., Andrea Hemetsberger, and Hope Jensen Schau (2008), “The
Wisdom of Consumer Crowds. Collective Innovation in the Age of Networked
Marketing,” Journal of Macromarketing, 28 (4), 339- 354.
Kozinets, Robert V., Kristine de Valck, Andrea C. Wojnicki and Sarah J.S. Wilner
(2010), “Networked Narratives: Understanding Word-of-Mouth Marketing in
Online Communities,” Journal of Marketing, 74 (2), 71- 89.
Krishna, Aradhna, Rongrong Zhou and Shi Zhang (2008), "The Effect of Self-
Construal on Spatial Judgments," Journal of Consumer Research, 35 (3), 337-
348.
Kühnen, Ulrich, Bettina Hannover and Benjamin Schubert (2001), “The Semantic-
Procedural Interface Model of the Self: The Role of Self-Knowledge for
Context-Dependent Versus Context-Independent Modes of Thinking,” Journal
of Personality and Social Psychology, 80 (3), 397- 409.
Lee, Angela Y., Jennifer L. Aaker and Wendi L. Gardner (2000), “The Pleasures and
Pains of Distinct Self-Construals: The Role of Interdependence in Regulatory
Focus,” Journal of Personality and Social Psychology, 78 (6), 1122- 1134.
Lord, Barry and Bail Dexter Lord (2001), The Manual of Museum Exhibitions,
Altamira Press, Walnut Creek, California, USA.
Ludwig, Stephan, Ko de Ruyter, Mike Friedman, Elisabeth C. Brüggen, Martin
Wetzels and Gerard Pfann (2013), “More Than Words: The Influence of
Affective Content and Linguistic Style Matches in Online Reviews on
Conversion Rates,” Journal of Marketing: 77 (1), 87-103.
Luo, Xueming, Sascha Raithel, and Michael A. Wiles (2013), “The Impact of Brand
Rating Dispersion on Firm Value,” Journal of Marketing Research, 50 (3),
399-415.
Lutz, Kathy A. and Richard J. Lutz (1978), “Imagery-Eliciting Strategies: Review and
Implications of Research,” in Advances in Consumer Research, Vol. 5, ed. H.
Keith Hunt, Ann Arbor, MI: Association for Consumer Research, 611- 620.
Macdonald, Sharon (2007), “Interconnecting: Museum Visiting and Exhibition
Design,” CoDesign: International Journal of CoCreation in Design and the
Arts, 3 (1), 149- 162.

100
Mandel, Naomi (2003), “Shifting Selves and Decision Making: The Effects of Self-
Construal Priming on Consumer Risk-Taking,” Journal of Consumer
Research, 30 (January), 30- 40.
Mandel, Naomi and Eric J. Johnson (2002), “When Web Pages Influence Choice:
Effects of Visual Primes on Experts and Novices,” Journal of Consumer
Research, 29 (September), 235- 245.
Markus, Hazel and Shinobu Kitayama (1991), “Culture and the Self: Implications for
Cognition, Emotion and Motivation,” Psychological Review, 98 (2), 224- 253.
Markus, Hazel and Shinobu Kitayama (1994), “A Collective Fear of the Collective:
Implications for Selves and Theories of Selves,” Personality and Social
Psychology Bulletin, 20 (5), 568- 579.
Mashable (2014), “9 Ways Social Media Marketing Will Change in 2014,” Available
at http://mashable.com/2014/01/27/social-media-marketing-2014/. Accessed
6/2/2014
McLean, Kathleen (1999), “Museum Exhibitions and the Dynamics of Dialogue,”
Deadalus, 83, 83- 107.
Mitchell, W. J. T. (2005), What do Pictures Want?, Chicago and London: The
University of Chicago Press.
Moser, Stephanie (2010), “The Devil is in the Detail: Museum Displays and the
Creation of Knowledge,” Museum Anthropology, 33 (1), 22- 32.
Naylor, Rebecca Walker, Cait Poynor Lamberton, and Patricia M. West (2012),
“Beyond the ‘Like’ Button: Exploring the Effects of Mere Virtual Presence on
Brand Evaluation,” Journal of Marketing, 76 (November), 105- 120.
Patience, Kaitlyn (2010), “Hysterical Spaces: Curatorship and Meaning in the
Traveling Exhibition: A Case Study of the National Gallery of Canada’s
“Hysteria and the Body,” SHIFT: Graduate Journal of Visual and Material
Culture, 3, 1- 23.
Patrick, Vanessa M. and Henrik Hagtvedt (2011), “Aesthetic Incongruity Resolution,”
Journal of Marketing Research, 48 (2), 393-402.
Potter, John, Banaji, Shakuntala (2012), “Social Media and Self-curatorship:
Reflections on Identity and Pedagogy through Blogging on a Masters
Module,” Comunicar, 38, 83-91.
Puwar, Nirmal and Sanjay Sharma (2012), “Curating Sociology,” The Sociological
Review, 60, 40-63.

101
Ransbotham, Sam, Gerald C. Kane and Nicholas H. Lurie (2012), “Network
Characteristics and the Value of Collaborative User-Generated Content,”
Marketing Science, 31 (3), 387-405.
Schroeder, Jonathan E. (2004), “Visual Consumption in the Image Economy”, In:
Elusive Consumption, edited by Karin M. Ekström and Helene Brembeck.
Berg: NY.
Schweidel, David A. and Wendy W. Moe (2014), "Listening in on Social Media: A
Joint Model of Sentiment and Venue Format Choice," Journal of Marketing
Research In-Press.
Singh, Sangeeta and Stephan Sonnenburg (2012), “Brand Performances in Social
Media,” Journal of Interactive Marketing, 26 (4), 189-197.
Smith, Andrew N., Eileen Fischer andChen Yongjian (2012), “How Does Brand-
related User-generated Content Differ across YouTube, Facebook, and
Twitter?,” Journal of Interactive Marketing, 26 (2), 102-113.
Smith, Andrew T., Krish D. Singh and Mark W. Greenlee (2000), “Attentional
Suppression of Activity in the Human Visual Cortex,” NeuroReport, 11 (2),
271- 277.
Socialmediaexaminer (2014), “New Research Shows Which Social Networks are Ideal
for Marketers,” Available at http://www.socialmediaexaminer.com/new-
research-shows-social-networks-ideal-marketers/. Accessed 6/2/2014
Spencer, Stephen (2011), Visual Research Methods in the Social Sciences, London:
Routledge.
Sridhar, Shrihari and Raji Srinivasan (2012), “Social Influence Effects in Online
Product Ratings,” Journal of Marketing, 76 (5), 70- 88.
Stephen, Andrew T. and Jeff Galak (2012), "The Effects of Traditional and Social
Earned Media on Sales: A Study of a Microlending Marketplace," Journal of
Marketing Research, 49 (October), 624- 39.
Thompson, Debora V. and Prashant Malaviya (2013), “Consumer-Generated Ads:
Does Awareness of Advertising Co-Creation Help or Hurt Persuasion?,”
Journal of Marketing, 77 (3), 33- 47.
Trafimow, David, Harry C. Triandis and Sharon G. Goto (1991), “Some Tests of the
Distinction Between the Private Self and the Collective Self,” Journal of
Personality and Social Psychology, 60 (5), 649- 655.
Trusov, Michael, Randolph E. Bucklin and Koen Pauwels (2009), “Effects of Word-
of-Mouth Versus Traditional Marketing: Findings from and Internet Social
Networking Site,” Journal of Marketing, 73 (September), 90-102.

102
Turner, John C., Michael A. Hogg, Penelope J. Oakes, Stephen D. Reicher and
Margaret S. Wetherell (1987), Rediscovering the social group: A self-
categorization theory. Cambridge, MA, US: Basil Blackwell.
Warren, Samantha and Russ Vince (2012), “Qualitative, Participatory Visual
Methods”. In: The Practice of Qualitative Organizational Research: Core
Methods and Current Challenges. Sage.
Wilcox, Keith and Andrew T. Stephen (2013), “Are Close Friends the Enemy? Online
Social Networks, Self-Esteem, and Self-Control,” Journal of Consumer
Research, 40 (1), 90-103.
Woodside, Arch G. (2010), “Brand–Consumer Storytelling Theory and Research:
Introduction to a Psychology & Marketing Special Issue,” Psychology &
Marketing, 27 (6), 531-540.
Ybarra, Oscar and David Trafimow (1998), “How Priming the Private Self or
Collective Self Affects the Relative Weights of Attitude and Subjective
Norms,” Personality and Social Psychology Bulletin, 24 (4), 362- 370.
Zhang, Yinlong and L. J. Shrum (2009), “The Influence of Self-Construal on
Impulsive Consumption,” Journal of Consumer Research, 35 (5), 838- 850.

103
APPENDIX 1
Study 1 stimuli
Condition 1: Traditional media (corporate advertisement) – CA message
Atlantic Crowdsourcing offers tasks adapted to your interests and skills. Our
algorithms optimize the presentation of the tasks so they are relevant and fit your
interests. Since 2000, our annual investments in R&D exceed the industry average.
Atlantic Crowdsourcing servers use the latest Xeon E7-4800 v2 chips that stress in-
memory computing that bring you seamless experiences. Our reliable IT
administrators collect metrics to identify, diagnose, and immediately fix performance
issues in the site. Atlantic Crowdsourcing robust technology allows our developers to
focus on innovative site design. In fact, we were recently ranked in the Top 5% of
U.S. Crowdsourcing companies in innovation by the Wall Street Journal.
Condition 2: Traditional media (corporate advertisement) – CSR message
Atlantic Crowdsourcing mission is to be an ethical company, which conducts
business with honesty and integrity. Employees as well as task requesters pass strict
standards of integrity before joining Atlantic Crowdsourcing. We pride ourselves on
our leadership in ethical business and labor practices. In fact, we were recently ranked
in the Top 5% of U.S. Crowdsourcing companies practicing ethical business policies
by the Wall Street Journal. Atlantic Crowdsourcing gives its employees flexibility to
volunteer in their communities and make a difference. In addition, we support
important charities. We give a percentage of our revenues to charities such as the Free
Software Foundation and the LaborNet Group.

104
Condition 3: Social media (blog posting) – CA message
After using Atlantic Crowdsourcing, I must say that they offer tasks adapted to
my interests and skills. In my experience, their algorithms optimized the presentation
of the tasks so they were relevant and interesting to me. This is probably explained by
their annual investments in R&D that have exceeded industry average since 2000.
Also, I truly believe that the use of the latest Xeon E7-4800 v2 chips in their servers
provide seamless experiences. Their IT administrators probably collect metrics to
identify, diagnose and immediately fix performance issues because I never
experienced any problems. I think their robust technology allows their developers to
focus on the innovative site design. No wonder why they are ranked in the Top 5% of
the U.S. Crowdsourcing companies in innovation by the Wall Street Journal.
Condition 4: Social media (blog posting) – CSR message
After using Atlantic Crowdsourcing, I must say that they are ethical and conduct
business with honesty and integrity. This is probably due to the fact that employees
and task requesters pass the same strict standards of integrity before joining the
company or the site. In my opinion, they are leaders when it comes to ethical business
and labor practices. No wonder why they are ranked in the Top 5% of U.S. companies
practicing ethical business policies by the Wall Street Journal. Something I really like
about Atlantic Crowdsourcing is that the company gives its employees flexibility to
volunteer in their communities making a difference. Also, what really sold me was
that they support important charities by giving a percentage of their revenues to
charities as the Free Software Foundation and the LaborNet Group.

105
Study 2 stimuli
Condition 1: Traditional media (corporate advertisement) – CA message
Atlantic Finance is committed to offering you the highest quality and
performance products and services. Atlantic Finance offers customized financial plans
adapted to your income and personal situation. Our clients range from new investors
who are just starting in the market to sophisticated investors with large portfolios. Our
mutual funds are all ranked in the top 5% in 10-year aggregate returns, outperforming
even powerful fund companies like Fidelity Investments and the Dow Jones Index.
Atlantic Finance invests in the latest technology to construct complex financial models
that help our staff provide extraordinary financial advice. Since 2000, our annual
profitability consistently exceeds the industry average. We hire only friendly and
professional financial advisers, who are trained to understand your questions,
problems, and concerns so you never experience any problems. In fact, we are ranked
in the Top 5% of U.S. Financial Services Companies in customer satisfaction by the
Wall Street Journal.
Condition 2: Traditional media (corporate advertisement) – CSR message
Atlantic Finance is committed to conducting ethical business practices and
supporting charitable causes. Atlantic Finance mission is to be an ethical company,
which conducts business with honesty and integrity. We hire only those people who
pass strict standards of integrity. We pride ourselves in our leadership in ethical
business and labor practices. In fact, we are ranked in the Top 5% of U.S. companies
practicing ethical business policies by the Wall Street Journal. We give our employees

106
flexibility to volunteer for their favorite local and community charities making a
difference. Our employees take 4 hours off of their work weeks to contribute to the
community. In addition, Atlantic Finance supports important charities voted on by
employees. We give a percentage of our total revenues to charities that are active in
our communities such as the LaborNet Group and Communities in Schools, and
sponsor local youth sports teams, theater, and music.
Condition 3: Social media (blog posting) – CA message
After having used their services, I must say that Atlantic Finance is committed to
offering the highest quality and performance products and services. They offer
customized financial plans adapted to my income and personal situation. I am a new
investor starting in the market, but they also work with sophisticated investors with
large portfolios. From what I have seen, their mutual funds are ranked in the top 5% in
10-year aggregate returns, and outperform powerful fund companies like Fidelity
Investments and the Dow Jones Index. In my experience, their staff provides me with
extraordinary financial advice. This is probably explained by their investments in the
latest technology to construct complex financial models. I chose their financial plans
because I truly believe that since 2000, their annual profitability consistently exceeds
the industry average. In my experience, their financial advisers are friendly,
professional, and understand my questions. I have never experienced any problems.
No wonder why they are ranked in the Top 5% of U.S. Financial Services Companies
in customer satisfaction by the Wall Street Journal.

107
Condition 4: Social media (blog posting) – CSR message
After having used their services, I must say that Atlantic Finance is committed to
conducting ethical business practices and supporting charitable causes. They are
ethical and conduct business with honesty and integrity. This is probably because their
employees pass strict standards of integrity before joining the company. In my
opinion, they are leaders when it comes to ethical business and labor practices. No
wonder why they are ranked in the Top 5% of U.S. companies practicing ethical
business policies by the Wall Street Journal. Something I really like about Atlantic
Finance is that it gives the employees flexibility to volunteer for their local and
community charities making a difference. From what I know, employees take 4 hours
off of their work weeks to contribute to the community. Also, what really sold me was
that Atlantic Finance supports important charities in their communities voted on by
employees by giving a percentage of their revenues. They make donations to charities
such as the LaborNet Group and Communities in Schools, and support local youth
sports teams, theater, and music.

108
APPENDIX 2
Study 1 stimuli
Condition 1: Bow tie (sophistication)
Condition 2: Trailer truck (ruggedness)

109
Condition 3: Bow tie and trailer truck (sophistication + ruggedness)
Study 2 stimuli
Condition 1: Bow tie high vivid, no shares. Truck low vivid, no shares

110
Condition 2: Bow tie low vivid, no shares. Truck high vivid, no shares
Condition 3: Bow tie high vivid, high shares. Truck low vivid, low shares
Shares: 7Shares: 1,407
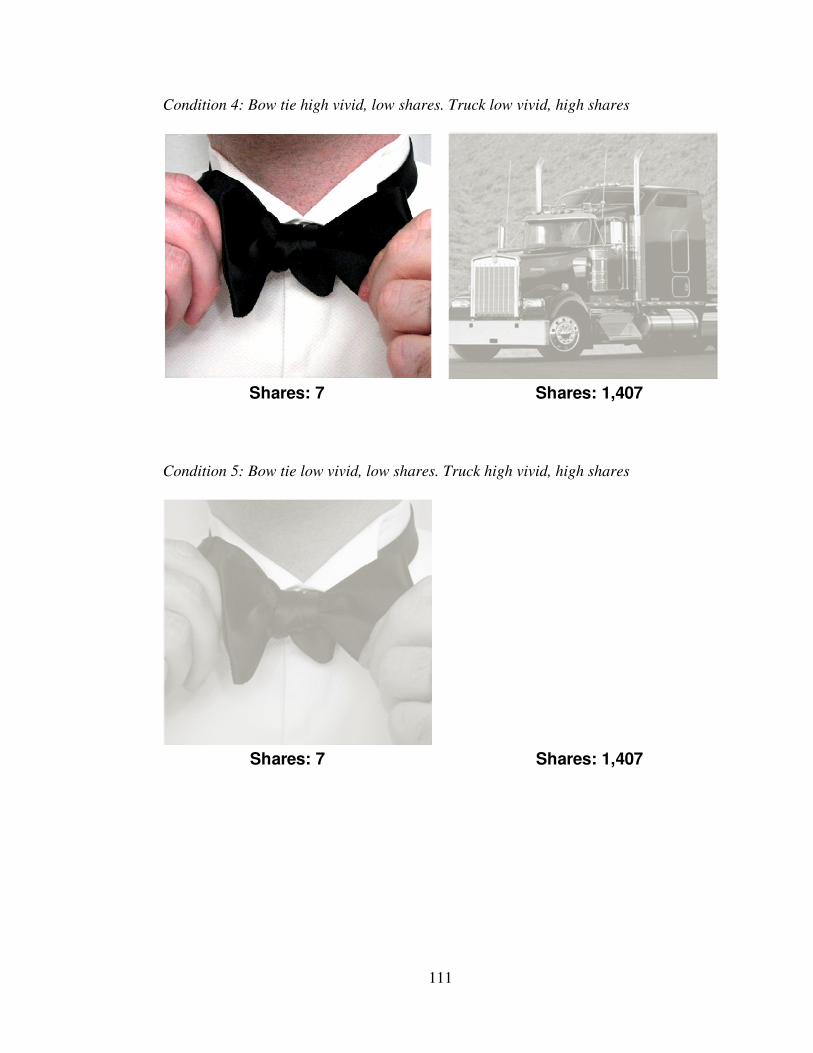
111
Condition 4: Bow tie high vivid, low shares. Truck low vivid, high shares
Shares: 1,407Shares: 7
Condition 5: Bow tie low vivid, low shares. Truck high vivid, high shares
Shares: 1,407Shares: 7

112
Condition 6: Bow tie low vivid, high shares. Truck high vivid, low shares
Shares: 7Shares: 1,407
Study 3 stimuli
Condition 1: Independent self-construal
You are playing in a tennis tournament and have made it to the finals. It is 4:26
pm, and the sun is beating down on you. You can count the strings on your racquet
and bounce the ball on your racquet a few times, thinking to yourself: If you win this
last match, you will win the championship title and bring home the huge trophy.
Condition 2: Interdependent self-construal
Your team is playing in a tennis tournament and has made it to the finals. It is
4:26 pm, and the sun is beating down on your team. You are representing your team in
the finals. You can count the strings on your racquet and bounce the ball on your
racquet a few times, thinking to yourself: If you win this last match, your team will
win the championship title and bring home the huge trophy.