Embed Size (px)
Citation preview
PLoS Biology | www.plosbiology.org 1300
Essay
August 2006 | Volume 4 | Issue 8 | e277
The diversity of life on Earth is dramatically affected by human alterations of ecosystems [1].
Compelling evidence now shows that the reverse is also true: biodiversity in the broad sense affects the properties of ecosystems and, therefore, the benefi ts that humans obtain from them. In this article, we provide a synthesis of the most crucial messages emerging from the latest scientifi c literature and international assessments of the role of biodiversity in ecosystem services and human well-being.
Human societies have been built on biodiversity. Many activities indispensable for human subsistence lead to biodiversity loss, and this trend is likely to continue in the future. We clearly benefi t from the diversity of organisms that we have learned to use for medicines, food, fi bers, and other renewable resources. In addition, biodiversity has always been an integral part of the human experience, and there are many moral reasons to preserve it for its own sake. What has been less recognized is that biodiversity also infl uences human well-being, including the access to water and basic materials for a satisfactory life, and security in the face of environmental change, through its effects on the ecosystem processes that lie at the core of the Earth’s most vital life support systems (Figure 1).
Three recent publications from the Millennium Ecosystem Assessment [2–4], an initiative involving more than 1,500 scientists from all over the world [5], provide an updated picture of the fundamental messages and key challenges regarding biodiversity at the global scale. Chief among them are: (a) human-induced changes in land cover at the global scale lead to clear losers and winners among species in biotic communities; (b) these changes have large impacts on ecosystem
processes and, thus, human well-being; and (c) such consequences will be felt disproportionately by the poor, who are most vulnerable to the loss of ecosystem services.
What We Do Know: Functional Traits Matter Most
Biodiversity in the broad sense is the number, abundance, composition, spatial distribution, and interactions of genotypes, populations, species, functional types and traits, and landscape units in a given system (Figure 2). Biodiversity infl uences ecosystem services, that is, the benefi ts provided by ecosystems to humans, that contribute to making human life both possible and worth living [4] (Box 1). As well as the direct provision of numerous organisms that are important for human material and cultural life (Figure 1, path 1), biodiversity has well-established or putative effects on a number of ecosystem services mediated by ecosystem processes (Figure 1, path 2). Examples of these services are pollination and seed dispersal of useful plants, regulation of climatic conditions suitable to humans and the animals and plants they consider important, the control of agricultural pests and diseases, and the regulation of human health. Also, by affecting ecosystem processes such as biomass production by plants, nutrient and water cycling, and soil formation and retention, biodiversity indirectly supports the production of food, fi ber, potable water, shelter, and medicines. The links between biodiversity and ecosystem services have been gaining increasing attention in the scientifi c literature of the past few years [2–4,6]. However, not until now has there been an effort to summarize those components of biodiversity that do, or should, matter the most for the provision of these services, and the underlying mechanisms explaining those links (Table 1; see also [3]).
A few key messages can be drawn from existing theory and empirical
studies. The fi rst is that the number and strength of mechanistic connections between biodiversity and ecosystem processes and services clearly justify the protection of the biotic integrity of existing and restored ecosystems and its inclusion in the design of managed ecosystems. All components of biodiversity, from genetic diversity to the spatial arrangement of landscape units, may play a role in the long-term provision of at least some ecosystem services. However, some of these components are more important than others in infl uencing specifi c ecosystem services. The evidence available indicates that it is functional composition—that is, the identity, abundance, and range of species traits—that appears to cause the effects of biodiversity on many ecosystem services. At least among species within the same trophic level (e.g., plants), rarer species are likely to have small effects at any given point in time. Thus, in natural systems, if we are to preserve the services that ecosystems provide to humans, we should focus on preserving or restoring
Biodiversity Loss Threatens Human Well-BeingSandra Díaz*, Joseph Fargione, F. Stuart Chapin III, David Tilman
Citation: Díaz S, Fargione J, Stuart Chapin F III, Tilman D (2006) Biodiversity loss threatens human well-being. PLoS Biol 4(8): e277. DOI: 10.1371/journal.pbio.0040277
DOI: 10.1371/journal.pbio.0040277
Copyright: © 2006 Díaz et al. This is an open-access article distributed under the terms of the Creative Commons Attribution License, which permits unrestricted use, distribution, and reproduction in any medium, provided the original author and source are credited.
Sandra Díaz is principal researcher and associate professor of ecology and biogeography at Instituto Multidisciplinario de Biología Vegetal (CONICET-UNC) and FCEFyN, Universidad Nacional de Córdoba, Argentina. Joseph Fargione is research assistant faculty at the Department of Biology, University of New Mexico, Albuquerque, New Mexico, United States of America. F. Stuart Chapin III is professor of ecology at the Institute of Arctic Biology, University of Alaska at Fairbanks, Fairbanks, Alaska, United States of America. David Tilman is the McKnight Presidential Chair in Ecology at the Department of Ecology, Evolution and Behavior, University of Minnesota, St. Paul, Minnesota, United States of America.
* To whom correspondence should be addressed. E-mail: [email protected]
Essays articulate a specifi c perspective on a topic of broad interest to scientists.

PLoS Biology | www.plosbiology.org 1301
their biotic integrity in terms of species composition, relative abundance, functional organization, and species numbers (whether inherently species-poor or species-rich), rather than on simply maximizing the number of species present.
Another key message is that, precisely because ecosystem processes depend on the presence and abundance of organisms with particular functional traits, there is wide variation in how ecosystem services—that in turn depend on ecosystem processes—respond to changes in species number as particular species are lost from or get established in the system. So, to the question of how biodiversity matters to ecosystem services, we have to reply that it depends on what organisms there are. Daunting? Certainly, but
not hopeless. We know from recent assessments [1,2,7,8] that global biodiversity loss is not occurring at random. As a consequence of global change drivers, such as climate, biological invasions, and especially land use, not only is the total number of species on the planet decreasing, but there are also losers and winners. On average, the organisms that are losing out have longer lifespans, bigger bodies, poorer dispersal capacities, more specialized resource use, lower reproductive rates, and other traits that make them more susceptible to human activities such as nutrient loading, harvesting, and biomass removal by burning, livestock grazing, ploughing, clear-felling, etc. A small number of species with the opposite characteristics are becoming increasingly dominant
around the world (Figure 3). Because there are well-established links between functional traits of locally abundant organisms and ecosystem processes, especially for plants [9–12], it may become possible to identify changes in ecosystem processes and in ecosystem services that depend on them under different biodiversity scenarios.
What We Do Not Know: Cascades, Surprises, and Megadiversity Hot-Spots
Some ecosystem services show a saturating relationship to species number—that is, the ecosystem-service response to additional species is large at low number of species and becomes asymptotic beyond a certain number of species. We seldom know what this threshold number is, but we suspect
Box 1. From Ecosystem Processes to Human Well-BeingEcosystem processes are intrinsic processes and fl uxes whereby an ecosystem
maintains its integrity (such as primary productivity, trophic transfer from plants to animals, decomposition and nutrient cycling, evapotranspiration, etc.). They exist independently from human valuation, and their magnitude and rate can be established regardless of the cultural, economic, and social values and interests of different human groups (Figure 1, Ecosystem Processes box).
Ecosystem services are the benefi ts provided by ecosystems that contribute to making human life both possible and worth living. Ecosystem services are context-dependent; that is, the same ecosystem process can produce an ecosystem service that is highly valued by one society or stakeholder group but not highly valued by other societies or groups. Some ecosystem services involve the direct provision of material and non-material goods and are associated directly with the presence of particular species of plants and animals—for example, food, timber, medicines, and ritual materials (Figure 1, path 1 and bottom sub-box of Ecosystem Services box). Other ecosystem services arise, either directly or indirectly, from the continued functioning of ecosystem processes. For example, the service of formation, retention, and sustained fertility of soils necessary for the production of plants and animals considered important by different human societies depends on the ecosystem processes of decomposition, nutrient cycling by soil microbiota, and the retention of water and soil particles by a well-developed root network (Figure 1, path 2 and top sub-box in red of Ecosystem Services box). Some authors (e.g., [30]) have advocated a stricter defi nition of ecosystem services as components of nature that are directly enjoyed, consumed, or used in order to maintain or enhance human well-being. Although such an approach can be useful when it comes to ecosystem service accounting, our emphasis here is conceptual, and therefore we prefer to use the broader, widely accepted defi nitions and classifi cation adopted by the Millennium Ecosystem Assessment [4]. This is because some ecosystem services (e.g., food provision) can be quantifi ed in units that are easily comprehensible by policy makers and the general public. Others—for example, the services that regulate and support the production of tradable goods—are more diffi cult to quantify. If a criterion based on economic accounting is applied too strictly, there is a risk that ecosystem service assessment could be biased toward services that are easily quantifi able, but not necessarily the most critical ones [29].
Human well-being is a human experience that includes the basic materials for a good life, freedom of choice and action, health, good social relationships, a sense of cultural identity, and a sense of security. The sense of well-being is strongly dependent on the specifi c cultural, geographical, and historical context in which different human societies develop, and is determined by cultural-socio-economic processes as well as by the provision of ecosystem services. However, the well-being of the vast majority of human societies is based more or less directly on the sustained delivery of fundamental ecosystem services, such as the production of food, fuel, and shelter, the regulation of the quality and quantity of water supply, the control of natural hazards, etc. (see Figure 1, path 3).
DOI: 10.1371/journal.pbio.0040277.g001
Figure 1. Biodiversity Is Both a Response Variable Affected by Global Change Drivers and a Factor That Affects Human Well-Being Links developed in this article are indicated in red. In the biodiversity box, the hierarchical components of biodiversity (genotypes, species, functional groups, and landscape units) each have the characteristics listed in the sub-box and explained in Figure 2 (number, relative abundance, composition, spatial distribution, and interactions involved in “vertical” diversity).Modifi ed from [3,4].
August 2006 | Volume 4 | Issue 8 | e277

PLoS Biology | www.plosbiology.org 1302
it differs among ecosystems, trophic levels, and services. The experimental evidence indicates that, in the case of primary production (e.g., for plant-based agricultural products), nutrient retention (which can reduce nutrient pollution and sustain production in the long term), and resistance to invasions (which incur damage and control costs in agricultural and other settings) by temperate, herbaceous communities, responses often do not show further signifi cant increases beyond about ten plant species per square meter [3,13]. But in order to achieve this number in a single square meter, a much higher number of species is needed at the landscape level [14]. What about slow-growing natural communities, or communities that consist of plant species with more contrasting biology? What about communities that typically include many more species—for example, the megadiverse forest hot-spots of the Amazon and Borneo, where species number can exceed 100 tree species per hectare [15]? To what extent are all those species essential for the maintenance of different ecosystem processes and services? Ecological theory [16] and traditional knowledge [17,18] suggest that a large number of resident species per functional group, including those species that are rare, may act as ‘insurance” that buffers ecosystem processes and their derived services in the face of changes in the physical and biological environment (e.g., precipitation, temperature, pathogens), but these ideas have yet to be tested experimentally, and no manipulative experiment has been performed in any megadiversity hot-spot.
Most of the links between biodiversity and ecosystem services summarized in Table 1 emerged from theory and manipulative experiments, involved biodiversity within a single trophic level (usually plants), and operated mostly at the level of local communities. However, the most dramatic examples of effects of small changes in biodiversity on ecosystem services have occurred at the landscape level and have involved alterations of food-web diversity through indirect interactions and trophic cascades. Most of these have been “natural experiments,” that is, the unintended consequence of intentional or accidental removal or addition of certain predator,
pathogen, herbivore, or plant species to ecosystems. These “ecological surprises” usually involve disproportionately large, unexpected, irreversible, and negative alterations of ecosystem processes, often with repercussions at the level of ecosystem services, with large environmental, economic, and cultural losses. Examples include the cascading effects of decreases in sea otter population that led to coastal erosion in the North Pacifi c [19], and a marked decrease in grassland productivity and nutritional quality in the Aleutian islands as a consequence of decreased nutrient fl ux from the sea by the introduction of Arctic foxes [20] (see [3] for a comprehensive list of examples). The vast literature on biological invasions and their ecological and socio-economic impacts [21] further illustrates this point. Ecological surprises are diffi cult to predict, since they usually involve novel interactions among species. They most often result from introductions of predators, herbivores, pathogens
and diseases, although cases involving introduced plants are also known. They do not depend linearly on species number or on well-established links between the functional traits of the species in question and putative ecosystem processes or services [3,22].
Uneven Impacts: Biodiversity and Vulnerable Peoples
People who rely most directly on ecosystem services, such as subsistence farmers, the rural poor, and traditional societies, face the most serious and immediate risks from biodiversity loss. First, they are the ones who rely the most on the “safety net” provided by the biodiversity of natural ecosystems in terms of food security and sustained access to medicinal products, fuel, construction materials, and protection from natural hazards such as storms and fl oods [4]. In many cases the provision of services to the most privileged sectors of society is subsidized but leaves the most vulnerable to pay most of the cost of biodiversity losses. These include, for example, subsistence farmers in the face of industrial agriculture [23] and subsistence fi shermen in the face of intensive commercial fi shing and aquaculture [24]. Second, because of their low economic and political power, the less privileged sectors cannot substitute purchased goods and services for the lost ecosystem benefi ts and they typically have little infl uence on national policy. When the quality of water deteriorates as a result of fertilizer and pesticide loading by industrial agriculture, the poor are unable to purchase safe water. When protein and vitamins from local sources, such as hunting and fruit, decrease as a result of habitat loss, the rich can still purchase them, whereas the poor cannot. When the capacity of natural ecosystems to buffer the effects of storms and fl oods is lost because of coastal development [25], it is usually the people who cannot fl ee—for example, subsistence fi shermen—who suffer the most. In summary, the loss of biodiversity-dependent ecosystem services is likely to accentuate inequality and marginalization of the most vulnerable sectors of society, by decreasing their access to basic materials for a healthy life and by reducing their freedom of choice and action. Economic development that does not consider effects on these
DOI: 10.1371/journal.pbio.0040277.g002
Figure 2. The Different Components of BiodiversityAll of these components can be affected by human intervention (arrows), and in turn have repercussions for ecosystem properties and services. Symbols represent individuals or biomass units. Symbols of different shades represent different genotypes, phenotypes, or species.
August 2006 | Volume 4 | Issue 8 | e277

PLoS Biology | www.plosbiology.org 1303
ecosystem services may decrease the quality of life of these vulnerable populations, even if other segments of society benefi t. Biodiversity change
is therefore inextricably linked to poverty, the largest threat to the future of humanity identifi ed by the United Nations. This is a sobering conclusion
for those who argue that biodiversity is simply an intellectual preoccupation of those whose basic needs and aspirations are fulfi lled.
Table 1. Biodiversity Components Affect Ecosystem Services in Multiple and Complex Ways
Ecosystem Services Main Components of Diversity Involved and Mechanisms That Produce the Effect
Amount of biomass produced by plants considered
important by humans
*** Functional composition—Faster-growing, bigger, more locally adapted plants produce more biomass,
irrespective of the number of species present; in species-poor systems, coexisting plants with different resource use
strategies or that facilitate each other’s performance may take up more resources.
** Number of species—Within a constant resource and disturbance regime, a large species pool is more likely to
contain groups of complementary or facilitating species and highly productive species, both of which could lead to
higher productivity of the community.
Stability of biomass production by plants considered
important by humans
*** Genetic diversity—Large genetic variability within a crop species buffers production against losses due to
diseases and environmental change.
*** Number of species—Cultivation of more than one species in the same plot or landscape maintains production
over a broader range of conditions.
*** Functional composition—Life history characteristics and resource use strategy of dominant plants determine the
capacity of ecosystem processes to remain unchanged or return to their initial state in the face of perturbations.
Preservation of the fertility of soils that sustain
the production of plants and animals considered
important by humans
*** Functional composition—Fast-growing, nutrient-rich plants enhance soil fertility; dense root systems prevent soil
erosion.
Regulation of quantity and quality of water available
to humans, domestic animals, and crops
*** Arrangement and size of landscape units—Intact riparian corridors and extensive areas with dense vegetation
cover reduce erosion and improve water quality.
*** Functional composition—Vegetation dominated by large, fast-growing, big-leafed, deep-rooted plants has high
transpiration rate, reducing stream fl ow.
Pollination essential for the immediate production
of fruits by, and the perpetuation of, important plant
species
*** Functional composition of pollinator assemblage—Loss of specialized pollinators leads to genetic
impoverishment and lower number and quality of fruits.
** Number of species of pollinator assemblage—Lower number of pollinator species leads to genetic
impoverishment of plant species.
** Arrangement and size of landscape units—Large and/or well-connected landscape units allow movement of
pollinators among plants of the same species, thus maintaining plant genetic pool.
Resistance to invasive organisms that have negative
ecological, economic, and/or cultural impacts
*** Functional composition—Some key native species are very competitive or can act as biological controls to the
spread of aliens.
*** Arrangement of landscape units—Landscape corridors (e.g., roads, rivers, and extensive crops) can facilitate the
spread of aliens; size and nature of suitable corridors are likely to be different for different organisms.
** Number of species—All else being equal, species-rich communities are more likely to contain highly competitive
species and to contain less unused resources, and therefore be more resistant to invasions.
Pest and disease control in agricultural systems *** Genetic diversity of crops—High intraspecifi c genetic diversity reduces density of hosts for specialist pests and,
thus, their ability to spread.
** Number of crop, weed, and invertebrate species—High number of species acts similarly as genetic diversity and
also increases habitat for natural enemies of pest species.
** Spatial distribution of landscape units—Natural vegetation patches intermingled with crops provide habitat for
natural enemies of insect pests.
Regulation through biophysical feedbacks of climatic
conditions suitable to humans and the animals and
plants they consider important
*** Arrangement and size of landscape units—Size and spatial arrangement of landscape units over large areas
infl uence local-to-regional climate by lateral movement of air masses of different temperature and moisture; the
threshold for effect is patch size of about 10 km diameter, depending on wind speed and topography.
** Functional composition—Height, structural diversity, architecture, and phenology modify albedo, heat absorption,
and mechanical turbulence, thus changing local air temperature and circulation patterns.
Regulation through carbon sequestration in the
biosphere of climatic conditions suitable to humans
and the animals and plants they consider important
*** Arrangement and size of landscape units—Carbon loss is higher at forest edges, therefore as forest fragments
decline in size or area/perimeter ratio, a larger proportion of the total landscape is losing carbon.
** Functional composition—Small, fast-growing, fast-decomposing, short-lived plants retain less carbon in their
biomass than large, slow-growing, slow-decomposing, long-lived plants.
* Number of species—High number of species can slow down the spread of pests and pathogens, which are
important agents of carbon loss from ecosystems.
Protection against natural hazards (storms, fl oods,
hurricanes, fi res) that cause damage to humans and
the animal production systems that they depend on
*** Arrangement and size of landscape units—Large patches of structurally complex vegetation or small, close-by
patches are likely to offer more shelter to nearby ecosystems, and buffer them against fl ooding, sea intrusion, and
wind.
*** Functional composition—Deep-rooted plants are less susceptible to uprooting by hurricanes; extensive, mat-
forming, superfi cial root systems protect soil against erosion by fl oods and storms; deciduous canopy types decrease
fl ammability.
Asterisks indicate importance and/or degree or certainty (*** > ** > *) of the link between the ecosystem service in question and different components of biodiversity. Biodiversity components refer to plant assemblages unless otherwise specifi ed. The putative mechanisms have been empirically tested in some cases, but remain speculative in others (modifi ed from [3]). The list of ecosystem services is illustrative, rather than exhaustive.DOI: 10.1371/journal.pbio.0040277.t001
August 2006 | Volume 4 | Issue 8 | e277

PLoS Biology | www.plosbiology.org 1304
Future DirectionsMost of the concrete actions to slow down biodiversity loss fall under the domain of policy making by governments and the civil society. However, the scientifi c community still needs to fi ll crucial knowledge gaps. First, we need to know more about the links between biodiversity and ecosystem services in species-rich ecosystems dominated by long-lived
plants. Second, if we are to anticipate and avoid undesirable ecological surprises, better models and more empirical evidence are needed on the links between ecosystem services and interactions among different trophic levels. Third, we need to reinforce the systematic screening for functional traits of organisms likely to have ecosystem-level consequences. In this sense, our knowledge of how
the presence and local abundance of organisms (especially plants) bearing certain attributes affect ecosystem processes has made considerable progress in the past few years. However, we know much less of how the range of responses to environmental change among species affecting the same ecosystem function contributes to the preservation of ecosystem processes and services in the face of environmental change and uncertainty [16,26]. This is directly relevant to risk assessment of the sustained provision of ecosystem services. Fourth, experimental designs for studying links between biodiversity and ecosystem processes and services need to not only meet statistical criteria but also mimic biotic confi gurations that appear in real ecosystems as a result of common land-use practices (e.g., primary forest versus monospecifi c plantations versus enrichment planting, or grazing-timber agroforestry systems versus a diverse grazing megafauna versus a single grazer such as cattle). In pursuing this, traditional knowledge systems and common management practices provide a valuable source of inspiration to develop new designs and testable hypotheses [27,28]. Finally, in order to assist policy decisions and negotiation among different local, national, and international stakeholders, considerable advance is needed in the evaluation and accounting of ecosystem services [29,30]. The challenge here is to fi nd ways to identify and monitor services that are as concrete as possible, but at the same time not alienate the view of less powerful social actors or bias the analysis against services that are diffi cult to quantify or grasp.
The Bottom Line
By affecting the magnitude, pace, and temporal continuity by which energy and materials are circulated through ecosystems, biodiversity in the broad sense infl uences the provision of ecosystem services. The most dramatic changes in ecosystem services are likely to come from altered functional compositions of communities and from the loss, within the same trophic level, of locally abundant species rather than from the loss of already rare species. Based on the available evidence, we cannot defi ne a level of biodiversity loss that is safe, and we still do not have satisfactory models to
DOI: 10.1371/journal.pbio.0040277.g003
Figure 3. Lost Ecosystem Services and Vanishing Ecological RolesForest ecosystems in the tropics and subtropics are being quickly replaced by industrial crops and plantations. This provides large amounts of goods for national and international markets, but results in the loss of crucial ecosystem services mediated by ecological processes. In Argentina and Bolivia, the Chaco thorn forest (A) is being felled at a rate considered among the highest in the world (B), to give way to soybean cultivation (C). In Borneo, the Dypterocarp forest, one of the species-richest in the world (F), is being replaced by oil palm plantations (G). These changes are irreversible for all practical purposes (H). Many animal and plant populations have been dramatically reduced by changing land use patterns, to the point that they could be considered functionally extinct, such as the maned wolf (D) and the giant anteater in the Chaco plains (E), and the orangutan (I) and several species of pitcher plants (J) in the Bornean rainforest.Photos by Sandra Díaz, except (A and C), courtesy by Marcelo R. Zak.
August 2006 | Volume 4 | Issue 8 | e277

PLoS Biology | www.plosbiology.org 1305
account for ecological surprises. Direct effects of drivers of biodiversity loss (eutrophication, burning, soil erosion and fl ooding, etc.) on ecosystem processes and services are often more dramatic than those mediated by biodiversity change. Nevertheless, there is compelling evidence that the tapestry of life, rather than responding passively to global environmental change, actively mediates changes in the Earth’s life-support systems. Its degradation is threatening the fulfi llment of basic needs and aspiration of humanity as a whole, but especially, and most immediately, those of the most disadvantaged segments of society. �
the Condition and Trends Working Group. Washington (D. C.): Island Press. pp. 297–329.
4. Millennium Ecosystem Assessment (2005) Ecosystems and human well-being: Biodiversity synthesis. Washington (D. C.): World Resources Institute. 86 p.
5. Stokstad E (2005) Ecology: Taking the pulse of earth’s life-support systems. Science 308: 41–43.
6. Kremen C (2005) Managing ecosystem services: What do we need to know about their ecology? Ecol Lett 8: 468–479.
7. Kotiaho JS, Kaitala V, Komonen A, Paivinen J (2005) Predicting the risk of extinction from shared ecological characteristics. Proc Natl Acad Sci U S A 102: 1963–1967.
8. McKinney M, Lockwood J (1999) Biotic homogenization: A few winners replacing many losers in the next mass extinction. Trends Ecol Evol 14: 450–453.
9. Grime JP (2001) Plant strategies, vegetation processes, and ecosystem properties. Chichester (United Kingdom); New York: John Wiley & Sons. 417 p.
10. Eviner VT, Chapin FS (2003) Functional matrix: A conceptual framework for predicting multiple plant effects on ecosystem processes. In: Futuyma DJ, editor. Annual review of ecology evolution and systematics, volume 34. Palo Alto (California): Annual Reviews. pp. 455–485.
11. Díaz S, Hodgson JG, Thompson K, Cabido M, Cornelissen JHC, et al. (2004) The plant traits that drive ecosystems: Evidence from three continents. J Veg Sci 15: 295–304.
12. Garnier E, Cortez J, Billès G, Navas ML, Roumet C, et al. (2004) Plant functional markers capture ecosystem properties during secondary succession. Ecology 85: 2630–2637.
13. Hooper DU, Chapin FS, Ewel JJ, Hector A, Inchausti P, et al. (2005) Effects of biodiversity on ecosystem functioning: A consensus of current knowledge. Ecol Monogr 75: 3–35.
14. Tilman D (1999) Diversity and production in European grasslands. Science 286: 1099–1100.
15. Phillips OL, Hall P, Gentry AH, Sawyer SA, Vasquez R (1994) Dynamics and species richness of tropical rain-forests. Proc Natl Acad Sci U S A 91: 2805–2809.
16. Elmqvist T, Folke C, Nystrom M, Peterson G, Bengtsson J, et al. (2003) Response diversity, ecosystem change, and resilience. Frontiers in Ecology and the Environment 1: 488–494.
17. Trenbath B (1999) Multispecies cropping systems in India: Predictions of their productivity, stability, resilience and ecological sustainability. Agroforestry Systems 45: 81–107.
18. Altieri M (2004) Linking ecologists and traditional farmers in the search for sustainable
agriculture. Frontiers in Ecology and the Environment 2: 35–42.
19. Estes JA, Tinker MT, Williams TM, Doak DF (1998) Killer whale predation on sea otters linking oceanic and nearshore ecosystems. Science 282: 473–476.
20. Maron JL, Estes JA, Croll DA, Danner EM, Elmendorf SC, et al. (2006) An introduced predator alters Aleutian Island plant communities by thwarting nutrient subsidies. Ecol Monogr 76: 3–24.
21. Mooney HA, Mack RN, McNeely J, Neville LE, Schei PJ, et al. (2005) Invasive alien species: A new synthesis. Washington (D. C.): Island Press. 368 p.
22. Walker B, Meyers JA (2004) Thresholds in ecological and social-ecological systems: A developing database. Ecology and Society 9. Available: http:⁄⁄www.ecologyandsociety.org/vol9/iss2/art3. Accessed 23 June 2006.
23. Lambin EF, Geist HJ, Lepers E (2003) Dynamics of land-use and land-cover change in tropical regions. Annual Review of Environment and Resources 28: 205–241.
24. Naylor RL, Goldburg RJ, Primavera JH, Kautsky N, Beveridge MCM, et al. (2000) Effect of aquaculture on world fi sh supplies. Nature 405: 1017–1024.
25. Danielsen F, Sorensen MK, Olwig MF, Selvam V, Parish F, et al. (2005) The Asian tsunami: A protective role for coastal vegetation. Science 310: 643.
26. Lavorel S, Garnier E (2002) Predicting changes in community composition and ecosystem functioning from plant traits: Revisiting the Holy Grail. Funct Ecol 16: 545–556.
27. Díaz S, Symstad AJ, Chapin FS, Wardle DA, Huenneke LF (2003) Functional diversity revealed by removal experiments. Trends Ecol Evol 18: 140–146.
28. Scherer-Lorenzen M, Potvin C, Koricheva J, Bornik Z, Hector A, et al. (2005) The design of experimental tree plantations for functional biodiversity research. In: Scherer-Lorenzen M, Körner C, Schulze ED, editors. The functional signifi cance of forest diversity. Berlin: Springer-Verlag. pp. 377–389.
29. DeFries R, Pagiola S, Adamowicz W, Resit Akçakaya H, Arcenas A, et al. (2005) Analytical approaches for assessing ecosystem conditions and human well-being. In: Hassan R, Scholes R, Ash N, editors. Ecosystems and human well-being Current state and trends: Findings of the Condition and Trends Working Group. Washington (D. C.): Island Press. pp. 37–71.
30. Boyd J, Banzhaf S (2006) What are ecosystem services? The need for standardized environmental accounting units. Washington (D. C): Resources for the Future.
AcknowledgementsWe are grateful to W. Reid, H. A. Mooney, G. Orians, and S. Lavorel for encouragement, inspiration, and critical comments during the process that led to this article, and to the leading authors of Millennium Ecosystem Assessment’s Current State and Trends, chapter 11.
Funding. SD is funded by FONCyT, CONICET, and Universidad Nacional de Córdoba.
Competing interests. The authors have declared that no competing interests exist.
References1. Baillie JEM, Hilton-Taylor C, Stuart SN
(2004) IUCN Red List of Threatened Species: A Global Species Assessment. Gland (Switzerland): IUCN.
2. Mace G, Masundire H, Baillie J, Ricketts T, Brooks T, et al. (2005) Biodiversity. In: Hassan R, Scholes R, Ash N, editors. Ecosystems and human well-being: Current state and trends: Findings of the Condition and Trends Working Group. Washington (D. C.): Island Press. pp. 77–122.
3. Díaz S, Tilman D, Fargione J, Chapin FI, Dirzo R, et al. (2005) Biodiversity regulation of ecosystem services. In: Hassan R, Scholes R, Ash N, editors. Ecosystems and human well-being: Current state and trends: Findings of
August 2006 | Volume 4 | Issue 8 | e277

Where does biodiversity go from here? A grimbusiness-as-usual forecast and a hopeful portfolioof partial solutionsPaul R. Ehrlich* and Robert M. Pringle
Department of Biological Sciences, Stanford University, Stanford, CA 94305
The threats to the future of biodiversity are many and well known.They include habitat conversion, environmental toxification, cli-mate change, and direct exploitation of wildlife, among others.Moreover, the projected addition of 2.6 billion people by mid-century will almost certainly have a greater environmental impactthan that of the last 2.6 billion. Collectively, these trends portenda grim future for biodiversity under a business-as-usual scenario.These threats and their interactions are formidable, but we reviewseven strategies that, if implemented soundly and scaled updramatically, would preserve a substantial portion of global biodi-versity. These are actions to stabilize the human population andreduce its material consumption, the deployment of endowmentfunds and other strategies to ensure the efficacy and permanenceof conservation areas, steps to make human-dominated landscapeshospitable to biodiversity, measures to account for the economiccosts of habitat degradation, the ecological reclamation of de-graded lands and repatriation of extirpated species, the educationand empowerment of people in the rural tropics, and the funda-mental transformation of human attitudes about nature. Like thecarbon ‘‘stabilization wedges’’ outlined by Pacala and Socolow[Pacala S, Socolow R (2004) Stabilization wedges: Solving theclimate problem for the next 50 years with current technologies.Science 305:968–972] (1), the science and technologies needed toeffect this vision already exist. The remaining challenges arelargely social, political, and economic. Although academic conser-vation biology still has an important role to play in developingtechnical tools and knowledge, success at this juncture hingesmore on a massive mobilization of effort to do things that havetraditionally been outside the scope of the discipline.
biodiversity loss � conservation trust funds � global warming �national parks � population extinction
The fate of biological diversity for the next 10 million years willalmost certainly be determined during the next 50–100 years
by the activities of a single species. That species, Homo sapiens,is �200,000 years old. It has been fabulously successful byecological standards: it boasts as-yet-unchecked populationgrowth and a cosmopolitan distribution, and it has vanquished itspredators, competitors, and some of its parasites. The fossilrecord suggests that the typical mammal species persists forapproximately one million years (2), which puts Homo sapiens inmid-adolescence. This is a fitting coincidence, because Homosapiens is now behaving in ways reminiscent of a spoiled teen-ager. Narcissistic and presupposing our own immortality, wemistreat the ecosystems that produced us and support us,mindless of the consequences.
The state of biodiversity today is a reflection of that abuse, butthe reflection is hazy because we know neither the total numberof populations or species nor how many have gone extinct. Ourbest information is on the rate and extent of habitat destructionand degradation. For example, we know from long-term mon-itoring that coral cover in Jamaican reef ecosystems declinedfrom �50% to �5% between the late 1970s and 1994 (3). Fromremote-sensing studies, we know that the rate of selective loggingin the Brazilian Amazon ranged from 12,000 to 20,000 km2/year
between 1999 and 2002 (4) and that the rate of deforestation inthe Peruvian Amazon averaged 645 km2/year from 1999 to 2005(5). Likewise, we know from global mapping studies that nearly50% of all temperate grasslands, tropical dry forests, andtemperate broadleaf forests have been converted to human-dominated uses worldwide, whereas only 4–10% of those biometypes are formally protected (6).
Of the total number of species on Earth, we still cannot saymuch more than that it is likely to be ‘‘of the general order of 107’’(7). Estimates of species extinction rates—often based on esti-mates of habitat loss in conjunction with the species–arearelationship—are similarly imprecise (8, 9) and are sensitive tomultiple assumptions (e.g., refs. 10 and 11). The number ofanimal and plant extinctions certified since 1600 is only slightlygreater than 1,000 (8), but our pitiful knowledge of biodiversity’sextent and the inherently inconspicuous nature of extinctionensures that this figure is a small fraction of the true number.Although no scientific consensus is forthcoming on the exact rateof extinction for any region or group of organisms, much less forglobal biodiversity, there is a consensus that current extinctionrates vastly exceed background ones, perhaps by two to threeorders of magnitude (12, 13).
Although species loss occupies an overwhelming proportion ofthe literature, genetically distinct populations are also an im-portant component of biodiversity. Estimates of populationdiversity and extinction rates are even more uncertain than thosefor species, but even these crude estimates are alarming: ofperhaps one to seven billion populations worldwide, 16 millionmay be extinguished each year in tropical forests alone (14).Trends in key parameters of well studied populations are con-sistent with this picture of decline. Amphibian populations havedeclined locally and globally in recent years (15, 16), and manymammal species worldwide exhibit range-size contractions in-dicative of heavy population loss (17).
When we were first asked to prepare a paper addressing thequestion ‘‘Where does biodiversity go from here?’’ a variety ofcynical answers leapt to mind. The principal threats to biodi-versity—direct overexploitation of organisms, habitat destruc-tion and degradation, environmental toxification, climatechange, and biological invasions, among others—have beenknown for decades. Yet despite a ballooning number of publi-cations about biodiversity and its plight, there has been dispir-itingly little progress in stanching the losses—so little that somecommentators have characterized applied ecology as ‘‘an ever-more sophisticated refinement of the obituary of nature’’ (18).
This paper results from the Arthur M. Sackler Colloquium of the National Academy ofSciences, ‘‘In the Light of Evolution II: Biodiversity and Extinction,’’ held December 6–8,2007, at the Arnold and Mabel Beckman Center of the National Academies of Sciences andEngineering in Irvine, CA. The complete program and audio files of most presentations areavailable on the NAS web site at www.nasonline.org/Sackler�biodiversity.
Author contributions: P.R.E. and R.M.P. wrote the paper.
The authors declare no conflict of interest.
*To whom correspondence should be addressed. E-mail: [email protected].
© 2008 by The National Academy of Sciences of the USA
www.pnas.org�cgi�doi�10.1073�pnas.0801911105 PNAS � August 12, 2008 � vol. 105 � suppl. 1 � 11579–11586

As conservation-oriented scientists, we are responsible for biodi-versity. Its loss is our failure.
We draw on the literature to sketch a brief and incompleteanswer to the question posed to us, assuming that societycontinues business as usual. Because that outlook is bleaker thanwe are willing to accept, we then outline a more hopeful set ofanswers. These amount to a portfolio of strategies for combatingbiodiversity loss.
Business as Usual: Where Does Biodiversity Go from Here?There are �6.7 billion people in the world as we write this, anumber that is projected to grow (according to a mid-rangeforecast) to 9.3 billion by 2050 (19). The continued growth of thehuman population displaces biodiversity directly, as land isdeveloped to create living room. In one recent example, Vene-zuelan president Hugo Chavez aims to translocate 100,000people into a brand new city in El Avila National Park toalleviate overcrowding in Caracas (20). Providing a huge globalpopulace with the resources necessary for survival (much lesscomfort) also displaces biodiversity. A recent spatially explicitanalysis showed that humanity already appropriates nearly aquarter of global terrestrial net primary productivity, and up to80% in large regional swaths (21).
Supplying the consumption of the next 2.6 billion people willalmost certainly have a greater environmental impact thansupplying the last 2.6 billion added since 1975. Our species hasalready plucked the lowest-hanging resources and converted therichest lands. To maintain the pace, metals will have to be wonfrom ever-poorer ores, and oil, natural gas, and water will needto be obtained from ever-deeper wells and transported farther—all requiring accelerating energy use. So-called ‘‘marginal lands,’’often the last holdouts of biodiversity, are the final frontier,awaiting conversion into more human biomass. Whenever biodi-versity preservation poses a threat to human livelihood, comfort,or convenience, the politically expedient choice is usually toliquidate the natural capital. In sum, every increment in thehuman population accelerates competition with other organismsfor Earth’s primary production. And, of course, not only do thepresent poor need more consumption, the present rich alsodemand it—as certainly will the newcomers. This is all in the faceof signs that average per capita consumption is already unsus-tainable in developed regions (22), indicating a stark tradeoffbetween today’s consumption and the basic human rights offuture generations.
A major byproduct of human consumption is the toxificationof Earth’s ecosystems. Human agriculture and fossil-fuel com-bustion have multiplied the emission and deposition of nitrogenin recent decades, with negative consequences for biodiversity ingrasslands (23) and aquatic ecosystem (24). Widely used herbi-cides such as atrazine and glyphosphate harm amphibians (25,26), potentially contributing to global amphibian decline, and theuse of antiinflammatory drugs such as diclofenac and ibuprofento treat livestock in India has ravaged scavenging birds, for whichcattle carcasses are a major food source (27, 28).
Anthropogenic climate change stems from a special case oftoxification: carbon pollution. Many biological impacts of globalheating are evident, as animals and plants undergo changes inphenology, distribution, and local abundance (29). More alarm-ing, anthropogenic heating has already been directly implicatedin several extinctions (30) and seems likely to precipitate others.In the oceans, heating is already reducing the extent and alteringthe structure of coral reefs via breakdown of the coral–algalsymbiosis (31). Moreover, rising CO2 concentrations are lower-ing oceanic pH, with potentially disastrous consequences forcoral reefs and other marine ecosystems (32, 33).
Direct exploitation of wildlife species by human beings takesa variety of forms, from subsistence hunting (34) to the harvest-ing of wild plants and animals for conversion into luxury goods
and pets (35, 36). Large mammals and fish suffer disproportion-ately from direct human predation. Many of these vertebrates(e.g., apex carnivores, large ungulates, etc.) are strongly inter-acting species in their native ecosystems (37–40), and overhar-vesting them may have destabilizing effects on biodiversity andecological processes such as seed dispersal, nutrient cycling, andeven primary production. In oceans, top piscivores suffer dis-proportionately as fleets fish down the food web (41). Industri-alized fisheries have often devastated community biomass ofpredatory fish within a few decades (42), with even sharperdeclines common among the apex predators (43).
Nonnative species introduced by people into naive ecosystemshave occasionally wrought havoc on local biodiversity via pre-dation, competition, and the disruption of co-evolved interac-tions. Biotic interchange is likely to increase with increasingmobility in an increasingly globalized world; under business asusual, biogeography will be increasingly homogeneous.
A cryptic yet critical threat to biodiversity is the loss of futureevolutionary potential. Extinction of genetically distinct popu-lations, decreases in effective population sizes, and homogeni-zation of habitat types are all likely to have negative effects onfuture biodiversity (13, 44). The positive relationship betweenspeciation rate and habitat area (45) indicates that decreases inspecies geographic ranges will diminish future speciation rates,which in turn will impoverish future diversity (46). Speciation oflarge vertebrates, which are highly mobile and require largehabitats, may cease entirely (13), and biodisparity—the range ofmorphological and physiological variety on Earth—will decreaseas phylogenetically distinct, species-poor branches are prunedfrom the tree of life (47).
Loss of microevolutionary potential will also limit the capacityof populations to adapt to changing environmental conditions,highlighting another important point: The drivers of biodiversityloss will often act synergistically in imperiling populations andspecies. Habitat loss and fragmentation compound the effects ofclimate change, as species are unable to track their thermalniches spatially (48). The interactions among logging, fire, andclimate change threaten to transform the Amazon rainforest intosavanna (49, 50). Such positive feedbacks seem to be a rule,rather than an exception, and they make it impossible to generateprecise estimates of future biodiversity.
In short, although there are many uncertainties about thetrajectories of individual populations and species, we knowwhere biodiversity will go from here in the absence of a rapid,transformative intervention: up in smoke; toward the poles andunder water; into crops and livestock; onto the table and into yetmore human biomass; into fuel tanks; into furniture, pet stores,and home remedies for impotence; out of the way of more citiesand suburbs; into distant memory and history books. As biodi-versity recedes, we also lose the stories that go with it and manyways of relating to the world in which we evolved.
We now consider what might happen if humanity changes theway it does business. Ours is not a comprehensive treatment ofthis issue. The Millennium Ecosystem Assessment (51) containsa thorough and colorful summary of the state of biodiversity, andit provides important (and necessarily overarching) recommen-dations for softening human impact on ecosystems—things likeincreasing governmental accountability, eliminating environ-mentally malign subsidies, and reducing greenhouse-gas emis-sions. However, the breadth and complexity of these objectives,and the considerable political clout required to enact them, canengender the misconception that only governments can deter-mine where biodiversity goes from here. That misconception, inturn, is a recipe for paralysis among concerned individuals.Therefore, we try to focus more narrowly on seven more-or-lessconcrete sets of actions that individuals or small groups havealready set in motion. If implemented more broadly and scaled
11580 � www.pnas.org�cgi�doi�10.1073�pnas.0801911105 Ehrlich and Pringle

up dramatically, these actions would collectively enable a dif-ferent, more appealing fate for biodiversity.
Although each of the following strategies is being usedsomewhere, none is yet realizing its full potential. Some may notbe achievable in all times and places, but none is exclusive of anyother. Most of these strategies are familiar to most people in theconservation community; the notion that they are all ‘‘correct’’ways to conserve biodiversity is perhaps less so. Indeed, squab-bles over strategy are endemic within the conservation commu-nity, perhaps because different strategies are seen as competingfor funding and for primacy in the scholarly idea-scape. Thealacrity with which international conservation nongovernmentalorganizations have ‘‘branded’’ themselves (52) and the some-times absurdly acrimonious exchanges between conservationacademics seem to manifest a widespread ‘‘either–or’’ belief thatthere are absolutely right and wrong ways to protect biodiversity(53). Ostrom et al. (54), in a recent PNAS Special Feature, wroteof the need ‘‘to go beyond relying on abstract cure-all proposalsfor solving complex problems related to achieving sustainablesocial–ecological systems.’’ By emphasizing a portfolio of partialsolutions, we hope to reinforce the idea that maximizing futurebiodiversity will require a plurality of approaches in creativeadmixtures that are tailored to local realities. Each place needsa different mixture.
Business as Unusual: Where Else Might BiodiversityGo from Here?Into a Less Peopled, Less Hostile Planet. The human impact onbiodiversity is a product of three root factors, summarized in theheuristic I�PAT identity (55). The overall Impact (encompass-ing all of the drivers of biodiversity loss discussed above) is theproduct of Population size, per capita Aff luence, and the Tech-nologies (and socioeconomic–political systems) used to generateaffluence. ‘‘Affluence’’ in this context is simply per capitaconsumption, and ‘‘socioeconomic–political systems’’ refer tothe strictures that regulate technology use.
Tangible steps to reduce any of these factors will lessen theirproduct and help produce a more hospitable future for biodi-versity. A current example that integrates all three factors is thedrive to produce biofuel (T) to satisfy the expanding energyconsumption (A) of a growing population (P). Uncheckedbiofuel production has the potential to destroy all moist-tropicalbiodiversity that lacks conservation status. Biologically impov-erished monocultures of oil palm, soybeans, and sugarcane forbiodiesel and ethanol are devouring swaths of Brazilian Amazonand Cerrado, Indonesian, and Malaysian tropical rainforests andother vast reservoirs of biodiversity (56, 57). However, theproduction of biofuels from native grassland perennials onagriculturally degraded lands has the potential to reduce carbonemissions without displacing food production or convertingnative habitats (58). In this case, an innovative Technologicaladjustment would reduce overall Impact. Likewise, simple shiftsin socioeconomic–political systems—instituting high-occupancyvehicle lanes to reduce carbon emissions, for example, or de-manding high-seas ballast water exchange for cargo ships toreduce species introductions—would do a great deal.
Although population growth has slowed or is slowing in manydeveloped countries, it remains high in many developing regions.Much is known about how to hasten the transition to a stable andthen declining world population. Education and employment—for women especially—along with access to contraception andsafe abortions are the most important components (59). Less isknown about how to prevent overconsumption of natural re-sources (22). Mass media are a powerful tool for raising envi-ronmental awareness and influencing attitudes toward consump-tion, as demonstrated by Al Gore and his documentary film AnInconvenient Truth. To this end, we should exploit the media tothe fullest possible extent. Although more environmentally
benign technologies will also help, the battle will not be wonwithout a transformative collective decision by consumers thatless can be more. For example, although an 80% shift from beefand pork to farmed fish and poultry could enable displacementof up to 22% of U.S. gasoline consumption with low-impact,high-diversity biofuel (D. Tilman, personal communication),such a shift will not happen without hundreds of millions ofconscious decisions that a sustainable economy is worth morethan the taste of bacon cheeseburgers.
Into Perpetuity via Endowments for Conserved Areas. As manyconservation biologists have noted, formally protected areas arenot realizing their full potential, being too few, too small, too farapart, too expensive to establish and maintain, and/or too poorlyadministered (60, 61). These pitfalls notwithstanding, natureparks and other conservation areas are central to the future ofbiodiversity (62).
The outstanding national parks of North America and Aus-tralia demonstrate that well fed voter/taxpayers, whatever theirenvironmental shortcomings, are at least willing and able tosupport biological preserves; people in poorer countries, theargument goes, cannot necessarily afford that luxury. Of thevarious forms of revenue used to support protected areas in poorcountries, conservation trust funds—specifically, endowmentfunds intended to last in perpetuity—are the most promising.Unlike taxes, user fees, and debt swaps, endowments providesustained funding and are relatively resilient to political whimsand fluctuations in the demand for ecotourism (63). As of 2000,conservation trust funds had been established in more than 40countries, and nine developing nations boasted endowments ofUS$10 million or more (63).
Spergel (63) argues that conservation trust funds should beadditional to existing government funding, but this may not alwaysbe the case. Consider the following initiative being consideredin Costa Rica. It is called Paz Con la Naturaleza—Peace withNature—and it aims, among other things, to generate $500 millionto endow the country’s entire conserved-area system. Crucially,this would relieve Costa Rican taxpayers of the burden of financingconservation. Under the plan, $100 million would be spent toconsolidate the existing national park system—25% of thecountry—into 11 large conservation areas (ref. 64 and D. H.Janzen, personal communication). The remaining $400 millionwould be invested outside the country in a university-like endow-ment; $20 million of annual revenue from that endowment wouldbe divided among the conservation areas and used to coveroperating costs, with any remaining income plowed back into thefund for growth. Although the financing would operate at a nationaland international scale, the plan calls for decentralized local ad-ministration of the individual conservation areas. This plan, withan endowment as its centerpiece, simultaneously redresses most ofthe frequently cited shortcomings of conservation areas: it aims tomake them bigger, closer together, better administered, and essen-tially free to their users (aside from the opportunity cost of theland use).
It is an ambitious goal, to be sure. The price tag is steep bytraditional conservation standards, but with many U.S. researchuniversities boasting endowments in the multiple billions ofdollars, $500 million to conserve 25% of a nation and 4% ofglobal biodiversity forever—creating the world’s first explicitlygreen country in the process—seems like a bargain. It remainsto be seen whether the plan can be implemented in small, stable,‘‘green’’ Costa Rica, much less anywhere else; we will not knowuntil money is pledged. In any event, perpetual endowment fundshave tremendous potential in conservation (e.g., as a source ofrevenue for restoration and other projects: refs. 63 and 65) andwill generally increase the ‘‘localization’’ and longevity of con-servation initiatives by tying funds to long-term programs inparticular areas.
Ehrlich and Pringle PNAS � August 12, 2008 � vol. 105 � suppl. 1 � 11581

Into Human-Modified Landscapes, as Best It Can. Unbroken tracts ofconserved wild area, if they exist, will always be the greatestreservoirs of biodiversity and the most interesting places to visit.But under certain conditions, human-dominated pastoral andagricultural landscapes can also harbor an appreciable amount ofbiodiversity (66–68). Simple and inexpensive management tech-niques, such as maintaining living hedges around agriculturalplots (69) and preserving remnant trees in pasture (70), can oftenbuttress the biodiversity of these areas.
There are many compelling reasons to conserve countrysidebiodiversity. One is that most human-dominated landscapes willnot revert to wildness anytime soon; enabling wild populationsto persist in these areas is the best plausible outcome forbiodiversity. Another is that habitat types vary in their toleranceof human activity. Whereas tropical forests are quite sensitive toburning, wood chopping, and hunting, tropical savannas arerelatively resilient to anthropogenic disturbance. In many partsof Africa, much or most wildlife occurs outside of nationallyprotected areas (68), and wildlife can coexist alongside limitedlivestock populations (71). That people also share this space doesnot necessarily diminish its conservation value. Moreover, main-taining nonconserved areas in biodiversity-friendly ways aidsmigration and dispersal between protected areas, a process thatwill become even more important as climate change rearrangesspecies’ distributions (48, 72). Finally, maximizing biodiversity inareas where humans are active in their daily lives increases thefrequency of interactions between human and nonhuman or-ganisms, which enhances the potential for ecosystem-servicedelivery and bioliteracy development (see Onto the CulturalRadar Screen). Economic incentives (or legal strictures) can bedeveloped to encourage (or require) biodiversity-friendly use ofprivately held lands (73, 74).
Biodiversity maximization in human-dominated landscapesdoes not in any respect reduce the need for large conservedwildlands. How to allocate conservation resources among thesetwo different frameworks is a local problem, and answers willvary depending on such factors as the habitat types involved,local land-use history, the state of the region’s government andprotected-area system, and the availability and price of land forpurchase. As in most other respects, Britain is different fromKenya is different from Amazonia. The challenges in planningfor conservation in human-dominated landscapes are perhapsmost pronounced in fragmented tropical forest–pasture–fieldmosaics, because tropical-forest biodiversity is so great and thealternate landscape states are so dramatically different from thebaseline. One uncertainty is whether the apparently high con-servation value of these mosaics (e.g., refs. 66 and 75) will besustained over centuries, or whether it will ultimately succumbto the ‘‘extinction debt’’ (76, 77). A related concern is that thediversity of interspecific interactions in human-dominated land-scapes will decline more quickly and less perceptibly than thediversity of populations or species and that this will eventuallylead to additional population and species loss. A 300-year-oldcanopy tree species in a Brazilian pasture may serve as a roostfor a diversity of birds, epiphytes, and other organisms. But if itspollinator or seed disperser has been lost or will not venture intothe pasture (78), or if its seeds will not germinate in a pasture,or if its seedling crop will be devastated by pasture-tolerantseedling predators, then it is among the living dead (76): it willnot replace itself, and, when it goes, so go the other species thatused it.
Toward a (Protected) Role Within the Global Economy. Ecotourismhas long been one of the most potent forces favoring conserva-tion and will continue to be so. Ecotourists are consumers ofservices that nature provides (beauty, adventure, life lists, etc.),and they obligingly pay for these services in many ways (paying
for park entry fees, rooms at hotels, vehicle repairs at the localmechanic, etc.).
But ecotourism is exceptional in these respects. The biosphereprovides a steady stream of other direct and indirect benefits tohumanity for which nobody pays. The last decade has seen‘‘ecosystem services’’ transformed from an abstract academicconcept (79) into an applied research program and a powerfulpolicy tool (51, 80). These services include, but are not limitedto, providing raw materials, natural water filtration, carbonsequestration and storage in forests, f lood and erosion mitigationby plant communities, and pollination of crops by wild animals(80). Ecosystems, in addition to being reservoirs of biologicaldiversity and an integral part of our planetary and culturalheritage, are capital assets.
The global economy does not in any serious way account forthe value of ecosystem services. The perversity of this situationis obvious. The costs, both in the traditional economic sense andin terms of human health and well being, of losing these serviceswould be immense: many economic institutions would eithercollapse outright or require technological surrogates vastly moreexpensive than simply conserving the relevant ecosystems. Thearchetypal example of an ecosystem service in action is theconservation of the Catskill watershed, which has (thus far)spared the city of New York the $8 billion cost of building awater-filtration plant. Elsewhere, there are indications thatmangroves and other coastal vegetation might have protectedsome coastal villages from the devastating Asian tsunami of 2004(81). Recent population crashes of honey bees (Apis mellifera)have threatened an approximately $15 billion crop-pollinatingindustry in the United States, highlighting the importance ofconserving diverse native-bee communities (82, 83). These casestudies are small components of a total-biosphere value that is,effectively, infinite (84).
The idea that economic growth is independent of environ-mental health, and that humanity can therefore indefinitelyexpand its physical economy, is a dangerous delusion. Theproblem is that although we know that individual ecosystemservices are valuable, we rarely know precisely how valuable.And although quantitatively estimating the dollar value ofindividual services can be an eye-opening exercise, the effortrequired makes doing so prohibitive for every ecosystem (to saynothing of the futility of trying to add up to infinity). Thechallenges, then, are to provoke society to acknowledge ecosys-tem-service values (even though approximate or only qualita-tive) and to maintain service provision by protecting servicesources.
In addition to the individual efforts of a growing number ofacademics and practitioners, innovative programs are emergingto tackle these twin challenges at large scales. The NaturalCapital Project is an international collaboration involving Stan-ford University, The Nature Conservancy, and World WildlifeFund that aims to integrate ecosystem-service values into land-use and policy decisions (85). By developing new decision-support tools—including software to quantify and map the valueof ecosystem services across landscapes and seascapes—andapplying them in several demonstration sites across the world,the project hopes to promote more forward-thinking land-usedecisions.
In some cases, protecting ecosystem services (or even engi-neering them) may not enhance biodiversity conservation (86,87), but it may be useful for other anthropocentric reasons. Weshould be frank about that when pondering how to justify andfinance our operations. We should also think about how in-creased valuation of ecosystem services might spill over intoother sectors of the economy: If we rely on an ecosystem to doa job, are we putting a human being out of work, and might thatperson retaliate against the service-providing ecosystem?
Finally, we must recognize that, for whatever reason, demand
11582 � www.pnas.org�cgi�doi�10.1073�pnas.0801911105 Ehrlich and Pringle
for particular ecosystem services will wax and wane, but that thesources of the services must not be allowed to wax and wane insync. As proponents and critics of market-based conservationapproaches both point out, complete commodification of eco-systems is not the goal. Yes, ecosystem services have enormousvalue in traditional economic terms for their role in sustainingand enriching human life, and efforts to ascertain these valuesare important. No, ecosystems and their biodiversity cannotcompete on the open market as service providers alone (88). Tosubject ecosystems to all of the same demands and risks thatcommodities and corporations face in capitalist economieswould be to ensure their eventual diminution and demise.
Globalization intensifies this hazard. In a globalized, demodu-larized world, goods and services can often be imported andoutsourced more cheaply than they can be obtained locally—andthis includes goods and services provided by ecosystems. ‘‘En-demic’’ ecosystem services, which cannot be supplanted by goodsand services from distant sources, will likely be the most effectiveallies to biodiversity in the future.
Into Ecologically Reclaimed and Restored Habitats. Experience hasshown not only that science can inform more rapid, moreeffective restoration of local habitats (89), but also that contig-uous ecosystems can be built from scattered pieces at large scales(90). This process has several names—restoration, rewilding,renaturalization—and provides a constructive, creative counter-point to the stop-loss approach of traditional conservation. Thus,the future of biodiversity is not just what we can save of what isleft, but also what we can create from what is left (see also ref.91). As Young (92) put it, ‘‘The conservation mindset is one ofloss on a relatively short time horizon, whereas the restorationmindset is one of long-term recovery.’’
Successes abound. The regeneration of tropical forest inGuanacaste Province, northwestern Costa Rica (90, 93), isparticularly heartening for several reasons: it involves restorationof multiple habitat types; it is large-scale yet local and decen-tralized; and it was achieved by using a portfolio of innovativemechanisms and via broad collaboration among scientists, busi-nesspeople, politicians, and the local community. The result hasbeen the regeneration and conservation of 700 km2 of tropicaldry forest along with abutting chunks of rain and montane forest.In poverty-stricken Niger on the fringe of the Sahara, farmershave helped hold off desertification in many areas by nurturingsaplings in their fields rather than removing them—and theyhave begun to reap benefits from this greening of the country-side (94). In the oceans, researchers have had some successtransplanting live coral fragments onto degraded reefs (95).Likewise, efforts to rebuild damaged watersheds and wetlandshave been a major focus of scientific restoration ecology (e.g.,ref. 96), with important implications for the availability ofpotable water.
Large animals are particularly extinction-prone, at both thepopulation and species levels. They are also often particularlyimportant to ecological dynamics. Returning megafaunal speciesto what remains of their historical ranges (97) can yield a numberof overlapping benefits: the return of these charismatic speciesundoes population extinctions, makes habitats more interestingand exciting, and can restore ecological interactions with ap-pealing system-wide consequences. The repatriation of wolves toYellowstone National Park in 1995 not only titillated tourists butalso revived a multispecies trophic interaction involving elk,beavers, and trees, which has rejuvenated the region’s riparianecosystems (98, 99).
These examples and others illustrate that ecological restora-tion has a critical role in determining where biodiversity goesfrom here; we hope for enormous and rapid expansion of suchrevival efforts, even if the ultimate ecological goals take centu-ries to achieve. The only caveat is that many projects branded as
‘‘restoration’’ may be only weakly beneficial or neutral forbiodiversity (100). Tree plantations are not forests.
Into the Fabric of Local Communities. For various reasons, conser-vation programs in developing regions are likely to fail when theyare imposed from the top down by outsiders/foreigners (101).That realization has spurred interest in (i) involving localcommunities in conservation planning and (ii) fostering theirdesire and capacity to help achieve conservation goals. In someways, these can be seen as short- and long-term components ofthe same strategy. Earning local support for a conservationinitiative is needed to get the ball rolling; building local capacityensures that the ball keeps rolling once the outsiders leave.
Community involvement in conservation planning andprotected-area establishment/maintenance can take a variety offorms (102, 103) and is the subject of a gargantuan literature. Atits most straightforward, it involves dialogue and follow-up withlocal stakeholders to establish what kinds of compensation(broadly construed) would sweeten the prospect of restrictionson habitat use, but more nuanced and sophisticated schemeshave also been used (104, 105).
Local capacity building can also operate at multiple scales.Education is clearly central to this goal, from providing on-the-ground biodiversity training in parataxonomy (106, 107) totraining professional national park staffs to facilitating advanceddegrees for local students via scholarships and other mechanisms(52). But even more basic contributions (local-language publi-cations and extension efforts, computer and telecommunicationsaccess, etc.) can be extremely beneficial.
As conservationists increasingly realize, programs along theselines should attend every tropical conservation effort. Suchprograms are crucial—not only for the long-term success of thegiven conservation effort, but also for the augmentation andtransmission of biodiversity knowledge. Efforts to ‘‘engage’’local communities in conservation and land management canand have gone awry, and there are often important tradeoffsbetween conservation and development (88). None of this altersthe fact that, without local acceptance of biodiversity and therationale for its conservation, any gains will be ephemeral.
Onto the Cultural Radar Screen. For decades, conservationists haveappealed to aesthetics as a principal reason to conserve wildareas and species. But beauty is in the eye of the beholder, andthe 13-billion-plus beholding eyes of the world are drawn to manythings that are hostile to biodiversity: large families, tractors,treasure, pavement, goats, and Cadillacs, to name a few. Theprocesses of economic and infrastructural development help todivorce people from the natural world. Moreover, althoughoutdoor recreation and ecotourism are still important parts ofmany lives in rich countries, biophilic impulses seem increasinglyswamped by other stimuli. In the United States, the rise ofelectronic media has coincided with a 20-year downturn inNational Park visitation, after 50 years of steady increase (108).Recent findings indicate that similar declines in contact withnature are common to developed nations worldwide (109).
Such trends will not be reversed and the biodiversity crisis willnot be resolved until nature can rival virtual reality as a sourceof entertainment, intrigue, and inspiration. Janzen (110, 111)offers a compelling analogy: as books are uninteresting anduseless to an illiterate person, so is biodiversity uninterestingand useless to a bioilliterate person. People keep what they use,and increasing bioliteracy would enable more people to find usesfor biodiversity. Demand for ecotourism and perceived ‘‘exis-tence values’’ would increase and, with them, biodiversity-sustaining revenues. In a world of stingy appropriations forconservation, we have a wonderful academic literature on howto maximize returns on conservation investments (112). But wehave spent comparatively little effort figuring out ways to create
Ehrlich and Pringle PNAS � August 12, 2008 � vol. 105 � suppl. 1 � 11583

a world of biodiversity fanatics and conservation voters, whereconservation resources would presumably flow more freely.
The earlier in the developmental process comes exposure tonature, the better the odds of inspiring devotion to biodiversityand its conservation. It is a rare conservationist who did notencounter nature as a child. Every one of us can go to elementaryschools to show pictures of animals and plants and tell funnystories about ecology. The teachers will be happy to have us.More ambitious people might think about how to finance andinstitutionalize school field trips to natural areas. Those of uswho work in the tropics can do these things there, too.
Clearly, we can also use other strategies. One method is toappropriate the very technologies that are currently enforcingthe divide between people and biodiversity. Biodiversity isincreasingly on the World Wide Web via projects such as theEncyclopedia of Life (www.eol.org) and Wikispecies (http://species.wikimedia.org). But we can do more. We can uploadscience and nature shorts to YouTube and contribute ourknowledge to Wikipedia and its offshoots. We can post ourlectures online (113). We can work to add ecological dimensionsto online virtual-reality platforms and video games like SecondLife, which currently has 10 million registered accounts. Theseare obvious ideas; many more are possible. There is hope here:Online sales have helped to revitalize classical music (114),which is like biodiversity in that its devotees have long beenpredicting and lamenting its demise.
Some have argued that the key to widespread biodiversityappreciation is the ability to know immediately what is what innature. Janzen (110) believes that this requires a comprehensivelibrary of DNA barcodes (115) along with a handheld, nano-technological, field-portable sequencing device. We are hopefulabout this dream, as well as any other means of achieving thesame end.
Profound social transformations are not impossible or ‘‘un-realistic.’’ Shifts happen. They have happened in our lifetimes.We all know these terms: segregation, Iron Curtain, apartheid.‘‘Anthropogenic extinction’’ belongs on that list. More thananything else, the long-term future of biodiversity will bedetermined by our success or failure in helping to precipitatesuch an overhaul in popular perceptions of nature and what itmeans.
Concluding ThoughtsA substantial amount of biodiversity—enough to preserve manyfunctional ecosystems and to satisfy the desire felt by many tocoexist with our only known living companions in the universe—can be saved via the pluralistic deployment of the seven sets ofactions that are discussed above and that have been discussed foryears in countless other corners of academia.
The subheadings sound ambitious, but the actions they com-prise are demonstrably doable. As with the atmospheric ‘‘stabi-lization wedges’’ of Pacala and Socolow (1), each of the strategies
above has passed beyond the laboratory bench and demonstra-tion phase, but none has yet been implemented on a large-enough scale or in conjunction with enough of the others. Partof the reason for this shortfall is that most of us in the academiccommunity who are familiar with all of these ideas do not seeimplementing them as part of our job description.
Where Does Conservation Biology Go from Here? Academic ecolog-ical papers are often tinseled with one or two sentences about theapplied significance of the science (116), which accomplisheslittle. The selective pressures of academia, as currently set up,promote this practice by insisting on work that is at oncescientifically transformative and socially beneficial. Yet many ofthe most useful things that we can do for biodiversity—liketalking to kindergartners—are not at the cutting edge of science.Thus, we are implicitly encouraged to deck our papers withreferences to the urgent biodiversity crisis while quietly optingout of the grittier work. (We do not excuse ourselves from thisindictment.)
This phenomenon is the very definition of the Ivory Tower,but it need not apply here. It is up to us. We can maintain thestatus quo, which has not yet enabled us to stop or even slowbiodiversity loss. Alternatively, we can go a few steps down fromour cathedral by systematically rewarding (or even mandating) acertain tithe to society and incorporating it into our system forevaluating one another. Each institution seems free to make itsown decision on this front. Major funding bodies, such as theU.S. National Science Foundation, rightly insist that applicantsexplain both the intellectual importance and the ‘‘broaderimpacts’’ of their science. However, we suspect that scientistsface more accountability to the former than to the latter. Closerscrutiny of the delivery of societal benefits promised fromprevious grants would likely prompt an increase in tithing.
Where Does Humanity Go from Here? Where the human juggernautgoes from here will depend in many ways on where biodiversitygoes. In this article we have tried to suggest one hopeful answer:from here, humanity goes to grips with biodiversity as a part ofsociety that we accept, accommodate, need, use, pay for, puzzleover, admire, and enjoy. The alternative future is much uglier,but we still have time to reject it.
ACKNOWLEDGMENTS. We thank the many contributors to the ideas summa-rized here. In particular, we are indebted to Hal Mooney, Dan Janzen, WinnieHallwachs, Gretchen Daily, John Terborgh, Peter Raven, Todd Palmer, JakeGoheen, Josh Goldstein, Liba Pejchar, and Beth Pringle, whose thoughts andconstructive comments permeate our review. We are grateful to Peter andHelen Bing, Larry Condon, Wren Wirth, the late LuEsther T. Mertz, the HeinzFamily Philanthropies, the Northern California Association of Phi Beta Kappa,the Sherwood Family Foundation, and the U.S. National Science Foundation,whose generous support has enabled us to contemplate these issues.
1. Pacala S, Socolow R (2004) Stabilization wedges: Solving the climate problem for thenext 50 years with current technologies. Science 305:968–972.
2. Martin RD (1993) Primate origins: Plugging the gaps. Nature 363:223–234.3. Hughes TP (1994) Catastrophes, phase-shifts, and large-scale degradation of a Carib-
bean coral reef. Science 265:1547–1551.4. Asner GP, et al. (2005) Selective logging in the Brazilian Amazon. Science 310:480–
482.5. Oliveira PJC, et al. (2007) Land-use allocation protects the Peruvian Amazon. Science
317:1233–1236.6. Hoekstra JM, Boucher TM, Ricketts TH, Roberts C (2005) Confronting a biome crisis:
Global disparities of habitat loss and protection. Ecol Lett 8:23–29.7. May RM (1988) How many species are there on Earth? Science 241:1441–1449.8. May RM, Lawton JH, Stork NE (1995) in Extinction Rates, eds Lawton JH, May RM
(Oxford Univ Press, Oxford), pp 1–24.9. Balmford A, Green RE, Jenkins M (2003) Measuring the changing state of nature.
Trends Ecol Evol 18:326–330.10. Regan HM, Lupia R, Drinnan AN, Burgman MA (2001) The currency and tempo of
extinction. Am Nat 157:1–10.
11. Seabloom EW, Dobson AP, Stoms DM (2002) Extinction rates under nonrandompatterns of habitat loss. Proc Natl Acad Sci USA 99:11229–11234.
12. Pimm SL, Russell GJ, Gittleman JL, Brooks TM (1995) The future of biodiversity. Science269:347–350.
13. Woodruff DS (2001) Declines of biomes and biotas and the future of evolution. ProcNatl Acad Sci USA 98:5471–5476.
14. Hughes JB, Daily GC, Ehrlich PR (1997) Population diversity: Its extent and extinction.Science 278:689–692.
15. Houlahan JE, Findlay CS, Schmidt BR, Meyer AH, Kuzmin SL (2000) Quantitativeevidence for global amphibian population declines. Nature 404:752–755.
16. Rachowicz LJ, et al. (2006) Emerging infectious disease as a proximate cause ofamphibian mass mortality. Ecology 87:1671–1683.
17. Ceballos G, Ehrlich PR (2002) Mammal population losses and the extinction crisis.Science 296:904–907.
18. Jackson JBC (2007) Economic incentives, social norms, and the crisis of fisheries. EcolRes 22:16–18.
19. Population Reference Bureau (2007) 2007 World Population Data Sheet (PopulationReference Bureau, Washington, DC).
11584 � www.pnas.org�cgi�doi�10.1073�pnas.0801911105 Ehrlich and Pringle

20. Forero J (November 12, 2007) Venezuela’s Chavez attempts new city. Morning Edition(National Public Radio, Washington, DC).
21. Haberl H, et al. (2007) Quantifying and mapping the human appropriation of netprimary production in earth’s terrestrial ecosystems. Proc Natl Acad Sci USA104:12942–12945.
22. Ehrlich PR, Goulder LH (2007) Is current consumption excessive? A general frameworkand some indications for the United States. Conserv Biol 21:1145–1154.
23. Stevens CJ, Dise NB, Mountford JO, Gowing DJ (2004) Impact of nitrogen depositionon the species richness of grasslands. Science 303:1876–1879.
24. Carpenter SR, et al. (1998) Nonpoint pollution of surface waters with phosphorus andnitrogen. Ecol Appl 8:559–568.
25. Hayes TB, et al. (2002) Hermaphroditic, demasculinized frogs after exposure to theherbicide atrazine at low ecologically relevant doses. Proc Natl Acad Sci USA 99:5476–5480.
26. Relyea RA (2005) The lethal impact of roundup on aquatic and terrestrial amphibians.Ecol Appl 15:1118–1124.
27. Oaks JL, et al. (2004) Diclofenac residues as the cause of vulture population decline inPakistan. Nature 427:630–633.
28. Cuthbert R, Parry-Jones J, Green RE, Pain DJ (2007) NSAIDs and scavenging birds:Potential impacts beyond Asia’s critically endangered vultures. Biol Lett 3:90–93.
29. Parmesan C (2006) Ecological and evolutionary responses to recent climate change.Annu Rev Ecol Evol Syst 37:637–669.
30. Pounds JA, et al. (2006) Widespread amphibian extinctions from epidemic diseasedriven by global warming. Nature 439:161–167.
31. Hughes TP, et al. (2003) Climate change, human impacts, and the resilience of coralreefs. Science 301:929–933.
32. Orr JC, et al. (2005) Anthropogenic ocean acidification over the twenty-first centuryand its impact on calcifying organisms. Nature 437:681–686.
33. Hoegh-Guldberg O, et al. (2007) Coral reefs under rapid climate change and oceanacidification. Science 318:1737–1742.
34. Brashares JS, et al. (2004) Bushmeat hunting, wildlife declines, and fish supply in WestAfrica. Science 306:1180–1183.
35. Root TL, Bishop KD, Ehrlich PR, Schneider SH, Ehrlich AH (2006) Conservation ofsoutheast Asian birds: The role of bird markets and avian flu. Environ Awareness29:57–65.
36. O’Brien S, et al. (2003) Decline of the Madagascar radiated tortoise Geocheloneradiata due to overexploitation. Oryx 37:338–343.
37. Terborgh J, et al. (2001) Ecological meltdown in predator-free forest fragments.Science 294:1923–1926.
38. Ripple WJ, Beschta RL (2007) Hardwood tree decline following large carnivore loss onthe Great Plains, USA. Front Ecol Environ 5:241–246.
39. Pringle RM, Young TP, Rubenstein DI, McCauley DJ (2007) Herbivore-initiated inter-action cascades and their modulation by productivity in an African savanna. Proc NatlAcad Sci USA 104:193–197.
40. Palmer TM, et al. (2008) Breakdown of an ant-plant mutualism follows the loss oflarge mammals from an African savanna. Science 319:192–195.
41. Pauly D, Christensen V, Dalsgaard J, Froese R, Torres F (1998) Fishing down marinefood webs. Science 279:860–863.
42. Myers RA, Worm B (2003) Rapid worldwide depletion of predatory fish communities.Nature 423:280–283.
43. Baum JK, Myers RA (2004) Shifting baselines and the decline of pelagic sharks in theGulf of Mexico. Ecol Lett 7:135–145.
44. Myers N, Knoll AH (2001) The biotic crisis and the future of evolution. Proc Natl AcadSci USA 98:5389–5392.
45. Losos JB, Schluter D (2000) Analysis of an evolutionary species-area relationship.Nature 408:847–850.
46. Rosenzweig ML (2001) Loss of speciation rate will impoverish future diversity. ProcNatl Acad Sci USA 98:5404–5410.
47. Jablonski D (1995) in Extinction Rates, eds Lawton JH, May RM (Oxford Univ Press,Oxford), pp 25–44.
48. Travis JMJ (2003) Climate change and habitat destruction: A deadly anthropogeniccocktail. Proc Biol Sci 270:467–473.
49. Oyama MD, Nobre CA (2003) A new climate-vegetation equilibrium state for tropicalSouth America. Geophys Res Lett 30.
50. Terborgh J (2007) The green vs. the brown Amazon. NY Rev Books LIV:33–35.51. Millennium Ecosystem Assessment (2005) Ecosystems and Human Well-Being: Syn-
thesis (Island, Washington, DC).52. Rodriguez JP, et al. (2007) Globalization of conservation: A view from the south.
Science 317:755–756.53. Wiens J (2007) The dangers of black-and-white conservation. Conserv Biol 21:1371–
1372.54. Ostrom E, Janssen MA, Anderies JM (2007) Going beyond panaceas. Proc Natl Acad Sci
USA 104:15176–15178.55. Ehrlich PR, Holdren JP (1971) Impact of population growth. Science 171:1212–1217.56. Fearnside PM (2001) Soybean cultivation as a threat to the environment in Brazil.
Environ Conserv 28:23–38.57. Klink CA, Machado RB (2005) Conservation of the Brazilian Cerrado. Conserv Biol
19:707–713.58. Tilman D, Hill J, Lehman C (2006) Carbon-negative biofuels from low-input high-
diversity grassland biomass. Science 314:1598–1600.59. Rindfuss RR, Bumpass L, St. John C (1980) Education and fertility: Implications for the
roles women occupy. Am Sociol Rev 45:431–447.60. Noss RF, Cooperrider AY (1994) Saving Nature’s Legacy: Protecting and Restoring
Biodiversity (Island, Washington, DC).
61. Kareiva P (2006) Conservation biology: Beyond marine protected areas. Curr Biol16:533–535.
62. Terborgh J, van Schaik C (2002) in Making Parks Work: Strategies for PreservingTropical Nature, eds Terborgh J, van Schaik C, Davenport L, Rao M (Island, Washing-ton, DC), pp 3–14.
63. Spergel B (2002) in Making Parks Work: Strategies for Preserving Tropical Nature, edsTerborgh J, van Schaik C, Davenport L, Rao M (Island, Washington, DC), pp 364–382.
64. Dalton R (2006) Biodiversity: Cashing in on the rich coast. Nature 441:567–569.65. Schuyt K (2005) in Forest Restoration in Landscapes: Beyond Planting Trees, eds
Mansourian S, Vallauri D, Dudley N (Springer, New York), pp 161–165.66. Daily GC, Ehrlich PR, Sanchez-Azofeifa GA (2001) Countryside biogeography: Use of
human-dominated habitats by the avifauna of southern Costa Rica. Ecol Appl11:1–13.
67. Pimentel D, et al. (1992) Conserving biological diversity in agricultural-forestry sys-tems: Most biological diversity exists in human-managed ecosystems. BioScience42:354–362.
68. Western D (1989) in Conservation for the Twenty-First Century, eds Western D, PearlMM (Oxford Univ Press, Oxford), pp 158–165.
69. Robinson RA, Sutherland WJ (2002) Post-war changes in arable farming and biodi-versity in Great Britain. J Appl Ecol 39:157–176.
70. Luck GW, Daily GC (2003) Tropical countryside bird assemblages: Richness, composi-tion, and foraging differ by landscape context. Ecol Appl 13:235–247.
71. Georgiadis NJ, Olwero JGN, Ojwang G, Romanach SS (2007) Savanna herbivoredynamics in a livestock-dominated landscape: I. Dependence on land use, rainfall,density, and time. Biol Conserv 137:461–472.
72. Ricketts TH (2001) The matrix matters: Effective isolation in fragmented landscapes.Am Nat 158:87–99.
73. Stoneham G, Chaudhri V, Ha A, Strappazzon L (2003) Auctions for conservationcontracts: An empirical examination of Victoria’s BushTender trial. Austr J AgricResource Econ 47:477–500.
74. Farrier D (1995) Conserving biodiversity on private land: Incentives for managementor compensation for lost expectations? Harvard Environ Law Rev 19:303–408.
75. Mayfield MM, Daily GC (2005) Countryside biogeography of neotropical herbaceousand shrubby plants. Ecol Appl 15:423–439.
76. Janzen DH (1986) The future of tropical ecology. Annu Rev Ecol Syst 17:305–324.77. Tilman D, May RM, Lehman CL, Nowak MA (1994) Habitat destruction and the
extinction debt. Nature 371:65–66.78. Cordeiro NJ, Howe HF (2003) Forest fragmentation severs mutualism between seed
dispersers and an endemic African tree. Proc Natl Acad Sci USA 100:14052–14056.79. Ehrlich PR, Mooney HA (1983) Extinction, substitution, and ecosystem services. Bio-
Science 33:248–254.80. Daily GC (1997) Nature’s Services: Societal Dependence on Natural Ecosystems (Island,
Washington, DC).81. Danielsen F, et al. (2005) The Asian tsunami: A protective role for coastal vegetation.
Science 310:643–643.82. Kremen C, Williams NM, Thorp RW (2002) Crop pollination from native bees at risk
from agricultural intensification. Proc Natl Acad Sci USA 99:16812–16816.83. Winfree R, Williams NM, Dushoff J, Kremen C (2007) Native bees provide insurance
against ongoing honey bee losses. Ecol Lett 10:1105–1113.84. Dasgupta P, Levin S, Lubchenco J (2000) Economic pathways to ecological sustain-
ability. BioScience 50:339–345.85. Aldhous P, Holmes B (2007) Innovate or watch them die. New Scientist 195:6–8.86. Chan KMA, Shaw MR, Cameron DR, Underwood EC, Daily GC (2006) Conservation
planning for ecosystem services. PLoS Biol 4:2138–2152.87. Turner WR, et al. (2007) Global conservation of biodiversity and ecosystem services.
BioScience 57:868–873.88. Chan KMA, et al. (2007) When agendas collide: Human welfare and biological
conservation. Conserv Biol 21:59–68.89. Young TP, Petersen DA, Clary JJ (2005) The ecology of restoration: Historical links,
emerging issues and unexplored realms. Ecol Lett 8:662–673.90. Janzen DH (2000) in Norway/UN Conference on the Ecosystem Approach for Sus-
tainable Use of Biological Diversity (Norwegian Directorate for Nature Research,Trondheim, Norway), pp 122–132.
91. Soule ME, Terborgh J (1999) Conserving nature at regional and continental scales: Ascientific program for North America. BioScience 49:809–817.
92. Young TP (2000) Restoration ecology and conservation biology. Biol Conserv92:73–83.
93. Janzen DH (2002) in Handbook of Ecological Restoration, Volume 2: Restoration inPractice, eds Perrow MR, Davy AJ (Cambridge Univ Press, Cambridge, UK), pp 559–583.
94. Polgreen L (February 11, 2007) In Niger, trees and crops turn back the desert. NYTimes, World Section, www.nytimes.com/2007/02/11/world/africa/11uiger.html.
95. Guzman HM (1991) Restoration of coral reefs in Pacific Costa Rica. Conserv Biol5:189–195.
96. Mitsch WJ, Wilson RF (1996) Improving the success of wetland creation and restora-tion with know-how, time, and self-design. Ecol Appl 6:77–83.
97. Donlan CJ, et al. (2006) Pleistocene rewilding: An optimistic agenda for twenty-firstcentury conservation. Am Nat 168:660–681.
98. Ripple WJ, Beschta RL (2007) Restoring Yellowstone’s aspen with wolves. Biol Conserv138:514–519.
99. Wolf EC, Cooper DJ, Hobbs NT (2007) Hydrologic regime and herbivory stabilize analternative state in Yellowstone National Park. Ecol Appl 17:1572–1587.
100. Zedler JB, Callaway JC (1999) Tracking wetland restoration: Do mitigation sites followdesired trajectories? Restor Ecol 7:69–73.
101. Chapin M (2004) A challenge to conservationists. World Watch Mag 2004:17–31.
Ehrlich and Pringle PNAS � August 12, 2008 � vol. 105 � suppl. 1 � 11585

102. Western D, Wright MA (1994) Natural Connections: Perspectives in Community-BasedConservation (Island, Washington, DC).
103. Borgerhoff Mulder M, Coppolillo P (2005) Conservation: Linking Ecology, Economicsand Culture (Princeton Univ Press, Princeton).
104. Berkes F (2007) Community-based conservation in a globalized world. Proc Natl AcadSci USA 104:15188–15193.
105. Kremen C, et al. (1999) Designing the Masoala National Park in Madagascar based onbiological and socioeconomic data. Conserv Biol 13:1055–1068.
106. Sheil D, Lawrence A (2004) Tropical biologists, local people and conservation: Newopportunities for collaboration. Trends Ecol Evol 19:634–638.
107. Janzen DH (2004) Setting up tropical biodiversity for conservation through non-damaging use: Participation by parataxonomists. J Appl Ecol 41:181–187.
108. Pergams ORW, Zaradic PA (2006) Is love of nature in the US becoming love of electronicmedia? 16-year downtrend in national park visits explained by watching movies, playingvideo games, internet use, and oil prices. J Environ Manag 80:387–393.
109. Pergams ORW, Zaradic PA (2008) Evidence for a fundamental and pervasive shiftaway from nature-based recreation. Proc Natl Acad Sci USA 105:2295–2300.
110. Janzen DH (2004) Now is the time. Phil Trans R Soc London B 359:731–732.111. Janzen DH (2005) in Plant Conservation: A Natural History Approach, eds Krupnick G,
Kress J (Univ of Chicago Press, Chicago), pp ix–xiii.112. Wilson KA, et al. (2007) Conserving biodiversity efficiently: What to do, where, and
when. PLoS Biol 5:e223.113. Rimer S (December 19, 2007) At 71, physics professor is a web star. NY Times,
Education Section http://www.nytimes.com/2007/12/19/education/19physics.html.114. Kozinn A (May 28, 2006) Check the numbers: Rumors of classical music’s demise are
dead wrong. NY Times, Arts Section http://www.nytimes.com/2006/05/28/arts/music/28kozi.html.
115. Janzen DH, et al. (2005) Wedding biodiversity inventory of a large and complexLepidoptera fauna with DNA barcoding. Philos Trans R Soc London B 360:1835–1845.
116. Marris E (2007) What to let go. Nature 450:152–155.
11586 � www.pnas.org�cgi�doi�10.1073�pnas.0801911105 Ehrlich and Pringle

DOI: 10.1126/science.1187512, 1164 (2010);328 Science
, et al.Stuart H. M. ButchartGlobal Biodiversity: Indicators of Recent Declines
This copy is for your personal, non-commercial use only.
clicking here.colleagues, clients, or customers by , you can order high-quality copies for yourIf you wish to distribute this article to others
here.following the guidelines
can be obtained byPermission to republish or repurpose articles or portions of articles
): September 9, 2011 www.sciencemag.org (this infomation is current as of
The following resources related to this article are available online at
http://www.sciencemag.org/content/328/5982/1164.full.htmlversion of this article at:
including high-resolution figures, can be found in the onlineUpdated information and services,
http://www.sciencemag.org/content/suppl/2010/04/28/science.1187512.DC1.html can be found at: Supporting Online Material
http://www.sciencemag.org/content/328/5982/1164.full.html#relatedfound at:
can berelated to this article A list of selected additional articles on the Science Web sites
http://www.sciencemag.org/content/328/5982/1164.full.html#ref-list-1, 8 of which can be accessed free:cites 21 articlesThis article
9 article(s) on the ISI Web of Sciencecited by This article has been
http://www.sciencemag.org/content/328/5982/1164.full.html#related-urls21 articles hosted by HighWire Press; see:cited by This article has been
http://www.sciencemag.org/cgi/collection/ecologyEcology
subject collections:This article appears in the following
registered trademark of AAAS. is aScience2010 by the American Association for the Advancement of Science; all rights reserved. The title
CopyrightAmerican Association for the Advancement of Science, 1200 New York Avenue NW, Washington, DC 20005. (print ISSN 0036-8075; online ISSN 1095-9203) is published weekly, except the last week in December, by theScience
on
Sep
tem
ber
9, 2
011
ww
w.s
cien
cem
ag.o
rgD
ownl
oade
d fr
om

between ORC binding and nucleosome turnover,suggesting that turnover facilitates ORC binding.In contrast, other chromatin features that wouldbe expected for open or dynamic chromatin, in-cluding nucleosome density, mononucleosome/oligonucleosome ratio (a measure of micrococcalnuclease accessibility), H2Av (an H2A.Z his-tone variant enriched in active chromatin), andsalt-soluble nucleosomes, show little if any de-pendence on ORC abundance (Fig. 3, H to P).Our findings support the hypothesis that repli-cation origins are determined by chromatin, notby sequence features (20, 21). The better quan-titative correspondence of ORC to CATCH-ITdata than to other chromatin measurements impliesthat the ORC occupies DNA that is made acces-sible by nucleosome turnover. In support of thisinterpretation, we note that very similar corre-spondences are seen when CATCH-IT data arealigned with GAF sites (fig. S9) and that GAFdirects nucleosome turnover in vivo (22, 23).
Our direct strategy for measuring the kineticsof nucleosome turnover does not rely on trans-genes or antibodies but rather uses native his-tones and generic reagents. Thus, CATCH-ITprovides a general tool for studying activitiesthat influence nucleosome turnover. With use ofCATCH-IT, we found direct evidence that epige-netic maintenance involves nucleosome turnover,a process that erases histone modifications (10).
The fact that EZ is responsible for di- and tri-methylation of H3K27, but the nucleosomes thatit modifies turn over faster than a cell cycle,argues against proposals that histone modifica-tions required for cellular memory themselvestransmit epigenetic information (24). Rather, bysimply increasing or decreasing accessibility ofDNA to sequence-specific binding proteins, regu-lated nucleosome turnover may perpetuate activeor silent gene expression states and facilitate ini-tiation of replication.
References and Notes1. S. Henikoff, Nat. Rev. Genet. 9, 15 (2008).2. Y. Mito, J. G. Henikoff, S. Henikoff, Nat. Genet. 37, 1090
(2005).3. Y. Mito, J. G. Henikoff, S. Henikoff, Science 315, 1408
(2007).4. U. Braunschweig, G. J. Hogan, L. Pagie, B. van Steensel,
EMBO J. 28, 3635 (2009).5. C. M. Chow et al., EMBO Rep. 6, 354 (2005).6. C. Wirbelauer, O. Bell, D. Schübeler, Genes Dev. 19,
1761 (2005).7. C. Jin et al., Nat. Genet. 41, 941 (2009).8. S. L. Ooi, J. G. Henikoff, S. Henikoff, Nucleic Acids Res.
38, e26 (2010).9. A. Jamai, R. M. Imoberdorf, M. Strubin, Mol. Cell 25, 345
(2007).10. M. F. Dion et al., Science 315, 1405 (2007).11. A. Rufiange, P.-E. Jacques, W. Bhat, F. Robert,
A. Nourani, Mol. Cell 27, 393 (2007).12. Materials and methods are available as supporting
material on Science Online.
13. J. A. Prescher, C. R. Bertozzi, Nat. Chem. Biol. 1, 13(2005).
14. D. C. Dieterich, A. J. Link, J. Graumann, D. A. Tirrell,E. M. Schuman, Proc. Natl. Acad. Sci. U.S.A. 103, 9482(2006).
15. K. Yamasu, T. Senshu, J. Biochem. 107, 15 (1990).16. Y. B. Schwartz et al., Nat. Genet. 38, 700 (2006).17. N. Nègre et al., PLoS Genet. 6, e1000814 (2010).18. S. Henikoff, J. G. Henikoff, A. Sakai, G. B. Loeb,
K. Ahmad, Genome Res. 19, 460 (2009).19. B. P. Duncker, I. N. Chesnokov, B. J. McConkey, Genome
Biol. 10, 214 (2009).20. H. K. Macalpine, R. Gordan, S. K. Powell, A. J. Hartemink,
D. M. Macalpine, Genome Res. 20, 201 (2010).21. D. M. Gilbert, Nat. Rev. Mol. Cell Biol. 5, 848
(2004).22. T. Nakayama, K. Nishioka, Y. X. Dong, T. Shimojima,
S. Hirose, Genes Dev. 21, 552 (2007).23. S. J. Petesch, J. T. Lis, Cell 134, 74 (2008).24. K. H. Hansen et al., Nat. Cell Biol. 10, 1291 (2008).25. We thank T. Furuyama for suggesting this approach,
members of our lab for helpful discussions, and theHutchinson Center Genomics Shared Resource formicroarray processing. This work was supported by NIHgrant 1R21DA025758 to S.H. and NIH PostdoctoralFellowship 1F32GM083449 to R.B.D. All data sets can befound in GEO: GSE19788.
Supporting Online Materialwww.sciencemag.org/cgi/content/full/328/5982/1161/DC1Materials and MethodsFigs. S1 to S9Table S1References
7 January 2010; accepted 1 April 201010.1126/science.1186777
Global Biodiversity: Indicators ofRecent DeclinesStuart H. M. Butchart,1,2* Matt Walpole,1 Ben Collen,3 Arco van Strien,4Jörn P. W. Scharlemann,1 Rosamunde E. A. Almond,1 Jonathan E. M. Baillie,3Bastian Bomhard,1 Claire Brown,1 John Bruno,5 Kent E. Carpenter,6 Geneviève M. Carr,7†Janice Chanson,8 Anna M. Chenery,1 Jorge Csirke,9 Nick C. Davidson,10 Frank Dentener,11Matt Foster,12 Alessandro Galli,13 James N. Galloway,14 Piero Genovesi,15Richard D. Gregory,16 Marc Hockings,17 Valerie Kapos,1,18 Jean-Francois Lamarque,19Fiona Leverington,17 Jonathan Loh,20 Melodie A. McGeoch,21 Louise McRae,3Anahit Minasyan,22 Monica Hernández Morcillo,1 Thomasina E. E. Oldfield,23 Daniel Pauly,24Suhel Quader,25 Carmen Revenga,26 John R. Sauer,27 Benjamin Skolnik,28 Dian Spear,29Damon Stanwell-Smith,1 Simon N. Stuart,1,12,30,31 Andy Symes,2 Megan Tierney,1Tristan D. Tyrrell,1 Jean-Christophe Vié,32 Reg Watson24
In 2002, world leaders committed, through the Convention on Biological Diversity, to achievea significant reduction in the rate of biodiversity loss by 2010. We compiled 31 indicators to reporton progress toward this target. Most indicators of the state of biodiversity (covering species’population trends, extinction risk, habitat extent and condition, and community composition)showed declines, with no significant recent reductions in rate, whereas indicators of pressureson biodiversity (including resource consumption, invasive alien species, nitrogen pollution,overexploitation, and climate change impacts) showed increases. Despite some local successesand increasing responses (including extent and biodiversity coverage of protected areas,sustainable forest management, policy responses to invasive alien species, and biodiversity-relatedaid), the rate of biodiversity loss does not appear to be slowing.
In2002, world leaders committed, through theConvention on Biological Diversity (CBD),“to achieve by 2010 a significant reduction of
the current rate of biodiversity loss” (1), and this
“2010 target” has been incorporated into theUnited Nations Millennium Development Goalsin recognition of the impact of biodiversity losson human well-being (2). The CBD created a
framework of indicators to measure biodiversityloss at the level of genes, populations, species,and ecosystems (3, 4). Although a minority havebeen published individually (5), hitherto they havenot been synthesized to provide an integratedoutcome. Despite suggestions that the target isunlikely to be (6–8), or has not been (4, 9, 10),met, we test this empirically using a broad suite ofbiodiversity indicators.
To evaluate achievement of the 2010 target,we (i) determined the trend, and timing anddirectionof significant inflections in trend for individualindicators (11) and (ii) calculated aggregated in-dices relating to the state of biodiversity, pres-sures upon it, policy and management responses,and the state of benefits (ecosystem services) thatpeople derive from biodiversity, using the bestavailable sources. To calculate aggregate indices,we first scaled each of 24 indicators (out of 31)with available trend information to a value of 1 inthe first year with data from 1970 onward (onlyeight indicators had earlier trends) and calculatedannual proportional change from this first year.Then we used a generalized additive modelingframework (5, 12, 13) and determined significantinflections (12). Although absolute values aredifficult to interpret because they aggregate dif-ferent elements of biodiversity, this approachpermits a synthetic interpretation of rate changesacross the elements measured: For example, theaggregated state index should show positiveinflections if biodiversity loss has been signifi-cantly reduced.
28 MAY 2010 VOL 328 SCIENCE www.sciencemag.org1164
REPORTS
on
Sep
tem
ber
9, 2
011
ww
w.s
cien
cem
ag.o
rgD
ownl
oade
d fr
om

Our analyses suggest that biodiversity hascontinued to decline over the past four decades,with most (8 out of 10) state indicators showingnegative trends (Fig. 1 and Table 1). There havebeen declines in population trends of (i) ver-tebrates (13) and (ii) habitat specialist birds; (iii)shorebird populations worldwide; extent of (iv)forest (14, 15); (v) mangroves; (vi) seagrass beds;and (vii) the condition of coral reefs. None show
significant recent reductions in the rate of decline(Table 1), which is either fluctuating (i), stable (ii),based on too few data to test significance (iii to vi),or stable after a deceleration two decades ago (vii).Two indicators, freshwater quality and trophic in-tegrity in the marine ecosystem, show stable andmarginally improving trends, respectively, whichare likely explained by geographic biases in dataavailability for the former and spatial expansionof fisheries for the latter (5). Aggregated trendsacross state indicators have declined, with no sig-nificant recent reduction in rate: The most recentinflection in the index (in 1972) was negative (Fig.2). Because there were fewer indicators with trenddata in the 1970s, we recalculated the index from1980, which also showed accelerating biodiversityloss: The most recent inflection (2004) was neg-ative. Finally, aggregated species’ extinction risk(i.e., biodiversity loss at the species level) has ac-celerated: The InternationalUnion for Conservationof Nature (IUCN) Red List Index (RLI), measuringrate of change (16, 17), shows negative trends.
The majority of indicators of pressures onbiodiversity show increasing trends over recentdecades (Fig. 1 and Table 1), with increases in (i)aggregate human consumption of the planet’secological assets, (ii) deposition of reactive nitro-gen, (iii) number of alien species in Europe, (iv)proportion of fish stocks overharvested, and (v)impact of climate change on European bird pop-ulation trends (18). In no case was there a signif-icant reduction in the rate of increase (Table 1),which was stable (i, iii, and v), fluctuating (iv), orbased on too few data to test significance (ii),although growth in global nitrogen depositionmayhave slowed, and this may explain why the mostrecent inflection in aggregated trends (in 2006)was negative (Fig. 2) (5). Global trends forhabitat fragmentation are unavailable, but it isprobably increasing; for example, 80% of remain-ing Atlantic Forest fragments are <0.5 km2 insize (19), and 59% of large river systems aremoderately or strongly fragmented by dams andreservoirs (20).
1United Nations Environment Programme World ConservationMonitoring Centre, 219 Huntingdon Road, Cambridge CB30DL, UK. 2BirdLife International, Wellbrook Court, CambridgeCB3 0NA, UK. 3Institute of Zoology, Zoological Society ofLondon, Regent’s Park, London NW1 4RY, UK. 4StatisticsNetherlands, Post Office Box 24500, The Hague, 2490 HA,Netherlands. 5Department of Marine Sciences, University ofNorth Carolina at Chapel Hill, 340 Chapman Hall, CB 3300,Chapel Hill, NC 27599, USA. 6International Union forConservation of Nature (IUCN) and Conservation InternationalGlobal Marine Species Assessment, Biological Sciences, OldDominion University, Norfolk, VA 23529, USA. 7UnitedNations Environment Programme, Global Environment Mon-itoring System—Water, c/o National Water Research Institute,867 Lakeshore Road, Burlington, Ontario L7R 4A6, Canada.8IUCN Species Survival Commission, Conservation Interna-tional, Biodiversity Assessment Unit, c/o Center for AppliedBiodiversity Science, Conservation International, 2011 CrystalDrive, Suite 500, Arlington, VA 22202, USA. 9Fisheries andAquaculture Management Division, Food and AgricultureOrganization of the United Nations, Viale delle Terme diCaracalla 00153, Rome, Italy. 10Secretariat of the RamsarConvention on Wetlands, Rue Mauverney 28, 1196 Gland,Switzerland. 11European Commission Joint Research Centre,Institute for Environment and Sustainability, TP290, ViaEnrico Fermi 2749, 21027 Ispra (VA), Italy. 12Center forApplied Biodiversity Science, Conservation International,2011 Crystal Drive, Suite 500, Arlington, VA 22202, USA.13Global Footprint Network, 312 Clay Street, Suite 300,Oakland, CA 94607–3510, USA. 14Environmental SciencesDepartment, University of Virginia, Charlottesville, VA22903, USA. 15Istituto Superiore per la Protezione e laRicerca Ambientale, Via Curtatone 3, I-00185 Rome, Italy.16Royal Society for the Protection of Birds, The Lodge, SandySG19 2DL, UK, and European Bird Census Council.17School of Integrative Systems, University of Queensland,St. Lucia, Brisbane, Qld 4067, Australia. 18Department ofZoology, University of Cambridge, Downing Street, Cam-bridge CB2 3EJ, UK. 19National Center for AtmosphericResearch, 3450 Mitchell Lane, Boulder, CO 80301, USA.20World Wildlife Fund (WWF) International, 1196 Gland,Switzerland. 21South African National Parks, Centre forInvasion Biology and Global Invasive Species Programme,Post Office Box 216, Steenberg 7947, South Africa. 22UnitedNations Educational, Scientific, and Cultural Organization,7 place de Fontenoy, 75352 Paris, France. 23TRAFFICInternational, 219 Huntingdon Road, Cambridge CB3 0DL,UK. 24Sea Around Us Project, Fisheries Centre, University ofBritish Columbia, 2202 Main Mall, Vancouver, BC V6T1Z4,Canada. 25National Centre for Biological Sciences, TataInstitute of Fundamental Research, GKVK Campus, BellaryRoad, Bangalore 560 065, India. 26The Nature Conservancy,4245 North Fairfax Drive, Arlington, VA 22203, USA. 27U.S.Geological Survey, Patuxent Wildlife Research Center, 12100Beech Forest Road, Laurel, MD 20708–4039, USA. 28Amer-ican Bird Conservancy, 1731 Connecticut Avenue, N.W., 3rdFloor, Washington, DC 20009, USA. 29Centre for InvasionBiology, Stellenbosch University, Private Bag X1, Matieland7602, South Africa. 30IUCN Species Survival Commission,Department of Biology and Biochemistry, University of Bath,Bath BA2 7AY, UK. 31Al Ain Wildlife Park and Resort, PostOffice Box 45553, Abu Dhabi, United Arab Emirates. 32IUCN,Rue Mauverney 28, 1196 Gland, Switzerland.
*To whom correspondence should be addressed. E-mail:[email protected]†Present address: Indian and Northern Affairs Canada, 15Eddy, Gatineau QC K1A 0H4, Canada.
Fig. 1. Indicator trends for (A) the state of biodiversity, (B) pressures upon it, (C) responses to address itsloss, and (D) the benefits humans derive from it. Data scaled to 1 in 1970 (or for first year of data if>1970), modeled (if >13 data points; see Table 1), and plotted on a logarithmic ordinate axis. Shadingshows 95% confidence intervals except where unavailable (i.e., mangrove, seagrass, and forest extent,nitrogen deposition, and biodiversity aid). WBI, Wild Bird Index; WPSI, Waterbird Population Status Index;LPI, Living Planet Index; RLI, Red List Index; IBA, Important Bird Area; AZE, Alliance for Zero Extinctionsite; IAS, invasive alien species.
www.sciencemag.org SCIENCE VOL 328 28 MAY 2010 1165
REPORTS
on
Sep
tem
ber
9, 2
011
ww
w.s
cien
cem
ag.o
rgD
ownl
oade
d fr
om

Table 1. Summary of global biodiversity indicator trends.
IndicatorData
availability(years)†
% Change since1970‡
Mean annual % change§ Trends inrate of change║1970s 1980s 1990s 2000s Since 1970
StateLiving Planet Index (LPI)
(mean population trends of vertebrates)1970–2006 –31* –0.2 –1.4 –1.4 –0.9 –1.0 F
Wild Bird Index [mean population trendsof habitat specialists in Europe and NorthAmerica, disaggregated for terrestrial (t)and wetland (w) species]
1980–2007 –2.6*–16*(t)+40*(w)
–0.6–1.3+1.1
–0.2–0.7+1.3
+0.6+0.3+1.1
–0.1–0.7+1.2
SD 1982–2007
S
Waterbird Population Status Index(% shorebird populations increasing,stable, or decreasing)
1985–2005† –33 –1.4 –2.0 –2.4 –2.0 A?
Red List Index (RLI) (extinction risk ofmammals, birds, amphibians, and corals)
1986–2008 –6.1* –0.1 –0.2 –0.5 –0.3 A
Marine Trophic Index(shift in fishing catch from toppredators to lower trophic levels)
1950–2006 +3.0* +0.1 –0.1 +0.1 +0.1 +0.1 S
Forest extent 1990–2005† –3.1 –0.2 –0.2 –0.2 S?Mangrove extent 1980–2005† –19 –1.0 –0.7 –0.7 –0.8 S?Seagrass extent 1930–2003† –20 –0.4 –0.5 –0.5 –2.4 –0.7 A?Coral reef condition
(live hard coral cover)1980–2004 –38* –3.9 –0.3 +0.2 –1.8 D 1985–1988
Water Quality Index(physical/chemical quality of freshwater)
1980–2005 0 +0.1 +0.0 –0.2 +0 S
Number of state indicators declining 2/3 8/9 8/10 7/10 8/10Pressures
Ecological footprint(humanity’s aggregate resource-consumption)
1961–2006 +78* +2.0 +1.3 +1.3 +2.1 +1.6 S
Nitrogen deposition rate(annual reactive N deposited)
1850–2005† +35 +2.0 +1.3 –0.3 +0.2 +0.9 D?
No. alien species in Europe(Mediterranean marine, mammal, and freshwater)
1970–2007 +76* +2.0 +1.4 +1.6 +1.1 +1.5 S
Exploitation of fish stocks(% overexploited, fully exploited, or depleted)
1974–2006 +31* +0.6 +0.6 +1.1 +1.2 +0.9 F
Climatic Impact Indicator(degree to which European bird population trendshave responded in the directionexpected from climate change)
1980–2005 +23* –0.8 +3.2 +1.2 +1.2 S
Number of pressure indicators increasing 4/4 4/5 4/5 5/5 5/5Responses
Extent of Protected Areas (PAs) 1888–2006 +400* +7.6 +4.5 +3.4 +2.4 +4.7 SCoverage by PAs of Important
Bird Areas and Alliance for Zero Extinction sites1888–2009 +360* +5.6 +4.6 +2.6 +0.8 +3.4 D 1999–2008
Area of forest under sustainablemanagement (FSC certified)
1995–2008 +12,000* +100 +20 +46 D 2006
International IAS policy adoption(no. signatories to conventionswith provision for tackling IAS)
1952–2008 +2700* +10 +6.9 +14 +5.1 +9.1 S
National IAS policy adoption(% countries with relevant legislation)
1964–2009 +10,000* +30 +8.7 +12 +4.1 +13 D 2004–2009
Official development assistance(US$ per year provided in support of CBD)
2005–2007† +17 +8.4 +8.3 D?
Number of response indicators increasing 4/4 4/4 5/5 6/6 6/6Benefits
LPI for utilized vertebrate populations 1970–2006 –15* +1.0 –0.3 –1.3 –1.7 –0.4 A 1972–2006RLI for species used for food and medicine 1986–2008 –3.5* –0.2 –0.2 –0.2 –0.2 ARLI for bird species in international trade 1988–2008 –0.5* –0.01 –0.03 –0.02 –0.03 ANumber of benefits indicators declining 0/1 3/3 3/3 3/3 3/3*Significant trends (P < 0.05). †Identifies indicators with insufficient data to test significance of post-1970 trends, usually because annual estimates are unavailable. ‡Since earliestdate with data if this is post-1970. §Because the indicators measure different parameters, some comparisons of mean annual % change between indicators are less meaningful thancomparisons between decades for the same indicator. ║Rate of change decelerating (D), accelerating (A), stable (S, i.e., no years with significant changes), fluctuating (F, i.e., a sequence ofsignificant positive and negative changes), or with too few data points to test significance (?); years indicate periods in which second derivatives differed significantly from zero (P < 0.05).
28 MAY 2010 VOL 328 SCIENCE www.sciencemag.org1166
REPORTS
on
Sep
tem
ber
9, 2
011
ww
w.s
cien
cem
ag.o
rgD
ownl
oade
d fr
om
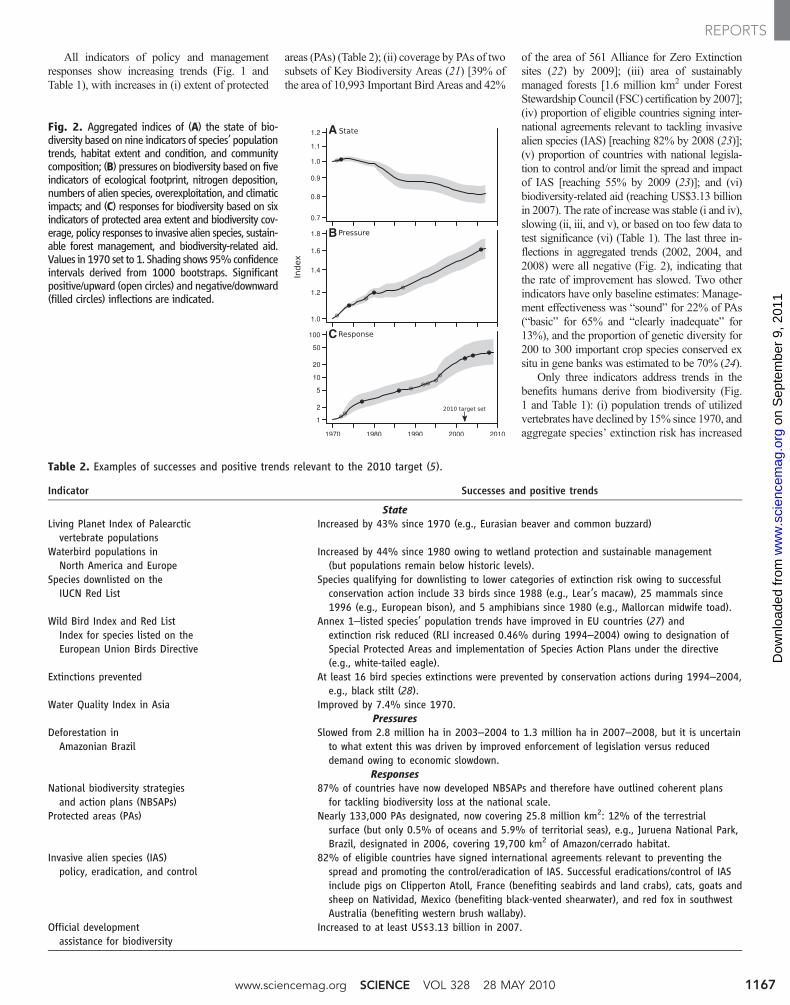
All indicators of policy and managementresponses show increasing trends (Fig. 1 andTable 1), with increases in (i) extent of protected
areas (PAs) (Table 2); (ii) coverage by PAs of twosubsets of Key Biodiversity Areas (21) [39% ofthe area of 10,993 Important Bird Areas and 42%
of the area of 561 Alliance for Zero Extinctionsites (22) by 2009]; (iii) area of sustainablymanaged forests [1.6 million km2 under ForestStewardship Council (FSC) certification by 2007];(iv) proportion of eligible countries signing inter-national agreements relevant to tackling invasivealien species (IAS) [reaching 82% by 2008 (23)];(v) proportion of countries with national legisla-tion to control and/or limit the spread and impactof IAS [reaching 55% by 2009 (23)]; and (vi)biodiversity-related aid (reaching US$3.13 billionin 2007). The rate of increase was stable (i and iv),slowing (ii, iii, and v), or based on too few data totest significance (vi) (Table 1). The last three in-flections in aggregated trends (2002, 2004, and2008) were all negative (Fig. 2), indicating thatthe rate of improvement has slowed. Two otherindicators have only baseline estimates: Manage-ment effectiveness was “sound” for 22% of PAs(“basic” for 65% and “clearly inadequate” for13%), and the proportion of genetic diversity for200 to 300 important crop species conserved exsitu in gene banks was estimated to be 70% (24).
Only three indicators address trends in thebenefits humans derive from biodiversity (Fig.1 and Table 1): (i) population trends of utilizedvertebrates have declined by 15% since 1970, andaggregate species’ extinction risk has increased
Fig. 2. Aggregated indices of (A) the state of bio-diversity based on nine indicators of species’ populationtrends, habitat extent and condition, and communitycomposition; (B) pressures on biodiversity based on fiveindicators of ecological footprint, nitrogen deposition,numbers of alien species, overexploitation, and climaticimpacts; and (C) responses for biodiversity based on sixindicators of protected area extent and biodiversity cov-erage, policy responses to invasive alien species, sustain-able forest management, and biodiversity-related aid.Values in 1970 set to 1. Shading shows 95%confidenceintervals derived from 1000 bootstraps. Significantpositive/upward (open circles) and negative/downward(filled circles) inflections are indicated.
A
B
C
Table 2. Examples of successes and positive trends relevant to the 2010 target (5).
Indicator Successes and positive trends
StateLiving Planet Index of Palearctic
vertebrate populationsIncreased by 43% since 1970 (e.g., Eurasian beaver and common buzzard)
Waterbird populations inNorth America and Europe
Increased by 44% since 1980 owing to wetland protection and sustainable management(but populations remain below historic levels).
Species downlisted on theIUCN Red List
Species qualifying for downlisting to lower categories of extinction risk owing to successfulconservation action include 33 birds since 1988 (e.g., Lear’s macaw), 25 mammals since1996 (e.g., European bison), and 5 amphibians since 1980 (e.g., Mallorcan midwife toad).
Wild Bird Index and Red ListIndex for species listed on theEuropean Union Birds Directive
Annex 1–listed species’ population trends have improved in EU countries (27) andextinction risk reduced (RLI increased 0.46% during 1994–2004) owing to designation ofSpecial Protected Areas and implementation of Species Action Plans under the directive(e.g., white-tailed eagle).
Extinctions prevented At least 16 bird species extinctions were prevented by conservation actions during 1994–2004,e.g., black stilt (28).
Water Quality Index in Asia Improved by 7.4% since 1970.Pressures
Deforestation inAmazonian Brazil
Slowed from 2.8 million ha in 2003–2004 to 1.3 million ha in 2007–2008, but it is uncertainto what extent this was driven by improved enforcement of legislation versus reduceddemand owing to economic slowdown.
ResponsesNational biodiversity strategies
and action plans (NBSAPs)87% of countries have now developed NBSAPs and therefore have outlined coherent plansfor tackling biodiversity loss at the national scale.
Protected areas (PAs) Nearly 133,000 PAs designated, now covering 25.8 million km2: 12% of the terrestrialsurface (but only 0.5% of oceans and 5.9% of territorial seas), e.g., Juruena National Park,Brazil, designated in 2006, covering 19,700 km2 of Amazon/cerrado habitat.
Invasive alien species (IAS)policy, eradication, and control
82% of eligible countries have signed international agreements relevant to preventing thespread and promoting the control/eradication of IAS. Successful eradications/control of IASinclude pigs on Clipperton Atoll, France (benefiting seabirds and land crabs), cats, goats andsheep on Natividad, Mexico (benefiting black-vented shearwater), and red fox in southwestAustralia (benefiting western brush wallaby).
Official developmentassistance for biodiversity
Increased to at least US$3.13 billion in 2007.
www.sciencemag.org SCIENCE VOL 328 28 MAY 2010 1167
REPORTS
on
Sep
tem
ber
9, 2
011
ww
w.s
cien
cem
ag.o
rgD
ownl
oade
d fr
om

at an accelerating rate (as shown by the RLI) for(ii) mammals, birds, and amphibian species usedfor food and medicine (with 23 to 36% of suchspecies threatened with extinction) and (iii) birdsthat are internationally traded (principally for thepet trade; 8% threatened). Trends are not yetavailable for plants and other important utilizedanimal groups. Three other indicators, which lacktrend data, show (iv) 21% of domesticated an-imal breeds are at risk of extinction (and 9% arealready extinct); (v) languages spoken by fewerthan 1000 people (22% of the current 6900 lan-guages) have lost speakers over the past 40 yearsand are in danger of disappearing within thiscentury (loss of linguistic diversity being a proxyfor loss of indigenous biodiversity knowledge);and (vi) more than 100 million poor people livein remote areas within threatened ecoregions andare therefore likely to be particularly dependentupon biodiversity and the ecosystem services itprovides.
Indicator development has progressed sub-stantially since the 2010 target was set. However,there are considerable gaps and heterogeneity ingeographic, taxonomic, and temporal coverageof existing indicators, with fewer data for devel-oping countries, for nonvertebrates, and frombefore 1980 and after 2005 (4, 5, 25). Interlink-ages between indicators and the degree to whichthey are representative are incompletely under-stood. In addition, there are gaps for several keyaspects of state, pressures, responses, and espe-cially benefits (4, 5, 7, 26).
Despite these challenges, there are sufficientdata on key dimensions of biodiversity to con-clude that at the global scale it is highly unlikelythat the 2010 target has been met. Neither indi-vidual nor aggregated indicators of the state ofbiodiversity showed significant reductions in theirrates of decline, apart from coral reef condition,for which there has been no further decelerationin decline since the mid-1980s. Furthermore, allpressure indicators showed increasing trends, withnone significantly decelerating. Some local system-specific exceptions with positive trends for par-ticular populations, taxa, and habitats (Table 2)suggest that, with political will and adequate re-sources, biodiversity loss can be reduced or re-versed.More generally, individual and aggregatedresponse indicators showed increasing trends, albeitat a decelerating rate (and with little direct infor-mation on whether such actions are effective).Overall, efforts to stembiodiversity loss have clearlybeen inadequate, with a growingmismatch betweenincreasing pressures and slowing responses.
Our results show that, despite a few encour-aging achievements, efforts to address the loss ofbiodiversity need to be substantially strengthenedby reversing detrimental policies, fully integratingbiodiversity into broad-scale land-use planning,incorporating its economic value adequately intodecisionmaking, and sufficiently targeting, fundingand implementing policies that tackle biodiversityloss, among other measures. Sustained investmentin coherent global biodiversity monitoring and in-
dicators is essential to track and improve the ef-fectiveness of these responses.
References and Notes1. Secretariat of the Convention on Biological Diversity,
Handbook of the Convention on Biological Diversity(Earthscan, London, 2003).
2. United Nations, Millennium Development GoalsIndicators (http://unstats.un.org/unsd/mdg/Host.aspx?Content=Indicators/OfficialList.htm, 2008).
3. Convention on Biological Diversity, Framework formonitoring implementation of the achievement of the2010 target and integration of targets into thethematic programmes of work, COP 8 Decision VIII/15(www.cbd.int/decisions, 2006).
4. M. Walpole et al., Science 325, 1503 (2009).5. Further information is available as supporting material
on Science Online.6. H. M. Pereira, H. David Cooper, Trends Ecol. Evol. 21,
123 (2006).7. G. M. Mace, J. E. M. Baillie, Conserv. Biol. 21, 1406 (2007).8. J. D. Sachs et al., Science 325, 1502 (2009).9. N. Gilbert, Nature 462, 263 (2009).10. H. Mooney, G. Mace, Science 325, 1474 (2009).11. L. Soldaat, H. Visser, M. van Roomen, A. van Strien,
J. Ornithol. 148, (S2), 351 (2007).12. R. M. Fewster, S. T. Buckland, G. M. Siriwardena,
S. R. Baillie, J. D. Wilson, Ecology 81, 1970 (2000).13. B. Collen et al., Conserv. Biol. 23, 317 (2009).14. Food and Agriculture Organization, Global Forest
Resources Assessment 2005 (FAO, Rome, 2006).15. M. C. Hansen et al., Proc. Natl. Acad. Sci. U.S.A. 105,
9439 (2008).16. S. H. M. Butchart et al., PLoS ONE 2, e140 (2007).17. J. C. Vié, C. Hilton-Taylor, S. N. Stuart, Eds., Wildlife
in a Changing World (IUCN, Gland, Switzerland, 2008).18. R. D. Gregory et al., PLoS ONE 4, e4678 (2009).19. M. C. Ribeiro, J. P. Metzger, A. C. Martensen, F. Ponzoni,
M. Hirota, Biol. Conserv. 142, 1141 (2009).20. C. Nilsson, C. A. Reidy, M. Dynesius, C. Revenga, Science
308, 405 (2005).21. G. Eken et al., Bioscience 54, 1110 (2004).22. T. H. Ricketts et al., Proc. Natl. Acad. Sci. U.S.A. 102,
18497 (2005).
23. M. A. McGeoch et al., Divers. Distrib. 16, 95 (2010).24. SCBD, The Convention on Biological Diversity Plant
Conservation Reports (SCBD, Montreal, 2009).25. B. Collen, M. Ram, T. Zamin, L. McRae, Trop. Conserv. Sci.
1, 75 (2008).26. A. Balmford, P. Crane, A. Dobson, R. E. Green,
G. M. Mace, Philos. Trans. R. Soc. London Ser. B 360,221 (2005).
27. P. F. Donald et al., Science 317, 810 (2007).28. S. H. M. Butchart, A. J. Stattersfield, N. J. Collar, Oryx 40,
266 (2006).29. We are grateful for comments, data, or help from
R. Akçakaya, L. Alvarez-Filip, A. Angulo, L. Bennun,L. Coad, N. Cox, M. Dubé, C. Estreguil, M. Evans,B. Galil, V. Gaveau, F. Gherardi, S. Goldfinger, R. Green,A. Grigg, P. Herkenrath, C. Hilton-Taylor, M. Hoffmann,E. Kleynhans, J. Lamoreux, S. Livingstone, E. Marais,P. Martin, I. May, A. Milam, K. Noonan-Mooney, H. Pavese,B. Polidoro, C. Pollock, D. Pritchard, J. Schipper,F. Schutyser, V. Shutte, S. Simons, J. Skorpilová,A. Stattersfield, P. Voříšek, R. Wright, M. Wackernagel,and M. Waycott. We acknowledge support from the GlobalEnvironment Facility to the 2010 Biodiversity IndicatorsPartnership; Shell Foundation; European Commission; theSea Around Us Project (University of British Columbia/PewEnvironment Group) to D.P. and R.W.; World WildlifeFund, The Nature Conservancy, and the University ofQueensland to M.H. and F.L.; T. Haas and the NewHampshire Charitable Foundation to K.E.C.; and theNational Science Foundation (NSF) to J.-F.L. Opinionsand findings expressed here do not necessarily reflect theviews of the NSF or other funding bodies.
Supporting Online Materialwww.sciencemag.org/cgi/content/full/science.1187512/DC1MethodsSOM TextFigs. S1 and S2Tables S1 to S4ReferencesData File 1
26 January 2010; accepted 8 April 2010Published online 29 April 2010;10.1126/science.1187512Include this information when citing this paper.
Plectasin, a Fungal Defensin,Targets the Bacterial Cell WallPrecursor Lipid IITanja Schneider,1 Thomas Kruse,2 Reinhard Wimmer,3 Imke Wiedemann,1 Vera Sass,1Ulrike Pag,1 Andrea Jansen,1 Allan K. Nielsen,4 Per H. Mygind,4 Dorotea S. Raventós,4Søren Neve,4 Birthe Ravn,4 Alexandre M. J. J. Bonvin,5 Leonardo De Maria,4Anders S. Andersen,2,4 Lora K. Gammelgaard,4 Hans-Georg Sahl,1 Hans-Henrik Kristensen4*
Host defense peptides such as defensins are components of innate immunity and have retainedantibiotic activity throughout evolution. Their activity is thought to be due to amphipathicstructures, which enable binding and disruption of microbial cytoplasmic membranes. Contrary tothis, we show that plectasin, a fungal defensin, acts by directly binding the bacterial cell-wallprecursor Lipid II. A wide range of genetic and biochemical approaches identify cell-wallbiosynthesis as the pathway targeted by plectasin. In vitro assays for cell-wall synthesis identifiedLipid II as the specific cellular target. Consistently, binding studies confirmed the formation of anequimolar stoichiometric complex between Lipid II and plectasin. Furthermore, key residues inplectasin involved in complex formation were identified using nuclear magnetic resonancespectroscopy and computational modeling.
Plectasin is a 40–amino acid residue fungaldefensin produced by the saprophytic as-comycete Pseudoplectania nigrella (1).
Plectasin shares primary structural features withdefensins from spiders, scorpions, dragonflies andmussels and folds into a cystine-stabilized alpha-
28 MAY 2010 VOL 328 SCIENCE www.sciencemag.org1168
REPORTS
on
Sep
tem
ber
9, 2
011
ww
w.s
cien
cem
ag.o
rgD
ownl
oade
d fr
om

18 SEPTEMBER 2009 VOL 325 SCIENCE www.sciencemag.org 1502
POLICYFORUM
The Millennium Development Goals
(MDGs) are designed to inspire efforts
to improve people’s lives by, among
other priorities, halving extreme poverty by
2015 ( 1). Analogously, concern about global
decline in biodiversity and degradation of eco-
system services ( 2) gave rise in 1992 to the
Convention on Biological Diversity (CBD).
The CBD target “to achieve by 2010 a signifi -
cant reduction of the current rate of biodiversity
loss” was incorporated into the MDGs in 2002.
Our lack of progress toward the 2010 target ( 3,
4) could undermine achievement of the MDGs
and poverty reduction in the long term. With
increasing global challenges, such as popu-
lation growth, climate change, and overcon-
sumption of ecosystem services, we need fur-
ther integration of the poverty alleviation and
biodiversity conservation agendas.
The links between poverty and the environ-
ment are, unsurprisingly, complex (5, 6) ( Fig.
1). Some attempts have been made to identify a
relation between development and biodiversity,
but these have yielded mixed results ( 5). Action
is urgently needed to identify and quantify the
links between biodiversity and ecosystem ser-
vices on the one hand, and poverty reduction on
the other, while taking into account the global,
regional, and local drivers of biodiversity loss
in poor areas.
Tackling the root causes of both biodiver-
sity loss and poverty can lead to complemen-
tary positive results. For example, reducing
population pressure by promoting voluntary
reductions in fertility in impoverished regions
could support conservation of biodiversity and
faster poverty alleviation ( 7). However, there
may be complex trade-offs, especially in the
short term. Trade liberalization, for instance,
might increase the supply of food commodi-
ties and could reduce prices in food-import-
ing countries, which would remove some
pressure on these countries’ natural habitats.
But reductions in trade barriers might also
lead to increased production in food-export-
ing countries where commercial agriculture
could increase vulnerability to deforestation,
pests, diseases, and/or natural disasters, and
might reduce the availability of ecosystem
services ( 8, 9). Nevertheless, countervailing
efforts to maintain biodiversity must be sensi-
tive to human needs if they are to retain public
support ( 10).
The scientifi c and development policy com-
munities should focus on jointly articulating
and addressing the critical research questions
that, when answered, will help ensure that pov-
erty alleviation and conservation efforts pro-
duce win-win outcomes, or at least minimize
harm to either agenda. To ensure greater syner-
gies, we suggest the following actions. Atten-
tion must focus on constructing and meeting a
new biodiversity target for the remaining MDG
period and beyond. The next target should be
more specifi c, similarly time-limited, reason-
ably achievable, and should address the con-
sequences of biodiversity loss globally and
for the most vulnerable people and societies.
It should be supported by a small set of indi-
cators ( 11) that measure trends in the state of
biodiversity and ecosystem services, drivers
of biodiversity loss and activities to safeguard
biodiversity.
We need evidence-based interventions that
can address both poverty reduction and envi-
ronmental sustainability. In agriculture, for
instance, we can use existing land more effi -
ciently; we can pursue development that pro-
tects or enhances biodiversity; and we can
improve productivity in ways that maintain eco-
system services, through institutional changes
to secure better access to seeds, markets, and
expertise, combined with adaptive applications
of technologies ( 12). Similarly, finance and
technology for adaptation, disaster manage-
ment, and reduced emissions from deforesta-
tion and forest degradation ( 13) are particularly
important in helping developing countries deal
with climate change.
Future projects should explicitly monitor
the impact poverty alleviation efforts have on
ecosystems and their services; similarly, con-
servationists must better document the impact
their interventions have on the poor. Ideally,
interdisciplinary science that helps to identify
the most cost-effective solutions will ensure
that future environment and development proj-
ects are implemented, not just simultaneously,
but in an integrated fashion.
Poverty alleviation and biodiversity agen-
das need to be jointly presented to policy-
makers. Establishment of a proposed Inter-
governmental Platform on Biodiversity and
Ecosystem Services to complement the exist-
ing Intergovernmental Panel on Climate
Biodiversity Conservation and the Millennium Development Goals
ECOLOGY
Jeffrey D. Sachs, 1* Jonathan E. M. Baillie, 2 William J. Sutherland, 3 Paul R. Armsworth, 4 Neville Ash, 5 John Beddington, 6 Tim M. Blackburn, 2 Ben Collen, 2 Barry Gardiner, 7 Kevin J. Gaston, 4 H. Charles J. Godfray, 8 Rhys E. Green, 3 ,9 Paul H. Harvey, 2,8 Brett House, 1 Sandra Knapp, 10 Noëlle F. Kümpel, 2 David W. Macdonald, 8 Georgina M. Mace, 11 James Mallet, 12 Adam Matthews, 13
Robert M. May, 8 Owen Petchey, 4 Andy Purvis, 6 Dilys Roe, 14 Kamran Safi , 2 Kerry Turner, 15 Matt Walpole, 16 Robert Watson, 15, 17 Kate E. Jones 2 †
Any near-term gains in reducing extreme
poverty will be maintained only if
environmental sustainability is also achieved.
10% quantiles
Thre
ate
ned
spec
ies
Poverty
Fig. 1. Map of poverty and potential biodiversity loss, showing the level of poverty (proxied by the log rate of human infant mortality) combined with the log number of threatened species of mammals, birds, and amphibians per one-degree grid square (Behrmann equal-area projection). White areas represent missing data. Data from ( 14) and ( 15).
*Full affiliations for all authors are provided online. †Author for correspondence. E-mail: [email protected]
1Columbia University. 2Zoological Society of London. 3Univer-sity of Cambridge. 4University of Sheffi eld. 5IUCN. 6Imperial College London. 7House of Commons, London. 8University of Oxford. 9Royal Society for The Protection of Birds. 10Natural History Museum London. 11Imperial College London. 12Univer-sity College London. 13GLOBE International, London. 14Inter-national Institute for Environment and Development, London. 15University East Anglia. 16United Nations Environment Pro-gramme World Conservation Monitoring Centre. 17Depart-ment for Environment, Food and Rural Affairs, London.
Published by AAAS
on
Sep
tem
ber
9, 2
011
ww
w.s
cien
cem
ag.o
rgD
ownl
oade
d fr
om

www.sciencemag.org SCIENCE VOL 325 18 SEPTEMBER 2009 1503
POLICYFORUM
Change may provide a means to enhance
the quality and timeliness of the inter actions
between scientists and policy-makers at
national scales and above. The GLOBE Inter-
national Commission on Land Use Change
and Ecosystems, made up of senior legisla-
tors from the G8+5 and several developing
countries, provides another opportunity to
bring policy-makers and scientists together.
Similar initiatives will also be needed at the
subnational scale.
The United Nations will convene a sum-
mit in 2010 to consider the second 5-year
review of the MDGs and to catalyze action
ahead of the 2015 MDG target year. We must
advise policy-makers and civil society organi-
zations on the most critical initiatives needed
to achieve the MDGs while preserving biodi-
versity and ecosystem services.
References and Notes 1. U.N. Millennium Project, Investing in Development: A
Practical Plan to Achieve the Millennium Development
Goals (Earthscan, New York, 2005).
2. G. M. Mace, H. Masundire, J. E. M. Baillie, in Ecosys-
tems and Human Well-Being: Current State and Trends:
Findings of the Condition and Trends Working Group
(Millennium Ecosystem Assessment Series, Island Press,
Washington, DC, vol. 1, 2005), chap. 4.
3. B. Collen et al., Conserv. Biol. 23, 317 (2009).
4. G. M. Mace, J. E. M. Baillie, Conserv. Biol. 21, 1406 (2007).
5. S. Dasgupta, B. Laplante, H. Wang, D. Wheeler, J. Econ.
Perspect. 16, 147 (2002).
6. P. Dasgupta, in Handbook of Environmental Economics:
Environmental Degradation and Institutional Responses,
K.-G. Maler, J. R. Vincent, Eds. (Elsevier, London, 2003),
pp. 192–240.
7. M. Q. Dao, J. Stud. Econ. Econometr. 32, 47 (2008).
8. J. D. Sachs, The End of Poverty: Economic Possibilities for
Our Time (Penguin, New York, 2005).
9. R. E. Green, S. J. Cornell, P. W. Scharlemann, A. Balmford,
Science 307, 550 (2005).
10. W. M. Adams, J. Hutton, Conserv. Soc. 5, 147 (2007).
11. M. Walpole et al., Science 325, 1503 (2009).
12. W. M. Adams et al., Science 306, 1146 (2004).
13. B. Strassburg, R. K. Turner, B. Fisher, R. Schaeffer, A.
Lovett, Glob. Environ. Change 19, 265 (2009).
14. Poverty maps, http://sedac.ciesin.columbia.edu/povmap.
15. R. Grenyer et al., Nature 444, 93 (2006).
10.1126/science.1175035
In response to global declines in biodiver-
sity, some 190 countries have pledged,
under the Convention on Biological
Diversity (CBD), to reduce the rate of bio-
diversity loss by 2010 ( 1, 2). Moreover, this
target has recently been incorporated into
the Millennium Development Goals in rec-
ognition of the impact of biodiversity loss on
human well-being ( 3). Timely information on
where and in what ways the target has or has
not been met, as well as the likely direction
of future trends, depends on a rigorous, rele-
vant, and comprehensive suite of biodiversity
indicators with which to track changes over
time, to assess the impacts of policy and man-
agement responses, and to identify priorities
for action. How far have we come in meeting
these needs, and is it suffi cient?
In 2006, the CBD adopted a framework
of 22 cross-disciplinary headline indicators
with which to measure progress toward the
target at a global level ( 4, 5). Countries are
being encouraged to report progress at the
national level using this framework, which
is also being applied in regional initiatives
such as “Streamlining European Biodiversity
Indicators” (SEBI 2010). Other global mul-
tilateral environmental agreements, includ-
ing the Ramsar Convention on Wetlands, the
Convention on Migratory Species, and the
Convention on International Trade in Endan-
gered Species of Wild Fauna and Flora, are
also adopting and adapting relevant subsets
of the indicators.
However, with 2010 fast approaching,
the indicator set is by no means complete.
This is unsurprising given the short time
since the framework was agreed upon. Of
the 22 headline indicators, 5 are not being
developed at a global scale, and there will
be none to measure the status of access and
benefi t sharing, one of the three objectives
of the CBD. The remainder has been sub-
divided into 29 actual measures, of which
only 9 can be considered well-developed,
with established methodologies, reasonable
global coverage (all continents except Ant-
arctica, tropical and temperate regions, and
developed and developing countries), and
suffi cient time-series data (at least three data
points spanning at least 10 years) to demon-
strate changes over time [( Table 1) and sup-
porting online material (SOM)].
Even for these well-developed global
indicators, there are challenges in terms
of data availability, consistency, and rele-
vance. Some indicators are only weak prox-
ies for biodiversity, because the urgent need
for indicators has often meant relying on
existing measures designed for purposes
other than tracking biodiversity change. For
example, forest cover may be an acceptable
proxy for timber stocks, but says less about
the condition of forest biodiversity. Like-
wise, protected area coverage signals gov-
ernment commitments but does not in itself
measure effectiveness in reducing biodiver-
sity loss. These subtleties are beginning to
be explored but require further effort.
Patchy data are another challenge, includ-
ing gaps in data submissions for indicators
compiled from national reports ( 6– 9) and
incomplete taxonomic and geographic cover-
age of indicators compiled directly from data.
The most well developed direct measures of
biodiversity are species indicators, such as the
IUCN Red List Index (RLI) ( 10) and the Living
Planet Index (LPI) ( 11). They are being used to
inform and underpin a variety of other indica-
Tracking Progress Toward the 2010 Biodiversity Target and Beyond
ECOLOGY
Matt Walpole, 1 * † Rosamunde E. A. Almond, 1 Charles Besançon, 1 Stuart H. M. Butchart, 2 Diarmid Campbell-Lendrum, 3 Geneviève M. Carr, 4 ,5 Ben Collen, 6 Linda Collette, 7 Nick C. Davidson, 8 Ehsan Dulloo, 9 Asghar M. Fazel, 1 James N. Galloway, 10 Michael Gill, 11 Tessa Goverse, 12 Marc Hockings, 13 Danna J. Leaman, 14 David H. W. Morgan, 15 Carmen Revenga, 16 Carrie J. Rickwood, 5, 17 Frederik Schutyser, 18 Sarah Simons, 19 Alison J. Stattersfi eld, 2 Tristan D. Tyrrell, 1 Jean-Christophe Vié, 20 Mark Zimsky 21
Biodiversity indicators used by policy-makers
are underdeveloped and underinvested.
*Full affi liations for all authors are provided online. †Author for correspondence. E-mail: [email protected]
1United Nations Environment Programme World Conservation Monitoring Centre (UNEP-WCMC). 2BirdLife International. 3Global Environmental Change, Public Health, and Environment, World Health Organization. 4Indian and Northern Affairs Canada. 5UNEP, Global Environment Monitoring System—Water. 6Institute of Zoology, Zoological Society of London. 7The Food and Agriculture Organization of the United Nations (FAO). 8Secretariat of the Ramsar Convention on Wetlands. 9Bio-versity International. 10Environmental Sciences Department, University of Virginia. 11Circumpolar Biodiversity Monitoring Program, Environment Canada. 12Division of Global Environment Facility Coordination, UNEP. 13School of Integrative Sys-tems, University of Queensland. 14International Union for Conservation of Nature–Species Survival Commission (IUCN-SSC) Medicinal Plant Specialist Group. 15Convention on International Trade in Endangered Species of Wild Fauna and Flora Sec-retariat. 16The Nature Conservancy. 17Natural Resources Canada. 18European Environment Agency. 19Global Invasive Species Programme. 20Species Programme, IUCN. 21Global Environment Facility.
Supporting Online Materialwww.sciencemag.org/cgi/content/full/325/5947/1502/DC1
Published by AAAS
on
Sep
tem
ber
9, 2
011
ww
w.s
cien
cem
ag.o
rgD
ownl
oade
d fr
om

18 SEPTEMBER 2009 VOL 325 SCIENCE www.sciencemag.org 1504
POLICYFORUM
tors (see SOM). Nevertheless, in the RLI, only
a small number of taxonomic groups have been
fully assessed, whereas, in the LPI, tropical
species are poorly represented ( 12). Efforts are
being made to improve representation in both
of these indicators, including through a sam-
pled RLI approach ( 13).
Information on genetic- or ecosystem-
level changes in biodiversity is much patch-
ier. Despite the promise of remote sensing
and the increasing quality and availability of
satellite imagery, translating this into mean-
ingful metrics of change for freshwater sys-
tems, drylands, coastal and marine habitats,
and other ecosystem types has proved chal-
lenging to date. Local and regional studies are
available ( 14), but they are yet to be applied
globally. Likewise, indicators of genetic
biodiversity are slowly being compiled for
domesticated and cultivated varieties but not
yet for wild relatives.
For the indicators that are under develop-
ment, the race is now on to ensure adequate
coverage and sufficient time-series data
by 2010. Although progress has undoubt-
edly been made, for some, such as trends in
genetic diversity and ecosystem fragmenta-
tion, a baseline and established methodology
may be the most that can be expected. Some
of these indicators require input from a range
of disciplines not traditionally associated with
biodiversity science, such as geophysics, eco-
nomics, sociology, anthropology, agronomy,
and health. The scientifi c community must be
encouraged to engage in the devel-
opment of these indicators and to
provide case studies demonstrat-
ing how and why biodiversity
losses have been reduced.
Whatever the indicators tell us,
it is widely held that the target can-
not and will not be achieved in its
entirety ( 16). Although the current
indicators will provide a partial
story about both achievements and
failures, there are gaps and missing
linkages in the framework that mean
it may not be suffi cient to commu-
nicate the urgency of the message,
to hold politicians to account, or to
inform them of how best to act.
In October 2010, the Confer-
ence of the Parties (COP) to the
CBD will review progress and
agree on a new set of targets and
a revised indicator framework.
Whatever shape these targets take,
the lessons for indicator develop-
ment are clear. Indicators must
be closely linked to the targets,
but also to each other. We believe
that a revised framework compris-
ing a small set of headline indica-
tors in four focal areas (pressures–
threats, status–trends, benefits–
services, and actions–responses)
with underlying measures that are
causally linked, will make it clearer
to policy-makers how biodiversity
loss affects people and how actions
to reduce threats make a difference.
Continued investment must be
made in the existing indicators to
improve taxonomic, geographic,
and temporal coverage, along-
side support to develop measures
at the fi ner (genetic) and broader
(ecosystem) scales. Indicators of
the biodiversity impacts of a wider range of
threats, including climate change, should be
incorporated. Critically, indicators must be
developed to fi ll a major gap regarding the
effect of biodiversity change on the provi-
sion of ecosystem services. A balance must
be found between developing too large and
confusing an array of individual measures
versus relying on a few aggregate indices
that appear compelling but that mask com-
plexity and can be misinterpreted. Quality-
control efforts are needed to ensure that indi-
cators are suffi ciently scientifi cally rigorous,
free of bias, and sensitive enough to detect
meaningful change ( 16).
Indicators cannot be developed in the
absence of reliable biodiversity data. System-
atic global biodiversity monitoring ( 17, 18)
would help, but this must be balanced with sig-
nifi cant indicator capacity development at the
national level. Better national indicators, devel-
oped as part of an inclusive international pro-
cess, will enable better global syntheses beyond
2010. The scientifi c community must engage
and encourage governments in this regard.
References and Notes 1. In 2002, the COP to the CBD agreed “to achieve by 2010
a signifi cant reduction of the current rate of biodiversity loss at global, regional, and national level as a contribu-tion to poverty alleviation and to the benefi t of all life on Earth” ( 2).
2. “Strategic Plan for the Convention on Biological Diversity” [Decision VI/26 of the COP to the CBD at the Sixth Meeting (COP 6), 2002]; available at www.cbd.int/decisions/.
3. Millennium Development Goals Indicators, http://unstats.un.org/unsd/mdg/Host.aspx?Content=Indicators/Offi cialList.htm.
4. A. Balmford et al., Science 307, 212 (2005). 5. “Framework for monitoring implementation of the achieve-
ment of the 2010 target and integration of targets into the thematic programmes of work” (Decision VIII/15, COP 8, 2006); available at www.cbd.int/decisions/.
6. G. M. Carr, C. J. Rickwood, Water Quality Index for Biodiversity Technical Development Document [UNEP Global Environment Monitoring System (GEMS) Water Programme, Gatineau, Canada, 2007].
7. E. B. S. Goldfi nger et al., The Ecological Footprint Atlas 2008 (Global Footprint Network, Oakland, CA, 2008).
8. FAO, Global Forest Resources Assessment 2005: Progress Towards Sustainable Forest Management (FAO, Rome, 2006).
9. UNEP-WCMC, State of the World’s Protected Areas: An Annual Review of Global Conservation Progress (UNEP-WCMC, Cambridge, 2008).
10. S. H. M. Butchart et al., PLoS One 2, e140 (2007). 11. J. Loh et al., Philos. Trans. R. Soc. London B Biol. Sci.
360, 289 (2005). 12. B. Collen et al., Conserv. Biol. 23, 317 (2009). 13. J. E. M. Baillie et al., Conserv. Lett 1, 18 (2008). 14. M. C. Hansen et al., Proc. Natl. Acad. Sci. U.S.A. 105,
9439 (2008). 15. CBD, Global Biodiversity Outlook 2 (Secretariat of the
CBD, Montreal, 2006). 16. G. M. Mace, J. E. M. Baillie, Conserv. Biol. 21, 1406
(2007). 17. R. J. Scholes et al., Science 321, 1044 (2008). 18. H. M. Pereira, H. D. Cooper, Trends Ecol. Evol. 21, 123
(2006).
Area under sustainable management
Proportion of products from sustainable sources
Ecological footprint and related concepts
Nitrogen deposition
Trends in invasive alien species
Marine Trophic Index
Water quality of freshwater ecosystems
Trophic integrity of other ecosystems
Connectivity/fragmentation of ecosystems
Human-induced ecosystem failure
Health and well-being of communities
Biodiversity for food and medicine
Linguistic diversity
Indigenous and traditional knowledge
Access and benefits sharing
Official development assistance
Technology transfer
Status of knowledge, innovations, and practices
Components of biodiversity
Biodiversity indicators
Sustainable use
Threats to biodiversity
Ecosystem integrity, goods and services
Status of access and benefits sharing
Status of resource transfers
Table 1. Current development of the headline biodiversity indi-
cators within the CBD framework. ■ Fully developed with well-established methodologies and global time-series data, ■ under development, and ■ not being developed. Multiple labels indicate multiple measures under each headline. See also SOM and 2010 Biodiversity Indicators Partnership, www.twentyten.net.
Supporting Online Materialwww.sciencemag.org/cgi/content/full/325/5947/1503/DC1
10.1126/science.1175466
Published by AAAS
on
Sep
tem
ber
9, 2
011
ww
w.s
cien
cem
ag.o
rgD
ownl
oade
d fr
om

This article was downloaded by: [Massachusetts Institute of Technology]On: 09 September 2011, At: 08:13Publisher: Taylor & FrancisInforma Ltd Registered in England and Wales Registered Number: 1072954 Registered office: Mortimer House,37-41 Mortimer Street, London W1T 3JH, UK
Systematics and BiodiversityPublication details, including instructions for authors and subscription information:http://www.tandfonline.com/loi/tsab20
Biodiversity and systematics: how have we fared in theInternational Year of Biodiversity?SANDRA KNAPP a & GEOFF BOXSHALL ba Department of Botany, The Natural History Museum, Cromwell Road, London, SW7 5BD,United Kingdomb Department of Zoology, The Natural History Museum, Cromwell Road, London, SW7 5BD,United Kingdom
Available online: 21 Dec 2010
To cite this article: SANDRA KNAPP & GEOFF BOXSHALL (2010): Biodiversity and systematics: how have we fared in theInternational Year of Biodiversity?, Systematics and Biodiversity, 8:4, 419-422
To link to this article: http://dx.doi.org/10.1080/14772000.2010.543008
PLEASE SCROLL DOWN FOR ARTICLE
Full terms and conditions of use: http://www.tandfonline.com/page/terms-and-conditions
This article may be used for research, teaching and private study purposes. Any substantial or systematicreproduction, re-distribution, re-selling, loan, sub-licensing, systematic supply or distribution in any form toanyone is expressly forbidden.
The publisher does not give any warranty express or implied or make any representation that the contentswill be complete or accurate or up to date. The accuracy of any instructions, formulae and drug doses shouldbe independently verified with primary sources. The publisher shall not be liable for any loss, actions, claims,proceedings, demand or costs or damages whatsoever or howsoever caused arising directly or indirectly inconnection with or arising out of the use of this material.

Systematics and Biodiversity (2010), 8(4): 419–422
Invited Perspective
Biodiversity and systematics: how have we fared in the InternationalYear of Biodiversity?
SANDRA KNAPP1 & GEOFF BOXSHALL2
1Department of Botany and 2Department of Zoology, The Natural History Museum, Cromwell Road, London SW7 5BD,United Kingdom
(Received 17 November 2010; accepted 19 November 2010)
The 2010 target to achieve a significant reduction in the current rate of loss of biodiversity at global, regional and nationallevels was not met. However, progress was made and the International Year of Biodiversity has kept biodiversity in thespotlight—illuminating our limited successes as well as the failures. Much has been learned from the process and the newgeneration of 2020 targets, agreed at Nagoya, includes a range of more focused practical goals as well as the longer-term,aspirational changes that need to take place. We recognise that there is a shift in thinking towards increasing themanagement of all ecosystems – “gardening the planet” – but we are concerned that the science of ecosystem managementis insufficiently developed to deliver. In particular, our knowledge of the components of biodiversity of many ecosystems,and of their interactions, is dangerously incomplete and for many natural systems we are ill-informed to make decisions ontheir management. Taxonomists must help to fill these gaps in the science underpinning the field of biodiversity andecosystem services. We welcome the proposed Intergovernmental Platform on Biodiversity and Ecosystem Services(IPBES) as a mechanism for integrating the relevant science, from taxonomy and ecology to earth system modelling. Itswork will likely be subject to intense scrutiny, just like the reports of the International Panel on Climate Change, and itsfocus must similarly always be on the evidence base and on the clarity and transparency of its arguments.
Key words: biodiversity, ecosystem management, targets, taxonomy
IntroductionActivities over the past year have focused minds, and hope-fully hearts, on the plight of the rest of life on Earth. TheInternational Year of Biodiversity (IYOB) coincided withthe date made explicit in the 2010 target agreed by Heads ofState in 2002 to “achieve, by 2010, a significant reduction ofthe current rate of biodiversity loss at the global, regionaland national levels as a contribution to poverty allevia-tion and to the benefit of all life on Earth.” Unfortunately,this target has not been met (Fisher, 2009; Walpole et al.,2009; Butchart et al., 2010), but considerable progress hasbeen made in some of the more detailed aspects inherentin such a broad ambition. For example, area of land inprotected areas has increased, and development assistancerelated to biodiversity has greatly improved (Secretariat ofthe Convention on Biological Diversity, 2010). The level ofattention being paid to conservation targets has greatly in-creased; individual regions have set their own targets, bothfor 2010 (Fontaine et al., 2007) and undoubtedly post-
Correspondence to: Sandra Knapp. E-mail: [email protected]
IYOB, beyond. At the CBD Conference of the Parties inNagoya, Japan, signatories assessed the extent to which the2010 biodiversity target was met, and set new targets for2020 as part of a strategic vision to 2050. If we concentrateon the target at the expense of biodiversity itself, we willhave missed our big chance, that is, to use this IYOB togenerate a truly sustained change of heart towards the restof life on Earth. Targets, while a feature of 21st century life,are not necessarily meant to be hit at the centre every time;they should be aspirational and challenging, we ought to becelebrating where things have gone right and progress hasbeen made. However, it is right to continue to be concernedabout biodiversity; it is central to achieving a range of othersocietal imperatives (Sachs et al., 2009).
The indicators associated with the 2010 target that wereconsidered not developed (i.e., failures) include key piecesof the ecological puzzle such as the trophic integrity ofecosystems (Walpole et al., 2009) and decline in extentof habitat (Secretariat of the Convention on BiologicalDiversity, 2010). Rockstrom et al. (2009) developed aconcept of “planetary boundaries” in which they identified
ISSN 1477-2000 print / 1478-0933 onlineC© 2010 The Natural History Museum
DOI: 10.1080/14772000.2010.543008
Dow
nloa
ded
by [
Mas
sach
uset
ts I
nstit
ute
of T
echn
olog
y] a
t 08:
13 0
9 Se
ptem
ber
2011

420 S. Knapp & G. Boxshall
aspects of Earth’s systems whose measurement could iden-tify parameters within which humanity could operate safely– within the boundaries. The three planetary boundaries al-ready transgressed by humanity are those involved withclimate change, nitrogen accumulation and biodiversity(Rockstrom et al., 2009). They suggested that biodiver-sity loss is both the least well-characterized and most likelyto have already entered into a zone where undesired systemchange cannot be excluded, in other words, we may havealready passed the tipping point. One reason that biodi-versity in their model is so unpredictable is that while thereal regulating role of biodiversity has been recognized ithas not yet been characterized in a quantitative way. Bio-diversity itself, the components which generate all of theservices of ecosystems that are essential for continued hu-man well-being (MEA, 2005), is not itself particularly wellcharacterized. It is telling that the indicators associated withthe 2010 target all depend upon a few taxa of vertebrates;this is not to say of course that vertebrates are not importantcomponents of the diversity of life on Earth, but the use andre-use of these same taxa bring with it some risk. Most oflife on Earth is invertebrate or micro-organismal by ordersof magnitude; do the patterns of threat, extinction and tra-jectory match those observed for vertebrates? We just don’tknow, but indications are that some of the correlates of riskobserved in vertebrates do not predict risk of extinction inflowering plants (V. Savolainen, pers. comm., 2010) and inEurope, listed protected species may not be those at mostrisk of extinction (Fontaine et al., 2007). It is clear that weneed more data across the Tree of Life with which to assesshow best to preserve its evolutionary potential.
Taxonomy and systematicsThis is where taxonomy and systematics come into theequation. Understanding of the species or populations withwhich we share the planet, comes from knowing what theyare, where they live and how they vary. With this baselineknowledge we can proceed to study population dynamics,or the effects of climate change. If ecosystem services are ablack box out of which flow benefits for humankind, then itis the microbes, plants and animals that are inside the boxthat generate the services. The sheer magnitude of the diver-sity of life, especially in invertebrates and micro-organisms,has in the past often caused paralysis and a sense of helpless-ness in those involved in describing and documenting thisdiversity, but new generations of tools have provided newanalytical approaches to studying functional diversity. Theother side of that coin is the feeling that the entire enterpriseis merely a listing exercise, tantamount to “fiddling whileRome burns”. Accelerating global taxonomy has been atopic of discussion for several years; most reviews have con-cluded that both speed and scale need radical change, justscaling up what was standard practice is not enough (EDIT,
2008). New technologies such as sequencing, both bar-coding (http://www.barcodeoflife.org/) and next-generationhigh-throughput sequencing, automated digital identifica-tion and bioinformatics have all had an effect on taxonomy.But at its core, taxonomy and systematics is partly aboutrecognizing units in nature, what we call species in eukary-otes; other aspects of taxonomy are focused on identifica-tion and the investigation of the evolutionary relationshipsof organisms, phylogeny (Godfray & Knapp, 2004). Over-all measures of diversity have long been used to assessthe health of ecosystems (Hector & Hooper, 2002); thesein general measure things like species richness or abun-dance without taking into account the identities of individ-ual species. For these indices, taxonomy might not reallymatter. But the identity of species does matter; Magurran &Henderson (2010) showed that taking into account speciesidentity rather than only species richness provides betterearly warning of impact over time. They suggest that newmodels tracking biodiversity change through time need toaccount for changing species composition (what the speciesactually are) as well as tracking changes in species abun-dance (how many species there are). The former is utterlydependent on good taxonomy, whether based on morphol-ogy or molecules.
Taxonomy and systematics have themselves been consid-ered under threat in the UK (House of Lords’ Select Com-mittee on Science and Technology, 2008), and were iden-tified as one of the critical skills gaps in a review of skillsrequirements in the environmental sector over the next tenyears, undertaken by the UK’s Environment Research Fun-ders’ Forum (ERFF, 2010). These skills were recognized ascrucial for “monitoring and understanding the functional-ity of the marine environments”, and for “recognising therole of biodiversity and ecosystem resilience in a changingclimate”. The critical shortage of same skills was also ap-parent in other areas highlighted by the review, includingfieldwork – where “survey skills including species identifi-cation” was a specific need, and Sustainability Science andPlanning – where “environmental impact assessment” wasa specific need. It appears that, at the very time when theimportance of biodiversity has been realised, our capabilityof describing and documenting it has been eroded to a crisispoint.
The futureSo what of the future? We have a new set of twenty key bio-diversity targets for 2020 agreed at Nagoya, which include:
� Cutting the rate of loss of natural habitats, such asforest, by at least 50%
� Restoring at least 15% of areas where biodiversity isclassified as degraded
� Increasing terrestrial nature reserves from 13% to 17%of the global land area
Dow
nloa
ded
by [
Mas
sach
uset
ts I
nstit
ute
of T
echn
olog
y] a
t 08:
13 0
9 Se
ptem
ber
2011

International Year of Biodiversity 421
� Increasing marine and coastal nature reserves from 1%to 10% of the global ocean.
� Preventing the extinction of threatened plant and ver-tebrate species
If achieved these practical targets should offer greaterprotection for natural systems, although as Agardy et al.(2003) point out, there is a danger that nature reserves(specifically marine protected areas) implemented withouta firm understanding of the underlying conservation sciencecan actually threaten bona fide progress in conservation. Asthese targets imply, there is a shift in thinking towards in-creasing the management of ecosystems – encapsulated inthe emergence of the “gardening the planet” concept. Giventhat all four of the scenarios developed by the MillenniumEcosystem Assessment to explore the possible futures ofecosystems predict loss of biodiversity, it is clear that thescience of ecosystem management does need to be devel-oped strongly in order to meet the growing demands forfood and energy, and to enhance the ability of ecosystemsto deliver multiple benefits (IAP, 2010).
Biodiversity agendaImproving knowledge of biodiversity will be central to thedevelopment of ecosystem management, but we will needto be transparent in acknowledging that there is a dualityat the heart of biodiversity research. There has long been abiodiversity conservation agenda, built on moral and eth-ical arguments, targeting the conservation of species andecosystems. A second biodiversity agenda has really grownout of the study of ecosystem functioning. As the Mil-lennium Ecosystem Assessment (MEA, 2005) articulatedso clearly, continued human well being is dependent uponthe provision of ecosystem services across all categoriesfrom supporting and regulating services, through culturalservices to the more obvious provisioning services. Theagenda that has crystallised strongly over the past decadehas been that biodiversity must be maintained and respon-sible stewardship practised because we are dependent on it;i.e., it is in our own direct self interest to maintain biodi-versity because it provides ecosystem services. This argu-ment, despite its inherently abstract quality has generatedconsiderable traction with policy makers. But can evolutioncontinue to occur in a totally managed system? It is worththinking about.
These two approaches to biodiversity are different. Theymay have overlapping or even shared goals at times, but it isimportant to maintain clarity and transparency in our artic-ulation of the issues surrounding biodiversity research. Theinconvenient fact is that key ecosystem services are oftenprovided by unnoticed, and probably unloved, organisms.Bacteria, for example, effectively run the nitrogen cycle.In the oceans, we now know that bacterial photosynthesiscan in certain areas contribute more to primary productivity
than typical green alga/chlorophyll based photosynthesis.Using metagenomics methods, Venter et al. (2004), for ex-ample, recorded hundreds of different bacterial rhodopsingenes in a cubic metre of Sargasso Sea water. These bacteriaare undetected by the chlorophyll-attuned remote sensorsthat measure oceanic primary productivity from satellites.Their abundance illustrates how relatively crude our earthsystem models still are. Key ecosystem services are oftenprovided by the least charismatic organisms and the argu-ment that functioning ecosystems must be protected can beharder to make than the need to conserve particular speciesor fragile systems. So there is a tendency to conflate thetwo core concepts: to conserve biodiversity because it isthe right thing (the moral/ethical approach) and to preserveecosystem functioning because we must (the self interestapproach). The planetary boundaries study of Rockstromet al. (2009) is an example. They identified the rate of bio-diversity loss as being beyond a critical threshold, notingthat its importance was due to its impact on many otherboundaries, such as Carbon storage, freshwater, Nitrogenand Phosphorus cycles and land systems. However, theyalso added “Massive loss of biodiversity unacceptable forethical reasons”. So, even when focusing on functioning ofthe earth system and using a semi-quantitative approach,biodiversity loss and its impact are considered using argu-ments marshalled both from the conservation and ecosys-tem services agendas.
ConclusionsScience-policy links in biodiversity and ecosystem servicesneed to be strengthened and one mechanism for achiev-ing this is the creation of the proposed IntergovernmentalPlatform on Biodiversity and Ecosystem Services (IPBES),modelled along the lines of the Intergovernmental Panel onClimate Change (IPCC). Lessons the IPBES must learnfrom the often rocky ride experienced by the reports of theIPCC, include the need to be absolutely clear in the pre-sentation of evidence, and to present clear and transparentarguments. The duality at the core of biodiversity sciencemakes this harder to achieve. It is equally important thatthe role of taxonomy and systematics in delivery of biodi-versity research is articulated with clarity and transparency.The legacy of the IYOB must include action in taxonomy:action to accelerate the task of documenting and describingthe components of biodiversity. Failure to ensure the conser-vation of a dynamic planet, with biota that are able to evolveand change, and with ecosystems that have resilience andadaptability, will move us closer to the fictional scenarioenvisaged by Adams (2010).
ReferencesADAMS, W.M. 2010. Conservation plc. Oryx 44, 482–484.
Dow
nloa
ded
by [
Mas
sach
uset
ts I
nstit
ute
of T
echn
olog
y] a
t 08:
13 0
9 Se
ptem
ber
2011

422 S. Knapp & G. Boxshall
AGARDY, T., BRIDGEWATER, P., CROSBY, M.P., DAY, J., DAYTON,P.K., KENCHINGTON, R, LAFFOLEY, D., MCCONNEY, P., MUR-RAY, P.A., PARKS, J.E. & PEAU, L. 2003. Dangerous targets?Unresolved issues and ideological clashes around marine pro-tected areas. Aquatic Conservation: Marine and FreshwaterEcosystems 14, 353–367.
BUTCHART, S.H.M., WALPOLE, M., COLLEN, B., VAN STRIEN,A., SCHARLEMANN, J.P.W., ALMOND, R.E.A., BAILLIE, J.E.M.,BOMHARD, B., BROWN, C., BRUNO, J., CARPENTER, K.E.,CARR, G.M., CHANSON, J., CHENERY, A.M., CSIRKE, J., DAVID-SON, N.C., DENTENER, F., FOSTER, M., GALLI, A., GALLOWAY,J.N., GENOVESI, P., GREGORY, R.D., HOCKINGS, M., KAPOS,V., LAMARQUE, J-F., LEVERINGTON, F., LOH, J.,. MCGEOCH,M.SA., MCRAE, L., MINASYAN, A., HERNANDEZ MORCILLO,M., OLDFIELD, T.E.F., PAULY, D., QUADER, S., REVENGA,C., SAUER, J.R., SKOLNIK, B., SPEAR, D., STANWELL-SMITH,D., STUART, S.N., SYMES, A., TIERNEY, M., TYRRELL, T.D.,VIE, J-C., & WATSON, R. 2010. Global Biodiversity: In-dicators of Recent Declines (2010). Science, 328, 1164–1168.
EDIT [EUROPEAN DIGITAL INSTITUTE OF TAXONOMY]. 2008. Tax-onomy in Europe in the 21st century. Unpublished re-port to the EDIT 4th BoD meeting, 25 January 2008,http://www.e-taxonomy.eu/files/Taxonomy21report.pdf [ac-cessed 19 November 2010].
ERFF [ENVIRONMENTAL RESEARCH FUNDERS’ FORUM]. 2010.Most Wanted. Skills Needs in the Environmental Sec-tor. ERFF Report 07. http://www.ukcds.org.uk/_assets/file/publications/ERFF-Most-Wanted-report.pdf [accessed 19November 2010].
FISHER, M. 2009. 2010 and all that – looking forward to bio-diversity conservation in 2010 and beyond. Oryx 43, 449–450.
FONTAINE, B., BOUCHET, P., VAN ACHTERBERG, K., ALONSO-ZARAZAGA, M.A., ARAUJO, R., ASPOCK, U., AUDISIO, P.,AUKEMA, B., BAILLY, N., BALSAMO, M., BANK, R.A.,BARNARD, P., BELFIORE, C., BOGDANOWICZ, W., BONGERS,T., BOXSHALL, G.A., BURCKHARDT, D., CAMICAS, J.L., CHY-LARECKI, P., CRUCITTI, P., DEHARVENG, L., DUBOIS, A.,ENGHOFF, H., FAUBEL, A., FOCHETTI, R., GARGOMINY, O.,GIBSON, D.I., GIBSON, R., GOMEZ LOPEZ, M.S., GOUJET, D.,HARVEY, M.S., HELLER, K.-G., VAN HELSDINGEN, P., HOCH, H.,DE JONG, H., DE JONG, Y., KARSHOLT, O., LOS, W., LUNDQVIST,L., MAGOWSKI, W., MANCONI, R., MARTENS, J., MASSARD, J.A.,MASSARD-GEIMER, G., MCINNES, S.J., MENDES, L.F., MEY, E.,MICHELSEN, V., MINELLI, A., NIELSEN, C., NIETO NAFRIA, J.M.,VAN NIEUKERKEN, E., NOYES, J., PAPE, T., POHL, H., DE PRINS,W., RICCI, C., ROSELAAR, C., ROTA, E., SCHMIDT-RHAESA, A.,SEGERS, H., ZUR STRASSEN, R., SZEPTYCKI, A., THIBAUD, J.-M.,THOMAS, A., TIMM, T., VAN TOL, J., VERVOORT, W. & WILL-MANN, R. 2007. The European Union’s 2010 target: Puttingrare species in focus. Biological Conservation 139, 167–185.
GODFRAY, H.C.J. & KNAPP, S. 2004. Introduction, Taxonomy forthe 21st century. Philosophical Transactions of the Royal So-ciety, B, 359, 559–569.
HECTOR, A. & HOOPER, R. 2002. Darwin and the first ecologicalexperiment. Science 295, 639–640.
HOUSE OF LORDS’ SELECT COMMITTEE ON SCIENCE AND TECH-NOLOGY. 2008. Systematics and Taxonomy Followup: Reportwith Evidence. 5th report (2007–08) (HL Paper 162). TheStationery Office Limited, London.
IAP [THE INTERACADEMY PANEL ON INTERNATIONAL ISSUES].2010. Communique of the InterAcademy Panel on Biodiver-sity Conference 13–14 January 2010. http://royalsociety.org/Communique-of-the-IAP-Biodiversity-Conference/ [acces-sed 19 November 2010].
MAGURRAN, A. & HENDERSON, P.A. 2010. Temporal turnover andthe maintenance of diversity in ecological assemblages. Philo-sophical Transactions of the Royal Society, B 365, 3611–3620.
MEA [MILLENNIUM ECOSYSTEM ASSESSMENT]. Biodiversity Syn-thesis Report, 2005. http://www.maweb.org/ [accessed 19November 2010].
ROCKSTROM, J., STEFFEN, W., NOONE, K., PERSSON, A., CHAPIN,F.S. III, LAMBIN, E. LENTON, T.M., SCHEFFER, M., FOLKE, C.,SCHNELLNHUBER, H.J., NYKVIST, B., de WIT, C.A., HUGHES,T., VAN DER LEEUW, S., RODHE, H., SORLIN, S., SYNDER,P.K., COSTANZA, P., SVEDIN, U., FALKENMARK, M., KARL-BERG, L., CORELL, R.W., FABRY, V.J., JANSEN, J., WALKER,B., LIVERMAN, D., RICHARDSON, K., CRUTZEN, P. & FO-LEY, J. 2009. Planetary boundaries: exploring the safeoperating space for humanity. Ecology and Society 14,32 http://www.ecologyandsociety.org/vol14/iss2/art32/ [ac-cessed 19 November 2010].
SACHS, J.D., BAILLIE, J.E.M., SUTHERLAND, W.J., ARMSWORTH, P.R.,ASH, N., BEDDINGTON, J., BLACKBURN, T.M., COLLEN, B., GAR-DINER, B., GASTON, K.J., GODFRAY, H.C.J., GREEN, R.E., HAR-VEY, P.H., HOUSE, B., KNAPP, S., KUMPEL, N.F., MACDON-ALD, D.W., MACE, G.M., MALLET, J., MATTHEWS, A., MAY,R.M., PETCHEY, O., PURVIS, A., ROE, D., SAFI, K., TURNER,K., WALPOLE, M., WATSON, R. & JONES, K.E. 2009. Biodi-versity conservation and the Millennium Development Goals.Science 325, 1502–1503.
SECRETARIAT OF THE CONVENTION ON BIOLOGICAL DIVERSITY.2010. Global Biodiversity Outlook 3. Montreal, Canada.
VENTER, J.C., REMINGTON, K., HEIDELBERG, J.F., HALPERN, A.L.,RUSCH, D., EISEN, J.A., WU, D., PAULSEN, I., NELSON, K.E.,NELSON, W., FOUTS, D.E., LEVY, S., KNAP, A.H., LOMAS,M.W., NEALSON, K., WHITE, O., PETERSON, J., HOFFMAN, J.,PARSONS, R., BADEN-TILLSON, H., PFANNKOCH, C., ROGERS,Y. & SMITH, H.O. 2004. Environmental genome shotgunsequencing of the Sargasso Sea. Science 304, 66–74. doi:10011226/science.1093857
WALPOLE, M., ALMOND, R.E.A., BESANCON, C., BUTCHART,S.H.M., CAMPBELL-LENDRUM, D., CARR, G.M., COLLEN, B.,COLLETTE, L., DAVIDSON, N.C., DULLOO, E., FAZEL, A.M.,GALLOWAY, J.N., GILL, M., GOVERSE, T., HOCKINGS, M., LEA-MAN, D.J., MORGAN, D.H.W., REVENGA, C., RICKWOOD, C.J.,SCHUTYSER, F., SIMONS, S.,. STATTERSFIELD, A.J., TYRRELL,T.D., VIE, J-C., & ZIMSKY, M. 2009. Tracking progress to-ward the 2010 biodiversity target and beyond. Science 325,1503–1504.
Dow
nloa
ded
by [
Mas
sach
uset
ts I
nstit
ute
of T
echn
olog
y] a
t 08:
13 0
9 Se
ptem
ber
2011

437
© The Ecological Society of America wwwwww..ffrroonnttiieerrssiinneeccoollooggyy..oorrgg
The mass extinction of species currently underway hasgenerated concern for many reasons, ranging from
aesthetic and spiritual to purely commercial. But from theutilitarian perspective that underpins most policy, per-haps the most important concerns involve the potentialconsequences of species loss for the continued function-ing of ecosystems and the services they provide tohumanity. This recognition stimulated a rapid growth ofresearch on links between biodiversity and ecosystemfunctioning (BEF) over the past decade. These studieshave generated continuing controversy (eg Huston 1997;Wardle et al. 2000; Leps 2004), leading some reviewers toconclude that the results of BEF experiments are too vari-able to draw general conclusions (Giller et al. 2004;Thompson and Starzomski 2007). The latter concern hasnow been largely resolved by two comprehensive meta-
analyses that examined the results of over 100 experi-ments and > 400 measures of biodiversity effects(Balvanera et al. 2006; Cardinale et al. 2006). Theseanalyses revealed evidence that mixtures of species pro-duce more biomass and use more resources, on average,than do single species. This pattern is surprisingly consis-tent across taxa, trophic levels, and habitats. Even withinmore realistic, multilevel food webs, experiments showthat biodiversity tends to have predictable effects, withprey diversity generally supporting higher predatorgrowth, but lower predator impact on total prey biomass(Duffy et al. 2007).
BEF research has often been justified in the context ofunderstanding the consequences of looming extinctionfor human welfare. However, in practice, most researchhas been more narrowly focused, employing small-scale,highly controlled experiments with designs whose rele-vance to natural ecosystems and realistic extinction sce-narios is often unclear. For these reasons, research on BEFlinks has persistently been criticized, suggesting to someauthors that invoking BEF relationships to justify biodi-versity conservation may be misleading or counterpro-ductive (Wardle 1999; Srivastava and Vellend 2005;Thompson and Starzomski 2007). In this paper, I arguethat many of these criticisms are overstated, and that theexperimental evidence for BEF is generally consistentand has important practical implications for conservationand management.
As others have emphasized elsewhere (eg Srivastavaand Vellend 2005), discussions of BEF research havesometimes confused scientific concepts (functioning)with value or normative judgments (services). I distin-guish an ecosystem property as any aggregate structuralvariable, ie a measure of the current state of the system,
CONCEPTS AND QUESTIONS
Why biodiversity is important to thefunctioning of real-world ecosystems JJ EEmmmmeetttt DDuuffffyy
Controlled experiments have substantially advanced our understanding of the links between changingbiodiversity and ecosystem functioning (BEF) in recent years. However, controversy continues regardingthe relevance of BEF experiments to the complex ecosystems and large spatial and temporal scales ofinterest in conservation and management. Here, I address some of the persistent criticisms regardingexperimental BEF research and argue that these have been overstated. Contrary to some suggestions,many putative artifacts attributed to experiments render their conclusions about BEF links stronger,rather than weaker. Like other broad ecological concepts, BEF focuses on general patterns, rather thanlooking at species-level, applied conservation problems. Nevertheless, insights from BEF experiments con-ducted to date are likely to underestimate, rather than overestimate, the importance of biodiversity toecosystem functioning and the provision of ecosystem services in the real world. These experiments sug-gest that managing ecosystems to promote biodiversity can have important practical benefits.
Front Ecol Environ 2009; 7(8): 437–444, doi:10.1890/070195 (published online 27 Aug 2008)
Virginia Institute of Marine Science, The College of William andMary, Gloucester Point, VA ([email protected])
IInn aa nnuuttsshheellll::• The dominant influence of individual species (compared with
diverse communities) on ecosystem functioning in experimen-tal settings is largely an artifact of their simplified environ-ments and the single response variables considered
• As a result, experiments have probably underestimated theimportance of biodiversity to real-world ecosystem functioning
• Suggested discrepancies between diversity–productivity rela-tionships in nature versus those in experiments are largelyillusory, and stem from the bidirectional influence betweenproductivity (potential or realized) and diversity
• Several lines of evidence indicate that maintaining multipleecosystem services over time in a changing world is enhancedby high local and regional diversity

Biodiversity and ecosystems JE Duffy
438
wwwwww..ffrroonnttiieerrssiinneeccoollooggyy..oorrgg © The Ecological Society of America
such as biomass or soil nitrogen content, and an ecosys-tem function as any aggregate process, such as production,respiration, or grazing rate. The sign, whether positive ornegative, and the magnitude of these variables are nei-ther “good” nor “bad”. In contrast, an ecosystem service isa process considered to have some, necessarily subjective,value to humanity. Thus, a diversity-mediated increase inthe ecosystem function of primary production can beconsidered either a service (eg a crop, or the foundationspecies of a valued ecosystem) or a disservice (eg aeutrophic water body). For the sake of clarity, I refer tochanges in any of these aggregate ecosystem variables asecosystem responses. Most BEF experiments and theoryhave focused on species richness as the metric of biodi-versity, so I follow that usage here, although a growingbody of evidence suggests that the influence of biodiver-sity on ecosystem functioning is broadly similar acrosslevels of organization.
� Responses to some criticisms of BEF research
Criticism 1: Most BEF relationships result fromstatistical sampling effects, rather than from“true” effects of diversity
In experiments, diverse mixtures of species can showhigher productivity than the average single-species plot,simply because they are more likely to contain the onespecies that grows best under local conditions, if thatspecies then comes to dominate the plot. This statisticalphenomenon has been termed the “sampling effect”(Huston 1997; Tilman et al. 1997). Since, under thishypothesis, functioning is dominated by a single species,it has been considered an artifact, rather than a “true”effect of diversity (Huston 1997; Wardle 1999). From aconservation perspective, even BEF relationships thatcan be explained by this sampling mechanism are impor-tant in showing that species loss can substantially changenormal ecosystem functioning (Srivastava 2002). But thequestion remains: is the sampling effect in fact commonand important? Meta-analysis of 111 experiments con-firmed that diverse mixtures of species rarely producedmore biomass than the most productive single species(Cardinale et al. 2006), a result superficially consistentwith the sampling effect.
However, three points caution against accepting thisinterpretation at face value. First, the failure of polycul-tures to outperform the best monoculture can result notonly from the sampling effect, but also from a combina-tion of positive complementarity (ie resource partition-ing or facilitation) and negative selection effects (ie dom-inance by a poor performer; Loreau and Hector 2001). Infact, experiments with both terrestrial (Hector et al.2002; Hooper and Dukes 2004) and marine (Bruno et al.2005) plants found that the failure of diverse assemblagesto outperform the best monoculture was indeed due to acombination of negative selection and complementarity,
not to the sampling effect. Although this may seem anarcane distinction, it is fundamentally important becausethis interaction of selection and complementarity allowsmultiple species to coexist in the community, whereas inthe classical sampling effect model (Huston 1997; Tilmanet al. 1997), the single best-performing species outcom-petes the others, which eventually results in a monocul-ture. The second point is that the complementaryresource use that underlies BEF relationships is predictedto emerge over time (Pacala and Tilman 2002), yet manyexperiments have not run for long enough to see comple-mentarity become important. Those that have done so(Tilman et al. 2001; Hooper and Dukes 2004; Stachowiczet al. 2008) found that, over time, the BEF relationshipand the importance of complementarity become stronger,and that the number of species required to maximizefunction increases. These general patterns are confirmedby a recent meta-analysis of 44 experiments (Cardinale etal. 2007; Figure 1). Third, and finally, the sampling effectimplicitly focuses on a single response variable, typicallyplant biomass accumulation. In the context of manage-ment and conservation, we are interested in ecosystemsthat perform multiple functions and services. Even incases where a single species dominates a given ecosystemprocess, it is unlikely to dominate all of the processes ofinterest. Indeed, simulations of empirical data show that,as the number of ecosystem processes we considerincreases, redundancy among species decreases and therelationship between species richness and (multivariate)ecosystem functioning grows stronger (Petchey andGaston 2002b). Recent BEF experiments support thisprediction, showing that, even where particular speciesmonocultures can match diverse mixtures for individualecosystem processes, different species maximize differentecosystem properties. The result is that only the diversemixture maximizes multiple properties simultaneously, aphenomenon termed “multivariate complementarity”(Duffy et al. 2003; Bracken and Stachowicz 2006; Hectorand Bagchi 2007; Gamfeldt et al. 2008; Figure 2). Theseconsiderations show that, from the perspective of main-taining integrity of multifunctional ecosystems, theclassical argument about the sampling effect in BEFexperiments is a red herring, arising from a narrow focuson single response variables and short-term experiments.Maintenance of the multiple functions provided by real,complex ecosystems requires multiple species.
Criticism 2: BEF relationships usually reach anasymptote at very low species richness
Arguments for the functional importance of biodiversityseem incompatible with the common finding that, inexperiments, ecosystem function typically saturates at aspecies richness much lower than that found in nature(Schwartz et al. 2000). The probable reason for this isthat ecosystem processes tend to be most strongly influ-enced by dominant species (Grime 1998; Polley et al.

JE Duffy Biodiversity and ecosystems
439
© The Ecological Society of America wwwwww..ffrroonnttiieerrssiinneeccoollooggyy..oorrgg
2007). An obvious conclusion would be thatvery few species are needed to maintain nor-mal ecosystem functioning, but recentresearch shows that this conclusion is unjus-tified for several reasons. First, as the previ-ous section showed, the short durations ofmany previous experiments probably pre-cluded expression of diversity effects.Second, and perhaps more importantly,nearly all BEF experiments to date havefocused on a single response variable at atime. But, as discussed above, even wheresampling might explain individual ecosys-tem responses, different species can domi-nate different ecosystem response variables,so maintaining multiple functions requiresmore species (Figure 2). Third, most experi-ments have been conducted in small plots,under highly controlled, homogenized con-ditions, yet theory predicts that the influ-ence of diversity increases in heterogeneousenvironments or landscapes (Tilman et al.1997; Cardinale et al. 2000; Loreau et al.2003). Recent evidence from several wild,non-experimental systems supports this pre-diction (Tylianakis et al. 2008; Figures 3, 4).More generally, there is considerable evi-dence that rare species can make importantcontributions to ecosystem processes underchanging conditions (Lyons et al. 2005).Finally, because of the well-documentedrelationship between species richness andarea, maintenance of a given level of diver-sity at the local (plot) level depends on aconsiderably higher regional diversity. Thus,maintaining a given level of local speciesrichness requires conserving a larger numberof species at the regional scale. All of theseconsiderations suggest that the apparent sat-uration of ecosystem function at low speciesrichness is largely an artifact of the homoge-neous conditions, short time scales, small plot sizes, andnarrow focus of experiments conducted to date. Again,the conclusion is that experiments have underestimated,not overestimated, the importance of biodiversity to thefunctioning of real, complex ecosystems.
Criticism 3: Experimental diversity gradients bear noresemblance to real-world extinction scenarios
The artificiality of random assembly in BEF experimentshas been noted repeatedly (eg Huston 1997; Srivastava2002; Giller et al. 2004; Leps 2004). Random assemblydesigns were used in many early BEF experiments,because they avoid confounding the effects of speciesrichness – the object of most such experiments – with theeffects of species composition. Although the first genera-
tion of BEF experiments required these designs to sepa-rate richness and complementarity effects (Huston 1997),it has long been recognized that random assembly tradesoff realism for this precision in interpretation. To remedythis, researchers have used theory (Gross and Cardinale2005), simulations (Petchey and Gaston 2002a; Ostfeldand LoGiudice 2003; Solan et al. 2004), and experiments(Jonsson et al. 2002; Zavaleta and Hulvey 2004) toexplore effects of non-random loss scenarios. These stud-ies confirm the intuitive expectation that order of lossaffects ecosystem responses, and most show more specifi-cally that realistic extinction orders have larger effects onecosystem responses than do random loss sequences.Thus, if existing experimental results can be generalized,they suggest that random loss designs underestimate theecosystem consequences of diversity loss. Again, conclu-
FFiigguurree 11.. The importance of biodiversity and complementary resource use to plantproductivity increases with time. (a) In a grassland experiment, both the magnitudeof the diversity effect on primary production (upper panel) and the relativeimportance of complementarity (lower panel) increased through time; colored linesand numbers indicate the number of years after beginning of the experiment (± SE;after Tilman et al. 2001). (b) Similarly, in a marine intertidal experiment, en-hancement of biomass accumulation by seaweed diversity increased as theexperiment matured from 3 months to 3 years (± SE; Stachowicz et al. 2008).(c) Quantitative meta-analysis confirms that these examples are not atypical. Among44 experiments, both the net effect of species richness on production (upper panel)and the magnitude of the diversity effect relative to the most productive monoculture(lower panel) increased with time (adapted from Cardinale et al. 2007).
(a)
(b)
(c)
1.2
0.8
0.4
0
Tota
l bio
mas
s
60
40
20
0% p
lots
with
bio
mas
s>
bes
t m
ono
cultu
re2 4 8 16
Number of species
2
1
0
–1Net
div
ersi
ty e
ffec
t
41
0
–1
–2
Tran
sgre
ssiv
eo
very
ield
ing
4 5 6 7 8Experimental duration (days)
160
140
120
100
80
60
40Sea
wee
d %
co
ver
3 months 15 months 27 months 36 months
1 4 1 4 1 4 1 4Number of species

Biodiversity and ecosystems JE Duffy
440
wwwwww..ffrroonnttiieerrssiinneeccoollooggyy..oorrgg © The Ecological Society of America
sions about the functional consequences of diversity lossfrom random assembly experiments appear conservative.
Criticism 4: Diversity may enhance productivity inexperiments, but the opposite pattern is found innature
It has been suggested by some authors that the frequentlynegative relationship between resource availability (“pro-ductivity”) and plant diversity in nature contradicts theresults of BEF experiments (Huston 1997; Wardle et al.2000). However, others have shown that this contradic-tion is illusory, stemming from conflation of two distinctphenomena that are both referred to as “productivity”.The apparent discrepancy can be explained by the factthat relationships between species diversity and “produc-tivity” are bidirectional (Loreau et al. 2001). Within-habitat diversity generally increases as resource availabil-ity (productivity potential) rises from low to moderatelevels, because the more favorable environment allowsspecies to persist that could not do so with less abundantresources. However, as resources increase in abundance,intensifying competition reduces diversity, illustratingthe “paradox of enrichment”. Thus, cross-site compar-isons over the higher end of this resource availabilityrange often show negative relationships between envi-ronmental “productivity” (eg nutrient supply) and plantdiversity (reviewed by Huston 1997). Such comparisons
consider a gradient in the abiotic environment andassume implicitly that a large regional pool of species isavailable to colonize all sites. In this situation, oneexpects a negative correlation between aggregate bio-mass, which reflects carrying capacity and local diversity.However, this relationship occurs because variance inresource availability (environmental “productivity”) isdetermining diversity, rather than vice versa.
In contrast, BEF experiments seek implicitly to addressthe opposite phenomenon, the consequences of global orregional species loss from a system in which resources andthe abiotic environment are held constant. Thus, surveysand experiments test different causal directions of thebiodiversity–productivity relationship. Surveys of unma-nipulated systems test how local diversity responds tochanging resource availability (“productivity”), whereasexperiments test how productivity (biomass productionper unit time) responds to changing species diversity.Importantly, the two phenomena are not mutually exclu-sive: at any given site along a resource gradient, resourceavailability will determine which, and how many, speciesfrom the available pool persist in the community (iediversity). However, as theory and experiments show, theactual production of plant biomass at that site is likely tobe lower when the pool of species available to colonize itis reduced (Loreau et al. 2001). Thus, the patterns innature and in experiments are not contradictory.Moreover, the apparent discrepancy between experi-
FFiigguurree 22.. Multifunctional ecosystems require many species. (a) In experimental seagrass systems, different herbivore speciesmaximized different ecosystem properties, but only the diverse assemblage containing all species (black) maximized all simultaneously(± SE; data from Duffy et al. 2003). (b) In grassland experiments, the number of species required to maximize ecosystemfunctioning increased with the number of ecosystem processes considered (modified from Hector and Bagchi 2007). (c) Similarly, ina seaweed assemblage, uptake of individual nutrients was predictable by summing contributions of individual species (predicted= measured), whereas total nitrogen uptake (NH4
+ + NO3–) was greater than predicted from individual species contributions
(± SE; modified from Bracken and Stachowicz 2006).
(a) (b)
2˚ production
Grazing impact
1.5
0
Her
biv
ore
bio
mas
s (g
)
10
0
Alg
alb
iom
ass
(g)
Sed’t C storage
0.2
0
�g
g s
edim
ent–1
Bitt
ium
Am
pith
oe
Dul
ichi
ella
Eri
chso
nella
Gam
mar
us
Ido
tea
6 sp
p
Num
ber
of
spec
ies
20
15
10
5
0
2 4 6
Number ofecosystem processes
(c)
N u
pta
ke c
oef
fieci
ent
(L h
–1g
–1)
0.15
0.030.15
0.030.16
0.03
NH4+
NO3–
NH4+ + NO3
–
Predicted Measured

JE Duffy Biodiversity and ecosystems
ments and field patterns for land plants is not seen insome marine benthic systems, where the greater impactsof diverse assemblages on invaders and on prey are consis-tent with patterns in the field (Stachowicz et al. 2002;Byrnes et al. 2006; see also Figure 3).
Criticism 5: Biodiversity effects, when present, areprobably minor as compared with resource supplyand other drivers of ecosystem processes
At regional or continental scales, plant production isclosely correlated with resource availability. How muchextra variance, if any, is explained by plant diversity? Fewexperiments have explicitly compared the quantitativeimportance of changing diversity within trophic levels tothat of nutrient loading, cascading predator effects, andother factors. The few that have done so suggest thatchanging biodiversity within trophic levels can be ofcomparable importance to realistic ranges of bottom-upand top-down forcing. In the most comprehensive exam-ple, changing species richness of herbivorous pond snailshad comparable or greater effects on a range of ecosystemprocesses than did a fourfold change in nutrient supply orexclusion of predators (Wojdak 2005). Experiments inseagrass ecosystems showed similar results; effects ofchanging herbivore diversity were comparable in magni-tude to those of cascading predator effects (Duffy et al.2005) and often greater than those of changing lightavailability or seasonal forcing (Spivak et al. 2007; Duffyet al. unpublished data). Earlier experiments that manipu-lated both nutrients and plant diversity (Fridley 2002)concluded that nutrient effects overwhelmed diversityeffects, but used large ranges in nutrient supply and rela-tively modest ranges in diversity. Again, cases where fieldpatterns and experimental results are concordant(Stachowicz et al. 2002; Byrnes et al. 2006) further sup-port the importance of diversity in some real ecosystems.Thus, the few available experimental data suggest thatchanging diversity within trophic levels has non-trivialconsequences, even within the context of dynamicecosystems impacted by other factors.
Criticism 6: Effects of declining biodiversity onecosystem functioning are indirect and weakerthan direct impacts of habitat destruction
This is a compelling argument for terrestrial systems,where habitat destruction is the major threat to ecosys-tems (Srivastava 2002; Srivastava and Vellend 2005). Itarguably carries less weight in the oceans, where thegreatest threat to biodiversity is direct overharvesting(Figure 5). Even on land, this argument applies more toshort-term than to long-term effects of biodiversity loss.Clearly, habitat destruction, which involves both biodi-versity loss and abiotic habitat alteration, will usuallyhave stronger impacts on ecological processes than willspecies loss alone. And, in practice, focusing conserva-
tion effort on protecting habitat is likely to conserve bothbiodiversity per se and the abiotic and structural compo-nents necessary to sustain it. Nevertheless, biodiversityloss remains uniquely important because, within limits,
441
© The Ecological Society of America wwwwww..ffrroonnttiieerrssiinneeccoollooggyy..oorrgg
FFiigguurree 33.. The influence of biodiversity on ecosystem processesincreases with environmental heterogeneity in wild, non-experimental systems. More spatially heterogeneousenvironments exhibit stronger relationships between (a) plantrichness and plant biomass production in a European grassland;(b) natural enemy richness and rates of parasitism on wasps incoastal Ecuador; and (c) wild bee richness and pollinationeffectiveness on coffee plantations in Indonesia. In each panel,data are divided into three classes of environmentalheterogeneity: low (blue symbols, dotted line), medium (redsymbols, dashed line), and high (green symbols, solid line). AfterTylianakis et al. (2008).
1500
1000
500
08 16 24
Plant species richness
Bel
ow
gro
und
bio
mas
sP
aras
itism
rat
e
0.6
0.3
01 2 3
Parasitoid species richness
Po
llina
tion
ben
efit
40
20
0
2 12 20
Bee species richness
(a)
(b)
(c)

Biodiversity and ecosystems JE Duffy
degraded habitats can potentially be restored, whereasextinction of species is permanent. In Costa Rica, forexample, forest cover had declined by 80% before recla-mation and tree planting brought it back above 50%. Yet,any species lost to extinction during that deforestationcannot be reclaimed. Thus, over the long term and acrosssystems, conserving species is probably as important aspreventing habitat loss.
� Conclusions
Experimental BEF research has now matured sufficientlyto allow us to conclude with some confidence that, onaverage, higher species richness increases biomass accu-
mulation and resource use within trophic levels, anddecreases variance in those responses through time. Inmany cases, these effects on structure and functioningalso have implications for ecosystem services of value tohumanity. Although the real-world implications of thisBEF research have often been questioned, the issues con-sidered here suggest that experimental results generallyunderestimate the influence of biodiversity on function-ing of complex ecosystems and, thus, are conservative.Maintenance of the multiple ecosystem services that sup-port society over extended time scales in a changingworld will probably require a much greater number ofspecies than are typically used in BEF experiments. Thus,management to conserve biodiversity should often pro-
442
wwwwww..ffrroonnttiieerrssiinneeccoollooggyy..oorrgg © The Ecological Society of America
(a) (b)
FFiigguurree 44.. Examples in which species or genetic diversity have been shown to enhance important ecosystem services in the real world.(a) Crop pollination is often more effective in areas with higher native bee diversity (Klein et al. 2003). The picture shows the nativebee Andrena cerasifolii visiting an almond flower in California. (b) Harvest of salmon in Alaska has been relatively stable overrecent decades, despite strong fluctuations in individual stocks, because ecologically differentiated stocks respond differently to climatechange and other environmental variation (Hilborn et al. 2003).
©A
-M K
lein
©A
lask
a S
eafo
od M
arke
ting
Inst
itute
FFiigguurree 55.. Drivers of environmental change differ amongsystems, with implications for how biodiversity affects ecosystemprocesses. (a) In terrestrial systems, such as Southeast Asianrainforests, habitat loss and degradation drive changes inecosystem processes both directly and indirectly, through theirimpacts on biodiversity. (b) In the ocean, overharvesting is apervasive human impact and is likely to influence ecosystemfunctioning indirectly, through the changing interactions thatstem from loss or ecological extinction of species.
(a) (b)

JE Duffy Biodiversity and ecosystems
vide utilitarian benefits, which serve as one among theseveral rationales for conservation. Palumbi et al. (2009)have made essentially the same case in the context ofimplementing ecosystem-based management (EBM) ofmarine fisheries. EBM has been federally mandated, inpart because of frequent failure of, and conflict involvedin, management efforts focusing on single fishery species.Palumbi et al. argue that ecosystems are so complex thatwe will rarely understand their workings mechanistically,so that maintenance of biodiversity may serve as a usefulproxy for a system state that supplies the multiple ecosys-tem services of interest. Thus, managing to maximize bio-logical diversity (however defined) may be a workableway to ensure long-term maintenance of an acceptablebalance among the sometimes competing demands forvarious ecosystem services. This is an example where abroad-brush approach, informed by BEF research, mayactually prove more effective in conservation than onebased on the biology of individual species. Clearly, man-aging for biodiversity is not a substitute for identifyingkey ecosystem service providers, community interactions,and environmental drivers within particular systems(Kremen 2005). However, by providing a conceptualframework based on general principles, it can provide acomplementary approach.
Previous research and controversies offer severalpoints of guidance for future work and application. Oneway to make BEF research more realistic and applicableis to focus on key traits of organisms – specifically, thecovariance between traits that predispose species toextinction and traits that influence ecosystem proper-ties (Gross and Cardinale 2005). There is a growingbody of empirical data on extinction sequences andextinction traits (eg Purvis et al. 2000; Dulvy et al. 2004)and a growing interest in how traits influence vitalecosystem processes. An important step involves unit-ing these bodies of knowledge with community ecologi-cal theory to build predictive models of how realisticextinction scenarios will influence ecosystem processesand services (Srivastava 2002; Kremen 2005). Since oneof the most consistent extinction predictors is hightrophic level, practical application of BEF research willalso require a more intensive focus on effects of chang-ing diversity in multitrophic systems (Duffy et al. 2007).In the meantime, we have learned enough from theoryand experiments about how biodiversity affects ecosys-tem functioning to justify a general goal of conservingbiodiversity for utilitarian as well as other reasons.
� Acknowledgements
The author is grateful to the BIOMERGE group for stim-ulating discussions, to M Bracken, J Bruno, M Schwartz,and J Stachowicz for comments that improved the manu-script, to A-M Klein and the Alaska Seafood MarketingInstitute for permission to reproduce photos, and to theNSF (OCE-0623874) for support.
� References Balvanera P, Pfisterer AB, Buchmann N, et al. 2006. Quantifying
the evidence for biodiversity effects on ecosystem functioningand services. Ecol Lett 99: 1146–56.
Bracken MES and Stachowicz JJ. 2006. Seaweed diversityenhances nitrogen uptake via complementary use of nitrateand ammonium. Ecology 8877: 2397–2403.
Bruno JF, Boyer KE, Duffy JE, et al. 2005. Effects of macroalgalspecies identity and richness on primary production in benthicmarine communities. Ecol Lett 88: 1165–74.
Byrnes J, Stachowicz JJ, Hultgren KM, et al. 2006. Predator diver-sity strengthens trophic cascades in kelp forests by modifyingherbivore behaviour. Ecol Lett 99: 61–71.
Cardinale BJ, Nelson K, and Palmer MA. 2000. Linking speciesdiversity to the functioning of ecosystems: on the importanceof environmental context. Oikos 9911: 175–83.
Cardinale BJ, Srivastava DS, Duffy JE, et al. 2006. Effects of biodi-versity on the functioning of trophic groups and ecosystems.Nature 444433: 989–92.
Cardinale BJ, Wright JP, Cadotte MW, et al. 2007. Impacts of plantdiversity on biomass production increase through time becauseof species complementarity. P Natl Acad Sci USA 110044:18123–28.
Duffy JE, Cardinale BJ, France KE, et al. 2007. The functional roleof biodiversity in ecosystems: incorporating trophic complex-ity. Ecol Lett 1100: 522–38.
Duffy JE, Richardson JP, and Canuel EA. 2003. Grazer diversityeffects on ecosystem functioning in seagrass beds. Ecol Lett 66:637–45.
Duffy JE, Richardson JP, and France KE. 2005. Ecosystem conse-quences of diversity depend on food chain length in estuarinevegetation. Ecol Lett 88: 301–09.
Dulvy NK, Ellis JR, Goodwin NB, et al. 2004. Methods of assessingextinction risk in marine fishes. Fish Fisher 55: 255–76.
Fridley JD. 2002. Resource availability dominates and alters therelationship between species diversity and ecosystem produc-tivity in experimental plant communities. Oecologia 113322:271–77.
Gamfeldt L, Hillebrand H, and Jonsson PR. 2008. Multiple func-tions increase the importance of biodiversity for overall ecosys-tem functioning. Ecology 8899: 1223–31.
Giller PS, Hillebrand H, Berninger UG, et al. 2004. Biodiversityeffects on ecosystem functioning: emerging issues and theirexperimental test in aquatic environments. Oikos 110044: 423–36.
Grime JP. 1998. Benefits of plant diversity to ecosystems: immedi-ate, filter and founder effects. J Ecol 8866: 902–10.
Gross K and Cardinale BJ. 2005. The functional consequences ofrandom vs ordered species extinctions. Ecol Lett 88: 409–18.
Hector A and Bagchi R. 2007. Biodiversity and ecosystem multi-functionality. Nature 444488: 188–96.
Hector A, Bazeley-White E, Loreau M, et al. 2002. Overyielding ingrassland communities: testing the sampling effect hypothesiswith replicated biodiversity experiments. Ecol Lett 55: 502–11.
Hilborn R, Quinn TP, Schindler DE, and Rogers DE. 2003.Biocomplexity and fisheries sustainability. P Natl Acad Sci USA110000: 6564–68.
Hooper DU and Dukes JS. 2004. Overyielding among plant func-tional groups in a long-term experiment. Ecol Lett 77: 95–105.
Huston MA. 1997. Hidden treatments in ecological experiments:re-evaluating the ecosystem function of biodiversity. Oecologia111100: 449–60.
Jonsson M, Dangles O, Malmqvist B, and Guerold F. 2002.Simulating species loss following perturbation: assessing theeffects on process rates. P Roy Soc Lond B Bio 226699: 1047–52.
Klein AM, Steffan-Dewenter I, and Tscharntke T. 2003. Fruit set ofhighland coffee increases with the diversity of pollinating bees.P Roy Soc Lond B Bio 227700: 955–61.
Kremen C. 2005. Managing ecosystem services: what do we need to
443
© The Ecological Society of America wwwwww..ffrroonnttiieerrssiinneeccoollooggyy..oorrgg

Biodiversity and ecosystems JE Duffy
know about their ecology? Ecol Lett 88: 468–79.Leps J. 2004. What do the biodiversity experiments tell us about
consequences of plant species loss in the real world? Basic ApplEcol 55: 529–34.
Loreau M and Hector A. 2001. Partitioning selection and comple-mentarity in biodiversity experiments. Nature 441122: 72–76.
Loreau M, Mouquet N, and Gonzalez A. 2003. Biodiversity as spa-tial insurance in heterogeneous landscapes. P Natl Acad SciUSA 110000: 12765–70.
Loreau M, Naeem S, Inchausti P, et al. 2001. Biodiversity andecosystem functioning: current knowledge and future chal-lenges. Science 229944: 804–08.
Lyons KG, Brigham CA, Traut BH, and Schwartz MW. 2005. Rarespecies and ecosystem functioning. Conserv Biol 1199: 1019–24.
Ostfeld RS and LoGiudice K. 2003. Community disassembly, bio-diversity loss, and the erosion of an ecosystem service. Ecology8844: 1421–27.
Pacala S and Tilman D. 2002. The transition from sampling tocomplementarity. In: Kinzig AP, Pacala SW, and Tilman D(Eds). The functional consequences of biodiversity. Empiricalprogress and theoretical extensions. Princeton, NJ: PrincetonUniversity Press.
Palumbi SR, Sandifer PA, Allan JD, et al. 2009. Managing forocean biodiversity: creating a national biodiversity conserva-tion agenda to sustain marine ecosystem services. Front EcolEnviron 77: 204–11.
Petchey OL and Gaston KJ. 2002a. Extinction and the loss of func-tional diversity. P Roy Soc Lond B Bio 226699: 1721–27.
Petchey OL and Gaston KJ. 2002b. Functional diversity (FD), speciesrichness and community composition. Ecol Lett 55: 402–11.
Polley HW, Wilsey BJ, and Derner JD. 2007. Dominant speciesconstrain effects of species diversity on temporal variability inbiomass production of tallgrass prairie. Oikos 111166: 2044–52.
Purvis A, Gittleman JL, Cowlishaw G, and Mace GM. 2000.Predicting extinction risk in declining species. P Roy Soc LondB Bio 226677: 1947–52.
Schwartz MW, Brigham CA, Hoeksema JD, et al. 2000. Linkingbiodiversity to ecosystem function: implications for conserva-tion ecology. Oecologia 112222: 297–305.
Solan M, Cardinale BJ, Downing AL, et al. 2004. Extinction and
ecosystem function in the marine benthos. Science 330066:1177–80.
Spivak AC, Canuel EA, Duffy JE, and Richardson JP. 2007. Top-down and bottom-up controls on sediment organic mattercomposition in an experimental seagrass ecosystem. LimnolOceanogr 5522: 2595–2607.
Srivastava DS. 2002. The role of conservation in expanding biodi-versity research. Oikos 9988: 351–60.
Srivastava DS and Vellend M. 2005. Biodiversity–ecosystem func-tion research: is it relevant to conservation? Annu Rev EcolEvol Syst 3366: 267–94.
Stachowicz JJ, Fried H, Osman RW, and Whitlatch RB. 2002.Biodiversity, invasion resistance, and marine ecosystem func-tion: reconciling pattern and process. Ecology 8833: 2575–90.
Stachowicz JJ, Graham M, Bracken MES, et al. 2008. Diversityenhances cover and stability of seaweed assemblages: the roleof heterogeneity and time. Ecology 8899: 3008–19.
Thompson R and Starzomski BM. 2007. What does biodiversityactually do? A review for managers and policy makers. BiodiversConserv 1166: 1359–78.
Tilman D, Lehman CL, and Thomson KT. 1997. Plant diversityand ecosystem productivity: theoretical considerations. P NatlAcad Sci USA 9944: 1857–61.
Tilman D, Reich PB, Knops J, et al. 2001. Diversity and productiv-ity in a long-term grassland experiment. Science 229944: 843–45.
Tylianakis JM, Rand TA, Kahmen A, et al. 2008. Resource hetero-geneity moderates the biodiversity-function relationship in realworld ecosystems. PLoS Biol 66: 947–56.
Wardle DA. 1999. Is “sampling effect” a problem for experimentsinvestigating biodiversity–ecosystem function relationships?Oikos 87: 403–07.
Wardle DA, Huston MA, Grime JP, et al. 2000. Biodiversity andecosystem function: an issue in ecology. B Ecol Soc Am 8811:235–39.
Wojdak JM. 2005. Relative strength of top-down, bottom-up, andconsumer species richness effects on pond ecosystems. EcolMonogr 7755: 489–504.
Zavaleta ES and Hulvey KB. 2004. Realistic species losses dispro-portionately reduce grassland resistance to biological invaders.Science 330066: 1175–77.
444
wwwwww..ffrroonnttiieerrssiinneeccoollooggyy..oorrgg © The Ecological Society of America
TAKE THIS JOURNAL TO YOUR LIBRARIAN, PLEASEAre you enjoying this issue of Frontiers?
If your library had a subscription, colleagues and students could enjoy it too.Please consider recommending Frontiers in Ecology and the Environment to your library.
Clip or copy the form below. Thank you for your support.
LLiibbrraarryy RReeccoommmmeennddaattiioonn FFoorrmm
To Acquisition Librarian, Serials
From
Dept
Signature Date
II rreeccoommmmeenndd tthhee lliibbrraarryy ssuubbssccrriibbee ttoo:: Frontiers in Ecology and the Environment ((IISSSSNN 11554400--99229955))
To request a free sample issue of Frontiers in Ecology and the Environment, email Eric Gordon at [email protected].
Order Frontiers by contacting ESA Headquarters at (202) 833-8773, online at www.esa.org, or through your subscription agent.
�
�