Embed Size (px)
Citation preview
Essar Oil and Gas Exploration and Production LimitedRG (East)-CBM-2001/1 (Phase-II) Half Yearly Environment Clearance Compliance
Report(October’ 19 to March’ 20)
Page | 1
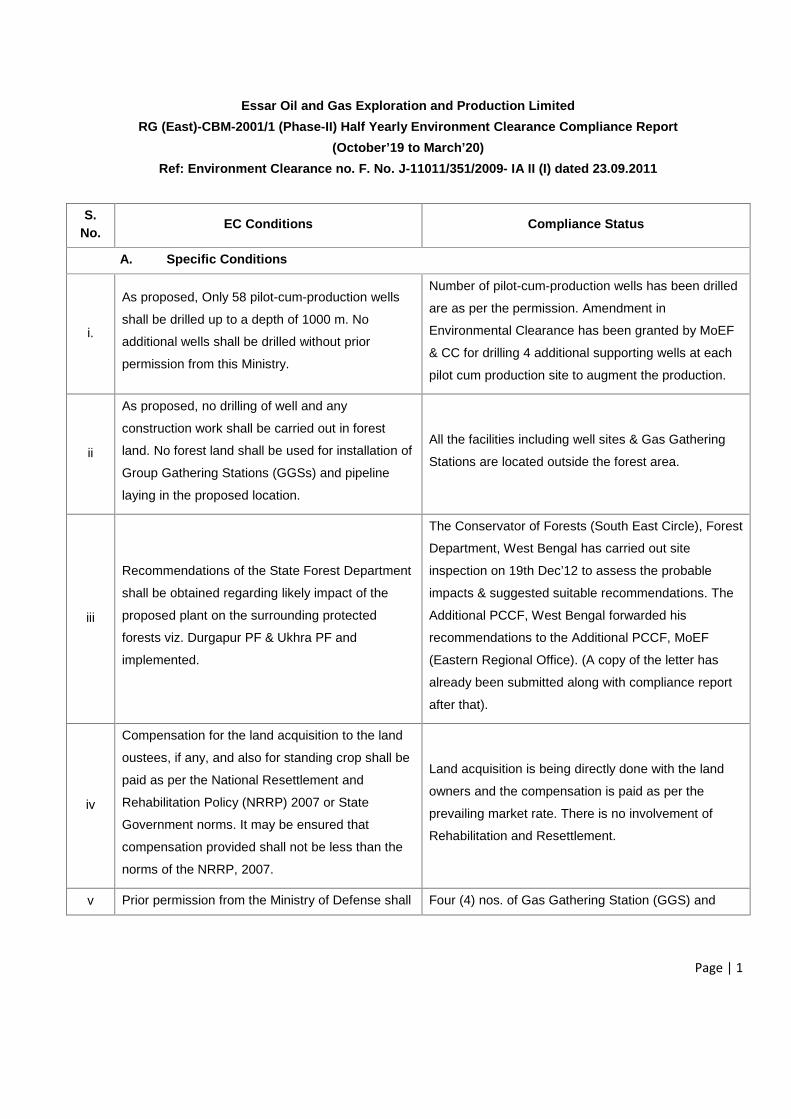
Essar Oil and Gas Exploration and Production LimitedRG (East)-CBM-2001/1 (Phase-II) Half Yearly Environment Clearance Compliance Report
(October’19 to March’20)Ref: Environment Clearance no. F. No. J-11011/351/2009- IA II (I) dated 23.09.2011
S.No.
EC Conditions Compliance Status
A. Specific Conditions
i.
As proposed, Only 58 pilot-cum-production wells
shall be drilled up to a depth of 1000 m. No
additional wells shall be drilled without prior
permission from this Ministry.
Number of pilot-cum-production wells has been drilled
are as per the permission. Amendment in
Environmental Clearance has been granted by MoEF
& CC for drilling 4 additional supporting wells at each
pilot cum production site to augment the production.
ii
As proposed, no drilling of well and any
construction work shall be carried out in forest
land. No forest land shall be used for installation of
Group Gathering Stations (GGSs) and pipeline
laying in the proposed location.
All the facilities including well sites & Gas Gathering
Stations are located outside the forest area.
iii
Recommendations of the State Forest Department
shall be obtained regarding likely impact of the
proposed plant on the surrounding protected
forests viz. Durgapur PF & Ukhra PF and
implemented.
The Conservator of Forests (South East Circle), Forest
Department, West Bengal has carried out site
inspection on 19th Dec’12 to assess the probable
impacts & suggested suitable recommendations. The
Additional PCCF, West Bengal forwarded his
recommendations to the Additional PCCF, MoEF
(Eastern Regional Office). (A copy of the letter has
already been submitted along with compliance report
after that).
iv
Compensation for the land acquisition to the land
oustees, if any, and also for standing crop shall be
paid as per the National Resettlement and
Rehabilitation Policy (NRRP) 2007 or State
Government norms. It may be ensured that
compensation provided shall not be less than the
norms of the NRRP, 2007.
Land acquisition is being directly done with the land
owners and the compensation is paid as per the
prevailing market rate. There is no involvement of
Rehabilitation and Resettlement.
v Prior permission from the Ministry of Defense shall Four (4) nos. of Gas Gathering Station (GGS) and
Page | 2
S.No.
EC Conditions Compliance Status
be obtained regarding impact of proposed plant on
Panagarh air base, if any.
One Main Compressor Station (MCS) was constructed
as per the condition of the NOC of Ministry of Defense
(MoD).
vi
The surface facilities shall be installed as per the
applicable codes and standards, international
practices and applicable local regulations.
Surface facilities have been designed as per
applicable Code and Standard.
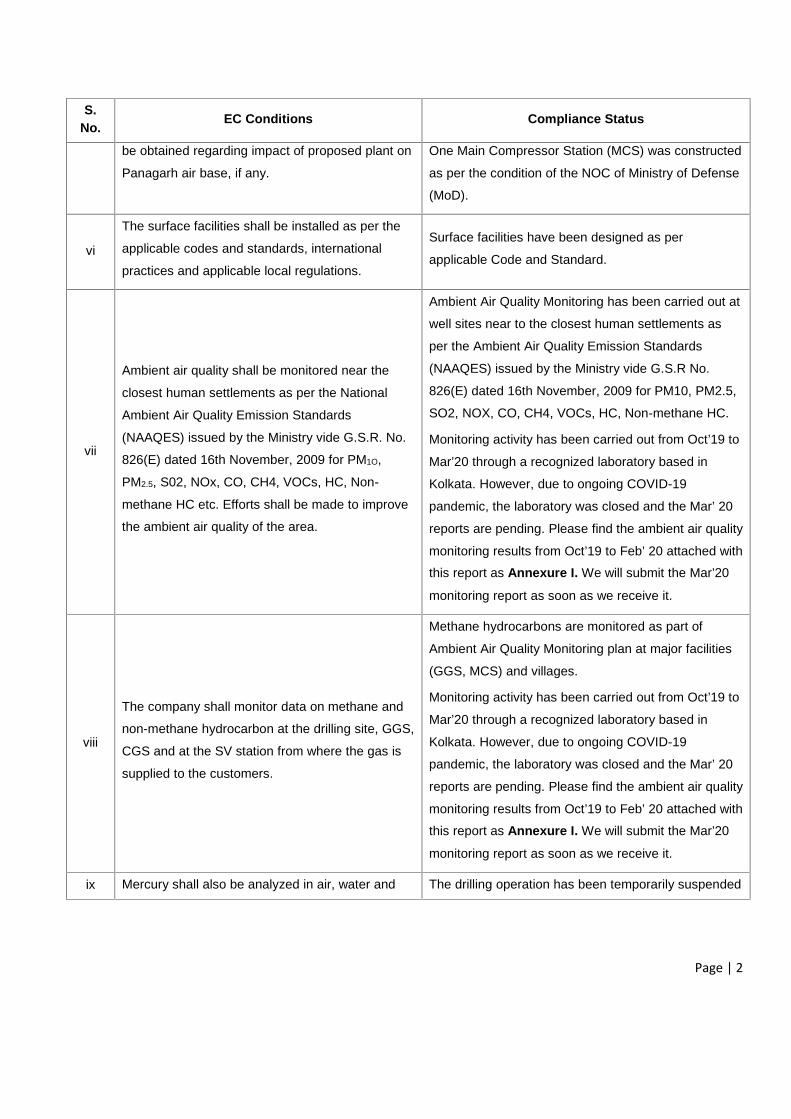
vii
Ambient air quality shall be monitored near the
closest human settlements as per the National
Ambient Air Quality Emission Standards
(NAAQES) issued by the Ministry vide G.S.R. No.
826(E) dated 16th November, 2009 for PM1O,
PM2.5, S02, NOx, CO, CH4, VOCs, HC, Non-
methane HC etc. Efforts shall be made to improve
the ambient air quality of the area.
Ambient Air Quality Monitoring has been carried out at
well sites near to the closest human settlements as
per the Ambient Air Quality Emission Standards
(NAAQES) issued by the Ministry vide G.S.R No.
826(E) dated 16th November, 2009 for PM10, PM2.5,
SO2, NOX, CO, CH4, VOCs, HC, Non-methane HC.
Monitoring activity has been carried out from Oct’19 to
Mar’20 through a recognized laboratory based in
Kolkata. However, due to ongoing COVID-19
pandemic, the laboratory was closed and the Mar’ 20
reports are pending. Please find the ambient air quality
monitoring results from Oct’19 to Feb’ 20 attached with
this report as Annexure I. We will submit the Mar’20
monitoring report as soon as we receive it.
viii
The company shall monitor data on methane and
non-methane hydrocarbon at the drilling site, GGS,
CGS and at the SV station from where the gas is
supplied to the customers.
Methane hydrocarbons are monitored as part of
Ambient Air Quality Monitoring plan at major facilities
(GGS, MCS) and villages.
Monitoring activity has been carried out from Oct’19 to
Mar’20 through a recognized laboratory based in
Kolkata. However, due to ongoing COVID-19
pandemic, the laboratory was closed and the Mar’ 20
reports are pending. Please find the ambient air quality
monitoring results from Oct’19 to Feb’ 20 attached with
this report as Annexure I. We will submit the Mar’20
monitoring report as soon as we receive it.
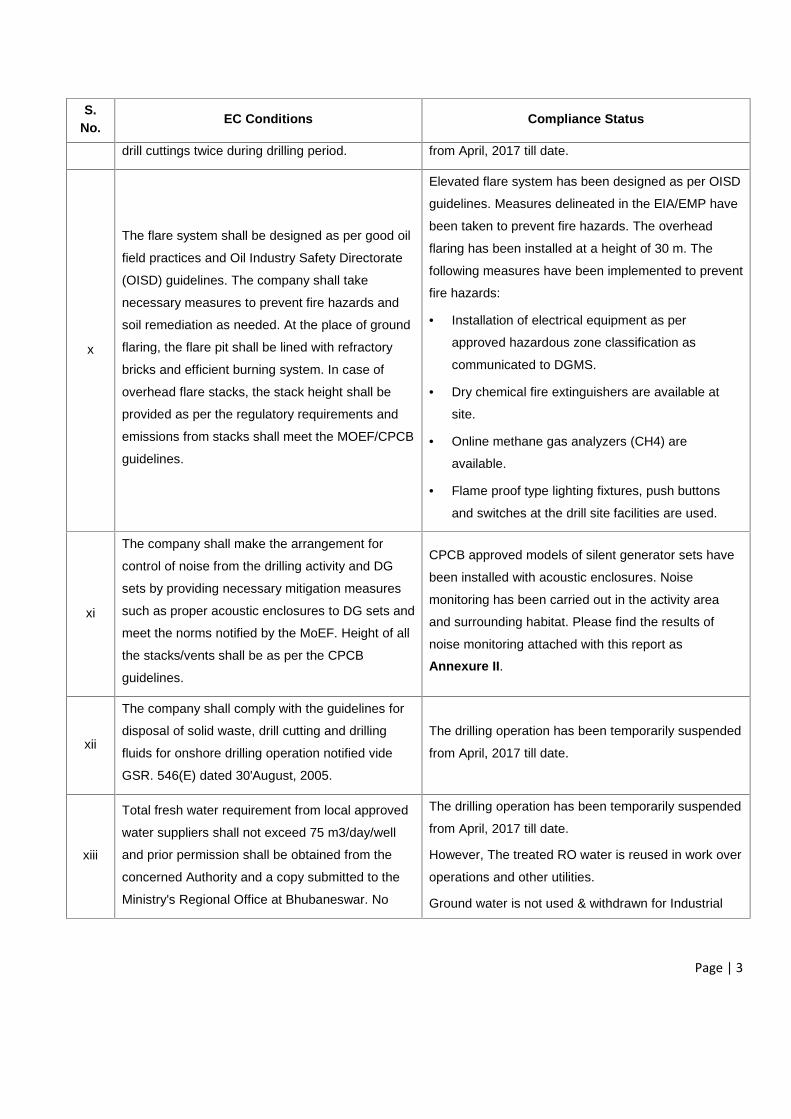
ix Mercury shall also be analyzed in air, water and The drilling operation has been temporarily suspended
Page | 3
S.No.
EC Conditions Compliance Status
drill cuttings twice during drilling period. from April, 2017 till date.
x
The flare system shall be designed as per good oil
field practices and Oil Industry Safety Directorate
(OISD) guidelines. The company shall take
necessary measures to prevent fire hazards and
soil remediation as needed. At the place of ground
flaring, the flare pit shall be lined with refractory
bricks and efficient burning system. In case of
overhead flare stacks, the stack height shall be
provided as per the regulatory requirements and
emissions from stacks shall meet the MOEF/CPCB
guidelines.
Elevated flare system has been designed as per OISD
guidelines. Measures delineated in the EIA/EMP have
been taken to prevent fire hazards. The overhead
flaring has been installed at a height of 30 m. The
following measures have been implemented to prevent
fire hazards:
Installation of electrical equipment as per
approved hazardous zone classification as
communicated to DGMS.
Dry chemical fire extinguishers are available at
site.
Online methane gas analyzers (CH4) are
available.
Flame proof type lighting fixtures, push buttons
and switches at the drill site facilities are used.
xi
The company shall make the arrangement for
control of noise from the drilling activity and DG
sets by providing necessary mitigation measures
such as proper acoustic enclosures to DG sets and
meet the norms notified by the MoEF. Height of all
the stacks/vents shall be as per the CPCB
guidelines.
CPCB approved models of silent generator sets have
been installed with acoustic enclosures. Noise
monitoring has been carried out in the activity area
and surrounding habitat. Please find the results of
noise monitoring attached with this report as
Annexure II.
xii
The company shall comply with the guidelines for
disposal of solid waste, drill cutting and drilling
fluids for onshore drilling operation notified vide
GSR. 546(E) dated 30'August, 2005.
The drilling operation has been temporarily suspended
from April, 2017 till date.
xiii
Total fresh water requirement from local approved
water suppliers shall not exceed 75 m3/day/well
and prior permission shall be obtained from the
concerned Authority and a copy submitted to the
Ministry's Regional Office at Bhubaneswar. No
The drilling operation has been temporarily suspended
from April, 2017 till date.
However, The treated RO water is reused in work over
operations and other utilities.
Ground water is not used & withdrawn for Industrial
Page | 4
S.No.
EC Conditions Compliance Status
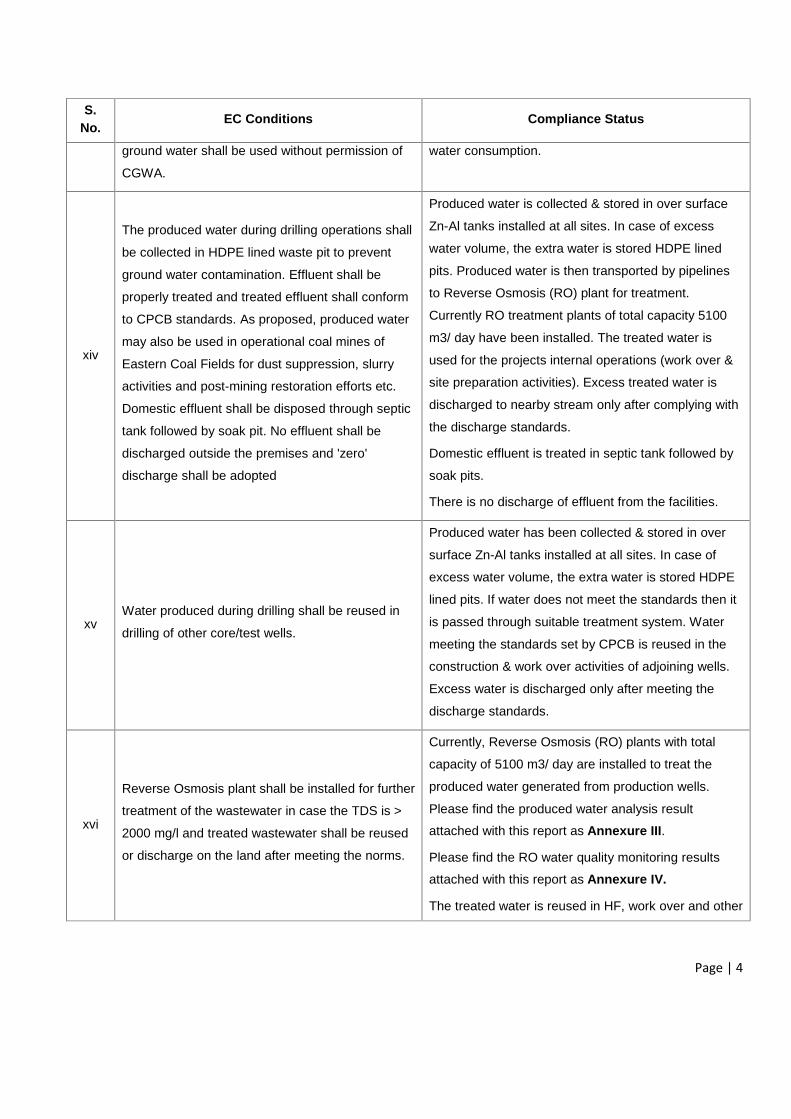
ground water shall be used without permission of
CGWA.
water consumption.
xiv
The produced water during drilling operations shall
be collected in HDPE lined waste pit to prevent
ground water contamination. Effluent shall be
properly treated and treated effluent shall conform
to CPCB standards. As proposed, produced water
may also be used in operational coal mines of
Eastern Coal Fields for dust suppression, slurry
activities and post-mining restoration efforts etc.
Domestic effluent shall be disposed through septic
tank followed by soak pit. No effluent shall be
discharged outside the premises and 'zero'
discharge shall be adopted
Produced water is collected & stored in over surface
Zn-Al tanks installed at all sites. In case of excess
water volume, the extra water is stored HDPE lined
pits. Produced water is then transported by pipelines
to Reverse Osmosis (RO) plant for treatment.
Currently RO treatment plants of total capacity 5100
m3/ day have been installed. The treated water is
used for the projects internal operations (work over &
site preparation activities). Excess treated water is
discharged to nearby stream only after complying with
the discharge standards.
Domestic effluent is treated in septic tank followed by
soak pits.
There is no discharge of effluent from the facilities.
xvWater produced during drilling shall be reused in
drilling of other core/test wells.
Produced water has been collected & stored in over
surface Zn-Al tanks installed at all sites. In case of
excess water volume, the extra water is stored HDPE
lined pits. If water does not meet the standards then it
is passed through suitable treatment system. Water
meeting the standards set by CPCB is reused in the
construction & work over activities of adjoining wells.
Excess water is discharged only after meeting the
discharge standards.
xvi
Reverse Osmosis plant shall be installed for further
treatment of the wastewater in case the TDS is >
2000 mg/l and treated wastewater shall be reused
or discharge on the land after meeting the norms.
Currently, Reverse Osmosis (RO) plants with total
capacity of 5100 m3/ day are installed to treat the
produced water generated from production wells.
Please find the produced water analysis result
attached with this report as Annexure III.
Please find the RO water quality monitoring results
attached with this report as Annexure IV.
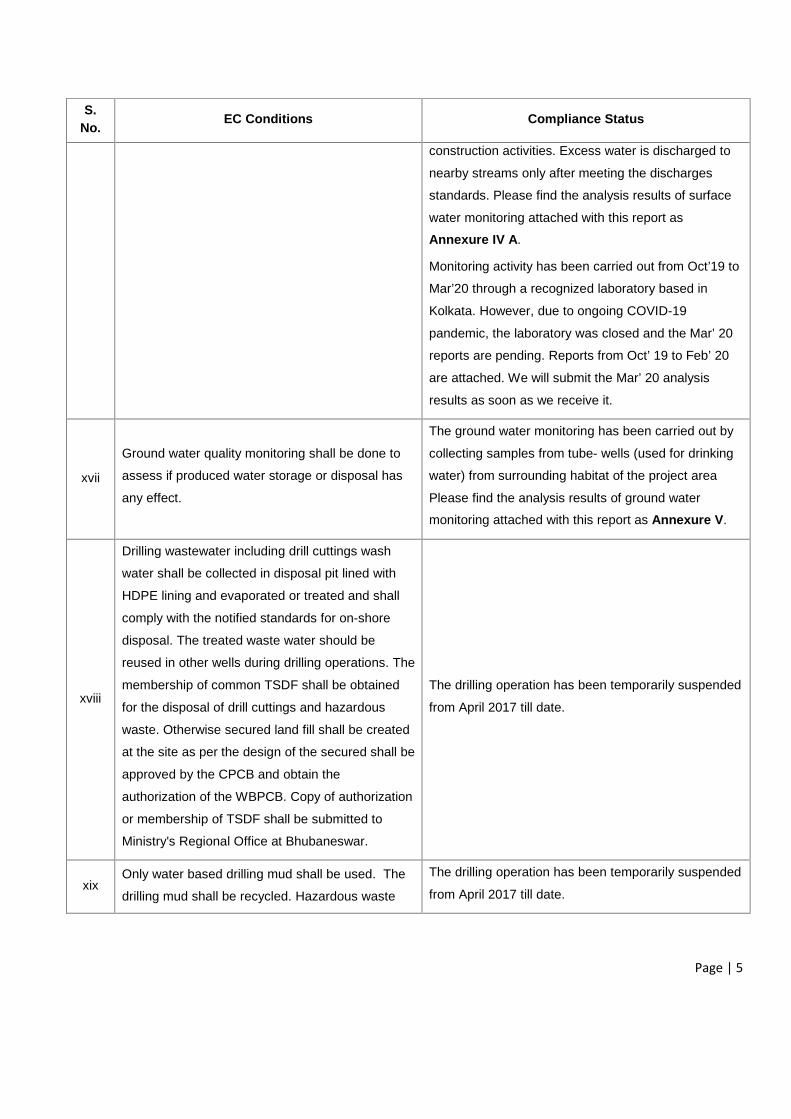
The treated water is reused in HF, work over and other
Page | 5
S.No.
EC Conditions Compliance Status
construction activities. Excess water is discharged to
nearby streams only after meeting the discharges
standards. Please find the analysis results of surface
water monitoring attached with this report as
Annexure IV A.
Monitoring activity has been carried out from Oct’19 to
Mar’20 through a recognized laboratory based in
Kolkata. However, due to ongoing COVID-19
pandemic, the laboratory was closed and the Mar’ 20
reports are pending. Reports from Oct’ 19 to Feb’ 20
are attached. We will submit the Mar’ 20 analysis
results as soon as we receive it.
xvii
Ground water quality monitoring shall be done to
assess if produced water storage or disposal has
any effect.
The ground water monitoring has been carried out by
collecting samples from tube- wells (used for drinking
water) from surrounding habitat of the project area
Please find the analysis results of ground water
monitoring attached with this report as Annexure V.
xviii
Drilling wastewater including drill cuttings wash
water shall be collected in disposal pit lined with
HDPE lining and evaporated or treated and shall
comply with the notified standards for on-shore
disposal. The treated waste water should be
reused in other wells during drilling operations. The
membership of common TSDF shall be obtained
for the disposal of drill cuttings and hazardous
waste. Otherwise secured land fill shall be created
at the site as per the design of the secured shall be
approved by the CPCB and obtain the
authorization of the WBPCB. Copy of authorization
or membership of TSDF shall be submitted to
Ministry's Regional Office at Bhubaneswar.
The drilling operation has been temporarily suspended
from April 2017 till date.
xixOnly water based drilling mud shall be used. The
drilling mud shall be recycled. Hazardous waste
The drilling operation has been temporarily suspended
from April 2017 till date.
Page | 6
S.No.
EC Conditions Compliance Status
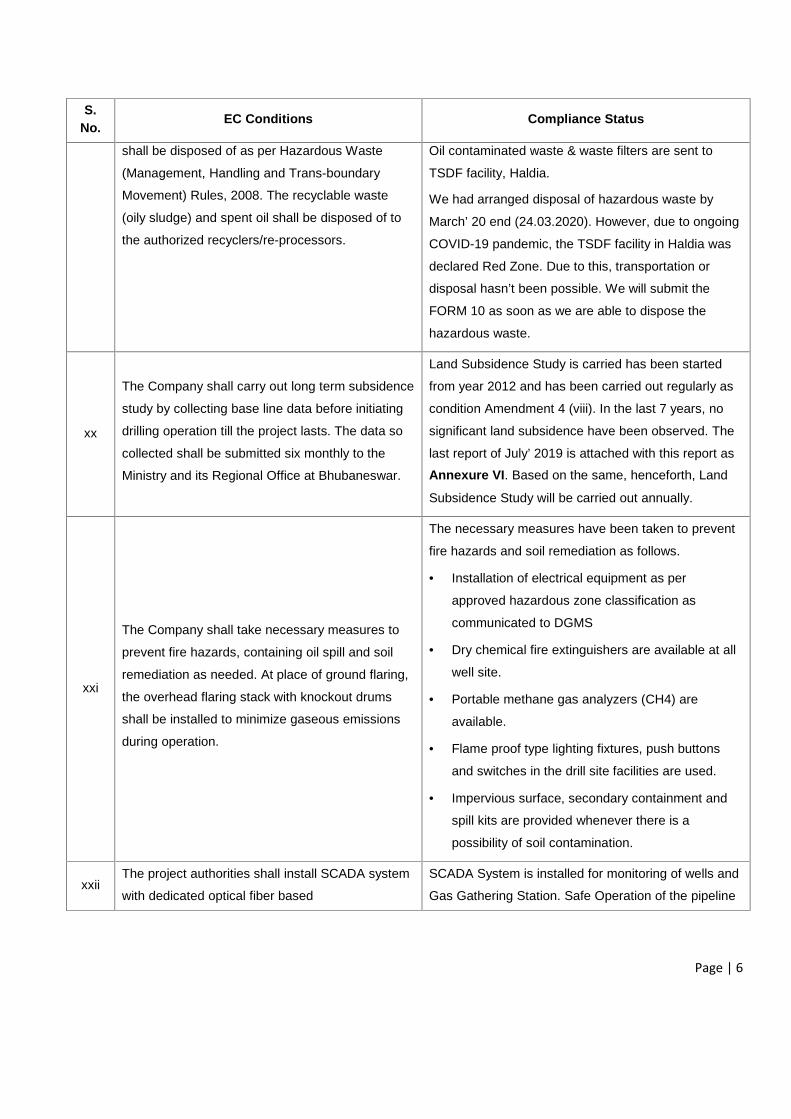
shall be disposed of as per Hazardous Waste
(Management, Handling and Trans-boundary
Movement) Rules, 2008. The recyclable waste
(oily sludge) and spent oil shall be disposed of to
the authorized recyclers/re-processors.
Oil contaminated waste & waste filters are sent to
TSDF facility, Haldia.
We had arranged disposal of hazardous waste by
March’ 20 end (24.03.2020). However, due to ongoing
COVID-19 pandemic, the TSDF facility in Haldia was
declared Red Zone. Due to this, transportation or
disposal hasn’t been possible. We will submit the
FORM 10 as soon as we are able to dispose the
hazardous waste.
xx
The Company shall carry out long term subsidence
study by collecting base line data before initiating
drilling operation till the project lasts. The data so
collected shall be submitted six monthly to the
Ministry and its Regional Office at Bhubaneswar.
Land Subsidence Study is carried has been started
from year 2012 and has been carried out regularly as
condition Amendment 4 (viii). In the last 7 years, no
significant land subsidence have been observed. The
last report of July’ 2019 is attached with this report as
Annexure VI. Based on the same, henceforth, Land
Subsidence Study will be carried out annually.
xxi
The Company shall take necessary measures to
prevent fire hazards, containing oil spill and soil
remediation as needed. At place of ground flaring,
the overhead flaring stack with knockout drums
shall be installed to minimize gaseous emissions
during operation.
The necessary measures have been taken to prevent
fire hazards and soil remediation as follows.
Installation of electrical equipment as per
approved hazardous zone classification as
communicated to DGMS
Dry chemical fire extinguishers are available at all
well site.
Portable methane gas analyzers (CH4) are
available.
Flame proof type lighting fixtures, push buttons
and switches in the drill site facilities are used.
Impervious surface, secondary containment and
spill kits are provided whenever there is a
possibility of soil contamination.
xxiiThe project authorities shall install SCADA system
with dedicated optical fiber based
SCADA System is installed for monitoring of wells and
Gas Gathering Station. Safe Operation of the pipeline
Page | 7
S.No.
EC Conditions Compliance Status
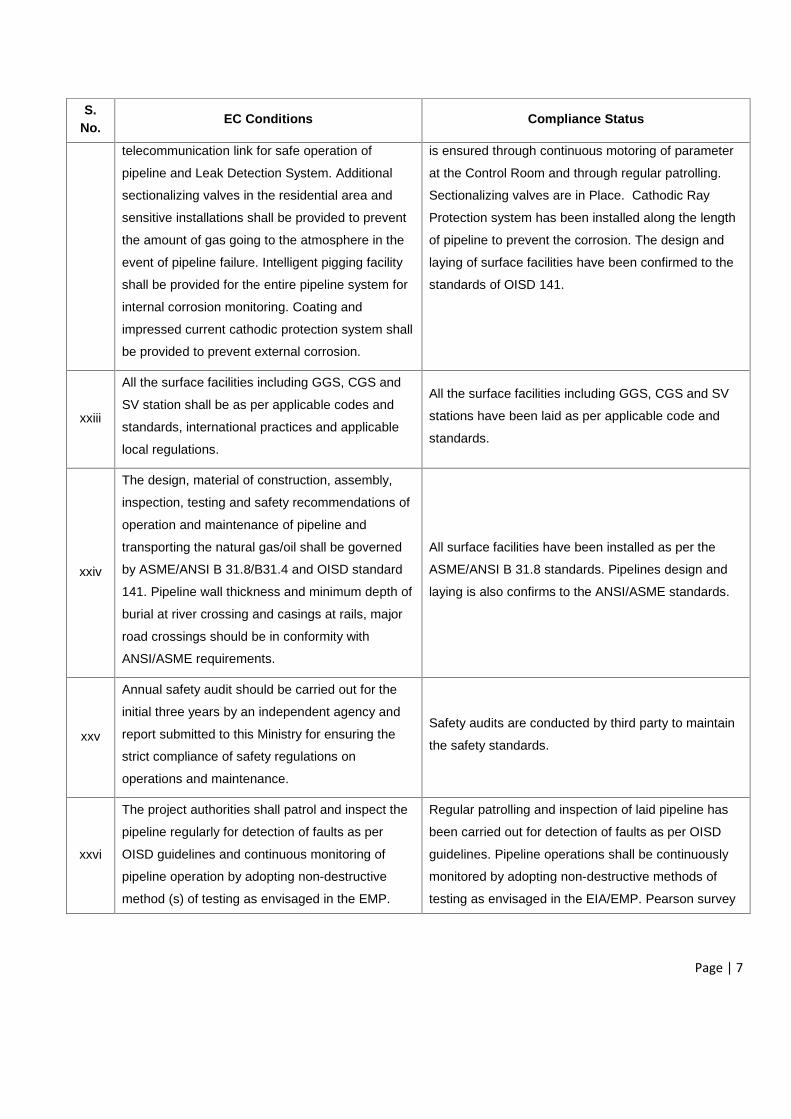
telecommunication link for safe operation of
pipeline and Leak Detection System. Additional
sectionalizing valves in the residential area and
sensitive installations shall be provided to prevent
the amount of gas going to the atmosphere in the
event of pipeline failure. Intelligent pigging facility
shall be provided for the entire pipeline system for
internal corrosion monitoring. Coating and
impressed current cathodic protection system shall
be provided to prevent external corrosion.
is ensured through continuous motoring of parameter
at the Control Room and through regular patrolling.
Sectionalizing valves are in Place. Cathodic Ray
Protection system has been installed along the length
of pipeline to prevent the corrosion. The design and
laying of surface facilities have been confirmed to the
standards of OISD 141.
xxiii
All the surface facilities including GGS, CGS and
SV station shall be as per applicable codes and
standards, international practices and applicable
local regulations.
All the surface facilities including GGS, CGS and SV
stations have been laid as per applicable code and
standards.
xxiv
The design, material of construction, assembly,
inspection, testing and safety recommendations of
operation and maintenance of pipeline and
transporting the natural gas/oil shall be governed
by ASME/ANSI B 31.8/B31.4 and OISD standard
141. Pipeline wall thickness and minimum depth of
burial at river crossing and casings at rails, major
road crossings should be in conformity with
ANSI/ASME requirements.
All surface facilities have been installed as per the
ASME/ANSI B 31.8 standards. Pipelines design and
laying is also confirms to the ANSI/ASME standards.
xxv
Annual safety audit should be carried out for the
initial three years by an independent agency and
report submitted to this Ministry for ensuring the
strict compliance of safety regulations on
operations and maintenance.
Safety audits are conducted by third party to maintain
the safety standards.
xxvi
The project authorities shall patrol and inspect the
pipeline regularly for detection of faults as per
OISD guidelines and continuous monitoring of
pipeline operation by adopting non-destructive
method (s) of testing as envisaged in the EMP.
Regular patrolling and inspection of laid pipeline has
been carried out for detection of faults as per OISD
guidelines. Pipeline operations shall be continuously
monitored by adopting non-destructive methods of
testing as envisaged in the EIA/EMP. Pearson survey
Page | 8
S.No.
EC Conditions Compliance Status
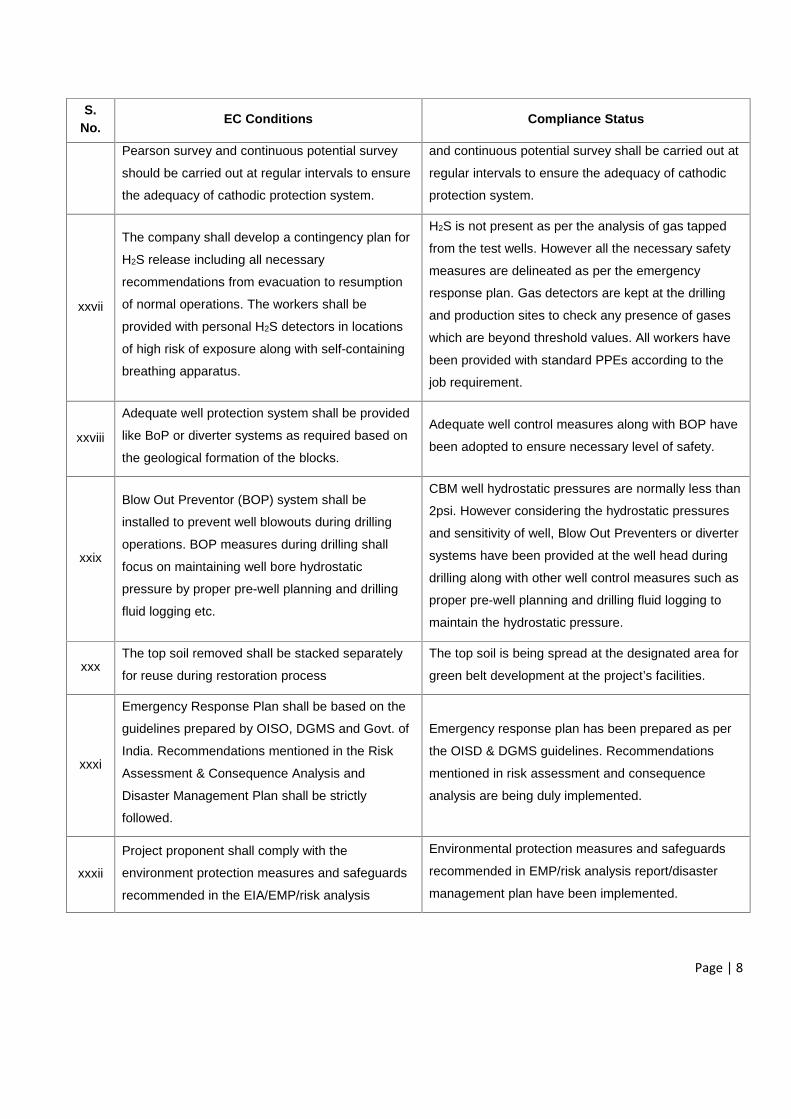
Pearson survey and continuous potential survey
should be carried out at regular intervals to ensure
the adequacy of cathodic protection system.
and continuous potential survey shall be carried out at
regular intervals to ensure the adequacy of cathodic
protection system.
xxvii
The company shall develop a contingency plan for
H2S release including all necessary
recommendations from evacuation to resumption
of normal operations. The workers shall be
provided with personal H2S detectors in locations
of high risk of exposure along with self-containing
breathing apparatus.
H2S is not present as per the analysis of gas tapped
from the test wells. However all the necessary safety
measures are delineated as per the emergency
response plan. Gas detectors are kept at the drilling
and production sites to check any presence of gases
which are beyond threshold values. All workers have
been provided with standard PPEs according to the
job requirement.
xxviii
Adequate well protection system shall be provided
like BoP or diverter systems as required based on
the geological formation of the blocks.
Adequate well control measures along with BOP have
been adopted to ensure necessary level of safety.
xxix
Blow Out Preventor (BOP) system shall be
installed to prevent well blowouts during drilling
operations. BOP measures during drilling shall
focus on maintaining well bore hydrostatic
pressure by proper pre-well planning and drilling
fluid logging etc.
CBM well hydrostatic pressures are normally less than
2psi. However considering the hydrostatic pressures
and sensitivity of well, Blow Out Preventers or diverter
systems have been provided at the well head during
drilling along with other well control measures such as
proper pre-well planning and drilling fluid logging to
maintain the hydrostatic pressure.
xxxThe top soil removed shall be stacked separately
for reuse during restoration process
The top soil is being spread at the designated area for
green belt development at the project’s facilities.
xxxi
Emergency Response Plan shall be based on the
guidelines prepared by OISO, DGMS and Govt. of
India. Recommendations mentioned in the Risk
Assessment & Consequence Analysis and
Disaster Management Plan shall be strictly
followed.
Emergency response plan has been prepared as per
the OISD & DGMS guidelines. Recommendations
mentioned in risk assessment and consequence
analysis are being duly implemented.
xxxii
Project proponent shall comply with the
environment protection measures and safeguards
recommended in the EIA/EMP/risk analysis
Environmental protection measures and safeguards
recommended in EMP/risk analysis report/disaster
management plan have been implemented.
Page | 9
S.No.
EC Conditions Compliance Status
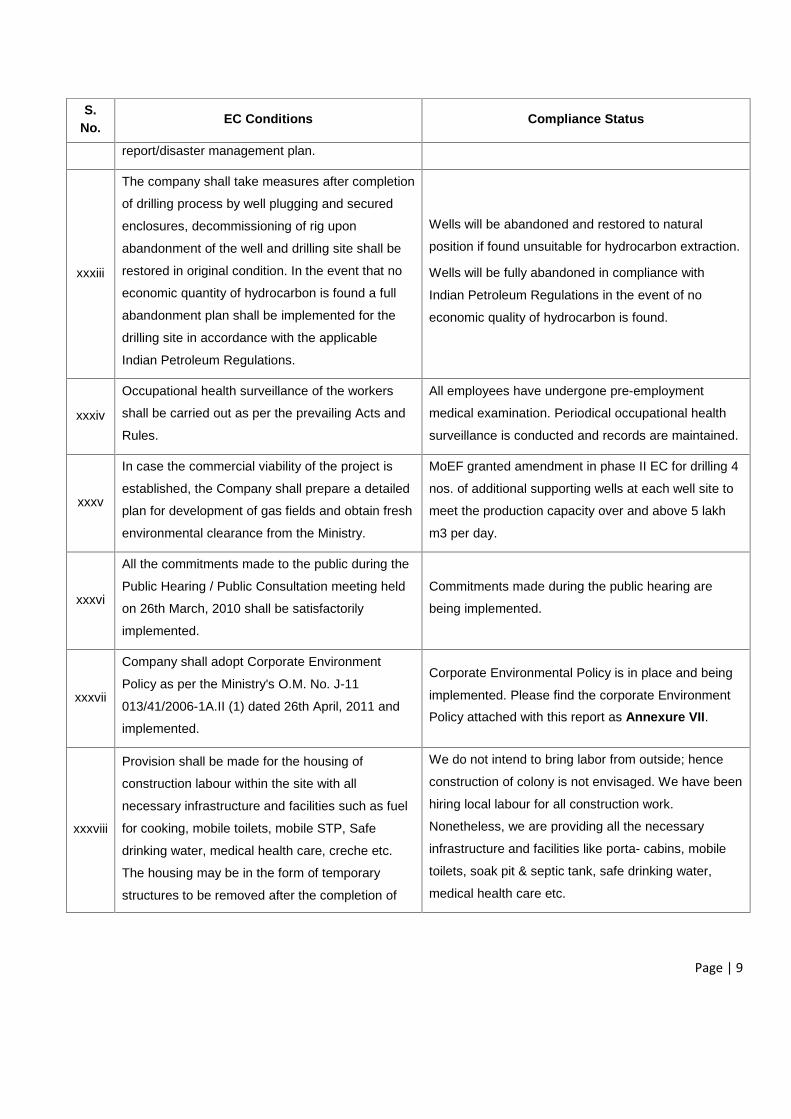
report/disaster management plan.
xxxiii
The company shall take measures after completion
of drilling process by well plugging and secured
enclosures, decommissioning of rig upon
abandonment of the well and drilling site shall be
restored in original condition. In the event that no
economic quantity of hydrocarbon is found a full
abandonment plan shall be implemented for the
drilling site in accordance with the applicable
Indian Petroleum Regulations.
Wells will be abandoned and restored to natural
position if found unsuitable for hydrocarbon extraction.
Wells will be fully abandoned in compliance with
Indian Petroleum Regulations in the event of no
economic quality of hydrocarbon is found.
xxxiv
Occupational health surveillance of the workers
shall be carried out as per the prevailing Acts and
Rules.
All employees have undergone pre-employment
medical examination. Periodical occupational health
surveillance is conducted and records are maintained.
xxxv
In case the commercial viability of the project is
established, the Company shall prepare a detailed
plan for development of gas fields and obtain fresh
environmental clearance from the Ministry.
MoEF granted amendment in phase II EC for drilling 4
nos. of additional supporting wells at each well site to
meet the production capacity over and above 5 lakh
m3 per day.
xxxvi
All the commitments made to the public during the
Public Hearing / Public Consultation meeting held
on 26th March, 2010 shall be satisfactorily
implemented.
Commitments made during the public hearing are
being implemented.
xxxvii
Company shall adopt Corporate Environment
Policy as per the Ministry's O.M. No. J-11
013/41/2006-1A.II (1) dated 26th April, 2011 and
implemented.
Corporate Environmental Policy is in place and being
implemented. Please find the corporate Environment
Policy attached with this report as Annexure VII.
xxxviii
Provision shall be made for the housing of
construction labour within the site with all
necessary infrastructure and facilities such as fuel
for cooking, mobile toilets, mobile STP, Safe
drinking water, medical health care, creche etc.
The housing may be in the form of temporary
structures to be removed after the completion of
We do not intend to bring labor from outside; hence
construction of colony is not envisaged. We have been
hiring local labour for all construction work.
Nonetheless, we are providing all the necessary
infrastructure and facilities like porta- cabins, mobile
toilets, soak pit & septic tank, safe drinking water,
medical health care etc.
Page | 10
S.No.
EC Conditions Compliance Status
the project
General Condition
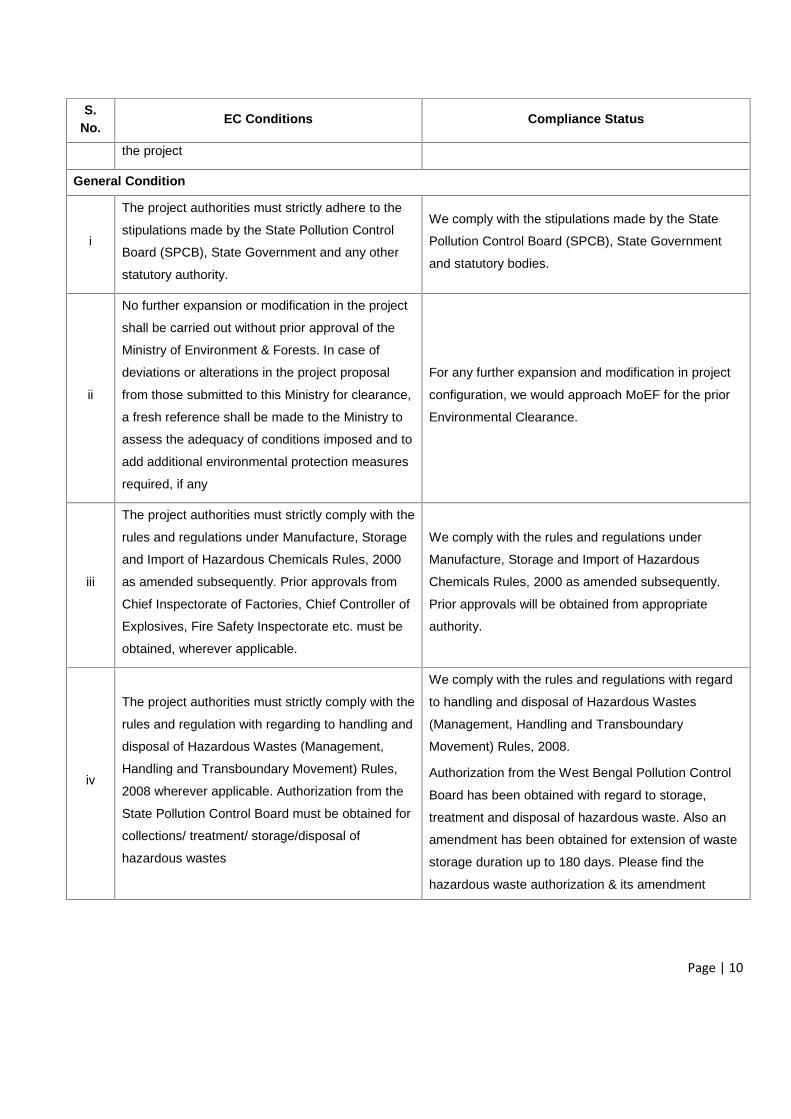
i
The project authorities must strictly adhere to the
stipulations made by the State Pollution Control
Board (SPCB), State Government and any other
statutory authority.
We comply with the stipulations made by the State
Pollution Control Board (SPCB), State Government
and statutory bodies.
ii
No further expansion or modification in the project
shall be carried out without prior approval of the
Ministry of Environment & Forests. In case of
deviations or alterations in the project proposal
from those submitted to this Ministry for clearance,
a fresh reference shall be made to the Ministry to
assess the adequacy of conditions imposed and to
add additional environmental protection measures
required, if any
For any further expansion and modification in project
configuration, we would approach MoEF for the prior
Environmental Clearance.
iii
The project authorities must strictly comply with the
rules and regulations under Manufacture, Storage
and Import of Hazardous Chemicals Rules, 2000
as amended subsequently. Prior approvals from
Chief Inspectorate of Factories, Chief Controller of
Explosives, Fire Safety Inspectorate etc. must be
obtained, wherever applicable.
We comply with the rules and regulations under
Manufacture, Storage and Import of Hazardous
Chemicals Rules, 2000 as amended subsequently.
Prior approvals will be obtained from appropriate
authority.
iv
The project authorities must strictly comply with the
rules and regulation with regarding to handling and
disposal of Hazardous Wastes (Management,
Handling and Transboundary Movement) Rules,
2008 wherever applicable. Authorization from the
State Pollution Control Board must be obtained for
collections/ treatment/ storage/disposal of
hazardous wastes
We comply with the rules and regulations with regard
to handling and disposal of Hazardous Wastes
(Management, Handling and Transboundary
Movement) Rules, 2008.
Authorization from the West Bengal Pollution Control
Board has been obtained with regard to storage,
treatment and disposal of hazardous waste. Also an
amendment has been obtained for extension of waste
storage duration up to 180 days. Please find the
hazardous waste authorization & its amendment
Page | 11
S.No.
EC Conditions Compliance Status
attached with this report as Annexure VIII.
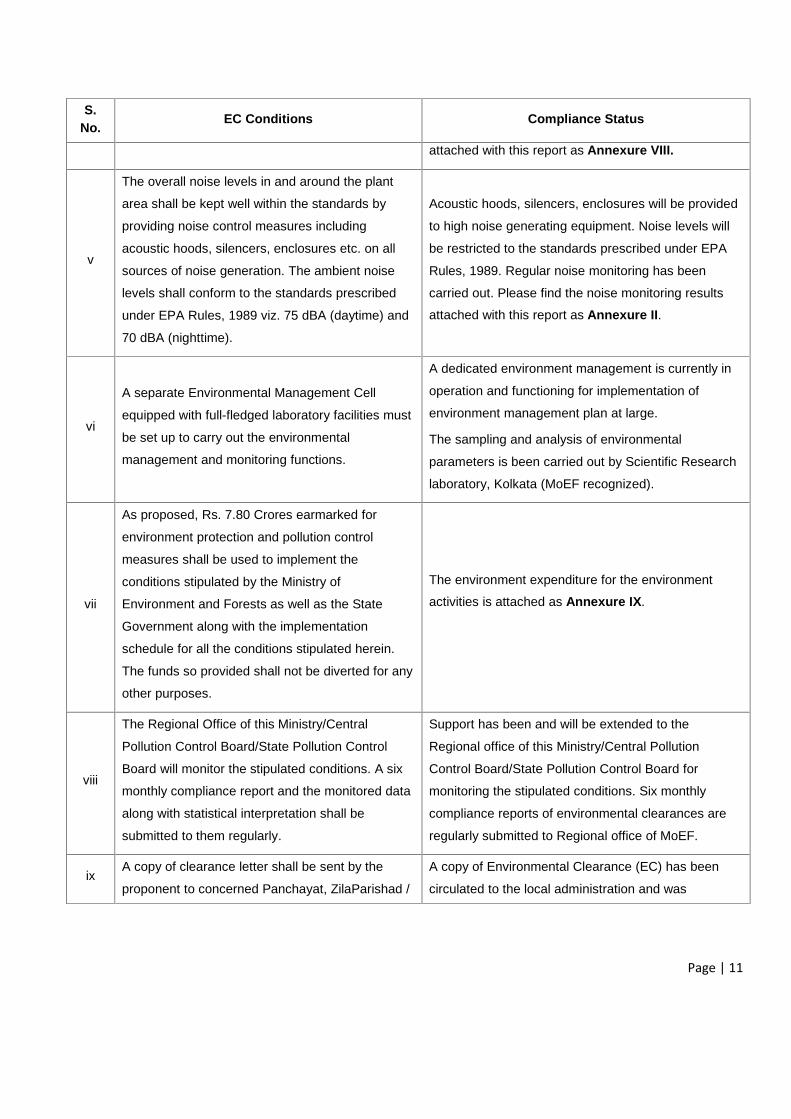
v
The overall noise levels in and around the plant
area shall be kept well within the standards by
providing noise control measures including
acoustic hoods, silencers, enclosures etc. on all
sources of noise generation. The ambient noise
levels shall conform to the standards prescribed
under EPA Rules, 1989 viz. 75 dBA (daytime) and
70 dBA (nighttime).
Acoustic hoods, silencers, enclosures will be provided
to high noise generating equipment. Noise levels will
be restricted to the standards prescribed under EPA
Rules, 1989. Regular noise monitoring has been
carried out. Please find the noise monitoring results
attached with this report as Annexure II.
vi
A separate Environmental Management Cell
equipped with full-fledged laboratory facilities must
be set up to carry out the environmental
management and monitoring functions.
A dedicated environment management is currently in
operation and functioning for implementation of
environment management plan at large.
The sampling and analysis of environmental
parameters is been carried out by Scientific Research
laboratory, Kolkata (MoEF recognized).
vii
As proposed, Rs. 7.80 Crores earmarked for
environment protection and pollution control
measures shall be used to implement the
conditions stipulated by the Ministry of
Environment and Forests as well as the State
Government along with the implementation
schedule for all the conditions stipulated herein.
The funds so provided shall not be diverted for any
other purposes.
The environment expenditure for the environment
activities is attached as Annexure IX.
viii
The Regional Office of this Ministry/Central
Pollution Control Board/State Pollution Control
Board will monitor the stipulated conditions. A six
monthly compliance report and the monitored data
along with statistical interpretation shall be
submitted to them regularly.
Support has been and will be extended to the
Regional office of this Ministry/Central Pollution
Control Board/State Pollution Control Board for
monitoring the stipulated conditions. Six monthly
compliance reports of environmental clearances are
regularly submitted to Regional office of MoEF.
ixA copy of clearance letter shall be sent by the
proponent to concerned Panchayat, ZilaParishad /
A copy of Environmental Clearance (EC) has been
circulated to the local administration and was
Page | 12
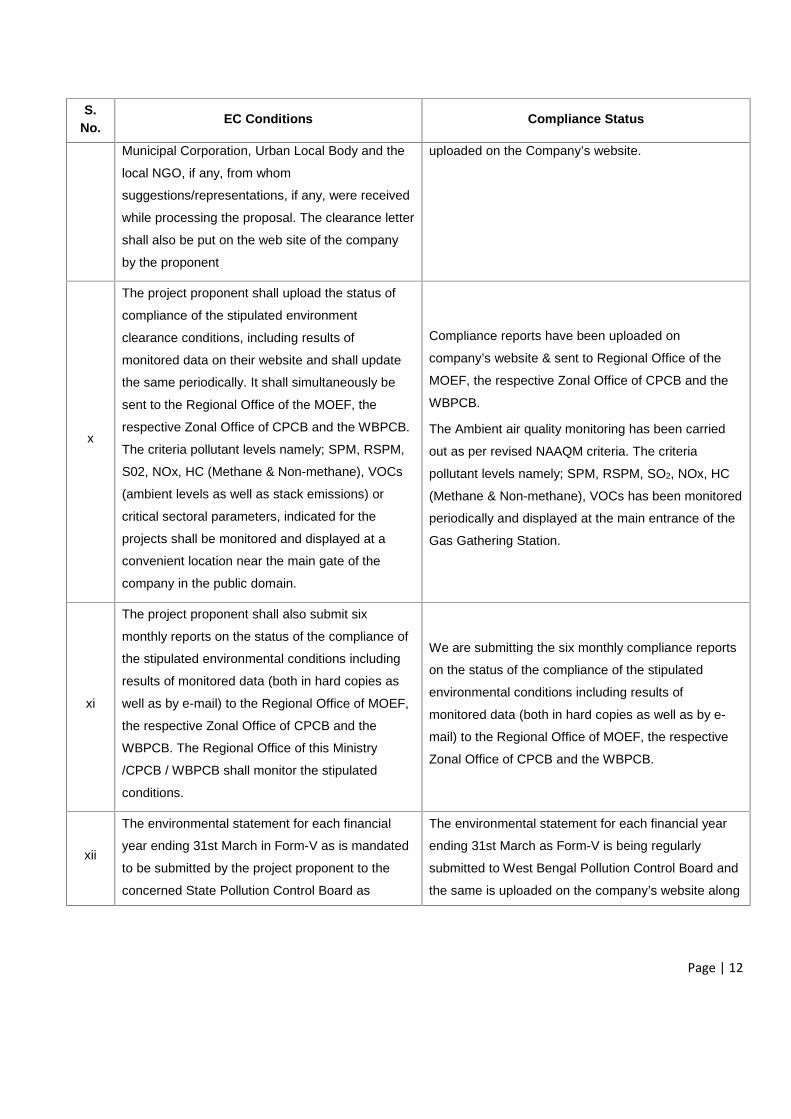
S.No.
EC Conditions Compliance Status
Municipal Corporation, Urban Local Body and the
local NGO, if any, from whom
suggestions/representations, if any, were received
while processing the proposal. The clearance letter
shall also be put on the web site of the company
by the proponent
uploaded on the Company’s website.
x
The project proponent shall upload the status of
compliance of the stipulated environment
clearance conditions, including results of
monitored data on their website and shall update
the same periodically. It shall simultaneously be
sent to the Regional Office of the MOEF, the
respective Zonal Office of CPCB and the WBPCB.
The criteria pollutant levels namely; SPM, RSPM,
S02, NOx, HC (Methane & Non-methane), VOCs
(ambient levels as well as stack emissions) or
critical sectoral parameters, indicated for the
projects shall be monitored and displayed at a
convenient location near the main gate of the
company in the public domain.
Compliance reports have been uploaded on
company’s website & sent to Regional Office of the
MOEF, the respective Zonal Office of CPCB and the
WBPCB.
The Ambient air quality monitoring has been carried
out as per revised NAAQM criteria. The criteria
pollutant levels namely; SPM, RSPM, SO2, NOx, HC
(Methane & Non-methane), VOCs has been monitored
periodically and displayed at the main entrance of the
Gas Gathering Station.
xi
The project proponent shall also submit six
monthly reports on the status of the compliance of
the stipulated environmental conditions including
results of monitored data (both in hard copies as
well as by e-mail) to the Regional Office of MOEF,
the respective Zonal Office of CPCB and the
WBPCB. The Regional Office of this Ministry
/CPCB / WBPCB shall monitor the stipulated
conditions.
We are submitting the six monthly compliance reports
on the status of the compliance of the stipulated
environmental conditions including results of
monitored data (both in hard copies as well as by e-
mail) to the Regional Office of MOEF, the respective
Zonal Office of CPCB and the WBPCB.
xii
The environmental statement for each financial
year ending 31st March in Form-V as is mandated
to be submitted by the project proponent to the
concerned State Pollution Control Board as
The environmental statement for each financial year
ending 31st March as Form-V is being regularly
submitted to West Bengal Pollution Control Board and
the same is uploaded on the company’s website along
Page | 13
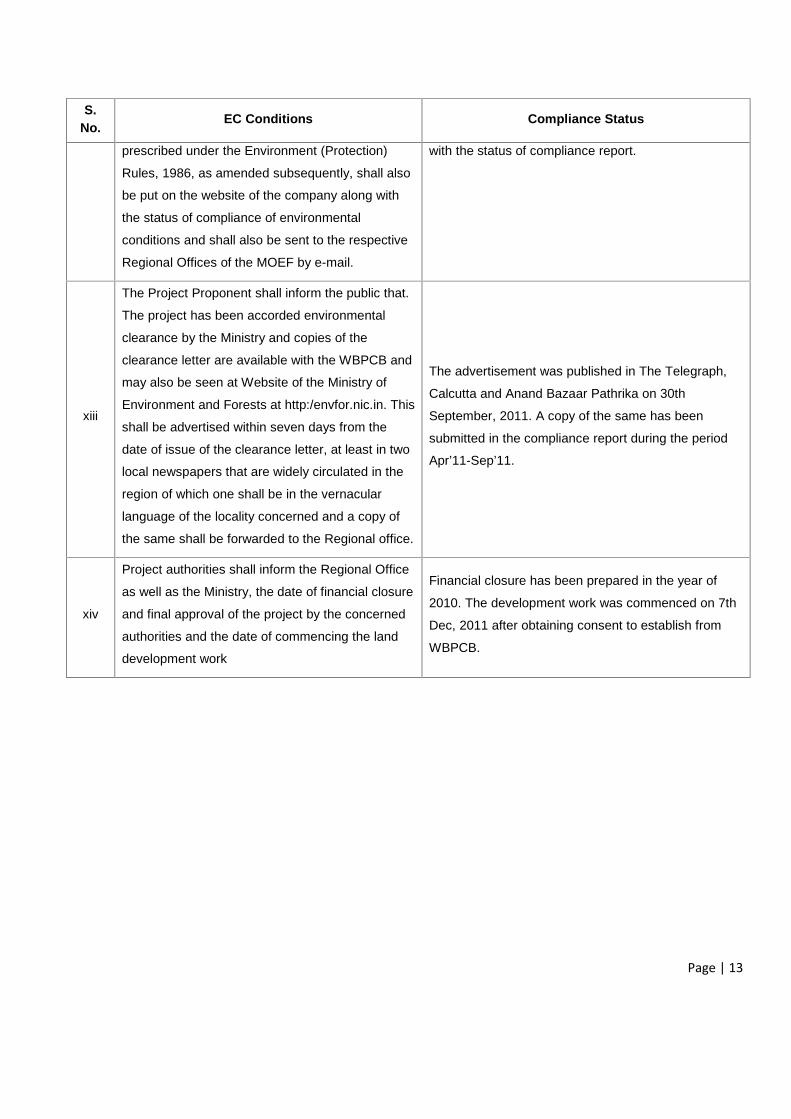
S.No.
EC Conditions Compliance Status
prescribed under the Environment (Protection)
Rules, 1986, as amended subsequently, shall also
be put on the website of the company along with
the status of compliance of environmental
conditions and shall also be sent to the respective
Regional Offices of the MOEF by e-mail.
with the status of compliance report.
xiii
The Project Proponent shall inform the public that.
The project has been accorded environmental
clearance by the Ministry and copies of the
clearance letter are available with the WBPCB and
may also be seen at Website of the Ministry of
Environment and Forests at http:/envfor.nic.in. This
shall be advertised within seven days from the
date of issue of the clearance letter, at least in two
local newspapers that are widely circulated in the
region of which one shall be in the vernacular
language of the locality concerned and a copy of
the same shall be forwarded to the Regional office.
The advertisement was published in The Telegraph,
Calcutta and Anand Bazaar Pathrika on 30th
September, 2011. A copy of the same has been
submitted in the compliance report during the period
Apr’11-Sep’11.
xiv
Project authorities shall inform the Regional Office
as well as the Ministry, the date of financial closure
and final approval of the project by the concerned
authorities and the date of commencing the land
development work
Financial closure has been prepared in the year of
2010. The development work was commenced on 7th
Dec, 2011 after obtaining consent to establish from
WBPCB.
Essar Oil and Gas Exploration and Production LimitedRG (East)-CBM-2001/1 (Phase-II A) Half Yearly Environment Clearance
Compliance Report(October’ 19 to March’ 20)
Page | 14
Essar Oil and Gas Exploration and Production LimitedRG (East)-CBM-2001/1 (Phase-IIA) Half Yearly Environment Clearance Compliance Report
(October’ 19 to March’ 20)Ref: Environment Clearance no. F. No. J-11011/351/2009- IA II (I) dated 18.06.2012
S.No.
EC Conditions Compliance Status
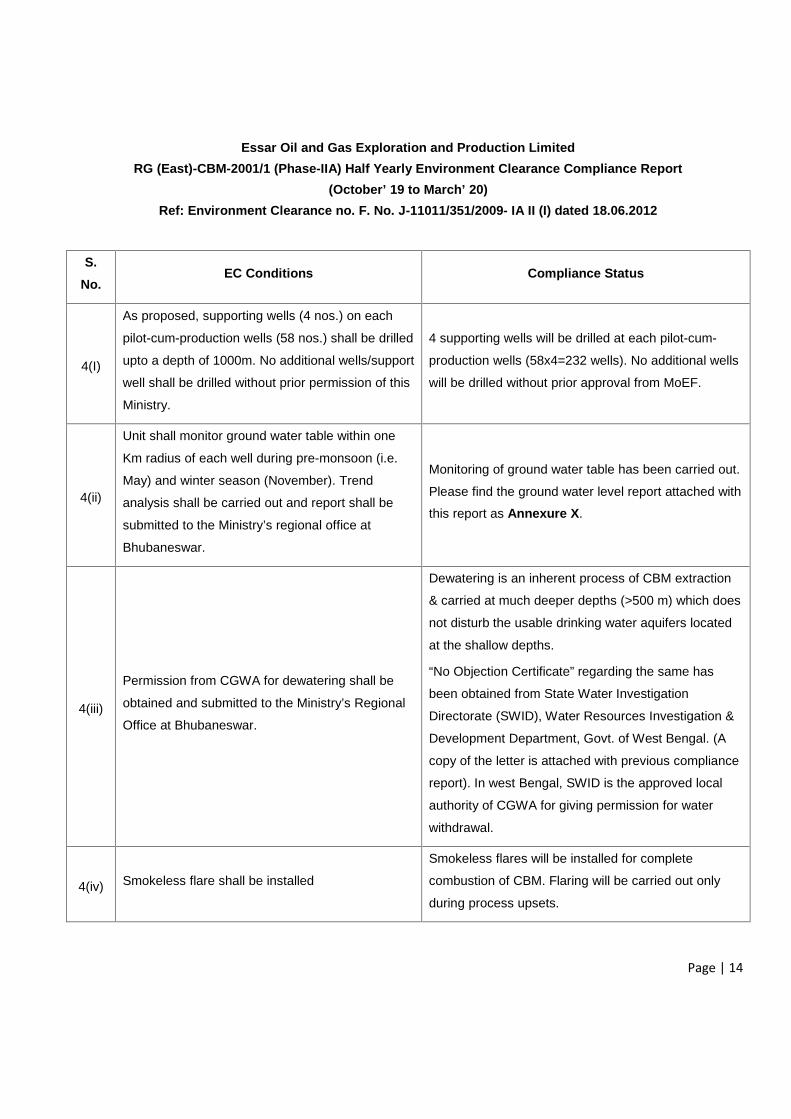
4(I)
As proposed, supporting wells (4 nos.) on each
pilot-cum-production wells (58 nos.) shall be drilled
upto a depth of 1000m. No additional wells/support
well shall be drilled without prior permission of this
Ministry.
4 supporting wells will be drilled at each pilot-cum-
production wells (58x4=232 wells). No additional wells
will be drilled without prior approval from MoEF.
4(ii)
Unit shall monitor ground water table within one
Km radius of each well during pre-monsoon (i.e.
May) and winter season (November). Trend
analysis shall be carried out and report shall be
submitted to the Ministry’s regional office at
Bhubaneswar.
Monitoring of ground water table has been carried out.
Please find the ground water level report attached with
this report as Annexure X.
4(iii)
Permission from CGWA for dewatering shall be
obtained and submitted to the Ministry’s Regional
Office at Bhubaneswar.
Dewatering is an inherent process of CBM extraction
& carried at much deeper depths (>500 m) which does
not disturb the usable drinking water aquifers located
at the shallow depths.
“No Objection Certificate” regarding the same has
been obtained from State Water Investigation
Directorate (SWID), Water Resources Investigation &
Development Department, Govt. of West Bengal. (A
copy of the letter is attached with previous compliance
report). In west Bengal, SWID is the approved local
authority of CGWA for giving permission for water
withdrawal.
4(iv) Smokeless flare shall be installed
Smokeless flares will be installed for complete
combustion of CBM. Flaring will be carried out only
during process upsets.
Page | 15
S.No.
EC Conditions Compliance Status
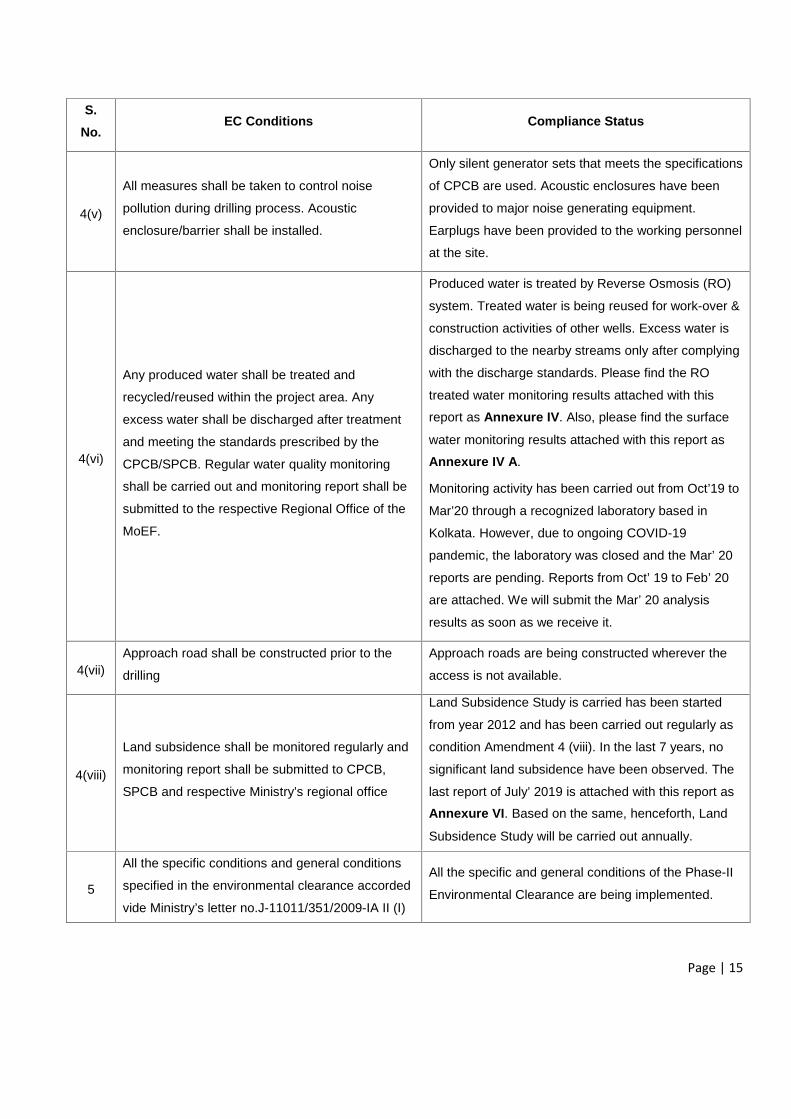
4(v)
All measures shall be taken to control noise
pollution during drilling process. Acoustic
enclosure/barrier shall be installed.
Only silent generator sets that meets the specifications
of CPCB are used. Acoustic enclosures have been
provided to major noise generating equipment.
Earplugs have been provided to the working personnel
at the site.
4(vi)
Any produced water shall be treated and
recycled/reused within the project area. Any
excess water shall be discharged after treatment
and meeting the standards prescribed by the
CPCB/SPCB. Regular water quality monitoring
shall be carried out and monitoring report shall be
submitted to the respective Regional Office of the
MoEF.
Produced water is treated by Reverse Osmosis (RO)
system. Treated water is being reused for work-over &
construction activities of other wells. Excess water is
discharged to the nearby streams only after complying
with the discharge standards. Please find the RO
treated water monitoring results attached with this
report as Annexure IV. Also, please find the surface
water monitoring results attached with this report as
Annexure IV A.
Monitoring activity has been carried out from Oct’19 to
Mar’20 through a recognized laboratory based in
Kolkata. However, due to ongoing COVID-19
pandemic, the laboratory was closed and the Mar’ 20
reports are pending. Reports from Oct’ 19 to Feb’ 20
are attached. We will submit the Mar’ 20 analysis
results as soon as we receive it.
4(vii)Approach road shall be constructed prior to the
drilling
Approach roads are being constructed wherever the
access is not available.
4(viii)
Land subsidence shall be monitored regularly and
monitoring report shall be submitted to CPCB,
SPCB and respective Ministry’s regional office
Land Subsidence Study is carried has been started
from year 2012 and has been carried out regularly as
condition Amendment 4 (viii). In the last 7 years, no
significant land subsidence have been observed. The
last report of July’ 2019 is attached with this report as
Annexure VI. Based on the same, henceforth, Land
Subsidence Study will be carried out annually.
5
All the specific conditions and general conditions
specified in the environmental clearance accorded
vide Ministry’s letter no.J-11011/351/2009-IA II (I)
All the specific and general conditions of the Phase-II
Environmental Clearance are being implemented.
Page | 16
S.No.
EC Conditions Compliance Status
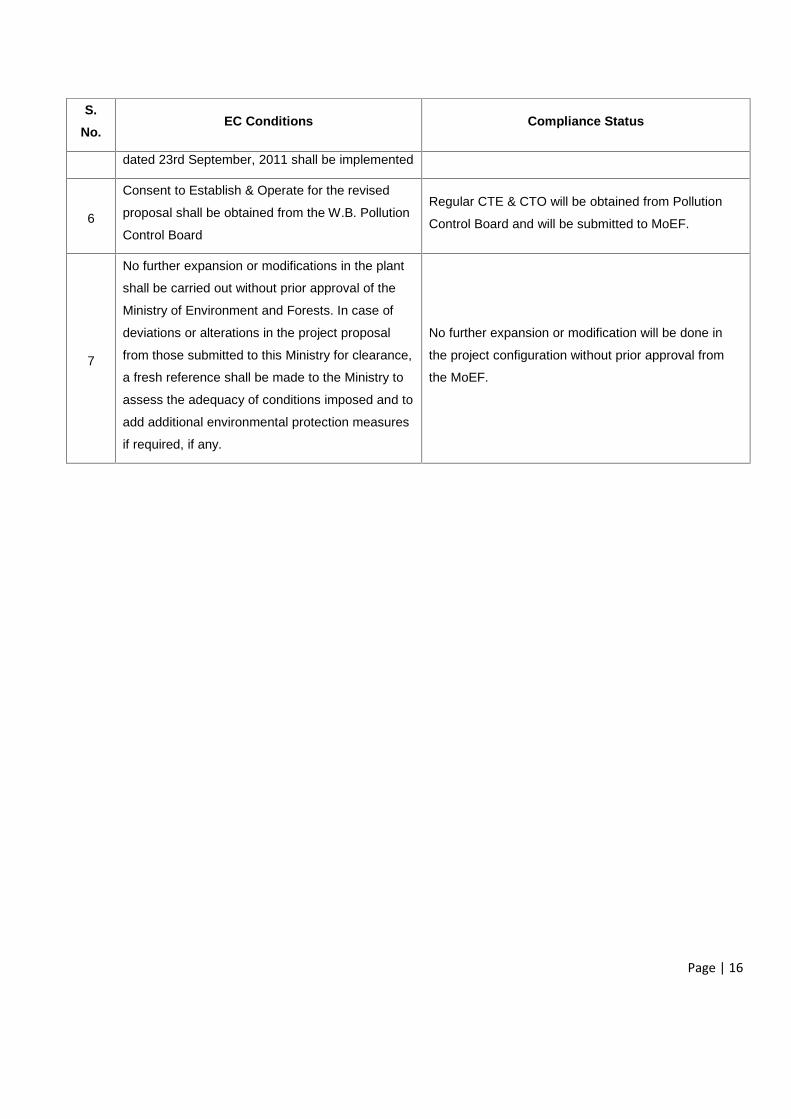
dated 23rd September, 2011 shall be implemented
6
Consent to Establish & Operate for the revised
proposal shall be obtained from the W.B. Pollution
Control Board
Regular CTE & CTO will be obtained from Pollution
Control Board and will be submitted to MoEF.
7
No further expansion or modifications in the plant
shall be carried out without prior approval of the
Ministry of Environment and Forests. In case of
deviations or alterations in the project proposal
from those submitted to this Ministry for clearance,
a fresh reference shall be made to the Ministry to
assess the adequacy of conditions imposed and to
add additional environmental protection measures
if required, if any.
No further expansion or modification will be done in
the project configuration without prior approval from
the MoEF.
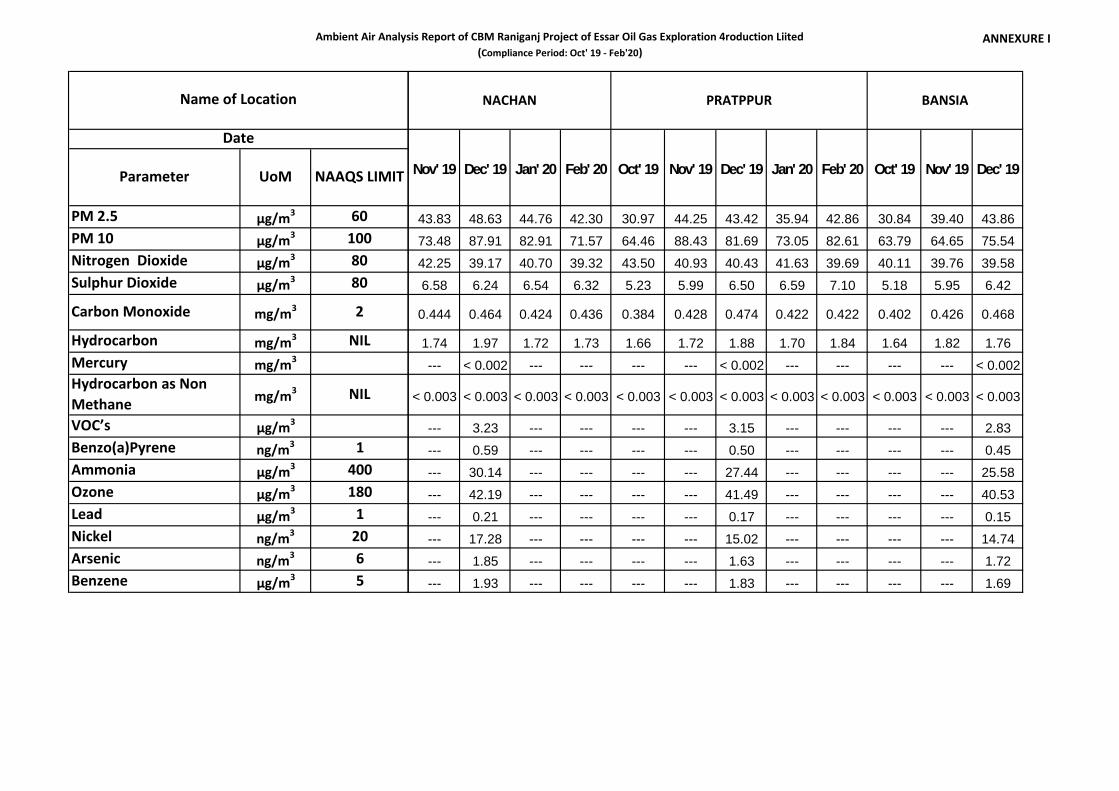
ANNEXURE I: Ambient Air Analysis Report
(Compliance Period: Oct’ 19 to Feb’ 20)
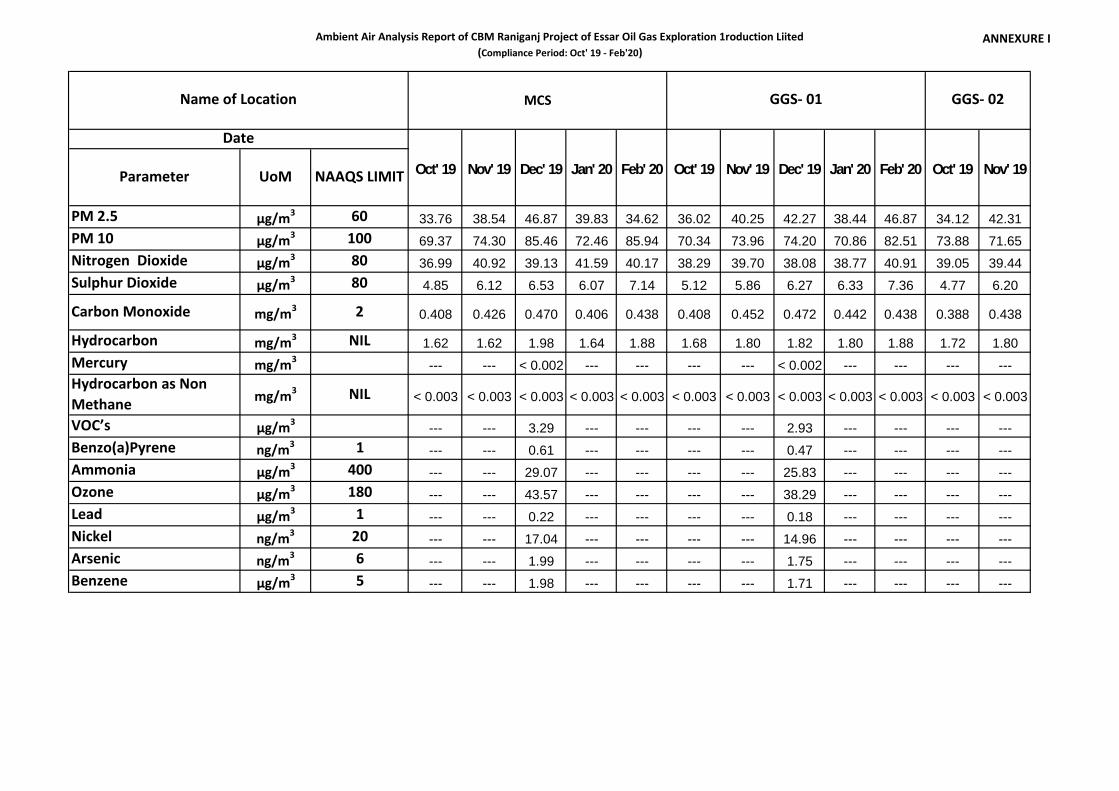
Ambient Air Analysis Report of CBM Raniganj Project of Essar Oil Gas Exploration 1roduction Liited(Compliance Period: Oct' 19 - Feb'20)
ANNEXURE I
Parameter UoM NAAQS LIMIT
PM 2.5 µg/m3 60 33.76 38.54 46.87 39.83 34.62 36.02 40.25 42.27 38.44 46.87 34.12 42.31PM 10 µg/m3 100 69.37 74.30 85.46 72.46 85.94 70.34 73.96 74.20 70.86 82.51 73.88 71.65Nitrogen Dioxide µg/m3 80 36.99 40.92 39.13 41.59 40.17 38.29 39.70 38.08 38.77 40.91 39.05 39.44Sulphur Dioxide µg/m3 80 4.85 6.12 6.53 6.07 7.14 5.12 5.86 6.27 6.33 7.36 4.77 6.20
Carbon Monoxide mg/m3 2 0.408 0.426 0.470 0.406 0.438 0.408 0.452 0.472 0.442 0.438 0.388 0.438
Hydrocarbon mg/m3 NIL 1.62 1.62 1.98 1.64 1.88 1.68 1.80 1.82 1.80 1.88 1.72 1.80Mercury mg/m3 --- --- < 0.002 --- --- --- --- < 0.002 --- --- --- ---Hydrocarbon as NonMethane mg/m3 NIL < 0.003 < 0.003 < 0.003 < 0.003 < 0.003 < 0.003 < 0.003 < 0.003 < 0.003 < 0.003 < 0.003 < 0.003
VOC’s µg/m3 --- --- 3.29 --- --- --- --- 2.93 --- --- --- ---Benzo(a)Pyrene ng/m3 1 --- --- 0.61 --- --- --- --- 0.47 --- --- --- ---Ammonia µg/m3 400 --- --- 29.07 --- --- --- --- 25.83 --- --- --- ---Ozone µg/m3 180 --- --- 43.57 --- --- --- --- 38.29 --- --- --- ---Lead µg/m3 1 --- --- 0.22 --- --- --- --- 0.18 --- --- --- ---Nickel ng/m3 20 --- --- 17.04 --- --- --- --- 14.96 --- --- --- ---Arsenic ng/m3 6 --- --- 1.99 --- --- --- --- 1.75 --- --- --- ---Benzene µg/m3 5 --- --- 1.98 --- --- --- --- 1.71 --- --- --- ---
Name of Location MCS GGS- 01
Feb' 20
Date
Oct' 19 Nov' 19 Dec' 19 Jan' 20 Feb' 20 Oct' 19 Nov' 19 Dec' 19 Jan' 20 Oct' 19 Nov' 19
GGS- 02
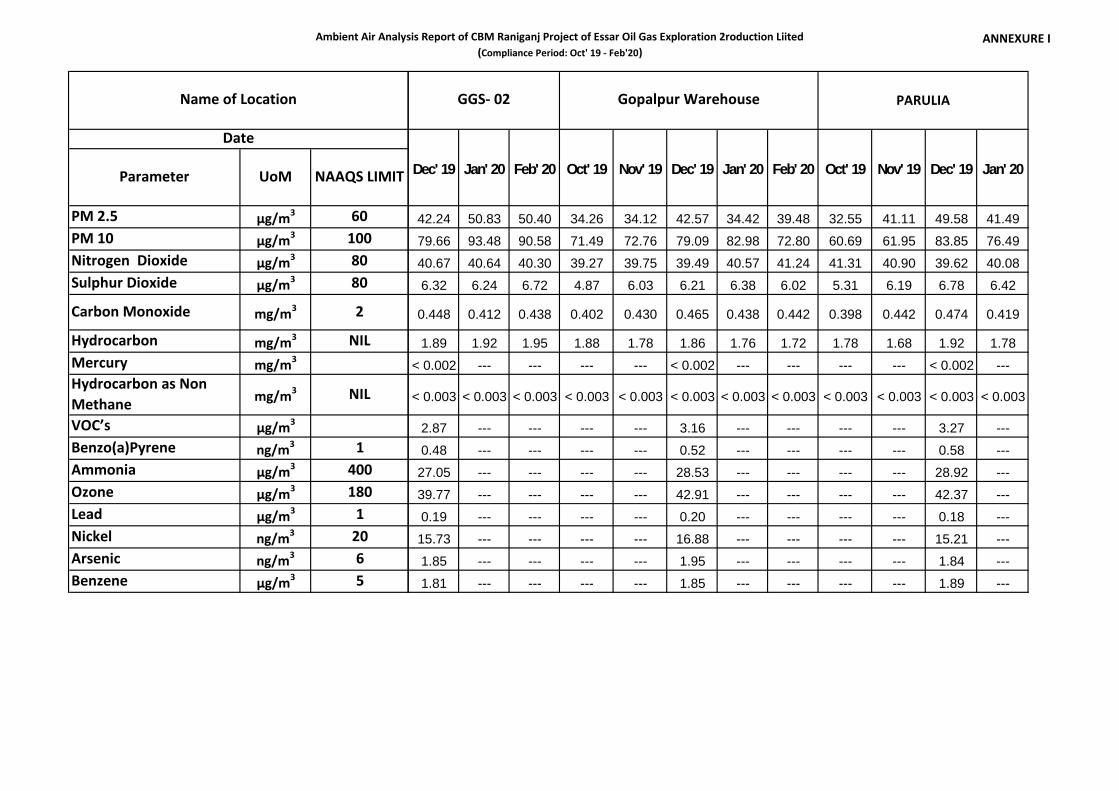
Ambient Air Analysis Report of CBM Raniganj Project of Essar Oil Gas Exploration 2roduction Liited(Compliance Period: Oct' 19 - Feb'20)
ANNEXURE I
Parameter UoM NAAQS LIMIT
PM 2.5 µg/m3 60PM 10 µg/m3 100Nitrogen Dioxide µg/m3 80Sulphur Dioxide µg/m3 80
Carbon Monoxide mg/m3 2
Hydrocarbon mg/m3 NILMercury mg/m3
Hydrocarbon as NonMethane mg/m3 NIL
VOC’s µg/m3
Benzo(a)Pyrene ng/m3 1Ammonia µg/m3 400Ozone µg/m3 180Lead µg/m3 1Nickel ng/m3 20Arsenic ng/m3 6Benzene µg/m3 5
Name of Location
Date
42.24 50.83 50.40 34.26 34.12 42.57 34.42 39.48 32.55 41.11 49.58 41.49
79.66 93.48 90.58 71.49 72.76 79.09 82.98 72.80 60.69 61.95 83.85 76.49
40.67 40.64 40.30 39.27 39.75 39.49 40.57 41.24 41.31 40.90 39.62 40.08
6.32 6.24 6.72 4.87 6.03 6.21 6.38 6.02 5.31 6.19 6.78 6.42
0.448 0.412 0.438 0.402 0.430 0.465 0.438 0.442 0.398 0.442 0.474 0.419
1.89 1.92 1.95 1.88 1.78 1.86 1.76 1.72 1.78 1.68 1.92 1.78
< 0.002 --- --- --- --- < 0.002 --- --- --- --- < 0.002 ---
< 0.003 < 0.003 < 0.003 < 0.003 < 0.003 < 0.003 < 0.003 < 0.003 < 0.003 < 0.003 < 0.003 < 0.003
2.87 --- --- --- --- 3.16 --- --- --- --- 3.27 ---
0.48 --- --- --- --- 0.52 --- --- --- --- 0.58 ---
27.05 --- --- --- --- 28.53 --- --- --- --- 28.92 ---
39.77 --- --- --- --- 42.91 --- --- --- --- 42.37 ---
0.19 --- --- --- --- 0.20 --- --- --- --- 0.18 ---
15.73 --- --- --- --- 16.88 --- --- --- --- 15.21 ---
1.85 --- --- --- --- 1.95 --- --- --- --- 1.84 ---
1.81 --- --- --- --- 1.85 --- --- --- --- 1.89 ---
Gopalpur Warehouse
Dec' 19 Jan' 20 Jan' 20Feb' 20Dec' 19 Jan' 20 Feb' 20 Oct' 19 Nov' 19 Oct' 19 Nov' 19 Dec' 19
GGS- 02 PARULIA
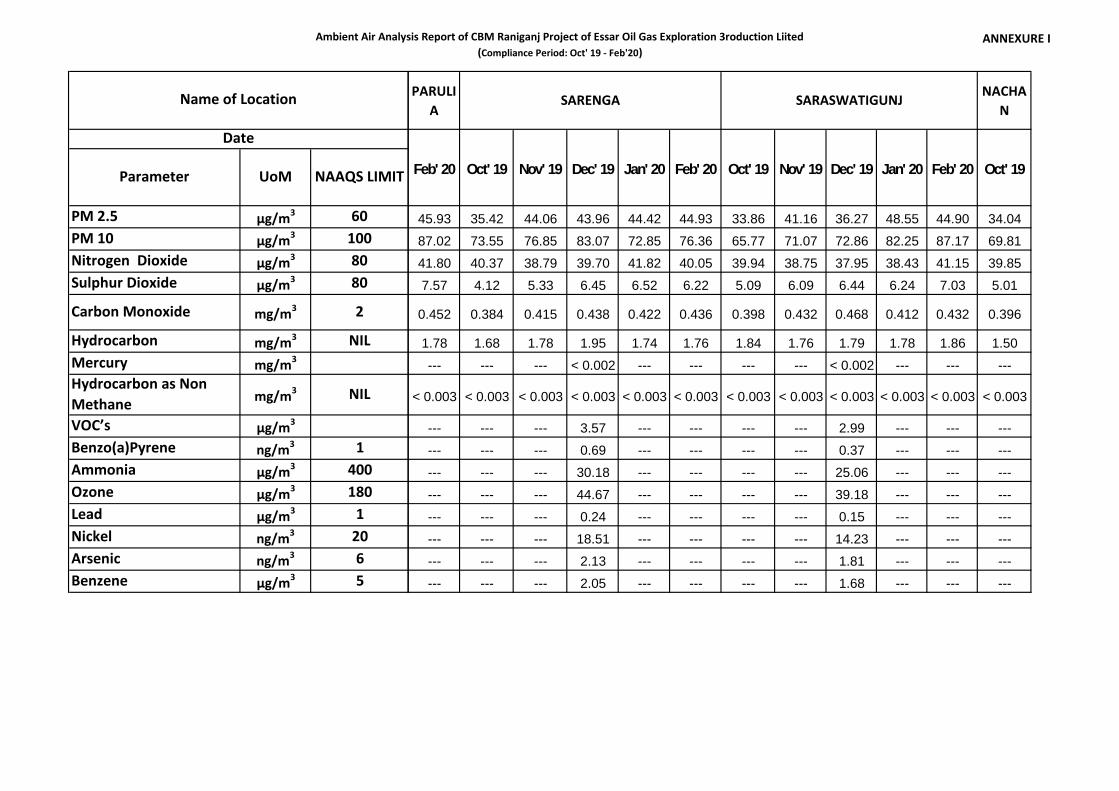
Ambient Air Analysis Report of CBM Raniganj Project of Essar Oil Gas Exploration 3roduction Liited(Compliance Period: Oct' 19 - Feb'20)
ANNEXURE I
Parameter UoM NAAQS LIMIT
PM 2.5 µg/m3 60PM 10 µg/m3 100Nitrogen Dioxide µg/m3 80Sulphur Dioxide µg/m3 80
Carbon Monoxide mg/m3 2
Hydrocarbon mg/m3 NILMercury mg/m3
Hydrocarbon as NonMethane mg/m3 NIL
VOC’s µg/m3
Benzo(a)Pyrene ng/m3 1Ammonia µg/m3 400Ozone µg/m3 180Lead µg/m3 1Nickel ng/m3 20Arsenic ng/m3 6Benzene µg/m3 5
Name of Location
Date
PARULIA
NACHAN
45.93 35.42 44.06 43.96 44.42 44.93 33.86 41.16 36.27 48.55 44.90 34.04
87.02 73.55 76.85 83.07 72.85 76.36 65.77 71.07 72.86 82.25 87.17 69.81
41.80 40.37 38.79 39.70 41.82 40.05 39.94 38.75 37.95 38.43 41.15 39.85
7.57 4.12 5.33 6.45 6.52 6.22 5.09 6.09 6.44 6.24 7.03 5.01
0.452 0.384 0.415 0.438 0.422 0.436 0.398 0.432 0.468 0.412 0.432 0.396
1.78 1.68 1.78 1.95 1.74 1.76 1.84 1.76 1.79 1.78 1.86 1.50
--- --- --- < 0.002 --- --- --- --- < 0.002 --- --- ---
< 0.003 < 0.003 < 0.003 < 0.003 < 0.003 < 0.003 < 0.003 < 0.003 < 0.003 < 0.003 < 0.003 < 0.003
--- --- --- 3.57 --- --- --- --- 2.99 --- --- ---
--- --- --- 0.69 --- --- --- --- 0.37 --- --- ---
--- --- --- 30.18 --- --- --- --- 25.06 --- --- ---
--- --- --- 44.67 --- --- --- --- 39.18 --- --- ---
--- --- --- 0.24 --- --- --- --- 0.15 --- --- ---
--- --- --- 18.51 --- --- --- --- 14.23 --- --- ---
--- --- --- 2.13 --- --- --- --- 1.81 --- --- ---
--- --- --- 2.05 --- --- --- --- 1.68 --- --- ---
SARENGA SARASWATIGUNJ
Oct' 19 Nov' 19 Dec' 19Feb' 20 Jan' 20 Oct' 19Feb' 20 Oct' 19 Nov' 19 Dec' 19 Jan' 20 Feb' 20
Ambient Air Analysis Report of CBM Raniganj Project of Essar Oil Gas Exploration 4roduction Liited(Compliance Period: Oct' 19 - Feb'20)
ANNEXURE I
Parameter UoM NAAQS LIMIT
PM 2.5 µg/m3 60PM 10 µg/m3 100Nitrogen Dioxide µg/m3 80Sulphur Dioxide µg/m3 80
Carbon Monoxide mg/m3 2
Hydrocarbon mg/m3 NILMercury mg/m3
Hydrocarbon as NonMethane mg/m3 NIL
VOC’s µg/m3
Benzo(a)Pyrene ng/m3 1Ammonia µg/m3 400Ozone µg/m3 180Lead µg/m3 1Nickel ng/m3 20Arsenic ng/m3 6Benzene µg/m3 5
Name of Location
Date
43.83 48.63 44.76 42.30 30.97 44.25 43.42 35.94 42.86 30.84 39.40 43.86
73.48 87.91 82.91 71.57 64.46 88.43 81.69 73.05 82.61 63.79 64.65 75.54
42.25 39.17 40.70 39.32 43.50 40.93 40.43 41.63 39.69 40.11 39.76 39.58
6.58 6.24 6.54 6.32 5.23 5.99 6.50 6.59 7.10 5.18 5.95 6.42
0.444 0.464 0.424 0.436 0.384 0.428 0.474 0.422 0.422 0.402 0.426 0.468
1.74 1.97 1.72 1.73 1.66 1.72 1.88 1.70 1.84 1.64 1.82 1.76
--- < 0.002 --- --- --- --- < 0.002 --- --- --- --- < 0.002
< 0.003 < 0.003 < 0.003 < 0.003 < 0.003 < 0.003 < 0.003 < 0.003 < 0.003 < 0.003 < 0.003 < 0.003
--- 3.23 --- --- --- --- 3.15 --- --- --- --- 2.83
--- 0.59 --- --- --- --- 0.50 --- --- --- --- 0.45
--- 30.14 --- --- --- --- 27.44 --- --- --- --- 25.58
--- 42.19 --- --- --- --- 41.49 --- --- --- --- 40.53
--- 0.21 --- --- --- --- 0.17 --- --- --- --- 0.15
--- 17.28 --- --- --- --- 15.02 --- --- --- --- 14.74
--- 1.85 --- --- --- --- 1.63 --- --- --- --- 1.72
--- 1.93 --- --- --- --- 1.83 --- --- --- --- 1.69
PRATPPUR
Nov' 19 Dec' 19 Jan' 20 Oct' 19 Nov' 19 Dec' 19Feb' 20 Oct' 19 Nov' 19 Dec' 19 Jan' 20 Feb' 20
NACHAN BANSIA
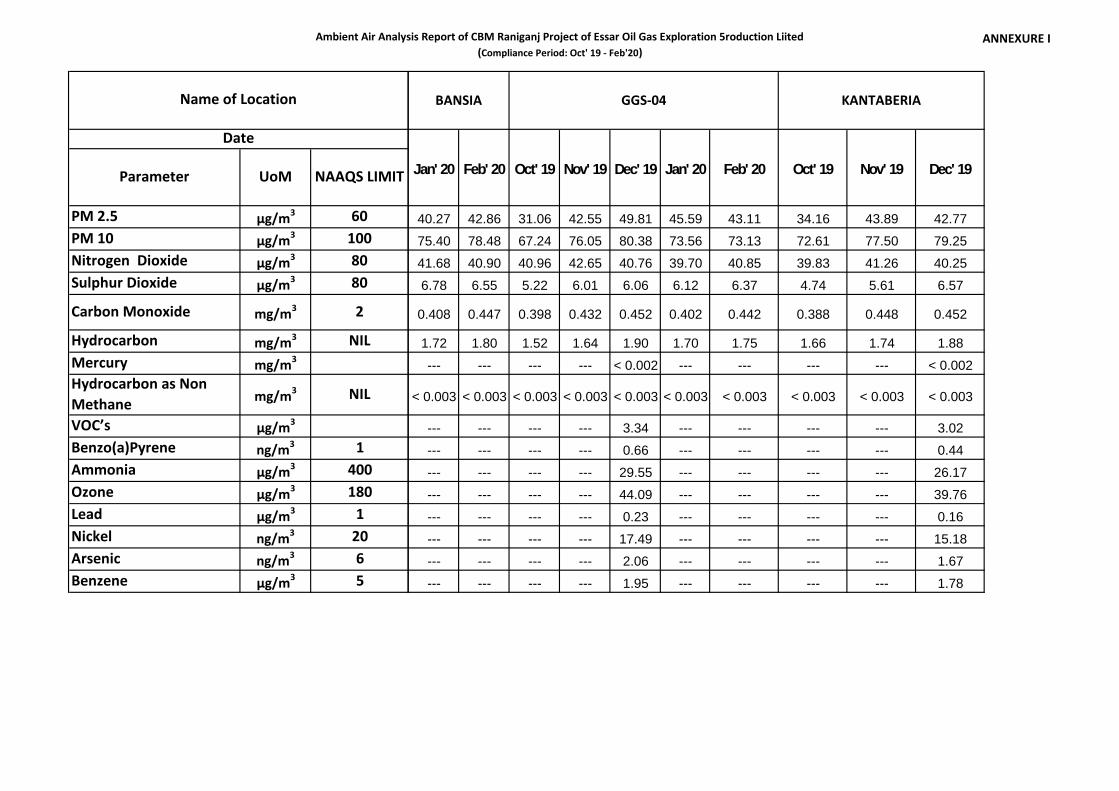
Ambient Air Analysis Report of CBM Raniganj Project of Essar Oil Gas Exploration 5roduction Liited(Compliance Period: Oct' 19 - Feb'20)
ANNEXURE I
Parameter UoM NAAQS LIMIT
PM 2.5 µg/m3 60PM 10 µg/m3 100Nitrogen Dioxide µg/m3 80Sulphur Dioxide µg/m3 80
Carbon Monoxide mg/m3 2
Hydrocarbon mg/m3 NILMercury mg/m3
Hydrocarbon as NonMethane mg/m3 NIL
VOC’s µg/m3
Benzo(a)Pyrene ng/m3 1Ammonia µg/m3 400Ozone µg/m3 180Lead µg/m3 1Nickel ng/m3 20Arsenic ng/m3 6Benzene µg/m3 5
Name of Location
Date
40.27 42.86 31.06 42.55 49.81 45.59 43.11 34.16 43.89 42.77
75.40 78.48 67.24 76.05 80.38 73.56 73.13 72.61 77.50 79.25
41.68 40.90 40.96 42.65 40.76 39.70 40.85 39.83 41.26 40.25
6.78 6.55 5.22 6.01 6.06 6.12 6.37 4.74 5.61 6.57
0.408 0.447 0.398 0.432 0.452 0.402 0.442 0.388 0.448 0.452
1.72 1.80 1.52 1.64 1.90 1.70 1.75 1.66 1.74 1.88
--- --- --- --- < 0.002 --- --- --- --- < 0.002
< 0.003 < 0.003 < 0.003 < 0.003 < 0.003 < 0.003 < 0.003 < 0.003 < 0.003 < 0.003
--- --- --- --- 3.34 --- --- --- --- 3.02
--- --- --- --- 0.66 --- --- --- --- 0.44
--- --- --- --- 29.55 --- --- --- --- 26.17
--- --- --- --- 44.09 --- --- --- --- 39.76
--- --- --- --- 0.23 --- --- --- --- 0.16
--- --- --- --- 17.49 --- --- --- --- 15.18
--- --- --- --- 2.06 --- --- --- --- 1.67
--- --- --- --- 1.95 --- --- --- --- 1.78
Feb' 20
GGS-04
Jan' 20 Oct' 19 Nov' 19 Dec' 19 Jan' 20Feb' 20 Oct' 19 Nov' 19 Dec' 19
BANSIA KANTABERIA
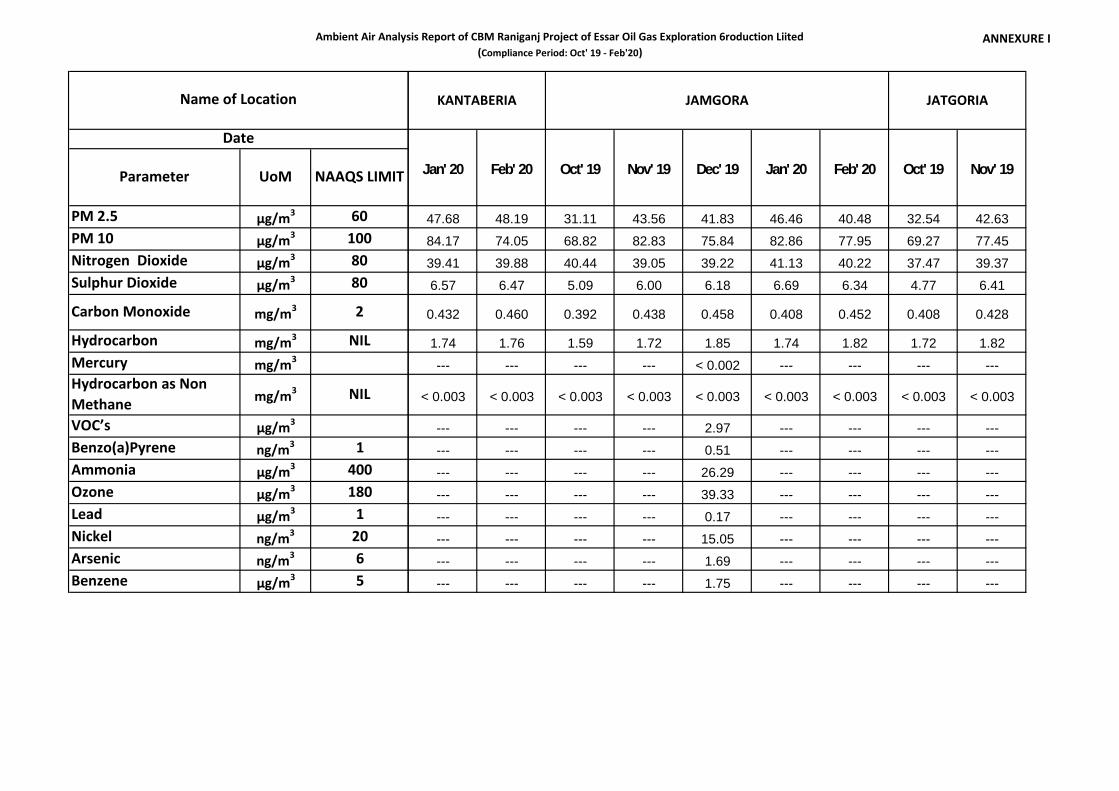
Ambient Air Analysis Report of CBM Raniganj Project of Essar Oil Gas Exploration 6roduction Liited(Compliance Period: Oct' 19 - Feb'20)
ANNEXURE I
Parameter UoM NAAQS LIMIT
PM 2.5 µg/m3 60PM 10 µg/m3 100Nitrogen Dioxide µg/m3 80Sulphur Dioxide µg/m3 80
Carbon Monoxide mg/m3 2
Hydrocarbon mg/m3 NILMercury mg/m3
Hydrocarbon as NonMethane mg/m3 NIL
VOC’s µg/m3
Benzo(a)Pyrene ng/m3 1Ammonia µg/m3 400Ozone µg/m3 180Lead µg/m3 1Nickel ng/m3 20Arsenic ng/m3 6Benzene µg/m3 5
Name of Location
Date
47.68 48.19 31.11 43.56 41.83 46.46 40.48 32.54 42.63
84.17 74.05 68.82 82.83 75.84 82.86 77.95 69.27 77.45
39.41 39.88 40.44 39.05 39.22 41.13 40.22 37.47 39.37
6.57 6.47 5.09 6.00 6.18 6.69 6.34 4.77 6.41
0.432 0.460 0.392 0.438 0.458 0.408 0.452 0.408 0.428
1.74 1.76 1.59 1.72 1.85 1.74 1.82 1.72 1.82
--- --- --- --- < 0.002 --- --- --- ---
< 0.003 < 0.003 < 0.003 < 0.003 < 0.003 < 0.003 < 0.003 < 0.003 < 0.003
--- --- --- --- 2.97 --- --- --- ---
--- --- --- --- 0.51 --- --- --- ---
--- --- --- --- 26.29 --- --- --- ---
--- --- --- --- 39.33 --- --- --- ---
--- --- --- --- 0.17 --- --- --- ---
--- --- --- --- 15.05 --- --- --- ---
--- --- --- --- 1.69 --- --- --- ---
--- --- --- --- 1.75 --- --- --- ---
Jan' 20 Feb' 20 Oct' 19 Nov' 19 Dec' 19 Jan' 20 Feb' 20 Oct' 19 Nov' 19
KANTABERIA JATGORIAJAMGORA
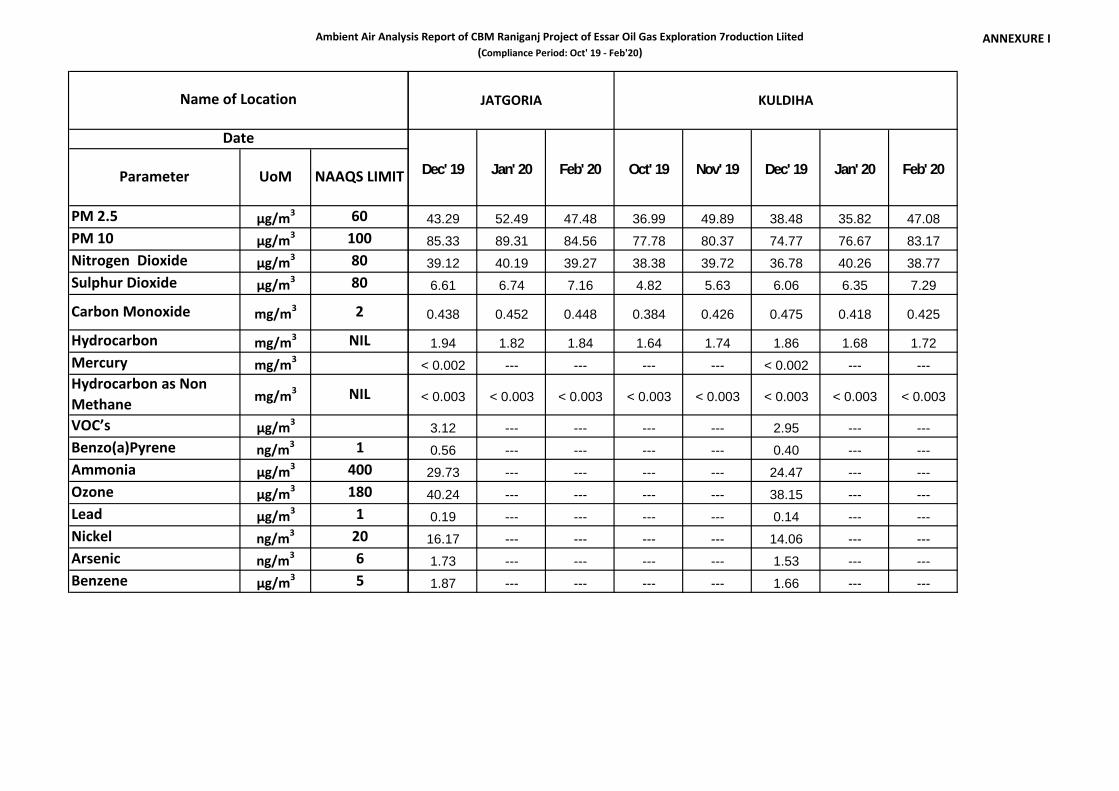
Ambient Air Analysis Report of CBM Raniganj Project of Essar Oil Gas Exploration 7roduction Liited(Compliance Period: Oct' 19 - Feb'20)
ANNEXURE I
Parameter UoM NAAQS LIMIT
PM 2.5 µg/m3 60PM 10 µg/m3 100Nitrogen Dioxide µg/m3 80Sulphur Dioxide µg/m3 80
Carbon Monoxide mg/m3 2
Hydrocarbon mg/m3 NILMercury mg/m3
Hydrocarbon as NonMethane mg/m3 NIL
VOC’s µg/m3
Benzo(a)Pyrene ng/m3 1Ammonia µg/m3 400Ozone µg/m3 180Lead µg/m3 1Nickel ng/m3 20Arsenic ng/m3 6Benzene µg/m3 5
Name of Location
Date
43.29 52.49 47.48 36.99 49.89 38.48 35.82 47.08
85.33 89.31 84.56 77.78 80.37 74.77 76.67 83.17
39.12 40.19 39.27 38.38 39.72 36.78 40.26 38.77
6.61 6.74 7.16 4.82 5.63 6.06 6.35 7.29
0.438 0.452 0.448 0.384 0.426 0.475 0.418 0.425
1.94 1.82 1.84 1.64 1.74 1.86 1.68 1.72
< 0.002 --- --- --- --- < 0.002 --- ---
< 0.003 < 0.003 < 0.003 < 0.003 < 0.003 < 0.003 < 0.003 < 0.003
3.12 --- --- --- --- 2.95 --- ---
0.56 --- --- --- --- 0.40 --- ---
29.73 --- --- --- --- 24.47 --- ---
40.24 --- --- --- --- 38.15 --- ---
0.19 --- --- --- --- 0.14 --- ---
16.17 --- --- --- --- 14.06 --- ---
1.73 --- --- --- --- 1.53 --- ---
1.87 --- --- --- --- 1.66 --- ---
Dec' 19 Jan' 20 Feb' 20
KULDIHA
Oct' 19 Nov' 19 Dec' 19 Jan' 20 Feb' 20
JATGORIA
ANNEXURE II: Ambient Noise Analysis Report
(Compliance Period: Oct' 19 – Feb’ 20)
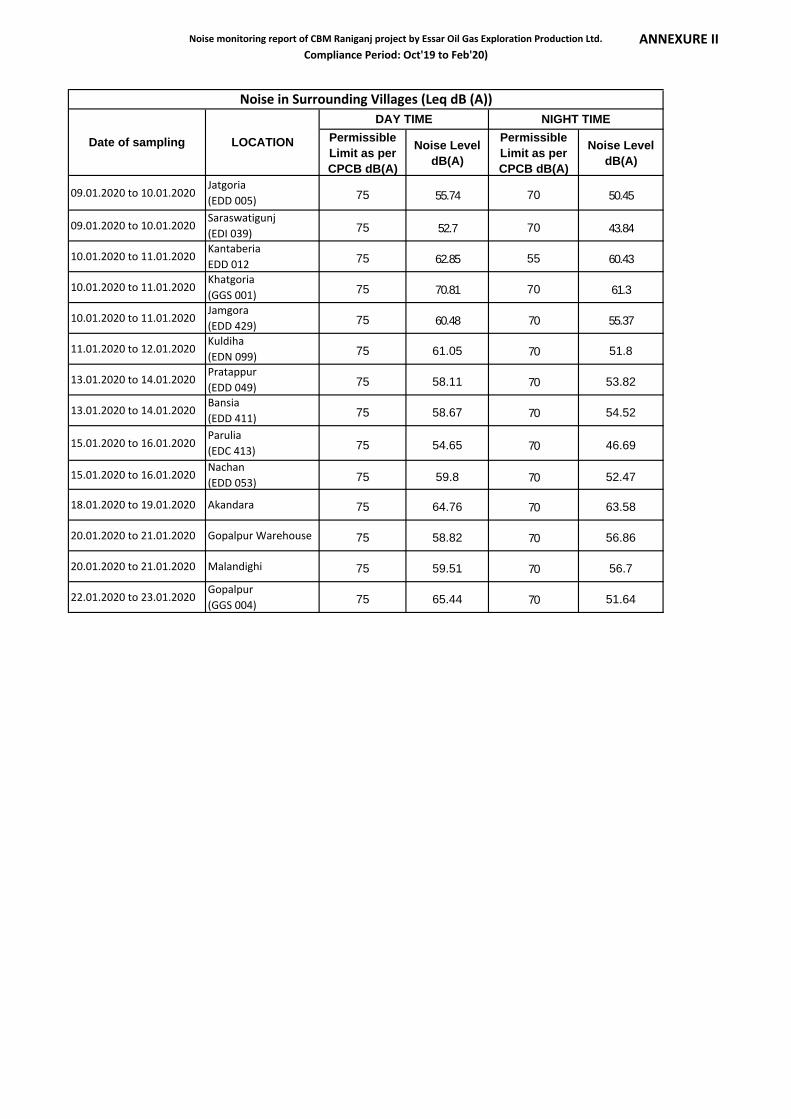
Noise monitoring report of CBM Raniganj project by Essar Oil Gas Exploration Production Ltd.Compliance Period: Oct'19 to Feb'20)
ANNEXURE II
PermissibleLimit as perCPCB dB(A)
Noise LeveldB(A)
PermissibleLimit as perCPCB dB(A)
Noise LeveldB(A)
09.01.2020 to 10.01.2020Jatgoria(EDD 005) 75 55.74 70 50.45
09.01.2020 to 10.01.2020Saraswatigunj(EDI 039) 75 52.7 70 43.84
10.01.2020 to 11.01.2020KantaberiaEDD 012 75 62.85 55 60.43
10.01.2020 to 11.01.2020Khatgoria(GGS 001) 75 70.81 70 61.3
10.01.2020 to 11.01.2020Jamgora(EDD 429) 75 60.48 70 55.37
11.01.2020 to 12.01.2020Kuldiha(EDN 099) 75 61.05 70 51.8
13.01.2020 to 14.01.2020Pratappur(EDD 049) 75 58.11 70 53.82
13.01.2020 to 14.01.2020Bansia(EDD 411) 75 58.67 70 54.52
15.01.2020 to 16.01.2020Parulia(EDC 413) 75 54.65 70 46.69
15.01.2020 to 16.01.2020Nachan(EDD 053) 75 59.8 70 52.47
18.01.2020 to 19.01.2020 Akandara 75 64.76 70 63.58
20.01.2020 to 21.01.2020 Gopalpur Warehouse 75 58.82 70 56.86
20.01.2020 to 21.01.2020 Malandighi 75 59.51 70 56.7
22.01.2020 to 23.01.2020Gopalpur(GGS 004) 75 65.44 70 51.64
Noise in Surrounding Villages (Leq dB (A))
Date of sampling LOCATION
DAY TIME NIGHT TIME
ANNEXURE III: Produced Water Analysis Report
(Compliance Period: Oct'19- Feb’ 20)
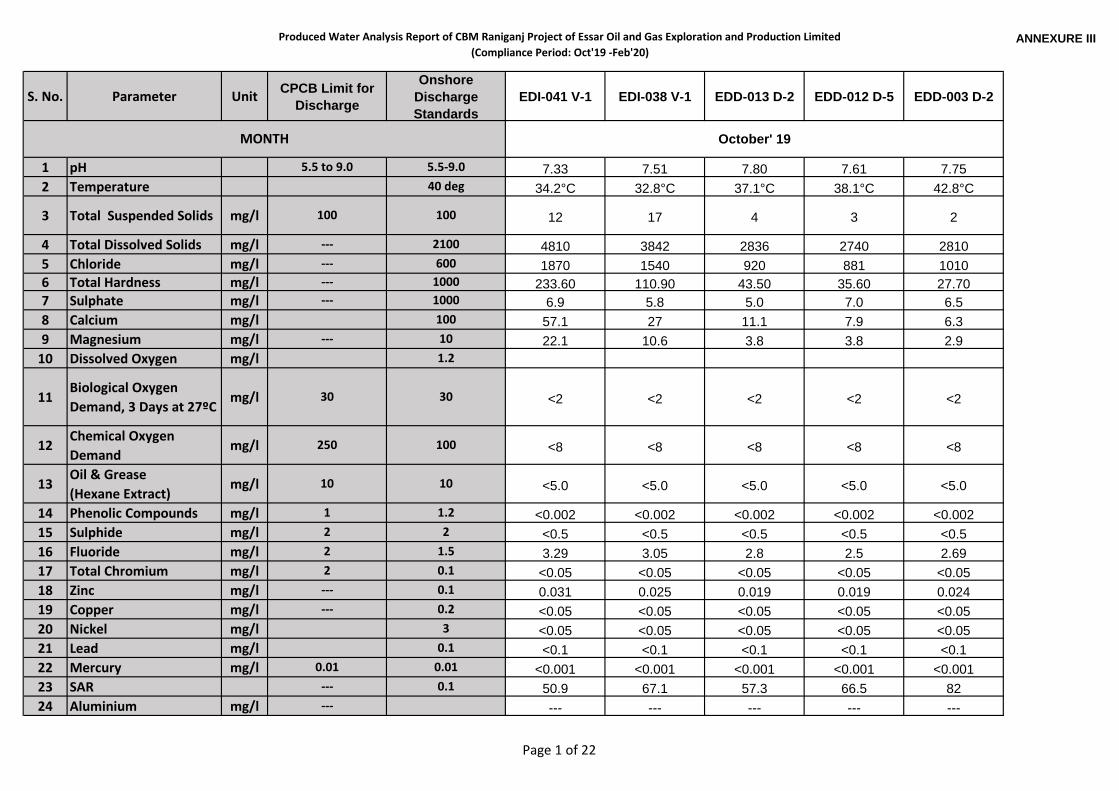
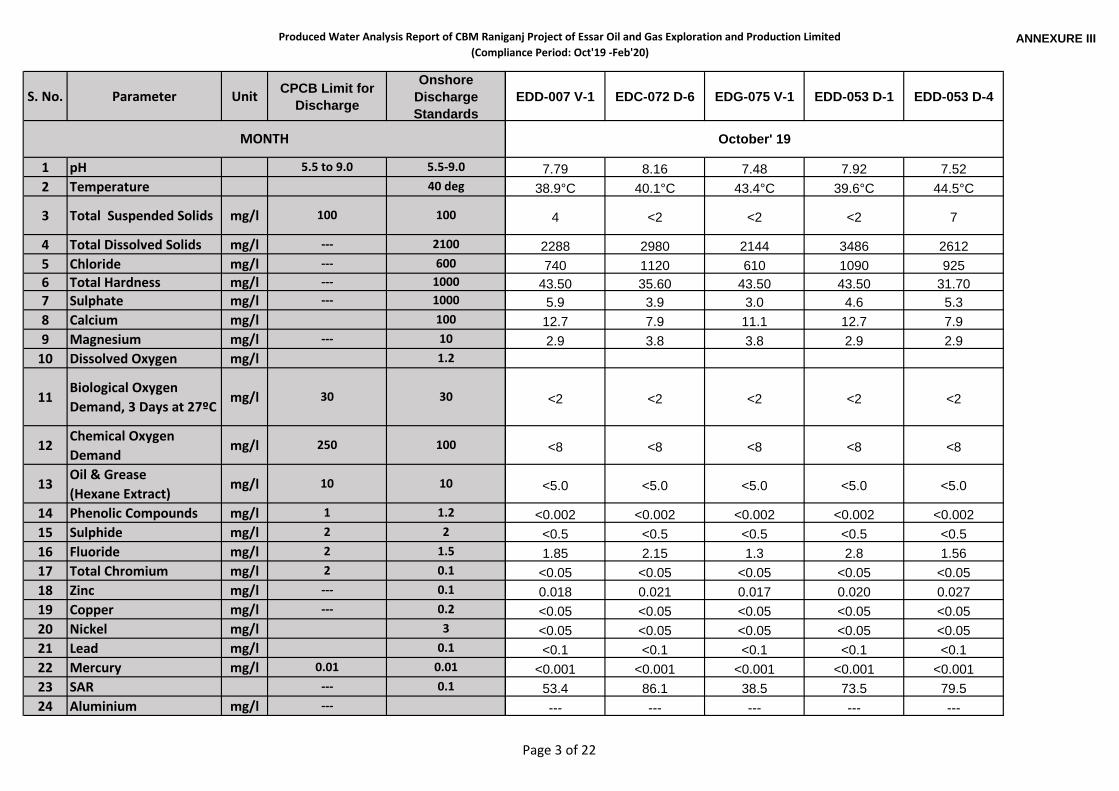
Produced Water Analysis Report of CBM Raniganj Project of Essar Oil and Gas Exploration and Production Limited(Compliance Period: Oct'19 -Feb'20)
ANNEXURE III
S. No. Parameter Unit CPCB Limit forDischarge
OnshoreDischargeStandards
EDI-041 V-1 EDI-038 V-1 EDD-013 D-2 EDD-012 D-5 EDD-003 D-2
1 pH 5.5 to 9.0 5.5-9.0 7.33 7.51 7.80 7.61 7.752 Temperature 40 deg 34.2°C 32.8°C 37.1°C 38.1°C 42.8°C
3 Total Suspended Solids mg/l 100 100 12 17 4 3 2
4 Total Dissolved Solids mg/l --- 2100 4810 3842 2836 2740 28105 Chloride mg/l --- 600 1870 1540 920 881 10106 Total Hardness mg/l --- 1000 233.60 110.90 43.50 35.60 27.707 Sulphate mg/l --- 1000 6.9 5.8 5.0 7.0 6.58 Calcium mg/l 100 57.1 27 11.1 7.9 6.39 Magnesium mg/l --- 10 22.1 10.6 3.8 3.8 2.9
10 Dissolved Oxygen mg/l 1.2
11Biological OxygenDemand, 3 Days at 27ºC
mg/l 30 30 <2 <2 <2 <2 <2
12Chemical OxygenDemand
mg/l 250 100 <8 <8 <8 <8 <8
13Oil & Grease(Hexane Extract)
mg/l 10 10 <5.0 <5.0 <5.0 <5.0 <5.0
14 Phenolic Compounds mg/l 1 1.2 <0.002 <0.002 <0.002 <0.002 <0.00215 Sulphide mg/l 2 2 <0.5 <0.5 <0.5 <0.5 <0.516 Fluoride mg/l 2 1.5 3.29 3.05 2.8 2.5 2.6917 Total Chromium mg/l 2 0.1 <0.05 <0.05 <0.05 <0.05 <0.0518 Zinc mg/l --- 0.1 0.031 0.025 0.019 0.019 0.02419 Copper mg/l --- 0.2 <0.05 <0.05 <0.05 <0.05 <0.0520 Nickel mg/l 3 <0.05 <0.05 <0.05 <0.05 <0.0521 Lead mg/l 0.1 <0.1 <0.1 <0.1 <0.1 <0.122 Mercury mg/l 0.01 0.01 <0.001 <0.001 <0.001 <0.001 <0.00123 SAR --- 0.1 50.9 67.1 57.3 66.5 8224 Aluminium mg/l --- --- --- --- --- ---
MONTH October' 19
Page 1 of 22

Produced Water Analysis Report of CBM Raniganj Project of Essar Oil and Gas Exploration and Production Limited(Compliance Period: Oct'19 -Feb'20)
ANNEXURE III
S. No. Parameter Unit CPCB Limit forDischarge
OnshoreDischargeStandards
EDI-041 V-1 EDI-038 V-1 EDD-013 D-2 EDD-012 D-5 EDD-003 D-2
MONTH October' 19
25 Lithium mg/l --- --- --- --- ---26 Molybdenum mg/l --- --- --- --- --- ---27 Palladium mg/l --- --- --- --- --- ---28 Selenium mg/l --- --- --- --- ---29 Vanadium mg/l --- --- --- --- --- ---30 Cadmium mg/l --- --- --- --- ---31 Cobalt mg/l --- --- --- --- ---32 Bicarbonate mg/l --- --- --- --- ---33 Sodium mg/l --- 1790.0 1630.0 870.0 910.0 990.034 Cyanide mg/l 0.2 0.2 <0.02 <0.02 <0.02 <0.02 <0.02
35 Hexavalent Chromium mg/l 0.1 <0.01 <0.01 <0.01 <0.01 <0.01
36 % Sodium 60 --- --- --- --- ---
Page 2 of 22
Produced Water Analysis Report of CBM Raniganj Project of Essar Oil and Gas Exploration and Production Limited(Compliance Period: Oct'19 -Feb'20)
ANNEXURE III
S. No. Parameter Unit CPCB Limit forDischarge
OnshoreDischargeStandards
1 pH 5.5 to 9.0 5.5-9.02 Temperature 40 deg
3 Total Suspended Solids mg/l 100 100
4 Total Dissolved Solids mg/l --- 21005 Chloride mg/l --- 6006 Total Hardness mg/l --- 10007 Sulphate mg/l --- 10008 Calcium mg/l 1009 Magnesium mg/l --- 10
10 Dissolved Oxygen mg/l 1.2
11Biological OxygenDemand, 3 Days at 27ºC
mg/l 30 30
12Chemical OxygenDemand
mg/l 250 100
13Oil & Grease(Hexane Extract)
mg/l 10 10
14 Phenolic Compounds mg/l 1 1.215 Sulphide mg/l 2 216 Fluoride mg/l 2 1.517 Total Chromium mg/l 2 0.118 Zinc mg/l --- 0.119 Copper mg/l --- 0.220 Nickel mg/l 321 Lead mg/l 0.122 Mercury mg/l 0.01 0.0123 SAR --- 0.124 Aluminium mg/l ---
MONTH
EDD-007 V-1 EDC-072 D-6 EDG-075 V-1 EDD-053 D-1 EDD-053 D-4
7.79 8.16 7.48 7.92 7.5238.9°C 40.1°C 43.4°C 39.6°C 44.5°C
4 <2 <2 <2 7
2288 2980 2144 3486 2612740 1120 610 1090 925
43.50 35.60 43.50 43.50 31.705.9 3.9 3.0 4.6 5.312.7 7.9 11.1 12.7 7.92.9 3.8 3.8 2.9 2.9
<2 <2 <2 <2 <2
<8 <8 <8 <8 <8
<5.0 <5.0 <5.0 <5.0 <5.0
<0.002 <0.002 <0.002 <0.002 <0.002<0.5 <0.5 <0.5 <0.5 <0.51.85 2.15 1.3 2.8 1.56
<0.05 <0.05 <0.05 <0.05 <0.050.018 0.021 0.017 0.020 0.027<0.05 <0.05 <0.05 <0.05 <0.05<0.05 <0.05 <0.05 <0.05 <0.05<0.1 <0.1 <0.1 <0.1 <0.1
<0.001 <0.001 <0.001 <0.001 <0.00153.4 86.1 38.5 73.5 79.5--- --- --- --- ---
October' 19
Page 3 of 22
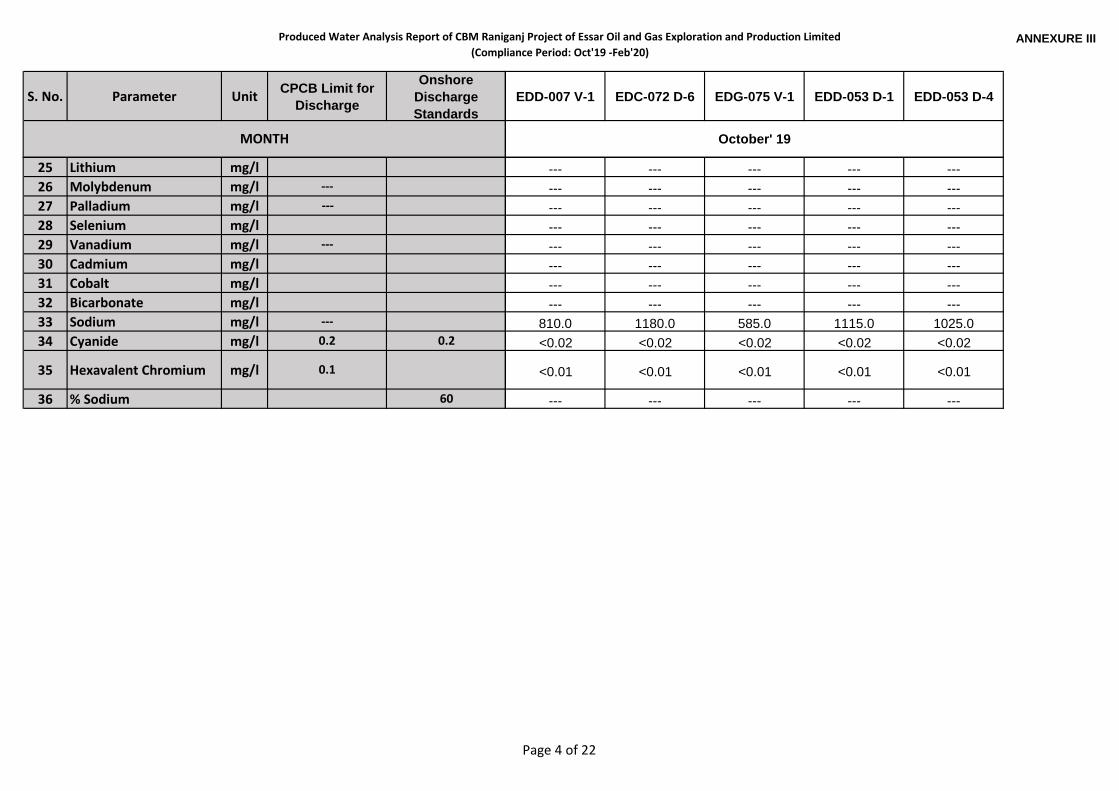
Produced Water Analysis Report of CBM Raniganj Project of Essar Oil and Gas Exploration and Production Limited(Compliance Period: Oct'19 -Feb'20)
ANNEXURE III
S. No. Parameter Unit CPCB Limit forDischarge
OnshoreDischargeStandards
MONTH
25 Lithium mg/l26 Molybdenum mg/l ---27 Palladium mg/l ---28 Selenium mg/l29 Vanadium mg/l ---30 Cadmium mg/l31 Cobalt mg/l32 Bicarbonate mg/l33 Sodium mg/l ---34 Cyanide mg/l 0.2 0.2
35 Hexavalent Chromium mg/l 0.1
36 % Sodium 60
EDD-007 V-1 EDC-072 D-6 EDG-075 V-1 EDD-053 D-1 EDD-053 D-4
October' 19
--- --- --- --- ------ --- --- --- ------ --- --- --- ------ --- --- --- ------ --- --- --- ------ --- --- --- ------ --- --- --- ------ --- --- --- ---
810.0 1180.0 585.0 1115.0 1025.0<0.02 <0.02 <0.02 <0.02 <0.02
<0.01 <0.01 <0.01 <0.01 <0.01
--- --- --- --- ---
Page 4 of 22
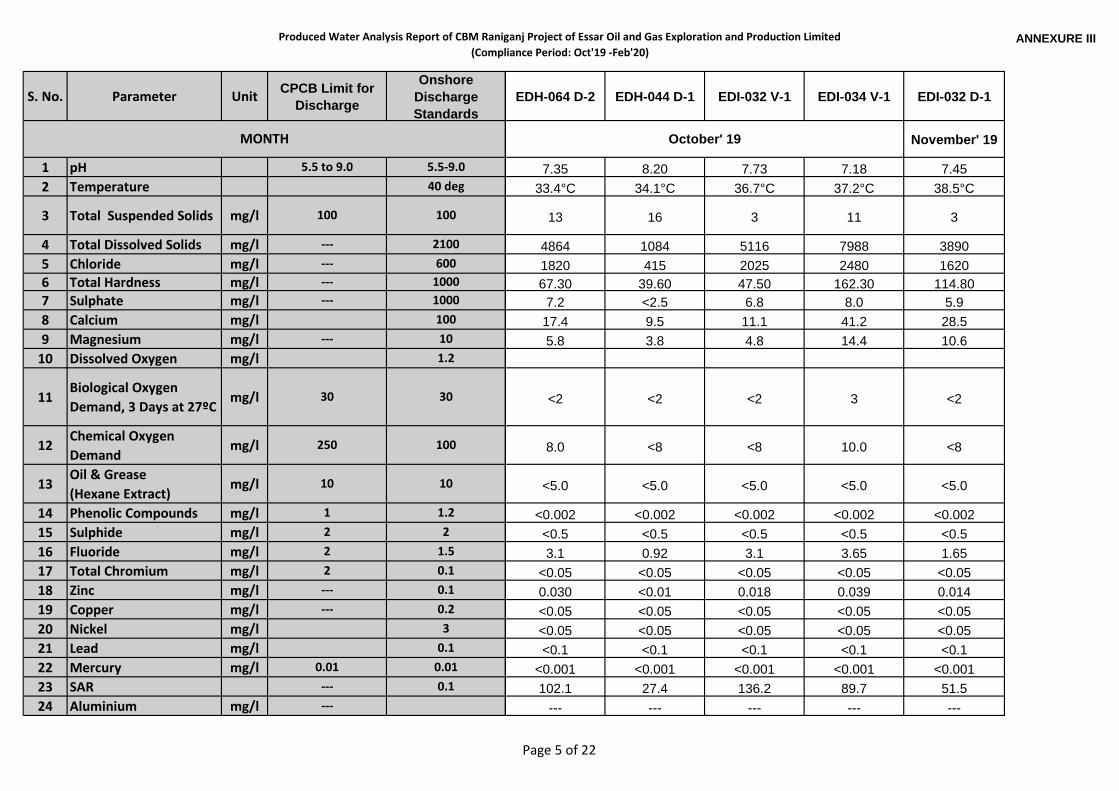
Produced Water Analysis Report of CBM Raniganj Project of Essar Oil and Gas Exploration and Production Limited(Compliance Period: Oct'19 -Feb'20)
ANNEXURE III
S. No. Parameter Unit CPCB Limit forDischarge
OnshoreDischargeStandards
1 pH 5.5 to 9.0 5.5-9.02 Temperature 40 deg
3 Total Suspended Solids mg/l 100 100
4 Total Dissolved Solids mg/l --- 21005 Chloride mg/l --- 6006 Total Hardness mg/l --- 10007 Sulphate mg/l --- 10008 Calcium mg/l 1009 Magnesium mg/l --- 10
10 Dissolved Oxygen mg/l 1.2
11Biological OxygenDemand, 3 Days at 27ºC
mg/l 30 30
12Chemical OxygenDemand
mg/l 250 100
13Oil & Grease(Hexane Extract)
mg/l 10 10
14 Phenolic Compounds mg/l 1 1.215 Sulphide mg/l 2 216 Fluoride mg/l 2 1.517 Total Chromium mg/l 2 0.118 Zinc mg/l --- 0.119 Copper mg/l --- 0.220 Nickel mg/l 321 Lead mg/l 0.122 Mercury mg/l 0.01 0.0123 SAR --- 0.124 Aluminium mg/l ---
MONTH
EDH-064 D-2 EDH-044 D-1 EDI-032 V-1 EDI-034 V-1 EDI-032 D-1
November' 19
7.35 8.20 7.73 7.18 7.4533.4°C 34.1°C 36.7°C 37.2°C 38.5°C
13 16 3 11 3
4864 1084 5116 7988 38901820 415 2025 2480 162067.30 39.60 47.50 162.30 114.807.2 <2.5 6.8 8.0 5.917.4 9.5 11.1 41.2 28.55.8 3.8 4.8 14.4 10.6
<2 <2 <2 3 <2
8.0 <8 <8 10.0 <8
<5.0 <5.0 <5.0 <5.0 <5.0
<0.002 <0.002 <0.002 <0.002 <0.002<0.5 <0.5 <0.5 <0.5 <0.53.1 0.92 3.1 3.65 1.65
<0.05 <0.05 <0.05 <0.05 <0.050.030 <0.01 0.018 0.039 0.014<0.05 <0.05 <0.05 <0.05 <0.05<0.05 <0.05 <0.05 <0.05 <0.05<0.1 <0.1 <0.1 <0.1 <0.1
<0.001 <0.001 <0.001 <0.001 <0.001102.1 27.4 136.2 89.7 51.5
--- --- --- --- ---
October' 19
Page 5 of 22
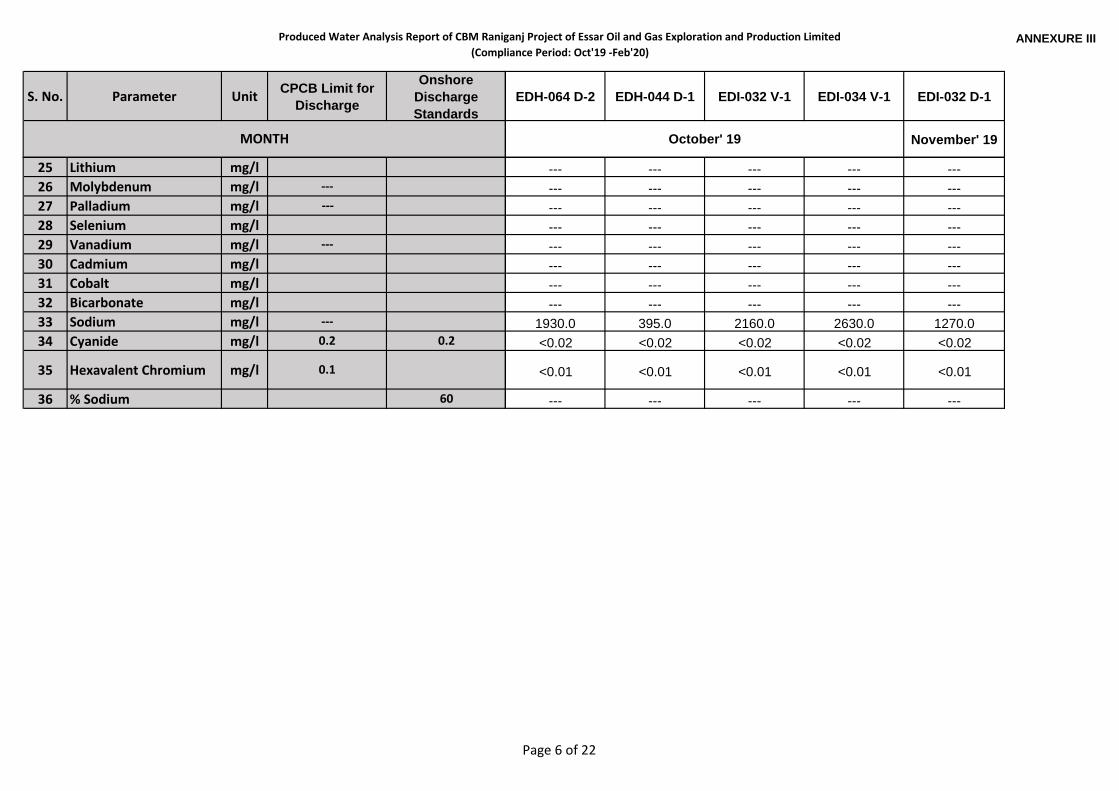
Produced Water Analysis Report of CBM Raniganj Project of Essar Oil and Gas Exploration and Production Limited(Compliance Period: Oct'19 -Feb'20)
ANNEXURE III
S. No. Parameter Unit CPCB Limit forDischarge
OnshoreDischargeStandards
MONTH
25 Lithium mg/l26 Molybdenum mg/l ---27 Palladium mg/l ---28 Selenium mg/l29 Vanadium mg/l ---30 Cadmium mg/l31 Cobalt mg/l32 Bicarbonate mg/l33 Sodium mg/l ---34 Cyanide mg/l 0.2 0.2
35 Hexavalent Chromium mg/l 0.1
36 % Sodium 60
EDH-064 D-2 EDH-044 D-1 EDI-032 V-1 EDI-034 V-1 EDI-032 D-1
November' 19October' 19
--- --- --- --- ------ --- --- --- ------ --- --- --- ------ --- --- --- ------ --- --- --- ------ --- --- --- ------ --- --- --- ------ --- --- --- ---
1930.0 395.0 2160.0 2630.0 1270.0<0.02 <0.02 <0.02 <0.02 <0.02
<0.01 <0.01 <0.01 <0.01 <0.01
--- --- --- --- ---
Page 6 of 22

Produced Water Analysis Report of CBM Raniganj Project of Essar Oil and Gas Exploration and Production Limited(Compliance Period: Oct'19 -Feb'20)
ANNEXURE III
S. No. Parameter Unit CPCB Limit forDischarge
OnshoreDischargeStandards
1 pH 5.5 to 9.0 5.5-9.02 Temperature 40 deg
3 Total Suspended Solids mg/l 100 100
4 Total Dissolved Solids mg/l --- 21005 Chloride mg/l --- 6006 Total Hardness mg/l --- 10007 Sulphate mg/l --- 10008 Calcium mg/l 1009 Magnesium mg/l --- 10
10 Dissolved Oxygen mg/l 1.2
11Biological OxygenDemand, 3 Days at 27ºC
mg/l 30 30
12Chemical OxygenDemand
mg/l 250 100
13Oil & Grease(Hexane Extract)
mg/l 10 10
14 Phenolic Compounds mg/l 1 1.215 Sulphide mg/l 2 216 Fluoride mg/l 2 1.517 Total Chromium mg/l 2 0.118 Zinc mg/l --- 0.119 Copper mg/l --- 0.220 Nickel mg/l 321 Lead mg/l 0.122 Mercury mg/l 0.01 0.0123 SAR --- 0.124 Aluminium mg/l ---
MONTH
EDD-053 D-4 EDG-075 D-1 EDD-049 D-1 EDD-003 D-3 EDD-008 D-3
7.51 7.67 7.68 7.58 7.9143.7°C 42.5°C 38.2°C 38.9°C 37.1°C
11 <2 6 2 <2
2698 1482 3045 2422 25861130 612 1085 735 81043.50 35.60 43.50 47.50 31.704.6 3.6 6.1 5.3 5.911.1 9.5 9.5 11.1 7.93.8 2.9 4.8 4.8 2.9
<2 <2 <2 <2 <2
<8 <8 <8 <8 <8
<5.0 <5.0 <5.0 <5.0 <5.0
<0.002 <0.002 <0.002 <0.002 <0.002<0.5 <0.5 <0.5 <0.5 <0.51.05 0.9 2.25 1.8 1.93
<0.05 <0.05 <0.05 <0.05 <0.050.011 <0.01 0.019 0.013 0.016<0.05 <0.05 <0.05 <0.05 <0.05<0.05 <0.05 <0.05 <0.05 <0.05<0.1 <0.1 <0.1 <0.1 <0.1
<0.001 <0.001 <0.001 <0.001 <0.00162 31.4 60 38.7 56.1--- --- --- --- ---
November' 19
Page 7 of 22
Produced Water Analysis Report of CBM Raniganj Project of Essar Oil and Gas Exploration and Production Limited(Compliance Period: Oct'19 -Feb'20)
ANNEXURE III
S. No. Parameter Unit CPCB Limit forDischarge
OnshoreDischargeStandards
MONTH
25 Lithium mg/l26 Molybdenum mg/l ---27 Palladium mg/l ---28 Selenium mg/l29 Vanadium mg/l ---30 Cadmium mg/l31 Cobalt mg/l32 Bicarbonate mg/l33 Sodium mg/l ---34 Cyanide mg/l 0.2 0.2
35 Hexavalent Chromium mg/l 0.1
36 % Sodium 60
EDD-053 D-4 EDG-075 D-1 EDD-049 D-1 EDD-003 D-3 EDD-008 D-3
November' 19
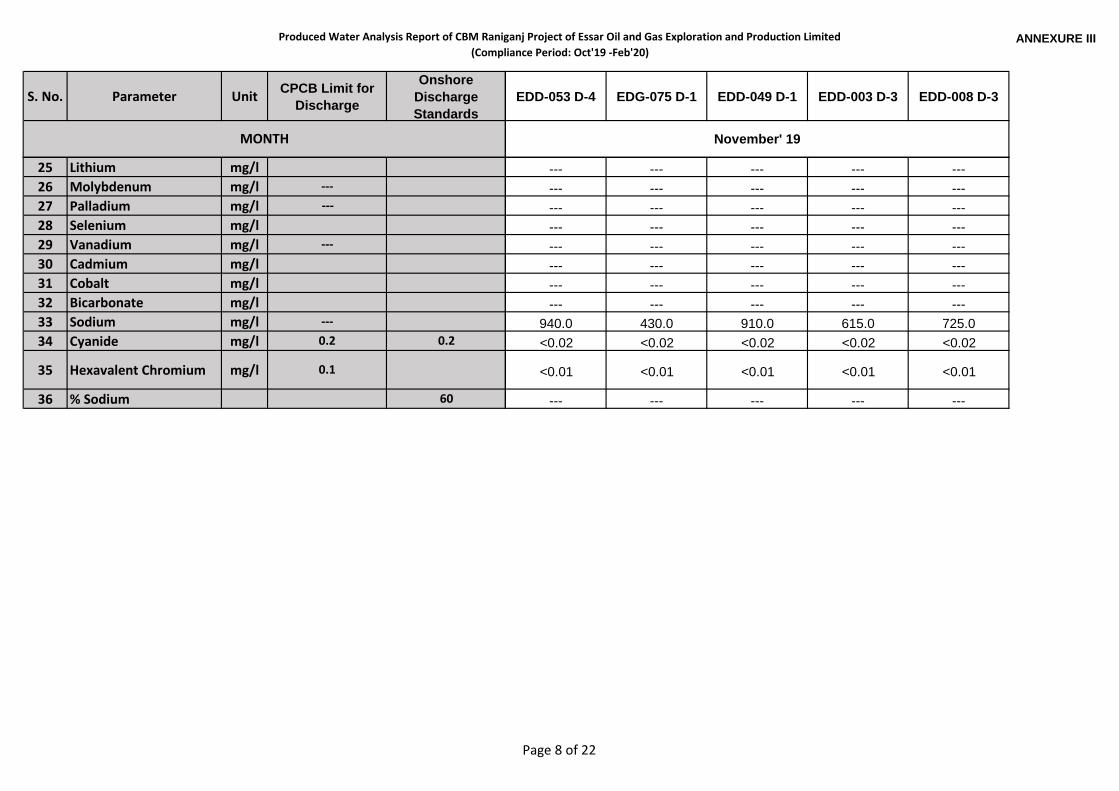
--- --- --- --- ------ --- --- --- ------ --- --- --- ------ --- --- --- ------ --- --- --- ------ --- --- --- ------ --- --- --- ------ --- --- --- ---
940.0 430.0 910.0 615.0 725.0<0.02 <0.02 <0.02 <0.02 <0.02
<0.01 <0.01 <0.01 <0.01 <0.01
--- --- --- --- ---
Page 8 of 22

Produced Water Analysis Report of CBM Raniganj Project of Essar Oil and Gas Exploration and Production Limited(Compliance Period: Oct'19 -Feb'20)
ANNEXURE III
S. No. Parameter Unit CPCB Limit forDischarge
OnshoreDischargeStandards
1 pH 5.5 to 9.0 5.5-9.02 Temperature 40 deg
3 Total Suspended Solids mg/l 100 100
4 Total Dissolved Solids mg/l --- 21005 Chloride mg/l --- 6006 Total Hardness mg/l --- 10007 Sulphate mg/l --- 10008 Calcium mg/l 1009 Magnesium mg/l --- 10
10 Dissolved Oxygen mg/l 1.2
11Biological OxygenDemand, 3 Days at 27ºC
mg/l 30 30
12Chemical OxygenDemand
mg/l 250 100
13Oil & Grease(Hexane Extract)
mg/l 10 10
14 Phenolic Compounds mg/l 1 1.215 Sulphide mg/l 2 216 Fluoride mg/l 2 1.517 Total Chromium mg/l 2 0.118 Zinc mg/l --- 0.119 Copper mg/l --- 0.220 Nickel mg/l 321 Lead mg/l 0.122 Mercury mg/l 0.01 0.0123 SAR --- 0.124 Aluminium mg/l ---
MONTH
EDI-123-D5 EDE-041 D2 EDE-001-V1 EDD-007-D1 EDD-011-D2
7.24 6.91 7.81 7.53 7.5036.8°C 37.1°C 27.4°C 37.4°C 33.3°C
107 23 20 2 3
4028 3480 2976 1620 22841180 1075 882 470 635
807.00 392.00 83.20 31.70 31.707.8 7.0 6.3 6.1 6.8
220.6 100.0 20.6 7.9 6.381.8 34.6 7.7 2.9 3.84.9 5.3 5.1 5.3 5.1
2 <2 <2 <2 <2
10.0 8.0 <8 <8 <8
<5.0 <5.0 <5.0 <5.0 <5.0
<0.002 <0.002 <0.002 <0.002 <0.002<0.5 <0.5 <0.5 <0.5 <0.53.2 2.95 2.25 1.7 1.85
<0.05 <0.05 <0.05 <0.05 <0.050.023 0.017 0.016 0.014 0.019<0.05 <0.05 <0.05 <0.05 <0.05<0.05 <0.05 <0.05 <0.05 <0.05<0.1 <0.1 <0.1 <0.1 <0.1
<0.001 <0.001 <0.001 <0.001 <0.00118.1 26.1 44.1 30.3 53.8
<0.01 <0.01 <0.01 <0.01 <0.01
December' 19
Page 9 of 22

Produced Water Analysis Report of CBM Raniganj Project of Essar Oil and Gas Exploration and Production Limited(Compliance Period: Oct'19 -Feb'20)
ANNEXURE III
S. No. Parameter Unit CPCB Limit forDischarge
OnshoreDischargeStandards
MONTH
25 Lithium mg/l26 Molybdenum mg/l ---27 Palladium mg/l ---28 Selenium mg/l29 Vanadium mg/l ---30 Cadmium mg/l31 Cobalt mg/l32 Bicarbonate mg/l33 Sodium mg/l ---34 Cyanide mg/l 0.2 0.2
35 Hexavalent Chromium mg/l 0.1
36 % Sodium 60
EDI-123-D5 EDE-041 D2 EDE-001-V1 EDD-007-D1 EDD-011-D2
December' 19
<0.5 <0.5 <0.5 <0.5 <0.5<0.5 <0.5 <0.5 <0.5 <0.5<0.5 <0.5 <0.5 <0.5 <0.5
<0.005 <0.005 <0.005 <0.005 <0.005<0.2 <0.2 <0.2 <0.2 <0.2<0.02 <0.02 <0.02 <0.02 <0.02<0.1 <0.1 <0.1 <0.1 <0.1
615.00 540.00 475.00 325.00 438.001240.0 1190.0 925.0 390.0 695.0<0.02 <0.02 <0.02 <0.02 <0.02
<0.01 <0.01 <0.01 <0.01 <0.01
75.3 86.9 96.1 96.5 98
Page 10 of 22
Produced Water Analysis Report of CBM Raniganj Project of Essar Oil and Gas Exploration and Production Limited(Compliance Period: Oct'19 -Feb'20)
ANNEXURE III
S. No. Parameter Unit CPCB Limit forDischarge
OnshoreDischargeStandards
1 pH 5.5 to 9.0 5.5-9.02 Temperature 40 deg
3 Total Suspended Solids mg/l 100 100
4 Total Dissolved Solids mg/l --- 21005 Chloride mg/l --- 6006 Total Hardness mg/l --- 10007 Sulphate mg/l --- 10008 Calcium mg/l 1009 Magnesium mg/l --- 10
10 Dissolved Oxygen mg/l 1.2
11Biological OxygenDemand, 3 Days at 27ºC
mg/l 30 30
12Chemical OxygenDemand
mg/l 250 100
13Oil & Grease(Hexane Extract)
mg/l 10 10
14 Phenolic Compounds mg/l 1 1.215 Sulphide mg/l 2 216 Fluoride mg/l 2 1.517 Total Chromium mg/l 2 0.118 Zinc mg/l --- 0.119 Copper mg/l --- 0.220 Nickel mg/l 321 Lead mg/l 0.122 Mercury mg/l 0.01 0.0123 SAR --- 0.124 Aluminium mg/l ---
MONTH
EDD-003-D6 EDG-075-D7 EDG-077-D5 EDG-077-D1 EDD-049-D3 EDH-064-D1
December' 19
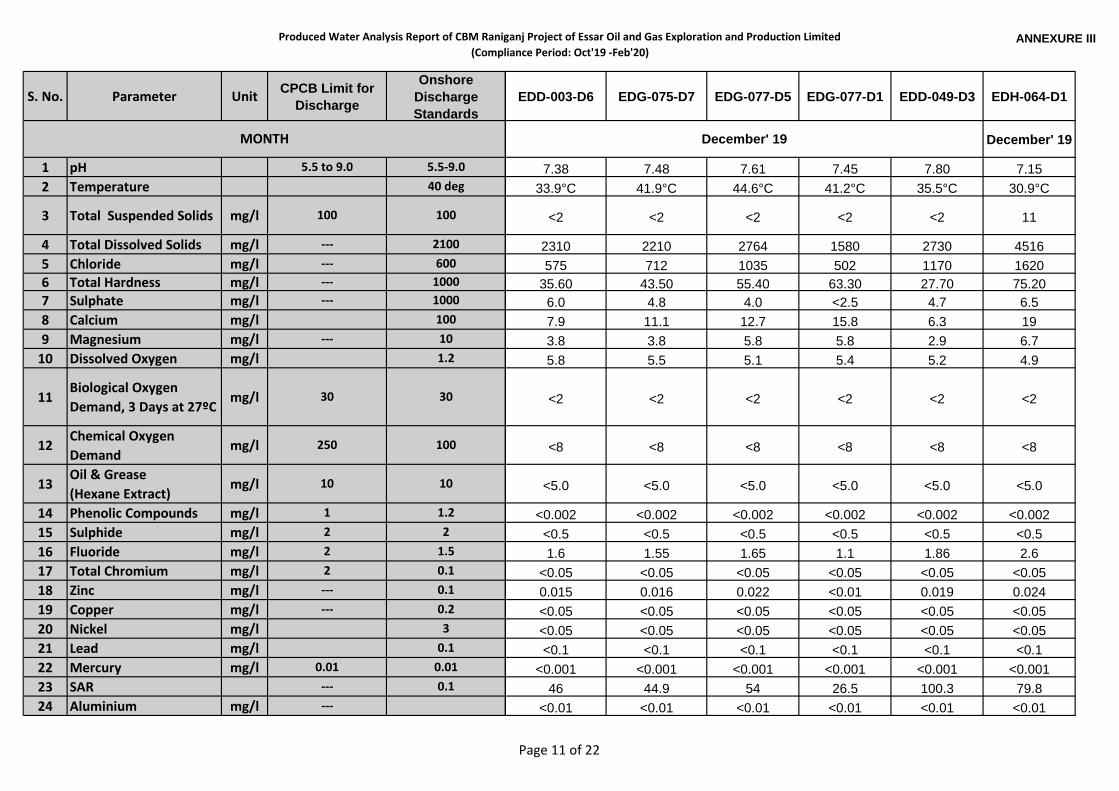
7.38 7.48 7.61 7.45 7.80 7.1533.9°C 41.9°C 44.6°C 41.2°C 35.5°C 30.9°C
<2 <2 <2 <2 <2 11
2310 2210 2764 1580 2730 4516575 712 1035 502 1170 1620
35.60 43.50 55.40 63.30 27.70 75.206.0 4.8 4.0 <2.5 4.7 6.57.9 11.1 12.7 15.8 6.3 193.8 3.8 5.8 5.8 2.9 6.75.8 5.5 5.1 5.4 5.2 4.9
<2 <2 <2 <2 <2 <2
<8 <8 <8 <8 <8 <8
<5.0 <5.0 <5.0 <5.0 <5.0 <5.0
<0.002 <0.002 <0.002 <0.002 <0.002 <0.002<0.5 <0.5 <0.5 <0.5 <0.5 <0.51.6 1.55 1.65 1.1 1.86 2.6
<0.05 <0.05 <0.05 <0.05 <0.05 <0.050.015 0.016 0.022 <0.01 0.019 0.024<0.05 <0.05 <0.05 <0.05 <0.05 <0.05<0.05 <0.05 <0.05 <0.05 <0.05 <0.05<0.1 <0.1 <0.1 <0.1 <0.1 <0.1
<0.001 <0.001 <0.001 <0.001 <0.001 <0.00146 44.9 54 26.5 100.3 79.8
<0.01 <0.01 <0.01 <0.01 <0.01 <0.01
December' 19
Page 11 of 22
Produced Water Analysis Report of CBM Raniganj Project of Essar Oil and Gas Exploration and Production Limited(Compliance Period: Oct'19 -Feb'20)
ANNEXURE III
S. No. Parameter Unit CPCB Limit forDischarge
OnshoreDischargeStandards
MONTH
25 Lithium mg/l26 Molybdenum mg/l ---27 Palladium mg/l ---28 Selenium mg/l29 Vanadium mg/l ---30 Cadmium mg/l31 Cobalt mg/l32 Bicarbonate mg/l33 Sodium mg/l ---34 Cyanide mg/l 0.2 0.2
35 Hexavalent Chromium mg/l 0.1
36 % Sodium 60
EDD-003-D6 EDG-075-D7 EDG-077-D5 EDG-077-D1 EDD-049-D3 EDH-064-D1
December' 19December' 19
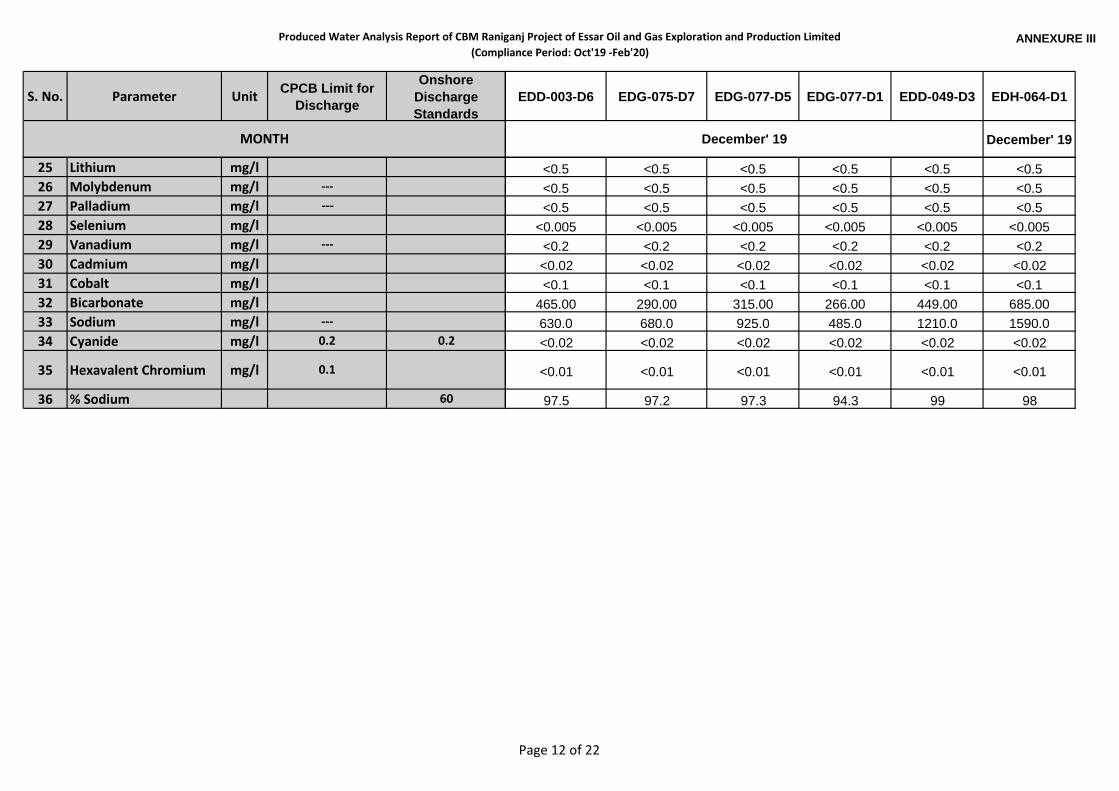
<0.5 <0.5 <0.5 <0.5 <0.5 <0.5<0.5 <0.5 <0.5 <0.5 <0.5 <0.5<0.5 <0.5 <0.5 <0.5 <0.5 <0.5
<0.005 <0.005 <0.005 <0.005 <0.005 <0.005<0.2 <0.2 <0.2 <0.2 <0.2 <0.2<0.02 <0.02 <0.02 <0.02 <0.02 <0.02<0.1 <0.1 <0.1 <0.1 <0.1 <0.1
465.00 290.00 315.00 266.00 449.00 685.00630.0 680.0 925.0 485.0 1210.0 1590.0<0.02 <0.02 <0.02 <0.02 <0.02 <0.02
<0.01 <0.01 <0.01 <0.01 <0.01 <0.01
97.5 97.2 97.3 94.3 99 98
Page 12 of 22
Produced Water Analysis Report of CBM Raniganj Project of Essar Oil and Gas Exploration and Production Limited(Compliance Period: Oct'19 -Feb'20)
ANNEXURE III
S. No. Parameter Unit CPCB Limit forDischarge
OnshoreDischargeStandards
1 pH 5.5 to 9.0 5.5-9.02 Temperature 40 deg
3 Total Suspended Solids mg/l 100 100
4 Total Dissolved Solids mg/l --- 21005 Chloride mg/l --- 6006 Total Hardness mg/l --- 10007 Sulphate mg/l --- 10008 Calcium mg/l 1009 Magnesium mg/l --- 10
10 Dissolved Oxygen mg/l 1.2
11Biological OxygenDemand, 3 Days at 27ºC
mg/l 30 30
12Chemical OxygenDemand
mg/l 250 100
13Oil & Grease(Hexane Extract)
mg/l 10 10
14 Phenolic Compounds mg/l 1 1.215 Sulphide mg/l 2 216 Fluoride mg/l 2 1.517 Total Chromium mg/l 2 0.118 Zinc mg/l --- 0.119 Copper mg/l --- 0.220 Nickel mg/l 321 Lead mg/l 0.122 Mercury mg/l 0.01 0.0123 SAR --- 0.124 Aluminium mg/l ---
MONTH
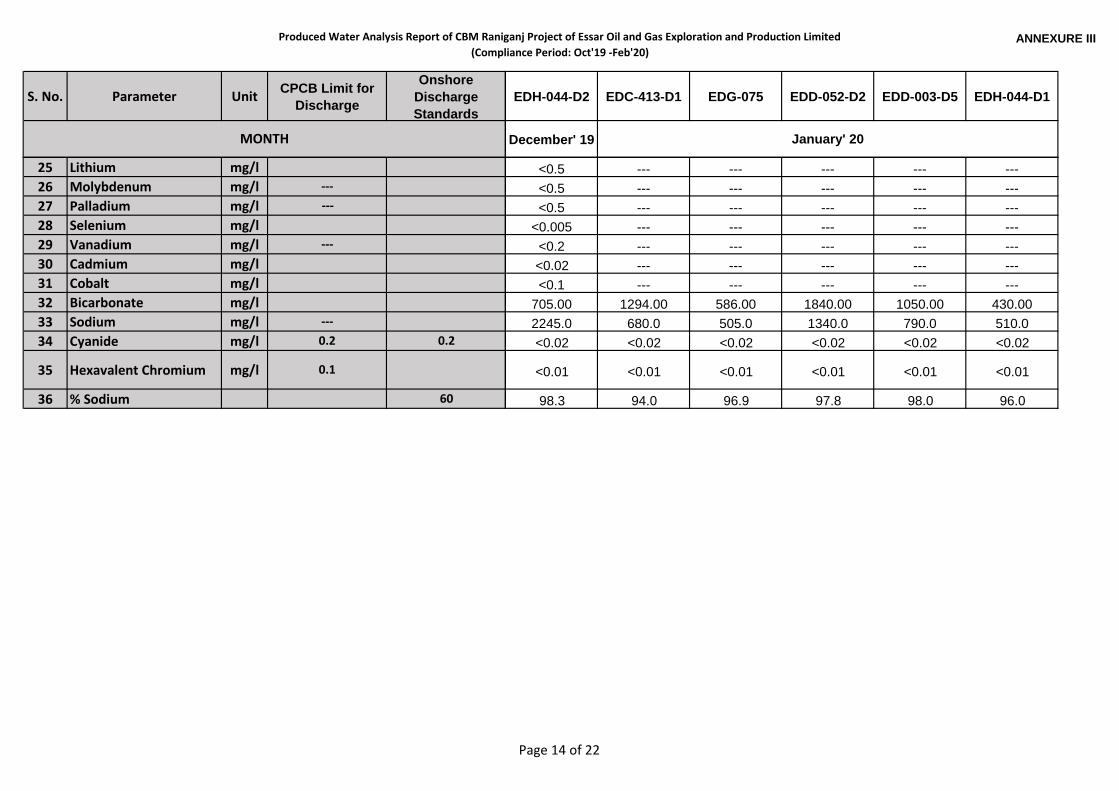
EDH-044-D2 EDC-413-D1 EDG-075 EDD-052-D2 EDD-003-D5 EDH-044-D1
December' 19
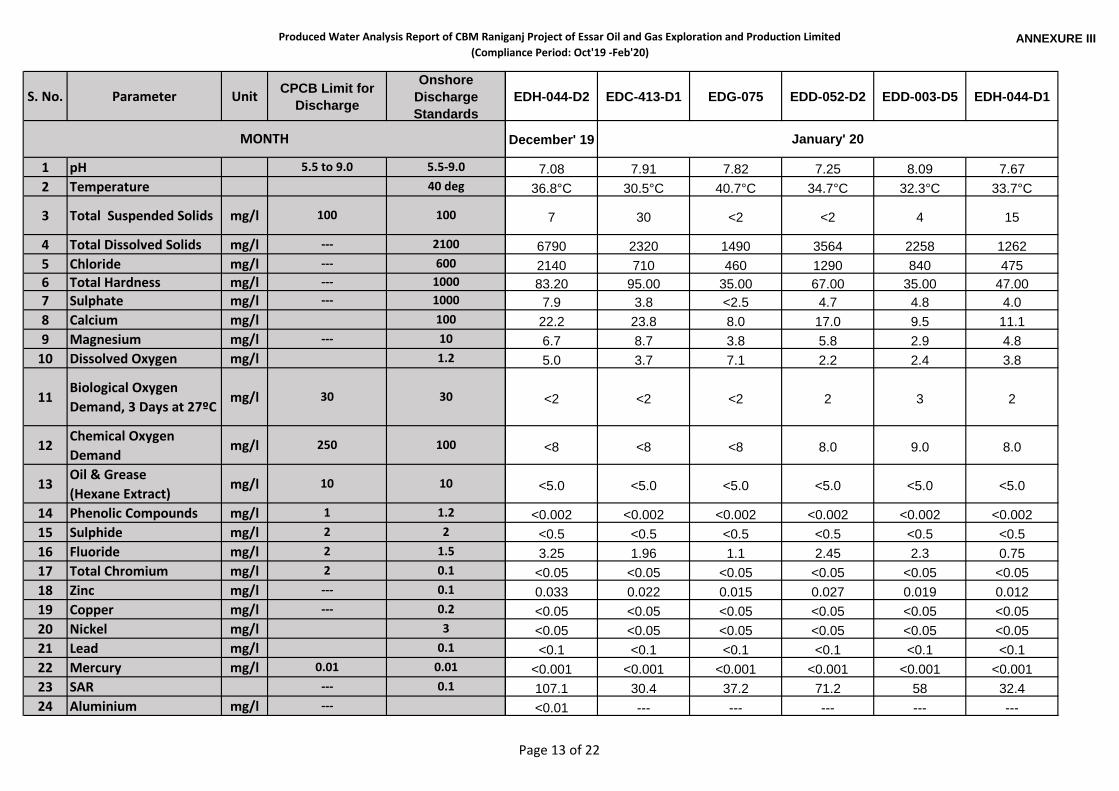
7.08 7.91 7.82 7.25 8.09 7.6736.8°C 30.5°C 40.7°C 34.7°C 32.3°C 33.7°C
7 30 <2 <2 4 15
6790 2320 1490 3564 2258 12622140 710 460 1290 840 47583.20 95.00 35.00 67.00 35.00 47.007.9 3.8 <2.5 4.7 4.8 4.022.2 23.8 8.0 17.0 9.5 11.16.7 8.7 3.8 5.8 2.9 4.85.0 3.7 7.1 2.2 2.4 3.8
<2 <2 <2 2 3 2
<8 <8 <8 8.0 9.0 8.0
<5.0 <5.0 <5.0 <5.0 <5.0 <5.0
<0.002 <0.002 <0.002 <0.002 <0.002 <0.002<0.5 <0.5 <0.5 <0.5 <0.5 <0.53.25 1.96 1.1 2.45 2.3 0.75
<0.05 <0.05 <0.05 <0.05 <0.05 <0.050.033 0.022 0.015 0.027 0.019 0.012<0.05 <0.05 <0.05 <0.05 <0.05 <0.05<0.05 <0.05 <0.05 <0.05 <0.05 <0.05<0.1 <0.1 <0.1 <0.1 <0.1 <0.1
<0.001 <0.001 <0.001 <0.001 <0.001 <0.001107.1 30.4 37.2 71.2 58 32.4<0.01 --- --- --- --- ---
January' 20
Page 13 of 22
Produced Water Analysis Report of CBM Raniganj Project of Essar Oil and Gas Exploration and Production Limited(Compliance Period: Oct'19 -Feb'20)
ANNEXURE III
S. No. Parameter Unit CPCB Limit forDischarge
OnshoreDischargeStandards
MONTH
25 Lithium mg/l26 Molybdenum mg/l ---27 Palladium mg/l ---28 Selenium mg/l29 Vanadium mg/l ---30 Cadmium mg/l31 Cobalt mg/l32 Bicarbonate mg/l33 Sodium mg/l ---34 Cyanide mg/l 0.2 0.2
35 Hexavalent Chromium mg/l 0.1
36 % Sodium 60
EDH-044-D2 EDC-413-D1 EDG-075 EDD-052-D2 EDD-003-D5 EDH-044-D1
December' 19 January' 20
<0.5 --- --- --- --- ---<0.5 --- --- --- --- ---<0.5 --- --- --- --- ---
<0.005 --- --- --- --- ---<0.2 --- --- --- --- ---<0.02 --- --- --- --- ---<0.1 --- --- --- --- ---
705.00 1294.00 586.00 1840.00 1050.00 430.002245.0 680.0 505.0 1340.0 790.0 510.0<0.02 <0.02 <0.02 <0.02 <0.02 <0.02
<0.01 <0.01 <0.01 <0.01 <0.01 <0.01
98.3 94.0 96.9 97.8 98.0 96.0
Page 14 of 22
Produced Water Analysis Report of CBM Raniganj Project of Essar Oil and Gas Exploration and Production Limited(Compliance Period: Oct'19 -Feb'20)
ANNEXURE III
S. No. Parameter Unit CPCB Limit forDischarge
OnshoreDischargeStandards
1 pH 5.5 to 9.0 5.5-9.02 Temperature 40 deg
3 Total Suspended Solids mg/l 100 100
4 Total Dissolved Solids mg/l --- 21005 Chloride mg/l --- 6006 Total Hardness mg/l --- 10007 Sulphate mg/l --- 10008 Calcium mg/l 1009 Magnesium mg/l --- 10
10 Dissolved Oxygen mg/l 1.2
11Biological OxygenDemand, 3 Days at 27ºC
mg/l 30 30
12Chemical OxygenDemand
mg/l 250 100
13Oil & Grease(Hexane Extract)
mg/l 10 10
14 Phenolic Compounds mg/l 1 1.215 Sulphide mg/l 2 216 Fluoride mg/l 2 1.517 Total Chromium mg/l 2 0.118 Zinc mg/l --- 0.119 Copper mg/l --- 0.220 Nickel mg/l 321 Lead mg/l 0.122 Mercury mg/l 0.01 0.0123 SAR --- 0.124 Aluminium mg/l ---
MONTH
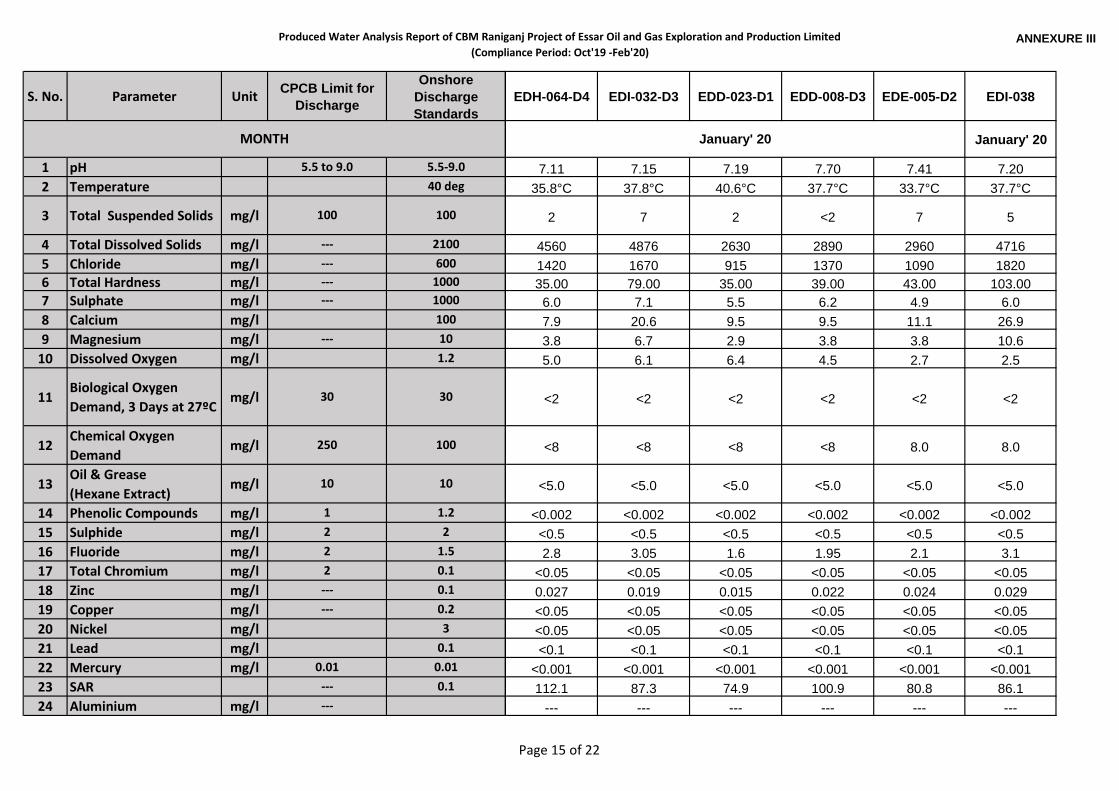
EDH-064-D4 EDI-032-D3 EDD-023-D1 EDD-008-D3 EDE-005-D2 EDI-038
January' 20
7.11 7.15 7.19 7.70 7.41 7.2035.8°C 37.8°C 40.6°C 37.7°C 33.7°C 37.7°C
2 7 2 <2 7 5
4560 4876 2630 2890 2960 47161420 1670 915 1370 1090 182035.00 79.00 35.00 39.00 43.00 103.006.0 7.1 5.5 6.2 4.9 6.07.9 20.6 9.5 9.5 11.1 26.93.8 6.7 2.9 3.8 3.8 10.65.0 6.1 6.4 4.5 2.7 2.5
<2 <2 <2 <2 <2 <2
<8 <8 <8 <8 8.0 8.0
<5.0 <5.0 <5.0 <5.0 <5.0 <5.0
<0.002 <0.002 <0.002 <0.002 <0.002 <0.002<0.5 <0.5 <0.5 <0.5 <0.5 <0.52.8 3.05 1.6 1.95 2.1 3.1
<0.05 <0.05 <0.05 <0.05 <0.05 <0.050.027 0.019 0.015 0.022 0.024 0.029<0.05 <0.05 <0.05 <0.05 <0.05 <0.05<0.05 <0.05 <0.05 <0.05 <0.05 <0.05<0.1 <0.1 <0.1 <0.1 <0.1 <0.1
<0.001 <0.001 <0.001 <0.001 <0.001 <0.001112.1 87.3 74.9 100.9 80.8 86.1
--- --- --- --- --- ---
January' 20
Page 15 of 22
Produced Water Analysis Report of CBM Raniganj Project of Essar Oil and Gas Exploration and Production Limited(Compliance Period: Oct'19 -Feb'20)
ANNEXURE III
S. No. Parameter Unit CPCB Limit forDischarge
OnshoreDischargeStandards
MONTH
25 Lithium mg/l26 Molybdenum mg/l ---27 Palladium mg/l ---28 Selenium mg/l29 Vanadium mg/l ---30 Cadmium mg/l31 Cobalt mg/l32 Bicarbonate mg/l33 Sodium mg/l ---34 Cyanide mg/l 0.2 0.2
35 Hexavalent Chromium mg/l 0.1
36 % Sodium 60
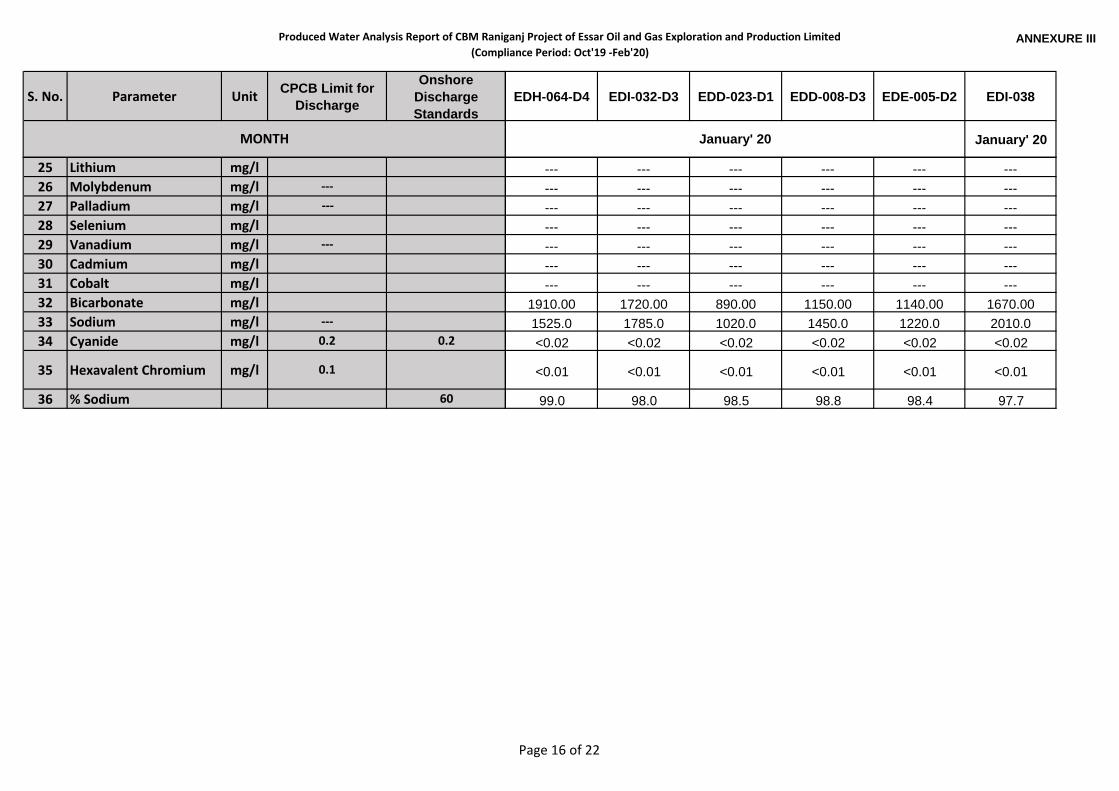
EDH-064-D4 EDI-032-D3 EDD-023-D1 EDD-008-D3 EDE-005-D2 EDI-038
January' 20January' 20
--- --- --- --- --- ------ --- --- --- --- ------ --- --- --- --- ------ --- --- --- --- ------ --- --- --- --- ------ --- --- --- --- ------ --- --- --- --- ---
1910.00 1720.00 890.00 1150.00 1140.00 1670.001525.0 1785.0 1020.0 1450.0 1220.0 2010.0<0.02 <0.02 <0.02 <0.02 <0.02 <0.02
<0.01 <0.01 <0.01 <0.01 <0.01 <0.01
99.0 98.0 98.5 98.8 98.4 97.7
Page 16 of 22
Produced Water Analysis Report of CBM Raniganj Project of Essar Oil and Gas Exploration and Production Limited(Compliance Period: Oct'19 -Feb'20)
ANNEXURE III
S. No. Parameter Unit CPCB Limit forDischarge
OnshoreDischargeStandards
1 pH 5.5 to 9.0 5.5-9.02 Temperature 40 deg
3 Total Suspended Solids mg/l 100 100
4 Total Dissolved Solids mg/l --- 21005 Chloride mg/l --- 6006 Total Hardness mg/l --- 10007 Sulphate mg/l --- 10008 Calcium mg/l 1009 Magnesium mg/l --- 10
10 Dissolved Oxygen mg/l 1.2
11Biological OxygenDemand, 3 Days at 27ºC
mg/l 30 30
12Chemical OxygenDemand
mg/l 250 100
13Oil & Grease(Hexane Extract)
mg/l 10 10
14 Phenolic Compounds mg/l 1 1.215 Sulphide mg/l 2 216 Fluoride mg/l 2 1.517 Total Chromium mg/l 2 0.118 Zinc mg/l --- 0.119 Copper mg/l --- 0.220 Nickel mg/l 321 Lead mg/l 0.122 Mercury mg/l 0.01 0.0123 SAR --- 0.124 Aluminium mg/l ---
MONTH
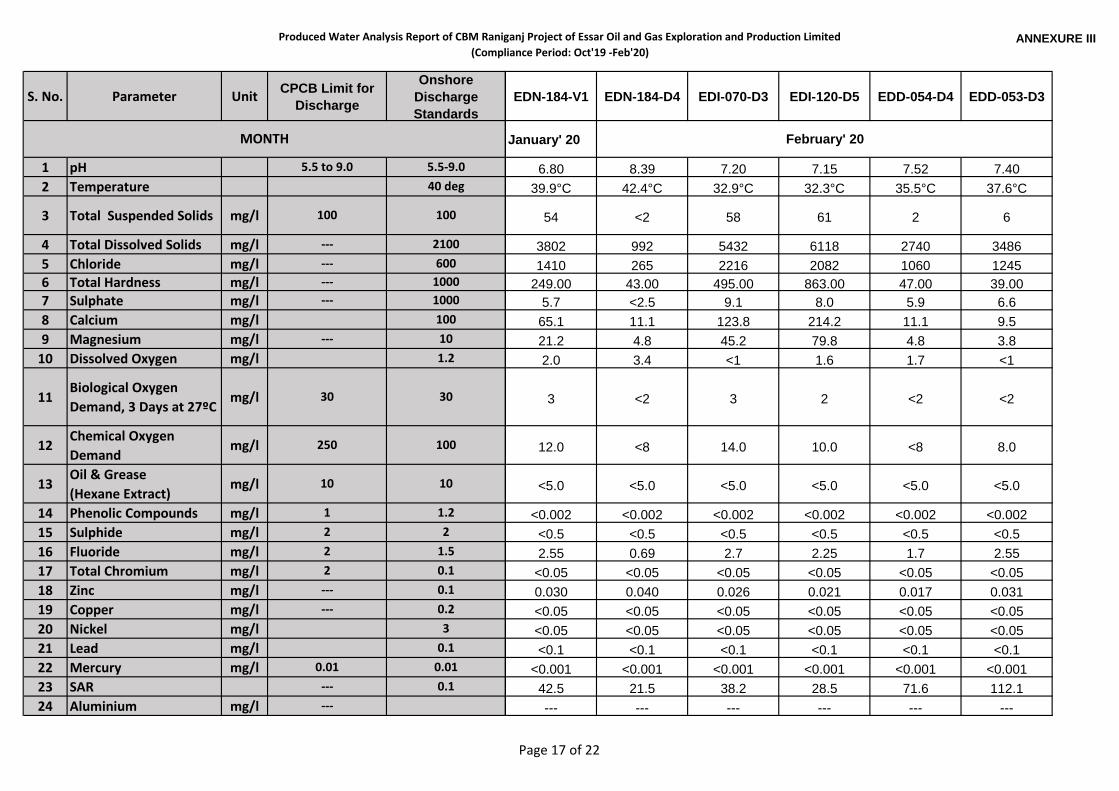
EDN-184-V1 EDN-184-D4 EDI-070-D3 EDI-120-D5 EDD-054-D4 EDD-053-D3
January' 20
6.80 8.39 7.20 7.15 7.52 7.4039.9°C 42.4°C 32.9°C 32.3°C 35.5°C 37.6°C
54 <2 58 61 2 6
3802 992 5432 6118 2740 34861410 265 2216 2082 1060 1245
249.00 43.00 495.00 863.00 47.00 39.005.7 <2.5 9.1 8.0 5.9 6.665.1 11.1 123.8 214.2 11.1 9.521.2 4.8 45.2 79.8 4.8 3.82.0 3.4 <1 1.6 1.7 <1
3 <2 3 2 <2 <2
12.0 <8 14.0 10.0 <8 8.0
<5.0 <5.0 <5.0 <5.0 <5.0 <5.0
<0.002 <0.002 <0.002 <0.002 <0.002 <0.002<0.5 <0.5 <0.5 <0.5 <0.5 <0.52.55 0.69 2.7 2.25 1.7 2.55
<0.05 <0.05 <0.05 <0.05 <0.05 <0.050.030 0.040 0.026 0.021 0.017 0.031<0.05 <0.05 <0.05 <0.05 <0.05 <0.05<0.05 <0.05 <0.05 <0.05 <0.05 <0.05<0.1 <0.1 <0.1 <0.1 <0.1 <0.1
<0.001 <0.001 <0.001 <0.001 <0.001 <0.00142.5 21.5 38.2 28.5 71.6 112.1--- --- --- --- --- ---
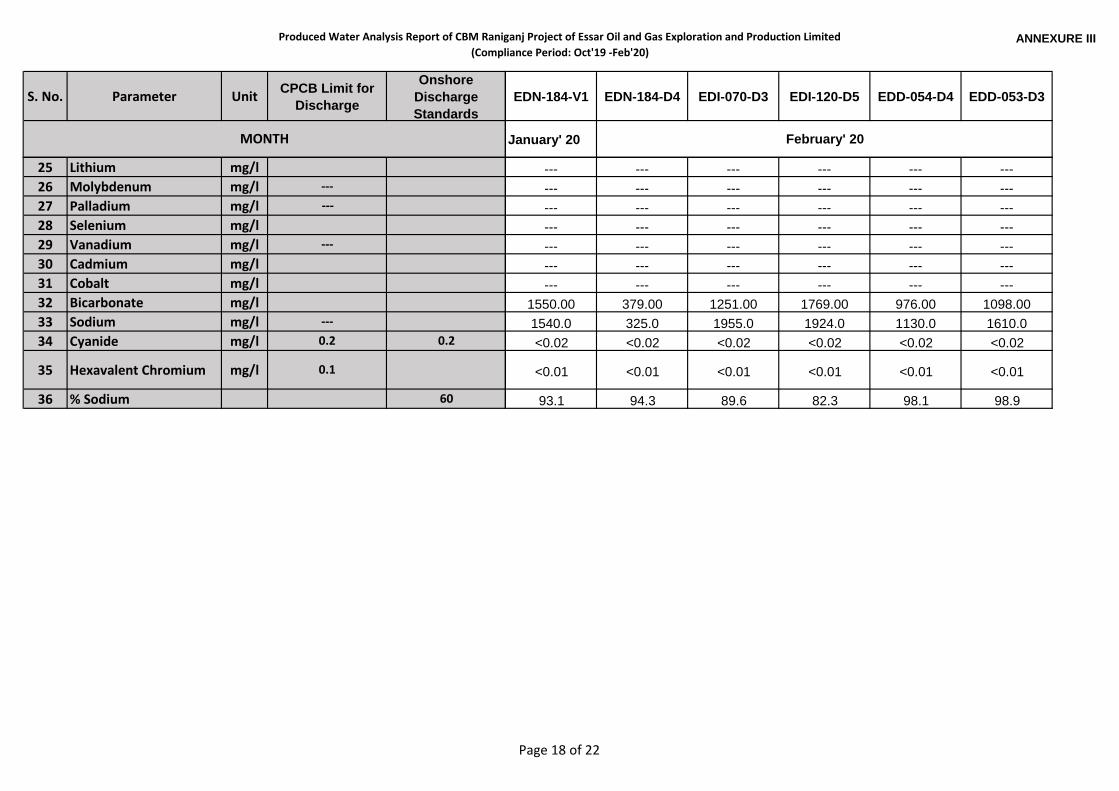
February' 20
Page 17 of 22
Produced Water Analysis Report of CBM Raniganj Project of Essar Oil and Gas Exploration and Production Limited(Compliance Period: Oct'19 -Feb'20)
ANNEXURE III
S. No. Parameter Unit CPCB Limit forDischarge
OnshoreDischargeStandards
MONTH
25 Lithium mg/l26 Molybdenum mg/l ---27 Palladium mg/l ---28 Selenium mg/l29 Vanadium mg/l ---30 Cadmium mg/l31 Cobalt mg/l32 Bicarbonate mg/l33 Sodium mg/l ---34 Cyanide mg/l 0.2 0.2
35 Hexavalent Chromium mg/l 0.1
36 % Sodium 60
EDN-184-V1 EDN-184-D4 EDI-070-D3 EDI-120-D5 EDD-054-D4 EDD-053-D3
January' 20 February' 20
--- --- --- --- --- ------ --- --- --- --- ------ --- --- --- --- ------ --- --- --- --- ------ --- --- --- --- ------ --- --- --- --- ------ --- --- --- --- ---
1550.00 379.00 1251.00 1769.00 976.00 1098.001540.0 325.0 1955.0 1924.0 1130.0 1610.0<0.02 <0.02 <0.02 <0.02 <0.02 <0.02
<0.01 <0.01 <0.01 <0.01 <0.01 <0.01
93.1 94.3 89.6 82.3 98.1 98.9
Page 18 of 22
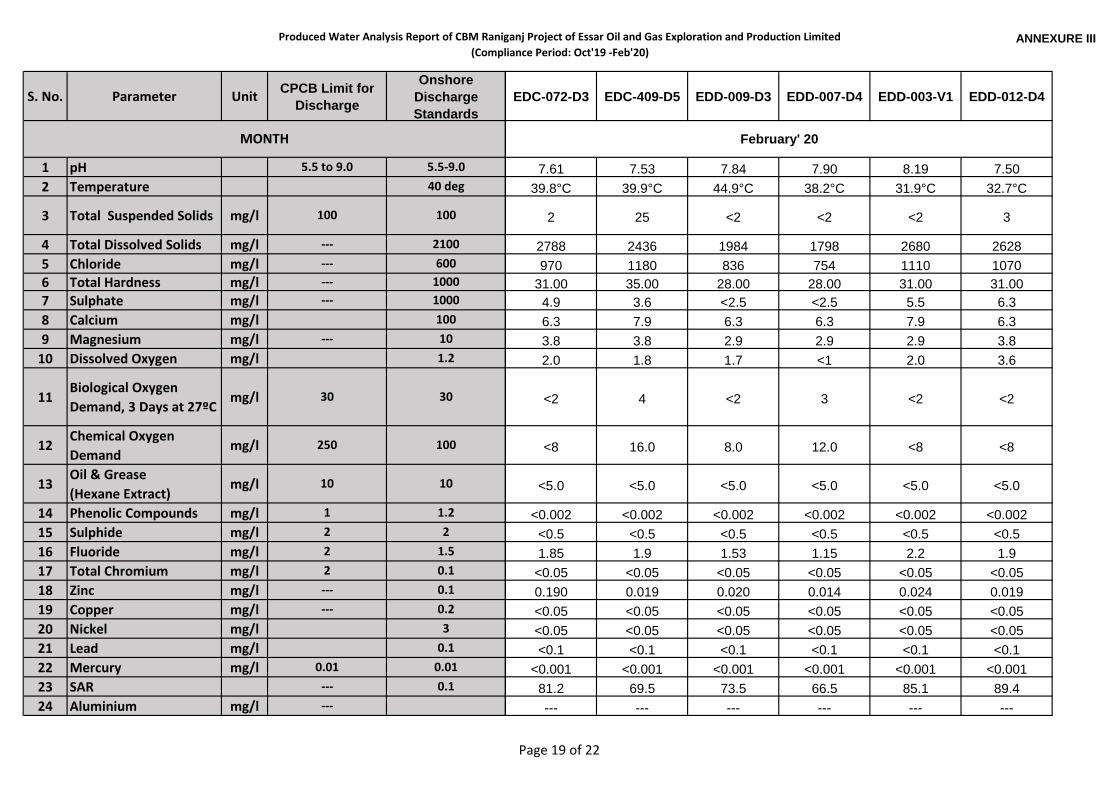
Produced Water Analysis Report of CBM Raniganj Project of Essar Oil and Gas Exploration and Production Limited(Compliance Period: Oct'19 -Feb'20)
ANNEXURE III
S. No. Parameter Unit CPCB Limit forDischarge
OnshoreDischargeStandards
1 pH 5.5 to 9.0 5.5-9.02 Temperature 40 deg
3 Total Suspended Solids mg/l 100 100
4 Total Dissolved Solids mg/l --- 21005 Chloride mg/l --- 6006 Total Hardness mg/l --- 10007 Sulphate mg/l --- 10008 Calcium mg/l 1009 Magnesium mg/l --- 10
10 Dissolved Oxygen mg/l 1.2
11Biological OxygenDemand, 3 Days at 27ºC
mg/l 30 30
12Chemical OxygenDemand
mg/l 250 100
13Oil & Grease(Hexane Extract)
mg/l 10 10
14 Phenolic Compounds mg/l 1 1.215 Sulphide mg/l 2 216 Fluoride mg/l 2 1.517 Total Chromium mg/l 2 0.118 Zinc mg/l --- 0.119 Copper mg/l --- 0.220 Nickel mg/l 321 Lead mg/l 0.122 Mercury mg/l 0.01 0.0123 SAR --- 0.124 Aluminium mg/l ---
MONTH
EDC-072-D3 EDC-409-D5 EDD-009-D3 EDD-007-D4 EDD-003-V1 EDD-012-D4
7.61 7.53 7.84 7.90 8.19 7.5039.8°C 39.9°C 44.9°C 38.2°C 31.9°C 32.7°C
2 25 <2 <2 <2 3
2788 2436 1984 1798 2680 2628970 1180 836 754 1110 1070
31.00 35.00 28.00 28.00 31.00 31.004.9 3.6 <2.5 <2.5 5.5 6.36.3 7.9 6.3 6.3 7.9 6.33.8 3.8 2.9 2.9 2.9 3.82.0 1.8 1.7 <1 2.0 3.6
<2 4 <2 3 <2 <2
<8 16.0 8.0 12.0 <8 <8
<5.0 <5.0 <5.0 <5.0 <5.0 <5.0
<0.002 <0.002 <0.002 <0.002 <0.002 <0.002<0.5 <0.5 <0.5 <0.5 <0.5 <0.51.85 1.9 1.53 1.15 2.2 1.9
<0.05 <0.05 <0.05 <0.05 <0.05 <0.050.190 0.019 0.020 0.014 0.024 0.019<0.05 <0.05 <0.05 <0.05 <0.05 <0.05<0.05 <0.05 <0.05 <0.05 <0.05 <0.05<0.1 <0.1 <0.1 <0.1 <0.1 <0.1
<0.001 <0.001 <0.001 <0.001 <0.001 <0.00181.2 69.5 73.5 66.5 85.1 89.4--- --- --- --- --- ---
February' 20
Page 19 of 22
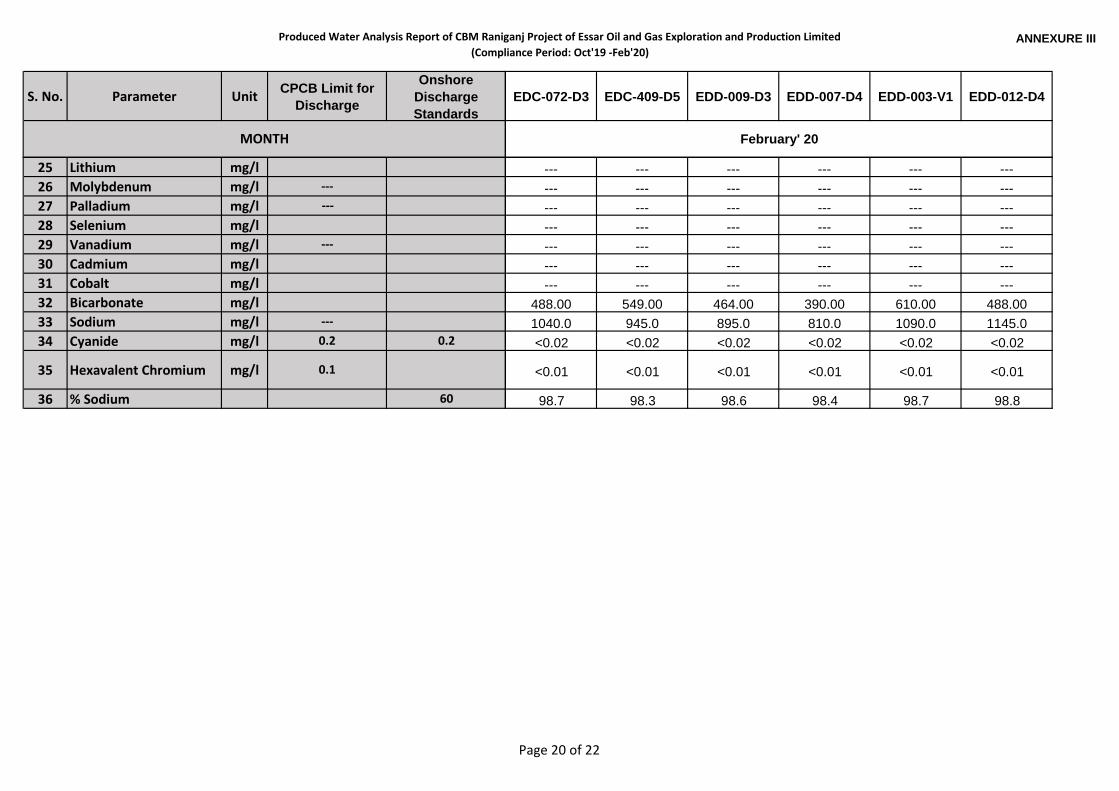
Produced Water Analysis Report of CBM Raniganj Project of Essar Oil and Gas Exploration and Production Limited(Compliance Period: Oct'19 -Feb'20)
ANNEXURE III
S. No. Parameter Unit CPCB Limit forDischarge
OnshoreDischargeStandards
MONTH
25 Lithium mg/l26 Molybdenum mg/l ---27 Palladium mg/l ---28 Selenium mg/l29 Vanadium mg/l ---30 Cadmium mg/l31 Cobalt mg/l32 Bicarbonate mg/l33 Sodium mg/l ---34 Cyanide mg/l 0.2 0.2
35 Hexavalent Chromium mg/l 0.1
36 % Sodium 60
EDC-072-D3 EDC-409-D5 EDD-009-D3 EDD-007-D4 EDD-003-V1 EDD-012-D4
February' 20
--- --- --- --- --- ------ --- --- --- --- ------ --- --- --- --- ------ --- --- --- --- ------ --- --- --- --- ------ --- --- --- --- ------ --- --- --- --- ---
488.00 549.00 464.00 390.00 610.00 488.001040.0 945.0 895.0 810.0 1090.0 1145.0<0.02 <0.02 <0.02 <0.02 <0.02 <0.02
<0.01 <0.01 <0.01 <0.01 <0.01 <0.01
98.7 98.3 98.6 98.4 98.7 98.8
Page 20 of 22
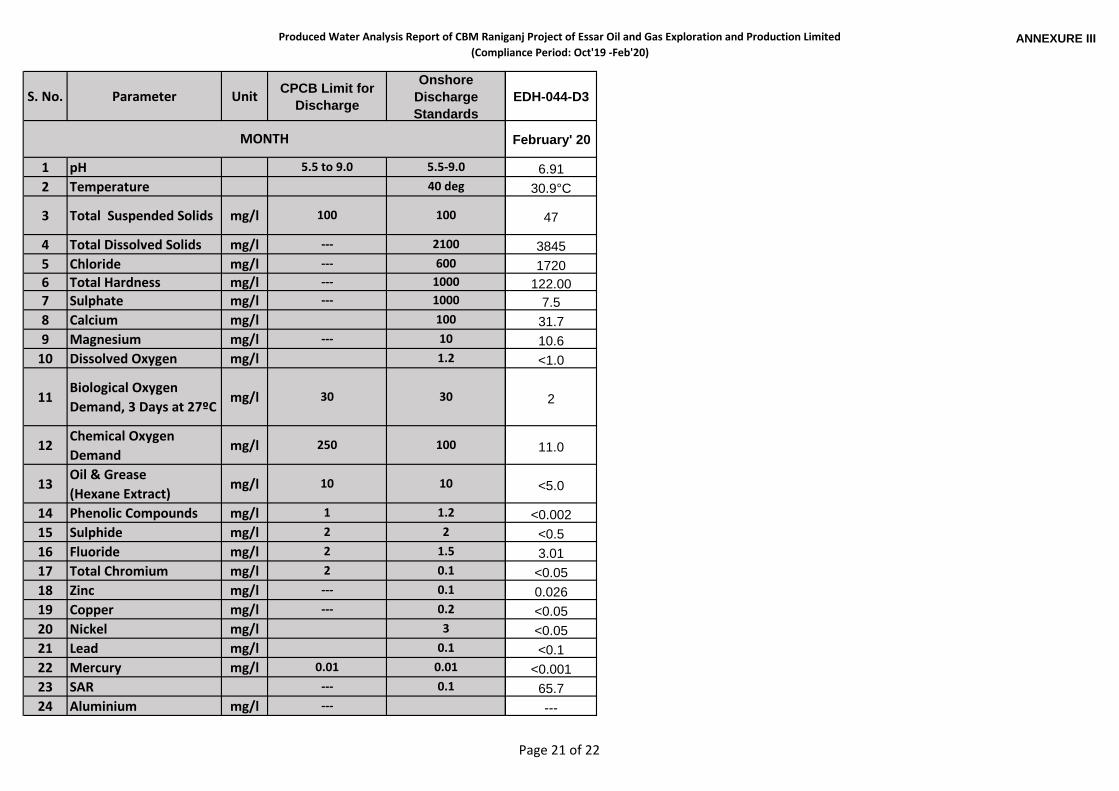
Produced Water Analysis Report of CBM Raniganj Project of Essar Oil and Gas Exploration and Production Limited(Compliance Period: Oct'19 -Feb'20)
ANNEXURE III
S. No. Parameter Unit CPCB Limit forDischarge
OnshoreDischargeStandards
1 pH 5.5 to 9.0 5.5-9.02 Temperature 40 deg
3 Total Suspended Solids mg/l 100 100
4 Total Dissolved Solids mg/l --- 21005 Chloride mg/l --- 6006 Total Hardness mg/l --- 10007 Sulphate mg/l --- 10008 Calcium mg/l 1009 Magnesium mg/l --- 10
10 Dissolved Oxygen mg/l 1.2
11Biological OxygenDemand, 3 Days at 27ºC
mg/l 30 30
12Chemical OxygenDemand
mg/l 250 100
13Oil & Grease(Hexane Extract)
mg/l 10 10
14 Phenolic Compounds mg/l 1 1.215 Sulphide mg/l 2 216 Fluoride mg/l 2 1.517 Total Chromium mg/l 2 0.118 Zinc mg/l --- 0.119 Copper mg/l --- 0.220 Nickel mg/l 321 Lead mg/l 0.122 Mercury mg/l 0.01 0.0123 SAR --- 0.124 Aluminium mg/l ---
MONTH
EDH-044-D3
February' 20
6.9130.9°C
47
38451720
122.007.531.710.6<1.0
2
11.0
<5.0
<0.002<0.53.01
<0.050.026<0.05<0.05<0.1
<0.00165.7---
Page 21 of 22
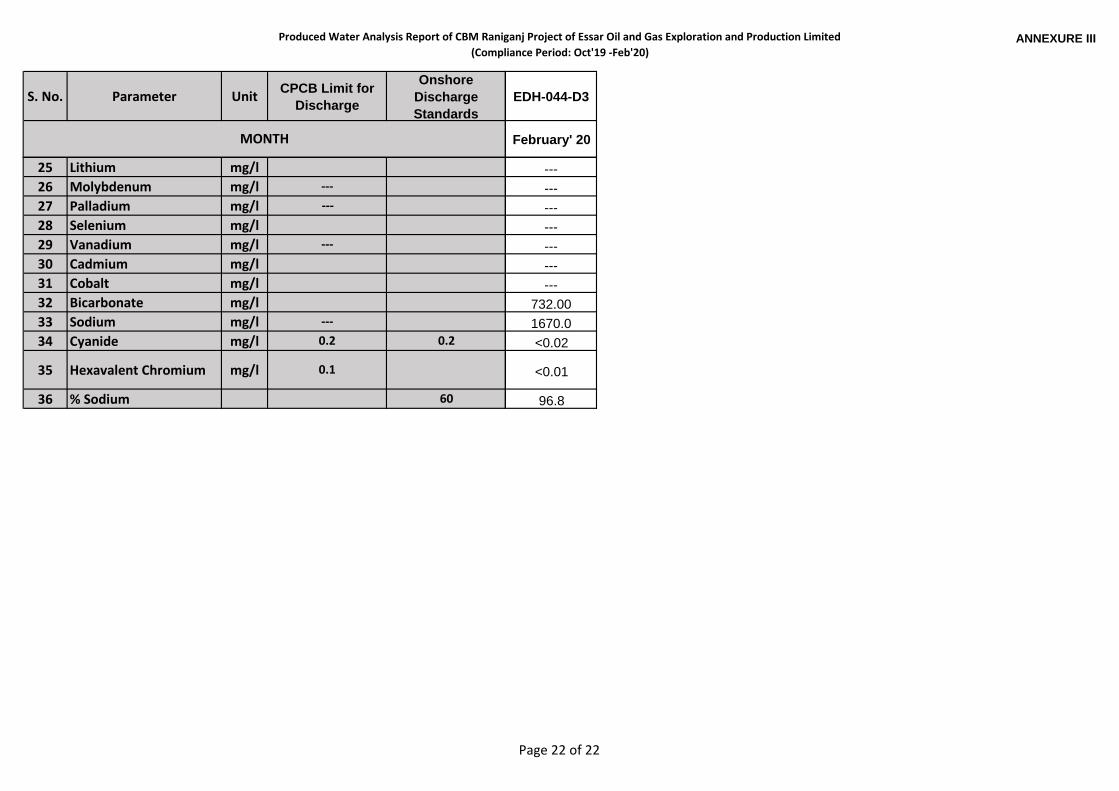
Produced Water Analysis Report of CBM Raniganj Project of Essar Oil and Gas Exploration and Production Limited(Compliance Period: Oct'19 -Feb'20)
ANNEXURE III
S. No. Parameter Unit CPCB Limit forDischarge
OnshoreDischargeStandards
MONTH
25 Lithium mg/l26 Molybdenum mg/l ---27 Palladium mg/l ---28 Selenium mg/l29 Vanadium mg/l ---30 Cadmium mg/l31 Cobalt mg/l32 Bicarbonate mg/l33 Sodium mg/l ---34 Cyanide mg/l 0.2 0.2
35 Hexavalent Chromium mg/l 0.1
36 % Sodium 60
EDH-044-D3
February' 20
---------------------
732.001670.0<0.02
<0.01
96.8
Page 22 of 22

ANNEXURE IV: RO Water Analysis Report
(Compliance Period: Oct’ 19- Feb’ 20)
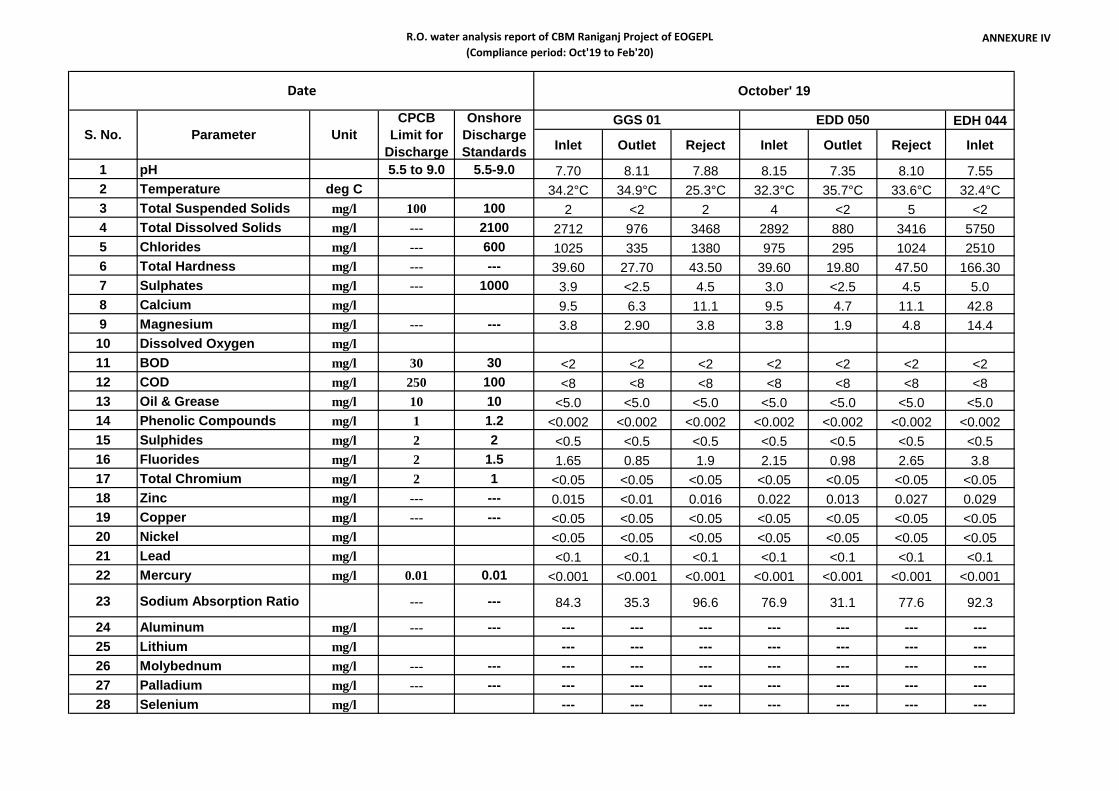
R.O. water analysis report of CBM Raniganj Project of EOGEPL(Compliance period: Oct'19 to Feb'20)
ANNEXURE IV
EDH 044
Inlet Outlet Reject Inlet Outlet Reject Inlet
1 pH 5.5 to 9.0 5.5-9.0 7.70 8.11 7.88 8.15 7.35 8.10 7.552 Temperature deg C 34.2°C 34.9°C 25.3°C 32.3°C 35.7°C 33.6°C 32.4°C3 Total Suspended Solids mg/l 100 100 2 <2 2 4 <2 5 <24 Total Dissolved Solids mg/l --- 2100 2712 976 3468 2892 880 3416 57505 Chlorides mg/l --- 600 1025 335 1380 975 295 1024 25106 Total Hardness mg/l --- --- 39.60 27.70 43.50 39.60 19.80 47.50 166.307 Sulphates mg/l --- 1000 3.9 <2.5 4.5 3.0 <2.5 4.5 5.08 Calcium mg/l 9.5 6.3 11.1 9.5 4.7 11.1 42.89 Magnesium mg/l --- --- 3.8 2.90 3.8 3.8 1.9 4.8 14.4
10 Dissolved Oxygen mg/l11 BOD mg/l 30 30 <2 <2 <2 <2 <2 <2 <212 COD mg/l 250 100 <8 <8 <8 <8 <8 <8 <813 Oil & Grease mg/l 10 10 <5.0 <5.0 <5.0 <5.0 <5.0 <5.0 <5.014 Phenolic Compounds mg/l 1 1.2 <0.002 <0.002 <0.002 <0.002 <0.002 <0.002 <0.00215 Sulphides mg/l 2 2 <0.5 <0.5 <0.5 <0.5 <0.5 <0.5 <0.516 Fluorides mg/l 2 1.5 1.65 0.85 1.9 2.15 0.98 2.65 3.817 Total Chromium mg/l 2 1 <0.05 <0.05 <0.05 <0.05 <0.05 <0.05 <0.0518 Zinc mg/l --- --- 0.015 <0.01 0.016 0.022 0.013 0.027 0.02919 Copper mg/l --- --- <0.05 <0.05 <0.05 <0.05 <0.05 <0.05 <0.0520 Nickel mg/l <0.05 <0.05 <0.05 <0.05 <0.05 <0.05 <0.0521 Lead mg/l <0.1 <0.1 <0.1 <0.1 <0.1 <0.1 <0.122 Mercury mg/l 0.01 0.01 <0.001 <0.001 <0.001 <0.001 <0.001 <0.001 <0.001
23 Sodium Absorption Ratio --- --- 84.3 35.3 96.6 76.9 31.1 77.6 92.3
24 Aluminum mg/l --- --- --- --- --- --- --- --- ---25 Lithium mg/l --- --- --- --- --- --- ---26 Molybednum mg/l --- --- --- --- --- --- --- --- ---27 Palladium mg/l --- --- --- --- --- --- --- --- ---28 Selenium mg/l --- --- --- --- --- --- ---
Date
S. No. Parameter UnitCPCB
Limit forDischarge
OnshoreDischargeStandards
EDD 050
October' 19
GGS 01
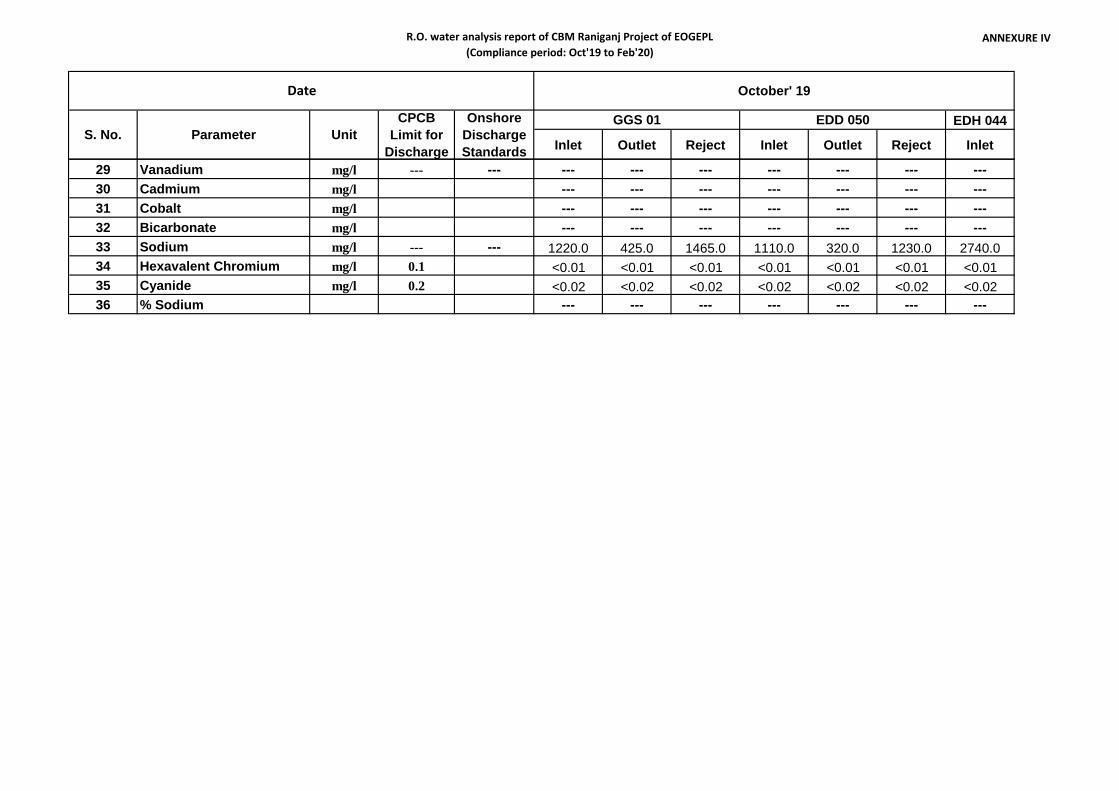
R.O. water analysis report of CBM Raniganj Project of EOGEPL(Compliance period: Oct'19 to Feb'20)
ANNEXURE IV
EDH 044
Inlet Outlet Reject Inlet Outlet Reject Inlet
Date
S. No. Parameter UnitCPCB
Limit forDischarge
OnshoreDischargeStandards
EDD 050
October' 19
GGS 01
29 Vanadium mg/l --- --- --- --- --- --- --- --- ---30 Cadmium mg/l --- --- --- --- --- --- ---31 Cobalt mg/l --- --- --- --- --- --- ---32 Bicarbonate mg/l --- --- --- --- --- --- ---33 Sodium mg/l --- --- 1220.0 425.0 1465.0 1110.0 320.0 1230.0 2740.034 Hexavalent Chromium mg/l 0.1 <0.01 <0.01 <0.01 <0.01 <0.01 <0.01 <0.0135 Cyanide mg/l 0.2 <0.02 <0.02 <0.02 <0.02 <0.02 <0.02 <0.0236 % Sodium --- --- --- --- --- --- ---
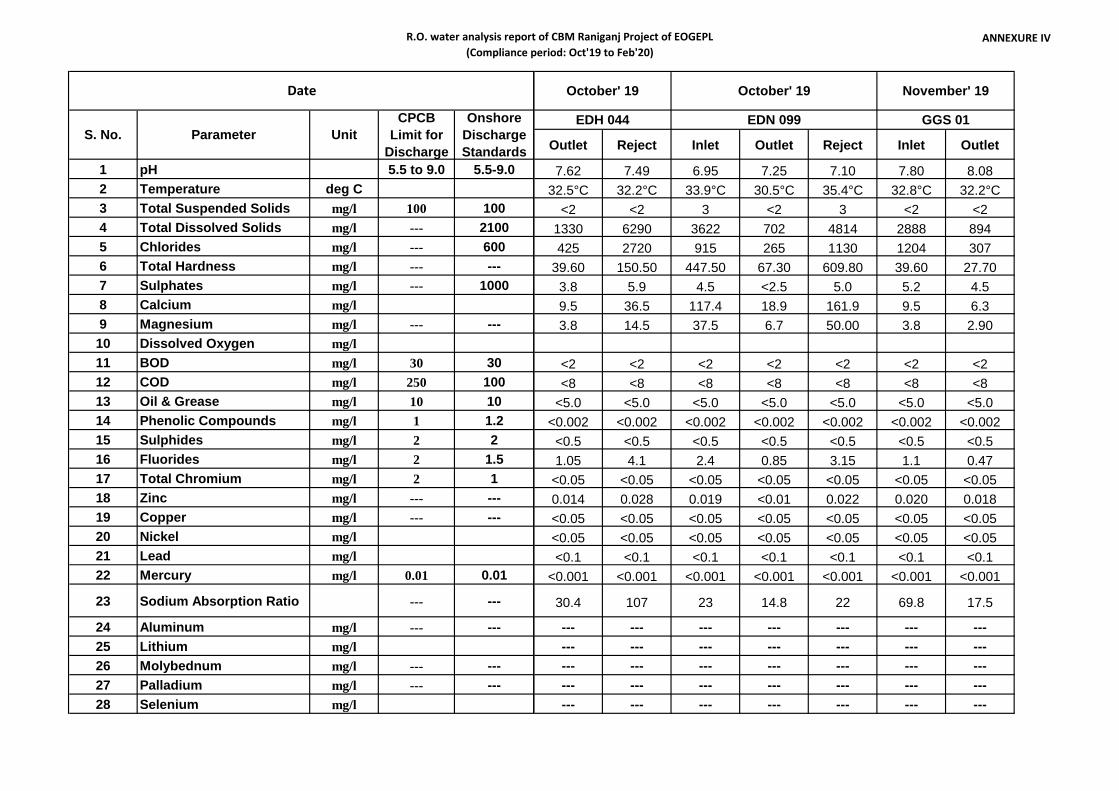
R.O. water analysis report of CBM Raniganj Project of EOGEPL(Compliance period: Oct'19 to Feb'20)
ANNEXURE IV
1 pH 5.5 to 9.0 5.5-9.02 Temperature deg C3 Total Suspended Solids mg/l 100 1004 Total Dissolved Solids mg/l --- 21005 Chlorides mg/l --- 6006 Total Hardness mg/l --- ---7 Sulphates mg/l --- 10008 Calcium mg/l9 Magnesium mg/l --- ---
10 Dissolved Oxygen mg/l11 BOD mg/l 30 3012 COD mg/l 250 10013 Oil & Grease mg/l 10 1014 Phenolic Compounds mg/l 1 1.215 Sulphides mg/l 2 216 Fluorides mg/l 2 1.517 Total Chromium mg/l 2 118 Zinc mg/l --- ---19 Copper mg/l --- ---20 Nickel mg/l21 Lead mg/l22 Mercury mg/l 0.01 0.01
23 Sodium Absorption Ratio --- ---
24 Aluminum mg/l --- ---25 Lithium mg/l26 Molybednum mg/l --- ---27 Palladium mg/l --- ---28 Selenium mg/l
Date
S. No. Parameter UnitCPCB
Limit forDischarge
OnshoreDischargeStandards Outlet Reject Inlet Outlet Reject Inlet Outlet
7.62 7.49 6.95 7.25 7.10 7.80 8.0832.5°C 32.2°C 33.9°C 30.5°C 35.4°C 32.8°C 32.2°C
<2 <2 3 <2 3 <2 <21330 6290 3622 702 4814 2888 894425 2720 915 265 1130 1204 307
39.60 150.50 447.50 67.30 609.80 39.60 27.703.8 5.9 4.5 <2.5 5.0 5.2 4.59.5 36.5 117.4 18.9 161.9 9.5 6.33.8 14.5 37.5 6.7 50.00 3.8 2.90
<2 <2 <2 <2 <2 <2 <2<8 <8 <8 <8 <8 <8 <8
<5.0 <5.0 <5.0 <5.0 <5.0 <5.0 <5.0<0.002 <0.002 <0.002 <0.002 <0.002 <0.002 <0.002<0.5 <0.5 <0.5 <0.5 <0.5 <0.5 <0.51.05 4.1 2.4 0.85 3.15 1.1 0.47
<0.05 <0.05 <0.05 <0.05 <0.05 <0.05 <0.050.014 0.028 0.019 <0.01 0.022 0.020 0.018<0.05 <0.05 <0.05 <0.05 <0.05 <0.05 <0.05<0.05 <0.05 <0.05 <0.05 <0.05 <0.05 <0.05<0.1 <0.1 <0.1 <0.1 <0.1 <0.1 <0.1
<0.001 <0.001 <0.001 <0.001 <0.001 <0.001 <0.001
30.4 107 23 14.8 22 69.8 17.5
--- --- --- --- --- --- ------ --- --- --- --- --- ------ --- --- --- --- --- ------ --- --- --- --- --- ------ --- --- --- --- --- ---
EDH 044
October' 19 November' 19October' 19
EDN 099 GGS 01
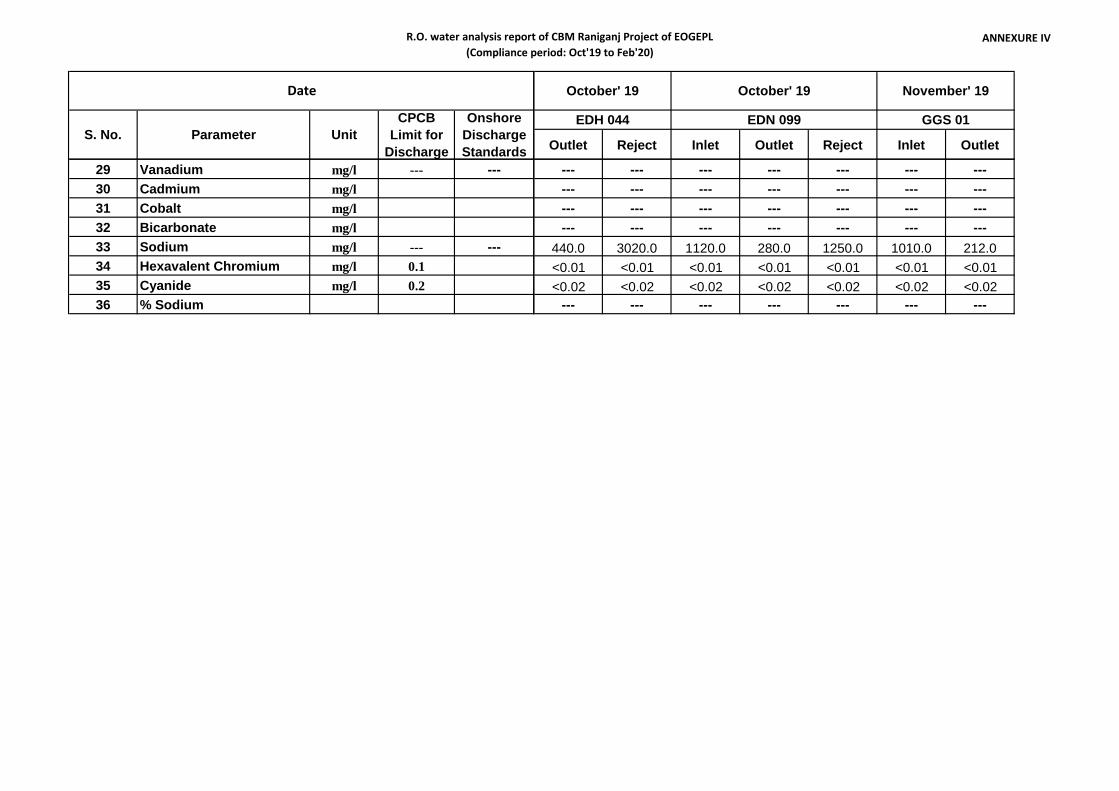
R.O. water analysis report of CBM Raniganj Project of EOGEPL(Compliance period: Oct'19 to Feb'20)
ANNEXURE IV
Date
S. No. Parameter UnitCPCB
Limit forDischarge
OnshoreDischargeStandards
29 Vanadium mg/l --- ---30 Cadmium mg/l31 Cobalt mg/l32 Bicarbonate mg/l33 Sodium mg/l --- ---34 Hexavalent Chromium mg/l 0.135 Cyanide mg/l 0.236 % Sodium
Outlet Reject Inlet Outlet Reject Inlet Outlet
EDH 044
October' 19 November' 19October' 19
EDN 099 GGS 01
--- --- --- --- --- --- ------ --- --- --- --- --- ------ --- --- --- --- --- ------ --- --- --- --- --- ---
440.0 3020.0 1120.0 280.0 1250.0 1010.0 212.0<0.01 <0.01 <0.01 <0.01 <0.01 <0.01 <0.01<0.02 <0.02 <0.02 <0.02 <0.02 <0.02 <0.02
--- --- --- --- --- --- ---

R.O. water analysis report of CBM Raniganj Project of EOGEPL(Compliance period: Oct'19 to Feb'20)
ANNEXURE IV
1 pH 5.5 to 9.0 5.5-9.02 Temperature deg C3 Total Suspended Solids mg/l 100 1004 Total Dissolved Solids mg/l --- 21005 Chlorides mg/l --- 6006 Total Hardness mg/l --- ---7 Sulphates mg/l --- 10008 Calcium mg/l9 Magnesium mg/l --- ---
10 Dissolved Oxygen mg/l11 BOD mg/l 30 3012 COD mg/l 250 10013 Oil & Grease mg/l 10 1014 Phenolic Compounds mg/l 1 1.215 Sulphides mg/l 2 216 Fluorides mg/l 2 1.517 Total Chromium mg/l 2 118 Zinc mg/l --- ---19 Copper mg/l --- ---20 Nickel mg/l21 Lead mg/l22 Mercury mg/l 0.01 0.01
23 Sodium Absorption Ratio --- ---
24 Aluminum mg/l --- ---25 Lithium mg/l26 Molybednum mg/l --- ---27 Palladium mg/l --- ---28 Selenium mg/l
Date
S. No. Parameter UnitCPCB
Limit forDischarge
OnshoreDischargeStandards
GGS 01
Reject Inlet Outlet Reject Inlet Outlet Reject
7.80 8.29 7.83 8.15 7.50 7.18 7.7132.0°C 29.6°C 33.7°C 30.0°C 28.0°C 28.1°C 28.1°C
<2 <2 <2 2 <2 <2 <23416 2886 818 2910 2782 426 32801520 1470 245 1510 1135 184 123043.50 51.50 23.70 51.50 87.10 27.70 83.206.8 4.9 3.0 5.6 6.9 3.5 7.59.5 12.7 4.7 12.7 22.2 6.3 194.8 4.8 2.9 4.8 7.7 2.9 8.6
<2 <2 <2 <2 <2 <2 <2<8 <8 <8 <8 <8 <8 <8
<5.0 <5.0 <5.0 <5.0 <5.0 <5.0 <5.0<0.002 <0.002 <0.002 <0.002 <0.002 <0.002 <0.002<0.5 <0.5 <0.5 <0.5 <0.5 <0.5 <0.51.35 1.65 0.8 1.92 1.75 0.56 2.05
<0.05 <0.05 <0.05 <0.05 <0.05 <0.05 <0.050.240 0.021 0.015 0.027 0.024 0.012 0.029<0.05 <0.05 <0.05 <0.05 <0.05 <0.05 <0.05<0.05 <0.05 <0.05 <0.05 <0.05 <0.05 <0.05<0.1 <0.1 <0.1 <0.1 <0.1 <0.1 <0.1
<0.001 <0.001 <0.001 <0.001 <0.001 <0.001 <0.001
77.2 72 16.1 73.9 39.1 10.3 42.5
--- --- --- --- --- --- ------ --- --- --- --- --- ------ --- --- --- --- --- ------ --- --- --- --- --- ------ --- --- --- --- --- ---
November' 19
EDH 044EDD 050
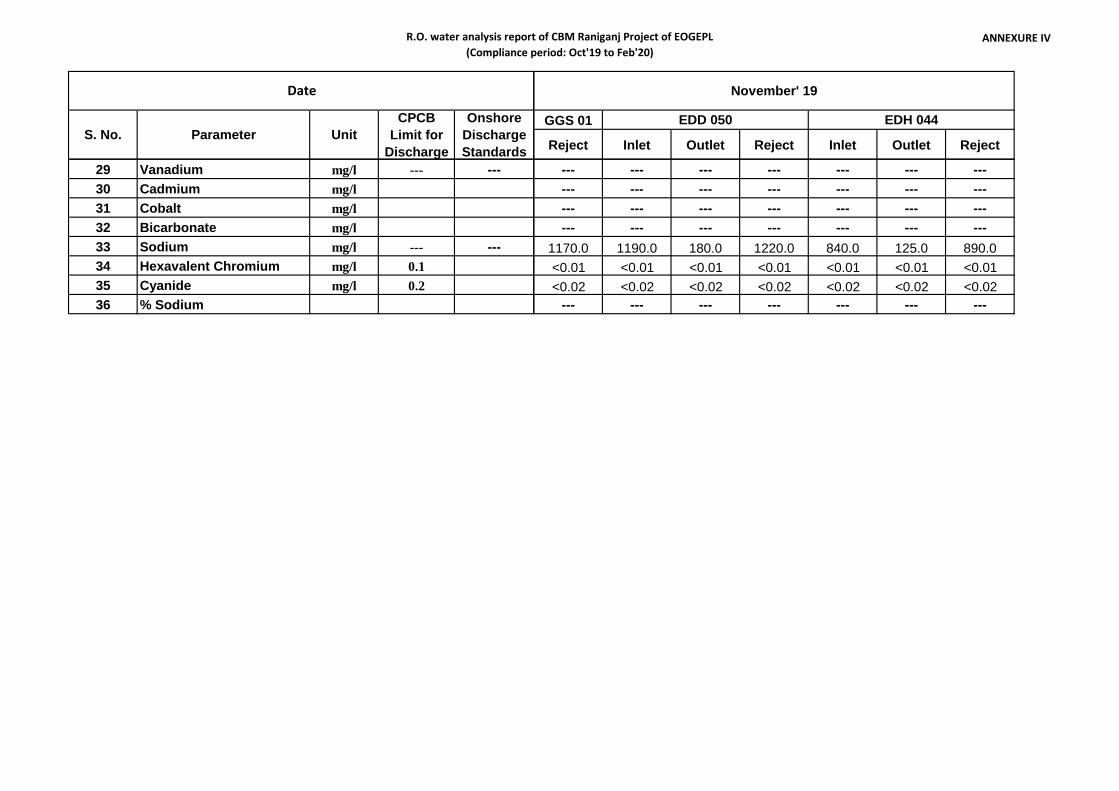
R.O. water analysis report of CBM Raniganj Project of EOGEPL(Compliance period: Oct'19 to Feb'20)
ANNEXURE IV
Date
S. No. Parameter UnitCPCB
Limit forDischarge
OnshoreDischargeStandards
29 Vanadium mg/l --- ---30 Cadmium mg/l31 Cobalt mg/l32 Bicarbonate mg/l33 Sodium mg/l --- ---34 Hexavalent Chromium mg/l 0.135 Cyanide mg/l 0.236 % Sodium
GGS 01
Reject Inlet Outlet Reject Inlet Outlet Reject
November' 19
EDH 044EDD 050
--- --- --- --- --- --- ------ --- --- --- --- --- ------ --- --- --- --- --- ------ --- --- --- --- --- ---
1170.0 1190.0 180.0 1220.0 840.0 125.0 890.0<0.01 <0.01 <0.01 <0.01 <0.01 <0.01 <0.01<0.02 <0.02 <0.02 <0.02 <0.02 <0.02 <0.02
--- --- --- --- --- --- ---
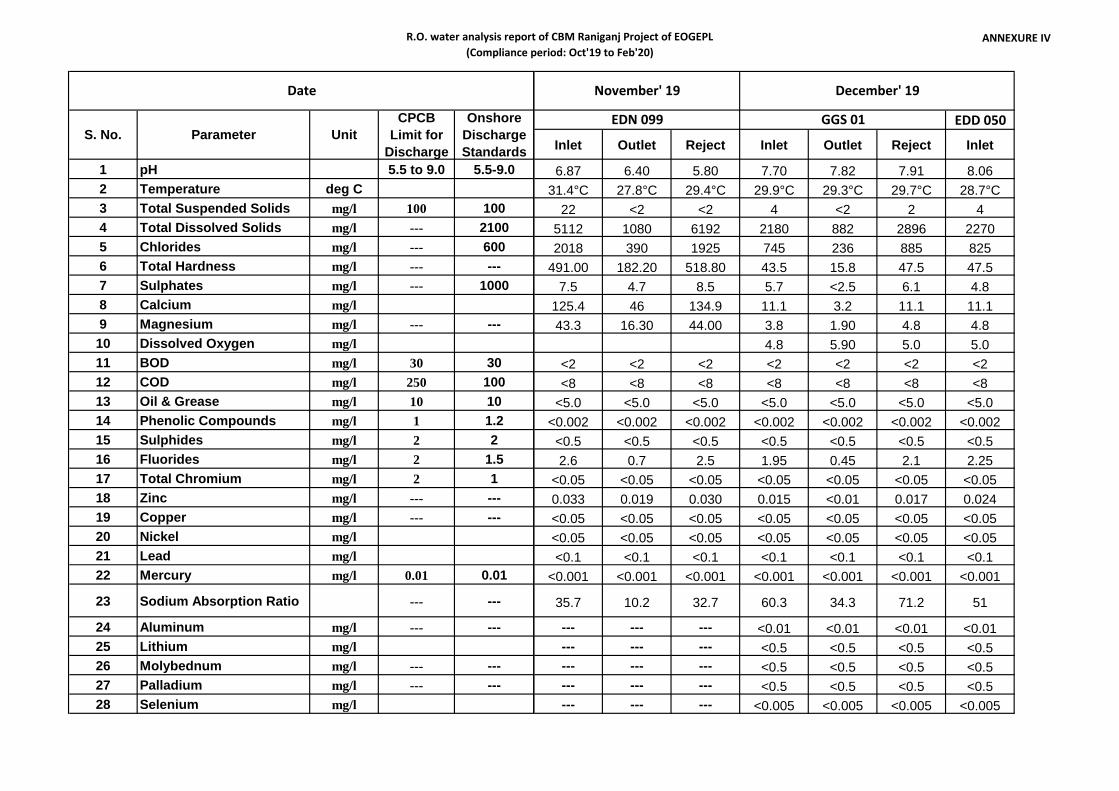
R.O. water analysis report of CBM Raniganj Project of EOGEPL(Compliance period: Oct'19 to Feb'20)
ANNEXURE IV
1 pH 5.5 to 9.0 5.5-9.02 Temperature deg C3 Total Suspended Solids mg/l 100 1004 Total Dissolved Solids mg/l --- 21005 Chlorides mg/l --- 6006 Total Hardness mg/l --- ---7 Sulphates mg/l --- 10008 Calcium mg/l9 Magnesium mg/l --- ---
10 Dissolved Oxygen mg/l11 BOD mg/l 30 3012 COD mg/l 250 10013 Oil & Grease mg/l 10 1014 Phenolic Compounds mg/l 1 1.215 Sulphides mg/l 2 216 Fluorides mg/l 2 1.517 Total Chromium mg/l 2 118 Zinc mg/l --- ---19 Copper mg/l --- ---20 Nickel mg/l21 Lead mg/l22 Mercury mg/l 0.01 0.01
23 Sodium Absorption Ratio --- ---
24 Aluminum mg/l --- ---25 Lithium mg/l26 Molybednum mg/l --- ---27 Palladium mg/l --- ---28 Selenium mg/l
Date
S. No. Parameter UnitCPCB
Limit forDischarge
OnshoreDischargeStandards
EDD 050
Inlet Outlet Reject Inlet Outlet Reject Inlet
6.87 6.40 5.80 7.70 7.82 7.91 8.0631.4°C 27.8°C 29.4°C 29.9°C 29.3°C 29.7°C 28.7°C
22 <2 <2 4 <2 2 45112 1080 6192 2180 882 2896 22702018 390 1925 745 236 885 825
491.00 182.20 518.80 43.5 15.8 47.5 47.57.5 4.7 8.5 5.7 <2.5 6.1 4.8
125.4 46 134.9 11.1 3.2 11.1 11.143.3 16.30 44.00 3.8 1.90 4.8 4.8
4.8 5.90 5.0 5.0<2 <2 <2 <2 <2 <2 <2<8 <8 <8 <8 <8 <8 <8
<5.0 <5.0 <5.0 <5.0 <5.0 <5.0 <5.0<0.002 <0.002 <0.002 <0.002 <0.002 <0.002 <0.002<0.5 <0.5 <0.5 <0.5 <0.5 <0.5 <0.52.6 0.7 2.5 1.95 0.45 2.1 2.25
<0.05 <0.05 <0.05 <0.05 <0.05 <0.05 <0.050.033 0.019 0.030 0.015 <0.01 0.017 0.024<0.05 <0.05 <0.05 <0.05 <0.05 <0.05 <0.05<0.05 <0.05 <0.05 <0.05 <0.05 <0.05 <0.05<0.1 <0.1 <0.1 <0.1 <0.1 <0.1 <0.1
<0.001 <0.001 <0.001 <0.001 <0.001 <0.001 <0.001
35.7 10.2 32.7 60.3 34.3 71.2 51
--- --- --- <0.01 <0.01 <0.01 <0.01--- --- --- <0.5 <0.5 <0.5 <0.5--- --- --- <0.5 <0.5 <0.5 <0.5--- --- --- <0.5 <0.5 <0.5 <0.5--- --- --- <0.005 <0.005 <0.005 <0.005
GGS 01EDN 099
December' 19November' 19
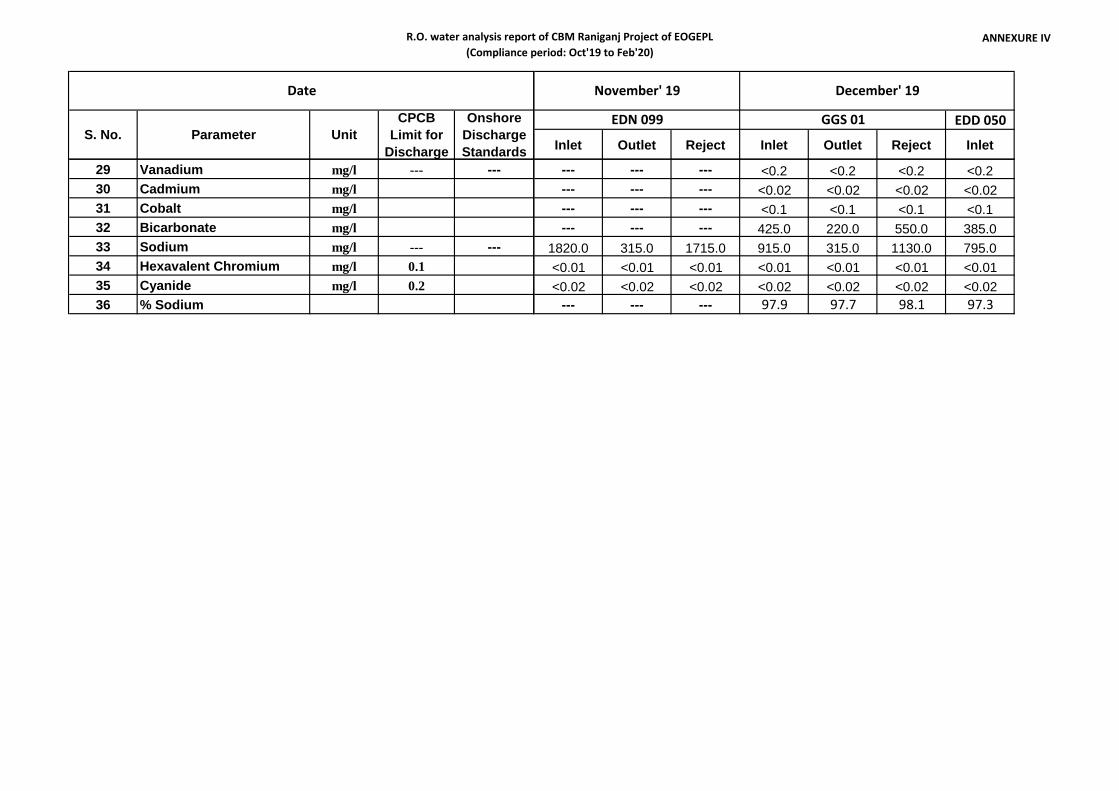
R.O. water analysis report of CBM Raniganj Project of EOGEPL(Compliance period: Oct'19 to Feb'20)
ANNEXURE IV
Date
S. No. Parameter UnitCPCB
Limit forDischarge
OnshoreDischargeStandards
29 Vanadium mg/l --- ---30 Cadmium mg/l31 Cobalt mg/l32 Bicarbonate mg/l33 Sodium mg/l --- ---34 Hexavalent Chromium mg/l 0.135 Cyanide mg/l 0.236 % Sodium
EDD 050
Inlet Outlet Reject Inlet Outlet Reject Inlet
GGS 01EDN 099
December' 19November' 19
--- --- --- <0.2 <0.2 <0.2 <0.2--- --- --- <0.02 <0.02 <0.02 <0.02--- --- --- <0.1 <0.1 <0.1 <0.1--- --- --- 425.0 220.0 550.0 385.0
1820.0 315.0 1715.0 915.0 315.0 1130.0 795.0<0.01 <0.01 <0.01 <0.01 <0.01 <0.01 <0.01<0.02 <0.02 <0.02 <0.02 <0.02 <0.02 <0.02
--- --- --- 97.9 97.7 98.1 97.3
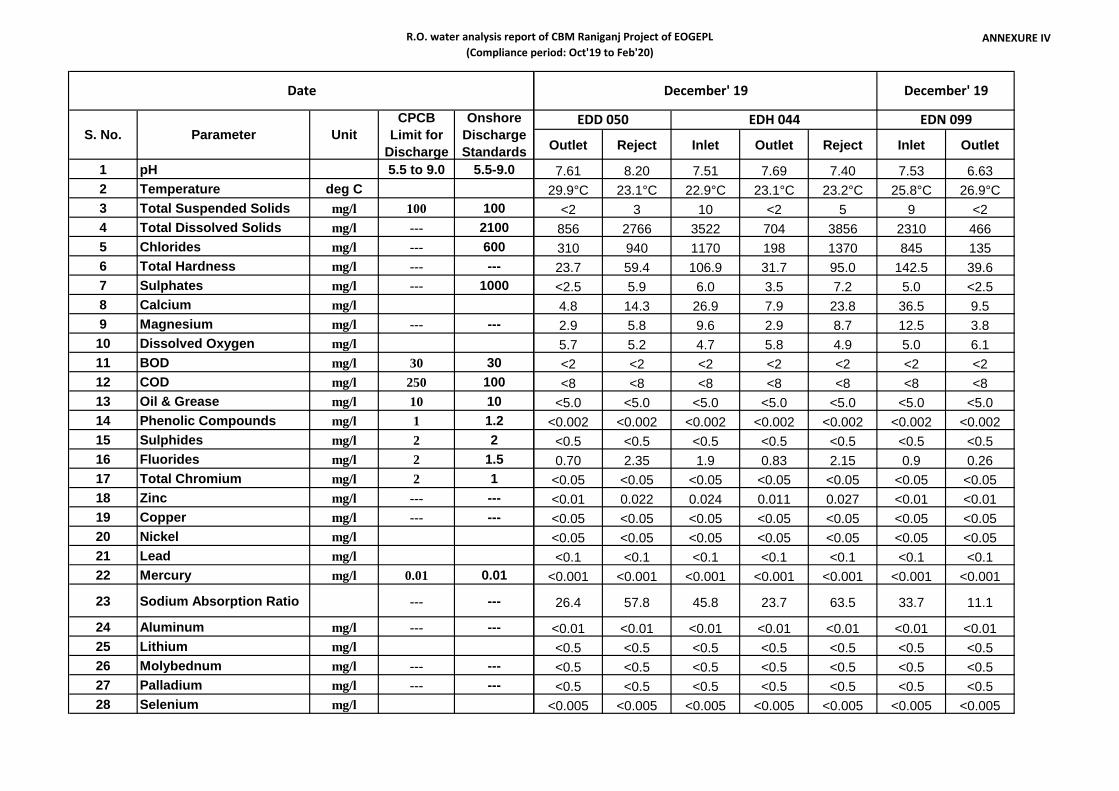
R.O. water analysis report of CBM Raniganj Project of EOGEPL(Compliance period: Oct'19 to Feb'20)
ANNEXURE IV
1 pH 5.5 to 9.0 5.5-9.02 Temperature deg C3 Total Suspended Solids mg/l 100 1004 Total Dissolved Solids mg/l --- 21005 Chlorides mg/l --- 6006 Total Hardness mg/l --- ---7 Sulphates mg/l --- 10008 Calcium mg/l9 Magnesium mg/l --- ---
10 Dissolved Oxygen mg/l11 BOD mg/l 30 3012 COD mg/l 250 10013 Oil & Grease mg/l 10 1014 Phenolic Compounds mg/l 1 1.215 Sulphides mg/l 2 216 Fluorides mg/l 2 1.517 Total Chromium mg/l 2 118 Zinc mg/l --- ---19 Copper mg/l --- ---20 Nickel mg/l21 Lead mg/l22 Mercury mg/l 0.01 0.01
23 Sodium Absorption Ratio --- ---
24 Aluminum mg/l --- ---25 Lithium mg/l26 Molybednum mg/l --- ---27 Palladium mg/l --- ---28 Selenium mg/l
Date
S. No. Parameter UnitCPCB
Limit forDischarge
OnshoreDischargeStandards Outlet Reject Inlet Outlet Reject Inlet Outlet
7.61 8.20 7.51 7.69 7.40 7.53 6.6329.9°C 23.1°C 22.9°C 23.1°C 23.2°C 25.8°C 26.9°C
<2 3 10 <2 5 9 <2856 2766 3522 704 3856 2310 466310 940 1170 198 1370 845 13523.7 59.4 106.9 31.7 95.0 142.5 39.6<2.5 5.9 6.0 3.5 7.2 5.0 <2.54.8 14.3 26.9 7.9 23.8 36.5 9.52.9 5.8 9.6 2.9 8.7 12.5 3.85.7 5.2 4.7 5.8 4.9 5.0 6.1<2 <2 <2 <2 <2 <2 <2<8 <8 <8 <8 <8 <8 <8
<5.0 <5.0 <5.0 <5.0 <5.0 <5.0 <5.0<0.002 <0.002 <0.002 <0.002 <0.002 <0.002 <0.002<0.5 <0.5 <0.5 <0.5 <0.5 <0.5 <0.50.70 2.35 1.9 0.83 2.15 0.9 0.26
<0.05 <0.05 <0.05 <0.05 <0.05 <0.05 <0.05<0.01 0.022 0.024 0.011 0.027 <0.01 <0.01<0.05 <0.05 <0.05 <0.05 <0.05 <0.05 <0.05<0.05 <0.05 <0.05 <0.05 <0.05 <0.05 <0.05<0.1 <0.1 <0.1 <0.1 <0.1 <0.1 <0.1
<0.001 <0.001 <0.001 <0.001 <0.001 <0.001 <0.001
26.4 57.8 45.8 23.7 63.5 33.7 11.1
<0.01 <0.01 <0.01 <0.01 <0.01 <0.01 <0.01<0.5 <0.5 <0.5 <0.5 <0.5 <0.5 <0.5<0.5 <0.5 <0.5 <0.5 <0.5 <0.5 <0.5<0.5 <0.5 <0.5 <0.5 <0.5 <0.5 <0.5
<0.005 <0.005 <0.005 <0.005 <0.005 <0.005 <0.005
December' 19December' 19
EDD 050 EDN 099EDH 044
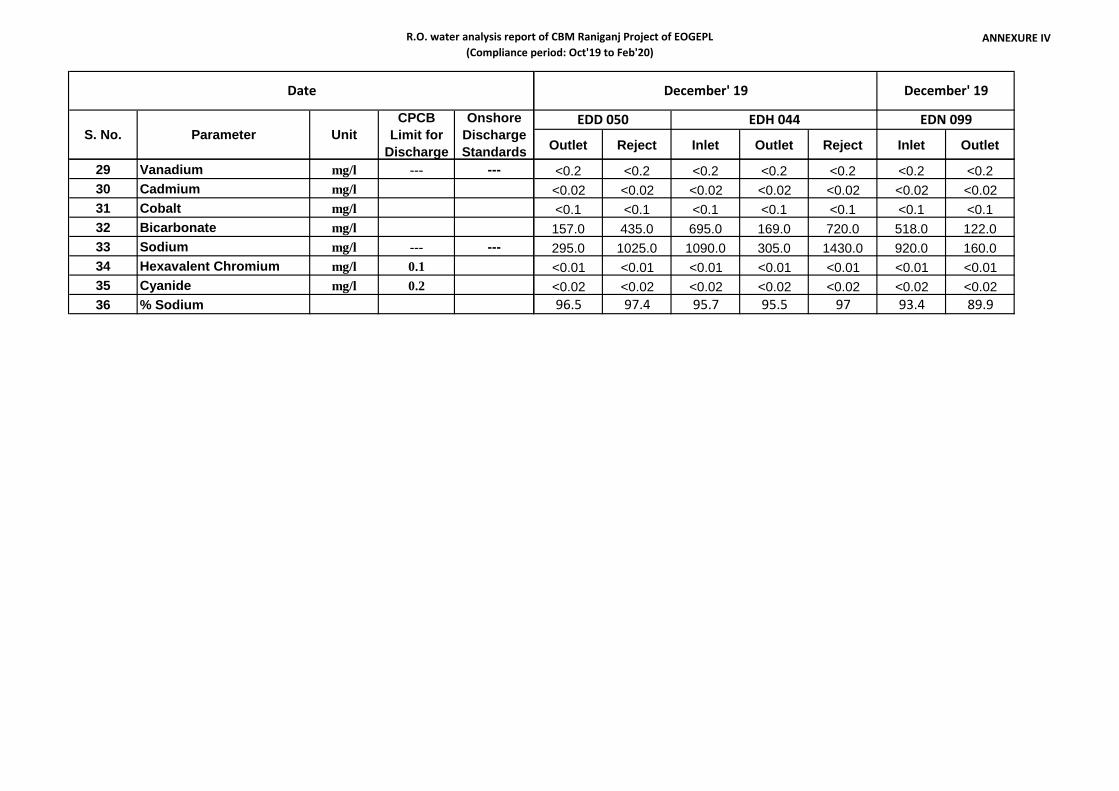
R.O. water analysis report of CBM Raniganj Project of EOGEPL(Compliance period: Oct'19 to Feb'20)
ANNEXURE IV
Date
S. No. Parameter UnitCPCB
Limit forDischarge
OnshoreDischargeStandards
29 Vanadium mg/l --- ---30 Cadmium mg/l31 Cobalt mg/l32 Bicarbonate mg/l33 Sodium mg/l --- ---34 Hexavalent Chromium mg/l 0.135 Cyanide mg/l 0.236 % Sodium
Outlet Reject Inlet Outlet Reject Inlet Outlet
December' 19December' 19
EDD 050 EDN 099EDH 044
<0.2 <0.2 <0.2 <0.2 <0.2 <0.2 <0.2<0.02 <0.02 <0.02 <0.02 <0.02 <0.02 <0.02<0.1 <0.1 <0.1 <0.1 <0.1 <0.1 <0.1157.0 435.0 695.0 169.0 720.0 518.0 122.0295.0 1025.0 1090.0 305.0 1430.0 920.0 160.0<0.01 <0.01 <0.01 <0.01 <0.01 <0.01 <0.01<0.02 <0.02 <0.02 <0.02 <0.02 <0.02 <0.0296.5 97.4 95.7 95.5 97 93.4 89.9
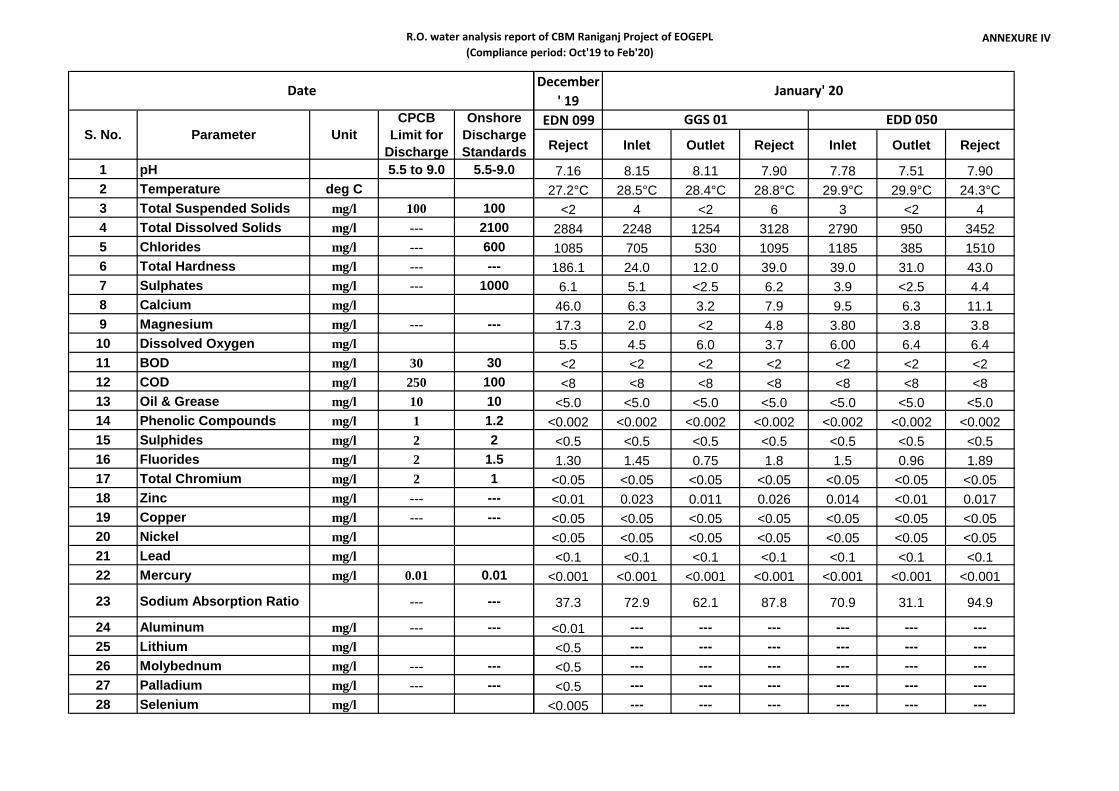
R.O. water analysis report of CBM Raniganj Project of EOGEPL(Compliance period: Oct'19 to Feb'20)
ANNEXURE IV
1 pH 5.5 to 9.0 5.5-9.02 Temperature deg C3 Total Suspended Solids mg/l 100 1004 Total Dissolved Solids mg/l --- 21005 Chlorides mg/l --- 6006 Total Hardness mg/l --- ---7 Sulphates mg/l --- 10008 Calcium mg/l9 Magnesium mg/l --- ---
10 Dissolved Oxygen mg/l11 BOD mg/l 30 3012 COD mg/l 250 10013 Oil & Grease mg/l 10 1014 Phenolic Compounds mg/l 1 1.215 Sulphides mg/l 2 216 Fluorides mg/l 2 1.517 Total Chromium mg/l 2 118 Zinc mg/l --- ---19 Copper mg/l --- ---20 Nickel mg/l21 Lead mg/l22 Mercury mg/l 0.01 0.01
23 Sodium Absorption Ratio --- ---
24 Aluminum mg/l --- ---25 Lithium mg/l26 Molybednum mg/l --- ---27 Palladium mg/l --- ---28 Selenium mg/l
Date
S. No. Parameter UnitCPCB
Limit forDischarge
OnshoreDischargeStandards
December' 19
EDN 099
Reject Inlet Outlet Reject Inlet Outlet Reject
7.16 8.15 8.11 7.90 7.78 7.51 7.9027.2°C 28.5°C 28.4°C 28.8°C 29.9°C 29.9°C 24.3°C
<2 4 <2 6 3 <2 42884 2248 1254 3128 2790 950 34521085 705 530 1095 1185 385 1510186.1 24.0 12.0 39.0 39.0 31.0 43.06.1 5.1 <2.5 6.2 3.9 <2.5 4.446.0 6.3 3.2 7.9 9.5 6.3 11.117.3 2.0 <2 4.8 3.80 3.8 3.85.5 4.5 6.0 3.7 6.00 6.4 6.4<2 <2 <2 <2 <2 <2 <2<8 <8 <8 <8 <8 <8 <8
<5.0 <5.0 <5.0 <5.0 <5.0 <5.0 <5.0<0.002 <0.002 <0.002 <0.002 <0.002 <0.002 <0.002<0.5 <0.5 <0.5 <0.5 <0.5 <0.5 <0.51.30 1.45 0.75 1.8 1.5 0.96 1.89
<0.05 <0.05 <0.05 <0.05 <0.05 <0.05 <0.05<0.01 0.023 0.011 0.026 0.014 <0.01 0.017<0.05 <0.05 <0.05 <0.05 <0.05 <0.05 <0.05<0.05 <0.05 <0.05 <0.05 <0.05 <0.05 <0.05<0.1 <0.1 <0.1 <0.1 <0.1 <0.1 <0.1
<0.001 <0.001 <0.001 <0.001 <0.001 <0.001 <0.001
37.3 72.9 62.1 87.8 70.9 31.1 94.9
<0.01 --- --- --- --- --- ---<0.5 --- --- --- --- --- ---<0.5 --- --- --- --- --- ---<0.5 --- --- --- --- --- ---
<0.005 --- --- --- --- --- ---
January' 20
EDD 050GGS 01
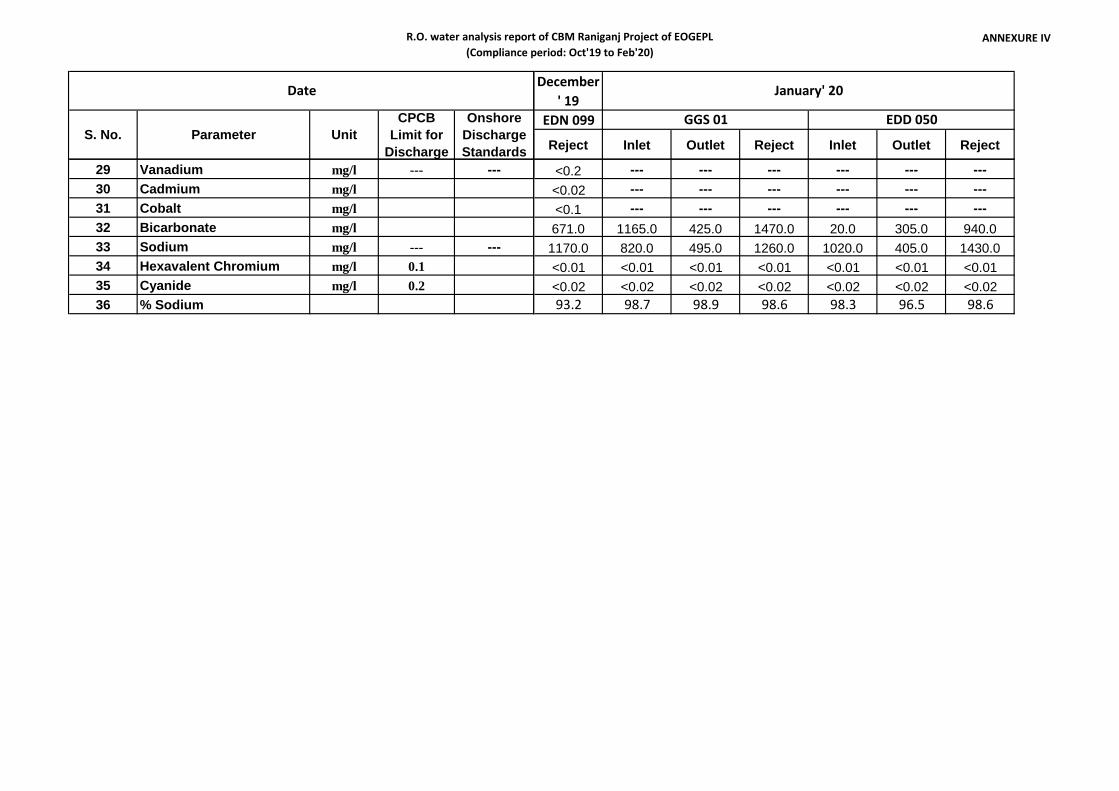
R.O. water analysis report of CBM Raniganj Project of EOGEPL(Compliance period: Oct'19 to Feb'20)
ANNEXURE IV
Date
S. No. Parameter UnitCPCB
Limit forDischarge
OnshoreDischargeStandards
29 Vanadium mg/l --- ---30 Cadmium mg/l31 Cobalt mg/l32 Bicarbonate mg/l33 Sodium mg/l --- ---34 Hexavalent Chromium mg/l 0.135 Cyanide mg/l 0.236 % Sodium
December' 19
EDN 099
Reject Inlet Outlet Reject Inlet Outlet Reject
January' 20
EDD 050GGS 01
<0.2 --- --- --- --- --- ---<0.02 --- --- --- --- --- ---<0.1 --- --- --- --- --- ---671.0 1165.0 425.0 1470.0 20.0 305.0 940.01170.0 820.0 495.0 1260.0 1020.0 405.0 1430.0<0.01 <0.01 <0.01 <0.01 <0.01 <0.01 <0.01<0.02 <0.02 <0.02 <0.02 <0.02 <0.02 <0.0293.2 98.7 98.9 98.6 98.3 96.5 98.6

R.O. water analysis report of CBM Raniganj Project of EOGEPL(Compliance period: Oct'19 to Feb'20)
ANNEXURE IV
1 pH 5.5 to 9.0 5.5-9.02 Temperature deg C3 Total Suspended Solids mg/l 100 1004 Total Dissolved Solids mg/l --- 21005 Chlorides mg/l --- 6006 Total Hardness mg/l --- ---7 Sulphates mg/l --- 10008 Calcium mg/l9 Magnesium mg/l --- ---
10 Dissolved Oxygen mg/l11 BOD mg/l 30 3012 COD mg/l 250 10013 Oil & Grease mg/l 10 1014 Phenolic Compounds mg/l 1 1.215 Sulphides mg/l 2 216 Fluorides mg/l 2 1.517 Total Chromium mg/l 2 118 Zinc mg/l --- ---19 Copper mg/l --- ---20 Nickel mg/l21 Lead mg/l22 Mercury mg/l 0.01 0.01
23 Sodium Absorption Ratio --- ---
24 Aluminum mg/l --- ---25 Lithium mg/l26 Molybednum mg/l --- ---27 Palladium mg/l --- ---28 Selenium mg/l
Date
S. No. Parameter UnitCPCB
Limit forDischarge
OnshoreDischargeStandards
February'20
GGS 01
Inlet Outlet Reject Inlet Outlet Reject Inlet
7.39 7.52 7.72 7.15 6.95 6.81 7.8226.3°C 26.3°C 26.1°C 27.2°C 28.5°C 27.8°C 27.5°C
8 <2 7 <2 <2 <2 33382 692 4188 4236 656 5280 22161320 245 1710 2110 286 2340 830115.0 16.0 79.0 436.0 36.0 594.0 47.08.0 <2.5 10.0 5.3 <2.5 6.2 <2.525.4 3.2 19 112.7 7.9 161.9 11.112.5 2.0 7.7 37.5 3.8 46.2 4.84.7 6.1 4.3 5.0 5.9 3.5 2.0<2 <2 <2 <2 <2 <2 <2<8 <8 <8 <8 <8 <8 <8
<5.0 <5.0 <5.0 <5.0 <5.0 <5.0 <5.0<0.002 <0.002 <0.002 <0.002 <0.002 <0.002 <0.002<0.5 <0.5 <0.5 <0.5 <0.5 <0.5 <0.52.9 0.61 1.75 1.85 0.81 2.30 1.4
<0.05 <0.05 <0.05 <0.05 <0.05 <0.05 <0.050.019 <0.01 0.021 0.015 <0.01 0.022 0.017<0.05 <0.05 <0.05 <0.05 <0.05 <0.05 <0.05<0.05 <0.05 <0.05 <0.05 <0.05 <0.05 <0.05<0.1 <0.1 <0.1 <0.1 <0.1 <0.1 <0.1
<0.001 <0.001 <0.001 <0.001 <0.001 <0.001 <0.001
57.2 31.5 89.6 36.3 22.5 34.3 55.4
--- --- --- --- --- --- ------ --- --- --- --- --- ------ --- --- --- --- --- ------ --- --- --- --- --- ------ --- --- --- --- --- ---
EDH 044 EDN 099
January' 20
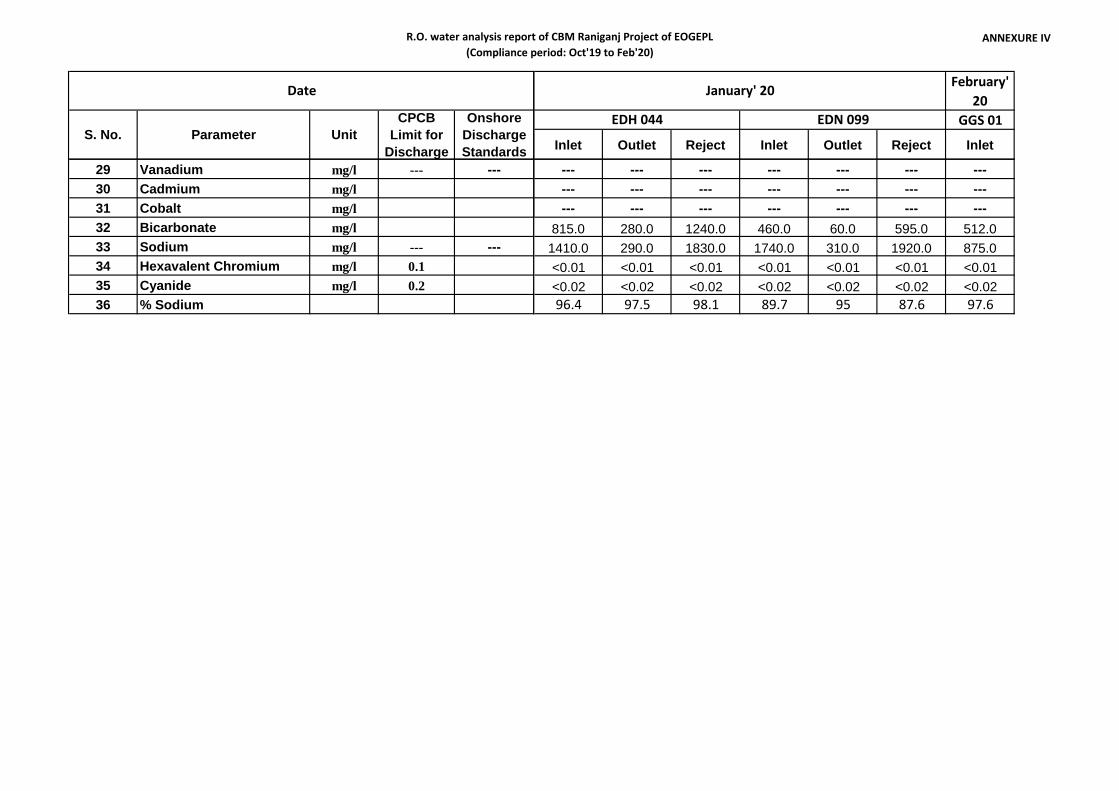
R.O. water analysis report of CBM Raniganj Project of EOGEPL(Compliance period: Oct'19 to Feb'20)
ANNEXURE IV
Date
S. No. Parameter UnitCPCB
Limit forDischarge
OnshoreDischargeStandards
29 Vanadium mg/l --- ---30 Cadmium mg/l31 Cobalt mg/l32 Bicarbonate mg/l33 Sodium mg/l --- ---34 Hexavalent Chromium mg/l 0.135 Cyanide mg/l 0.236 % Sodium
February'20
GGS 01
Inlet Outlet Reject Inlet Outlet Reject Inlet
EDH 044 EDN 099
January' 20
--- --- --- --- --- --- ------ --- --- --- --- --- ------ --- --- --- --- --- ---
815.0 280.0 1240.0 460.0 60.0 595.0 512.01410.0 290.0 1830.0 1740.0 310.0 1920.0 875.0<0.01 <0.01 <0.01 <0.01 <0.01 <0.01 <0.01<0.02 <0.02 <0.02 <0.02 <0.02 <0.02 <0.0296.4 97.5 98.1 89.7 95 87.6 97.6
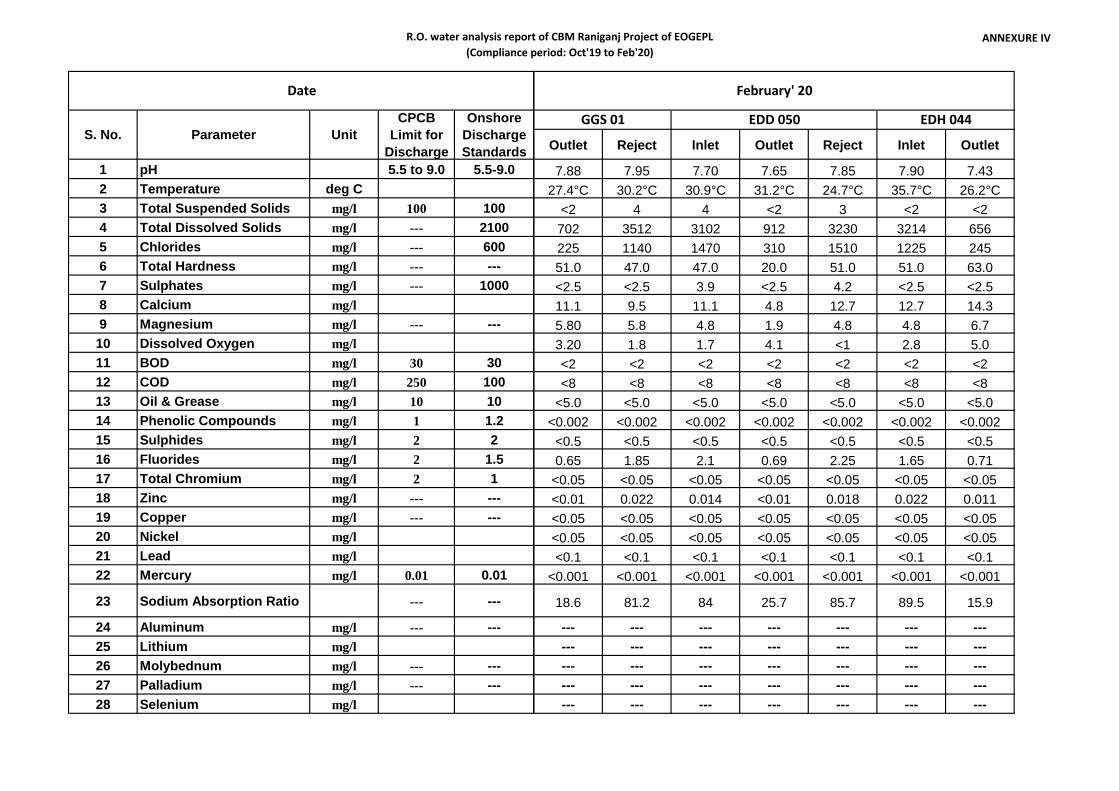
R.O. water analysis report of CBM Raniganj Project of EOGEPL(Compliance period: Oct'19 to Feb'20)
ANNEXURE IV
1 pH 5.5 to 9.0 5.5-9.02 Temperature deg C3 Total Suspended Solids mg/l 100 1004 Total Dissolved Solids mg/l --- 21005 Chlorides mg/l --- 6006 Total Hardness mg/l --- ---7 Sulphates mg/l --- 10008 Calcium mg/l9 Magnesium mg/l --- ---
10 Dissolved Oxygen mg/l11 BOD mg/l 30 3012 COD mg/l 250 10013 Oil & Grease mg/l 10 1014 Phenolic Compounds mg/l 1 1.215 Sulphides mg/l 2 216 Fluorides mg/l 2 1.517 Total Chromium mg/l 2 118 Zinc mg/l --- ---19 Copper mg/l --- ---20 Nickel mg/l21 Lead mg/l22 Mercury mg/l 0.01 0.01
23 Sodium Absorption Ratio --- ---
24 Aluminum mg/l --- ---25 Lithium mg/l26 Molybednum mg/l --- ---27 Palladium mg/l --- ---28 Selenium mg/l
Date
S. No. Parameter UnitCPCB
Limit forDischarge
OnshoreDischargeStandards Outlet Reject Inlet Outlet Reject Inlet Outlet
7.88 7.95 7.70 7.65 7.85 7.90 7.4327.4°C 30.2°C 30.9°C 31.2°C 24.7°C 35.7°C 26.2°C
<2 4 4 <2 3 <2 <2702 3512 3102 912 3230 3214 656225 1140 1470 310 1510 1225 24551.0 47.0 47.0 20.0 51.0 51.0 63.0<2.5 <2.5 3.9 <2.5 4.2 <2.5 <2.511.1 9.5 11.1 4.8 12.7 12.7 14.35.80 5.8 4.8 1.9 4.8 4.8 6.73.20 1.8 1.7 4.1 <1 2.8 5.0<2 <2 <2 <2 <2 <2 <2<8 <8 <8 <8 <8 <8 <8
<5.0 <5.0 <5.0 <5.0 <5.0 <5.0 <5.0<0.002 <0.002 <0.002 <0.002 <0.002 <0.002 <0.002<0.5 <0.5 <0.5 <0.5 <0.5 <0.5 <0.50.65 1.85 2.1 0.69 2.25 1.65 0.71
<0.05 <0.05 <0.05 <0.05 <0.05 <0.05 <0.05<0.01 0.022 0.014 <0.01 0.018 0.022 0.011<0.05 <0.05 <0.05 <0.05 <0.05 <0.05 <0.05<0.05 <0.05 <0.05 <0.05 <0.05 <0.05 <0.05<0.1 <0.1 <0.1 <0.1 <0.1 <0.1 <0.1
<0.001 <0.001 <0.001 <0.001 <0.001 <0.001 <0.001
18.6 81.2 84 25.7 85.7 89.5 15.9
--- --- --- --- --- --- ------ --- --- --- --- --- ------ --- --- --- --- --- ------ --- --- --- --- --- ------ --- --- --- --- --- ---
GGS 01 EDH 044EDD 050
February' 20
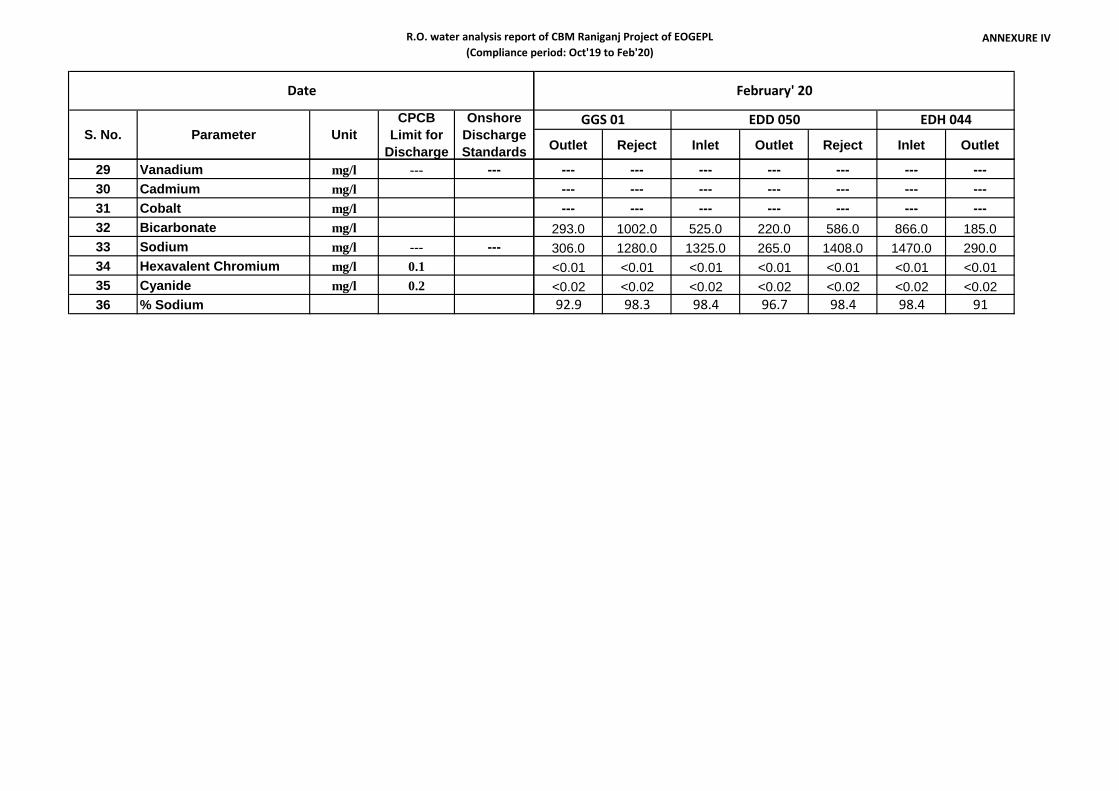
R.O. water analysis report of CBM Raniganj Project of EOGEPL(Compliance period: Oct'19 to Feb'20)
ANNEXURE IV
Date
S. No. Parameter UnitCPCB
Limit forDischarge
OnshoreDischargeStandards
29 Vanadium mg/l --- ---30 Cadmium mg/l31 Cobalt mg/l32 Bicarbonate mg/l33 Sodium mg/l --- ---34 Hexavalent Chromium mg/l 0.135 Cyanide mg/l 0.236 % Sodium
Outlet Reject Inlet Outlet Reject Inlet Outlet
GGS 01 EDH 044EDD 050
February' 20
--- --- --- --- --- --- ------ --- --- --- --- --- ------ --- --- --- --- --- ---
293.0 1002.0 525.0 220.0 586.0 866.0 185.0306.0 1280.0 1325.0 265.0 1408.0 1470.0 290.0<0.01 <0.01 <0.01 <0.01 <0.01 <0.01 <0.01<0.02 <0.02 <0.02 <0.02 <0.02 <0.02 <0.0292.9 98.3 98.4 96.7 98.4 98.4 91
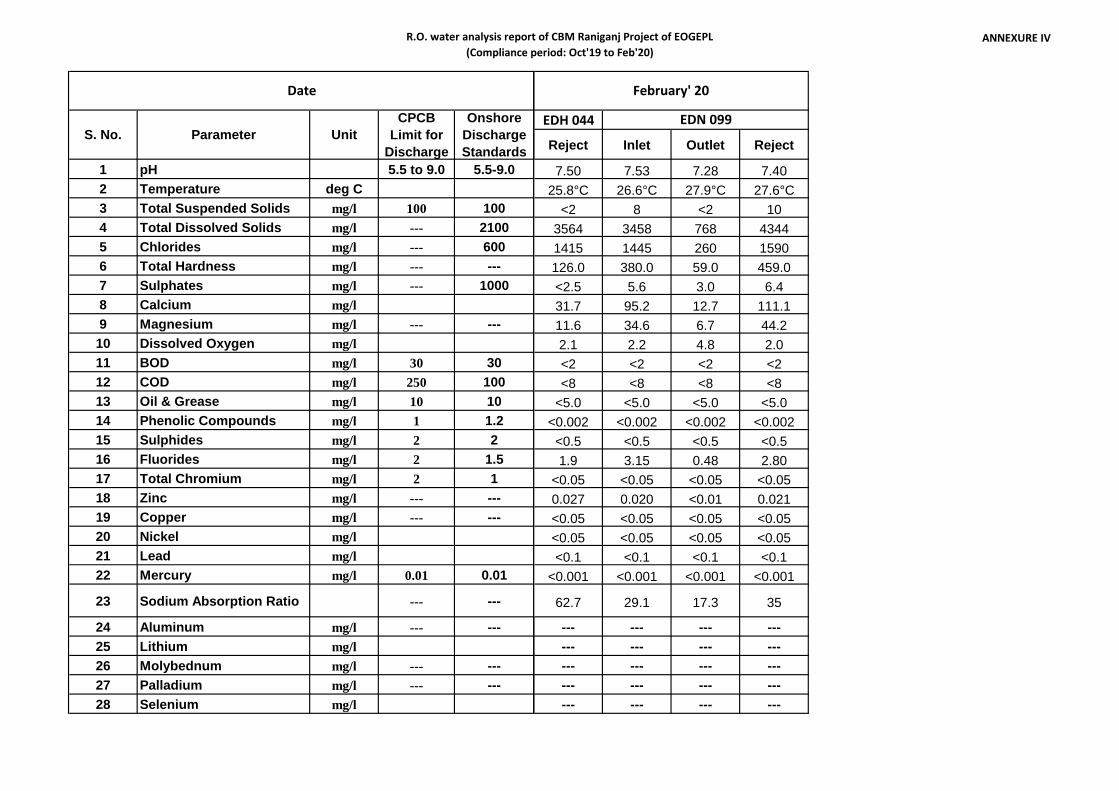
R.O. water analysis report of CBM Raniganj Project of EOGEPL(Compliance period: Oct'19 to Feb'20)
ANNEXURE IV
1 pH 5.5 to 9.0 5.5-9.02 Temperature deg C3 Total Suspended Solids mg/l 100 1004 Total Dissolved Solids mg/l --- 21005 Chlorides mg/l --- 6006 Total Hardness mg/l --- ---7 Sulphates mg/l --- 10008 Calcium mg/l9 Magnesium mg/l --- ---
10 Dissolved Oxygen mg/l11 BOD mg/l 30 3012 COD mg/l 250 10013 Oil & Grease mg/l 10 1014 Phenolic Compounds mg/l 1 1.215 Sulphides mg/l 2 216 Fluorides mg/l 2 1.517 Total Chromium mg/l 2 118 Zinc mg/l --- ---19 Copper mg/l --- ---20 Nickel mg/l21 Lead mg/l22 Mercury mg/l 0.01 0.01
23 Sodium Absorption Ratio --- ---
24 Aluminum mg/l --- ---25 Lithium mg/l26 Molybednum mg/l --- ---27 Palladium mg/l --- ---28 Selenium mg/l
Date
S. No. Parameter UnitCPCB
Limit forDischarge
OnshoreDischargeStandards
EDH 044
Reject Inlet Outlet Reject
7.50 7.53 7.28 7.4025.8°C 26.6°C 27.9°C 27.6°C
<2 8 <2 103564 3458 768 43441415 1445 260 1590126.0 380.0 59.0 459.0<2.5 5.6 3.0 6.431.7 95.2 12.7 111.111.6 34.6 6.7 44.22.1 2.2 4.8 2.0<2 <2 <2 <2<8 <8 <8 <8
<5.0 <5.0 <5.0 <5.0<0.002 <0.002 <0.002 <0.002<0.5 <0.5 <0.5 <0.51.9 3.15 0.48 2.80
<0.05 <0.05 <0.05 <0.050.027 0.020 <0.01 0.021<0.05 <0.05 <0.05 <0.05<0.05 <0.05 <0.05 <0.05<0.1 <0.1 <0.1 <0.1
<0.001 <0.001 <0.001 <0.001
62.7 29.1 17.3 35
--- --- --- ------ --- --- ------ --- --- ------ --- --- ------ --- --- ---
February' 20
EDN 099
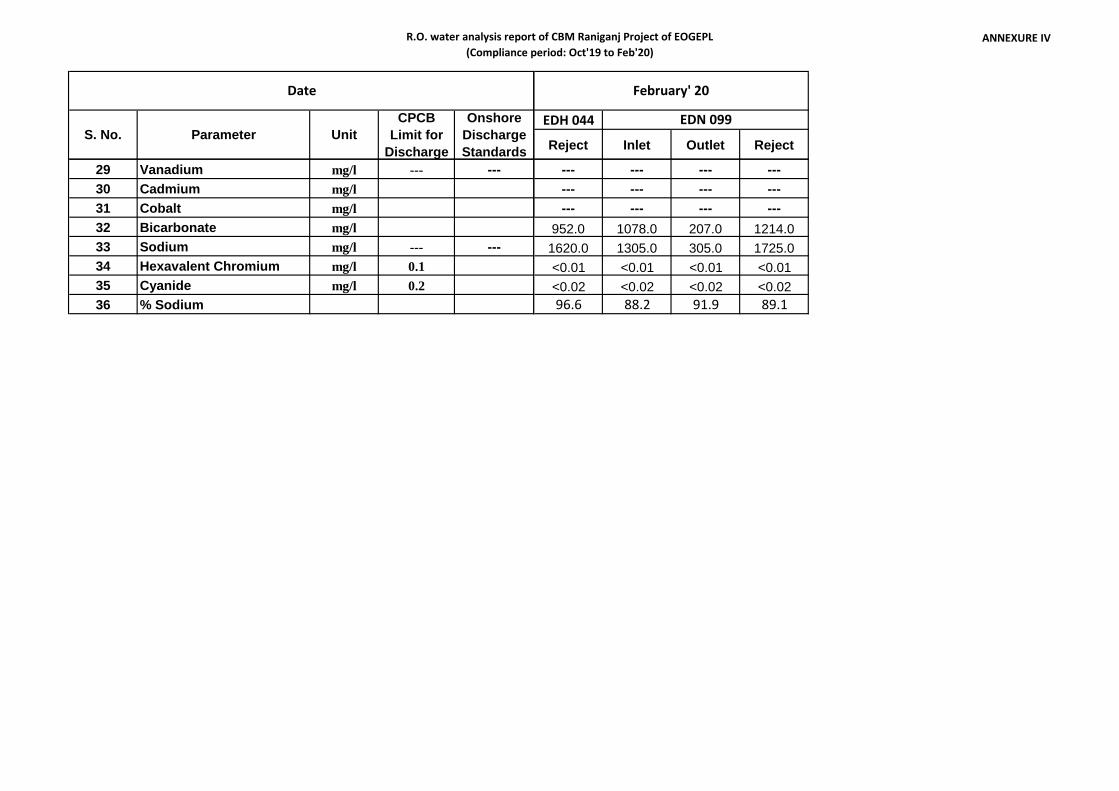
R.O. water analysis report of CBM Raniganj Project of EOGEPL(Compliance period: Oct'19 to Feb'20)
ANNEXURE IV
Date
S. No. Parameter UnitCPCB
Limit forDischarge
OnshoreDischargeStandards
29 Vanadium mg/l --- ---30 Cadmium mg/l31 Cobalt mg/l32 Bicarbonate mg/l33 Sodium mg/l --- ---34 Hexavalent Chromium mg/l 0.135 Cyanide mg/l 0.236 % Sodium
EDH 044
Reject Inlet Outlet Reject
February' 20
EDN 099
--- --- --- ------ --- --- ------ --- --- ---
952.0 1078.0 207.0 1214.01620.0 1305.0 305.0 1725.0<0.01 <0.01 <0.01 <0.01<0.02 <0.02 <0.02 <0.0296.6 88.2 91.9 89.1

ANNEXURE IV A: Surface Water Analysis Report
(Compliance Period: Oct'19- Feb’ 20)
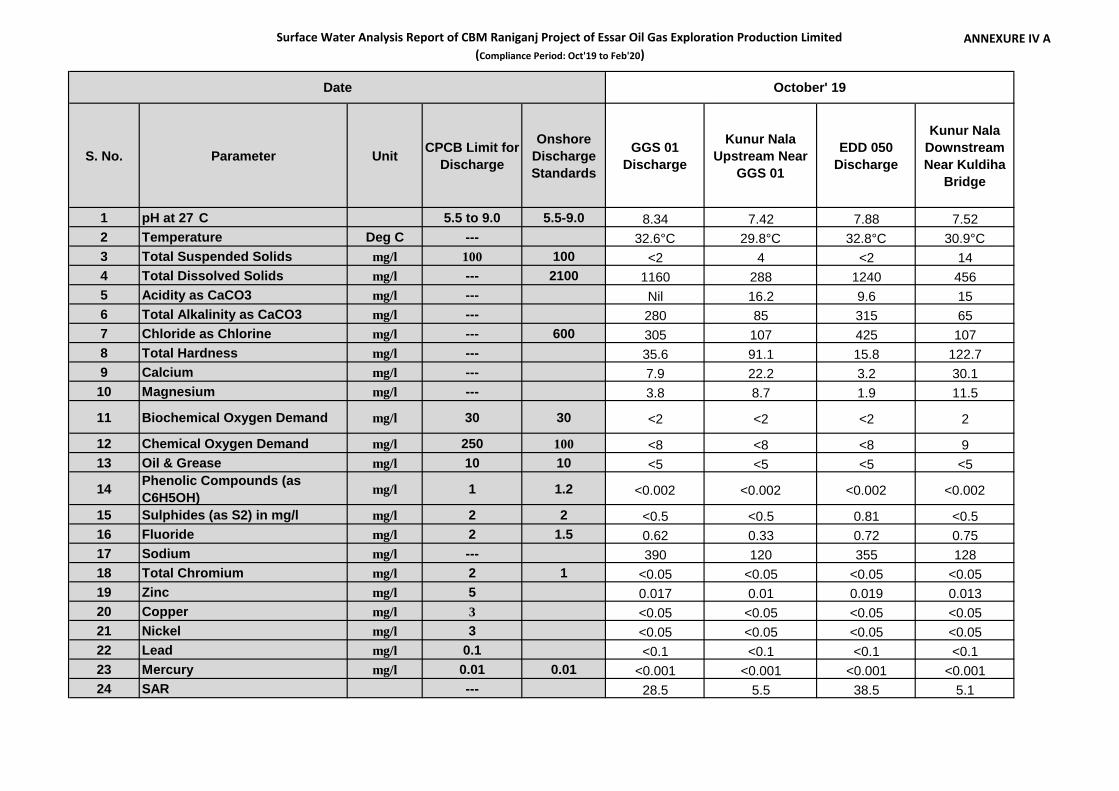
Surface Water Analysis Report of CBM Raniganj Project of Essar Oil Gas Exploration Production Limited(Compliance Period: Oct'19 to Feb'20)
ANNEXURE IV A
S. No. Parameter Unit CPCB Limit forDischarge
OnshoreDischargeStandards
GGS 01Discharge
Kunur NalaUpstream Near
GGS 01
EDD 050Discharge
Kunur NalaDownstreamNear Kuldiha
Bridge
1 pH at 27⁰C 5.5 to 9.0 5.5-9.0 8.34 7.42 7.88 7.522 Temperature Deg C --- 32.6°C 29.8°C 32.8°C 30.9°C3 Total Suspended Solids mg/l 100 100 <2 4 <2 144 Total Dissolved Solids mg/l --- 2100 1160 288 1240 4565 Acidity as CaCO3 mg/l --- Nil 16.2 9.6 156 Total Alkalinity as CaCO3 mg/l --- 280 85 315 657 Chloride as Chlorine mg/l --- 600 305 107 425 1078 Total Hardness mg/l --- 35.6 91.1 15.8 122.79 Calcium mg/l --- 7.9 22.2 3.2 30.1
10 Magnesium mg/l --- 3.8 8.7 1.9 11.5
11 Biochemical Oxygen Demand mg/l 30 30 <2 <2 <2 2
12 Chemical Oxygen Demand mg/l 250 100 <8 <8 <8 913 Oil & Grease mg/l 10 10 <5 <5 <5 <5
14 Phenolic Compounds (asC6H5OH) mg/l 1 1.2 <0.002 <0.002 <0.002 <0.002
15 Sulphides (as S2) in mg/l mg/l 2 2 <0.5 <0.5 0.81 <0.516 Fluoride mg/l 2 1.5 0.62 0.33 0.72 0.7517 Sodium mg/l --- 390 120 355 12818 Total Chromium mg/l 2 1 <0.05 <0.05 <0.05 <0.0519 Zinc mg/l 5 0.017 0.01 0.019 0.01320 Copper mg/l 3 <0.05 <0.05 <0.05 <0.0521 Nickel mg/l 3 <0.05 <0.05 <0.05 <0.0522 Lead mg/l 0.1 <0.1 <0.1 <0.1 <0.123 Mercury mg/l 0.01 0.01 <0.001 <0.001 <0.001 <0.00124 SAR --- 28.5 5.5 38.5 5.1
Date October' 19
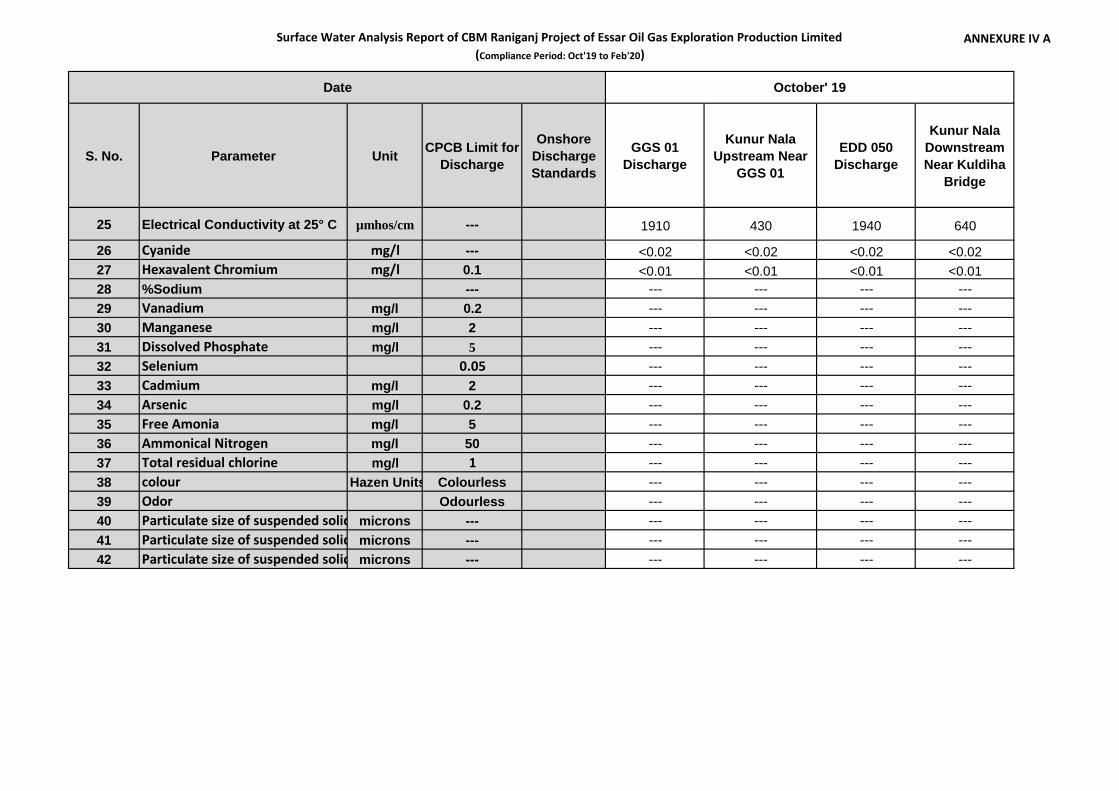
Surface Water Analysis Report of CBM Raniganj Project of Essar Oil Gas Exploration Production Limited(Compliance Period: Oct'19 to Feb'20)
ANNEXURE IV A
S. No. Parameter Unit CPCB Limit forDischarge
OnshoreDischargeStandards
GGS 01Discharge
Kunur NalaUpstream Near
GGS 01
EDD 050Discharge
Kunur NalaDownstreamNear Kuldiha
Bridge
Date October' 19
25 Electrical Conductivity at 25° C µmhos/cm --- 1910 430 1940 640
26 Cyanide mg/l --- <0.02 <0.02 <0.02 <0.0227 Hexavalent Chromium mg/l 0.1 <0.01 <0.01 <0.01 <0.0128 %Sodium --- --- --- --- ---29 Vanadium mg/l 0.2 --- --- --- ---30 Manganese mg/l 2 --- --- --- ---31 Dissolved Phosphate mg/l 5 --- --- --- ---32 Selenium 0.05 --- --- --- ---33 Cadmium mg/l 2 --- --- --- ---34 Arsenic mg/l 0.2 --- --- --- ---35 Free Amonia mg/l 5 --- --- --- ---36 Ammonical Nitrogen mg/l 50 --- --- --- ---37 Total residual chlorine mg/l 1 --- --- --- ---38 colour Hazen Units Colourless --- --- --- ---39 Odor Odourless --- --- --- ---40 Particulate size of suspended solids (<0.45)microns --- --- --- --- ---41 Particulate size of suspended solids(0.45-1.2)microns --- --- --- --- ---42 Particulate size of suspended solids(>1.2)microns --- --- --- --- ---
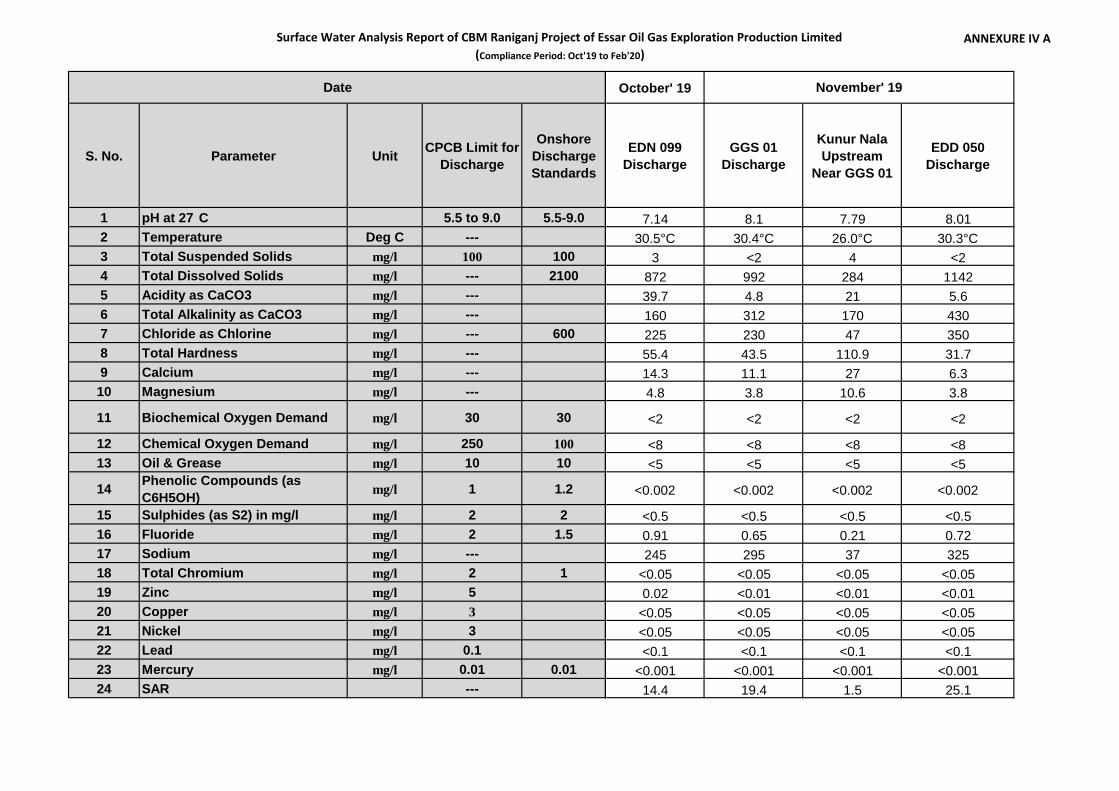
Surface Water Analysis Report of CBM Raniganj Project of Essar Oil Gas Exploration Production Limited(Compliance Period: Oct'19 to Feb'20)
ANNEXURE IV A
S. No. Parameter Unit CPCB Limit forDischarge
OnshoreDischargeStandards
1 pH at 27⁰C 5.5 to 9.0 5.5-9.02 Temperature Deg C ---3 Total Suspended Solids mg/l 100 1004 Total Dissolved Solids mg/l --- 21005 Acidity as CaCO3 mg/l ---6 Total Alkalinity as CaCO3 mg/l ---7 Chloride as Chlorine mg/l --- 6008 Total Hardness mg/l ---9 Calcium mg/l ---
10 Magnesium mg/l ---
11 Biochemical Oxygen Demand mg/l 30 30
12 Chemical Oxygen Demand mg/l 250 10013 Oil & Grease mg/l 10 10
14 Phenolic Compounds (asC6H5OH) mg/l 1 1.2
15 Sulphides (as S2) in mg/l mg/l 2 216 Fluoride mg/l 2 1.517 Sodium mg/l ---18 Total Chromium mg/l 2 119 Zinc mg/l 520 Copper mg/l 321 Nickel mg/l 322 Lead mg/l 0.123 Mercury mg/l 0.01 0.0124 SAR ---
Date October' 19
EDN 099Discharge
GGS 01Discharge
Kunur NalaUpstream
Near GGS 01
EDD 050Discharge
7.14 8.1 7.79 8.0130.5°C 30.4°C 26.0°C 30.3°C
3 <2 4 <2872 992 284 114239.7 4.8 21 5.6160 312 170 430225 230 47 35055.4 43.5 110.9 31.714.3 11.1 27 6.34.8 3.8 10.6 3.8
<2 <2 <2 <2
<8 <8 <8 <8<5 <5 <5 <5
<0.002 <0.002 <0.002 <0.002
<0.5 <0.5 <0.5 <0.50.91 0.65 0.21 0.72245 295 37 325
<0.05 <0.05 <0.05 <0.050.02 <0.01 <0.01 <0.01
<0.05 <0.05 <0.05 <0.05<0.05 <0.05 <0.05 <0.05<0.1 <0.1 <0.1 <0.1
<0.001 <0.001 <0.001 <0.00114.4 19.4 1.5 25.1
November' 19
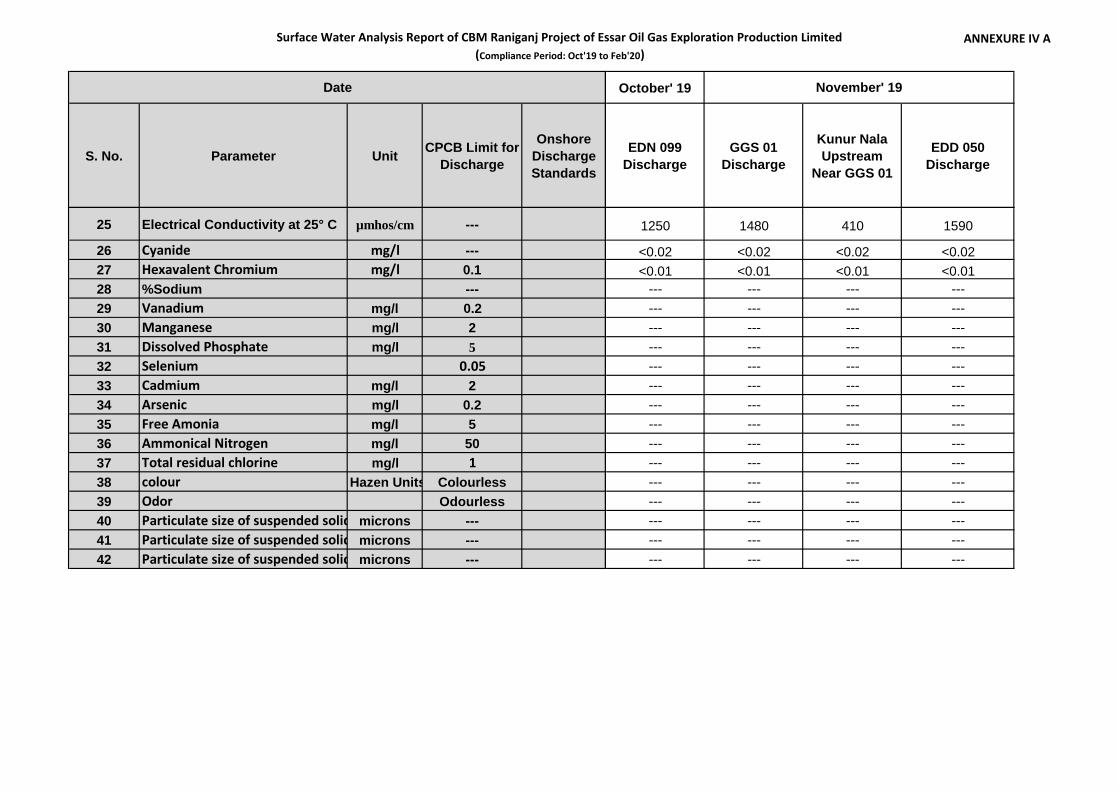
Surface Water Analysis Report of CBM Raniganj Project of Essar Oil Gas Exploration Production Limited(Compliance Period: Oct'19 to Feb'20)
ANNEXURE IV A
S. No. Parameter Unit CPCB Limit forDischarge
OnshoreDischargeStandards
Date
25 Electrical Conductivity at 25° C µmhos/cm ---
26 Cyanide mg/l ---27 Hexavalent Chromium mg/l 0.128 %Sodium ---29 Vanadium mg/l 0.230 Manganese mg/l 231 Dissolved Phosphate mg/l 532 Selenium 0.0533 Cadmium mg/l 234 Arsenic mg/l 0.235 Free Amonia mg/l 536 Ammonical Nitrogen mg/l 5037 Total residual chlorine mg/l 138 colour Hazen Units Colourless39 Odor Odourless40 Particulate size of suspended solids (<0.45)microns ---41 Particulate size of suspended solids(0.45-1.2)microns ---42 Particulate size of suspended solids(>1.2)microns ---
October' 19
EDN 099Discharge
GGS 01Discharge
Kunur NalaUpstream
Near GGS 01
EDD 050Discharge
November' 19
1250 1480 410 1590
<0.02 <0.02 <0.02 <0.02<0.01 <0.01 <0.01 <0.01
--- --- --- ------ --- --- ------ --- --- ------ --- --- ------ --- --- ------ --- --- ------ --- --- ------ --- --- ------ --- --- ------ --- --- ------ --- --- ------ --- --- ------ --- --- ------ --- --- ------ --- --- ---
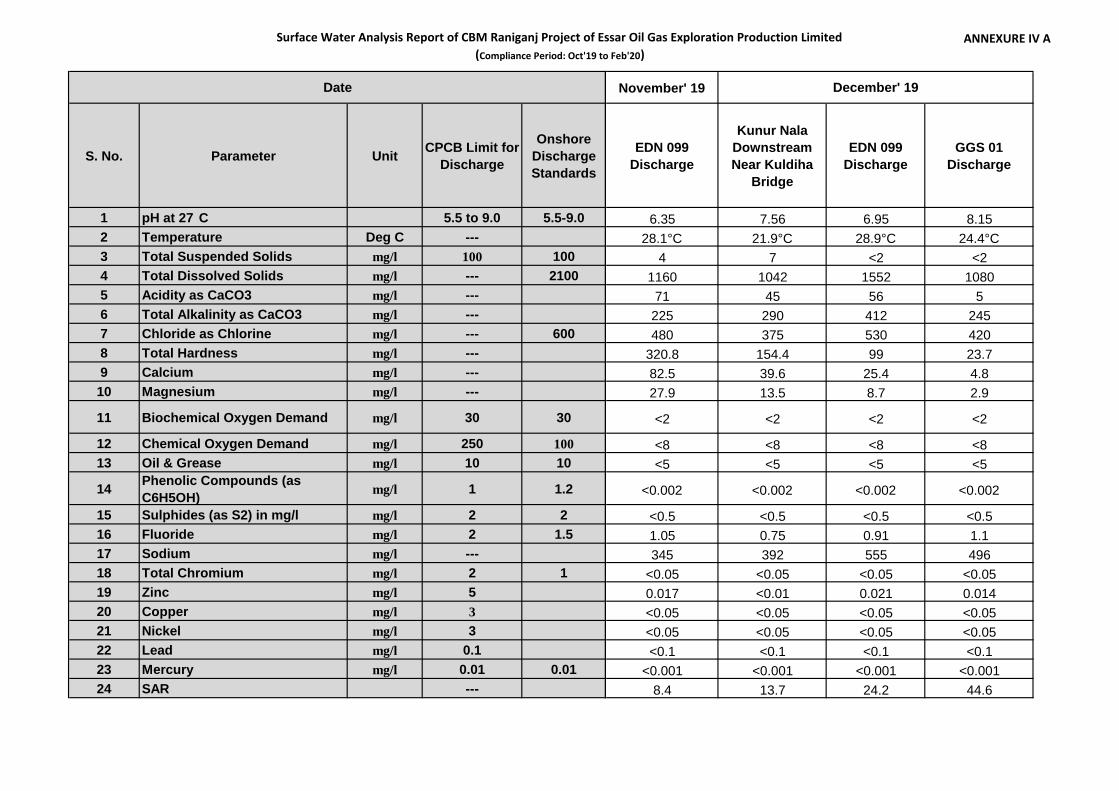
Surface Water Analysis Report of CBM Raniganj Project of Essar Oil Gas Exploration Production Limited(Compliance Period: Oct'19 to Feb'20)
ANNEXURE IV A
S. No. Parameter Unit CPCB Limit forDischarge
OnshoreDischargeStandards
1 pH at 27⁰C 5.5 to 9.0 5.5-9.02 Temperature Deg C ---3 Total Suspended Solids mg/l 100 1004 Total Dissolved Solids mg/l --- 21005 Acidity as CaCO3 mg/l ---6 Total Alkalinity as CaCO3 mg/l ---7 Chloride as Chlorine mg/l --- 6008 Total Hardness mg/l ---9 Calcium mg/l ---
10 Magnesium mg/l ---
11 Biochemical Oxygen Demand mg/l 30 30
12 Chemical Oxygen Demand mg/l 250 10013 Oil & Grease mg/l 10 10
14 Phenolic Compounds (asC6H5OH) mg/l 1 1.2
15 Sulphides (as S2) in mg/l mg/l 2 216 Fluoride mg/l 2 1.517 Sodium mg/l ---18 Total Chromium mg/l 2 119 Zinc mg/l 520 Copper mg/l 321 Nickel mg/l 322 Lead mg/l 0.123 Mercury mg/l 0.01 0.0124 SAR ---
Date November' 19
EDN 099Discharge
Kunur NalaDownstreamNear Kuldiha
Bridge
EDN 099Discharge
GGS 01Discharge
6.35 7.56 6.95 8.1528.1°C 21.9°C 28.9°C 24.4°C
4 7 <2 <21160 1042 1552 108071 45 56 5225 290 412 245480 375 530 420
320.8 154.4 99 23.782.5 39.6 25.4 4.827.9 13.5 8.7 2.9
<2 <2 <2 <2
<8 <8 <8 <8<5 <5 <5 <5
<0.002 <0.002 <0.002 <0.002
<0.5 <0.5 <0.5 <0.51.05 0.75 0.91 1.1345 392 555 496
<0.05 <0.05 <0.05 <0.050.017 <0.01 0.021 0.014<0.05 <0.05 <0.05 <0.05<0.05 <0.05 <0.05 <0.05<0.1 <0.1 <0.1 <0.1
<0.001 <0.001 <0.001 <0.0018.4 13.7 24.2 44.6
December' 19
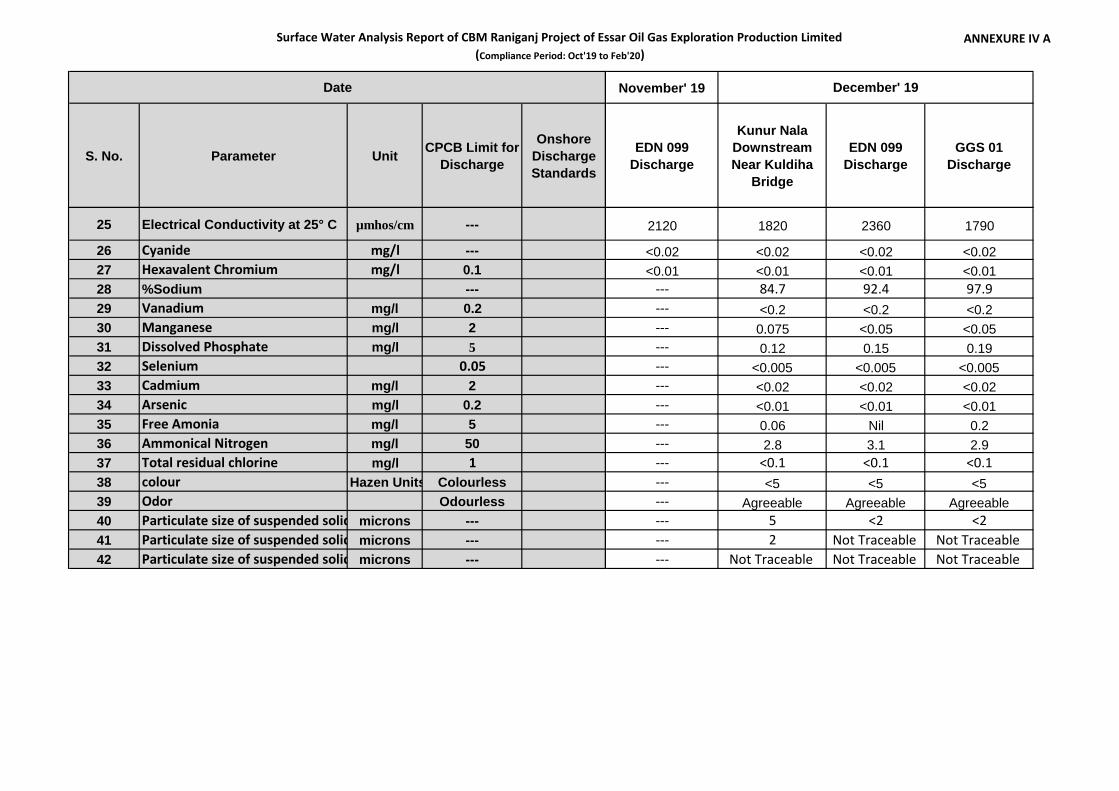
Surface Water Analysis Report of CBM Raniganj Project of Essar Oil Gas Exploration Production Limited(Compliance Period: Oct'19 to Feb'20)
ANNEXURE IV A
S. No. Parameter Unit CPCB Limit forDischarge
OnshoreDischargeStandards
Date
25 Electrical Conductivity at 25° C µmhos/cm ---
26 Cyanide mg/l ---27 Hexavalent Chromium mg/l 0.128 %Sodium ---29 Vanadium mg/l 0.230 Manganese mg/l 231 Dissolved Phosphate mg/l 532 Selenium 0.0533 Cadmium mg/l 234 Arsenic mg/l 0.235 Free Amonia mg/l 536 Ammonical Nitrogen mg/l 5037 Total residual chlorine mg/l 138 colour Hazen Units Colourless39 Odor Odourless40 Particulate size of suspended solids (<0.45)microns ---41 Particulate size of suspended solids(0.45-1.2)microns ---42 Particulate size of suspended solids(>1.2)microns ---
November' 19
EDN 099Discharge
Kunur NalaDownstreamNear Kuldiha
Bridge
EDN 099Discharge
GGS 01Discharge
December' 19
2120 1820 2360 1790
<0.02 <0.02 <0.02 <0.02<0.01 <0.01 <0.01 <0.01
--- 84.7 92.4 97.9--- <0.2 <0.2 <0.2--- 0.075 <0.05 <0.05--- 0.12 0.15 0.19--- <0.005 <0.005 <0.005--- <0.02 <0.02 <0.02--- <0.01 <0.01 <0.01--- 0.06 Nil 0.2--- 2.8 3.1 2.9--- <0.1 <0.1 <0.1--- <5 <5 <5--- Agreeable Agreeable Agreeable--- 5 <2 <2--- 2 Not Traceable Not Traceable--- Not Traceable Not Traceable Not Traceable
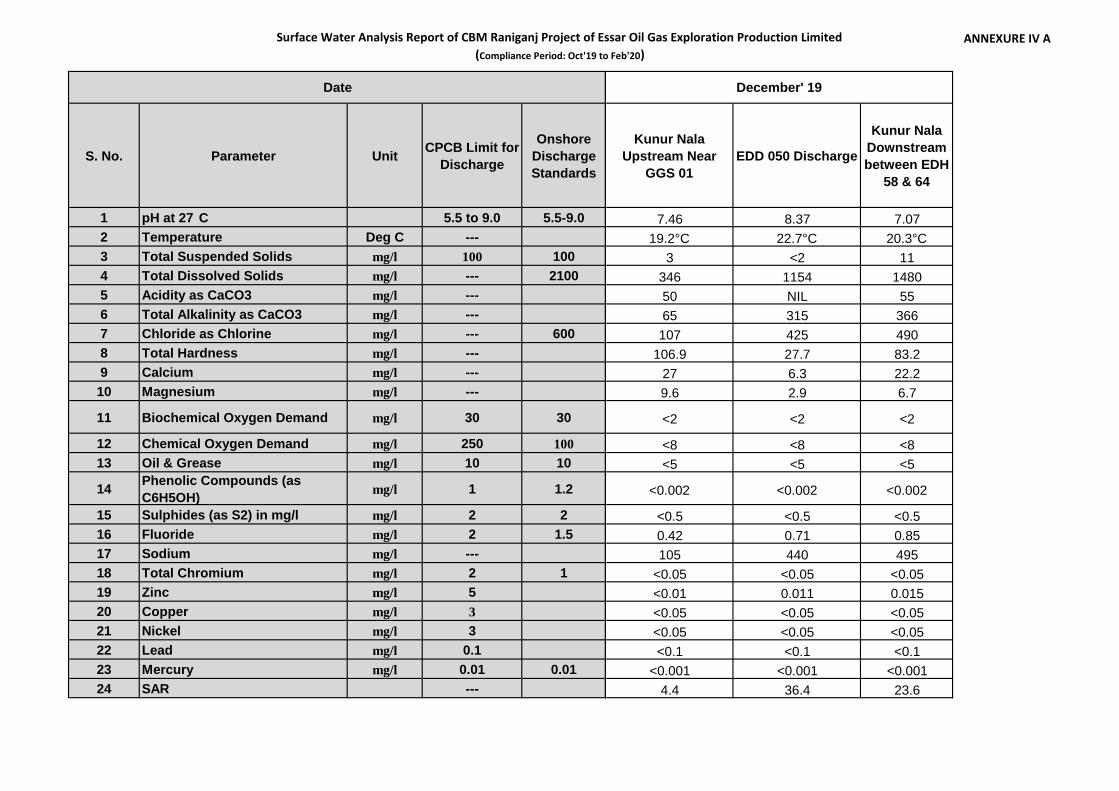
Surface Water Analysis Report of CBM Raniganj Project of Essar Oil Gas Exploration Production Limited(Compliance Period: Oct'19 to Feb'20)
ANNEXURE IV A
S. No. Parameter Unit CPCB Limit forDischarge
OnshoreDischargeStandards
1 pH at 27⁰C 5.5 to 9.0 5.5-9.02 Temperature Deg C ---3 Total Suspended Solids mg/l 100 1004 Total Dissolved Solids mg/l --- 21005 Acidity as CaCO3 mg/l ---6 Total Alkalinity as CaCO3 mg/l ---7 Chloride as Chlorine mg/l --- 6008 Total Hardness mg/l ---9 Calcium mg/l ---
10 Magnesium mg/l ---
11 Biochemical Oxygen Demand mg/l 30 30
12 Chemical Oxygen Demand mg/l 250 10013 Oil & Grease mg/l 10 10
14 Phenolic Compounds (asC6H5OH) mg/l 1 1.2
15 Sulphides (as S2) in mg/l mg/l 2 216 Fluoride mg/l 2 1.517 Sodium mg/l ---18 Total Chromium mg/l 2 119 Zinc mg/l 520 Copper mg/l 321 Nickel mg/l 322 Lead mg/l 0.123 Mercury mg/l 0.01 0.0124 SAR ---
Date
Kunur NalaUpstream Near
GGS 01EDD 050 Discharge
Kunur NalaDownstreambetween EDH
58 & 64
7.46 8.37 7.0719.2°C 22.7°C 20.3°C
3 <2 11346 1154 148050 NIL 5565 315 366107 425 490
106.9 27.7 83.227 6.3 22.29.6 2.9 6.7
<2 <2 <2
<8 <8 <8<5 <5 <5
<0.002 <0.002 <0.002
<0.5 <0.5 <0.50.42 0.71 0.85105 440 495
<0.05 <0.05 <0.05<0.01 0.011 0.015<0.05 <0.05 <0.05<0.05 <0.05 <0.05<0.1 <0.1 <0.1
<0.001 <0.001 <0.0014.4 36.4 23.6
December' 19

Surface Water Analysis Report of CBM Raniganj Project of Essar Oil Gas Exploration Production Limited(Compliance Period: Oct'19 to Feb'20)
ANNEXURE IV A
S. No. Parameter Unit CPCB Limit forDischarge
OnshoreDischargeStandards
Date
25 Electrical Conductivity at 25° C µmhos/cm ---
26 Cyanide mg/l ---27 Hexavalent Chromium mg/l 0.128 %Sodium ---29 Vanadium mg/l 0.230 Manganese mg/l 231 Dissolved Phosphate mg/l 532 Selenium 0.0533 Cadmium mg/l 234 Arsenic mg/l 0.235 Free Amonia mg/l 536 Ammonical Nitrogen mg/l 5037 Total residual chlorine mg/l 138 colour Hazen Units Colourless39 Odor Odourless40 Particulate size of suspended solids (<0.45)microns ---41 Particulate size of suspended solids(0.45-1.2)microns ---42 Particulate size of suspended solids(>1.2)microns ---
Kunur NalaUpstream Near
GGS 01EDD 050 Discharge
Kunur NalaDownstreambetween EDH
58 & 64
December' 19
510 1760 2100
<0.02 <0.02 <0.02<0.01 <0.01 <0.0168.5 97.2 92.9<0.2 <0.2 <0.20.052 <0.05 0.0820.07 0.11 0.16
<0.005 <0.005 <0.005<0.02 <0.02 <0.02<0.01 <0.01 <0.01
Nil 0.53 Nil0.68 4.8 3.5<0.1 <0.1 <0.1<5 <5 <5
Agreeable Agreeable Agreeable3 <2 7
Not Traceable Not Traceable 4Not Traceable Not Traceable Not Traceable

Surface Water Analysis Report of CBM Raniganj Project of Essar Oil Gas Exploration Production Limited(Compliance Period: Oct'19 to Feb'20)
ANNEXURE IV A
S. No. Parameter Unit CPCB Limit forDischarge
OnshoreDischargeStandards
1 pH at 27⁰C 5.5 to 9.0 5.5-9.02 Temperature Deg C ---3 Total Suspended Solids mg/l 100 1004 Total Dissolved Solids mg/l --- 21005 Acidity as CaCO3 mg/l ---6 Total Alkalinity as CaCO3 mg/l ---7 Chloride as Chlorine mg/l --- 6008 Total Hardness mg/l ---9 Calcium mg/l ---
10 Magnesium mg/l ---
11 Biochemical Oxygen Demand mg/l 30 30
12 Chemical Oxygen Demand mg/l 250 10013 Oil & Grease mg/l 10 10
14 Phenolic Compounds (asC6H5OH) mg/l 1 1.2
15 Sulphides (as S2) in mg/l mg/l 2 216 Fluoride mg/l 2 1.517 Sodium mg/l ---18 Total Chromium mg/l 2 119 Zinc mg/l 520 Copper mg/l 321 Nickel mg/l 322 Lead mg/l 0.123 Mercury mg/l 0.01 0.0124 SAR ---
Date
EDD 050Discharge
Kunur NalaUpstream
Near GGS 01
GGS 01Discharge
Kunur NalaDownstreambetween EDH
58 & 64
8.16 7.53 8.2 8.1623.7°C 19.8°C 25.3°C 23.2°C
<2 <2 <2 301264 550 1342 14424.8 30 4 4.8437 246 491 310396 207 412 51044 99 32 67
11.1 25.4 6.3 15.83.8 8.7 3.8 6.7
<2 <2 <2 <2
<8 <8 <8 <8<5 <5 <5 <5
<0.002 <0.002 <0.002 <0.002
<0.5 <0.5 <0.5 <0.51.8 0.63 1.95 0.95415 190 392 496
<0.05 <0.05 <0.05 <0.05<0.01 <0.01 <0.01 0.016<0.05 <0.05 <0.05 <0.05<0.05 <0.05 <0.05 <0.05<0.1 <0.1 <0.1 <0.1
<0.001 <0.001 <0.001 <0.00127.1 8.3 30.1 26.4
January' 20
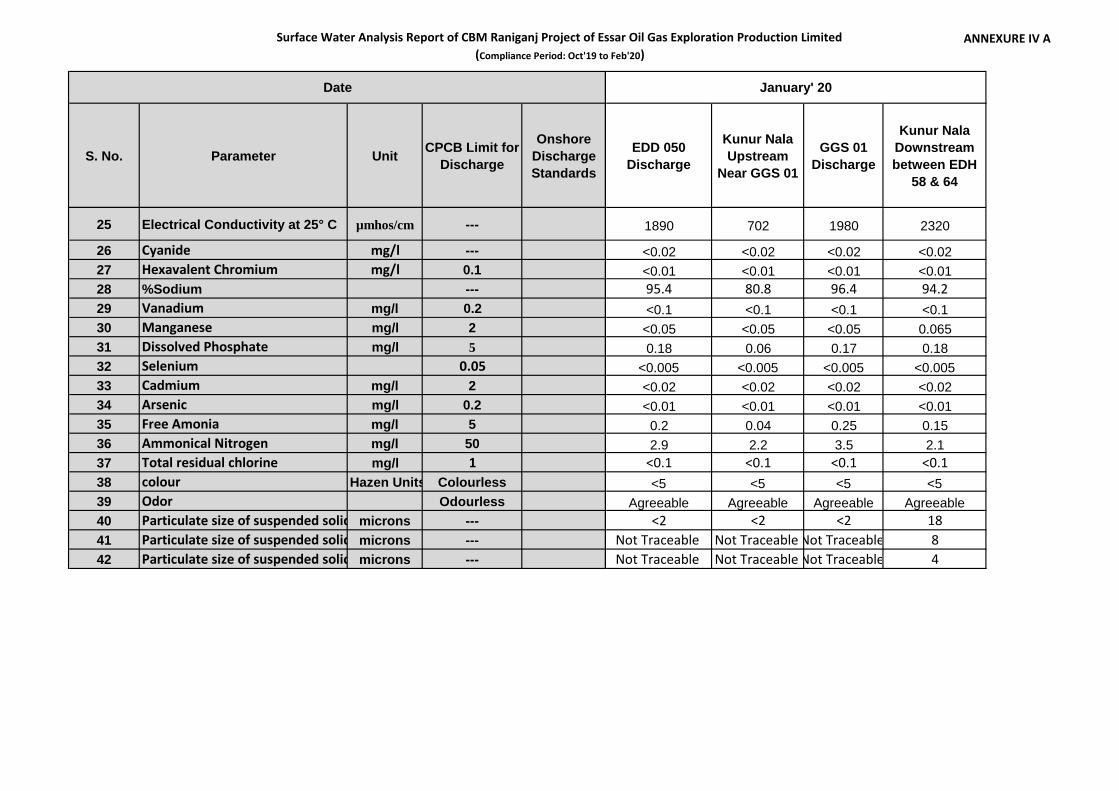
Surface Water Analysis Report of CBM Raniganj Project of Essar Oil Gas Exploration Production Limited(Compliance Period: Oct'19 to Feb'20)
ANNEXURE IV A
S. No. Parameter Unit CPCB Limit forDischarge
OnshoreDischargeStandards
Date
25 Electrical Conductivity at 25° C µmhos/cm ---
26 Cyanide mg/l ---27 Hexavalent Chromium mg/l 0.128 %Sodium ---29 Vanadium mg/l 0.230 Manganese mg/l 231 Dissolved Phosphate mg/l 532 Selenium 0.0533 Cadmium mg/l 234 Arsenic mg/l 0.235 Free Amonia mg/l 536 Ammonical Nitrogen mg/l 5037 Total residual chlorine mg/l 138 colour Hazen Units Colourless39 Odor Odourless40 Particulate size of suspended solids (<0.45)microns ---41 Particulate size of suspended solids(0.45-1.2)microns ---42 Particulate size of suspended solids(>1.2)microns ---
EDD 050Discharge
Kunur NalaUpstream
Near GGS 01
GGS 01Discharge
Kunur NalaDownstreambetween EDH
58 & 64
January' 20
1890 702 1980 2320
<0.02 <0.02 <0.02 <0.02<0.01 <0.01 <0.01 <0.0195.4 80.8 96.4 94.2<0.1 <0.1 <0.1 <0.1<0.05 <0.05 <0.05 0.0650.18 0.06 0.17 0.18
<0.005 <0.005 <0.005 <0.005<0.02 <0.02 <0.02 <0.02<0.01 <0.01 <0.01 <0.01
0.2 0.04 0.25 0.152.9 2.2 3.5 2.1
<0.1 <0.1 <0.1 <0.1<5 <5 <5 <5
Agreeable Agreeable Agreeable Agreeable<2 <2 <2 18
Not Traceable Not Traceable Not Traceable 8Not Traceable Not Traceable Not Traceable 4
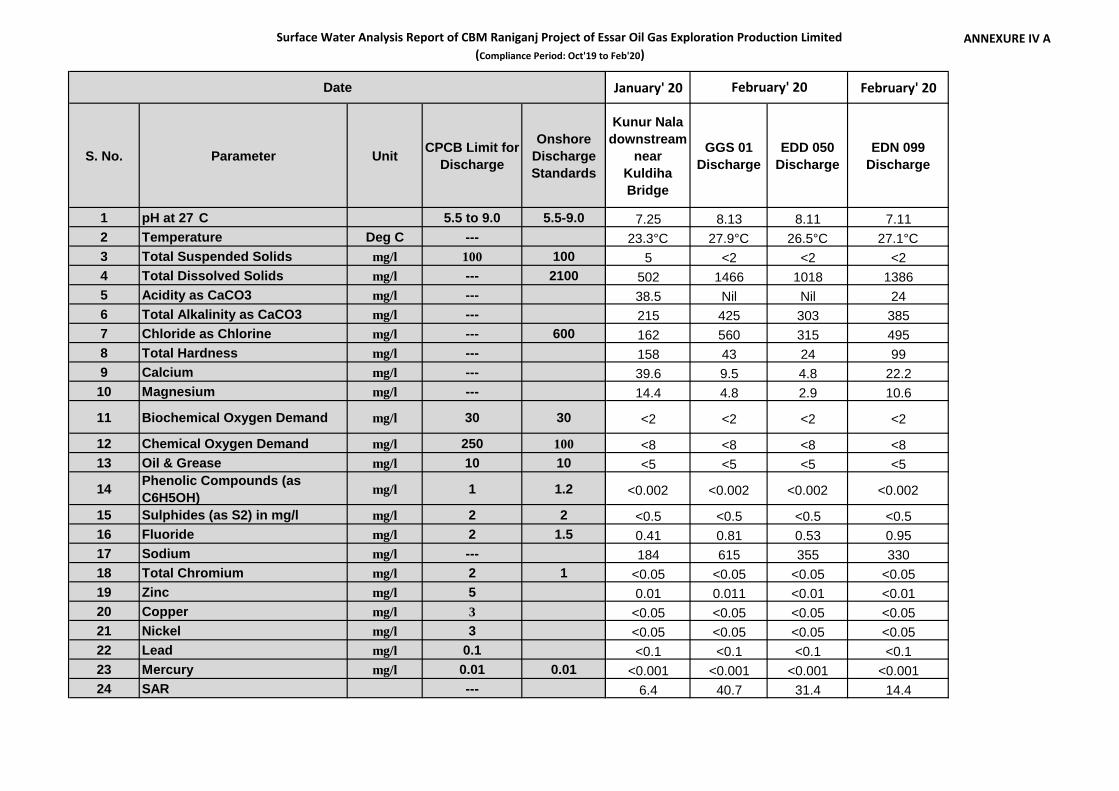
Surface Water Analysis Report of CBM Raniganj Project of Essar Oil Gas Exploration Production Limited(Compliance Period: Oct'19 to Feb'20)
ANNEXURE IV A
S. No. Parameter Unit CPCB Limit forDischarge
OnshoreDischargeStandards
1 pH at 27⁰C 5.5 to 9.0 5.5-9.02 Temperature Deg C ---3 Total Suspended Solids mg/l 100 1004 Total Dissolved Solids mg/l --- 21005 Acidity as CaCO3 mg/l ---6 Total Alkalinity as CaCO3 mg/l ---7 Chloride as Chlorine mg/l --- 6008 Total Hardness mg/l ---9 Calcium mg/l ---
10 Magnesium mg/l ---
11 Biochemical Oxygen Demand mg/l 30 30
12 Chemical Oxygen Demand mg/l 250 10013 Oil & Grease mg/l 10 10
14 Phenolic Compounds (asC6H5OH) mg/l 1 1.2
15 Sulphides (as S2) in mg/l mg/l 2 216 Fluoride mg/l 2 1.517 Sodium mg/l ---18 Total Chromium mg/l 2 119 Zinc mg/l 520 Copper mg/l 321 Nickel mg/l 322 Lead mg/l 0.123 Mercury mg/l 0.01 0.0124 SAR ---
Date January' 20 February' 20
Kunur Naladownstream
nearKuldihaBridge
GGS 01Discharge
EDD 050Discharge
EDN 099Discharge
7.25 8.13 8.11 7.1123.3°C 27.9°C 26.5°C 27.1°C
5 <2 <2 <2502 1466 1018 138638.5 Nil Nil 24215 425 303 385162 560 315 495158 43 24 9939.6 9.5 4.8 22.214.4 4.8 2.9 10.6
<2 <2 <2 <2
<8 <8 <8 <8<5 <5 <5 <5
<0.002 <0.002 <0.002 <0.002
<0.5 <0.5 <0.5 <0.50.41 0.81 0.53 0.95184 615 355 330
<0.05 <0.05 <0.05 <0.050.01 0.011 <0.01 <0.01
<0.05 <0.05 <0.05 <0.05<0.05 <0.05 <0.05 <0.05<0.1 <0.1 <0.1 <0.1
<0.001 <0.001 <0.001 <0.0016.4 40.7 31.4 14.4
February' 20
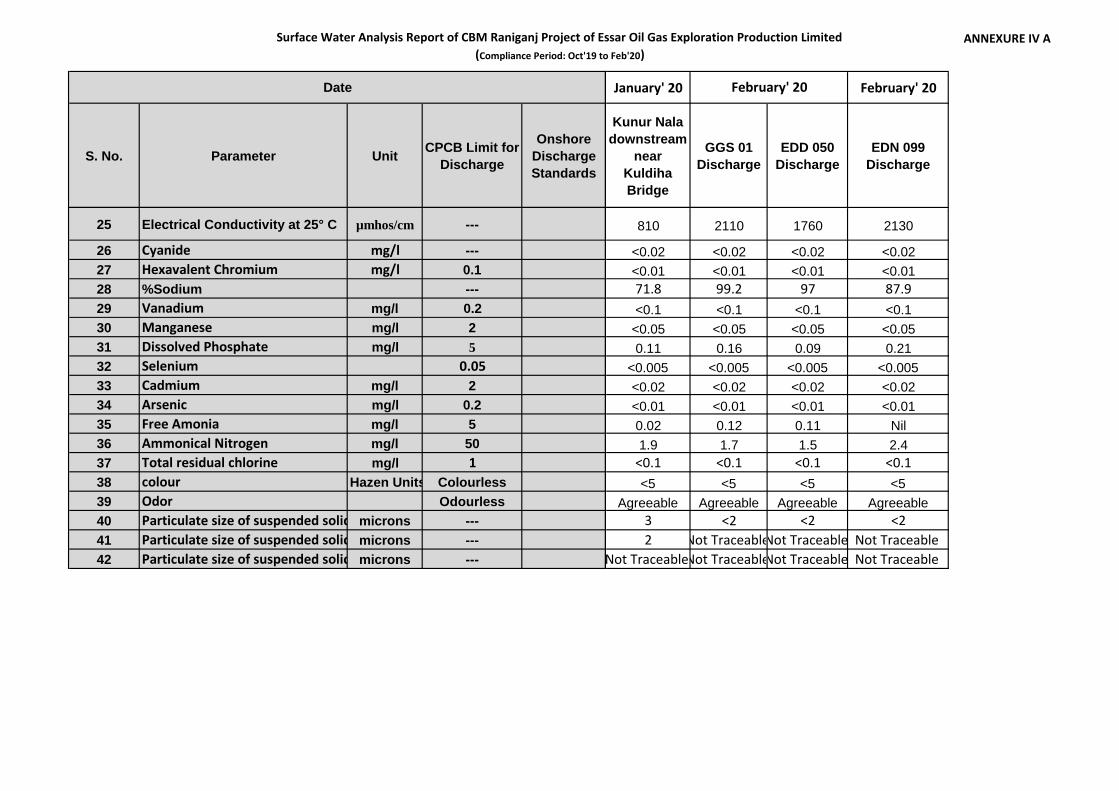
Surface Water Analysis Report of CBM Raniganj Project of Essar Oil Gas Exploration Production Limited(Compliance Period: Oct'19 to Feb'20)
ANNEXURE IV A
S. No. Parameter Unit CPCB Limit forDischarge
OnshoreDischargeStandards
Date
25 Electrical Conductivity at 25° C µmhos/cm ---
26 Cyanide mg/l ---27 Hexavalent Chromium mg/l 0.128 %Sodium ---29 Vanadium mg/l 0.230 Manganese mg/l 231 Dissolved Phosphate mg/l 532 Selenium 0.0533 Cadmium mg/l 234 Arsenic mg/l 0.235 Free Amonia mg/l 536 Ammonical Nitrogen mg/l 5037 Total residual chlorine mg/l 138 colour Hazen Units Colourless39 Odor Odourless40 Particulate size of suspended solids (<0.45)microns ---41 Particulate size of suspended solids(0.45-1.2)microns ---42 Particulate size of suspended solids(>1.2)microns ---
January' 20 February' 20
Kunur Naladownstream
nearKuldihaBridge
GGS 01Discharge
EDD 050Discharge
EDN 099Discharge
February' 20
810 2110 1760 2130
<0.02 <0.02 <0.02 <0.02<0.01 <0.01 <0.01 <0.0171.8 99.2 97 87.9<0.1 <0.1 <0.1 <0.1<0.05 <0.05 <0.05 <0.050.11 0.16 0.09 0.21
<0.005 <0.005 <0.005 <0.005<0.02 <0.02 <0.02 <0.02<0.01 <0.01 <0.01 <0.010.02 0.12 0.11 Nil1.9 1.7 1.5 2.4
<0.1 <0.1 <0.1 <0.1<5 <5 <5 <5
Agreeable Agreeable Agreeable Agreeable3 <2 <2 <22 Not TraceableNot Traceable Not Traceable
Not TraceableNot TraceableNot Traceable Not Traceable
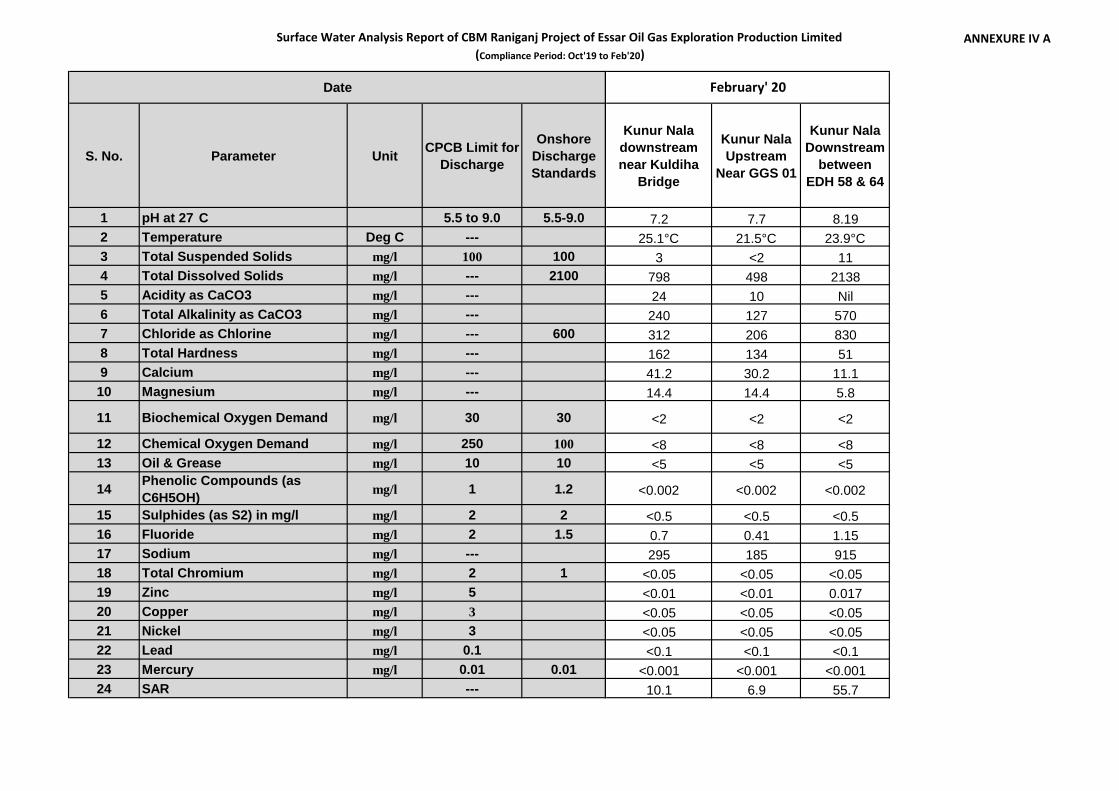
Surface Water Analysis Report of CBM Raniganj Project of Essar Oil Gas Exploration Production Limited(Compliance Period: Oct'19 to Feb'20)
ANNEXURE IV A
S. No. Parameter Unit CPCB Limit forDischarge
OnshoreDischargeStandards
1 pH at 27⁰C 5.5 to 9.0 5.5-9.02 Temperature Deg C ---3 Total Suspended Solids mg/l 100 1004 Total Dissolved Solids mg/l --- 21005 Acidity as CaCO3 mg/l ---6 Total Alkalinity as CaCO3 mg/l ---7 Chloride as Chlorine mg/l --- 6008 Total Hardness mg/l ---9 Calcium mg/l ---
10 Magnesium mg/l ---
11 Biochemical Oxygen Demand mg/l 30 30
12 Chemical Oxygen Demand mg/l 250 10013 Oil & Grease mg/l 10 10
14 Phenolic Compounds (asC6H5OH) mg/l 1 1.2
15 Sulphides (as S2) in mg/l mg/l 2 216 Fluoride mg/l 2 1.517 Sodium mg/l ---18 Total Chromium mg/l 2 119 Zinc mg/l 520 Copper mg/l 321 Nickel mg/l 322 Lead mg/l 0.123 Mercury mg/l 0.01 0.0124 SAR ---
Date
Kunur Naladownstreamnear Kuldiha
Bridge
Kunur NalaUpstream
Near GGS 01
Kunur NalaDownstream
betweenEDH 58 & 64
7.2 7.7 8.1925.1°C 21.5°C 23.9°C
3 <2 11798 498 213824 10 Nil240 127 570312 206 830162 134 5141.2 30.2 11.114.4 14.4 5.8
<2 <2 <2
<8 <8 <8<5 <5 <5
<0.002 <0.002 <0.002
<0.5 <0.5 <0.50.7 0.41 1.15295 185 915
<0.05 <0.05 <0.05<0.01 <0.01 0.017<0.05 <0.05 <0.05<0.05 <0.05 <0.05<0.1 <0.1 <0.1
<0.001 <0.001 <0.00110.1 6.9 55.7
February' 20
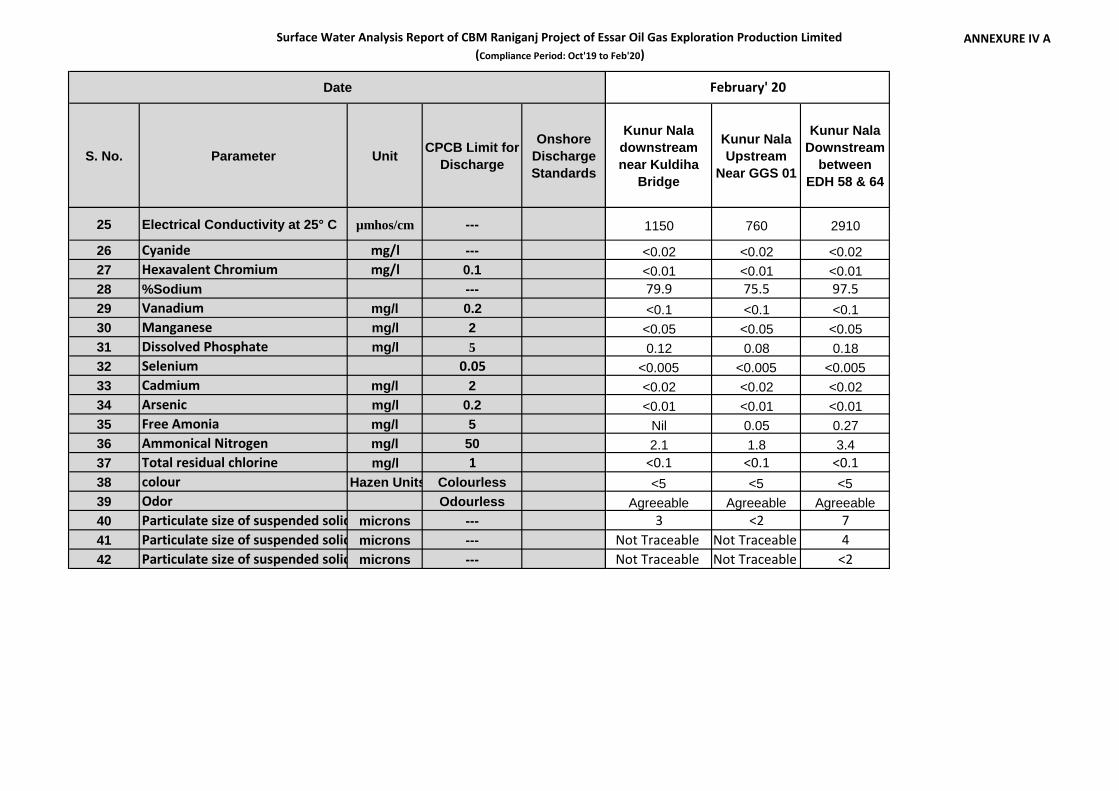
Surface Water Analysis Report of CBM Raniganj Project of Essar Oil Gas Exploration Production Limited(Compliance Period: Oct'19 to Feb'20)
ANNEXURE IV A
S. No. Parameter Unit CPCB Limit forDischarge
OnshoreDischargeStandards
Date
25 Electrical Conductivity at 25° C µmhos/cm ---
26 Cyanide mg/l ---27 Hexavalent Chromium mg/l 0.128 %Sodium ---29 Vanadium mg/l 0.230 Manganese mg/l 231 Dissolved Phosphate mg/l 532 Selenium 0.0533 Cadmium mg/l 234 Arsenic mg/l 0.235 Free Amonia mg/l 536 Ammonical Nitrogen mg/l 5037 Total residual chlorine mg/l 138 colour Hazen Units Colourless39 Odor Odourless40 Particulate size of suspended solids (<0.45)microns ---41 Particulate size of suspended solids(0.45-1.2)microns ---42 Particulate size of suspended solids(>1.2)microns ---
Kunur Naladownstreamnear Kuldiha
Bridge
Kunur NalaUpstream
Near GGS 01
Kunur NalaDownstream
betweenEDH 58 & 64
February' 20
1150 760 2910
<0.02 <0.02 <0.02<0.01 <0.01 <0.0179.9 75.5 97.5<0.1 <0.1 <0.1<0.05 <0.05 <0.050.12 0.08 0.18
<0.005 <0.005 <0.005<0.02 <0.02 <0.02<0.01 <0.01 <0.01
Nil 0.05 0.272.1 1.8 3.4
<0.1 <0.1 <0.1<5 <5 <5
Agreeable Agreeable Agreeable3 <2 7
Not Traceable Not Traceable 4Not Traceable Not Traceable <2
ANNEXURE V: Ground Water Analysis Report
(Compliance Period: Oct'19- Mar’ 20)
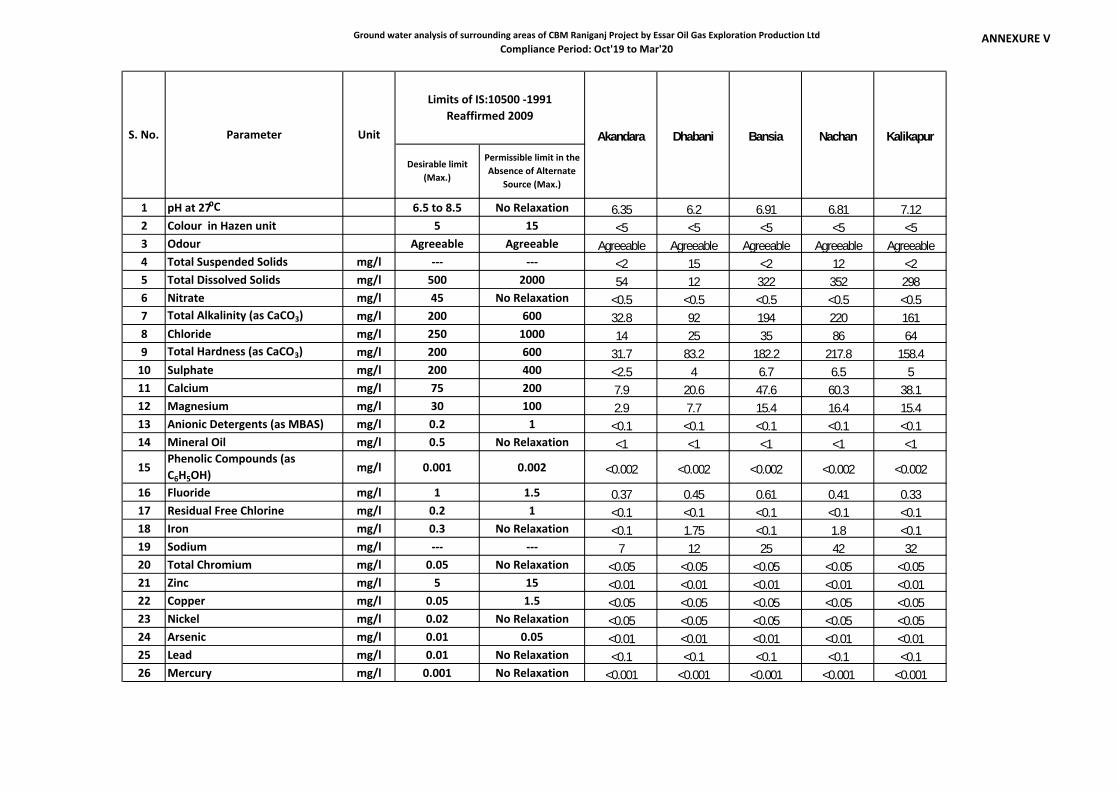
Ground water analysis of surrounding areas of CBM Raniganj Project by Essar Oil Gas Exploration Production LtdCompliance Period: Oct'19 to Mar'20
ANNEXURE V
Desirable limit(Max.)
Permissible limit in theAbsence of Alternate
Source (Max.)
1 pH at 27⁰C 6.5 to 8.5 No Relaxation 6.35 6.2 6.91 6.81 7.122 Colour in Hazen unit 5 15 <5 <5 <5 <5 <53 Odour Agreeable Agreeable Agreeable Agreeable Agreeable Agreeable Agreeable4 Total Suspended Solids mg/l --- --- <2 15 <2 12 <25 Total Dissolved Solids mg/l 500 2000 54 12 322 352 2986 Nitrate mg/l 45 No Relaxation <0.5 <0.5 <0.5 <0.5 <0.57 Total Alkalinity (as CaCO3) mg/l 200 600 32.8 92 194 220 1618 Chloride mg/l 250 1000 14 25 35 86 649 Total Hardness (as CaCO3) mg/l 200 600 31.7 83.2 182.2 217.8 158.4
10 Sulphate mg/l 200 400 <2.5 4 6.7 6.5 511 Calcium mg/l 75 200 7.9 20.6 47.6 60.3 38.112 Magnesium mg/l 30 100 2.9 7.7 15.4 16.4 15.413 Anionic Detergents (as MBAS) mg/l 0.2 1 <0.1 <0.1 <0.1 <0.1 <0.114 Mineral Oil mg/l 0.5 No Relaxation <1 <1 <1 <1 <1
15Phenolic Compounds (asC6H5OH) mg/l 0.001 0.002 <0.002 <0.002 <0.002 <0.002 <0.002
16 Fluoride mg/l 1 1.5 0.37 0.45 0.61 0.41 0.3317 Residual Free Chlorine mg/l 0.2 1 <0.1 <0.1 <0.1 <0.1 <0.118 Iron mg/l 0.3 No Relaxation <0.1 1.75 <0.1 1.8 <0.119 Sodium mg/l --- --- 7 12 25 42 3220 Total Chromium mg/l 0.05 No Relaxation <0.05 <0.05 <0.05 <0.05 <0.0521 Zinc mg/l 5 15 <0.01 <0.01 <0.01 <0.01 <0.0122 Copper mg/l 0.05 1.5 <0.05 <0.05 <0.05 <0.05 <0.0523 Nickel mg/l 0.02 No Relaxation <0.05 <0.05 <0.05 <0.05 <0.0524 Arsenic mg/l 0.01 0.05 <0.01 <0.01 <0.01 <0.01 <0.0125 Lead mg/l 0.01 No Relaxation <0.1 <0.1 <0.1 <0.1 <0.126 Mercury mg/l 0.001 No Relaxation <0.001 <0.001 <0.001 <0.001 <0.001
Dhabani Bansia Nachan KalikapurS. No. Parameter Unit
Limits of IS:10500 -1991Reaffirmed 2009
Akandara
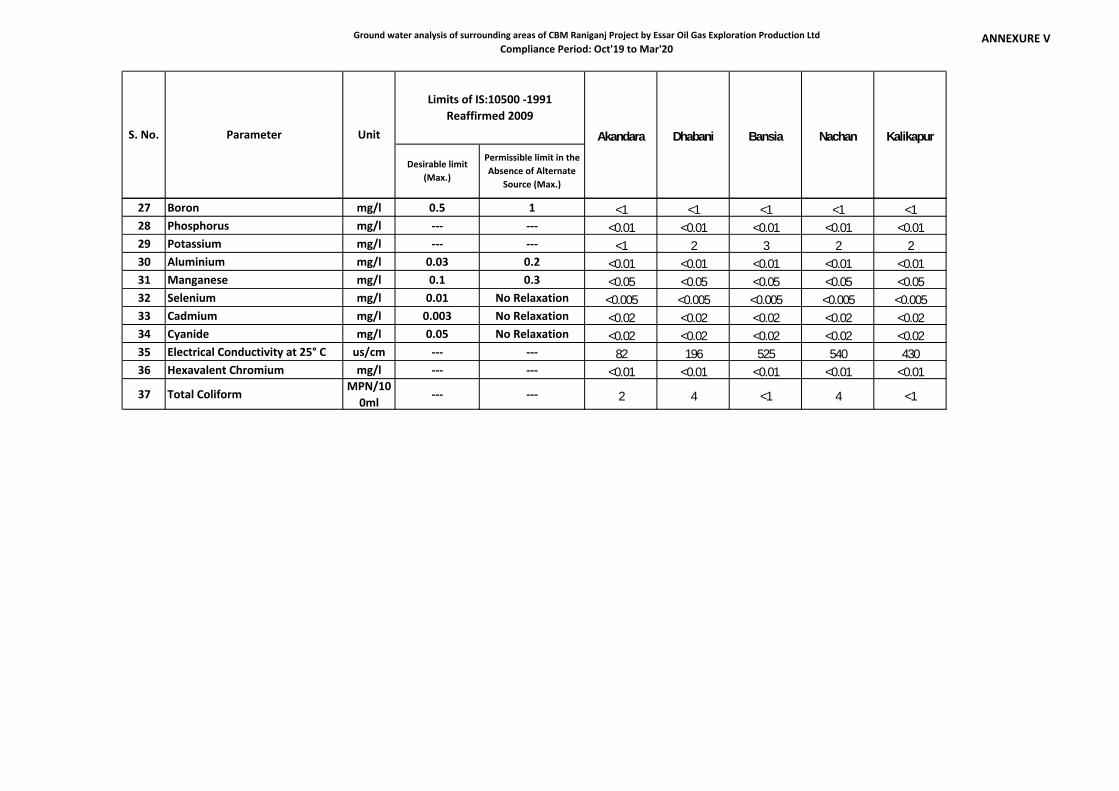
Ground water analysis of surrounding areas of CBM Raniganj Project by Essar Oil Gas Exploration Production LtdCompliance Period: Oct'19 to Mar'20
ANNEXURE V
Desirable limit(Max.)
Permissible limit in theAbsence of Alternate
Source (Max.)
Dhabani Bansia Nachan KalikapurS. No. Parameter Unit
Limits of IS:10500 -1991Reaffirmed 2009
Akandara
27 Boron mg/l 0.5 1 <1 <1 <1 <1 <128 Phosphorus mg/l --- --- <0.01 <0.01 <0.01 <0.01 <0.0129 Potassium mg/l --- --- <1 2 3 2 230 Aluminium mg/l 0.03 0.2 <0.01 <0.01 <0.01 <0.01 <0.0131 Manganese mg/l 0.1 0.3 <0.05 <0.05 <0.05 <0.05 <0.0532 Selenium mg/l 0.01 No Relaxation <0.005 <0.005 <0.005 <0.005 <0.00533 Cadmium mg/l 0.003 No Relaxation <0.02 <0.02 <0.02 <0.02 <0.0234 Cyanide mg/l 0.05 No Relaxation <0.02 <0.02 <0.02 <0.02 <0.0235 Electrical Conductivity at 25° C us/cm --- --- 82 196 525 540 43036 Hexavalent Chromium mg/l --- --- <0.01 <0.01 <0.01 <0.01 <0.01
37 Total ColiformMPN/10
0ml--- --- 2 4 <1 4 <1

Ground water analysis of surrounding areas of CBM Raniganj Project by Essar Oil Gas Exploration Production LtdCompliance Period: Oct'19 to Mar'20
ANNEXURE V
Desirable limit(Max.)
Permissible limit in theAbsence of Alternate
Source (Max.)
1 pH at 27⁰C 6.5 to 8.5 No Relaxation2 Colour in Hazen unit 5 153 Odour Agreeable Agreeable4 Total Suspended Solids mg/l --- ---5 Total Dissolved Solids mg/l 500 20006 Nitrate mg/l 45 No Relaxation7 Total Alkalinity (as CaCO3) mg/l 200 6008 Chloride mg/l 250 10009 Total Hardness (as CaCO3) mg/l 200 600
10 Sulphate mg/l 200 40011 Calcium mg/l 75 20012 Magnesium mg/l 30 10013 Anionic Detergents (as MBAS) mg/l 0.2 114 Mineral Oil mg/l 0.5 No Relaxation
15Phenolic Compounds (asC6H5OH) mg/l 0.001 0.002
16 Fluoride mg/l 1 1.517 Residual Free Chlorine mg/l 0.2 118 Iron mg/l 0.3 No Relaxation19 Sodium mg/l --- ---20 Total Chromium mg/l 0.05 No Relaxation21 Zinc mg/l 5 1522 Copper mg/l 0.05 1.523 Nickel mg/l 0.02 No Relaxation24 Arsenic mg/l 0.01 0.0525 Lead mg/l 0.01 No Relaxation26 Mercury mg/l 0.001 No Relaxation
S. No. Parameter Unit
Limits of IS:10500 -1991Reaffirmed 2009
6.3 6.71 7.12 6.45 6.28<5 <5 <5 <5 <5
Agreeable Agreeable Agreeable Agreeable Agreeable4 212 2 35 <248 120 104 98 228
<0.5 <0.5 <0.5 <0.5 <0.531 43 54 50 14.810 24 22 28 82.6
43.5 23.8 51.5 47.5 83.1<2.5 5 6.2 4.7 89.5 6.3 12.7 11.1 33.34.8 1.9 4.8 4.8 7.7<0.1 <0.1 <0.1 <0.1 <0.1<1 <1 <1 <1 <1
<0.002 <0.002 <0.002 <0.002 <0.002
0.2 0.19 0.1 0.12 0.26<0.1 <0.1 <0.1 <0.1 <0.10.52 55.5 0.8 9 0.33
4 11 14 12 64<0.05 <0.05 <0.05 <0.05 <0.05<0.01 <0.01 <0.01 <0.01 <0.01<0.05 <0.05 <0.05 <0.05 <0.05<0.05 <0.05 <0.05 <0.05 <0.05<0.01 <0.01 <0.01 <0.01 <0.01<0.1 <0.1 <0.1 <0.1 <0.1
<0.001 <0.001 <0.001 <0.001 <0.001
Bargoria Kantaberia Jatgoria Saraswatiganj Gopalpur
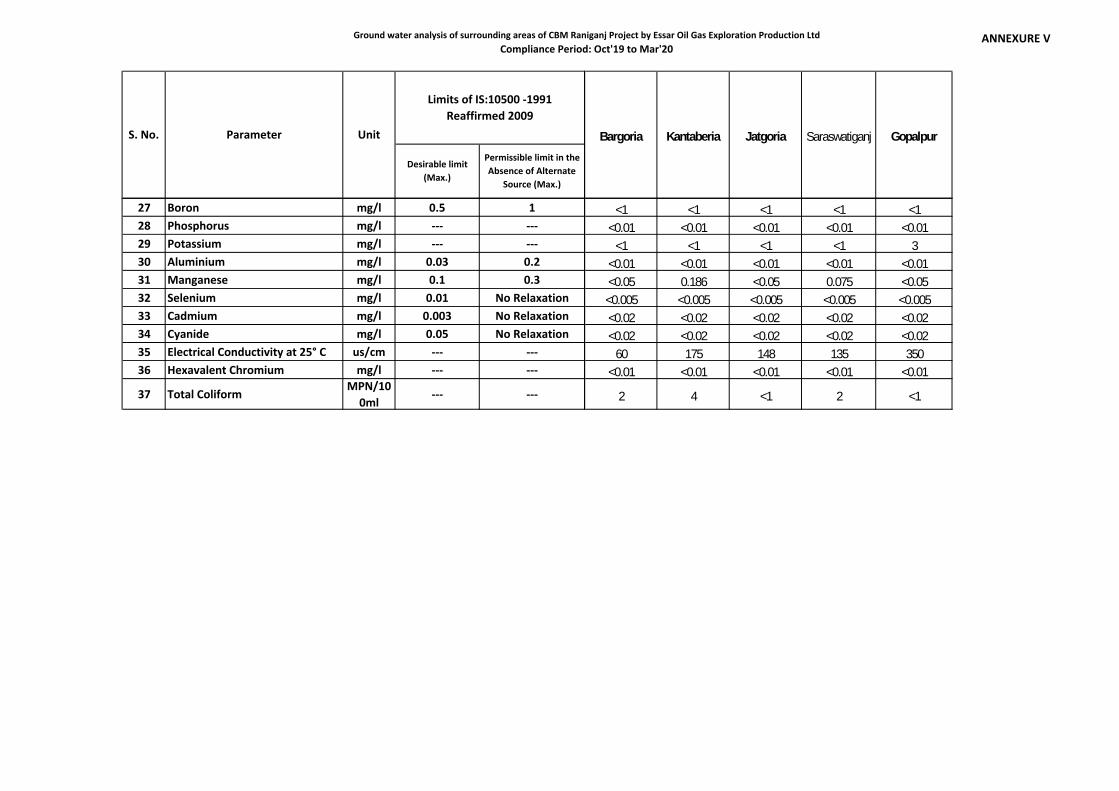
Ground water analysis of surrounding areas of CBM Raniganj Project by Essar Oil Gas Exploration Production LtdCompliance Period: Oct'19 to Mar'20
ANNEXURE V
Desirable limit(Max.)
Permissible limit in theAbsence of Alternate
Source (Max.)
S. No. Parameter Unit
Limits of IS:10500 -1991Reaffirmed 2009
27 Boron mg/l 0.5 128 Phosphorus mg/l --- ---29 Potassium mg/l --- ---30 Aluminium mg/l 0.03 0.231 Manganese mg/l 0.1 0.332 Selenium mg/l 0.01 No Relaxation33 Cadmium mg/l 0.003 No Relaxation34 Cyanide mg/l 0.05 No Relaxation35 Electrical Conductivity at 25° C us/cm --- ---36 Hexavalent Chromium mg/l --- ---
37 Total ColiformMPN/10
0ml--- ---
Bargoria Kantaberia Jatgoria Saraswatiganj Gopalpur
<1 <1 <1 <1 <1<0.01 <0.01 <0.01 <0.01 <0.01
<1 <1 <1 <1 3<0.01 <0.01 <0.01 <0.01 <0.01<0.05 0.186 <0.05 0.075 <0.05<0.005 <0.005 <0.005 <0.005 <0.005<0.02 <0.02 <0.02 <0.02 <0.02<0.02 <0.02 <0.02 <0.02 <0.02
60 175 148 135 350<0.01 <0.01 <0.01 <0.01 <0.01
2 4 <1 2 <1
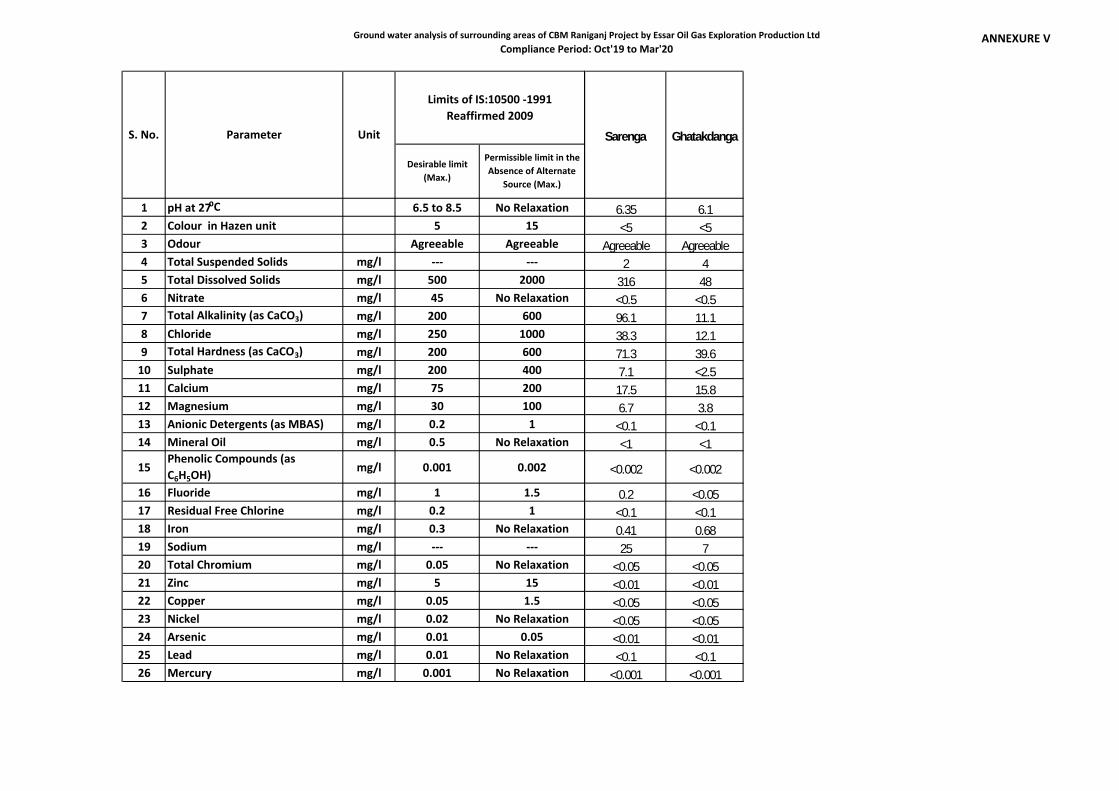
Ground water analysis of surrounding areas of CBM Raniganj Project by Essar Oil Gas Exploration Production LtdCompliance Period: Oct'19 to Mar'20
ANNEXURE V
Desirable limit(Max.)
Permissible limit in theAbsence of Alternate
Source (Max.)
1 pH at 27⁰C 6.5 to 8.5 No Relaxation2 Colour in Hazen unit 5 153 Odour Agreeable Agreeable4 Total Suspended Solids mg/l --- ---5 Total Dissolved Solids mg/l 500 20006 Nitrate mg/l 45 No Relaxation7 Total Alkalinity (as CaCO3) mg/l 200 6008 Chloride mg/l 250 10009 Total Hardness (as CaCO3) mg/l 200 600
10 Sulphate mg/l 200 40011 Calcium mg/l 75 20012 Magnesium mg/l 30 10013 Anionic Detergents (as MBAS) mg/l 0.2 114 Mineral Oil mg/l 0.5 No Relaxation
15Phenolic Compounds (asC6H5OH) mg/l 0.001 0.002
16 Fluoride mg/l 1 1.517 Residual Free Chlorine mg/l 0.2 118 Iron mg/l 0.3 No Relaxation19 Sodium mg/l --- ---20 Total Chromium mg/l 0.05 No Relaxation21 Zinc mg/l 5 1522 Copper mg/l 0.05 1.523 Nickel mg/l 0.02 No Relaxation24 Arsenic mg/l 0.01 0.0525 Lead mg/l 0.01 No Relaxation26 Mercury mg/l 0.001 No Relaxation
S. No. Parameter Unit
Limits of IS:10500 -1991Reaffirmed 2009
6.35 6.1<5 <5
Agreeable Agreeable2 4
316 48<0.5 <0.596.1 11.138.3 12.171.3 39.67.1 <2.517.5 15.86.7 3.8<0.1 <0.1<1 <1
<0.002 <0.002
0.2 <0.05<0.1 <0.10.41 0.6825 7
<0.05 <0.05<0.01 <0.01<0.05 <0.05<0.05 <0.05<0.01 <0.01<0.1 <0.1
<0.001 <0.001
Sarenga Ghatakdanga
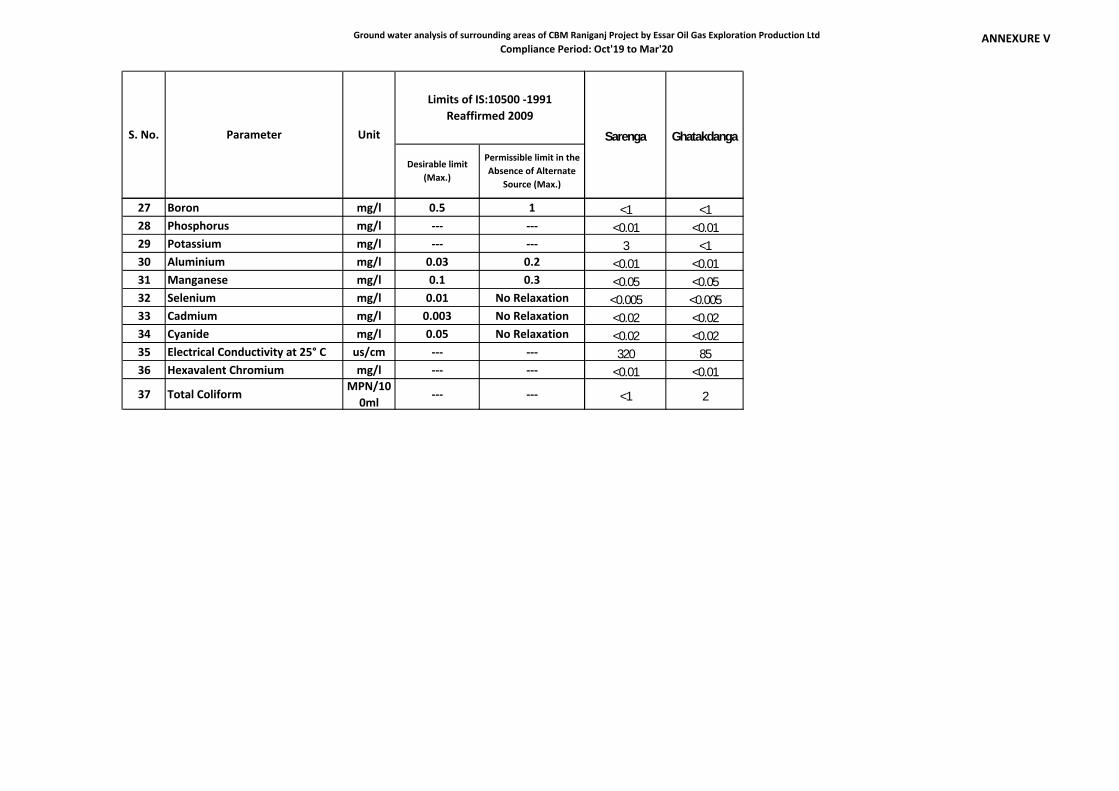
Ground water analysis of surrounding areas of CBM Raniganj Project by Essar Oil Gas Exploration Production LtdCompliance Period: Oct'19 to Mar'20
ANNEXURE V
Desirable limit(Max.)
Permissible limit in theAbsence of Alternate
Source (Max.)
S. No. Parameter Unit
Limits of IS:10500 -1991Reaffirmed 2009
27 Boron mg/l 0.5 128 Phosphorus mg/l --- ---29 Potassium mg/l --- ---30 Aluminium mg/l 0.03 0.231 Manganese mg/l 0.1 0.332 Selenium mg/l 0.01 No Relaxation33 Cadmium mg/l 0.003 No Relaxation34 Cyanide mg/l 0.05 No Relaxation35 Electrical Conductivity at 25° C us/cm --- ---36 Hexavalent Chromium mg/l --- ---
37 Total ColiformMPN/10
0ml--- ---
Sarenga Ghatakdanga
<1 <1<0.01 <0.01
3 <1<0.01 <0.01<0.05 <0.05<0.005 <0.005<0.02 <0.02<0.02 <0.02320 85
<0.01 <0.01
<1 2
ANNEXURE VI: Land Subsidence Study Report
(Compliance Period: July’ 19)
Subsidence Monitoring at ESSAR Raniganj CBM Block at Durgapur [RG (E) –CBM-2001/1 Block] Page1
FOURTH (FINAL) PHASE
REPORT
ON
Land Subsidence Study at ESSAR Raniganj CBM Block at Durgapur
[RG (E) –CBM-2001/1 Block]
FOR
ESSAR OIL LTD. (E&P DIVISION)
PREPARED BY
DEPARTMENT OF EARTH AND ENVIRONMENTAL STUDIES
NATIONAL INSTITUTE OF TECHNOLOGY
DURGAPUR- 713209
Dr. Kalyan Adhikari Dr. Supriya Pal
Dept. of EES Dept. of CE
Principal Investigator Investigator
OCTOBER 2019
Subsidence Monitoring at ESSAR Raniganj CBM Block at Durgapur [RG (E) –CBM-2001/1 Block] Page2
Table of Contents
1.Introduction: ....................................................................................................................................................... 5
2. Location and Accessibility: ............................................................................................................................. 6
3.Development of subsidence ............................................................................................................................ 6
4.Impacts of subsidence...................................................................................................................................... 6
5.Instruments: ....................................................................................................................................................... 7
6.Procedure: .......................................................................................................................................................... 9
7.Results: ............................................................................................................................................................. 12
8.Conclusion & Recommendation: .................................................................................................................. 17
9. Deliverables: ................................................................................................................................................... 17
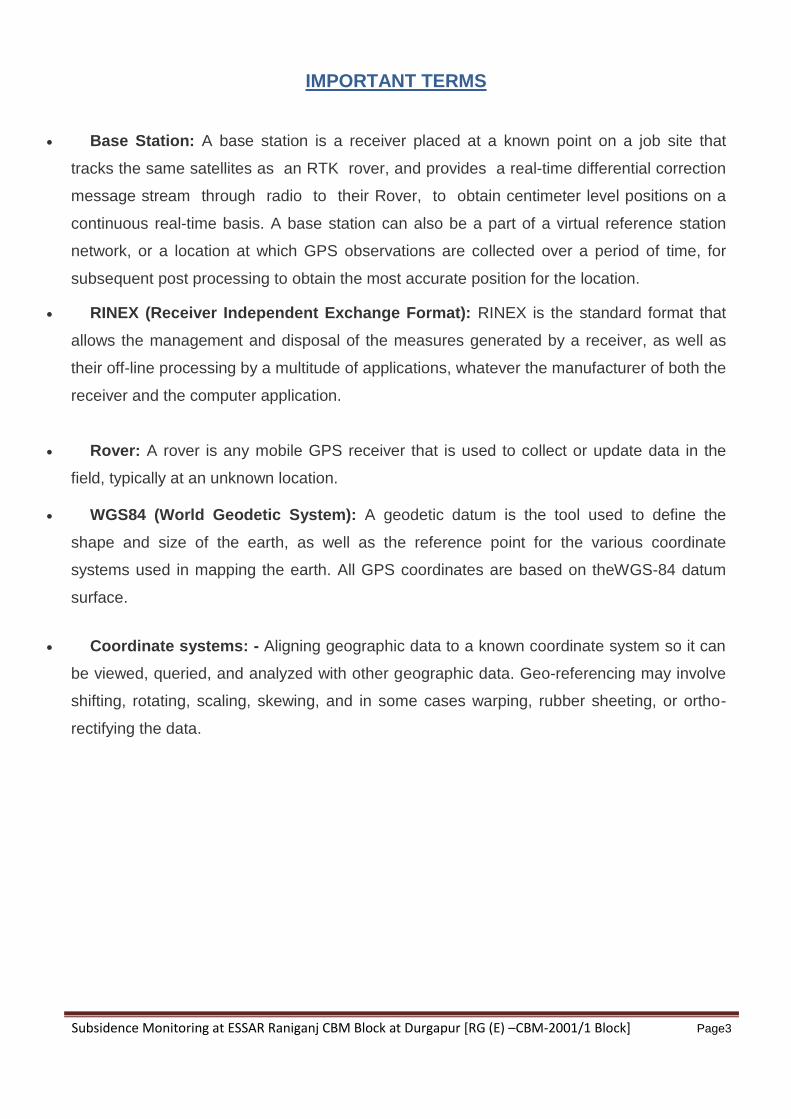
Subsidence Monitoring at ESSAR Raniganj CBM Block at Durgapur [RG (E) –CBM-2001/1 Block] Page3
IMPORTANT TERMS
Base Station: A base station is a receiver placed at a known point on a job site that
tracks the same satellites as an RTK rover, and provides a real-time differential correction
message stream through radio to their Rover, to obtain centimeter level positions on a
continuous real-time basis. A base station can also be a part of a virtual reference station
network, or a location at which GPS observations are collected over a period of time, for
subsequent post processing to obtain the most accurate position for the location.
RINEX (Receiver Independent Exchange Format): RINEX is the standard format that
allows the management and disposal of the measures generated by a receiver, as well as
their off-line processing by a multitude of applications, whatever the manufacturer of both the
receiver and the computer application.
Rover: A rover is any mobile GPS receiver that is used to collect or update data in the
field, typically at an unknown location.
WGS84 (World Geodetic System): A geodetic datum is the tool used to define the
shape and size of the earth, as well as the reference point for the various coordinate
systems used in mapping the earth. All GPS coordinates are based on theWGS-84 datum
surface.
Coordinate systems: - Aligning geographic data to a known coordinate system so it can
be viewed, queried, and analyzed with other geographic data. Geo-referencing may involve
shifting, rotating, scaling, skewing, and in some cases warping, rubber sheeting, or ortho-
rectifying the data.
Subsidence Monitoring at ESSAR Raniganj CBM Block at Durgapur [RG (E) –CBM-2001/1 Block] Page4
ABBREVIATIONS
PCP : Primary control points.
DGPS : Differential Global Positioning System.
RTK : Real Time Kinematic mode.
ETS : Electronic Total station.
RINEX : Receiver Independent Exchange Format
UTM : Universal Transverse Mercator
GIS : Geographical Information System
GCP : Ground Control Point.
Subsidence Monitoring at ESSAR Raniganj CBM Block at Durgapur [RG (E) –CBM-2001/1 Block] Page5
1. Introduction:
Essar Oil Limited (EOL) was awarded block RG (East)-CBM-2001/1 covering an area of
approx. 500 sq km under the CBM-I Round, contract signed on 26th July 2002. EOL holds
100% participating interest in the block. The Petroleum Exploration License (PEL) was issued
by the Government of West Bengal on 29th March 2005.
The Ministry of Environment & Forests (MoEF) granted Environment Clearance for drilling
650 development cum production wells, laying 8 Gas Gathering Stations, 1 Main Compressor
Station and pipeline vide F.No.J-11011/491/2011-IA II(I) dated 26th February, 2013.
It was further suggested by MoEF to get the land subsidence study carried out by an institute
of repute. In view of above, it was requested by ESSAR to Department of Earth and
Environmental Studies, National Institute of Technology (NIT) Durgapur for carrying out land
subsidence study on prefixed control stations (vertical concrete pillars) at RG (E) –CBM-
2001/1 block. Project work order was awarded to the Department of Earth and Environmental
Studies, NIT Durgapur for a period of two years with half yearly frequency subsidence
monitoring to all established monitoring stations. Accordingly, a visit was made by the
Investigators for reconnaissance study of the site in the month of June 2016. During the
study, it was observed that few controlling stations are in damaged conditions. However, first,
second and third phase monitoring work was executed in the mid of June, 2016, mid of
January 2017 and first week of February, 2019. Fourth phase monitoring work was executed
in the last week of July, 2019.
A brief report was prepared based on the data obtained from the site.
This report mainly consists of the following
A brief description of the Essar CBM Block, RG (East)-CBM-2001/1
Details of locations of monitoring stations over the surface of the CBM block, RG
(East)-CBM-2001/1
Methodology adopted for subsidence study through DGPS observation.
Plot of ground elevation of the control stations.
Subsidence Monitoring at ESSAR Raniganj CBM Block at Durgapur [RG (E) –CBM-2001/1 Block] Page6
2. Location and Accessibility:
Block: RG (East)-CBM-2001/1 covers an area of 500 sq.km. (Approximately) and is located
in the eastern-most part of the Raniganj Coalfield. It falls largely in Bardhaman district (90%),
West Bengal. The block is bounded by Latitude 23021’45” and 23041’12” N and Longitude:
87014’40” and 87028’46” E. It lies in the Survey of India Topographical Sheet Nos. 73 M/2,
M/3, M/6 & M/7 (1:50,000).
3. Development of subsidence
Coal seam gas production often involves the extraction of groundwater to facilitate
depressurization of the target coal seam. The disposal or reuse of this collected water is an
area of great public interest, as depressurization results in compaction of the ground and
leads to settlement of the ground surface (surface subsidence). The reduction in pore
pressure eventually promotes compaction of the geological units due to superincumbent
load. In addition, the liberation of gas from coal seams results in compaction of the coal.
Subsidence at the ground surface is some component of the total compaction occurring
within (potentially) multiple geological units. It is dependent on the magnitude and direction of
compression (which is dictated by pressure changes from groundwater withdrawal and
desorption of gas from coal seams), the depth and depth-interval over which compression
occurs, and the geotechnical properties of the geological units throughout the depth profile.
1. Impacts of subsidence
Land subsidence may affect a variety of assets, including infrastructure (such as buildings,
roads, railways, pipelines, dams, water channels, levees and electrical infrastructure) and
environmental assets (such as aquifers, groundwater dependent ecosystems, streams, lakes,
springs, and other surface water resources). Impacts of subsidence on infrastructure could
include structural damage to buildings, buried pipes and sewers, and reduction in stability of
buildings and electrical transmission lines and towers/poles. The serviceability of roads and
railways may be affected by distortion of the road surface and rail foundation. Depressions in
the ground surface due to subsidence may increase exposure to flooding, overflowing levees
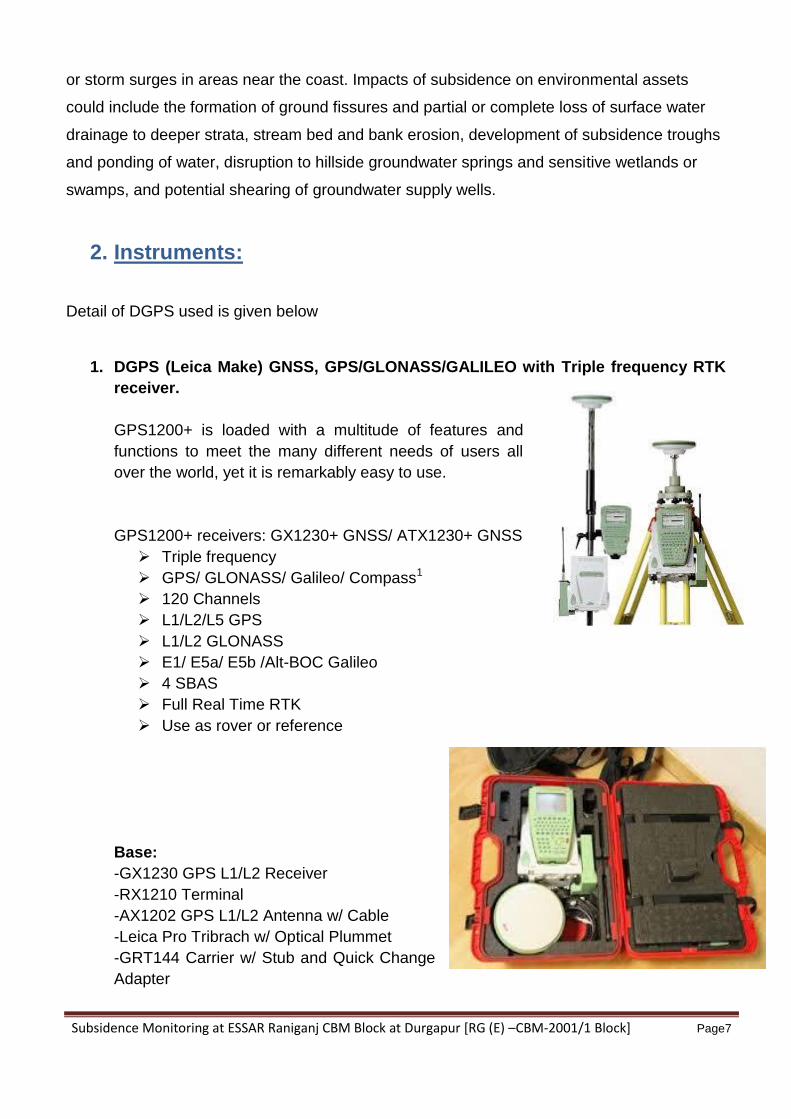
Subsidence Monitoring at ESSAR Raniganj CBM Block at Durgapur [RG (E) –CBM-2001/1 Block] Page7
or storm surges in areas near the coast. Impacts of subsidence on environmental assets
could include the formation of ground fissures and partial or complete loss of surface water
drainage to deeper strata, stream bed and bank erosion, development of subsidence troughs
and ponding of water, disruption to hillside groundwater springs and sensitive wetlands or
swamps, and potential shearing of groundwater supply wells.
2. Instruments:
Detail of DGPS used is given below
1. DGPS (Leica Make) GNSS, GPS/GLONASS/GALILEO with Triple frequency RTK
receiver.
GPS1200+ is loaded with a multitude of features and
functions to meet the many different needs of users all
over the world, yet it is remarkably easy to use.
GPS1200+ receivers: GX1230+ GNSS/ ATX1230+ GNSS
Triple frequency
GPS/ GLONASS/ Galileo/ Compass1
120 Channels
L1/L2/L5 GPS
L1/L2 GLONASS
E1/ E5a/ E5b /Alt-BOC Galileo
4 SBAS
Full Real Time RTK
Use as rover or reference
Base:
-GX1230 GPS L1/L2 Receiver
-RX1210 Terminal
-AX1202 GPS L1/L2 Antenna w/ Cable
-Leica Pro Tribrach w/ Optical Plummet
-GRT144 Carrier w/ Stub and Quick Change
Adapter
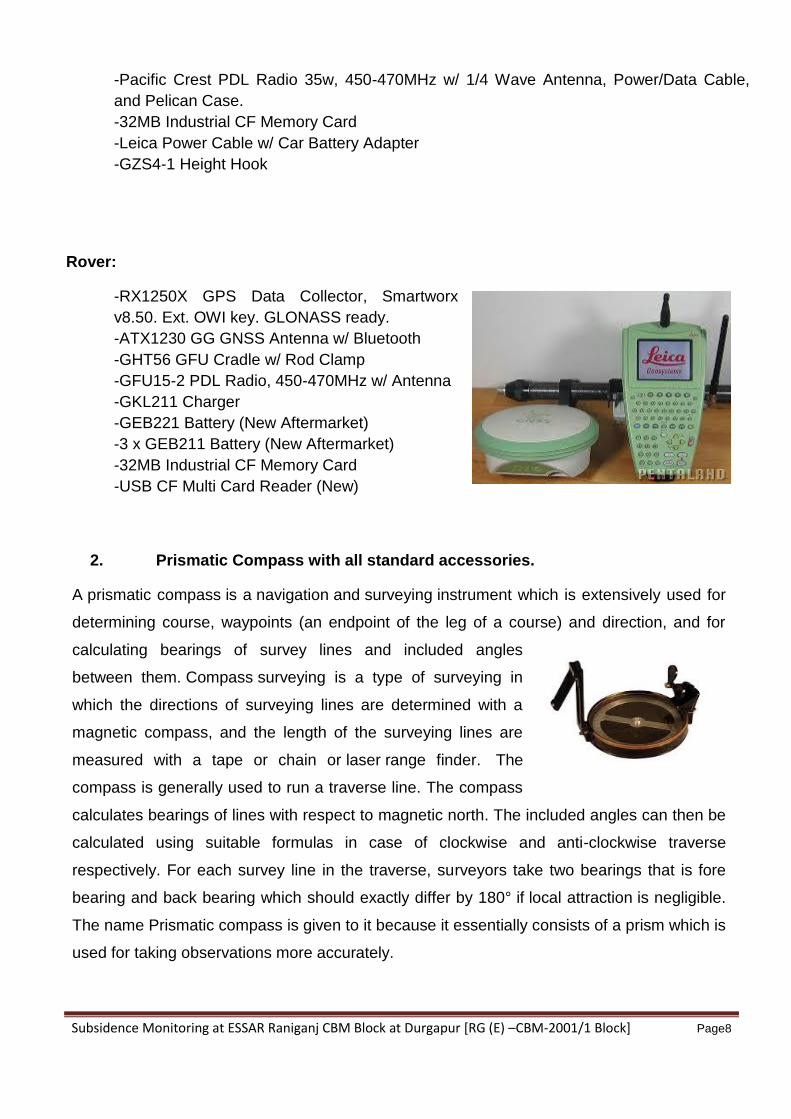
Subsidence Monitoring at ESSAR Raniganj CBM Block at Durgapur [RG (E) –CBM-2001/1 Block] Page8
-Pacific Crest PDL Radio 35w, 450-470MHz w/ 1/4 Wave Antenna, Power/Data Cable,
and Pelican Case.
-32MB Industrial CF Memory Card
-Leica Power Cable w/ Car Battery Adapter
-GZS4-1 Height Hook
Rover:
-RX1250X GPS Data Collector, Smartworx
v8.50. Ext. OWI key. GLONASS ready.
-ATX1230 GG GNSS Antenna w/ Bluetooth
-GHT56 GFU Cradle w/ Rod Clamp
-GFU15-2 PDL Radio, 450-470MHz w/ Antenna
-GKL211 Charger
-GEB221 Battery (New Aftermarket)
-3 x GEB211 Battery (New Aftermarket)
-32MB Industrial CF Memory Card
-USB CF Multi Card Reader (New)
2. Prismatic Compass with all standard accessories.
A prismatic compass is a navigation and surveying instrument which is extensively used for
determining course, waypoints (an endpoint of the leg of a course) and direction, and for
calculating bearings of survey lines and included angles
between them. Compass surveying is a type of surveying in
which the directions of surveying lines are determined with a
magnetic compass, and the length of the surveying lines are
measured with a tape or chain or laser range finder. The
compass is generally used to run a traverse line. The compass
calculates bearings of lines with respect to magnetic north. The included angles can then be
calculated using suitable formulas in case of clockwise and anti-clockwise traverse
respectively. For each survey line in the traverse, surveyors take two bearings that is fore
bearing and back bearing which should exactly differ by 180° if local attraction is negligible.
The name Prismatic compass is given to it because it essentially consists of a prism which is
used for taking observations more accurately.
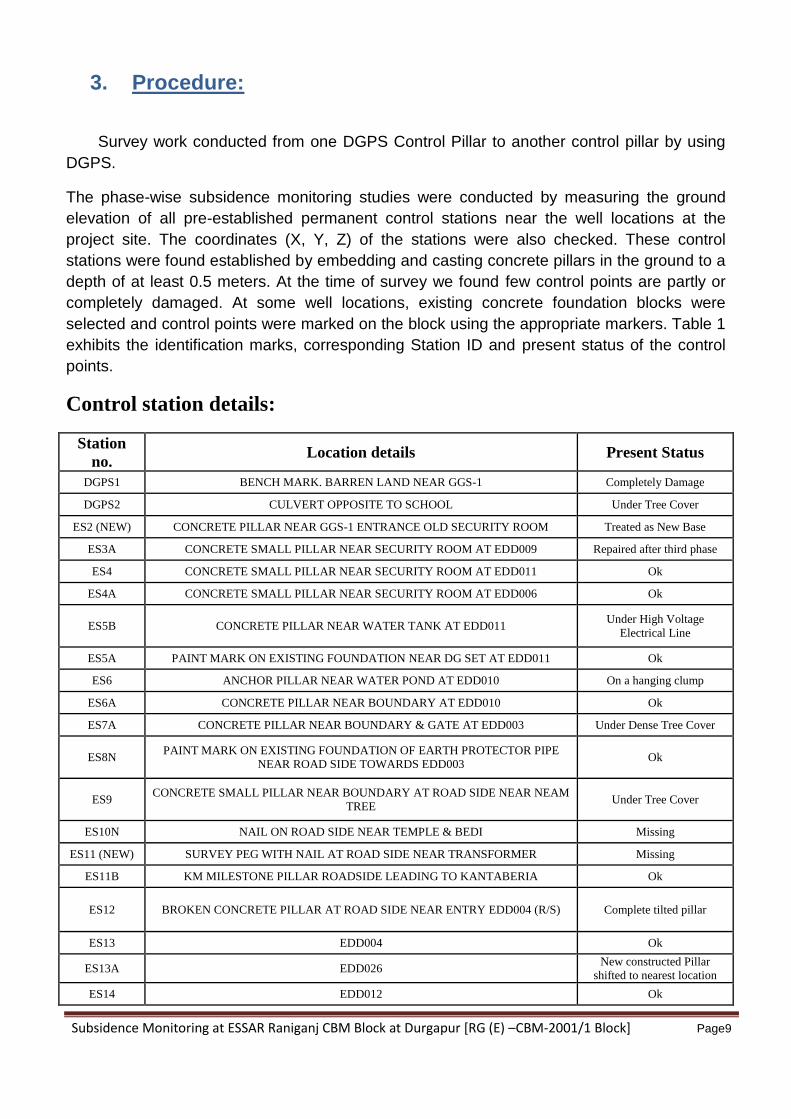
Subsidence Monitoring at ESSAR Raniganj CBM Block at Durgapur [RG (E) –CBM-2001/1 Block] Page9
3. Procedure:
Survey work conducted from one DGPS Control Pillar to another control pillar by using
DGPS.
The phase-wise subsidence monitoring studies were conducted by measuring the ground
elevation of all pre-established permanent control stations near the well locations at the
project site. The coordinates (X, Y, Z) of the stations were also checked. These control
stations were found established by embedding and casting concrete pillars in the ground to a
depth of at least 0.5 meters. At the time of survey we found few control points are partly or
completely damaged. At some well locations, existing concrete foundation blocks were
selected and control points were marked on the block using the appropriate markers. Table 1
exhibits the identification marks, corresponding Station ID and present status of the control
points.
Control station details:
Station
no. Location details Present Status
DGPS1 BENCH MARK. BARREN LAND NEAR GGS-1 Completely Damage
DGPS2 CULVERT OPPOSITE TO SCHOOL Under Tree Cover
ES2 (NEW) CONCRETE PILLAR NEAR GGS-1 ENTRANCE OLD SECURITY ROOM Treated as New Base
ES3A CONCRETE SMALL PILLAR NEAR SECURITY ROOM AT EDD009 Repaired after third phase
ES4 CONCRETE SMALL PILLAR NEAR SECURITY ROOM AT EDD011 Ok
ES4A CONCRETE SMALL PILLAR NEAR SECURITY ROOM AT EDD006 Ok
ES5B CONCRETE PILLAR NEAR WATER TANK AT EDD011 Under High Voltage
Electrical Line
ES5A PAINT MARK ON EXISTING FOUNDATION NEAR DG SET AT EDD011 Ok
ES6 ANCHOR PILLAR NEAR WATER POND AT EDD010 On a hanging clump
ES6A CONCRETE PILLAR NEAR BOUNDARY AT EDD010 Ok
ES7A CONCRETE PILLAR NEAR BOUNDARY & GATE AT EDD003 Under Dense Tree Cover
ES8N PAINT MARK ON EXISTING FOUNDATION OF EARTH PROTECTOR PIPE
NEAR ROAD SIDE TOWARDS EDD003 Ok
ES9 CONCRETE SMALL PILLAR NEAR BOUNDARY AT ROAD SIDE NEAR NEAM
TREE Under Tree Cover
ES10N NAIL ON ROAD SIDE NEAR TEMPLE & BEDI Missing
ES11 (NEW) SURVEY PEG WITH NAIL AT ROAD SIDE NEAR TRANSFORMER Missing
ES11B KM MILESTONE PILLAR ROADSIDE LEADING TO KANTABERIA Ok
ES12 BROKEN CONCRETE PILLAR AT ROAD SIDE NEAR ENTRY EDD004 (R/S) Complete tilted pillar
ES13 EDD004 Ok
ES13A EDD026 New constructed Pillar
shifted to nearest location
ES14 EDD012 Ok
Subsidence Monitoring at ESSAR Raniganj CBM Block at Durgapur [RG (E) –CBM-2001/1 Block] Page10
Station
no. Location details Present Status
ES15 ROAD SIDE CULVERT Almost Damaged
ES15A(NEW) KM MILESTONE PILLAR ROADSIDE KANTABERIA CHOWK Cancelled
ES15B ROAD SIDE RIGHT HAND CULVERT AFTER KANTABERIA CHOWK Almost Damaged
ES15C ROAD SIDE KM MILE STONE AFTER KANTABERIA CHOWK Under Tree Cover
ES18N NEAR BOUNDARY WALL OF PLAYGROUND AFTER KANTABERIA CHOWK Ok
ES19 EDD008 Ok
ES19A PAINT MARK ON FOUNDATION OF PIPE LINE SIGN BOARD RIGHT SIDE
ROAD AFTER EDD008 Almost Not Visible
ES19B PAINT MARK ON FOUNDATION OF EARTH PROTECTOR RIGHT SIDE ROAD
AFTER EDD008 Almost Not Visible
ES19C PAINT MARK ON KM MILE STONE RIGHT SIDE ROAD AFTER EDD008 Ok
ES20 EDD005 Ok
ES22N IN FRONT OF EDD013 ON HIGH MOUND GROUND NEAR TEMPORARY
SHED Ok
ES22A LEFT SIDE CULVERT NEAR WATER SETLING POND AFTER EDD013 Ok
ES23 EDD002 Ok
ES23A CONCRETE PILLAR LEFT SIDE OF ROAD AFTER EDD002, BARREN LAND Ok
ES24A EDD018 Ok
ES24B EDD025 New constructed pillar
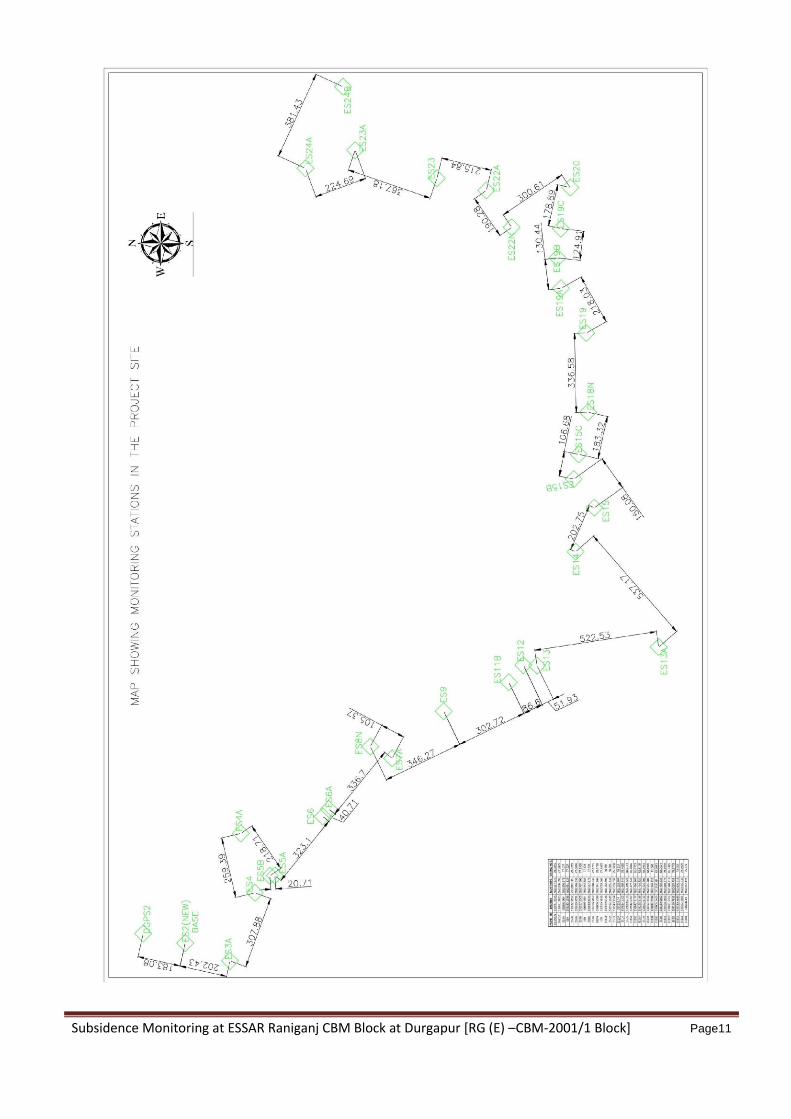
Subsidence Monitoring at ESSAR Raniganj CBM Block at Durgapur [RG (E) –CBM-2001/1 Block] Page11
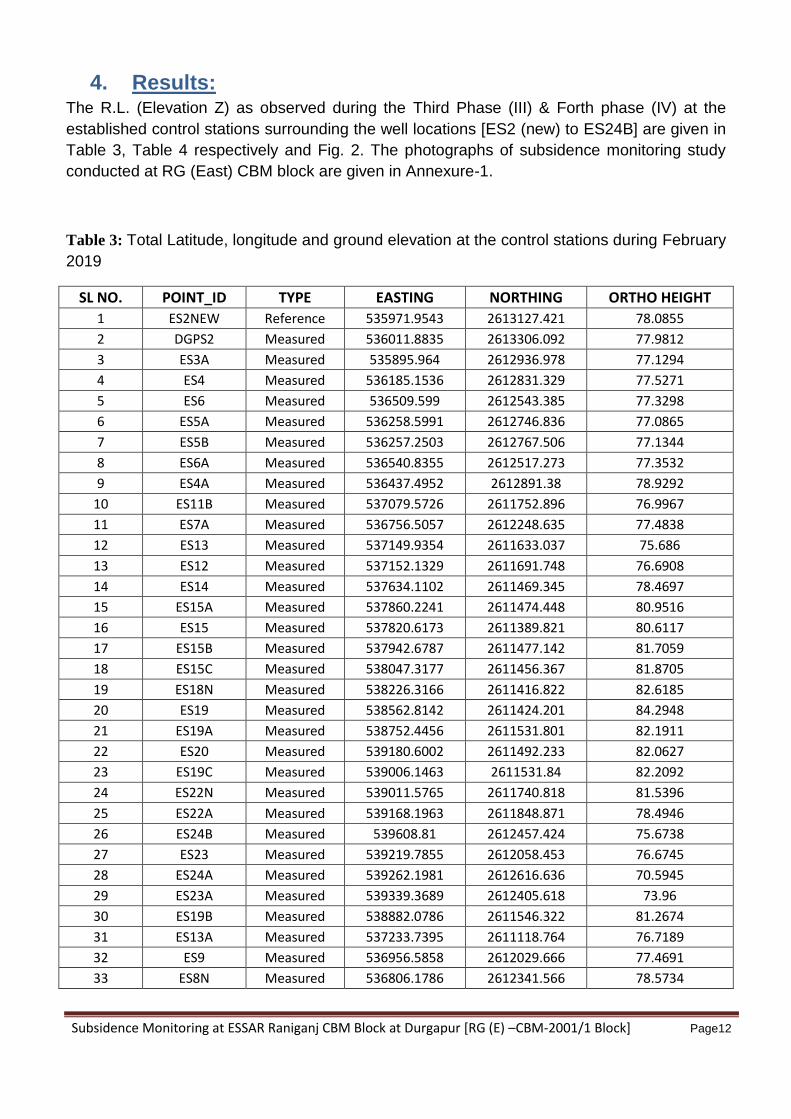
Subsidence Monitoring at ESSAR Raniganj CBM Block at Durgapur [RG (E) –CBM-2001/1 Block] Page12
4. Results: The R.L. (Elevation Z) as observed during the Third Phase (III) & Forth phase (IV) at the
established control stations surrounding the well locations [ES2 (new) to ES24B] are given in
Table 3, Table 4 respectively and Fig. 2. The photographs of subsidence monitoring study
conducted at RG (East) CBM block are given in Annexure-1.
Table 3: Total Latitude, longitude and ground elevation at the control stations during February
2019
SL NO. POINT_ID TYPE EASTING NORTHING ORTHO HEIGHT
1 ES2NEW Reference 535971.9543 2613127.421 78.0855
2 DGPS2 Measured 536011.8835 2613306.092 77.9812
3 ES3A Measured 535895.964 2612936.978 77.1294
4 ES4 Measured 536185.1536 2612831.329 77.5271
5 ES6 Measured 536509.599 2612543.385 77.3298
6 ES5A Measured 536258.5991 2612746.836 77.0865
7 ES5B Measured 536257.2503 2612767.506 77.1344
8 ES6A Measured 536540.8355 2612517.273 77.3532
9 ES4A Measured 536437.4952 2612891.38 78.9292
10 ES11B Measured 537079.5726 2611752.896 76.9967
11 ES7A Measured 536756.5057 2612248.635 77.4838
12 ES13 Measured 537149.9354 2611633.037 75.686
13 ES12 Measured 537152.1329 2611691.748 76.6908
14 ES14 Measured 537634.1102 2611469.345 78.4697
15 ES15A Measured 537860.2241 2611474.448 80.9516
16 ES15 Measured 537820.6173 2611389.821 80.6117
17 ES15B Measured 537942.6787 2611477.142 81.7059
18 ES15C Measured 538047.3177 2611456.367 81.8705
19 ES18N Measured 538226.3166 2611416.822 82.6185
20 ES19 Measured 538562.8142 2611424.201 84.2948
21 ES19A Measured 538752.4456 2611531.801 82.1911
22 ES20 Measured 539180.6002 2611492.233 82.0627
23 ES19C Measured 539006.1463 2611531.84 82.2092
24 ES22N Measured 539011.5765 2611740.818 81.5396
25 ES22A Measured 539168.1963 2611848.871 78.4946
26 ES24B Measured 539608.81 2612457.424 75.6738
27 ES23 Measured 539219.7855 2612058.453 76.6745
28 ES24A Measured 539262.1981 2612616.636 70.5945
29 ES23A Measured 539339.3689 2612405.618 73.96
30 ES19B Measured 538882.0786 2611546.322 81.2674
31 ES13A Measured 537233.7395 2611118.764 76.7189
32 ES9 Measured 536956.5858 2612029.666 77.4691
33 ES8N Measured 536806.1786 2612341.566 78.5734
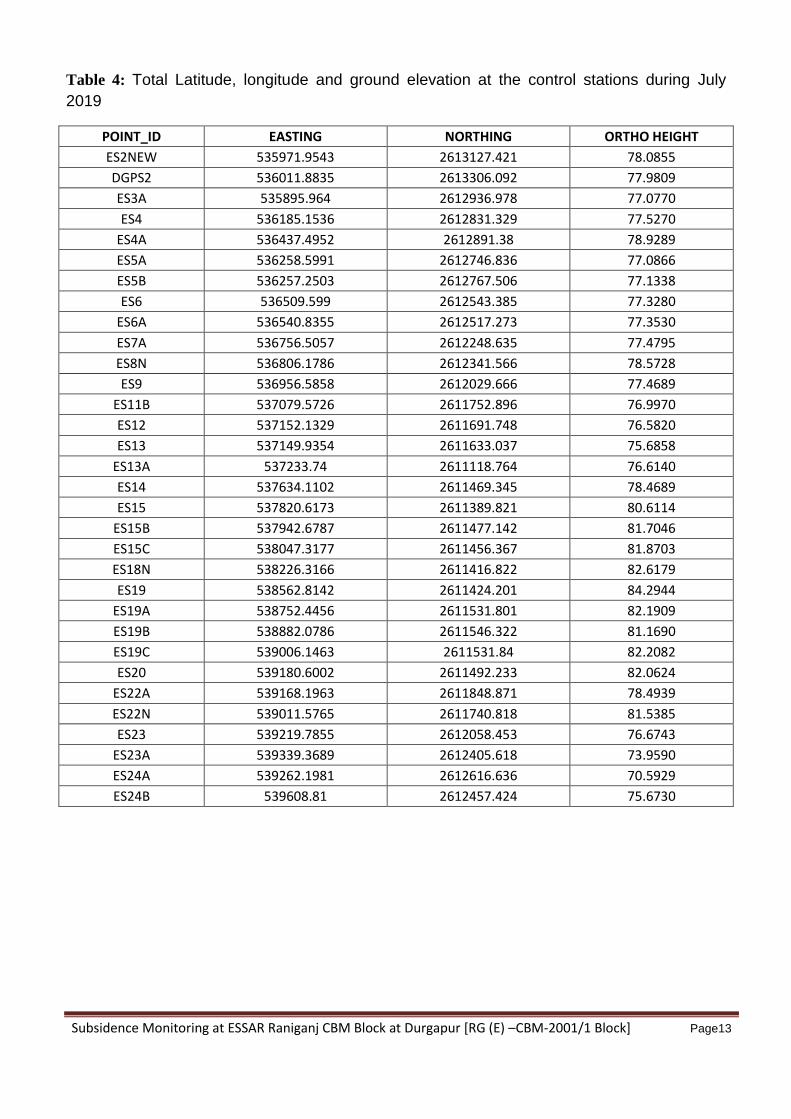
Subsidence Monitoring at ESSAR Raniganj CBM Block at Durgapur [RG (E) –CBM-2001/1 Block] Page13
Table 4: Total Latitude, longitude and ground elevation at the control stations during July
2019
POINT_ID EASTING NORTHING ORTHO HEIGHT
ES2NEW 535971.9543 2613127.421 78.0855
DGPS2 536011.8835 2613306.092 77.9809
ES3A 535895.964 2612936.978 77.0770
ES4 536185.1536 2612831.329 77.5270
ES4A 536437.4952 2612891.38 78.9289
ES5A 536258.5991 2612746.836 77.0866
ES5B 536257.2503 2612767.506 77.1338
ES6 536509.599 2612543.385 77.3280
ES6A 536540.8355 2612517.273 77.3530
ES7A 536756.5057 2612248.635 77.4795
ES8N 536806.1786 2612341.566 78.5728
ES9 536956.5858 2612029.666 77.4689
ES11B 537079.5726 2611752.896 76.9970
ES12 537152.1329 2611691.748 76.5820
ES13 537149.9354 2611633.037 75.6858
ES13A 537233.74 2611118.764 76.6140
ES14 537634.1102 2611469.345 78.4689
ES15 537820.6173 2611389.821 80.6114
ES15B 537942.6787 2611477.142 81.7046
ES15C 538047.3177 2611456.367 81.8703
ES18N 538226.3166 2611416.822 82.6179
ES19 538562.8142 2611424.201 84.2944
ES19A 538752.4456 2611531.801 82.1909
ES19B 538882.0786 2611546.322 81.1690
ES19C 539006.1463 2611531.84 82.2082
ES20 539180.6002 2611492.233 82.0624
ES22A 539168.1963 2611848.871 78.4939
ES22N 539011.5765 2611740.818 81.5385
ES23 539219.7855 2612058.453 76.6743
ES23A 539339.3689 2612405.618 73.9590
ES24A 539262.1981 2612616.636 70.5929
ES24B 539608.81 2612457.424 75.6730
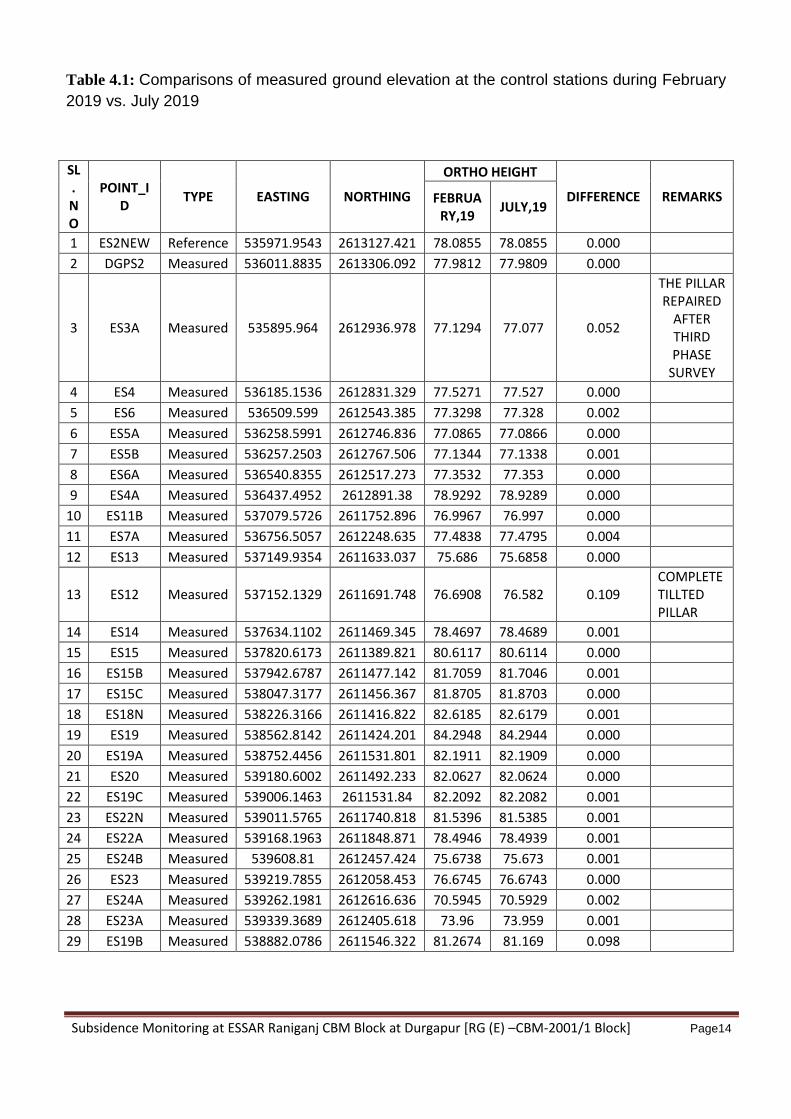
Subsidence Monitoring at ESSAR Raniganj CBM Block at Durgapur [RG (E) –CBM-2001/1 Block] Page14
Table 4.1: Comparisons of measured ground elevation at the control stations during February
2019 vs. July 2019
SL. NO
POINT_ID
TYPE EASTING NORTHING
ORTHO HEIGHT
DIFFERENCE REMARKS FEBRUARY,19
JULY,19
1 ES2NEW Reference 535971.9543 2613127.421 78.0855 78.0855 0.000
2 DGPS2 Measured 536011.8835 2613306.092 77.9812 77.9809 0.000
3 ES3A Measured 535895.964 2612936.978 77.1294 77.077 0.052
THE PILLAR REPAIRED
AFTER THIRD PHASE
SURVEY
4 ES4 Measured 536185.1536 2612831.329 77.5271 77.527 0.000
5 ES6 Measured 536509.599 2612543.385 77.3298 77.328 0.002
6 ES5A Measured 536258.5991 2612746.836 77.0865 77.0866 0.000
7 ES5B Measured 536257.2503 2612767.506 77.1344 77.1338 0.001
8 ES6A Measured 536540.8355 2612517.273 77.3532 77.353 0.000
9 ES4A Measured 536437.4952 2612891.38 78.9292 78.9289 0.000
10 ES11B Measured 537079.5726 2611752.896 76.9967 76.997 0.000
11 ES7A Measured 536756.5057 2612248.635 77.4838 77.4795 0.004
12 ES13 Measured 537149.9354 2611633.037 75.686 75.6858 0.000
13 ES12 Measured 537152.1329 2611691.748 76.6908 76.582 0.109 COMPLETE TILLTED PILLAR
14 ES14 Measured 537634.1102 2611469.345 78.4697 78.4689 0.001
15 ES15 Measured 537820.6173 2611389.821 80.6117 80.6114 0.000
16 ES15B Measured 537942.6787 2611477.142 81.7059 81.7046 0.001
17 ES15C Measured 538047.3177 2611456.367 81.8705 81.8703 0.000
18 ES18N Measured 538226.3166 2611416.822 82.6185 82.6179 0.001
19 ES19 Measured 538562.8142 2611424.201 84.2948 84.2944 0.000
20 ES19A Measured 538752.4456 2611531.801 82.1911 82.1909 0.000
21 ES20 Measured 539180.6002 2611492.233 82.0627 82.0624 0.000
22 ES19C Measured 539006.1463 2611531.84 82.2092 82.2082 0.001
23 ES22N Measured 539011.5765 2611740.818 81.5396 81.5385 0.001
24 ES22A Measured 539168.1963 2611848.871 78.4946 78.4939 0.001
25 ES24B Measured 539608.81 2612457.424 75.6738 75.673 0.001
26 ES23 Measured 539219.7855 2612058.453 76.6745 76.6743 0.000
27 ES24A Measured 539262.1981 2612616.636 70.5945 70.5929 0.002
28 ES23A Measured 539339.3689 2612405.618 73.96 73.959 0.001
29 ES19B Measured 538882.0786 2611546.322 81.2674 81.169 0.098
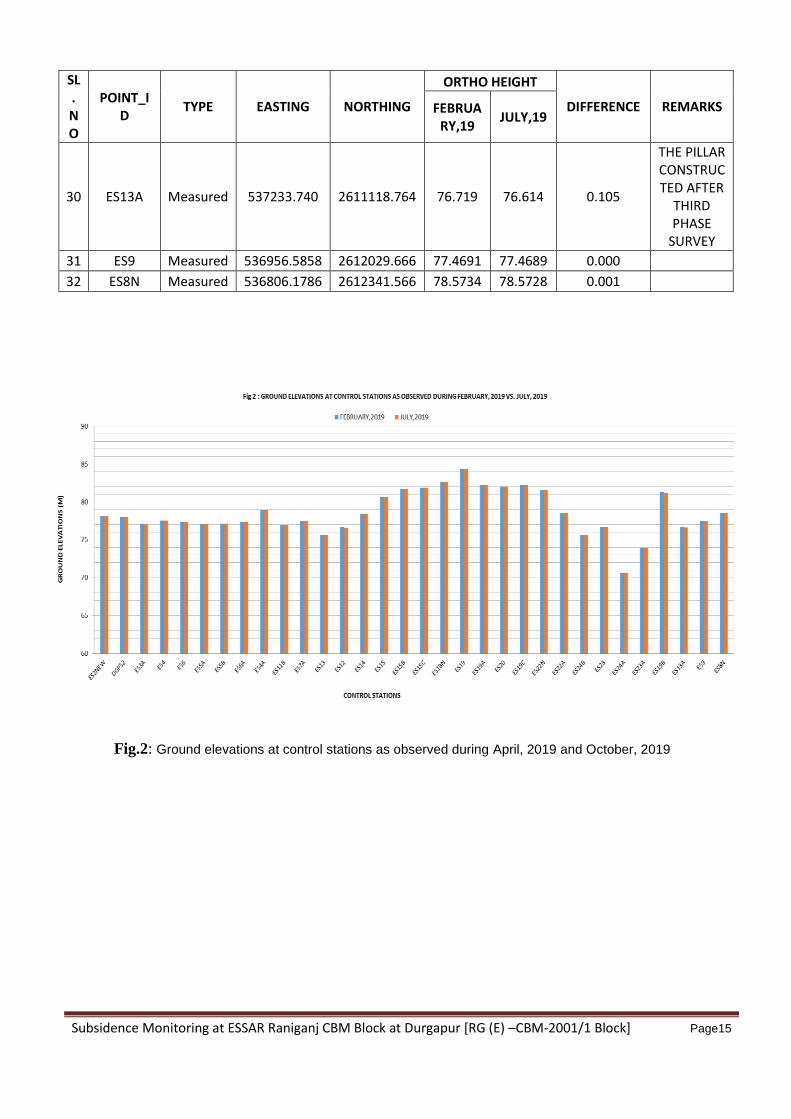
Subsidence Monitoring at ESSAR Raniganj CBM Block at Durgapur [RG (E) –CBM-2001/1 Block] Page15
SL. NO
POINT_ID
TYPE EASTING NORTHING
ORTHO HEIGHT
DIFFERENCE REMARKS FEBRUARY,19
JULY,19
30 ES13A Measured 537233.740 2611118.764 76.719 76.614 0.105
THE PILLAR CONSTRUCTED AFTER
THIRD PHASE
SURVEY
31 ES9 Measured 536956.5858 2612029.666 77.4691 77.4689 0.000
32 ES8N Measured 536806.1786 2612341.566 78.5734 78.5728 0.001
Fig.2: Ground elevations at control stations as observed during April, 2019 and October, 2019
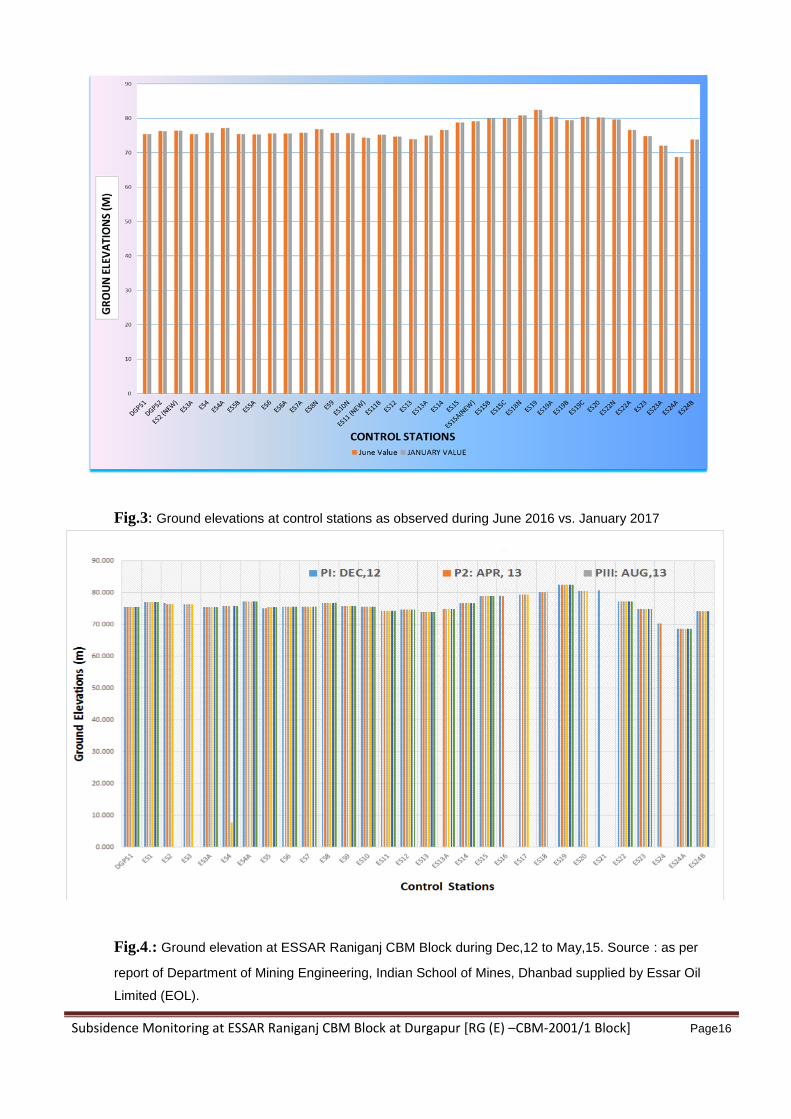
Subsidence Monitoring at ESSAR Raniganj CBM Block at Durgapur [RG (E) –CBM-2001/1 Block] Page16
Fig.3: Ground elevations at control stations as observed during June 2016 vs. January 2017
Fig.4.: Ground elevation at ESSAR Raniganj CBM Block during Dec,12 to May,15. Source : as per
report of Department of Mining Engineering, Indian School of Mines, Dhanbad supplied by Essar Oil
Limited (EOL).
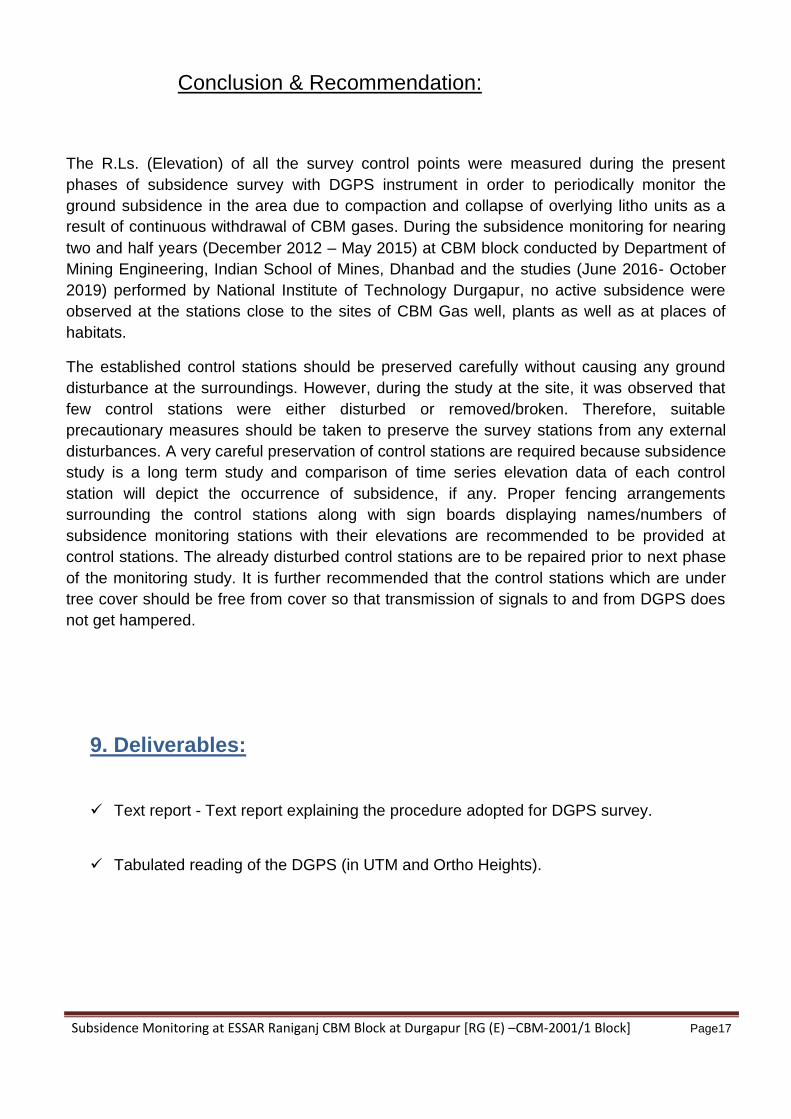
Subsidence Monitoring at ESSAR Raniganj CBM Block at Durgapur [RG (E) –CBM-2001/1 Block] Page17
Conclusion & Recommendation:
The R.Ls. (Elevation) of all the survey control points were measured during the present
phases of subsidence survey with DGPS instrument in order to periodically monitor the
ground subsidence in the area due to compaction and collapse of overlying litho units as a
result of continuous withdrawal of CBM gases. During the subsidence monitoring for nearing
two and half years (December 2012 – May 2015) at CBM block conducted by Department of
Mining Engineering, Indian School of Mines, Dhanbad and the studies (June 2016- October
2019) performed by National Institute of Technology Durgapur, no active subsidence were
observed at the stations close to the sites of CBM Gas well, plants as well as at places of
habitats.
The established control stations should be preserved carefully without causing any ground
disturbance at the surroundings. However, during the study at the site, it was observed that
few control stations were either disturbed or removed/broken. Therefore, suitable
precautionary measures should be taken to preserve the survey stations from any external
disturbances. A very careful preservation of control stations are required because subsidence
study is a long term study and comparison of time series elevation data of each control
station will depict the occurrence of subsidence, if any. Proper fencing arrangements
surrounding the control stations along with sign boards displaying names/numbers of
subsidence monitoring stations with their elevations are recommended to be provided at
control stations. The already disturbed control stations are to be repaired prior to next phase
of the monitoring study. It is further recommended that the control stations which are under
tree cover should be free from cover so that transmission of signals to and from DGPS does
not get hampered.
9. Deliverables:
Text report - Text report explaining the procedure adopted for DGPS survey.
Tabulated reading of the DGPS (in UTM and Ortho Heights).
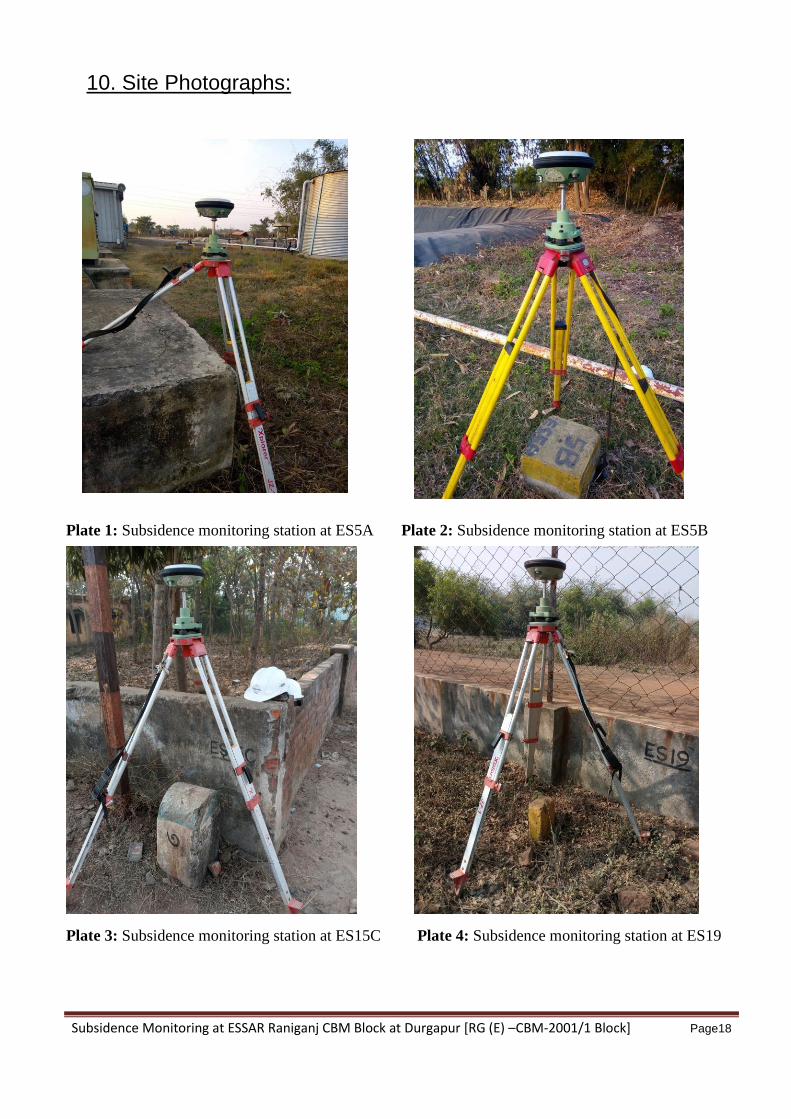
Subsidence Monitoring at ESSAR Raniganj CBM Block at Durgapur [RG (E) –CBM-2001/1 Block] Page18
10. Site Photographs:
Plate 1: Subsidence monitoring station at ES5A Plate 2: Subsidence monitoring station at ES5B
Plate 3: Subsidence monitoring station at ES15C Plate 4: Subsidence monitoring station at ES19
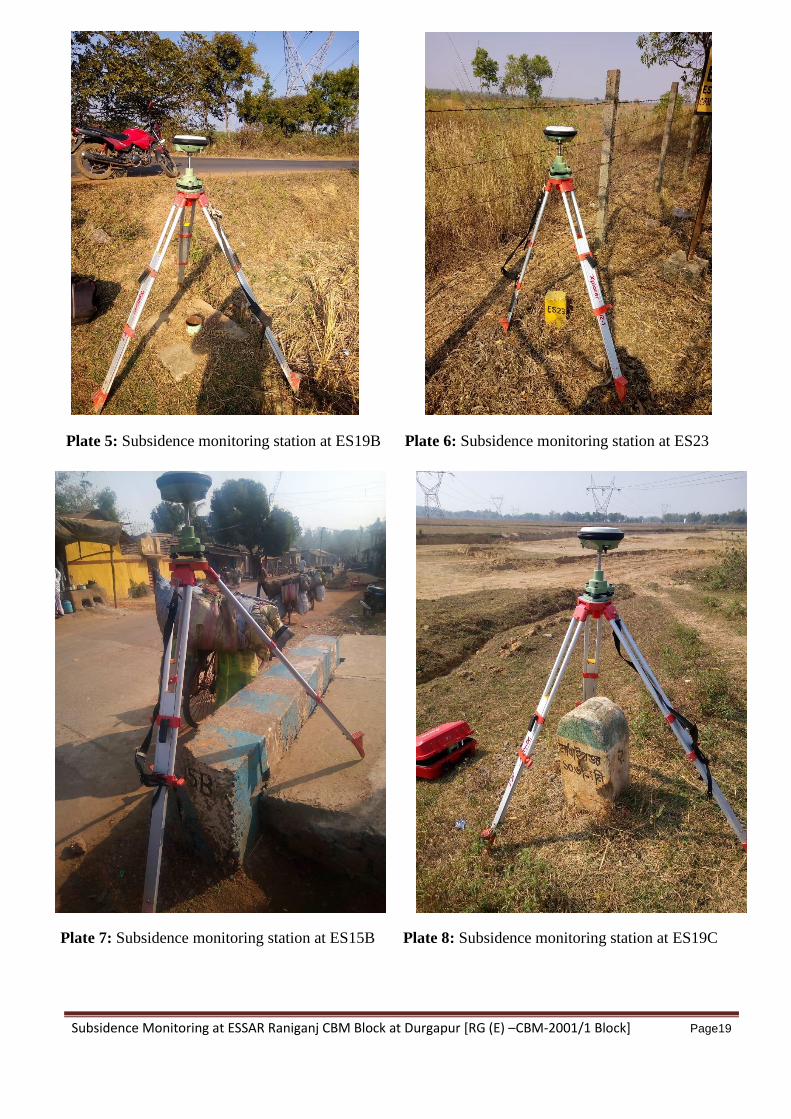
Subsidence Monitoring at ESSAR Raniganj CBM Block at Durgapur [RG (E) –CBM-2001/1 Block] Page19
Plate 5: Subsidence monitoring station at ES19B Plate 6: Subsidence monitoring station at ES23
Plate 7: Subsidence monitoring station at ES15B Plate 8: Subsidence monitoring station at ES19C
ANNEXURE VII: Corporate Environmental Policy
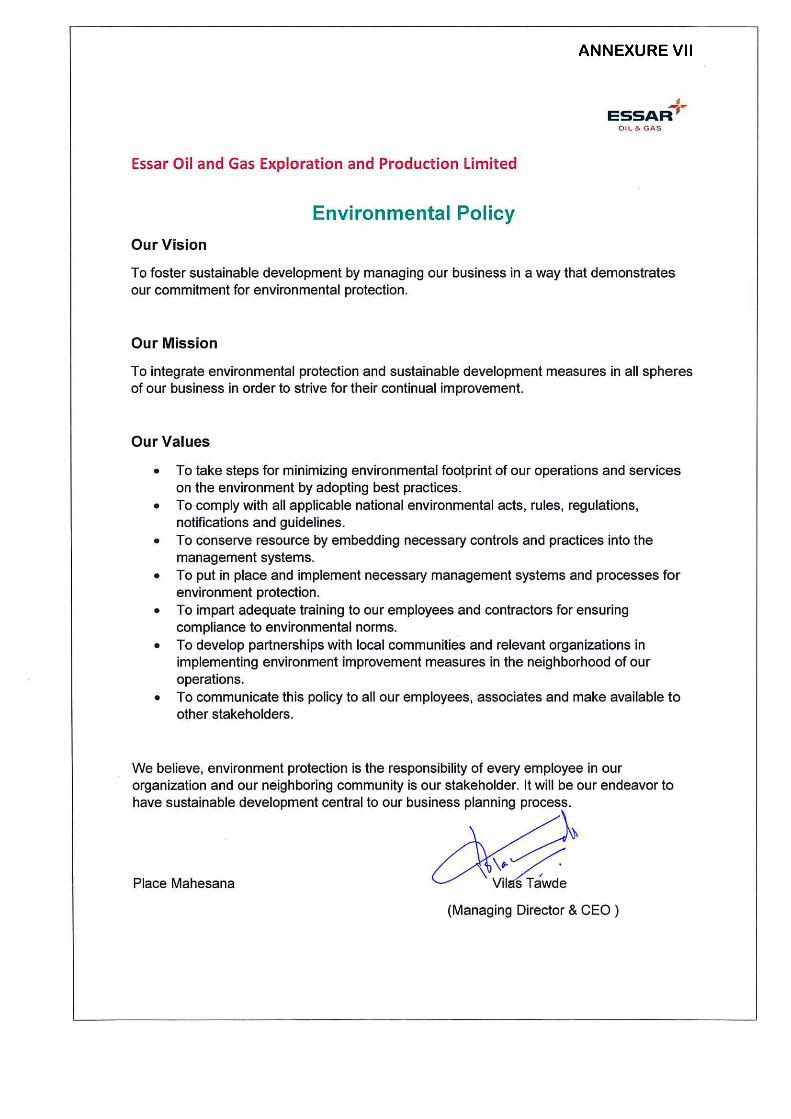
ANNEXURE VIII: Hazardous Waste Authorization and Amendment
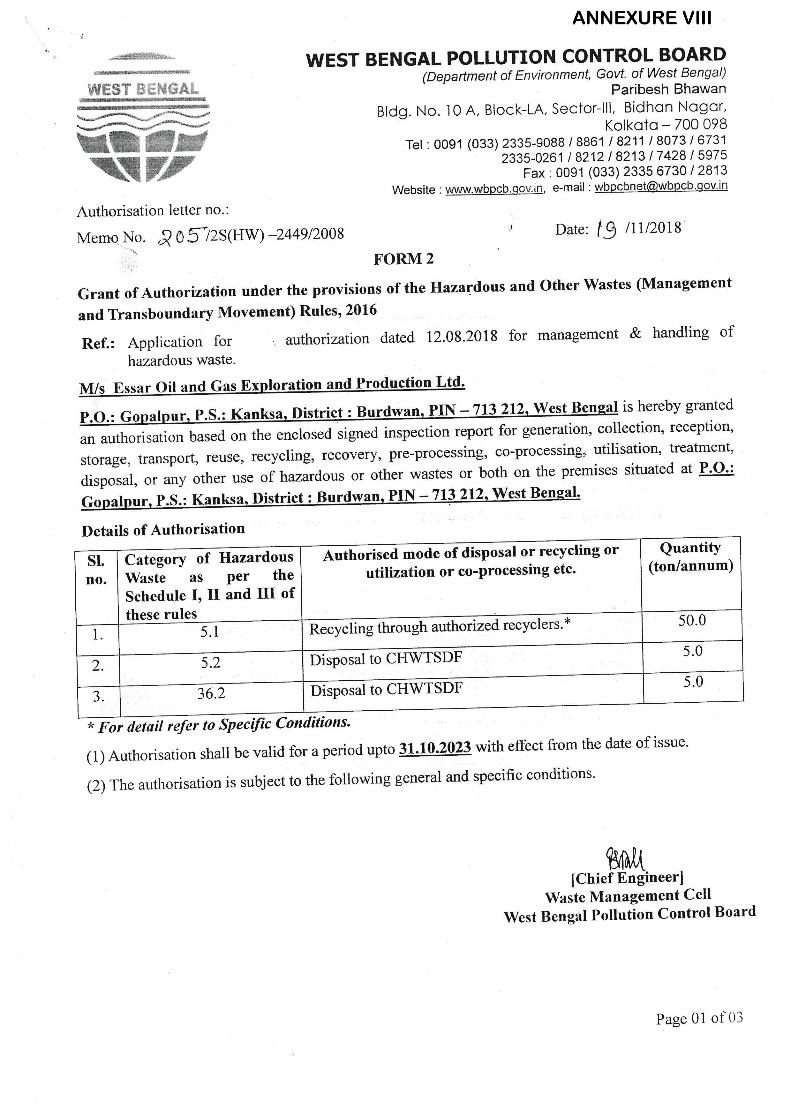
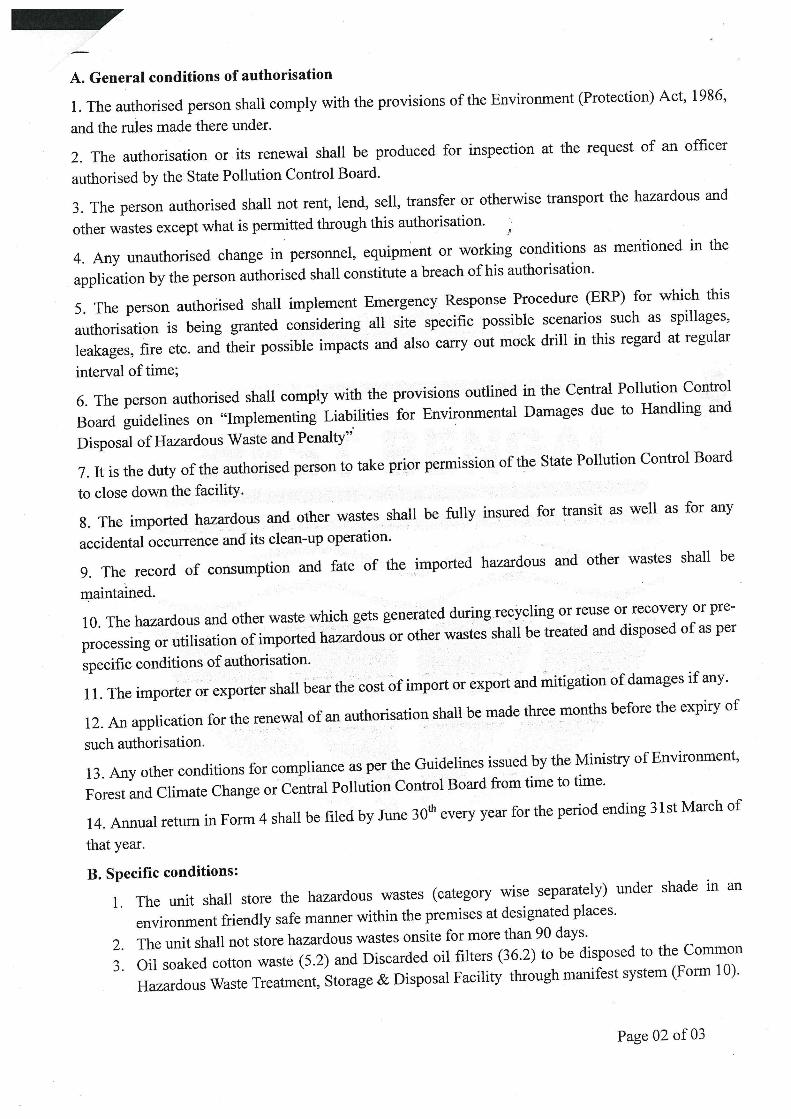
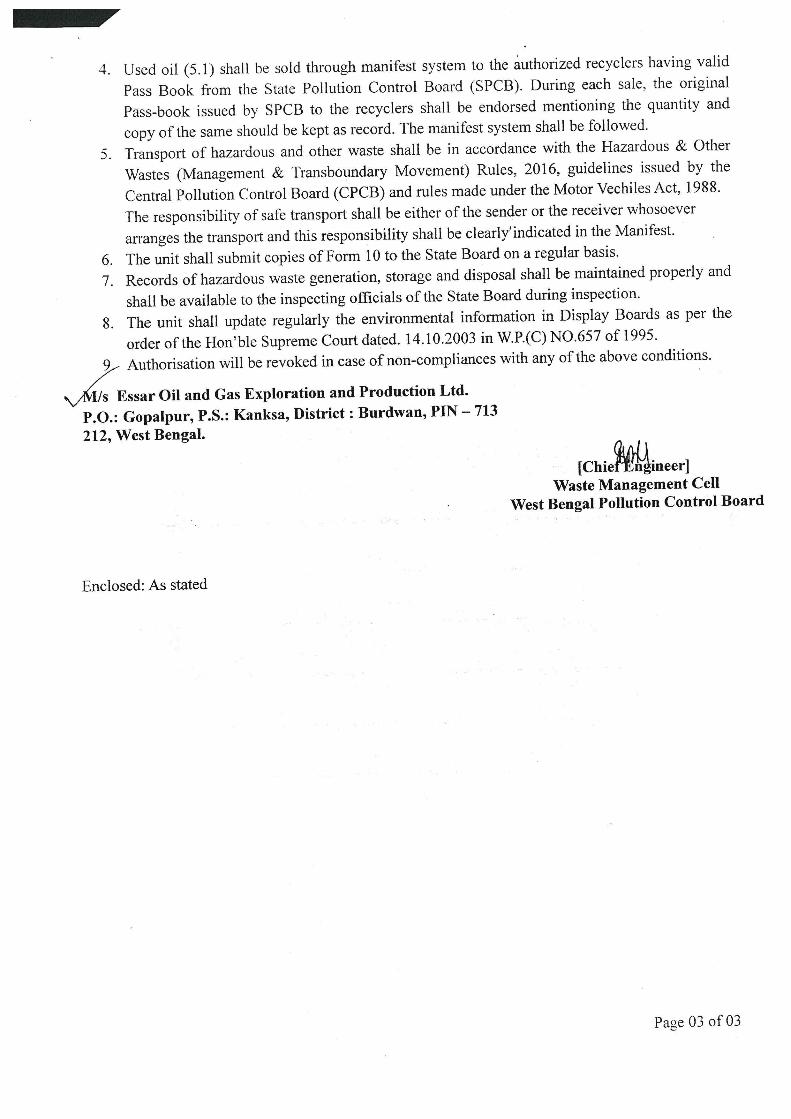

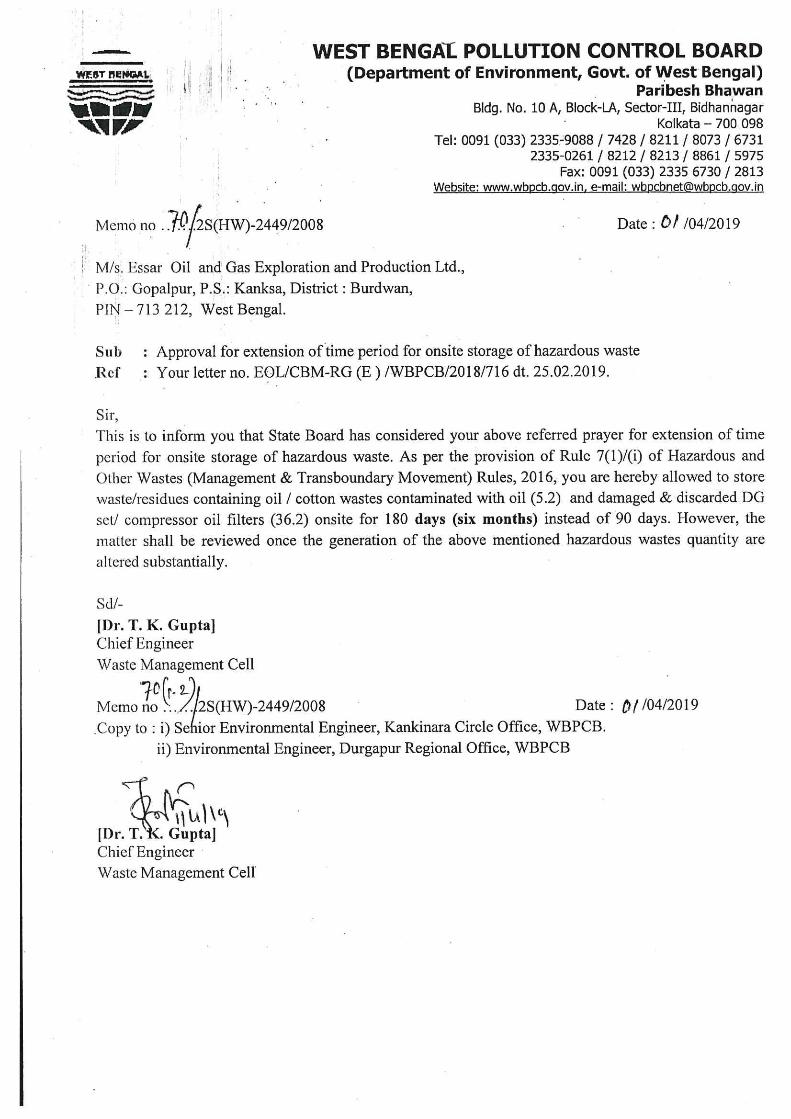
ANNEXURE IX: Expenditure towards Environmental Protection
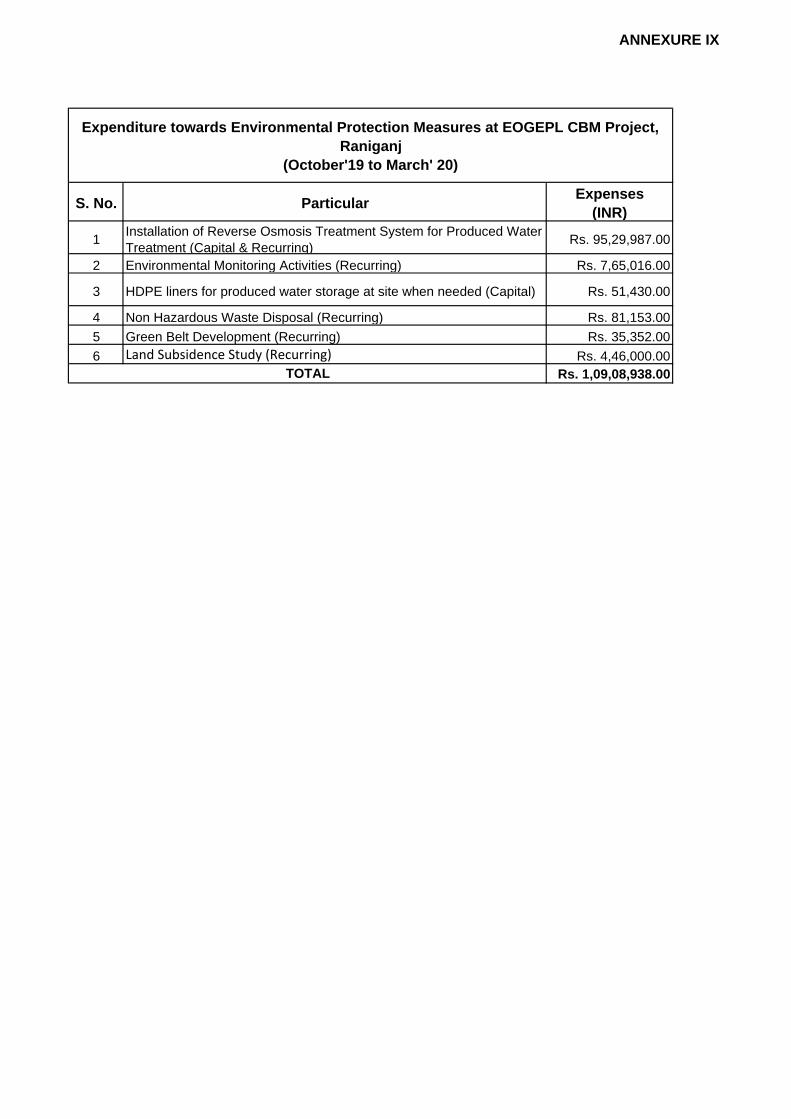
ANNEXURE IX
S. No. Particular Expenses(INR)
1 Installation of Reverse Osmosis Treatment System for Produced WaterTreatment (Capital & Recurring) Rs. 95,29,987.00
2 Environmental Monitoring Activities (Recurring) Rs. 7,65,016.00
3 HDPE liners for produced water storage at site when needed (Capital) Rs. 51,430.00
4 Non Hazardous Waste Disposal (Recurring) Rs. 81,153.005 Green Belt Development (Recurring) Rs. 35,352.006 Land Subsidence Study (Recurring) Rs. 4,46,000.00
Rs. 1,09,08,938.00
Expenditure towards Environmental Protection Measures at EOGEPL CBM Project,Raniganj
(October'19 to March' 20)
TOTAL
ANNEXURE XI: Ground Water Level Report
(Compliance Period: Oct’ 19 to Mar’ 20)
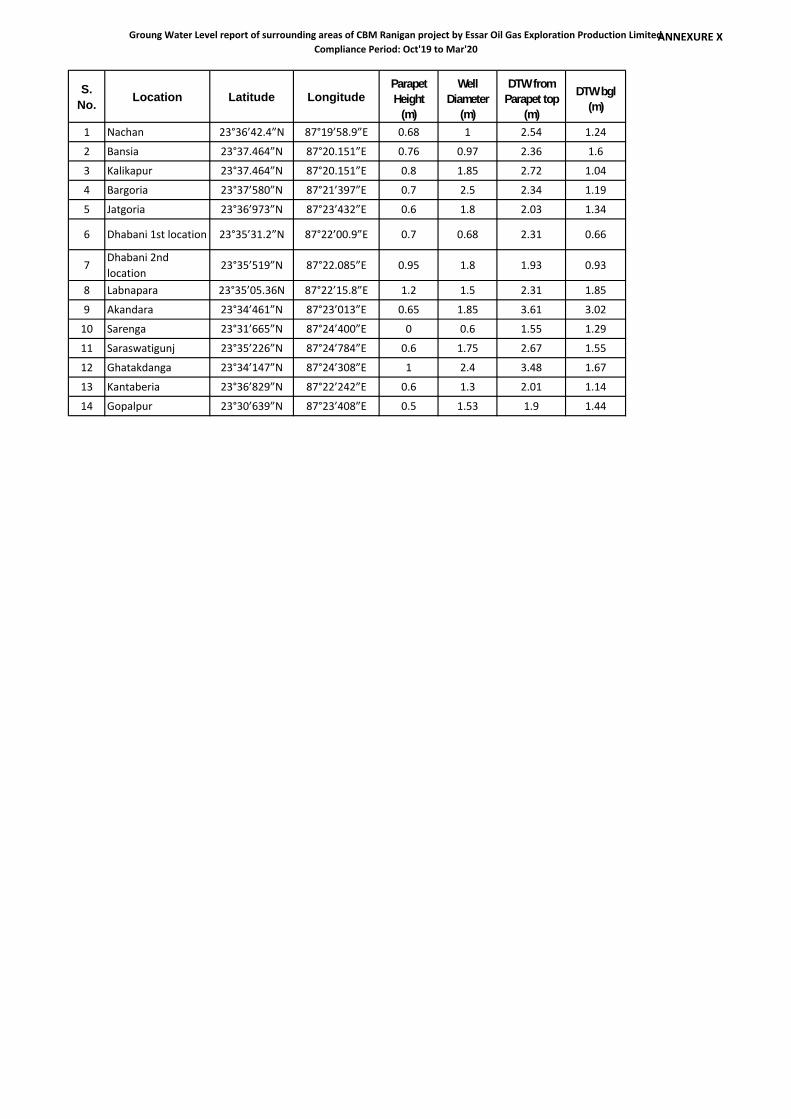
Groung Water Level report of surrounding areas of CBM Ranigan project by Essar Oil Gas Exploration Production LimitedCompliance Period: Oct'19 to Mar'20
ANNEXURE X
S.No. Location Latitude Longitude
ParapetHeight
(m)
WellDiameter
(m)
DTW fromParapet top
(m)
DTW bgl(m)
1 Nachan 23°36’42.4”N 87°19’58.9”E 0.68 1 2.54 1.24
2 Bansia 23°37.464”N 87°20.151”E 0.76 0.97 2.36 1.6
3 Kalikapur 23°37.464”N 87°20.151”E 0.8 1.85 2.72 1.04
4 Bargoria 23°37’580”N 87°21’397”E 0.7 2.5 2.34 1.19
5 Jatgoria 23°36’973”N 87°23’432”E 0.6 1.8 2.03 1.34
6 Dhabani 1st location 23°35’31.2”N 87°22’00.9”E 0.7 0.68 2.31 0.66
7Dhabani 2ndlocation
23°35’519”N 87°22.085”E 0.95 1.8 1.93 0.93
8 Labnapara 23°35’05.36N 87°22’15.8”E 1.2 1.5 2.31 1.85
9 Akandara 23°34’461”N 87°23’013”E 0.65 1.85 3.61 3.02
10 Sarenga 23°31’665”N 87°24’400”E 0 0.6 1.55 1.29
11 Saraswatigunj 23°35’226”N 87°24’784”E 0.6 1.75 2.67 1.55
12 Ghatakdanga 23°34’147”N 87°24’308”E 1 2.4 3.48 1.67
13 Kantaberia 23°36’829”N 87°22’242”E 0.6 1.3 2.01 1.14
14 Gopalpur 23°30’639”N 87°23’408”E 0.5 1.53 1.9 1.44