Embed Size (px)
Citation preview

Essar Oil Limited | Annual Report 2012-13
Positive Moves. Positive Results.
PDF processed with CutePDF evaluation edition www.CutePDF.com

CORPORATE INFORMATION
BOARD OF DIRECTORS
(As on August 14, 2013)
Prashant Ruia, ChairmanNaresh K. Nayyar, Deputy ChairmanLalit Kumar Gupta, Managing Director & CEOChakrapany Manoharan, Director (Refinery)Philip Aiken AMDilip J. ThakkarK. N. VenkatasubramanianV. S. JainRajiv Pal Singh, Nominee of State Bank of IndiaMelwyn Rego, Nominee of IDBI Bank Ltd.Suneet Shukla, Nominee of IFCI Ltd.R. Sudarsan, Nominee of LIC of India
COMPANY SECRETARY
Sheikh S. Shaffi
TRANSFER AGENTS
M/s. Datamatics Financial Services Ltd.Unit: Essar Oil LimitedPlot No. B-5, Part B Cross Lane,MIDC, Andheri (East), Mumbai – 400 093Tel: +91-22-66712151 to 66712156Fax: +91-22-66712209Email: [email protected]: www.dfssl.com
AUDITORSM/s. Deloitte Haskins & Sells, Ahmedabad
BANKERS
ICICI Bank Ltd.State Bank of IndiaIDBI Bank Ltd.Punjab National BankHDFC Bank Ltd.Axis Bank Ltd.Indian Overseas BankOriental Bank of CommerceIndian BankCentral Bank of IndiaBank of IndiaState Bank of PatialaYes BankAllahabad BankSyndicate BankBank of BarodaState Bank of Mysore
REGISTERED OFFICE
Khambalia Post, Post Box No. 24Dist. Jamnagar – 361 305, GujaratTel: +91-2833-661444Fax: +91-2833-662929Email: [email protected]
CORPORATE OFFICE
Essar House, Post Box No. 794511, Keshavrao Khadye MargMahalaxmi, Mumbai – 400034Tel: +91-22-66601100Fax: +91-22-23544281/ 23540450Website: www.essar.com

Contents Company Overview02 Positive Moves. Positive Results.03 Highlights04 Essar Oil at a Glance06 Chairman’s Message08 MD & CEO’s Message12 Profiles of the Board of Directors16 Senior Management Team
18 Management Discussion and Analysis
40 Sustainability
Governance48 Directors’ Report59 Corporate Governance Report
Financials70 Independent Auditors’ Report76 Balance Sheet77 Statement of Profit & Loss78 Cash Flow Statement80 Notes to the Financial Statements
129 Notice
Cover images: 1. Gas Gathering Station (GGS) at Raniganj2. Vacuum Gas Oil Hydrotreater (VGOHDT) Unit, Charge Heaters and Reactors at the Vadinar Refinery3. Essar Foundation supported Gujarat Government school enrolment drive (Shala Pravesh Utsav)4. Company owned and operated retail outlet at Hazira, Gujarat
1 2
3 4
Green Belt at Vadinar

Annual Report 2012-132
At Essar Oil, we are moving
forward with a consistent focus
to deliver stakeholder value, despite growing
challenges in an uncertain global economy. Following the
completion of the Expansion and Optimisation Projects of the Vadinar
Refinery, we have concentrated on operational excellence to set new industry
benchmarks. As India continues to be one of the fastest growing major economies in the
world, the country’s energy demand will escalate further. We will continue to emphasize on domestic
markets to help achieve India’s energy security. Our positive moves during FY 2012-13 helped us to perform
better in an adverse operating environment.
We have initiated concrete measures to facilitate enhanced refinery operations and dollarisation of the balance sheet leading to reduced
cost of debt. Besides, we are taking appropriate measures to ensure workplace safety, reduce environmental impact and give back to the
communities we work with.
Our positivity and holistic sustainability efforts are creating long-term value for the community and society at large.
Positive Moves. Positive Results.

CO
MP
AN
Y O
VE
RV
IEW
MA
NA
GE
ME
NT
DIS
CU
SS
ION
AN
D A
NA
LYS
ISS
US
TAIN
AB
ILITY
GO
VE
RN
AN
CE
FIN
AN
CIA
LS
Highlights
THROUGHPUT (MMT)
09-1008-09 10-11 11-12 12-13
13.5
11.9
5
13.5
14.7
6
19.7
7REVENUE (` crore)
09-1008-09 10-11 11-12 12-13
96,7
97
63,3
40
53,1
19
42,4
02
41,8
16
CP GRM (USD/bbl)
09-10 10-11 11-12 12-13
4.53
1.6
7.96
4.23
EBITDA (` Crore)
09-1008-09 10-11 11-12 12-13
3,65
1
2,10
1
2,77
9
1,93
8
1,20
3
Annual Report 2012-134
Essar Oil at a glance
20 MMTPA CapacityProcessed 19.8 MMT in FY 2012-13
With 11.8 complexity: The Vadinar refinery is now amongst most complex refineries in the world
Crude diet comprised of 86% heavy & ultra heavy crude
Improved product mix with 83% high value light & middle distillates
Vacuum Gas Oil Hydrotreater (VGOHT) Unit at Vadinar
5

CO
MP
AN
Y O
VE
RV
IEW
MA
NA
GE
ME
NT
DIS
CU
SS
ION
AN
D A
NA
LYS
ISS
US
TAIN
AB
ILITY
GO
VE
RN
AN
CE
FIN
AN
CIA
LS
USD
481 million Dollarised to create a natural hedge
Achieved 100% capacity utilisation within a quarter post expansion
Delivered
full benefits of upgraded refinery
Completed
CDR exitallowing for future operational & financial flexibility
Improved Credit Rating to BBB+
(from BBB-)
Approval for full development for the Raniganj Block received
Currently producing 100,000 scm/day 165 wells drilled
Fluid Catalytic Cracking Unit (FCCU) at Vadinar
Business Highlights
Essar Oil is a fully integrated oil and gas company with a strong presence across the hydrocarbon value chain – from exploration and production to refining and oil retail.
The Company’s refinery at Vadinar, Gujarat, is India’s second largest single site refinery with an annual capacity of 20 MMTPA, or 405,000 barrels per day, and 11.8 complexity.
Essar Oil’s portfolio of five Coal Bed Methane (CBM) gas blocks with a total of 10 trillion cubic feet (TCF), or about 1.7 billion barrels of oil equivalent, of reserves and prospective resources, makes it the largest CBM player in the country.
On the marketing side, the Company operates a pan-India network of over 1,400 retail outlets, with another 200 in various stages of commissioning.

Annual Report 2012-136
Chairman’s Message
Dear Shareholders,
I am very happy to present to you the Annual Report for FY 2012-13. It was indeed a watershed year for your Company. Our proactive attitude contributed largely to our significant progress and achievements. Last year, we were at the threshold of entering a new phase of growth. We can be proud to have realised our dream of building one of the most complex world-class refineries globally.
Economy and industryThe overall growth in our country was constrained by supply-side bottlenecks, slowdown in fixed capital formation, weakness in industrial sector and lack of push on much needed structural reforms. Despite the challenges faced by a slowdown of economic growth, both on domestic and global fronts, your Company sustained its position as the country’s second largest private refiner.
5.6% CAGRgrowth in petroleum products in India
PRASHANT RUIA
7

CO
MP
AN
Y O
VE
RV
IEW
MA
NA
GE
ME
NT
DIS
CU
SS
ION
AN
D A
NA
LYS
ISS
US
TAIN
AB
ILITY
GO
VE
RN
AN
CE
FIN
AN
CIA
LS
the maximum. We continue to focus on domestic markets, keeping in mind the increasing domestic demand for energy. As our country continues on its growth trajectory as one of the fastest growing economies in the world, there is an increasing need to bridge the demand-supply gap in the energy sector.
Your Company is advantageously positioned to capitalise on this transformative change in energy sector in the country. We successfully transitioned, from being a project-focused company to an operational company. Our Vadinar Refinery was completed at an investment of approximately ` 24,000 crore. Since June 2012 our expanded 20 MMTPA facility is fully operational, benchmarked with a global high complex refining capability. This enabled us to demonstrate an excellent operating performance with a very strong focus on safety and post record Gross Refining Margins (GRM). Between FY 2011-12 and FY 2012-13, we almost doubled our GRMs by producing more high margin light and middle distillates and processing a higher percentage of lower cost heavy and ultra-heavy crude oil. By doing so, we have showcased the true potential of our assets.
Going forward we are committed to delivering superior stakeholder value by unleashing the full potential of our people. We stand firm on keeping our entrepreneurial spirit alive among our people and achieve more leadership milestones during the course of our journey. It is this spirit that has fueled our growth and helped us build a successful enterprise.
Positive AttitudeIt was a memorable year which showed strong operational and people performance. This, coupled with excellent financial performance helped us emerge stronger as world-class integrated energy player post stabilisation of Expansion and Optimisation Projects. While we are indeed proud of the several milestones we achieved during the year, we are confident of displaying a stronger growth in the coming years to maximise shareholder value.
Best wishes,
Prashant Ruia Chairman
Global demand for energy continues to grow, especially in developing countries. In India, overall demand for petroleum products is expected to grow at a Compound Annual Growth Rate (CAGR) of 5.6% to 194 MTPA by 2016-17. The oil and gas sector in India is a critical component of the country’s economy, accounting for 15% of the country’s Gross Domestic Product (GDP). Even today, our country imports almost 80% of crude oil for refining. There have been some positive steps taken by the Government to revive the sector and accelerate investments which have contributed positively to the overall growth in the industry. Despite the concern on persistent risks that surround the industry (lower return on capital investments in initial years, fluctuating commodity prices and an ambiguous regulatory environment for exploration), the changes in the industry present significant opportunities to your Company.
Positivity at Essar OilWe derive optimism for our business growth on a few basic fundamentals. Post completion of Expansion and Optimisation Projects of Vadinar Refinery, we have leveraged our operational expertise to
We are committed towards delivering superior stakeholder value by unleashing the full potential of our people.

Annual Report 2012-138
MD & CEO’s Message
20 MMPTAincrease in capacity from second quarter
LALIT KUMAR GUPTA
Dear friends,It is a pleasure to present the Annual Report for FY 2012-13 of Essar Oil Limited. The year was remarkable for us in more ways than one.
We began the year with lot of uncertainties and challenges but were able to successfully address them during the year.
The Refinery operations were stabilised in a record period of three months post completion of the Expansion and Optimisation Projects and is now successfully operating at more than 100% of the 20
MMTPA rated capacity from the second quarter of FY 2012-13.
The benefits of increased complexity of 11.8 were also reflected in the operations of the Refinery as it is using almost 85% of heavy and ultra-heavy crudes and is still able to produce the stringent Euro III/IV-compliant high-margin light and middle distillates.
The sourcing of ultra-heavy crudes has been tied-up with domestic and overseas suppliers and the enhanced production has been marketed in the domestic market to the
9

CO
MP
AN
Y O
VE
RV
IEW
MA
NA
GE
ME
NT
DIS
CU
SS
ION
AN
D A
NA
LYS
ISS
US
TAIN
AB
ILITY
GO
VE
RN
AN
CE
FIN
AN
CIA
LS
extent of 65 to 70% of total production.
The uncertainty of Sales Tax incentives payments was addressed after the Hon’ble Supreme Court allowed us to pay the Sales Tax dues along with 10% interest prospectively from the date of its decision on 17/1/2012 in eight equal quarterly instalments commencing from January 2013. We have already tied up a bank facility of ` 5,000 crore to take care of this payment.
The CDR exit has been completed in March 2013 and therefore your Company will have much better operational and other flexibilities in its decision making processes.
The Third stage Environmental Clearance of our Raniganj CBM project has been received and the project is now on a fast track with the completion of drilling of 165 wells.
Your Company’s credit ratings improved by two notches from BBB- to BBB+ by the rating agency, CARE, reflecting an improved outlook and removal of uncertainties previously faced.
It is important to mention that your Company achieved the above amidst challenges
faced both on the global and domestic fronts.
Doing Things RightOur agility not only allowed us to commission the Expansion Project at the Vadinar Refinery on time, but also enabled us to complete the commissioning of the Optimisation Projects four months ahead of schedule. Today, our Refinery is the second largest refinery at a single location in India, accounting for almost 10% of India’s total refining capacity.
Our achievements at Vadinar were a result of a focused growth strategy. We successfully stabilised the expansion units taking the capacity from 10.5 MMTPA to 18 MMTPA at the beginning of FY 2012-13. By June 2012, we completed the Optimisation Project, increasing the capacity to 20 MMTPA and taking the refining complexity level to 11.8. The elevated complexity puts us among the top five refineries in the world. Additions of several technological advanced units (ISOM, DHDT, VGO-HT and DCU) which enhanced our refinery complexity contributed to a quantum jump in our overall Gross Refining Margins (GRM).
Strengthening Our PerformanceWe did not just improve but almost doubled our refining margins. Our Current Price Gross Refining Margin (CP GRM) stood at USD 7.96 per barrel (/bbl) in FY 2012-13 against USD 4.23/bbl in FY 2011-12. In fact our CP GRM for the second half of FY 2012-13, where we had full benefit of coal fired power and higher complexity upon stabilisation of the new units, was USD 9.4/bbl. Moreover, the fact that we operated at more than 100% of our 20 MMTPA capacity from the second quarter onwards with higher complexity, enabled us to post our highest-ever revenue and EBITDA figures of ` 96,797 crore and ` 3,651 crore, respectively.
Post CDR exit we are now fully focused to convert our Rupee debt into low cost USD loans. We have already converted Rupee loan to the extent of USD 480 Million through ECBs/swaps. Since the refining business is a completely dollarised business and our Revenues /GRMs are linked to the US Dollar, this will also de-risk our balance sheet and align our debt in line with our earnings currency, i.e. US Dollars. It is important to note that dollar debt is 5 to 6
Post CDR exit we are now fully focused to convert our Rupee debt into low cost USD loans. We have already converted Rupee loan to the extent of USD 480 Million through ECBs/swaps.

Annual Report 2012-1310
percentage points cheaper than rupee debt. This exercise will therefore reduce our interest cost and enable us to benefit from longer maturities of ECBs.
Operations During the year, the Refinery achieved a throughput of 19.76 MMT which was 46% higher compared to 13.5 MMT in FY 2011-12 owing to the completion of Expansion and Optimisation Projects. We also could reduce average API of our crude intake to 27, compared to 33 in FY 2011-12. The higher complexity of the Refinery also enabled us to improve our product mix by producing high-margin middle and light distillates at 83% of our product slate, compared to 72% in FY 2011-12.
With a view to achieve a substantial reduction in our fuel cost, we commissioned a captive coal-based power plant during the year, making us one of the few refineries in Asia to operate a coal fired power plant. This is expected to result in the enhancement in margins to the tune of ~USD 1/bbl.
We have a right sourcing strategy assuring continuous supply of crude oil to our refinery with the flexibility to take advantage of any future market opportunities. We have balance of spot and long-term contracts
ensuring a continuous supply of crude diet at competitive pricing.
While we are running our refinery at more than 100% capacity on sustainable basis, we continue to focus on maintaining the highest safety standards at our facilities. Our Refinery continues its commitment to excellence in safety standards with a track of 1,960 Lost Time Injury (LTI) free man days and 1,545 days without any major fire as of August 14, 2013.
Exploration & ProductionOn the exploration front, we focus on the exploration of non-conventional gas. We are one of the leading Coal Bed Methane (CBM) players in the country with more than 2,500 sq.km of acreage under exploration. At Raniganj, our flagship CBM block, activity has progressed significantly such that we have completed drilling of more than 165 wells and increased the production to almost 100,000 standard cubic metres per day (scmd). In totality, we transformed several risks and challenges in Raniganj into opportunities by making significant progress in drilling technology. This entire exercise is backed by a highly qualified team of geologists, geophysicists, petro-physicists and petroleum engineers
among others. Over the coming years, we plan to increase the number of wells to 360 and expect to increase the production to reach 3 million scmd.
Marketing Since starting our retail business a decade ago, we expanded our network to include over 1,400 commissioned outlets, with another 200 in various stages of commissioning, making us the largest private sector player in the market. The Government has shown a firm resolve with number of steps taken in the recent past to deregulate the marketing of petroleum products. Gasoline prices have been made fully market driven. The prices of bulk gasoil have also been made market driven. The retail prices of gasoil are being incrementally raised by 40 to 50 paise per litre starting January 2013. It now appears reasonably certain that retail gasoil prices will be made market-driven in due course.
Once fully deregulated, our retail network will provide great value to our stakeholders. In fact the time has come for us to have a serious look on further strengthening of our retail network to seize this upcoming opportunity in the Indian oil retail market.
11

CO
MP
AN
Y O
VE
RV
IEW
MA
NA
GE
ME
NT
DIS
CU
SS
ION
AN
D A
NA
LYS
ISS
US
TAIN
AB
ILITY
GO
VE
RN
AN
CE
FIN
AN
CIA
LS
Our asset-light franchisee model (franchisee owned and operated) provides a value-added proposition to our dealers, without putting pressure on our finances. Through this arrangement, the dealer has to make the initial capex while we compensate them with lease rentals, ROI and margins on sale – in line with state-run oil companies. A part of our strategy also includes providing holistic non-fuel solutions under one roof. For this, we have tied-up with leading industrial players (like Castrol, JK Tyres, Amul and Pepsi) to provide end-to-end service to consumers at our retail outlets.
Risk Management In order to insulate the business from volatile foreign exchange and commodity prices, your Company follows a very robust risk management policy which is approved by the Board.
Committed to SustainabilityOur parent company, Essar Energy plc, became a signatory to the United Nations Global Compact, the largest corporate responsibility initiative in the world in April 2013. As part of this initiative, Essar Oil also commits to adopting an established and globally recognised policy framework
for the development, implementation and disclosure of environmental, social and governance policies and practices.
We are committed to being a responsible corporate citizen and will continue to participate in community engagement activities to create long-term benefits for the community and society at large.
Health and SafetyHealth and safety of our employees and people who work for us is one of our top priorities. We are committed to making continued efforts to recognise hazards, assess health and safety risks in our operations and taking steps to mitigate those risks to enhance our safety performance.
People – our Biggest AssetOur biggest strength is our human capital that has supported us in fulfilling our objectives. I am grateful to each one of my team members and their families for their commitment and support of our Company’s vision to be the Employer of Choice and make our assets the very best in the industry. Employee engagement, innovation and a focus to nurture and retain high performing employees will
continue to be our key focus areas going forward.
Positive FutureFor the second consecutive year, we were recognised for the increased level of transparency and quality of information provided by us towards carbon disclosure by the Carbon Disclosure Project (CDP), UK. This reflects our high governance standards which align with quality in operations processes and ensure the meeting of safety, health and environmental standards.
On a concluding note, I would like to restate the fact that we are committed to move ahead to achieve greater heights in our responsibility to fulfil stakeholder expectations. We are confident that benefits accruing to us due to our Expansion and Optimisation Projects will make us stronger in the long-run. Increased capacities, quality operations, low-cost coal-fired captive power, integrated business, positive government reforms and above all our positive attitude will transform us into an efficient, reliable and sustainable organisation.
With best wishes and regards
Lalit Kumar GuptaManaging Director & CEO
We have balance of spot and long-term contracts ensuring a continuous supply of crude diet at competitive pricing.
MD & CEO’s Message

Annual Report 2012-1312
Profiles of the Board of Directors
PRASHANT RUIAChairman
Mr. Prashant Ruia has been actively involved with Essar Group’s operations and management since 1985 and spearheads the Group’s growth and diversification both within India and internationally. He is known for his project execution skills, financial expertise and people management capabilities. He was instrumental in commissioning of the Vadinar refinery in record time and the acquisition of Algoma Steel in Canada.
He holds several key positions on various regulatory and professional boards. He is a member of the Audit Committee of World Steel Association and the Energy Board Room at the World Economic Forum. He has also served as Chairman of the Hydrocarbons Committee of the Confederation of Indian Industries in 2008 and as member of the Prime Minister of India’s Advisory Council on Trade & Industry in 2007. He is Chairman on the Board of Essar Energy plc which is listed on the London Stock Exchange.
NARESH NAYYARDy. Chairman
Mr. Naresh Nayyar is the Chief Executive Officer of Essar Energy plc. He joined Essar Group in October 2007 as Managing Director and CEO of Essar Oil Limited and became Non Executive Director and Deputy Chairman in December 2011. Prior to joining Essar Oil, Mr. Nayyar was the CEO of ONGC Mittal Energy Limited.
Mr. Nayyar has close to 40 years of experience in the Energy market in India. He has been actively involved in Energy Policy making and energy security initiatives of India. He started his career with Indian Oil (India’s largest downstream Oil Company) in 1975 and rose to become its Director in October 2002, after having handled several key assignments in finance, treasury, international trade and business strategy.
Mr. Nayyar’s previous directorships include Indian Oil Corporation, Oil & Natural Gas Corporation, Petronet LNG Ltd; IBP, and Lanka IOC Limited where he served as Chairman. He was also Chairman of the Indian Oil Marubeni Panipat Power Project between March 2003 and November 2005.
LALIT KUMAR GUPTAManaging Director & CEO
Mr. Lalit Kumar Gupta is the Managing Director and Chief Executive Officer of Essar Oil Ltd. since December 2, 2011. In his current position, he is responsible for managing downstream oil business of Essar Oil Limited.
Mr. Gupta has over 32 years of leadership experience in core sectors of Energy (Oil & Gas), Utilities (Power) and Steel. Before joining Essar Oil, he was CEO and Joint Managing Director of JSW Energy Ltd. Prior to this, he was Director (Finance) with Mangalore Refinery & Petrochemicals Ltd., an ONGC subsidiary. At MRPL he was responsible for Finance, Taxation, Insurance, Legal and Commercial function as well as International Trade including Crude Procurements Strategy and Strategic Management of major Expansion projects. He was recognised by CNBC TV18 as the Best performing CFO in the Indian Oil & Gas sector in 2008-09.
Mr. Gupta is a Rank Holder Chartered Accountant, a Company Secretary and holds a Bachelors degree in Commerce (Gold Medallist), from Jiwaji University, Gwalior.
13
CO
MP
AN
Y O
VE
RV
IEW
MA
NA
GE
ME
NT
DIS
CU
SS
ION
AN
D A
NA
LYS
ISS
US
TAIN
AB
ILITY
GO
VE
RN
AN
CE
FIN
AN
CIA
LS
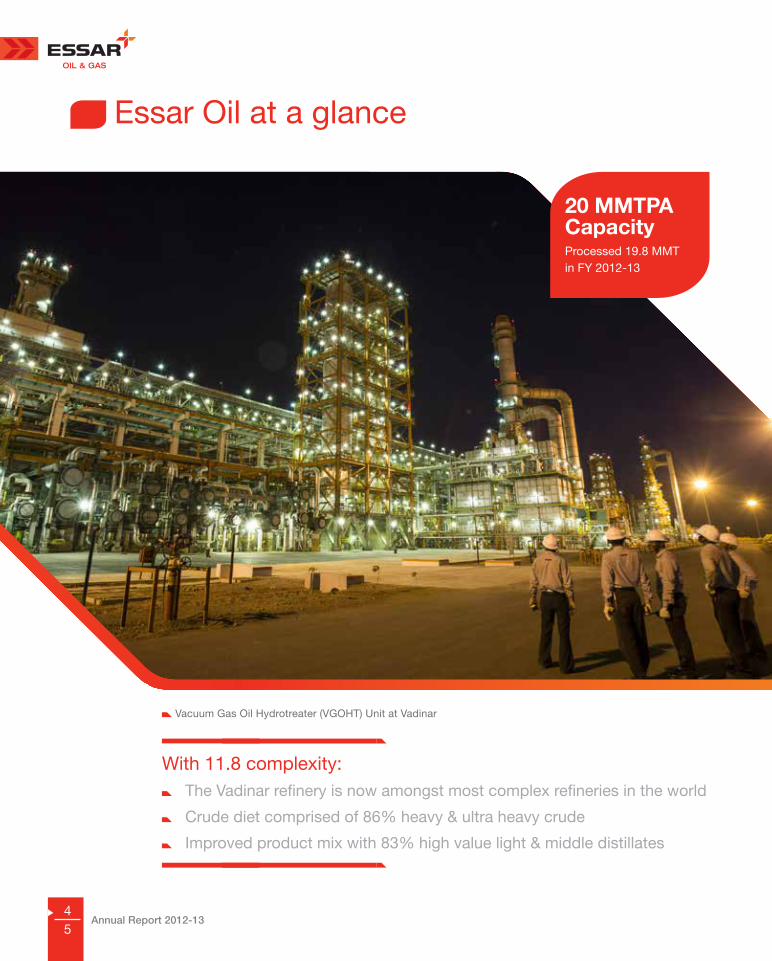
CHAKRAPANY MANOHARANDirector (Refinery)
Mr. Chakrapany Manoharan was appointed as Director (Refinery) on March 29, 2012. He joined Essar Oil Limited as Head of Refinery in May 2008. He started his career as Engineer Trainee in 1977 at Indian Oil Corporation Limited (IOCL), Gujarat Refinery, Baroda. He handled a variety of key assignments in various positions in Refining Operations, Maintenance, and Technical Services at Gujarat Refinery, Panipat Refinery as well as Head Office (Refinery Division). His last assignment with IOCL was at Panipat Refinery as Executive Director. Mr. Manoharan has also worked for 2 years on deputation to Nigeria providing technical assistance to the operating personnel at Port Harcourt Refinery of NNPC. He was a Board member and also served as Chairman of Indian Oil Technologies Limited. He also has the distinction of being the first Indian to be on the panel of NPRA’s Q&A 2003 session held at New Orleans in U.S.A.
He is a Chemical Engineer from Calicut University, Kerala.
PHILIP AIKEN AMIndependent Director
Mr. Philip Aiken AM was appointed to the Board of Directors on August 14, 2012.
He has over 40 years of experience in industry and commerce. Mr. Aiken is currently Chairman of Aveva plc, Sr. Independent Director of Essar Energy plc and Kazakhmys plc and Non Executive Director of National Grid and Newcrest Mining. He has held senior positions with BHP Billiton, BTR and BOC Group in the UK and Australia. Previous appointments include Chairman of Robert Walters plc, Non Executive Director of Miclyn Offshore Express, Chairman of the 2004 Sydney World Energy Congress and a Board member of Governor of Guangdong International Consultative Council, World Energy Council and Monash Mt. Eliza Business School.
He has done his Bachelor of Engineering (Chemical) from Sydney University.
DILIP J. THAKKARIndependent Director
Mr. Dilip J. Thakkar was appointed to the Board of Directors on November 3, 1994. He is a practicing Chartered Accountant, with over 52 years’ experience in taxation and foreign exchange regulations. He is associated with several public and private companies as a director.
He is a Fellow member of the Institute of Chartered Accountants of India.

Annual Report 2012-1314
K. N. VENKATASUBRAMANIANIndependent Director
Mr. K. N. Venkatasubramanian was appointed to the Board of Directors on November 29, 2000. He has over 51 years of experience in the oil & gas and petrochemicals sectors having worked for IPCL, IOCL and Gulf Oil Limited. He has previously served as director, Marketing and Director, Operations of IPCL, Chairman and Managing Director of Engineers India Ltd., Chairman and Managing Director of IOCL and as Chairman of Gulf Oil Ltd. He is currently Chairman of Times Technoplast Ltd.
He is a Chemical Engineer from A.C. College of Technology, Chennai and an M.Tech from IIT, Kharagpur.
V. S. JAINIndependent Director
Mr. V. S. Jain was appointed to the Board of Directors on May 10, 2013. He has worked with Indian Oil Corporation for 26 years. He was responsible for international negotiations for procurement of crude and petroleum products and implementation of financial strategies and financial appraisal of projects. Thereafter, he served another Maharatna – SAIL, first as Director – Finance, and thereafter as the Chairman till his retirement in 2006. After retirement, he served the Jindal Group as Managing Director and CEO of Jindal Stainless Limited. He also held the post of Member of the Public Enterprises Selection Board till July 2011.
He a Fellow member of the Institute of Chartered Accountants of India and the Institute of Cost Accountants of India.
RAJIV PAL SINGHNominee of State Bank of India
Mr. Rajiv Pal Singh was appointed to the Board of Directors on May 24, 2013. He has over 37 years rich experience in Banking and Finance industry. Mr. Singh began his professional career with State Bank of India and was engaged in various capacities as Country Head (Project Finance), DGM Corporate Accounts Group, DGM (MIS), Personnel Manager, and Manager Credit & Operations in Japan. He rose to the position of Chief General Manager (Foreign Offices) of SBI from which position he retired in January 2012. Mr. R P Singh has also served as Director on the Boards of 7 international subsidiaries of State Bank of India including as Managing Director of its Indonesian subsidiary.
Mr. Singh has done B. Tech in Chemical Engineering from IIT, Delhi and CAIIB from the Indian Institute of Banking & Finance.
15

CO
MP
AN
Y O
VE
RV
IEW
MA
NA
GE
ME
NT
DIS
CU
SS
ION
AN
D A
NA
LYS
ISS
US
TAIN
AB
ILITY
GO
VE
RN
AN
CE
FIN
AN
CIA
LS
MELWYN REGO Nominee of IDBI Bank Ltd.
Mr. Melwyn Rego was appointed to the Board of Directors on October 18, 2010. He joined IDBI in February 1984. He has held assignments in the areas of Corporate Banking, Rehabilitation Finance, Treasury, International Banking, Finance & Accounts, Subsidiaries & Associate Institutions and Legal. In September 2003, Mr. Rego was appointed as Managing Director & CEO of IDBI Homefinance Ltd., a position he held upto December 2007, whereafter he returned to IDBI Bank. He is currently Executive Director at IDBI Bank Ltd.
He is a Bachelor of Commerce and an MBA.
R. SUDARSANNominee of LIC of India
Mr. R. Sudarsan is presently the Executive Director of IT (Software Development) of LIC of India with its Corporate Office at Mumbai.
Mr. R. Sudarsan joined LIC of India in 1984 as a Direct Recruit officer. He has served in various offices of Central, Western, Eastern and Southern Zones of LIC of India, mostly in IT environment in LIC which has evolved in a big way during the last 15 years with computerisation of all branches and operations, networking, portal and CRM initiatives, where he has been actively involved at all levels. He has served in other assignments like Personnel, CRM also.
He has a Masters Degree in Economics.
Profiles of the Board of Directors
SUNEET SHUKLANominee of IFCI Ltd.
Mr. Suneet Shukla was appointed to the Board of Directors on November 9, 2012. He has worked in man-made fiber industry for 9 years before joining IFCI Limited in April 2000. At IFCI he gained vast experience in all the dimensions of project financing, structured financing and equity/equity- related structures. He headed the Hyderabad Regional Office of IFCI Ltd. for more than two and half years and thereafter the Mumbai and Ahmedabad Regional Offices of IFCI since April 2011. He has recently been elevated to the position of Managing Director of IFCI Financial Services Ltd.
He is a graduate in Chemical Technology from HBTI, Kanpur, a CAIIB from Indian Institute of Banking and Finance and has done MBA (Banking and Finance) from IGNOU.
Annual Report 2012-1316
1 2 3 4 5 6
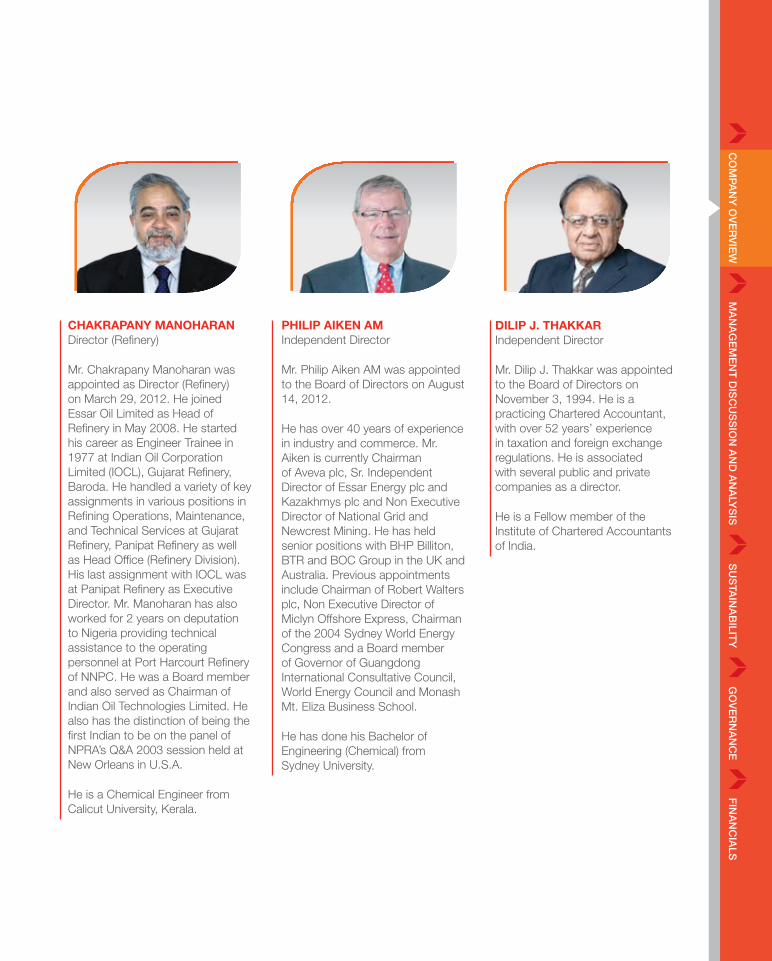
Senior Management Team
1. Mr. Lalit Kumar Gupta, Managing Director & CEO
2. Mr. Chakrapany Manoharan, Director (Refinery)
3. Mr. Iftikhar Nasir, CEO – Exploration & Production
4. Mr. S Thangapandian, CEO – Marketing and International Supply & Trading
5. Mr. Suresh Jain, Chief Financial Officer
6. Mr. K Govindarajan, CEO – Projects
17

CO
MP
AN
Y O
VE
RV
IEW
MA
NA
GE
ME
NT
DIS
CU
SS
ION
AN
D A
NA
LYS
ISS
US
TAIN
AB
ILITY
GO
VE
RN
AN
CE
FIN
AN
CIA
LS
7 8 9 10 11 12 13
7. Mr. V Ramachandran, President – CRG
8. Mr. Sheikh S Shaffi, Company Secretary & Head Legal
9. Mr. T Srinivas, Head – International Supply & Trading
10. Mr. Ajit Mishra, Head – Marketing
11. Mr. Sreedhar Rudraraju, Head – Economic Planning & Scheduling
12. Mr. Harsh Bhosale, Head – Human Resources
13. Mr. Vikas Prabhu, Chief Information Officer

Annual Report 2012-1318
Management Discussion and Analysis
Night view of the Vadinar Refinery
15%Oil & gas sector’s contribution to India’s GDP
55%Asia’s share of total oil demand growth in 2013-2017
19

CO
MP
AN
Y O
VE
RV
IEW
MA
NA
GE
ME
NT
DIS
CU
SS
ION
AN
D A
NA
LYS
ISS
US
TAIN
AB
ILITY
GO
VE
RN
AN
CE
FIN
AN
CIA
LS
Global Economic & Market OverviewThe global economy is expected to improve gradually with improvement in US economic environment, moderate growth of other emerging market economies like India, China and Brazil and revival in Euro zone and Japan. As per the International Monetary Fund’s (IMF) ‘World Economic Outlook’ published in April 2013, global economic growth is progressing to 3.3% in 2013 compared to 3% in 2012. However, the stability and growth prospectus of US economy resulted in flow of money from emerging markets to US and other developed markets which led to sharp depreciation of emerging market’s currencies against USD particularly India which largely depends on import of crude. This has made managing current account deficit a challenge for policy makers.
The global economic environment and delay in implementation of key policy decisions by the Government of India (Government) moderated Indian economic growth to 5% during FY 2012-13 from 6.2% in the previous year.
While India continues to be one of the fastest growing major economies in the world, in order to sustain a healthy growth rate in the future, the Government needs to quickly address key infrastructural bottlenecks, huge current account deficit and uncertainty with regard to policy and regulatory matters. The economy growth is expected to be back on track in coming year on account of new reforms announced and measures undertaken by the Government to contain current account deficit, high inflation and bring about overall improvement in fiscal consolidation.
Oil and natural gas will remain key sources of fuel in the global energy basket in the foreseeable future in spite of global thrust on increasing the share of renewal energy. There will be gradual increase of green / renewal energy and bio-fuels in overall basket of energy mix. However, this is not expected to significantly impact the oil demand. As per International Energy Agency (IEA), oil & natural gas is expected to be around 53% of total energy consumption by year 2030. Hence, the global strategic focus on hydrocarbon fuels will be
a key issue for policy makers across the world.
World oil demand is expected to grow at around 1 million barrel of oil equivalent per year between 2013 and 2017 with Asia accounting for 55% of the incremental demand growth. The focus of global energy demand growth has decisively shifted from developed markets to Asian region. Global markets continue to witness closures of refining capacities due to high operating cost, declining growth due to tough economic environment, high maintenance cost to maintain high quality products (Euro V), inability to process heavy and ultra heavy crudes due to environmental restrictions etc. In the last 4 years an average of more than 1 mmbbl of refining capacities have been shut down each year. New refinery capacities are being added in Asia and Middle East where demand is expected to grow at a healthy rate; the refineries in this region also have structural cost competitiveness compared to their west counterparts. On net basis, refinery capacity additions in next 2-3 years are expected to be more or less equal to incremental demand which is expected to support the refinery margins.

Annual Report 2012-1320
Indian Oil And Gas IndustryIndia is the fourth largest consumer of oil and the ninth largest crude oil importer in the world. The Oil and Gas sector contributes more than 15% to the GDP of the country. Economic growth is directly linked with energy demand and a conservative estimate of 7% growth is expected to double India’s per capita energy consumption from 560 kilograms of oil equivalent (kgoe) in FY 2009-10 to 1,124 kgoe by FY 2031-32.
Delayed Coker Unit (DCU) at Vadinar
CURRENT GAS DEMAND VS DOMESTIC SUPPLY
2011-12 2012-13 2013-14 2014-15 2015-16 2019-20
100
192 198215
0
200
300
400
500
600
SupplyDemand
(BCF/day) (MMSCD)
(Actual 130)
243 (8.6)
(10.8)
(13.6)
(15.3)
(17.2)(19.4)
305
385434
488
550
155(5.5) (6.6)
203
(7.0) (7.2) (8.5) (7.0)240
Source: Director General of Hydrocarbons and Mercados Analysis 2011
21

CO
MP
AN
Y O
VE
RV
IEW
MA
NA
GE
ME
NT
DIS
CU
SS
ION
AN
D A
NA
LYS
ISS
US
TAIN
AB
ILITY
GO
VE
RN
AN
CE
FIN
AN
CIA
LSManagement Discussion and Analysis
The robust economic growth of India over the past few years has led to increasing demand for energy. Presently, coal (~53%) and oil (~30%) constitute India’s primary energy sources. However, natural gas with a ~11% share, low as compared to the global ~24% share, is increasingly playing a crucial role in meeting the nation’s energy
requirement. Current natural gas consumption in the country is primarily attributed to the power, fertilizer and industrial sectors.
As the economy expands and the benefits thereof percolate to the country’s residents, the demand for modern and cleaner fuels like oil and gas are expected to witness sharp growth.
INDIAN DEMAND FOR FUELS (MMT)
FY04 FY13EFY05 FY08 FY09 FY15EFY14EFY12FY11FY10FY07FY06FY03FY02FY01
GasolineLPG
ATFFO/LSHS
Refinery Fuel
Diesel
Kerosene
Naphtha
Others
Capacity TMT
250
200
150
100
50
0
103 107 113 122
147 156 157
187206 211 216
235234
130127
Source: MoPNG, XIIth Plan, FACTS, BP Stats and Industry sources
A view of the Vadinar Refinery
The robust economic growth of India has led to increasing demand for energy; coal (~53%) and oil (~30%) constitute India’s primary energy sources.
2.8 mbpd refining capacity expected to come up in Asia, balancing the region’s demand.

Annual Report 2012-1322
KEY OIL FACTS IN 2012-13
Petroleum products accounted for about one-fifth of India’s outbound shipments, giving
the much-needed boost to the country’s exports. Petroleum product exports rose 7.7% at USD 60.3 billion
in FY 2012-13 from USD 56.04 billion in FY 2011-12.
Indian refiners processed 218.85 Million Metric Tonnes (MMT), which was 7.4% higher than the previous year reflecting expanded capacity.
CBM well drilling work in progress at Raniganj
A key issue impeding the country from unlocking its full hydrocarbon potential is energy pricing. The Government has taken firm policy decisions during the year to deregulate the pricing of transport fuels paving the way for a totally deregulated market. Today, the prices of bulk gasoil are fully deregulated effective January 2013 while retail gasoil prices are being aligned with international prices through regular incremental increases in the range of 40-50 paisa per month w.e.f. January 2013. With respect to Liquefied Petroleum Gas (LPG), the Government has put a cap of 9 cylinders per year per family for subsidised cylinders. The Government has also launched a Direct Cash Transfer of LPG subsidy to targeted families which is expected to substantially reduce the subsidy burden of the Government. Another notable policy decision of the Government is the price correction in gas sales thereby giving a much-needed fillip to the Indian upstream industry.
The above measures point towards a fully deregulated
market for oil and gas in India. Essar Oil Limited, with its complex refinery will be well-placed to increase its footprint in India and optimise sales further.
Indian Refining ScenarioThe total refining capacity in the country increased from 187.4 MMT (as on April 1, 2011) to 215 MMT (as on April 1, 2013). Measured by the number of upgraded capacities (secondary units) to primary distillation capacities (Crude Distillation Unit - CDU), Indian refineries’ combined complexity is today among the highest in the world and is growing. Hence, while the Asian overall upgrading/CDU ratio is 36%, India is at 41% and is expected to rise further. However it is also pertinent to note that around 30% of the country’s refineries are more than 30 years old. These ageing refineries are less
able to produce higher grade fuel products complying with stricter environment norms.
Indian Oil Retail ScenarioBulk gasoil deregulation brought in by the Government has opened a window of limited opportunity. There was a significant drop in marketing of products to institutional clients on account of deregulation in pricing. A drop of 40% in bulk sales was reciprocated by a rise in sales to retail outlets. This situation will be corrected once retail prices reach market-determined levels. As retail gasoil prices approach market-determined levels, it will create a more level playing field to unlock an enormous upside for private sector refiners. The growth rate of gasoline products’ consumption has been lower than expected over the past year in view of correction in the
23

CO
MP
AN
Y O
VE
RV
IEW
MA
NA
GE
ME
NT
DIS
CU
SS
ION
AN
D A
NA
LYS
ISS
US
TAIN
AB
ILITY
GO
VE
RN
AN
CE
FIN
AN
CIA
LS
pricing of gasoline and gasoil and also on account of various measures. These measures include a cap of 9 cylinders per house per annum taken by the Government and the setting in of a good monsoon in FY 2013-14.
Growth drivers
The demand for gasoline is expected to increase on account of rising number of automobiles. The gasoline car population in the country is estimated to have increased at 12.6% CAGR to 10.2 million units in FY 2011-12 from 5.6 million units in FY 2006-07.
The demand for gasoil is also expected to rise on account of increased demand from the transportation sector (heavy commercial vehicles, light commercial vehicles and railways) and the industrial sector. The indirect demand of oil and gas will also be propelled from sectors like infrastructure and FMCG, among others. Huge investments (up to USD 1 trillion) in infrastructure and the growing FMCG sector will proportionately increase demand of oil.
India continues to be a huge importer of crude oil. The average spending on oil imports as a percentage of the country’s GDP is higher for India as compared to others. The Government has been working
on various Policy initiatives to boost domestic oil and gas production so that the country’s import dependence may be reduced.
India’s Coal Bed Methane (CBM) ProspectsIndia has the fourth-largest proven coal reserves in the world and holds significant prospects for exploration and exploitation of CBM. Under the CBM policy, 33 exploration blocks have been awarded in the states of Andhra Pradesh, Assam, Chhattisgarh, Gujarat, Jharkhand, Madhya Pradesh, Maharashtra, Odisha, Rajasthan, Tamil Nadu and West Bengal. Out of the total available coal-bearing area of 26,000 sq. km for CBM exploration in the country, exploration has been initiated in about 17,000 sq. km. The prognosticated CBM resources in the country are about 92
trillion cubic feet (TCF), out of which only 8.92 TCF have so far been established. Commercial production of CBM in India has now become a reality with current CBM gas production of about 0.28 Million Metric Standard Cubic Metres per Day (MMSCMD).
However, the CBM industry remains largely fragmented with low infrastructure implementation and low development of resources. The recent announcement of the revision in gas prices by the Government, based on the recommendation of the Dr. Rangarajan Committee is a welcome step and will encourage large new investments in this sector for increasing domestic production of gas, thereby reducing imports of costly LNG.
Management Discussion and Analysis
Gas Gathering Station (GGS) at Raniganj

Annual Report 2012-1324
Essar Oil Limited is an end-to-end integrated oil and gas company with a strategic presence across hydrocarbon value chain. The integration is visible from the fact that the Company’s operations extend from exploration and production to refining to retail.
LocationEssar Oil’s Vadinar Refinery is strategically located to capitalise on rising
opportunities, both in the domestic market and abroad. It has proximity to the Middle East – the largest crude oil source in the world. This ensures sourcing crude oil at effectively lower freight costs which enhances the margins and competitiveness of the Refinery. The Company has strong captive infrastructure including port/ jetty and power plants which further strengthens the overall synergies. The location of the Vadinar Port also puts the Refinery on the major maritime route from the Middle East to the Far East.
Crude SlateConsequent to the expansion of Essar Oil’s Vadinar Refinery to 18 MMTPA in March 2012, the Refinery’s complexity increased to a level of 11.8. Subsequently with the completion of the Optimisation Project in June 2013, the refining capacity further increased to 20 MMTPA. This enabled the Refinery to process a high proportion (60%) of cheaper ultra-heavy crudes from the earlier levels of around 19%. The Company has shifted to a crude mix portfolio tilted
Diesel Hydrotreater (DHDT) at Vadinar
Essar Oil Limited – An insight
25

CO
MP
AN
Y O
VE
RV
IEW
MA
NA
GE
ME
NT
DIS
CU
SS
ION
AN
D A
NA
LYS
ISS
US
TAIN
AB
ILITY
GO
VE
RN
AN
CE
FIN
AN
CIA
LS
Train- 1 Sulphur Recovery Unit (SRU) at Vadinar
heavily in favour of heavy and ultra-heavy crude oil. Also, the high-margin light and middle distillates production, meeting stringent Euro III/IV/V norms increased from 72% before Expansion and Optimisation to 83% during the year.
Exploration-led ApproachEssar Oil is one of the leading CBM players in India and is on a mission to secure a leadership position in the unconventional hydrocarbon space. The Company’s Exploration and Production (E&P) business covers 5 unconventional (CBM) and 3 conventional oil and gas blocks in India. Its current focus is on the unconventional gas space where the 5 CBM gas blocks have a total of
approximately 10 TCF of reserves and prospective resources. Essar Oil has formed a balanced portfolio of assets which focuses on exploration in key basins of the Raniganj block in West Bengal. Raniganj is the first of Essar Oil’s CBM blocks under development. During the year, the block was granted Phase III environmental clearance by regulatory authorities. Post this clearance, Essar Oil has conducted full field development of 143 wells drilled till March 2013, of which 75 were in production. Current production from these wells stood at 100,000 Standard Cubic Metres per Day (scm/d) of gas with the objective to reach peak production of 3 MMSCMD of gas. Currently, Essar Oil supplies gas from Raniganj to a number of industrial customers, within the vicinity, through pipeline and cascades.
Over the next few years, the Company plans to increase the number of wells at Raniganj to 360. Going ahead, the Company is in the process of availing statutory clearances from regulatory authorities for the remaining four CBM blocks at Rajmahal (Jharkhand), Sohagpur (Madhya Pradesh-Chhattisgarh), Talchir and IB Valley (Odisha). The expertise and knowledge earned through current exploration activities at Raniganj will enable it to excel in future exploration activities on a large scale basis.
Refinery FocusedFY 2012-13 highlights:
The Optimisation Project was completed in June 2012, four months ahead of schedule, taking the Refinery capacity to 20 Million Metric Tonnes Per Annum (MMTPA) from 18 MMTPA. All units of the Refinery were fully stabilised in less than 3 months post completion of the Optimisation Project.
The Refinery achieved a throughput of 19.76 Million Metric Tonnes (MMT) post the Expansion-cum-Optimisation against the previous year processing of 13.5 MMT. The Refinery operated at more than 100% capacity from second quarter of the FY 2012-13 onwards. Refinery complexity of 11.8 allowed the processing of 86% heavy and ultra-heavy crude (72% in FY 2011-12). Additionally, the product slate improved with 83% of light and middle distillates produced (71% in FY 2011-12).
Crude diet fully geared towards ultra-heavy crude (60% plus) and product towards light and middle distillates (85%) with capability to produce Euro IV and V grade products.
Majority of heavy and ultra-heavy crudes were tied-up under term sourcing agreements. Long-term MOUs/Agreements with PSUs were also in place for off-take of petro products.
Management Discussion and Analysis

Annual Report 2012-1326
New Sulphur Recovery Unit at Vadinar
SUPERIOR REFINING CAPABILITIES
14
12
10
8
6
4
20
Exx
on M
obil
Vale
ro
Rel
ianc
e
Che
vron
Tex
aco
Ess
ar O
il
Citg
o
BP
She
ll
Mar
atho
n
Con
oco-
Phi
lips
BO
RL
Bin
a
HM
EL
Bha
tind
a
Pre
mco
r
Sun
oco
Teso
ro
HP
CL
S-O
il
Fuji
Oil
JX G
roup
Form
osa
IOC
L
Pet
ro C
hina
Pet
rona
s
Sin
opec
GS
Cal
tex
BP
CL
SK
Ene
rgy
Hyu
ndai
Oil
Ban
l
MR
PL
Sin
gap
ore
Idem
itsu
PT
Per
tam
ina
Thai
Oil
Cos
mo
oil
CP
C C
orp
CN
PC
CN
OO
C
Nel
son
Co
mp
lexi
ty
Source: Industry
Coal-based captive power plant was successfully commissioned in phases and is now fully operational. This plant is expected to provide a minimum saving of USD 1/bbl compared to using plant fuelled by gas or fuel oil.
Expanded crude basket with the introduction of 11 new crudes in process as a part of continuous optimisation.
Processed more than 36 varieties of crude during the year including ultra-heavy and tough crudes.
Achieved 1,825 LTI Free Days and 1,410 days without major fire incident as of March 31, 2013, highlighting safe operating practices.
The Essar Oil’s Vadinar Refinery is amongst the global top quartile on the complexity scale (which measures the value-additive quantum of a Refinery’s secondary processing units).
27

CO
MP
AN
Y O
VE
RV
IEW
MA
NA
GE
ME
NT
DIS
CU
SS
ION
AN
D A
NA
LYS
ISS
US
TAIN
AB
ILITY
GO
VE
RN
AN
CE
FIN
AN
CIA
LS
Quality PledgeThe Refinery at Vadinar, Gujarat is equipped with a state-of-the art laboratory. The credentials of the laboratory include assessment and monitoring of quality of crude oil and the entire process chain. The laboratory is benchmarked with American Society for Testing and Materials (ASTM) and Euro grades. Being a fellow member of ASTM, it participated in the International Proficiency Testing Programmes to enhance its knowledge capital on production of optimum quality of gasoline and gasoil.
The laboratory conducts extensive evaluation of crude through its True Boiling Unit (TBP). The capability of TBP was vindicated by evaluating 46 grades of crude, most of which were potentially being tested for the very first time. The TBP ensured arriving at a qualitative product with minimum possible cost.
The R&D team has resolved to upkeep with changing times. It successfully commissioned analysers which are required to study crude oil fouling. In addition, the R&D is actively engaged in multiple studies which are required for new product development, improvement in quality and trouble shooting.
32Average API density of crude in FY 2011-12
27Average API density of crude in FY 2012-13
71%Total output of light & middle distillates of total refining process in FY 2011-12
83%Total output of light & middle distillates of total refining process in FY 2012-13
13.5 MMT Crude processed in FY 2011-12
19.8 MMT Crude processed in FY 2012-13
72%Capability to process tough/heavy crude in FY 2011-12
86%Capability to process tough/heavy crude in FY 2012-13
Progress – uninterrupted
Quality
ASTMs
Standard
Euro Grades
TBP Unit
R&D
Team
Hallmark of quality
Management Discussion and Analysis

Annual Report 2012-1328
Sales and MarketingDuring the year, Essar Oil sold 12.7 MMT of products in the domestic market with a growth of more than 60% compared to FY 2011-12. This represented 67% of its total sales, with exports contributing 33%. The Company maintained its domestic share of sales at a high level, in spite of the
increase in production as well as the general increase in Indian refinery production. Retail volumes increased post complete deregulation of Gasoline. Additionally, Bulk Gasoil deregulation and phased deregulation of retail Gasoil is expected to further improve volumes and profitability.
Essar Oil Retail Outlet
GASOLINE BLENDING OPTIMISATION
Post implementation of Train-1 Refinery operations, gasoline production increased
significantly with increased number of gasoline grades and subsequent component streams. This increased the
criticality of gasoline blending operation in order to avoid quality giveaway and minimise tank corrections.
In line with the change, the Company successfully commissioned the gasoline online blending optimisation system at Refinery for production of multiple grades of gasoline to meet the pre-set specifications at all times. This ensured reduction in quality which minimised batch preparation time and maximised tank utilisation.
Oil Trivia
Gasoline is also known as Petrol / Motor Spirit, is typically a mixture of fractions of petroleum composed of hydrocarbons. Major components of the Gasoline Blending optimisation system are blend headers with required field instruments, state of the art Online Analysers and Blending Optimisation system.
29

CO
MP
AN
Y O
VE
RV
IEW
MA
NA
GE
ME
NT
DIS
CU
SS
ION
AN
D A
NA
LYS
ISS
US
TAIN
AB
ILITY
GO
VE
RN
AN
CE
FIN
AN
CIA
LS
Product sales portfolio (Domestic)
Particulars (in KTPA) FY 2010-11 FY 2011-12 FY 2012-13
LPG 596 576 819MS 851 828 933ATF/ Kerosene 706 630 589HSD 5,344 4,777 7,818FO 761 540 336Bitumen 456 261 195Petcoke - - 1683Sulphur 81 80 210Sub-total 8,795 7,692 12,583
Distribution of Domestic sale
Particulars (in KTPA) FY 2010-11 % FY 2011-12 % FY 2012-13 %
PSU 7,289 80.47 6802 87.09 10,112 79.59Direct Customers & Traders 1,212 13.38 843 10.86 2,439 19.20Retail 557 6.15 128 1.65 154 1.21Total 9,058 7,773 12,705
Review of SalesPublic sector oil marketing companies (PSUs) continue to be Essar Oil’s major customers. Sales to these companies constituted close to 80% of Essar Oil’s entire domestic sales or 10.1 MMT. The Company signed product purchase and sale agreements with Indian Oil Corporation Ltd. (IOCL) and Bharat Petroleum Corporation Ltd. (BPCL). A similar
agreement is to be signed with Hindustan Petroleum Corporation Ltd. shortly.
Essar Oil supplies to a number of industrial segments, such as cement factories, power plants, chemical industries, fertiliser plants and construction companies among others. During the year, the Company added petcoke as a new product to its portfolio. The Company finalised agreements with large cement consumers, to ensure sale of product from first day of production. In line with these agreements, Essar Oil has set up logistics to move the product by road, rail and coastal shipping.
Essar Oil’s potential to maximise refinery realisation has been
on account of its endeavour to increase the capacity and complexity of its Refinery. As a result, the crude diet has changed and so has the sulphur production. Sulphur production has almost tripled compared to last year, and most of the production has been sold in the domestic market.
Essar Oil has the largest number of active retail outlets amongst private players with an extensive network of around 1,400 commissioned retail fuel outlets across the country as on March 31, 2013. The Company’s retail sales stood at 154 TMT, a growth of 14% over FY 2011-12. Agreements with various public sector OMCs to supply to its retail network from
Essar Oil has the largest number of active retail outlets amongst private players.
Management Discussion and Analysis

Annual Report 2012-1330
their refineries and depots has helped the Company to ensure uninterrupted product supplies to its retail network across the country.
Essar Oil has taken a multi-fuel approach and has established tie-ups with all major CNG and auto-LPG players in the country.
As of end March 2013, the Company has 25 retail outlets offering Compressed Natural Gas (CNG) and 5 offering Auto LPG (ALPG). Among the total, 12 CNG outlets and one ALPG outlet were commissioned in FY 2012-13. On this front, strategic tie-up with leading gas marketing companies
1,400 Retail Outlets can ramp up quickly in case of Gasoil deregulation
43
6011
70
37 70
74
35
27 26
40
11
26
16
3
13
5
3 4
2
4
215103
103195
159
like Indraprastha Gas and Mahanagar Gas among others, helped secure gas supplies to outlets.
Outlook
The road ahead is filled with challenges and optimism. The growth rate of petroleum products consumption has moderated in India, which, along with surplus refining capacity is expected to exert pressure on the domestic evacuation. However, reasonable certainty in retail gasoil price deregulation will provide a level playing field for private fuel retailers. Petcoke demand is expected to be robust due to strong coal demand and the increasing acceptability of petcoke as a coal substitute by various customer segments. Additionally, plans to add non-fuel retail focused on the western and southern markets are also on the anvil.
Retail gasoil price deregulation will provide a level playing field for private fuel retailers.
31
CO
MP
AN
Y O
VE
RV
IEW
MA
NA
GE
ME
NT
DIS
CU
SS
ION
AN
D A
NA
LYS
ISS
US
TAIN
AB
ILITY
GO
VE
RN
AN
CE
FIN
AN
CIA
LS
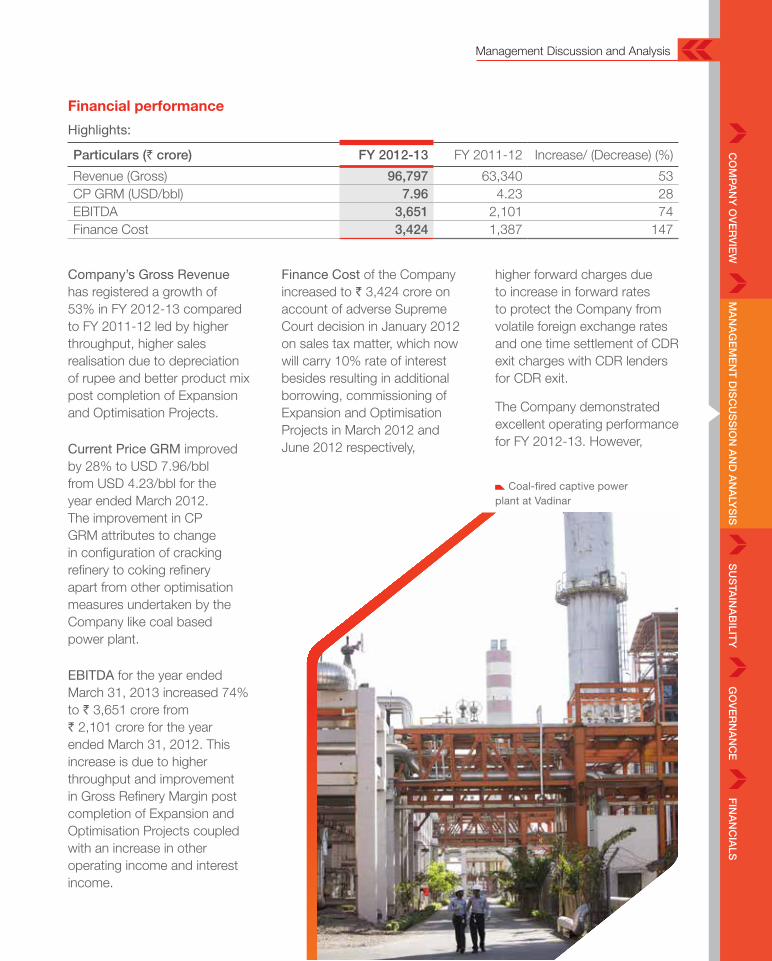
Financial performance
Highlights:
Particulars (` crore) FY 2012-13 FY 2011-12 Increase/ (Decrease) (%)
Revenue (Gross) 96,797 63,340 53CP GRM (USD/bbl) 7.96 4.23 28EBITDA 3,651 2,101 74Finance Cost 3,424 1,387 147
Company’s Gross Revenue has registered a growth of 53% in FY 2012-13 compared to FY 2011-12 led by higher throughput, higher sales realisation due to depreciation of rupee and better product mix post completion of Expansion and Optimisation Projects.
Current Price GRM improved by 28% to USD 7.96/bbl from USD 4.23/bbl for the year ended March 2012. The improvement in CP GRM attributes to change in configuration of cracking refinery to coking refinery apart from other optimisation measures undertaken by the Company like coal based power plant.
EBITDA for the year ended March 31, 2013 increased 74% to ` 3,651 crore from ` 2,101 crore for the year ended March 31, 2012. This increase is due to higher throughput and improvement in Gross Refinery Margin post completion of Expansion and Optimisation Projects coupled with an increase in other operating income and interest income.
Finance Cost of the Company increased to ` 3,424 crore on account of adverse Supreme Court decision in January 2012 on sales tax matter, which now will carry 10% rate of interest besides resulting in additional borrowing, commissioning of Expansion and Optimisation Projects in March 2012 and June 2012 respectively,
higher forward charges due to increase in forward rates to protect the Company from volatile foreign exchange rates and one time settlement of CDR exit charges with CDR lenders for CDR exit.
The Company demonstrated excellent operating performance for FY 2012-13. However,
Management Discussion and Analysis
Coal-fired captive power plant at Vadinar

Annual Report 2012-1332
the interest and finance cost increased sharply, impacting EBITDA. The Company has initiated various steps to reduce its cost of debt and improve its financial health.
Corporate Debt Restructuring (CDR) Exit:
In March 2013, the Company completed the process of exiting the CDR mechanism which was implemented in December 2004 to help the completion of the Vadinar Refinery in Gujarat. The CDR loan facilities have been replaced with new debt facilities of about ` 9,100 crore on
The CDR exit has provided the Company greater operational and financial flexibility for converting rupee debt into dollar debt.
Amine Regeneration Unit (ARU) at Vadinar
the rupee debt incurred for capital expenditure. Under this route, the Company has received an approval from RBI to raise ECBs to the extent of USD 2.27 billion to replace its rupee debt with lower cost US dollar loans. Almost entire revenues of the Company are in United States dollar terms / linked to United States dollars. Therefore, the Company has a natural hedge for debt servicing in respect of USD borrowings. USD borrowings are cheaper than the rupee borrowings. The Company is making all out efforts to raise USD borrowings to refinance the expensive rupee debt with lower cost USD loans. This will lower the interest cost, improve cash flows and profitability. The Company has already refinanced ` 2,611 crore of rupee loan into equivalent foreign currency debt of USD 481 million through the use of ECBs and by swapping rupee loans into USD by March 31, 2013.
Improvement in Credit Rating:
The Company is no longer a restructured asset and in
revised commercial terms from a similar group of lenders. The CDR exit has provided the Company greater operational and financial flexibility for converting rupee debt into dollar debt. Additionally, it paves the way for participation of foreign lenders in term debt /WC facilities which will reduce overall cost of debt.
Dollarisation of Debt:
The Reserve Bank of India (RBI) has opened a window allowing companies with export earnings to raise External Commercial Borrowings (ECB) funds and use the proceeds to prepay
` 2,611 croreRefinanced into foreign currency debt
33
CO
MP
AN
Y O
VE
RV
IEW
MA
NA
GE
ME
NT
DIS
CU
SS
ION
AN
D A
NA
LYS
ISS
US
TAIN
AB
ILITY
GO
VE
RN
AN
CE
FIN
AN
CIA
LS
its new avatar, it will have more operational flexibility, speedy approval mechanism and access to cheaper USD funds leading to better profits. With positives like removal of CDR tag, completion of the Expansion and Optimisation Project, the Company’s credit rating for raising term loan facilities has been upgraded by two notches to BBB+ from BBB- by CARE. Similarly, Fitch has assigned BBB+ credit rating to the Company based on its operational and financial strength post completion of its Expansion Projects. Improvement in the Credit Rating will open multiple sources through which the Company can access to funding at competitive rates.
Taxation:
The Company has installed and commenced production of various new Refinery units in last financial year ended March 31, 2012, which are working seamlessly with its existing Refinery. New Refinery units are eligible for 100% tax deduction of the profits for a period of seven consecutive Assessment Years including initial Assessment Year u/s 80IB(9) of the Income Tax Act. The Company will accordingly claim these benefits in its Income Tax assessments.
The Company has not recognised Deferred Tax
Asset (net) to the tune of approximately ` 1,900 crore on Unabsorbed Depreciation & Carried Forward Losses in its books of Account in view of the concept of “Virtual certainty supported by convincing evidence” as required under Accounting Standard 22 – Accounting for taxes on Income. The Company has created Deferred Tax Assets only to the extent of Deferred Tax Liability.
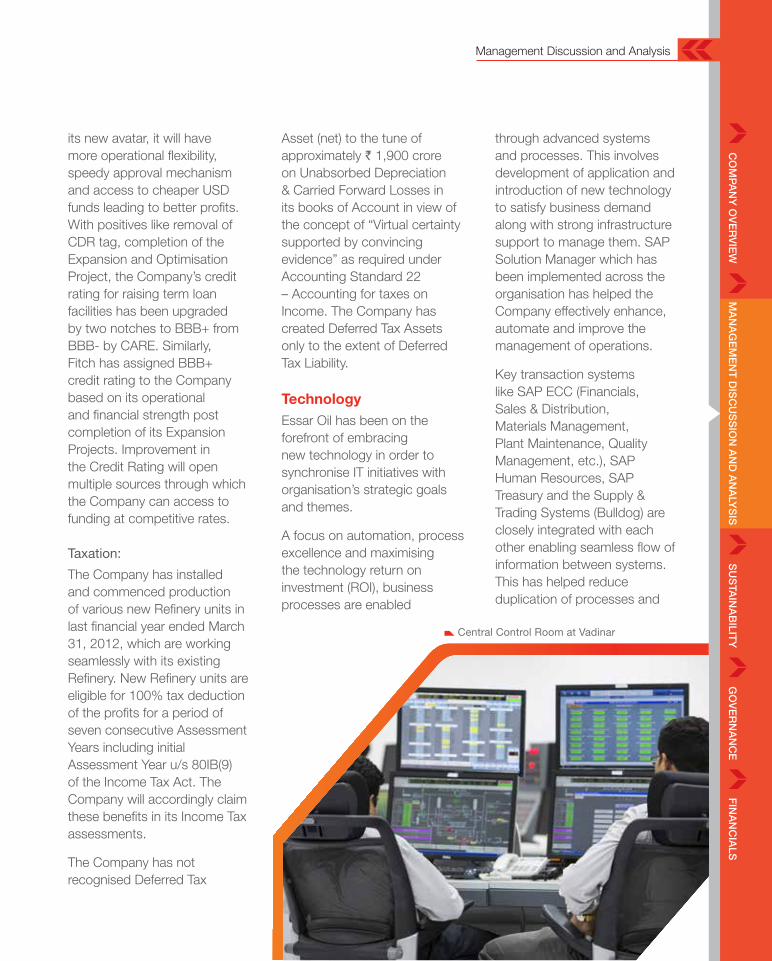
TechnologyEssar Oil has been on the forefront of embracing new technology in order to synchronise IT initiatives with organisation’s strategic goals and themes.
A focus on automation, process excellence and maximising the technology return on investment (ROI), business processes are enabled
through advanced systems and processes. This involves development of application and introduction of new technology to satisfy business demand along with strong infrastructure support to manage them. SAP Solution Manager which has been implemented across the organisation has helped the Company effectively enhance, automate and improve the management of operations.
Key transaction systems like SAP ECC (Financials, Sales & Distribution, Materials Management, Plant Maintenance, Quality Management, etc.), SAP Human Resources, SAP Treasury and the Supply & Trading Systems (Bulldog) are closely integrated with each other enabling seamless flow of information between systems. This has helped reduce duplication of processes and
Central Control Room at Vadinar
Management Discussion and Analysis

Annual Report 2012-1334
most importantly, promoting greater co-operation between departments. Applications like Weighbridges, Terminal Automation, Trade Capture, Payment and Indent Management System are also integrated with the SAP System.
Considering safety is a key feature of Essar Oil’s culture, a Work Clearance Management System has been implemented within ERP, catering various types of work permit needs with enhanced flow and traceability in future.
During the year under review, the Company management envisaged a Green Mission of paperless office. A green step
Coal-fired captive power plant Control Room at Vadinar
Seamless data integration across systems and workflow through EPS/IST allows the Company to keep pace with constantly changing scenarios.
was taken by implementing a tool called ‘Boardbooks’, which seamlessly works on traditional computing devices as well as new age tablets. This has helped the Company conduct its Board and its Sub Committees Meetings and other executive level meetings eliminating use of paper.
Seamless data integration across systems and workflow through EPS/IST allows the Company to keep pace with constantly changing scenarios. A couple of ‘What-If scenarios’ modules have been adopted to cut across available systems allowing the Company to evaluate and consolidate its position.
Email and mobile-based alerts have been adopted for Manufacturing Execution Systems in order to minimise failures and maintain a safe operating environment. Process Information Centre is enhanced for effective monitoring of critical operation parameters to leverage maximum plant capability. Laboratory Information Management System is enhanced with direct interface of Instruments; this is providing accurate data visibility and error free transactions. Integration of Laboratory Information Management Systems with Manufacturing Execution Systems and Process Information Centre is helping the business to meet market demand and tight quality targets.
35

CO
MP
AN
Y O
VE
RV
IEW
MA
NA
GE
ME
NT
DIS
CU
SS
ION
AN
D A
NA
LYS
ISS
US
TAIN
AB
ILITY
GO
VE
RN
AN
CE
FIN
AN
CIA
LS
The internal control system includes a well defined delegation of authority and a comprehensive Management Information System.
Lab unit at Vadinar
All Essar Oil locations are secured with Access Control System and CCTV cameras safeguarding the premises with strong integrated infrastructure acting as a backbone to enhance surveillance capabilities.
Internal Control SystemsThe Company maintains adequate internal control system and procedures commensurate with its size and nature of operations. The internal control systems are designed to provide a reasonable assurance over reliability in financial reporting, ensure appropriate authorisation of transactions, safe guarding the assets of the Company and prevent misuse/losses and legal compliances.
The internal control system includes a well defined delegation of authority and a comprehensive Management Information System coupled with monthly reviews of
operational and financial performance, a well structured budgeting process with regular monitoring of expenses, a state of art ERP systems and Internal audit.
The internal audit team is led by well experienced and seasoned professionals and supported by both financial and technical personnel drawn from across the organisation. The internal audit is conducted as per a plan drawn at the beginning of the year in consultation with the management and statutory auditors of the Company which is finally approved by the Audit and Governance Committee. The audit plan attempts to cover all significant risk areas, review and evaluation of the effectiveness of existing processes, controls and compliances and ensure adherence to policies and procedures. In addition, the internal auditors of the parent company Essar Energy plc also conducts audit of the
Company. All the significant audit observations made by the internal auditors of the Company and its parent company (Essar Energy plc) are regularly reviewed by a Management Audit Committee chaired by the Managing Director & Chief Executive Officer of the Company to ensure all issues are properly addressed. All significant audit observations along with the management responses/replies and follow up actions are periodically placed before the Audit & Governance Committee.
Management Discussion and Analysis

Annual Report 2012-1336
On the IT (Information Technology) side, various components of the overall IT landscape undergoes audit every year to strengthen internal controls and improve the IT processes. During the year, the Company reviewed the security and robustness parameters of its IT systems and communication network with the help of an independent external agency. The findings are being worked upon rigorously.
The Company have further embarked on the journey of putting in place a strong Governance, Risk & Compliance (GRC) tool which will help it to systematically monitor and manage authorisation-related risks in an organised approach.
Essar Oil is also working with key software vendors to strengthen its systems by implementing global best practises to improve functionalities, security and control facets of these applications.
SWOT Analysis
Strengths
20 MMTPA world-scale Refinery with a complexity of 11.8: one of the most complex refineries in the World. Capable of producing a high proportion of high-margin middle (60%) and light distillates (25%) meeting stringent Euro III/IV/V norms despite processing a high proportion of heavy and ultra-heavy crudes.
Strategically located on the west coast of India with proximity to the Middle East, the largest crude oil source in the world, resulting in lower crude freight costs: catering the demand of growing Indian domestic market and supply to global markets due to a presence in the major maritime route from the Middle East to the Far East
Supply security of ultra-heavy crudes through long-term supply agreements
Coal- based power plant to save liquid fuel and gas costs resulting in overall reduction of fuel cost by more than USD 1 per barrel.
Strong, captive infrastructure like port / jetty, power plants in proximity.
Large proportion of operating costs under control through long-term contracts.
Strong senior management team: each member has industry experience of about 30 years in leading oil and gas companies.
Challenges
Higher level of debt due to adverse sales tax ruling and historical backlog of CDR period interest impacting capability to take up future growth projects.
Higher interest cost due to very high proportion of Indian Rupee Debt affecting profitability.
Historically regulated oil and gas retail sector: only PSUs are compensated through subsidies for selling products below market prices.
Exposure to geo-political risks for crude sourcing due to lack of equity crude.
Rail Gantry at Vadinar
37

CO
MP
AN
Y O
VE
RV
IEW
MA
NA
GE
ME
NT
DIS
CU
SS
ION
AN
D A
NA
LYS
ISS
US
TAIN
AB
ILITY
GO
VE
RN
AN
CE
FIN
AN
CIA
LS
Export of treated Vacuum Gas Oil (VGO), an intermediate product, impacting ability to capture full margins.
Opportunities
Further optimisation of Refinery operations through implementation of a second Hydrogen Manufacturing unit. Project for the conversion of VGO into high-margin middle distillates and other quick payback margin booster schemes. Land, environment clearance and other supporting infrastructure readily available for future high growth projects.
Accelerate the development of CBM Raniganj and other blocks with clarity of pricing structure from Government effective from April 2014.
RBI approval in place for conversion of high cost rupee debt into foreign currency debt / ECBs with extended
maturity and full protection from depreciation of rupee due to dollarised income and GRMs.
De-regulation of retail sector to create level playing field for private refiners.
Threats
Weakness in Global Oil Product Demand, mainly in developed markets.
Global / Domestic Economic Growth may not materialise as per expectation net additional capacity of refineries in global market higher than that of incremental demand, if all the proposed projects are commissioned as per schedule.
Geo-political unrest in the Middle East and Africa.
Delay in refinancing of existing rupee loans by ECBs.
Shifting of product pricing policy from Trade Parity Pricing to Export Parity Pricing for Gasoil, LPG and Kerosene for products sold to PSU oil marketing companies.
Delay in Retail diesel price deregulation due to steep
depreciation in Indian Rupee vs. USD.
Addition of complex refining capacities to impact the availability of tough and heavy crudes.
Intellectual CapitalThe Company has 1,689 employees including advisors as on March 31, 2013. The Company’s priorities last year included employee retention, succession planning and nurturing and growing internal talent. Various employee engagement initiatives, coupled with an enhanced focus on individual training needs in alignment with the business objectives and a need-based compensation policy, helped the Company to meet objectives.
Last year, the Company introduced Balance Scorecard (BSC) methodology in its HR function. Moving forward, the performance related variable pay of the employees was linked this year with the Business objectives and each individual executive’s performance in the form of
The Company has 1,689 employees including advisors as on March 31, 2013.
Management Discussion and Analysis

Annual Report 2012-1338
an enhanced BSC-linked Incentive Plan to ensure that all individuals are aligned completely with the Company’s business goals and are achieved together as a team. Special incentives were designed and implemented to exemplify high performance and to incentivise achievement of important milestones.
ideas. All business feasible ideas are being implemented which is envisaged to lead to not only process improvements but also substantial value generation.
At Essar Oil the philosophy of continuous learning is reinforced frequently. Initiatives such as ‘Career Desk’ for career discussions, cross-functional learning opportunities such as Refinery Value Chain and Strategic Business Simulation were introduced.
As an organisation, Essar Oil places utmost importance in engaging with employees and their families beyond work. This is done by sharing business updates with employees through various interactive forums like Town halls, Sampark, or celebrating with families the various Indian festivals, conducting Sports events and cultural programmes.
During the year, the Company was recertified to ISO 9001:2008 for HR processes by United Kingdom Accreditation Service and received Greentech Award for Best HR Strategy.
Continuing with a focus on promoting innovative practices, this year, an organisation-wide competition, “Innovation Quest”, was launched by the Managing Director & CEO himself to galvanise all individuals across the organisation to take-on 6 business challenges. Employees participated in this quest with great zeal with 412
Cautionary StatementCertain words and statements in this Management Discussion and Analysis are forward looking based on numerous assumptions regarding the Company’s present and future business strategies and the environment in which the Company will operate in the future. The important factors that could cause actual results, performance or achievements to differ materially from such forward-looking statements include, among others, changes in demand and supply, government policies or regulations, political and economic development within and outside India and, in particular, changes relating to the administration of oil and gas industry.
Oil Tankages at Vadinar
39

CO
MP
AN
Y O
VE
RV
IEW
MA
NA
GE
ME
NT
DIS
CU
SS
ION
AN
D A
NA
LYS
ISS
US
TAIN
AB
ILITY
GO
VE
RN
AN
CE
FIN
AN
CIA
LSManagement Discussion and Analysis
Routine inspection at the Reverse Osmosis (RO) unit at Raniganj
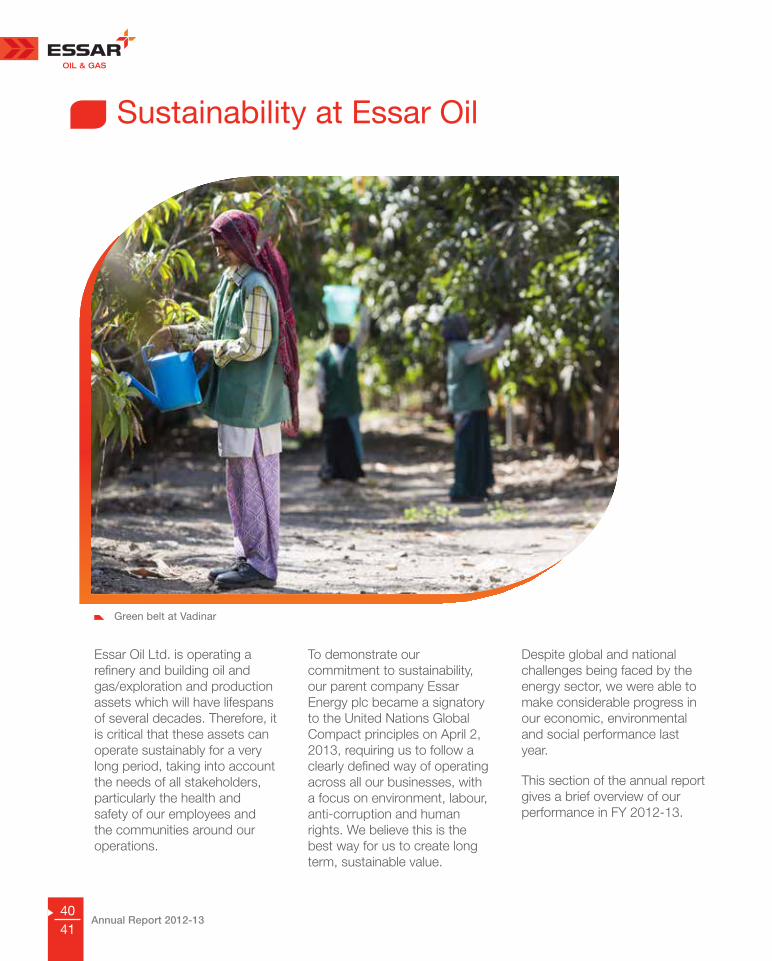
Annual Report 2012-1340
Sustainability at Essar Oil
Essar Oil Ltd. is operating a refinery and building oil and gas/exploration and production assets which will have lifespans of several decades. Therefore, it is critical that these assets can operate sustainably for a very long period, taking into account the needs of all stakeholders, particularly the health and safety of our employees and the communities around our operations.
To demonstrate our commitment to sustainability, our parent company Essar Energy plc became a signatory to the United Nations Global Compact principles on April 2, 2013, requiring us to follow a clearly defined way of operating across all our businesses, with a focus on environment, labour, anti-corruption and human rights. We believe this is the best way for us to create long term, sustainable value.
Despite global and national challenges being faced by the energy sector, we were able to make considerable progress in our economic, environmental and social performance last year.
This section of the annual report gives a brief overview of our performance in FY 2012-13.
Green belt at Vadinar
41

CO
MP
AN
Y O
VE
RV
IEW
MA
NA
GE
ME
NT
DIS
CU
SS
ION
AN
D A
NA
LYS
ISS
US
TAIN
AB
ILITY
GO
VE
RN
AN
CE
FIN
AN
CIA
LS
Sustainability Performance Highlights
Social Increase in the number of employees trained in health and safety by 124% at Vadinar refinery and
123% at CBM project, Raniganj
326% increase in number of contractors trained in health and safety at CBM project, Raniganj
Zero occupational disease rate achieved at all sites
Over 25,200 beneficiaries of our healthcare initiatives undertaken at Vadinar and CBM Project, Raniganj
Over 29,000 beneficiaries of our community care initiatives undertaken at Vadinar and CBM Project, Raniganj
Over 16,200 beneficiaries of our educational initiatives undertaken at Vadinar and CBM Project, Raniganj
1,517 employees trained in the UK Bribery Act
Environment For the second successive year, Essar Oil was ranked the highest scorer in the energy sector by the
Carbon Disclosure Project, India
189% increase in energy saved at Vadinar refinery
15% reduction in hazardous waste generation at Vadinar refinery
Our PeopleEssar Oil operates within a framework of HR policies, practices and regulations appropriate to our operations in India. We maintain policies relating to labour aspects which highlight our commitment to being an employee friendly organisation. There are HR processes in place for recruitment and selection of personnel at all levels; policies in place for induction, performance management, business practices learning and development, retirement and separation.
a - personnel directly hired through the company on a fixed term contract basis for a period ranging one and three years for certain projects
b - includes contractors and sub-contractors hired for specific jobs at sites
c - employee analysis includes permanent employees only for Refining and Marketing, India and permanent and fixed term contract employees for E&P business
n/c - not calculated
FY 2010-11 FY 2011-12 FY 2012-13
Total workforce by type
Employees 1658 1664 1659
Fixed term contracta 23 33 30
Third party contractb 2595 2942 2244
% women employeesc 6.64 6.91 6.63
Average hours of training per employeec
n/c 24.3 31.3
Number of employees appraisedc
n/c 1710 1638

Annual Report 2012-1342
Health and SafetyManaging the health and safety of the people who work for us, both directly and indirectly, continued to be our top priority. The focus at most of our sites last year was to enhance safety culture, contractor safety management, risk assessment and training. Although our overall safety performance was good and Vadinar refinery won external recognition for their safety efforts, there were also key learnings from the incidents that occurred at our sites which we will use to further improve our safety processes.
ESSAR OIL: THE INNOVATION
QUEST
With the never ending process of innovation being
instilled in the DNA of the organisation and our people being our
most important asset, an organisation wide competition was launched to harness untapped potential. With the theme “One Idea can change the World and it could be yours”, innovative solutions to six key business challenges were sought.
The competition generated a lot of enthusiasm and 412 ideas were registered, of which 97 were short listed for extensive evaluation. Mentors were introduced at this stage and provided support, created awareness and helped to refine the ideas. Subsequently, 22 finalists were chosen and made presentations to Mr. L K Gupta, MD & CEO, who reviewed these ideas for their true potential on the basis of parameters such as benefits to the organisation, feasibility of implementation, ease of adoption and resources required for implementation. 11 winning ideas were chosen and were awarded prizes.
Central Control Room at Vadinar
43

CO
MP
AN
Y O
VE
RV
IEW
MA
NA
GE
ME
NT
DIS
CU
SS
ION
AN
D A
NA
LYS
ISS
US
TAIN
AB
ILITY
GO
VE
RN
AN
CE
FIN
AN
CIA
LS
ESSAR OIL: EXIT INTERVIEWSAt Essar Oil, our personal exit interviews have become a great tool to understand the reasons for an employee leaving and this information can be used to avoid future employee losses.
Employee exit interviews at Essar Oil focus on retention by identifying the reason the employee is leaving and also determines whether the company’s level of performance or the employee’s unfulfilled expectations are an issue. We are well aware that employment environment can either delight or fail.
At Essar Oil, the exit interview process is triggered within 48 hours of receiving information that an employee is departing. A human resource manager engages in discussions with the employee to identify reasons for the decision to exit. If appropriate, all efforts are made to retain the employee. A three member task force comprising of the human resource manager, compensation and benefits manager and talent acquisition manager work together on creating a retention strategy. In the event the employee decides to reconsider his decision, necessary actions both financial and non-financial are taken to retain the employee.
In the event that the employee maintains his decision to exit despite efforts made, necessary actions are taken to ensure a smooth exit. Employee exit interviews provide a window to view and benchmark employee expectations regarding job responsibilities and performance, working conditions, opportunities for skill development, career advancement, supervision and management, work satisfaction, compensation and benefits , organisational culture, organisational and work group communication.
Employees can also provide us with market information on why they chose a new employer. The reasons could be, for example, better prospects, better compensation or a posting closer to home. This information helps us take necessary decisions to align our processes and systems with employee expectations.
In September 2012, we conducted post exit interviews with 20 employees in the middle and senior management cadre. Accordingly, information gathered during the exit interview provides valuable insights and feedback and helps us to benchmark our organisation against others.
Having achieved a zero occupational disease rate since commissioning of its first plant in 2006, the Vadinar refinery is committed to achieving excellence in occupational health management.
EnvironmentAs a respected and responsible oil and gas company, Essar
Oil recognises its obligations with regard to climate change mitigation and adaptation. Our approach towards climate change mitigation and adaptation continues to aim at providing clean solutions to our customers and reducing our carbon footprint by adopting the latest technology and energy conservation measures.
Sustainability at Essar Oil
We continue to report our carbon performance at Carbon Disclosure Project (CDP) level. For the second successive year, Essar Oil was ranked the highest scorer in the Energy sector by the Carbon Disclosure Project, India. In terms of the Carbon Disclosure Leadership Index (CDLI), Essar Oil achieved a score of 72 out
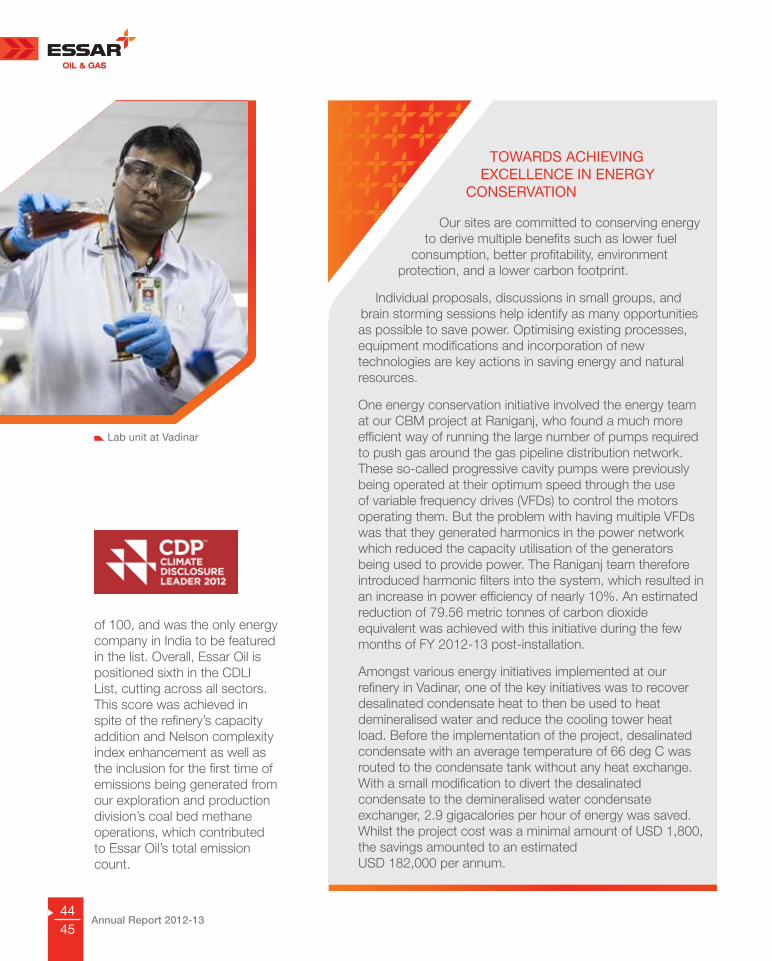
Annual Report 2012-1344
TOWARDS ACHIEVING EXCELLENCE IN ENERGY
CONSERVATION
Our sites are committed to conserving energy to derive multiple benefits such as lower fuel
consumption, better profitability, environment protection, and a lower carbon footprint.
Individual proposals, discussions in small groups, and brain storming sessions help identify as many opportunities as possible to save power. Optimising existing processes, equipment modifications and incorporation of new technologies are key actions in saving energy and natural resources.
One energy conservation initiative involved the energy team at our CBM project at Raniganj, who found a much more efficient way of running the large number of pumps required to push gas around the gas pipeline distribution network. These so-called progressive cavity pumps were previously being operated at their optimum speed through the use of variable frequency drives (VFDs) to control the motors operating them. But the problem with having multiple VFDs was that they generated harmonics in the power network which reduced the capacity utilisation of the generators being used to provide power. The Raniganj team therefore introduced harmonic filters into the system, which resulted in an increase in power efficiency of nearly 10%. An estimated reduction of 79.56 metric tonnes of carbon dioxide equivalent was achieved with this initiative during the few months of FY 2012-13 post-installation.
Amongst various energy initiatives implemented at our refinery in Vadinar, one of the key initiatives was to recover desalinated condensate heat to then be used to heat demineralised water and reduce the cooling tower heat load. Before the implementation of the project, desalinated condensate with an average temperature of 66 deg C was routed to the condensate tank without any heat exchange. With a small modification to divert the desalinated condensate to the demineralised water condensate exchanger, 2.9 gigacalories per hour of energy was saved. Whilst the project cost was a minimal amount of USD 1,800, the savings amounted to an estimated USD 182,000 per annum.
Lab unit at Vadinar
of 100, and was the only energy company in India to be featured in the list. Overall, Essar Oil is positioned sixth in the CDLI List, cutting across all sectors. This score was achieved in spite of the refinery’s capacity addition and Nelson complexity index enhancement as well as the inclusion for the first time of emissions being generated from our exploration and production division’s coal bed methane operations, which contributed to Essar Oil’s total emission count.
45

CO
MP
AN
Y O
VE
RV
IEW
MA
NA
GE
ME
NT
DIS
CU
SS
ION
AN
D A
NA
LYS
ISS
US
TAIN
AB
ILITY
GO
VE
RN
AN
CE
FIN
AN
CIA
LS
Product ResponsibilityAs an ISO 9001certified organisation, we deploy stringent measures to ensure the quality of our products. The quality control assessment starts from the raw material stage when crude oil is unloaded through crude and product process streams and right through to product ship loading.
Our refinery at Vadinar has a fully equipped laboratory to certify the refinery’s range of products, for example; LPG, kerosene, aviation turbine fuel/jet fuel, gasoline, diesel, furnace oil, bitumen, petcoke and vacuum gasoil. The facilities have been upgraded and new infrastructure built to house additional equipment with the completion of the refinery expansion. We also have a dedicated jet fuel testing laboratory approved by the Directorate General of Aeronautical Quality Assurance (DGAQA). The laboratory has
been designed to cater to the jet fuel demands complying to BIS and DEF STAN 91. In addition, the lab has a true boiling point (TBP) unit to predict the crude’s characteristics before it is processed.
As a part of the reliability and competency assessment of our laboratory, the refinery has been participating in the International Proficiency Testing Programs conducted by the ASTM standards body for various products and the gasoline and diesel fuel engine correlation scheme conducted by the Energy Institute. This participation has ensured our confidence in certifying the products before releasing to our customers.
On the marketing front, we continued to develop strategic alliances with alternative fuel and non-fuel retail products to offer a more congenial and mutually-beneficial business environment to our retail outlet franchisees. Currently Essar Oil has existing tie-ups with around 23 brands across segments including lubricants, agro products, banking and financial services, and food and beverages.
CommunityThe community engagement projects at our locations at Vadinar and CBM Project, Raniganj are undertaken through the Essar Group Foundation, which is a registered not for profit organisation under the Indian Trust Act, 1882. The engagement model is designed to deliver maximum value to
Potable water being supplied to villages around Vadinar
Assessing the social structure and understanding the socio-economic and political dynamics
Identifying and implementing projects in line with business goals and government programmes
Third-party assessment to evaluate the positive impact of our community projects
Sustainability at Essar Oil
the community in line with the Foundation’s philosophy.
The Essar Foundation at the beginning of each year draws up a plan of activities in consultation with our sites, local government authorities and the community to ensure that the projects undertaken during the year have maximum positive impact on the community.
Our mission towards socio-economic improvement of neighbourhood communities is an investment for the future and follows an equally dedicated and in-depth execution approach which is as follows:
Last year several activities were undertaken in the area of education, health and community care. The Foundation also celebrated local and international events to promote social causes.

Annual Report 2012-1346
VADINAR: A FIGHT AGAINST MALNOURISHMENT – SHISHU MANGALAM PROJECT
The World Bank estimates that India is ranked 2nd in the world of the number of children suffering from malnutrition. The prevalence of underweight children in India is amongst the highest in the world, with severe consequences for mobility, mortality, productivity and economic growth.
Gujarat has a particularly high proportion of children in this category, with 44.7% of children underweight, 22.3% of the population undernourished and 6.1% of children who die under the age of five from hunger. According to the National Family Health Survey III, 2005-06, every second child under three years age is underweight, and every second adolescent girl is anaemic.
The Essar Foundation, in collaboration with the District Panchayat, Jamnagar, started the Shishu Mangalam project during June 2012 to December 2012 in Khambhaliya, Jamnagar. This area has the highest percentage in India of malnutrition (38%) among children under the age of 5 years. The project strategy was to leverage the existing Integrated Child Development Services (ICDS) structure and focus exclusively on raising the health and nutritional level of malnourished children below six years old and reducing the number of highly malnourished children.
A physical assessment was conducted to identify and grade the nutritional status of children. Health check-ups of children in yellow zones were carried out by medical officers of the primary health centre and those in red zones were carried out by paediatricians. Medical causes were identified and basic treatment as well as referral was ensured. Additionally, a high protein nutrition supplement was provided along with nutrition education.
Post completion of the project, a third party assessment was completed to study the impact and the results showed a significant improvement in the nutritional status of children.
CHANGES IN SEVERELY UNDERNOURISHED CHILDREN COVERED BY THE PROJECT
Particulars June 2012 November 2012
Age Severely undernourished
children
Severely undernourished
children
Moderately undernourished
children
Healthy children Total
Boys Girls Total Boys Girls Total Boys Girls Total Boys Girls Total6-12 months 94 67 161 22 14 36 34 19 53 26 22 48 1371-3 years 228 242 470 79 99 178 88 89 177 36 33 69 4243-6 years 192 199 391 63 73 136 71 72 143 21 15 36 315Total 514 508 1.022 164 186 350 193 180 373 83 70 153 876
(Source: Calculations based on the data compiled by the ICDS from the Shishu Mangalam Health Card)
47

CO
MP
AN
Y O
VE
RV
IEW
MA
NA
GE
ME
NT
DIS
CU
SS
ION
AN
D A
NA
LYS
ISS
US
TAIN
AB
ILITY
GO
VE
RN
AN
CE
FIN
AN
CIA
LS
DURGAPUR - INSTILLING SELF-RELIANCE AMONGST
RURAL GIRLS
Jasmin Kahatun, aged 22, came from a farming family in Akandara village and
was struggling to make ends meet. She had a burning desire to assist the family but lacked
the skills training and confidence to take up a job. Jasmin participated in the Information, Education and Communication campaign, undertook the intensive training that gave her requisite tools and self-confidence to understand the retail and marketing sector and enter the workforce.
Jasmin now earns a salary, along with additional incentives, at one of the biggest store chains in Durgapur. She has overcome many challenges such as lengthy travel to work, long working hours and the bias of being a girl in the family by changing the family’s attitude through self-confidence and aspiration.
Jasmin said, “The opportunity has taught me many things besides making friends in the retail, sales and marketing domain and having a mentor to guide me whenever required. I’m really very thankful to the Essar Foundation for this training programme.”
Over 100 young people, many of whom are girls, have been trained, absorbed as workforce in reputed organisations and now receive a healthy income.
For more detailed information on Essar Oil’s sustainability activities, please refer to our parent company, Essar Energy plc’s second sustainability report – ‘Building a Sustainable Energy Business’, which is available at www.essarenergy.com
Sustainability at Essar Oil

Co
mp
an
y o
ve
rv
iew
ma
na
ge
me
nt
Dis
Cu
ss
ion
an
D a
na
lys
iss
us
tain
ab
ility
go
ve
rn
an
Ce
Fin
an
Cia
ls
annual report 2012-1348
To
the members of essar oil limited
Your Directors have pleasure in presenting the 23rd annual report and audited accounts of the Company for the financial year ended March 31, 2013.
(` in Crore)
particulars 2012-2013 2011-2012
Gross Revenue from Operations
97,067.92 63,427.77
Net Revenue including other income
89,186.90 58,761.39
Earnings before finance cost, depreciation and amortization, exceptional items and tax
3,650.68 2,100.76
Profit / (Loss) before Taxes and Exceptional Items
(1,068.96) (48.02)
Exceptional items (111.48) (1,237.46)
Net Profit / (Loss) after tax
(1,180.44) (1,285.48 )
Add: Balance brought forward from previous year
(4,164.82) (2,879.34)
Balance to be carried to Balance Sheet
(5,345.26) (4,164.82)
operational perFormanCe
The Refinery registered an impressive 46% growth in crude processing at 19.77 million metric tones (MMT) compared to 13.50 MMT during the previous financial year. All the new units completed under Train I expansion project were fully stabilized within two to three months of commissioning and the Optimisation project which took our refining capacity from 18 million metric tones per annum (MMTPA) to 20 MMTPA was also completed four months ahead of schedule in June 2012. The Refinery has operated successfully at the enhanced capacity of 20 MMTPA from July 2012 onwards.
Detailed information on the operational performance for the financial year is given in the Management Discussion and Analysis which is annexed to the Directors’ Report.
FinanCial perFormanCe
During the year, with increase in refining capacity, the Company recorded a strong revenue growth of 53% at ` 97,068 crore up from ` 63,428 crore in the previous financial year. The Current Price Gross Refining Margin (CP GRM) for the refinery business also registered a quantum jump at USD7.96 per barrel compared to USD4.23 per barrel for the previous financial year. The Earning before Interest, Depreciation, Tax and Amortization (EBIDTA) for the current financial year increased by 74% to ` 3,651 crore from ` 2,101 crore for previous financial year. This is mainly on account of increase in the sales volume arising due to expansion of Refining capacity from 10.5 MMTPA to 20 MMTPA, higher gross refining margins, increase in other operating income which is partially offset by MTM provision on commodity hedging. Further in the previous year, even though the income arising out of defeasement of sales tax incentive amounting to ` 778.25 was part of EBITDA, this was reversed and shown as exceptional item. For the financial year ended March 31, 2013, the loss after tax decreased marginally due to higher EBITDA as explained above offset by increase in interest and depreciation expenses post completion of Refinery expansion, which was treated as part of expenditure during construction in the previous year. Exceptional items for the previous year mainly represents reversal of sales tax incentive income post litigation of this matter and provision for impact towards exit from Corporate Debt Restructuring mechanism (CDR exit) whereas in the current year it only represents the additional impact on CDR exit. The Company reported net loss after tax (after exceptional items) for current financial year at ` 1,180 crore as against previous year figure of ` 1,285 crore.
In the absence of profits during the financial year, the Board has not recommended any dividend for the year.
The Sales tax matter has been resolved and concluded with the final judgment of Supreme Court on September 13, 2012. The Company is required to pay balance sales tax liability in two years with 10% interest. Your Company has successfully tied up for term loan facility with a Bank to mitigate the liquidity risk of payment of sales tax liability.
Your Company’s exit from CDR mechanism is another crucial landmark achieved by the Company towards the end of the financial year.
Directors’ Report
49

Co
mp
an
y o
ve
rv
iew
ma
na
ge
me
nt
Dis
Cu
ss
ion
an
D a
na
lys
iss
us
tain
ab
ility
go
ve
rn
an
Ce
Fin
an
Cia
ls
annual report 2012-1348
DireCtors
Mr. Prashant S Ruia has been elevated as Chairman of the Company with effect from August 14, 2013. He takes over the position of Chairman from Mr. Shashikant N Ruia, who stepped down from the Board effective August 14, 2013. Mr. Shashikant N Ruia, the Founder Chairman of the Essar Group and the Company has played a stellar role in steering the Group to a premier position. It was his vision that saw foray of the Company into Oil Refining business a sector which was earlier an exclusive domain of the public sector. The Board wishes to express its sincere gratitude to Mr. Shashikant N Ruia for the invaluable contributions made by him for bringing the Company to its present position.
During the year, Mr. R Sudarsan joined as Nominee of Life Insurance Corporation of India on the Board in place of Mr. V K Sinha with effect from January 15, 2013. Further, Mr. V. S. Jain, Independent Director and Mr. Rajiv Pal Singh, Nominee of State Bank of India joined the Board with effect from May 10, 2013 and May 24, 2013 respectively. Mr. K V Krishnamurthy, Independent Director passed away on January 16, 2013. The Board wishes to put on record its heartfelt condolences for Late Mr. K V Krishnamurthy. Further, the Board wishes to place on record its appreciation for the guidance and valuable services rendered by Late Mr. K V Krishnamurthy and Mr. V K Sinha during their tenures as members of the Board.
Mr. C Manoharan and Mr. K N Venkatasubramanian retire by rotation at the ensuing Annual General Meeting (AGM) and offer themselves for re-appointment. Further, it is proposed to appoint Mr. V. S. Jain, at the AGM as a director liable to retire by rotation. Particulars of the directors being re-appointed/appointed, as required under clause 49 of the Listing Agreement with the Stock Exchanges, are given in the Notice / Explanatory Statement convening the ensuing AGM, forming part of the Annual Report.
DireCtors’ responsibility statement
Pursuant to the provisions of section 217(2AA) of the Companies Act, 1956, it is hereby confirmed:
i) that in the preparation of the accounts for the
financial year ended March 31, 2013, the applicable accounting standards have been followed along with proper explanation relating to material departures;
ii) that the Directors have selected such accounting policies and applied them consistently and made judgments and estimates that were reasonable and prudent so as to give a true and fair view of the state of affairs of the Company at the end of the financial year and of the loss of the Company for that period;
iii) that the Directors have taken proper and sufficient care for the maintenance of adequate accounting records in accordance with the provisions of the Companies Act,1956 for safe guarding the assets of the Company and for preventing and detecting fraud and other irregularities; and
iv) that the Directors have prepared the accounts for the financial year ended March 31, 2013 on a ‘going concern’ basis.
Corporate governanCe
In terms of clause 49 of Listing Agreement with Stock Exchanges, a certificate from the auditors of the Company on compliance of conditions of Corporate Governance is annexed to the Directors’ Report. A report on Corporate Governance as provided in clause 49 of the listing agreement is included in the Annual Report.
employees stoCk option sCheme
The Company has introduced Essar Oil Employees Stock Option Scheme – 2011 (Scheme). The disclosures required to be made under the SEBI (Employee Stock Option Scheme and Employee Stock Purchase Scheme) Guidelines, 1999 (Guidelines) is enclosed as Annexure B. A certificate obtained from the auditors confirming compliance with the Guidelines and shareholders resolution approving the Scheme will be placed before the shareholders at the Annual General Meeting.
partiCulars oF employees
Information as per section 217(2A) of the Companies Act, 1956 read with the Companies (Particulars of Employees) Rules, 1975, as amended, is given in the
Directors’ Report

Co
mp
an
y o
ve
rv
iew
ma
na
ge
me
nt
Dis
Cu
ss
ion
an
D a
na
lys
iss
us
tain
ab
ility
go
ve
rn
an
Ce
Fin
an
Cia
ls
annual report 2012-1350
Annexures forming part of this Report. However, as per the provisions of section 219(1)(b)(iv) of the said Act, the Report and Accounts are being sent to all shareholders of the Company excluding the statement of particulars of employees under section 217(2A) of the said Act. Any shareholder interested in obtaining a copy of this statement may write to the Company Secretary, for the same, at the Registered Office of the Company.
energy, teChnology absorption anD Foreign exChange
The particulars as prescribed under section 217(1)(e) of the Act read with the Companies (Disclosure of Particulars in the Report of Board of Directors) Rules, 1988 are set out in Annexure A to this Report.
FixeD Deposits
Your Company has not accepted any public deposits under section 58A of the Companies Act, 1956 during financial year under report.
holDing Company
The Company, within the meaning of section 4(6) of the Companies Act, 1956, is an indirect subsidiary of Essar Oil & Gas Limited, Mauritius, which along with its subsidiary holds 87.09% of the total share capital as on March 31, 2013. Essar Oil & Gas Limited in turn is a wholly owned subsidiary of Essar Energy Plc.
subsiDiary Company
During the year, Essar Oil Mauritius Limited, Mauritius ceased to be subsidiary of the Company.
auDitors anD auDitors’ report
M/s. Deloitte Haskins & Sells, Chartered Accountants, Auditors of the Company hold office until the conclusion of the ensuing Annual General Meeting.
M/s. Deloitte Haskins & Sells, Chartered Accountants, have informed the Company that, if appointed, their appointment will be within the limits prescribed under section 224(1B) of the Companies Act, 1956. Accordingly, the members’ approval is being sought to their appointment as the Auditors of the Company at the ensuing Annual General Meeting.
Our comments on the audit observations are set out below:
(i) Auditors have drawn attention that the accumulated losses of the Company as on March 31, 2013 are more than 50% of its net worth with cash losses in the immediately preceding financial year.
The net worth of the Company had deteriorated mainly on account of reversal of sales defeasement income, recognized during financial years 2008-09 to 2011-12, consequent to a Supreme Court order. This had also resulted in cash losses during the previous financial year.
To improve the net worth, during the previous year the terms of Foreign Currency Convertible Bonds (FCCBs) have been amended whereby the above bonds have become compulsorily convertible into equity shares / GDSs on the same terms and conditions. Terms and conditions of FCCBs are mentioned in note 6 to financial statements.
With the Refinery currently operating at its full capacity (20 MMTPA) and improved complexity and other cost reduction measures initiated by the Company like getting cheap power and steam through coal based power plant, the revenue and bottom-line of the Company are expected to improve significantly in coming years.
This financial year has been a year of significant importance since the refinery was able to increase its capacity to 20 MMTPA and also improve its complexity from 6.1 to 11.8. During the year, the Company recorded a strong revenue growth of 53% at ` 97,068 crore, up from ` 63,428 crore in the previous financial year.
Directors’ Report
51

Co
mp
an
y o
ve
rv
iew
ma
na
ge
me
nt
Dis
Cu
ss
ion
an
D a
na
lys
iss
us
tain
ab
ility
go
ve
rn
an
Ce
Fin
an
Cia
ls
annual report 2012-1350
(ii) On use of funds raised on short term basis amounting to ` 2,786.08 crore for long term purposes, the Company has taken following steps to improve the position:
The Company has completed the expansion and optimization projects and the operations of the expanded refinery of 20 MMTPA have since stabilized. This will improve the revenues and profitability of the Company significantly. Further, the Company does not have any major capex program and hence the entire internal accruals will be utilized to deleverage the balance sheet.
The Company has received Reserve Bank of India (RBI) approval to raise External Commercial Borrowings (ECBs) to the extent of USD 2.27 billion for repayment of high cost rupee debt utilized for capital expenditure The Company has availed ECB of USD 270 million from IDBI Bank Ltd. The Company has further received approval for ECB of USD 325 million including commitment to convert buyers’ credit of USD 170 million into ECBs and approval of another USD 315 million is expected shortly. The Company has requested all other term lenders to consider sanction of ECBs for the purpose of refinancing high cost rupee debt. The dollarization program will have positive impact on the cash flows since it will not only reduce the interest cost to a large extent but also provide extended maturity of existing debt. The improved cash flows will be deployed for reducing the short term liabilities.
The Company is also in process of availing of long term export advance against future exports and is in discussions with various banks and overseas
suppliers. The availment of export advance will not only reduce the finance cost to a great extent but also shore up working capital of the Company.
Hence with the above measures, the short term funds will progressively get replaced with long term funds.
Other observations of the Auditors in the Audit report, by way of reference to notes to the accounts are self-explanatory.
Cost auDitors anD Cost auDit report
M/s. Chandra Wadhwa & Co was appointed as the Cost Auditor for the financial year ended March 31, 2013. The cost audit report for financial year ended March 31, 2013 will be filed with the Ministry of Corporate Affairs within the prescribed time period.
aCknowleDgement
The Board wishes to express appreciation and place on record its gratitude for the faith reposed in and co-operation extended to the Company by the Government of India, state governments, various government agencies/departments, financial institutions, banks, customers, suppliers and investors of the Company. Your Directors place on record their appreciation of the dedicated and sincere services rendered by the employees of the Company.
For and on behalf of the Board of Directors
lalit kumar gupta Managing Director & CEO
naresh nayyar Deputy Chairman
Mumbai, August 14, 2013
Directors’ Report

Co
mp
an
y o
ve
rv
iew
ma
na
ge
me
nt
Dis
Cu
ss
ion
an
D a
na
lys
iss
us
tain
ab
ility
go
ve
rn
an
Ce
Fin
an
Cia
ls
annual report 2012-1352
a. Conservation oF energy
a) energy Conservation measures taken:
In the Refinery at Jamnagar consistent efforts are being made for energy conservation. A dedicated Energy Cell is focusing on energy management and close monitoring of energy consumption pattern. Periodic energy audits are conducted by Refinery to improve energy performance and benchmark with other refineries. During the year, the Expansion Units of the Refinery have stabilized which have contributed significantly in reduction of energy consumption. Some of the major energy conservation measures undertaken are:
i) Use of coal based power and steam thereby significantly reducing the fuel costs;
ii) Crude Pre-Heat improved using Light Gas Oil Pump Around using existing idle Exchanger;
iii) Reduced dry slop generation to improve Crude Distillation Unit (CDU) throughput;
iv) Minimization of cooling tower heat load by utilizing heat of desal condensate to heat demineralised water;
v) Minimization of heat loss from steam piping through insulation upgradation; and
vi) Regular steam traps and steam leakage audits to minimize preventable steam losses.
The energy consumption of all process units and utility blocks are monitored constantly and corrective steps are immediately taken to utilize the energy in the most optimal manner.
In the Coal Bed Methane (CBM) field at Raniganj, West Bengal, energy sources such as High Speed Diesel (HSD), CBM Gas and Electricity are used for operational processes. Part of produced CBM gas is being used for running Gas Generator (GG) sets which resulted in reduced gas flaring.
b) additional investments and proposals, if any, being implemented for reduction of consumption of energy:
In the Refinery:
i) Vacuum slop routing to diesel storage or blending reduces reprocessing of slop;
ii) Stopping of wash water pumps in Diesel Hydrosulfurisation Unit resulting in saving of 102 KW/hr;
iii) Provision of step less control for Diesel Hydrotreater Make-up Gas compressor to save energy; and
iv) Up gradation of Induced Draft fan in CDU to improve the flue gas heat recovery.
c) impact of the measures at (a) and (b) above for reduction of energy consumption and consequent impact on the cost of production of goods:
Implementation of the energy conservation measures identified above have already started accruing benefits to the Refinery on a recurring basis.
Use of CBM gas for generation of electricity at Raniganj Project has helped reduction in diesel consumption and flaring of CBM.
Annexure A to the Directors’ ReportStatement of particulars under the Companies (Disclosure of Particulars in the Report of Board of Directors) Rules, 1988
53

Co
mp
an
y o
ve
rv
iew
ma
na
ge
me
nt
Dis
Cu
ss
ion
an
D a
na
lys
iss
us
tain
ab
ility
go
ve
rn
an
Ce
Fin
an
Cia
ls
annual report 2012-1352
d) total energy consumption and energy consumption per unit of production as per Form ‘a’ is attached hereto:
Form a
a power anD Fuel Consumption: 2012-13 2011-12
1 electricity
(a) i) Purchased
Unit (‘000 KWH) 12,525.41 41,842.64
Rate / Unit
(including minimum demand charge) 17.90 7.79
Total Amount (` in lakh) 2,242.41 3,260.58
ii) Duty on Own Power Generation
Unit (‘000 KWH) 991,670 219,135
Rate / Unit 0.41 0.44
Total Amount (` in lakh) 4,070.02 969.47
iii) Parallel Operation Charges
Total Amount (` in lakh) 1,374.20 759.20
Total (i+ii+iii) 7,686.63 4,989.25
(b) Own Generation
(i) Through Diesel Generator na NA
Unit (‘000 KWH)
KWH per litre of diesel oil
Cost / Unit (` /KWH)
(ii) Through Steam Turbine/Generator Unit (‘000 KWH) 1,411,775.70 573,364.50
KWH per unit of Fuel Oil/Gas/Coal/Naptha/HSD 4.17 3.29
Cost / Unit (` /KWH) 6.99 11.87
(c) Electricity Consumed (a+b) (‘000 KWH) 1,424,301.11 615,207.14
2 Coal- (specify quality and where used)- Coal generally with calorific value of 4000 kcal/kg is used in power plant – mts
1,081,889.62 NA
3 Furnace oil/other liquid fuels-purchased
Quantity (MTs) 0
Total amount (` in lakh) na NA
Average Rate (` /MT) na NA
4 others / internal generation
(i) Fuel Gas & Natural Gas
Unit (MTs) 741,703.63 319,282.89
Total amount (` in lakh) 300,734.94 109,093.20
Average Rate (`/MT) 40,546.51 34,168.20
Annexure A to the Directors’ Report

Co
mp
an
y o
ve
rv
iew
ma
na
ge
me
nt
Dis
Cu
ss
ion
an
D a
na
lys
iss
us
tain
ab
ility
go
ve
rn
an
Ce
Fin
an
Cia
ls
annual report 2012-1354
a power anD Fuel Consumption: 2012-13 2011-12
(ii) Liquid Fuel – Fuel Oil
a) FO
Unit (MTs) 247,998.39 273,632.63
Total amount (` in lakh) 73,379.92 70,010.54
Average Rate (` /MT) 29,588.87 25,585.60
b) HSD, Sour Naphtha
Unit (MTs) 59,630.40 28,883.03
Total amount (` in lakh) 28,233.94 12,999.98
Average Rate (` /MT) 47,348.23 45,009.04
(iii) Solid Fuel - Fluidised Catalytic Cracker Coke
Unit (MTs) 183,011.89 181,200.32
Total amount (` in lakh) 46,516.43 39,824.92
Average Rate (`/MT) 25,417.16 21,978.39
5 total liquid Fuel – (purchased + own generation) (mt) 247,998.39 273,632.63
Total Fuel Gas, Liquid, Solid – (Purchased + Own Generation) 2,314,233.93 802,998.88
b Consumption per unit oF proDuCtion:
(i) Actual Production (MTs) – 18,895,277 12,673,556
(ii) Consumption per MT of Production
- Electricity (Purchased + Generated) KWH/MT(Used in Refinery) 62.17 48.54
- Liquid Fuel (FO/LSHS/NAPHTHA) (Purchased + Internal Generation) – MTs 0.016 0.024
- Fuel Gas – MTs 0.039 0.026
- FCCU coke – MTs 0.010 0.014
b. teChnology absorption
e) Efforts made in technology absorption at the Refinery are set out in Form‘B’ hereto:
Form b
Research and development (R & D)
1) specific areas in which r & D was carried out by the Company
a) In-house Design and Development of Indigenous Fouling Potential Analyzer (FPA) for crude oil fouling characterization
b) Creating database for Crude oils for SARA, S- Value & Fouling
c) Modified sulfur based Binder with Bitumen for Road pavement
d) Development of acid treated clay for Kerosene treatment
2) benefits derived as a result of the above r&D
a) The Fouling Potential Analyzer (FPA) predicts the heat exchanger performance and the fouling during processing of various tough crudes.
b) Establish correlation between SARA, S-Value and fouling potential of crude blends. Based on correlation, the Refinery will be able to broaden the horizon for tough crude processing.
Form a (Contd.)
Annexure A to the Directors’ Report
55
Co
mp
an
y o
ve
rv
iew
ma
na
ge
me
nt
Dis
Cu
ss
ion
an
D a
na
lys
iss
us
tain
ab
ility
go
ve
rn
an
Ce
Fin
an
Cia
ls
annual report 2012-1354
c) The modified sulfur based binder will have equivalent binding potential as bitumen and can be sold as a new product.
d) The acid treatment to clay will help enhance the efficiency of normal clay for improving color of Kerosene. This technology can be transferred to clay supplier to enhance the quality of clay.
3) Future plan of action –
a) Explore possibility of making briquettes from Petcoke fines and Fly ash.
b) Erection of new infrastructure for R&D.
c) Continuation of current R&D activities.
4) expenditure on r & D: ` 2.22 crore
a) Capital – ` 1.69 crore
b) Recurring – ` 0.53 crore
c) Total – ` 2.22 crore
d) Total R & D expenditure as a percentage of total turnover– negligible
technology, absorption, adaptation and innovation
1) efforts, in brief, made towards technology absorption, adaptation and innovation
Post commissioning of the Refinery Expansion Project in March, 2012, we also successfully completed Optimisation Project. After completion of these projects, the Company’s Refinery has become one of the most complex and modern refineries of the world and India’s second largest single-location refinery, with an annual capacity of 20 MMTPA, or 405,000 barrels per day (bpd).
vbu to CDu Conversion: Commissioning of Delayed Coker Unit (DCU) made the existing Visbreaker Unit (VBU) redundant. To utilize VBU capital investment, this unit was converted to Crude Distillation Unit (CDU) with capacity of 2 MMTPA, to process heavy and waxy crudes as part of Optimisation Project.
Coal based captive power plant: Associate company successfully commissioned a coal based power plant whose operating cost is
cheaper than conventional fuel based boilers or Gas Turbines. Presently, Refinery is being operated 100% on coal based Boilers and STGs.
slurry yield reduction in FCCu: Slurry is a low value product. The Company has successfully reduced slurry yield in FCCU. The conversion has been controlled and slurry yield has been reduced from 12 to 8 wt%
mini hydrogen manufacturing unit (hmu) feed conversion from liquified petroleum gas (lpg) to natural gas (ng): Mini HMU was originally designed to run on LPG as feed. Based on economics NG was found to be cheaper feed compared to LPG. Required modifications were carried out in the unit to run the unit on either of the feeds (NG & LPG) based on economics.
apC implementation for CDu-2: Advanced process control (APC) is a proven technique to improve unit margins by safely stretching the process units operating domain to constraints and limits. It always ensures that all available operating windows are effectively utilized by optimizing on the yields and energy usage. With APC implementation Diesel recovery fluctuation has been reduced by 34%.
At Raniganj field, while the CBM Gas production is on-going, technological efforts have been made for conservation of energy on pilot basis and will be rolled out in field in the next financial year.
CBM gas is absorbed in the coal seams. To prevent free release of CBM gas into the atmosphere once the dewatering process is started in the wells, a pipeline is laid well in advance to collect this gas which is then transported to the gas grid (Network of Pipeline). Initially five wells-pads were connected by gas grid (Network of Pipeline). The above process has helped in reduction of carbon emission i.e. carbon footprint. Further, Diesel Generator Sets used at the individual well sites for pumping out gas and water from the wells are converted to Gas driven Generator sets, which has also helped in reduction of carbon emission.
Annexure A to the Directors’ Report

Co
mp
an
y o
ve
rv
iew
ma
na
ge
me
nt
Dis
Cu
ss
ion
an
D a
na
lys
iss
us
tain
ab
ility
go
ve
rn
an
Ce
Fin
an
Cia
ls
annual report 2012-1356
Annexure A to the Directors’ Report
Use of Variable Frequency Drive (VFD) reduces the capacity utilization of the generators. Active harmonic filters were introduced on test basis which avoid the generation of harmonics and thereby increases the capacity utilization. This increases power efficiency and reduces total CO2 generation.
2) benefits derived as a result of the above efforts, e.g., product improvement, cost reduction, product development, import substitution, etc.
Commissioning Expansion units, Optimisation Project and coal based power plant and use of latest technologies made the Refinery one of the most complex and modern refineries of the world. The complexity of the Refinery is increased from 6.1 to 11.8. The capacity expansion and complexity enhancement gives the Refinery, the capability to process over 80 per cent heavy and ultra-heavy lower cost crude oils. These enhancements also helped in reduction in cost of power and steam production. With these measures, the Refinery GRMs have got substantial boost of approximately USD 3-4 / bbl.
3) in case of imported technology (imported during the last 5 years reckoned from the beginning of the financial year), following information may be furnished :
a) Technology imported:
i. Imported UOP Technology for VGO Hydrotreater, Diesel Hydrotreater and Isomerisation unit, implemented and all units are running successfully for more than one year. This technology enables us to produce Euro IV and Euro V grades of HSD and MS. Technology is proved to be performing well meeting all design specifications.
ii. Delayed Coker Unit Technology was imported from Chicago Bridge & Iron Company (CB&I) to convert Vacuum Residue into valuable distillates and petroleum coke through severe thermal cracking and to eliminate production of Fuel oil. This unit is also running successfully for more than a year meeting all design specifications.
iii. Imported HALDOR TOPSOE, Denmark Technology to manufacture 99.9% pure
Hydrogen required for VGOHT, DHDT and ISOM. Guarantee performance test was completed and technology is proved to meet all design specifications and requirements.
iv. Imported JACOBS Technology, USA for Sulfur Recovery Unit, commissioned and running successfully.
b) Year of import of all above Technology.
All above Technologies imported in 2011-12
c) Has technology been fully absorbed?
i) UOP - Yes
ii) CB&I – Yes
iii) HALDOR TOPSOE – Yes
iv) JACOBS- Yes
d) If not fully absorbed, areas where this has not taken place, reasons there for and future plans of action – NA.
C. Foreign exchange earnings and outgo:
f) activities relating to exports; initiatives taken to increase exports; development of new export markets for products and services and export plans:
For the financial year 2012-13, of the total crude oil purchased by the Company about 18% was purchased domestically. Some of this indigenous crude oil was paid for in Indian Rupees, resulting in some reduction in forex outgo of the Company. The Company’s sales focus had been to supply maximum quantity of its products to PSU oil companies. However, with the country having enough refining capacity, surplus products produced from the Company’s Refinery over and above the domestic requirement were exported. This year, the Company has exported Gasoline, Gas Oil, Naphtha and Vacuum Gas Oil thereby contributing to improved forex earnings.
g) total foreign exchange used and earned: Particulars relating to Foreign Exchange outgo
and earnings appear in Note No. 31 and 33 to financial statements.
57

Co
mp
an
y o
ve
rv
iew
ma
na
ge
me
nt
Dis
Cu
ss
ion
an
D a
na
lys
iss
us
tain
ab
ility
go
ve
rn
an
Ce
Fin
an
Cia
ls
annual report 2012-1356
Annexure B to the Directors’ ReportInformation required to be disclosed under the SEBI (Employee Stock Option Scheme and Employee Stock Purchase Scheme) Guidelines, 1999:
Essar Oil Employee Stock Option Scheme 2011 (Scheme) was introduced pursuant to approval granted by shareholders at Annual General Meeting held on August 12, 2011 as modified by resolution approved at Annual General Meeting held on December 20, 2012. Under the Scheme, each option is convertible into equivalent number of equity shares of ` 10/- each of the Company. Options granted shall vest in a graded manner in three equal installments, at the end of 3rd / 4th / 5th years from the grant date. The options can be exercised within 7 years from the date of vesting.
Particulars of options granted so far are as follows:
Year of grant 2011 – 12Options granted 3,211,391Exercise price ` 69.05 per sharePricing formula Closing price of the equity
shares of the Company on the date immediately preceding the date of grant i.e. December 1, 2011at the National Stock Exchange of India Ltd., being the exchange having the higher quantity of trading on the Company’s shares
Options cancelled / forfeited
692,333
Options lapsed NilTotal number of options in force
2,519,058
Options vested NilOptions exercised NilNumber of shares allotted pursuant to exercise of options
Nil
Variation of terms of options
Nil
Amount realized by exercise of options (in `)
Nil
Employee wise details of options granted:
1) Options granted to Senior managerial personnel: ‘Nil’ at the time of grant of options. However, Mr. C. Manoharan, who was granted 191,509 stock options
as an executive of the Company, was subsequently appointed as Director (Refinery).
2) Employees who were granted options amounting to 5% or more of options granted in financial year 2011 – 12 are as follows:
Name of the employee No. of options granted*Narendra Vachharajani 220,971Chakrapany Manoharan 191,509
*The above does not include options granted which have been subsequently cancelled.
3) No employee was granted options during any one year equal to or exceeding 1% of the issued equity shares of the Company at the time of the grant.
The diluted earnings per share (EPS) on potential issue of shares upon exercise of options is ` (8.64). The Company has recognized a compensation cost of ` Nil in FY 2012–2013 based on the intrinsic value of options. However, had the Company used the fair value of options to determine the compensation cost for the year ended March 31, 2013, the loss for the year would have been higher by ` 2.41 crore and loss after tax would have been ` (1,182.85) crore. Accordingly, EPS basic and diluted earnings per share would have been ` (8.66).
The exercise price of ` 69.05 per share is equal to the market price at the time of grant of option. The weighted-average exercise price and weighted-average fair value of options is ` 69.05 and ` 47.94 per share, respectively.
The fair value of the options granted is ` 47.94 per share. The key assumptions used to estimate the fair value of options granted during the year ended March 31, 2013 are as follows:
Risk – free interest rate 8.36%
Expected life (years) 15Expected volatility 69.04%Expected dividend 0.00%The price of underlying share in market at the time of option grant
` 69.05
Co
mp
an
y o
ve
rv
iew
ma
na
ge
me
nt
Dis
Cu
ss
ion
an
D a
na
lys
iss
us
tain
ab
ility
go
ve
rn
an
Ce
Fin
an
Cia
ls
annual report 2012-1358
To
The Members of Essar Oil Limited
1. We have examined the compliance of conditions of Corporate Governance by Essar Oil Limited (“the Company”), for the year ended March 31, 2013 as stipulated in clause 49 of the Listing Agreement entered into by the said Company with stock exchanges in India.
2. The compliance of conditions of Corporate Governance is the responsibility of the management. Our examination was limited to proceduresand implementation thereof, adopted by the Company for ensuring the compliance of the conditions of the Corporate Governance. It is neither an audit nor an expression of opinion on the financial statements of the Company.
3. In our opinion and to the best of our information and according to the explanations given to us, we certify
that the Company has complied with the conditions of Corporate Governance as stipulated in the above-mentioned Listing Agreement.
4. We further state that such compliance is neither an assurance as to the future viability of the Company nor the efficiency or effectiveness with which the management has conducted the affairs of the Company.
For Deloitte haskins & sells
Chartered Accountants
(Registration No. 117365W)
r. D. kamat
Partner
Mumbai, August 14, 2013 Membership No. 36822
Auditors’ Certificate
59

Co
mp
an
y o
ve
rv
iew
ma
na
ge
me
nt
Dis
Cu
ss
ion
an
D a
na
lys
iss
us
tain
ab
ility
go
ve
rn
an
Ce
Fin
an
Cia
ls
annual report 2012-1358
1. Company’s philosophy on Corporate governanCe:
Essar Oil Ltd. believes that adhering to global standards of Corporate Governance is essential to enhance shareholder value and achieve long term corporate goals. The Company is committed to ethical conduct of business, manages its affairs with fairness to all stakeholders and operates with openness, integrity
2. boarD oF DireCtors:
The composition of the Board of Directors and other required details as on March 31, 2013 are given below:
name Category no. of board
meetings attended
whether attended
last agm
no. of other director-
ships held #
Committee membership Δ
member Chairman
Shashikant N Ruia1 (Chairman upto August 14, 2013)
Non-Independent Non- Executive
Nil No 1 Nil Nil
Prashant S Ruia2 (Chairman effective August 14, 2013)
Non-Independent Non- Executive
3 No 1 Nil Nil
Naresh K Nayyar (Dy. Chairman)
Non-Independent Non- Executive
4 No 1 1 Nil
Lalit K Gupta (Managing Director & CEO)
Executive 4 Yes 1 2 Nil
Chakrapany Manoharan (Director (Refinery))
Executive 4 Yes Nil Nil Nil
Philip Aiken AM 3 Independent Non- Executive
3 Yes Nil Nil Nil
D J Thakkar Independent Non- Executive
4 Yes 13 10 5
K N Venkatasubramanian Independent Non- Executive
4 Yes 4 3 Nil
Melwyn Rego (Nominee of IDBI Bank Ltd.)
Independent Non- Executive
3 No 1 Nil Nil
Suneet Shukla4 (Nominee of IFCI Ltd.)
Independent Non- Executive
2 Yes 1 Nil Nil
R Sudarsan5 (Nominee of LIC of India)
Independent Non- Executive
1 NA Nil 1 Nil
Anshuman S Ruia6 Non-Independent Non- Executive
1 NA Nil Nil Nil
Manju Jain7 (Nominee of IFCI Ltd.)
Independent Non- Executive
2 NA Nil Nil Nil
V K Sinha8 (Nominee of LIC of India)
Independent Non- Executive
2 No Nil Nil Nil
Late K V Krishnamurthy9 Independent Non- Executive
1 No Nil Nil Nil
and accountability. The Board of Directors conducts the business of the Company in due compliance with its Memorandum and Articles of Association and the laws applicable to the jurisdictions of the places where the Company operates and undertakes a periodic review of business plans, performance and compliance to regulatory requirements.
Corporate Governance Report

Co
mp
an
y o
ve
rv
iew
ma
na
ge
me
nt
Dis
Cu
ss
ion
an
D a
na
lys
iss
us
tain
ab
ility
go
ve
rn
an
Ce
Fin
an
Cia
ls
annual report 2012-1360
Corporate Governance Report
Details of directors appointed post March 31, 2013 are as follows:
name Category no. of board meetings attended
whether attended last
agm
no. of other director-
ships held #$
Committee membership Δ $
member Chairman
V. S. Jain10 Independent Non- Executive
N.A. N.A. 2 2 1
Rajiv Pal Singh11 (Nominee of State Bank of India)
Independent Non- Executive
N.A. N.A. 1 Nil Nil
# Excluding directorship in Private Limited Companies and Foreign Bodies Corporate and companies under section 25 of the Companies Act, 1956.
Δ Memberships/Chairmanships of Audit Committee and Shareholders Grievance Committee including positions held in the Company.
$ Directorships and Committee positions are as on the date of appointments for directors appointed post March 31, 2013.
1. Ceased to be Director with effect from August 14, 2013.
2. Ceased to be Director with effect from April 23, 2012. Appointed as Director with effect from August 14, 2012. Mr. Prashant Ruia has been elevated as the Chairman of the Company effective August 14, 2013.
3. Appointment as Director with effect from August 14, 2012.
4. Appointment as Nominee Director of IFCI Ltd. with effect from November 9, 2012.
5. Appointment as Nominee Director of LIC of India with effect from January 15, 2013.
6. Ceased to be Director with effect from August 7, 2012.
7. Ceased to be Nominee Director with effect from November 9, 2012.
8. Ceased to be Nominee Director with effect from January 15, 2013.
9. Demise of Director on January 16, 2013.
10. Appointment as Director with effect from May 10, 2013.
11. Appointment as Nominee Director of State Bank of India with effect from May 24, 2013.
Four Board Meetings were held during the financial year 2012-2013 on May 12, 2012; August 14, 2012; November 9, 2012 and January 15, 2013.
The management of the Company is conducted by the Managing Director & CEO, who is assisted by Heads of Divisions/Departments, subject to the supervision and control of the Board of Directors.
Mr. C Manoharan and Mr. K N Venkatasubramanian retire by rotation and being eligible seek re-appointment at the ensuing Twenty Third Annual General Meeting (AGM). Further, it is proposed to appoint Mr. V.S.Jain as Director liable to retire by rotation at the ensuing AGM. A brief resume of the directors being re-appointed /
appointed along with the nature of their expertise and the details of other directorships and the committee positions held by them and their shareholdings have been disclosed to the shareholders through notes/Explanatory Statement annexed to the Notice for the ensuing AGM. None of the Directors is related to any other director except for Mr. Prashant S Ruia who is the son of Mr. Shashikant N Ruia, Chairman. As on March 31, 2013, Mr. D J Thakkar and Mr. K N Venkatasubramanian held 300 shares and 6,500 shares respectively. Mr. V. S. Jain who joined the Board of Directors on May 10, 2013 holds 600 shares in the Company. None of the other directors hold any shares in the Company. Brief profile of all the directors is separately setout in the Annual Report.
61

Co
mp
an
y o
ve
rv
iew
ma
na
ge
me
nt
Dis
Cu
ss
ion
an
D a
na
lys
iss
us
tain
ab
ility
go
ve
rn
an
Ce
Fin
an
Cia
ls
annual report 2012-1360
DeClaration by managing DireCtor & Ceo
I, Lalit Kumar Gupta, Managing Director & CEO, of Essar Oil Limited hereby declare that all the Board Members and Senior Executives one level below the Executive Directors including all Functional Heads have affirmed for the financial year ended March 31, 2013, compliance with the Code of Conduct of the Company laid down for them.
August 14, 2013
lalit kumar gupta Managing Director & CEO
Corporate Governance Report
3. CoDe oF ConDuCt For DireCtors anD senior management:
The Company has adopted a Code of Conduct (‘Code’) for Directors and Senior Management personnel one level below the Executive Directors including all Functional Heads. The Code has been posted on the Company’s website.
The Directors, Senior Management and Functional Heads have affirmed compliance with the Code. The declaration to this effect of the Managing Director & CEO is given below:
4. auDit & governanCe Committee:
The Audit & Governance Committee comprises of 3 members viz. Mr. D J Thakkar, Mr. K N Venkatasubramanian and the nominee of Life Insurance Corporation of India, Mr. R Sudarsan. Late Mr. K V Krishnamurthy was a member of the Committee upto January 16, 2013. Mr. R Sudarsan joined the Board as nominee of LIC of India and consequently the Committee on January 15, 2013 in place of Mr. V K Sinha. All the members of the Committee are financially literate. Mr. D J Thakkar, a qualified Chartered Accountant, chairs the meetings of the Committee. The constitution and terms of reference of the Committee are set out in compliance with the requirements of section 292A of the Companies Act, 1956 and clause 49 of the Listing Agreement.
During the financial year 2012-2013, the Committee met five times. Mr. K N Venkatasubramanian and Mr. D J Thakkar attended all meetings. Mr. V K Sinha attended two meetings. Late Mr. K V Krishnamurthy and Mr. R Sudarsan attended one meeting each. The Statutory Auditors, Internal Auditors, the Managing Director & CEO, the Chief Financial Officer and the Vice-President (Accounts) are invited to attend the meetings of the Committee. All department heads are invited to attend the Committee meeting whenever audit issues concerning their departments are being discussed in the meeting. The representative of the Cost Auditor is invited to attend the meeting of the Committee when the Cost Audit Report is tabled for discussion. Internal audit team of the parent company, Essar Energy Plc, is also invited to present their audit observations to the Committee when the internal audit report generated by them are tabled for discussion. The Company Secretary of the Company acts as the Secretary to the Committee.
5. remuneration Committee:
The Remuneration Committee comprises of 4 members viz.: Mr. Naresh Nayyar, Mr. K N Venkatasubramanian, Mr. D J Thakkar and the Nominee Director of IDBI Bank Ltd., Mr. Melwyn Rego. Late Mr. K V Krishnamurthy was a member upto January 16, 2013. Mr. Naresh K Nayyar joined the Committee on January 15, 2013.
Two meetings were held during the year 2012-13. Mr. K N Venkatasubramanian and Mr. D J Thakkar attended all meetings. Late Mr. K V Krishnamurthy and Mr. Melwyn Rego attended one meeting each. Mr. K N Venkatasubramanian generally chairs the meetings. The terms of reference of Remuneration Committee include review, determination, increase/decrease and approval of remuneration, determination of terms of appointment, Company’s policy for specific remuneration package, etc. for the Executive and other Directors. During the year, the Committee’s scope was enhanced to include review and finalization of the performance of senior management executives just below the Managing Director and decide the variable pay and also determine the criteria and fix the overall annual variable pay of all executives.

Co
mp
an
y o
ve
rv
iew
ma
na
ge
me
nt
Dis
Cu
ss
ion
an
D a
na
lys
iss
us
tain
ab
ility
go
ve
rn
an
Ce
Fin
an
Cia
ls
annual report 2012-1362
remuneration to Directors
non-executive Directors
The Non-Executive Directors do not draw any remuneration from the Company except for sitting fees. The Non-Executive Directors are being paid sitting fees at the rate of ` 20,000/- for attending each meeting of the Board of Directors and ` 10,000/- for attending each meeting of Committee thereof. The sitting fees paid to the Directors for the year ended March 31, 2013 are as follows: Mr. Prashant S Ruia: 60,000/-; Mr. Anshuman S Ruia: ` 20,000/-; Mr. Naresh Nayyar: 1,40,000/; Mr. Philip Aiken AM: ` 60,000/-; Mr. D J Thakkar: ` 2,20,000/; Mr. K N Venkatasubramanian: ` 1,50,000/-; Late Mr. K V Krishnamurthy: ` 60,000/-; Mr. Melwyn Rego: ` 70,000/- (paid to IDBI Bank Ltd.); Mr. V K Sinha: 60,000/-; Mr. R Sudarsan: 30,000/- (paid to LIC of India); Mr. Suneet Shukla: ` 40,000/- and Mrs. Manju Jain: ` 40,000/-. During the year, there were no pecuniary relationships or transactions between the Company and any of its Non-Executive Directors.
The Company has not granted any stock options to its Non – Executive Directors.
executive Directors
During the financial year 2012-13, remuneration paid to the Executive Directors was as under:
(Amount in `)mr. lalit
kumar guptamr. Chakrapany
manoharan
managing Director & Ceo
Director (refinery)
Basic Salary 14,544,000 7,200,000 Allowances & Perquisites
10,220,008 5,883,579
Retirement benefits
1,745,280 864,000
Performance Linked Incentives
3,600,000* 5,980,573*
total 30,109,288 19,928,152Service contract
5 years from December 2,
2011
3 years from March 29,
2012 Notice period 3 months 3 months*Paid for previous year
Corporate Governance Report
In terms of the Essar Oil Employee Stock Options Scheme – 2011, the Executive Directors are entitled to be granted stock options. Prior to being appointed as Director (Refinery), Mr. C. Manoharan, in his capacity as Head of Refinery, was granted 191,509 stock options in financial year 2011-12. Stock options for FY 2011-12 and FY 2012-13 are yet to be granted. There is no separate provision for payment of severance fee to any of the Executive Directors.
6. investors’ relations:
i) investors’ relations Committee
As of March 31, 2013, the Investors’ Relations Committee comprised of 3 members viz. Mr. D J Thakkar; Mr. Naresh Nayyar and Mr. L K Gupta. Mr. D J Thakkar generally chairs the meetings. Mr. P S Ruia and Late Mr. K V Krishnamurthy were members upto April 23, 2012 and January 16, 2013.
During the financial year 2012-13, the Committee had 5 meetings. Mr. L K Gupta and Mr. D J Thakkar attended all 5 meetings, Mr. Naresh Nayyar attended 4 meetings and Late Mr. K V Krishnamurthy attended 2 meetings.
The Managing Director & CEO and Company Secretary have been authorised to approve every fortnight, matters pertaining to transfer/transmission/rematerialization of shares etc. upto certain specified limits.
ii) Company secretary
The Company Secretary, Mr. Sheikh S Shaffi, is the Compliance Officer.
iii) requests/complaints
There were no complaints from share/debenture holders pending at the beginning of the financial year. During the financial year, 1008 complaints were received and 1008 complaints were replied to/resolved. As of March 31, 2013, there were no pending complaints.
624 requests involving transfer of 87,000 shares were received during the financial year.
iv) equity share certificates lying unclaimed:
The details regarding the unclaimed certificates of
63

Co
mp
an
y o
ve
rv
iew
ma
na
ge
me
nt
Dis
Cu
ss
ion
an
D a
na
lys
iss
us
tain
ab
ility
go
ve
rn
an
Ce
Fin
an
Cia
ls
annual report 2012-1362
sr. no.
particulars no. of shares
no. of shareholders
1. Aggregate number of shareholders and the outstanding shares lying in the Unclaimed Suspense Account at the beginning of the year
41,950 258
2. Number of shareholders who approached the issuer for transfer of shares from the Unclaimed Suspense Account during the year
1,500 8
3. Number of shareholders to whom shares were transferred from the Unclaimed Suspense Account during the year
1,500 8
4. Aggregate number of shareholders and the outstanding shares lying in the Unclaimed Suspense Account at the end of the year
40,450 250
The voting rights on the shares outstanding in this suspense account as on March 31, 2013 shall remain frozen till rightful owner claims these shares.
Corporate Governance Report
equity shares lying with the Company in the demat account titled “Essar Oil Limited – Unclaimed Suspense Account” are as follows:
7. general boDy meetings:
a) annual general meetings
The date, time and venue of the last three Annual General Meetings and special resolutions passed at the meetings are given below:
Financial year
Date time venue special resolutions passed
2011-2012
December 20, 2012
2:30 p.m.
Khambhalia Post, Dist. Jamnagar
3
2010-2011
August 12, 2011
2:30 p.m.
Khambhalia Post, Dist. Jamnagar
2
2009-2010
September 24, 2010
2:30 p.m.
Khambhalia Post, Dist. Jamnagar
3
b) postal ballot
i) During the year two resolutions were passed through postal ballot for amending the Objects Clause of Memorandum of Association of the Company and taking on record a report of the Board of Directors.
ii) The procedure adopted for the above referred postal ballot is setout below:
The Board of Directors on January 16, 2013 authorised the Managing Director & CEO and the Company Secretary to conduct the postal ballot process and appointed Mr. Prakash Pandya, Practicing Company Secretary as scrutinizer for conducting the voting process. Posting of the Notice along with the Postal Ballot form to the members got completed on January 17, 2013. Shareholders were provided an option of voting either through e – voting or by physical mode. The postal ballot forms could be tendered to the Company by 5:00 p.m. on February 18, 2013 whereas the last day for closure of voting via electronic mode was February 17, 2013. The scrutinizer submitted his report to the Chairman

Co
mp
an
y o
ve
rv
iew
ma
na
ge
me
nt
Dis
Cu
ss
ion
an
D a
na
lys
iss
us
tain
ab
ility
go
ve
rn
an
Ce
Fin
an
Cia
ls
annual report 2012-1364
appointed for declaring the postal ballot outcome, Mr. Naresh K Nayyar on February 18, 2013. Based on the scrutinizers report the results of the Postal Ballot were declared on February 18, 2013 at the Corporate Office of the Company. The details of voting results for the resolutions are set out below.
iii) Details of voting results:
Details
resolution no. 1 resolution no. 2amendment in
objects Clause of memorandum of
association of the Company
taking on record report of the board
of Directors
no. of shares
% no. of shares
%
Total votes received
232,541,105 - 232,541,075 -
Less: Invalid votes received
87,726 - 87,105 -
Net valid votes received
232,453,379 - 232,453,970 -
Votes cast in favour of the resolution
232,437,835 99.99 232,437,411 99.99
Votes cast against the resolution
15,544 0.01 16,559 0.01
iv) No special resolution is proposed to be undertaken by postal ballot at the ensuing AGM.
8. DisClosures:
i) The Company does not have any material related parties’ transactions which have potential conflict with the interest of the Company at large. Transactions with related parties are disclosed in note 45 to the accompanying notes of the financial statements of the Company forming part of the Annual Report. The financial statements have been prepared in accordance with the accounting policies generally accepted in India. In compliance with clarificatory orders dated August 4, 2006 and August 11, 2006
Corporate Governance Report
issued by Hon’ble Gujarat High Court, interest on certain categories of debentures have been accounted on cash basis as detailed in note 7(ii)(a) to financial statements.
Regarding certain funded interest facilities as referred in note 7(ii)(c) to the financial statements, to give accounting effect to reflect substance of the transaction, the Facility Stoppage (FS) loan was, since inception, measured by the Company in accordance with the principles of IAS 39, Financial Instruments, Recognition and Measurement, in absence of specific guidance in Indian GAAP to cover the specific situation.In continuance of the above said principle and applying the principle of Accounting Standard AS 30, Financial Instruments, Recognition and Measurement, the FS loan has, upon signing of the Common Rupee Loan agreement (CLA), been re-measured since inception, considering present value of cash flows inclusive of interest.
ii) There were no instances of non-compliance on any matter related to the capital markets, during the last three years.
iii) In respect of compliance with the non-mandatory requirements, the Company has constituted a Remuneration Committee details whereof are given under the heading: Remuneration Committee. The quarterly, half-yearly and annual financial results are put up on the Company’s website www.essar.com, besides being available on www.corpfiling.co.in and are being published in English and Gujarati newspapers. The auditor’s observations have been adequately explained in Directors’ Report and also in the notes to the accounts wherever necessary and are self-explanatory.
iv) The Company has a Risk Management Policy Framework for risk identification, assessment and control to effectively manage risks associated with the business of the Company.
v) The Company has also adopted a Code of Internal Procedures and Conduct for Prevention of Insider Trading with a view to regulate trading in securities by the Directors and designated employees of the Company.
65
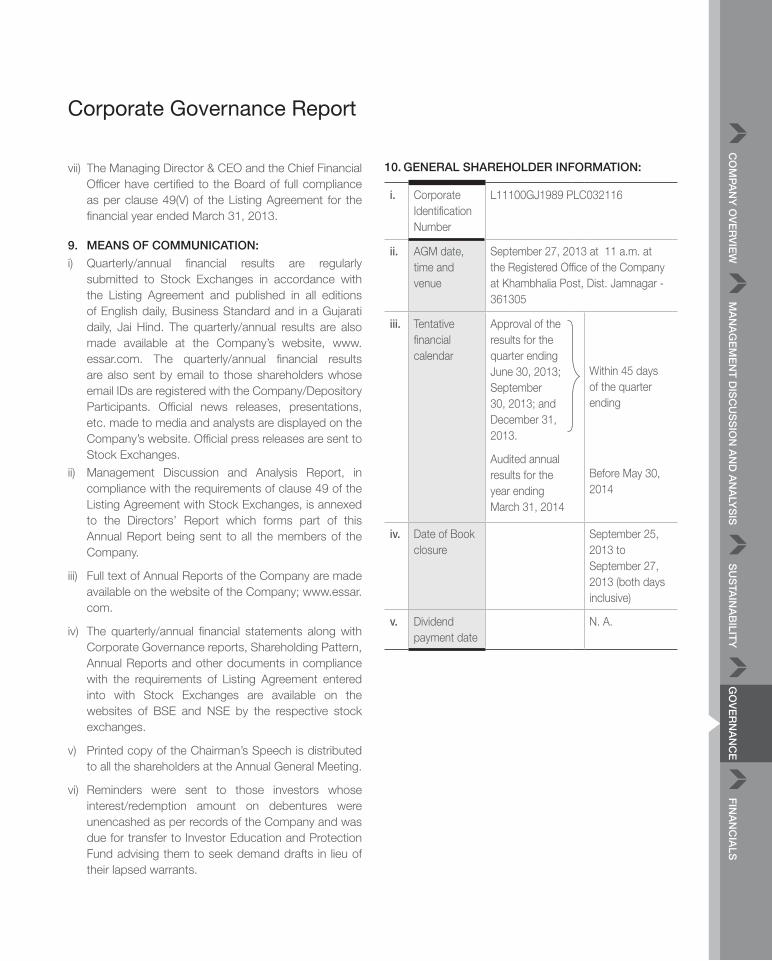
Co
mp
an
y o
ve
rv
iew
ma
na
ge
me
nt
Dis
Cu
ss
ion
an
D a
na
lys
iss
us
tain
ab
ility
go
ve
rn
an
Ce
Fin
an
Cia
ls
annual report 2012-1364
vii) The Managing Director & CEO and the Chief Financial Officer have certified to the Board of full compliance as per clause 49(V) of the Listing Agreement for the financial year ended March 31, 2013.
9. means oF CommuniCation:
i) Quarterly/annual financial results are regularly submitted to Stock Exchanges in accordance with the Listing Agreement and published in all editions of English daily, Business Standard and in a Gujarati daily, Jai Hind. The quarterly/annual results are also made available at the Company’s website, www.essar.com. The quarterly/annual financial results are also sent by email to those shareholders whose email IDs are registered with the Company/Depository Participants. Official news releases, presentations, etc. made to media and analysts are displayed on the Company’s website. Official press releases are sent to Stock Exchanges.
ii) Management Discussion and Analysis Report, in compliance with the requirements of clause 49 of the Listing Agreement with Stock Exchanges, is annexed to the Directors’ Report which forms part of this Annual Report being sent to all the members of the Company.
iii) Full text of Annual Reports of the Company are made available on the website of the Company; www.essar.com.
iv) The quarterly/annual financial statements along with Corporate Governance reports, Shareholding Pattern, Annual Reports and other documents in compliance with the requirements of Listing Agreement entered into with Stock Exchanges are available on the websites of BSE and NSE by the respective stock exchanges.
v) Printed copy of the Chairman’s Speech is distributed to all the shareholders at the Annual General Meeting.
vi) Reminders were sent to those investors whose interest/redemption amount on debentures were unencashed as per records of the Company and was due for transfer to Investor Education and Protection Fund advising them to seek demand drafts in lieu of their lapsed warrants.
Corporate Governance Report
10. general shareholDer inFormation:
i. Corporate Identification Number
L11100GJ1989 PLC032116
ii. AGM date, time and venue
September 27, 2013 at 11 a.m. at the Registered Office of the Company at Khambhalia Post, Dist. Jamnagar - 361305
iii. Tentative financial calendar
Approval of the results for the quarter ending June 30, 2013; September 30, 2013; and December 31, 2013.
Audited annual results for the year ending March 31, 2014
Within 45 days of the quarter ending
Before May 30, 2014
iv. Date of Book closure
September 25, 2013 to September 27, 2013 (both days inclusive)
v. Dividend payment date
N. A.

Co
mp
an
y o
ve
rv
iew
ma
na
ge
me
nt
Dis
Cu
ss
ion
an
D a
na
lys
iss
us
tain
ab
ility
go
ve
rn
an
Ce
Fin
an
Cia
ls
annual report 2012-1366
Corporate Governance Report
viii. stock market price data for the financial year 2012-2013:
High/Low (based on daily closing prices), closing prices and average of the aggregate of daily traded volume at NSE and BSE for each month in the financial year ended March 31, 2013 are as under:
month year
nse bse
(in ` per share) (in lakh) (in ` per share) (in lakh)
high low Close volume high low Close volume
April 2012 59.75 50.00 54.40 26.88 59.75 50.00 54.40 8.24
May 2012 53.55 49.75 50.25 18.72 53.45 49.70 50.35 5.26
June 2012 56.75 49.50 55.10 18.73 56.70 49.35 55.15 5.60
July 2012 59.25 48.25 55.60 25.26 59.20 48.15 55.60 6.93
August 2012 56.50 46.60 47.05 13.76 56.35 46.70 47.30 3.67
September 2012 53.00 46.85 50.65 19.37 53.10 46.85 50.80 5.06
October 2012 65.05 51.30 62.85 37.41 65.15 51.20 62.80 16.06
November 2012 70.30 62.40 70.30 19.31 70.00 62.55 70.00 8.36
December 2012 71.85 67.40 70.25 10.41 71.85 67.40 70.25 5.14
January 2013 85.95 69.35 85.95 23.55 85.60 69.30 85.60 9.45
February 2013 94.60 83.30 83.80 29.75 94.55 83.20 83.60 12.51
March 2013 89.80 71.35 78.05 29.83 90.00 71.05 77.60 15.28
vi. listing of equity shares on stock exchanges:
The equity shares of the Company are listed at Bombay Stock Exchange Ltd. (BSE) and National Stock Exchange of India Ltd. (NSE). The Company has paid the annual listing fees for the financial years 2012-2013 and 2013-2014 to BSE and NSE.
The addresses of the stock exchanges are setout below:
Bombay Stock Exchange Ltd. 1st Floor, Rotunda Bldg P. J. Towers, Dalal Street Mumbai - 400 023
National Stock Exchange of India Ltd. Exchange Plaza, 5th Floor, Plot No. C/1, G Block Bandra Kurla Complex, Bandra (East) Mumbai - 400 051
vii. stock Codes:
equity shares
Trading Symbol:
Bombay Stock Exchange Limited
500134
National Stock Exchange of India Limited
ESSAROIL
ISIN with NSDL and CDSL INE011A01019 non - Convertible Debentures 12.50% Secured Non-Convertible Debentures of ` 105/- each redeemable on July 23, 2018
INE011A07073
67

Co
mp
an
y o
ve
rv
iew
ma
na
ge
me
nt
Dis
Cu
ss
ion
an
D a
na
lys
iss
us
tain
ab
ility
go
ve
rn
an
Ce
Fin
an
Cia
ls
annual report 2012-1366
Corporate Governance Report
x. share transfer agent:
M/s. Datamatics Financial Services Ltd. is the Share Transfer Agent of the Company. The Share Transfer Agent acknowledges and executes transfers of securities and arranges for issue of interest/redemption warrants on debentures. The Share Transfer Agent also accepts, deals with and resolves requests, queries and complaints of share/debenture holders.
xi. share transfer system:
The Company’s shares are traded on the Stock Exchanges compulsorily in dematerialised mode. Physical shares which are lodged for transfer with the Transfer Agent are processed and returned to the shareholders within a period of 10-15 days.
xii. Distribution of shareholding as on march 31, 2013:
no. of shares
no. of shareholders
% no. of shares
%
Upto 500 348,354 95.92 42,830,818 3.14501-1000 9,205 2.54 7,153,542 0.521001-2000 3,255 0.90 4,893,901 0.362001-3000 861 0.24 2,217,833 0.163001-4000 408 0.11 1,479,982 0.114001-5000 270 0.07 1,278,681 0.095001-10000
425 0.12 3,096,742 0.23
10001 and above
396 0.11 1,302,715,587 95.39
total 363,174 100.00 1,365,667,086 100.00
ix. performance of share price in comparison to bse sensex:
Rel
ativ
e P
rice
(Bas
e P
rice
100
for
Ap
ril 1
, 201
2)
Company’s Share Price BSE SENSEX
180
170
160
150
140
130
120
110
100
90
80
Ap
r-20
12
May
-201
2
June
-201
2
July
-201
2
Aug
-201
2
Sep
-201
2
Oct
-201
2
Nov
-201
2
Dec
-201
2
Jan-
2013
Feb
-201
3
Mar
-201
3

Co
mp
an
y o
ve
rv
iew
ma
na
ge
me
nt
Dis
Cu
ss
ion
an
D a
na
lys
iss
us
tain
ab
ility
go
ve
rn
an
Ce
Fin
an
Cia
ls
annual report 2012-1368
Shareholding pattern as on March 31, 2013:
sl. no.
Category no. of shares%
physical electronic total
I Promoters a. Promoter and Promoter Group 0 218,020,941 218,020,941 15.96b. Depository for GDSs 0 1,010,522,772 1,010,522,772 73.99
Sub-total 0 1,228,543,713 1,228,543,713 89.96ii non-promoters a. FIs and Banks 50 11,270,302 11,270,352 0.83b. Mutual Funds and UTI 10,600 10,003,645 10,014,245 0.73c. Foreign Institutional Investors 300 33,984,353 33,984,653 2.49d. Private Corporate Bodies 57,451 16,407,254 16,464,705 1.20e. Indian Public 17,741,816 45,352,096 63,093,912 4.62f. NRIs and OCBs 788,950 1,506,556 2,295,506 0.17
sub-total 18,599,167 118,524,206 137,123,373 10.04Total 18,599,167 1,347,067,919 1,365,667,086 100.00
Corporate Governance Report
xiii. Dematerialisation of shares:
As on March 31, 2013, 98.64% of the Company’s total shares, i.e. 1,347,067,919 shares were held in dematerialized form and 1.36% i.e. 18,599,167shares were held in physical form.
xiv. outstanding gDrs/aDrs/warrants or any
Convertible instruments, conversion date and
likely impact on equity:
6,604,724 Global Depository Shares (GDSs) represented by 1,010,522,772 equity shares were outstanding as on March 31, 2013. Each GDS represents one hundred and fifty three (153) equity shares.
USD 115 million Foreign Currency Convertible Bonds (FCCBs) which are convertible at any time into fully paid equity shares of 10 each at a conversion price of 138 per share or GDSs each representing 153 equity shares subject to adjustments, with a fixed rate of exchange on conversion of ` 46.60 to USD1.00.
USD 147 million FCCBs are convertible at any time into fully paid equity shares of ` 10 each at a conversion price of ` 153 per share or GDS each representing 153 equity shares subject to adjustment, with a fixed rate of exchange on conversion of ` 46.85 to USD1.00. The FCCBs have to be compulsorily converted by maturity date.
xv. transfer of unclaimed amount to investor education & protection Fund:
For the financial year ended on March 31, 2013, the Company has transferred to Investor Education Protection Fund (IEPF) in compliance with section 205C of the Companies Act, 1956. ` 8.68 crore debenture interest and principal amount remaining unpaid or unclaimed for a period of 7 years from the date the amount became due for payment.
xvi. plant location: The Refinery of the Company is located at Khambhalia
Post, Dist. Jamnagar – 361 305, Gujarat. The Company’s oil fields are located at Mehsana, Gujarat and the Coal Bed Methane (CBM) fields are located in Durgapur, West Bengal.
xvii. address for communication: For any assistance, request or instruction regarding
transfer or transmission of shares and debentures, dematerialization of shares / debentures, change of address, non-receipt of annual report, interest warrant and any other query relating to the shares and debentures of the Company, please write to the following address: M/s. Datamatics Financial Services Ltd., Unit: Essar Oil Limited, Plot No. B - 5, Part B Cross Lane, MIDC, Andheri (East), Mumbai – 400 093. Phone: 91-22-66712151 to 66712156, Fax: 91-22-66712209, Email: [email protected]
For any assistance, share / debenture holders may also write to the Company at the following email ID exclusively designated for the purpose: [email protected]
69

Co
mp
an
y o
ve
rv
iew
ma
na
ge
me
nt
Dis
Cu
ss
ion
an
D a
na
lys
iss
us
tain
ab
ility
go
ve
rn
an
Ce
Fin
an
Cia
ls
annual report 2012-1368
Financials70 Independent Auditors’ Report76 Balance Sheet77 Statement of Profit & Loss78 Cash Flow Statement80 Notes to the Financial Statements
129 Notice
Annual Report 2012-1370
Independent Auditors’ Report
To THE MEMBERS OF ESSAR OIL LIMITED
Report on the Financial Statements
We have audited the accompanying financial statements of ESSAR OIL LIMITED (“the Company”), which comprise the Balance Sheet as at March 31, 2013, the Statement of Profit and Loss and the Cash Flow Statement for the year then ended and a summary of the significant accounting policies and other explanatory information.
Management’s Responsibility for the Financial Statements
The Company’s Management is responsible for the preparation of these financial statements that give a true and fair view of the financial position, financial performance and cash flows of the Company in accordance with the Accounting Standards referred to in Section 211(3C) of the Companies Act, 1956 (“the Act”) and in accordance with the accounting principles generally accepted in India. This responsibility includes the design, implementation and maintenance of internal controls relevant to the preparation and presentation of the financial statements that give a true and fair view and are free from material misstatement, whether due to fraud or error.
Auditors’ Responsibility
Our responsibility is to express an opinion on these financial statements based on our audit. We conducted our audit in accordance with the Standards on Auditing issued by the Institute of Chartered Accountants of India. Those Standards require that we comply with the ethical requirements and plan and perform the audit to obtain reasonable assurance about whether the financial statements are free from material misstatement.
An audit involves performing procedures to obtain audit evidence about the amounts and the disclosures in the financial statements. The procedures selected depend on the auditors’ judgment, including the assessment of the risks of material misstatement of the financial statements, whether due to fraud or error. In making those risk assessments, the auditor considers the internal controls relevant to the Company’s preparation and fair
presentation of the financial statements in order to design audit procedures that are appropriate in the circumstances, but not for the purpose of expressing an opinion on the effectiveness of the Company’s internal control. An audit also includes evaluating the appropriateness of the accounting policies used and the reasonableness of the accounting estimates made by the Management, as well as evaluating the overall presentation of the financial statements.
We believe that the audit evidence we have obtained is sufficient and appropriate to provide a basis for our audit opinion.
Opinion
In our opinion and to the best of our information and according to the explanations given to us, the aforesaid financial statements give the information required by the Act in the manner so required and give a true and fair view in conformity with the accounting principles generally accepted in India:
(a) in the case of the Balance Sheet, of the state of affairs of the Company as at March 31, 2013;
(b) in the case of the Statement of Profit and Loss, of the loss of the Company for the year ended on that date; and
(c) in the case of the Cash Flow Statement, of the cash flows of the Company for the year ended on that date.
Emphasis of Matters
We draw attention to:
(a) Note 7(ii)(c) to the financial statements detailing the recognition and measurement of the borrowings covered by a Common Loan Agreement which were hitherto covered by the Master Restructuring Agreement as per the accounting policy consistently followed by the Company; and Note 34 to the financial statements detailing the adoption of hedge accounting principles in respect of commodity derivative contracts, as set out in Accounting Standard (AS) 30, Financial Instruments: Recognition
71

Co
mp
an
y o
ve
rv
iew
ma
na
ge
me
nt
Dis
Cu
ss
ion
an
D a
na
lys
iss
us
tain
ab
ility
go
ve
rn
an
Ce
Fin
an
Cia
ls
Independent Auditors’ Report
and Measurement, in absence of specific guidance under the Accounting Standards referred to in sub-section (3C) of section 211 of the Act.
(b) Note 7(ii)(a) to the financial statements describing the fact about accounting of interest on certain categories of debentures on a cash basis as per the Court order.
(c) Note 19 [footnote (ii)] to the financial statements regarding receivables of ` 2,177.82 crore from Essar House Limited and the management plans of securing the dues as explained therein.
Our opinion is not qualified in respect of these matters.
Report on Other Legal and Regulatory Requirements
1. As required by the Companies (Auditor’s Report) Order, 2003 (“the Order”) issued by the Central Government in terms of Section 227(4A) of the Act, we give in the Annexure a statement on the matters specified in paragraphs 4 and 5 of the Order.
2. As required by Section 227(3) of the Act, we report that:
(a) We have obtained all the information and explanations which to the best of our knowledge and belief were necessary for the purposes of our audit.
(b) In our opinion, proper books of account as required by law have been kept by the Company so far as it appears from our examination of those books.
(c) The Balance Sheet, the Statement of Profit and Loss, and the Cash Flow Statement dealt with by this Report are in agreement with the books of account.
(d) In our opinion, the Balance Sheet, the Statement of Profit and Loss and the Cash Flow Statement comply with the Accounting Standards referred to in Section 211(3C) of the Act.
(e) On the basis of the written representations received from the directors other than the nominee directors appointed by public financial institutions who have been granted exemption from the provisions of section 274(1)(g) of the Act, and taken on record by the Board of Directors, none of the said directors is disqualified as on March 31, 2013 from being appointed as a director in terms of Section 274(1)(g) of the Act.
For Deloitte Haskins & Sells
Chartered Accountants
(Firm Registration No. 117365W)
R.D. Kamat
Partner
Mumbai, May 10, 2013 Membership No. 36822

Annual Report 2012-1372
[Referred to in paragraph 1 under “Report on Other Legal and Regulatory Requirements” section of our report of even date]
1. In respect of its fixed assets:
(a) The Company has maintained proper records showing full particulars, including quantitative details and situation of fixed assets.
(b) The fixed assets of the Company have been physically verified during the year by the Management according to a phased programme designed to cover all the items over a period of three years, which in our opinion, is reasonable having regard to the size of the Company and the nature of its assets. As per the information given to us by the Management, no material discrepancies as compared to book records were noticed in respect of the fixed assets verified during the year.
(c) In our opinion and according to the information and explanations given to us, the Company has not made any substantial disposals of fixed assets during the year affecting the going concern status of the Company.
2. In respect of its inventories:
(a) As explained to us, inventories were physically verified during the year by the Management at reasonable intervals.
(b) In our opinion and according to the information and explanations given to us, the procedures of physical verification of inventories followed by the Management were reasonable and adequate in relation to the size of the Company and the nature of its business.
(c) In our opinion and according to the information and explanations given to us, the Company has maintained proper records of its inventories. Records of fuel at third party location from 2012-2013 are being streamlined and are not material in the context of overall inventory carried. No material discrepancies were noticed on physical verification as compared to book records.
Annexure to the Auditors’ Report
3. According to the information and explanation given to us, the Company has neither granted nor taken any loans, secured or unsecured, to / from companies, firms or other parties covered in the register maintained under section 301 of the Act. Accordingly, the provisions of clause 4 (iii) (a) to (g) of the Order are not applicable to the Company.
4. In our opinion and according to the information and explanations given to us, and considering that some of the items purchased are of specialised nature and suitable alternative sources do not exist for obtaining comparable quotations, there is an adequate internal control system commensurate with the size of the Company and the nature of its business for the purchase of inventory and fixed assets and for the sale of goods and services. During the course of our audit, we have not observed any failure to correct major weaknesses in internal controls.
5. (a) To the best of our knowledge and belief and according to the information and explanations given to us, we are of the opinion that the particulars of contracts or arrangements that need to be entered into the register maintained under Section 301 of the Act have been so entered.
(b) In our opinion and according to the information and explanations given to us, the transactions made in pursuance of contracts or arrangements entered in the register maintained under Section 301 of the Act and exceeding the value of rupees five lakhs in respect of any party during the year have been made at prices which are reasonable having regard to the prevailing market prices at the relevant time.
6. In our opinion and according to the information and explanations given to us, the Company has not accepted public deposits within the meaning of Section 58A and 58AA of the Act, or any other relevant provisions of the Act and the Companies (Acceptance of Deposits) Rules, 1975 with regard to the deposits accepted from the public. Accordingly, the provisions of clause 4(vi) of the Order are not applicable to the Company.
73

Co
mp
an
y o
ve
rv
iew
ma
na
ge
me
nt
Dis
Cu
ss
ion
an
D a
na
lys
iss
us
tain
ab
ility
go
ve
rn
an
Ce
Fin
an
Cia
ls
Annexure to the Auditors’ Report
7. In our opinion, the Company has an internal audit system commensurate with the size of the Company and nature of its business.
8. We have broadly reviewed the books of account maintained by the Company pursuant to the rules made by the Central Government for the maintenance of cost records under Section 209(1)(d) of Act in respect of manufacture of petroleum products and are of the opinion that prima facie the prescribed accounts and records have been made and maintained. We have, however, not made a detailed examination of the records with a view to determine whether they are accurate or complete.
9. In respect of statutory dues:
(a) According to the information and explanations given to us, the Company has generally been regular in depositing undisputed statutory dues, including Provident Fund, Investor Education and Protection Fund, Income Tax, Sales Tax (refer paragraph (c) below), Wealth Tax, Service Tax, Custom Duty, Excise Duty, Cess and any other statutory dues, as applicable, with the appropriate authorities. As explained to us, the provisions of Employees State Insurance are not applicable to the Company during the year.
There are no undisputed amounts payable in respect of the above statutory dues outstanding as at March 31, 2013 for a period of more than six months from the date they became payable.
(b) According to the information and explanations given to us, details of Income tax, Sales tax, Service tax, Customs Duty and Excise Duty below, which have not been deposited as on March 31, 2013 on account of disputes are given below:
Name of Statute Nature of dues Forum where dispute is pending
Period to which the
amount relates
Amount (` in crore)
Gujarat Value Added Tax Act 2003
Sales Tax & Interest
Gujarat Sales Tax Tribunal
2007-08 0.20
Jt. Commissioner Appeal, Rajkot
2008-09 591.68*
Central Sales Tax Act, 1956
Sales Tax & Interest
Jt. Commissioner Appeal, Rajkot
2008-09 68.23*
Central Excise Act, 1944
Excise Duty, Interest, Fine and Penalty
Central Excise & Service Tax Appellate Tribunal (CESTAT)
2006-07 2007-08 2008-09 2009-10 2010-11
72.82
Commissioner of Central Excise (Appeals)
2006-07 2007-08 2008-09 2009-10 2010-11 2011-12
21.99

Annual Report 2012-1374
Annexure to the Auditors’ Report
(c) In response to a Special Leave Petition filed by the Company with the Honorable Supreme Court seeking installments for payment of the sales tax dues without interest, the Honorable Supreme Court has, on September 13, 2012, passed an order allowing the payment of the balance sales tax dues in eight equal quarterly installments beginning January 2, 2013 with interest of 10% p.a. with effect from January 17, 2012.
10. The accumulated losses of the Company are more than 50% of its net worth. The Company has not incurred cash losses during the current year. However, there were cash losses in the immediately preceding financial year.
Name of Statute Nature of dues Forum where dispute is pending
Period to which the
amount relates
Amount (` in crore)
Customs Act 1962 Customs Duty, Interest, Fine and Penalty
Central Excise & Service Tax Appellate Tribunal (CESTAT)
2006-07 2008-09 2010-11
0.42
2009-10 118.73**
Commissioner of Customs Excise (Appeals)
2006-07 8.27
Service Tax Rules, 1994 Penalty Commissioner of Central Excise (Appeals)
2004-05 2005-06 2009-10
0.13
Central Excise & Service Tax Appellate Tribunal (CESTAT)
2005-06 1.38
Madhya Pradesh Sthaniya Kshetra Me Mal Ke Pravesh Par Kar Adhiniyam, 1976
Entry Tax, Penalty and Interest
High Court of Madhya Pradesh
2008-09 0.02
Joint Commissioner of commercial tax
2007-08 0.07
Income Tax Act, 1961 Income tax and Interest
Supreme Court 1997-98 0.18
*Appeal has been filed on April 30, 2013. **Company is in the process of filing the appeal.According to the information and explanations given to us, there were no dues pending to be deposited on account of any dispute in respect of Wealth Tax and Cess as on March 31, 2013.
11. In our opinion and according to the information and explanations given to us, the Company has not defaulted in repayment of dues to any financial institution or bank or debenture holders during the year.
12. According to the information and explanations given to us, the Company has not granted loans and advances on the basis of security by way of pledge of shares, debentures and other securities. Accordingly, the provisions of clause 4(xii) of the Order are not applicable to the Company.
13. The Company is not a chit fund or a nidhi/mutual benefit fund/society. Accordingly, the provisions of clause 4(xiii) of the Order are not applicable to the Company.
75

Co
mp
an
y o
ve
rv
iew
ma
na
ge
me
nt
Dis
Cu
ss
ion
an
D a
na
lys
iss
us
tain
ab
ility
go
ve
rn
an
Ce
Fin
an
Cia
ls
Annexure to the Auditors’ Report
14. According to the information and explanations given to us, the Company is not dealing in or trading in shares, securities, debentures and other investments. Accordingly, the provisions of clause 4 (xiv) of the Order are not applicable to the Company.
15. In our opinion and according to the information and explanations given to us, the terms and conditions on which the Company has given guarantees for the loans taken by others from banks and financial institutions are not, prima facie, prejudicial to the interest of the Company.
16. In our opinion and according to the information and explanations given to us, the term loans have been applied by the Company during the year for the purposes for which they were obtained, other than temporary deployment pending application.
17. On the basis of an overall examination of the balance sheet of the Company and according to the information and explanations given to us, we report that funds raised on short-term basis amounting to ` 2,786.08 crore, have, prima facie, been used for long term investment / purposes. This excludes the effects of the judgment of the Supreme Court dated January 17, 2012 making the Company ineligible for a sales tax deferral scheme.
18. According to the information and explanations given to us, the Company has not made any preferential
allotment of shares to parties and companies covered in the Register maintained under Sec. 301 of the Act. Accordingly, the provisions of clause 4 (xviii) of the Order are not applicable to the Company.
19. According to the information and explanations given to us and the records examined by us, securities have been created in respect of the debentures except for the personal guarantees by some of the directors together with collateral securities.
20. The Company has not raised money by way of public issues during the year and the provisions of the Order are not applicable.
21. To the best of our knowledge and belief and according to the information and explanations given to us, no fraud by the Company and no material fraud on the Company was noticed or reported during the year.
For Deloitte Haskins & Sells
Chartered Accountants
(Firm Registration No. 117365W)
R.D. Kamat
Partner
Mumbai, May 10, 2013 Membership No. 36822

Annual Report 2012-1376
Balance Sheet as at March 31, 2013
(` in crore)
Particulars Notes As at
March 31, 2013 As at
March 31, 2012 EquITy AND LIABILITIESShareholders’ fundsa) Share capital 4 1,382.27 1,382.27 b) Reserves and surplus 5 (275.44) 798.47 Foreign Currency Compulsory Convertible Bonds 6 1,340.00 1,340.00 Non-current liabilitiesa) Long-term borrowings 7 14,538.73 12,202.80 b) Deferred tax liabilities (Net) 8 - - c) Other Long term liabilities 10 2,216.07 4,795.55 d) Long-term provisions 11 5.14 1.00 Current liabilitiesa) Short-term borrowings 12 7,840.21 3,818.37 b) Trade payables 9 11,356.10 10,810.04 c) Other current liabilities 10 9,122.71 4,912.49 d) Short-term provisions 11 40.06 30.63
Total 47,565.85 40,091.62 ASSETSNon-current assetsa) Fixed assets 13
(i) Tangible assets 21,256.13 21,299.90 (ii) Intangible assets 18.02 20.02 (iii) Capital work-in-progress 2,610.38 1,760.47
b) Non-current investments 14 103.00 103.00 c) Long-term loans and advances 18 1,138.14 410.93 d) Other non-current assets 19 1,334.53 1,809.64 Current assets a) Current investments 14 - 0.00 b) Inventories 15 10,588.37 7,681.67 c) Trade receivables 16 4,716.49 3,996.93 d) Cash and bank balances 17 2,430.66 2,060.94 e) Short-term loans and advances 18 1,276.29 228.02 f) Other current assets 19 2,093.84 720.10
Total 47,565.85 40,091.62 The accompanying notes are an integral part of the financial statements
In terms of our report attached For and on behalf of the Board of Directors
For Deloitte Haskins & Sells Lalit Kumar Gupta Naresh Nayyar Chartered Accountants Managing Director and Deputy Chairman
Chief Executive Officer
R. D. Kamat S. S. Shaffi Suresh Jain Partner Company Secretary Chief Financial Officer Mumbai, May 10, 2013 Mumbai, May 10, 2013
77

Co
mp
an
y o
ve
rv
iew
ma
na
ge
me
nt
Dis
Cu
ss
ion
an
D a
na
lys
iss
us
tain
ab
ility
go
ve
rn
an
Ce
Fin
an
Cia
ls
Statement of Profit & Loss for the year ended March 31, 2013
In terms of our report attached For and on behalf of the Board of Directors
For Deloitte Haskins & Sells Lalit Kumar Gupta Naresh Nayyar Chartered Accountants Managing Director and Deputy Chairman
Chief Executive Officer
R. D. Kamat S. S. Shaffi Suresh Jain Partner Company Secretary Chief Financial Officer Mumbai, May 10, 2013 Mumbai, May 10, 2013
(` in crore)
Particulars NotesFor the year ended
March 31, 2013For the year ended
March 31, 2012
INCOME
Revenue from operations 20 88,578.12 58,336.63 Other income 21 608.78 424.76 Total Revenue 89,186.90 58,761.39 ExPENSES
Cost of raw materials consumed 22 81,333.98 52,894.85 Purchases of traded goods 23 866.72 1,957.16 Changes in inventory of finished goods and work-in-progress 24 (236.88) (988.10)Employee benefits expense 25 185.66 134.56 Other expenses 26 3,386.74 2,662.16
85,536.22 56,660.63 Earnings before finance costs, depreciation / amortisation expenses, exceptional items and tax (EBIDTA)
3,650.68 2,100.76
Finance costs 27 3,423.58 1,386.84 Depreciation / amortization expense 13 1,296.06 761.94 Profit / (Loss) before exceptional items and tax (1,068.96) (48.02)Exceptional items 36 111.48 1,237.46 Profit / (Loss) before tax (1,180.44) (1,285.48)Tax expense:
(a) Current tax - - (b) Deferred tax - - Profit / (Loss) for the year from continuing operations (1,180.44) (1,285.48)Earnings per equity share (Face value ` 10 per share) : 28(1) Basic (in `) (8.64) (9.41)(2) Diluted (in `) (8.64) (9.41)The accompanying notes are an integral part of the financial statements

Annual Report 2012-1378
Cash Flow Statement for the year ended March 31, 2013
(` in crore)
ParticularsFor the year ended
March 31, 2013 For the year ended
March 31, 2012
(A) CASH FLOw FROM OPERATING ACTIvITIES
Net profit / (Loss) before tax and extraordinary items (1,180.44) (1,285.48)
Adjustments for :
Depreciation / amortisation {Including ` 0.54 crore (Previous year ` 25.77 crore) considered in exceptional items}
1,296.60 787.71
Fixed assets / capital work in progress written off / provided 0.23 -
Interest on income tax refund (1.74) (0.37)
Interest received on bank deposits (other than margin deposits) (8.61) (100.76)
Loss / (Profit) on sale of fixed assets (net) 0.01 (0.08)
Unrealised exchange differences 35.73 212.79
Mark to market - commodity hedging losses 24.17 -
Interest (Including ` 110.94 crore (Previous year ` 433.44 crore) considered in exceptional items)
2,815.14 1,451.95
Bad debts written off / doubtful debts provided for 2.34 (0.02)
Write back old liabilities / excess accrual (3.54) (29.46)
Operating profit before working capital changes 2,979.89 1,036.28
Working capital changes
Adjustments for :
Changes in inventories (2,904.72) (1,981.64)
Changes in receivables, advances and deposits (2,837.87) (2,582.94)
Changes in payables 1,956.97 4,049.53
Cash generated from operating activities (805.73) 521.23
Income tax refund / (payment) (net) (including interest) 14.58 (44.43)
Net cash (used) / generated from operating activities (A) (791.15) 476.80
(B) CASH FLOw FROM INvESTING ACTIvITIES
Additions to fixed assets / capital work in progress (2,216.71) (2,791.97)
Sale of fixed assets 0.04 1.11
Sale / (Purchase) of Investment in a subsidiary 0.00* (0.00)*
Placement of long term deposits (0.35) (826.45)
Encashment of long term deposits 65.48 2,174.87
Interest received on bank deposits (other than margin deposits) 14.26 98.68
Net cash used in investing activities (B) (2,137.28) (1,343.76)
79

Co
mp
an
y o
ve
rv
iew
ma
na
ge
me
nt
Dis
Cu
ss
ion
an
D a
na
lys
iss
us
tain
ab
ility
go
ve
rn
an
Ce
Fin
an
Cia
ls
(` in crore)
ParticularsFor the year ended
March 31, 2013 For the year ended
March 31, 2012
(C) CASH FLOw FROM FINANCING ACTIvITIES
Proceeds from borrowings (including funding of interest (refer note 7(ii)(c))
10,737.41 9,448.78
Repayment of borrowings and sales tax liabilities (10,921.32) (5,437.00)Changes in short term borrowings (net) 6,226.26 104.72 Interest paid (3,201.83) (1,736.52)Bills of exchange honoured (74.21) (1,495.03)Bills of exchange accepted 62.67 299.36 Net cash generated from financing activities (C) 2,828.98 1,184.31 Net (decrease) / increase in cash and cash equivalents (A+B+C)
(99.45) 317.35
Cash and cash equivalents at the beginning of the year 440.16 122.81 Cash and cash equivalents at the end of the year 340.71 440.16 Net (decrease) / increase in cash and cash equivalents (99.45) 317.35
Notes:
1 Non cash transaction:
During the year, the Company exited the Corporate Debt Restructuring Scheme resulting in termination of Master Restructuring Agreement dated December 17, 2004 (“the MRA”) and entered into a Common Loan Agreement dated March 25, 2013 (“the CLA”) with the lenders for the loan facilities which were hitherto being governed by the MRA.
2 Cash and cash equivalents included in the cash flow statement comprise of the following balance sheet amounts:
(` in crore)
Particulars As at
March 31, 2013 As at
March 31, 2012 Cash on hand and balances with banksCash and cash equivalents (refer note 17) 340.71 440.18 Less : Effect of exchange rate changes 0.00* 0.02 Cash and cash equivalents as restated 340.71 440.16 *amount less than ` 0.01 crore
In terms of our report attached For and on behalf of the Board of Directors
For Deloitte Haskins & Sells Lalit Kumar Gupta Naresh Nayyar Chartered Accountants Managing Director and Deputy Chairman
Chief Executive Officer
R. D. Kamat S. S. Shaffi Suresh Jain Partner Company Secretary Chief Financial Officer Mumbai, May 10, 2013 Mumbai, May 10, 2013
Cash Flow Statement for the year ended March 31, 2013

Annual Report 2012-1380
Notes to financial statements for the year ended March 31, 2013
1. CORPORATE INFORMATION:
Essar Oil Limited (The Company) is a public limited company domiciled in India and incorporated under the provisions of the Companies Act, 1956. The equity shares of the Company are currently listed on the Bombay Stock Exchange (BSE) and National Stock Exchange (NSE) in India. It is primarily engaged in the business of refining and marketing of petroleum products in domestic and overseas markets. It is also engaged in the business of Exploration and Production.
2. BASIS OF PREPARATION:
The financial statements of the Company have been prepared in accordance with Generally Accepted Accounting Principles in India (“Indian GAAP”). The Company has prepared these financial statements to comply in all material respects with the Accounting Standards notified under the Companies (Accounting Standards) Rules, 2006 (as amended) and the relevant provisions of the Companies Act, 1956. The financial statements of the Company have been prepared on an accrual basis and under the historical cost convention. Attention is invited to note (7)(ii)(a) and (c).
3. SuMMARy OF SIGNIFICANT ACCOuNTING POLICIES:
a) use of estimates
The preparation of financial statements in conformity with Indian GAAP requires the management of the Company to make judgments, estimates and assumptions that affect the reported amounts of revenues, expenses, assets and liabilities and disclosures relating to contingent liabilities, at the end of the reporting period. Though the management believes that the estimates used are prudent and reasonable and are based on management’s knowledge of current events and actions, actual results could differ from these estimates resulting in material adjustments to be recognized in the periods in which the results are known / materialise.
b) Revenue recognition
Revenue on sale of goods is recognised when property in the goods is transferred to the buyer for a price or when all significant risks and rewards of ownership have been transferred to the buyer and no effective control is retained by the Company in respect of the goods transferred to a degree usually associated with ownership and no significant uncertainty exists regarding the amount of consideration that will be derived from the sale of goods.
Revenue on transactions of rendering services is recognised under the completed service contract method. Contract is regarded as completed when no significant uncertainty exists regarding the amount of consideration that will be derived from rendering the services.
Interest income is recognized on time proportion basis taking into account the amount outstanding and rate applicable.
c) Government grants
Government grants are recognised only when there is reasonable assurance that the conditions attached to the grants will be complied with and where such benefits have been earned and it is reasonably certain that the ultimate collection will be made.
d) Tangible assets and depreciation
i. Tangible Assets
Tangible assets are recorded at cost less accumulated depreciation and impairment loss, if any. Cost is inclusive of non-recoverable duties and taxes, cost of construction including erection, installation, commissioning, know how and expenditure during construction including borrowing costs and results of trial run operations.
ii. Depreciation
Depreciation on plant and machinery is provided as per straight line method. All other assets are depreciated as per
81

Co
mp
an
y o
ve
rv
iew
ma
na
ge
me
nt
Dis
Cu
ss
ion
an
D a
na
lys
iss
us
tain
ab
ility
go
ve
rn
an
Ce
Fin
an
Cia
ls
Notes to financial statements for the year ended March 31, 2013
written down value method. Depreciation is computed at the rates based on the estimated useful lives of the assets or at the rates provided under Schedule XIV of the Companies Act, 1956, whichever is higher.
Depreciation on additions / deductions to fixed assets made during the year is provided on a pro-rata basis from / upto the date of such additions / deductions, as the case may be.
Cost of assets purchased and/or constructed by the Company whose ownership vests with others by virtue of a contract or otherwise, are amortised at the higher of rates based on the estimated useful lives of the assets or the contract period, or at the rates provided under Schedule XIV of the Companies Act, 1956.
e) work in progress and Expenditure during construction period
Direct expenditure on projects or assets under construction or development is shown under capital work-in-progress.
Expenditure incidental to the construction of projects or assets under construction or development that take substantial period of time to get ready for their intended use is accumulated as expenditure during construction, pending allocation to fixed assets and other relevant accounts, as applicable.
f) Intangible assets and amortisation
Intangible assets are recognised only when it is probable that the future economic benefits that are attributable to the assets will flow to the Company and the cost of the assets can be measured reliably. Intangible assets are stated at cost less accumulated amortisation and impairment loss, if any.
Intangible assets are amortised over the best estimate of their useful lives, subject to a
rebuttable presumption that such useful lives will not exceed ten years.
g) Oil and gas exploration and development of assets
The Company follows the full cost method of accounting for its oil and gas exploration and development activities whereby, all costs associated with acquisition, exploration and development of oil and gas reserves, are capitalised under capital work-in-progress, irrespective of success or failure of specific parts of the overall exploration activity within or outside a cost centre (known as ‘cost pool’).
Exploration and evaluation expenditure remain outside the cost pool until determination of commercial reserves or otherwise. These costs remain un-depleted, subject to there being no evidence of impairment. When any field in a cost pool is ready to commence commercial production, the accumulated costs in that cost pool are transferred from capital work-in-progress to the gross block of assets under producing properties. Subsequent exploration expenditure in that cost pool is added to the gross block of assets either on commencement of commercial production from a field discovery or failure. In case any block is surrendered, the accumulated exploration expenditure pertaining to such block is transferred to the gross block of assets within the cost pool.
Expenditure carried within each cost pool (including future development cost) is depleted on a unit-of-production basis with reference to quantities, with depletion computed on the basis of the ratio that oil and gas production bears to the balance proved reserves at commencement of the year.
h) Impairment of assets
The Company assesses at each balance sheet date whether there is any indication that an asset may be impaired. If any such indication exists, the Company estimates the recoverable amount of the asset. If such recoverable

Annual Report 2012-1382
amount of the asset is less than its carrying amount, the carrying amount is reduced to its recoverable amount. The reduction is treated as an impairment loss and is recognised in the statement of profit and loss. If at the balance sheet date, there is an indication that a previously assessed impairment loss no longer exists, the recoverable amount is reassessed and the asset is reflected at the recoverable amount but limited to the carrying amount that would have been determined (net of depreciation / amortisation) had no impairment loss been recognised in prior accounting periods.
i) valuation of inventories
Inventories (other than crude oil extracted by exploration and production segment) are valued at the lower of cost and net realisable value. The cost of crude inventory is determined using the first in first out cost formula and the cost of finished goods inventory, work-in-progress, stores and spares and other consumable including coal inventories are determined using the weighted average cost formula. Finished goods and work-in-progress include costs of conversion and other costs incurred in bringing the inventories to their present location and condition.
Closing stock of crude oil extracted and in saleable condition is valued at net realisable value.
j) Foreign currency transactions
Foreign currency transactions are accounted at the rate normally prevailing on the transaction date. Monetary items denominated in foreign currency other than net investment in non-integral foreign operations are translated at the exchange rate prevailing at the balance sheet date. In case of non-integral foreign operations, all the assets and liabilities are translated at the closing rate whereas the income and expense items are translated at average exchange rate during the period.
Exchange differences arising on a monetary item that, in substance, forms part of an enterprise’s net investments in a non-integral operation are accumulated in a foreign currency translation reserve until the disposal of the net investment, at which time the same is recognised in the statement of profit and loss.
Exchange differences arising on settlement or conversion of short term monetary items are recognised in the statement of profit and loss or capital work-in-progress / expenditure during construction, as applicable. Exchange differences relating to long term monetary items are accounted as under:
(i) in so far as they relate to the acquisition of a depreciable capital asset is added to / deducted from the cost of the asset and depreciated over the balance useful life of the asset;
(ii) in other cases such differences are accumulated in “Foreign Currency Monetary Item Translation Difference Account” and amortised in the statement of profit and loss over the balance life of the long term monetary item or March 31, 2020 whichever is shorter.
Premia or discounts arising on forward exchange contracts entered into for the purpose of hedging currency risk, are recognized as finance cost in the statement of profit and loss or expenditure during construction, as applicable, over the life of the contract.
The impact of exchange rate differences between the rates prevailing on the date of forward exchange contracts and the rate prevailing on the balance sheet date or on the dates of settlement of forward exchange contracts whichever is earlier, is recognised in the statement of profit and loss or expenditure during construction, as applicable.
Notes to financial statements for the year ended March 31, 2013
83

Co
mp
an
y o
ve
rv
iew
ma
na
ge
me
nt
Dis
Cu
ss
ion
an
D a
na
lys
iss
us
tain
ab
ility
go
ve
rn
an
Ce
Fin
an
Cia
ls
k) Derivative instruments (other than forward exchange contracts)
Commodity derivatives
In order to hedge its exposure to commodity price risk, the Company enters into non-speculative hedges such as forward, option or swap contracts and other appropriate derivative instruments.
The Company designates such derivative contracts in a cash flow hedging relationship by applying the hedge accounting principles set out in “Accounting Standard 30 Financial Instruments: Recognition and Measurement”. Gains/ losses on these derivative contracts arising from changes in fair value or settlement are recognized directly in “cash flow hedge reserve” under Reserves and surplus. Amounts accumulated in the “cash flow hedge reserve” are recycled to the statement of profit and loss in the same periods during which the forecasted transaction affects profit and loss. The ineffective portion is recognized immediately in the statement of profit and loss. Hedge accounting is discontinued if the hedging instrument no longer meets the criteria for hedge accounting, gets expired or is sold, terminated or exercised before the occurrence of the forecasted transaction.
For the contracts which are not form part of hedge accounting, the premium and gains / losses arising from settled derivative contracts and mark to market (MTM) losses in respect of outstanding derivative contracts as at balance sheet date are credited for gains or charged for losses to the raw material consumed in so far as it relates to the derivative instruments taken to hedge risk of movement in price of crude oil, and credited for gains or charged for losses to sales in so far as it relates to the derivative instruments (including margin cracks) taken to hedge risk of movement in price of finished products. The net MTM gains in respect of
outstanding derivatives contracts are not recognised on conservative basis.
Others
Gains or losses arising on settlement of financial derivative contracts are credited for gains or charged for losses to the statement of profit and loss or expenditure during construction, as applicable, as and when settlement takes place. The net MTM losses in respect of outstanding derivative contracts as at the balance sheet date are provided for. The net MTM gains in respect of outstanding derivative contracts are not recognised on conservative basis.
l) Lease
Operating lease
Lease expenses and lease income on operating leases are recognised on a straight line basis over the lease term in the statement of profit and loss or expenditure during construction, as applicable.
Finance lease
As lessee:
Assets taken on lease are capitalised at fair value or net present value of the minimum lease payments, whichever is lower. Depreciation on the assets taken on lease is charged at the rate applicable to similar type of fixed assets as per accounting policy of the Company on depreciation. If the leased assets are returnable to the lessor on the expiry of the lease period, depreciation is charged over its useful life or lease period, whichever is shorter. Lease payments made are apportioned between the finance charges and reduction of the outstanding liability in respect of assets taken on lease. The leases are generally recognised in the books of account at the inception of the lease term. The leases of assets under construction are recognized on commencement of the lease term in accordance with International Accounting Standard 17-Leases, as there is
Notes to financial statements for the year ended March 31, 2013

Annual Report 2012-1384
no specific guidance available under Indian Accounting Standard (AS-19) Leases.
As lessor:
The assets given under a finance lease are recognised as a receivable in the balance sheet at an amount equal to the net investment in the lease. The recognition of finance income is based on a pattern reflecting a constant periodic rate of return on the net investment outstanding in respect of the finance lease.
m) Employee benefits
i. Post-employment benefit plans
Contribution to defined contribution retirement benefit schemes are recognised as expense in the statement of profit and loss / expenditure during construction, as applicable, when employees have rendered services entitling them to contributions.
For defined benefit schemes, the cost of providing benefits is determined using the Projected Unit Credit Method, with actuarial valuations being carried out at each balance sheet date. Actuarial gains and losses are recognised in full in the statement of profit and loss / expenditure during construction, as applicable, for the period in which they occur. Past service cost is recognised immediately to the extent that the benefits are already vested, and is otherwise amortised on a straight-line basis over the average period until the benefits become vested.
The retirement benefit obligation recognised in the balance sheet represents the present value of the defined benefit obligation and is adjusted both for unrecognised past service cost, and for the fair value of plan assets. Any asset resulting from this calculation is limited to the present value of available refunds and reductions in future contributions to the scheme, if lower.
ii. Short-term employee benefits
The undiscounted amount of short-term employee benefits expected to be paid in exchange for the services rendered by employees is recognised during the period when the employee renders the services. These benefits include compensated absences such as paid annual leave, and performance incentives.
iii. Long-term employee benefits
Compensated absences which are not expected to occur within twelve months after the end of the period in which the employee renders the related services are recognised as a liability at the present value of the defined benefit obligation determined actuarially by using Projected Unit Credit Method at the balance sheet date.
iv. Employee Stock Option Scheme
Stock options granted to employees under the employees’ stock option scheme (ESOS) are accounted by adopting the intrinsic value method in accordance with the SEBI (Employee Stock Option Scheme and Employee Stock Purchase Scheme) Guidelines, 1999 and the Guidance Note on accounting for employee share based payments issued by the ICAI. Accordingly, the excess of market price of the shares over the exercise price is recognised as deferred employee compensation and is charged to statement of profit and loss account on straight-line basis over the vesting period.
The number of options expected to vest is based on the best available estimate and are revised, if necessary, if subsequent information indicates that the number of stock options expected to vest differs from previous estimates.
n) valuation of investments
Investments are classified into long term and current investments. Long term investments
Notes to financial statements for the year ended March 31, 2013
85

Co
mp
an
y o
ve
rv
iew
ma
na
ge
me
nt
Dis
Cu
ss
ion
an
D a
na
lys
iss
us
tain
ab
ility
go
ve
rn
an
Ce
Fin
an
Cia
ls
are carried at cost. Diminution in value of long term investments is provided for when it is considered as being other than temporary in nature. Current investments are carried at the lower of cost and fair value.
o) Borrowing costs
Borrowing costs that are attributable to the acquisition, construction or development of qualifying assets (i.e. the assets that take substantial period of time to get ready for its intended use) are charged to expenditure during construction.
Other borrowing costs are recognised in the statement of profit and loss.
p) Taxation
Provision for current taxation is computed in accordance with the relevant tax laws and regulations. Deferred tax is recognised on timing differences between the accounting and the taxable income for the year and quantified using the tax rates and laws enacted or substantively enacted as on the reporting date. Deferred tax assets are recognised only when there is a reasonable certainty that sufficient future taxable income will be available against which they will be realised. Where there is a carry forward of losses or unabsorbed depreciation, deferred tax assets are recognised only if there is a virtual certainty supported by convincing evidence of availability of taxable income against which such deferred tax assets can be realised in future.
Minimum alternative tax (MAT) paid in accordance with tax laws, which gives rise to future economic benefit in form of adjustment of future income tax liability, is considered as an asset if there is convincing evidence that the Company will pay normal tax after the tax holiday period. Accordingly it is recognised as an asset in the balance sheet when it is probable that future economic benefit associated with it
will flow to the Company and the asset can be measured reliably.
q) Provisions, contingent liabilities, contingent assets and commitments
A provision is recognised when there is a present obligation as a result of a past event and it is probable that an outflow of resources embodying economic benefits will be required to settle the obligation. Contingent liabilities in respect of show cause notices are considered only when converted into demand. Contingent liabilities are not recognised but disclosed unless the probability of an outflow of resources is remote. Contingent assets are neither recognised nor disclosed.
Contingent Liabilities and commitments are assessed and reported only for items exceeding ` 0.10 crore in each case.
r) Measurement of EBIDTA
The Company has elected to present earnings before interest (including finance costs), depreciation / amortization expenses and tax (EBIDTA) as a separate line item on the face of the statement of profit and loss. The Company measures EBIDTA on the basis of profit / (loss) from continuing operations and does not include interest (including finance costs), depreciation / amortization expenses, exceptional and extraordinary items and tax.
Notes to financial statements for the year ended March 31, 2013

Annual Report 2012-1386
4. SHARE CAPITAL
(` in crore)
Particulars As at March 31, 2013 As at March 31, 2012
Number of shares Amount Number of shares Amount
Authorised
Equity shares of ` 10 each 5,000,000,000 5,000.00 5,000,000,000 5,000.00
Issued and subscribed
Equity shares of ` 10 each 1,427,593,086 1,427.59 1,427,593,086 1,427.59
Paid up
Equity shares of ` 10 each fully paid up 1,365,667,086 1,365.67 1,365,667,086 1,365.67
Add : Forfeited shares - Equity shares of ` 10 each
61,926,000 16.60 61,926,000 16.60
1,382.27 1,382.27
a) Reconciliation of the number of shares outstanding at the beginning and at the end of the reporting period
(` in crore)
Particulars As at March 31, 2013 As at March 31, 2012
Number of shares Amount Number of shares Amount
Shares outstanding at the beginning of the year
1,365,667,086 1,365.67 1,365,667,086 1,365.67
Add : Equity Shares issued during the year
- - - -
Shares outstanding at the end of the year
1,365,667,086 1,365.67 1,365,667,086 1,365.67
b) Terms / rights attached to the equity Shares / Global depository shares (GDS)
The Company has only one class of equity shares having a par value of ` 10 per share. Each holder of equity share is entitled to one vote per share.
In the event of liquidation of the Company, the holders of equity shares will be entitled to receive remaining assets of the Company, after distribution of all preferential amounts. The distribution will be in proportion to the number of equity shares held by the shareholders.
Holders of GDS will be entitled to receive dividends, subject to the terms of the Deposit Agreement, to the same extent as the holders of shares, less the fees and expenses payable under such Deposit Agreement and any Indian tax applicable to such dividends. Holders of GDS will not have voting rights with respect to the Deposited Shares.
Notes to financial statements for the year ended March 31, 2013
87

Co
mp
an
y o
ve
rv
iew
ma
na
ge
me
nt
Dis
Cu
ss
ion
an
D a
na
lys
iss
us
tain
ab
ility
go
ve
rn
an
Ce
Fin
an
Cia
ls
c) Shares held by holding / ultimate holding company and / or their subsidiaries / associates
(` in crore)
Particulars As at March 31, 2013 As at March 31, 2012
Number of shares Amount Number of shares Amount
4,761,000 GDS (Previous year 4,761,000 GDS) held by Essar Oil & Gas Limited (formerly known as Vadinar Oil), Mauritius, the holding Company pursuant to section 4(6) of the Companies Act, 1956
728,433,000 728.43 728,433,000 728.43
1,843,724 GDS (Previous year 1,843,724 GDS) held by Essar Energy Holdings Ltd., Mauritius, subsidiary of the holding company
282,089,772 282.09 282,089,772 282.09
Equity shares held by Essar Energy Holdings Ltd., Mauritius, subsidiary of the holding company
178,858,624 178.86 178,858,624 178.86
Equity Shares held by Essar Power Hazira Holdings Ltd (name changed from Hazira Steel 2), subsidiary of ultimate holding company, Essar Global Fund Limited
100 0.00* 100 0.00*
* Amount less than ` 0.01 crore
d) Stock Options
On December 2, 2011, the Company approved grant of 32,11,391 options (convertible at the option of the eligible employees into equivalent number of equity shares of ` 10/- each of the Company, in three equal installments i.e. at the end of 3rd / 4th / 5th year from the grant date) to the eligible employees and Executive Directors of the Company pursuant to Essar Oil Employee Stock Option Scheme 2011 approved by the members at the 21st Annual General Meeting held on August 12, 2011. The exercise period for the options is 7 years from the date of vesting.
These stock options have been granted at an option value of ` 69.05 per equity share of face value of ` 10/- each (i.e. the closing price of the equity shares of the Company on December 01, 2011 at the National Stock Exchange of India Ltd, being the exchange having the higher quantity of trading of Company’s shares).
2,519,058 options (Previous year 2,910,749) were outstanding as on March 31, 2013. The Remuneration Committee of the Board of Directors has noted the forfeiture of 391,691 stock options on May 10, 2013.
Notes to financial statements for the year ended March 31, 2013

Annual Report 2012-1388
e) Details of shareholders (including GDS holders) holding more than 5% shares in the Company
Particulars As at March 31, 2013 As at March 31, 2012
Number of shares % of shares Number of shares % of shares
4,761,000 Global Depository Shares (“GDS”) (Previous year 4,761,000 GDS) held by Essar Oil & Gas Limited (formerly known as Vadinar Oil) Mauritius, the holding Company pursuant to section 4(6) of the Companies Act, 1956
728,433,000 53.34% 728,433,000 53.34%
1,843,724 GDS (Previous year 1,843,724 GDS) held by Essar Energy Holdings Ltd., Mauritius, subsidiary of the holding company
282,089,772 20.66% 282,089,772 20.66%
Equity shares held by Essar Energy Holdings Ltd., Mauritius, subsidiary of the holding company
178,858,624 13.10% 178,858,624 13.10%
5. RESERvES AND SuRPLuS
(` in crore)
Particulars As at
March 31, 2013 As at
March 31, 2012
Capital reserve
Balance as per last balance sheet 40.89 40.89
(A) 40.89 40.89
Securities premium account
Balance as per last balance sheet 4,928.45 4,928.45
(B) 4,928.45 4,928.45
Debenture redemption reserve
Balance as per last balance sheet 37.21 37.21
(C) 37.21 37.21
General reserve
Balance as per last balance sheet 22.25 22.25
(D) 22.25 22.25
Cash flow hedge reserve
Balance as per last balance sheet - -
Add: Transferred during the year (refer note 34) 104.90 -
(E) 104.90 -
Notes to financial statements for the year ended March 31, 2013
89

Co
mp
an
y o
ve
rv
iew
ma
na
ge
me
nt
Dis
Cu
ss
ion
an
D a
na
lys
iss
us
tain
ab
ility
go
ve
rn
an
Ce
Fin
an
Cia
ls
5. RESERvES AND SuRPLuS
(` in crore)
Particulars As at
March 31, 2013 As at
March 31, 2012
Surplus / (Deficit) - Balance in statement of profit and loss
Balance as per last balance sheet (4,164.82) (2,879.34)
Add : Net profit / (loss) for the year (1,180.44) (1,285.48)
(F) (5,345.26) (4,164.82)
Foreign currency monetary item translation difference account {refer note 3(j)}
Balance as per last balance sheet gain / (loss) (65.51) -
Add : Effect of foreign exchange rate variation during the year 43.83 (65.51)
Less : Amortisation during the year 42.20 -
(G) (63.88) (65.51)
Total (A+B+C+D+E+F+G) (275.44) 798.47
6. FOREIGN CuRRENCy COMPuLSORy CONvERTIBLE BONDS(FCCB)
The Company had issued FCCB of USD 115 million on June 15, 2010 and USD 147 million on July 9, 2010 which were convertible into 38,833,443 and 45,016,372 equity shares or into 253,813 and 294,224 GDS at a fixed price of ` 138 per share and ` 153 per share at the option of the holders of the FCCB until their maturity
dates of June 15, 2028 and September 30, 2028 respectively. The bonds bear interest of 5% per annum, subject to certain conditions, on the outstanding principal amount of the bonds from (and including) January 1, 2016 payable semi-annually. During the financial year 2011-12, the terms of the bonds were modified whereby these have become compulsorily convertible into equity share / GDS on the same terms and conditions as above.
7. LONG TERM BORROwINGS
(` in crore)
Particulars As at March 31, 2013 As at March 31, 2012
Non Current Current Non Current Current
(A) Secured loans / Borrowings
Debentures
Non convertible debentures (refer note (ii)(a) below)
152.18 - 184.21 -
(i) 152.18 - 184.21 -
Term loans and funded interest facilities
From banks 11,440.98 2,090.31 8,469.15 1,349.60
From financial institutions 1,010.59 232.57 1,242.73 312.22
Notes to financial statements for the year ended March 31, 2013

Annual Report 2012-1390
7. LONG TERM BORROwINGS
(` in crore)
Particulars As at March 31, 2013 As at March 31, 2012
Non Current Current Non Current Current
Funded interest facilities (refer note (ii)(c) below)
From banks 1,269.29 - 755.66 -
From financial institutions 599.50 - 346.58 -
Amount disclosed under the head of “Other Current / Long Term Liabilities” (refer note 10)
- (2,322.88) - (1,661.82)
(ii) 14,320.36 - 10,814.12 -
(A) - (i+ii) 14,472.54 - 10,998.33 -
(B) unsecured loans / Borrowings
Finance lease obligation {refer note 37(a)(i)}
From related parties (refer note 45) 44.69 7.19 45.11 12.98
From others 1.19 0.32 1.23 0.53
Other loans
Conditional grant from a bank 7.14 - 6.85 -
From related parties (refer note 45) 13.17 32.58 1,151.28 27.92
Amount disclosed under the head of “Other Current / Long Term Liabilities” (refer note 10)
- (40.09) - (41.43)
(B) 66.19 - 1,204.47 -
Total (A+B) 14,538.73 - 12,202.80 -
The classification of loans between current liabilities and non-current liabilities continues based on repayment schedule under respective agreements as no loans have been recalled due to non-compliance of conditions under any of the loan agreements. The non compliance of conditions under the loan agreements are primarily arising out of the order of the Hon’ble Supreme Court dated January 17, 2012 (refer note 36). This is in accordance with the guidance issued by the Institute of Chartered Accountants of India on Revised Schedule VI to the Companies Act, 1956.
Notes to financial statements for the year ended March 31, 2013
91

Co
mp
an
y o
ve
rv
iew
ma
na
ge
me
nt
Dis
Cu
ss
ion
an
D a
na
lys
iss
us
tain
ab
ility
go
ve
rn
an
Ce
Fin
an
Cia
ls
(i) Security for term loans and funded interest facilities from banks and financial institutions and debentures:
a) Term loans and funded interest facilities of ` 6,996.08 crore (Previous year ` 9,362.06 crore) and debentures of ` 152.18 crore (Previous year ` 184.21 crore) are secured / to be secured by first ranking security interests (pari passu with loans for refinery expansion, refinery optimisation, refinanced ECB Loan and Sales tax / General purpose term loan) on all immovable assets (except certain leased out assets), all movable assets other than current assets and second ranking security interests on current assets, present and future, security interest on rights, title and interests under project documents, trust and retention accounts, insurance policies all in relation to the refinery including refinery expansion and refinery optimisation, by pledge of certain shares of the Company held by promoters, personal guarantees of some of the promoters and other collaterals being charge on pledge of certain shares of the Group Company and charge by way of mortgage over a property of Group Company. Term Lenders have agreed to release personal guarantees and collaterals thereto and majority of the lenders have already released the same and other are in process of releasing. A term loan of 60.78 crore (Previous year ` 109.82 crore) {(including funded interest facilities of 21.37 crore) (Previous year 44.12 crore)} is also secured by a corporate guarantee and certain assets of a Group Company.
b) Corporate term loan from a bank of ` 1,000.00 crore (Previous year ` 500.00 crore) is secured by first charge on all current assets (ranking pari passu with working capital facility) excluding that of exploration and production division, second charge by way of mortgage of land and building and plant and machinery and other assets excluding certain category of assets, personal guarantees of some of the promoters and corporate guarantee by a Group Company
and other collaterals being second charge on pledge of certain shares of the Company and that of a Group Company held by promoters and second charge by way of mortgage over a property of Group Company.
c) Sales tax / General purpose term loan from a bank of ` 3,143.00 crore (Previous year ` Nil) is secured / to be secured by first ranking security interests (pari passu with loans for refinery, refinery expansion, Refinanced ECB Loan and refinery optimisation) on all immovable assets (except certain leased out assets), all movable assets other than current assets and second ranking security interests on current assets, present and future, personal guarantees of some of the promoters and certain undertakings provided from holding companies.
d) Refinanced ECB Loan from bank of ` 1,466.93 crore (Previous year ` Nil) is secured/to be secured by first ranking security interests (pari passu with loans for refinery, refinery expansion, refinery optimisation and Sales tax / General purpose term loan) on all immovable assets of Refinery Division, all movable assets of refinery division other than current assets and second ranking security interests on current assets, present and future, pledge of certain shares of the Company held by promoters.
e) Term loans of ` 3,990.43 crore (Previous year ` 4,562.03 crore) for the Refinery expansion are secured / to be secured by first ranking security interests (pari passu with loans for refinery, refinery optimisation, Refinanced ECB and Sales tax / General purpose term loan) on all immovable assets, all movable assets other than current assets and second ranking security interests on current assets, present and future, charge over immovable properties leased to entities implementing the terminal utility, power utility and township utility (subject to prior charge in favour of the lenders financing the said utilities), security interest on rights, title and interests under project documents, trust and retention accounts, insurance policies
Notes to financial statements for the year ended March 31, 2013

Annual Report 2012-1392
in relation to the refinery, including refinery expansion and further by pledge and non disposal undertaking of certain shares/global depository shares of the Company held by promoters / associates of promoters or of the Company, personal guarantees of promoters of the Company together with collateral securities and certain undertakings from holding and group companies and residual charge on the company’s participating interest and cash flows related to upstream oil and gas, coal bed methane fields and related assets subject to certain approvals.
f) Term loans of ` 1,013.45 crore (Previous year ` Nil) for the refinery optimisation are secured by first ranking security interests (pari passu with loans for refinery, refinery expansion, Refinanced ECB Loan and Sales tax / General purpose term loan) on all immovable assets (except certain leased out assets), all movable assets other than current assets and second ranking security interests on current assets, present and future, security interest on rights, title and interests under project documents, trust and retention accounts, insurance policies in relation to the refinery, refinery expansion and refinery optimisation and pledge of shares of the Company.
g) Term loans of ` 534.07 crore (Previous year ` 306.21 crore) is secured by first charge on immovable assets and movable assets (present and future), first charge over book debts, operational cash flows, receivables, trust and retention account, Debt Service Reserve account, participating interest under CBM contract, security interest on rights, title and interests under the project documents, insurance policies, clearances, rights under letter of credit, guarantee, performance bond, corporate guarantee and bank guarantees, all in relation to a CBM Project.
h) Term loan from a Bank of ` 1.20 crore (Previous year ` 6.00 crore) is secured by hypothecation of current assets of an oilfield, bank escrow
accounts for certain receivables and corporate guarantee by a Group Company.
(ii) Repayment and other terms:
a) Secured redeemable non – convertible deben- tures (“NCDs”) of ` 105/- each consists of :
13,868,050 (Previous year 16,918,250) – 12.50% NCDs of ` 105/- each amounting to ` 145.61 crore (Previous year ` 177.64 crore).
700,000 (Previous year 700,000) – 12.50% NCDs, of ` 100 each on private placement basis partly paid up at ` 93.86 per debenture amounting to ` 6.57 crore (Previous year ` 6.57 crore).
During the year, the Company refinanced its rupee borrowings with one of its existing lenders into an External Commercial Borrowing (ECB). This resulted in conversion of debentures having face value of ` 32.03 crore also into the ECB loan. Further, as per the Common Loan Agreement (“the CLA”) entered with lenders post exit from the Corporate Debt Restructuring (CDR) Scheme, the Company has agreed to pay interest on a monthly/quarterly basis, on debentures held by the erstwhile CDR lenders at a floating rate linked to the base rate of the respective bank prevailing on August 8, 2012, with effect from January 1, 2012, resulting in the interest rates ranging from 12.32% p.a. to 12.75% p.a. The Company is also in the process of sending offer letters to the remaining debenture holders (i.e. other than lenders) giving them, inter alia, an option for prepayment of debentures along with accumulated interest in full. The principal amount of debentures is otherwise payable from December 2014 to June 2018 and accumulated interest from December 2014 to March 2027, with an option to prepay certain portion of interest at a discounted rate. As an alternative, these debenture holders can opt for revising the terms and conditions applicable to debentures in line with the terms contained in the CLA.
Notes to financial statements for the year ended March 31, 2013
93

Co
mp
an
y o
ve
rv
iew
ma
na
ge
me
nt
Dis
Cu
ss
ion
an
D a
na
lys
iss
us
tain
ab
ility
go
ve
rn
an
Ce
Fin
an
Cia
ls
The Hon’ble High Court of Gujarat has, in response to the Company’s petition, ruled vide its orders dated August 04, 2006 and August 11, 2006 that the interest on certain categories of debentures should be accounted on cash basis. In accordance with the said petition / order, funded / accrued interest liabilities amounting to ` 417.72 crore (Previous year ` 428.24 crore) as at March 31, 2013 have not been accounted for. This amount carries interest rate ranging from fixed rate of 5% to a floating rate of 12.75% and is repayable from December 2014 to March 2027.
b) The Interest rates for Common Loan Agreement (“the CLA”) (earlier Master Restructuring Agreement (“the MRA”)) loans from Banks and Financial institutions amounting to ` 5,459.20 crore (Previous year ` 7,070.04 crore) will based on their prime lending rate / base rate / LIBOR plus margin (margin ranges from 2.12% to 3.00%) with different repayment installments starting from December 2009 to March 2026.
c) During the year, the Company exited Corporate Debt Restructuring Scheme resulting in termination of the MRA dated December 17, 2004 and entered into a CLA dated March 25, 2013 with the lenders for the loan facilities which were hitherto being governed by the MRA. The MRA gave an option, subject to consent of lenders, to the Company to prepay certain funded interest loans (the FS loans) of ` 2,471.63 crore on or before April 24, 2012 without interest. The FS loan has not been prepaid before April 24, 2012 and is now governed by the CLA.
In order to give accounting effect to reflect substance of the transaction, the FS loan was, since inception, measured by the Company in accordance with the principles of IAS 39, Financial Instruments, Recognition and Measurement, in absence of specific guidance in Indian GAAP to cover the specific situation. In continuance of the above said principle and applying the principle of Accounting Standard
AS 30, Financial Instruments, Recognition and Measurement, the FS loan has, upon signing of the CLA, been re-measured since inception, considering present value of cash flows inclusive of interest. Accordingly, the gross liability of ` 3,163.84 crore of the FS loans and funded interest thereon as at March 31, 2013 (comprising of ` 2,126.36 crore to the banks and 1,037.48 crore to the financial institutions) have been measured at ` 1,833.84 crore (comprising of ` 1,234.34 crore to the banks and ` 599.50 crore to the financial institutions). Consequently, borrowing cost of ` 536.71 crore attributable to construction of the Refinery Project based on such re-measurement has been capitalised as part of cost of Fixed Assets and balance borrowing cost of ` 110.94 crore has been recognised in the statement of profit and loss.
The FS Loans of ` 2,471.63 crore is repayable in various installments from March 2021 to March 2026 and the Funded Interest thereon as at March 31, 2013 amounting to 692.19 crore is repayable in 40 equal quarterly installments beginning June 30, 2015.
A funded interest loan of ` 206.88 crore (Previous year ` 206.88 crore) is payable in a single bullet payment in 2031 and is continued to be measured in accordance with the aforementioned principles at ` 34.95 crore (Previous year ` 31.67 crore).
d) Term Loans amounting to ` 4,563.97 crore (Previous year ` 4,071.90 crore) carry interest rate linked with respective banks’ prime lending rate / base rate / LIBOR plus margin / liquidity premium and are repayable in installments starting from December 2012 ending in March 2020. Out of above ` 948.45 crore (Previous year ` 1,707.61 crore) pertains to Buyers’ Credit which will be ultimately converted into Term Loan.
e) Term loans amounting to ` 534.07 crore (Previous year 306.21 crore) carry interest rate linked with respective banks prime lending rate/
Notes to financial statements for the year ended March 31, 2013

Annual Report 2012-1394
base rate/LIBOR plus margin and are repayable in installments starting from March 2014 and ending in June 2021. Out of above ` 67.62 crore (Previous year ` 32.47 crore) pertains to Buyers’ credit which will be ultimately converted into term loan.
f) Term loans amounting to ` 1.20 crore (Previous year ` 6.00 crore) carry 12.80% interest rate with repayments ending in April 2013.
g) ECB Loan amounting to ` 439.90 crore (Previous year 490.13 crore) carry interest rate of LIBOR + 2.75% are repayable in installments ending in October 2018.
h) ECB Loan amounting to ` 1,466.93 crore (Previous year ` Nil) carry interest rate of 6 months LIBOR + 5.00% are repayable in installments starting from March 2015 ending in March 2023.
i) Corporate term loan amounting to ` 1,000.00 crore (Previous year ` 500.00 crore) carry interest rate at banks’ prime lending rate / base rate plus 3.75% (margin / liquidity premium) and is repayable in installments from June 2014 to March 2017.
j) General purpose term loan amounting to ` 3,143.00 crore (Previous year ` Nil) carry interest rate at banks’ prime lending rate / base rate plus 3.00% (margin / liquidity premium) and is repayable in installments from December 2012 to September 2018.
k) The pilot project for coal bed methane gas was partially financed by a conditional grant of USD 0.89 million (Previous year USD 0.89 million) and ` 2.31 crore (Previous year ` 2.31 crore) received from a bank. The conditional grant, in terms of the agreement, will be repayable in the event the Company puts the project to commercial use, and repayments to the bank will be based on gross annual sales derived from the commercial exploitation of the project, subject to a maximum repayment of 200% of the conditional grant. Commercial exploitation of the project is dependent upon getting necessary approvals from the Government of India.
l) Unsecured loans from related parties includes ` Nil (Previous year ` 1,109.00 crore) carrying interest rate 9.5% and Rupee loan amounting to ` 45.75 crore (Previous year ` 70.20 crore) carrying interest rate 10.25% repayable by April 25, 2014 in various installments.
8. DEFERRED TAx LIABILITIES (NET)
(` in crore)
ParticularsAs at
March 31, 2013 As at
March 31, 2012
Deferred tax liability
Fixed asset (excess net book value over written down value as per the provisions of the Income Tax Act, 1961)
(2,191.43) (1,731.99)
(A) (2,191.43) (1,731.99)
Deferred tax assets (restricted to the extent of deferred tax liability considering virtual / reasonable certainty, as applicable)
Disallowance u/s 43B of The Income Tax Act, 1961 1,826.24 1,366.73
Unabsorbed depreciation carried forward as per provisions of the Income Tax Act, 1961
365.11 365.11
Others 0.08 0.15
(B) 2,191.43 1,731.99
Net deferred tax liabilities (net) (A) + (B) - -
Notes to financial statements for the year ended March 31, 2013
95

Co
mp
an
y o
ve
rv
iew
ma
na
ge
me
nt
Dis
Cu
ss
ion
an
D a
na
lys
iss
us
tain
ab
ility
go
ve
rn
an
Ce
Fin
an
Cia
ls
9. TRADE PAyABLES
(` in crore)
Particulars As at March 31, 2013 As at March 31, 2012
Short term Long term Short term Long term
Micro and small enterprises (refer note 43) 2.51 - 1.79 -
Towards raw materials, goods and services 11,353.59 - 10,808.25 -
Total 11,356.10 - 10,810. 04 -
10. OTHER LONG TERM LIABILITIES / OTHER CuRRENT LIABILITIES
(` in crore)
Particulars As at March 31, 2013 As at March 31, 2012
Current Long term Current Long term Current maturities of secured long-term debts {refer note 7(A)}
2,322.88 - 1,661.82 -
Current maturities of unsecured long-term debts {refer note 7(B)}
32.58 - 27.92 -
Current maturities of finance lease obligations {refer note 7(B)}
7.51 - 13.51 -
Interest accrued but not due on loans/borrowings
73.54 - 57.46 173.72
Interest accrued and due on loans/borrowings
- - 1.62 -
Capital creditors 349.71 - 417.84 - Bills Payable for capital creditors 15.26 156.23* 174.18 - Statutory dues 3,085.63 1,936.96 2,021.47 4,519.56 Advances received from customers 2,263.56 - 451.96 - Security deposits 22.66 5.56 16.74 3.23 Unclaimed debenture interest and principal (secured)** {For security details refer notes under note 7(i)(a)}
29.53 - 36.45 -
Temporary overdrawn bank balances *** 855.10 - - - Other liabilities 64.75 117.32 31.52 99.04 Other Current Liabilities 9,122.71 4,912.49 Other Long term Liabilities 2,216.07 4,795.55
* Represents bills payable for capital creditors as at March 31, 2013, with or without roll over, ultimately convertible into long term loans in line with the term loan agreements.
** There is no amount due and outstanding (Previous year ` 0.05 crore amount due and outstanding) to be credited to Investor Education and Protection Fund as at balance sheet date.
*** Represents temporary overdrawn bank balances as per books of Accounts as on March 31, 2013 consequent to issue of cheques at year end.
Notes to financial statements for the year ended March 31, 2013

Annual Report 2012-1396
11. PROvISIONS
(` in crore)
Particulars As at March 31, 2013 As at March 31, 2012
Short term Long term Short term Long term Provision for employee benefits (refer note 44) Earned leave 36.90 - 30.63 - Gratuity 3.16 - - - Other Provisions Site restoration - 5.14 - 1.00 Total 40.06 5.14 30.63 1.00
(` in crore)
Movement in Provisions Provision for Site Restoration
2012-2013 2011-2012
Opening Balance 1.00 1.00 Add: Provision made during the year 4.14 - Closing Balance 5.14 1.00
Represents current cost of restoring the Exploration and Production sites on abandonment or decommissioning of Oil and Gas wells and facilities at the end of their economic life.
12. SHORT TERM BORROwINGS
(` in crore)
Particulars As at
March 31, 2013As at
March 31, 2012Secured Borrowings Buyers’ credits and bills discounting and advance against LCs 7,357.68 3,620.28 Bank overdraft 92.53 198.09 Working capital demand loan 390.00 - Total 7,840.21 3,818.37
Security for short term borrowing:
(i) Buyers’ credits, bills discounting, advance against LCs and working capital demand loan:
a) ` 6,491.93 crore (Previous year 3,286.65 crore) are secured by first charge on all current assets (ranking pari passu with Corporate term loan) excluding that of Exploration and Production division, second charge by way of mortgage of land and building and plant and machinery and other assets excluding certain category of assets, personal guarantees of promoters, corporate guarantee by a Group Company, other collaterals being second charge on pledge of certain shares of the Company and that of a Group Company held by promoters
and second charge by way of mortgage over a property of Group Company.
b) ` 1,196.46 crore (Previous year ` Nil) are secured by charge over receivables.
c) ` Nil (Previous year ` 327.65 crore) are secured by first charge on all goods procured under the LCs opened by the banks and guarantee by the ultimate holding Company.
d) ` 59.29 crore (Previous year ` 5.98 crore) are secured by fixed deposits maintained with a bank.
(ii) Bank Overdraft from bank of ` 92.53 crore (Previous year ` 198.09 crore) is secured by fixed deposits maintained with the bank.
Notes to financial statements for the year ended March 31, 2013
97

Co
mp
an
y o
ve
rv
iew
ma
na
ge
me
nt
Dis
Cu
ss
ion
an
D a
na
lys
iss
us
tain
ab
ility
go
ve
rn
an
Ce
Fin
an
Cia
ls13
.F
IxE
D A
SS
ET
S
(` in
cro
re)
Des
crip
tion
of th
e as
sets
Gro
ss b
lock
(at c
ost)
(I)
Dep
reci
atio
n / a
mor
tisat
ion
(II)
Net
blo
ck (I
II) =
(I -
II)
As a
t Ap
ril 0
1,
2012
Add
ition
s D
educ
tions
/ W
rite
Offs
As
at
Mar
ch 3
1,
2013
As a
t Ap
ril 0
1,
2012
Dur
ing
the
year
D
educ
tions
/ W
rite
Offs
As
at
Mar
ch 3
1,
2013
As
at
Mar
ch 3
1,
2013
As a
t M
arch
31,
20
12
A)
Tang
ible
ass
ets
Land
1
48.1
4 4
.86
- 1
53.0
0 -
- -
-
153.
0014
8.14
Bui
ldin
gs
668
.29
11.
63
- 6
79.9
2 1
01.5
6 4
7.25
-
148
.81
531.
1156
6.73
Plan
t and
mac
hine
ry
23,0
96.1
3 1
,210
.74
0.1
0 24
,306
.77
2,7
42.3
9 1
,228
.27
0.0
1 3
,970
.65
20,3
36.1
220
,353
.74
Prod
ucin
g pr
oper
ties
188
.12
9.6
1 -
197
.73
4.7
8 2
.61
- 7
.39
190.
3418
3.34
Furn
iture
and
fixt
ures
1
7.01
5
.54
0.1
1 2
2.44
1
0.05
1
.52
0.0
9 1
1.48
10
.96
6.96
Offi
ce e
quip
men
ts
55.
81
4.1
2 0
.99
58.
94
39.
79
5.1
4 0
.88
44.
05
14.8
916
.02
Vehi
cles
1
2.05
1
.14
0.2
6 1
2.93
7
.32
1.5
9 0
.22
8.6
9 4.
244.
73Ai
rcra
ft 1
0.00
-
- 1
0.00
3
.03
1.1
3 -
4.1
6 5.
846.
97To
tal (
A)
24,1
95.5
5 1
,247
.64
1.4
6 25
,441
.73
2,9
08.9
2 1
,287
.51
1.2
0 4
,195
.23
21,2
46.5
0 21
,286
.63
B)
Tang
ible
ass
ets
take
n on
leas
e La
nd
0.1
7 -
- 0
.17
- -
- -
0.
170.
17B
uild
ing
72.
73
- -
72.
73
64.
52
3.2
8 -
67.
80
4.93
8.21
Plan
t and
Mac
hine
ry
5.6
2 -
- 5
.62
1.2
2 0
.27
- 1
.49
4.13
4.40
Furn
iture
and
Fix
ture
s 0
.88
- -
0.8
8 0
.51
0.0
7 -
0.5
8 0.
300.
37O
ffice
Equ
ipm
ents
0
.67
- -
0.6
7 0
.55
0.0
2 -
0.5
7 0.
100.
12To
tal (
B)
80.
07
-
-
80.
07
66.
80
3.6
4 -
7
0.44
9.
6313
.27
C)
Tang
ible
ass
ets
give
n on
leas
e Pl
ant a
nd M
achi
nery
1
8.20
-
- 1
8.20
1
8.20
-
- 1
8.20
-
-To
tal (
C)
18.
20
-
-
18.
20
18.
20
-
-
18.
20
--
Tota
l Tan
gibl
e as
sets
(A+B
+C)
24,2
93.8
2 1
,247
.64
1.4
6 25
,540
.00
2,9
93.9
2 1
,291
.15
1.2
0 4
,283
.87
21,2
56.1
3 21
,299
.90
D)
Inta
ngib
le a
sset
s So
ftwar
es a
nd lic
ense
s 5
2.56
7
.45
- 6
0.01
3
2.54
9
.45
- 4
1.99
18
.02
20.0
2To
tal I
ntan
gibl
e as
sets
(D)
52.
56
7.4
5 -
6
0.01
3
2.54
9
.45
- 4
1.99
18
.02
20.0
2To
tal (
A+B
+C+D
) 24
,346
.38
1,2
55.0
9 1
.46
25,6
00.0
1 3
,026
.46
1,3
00.6
0 1
.20
4,3
25.8
6 21
,274
.15
21,3
19.9
2 Pr
evio
us Y
ear
13,9
74.5
9 1
0,37
3.58
1
.79
24,3
46.3
8 2
,230
.50
796
.72
0.7
6 3
,026
.46
21,3
19.9
2 C
apita
l wor
k-in
-pro
gres
s (In
clud
ing
expe
nditu
re d
urin
g co
nstru
ctio
n)
2,6
10.3
8 1
,760
.47
NO
TES:
1
Tota
l dep
reci
atio
n / a
mor
tisat
ion
/ dep
letio
n fo
r the
yea
r - `
1,3
00.6
0 cr
ore
(Pre
vious
yea
r ` 7
96.7
2 cr
ore)
is c
harg
ed /
allo
cate
d as
und
er :
(i)
` 1,
296.
06 c
rore
(Pre
vious
yea
r ` 7
61.9
4 cr
ore)
to s
tate
men
t of p
rofit
and
loss
; and
` 0
.54
cror
e (P
revio
us y
ear `
25.
77 c
rore
) to
exce
ptio
nal it
ems;
(ii)
` N
il (Pr
evio
us y
ear `
4.9
0 cr
ore)
to e
xpen
ditu
re d
urin
g co
nstru
ctio
n;(iii
) `
4.00
cro
re (P
revio
us y
ear `
4.1
1 cr
ore)
to c
apita
l wor
k-in
-pro
gres
s (e
xplo
ratio
n ac
tiviti
es);
2
Pl
ant a
nd m
achi
nery
incl
udes
cap
ital e
xpen
ditu
re o
f ` 2
3.27
cro
re (P
revio
us y
ear `
23.
27 c
rore
) inc
urre
d by
the
Com
pany
for a
220
KVA
line
from
Pas
chim
Guj
arat
Vij C
ompa
ny L
imite
d (P
GVC
L) fe
eder
, the
ow
ners
hip
of w
hich
ves
ts w
ith P
GVC
L an
d is
am
ortis
ed o
ver a
per
iod
of 2
0 ye
ars.
3
Land
incl
udes
` 3
4.52
cro
re (P
revio
us y
ear `
34.
52 c
rore
) rep
rese
ntin
g co
st o
f lan
d le
ased
to V
adin
ar O
il Ter
min
al L
imite
d (V
OTL
), Va
dina
r Pow
er C
ompa
ny L
imite
d (V
PCL)
, Vad
inar
Por
ts
and
Term
inal
s Li
mite
d (V
PTL)
and
Vad
inar
Pro
perti
es L
imite
d. A
cha
rge
has
been
cre
ated
aga
inst
the
land
leas
ed to
VPC
L an
d VO
TL in
favo
ur o
f len
ders
of V
PCL
and
VOTL
resp
ectiv
ely.
4
Bui
ldin
gs in
clud
e G
ymna
stic
bui
ldin
gs b
eing
dep
reci
ated
at t
he ra
te o
f 31.
67 %
und
er s
traig
ht lin
e m
etho
d. IT
ass
ets
are
depr
ecia
ted
at th
e ra
te o
f 63
% p
er c
ent u
nder
WD
V m
etho
d.5
Ad
ditio
ns to
pla
nt a
nd m
achi
nery
incl
udes
exc
hang
e di
ffere
nces
of
246
.81
cror
e (P
revio
us ye
ar
132.
75 c
rore
) on
long
term
mon
etar
y ite
ms (
incl
udin
g bu
yers
’ cre
dit w
ith ro
ll ove
r, con
verti
ble
into
long
term
loan
s on
thei
r bec
omin
g du
e in
line
with
term
loan
agr
eem
ent),
bor
row
ing
cost
of
547
.52
cror
e (P
revio
us ye
ar
131.
58 c
rore
) incl
udin
g ef
fect
of C
DR
exi
t, 2
0.85
cro
re (P
revio
us
year
3
4.09
cro
re) in
tere
st o
n fu
nd u
tilis
ed fo
r cap
ex p
urpo
se a
nd
4.3
5 cr
ore
(Pre
vious
yea
r N
il) re
duct
ion
of V
AT in
put c
redi
t on
exem
pted
cap
ital g
oods
and
gai
n of
N
il (Pr
evio
us y
ear
` 23
.77
cror
e) o
n du
ty d
raw
bac
k.6
Th
e es
timat
ed u
sefu
l life
of s
oftw
ares
and
licen
ses
is e
stim
ated
to b
e 5
year
s fro
m th
e da
te o
f acq
uisi
tion.
7
Cap
ital w
ork-
in-p
rogr
ess
incl
udes
exc
hang
e ga
in o
f ` 1
.87
cror
e (P
revio
us y
ear l
oss
of `
33.
08 c
rore
).8
Th
e C
ompa
ny h
as c
ompl
eted
the
refin
ery
expa
nsio
n pr
ojec
t to
expa
nd th
e re
finin
g ca
paci
ty fr
om 1
8 M
MTP
A to
20
MM
TPA.
All e
xpen
ditu
re p
erta
inin
g to
the
com
plet
ed re
finer
y pr
ojec
t in
clud
ing
capi
tal w
ork-
in-p
rogr
ess
and
expe
nditu
re d
urin
g co
nstru
ctio
n ha
ve b
een
capi
talis
ed d
urin
g th
e ye
ar.
Notes to financial statements for the year ended March 31, 2013
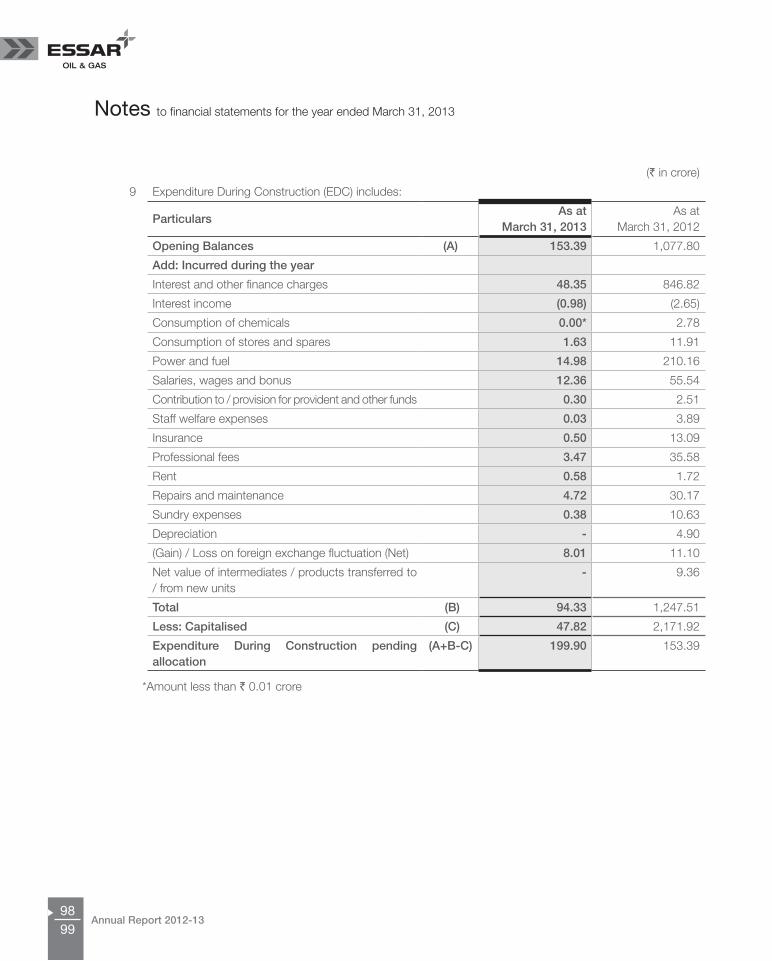
Annual Report 2012-1398
(` in crore)
9 Expenditure During Construction (EDC) includes:
ParticularsAs at
March 31, 2013As at
March 31, 2012
Opening Balances (A) 153.39 1,077.80
Add: Incurred during the year
Interest and other finance charges 48.35 846.82
Interest income (0.98) (2.65)
Consumption of chemicals 0.00* 2.78
Consumption of stores and spares 1.63 11.91
Power and fuel 14.98 210.16
Salaries, wages and bonus 12.36 55.54
Contribution to / provision for provident and other funds 0.30 2.51
Staff welfare expenses 0.03 3.89
Insurance 0.50 13.09
Professional fees 3.47 35.58
Rent 0.58 1.72
Repairs and maintenance 4.72 30.17
Sundry expenses 0.38 10.63
Depreciation - 4.90
(Gain) / Loss on foreign exchange fluctuation (Net) 8.01 11.10
Net value of intermediates / products transferred to / from new units
- 9.36
Total (B) 94.33 1,247.51
Less: Capitalised (C) 47.82 2,171.92
Expenditure During Construction pending allocation
(A+B-C) 199.90 153.39
*Amount less than ` 0.01 crore
Notes to financial statements for the year ended March 31, 2013
99

Co
mp
an
y o
ve
rv
iew
ma
na
ge
me
nt
Dis
Cu
ss
ion
an
D a
na
lys
iss
us
tain
ab
ility
go
ve
rn
an
Ce
Fin
an
Cia
ls
14. INvESTMENTS
(` in crore)
Particulars As at March 31, 2013 As at March 31, 2012
Non Current Current Non Current Current
Trade Investment
Investment in equity instrument
Investment in subsidiary (fully paid-up) (unquoted)
Nil (Previous year 1 equity share of USD 1) of Essar Oil Mauritius Limited (formerly known as Pitney Mauritius Holding Limited) (Face value USD 1)**
- - - 0.00*
Investment in associate (fully paid-up) (long- term, unquoted)
102,999,994 (Previous year 102,999,994) equity shares of ` 10 each of Vadinar Power Company Limited (VPCL) (Face value ` 10)
103.00 - 103.00 -
Other Investments (Long term, unquoted)
Investment in equity instrument
13,000,000 (Previous year 13,000,000) equity shares of ` 10 each of Petronet VK Limited (Face value ` 10) ***
13.00 - 13.00 -
1,584,000 (Previous year 1,584,000) equity shares of ` 10 each of Petronet CI Limited (Face value ` 10) (company under liquidation)
1.58 - 1.58 -
10,000,000 (Previous year 10,000,000) equity shares of ` 10 each of Petronet India Limited (Face value ` 10)
10.00 - 10.00 -
127.58 - 127.58 0.00*
Less : Provision for diminution in value of Other Investments (Long term, unquoted)
24.58 - 24.58 -
Total 103.00 - 103.00 0.00*
Refer note 3 (n) for basis of valuation.
*Amount less than ` 0.01 crore
**During the year, the Company has disposed off its holding in Essar Oil Mauritius Limited (EOML, formerly known as Pitney Mauritius Holdings Limited).
***All the shares are pledged with a lender against the loan disbursed to the Company.
Notes to financial statements for the year ended March 31, 2013
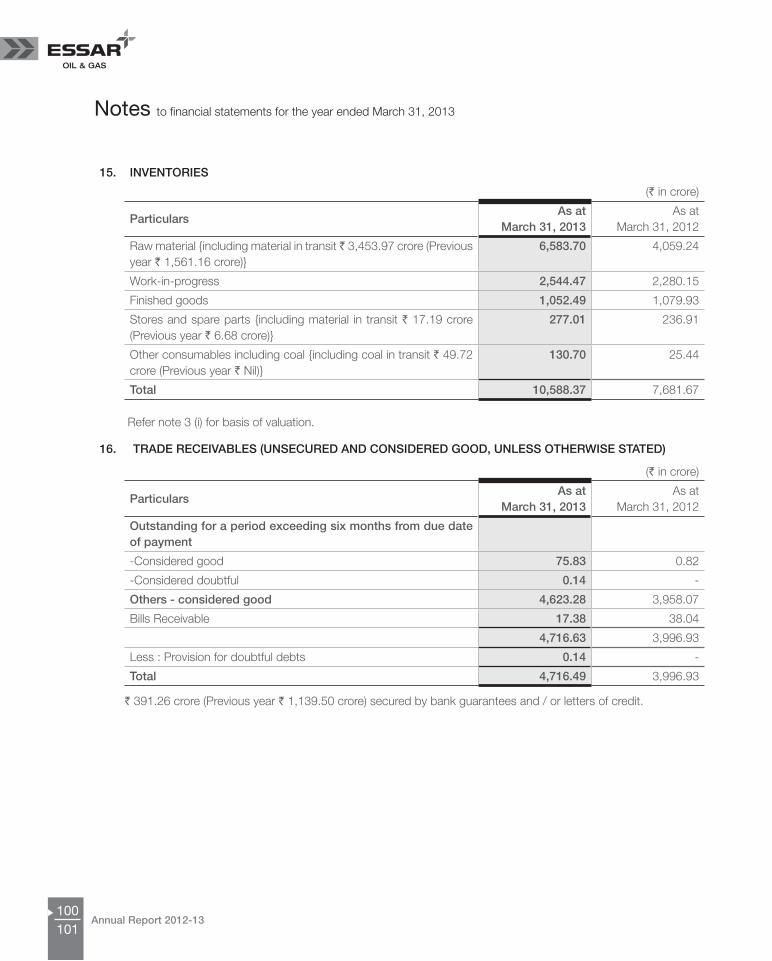
Annual Report 2012-13100
15. INvENTORIES
(` in crore)
Particulars As at
March 31, 2013 As at
March 31, 2012
Raw material {including material in transit 3,453.97 crore (Previous year ` 1,561.16 crore)}
6,583.70 4,059.24
Work-in-progress 2,544.47 2,280.15
Finished goods 1,052.49 1,079.93
Stores and spare parts {including material in transit ` 17.19 crore (Previous year ` 6.68 crore)}
277.01 236.91
Other consumables including coal {including coal in transit ` 49.72 crore (Previous year ` Nil)}
130.70 25.44
Total 10,588.37 7,681.67
Refer note 3 (i) for basis of valuation.
16. TRADE RECEIvABLES (uNSECuRED AND CONSIDERED GOOD, uNLESS OTHERwISE STATED)
(` in crore)
Particulars As at
March 31, 2013 As at
March 31, 2012
Outstanding for a period exceeding six months from due date of payment
-Considered good 75.83 0.82
-Considered doubtful 0.14 -
Others - considered good 4,623.28 3,958.07
Bills Receivable 17.38 38.04
4,716.63 3,996.93
Less : Provision for doubtful debts 0.14 -
Total 4,716.49 3,996.93
` 391.26 crore (Previous year ` 1,139.50 crore) secured by bank guarantees and / or letters of credit.
Notes to financial statements for the year ended March 31, 2013
101

Co
mp
an
y o
ve
rv
iew
ma
na
ge
me
nt
Dis
Cu
ss
ion
an
D a
na
lys
iss
us
tain
ab
ility
go
ve
rn
an
Ce
Fin
an
Cia
ls
17. CASH AND BANK BALANCES
(` in crore)
Particulars As at March 31, 2013 As at March 31, 2012
Current Non Current Current Non Current
Cash and cash equivalents
Balances with banks in:
Current accounts 326.24 - 155.31 -
Deposits with maturities less than 3 months 14.24 - 284.65 -
Cash on hand 0.23 - 0.22 -
(A) 340.71 - 440.18 -
Other bank balances:
Balances with banks in Current accounts - Earmarked accounts (unclaimed debenture interest)
28.85 - 35.94 -
Margin deposits and escrow accounts** 2,060.78 9.21 1,519.37 0.79
Other deposits 0.32 - 65.45 0.00*
Amount disclosed under the head “Other current / Non current assets” (refer note 19)
- (9.21) - (0.79)
(B) 2,089.95 - 1,620.76 -
Total (A+B) 2,430.66 - 2,060.94 -
*Amount less than ` 0.01 crore
**Deposit accounts comprises ` 2,069.99 crore (Previous year ` 1,520.16 crore) margin deposits mainly placed for letters of credit facilities, guarantees and short term borrowing.
18. LOANS AND ADvANCES
(unsecured and considered good, unless otherwise stated)(` in crore)
Particulars As at March 31, 2013 As at March 31, 2012
Current Non Current Current Non Current Advances recoverable in cash or in kind or for value to be received- From related parties (refer note 45) 776.82 38.41 46.55 - - From director 0.68 - 1.34 - Prepaid expenses 68.76 - 48.73 - Balances with government authorities- Considered good 48.40 - 65.91 - - Considered doubtful 0.45 - 0.62 - Less: Provision for doubtful advances (0.45) - (0.62) - Others 78.00 - 35.47 -
(A) 972.66 38.41 198.00 -
Notes to financial statements for the year ended March 31, 2013

Annual Report 2012-13102
18. LOANS AND ADvANCES
(unsecured and considered good, unless otherwise stated)(` in crore)
Particulars As at March 31, 2013 As at March 31, 2012
Current Non Current Current Non Current Advance on capital account-To related parties (refer note 45) - 937.71 - 75.84 -To other parties - 49.23 - 5.93
(B) - 986.94 - 81.77 Security depositsDeposit to related parties (refer note 45) 8.58 103.39 11.74 98.99 Deposit to others- Considered good 63.75 4.53 1.09 4.55 - Considered doubtful 0.35 - 0.35 - Less: Provision for doubtful deposits (0.35) - (0.35) -
(C) 72.33 107.92 12.83 103.54 Advance income tax / Tax deducted at source- Considered good 231.30 4.87 17.19 225.62
(D) 231.30 4.87 17.19 225.62 Total (A+B+C+D) 1,276.29 1,138.14 228.02 410.93
19. OTHER CuRRENT / NON CuRRENT ASSETS
(` in crore)
Particulars As at March 31, 2013 As at March 31, 2012
Current Non Current Current Non Current
Other receivables* 1,869.26 993.86 538.93 1,735.45
Export incentive receivables - 89.95 76.93 -
unamortised Expenses
- Ancillary cost for arranging borrowing 63.65 241.44 3.56 73.38
- Forward contract premium 70.29 - 37.17 -
Interest accrued on deposits 90.64 0.07 63.51 0.02
Amount transferred from “cash and bank balances” (refer note 17)
- 9.21 - 0.79
Total 2,093.84 1,334.53 720.10 1,809.64
*Other receivables include
(i) ` 167.67 crore (Previous year ` 149.59 crore) due from government companies / agencies in respect of the Company’s erstwhile oil drilling and offshore construction activities for which the Company received favourable awards in arbitration proceedings. The awards have since been challenged by the parties. Pending outcome of the litigations, the receivables are considered as recoverable based on the arbitration awards and assessment of the management.
Notes to financial statements for the year ended March 31, 2013
103

Co
mp
an
y o
ve
rv
iew
ma
na
ge
me
nt
Dis
Cu
ss
ion
an
D a
na
lys
iss
us
tain
ab
ility
go
ve
rn
an
Ce
Fin
an
Cia
ls
(ii) ` 2,177.82 crore receivable from Essar House Limited (EHL) being the amount paid under the defeasment agreement of the sales tax liability covered by the scheme (refer note 36). The Company has agreed to recover these dues in eight equal quarterly installments along with interest, coinciding with the installment facility made available by the Hon’ble Supreme Court to the Company for repayment of the Gujarat Sales tax dues. To secure this amount further, the Company is in the process of obtaining an additional guarantee from the parent company of EHL.
20. REvENuE FROM OPERATIONS
(` in crore)
Particulars For the year ended
March 31, 2013 For the year ended
March 31, 2012
Sale of petroleum products* 95,770.11 61,251.42 Sale of traded goods - crude and petroleum products 1,023.17 2,085.47 Sales - others 3.60 2.63 Other operating revenue 271.04 88.25 Revenue from operations (gross) 97,067.92 63,427.77 Less : Sales tax / VAT** 3,523.72 1,387.36 Revenue from operations before excise duty 93,544.20 62,040.41 Less : Excise duty 4,966.08 3,703.78 Revenue from operations (net) 88,578.12 58,336.63
Revenue from operations (gross) includes sale of goods net of trade discount, duty draw back income, recoverable sales tax / Value added tax (VAT) from customers, hedging loss/gain on product / cracks and excise duty.
* includes net loss of ` 175.76 crore (Previous year net gain ` 176.11 crore) on the instruments for hedging of risk of movement in prices of finished goods and margins.
**During the previous year, the Company deferred payment of sales tax /VAT liability amounting to ` 1,507.01 crore for the period April 01, 2011 to December 31, 2011 and defeased the same to a related party at its present value amounting to ` 528.42 crore. Sales tax/VAT amounting to ` 1,387.36 crore shown above as deduction from “Revenue from operations (gross)” includes the defeased value of sales tax/VAT liability of ` 528.42 crore as per the defeasance agreement pursuant to which the assignee has undertaken to discharge the sales tax/VAT liability on the due dates. Pursuant to the Supreme Court Order dated January 17, 2012, the Company subsequently reversed the entire amount of income recognized as an exceptional item (refer note 36).
21. OTHER INCOME
(` in crore)
Particulars For the year ended
March 31, 2013 For the year ended
March 31, 2012
Interest a) On deposits 164.92 353.96 b) Others 418.99 21.36
583.91 375.32 Profit on sale of fixed assets - 0.08 Profit on sale of current investments 4.05 6.31 Others 20.82 43.05 Total 608.78 424.76
Notes to financial statements for the year ended March 31, 2013

Annual Report 2012-13104
22. COST OF RAw MATERIALS CONSuMED
(` in crore)
Particulars For the year ended
March 31, 2013 For the year ended
March 31, 2012
Cost of raw materials consumed {refer note 32(a)} 81,333.98 52,894.85
Includes net loss of ` 238.23 crore (Previous year net loss ` 147.06 crore) on the instruments for hedge of risk of movement in prices of crude oil.
23. PuRCHASE OF TRADED GOODS
(` in crore)
Particulars For the year ended
March 31, 2013 For the year ended
March 31, 2012
Traded crude and petroleum products 865.57 1,954.43
Others 1.15 2.73
Total 866.72 1,957.16
24. CHANGES IN INvENTORy OF FINISHED GOODS AND wORK-IN-PROGRESS
(` in crore)
Particulars For the year ended
March 31, 2013 For the year ended
March 31, 2012
Opening inventory:
- Finished goods 1,079.93 891.83
- Work-in-progress 2,280.15 1,480.15
(A) 3,360.08 2,371.98
Closing inventory:
- Finished goods 1,052.49 1,079.93
- Work-in-progress 2,544.47 2,280.15
(B) 3,596.96 3,360.08
Changes (Increase) / Decrease in Inventory Total (A) - (B) (236.88) (988.10)
25. EMPLOyEE BENEFITS ExPENSE
(` in crore)
Particulars For the year ended
March 31, 2013 For the year ended
March 31, 2012
Salaries, wages and bonus 163.68 117.88
Contribution to / provision for provident and other funds 10.06 8.30
Staff welfare expenses 11.92 8.38
Total 185.66 134.56
[Regarding accounting of stock option refer note 3(m)(iv) & 4(d)]
Notes to financial statements for the year ended March 31, 2013
105

Co
mp
an
y o
ve
rv
iew
ma
na
ge
me
nt
Dis
Cu
ss
ion
an
D a
na
lys
iss
us
tain
ab
ility
go
ve
rn
an
Ce
Fin
an
Cia
ls
26. OTHER ExPENSES
(` in crore)
Particulars For the year ended
March 31, 2013 For the year ended
March 31, 2012
Operating Expenses:
Consumption of stores and spare parts 59.43 96.80
Intermediate material handling charges 129.23 129.08
Consumption of fuel 800.00 444.43
Power and Fuel {Net of consumed out of own production ` 733.80 crore (Previous year ` 700.11 crore)}
313.50 268.95
Excise duty (difference between duty on opening and closing stock) (15.95) 16.22
Other operating expenses {refer note 37(b)} 462.23 235.79
(A) 1,748.44 1,191.27
Selling and Marketing Expenses:
Terminalisation charges 6.66 6.56
Rent / ROI for retail outlets 17.07 16.26
Adhoc compensation to retail outlets 38.90 38.51
Product handling charges 367.40 313.39
Others selling and distribution expenses 152.46 24.95
(B) 582.49 399.67
General and Administrative Expenses:
Rates and taxes 2.41 2.14
Insurance 53.85 33.72
Professional fees 92.31 131.27
Rent 19.86 17.26
Repairs and maintenance
a) Buildings 23.61 16.96
b) Plant and machinery 62.34 71.77
c) Others 34.91 29.79
Provision / Write off of fixed assets 0.23 -
Loss on sale of fixed assets 0.01 -
Sundry expenses 115.25 142.60
Exchange differences (net) 651.03 625.71
(C) 1,055.81 1,071.22
Total (A)+(B)+(C) 3,386.74 2,662.16
Notes to financial statements for the year ended March 31, 2013

Annual Report 2012-13106
27. FINANCE COSTS
(` in crore)
Particulars For the year ended
March 31, 2013 For the year ended
March 31, 2012
Interest
a) On debentures {refer note 7(ii)(a)} 56.04 23.36
b) On fixed loans 1,739.66 664.09
c) On others 787.85 272.71
Change in present obligation of certain loans {refer note 7(ii)(c)} 120.65 58.35
Other finance charges 719.38 368.33
Total 3,423.58 1,386.84
28. EARNINGS PER SHARE
Particulars year ended
March 31, 2013 Year ended
March 31, 2012
Profit / (Loss) after tax (` In crore) (1,180.44) (1,285.48)
Profit / (Loss) attributable to ordinary shareholders for Basic EPS (` In crore)
(A) (1,180.44) (1,285.48)
Impact on Profit (Net of Tax) due to FCCB for Diluted EPS (` In crore)
- 3.80
Profit / (Loss) attributable to ordinary shareholders for Diluted EPS (` In crore)
(B) (1,180.44) (1,289.28)
Nos. Nos.
Ordinary shares at the beginning of the year for basic EPS 1,365,667,086 1,365,667,086
Add: Weighted average number of ordinary shares issued - -
Weighted average number of ordinary shares for basic EPS
(C) 1,365,667,086 1,365,667,086
Add:- Shares deemed to be issued 84,008,937 83,849,816
Weighted average number of ordinary shares for diluted EPS
(D) 1,449,676,023 1,449,516,902
Nominal value of ordinary shares (`) 10/- 10/-
Basic earnings per share (`) (A)/(C) (8.64) (9.41)
Diluted earnings per share (`) (A)/(C) (8.64) (9.41)
Notes to financial statements for the year ended March 31, 2013
107

Co
mp
an
y o
ve
rv
iew
ma
na
ge
me
nt
Dis
Cu
ss
ion
an
D a
na
lys
iss
us
tain
ab
ility
go
ve
rn
an
Ce
Fin
an
Cia
ls
29. CAPITAL COMMITMENTS
(` in crore)
Particularsyear ended
March 31, 2013Year ended
March 31, 2012
Estimated amount of contracts remaining to be executed on capital account and not provided for (net of advances) {including ` 0.28 crore (Previous year ` 0.86 crore) pertaining to joint ventures {refer note 38(c)}
1,054.17 1,922.39
The above figures does not include 19,153.39 crore (Previous year ` 18,600.45 crore) for contracts in relation to the implementation of the Phase II of Refinery Expansion Project, as the work under these contracts will commence only after definitive financial commitments being entered into, and following which, if the Company has not notified the counter-party that the work is to commence by September 2013, the contracts will terminate.
30. CONTINGENT LIABILITIES
(` in crore)
Particularsyear ended
March 31, 2013Year ended
March 31, 2012
a) Claims against the Company not acknowledged as debts
(i) In respect of income tax 67.49 64.35
(ii) In respect of sales tax / VAT 670.04 10.36
(iii) In respect of custom duty / excise duty 258.87 108.63
(iv) Others 508.01 274.73
The above includes certain arbitration matters ` 235.61 crore (Previous year ` 80.73 crore), Rupee term loan interest and bank charges ` Nil (Previous year ` 7.99 crore), stamp duty on import of crude ` 246.24 crore (Previous year ` 174.94 crore), demand of road tax on certain heavy equipment ` 0.94 crore (Previous year ` 0.89 crore), Gujarat entry tax ` 3.28 crore (Previous year ` 3.28 crore), litigation for additional compensation in land acquisition matter ` 0.64 crore (Previous year ` 1.92 crore), E & P drilling services claims ` 20.15 crore (Previous year ` 3.64 crore) and other miscellaneous claims of ` 1.15 crore (Previous year ` 1.34 crore)
b) Guarantees given by the Company on behalf of others 125.67 161.06
The claims by parties in respect of which the management has been legally advised that the same are frivolous and not tenable, have not been considered as contingent liabilities as the possibility of an outflow of resources embodying economic benefits is highly remote.
Notes to financial statements for the year ended March 31, 2013

Annual Report 2012-13108
31. CIF vALuE OF IMPORTS INCLuDING GOODS IN TRANSIT AND PROJECT IMPORTS (ON ACCRuAL BASIS)
(` in crore)
Particularsyear ended
March 31, 2013Year ended
March 31, 2012
a) Raw materials - crude oil 68,139.36 47,361.22
b) Components and spare parts (including other consumable spares and coal)
459.19 112.81
c) Capital goods 112.32 662.46
32. DETAILS OF COST OF RAw MATERIALS CONSuMED AND STORES AND SPARE PARTS CONSuMPTION
Particularsyear ended March 31, 2013 Year ended March 31, 2012
` in crore % ` in crore %
a) Cost of raw materials consumed* (including expenditure during construction)
(1) Imported 66,088.68 81.26 47,121.41 88.89
(2) Indigenous 15,245.30 18.74 5,892.31 11.11
Total 81,333.98 100.00 53,013.72 100.00
*Above figure includes cost of crude consumption during trial run ` Nil (Previous year ` 118.87 crore)
b) Consumption of stores and spare parts (including expenditure during construction)
(1) Imported 8.75 14.33 26.96 24.80
(2) Indigenous 52.30 85.67 81.78 75.20
Total 61.05 100.00 108.74 100.00
33. ExPENDITuRE AND EARNINGS IN FOREIGN CuRRENCy INCLuDING ExPENDITuRE DuRING CONSTRuCTION (ON ACCRuAL BASIS)
(` in crore)
Particularsyear ended
March 31, 2013Year ended
March 31, 2012
a) Expenditure in foreign currency including expenditure during construction (on accrual basis)
(i) Interest 134.00 107.63
(ii) Travelling expenses 0.37 2.95
Notes to financial statements for the year ended March 31, 2013
109

Co
mp
an
y o
ve
rv
iew
ma
na
ge
me
nt
Dis
Cu
ss
ion
an
D a
na
lys
iss
us
tain
ab
ility
go
ve
rn
an
Ce
Fin
an
Cia
ls
33. ExPENDITuRE AND EARNINGS IN FOREIGN CuRRENCy INCLuDING ExPENDITuRE DuRING CONSTRuCTION (ON ACCRuAL BASIS)
(` in crore)
Particularsyear ended
March 31, 2013Year ended
March 31, 2012
(iii) Professional / consultancy fees 10.10 31.85
(iv) Services 250.22 141.35
(v) On commodity hedging 1,666.00 314.45
(vi) Demurrage 47.15 19.85
(vii) Traded crude / Petroleum products purchase - 1,246.50
(viii) Others 87.61 69.36
b) Earnings in foreign currency including expenditure during construction (on accrual basis)
(i) Interest 0.68 -
(ii) FOB value of exports 30,640.29 19,915.33
(iii) Trading of crude / Petroleum products - 1,255.51
(iv) On commodity hedging 1,252.01 343.51
(v) Income from technical services 22.29 14.73
(vi) Others 6.53 7.20
34. HEDGE ACCOuNTING During the year, the Company adopted hedge accounting principles of AS - 30 – Financial Instruments and Derivatives for accounting of certain commodity hedges. Accordingly, ` 104.90 crore (gain) has been carried over to cash flow hedge reserve as of March 31, 2013 pertaining to highly probable forecast of sales proceeds. If hedge accounting principles of AS 30 had not been adopted for the year ended March 31, 2013, sales would have been higher by ` 18.48 crore,
consumption of raw materials would have been lower by ` 5.69 crore, profit after tax would have been higher by ` 24.17 crore and receivables would have been lower by ` 80.73 crore.
35. GDSs PROCEEDS uTILISATION
As at balance sheet date, the unutilized balance of proceeds from issue of global depository shares amounting to ` 14.75 crore (Previous year ` 14.75 crore from advance towards issue of global depository shares proceeds) is lying in bank deposit accounts.
Notes to financial statements for the year ended March 31, 2013

Annual Report 2012-13110
36. ExCEPTIONAL ITEMS
(` in crore)
Particularsyear ended
March 31, 2013Year ended
March 31, 2012
Reversal of defeased income* - 778.25
Interest on sales tax liability* - 83.39
CDR Exit impact {(refer note 7(ii)(c)} 111.48 375.82
Total 111.48 1,237.46
*The Hon’ble Supreme Court of India had vide its order dated January 17, 2012 set aside the order of the Hon’ble High Court of Gujarat dated April 22, 2008 which had earlier confirmed the Company’s eligibility to the Sales tax incentive Scheme (‘the scheme’) and accordingly the Company had reversed the net defeased income (net) of ` 778.25 crore recognized during April 1, 2011 to December 31, 2011 as exceptional items during the financial year 2011-12. ` 83.39 crore represents interest payable by the company on sales tax liability arising out of the Supreme Court order dated September 13, 2012.
37. LEASES
a) Finance lease:-
(i) Future lease rental payable and reconciliation of minimum lease payments and its present value in respect of the assets:-
(` in crore)
Particulars
Minimum Lease payment/Future
lease rent payable
Interest Present value of minimum lease
payments
As at March
31, 2013
As at March
31, 2012
As at March
31, 2013
As at March
31, 2012
As at March
31, 2013
As at March
31, 2012
Future lease rental obligation payable:
Not later than one year 14.61 14.61 7.10 1.10 7.51 13.51
Later than one year but not later than five years
42.77 53.56 16.72 17.53 26.05 36.03
Later than five years 36.63 40.32 16.80 30.01 19.83 10.31
Total 94.01 108.49 40.62 48.64 53.39 59.85
Notes to financial statements for the year ended March 31, 2013
111

Co
mp
an
y o
ve
rv
iew
ma
na
ge
me
nt
Dis
Cu
ss
ion
an
D a
na
lys
iss
us
tain
ab
ility
go
ve
rn
an
Ce
Fin
an
Cia
ls
(ii) General description of the leasing arrangements:
- Leased Assets – Residential township, Transit accommodation and supply depot.
- Future lease rental payments are determined on the basis of quarterly / monthly lease payments as provided in the agreements.
- At the expiry of the lease term, the Company has an option to extend the lease on mutual terms and conditions. In case of the supply depot, the ownership gets transferred to the Company at the end of the lease term.
- Assets are taken on lease over a period of 10 to 20 years.
(iii) The above disclosures pertain to lease arrangements where leases have commenced upon assets becoming ready to use.
b) Operating lease:-
- Leased Assets (cancellable) – Power plants
- Leased period - from January 1, 2013 to March 31, 2013
- The lease payments are recognised as “Other operating expenses” in the statement of profit and loss under note 26 - other expenses.
38. ExPLORATION AND PRODuCTION ACTIvITIES
a) As per the Company’s policy of Full Cost method of accounting prescribed in the Guidance Note on “Accounting for Oil and Gas Producing Activities” issued by the “Institute of Chartered Accountants of India”, the Company has identified the following 2 Cost Pools:
(i) India CBM (Coal Bed Methane) Pool:
a) Mehsana Pilot Project held outside Pool.
b) RG (East) 2001/1 Block – Commercial Production not yet started and held outside Pool.
c) RM-(E)-CBM-2008/IV (Rajmahal, Jharkhand, India)- in exploration phase, held outside pool
d) TL-CBM-2008/IV (Talcher, Orissa, India)- in exploration phase, held outside pool
e) IB-CBM-2008/IV (IB Valley, Orissa, India)- in exploration phase, held outside pool
f) SP(NE)-CBM-2008/4 (Sohagpur, Madhya Pradesh, India)- in exploration phase, held outside pool
(ii) India Oil & Gas Pool :
a) Block CB-ON/3 - existence of commercial reserves established in ESU field, held inside Pool.
b) Ratna & R-Series - discovered oilfield but contract not executed and hence held outside Pool.
c) AA-ONN-2004/3 - In exploration phase, held outside pool
d) AA-ONN-2004/5 - In exploration phase, held outside pool
On commencement of commercial production from ESU field forming part of CB-ON/3 block, the Pool has been transferred to “Producing Properties”. Depletion on “Producing Properties” is being charged on a “Unit of Production” basis.
Notes to financial statements for the year ended March 31, 2013
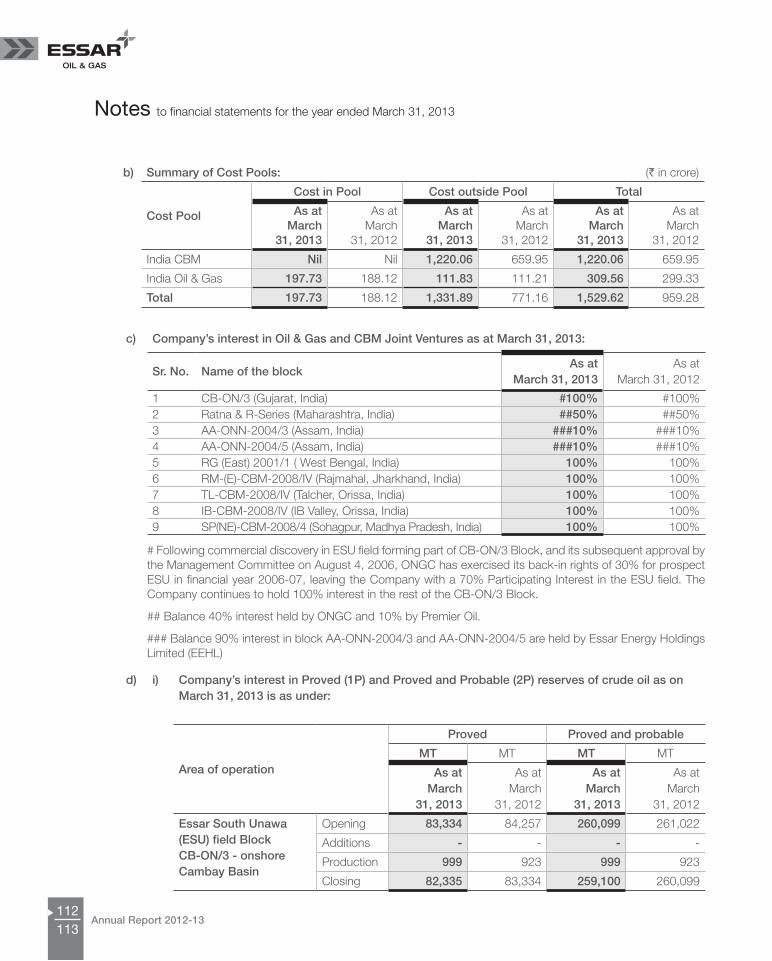
Annual Report 2012-13112
b) Summary of Cost Pools: (` in crore)
Cost Pool
Cost in Pool Cost outside Pool Total
As at March
31, 2013
As at March
31, 2012
As at March
31, 2013
As at March
31, 2012
As at March
31, 2013
As at March
31, 2012
India CBM Nil Nil 1,220.06 659.95 1,220.06 659.95
India Oil & Gas 197.73 188.12 111.83 111.21 309.56 299.33
Total 197.73 188.12 1,331.89 771.16 1,529.62 959.28
c) Company’s interest in Oil & Gas and CBM Joint ventures as at March 31, 2013:
Sr. No. Name of the blockAs at
March 31, 2013As at
March 31, 2012
1 CB-ON/3 (Gujarat, India) #100% #100%2 Ratna & R-Series (Maharashtra, India) ##50% ##50%3 AA-ONN-2004/3 (Assam, India) ###10% ###10%4 AA-ONN-2004/5 (Assam, India) ###10% ###10%5 RG (East) 2001/1 ( West Bengal, India) 100% 100%6 RM-(E)-CBM-2008/IV (Rajmahal, Jharkhand, India) 100% 100%7 TL-CBM-2008/IV (Talcher, Orissa, India) 100% 100%8 IB-CBM-2008/IV (IB Valley, Orissa, India) 100% 100%9 SP(NE)-CBM-2008/4 (Sohagpur, Madhya Pradesh, India) 100% 100%
# Following commercial discovery in ESU field forming part of CB-ON/3 Block, and its subsequent approval by the Management Committee on August 4, 2006, ONGC has exercised its back-in rights of 30% for prospect ESU in financial year 2006-07, leaving the Company with a 70% Participating Interest in the ESU field. The Company continues to hold 100% interest in the rest of the CB-ON/3 Block.
## Balance 40% interest held by ONGC and 10% by Premier Oil.
### Balance 90% interest in block AA-ONN-2004/3 and AA-ONN-2004/5 are held by Essar Energy Holdings Limited (EEHL)
d) i) Company’s interest in Proved (1P) and Proved and Probable (2P) reserves of crude oil as on March 31, 2013 is as under:
Area of operation
Proved Proved and probable
MT MT MT MT
As at March
31, 2013
As at March
31, 2012
As at March
31, 2013
As at March
31, 2012
Essar South unawa (ESu) field Block CB-ON/3 - onshore Cambay Basin
Opening 83,334 84,257 260,099 261,022
Additions - - - -
Production 999 923 999 923
Closing 82,335 83,334 259,100 260,099
Notes to financial statements for the year ended March 31, 2013
113

Co
mp
an
y o
ve
rv
iew
ma
na
ge
me
nt
Dis
Cu
ss
ion
an
D a
na
lys
iss
us
tain
ab
ility
go
ve
rn
an
Ce
Fin
an
Cia
ls
ii) Company’s interest in Proved (1P) and Proved and Probable (2P) reserves of coal bed methane gas as on March 31, 2013 is as under:
Area of operation
Proved Proved and probable
MMSCM MMSCM MMSCM MMSCM
As at March
31, 2013
As at March
31, 2012
As at March
31, 2013
As at March
31, 2012
RG(East)-CBM-2001/1 block west Bengal, India
Opening 630 - 3,199 -
Additions - 634 - 3,203
Production 14 4 14 4
Closing 616 630 3,185 3,199
39. ExPORT OBLIGATIONS (` in crore)
Obligation underAs at
March 31, 2013 As at
March 31, 2012
Export Promotion Capital Goods Scheme (EPCG) - 406.00
40. DERIvATIvE INSTRuMENTS AND uNHEDGED FOREIGN CuRRENCy ExPOSuRES
Derivative contracts entered into by the Company and outstanding as at balance sheet date:
a) For hedging currency related risks:
(i) The Company uses forward exchange contracts, options and interest rate swaps to hedge its exposure in foreign currency and interest rate. The information on outstanding contracts is given below:
Currency
Amount Buy/Sell
As at March
31, 2013
As at March
31, 2012
As at March
31, 2013
As at March
31, 2012
Forward contract :
US Dollar in million 1,514.51 850.00 Buy Buy
US Dollar in million 224.25 - Sell
Interest rate swap :
US Dollar in million 80.79 99.54 Buy Buy
Rupee in crore 1,150.00 - Sell
Notes to financial statements for the year ended March 31, 2013

Annual Report 2012-13114
(ii) The foreign currency exposure of the Company as at balance sheet date that have not been hedged by a derivative instrument or otherwise are given below:
Currency
Payable Receivable Loan Liabilities (Including
Interest accrued)
LC Outstanding #
` in
crore
FC in
Million
` in
crore
FC in
Million
` in
crore
FC in
Million
` in
crore
FC in
Million
JPy0.00** 0.07 - - - - - -
(0.00)** (0.02) - - - - (0.34) (5.45)
uSD10,485.55 1,927.87 1,017.30 187.04 3,291.12 *** 605.11*** 1,433.19 263.51
(7,787.37) (1,522.26) (1,615.59) (315.81) (4,112.16)*** (803.84)*** (895.55) (175.06)
EuRO 12.26 1.76 8.25 1.19 124.69 17.93 12.15 1.75
(9.14) (1.34) (4.94) (0.72) (282.32) (41.31) (66.70) (9.76)
GBP 0.80 0.10 0.55 0.07 1.52 0.18 - -
(4.40) (0.54) (2.28) (0.28) (13.98) (1.71) (0.55) (0.07)
CHF - - - - - - - -
(0.01) (0.00)* - - - - - -
AuD 0.05 0.01 - - - - - -
- - - - - - - -
SEK - - - - - - - -
(0.00)** (0.00)* - - - - - -
SGD - - - - - - - -
- - (0.00)** (0.00)* - - - -
AED - - - - - - - -
(0.00)** (0.00)* - - - - - -
Total10,498.66 1,026.10 3,417.33 1,445.34
(7,800.92) - (1,622.81) - (4,408.46) - (963.14) -
# Other than in respect of recognised liability * Amount less than 0.01 million ** Amount less than ` 0.01 crore ***excludes currency swap of ` 1,955.10 crore (USD 378.75 million) {Previous year ` 727.69 crore (USD 142.25 million)} Previous year figures have been shown in brackets.
(iii) Bank balance in foreign currency as at March 31, 2013 ` 0.03 crore (USD 0.00* million) & ` 0.00** crore (EUR 0.00* million){Previous year ` 0.53 crore (USD 0.10 million)}
Notes to financial statements for the year ended March 31, 2013
115

Co
mp
an
y o
ve
rv
iew
ma
na
ge
me
nt
Dis
Cu
ss
ion
an
D a
na
lys
iss
us
tain
ab
ility
go
ve
rn
an
Ce
Fin
an
Cia
ls
b) For hedging commodity related risks:
Category wise break-up of commodity derivative contracts entered into by the Company and outstanding as at balance sheet date:
Sr. No. Nature of instrument
Crude oil purchases /(sale)
qty. in Barrels (‘000)
Petroleum products purchases / (sale)
qty. in Barrels (‘000)
As at March
31, 2013
As at March
31, 2012
As at March
31, 2013
As at March
31, 2012
1 Net options - (5,995) - -
2 Net forward swaps (7,713) - (340) -
3 Spreads 2,543 - (3,600) -
4 Margin hedging - - (5,025) (1,425)
41. AuDITOR’S REMuNERATION
Professional Fees include payments to auditors for :-
(` in crore)
Particularsyear ended
March 31, 2013Year ended
March 31, 2012
(a) To statutory auditors
- Audit fees (including ` 0.10 crore for earlier year and ` 0.65 crore for reopening of accounts)(Previous year ` Nil)
2.40 1.50
- Taxation matters 0.06 0.07
- Other services 1.12 1.85
- Reimbursement of expenses 0.02 0.09
Total 3.60 3.51
Notes to financial statements for the year ended March 31, 2013

Annual Report 2012-13116
42. SEGMENT INFORMATION
(` in crore)
Sr. No. Particularsyear ended
March 31, 2013Year ended
March 31, 2012
1 Information about primary segment - business:-
Segment revenue
Refining including expansion and marketing 88,714.43 58,583.28
Exploration and production activities 15.91 13.71
Unallocated 29.98 107.27
Total segment revenue 88,760.32 58,704.26
Add : Interest income {Including ` Nil (Previous year ` 155.13 crore) considered in exceptional items}
418.99 176.49
Add : Profit on sale of investment 4.05 6.31
Add : Reversal of old liabilities / excess accrual 3.54 29.46
Total revenue 89,186.90 58,916.52
2 Segment result before interest, extraordinary items and tax
Refining including expansion and marketing 1,363.49 67.20
Exploration and production activities (1.49) (5.75)
Unallocated (154.40) (107.21)
Total 1,207.60 (45.76)
Less : Interest expense {Including ` 110.94 crore (Previous year ` 433.45 crore) considered in exceptional items}
2,814.62 1,451.98
Add : Interest income {Including ` Nil (Previous year ` 155.13 crore) considered in exceptional items}
418.99 176.49
Add : Profit on sale of Investments 4.05 6.31
Add : Reversal of old liabilities / excess accrual 3.54 29.46
Profit / (Loss) before tax (1,180.44) (1,285.48)
Less : Taxes - -
Profit / (Loss) after tax (1,180.44) (1,285.48)
3 Segment assets
Refining including expansion and marketing 42,309.85 35,765.18
Exploration and production activities 2,426.76 1,351.96
Unallocated 651.42 904.46
Total 45,388.03 38,021.60
Add : Amount recoverable against defeasement agreement
2,177.82 2,070.02
Total assets 47,565.85 40,091.62
Notes to financial statements for the year ended March 31, 2013
117

Co
mp
an
y o
ve
rv
iew
ma
na
ge
me
nt
Dis
Cu
ss
ion
an
D a
na
lys
iss
us
tain
ab
ility
go
ve
rn
an
Ce
Fin
an
Cia
ls
42. SEGMENT INFORMATION
(` in crore)
Sr. No. Particularsyear ended
March 31, 2013Year ended
March 31, 2012
4 Segment liabilities
Refining including expansion and marketing 15,327.66 12,118.56
Exploration and production activities 261.11 125.85
Unallocated 85.00 73.52
Total 15,673.77 12,317.93
Add : Loan funds (Including interest accrued due / not due) 24,815.45 17,957.23
Add : Liabilities towards sales tax including interest thereon (refer note 2 below)
4,629.80 6,295.72
Total liabilities 45,119.02 36,570.88
5 Additions to Fixed Assets
Refining including expansion and marketing 1,228.75 10,348.11
Exploration and production activities 18.73 8.97
Unallocated 7.61 16.50
Total 1,255.09 10,373.58
6 Depreciation / Amortisation (excluding depreciation accounted in expenditure during construction)
Refining including expansion and marketing {Including ` 0.54 crore (Previous year ` 25.77 crore) considered in exceptional items}
1,285.07 777.82
Exploration and production activities 2.98 2.75
Unallocated 8.55 7.14
Total 1,296.60 787.71
7 Significant non-cash expenses other than depreciation
Refining including expansion and marketing 62.98 210.65
Exploration and production activities (4.76) 2.14
Unallocated 0.71 (0.02)
Total 58.93 212.77
Notes:
1) The Company has disclosed Business Segment as the primary segment. Segments have been identified taking into account the organizational structure, nature of services, differing risks and internal reporting system. The Company’s operation predominantly relates to Refining including expansion and marketing of petroleum products, Oil & Gas exploration.
2) The sales tax liability payable in eight quarterly installments w.e.f. January 2, 2013 with interest is not considered as segment liability considering the substance of the terms.
3) Additions to fixed assets shown above are including exchange difference and excluding capital work in progress and expenditure during construction.
4) The Company operates in two geographical segments namely “within India” and “outside India”.
Notes to financial statements for the year ended March 31, 2013
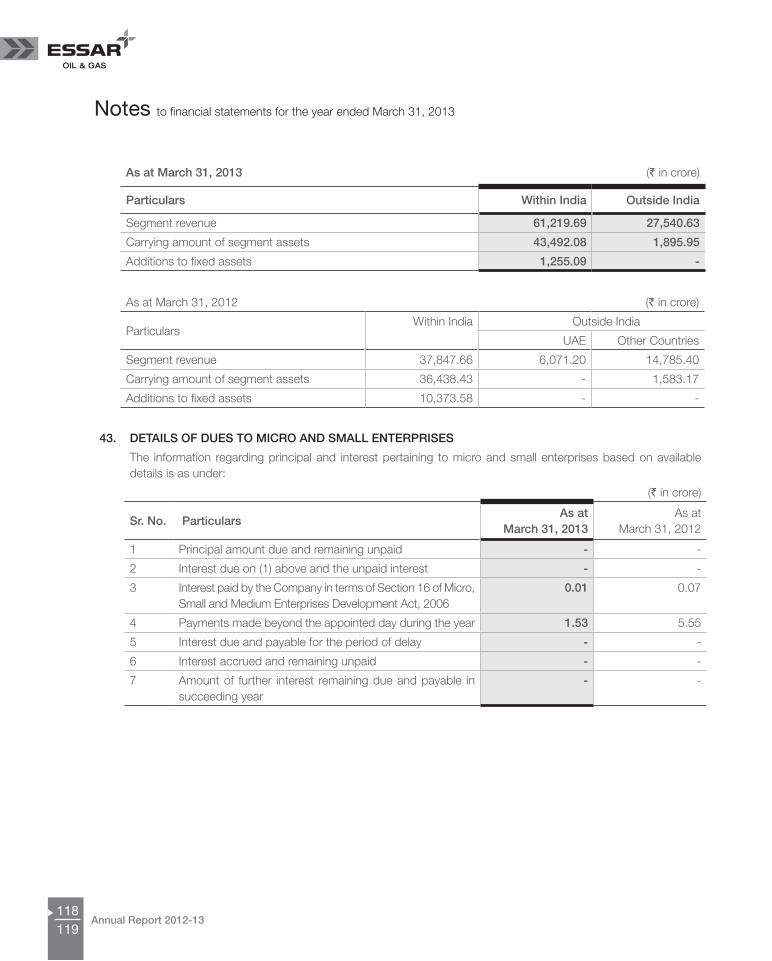
Annual Report 2012-13118
As at March 31, 2013 (` in crore)
Particulars within India Outside India
Segment revenue 61,219.69 27,540.63
Carrying amount of segment assets 43,492.08 1,895.95
Additions to fixed assets 1,255.09 -
As at March 31, 2012 (` in crore)
ParticularsWithin India Outside India
UAE Other Countries
Segment revenue 37,847.66 6,071.20 14,785.40
Carrying amount of segment assets 36,438.43 - 1,583.17
Additions to fixed assets 10,373.58 - -
43. DETAILS OF DuES TO MICRO AND SMALL ENTERPRISES
The information regarding principal and interest pertaining to micro and small enterprises based on available details is as under:
(` in crore)
Sr. No. Particulars As at
March 31, 2013As at
March 31, 2012
1 Principal amount due and remaining unpaid - -
2 Interest due on (1) above and the unpaid interest - -
3 Interest paid by the Company in terms of Section 16 of Micro, Small and Medium Enterprises Development Act, 2006
0.01 0.07
4 Payments made beyond the appointed day during the year 1.53 5.55
5 Interest due and payable for the period of delay - -
6 Interest accrued and remaining unpaid - -
7 Amount of further interest remaining due and payable in succeeding year
- -
Notes to financial statements for the year ended March 31, 2013
119

Co
mp
an
y o
ve
rv
iew
ma
na
ge
me
nt
Dis
Cu
ss
ion
an
D a
na
lys
iss
us
tain
ab
ility
go
ve
rn
an
Ce
Fin
an
Cia
ls
44. DEFINED BENEFIT PLANS / LONG TERM COMPENSATED ABSENCESa) Defined benefit plans / long term compensated absences – as per actuarial valuations as at March 31, 2013:
(` in crore)
Sr. No.
Particulars
Gratuity (Funded)
Compensated absences
(unfunded)
Company established
provident fund
As at March
31, 2013
As at March
31, 2012
As at March
31, 2013
As at March
31, 2012
As at March
31,2013
As at March
31, 2012
A Net assets / liability recognised in the balance sheet (refer note viii below)
1 Present value of defined benefit obligation
15.16 11.71 36.90 30.63 95.95 78.10
2 Fair value of plan assets 12.00 11.71 - - 95.95 78.10
3 Funded status - surplus / (deficit) (3.16) - (36.90) (30.63) - -
4 Net assets / (liability) recognised in the balance sheet
(3.16) - (36.90) (30.63) - -
B Expenses recognised in statement of profit and loss or expenditure during construction, as applicable for the year ended March 31, 2013
1 Current services cost 2.08 1.96 3.89 11.25 7.33 6.75
2 Interest cost 0.94 0.75 2.58 2.28 6.82 5.24
3 Expected return on plan assets (0.98) (0.86) - - (6.82) (5.24)
4 Past services cost - 0.14 - - - -
5 Actuarial losses/(gains) 0.97 0.18 (0.48) (10.91) - -
6 Total expenses 3.01 2.17 5.99 2.62 7.33 6.75
C Change in obligation and assets
C1 Change in defined benefit obligation
1 Defined benefit obligation at beginning of the year
11.71 9.74 30.63 28.97 78.10 61.99
2 Service cost 2.08 1.96 3.89 11.25 7.33 6.75
3 Interest cost 0.94 0.75 2.58 2.28 6.82 5.24
4 Plan Amendments - - - - - -
5 Acquisition adjustment/Transfer In/(Transfer Out)@
0.65 - 0.84 - 3.62 7.48
6 Actuarial losses / (gain) 1.01 (0.12) (0.48) (10.91) (1.45) (1.23)
7 Benefit payments (1.23) (0.62) (0.56) (0.96) (8.68) (11.32)
8 Employees contribution - - - - 10.21 9.19
9 Defined benefit obligation at the end of the year
15.16 11.71 36.90 30.63 95.95 78.10
C2 Change in fair value of assets
1 Fair value of plan assets at the beginning of the year
11.71 9.13 - - 78.10 61.99
2 Acquisition adjustment/Transfer In/(Transfer Out)@
0.36 - - - - -
3 Expected return on plan assets 0.98 0.86 - - 6.82 5.24
Notes to financial statements for the year ended March 31, 2013
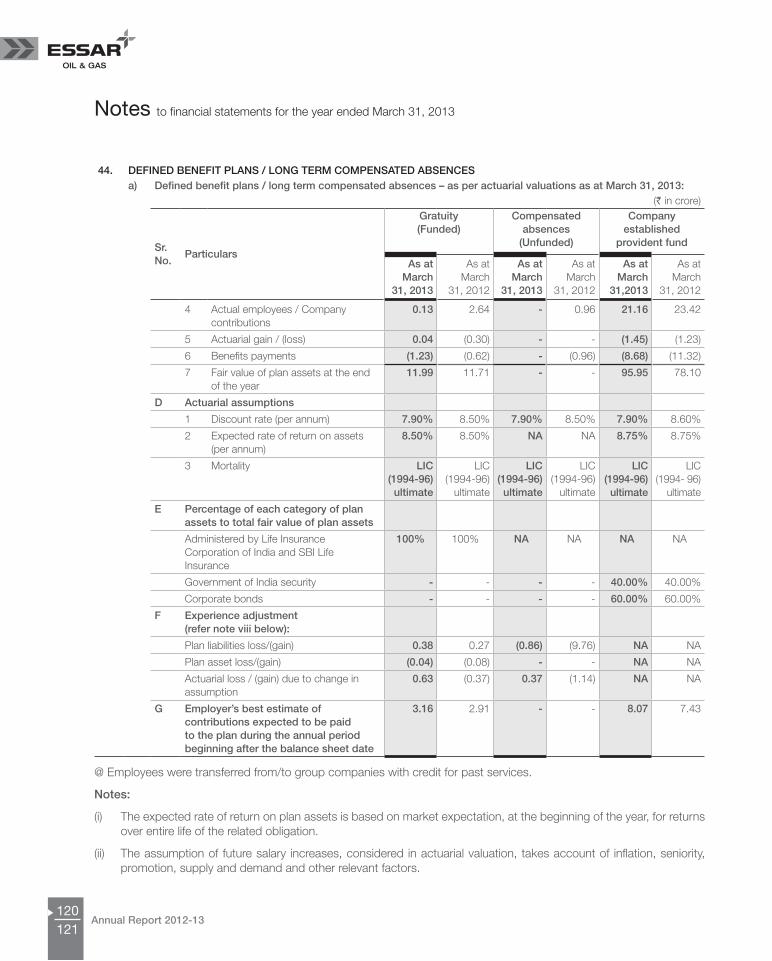
Annual Report 2012-13120
44. DEFINED BENEFIT PLANS / LONG TERM COMPENSATED ABSENCESa) Defined benefit plans / long term compensated absences – as per actuarial valuations as at March 31, 2013:
(` in crore)
Sr. No.
Particulars
Gratuity (Funded)
Compensated absences
(unfunded)
Company established
provident fund
As at March
31, 2013
As at March
31, 2012
As at March
31, 2013
As at March
31, 2012
As at March
31,2013
As at March
31, 2012
4 Actual employees / Company contributions
0.13 2.64 - 0.96 21.16 23.42
5 Actuarial gain / (loss) 0.04 (0.30) - - (1.45) (1.23)
6 Benefits payments (1.23) (0.62) - (0.96) (8.68) (11.32)
7 Fair value of plan assets at the end of the year
11.99 11.71 - - 95.95 78.10
D Actuarial assumptions
1 Discount rate (per annum) 7.90% 8.50% 7.90% 8.50% 7.90% 8.60%
2 Expected rate of return on assets (per annum)
8.50% 8.50% NA NA 8.75% 8.75%
3 Mortality LIC (1994-96) ultimate
LIC (1994-96)
ultimate
LIC (1994-96) ultimate
LIC (1994-96)
ultimate
LIC (1994-96)
ultimate
LIC (1994- 96)
ultimate
E Percentage of each category of plan assets to total fair value of plan assets
Administered by Life Insurance Corporation of India and SBI Life Insurance
100% 100% NA NA NA NA
Government of India security - - - - 40.00% 40.00%
Corporate bonds - - - - 60.00% 60.00%
F Experience adjustment (refer note viii below):
Plan liabilities loss/(gain) 0.38 0.27 (0.86) (9.76) NA NA
Plan asset loss/(gain) (0.04) (0.08) - - NA NA
Actuarial loss / (gain) due to change in assumption
0.63 (0.37) 0.37 (1.14) NA NA
G Employer’s best estimate of contributions expected to be paid to the plan during the annual period beginning after the balance sheet date
3.16 2.91 - - 8.07 7.43
@ Employees were transferred from/to group companies with credit for past services.
Notes:
(i) The expected rate of return on plan assets is based on market expectation, at the beginning of the year, for returns over entire life of the related obligation.
(ii) The assumption of future salary increases, considered in actuarial valuation, takes account of inflation, seniority, promotion, supply and demand and other relevant factors.
Notes to financial statements for the year ended March 31, 2013
121

Co
mp
an
y o
ve
rv
iew
ma
na
ge
me
nt
Dis
Cu
ss
ion
an
D a
na
lys
iss
us
tain
ab
ility
go
ve
rn
an
Ce
Fin
an
Cia
ls
(iii) The employees gratuity fund scheme managed by Life Insurance Corporation of India / SBI Life Insurance is a defined benefit plan. The present value of obligation is determined based on actuarial valuation using the Projected Unit Credit method.
(iv) The employer managed provident fund is considered as defined benefit plan.
(v) Liability on account of long term absences has been actuarially valued as per Projected Unit Credit Method.
(vi) Short term compensated absences have been provided on actual basis.
(vii) The Company is unable to obtain the details of plan assets from the Insurance Company (LIC of India / SBI Life Insurance) and hence the disclosure thereof is not made;
(viii) Amounts for the current and previous four years are as follows:
(` in crore)
Sr. No.
Particulars
Gratuity (Funded) Company Established Provident Fund
As at March
31, 2013
As at March
31, 2012
As at March
31, 2011
As at March
31, 2010
As at March
31, 2009
As at March
31, 2013
As at March
31, 2012
As at March
31, 2011
As at March
31, 2010
As at March
31, 2009
a) Net assets / liability recognized in the balance sheet
1 Present value of defined benefit obligation
15.16 11.71 9.74 5.39 3.96 95.95 78.10 61.99 50.83 43.18
2 Fair value of plan assets 12.00 11.71 9.13 4.86 3.89 95.95 78.10 61.99 50.83 43.18
3 Funded status - surplus / (deficit)
(3.16) - (0.61) (0.53) (0.07) - - - - -
4 Net assets / (liability) recognised in the balance sheet
(3.16) - (0.61) (0.53) (0.07) - - - - -
b) Experience adjustment
Plan liabilities loss/(gain) 0.38 0.27 0.19 (0.28) (0.16) NA NA NA NA NA
Plan assets loss/(gain) (0.04) (0.08) (0.08) - 0.31 NA NA NA NA NA
b) Defined contribution plans:
Company’s contribution to superannuation fund aggregating to ` 0.66 crore (Previous year ` 0.61 crore) are recognised in the statement of profit and loss / expenditure during construction, as applicable. There is no obligation other than the contribution payable to the respective trusts.
Notes to financial statements for the year ended March 31, 2013

Annual Report 2012-13122
45. RELATED PARTy DISCLOSuRES
I. Transactions with related parties
(` in crore)
Nature of transactions
Holding Company/
Intermediate Holding
Company
Subsidiaries Fellow Subsidiaries
Associates Companies in which
promoters have
significant influence
Advance received from Customers - - 816.02 - -
(EEOL - ` 816.02 crore) (Previous year - EEOL - ` 414.48 crore)
- - (414.48) - -
Expenses incurred on behalf of Joint venture
- - 5.27 - -
(EEHL - ` 5.27 crore) ( Previous year - EEHL - ` 12.89 crore)
- - (12.89) - -
Loans / advances taken - - - - -
(Previous year - EIL - ` 885.50 crore) - - (0.64) - (885.50)
Purchase of fixed assets/intangible assets (including CwIP)
- - 560.16 - 4.03
(EPIL - ` 497.44 crore) (Previous year - EPIL - ` 1,293.72 crore)
- - (1,397.78) - (12.28)
Advances given on capital account - - 761.37 - 107.63
(EPIL - ` 738.16 crore, VPL - ` 106.86 crore) (Previous year - EPIL - ` 55.32 crore)
- - (55.32) - -
Advances given to vendors for supplying services
- - 211.23 537.47 -
(VPCL - ` 537.47 crore, VPTL - ` 211.23 crore) (Previous year - ` Nil)
- - - - -
Deposits given by the Company - - 4.40 - 1.24
(EBPPL - ` 4.40 crore, EITL - ` 1.24 crore) (Previous year - VPL - ` 35.00 crore, EISL - ` 12.74 crore)
- - - - (47.74)
Present value of sales tax / vAT liability assigned
- - - - -
(Previous year - EHL - ` 528.42 crore) - - - - (528.42)
Sale of goods net of cash discount (including taxes)
- - 15,796.71 27.98 1.02
(EEOL - ` 15,457.06 crore) (Previous year - EEOL - ` 6,662.70 crore)
- - (6,830.37) - (0.87)
Interest income including reversal of break up charges
- - 71.91 32.54 310.60
(EHL ` 307.73 crore, EPIL - ` 47.16 crore)(Previous year - EHL - ` 155.13 crore)
- - - - (155.13)
Notes to financial statements for the year ended March 31, 2013
123

Co
mp
an
y o
ve
rv
iew
ma
na
ge
me
nt
Dis
Cu
ss
ion
an
D a
na
lys
iss
us
tain
ab
ility
go
ve
rn
an
Ce
Fin
an
Cia
ls
45. RELATED PARTy DISCLOSuRES
I. Transactions with related parties
(` in crore)
Nature of transactions
Holding Company/
Intermediate Holding
Company
Subsidiaries Fellow Subsidiaries
Associates Companies in which
promoters have
significant influence
Lease income (including lease tax) - - 1.62 0.02 0.01
(VPTL - ` 1.36 crore, VOTL - ` 0.25 crore)(Previous year - VPTL - ` 1.31 crore, VOTL - ` 0.25 crore)
- - (1.63) (0.02) (0.02)
Rendering of services - - 69.86 17.08 0.12
(VOTL - ` 36.56 crore, VPCL - ` 17.08 crore, EEHL - ` 12.02 crore) (Previous year - VOTL - ` 28.21 crore, ESL - ` 7.68 crore, EPIL - ` 7.50 crore)
- - (63.50) (0.94) (0.11)
Receiving of services - - 958.07 351.67 150.86
(VOTL - ` 588.37 crore, VPCL - ` 351.67 crore, VPTL - ` 253.52 crore) (Previous year - VOTL - ` 533.19 crore, VPCL - ` 255.14 crore, VPTL - ` 215.36 crore)
(0.02) - (883.19) (255.14) (207.23)
Purchase of goods/supply of material - - 2.99 5.69 -
(VPCL- ` 5.69 crore, ESTL - ` 2.99 crore)(Previous year - ` Nil)
- - - - -
Sale in Investment in Subsidiary / Investment in Subsidiary
- (0.00)* - - -
(Sale of Investment in EOML - USD 1)(Previous year purchase - EOML - USD 1)
- 0.00* - - -
Interest / financial charges paid / funded - - 6.29 5.89 35.73
(ICSPL - ` 35.73 crore, VOTL - ` 6.29 crore, VPCL - ` 5.89 crore) (Previous year - EIL - ` 102.03 crore)
- - (8.04) - (102.03)
Lease rent charged to Company - - - 97.58 15.27
(VPCL - ` 97.58 crore, VPL - ` 15.27 crore) (Previous year - VPL - ` 15.27 crore)
- - - - (15.27)
Assignment of provision/liability for employees benefit upon transfer of employee from the EPIL to EOL
- - 0.79 - 1.42
(EPIL - ` 0.79 crore, ESIL - ` 1.42 crore) (Previous year - ` Nil)
- - - - -
Notes to financial statements for the year ended March 31, 2013

Annual Report 2012-13124
45. RELATED PARTy DISCLOSuRES
I. Transactions with related parties
(` in crore)
Nature of transactions
Holding Company/
Intermediate Holding
Company
Subsidiaries Fellow Subsidiaries
Associates Companies in which
promoters have
significant influence
Assignment of provision/liability for employees benefit upon transfer of employees from EOL to EOSIL
- - 0.72 - -
(EOSIL - ` 0.72 crore) (Previous year - ` Nil) - - - - -
Cenvat / vAT charged - - - - -
(Previous year -VPCL - ` 0.69 crore) - - - (0.69) -
Guarantees given on behalf of the Company
- - - 99.05 11,672.83
(ICSPL - ` 11,661.41 crore) (Previous year - ESTL - ` 20.88 crore)
- - (20.88) - -
Transactions with other classes of related parties
a) Key management personnel (remuneration)
(Shri L K Gupta - ` 3.01 crore, Shri C Manoharan - ` 1.99 crore) (Previous year - Shri Naresh Nayyar - ` 1.63 crore, Shri L K Gupta - ` 1.55 crore)
5.00 (3.18)
b) Individuals having significant influence/control on the Company (Directors’ sitting fees)
(Shri A.S.Ruia - ` 20,000, Shri P.S.Ruia - ` 60,000) 0.01
(Previous year - Shri A.S.Ruia - ` 80,000) (0.01)
Notes to financial statements for the year ended March 31, 2013
125

Co
mp
an
y o
ve
rv
iew
ma
na
ge
me
nt
Dis
Cu
ss
ion
an
D a
na
lys
iss
us
tain
ab
ility
go
ve
rn
an
Ce
Fin
an
Cia
ls
45. RELATED PARTy DISCLOSuRES
II. Balances with related parties :
(` in crore)
Nature of balances
Holding Company/
Intermediate Holding
Company
Subsidiaries Fellow Subsidiaries
Associates Companies in which
promoters have
significant influence
Debit balances
Security deposits - - 13.40 - 98.57
(EISL - ` 12.98 crore, VPL - ` 63.00 crore)(Previous year - VPL - ` 63.00 crore, EISL - ` 12.98 crore, EITL - ` 11.29 crore)
- - (9.00) - (101.73)
Investments - - - 103.00 -
(VPCL - Equity shares of VPCL - ` 103.00 crore)(Previous year - VPCL - Equity shares of VPCL - ` 103.00 crore)
- (0.00)* - (103.00) -
Trade receivables - - 1,205.02 9.70 0.06
(EEOL - ` 926.06 crore, EPGL - ` 139.51 crore)(Previous year - EEOL - ` 293.15 crore)
- - (354.96) (0.02) (0.09)
Advances recoverable in cash or in kind or for value to be received
0.41 - 255.79 527.79 31.24
(VPCL - ` 527.79 crore, VPTL - ` 211.23 crore) (Previous year - EEHL - ` 31.82 crore, EEXPIL - ` 11.33 crore)
(0.41) - (45.43) - (0.71)
Advance on capital account - - 830.85 - 106.86
(EPIL - ` 814.23 crore, VPL - ` 106.86 crore)(Previous year - EPIL - ` 74.80 crore)
- - (75.84) - -
Other receivables 0.51 - 42.54 32.54 2,182.29
(EHL - ` 2,177.82 crore) (Previous year - EHL - ` 2,070.02 crore)
(0.12) - (16.11) - (2,073.22)
Credit balances
Security Deposits - - 9.11 - -
(AEGIS - ` 4.29 crore, EPIL - ` 3.80 crore, AGCNET - ` 1.00 crore) (Previous year - AEGIS - ` 4.29 crore)
- - (4.79) - -
Foreign currency compulsory convertible bonds
- - 1,340.00 - -
(EEHL - ` 1,340.00 crore) (Previous year - EEHL - ` 1,340.00 crore)
- - (1,340.00) - -
Long term borrowing - unsecured loans - - 45.75 - 51.88
(VOTL - ` 45.75 crore, VPL ` 51.88 crore)(Previous year - ICSPL - ` 1,109.00 crore, VOTL - ` 70.20 crore, VPL - ` 58.09 crore)
- - (70.20) - (1,167.08)
Notes to financial statements for the year ended March 31, 2013

Annual Report 2012-13126
45. RELATED PARTy DISCLOSuRES
II. Balances with related parties :
(` in crore)
Nature of balances
Holding Company/
Intermediate Holding
Company
Subsidiaries Fellow Subsidiaries
Associates Companies in which
promoters have
significant influence
Trade Payables / Other Liabilities - - 159.60 0.00 * 26.44
(EPIL - ` 91.90 crore, VOTL - ` 23.61 crore)(Previous year - EPIL - ` 160.10 crore, ICSPL - ` 173.72 crore, VPCL - ` 44.21 crore, VOTL - ` 34.60 crore)
- - (240.04) (44.21) (189.07)
Advance received from Customers - - 826.73 - -
(EEOL - ` 826.72 crore)(Previous year - EEOL - ` 414.48 crore)
- - (414.48) - -
Other balances
Advance to Directors - - - - 0.68
(Shri L K Gupta - ` 0.68 crore)(Previous year - Shri L K Gupta - ` 1.34 crore)
- - - - (1.34)
Outstanding guarantees given on behalf of the Company
6,160.79 - 128.00 99.05 12,434.09
(EIL - ` 12,434.09 crore#, EGL - ` 6,160.79 crore) (Previous year - EIL - ` 12,409.84 crore, EGL - ` 10,225.72 crore) # Does not include parallel guarantees provided by ICSPL for ` 11,661.41 crore during the year towards working capital facilities.
(10,225.72) - (535.44) - (12,409.84)
Outstanding guarantees given by the Company
- - 125.67 - -
(VOTL - ` 125.67 crore)(Previous year - VOTL - ` 161.06 crore)
- - (161.06) - -
* Amount less than ` 0.01 crore
Notes to financial statements for the year ended March 31, 2013
127

Co
mp
an
y o
ve
rv
iew
ma
na
ge
me
nt
Dis
Cu
ss
ion
an
D a
na
lys
iss
us
tain
ab
ility
go
ve
rn
an
Ce
Fin
an
Cia
ls
Notes :
1) Names of related parties and description of relationship:
Holding Companies Essar Global Fund Limited (FKA Essar Global Limited) - Cayman (Ultimate Holding Company)(EGL)
Essar Energy Plc - U.K (Holding Company of Vadinar Oil - Mauritius)(EEPLC)
Essar Oil & Gas Ltd (Formerly known as Vadinar Oil), Mauritius (Holding Company)(EOGL)
Subsidiaries Essar Oil Mauritius Limited (Subsidiary Company) – (formerly known as Pitney Mauritius Holdings Limited) (EOML) (Upto December 7, 2012)
Associate Vadinar Power Company Limited (VPCL)
Key management personnel Shri Lalit Kumar Gupta, Managing Director and CEO
Shri C Manoharan, Director - Refinery
Individuals having significant influence on the Company (Promoters)
Shri S. N. Ruia, Chairman
Shri P. S. Ruia, Director
Shri A. S. Ruia, Director (Upto August 7, 2012)
Fellow Subsidiaries Aegis Limited (AEGIS), Aegis Aspire Consultancy Services Limited (AACSL), AGC Networks Limited(AGCNET), Bhandar Power Limited (BPOL), Essar Bulk Terminal Limited (EBTL), Essar Bulk Terminal (Salaya) Limited (EBTSL), Essar Electric Power Development Corporation Limited (EEPDCL), Essar Energy Overseas Limited (EEOL), Essar Exploration & Production India Limited (EEXPIL), Essar Exploration & Production Limited (EEXPL), Essar Exploration & Production Southeast Asia Limited (EEXPSEAL), Essar Energy Holdings Limited - Mauritius (EEHL), Energy Transportation International Limited (ETIL), Essar Gujarat Petrochemicals Limited (EGPL), Essar Logistics Limited (ELL), Essar Offshore Subsea Limited (EOSL), Essar Oilfields Services India Limited (EOFSIL), Essar Oilfields Services Limited (EOFSL), Essar Oil UK Limited (EOLUK), Essar Power Gujarat Limited (EPGL), Essar Projects (India) Limited (EPIL), Essar Projects Management Consultants Limited (Merged with Essar Projects India Limited w.e.f. August 26, 2011) (EPMCL), Essar Power Limited (EPOL), Equinox Reality & Infrastructure Private Limited (ERIPL), Essar Steel India Limited (Merger of Essar Steel Orissa Limited, Essar Steel Hazira Limited, Hazira Pipe Mills Limited and Hazira Plates Limited w.e.f 1st Apr 2009) (ESTL), Essar Shipping & Logistics Limited (ESLL), Essar Shipping Limited (ESL), Vadinar Oil Terminal Limited (VOTL), Vadinar Ports and Terminal Limited (VPTL), Essar Exploration and Production Limited - Nigeria (EEPLN)
Notes to financial statements for the year ended March 31, 2013

Annual Report 2012-13128
Companies in which promoters have significant influence/control
Arkay Holdings Limited (ARKAYHPL), Essar Agrotech Limited (EATL), Bright Lamp Education Limited (BLEL) (Fka Essar Education Ltd), Essar Energy Services Limited (EESL), Essar Heavy Engineering Services Limited (EHESL), Essar House Limited (EHL), Essar Investments Limited (EIL), Imperial Consultants & Securities Private Limited (ICSPL) , Essar Information Technology Limited (EITL), Essar Infrastructure Services Limited (EISL), Essar Properties Limited (EPL), Essar Services India Limited (ESIL), Essar Steel (Jharkhand) Limited (ESTLR), Essar SEZ Hazira Limited (ESHL SEZ), Futura Travels Limited(FUTURA), Ibrox Estates Private Limited (IBROX), India Securities Limited (ISL), Kanak Communications Limited(KANAKCL), Kartik Estates Private Limited(KEPL), Neelkamal Traders Private Limited(NEELKAMAL), New Ambi Trading & Investments Private Limited (NEWAMBITPL), Paprika Media Limited, Sinter-Keramos & Composites Private Limited (SKCPL), The Mobilestore Limited (TMSL), Vadinar Properties Limited (VPL), SG Chemicals & Dyes Trading Limited (SGCHEMTL), Balaji trust (BALAJITR)
2) Names of related parties, where the transactions during the year with a single party are 10% or more, are disclosed under each nature of transaction.
3) Previous year figures have been shown in brackets.
46. Figures of previous year have been regrouped / rearranged, wherever necessary, to conform to those of the current year.
For and on behalf of the Board of Directors
Lalit Kumar Gupta Naresh Nayyar Managing Director and Deputy Chairman Chief Executive Officer
S. S. Shaffi Suresh Jain Company Secretary Chief Financial Officer Mumbai, May 10, 2013
Notes to financial statements for the year ended March 31, 2013
129

No
tic
e
Notice
NOTICE is hereby given that the Twenty Third Annual General Meeting of members of ESSAR OIL LIMITED will be held at the Registered Office of the Company at Refinery Complex, Khambhalia Post (39th km. stone on Jamnagar-Okha Highway), Dist. Jamnagar-361305, Gujarat on Friday, September 27, 2013 at 11:00 a.m. to transact, with or without modifications, as may be permissible, the following business:
ORDINARY BUSINESS:
1. To receive, consider, approve and adopt the Balance Sheet as at March 31, 2013, the Statement of Profit & Loss for the financial year ended on that date and the reports of the Board of Directors and Auditors thereon.
2. To appoint a Director in place of Mr. C Manoharan who retires from office by rotation and being eligible, offers himself for re-appointment.
3. To appoint a Director in place of Mr. K N Venkatasubramanian who retires from office by rotation and being eligible, offers himself for re-appointment.
4. To appoint M/s. Deloitte Haskins & Sells, Chartered Accountants, Ahmedabad, having ICAI Registration number 117365W, as Auditors to hold office from the conclusion of this Annual General Meeting until the conclusion of the next Annual General Meeting and to authorize the Board of Directors to fix their remuneration.
SPECIAL BUSINESS:
5. To consider and, if thought fit, to pass the following resolution as a Special Resolution:
“RESOLVED THAT in partial modification to special resolution passed by the members at the Annual General Meeting of the Company held on December 20, 2012 and pursuant to the provisions of sections 198, 269, 309 and other applicable provisions, if any, of the Companies Act, 1956 as amended or re-enacted from time to time read with Schedule XIII thereto, approval of the Company be and is hereby given for revision in the terms of remuneration of Mr. Chakrapany Manoharan, Director (Refinery)
of the Company with effect from April 1, 2013 for the remaining period of his term in office upon the terms and conditions as set out in the Explanatory Statement annexed to this Notice which is hereby specifically approved with authority to the Board of Directors (which term shall include the Nomination and Remuneration Committee constituted by the Board of Directors) to alter and vary the terms and conditions including period in office as may be agreed to between the Board of Directors and Mr. Chakrapany Manoharan, in the best interest of the Company.”
“RESOLVED FURTHER THAT the Board of Directors be and is hereby authorized to take such steps as may be necessary or expedient to give effect to this resolution.”
6. To consider and, if thought fit, to pass the following resolution as an Ordinary Resolution:
“RESOLVED THAT Mr. Virendra Singh Jain, who was appointed as an Additional Director by the Board of Directors with effect from May 10, 2013 pursuant to section 260 of the Companies Act, 1956 and who holds office upto the date of the Annual General Meeting and in respect of whom the Company has received a notice under section 257 of the Companies Act, 1956, in writing, proposing his candidature for the office of director, be and is hereby appointed as a Director of the Company.”
By Order of the Board of Directors
Mumbai Sheikh S. ShaffiAugust 14, 2013 Company Secretary
Registered Office:Khambhalia Post, P.O.Box 24Dist. Jamnagar - 361305, Gujarat

Annual Report 2012-13130
Notice
NOTES:
1. A member entitled to attend and vote at the meeting is entitled to appoint a proxy to attend and vote instead of himself and the proxy need not be a member of the Company. The proxy, in order to be effective, must be deposited at the Registered Office of the Company not less than 48 hours before the commencement of the meeting, i.e. before 11:00 a.m. of September 25, 2013.
2. The Register of Members and Share Transfer Books of the Company will remain closed from Wednesday, the 25th day of September 2013 to Friday, the 27th day of September, 2013 (both days inclusive).
3. All documents referred to in the accompanying Notice are open for inspection at the Registered Office of the Company on all working days, except Saturdays, Sundays and Bank holidays, between 11:00 a.m. and 1:00 p.m. upto the date of the Annual General Meeting.
4. Members / proxies should bring the attendance slip duly filled in for attending the meeting.
5. Members desiring any information with regard to Accounts / Reports are requested to write to the Company atleast ten days before the date of the meeting, so as to enable the management to keep the information ready.
6. Directors retiring by rotation:
Mr. C Manoharan was appointed as Director (Refinery) on March 29, 2012. He retires by rotation at the Annual General Meeting and offers himself for re-appointment. A brief profile of Mr. C Manoharan is setout in the Explanatory Statement annexed to this Notice.
Mr. K N Venkatasubramanian was appointed to the Board of Directors on November 29, 2000. He is a Chemical Engineer from A.C. College of Technology, Chennai and an M.Tech from IIT, Kharagpur, having over 51 years of experience in the oil & gas and petrochemicals sectors having worked for IPCL, IOCL and Gulf Oil Limited. He has previously served
as Director Marketing and Director Operations of IPCL, Chairman and Managing Director of Engineers India Ltd., Chairman and Managing Director of IOCL and as Chairman of Gulf Oil Ltd.
The other companies in which Mr. K N Venkatasubramanian is a Director are Gulf Carrosseri India Ltd, Gulf Oil Corporation Ltd, Imperial Corporate Finance & Services Pvt. Ltd, Royal Chemic Corporation Ltd, Time Technoplast Ltd, IDL Explosives Ltd and M&B Engineering Pvt. Ltd. He is a member of 6 Committees including 4 Committee positions in the Company. He holds 6,500 shares of the Company. Mr. K N Venkatasubramanian retires by rotation at the Annual General Meeting and offers himself for re-appointment.
7. The Securities and Exchange Board of India (SEBI) has mandated submission of Permanent Account Number (PAN) by every participant in securities market for transfer / transmission / transposition of securities and deletion of name. Members holding shares in physical form are requested to submit their PAN details to the Company / Share Transfer Agents (STA), M/s. Datamatics Financial Services Ltd. Members holding shares in electronic form have to submit the PAN details to their Depository Participants (DPs).
8. Facility for making nominations is available to individuals holding shares in the Company. Members holding shares in physical form may obtain the prescribed nomination form 2B from the STA. Members holding shares in electronic form are requested to approach their DPs for the nomination.
9. Pursuant to sections 205C of the Companies Act, 1956 all unclaimed principal amount on debentures remaining unpaid or unclaimed for a period of seven years from the date they became due for payment during the financial year 2004-05, have been transferred to the Investor Education and Protection Fund (IEPF) established by the Central Government.
131

No
tic
e
ANNEXURE TO NOTICE
Explanatory Statement pursuant to section 173(2) of the Companies Act, 1956 setting out all material facts relating to special business mentioned in accompanying Notice dated August 14, 2013.
Item No. 5
Mr. C Manoharan was appointed as Director (Refinery) of the Company for a period of 3 years with effect from March 29, 2012. The shareholders at the 22nd Annual General Meeting held on December 20, 2012 approved his appointment and terms of remuneration.
Taking into consideration the increased business activities and also the contributions made by the Director (Refinery), the Board of Directors has deemed it fit to increase the remuneration of Mr. C. Manoharan, Director (Refinery). Approval of the Central Government will not be required for the payment of increase in managerial remuneration to the Wholetime Director since he is a professional possessing specialized knowledge in the field of his profession and he does not have any interest in the capital of the Company nor is he interested in / related to directors / promoters of the Company.
Information required to be given to members as per Schedule XIII of the Companies Act, 1956 is as under:
I General Information:
(1) Nature of Industry:
The Company belongs to the oil and gas industry. It is an existing company engaged in exploration and production of oil and gas, refining of crude oil and marketing of petroleum products.
(2) Expected date of commencement of commercial production:
The Company is an operating entity. With the completion of Refinery Expansion Project in March, 2012 and Optimisation Project in June, 2012, the refining capacity of the Refinery at Vadinar, Gujarat stands enhanced to 20 MMTPA.
(3) Financial performance: (` in crore)
Financial parameters
Financial year ended March 31
2011 2012 2013
Gross sale from operations
53,119.10 63,339.52 96,796.88
Earnings before finance cost, depreciation and amortization, exceptional items and tax (EBIDTA)
2,779.49 2,100.76 3,650.68
Net profit / (loss) (as computed u/s 198)
* (3,081.54) * (4,367.08) * (5,545.40)
Net profit/(loss) after tax as per Statement of Profit & Loss
(251.69) (1,285.48) (1,180.44)
*includes loss for the preceding financial year/s.
Notice
(4) Export performance:
During the year ended March 31, 2013, FOB value of exports (on accrual basis) was ` 30,640.29 crore.
(5) Foreign investments and collaborations, if any:
Essar Energy Holdings Ltd. Foreign Co-Promoter, has made Foreign Direct Investment of ` 4,218 crore in the Company and post inter-se acquisition of shares from other Promoter Group companies presently holds 211,805,815 (15.51%) equity shares and 1,843,724 Global Depository Shares represented by 282,089,772 (20.66%) underlying equity shares of the Company.
II Information about Mr. C Manoharan:
Mr. C Manoharan is the Director (Refinery) and is responsible for all the operations of the Refinery at Vadinar, District Jamnagar. Under his leadership the Company was able to increase the thru’put of the refinery from 10.5 MMTPA to 14 MMTPA and recently

Annual Report 2012-13132
Notice
expanded the refining capacity to 20 MMTPA with stabilization of Expansion units in record 3 months time period. Further, the Refinery is maintaining an excellent safety record of 1,825 LTI Free Days as of March 31, 2013. His brief profile is set out below:
Mr. C Manoharan is 59 years old. He is a Graduate in Chemical Engineering from Calicut University, Kerala. He joined the Company as Head of Refinery in May 2008 from Indian Oil Corporation Limited (IOCL).
Mr. C Manoharan has extensive experience in the oil and gas industry. He started his career as Engineer Trainee in 1977 at Indian Oil Corporation Limited (IOCL), Gujarat Refinery, Baroda. He handled a variety of key assignments in various positions in Refining Operations, Maintenance and Technical Services at Gujarat Refinery, Panipat Refinery as well as Head Office (Refinery Division). His last assignment with IOCL was at Panipat Refinery as Executive Director. He had the privilege of associating with the construction and commissioning of various Refinery Projects including the first FCC unit in IOCL and first Hydrocracker Unit in the Country. Mr. Manoharan has also worked for 2 years on deputation to Nigeria providing technical assistance to the operating personnel at Port Harcourt Refinery of NNPC. He was a Board member of Indian Oil Technologies Limited from May 2004 and as Chairman of the Board from January 2007 to March 2008. He also has the distinction of being the first Indian to be on the panel of NPRA’s Q&A 2003 session held at New Orleans in U.S.A.
The revised particulars of remuneration payable to Mr. C Manoharan with effect from April 1, 2013 for the remaining period of his term in office as Director (Refinery) are ` 2.25 crore per annum comprising of basic salary, allowances and perquisites including house rent allowance / company provided accommodation, special allowance, reimbursement of vehicle operating, entertainment, telephone, professional perquisite, leave travel allowance, medical expenses as per Company rules, annual
performance bonus depending on performance of the Company and his performance assessed as per Company policy. He will also be covered under Company’s Provident Fund / Gratuity / Hospitalisation / Health Insurance / Group Personal Accident Scheme and mobile reimbursement policy. The total of salary / perquisites / allowances / other benefits and bonus as may be decided by the Board of Directors or the Nomination and Remuneration Committee during his tenure in office, will not exceed ` 3.00 crore per annum. The perquisite value of the facilities / benefits / allowances and bonus shall be evaluated, wherever applicable, as per the Income Tax Act, 1961 and the Rules framed thereunder. The Employee Stock Options granted / to be granted to Mr. C Manoharan from time to time are not to be included for the purpose of computation of overall ceiling of remuneration.
In the event of termination of employment, except in circumstances of fraud or gross misconduct on his part, he will be entitled to be paid remuneration for a maximum period of three months.
Subject to as aforesaid, he shall be governed by such of the existing service rules of the Company as may be in force from time to time.
The remuneration proposed to be paid to the Director (Refinery) is comparable with the remuneration being paid for similar assignments in the industry.
The above may be treated as an abstract of the agreement between the Company and Mr. C Manoharan pursuant to section 302 of the Act.
Mr. C Manoharan does not have direct or indirect pecuniary relationship with the Company or relationship with the managerial personnel other than getting remuneration as Director (Refinery) of the Company. He does not hold any shares in the Company. He is a member of 2 Committees of the Company. He is a Director on the Board of Vadinar Power Company Limited.
133
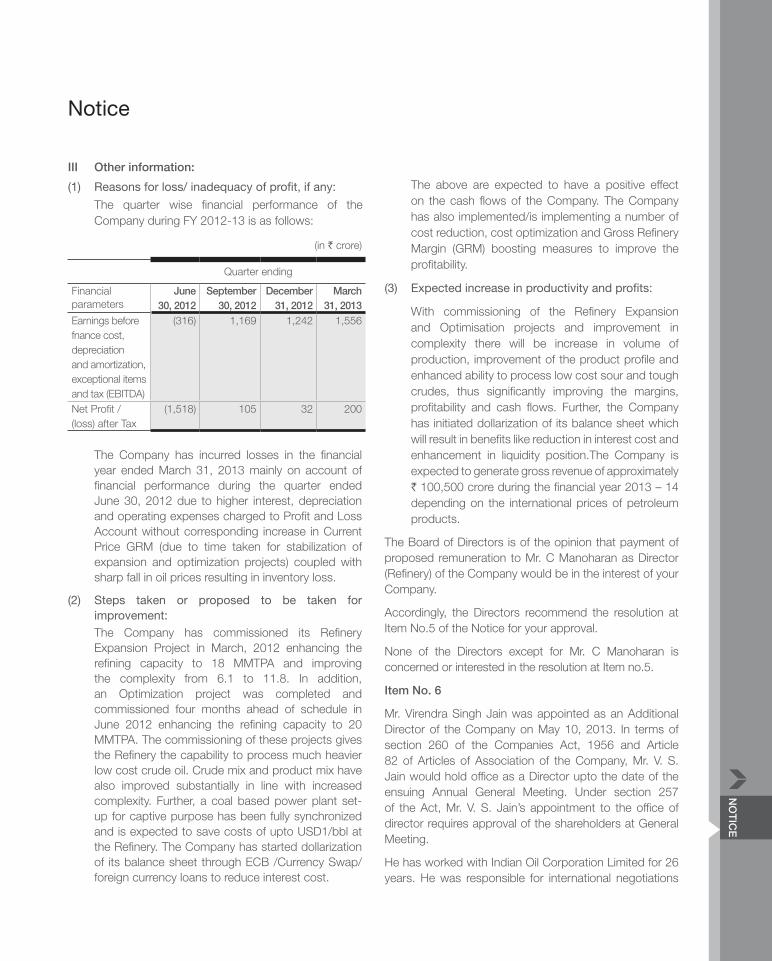
No
tic
e
III Other information:
(1) Reasons for loss/ inadequacy of profit, if any:
The quarter wise financial performance of the Company during FY 2012-13 is as follows:
(in ` crore)
Quarter ending
Financial parameters
June 30, 2012
September 30, 2012
December 31, 2012
March 31, 2013
Earnings before fnance cost, depreciation and amortization, exceptional items and tax (EBITDA)
(316) 1,169 1,242 1,556
Net Profit / (loss) after Tax
(1,518) 105 32 200
The Company has incurred losses in the financial year ended March 31, 2013 mainly on account of financial performance during the quarter ended June 30, 2012 due to higher interest, depreciation and operating expenses charged to Profit and Loss Account without corresponding increase in Current Price GRM (due to time taken for stabilization of expansion and optimization projects) coupled with sharp fall in oil prices resulting in inventory loss.
(2) Steps taken or proposed to be taken for improvement:
The Company has commissioned its Refinery Expansion Project in March, 2012 enhancing the refining capacity to 18 MMTPA and improving the complexity from 6.1 to 11.8. In addition, an Optimization project was completed and commissioned four months ahead of schedule in June 2012 enhancing the refining capacity to 20 MMTPA. The commissioning of these projects gives the Refinery the capability to process much heavier low cost crude oil. Crude mix and product mix have also improved substantially in line with increased complexity. Further, a coal based power plant set-up for captive purpose has been fully synchronized and is expected to save costs of upto USD1/bbl at the Refinery. The Company has started dollarization of its balance sheet through ECB /Currency Swap/foreign currency loans to reduce interest cost.
Notice
The above are expected to have a positive effect on the cash flows of the Company. The Company has also implemented/is implementing a number of cost reduction, cost optimization and Gross Refinery Margin (GRM) boosting measures to improve the profitability.
(3) Expected increase in productivity and profits:
With commissioning of the Refinery Expansion and Optimisation projects and improvement in complexity there will be increase in volume of production, improvement of the product profile and enhanced ability to process low cost sour and tough crudes, thus significantly improving the margins, profitability and cash flows. Further, the Company has initiated dollarization of its balance sheet which will result in benefits like reduction in interest cost and enhancement in liquidity position.The Company is expected to generate gross revenue of approximately ` 100,500 crore during the financial year 2013 – 14 depending on the international prices of petroleum products.
The Board of Directors is of the opinion that payment of proposed remuneration to Mr. C Manoharan as Director (Refinery) of the Company would be in the interest of your Company.
Accordingly, the Directors recommend the resolution at Item No.5 of the Notice for your approval.
None of the Directors except for Mr. C Manoharan is concerned or interested in the resolution at Item no.5.
Item No. 6
Mr. Virendra Singh Jain was appointed as an Additional Director of the Company on May 10, 2013. In terms of section 260 of the Companies Act, 1956 and Article 82 of Articles of Association of the Company, Mr. V. S. Jain would hold office as a Director upto the date of the ensuing Annual General Meeting. Under section 257 of the Act, Mr. V. S. Jain’s appointment to the office of director requires approval of the shareholders at General Meeting.
He has worked with Indian Oil Corporation Limited for 26 years. He was responsible for international negotiations

Annual Report 2012-13134
The Ministry of Corporate Affairs has taken a Green initiative in Corporate Governance by allowing paperless compliance by companies. Accordingly, companies can now send various documents electronically to those shareholders who register their email addresses. To receive all communications including Annual Reports by e-mail:
Holders of shares in physical form are requested to fill up the e-mail registration form made available on the Company’s website www.essar.com and send it to the share transfer agents, M/s. Datamatics Financial Services Ltd.
Members holding shares in demat form may register their e-mail IDs with the Company or the depository participant.
Notice
for procurement of crude and petroleum products and implementation of financial strategies and financial appraisal of projects. Thereafter, he served another Maharatna – Steel Authority of India Limited (SAIL), first as Director – Finance and thereafter as the Chairman till his retirement in 2006. After retirement, he served the Jindal Group as Managing Director and CEO of Jindal Stainless Limited. He also held the post of Member of the Public Enterprises Selection Board till July 2011. He a Fellow member of the Institute of Chartered Accountants of India and Institute of Cost Accountant of India.
Mr. V. S. Jain is a Director of Dalmia Bharat Ltd and Rashtriya Ispat Nigam Ltd. He is a member of 2 Committees including 1 in the Company. He holds 600 shares of the Company.
The Directors recommend the resolution at Item No. 6 of the Notice for your approval.
None of the other Directors except for Mr. V. S. Jain is in anyway concerned or interested in the resolution at Item no. 6.
By Order of the Board of Directors
Mumbai Sheikh S. ShaffiAugust 14, 2013 Company Secretary
Registered Office:Khambhalia Post, P.O.Box 24Dist. Jamnagar - 361305, Gujarat
135

Essar Oil LimitedRegistered Office: Khambhalia Post, Post Box No. 24, Dist. Jamnagar - 361 305, Gujarat
23RD ANNUAL GENERAL MEETING - SEPTEMBER 27, 2013 AT 11:00 A.M.
DP Id NAME & ADDRESS OF THE REGISTERED SHAREHOLDER
Client Id/Regd. Folio No.
No. of Shares held
I certify that I am a registered shareholder/proxy for the registered shareholder of the Company.
I hereby record my presence at the TWENTY THIRD ANNUAL GENERAL MEETING of the Company at the Registered Office at Khambhalia Post (39th Km. stone on Jamnagar-Okha Highway), Dist. Jamnagar - 361 305, Gujarat on Friday, September 27, 2013 at 11:00 a.m.
................................................................. Member’s/Proxy’s SignatureNote: Please complete this and hand it over at the entrance of the hall.
Essar Oil LimitedRegistered Office: Khambhalia Post, Post Box No. 24, Dist. Jamnagar - 361 305, Gujarat
23RD ANNUAL GENERAL MEETING - SEPTEMBER 27, 2013 AT 11:00 A.M.
I/We ...........................................................................................................................................................................
of......................................................................................................... in the district of ..............................................
being a member/members of ESSAR OIL LIMITED hereby appoint .............................................................................
of......................................................................................................... in the district of ..............................................
or failing him Shri ............................................................................of ........................................................................
......................... in the district of .................................................................................................................................
as my/our proxy to vote for me/us on my/our behalf at the TWENTY THIRD ANNUAL GENERAL MEETING of the Company to be held on Friday, September 27, 2013 at 11:00 a.m. at the Registered Office of the Company at Khambhalia Post (39th Km. stone on Jamnagar-Okha Highway), Dist. Jamnagar - 361 305, Gujarat and at any adjournment thereof.
Signed this ........................................ day of .................................... 2013
DP Id
Client Id/Regd. Folio No.
No. of Shares held
Note: This form of proxy in order to be effective, should be duly stamped, completed and signed and must be deposited at the Registered Office of the Company, not less than 48 hours before the commencement of the meeting.
ATTENDANCE SLIP
FORM OF PROXY
Signature ......................................................................
Affix15 paiseRevenueStamp
TEA
R H
ER
E
OIL & GAS


FUNCTION AWARD CATEGORY AWARD INSTITUTED BY
Health Safety & Environment 5S Gold Category Quality Forum Circle of India – Gujarat State
Health Safety & Environment Category 1 - Lowest Average Frequency Rate over a period of three consecutive years ending 2010, and Runner-up in Category 2 - Accident Free Year based on man hours worked during 2010.
Ministry of Labor and Environment, DGFASLI, Government of India
Health Safety & Environment National Oil Industry Safety Award - Third OISD, Ministry of Petroleum & Natural Gas
Operational efficiency PetroFed Refinery of the year award Petroleum Federation of India
Carbon management Top Final Disclosure Score, Indian Energy Sector – Carbon Disclosure leadership Index, 2012
Carbon Disclosure Project (UK)
Human Resource “Best HR Strategy” in the Oil & Gas category
Greentech Foundation
AWARDS AND RECOGNITIONS
Night view of the Vadinar Refinery

If undelivered, please return to:M/s. Datamatics Financial Services Ltd.Unit: Essar Oil LimitedPlot No. B-5, Part B Cross LaneMIDC, Marol, Andheri (East)Mumbai - 400 093INDIA
BOOK-POST