Embed Size (px)
Citation preview

ESS — Extension of Social Security
Global evidence on inequities in rural health protection
New data on rural deficits in health coverage
for 174 countries
Edited by
Xenia Scheil-Adlung
ESS Document No. 47
INTERNATIONAL LABOUR OFFICE
ii Global evidence on inequities in rural health protection
Copyright © International Labour Organization 2015
First published 2015
Publications of the International Labour Office enjoy copyright under Protocol 2 of the Universal Copyright
Convention. Nevertheless, short excerpts from them may be reproduced without authorization, on condition that
the source is indicated. For rights of reproduction or translation, application should be made to ILO Publications
(Rights and Permissions), International Labour Office, CH-1211 Geneva 22, Switzerland, or by email:
[email protected]. The International Labour Office welcomes such applications.
Libraries, institutions and other users registered with reproduction rights organizations may make copies in
accordance with the licences issued to them for this purpose. Visit www.ifrro.org to find the reproduction rights
organization in your country.
ILO Cataloguing in Publication Data
Scheil-Adlung, Xenia
Global evidence on inequities in rural health protection: new data on rural deficits in health coverage for 174
countries / Xenia Scheil-Adlung, (Ed.); International Labour Office, Social Protection Department. - Geneva:
ILO, 2015
(Extension of Social Security series ; No 47)
International Labour Office Social Protection Dept.
social protection / health insurance / rural worker / medical care / access to care / vulnerable groups / scope of
coverage / rural area / urban area
02.03.1
The designations employed in ILO publications, which are in conformity with United Nations practice, and the
presentation of material therein do not imply the expression of any opinion whatsoever on the part of the
International Labour Office concerning the legal status of any country, area or territory or of its authorities, or
concerning the delimitation of its frontiers.
The responsibility for opinions expressed in signed articles, studies and other contributions rests solely with their
authors, and publication does not constitute an endorsement by the International Labour Office of the opinions
expressed in them.
Reference to names of firms and commercial products and processes does not imply their endorsement by the
International Labour Office, and any failure to mention a particular firm, commercial product or process is not a
sign of disapproval.
ILO publications and electronic products can be obtained through major booksellers or ILO local offices in many
countries, or direct from ILO Publications, International Labour Office, CH-1211 Geneva 22, Switzerland.
Catalogues or lists of new publications are available free of charge from the above address, or by email:
Visit our web site: www.ilo.org/publns
The editor of the series is the Director of the Social Protection Department, ILO. For more information on the
series, please contact:
Isabel Ortiz, Director Social Protection Department
International Labour Organization
4 Route des Morillons
CH-1211 Geneva 22 Switzerland
Tel. +41.22.799.6226 • Fax:+41.22.799.79.62
Printed in Switzerland
Global evidence on inequities in rural health protection iii
Abstract
This paper presents global estimates on rural/urban disparities in access to health-care
services. The report uses proxy indicators to assess key dimensions of coverage and access
involving the core principles of universality and equity. Based on the results of the estimates,
policy options are discussed to close the gaps in a multi-sectoral approach addressing issues and
their root causes both within and beyond the health sector.
JEL Classification: I13, I14
Keywords: social protection, health insurance, vulnerable groups, rural area, urban area

iv Global evidence on inequities in rural health protection

Global evidence on inequities in rural health protection v
Foreword
While inequities in health protection are increasingly recognized as an important
issue in current policy debates on universal health coverage (UHC) and in the post-2015
agenda, the rural/urban divide is largely ignored. A key reason for disregarding equity in
coverage and access to health care of large parts of the population relates to the nearly
complete absence of disaggregated data providing sufficient information at national,
regional and global level. Only vague and fragmented information, often limited to micro-
data, can be found.
Given this gap in information, it is hardly possible to quantify and assess the extent
of disparities and deficits experienced by rural populations as regards key aspects of their
rights to health and social protection; the availability, affordability and financial protection
of needed health services; and increases or decreases in inequities. Further, governments
and policy-makers lack evidence to set priorities, and thus face challenges in addressing
the issues that are spread over various policy domains including health, social protection,
labour market and more generally economic and fiscal policies.
This paper presents and analyses for the first time related global, regional and
national data. It is developed and made available by the ILO. The data allow investigating
both the extent of and major causes of rural/urban inequities in coverage and access to
health care. Further, it discusses impacts and policy options to achieve more equitable
results.
The data development and related assessments provided in this paper are anchored
in the framework of universal health protection along the lines of international legal
standards, particularly the ILO Social Protection Floors Recommendation, 2012 (No. 202)
and the UN Resolution on Universal Health Coverage (12 December 2012).
The paper has been developed as part of the mandate of the ILO Areas of Critical
Importance (ACI) on Decent Work in the Rural Economy as well as the ACI on Creating
and Extending Social Protection Floors, and has been reviewed by a significant number of
experts in relevant development agencies. It highlights the needs of disadvantaged,
marginalized and vulnerable rural populations and contributes to related global research
products and statistics. Further, it provides guidance to ILO member States on establishing
and extending social protection floors for all as a fundamental element of national social
security systems.
The evidence provided in the paper suggests that inequalities in coverage and
access to health care exist globally, in every region and nearly every country. In fact, the
place of residence can be considered as the entry door or key barrier to accessing needed
health care. Against this background, the paper aims at contributing to the development of
urgently needed policy responses realizing the universal human rights to social protection
and health, particularly for rural populations.
Isabel Ortiz
Director
Social Protection Department
International Labour Organization

vi Global evidence on inequities in rural health protection
Global evidence on inequities in rural health protection vii
Contents
Page
Foreword ........................................................................................................................................... iv
Acknowledgements ........................................................................................................................... ix
Key messages .................................................................................................................................... xiii
1. The need to share resources equally between rural and urban populations, and the
discourse on universal health coverage ............................................................................................. 1
2. Addressing the information gap: A fresh look at data and methodologies ............................. 3
3. The evidence: Inequities in access to health care in rural and urban areas ............................. 6
3.1. The lack of rights at rural level ..................................................................................... 6
3.2. The impact of shortages of rural health workers and of their working conditions ....... 9
3.3. The extent of inequitable funding for health protection in rural and urban areas ......... 11
3.4. The health-related impoverishment of the rural vulnerable .......................................... 12
3.5. Life-threatening inequities: The extent of rural maternal mortality.............................. 16
3.6. The size of global rural/urban inequities ....................................................................... 19
3.7. Inequities in rural and urban areas at national level: Selected country studies ............. 22
3.7.1. Cambodia ............................................................................................................ 22
3.7.2. Mexico ................................................................................................................ 23
3.7.3. Nigeria ................................................................................................................ 25
3.7.4. Zambia ................................................................................................................ 26
4. Policies to end the rural/urban divide: Extending health protection to all and targeting the
social determinants of inequities ....................................................................................................... 28
4.1. Key objectives and principles: Removing the leading causes of inequities.................. 28
4.2. A shared agenda for the future: Addressing inequities in a coherent multi-sectoral
approach .................................................................................................................................. 29
4.2.1. Considering rural living and working characteristics ......................................... 30
4.2.2. Moving from charity to rights ............................................................................. 31
4.2.3. Developing fiscal space and allocating resources to rural health protection ...... 31
4.2.4. Making quality health care equally available in rural areas ............................... 33
4.2.5. Guaranteeing affordability of care and financial protection ............................... 36
4.2.6. Addressing the social determinants of inequities: Social protection policies ..... 37
4.3 The implementation process ............................................................................................. 39
5. Conclusions ............................................................................................................................. 43
Statistical annex: Deficits in universal health protection by rural/urban areas: Global, regional
and country estimates, latest available year ...................................................................................... 45
Further reading .................................................................................................................................. 59
viii Global evidence on inequities in rural health protection
List of tables
1 Indicators used to measure rural/urban coverage and access to health care ...................................... 3
2 Inequities in coverage and access to health care: Cambodia, Mexico, Nigeria, Zambia, 2015 ....... 22
3 Identifying core issues of rural/urban health access deficits ........................................................... 40
4 Selected policy options for reducing urban/rural health access deficits .......................................... 41
List of figures
1 Proportion of the global population not protected by legislation or affiliated to a health insurance
scheme, 2015 (percentages) .............................................................................................................. 6
2 Proportion of the rural population in Africa not protected by legislation or affiliated to a national
health service or scheme, 2015 (percentages) ................................................................................... 7
3 Rural/urban coverage deficits in Asia and the Pacific: Proportion of the population not protected
by legislation or affiliated to a national health service or scheme, 2015 (percentages) .................... 8
4 Distribution of countries where the rural coverage gap exceeds the urban by over 50 per cent, by
region and income level, 2015 (37 countries; percentages) .............................................................. 8
5 Global estimates of skilled health worker deficits in rural and urban areas, 2015 (millions) ........... 9
6 Rural/urban populations without access to health care due to health worker shortages, 2015 (ILO
staff access deficit,* percentages) ................................................................................................... 10
7 Rural and urban population without access to health care due to a lack of financial resources, 2015
(percentage of total world population) ............................................................................................ 11
8 Estimated health coverage gap due to financial deficits in rural/urban areas, selected regions, 2015
(percentages) ................................................................................................................................... 12
9 Distribution of rural OOP across the world, 2015 (percentage of THE) ......................................... 13
10 Distribution of urban OOP across the world, 2015 (percentage of THE) ....................................... 14
11 Global rural and urban OOP, 2015 (percentage of THE) ................................................................ 15
12 Distribution of rural and urban OOP, selected regions,* 2015 (percentage of THE) ..................... 15
13 Maternal mortality rates: Number of deaths per 10,000 live births, selected regions, 2015 ........... 17
14 Urban/rural estimates of maternal mortality rates, 2015 (by national MMR quintile) .................... 18
15 The rural staff access deficit and maternal mortality, selected countries, 2015 .............................. 19
16 The global deficit in effective access to health services, urban and rural populations, 2015
(percentages) ................................................................................................................................... 20
17 Regional deficits in effective access to health services, urban and rural populations, 2015
(percentages) ................................................................................................................................... 21
18 Health coverage and access to health care in rural and urban Cambodia, 2015 .............................. 23
19 Health coverage and access to health care in rural and urban Mexico, 2015 .................................. 24
20 Health coverage and access to health care in rural and urban Nigeria, 2015 .................................. 26
21 Health coverage and access to health care in rural and urban Zambia, 2015 .................................. 27

Global evidence on inequities in rural health protection ix
Acknowledgements
The data and the methodology used for the assessments presented in this paper
were developed by Andrea Nove and Sophie Witter, Integrare, Barcelona, Spain based on
earlier work of the ILO Social Protection Department on health coverage and access. The
ILO would like to offer thanks to both. Our thanks are extended to those who provided
significant support in the context of the complex data development and assessment: Jim
Campbell, World Health Organization (WHO); Jim Buchan, Queen Margaret University,
Edinburgh, Scotland; Melisa Martinez Alvarez, London School of Hygiene and Tropical
Medicine; Zoë Matthews, University of Southampton, United Kingdom; Allisyn Moran,
USAID; Francisco Pozo Martin, London School of Hygiene and Tropical Medicine;
Sheetal Sharma, Integrare, Barcelona; and Petra ten Hoope-Bender, Integrare, Barcelona.
Further, highly appreciated comments, feedback and validation regarding the data
development and methodological aspects were received through consultations with
numerous national and international organizations, research institutions, NGOs and others.
They included the Organisation for Economic Co-operation and Development (OECD);
World Bank; World Health Organization (WHO); Bocconi University, Milan, Italy;
Dumlupınar University, Turkey; Monash University, Australia; University of Heidelberg,
Germany; the International Social Security Association (ISSA); and Public Service
International (PSI).
In addition, the data development benefited from comments and support of ILO
colleagues Anne Drouin, Hiroshi Yamabana, Christina Behrendt and Andres Acuna-Ulate,
all of the ILO Social Protection Department, as well as colleagues from the ILO
Department of Statistics: Monica Castillo, Devora Levakova, Marie-Claire Sodergren and
Hassan Kashef.
The paper was edited by Xenia Scheil-Adlung, ILO Social Protection Department,
based on significant inputs by Andrea Nove, Integrare. Support was received from
Thorsten Behrendt and Lorraine Wong, both of the ILO Social Protection Department and
Christiane Wiskow, ILO Sectoral Policies Department. Further comments and inputs were
received from numerous colleagues including Valerie Schmitt, Christina Behrendt and
Fabio Duran Valverde, ILO Social Protection Department. The overall preparation of the
work was supervised by the Director of the Social Protection Department, Isabel Ortiz.

x Global evidence on inequities in rural health protection
Global evidence on inequities in rural health protection xi
Abbreviations
AAAQ Availability, accessibility, acceptability and quality (criteria)
ACI RE Areas of Critical Importance on “decent work in the rural economy”
ACI SPF Areas of Critical Importance in “creating and extending social protection
floors”
CBHI Community-based health insurance
CBM Community-based monitoring
FD Financial deficit
GDP Gross domestic product
GHO WHO Global Health Observatory Database
HRH Human resources for health
ILO International Labour Organization/ Office
ISSA International Social Security Association
MDG Millennium Development Goals
MMR Maternal mortality ratio
NGO Non-governmental organization
NRHM National Rural Health Mission (India)
OECD Organisation for Economic Co-operation and Development
OHCHR Office of the Hugh Commissioner for Human Rights
OOP Out-of-pocket payments/expenditure
PPP Purchasing power parity
PSI Public Service International
SAD Staff access deficit
SBA Skilled birth attendance
SPFs Social protection floors
xii Global evidence on inequities in rural health protection
THE Total health expenditure
UHC Universal health coverage
UN United Nations
UNDP United Nations Development Programme
UNFPA United Nations Population Fund
UNPOP United Nations Population Division
WHO World Health Organization
Global evidence on inequities in rural health protection xiii
Key messages
1. While reducing inequalities in health protection is widely recognized in the current discourse of
universal health coverage (UHC) and the post-2015 agenda, differences and impacts
experienced by rural populations as compared to urban populations have not been assessed up
to now, given the absence of disaggregated data.
2. Against this background, the ILO has developed for the first time global evidence that suggests
significant if not extreme differences between rural and urban populations in health coverage
and access at global, regional and national levels:
o While 56 per cent of the global rural population lacks health coverage, only 22 per cent
of the urban population is not covered. Globally most deprived of health coverage is the
rural population in Africa.
o The situation is aggravated by extreme health workforce shortages in rural areas
impacting on the delivery of quality services: in rural areas a global shortfall of about
seven million missing health workers to deliver services is observed, compared to a
lack of three million skilled staff in urban areas. Due to these rural health workforce
shortages, half the global rural population lacks access to urgently needed care.
o Deficits in per capita health spending are twice as large in rural areas as in urban areas.
o The deficits observed result in unnecessary suffering and death, as reflected for
example in rural maternal mortality rates that are 2.5 times higher than urban rates.
Globally, the highest levels in rural maternal mortality are found in Africa.
3. Based on the evidence provided, it can be concluded that the place of residence largely
determines coverage and access to health care. In fact, the rural/urban divide is a consistent
feature across the world, existing in all regions and within all countries. Currently, the place of
residence can be considered as an entry door or a key barrier to accessing health protection. As
a result, the place of residence determines whether people live or die.
4. The results of ILO estimates suggest that the fundamental rights to health and social protection
remain largely unfulfilled for rural populations. The issues behind these developments range
from missing or fragmented legislation to gaps in implementation, resulting for example in
severe deficits in service delivery in rural areas. Thus, rural populations cannot contribute to
urgently needed economic growth, wealth and development.
5. While core issues leading to the observed inequalities can be identified within the health sector,
many of the root causes are found beyond the sector itself. They include poverty, informality,
discrimination and lack of voice and power.
6. Addressing these issues requires systemic changes anchored in rights and social and economic
empowerment: ending the rural/urban divide involves establishing, extending and fully
implementing social protection coverage, as outlined in the ILO Social Protection Floors
Recommendation, 2012 (No. 202) (ILO, 2012a), to rural areas with a view to achieving
universal coverage and addressing the gaps in access to health care.
7. In line with Recommendation No. 202, the current discourse on universal health coverage and
the post-2015 agenda needs to consider state guarantees to ensure that all in need – including
those living in rural areas – have access to health protection and services that meet the criteria
of availability, affordability, accessibility, acceptability and quality (AAAQ):
o Availability of health services requires an adequate number of skilled rural health
workers employed with decent working conditions, particularly adequate wages, and
xiv Global evidence on inequities in rural health protection
sufficiently equipped to provide quality services. The ILO identifies 41.1 health
workers per 10,000 population as a minimum density to provide universal health
coverage.
o Affordability of quality health services and financial protection requires minimizing
out-of-pocket (OOP) payments for health care, through universal health protection
coverage anchored in legislation resulting in access to quality care. Free prenatal and
postnatal medical care for the most vulnerable should also be considered.
o Respecting the dignity of rural populations, non-discrimination and responsiveness to
special needs are key for accessibility and acceptability of services for rural
populations.
o Quality with due regard to social justice and equity should be achieved through a
variety of resources that are financially, fiscally and economically sustainable, taking
into account the contributory capacity of rural populations and creating fiscal space
through various methods including the prevention of fraud, tax evasion and non-
payment of contributions, as well as increased efficiency and effectiveness in the
provision of health care.
8. Key principles to extend equitable health protection and income security to rural populations
include universality, equity and non-discrimination. These principles call for solidarity in
financing and fairness in burden sharing. It is also vital to avoid financial hardship or an
increased risk of poverty for rural populations when accessing needed health care.
9. Further, efforts are needed to balance the maldistribution of funds between rural and urban
areas and construct more adequate rural structures based on a concept of inclusive societies
where everybody is equally covered by health protection and can access quality care when in
need.
10. Successful policies aiming to achieve equity in health protection and reduce the rural/urban
divide require a rapid and sustained extension of social protection including health protection to
rural areas. This involves political commitment and social and national dialogue as well as
technical expertise to
o prioritize equity-based strategies to extend health protection to rural areas and fully
implement related reform policies; and
o coordinate with other policy sectors with a view to improve policy, enhance income
generation, create employment opportunities and promote decent working conditions
for rural populations, including rural health workers, as outlined in Recommendation
No. 202.
11. Efficient and effective multisectoral policies to address the root causes of rural inequities
should consider the specific living and working characteristics of rural populations. If not
addressed, the rural/urban disparities identified in access to health care carry the potential to
considerably hamper overall socio-economic development in many developing countries.
12. The necessary fiscal space to address rural/urban inequities in health coverage and access can
be made available from various sources, including reducing the waste of health-care funds –
e.g. due to inefficient purchase of overpriced drugs – that is estimated at 20−40 per cent of
global health expenditure.
13. Impacts of in investments in more equitable access should be considered in the context of the
better health status of the population, including the workforce, and improved economic
performance, e.g. productivity as well as employment opportunities.
Global evidence on inequities in rural health protection 1
1. The need to share resources equally between rural and urban populations, and the discourse on universal health coverage
Inequitable resource-sharing between rural and urban areas resulting in socio-
economic differences is a persistent global phenomenon that is particularly apparent in
developing countries. In 2011, 3.1 billion people or 55 per cent of the population in these
countries lived in rural areas and many of them experienced poverty and ill-health: 70 per
cent of the developing world’s 1.4 billion extremely poor people are living in rural areas
(IFAD, 2011). Hence, although some 350 million rural people left extreme poverty in the
2000s, poverty remains acute and predominant in rural areas.
The situation is aggravated by the fact that rural populations are frequently confronted
with informality and self-employment and thus cannot generate sufficient income to afford
basic goods and services such as health. Also, public investments are often scarce and rural
areas are characterized by the absence of essential infrastructure, for example for health care
and transport. As a result, large parts of rural populations are left behind and often suffer
from social exclusion.
A key tool to address these inequities is social protection, such as health protection provided
through national health services and national and social health insurance schemes. Against
this background, a global political discourse in recent years has focused on achieving
universal coverage in social protection, including health protection. This has been reflected in
international standards such as the ILO Social Protection Floors Recommendation, 2012 (No.
202), which calls for universal guarantees for at least essential health care and basic income
support for all in need. The notion of universal health coverage has also been developed over
the years in other UN agencies, particularly the World Health Organization (WHO), which
referred to it in, for example, a resolution of the World Health Assembly (WHO, 2011)
encouraging countries to aim for universal health coverage (UHC), and the UN resolution on
universal health coverage (UN Resolution A /67/L.36 of 12 December 2012). Today, the
principle of universal social protection coverage has also gained momentum in the context of
discussions of the post-2015 development agenda.
While the concept of UHC is widely accepted and supported, it lacks clarity and
globally agreed definitions in many of its dimensions. What is coverage? Who is covered?
Which services need to be provided? Which quality levels should be available? These and
many more questions remain largely open in the current discourse. As a result, in some
countries narrowly targeted temporary safety nets occur, providing services at lowest levels
and ignoring the need for equal access, while other countries have achieved comprehensive
coverage for both health and income support in a relatively short time (ILO, 2014a).
The specific replies to the questions above depend principally on country-specific
characteristics and policies. However, there are some fundamental principles that should be
followed and agreed upon. At the core lies – besides the principle of universality that includes
everybody – the principle of equity. A prerequisite of equity is the development and
realization of rights guaranteeing legal entitlements, for example to health care for all in need,
independently of where people live. Such rights have to be implemented with a view to
ensuring human dignity and addressing vulnerability and social exclusion. Thus, States need
to guarantee that quality health services are available and accessible, without financial
hardship, for all in need as outlined in ILO Recommendation No. 202.
2 Global evidence on inequities in rural health protection
An analysis of the status quo and progress towards UHC needs to focus on these
principles and criteria. They imply that financial barriers such as high out-of-pocket
payments (OOP) and the absence of needed services, often due to the lack of a sufficient
number of health workers or underfunding of services in specific areas, are detrimental to
universal coverage as they create inequities in effective access to health care. However, such
analyses are currently not possible due to the scarcity of data, particularly disaggregated data
and specifically disaggregation by rural and urban areas. At present there are no globally
comparable data available that measure countries’ health access deficits in rural areas.
The lack of disaggregated data and analysis has a strong influence on national
resource allocation processes, leading to a neglect of rural populations in the policy processes
of many countries. The absence of data on rural populations at both global and national levels
has contributed to the creation and reinforcement of “urban biases” in many countries.
National data do not reveal the discrimination affecting the rural poor and are thus not
adequate to give policy-makers the necessary guidance on how to tackle rural/urban
inequities and share resources more evenly. Without meaningful data, resources will continue
to be inequitably allocated and rural/urban inequities will persist. Hence, there is a strong
need to increase the availability and quality of disaggregated data to ensure the identification
of the rural poor, to estimate the magnitude of rural/urban inequities, and to eventually make
the need for action visible to policy-makers.
Against this background, this paper takes a fresh look at data development and
applies new methodologies. The assessment presented cannot fill research gaps within
countries, but it seeks to provide a starting point for serious discussion and further research
on the issues that leave people in rural areas behind the rest of the world’s population. It
presents for the first time global estimates on rural/urban disparities in access to health-care
services. The report uses proxy indicators to assess key dimensions of coverage and access
involving the core principles of universality and equity. Based on the results of the estimates,
policy options are discussed to close the gaps in a multi-sectoral approach addressing issues
and their root causes both within and beyond the health sector.
Global evidence on inequities in rural health protection 3
2. Addressing the information gap: A fresh look at data and methodologies
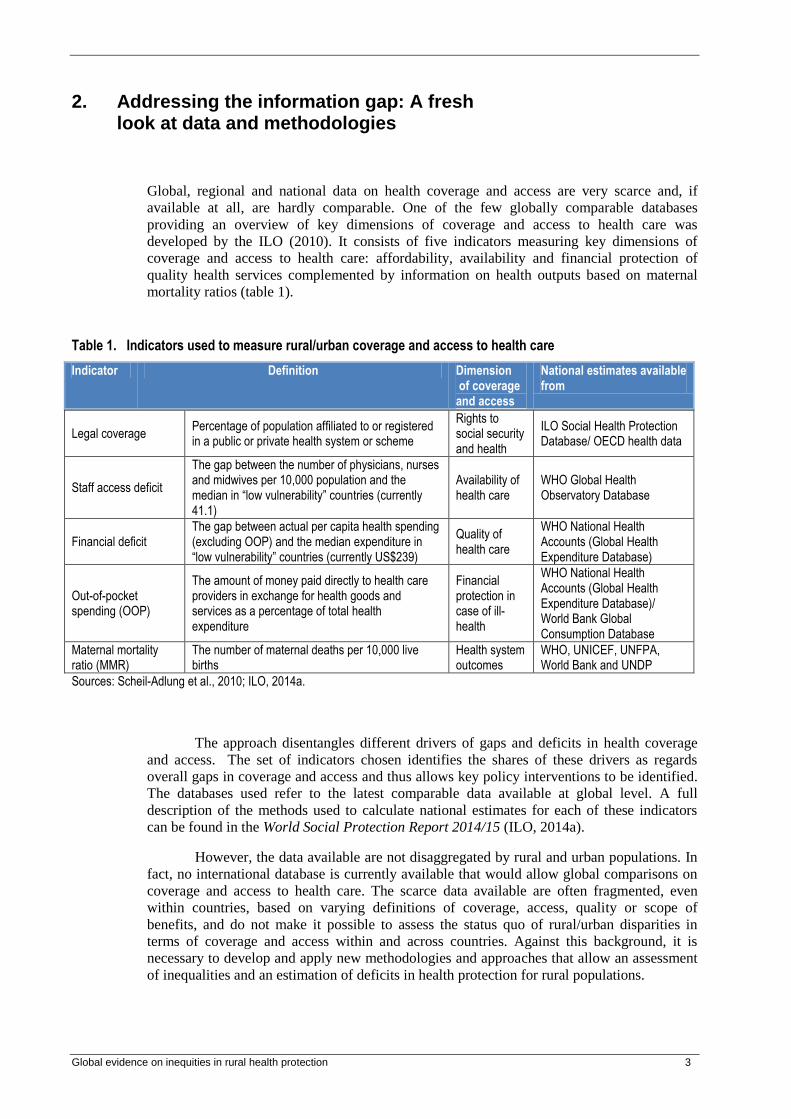
Global, regional and national data on health coverage and access are very scarce and, if
available at all, are hardly comparable. One of the few globally comparable databases
providing an overview of key dimensions of coverage and access to health care was
developed by the ILO (2010). It consists of five indicators measuring key dimensions of
coverage and access to health care: affordability, availability and financial protection of
quality health services complemented by information on health outputs based on maternal
mortality ratios (table 1).
Table 1. Indicators used to measure rural/urban coverage and access to health care
Indicator Definition Dimension of coverage and access
National estimates available from
Legal coverage Percentage of population affiliated to or registered in a public or private health system or scheme
Rights to social security and health
ILO Social Health Protection Database/ OECD health data
Staff access deficit
The gap between the number of physicians, nurses and midwives per 10,000 population and the median in “low vulnerability” countries (currently 41.1)
Availability of health care
WHO Global Health Observatory Database
Financial deficit The gap between actual per capita health spending (excluding OOP) and the median expenditure in “low vulnerability” countries (currently US$239)
Quality of health care
WHO National Health Accounts (Global Health Expenditure Database)
Out-of-pocket spending (OOP)
The amount of money paid directly to health care providers in exchange for health goods and services as a percentage of total health expenditure
Financial protection in case of ill-health
WHO National Health Accounts (Global Health Expenditure Database)/ World Bank Global Consumption Database
Maternal mortality ratio (MMR)
The number of maternal deaths per 10,000 live births
Health system outcomes
WHO, UNICEF, UNFPA, World Bank and UNDP
Sources: Scheil-Adlung et al., 2010; ILO, 2014a.
The approach disentangles different drivers of gaps and deficits in health coverage
and access. The set of indicators chosen identifies the shares of these drivers as regards
overall gaps in coverage and access and thus allows key policy interventions to be identified.
The databases used refer to the latest comparable data available at global level. A full
description of the methods used to calculate national estimates for each of these indicators
can be found in the World Social Protection Report 2014/15 (ILO, 2014a).
However, the data available are not disaggregated by rural and urban populations. In
fact, no international database is currently available that would allow global comparisons on
coverage and access to health care. The scarce data available are often fragmented, even
within countries, based on varying definitions of coverage, access, quality or scope of
benefits, and do not make it possible to assess the status quo of rural/urban disparities in
terms of coverage and access within and across countries. Against this background, it is
necessary to develop and apply new methodologies and approaches that allow an assessment
of inequalities and an estimation of deficits in health protection for rural populations.

4 Global evidence on inequities in rural health protection
This paper proposes an approach following up on the earlier methodologies used to
estimate deficits in universal health coverage (Scheil-Adlung et al., 2010; ILO, 2014a). The
proposed methodology refines the previous approach by applying it to rural and urban areas:
current estimates for deficits in universal health coverage based on the above five indicators
are disaggregated to measure rural/urban differentials in access to health care. The methods
used are deliberately not country-specific to ensure cross-country comparability.
Given the lack of available global databases, nearly all options to disaggregate data
involve the use of proxies. Thus, the disaggregation is based on those proxies that were
judged to be the best balance between the precision of estimates and scarce data availability.
The proxies chosen were tested for loss of precision against direct estimates that were
available for selected countries. Proxies meeting the requirements and considered most
appropriate have been cross-checked with available country data and the results adjusted
where necessary.
The legal coverage of the rural population was estimated by using the percentage of
GDP provided by the agricultural sector. The GDP provided by other sectors made it possible
to estimate the legal coverage of urban populations. In countries where national legal
coverage reached values above 99 per cent or below 1 per cent of the population, rural and
urban disparities were assumed to be the same. Estimating the staff access deficit, the
financial deficit and the maternal mortality ratio (MMR) of the rural population was based on
skilled birth attendance (SBA) given the high correlation observed. In countries where the
national deficit was zero, no rural or urban deficits were assumed. The estimates of OOP of
the rural population were based on World Bank household expenditure data. Since the
database is biased towards low- and middle-income countries, rural and urban discrepancies
in high-income countries were assumed equal. All assessments of estimates are either
population or births (MMR) weighted and refer to data from the UN World Population
Prospects Database (2012), the World Bank (World Development Indicators Database,
Global Consumption Database) and the WHO (Global Health Observatory Data Repository).
Comments on the methodological options were invited from national and
international organizations, research institutions, NGOs and others, including the
Organisation for Economic Co-operation and Development (OECD); International Labour
Organization (ILO); World Bank; World Health Organization (WHO); Bocconi University,
Milan, Italy; Dumlupınar University, Turkey; Monash University, Australia; University of
Southampton, United Kingdom; University of Heidelberg,
Germany; QueenMargaret University, Scotland; Integrare, Spain; the International Social
Security Association (ISSA); and Public Service International (PSI).
Since the data used in this paper derive from the approach described above to
disaggregate rural and urban populations, some limitations should be taken into account.
They concern particularly the following aspects of data interpretation:
The dynamic nature of the process of urbanization means that the estimates
presented here should be interpreted as a snapshot in time.
A country-specific use of definitions for urban and rural populations might impact
on cross-country comparisons. The reduction of urban/rural to a binary variable
can also be problematic for some countries, because it tends to be more of a
continuum than a binary variable.
Our reliance on proxy indicators has undoubtedly resulted in loss of precision, but
it is not possible to estimate the likely extent of this. In some cases, too, lack of
data or reliability of data was a problem for the selected proxy indicators.
Global evidence on inequities in rural health protection 5
Given the assumptions made for regions with low or little difference in rural and
urban areas – particularly in North America and Western Europe – disparities may
exist even though the results of this study do not reflect them.
The use of the equal rural and urban thresholds to estimate the financial deficit
and staff access deficit may result in an underestimation of the rural deficits, as
the rural populations might need more health workers per capita, either because
certain health conditions are more prevalent in rural areas or because lower
population density means that rural health workers cannot see as many service
users in a working day, especially if part of the health worker’s role is to work in
the community.
The best way to overcome the limitations described is to collect more and better data,
including sub-national disaggregation. However, there are considerable resource implications
to this and it is unlikely to happen in the foreseeable future. In the meantime, it would be
useful to study in more depth the relationships between the selected proxy variables and the
coverage access indicators, which would permit more nuanced and evidence-informed
adjustments to be made.

6 Global evidence on inequities in rural health protection
3. The evidence: Inequities in access to health care in rural and urban areas
We assume that inequities in access to health care between rural and urban areas are likely to
occur as regards the various dimensions of the criteria of accessibility, availability,
affordability and quality of services (AAAQ). Thus, using the set of indicators outlined
above, we estimate related disparities in terms of AAAQ as regards the existence of rights-
based coverage, health worker shortages, financing gaps, the impoverishing potential due to
OOP and the extent of maternal mortality in both areas.
3.1. The lack of rights at rural level
Legal coverage provides information on the proportion of the global population that is not
protected by legislation or affiliated to a national health service or health scheme and which
therefore does not have the right to access health care when in need. In the absence of such
rights, no entitlements to health care exist. As a result, people seeking health care are
deprived of equal opportunity to receive the highest attainable level of care, including
prevention. Besides quantity, quality of care may be hampered; nor is timely access to care
ensured. Further, discrimination on account of gender, age, minority or other aspects still
exists.
The global deficit in rural coverage is 2.5 times higher than that in urban areas. The
absence of legal health coverage worldwide is high: 38 per cent of the global population are
without rights-based health coverage (figure 1). The highest deficits occur globally in rural
areas, where 56 per cent of the population are without legal health coverage. Figure 1 shows
that the deficit in rural areas is 2.5 times higher than in urban areas, where the deficit amounts
to 22 per cent.
Figure 1. Proportion of the global population not protected by legislation or affiliated to a health insurance scheme, 2015 (percentages)
Source: ILO estimates, 2015.
0 10 20 30 40 50 60
World
Rural
Urban
World Rural Urban
Global evidence on inequities in rural health protection 7
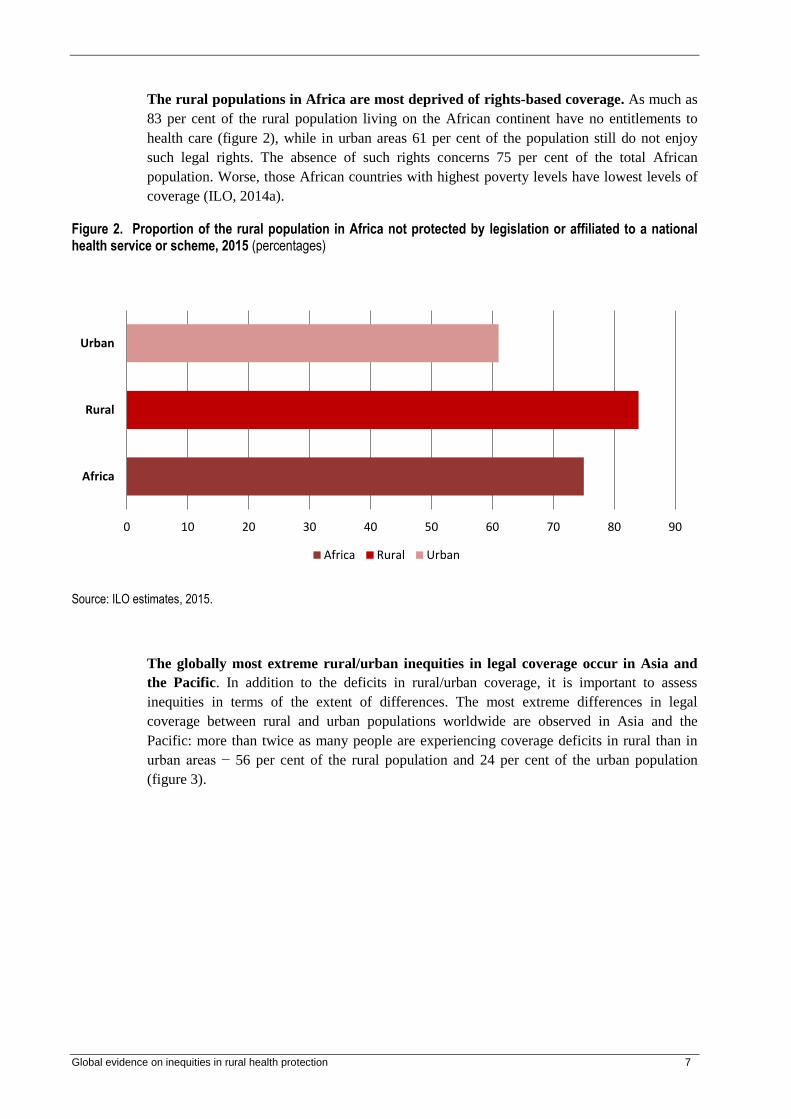
The rural populations in Africa are most deprived of rights-based coverage. As much as
83 per cent of the rural population living on the African continent have no entitlements to
health care (figure 2), while in urban areas 61 per cent of the population still do not enjoy
such legal rights. The absence of such rights concerns 75 per cent of the total African
population. Worse, those African countries with highest poverty levels have lowest levels of
coverage (ILO, 2014a).
Figure 2. Proportion of the rural population in Africa not protected by legislation or affiliated to a national health service or scheme, 2015 (percentages)
Source: ILO estimates, 2015.
The globally most extreme rural/urban inequities in legal coverage occur in Asia and
the Pacific. In addition to the deficits in rural/urban coverage, it is important to assess
inequities in terms of the extent of differences. The most extreme differences in legal
coverage between rural and urban populations worldwide are observed in Asia and the
Pacific: more than twice as many people are experiencing coverage deficits in rural than in
urban areas − 56 per cent of the rural population and 24 per cent of the urban population
(figure 3).
0 10 20 30 40 50 60 70 80 90
Africa
Rural
Urban
Africa Rural Urban

8 Global evidence on inequities in rural health protection
Figure 3. Rural/urban coverage deficits in Asia and the Pacific: Proportion of the population not protected by legislation or affiliated to a national health service or scheme, 2015 (percentages)
Source: ILO estimates, 2015.
In 37 countries of the world inequities in legal health coverage of the rural population
are extreme; coverage of these rural populations is more than 50 per cent less than that of the
urban populations. For example, in Bosnia-Herzegovina only 9 per cent of the urban
population lack coverage as compared to 67.5 per cent of the rural population.
More than half of these countries are in Africa, 24 per cent in Latin America and the
Caribbean, 19 per cent in Asia and Pacific, and the rest in Europe and Middle East. The
majority of these countries (51 per cent) are characterized by low to middle income, but
countries at all income levels are concerned (figure 4). These results point to the fact that the
extreme inequities in rural/urban coverage cannot be explained just by constraints on
resources.
Figure 4. Distribution of countries where the rural coverage gap exceeds the urban by over 50 per cent, by region and income level, 2015 (37 countries; percentages)
Source: ILO estimates, 2015.
010
2030
4050
60
56
24
42
Total
Urban
Rural
24%
51%
22%
3%
Low income
Low-middleincome
Upper middleincome
High income
51%
19%
3%
24%
3%
Africa
Asia and Pacific
Europe
Latin America
Middle East

Global evidence on inequities in rural health protection 9
Against this background, it is of utmost importance that governments increase their
efforts to extend and implement legislation covering the entire population, particularly
including those living in rural areas. Even in countries with resource constraints, equitable
access should be guaranteed, as requested by ILO Recommendation No. 202 (ILO, 2012a).
3.2. The impact of shortages of rural health workers and of their working conditions
Health workers are a prerequisite for access to health care. Without skilled health workers, no
quality health services can be delivered to those in need. Gaps in the health workforce can
occur if there are insufficient numbers of health workers available in rural and/or urban areas,
or if the skill mix of physicians, nurses and midwives does not match the needs in a specific
area. Such deficits and imbalances in the availability of professional health workers
necessarily result in no or inequitable access to quality health care.
The quality of care provided by skilled health workers is significantly affected by
their working conditions. In addition to the lack of such workers, low wages and unsafe
workplaces are among the core reasons for health worker shortages, as experienced most
recently in Ebola-affected countries (ILO, 2014b). In consequence, the impacts on health can
be very severe and even lead to unnecessary deaths.
Health worker shortages are more than twice as high in rural areas than in urban areas.
ILO estimates show that only 23 per cent health workers in the world today are deployed in
rural areas, while 50 per cent of the world’s population are living in these areas and need to
be served. Thus, rural areas experience extreme extents of unmet needs for physicians, nurses
and midwives.
Given the requirement to achieve UHC and provide health care equally to all in need,
the ILO estimates that globally 10.3 million skilled health workers are missing in the effort to
achieve UHC (ILO, 2014c). This is based on a relative threshold of 41.1 health workers per
10,000 population. Nearly 70 per cent of health workers (seven million), are missing in rural
areas (figure 5) compared to some three million in urban areas.
Figure 5. Global estimates of skilled health worker deficits in rural and urban areas, 2015 (millions)
Source: ILO estimates, 2015.
Rural deficit: About 7 million
Urban deficit:
More than 3 million
Global health worker
deficit:
10.3 million
10 Global evidence on inequities in rural health protection
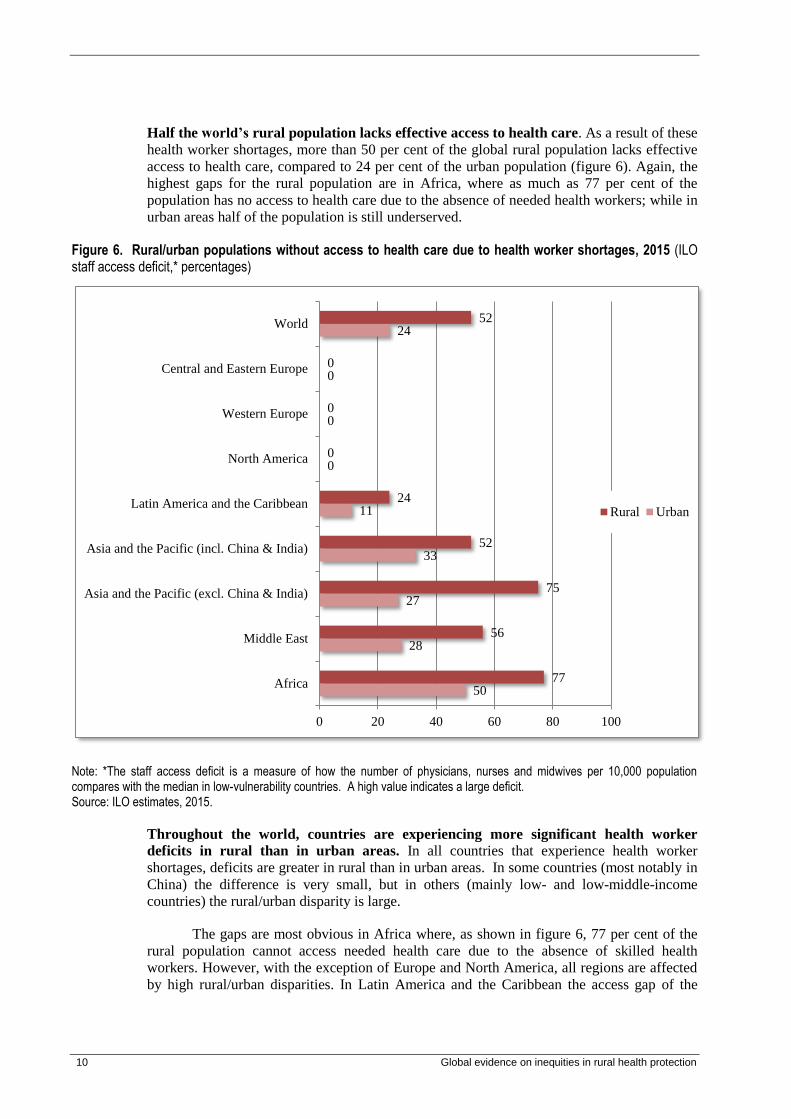
Half the world’s rural population lacks effective access to health care. As a result of these
health worker shortages, more than 50 per cent of the global rural population lacks effective
access to health care, compared to 24 per cent of the urban population (figure 6). Again, the
highest gaps for the rural population are in Africa, where as much as 77 per cent of the
population has no access to health care due to the absence of needed health workers; while in
urban areas half of the population is still underserved.
Figure 6. Rural/urban populations without access to health care due to health worker shortages, 2015 (ILO staff access deficit,* percentages)
Note: *The staff access deficit is a measure of how the number of physicians, nurses and midwives per 10,000 population compares with the median in low-vulnerability countries. A high value indicates a large deficit. Source: ILO estimates, 2015.
Throughout the world, countries are experiencing more significant health worker
deficits in rural than in urban areas. In all countries that experience health worker
shortages, deficits are greater in rural than in urban areas. In some countries (most notably in
China) the difference is very small, but in others (mainly low- and low-middle-income
countries) the rural/urban disparity is large.
The gaps are most obvious in Africa where, as shown in figure 6, 77 per cent of the
rural population cannot access needed health care due to the absence of skilled health
workers. However, with the exception of Europe and North America, all regions are affected
by high rural/urban disparities. In Latin America and the Caribbean the access gap of the
50
28
27
33
11
0
0
0
24
77
56
75
52
24
0
0
0
52
0 20 40 60 80 100
Africa
Middle East
Asia and the Pacific (excl. China & India)
Asia and the Pacific (incl. China & India)
Latin America and the Caribbean
North America
Western Europe
Central and Eastern Europe
World
Rural Urban

Global evidence on inequities in rural health protection 11
rural population is over twice that of the urban population: 24 per cent (rural) compared to 11
per cent (urban) are excluded from access to health care due to health worker shortages.
3.3. The extent of inequitable funding for health protection in rural and urban areas
Deficits in health-care funding determine nearly all dimensions of access to health
care, for instance waiting periods, quality of care, acceptance or rejection of patients,
availability of infrastructure and health workers and much more. While such deficits exist
widely, they are particularly observed in rural areas.
Lack of financial resources leaves 63 per cent of the world’s rural population
without access to health care. Underfunding of global health financing results in an access
deficit of 48 per cent of global population − nearly half the people in the world. This deficit
is unequally distributed across rural and urban populations: while in urban areas it concerns
33 per cent of the population, it is nearly twice this amount in rural areas: 63 per cent (figure
7).
Figure 7. Rural and urban population without access to health care due to a lack of financial resources, 2015 (percentage of total world population)
Source: ILO estimates, 2015.
The rural population in Africa suffers most from the financial deficit. While the
percentage of the population not covered due to the financial resource gap is higher in rural
than in urban areas (except in Europe and North America), the highest gaps are in Africa,
where 87 per cent of the rural population are excluded from access to health care due to
0
10
20
30
40
50
60
70
Global deficit inpopulation coverage
Rural deficit inpopulation coverage
Urban deficit inpopulation coverage
48
63
33
12 Global evidence on inequities in rural health protection
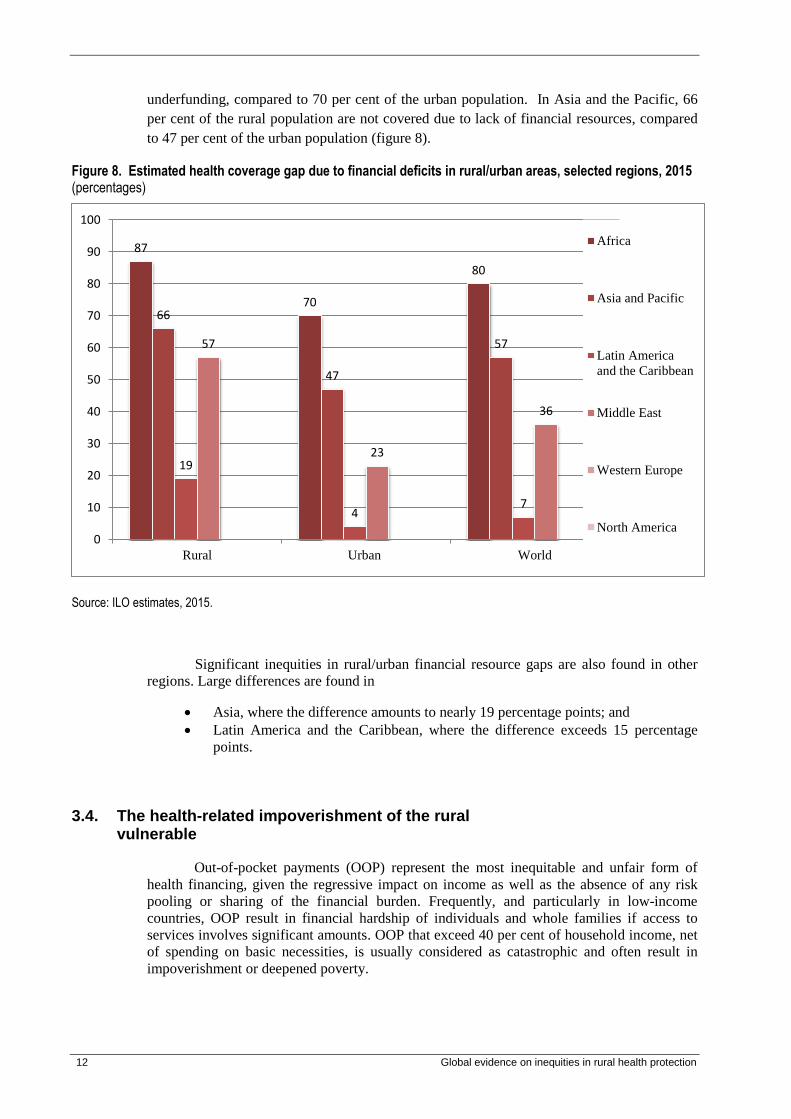
underfunding, compared to 70 per cent of the urban population. In Asia and the Pacific, 66
per cent of the rural population are not covered due to lack of financial resources, compared
to 47 per cent of the urban population (figure 8).
Figure 8. Estimated health coverage gap due to financial deficits in rural/urban areas, selected regions, 2015 (percentages)
Source: ILO estimates, 2015.
Significant inequities in rural/urban financial resource gaps are also found in other
regions. Large differences are found in
Asia, where the difference amounts to nearly 19 percentage points; and
Latin America and the Caribbean, where the difference exceeds 15 percentage
points.
3.4. The health-related impoverishment of the rural vulnerable
Out-of-pocket payments (OOP) represent the most inequitable and unfair form of
health financing, given the regressive impact on income as well as the absence of any risk
pooling or sharing of the financial burden. Frequently, and particularly in low-income
countries, OOP result in financial hardship of individuals and whole families if access to
services involves significant amounts. OOP that exceed 40 per cent of household income, net
of spending on basic necessities, is usually considered as catastrophic and often result in
impoverishment or deepened poverty.
87
70
80
66
47
57
19
4 7
57
23
36
0
10
20
30
40
50
60
70
80
90
100
Rural Urban World
Africa
Asia and Pacific
Latin America
and the Caribbean
Middle East
Western Europe
North America
Global evidence on inequities in rural health protection 13
The regional and national patterns of OOP reflect the impact and results of various
dimensions of health coverage and access to health care as regards rights, financing and
availability. Thus, when interpreting the extent of OOP in rural and urban areas it is
important to consider that OOP result from gaps in legal coverage, comprehensiveness of
benefits, and availability and affordability of care, as well as the financial resource deficits.
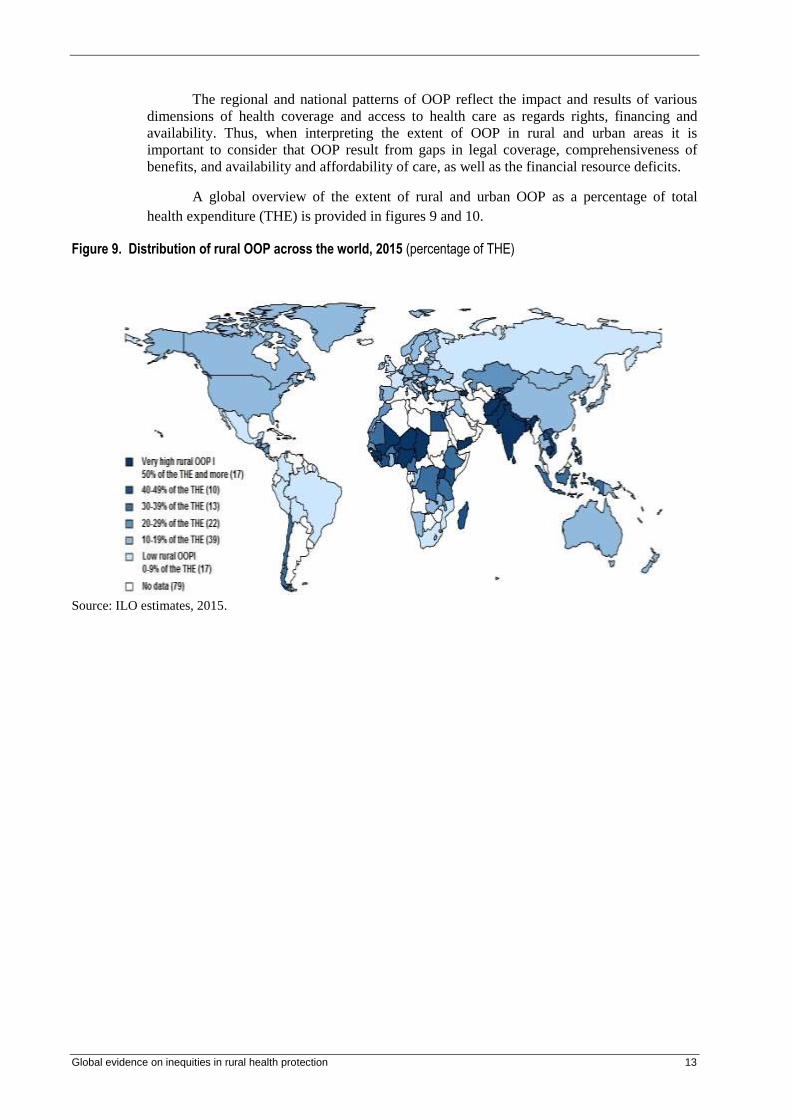
A global overview of the extent of rural and urban OOP as a percentage of total
health expenditure (THE) is provided in figures 9 and 10.
Figure 9. Distribution of rural OOP across the world, 2015 (percentage of THE)
Source: ILO estimates, 2015.

14 Global evidence on inequities in rural health protection
Figure 10. Distribution of urban OOP across the world, 2015 (percentage of THE)
Source: ILO estimates, 2015.
OOP are globally marginally higher for rural than for urban populations, but the
opposite is true at regional level. Global rural/urban inequities in OOP exist to some extent:
global rural OOP are higher than global urban OOP, at nearly 42 per cent of THE compared
to 40.6 per cent respectively (figure 11). However, the situation at regional level is much
more differentiated; it indicates lower OOP for rural populations than for urban populations
(figure 12). In most regions there are significant differences in the amounts of rural and urban
OOP:
In Africa, Latin America and the Caribbean as well as Central and Eastern
Europe, rural OOP are lower than urban OOP.
The highest regional OOP for rural populations are found in Asia and the Pacific,
at nearly 46 per cent of THE– an amount that is only marginally lower than that
for the urban population. Rural populations in Africa are burdened by more than
42 per cent of total health expenditure.
The most extreme inequities are found in Latin America and the Caribbean as well
as Central and Eastern Europe, where rural OOP are less than 10 and 15.5 per cent
respectively of THE, but urban OOP reach about 40 per cent.

Global evidence on inequities in rural health protection 15
Figure 11. Global rural and urban OOP, 2015 (percentage of THE)
Source: ILO estimates, 2015.
Figure 12. Distribution of rural and urban OOP, selected regions,* 2015 (percentage of THE)
Note: * Due to insufficient data the Middle East is excluded from this figure.
Source: ILO estimates, 2015.
Lower amounts of rural than urban OOP reflect the exclusion of rural
populations from access to health care. The lower rural OOP reflect the significant gaps in
coverage of the rural population that exceed the deficits in urban coverage in some regions by
more than 50 per cent. This is the case in Central and Eastern Europe as well as in Asia and
41.9
40.6
41.2
39.5 40 40.5 41 41.5 42
Rural
Urban
Total
42.2
9.5
15.5
45.9
15.4 12
53
39.6 40.6
46.9
13.1 12
0
10
20
30
40
50
60
Africa Latin America
& the
Caribbean
Central and
Eastern
Europe
Asia and
Pacific
Western
Europe
North America
Rural OOP
Urban OOP
16 Global evidence on inequities in rural health protection
the Pacific. In addition, in these regions the financial coverage gaps as well as the health
workforce shortages are predominantly found in rural areas. As a result, the rural population
hardly has an opportunity to spend OOP even if in need. Thus, it can be concluded that the
lower rural OOP mirror the exclusion of the rural population from needed care.
Further analyses of OOP in specific countries confirm the regional findings:
countries such as Colombia, Côte d’Ivoire and Ukraine are characterized by:
infrastructure that exists mainly in urban areas and is hardly reachable by the rural
population. This results in higher utilization rates by the urban population involving higher
levels of OOP. In some countries, health-care services may be totally unavailable in rural
areas. Thus, no access to health care is possible and low or no OOP occur;
higher financial resource gaps in rural than in urban areas; and
higher rural than urban health workforce shortages (Colombia, Côte d’Ivoire).
Finally, for the very poor OOP may even be zero, as private expenditure may not be
an option at all. Thus, this group of people is not reflected in the OOP statistics despite
experiencing the most significant inequity.
Where rural OOP are higher than urban OOP, gaps often occur but health care
is at least accessible even if at a higher price for the rural than for the urban population.
This is the case in Western Europe and in some countries of the Middle East such as Iraq (see
the statistical annex). In these countries, quality care and infrastructure can be accessed, but
at a higher price than that of the urban population. The additional costs may involve
transportation costs or seeking care at more expensive providers that offer services closer to
home.
Given the extent of OOP observed in rural areas and the extreme inequalities within
regions and countries, it can be assumed that the rural population is at a much higher risk of
health-related impoverishment than the urban population. Even if OOP are lower in rural
areas, the impact of ill-health on wealth and income generation of the sick person’s family
will play an important role.
3.5. Life-threatening inequities: The extent of rural maternal mortality
Maternal mortality serves as an overall indicator of the performance of a health
system, and particularly the affordability and availability of quality services provided by
health workers, including midwives.
Globally, the maternal mortality ratio (MMR) is 2.5 times higher in rural than
in urban areas. Across the world as a whole, an estimated 22 maternal deaths per 10,000
live births were observed in 2012. But the maternal mortality ratio (MMR) is much higher
among the rural population: 29 maternal deaths per 10,000 live births in rural areas as
compared to 11 in urban areas. In addition, in all regions except Europe and North America,
the rural MMR is at least double the urban MMR (figure 13).
Global evidence on inequities in rural health protection 17
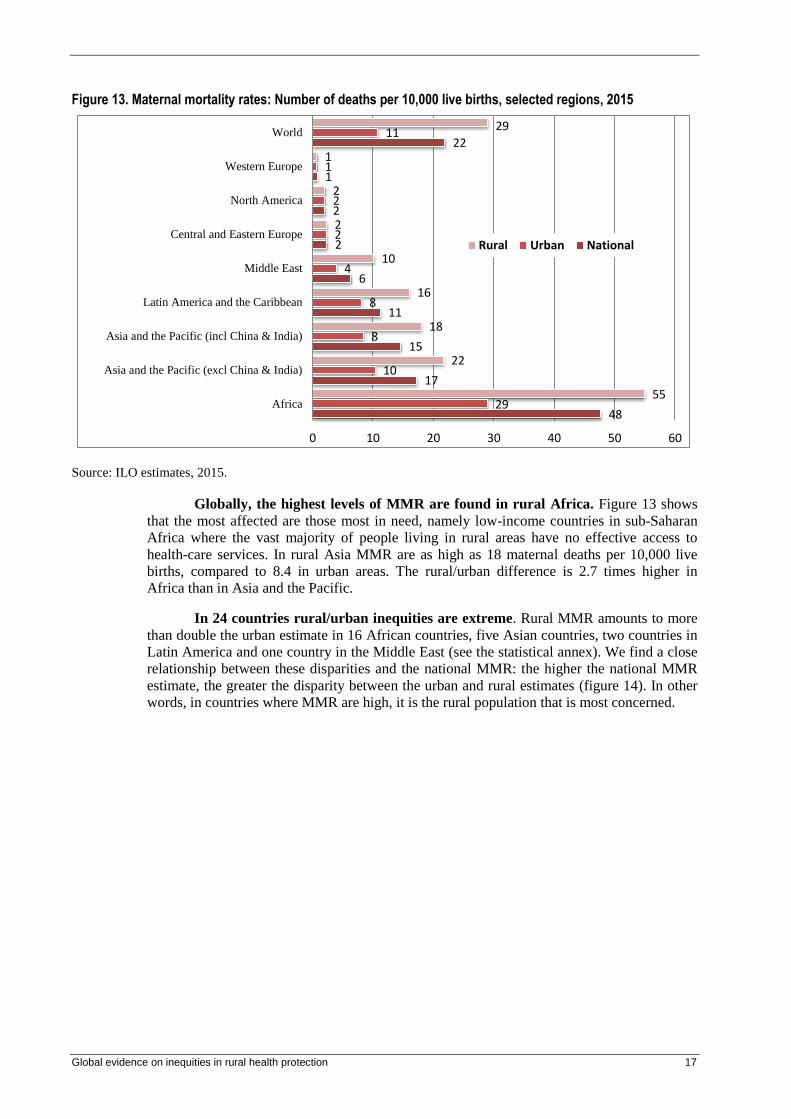
Figure 13. Maternal mortality rates: Number of deaths per 10,000 live births, selected regions, 2015
Source: ILO estimates, 2015.
Globally, the highest levels of MMR are found in rural Africa. Figure 13 shows
that the most affected are those most in need, namely low-income countries in sub-Saharan
Africa where the vast majority of people living in rural areas have no effective access to
health-care services. In rural Asia MMR are as high as 18 maternal deaths per 10,000 live
births, compared to 8.4 in urban areas. The rural/urban difference is 2.7 times higher in
Africa than in Asia and the Pacific.
In 24 countries rural/urban inequities are extreme. Rural MMR amounts to more
than double the urban estimate in 16 African countries, five Asian countries, two countries in
Latin America and one country in the Middle East (see the statistical annex). We find a close
relationship between these disparities and the national MMR: the higher the national MMR
estimate, the greater the disparity between the urban and rural estimates (figure 14). In other
words, in countries where MMR are high, it is the rural population that is most concerned.
48
17
15
11
6
2
2
1
22
29
10
8
8
4
2
2
1
11
55
22
18
16
10
2
2
1
29
0 10 20 30 40 50 60
Africa
Asia and the Pacific (excl China & India)
Asia and the Pacific (incl China & India)
Latin America and the Caribbean
Middle East
Central and Eastern Europe
North America
Western Europe
World
Rural Urban National

18 Global evidence on inequities in rural health protection
Figure 14. Urban/rural estimates of maternal mortality rates, 2015 (by national MMR quintile)
Source: ILO estimates, 2015.
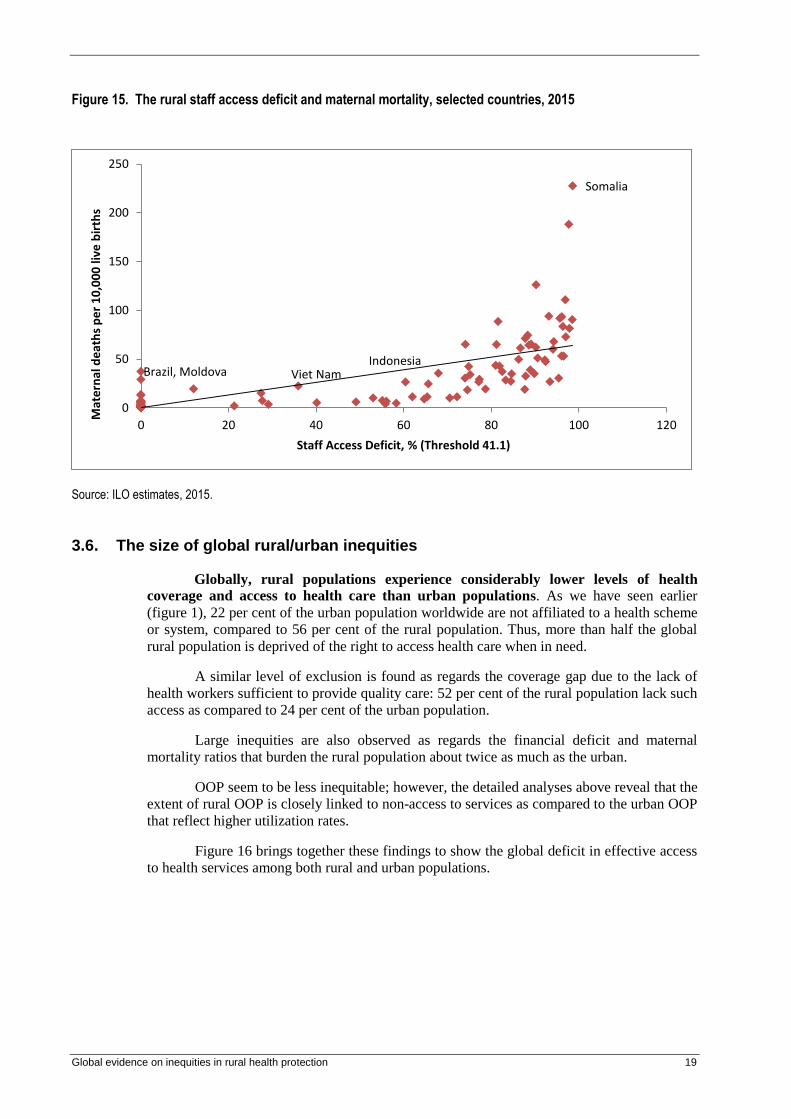
The maternal mortality rate increases with the extent of the health worker
deficit. The extent of MMR in rural areas is strongly related to the staff access deficit, as
shown in figure 15: with decreasing levels of health workers, particularly midwives, the
MMR increases significantly.
1 2 6
15
32
1 3 7
23
64
0
10
20
30
40
50
60
70
1 (lowest MMR) 2 3 4 5 (highest MMR)
Ma
tern
al
mo
rta
lity
ra
tio
(u
nw
eig
hte
d m
ean
for
the
cou
ntr
ies
in t
ha
t q
uin
tile
)
National MMR quintile
Urban Rural
Global evidence on inequities in rural health protection 19
Figure 15. The rural staff access deficit and maternal mortality, selected countries, 2015
Source: ILO estimates, 2015.
3.6. The size of global rural/urban inequities
Globally, rural populations experience considerably lower levels of health
coverage and access to health care than urban populations. As we have seen earlier
(figure 1), 22 per cent of the urban population worldwide are not affiliated to a health scheme
or system, compared to 56 per cent of the rural population. Thus, more than half the global
rural population is deprived of the right to access health care when in need.
A similar level of exclusion is found as regards the coverage gap due to the lack of
health workers sufficient to provide quality care: 52 per cent of the rural population lack such
access as compared to 24 per cent of the urban population.
Large inequities are also observed as regards the financial deficit and maternal
mortality ratios that burden the rural population about twice as much as the urban.
OOP seem to be less inequitable; however, the detailed analyses above reveal that the
extent of rural OOP is closely linked to non-access to services as compared to the urban OOP
that reflect higher utilization rates.
Figure 16 brings together these findings to show the global deficit in effective access
to health services among both rural and urban populations.
Brazil, Moldova
Somalia
Indonesia Viet Nam
0
50
100
150
200
250
0 20 40 60 80 100 120
Mat
ern
al d
eat
hs
pe
r 1
0,0
00
live
bir
ths
Staff Access Deficit, % (Threshold 41.1)

20 Global evidence on inequities in rural health protection
Figure 16. The global deficit in effective access to health services, urban and rural populations, 2015 (percentages)
Notes: OOP = out-of-pocket expenditure, MMR = maternal mortality ratio. Regional averages weighted by urban
and rural population, except for MMR which is weighted by urban and rural skilled birth attendants.
Source: ILO estimates, 2015.
When breaking down these results by region (figure 17) we find similar features, except
for regions with a significant number of high-income countries:
Virtually all the legal, staff access and financial deficits occur among rural populations.
The inequities in OOP are relatively smaller, except for Latin America and the Caribbean.
Maternal mortality ratios are regionally most important in Africa, but are also significant in
other regions.
22
24
33 41
11
56
52
63
42
29
0
20
40
60
80
Estimate of legal coverage
deficit as a % of total
population
Coverage gap due to health
professional staff deficit
(threshold: 41.1)
Financial deficit (threshold:
US$239)
OOP expenditure as % of
total health expenditure
Maternal mortality ratio per
10,000 live births
Urban Rural

Global evidence on inequities in rural health protection 21
Figure 17. Regional deficits in effective access to health services, urban and rural populations, 2015 (percentages)
Notes: OOP = out-of-pocket expenditure, MMR = maternal mortality ratio. Regional averages weighted by urban
and rural population, except for MMR which is weighted by urban and rural skilled birth attendants.
Against this background, it can be concluded that:
No single action focusing on only one of the areas highlighted by the indicators can solve the
issues observed: it is necessary to apply a comprehensive and systematic approach that
addresses issues within the health systems simultaneously − mainly the lack of rights, health
workers, funding, financial protection and quality. Thus, extending health protection and
related equitable access to all is key.
Further, the close relationship between gaps in access to health care and the socio-economic
characteristics of the rural population need to be considered when searching for sustainable
solutions to address the health protection deficits and gaps experienced by rural populations,
in order to minimize the impacts of inequities deriving from issues beyond the health sector.
020406080
100
Legalcoverage
deficit
Staff accessdeficit
Financialdeficit
OOP as % oftotal healthexpenditure
MMR per10,000 births
Africa (44 countries)
020406080
100
Legalcoverage
deficit
Staff accessdeficit
Financialdeficit
OOP as % oftotal healthexpenditure
MMR per10,000 births
Latin America & Caribbean (30 countries)
020406080
100
Legalcoverage
deficit
Staff accessdeficit
Financialdeficit
OOP as % oftotal healthexpenditure
MMR per10,000 births
Asia & the Pacific (30 countries)
020406080
100
Legalcoverage
deficit
Staff accessdeficit
Financialdeficit
OOP as % oftotal healthexpenditure
MMR per10,000 births
Middle East (12 countries)
Urban Rural
22 Global evidence on inequities in rural health protection
3.7. Inequities in rural and urban areas at national level: Selected country studies
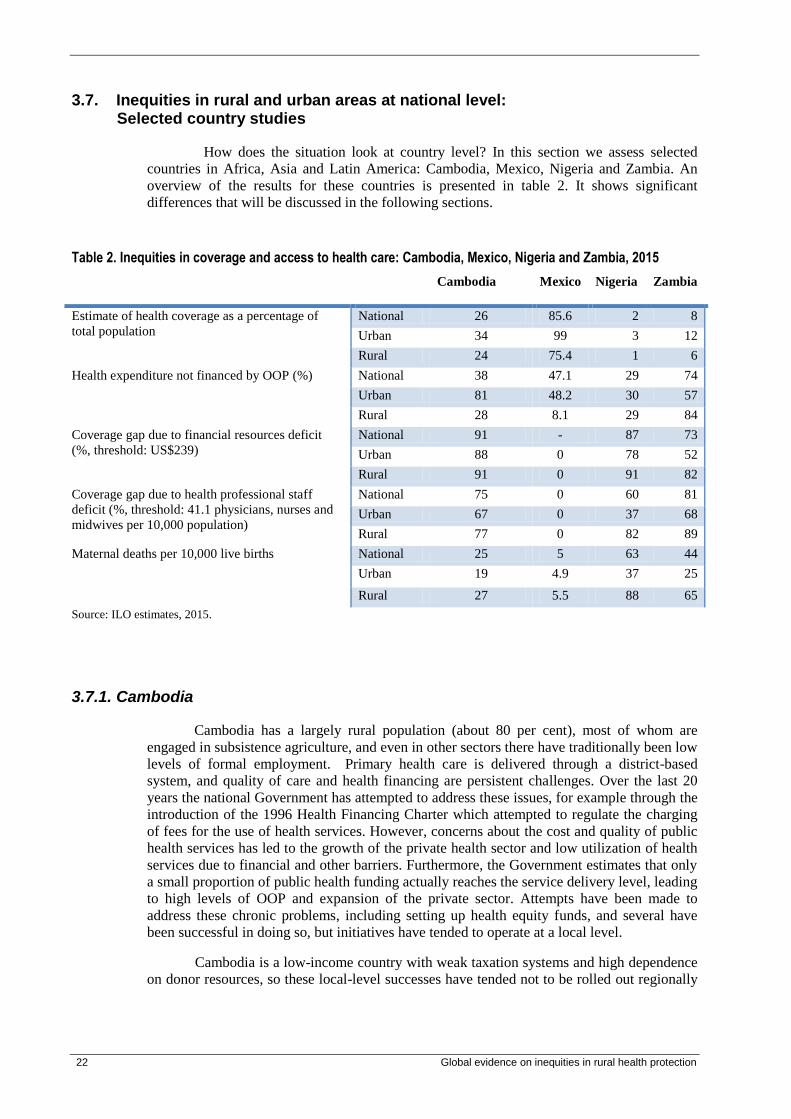
How does the situation look at country level? In this section we assess selected
countries in Africa, Asia and Latin America: Cambodia, Mexico, Nigeria and Zambia. An
overview of the results for these countries is presented in table 2. It shows significant
differences that will be discussed in the following sections.
Table 2. Inequities in coverage and access to health care: Cambodia, Mexico, Nigeria and Zambia, 2015
Cambodia Mexico Nigeria Zambia
Estimate of health coverage as a percentage of
total population
National 26 85.6 2 8
Urban 34 99 3 12
Rural 24 75.4 1 6
Health expenditure not financed by OOP (%) National 38 47.1 29 74
Urban 81 48.2 30 57
Rural 28 8.1 29 84
Coverage gap due to financial resources deficit
(%, threshold: US$239)
National 91 - 87 73
Urban 88 0 78 52
Rural 91 0 91 82
Coverage gap due to health professional staff
deficit (%, threshold: 41.1 physicians, nurses and
midwives per 10,000 population)
National 75 0 60 81
Urban 67 0 37 68
Rural 77 0 82 89
Maternal deaths per 10,000 live births National 25 5 63 44
Urban 19 4.9 37 25
Rural 27 5.5 88 65
Source: ILO estimates, 2015.
3.7.1. Cambodia
Cambodia has a largely rural population (about 80 per cent), most of whom are
engaged in subsistence agriculture, and even in other sectors there have traditionally been low
levels of formal employment. Primary health care is delivered through a district-based
system, and quality of care and health financing are persistent challenges. Over the last 20
years the national Government has attempted to address these issues, for example through the
introduction of the 1996 Health Financing Charter which attempted to regulate the charging
of fees for the use of health services. However, concerns about the cost and quality of public
health services has led to the growth of the private health sector and low utilization of health
services due to financial and other barriers. Furthermore, the Government estimates that only
a small proportion of public health funding actually reaches the service delivery level, leading
to high levels of OOP and expansion of the private sector. Attempts have been made to
address these chronic problems, including setting up health equity funds, and several have
been successful in doing so, but initiatives have tended to operate at a local level.
Cambodia is a low-income country with weak taxation systems and high dependence
on donor resources, so these local-level successes have tended not to be rolled out regionally
Global evidence on inequities in rural health protection 23
or nationally and their impact on national-level indicators has been very limited (Ministry of
Health for Cambodia et al., 2008).
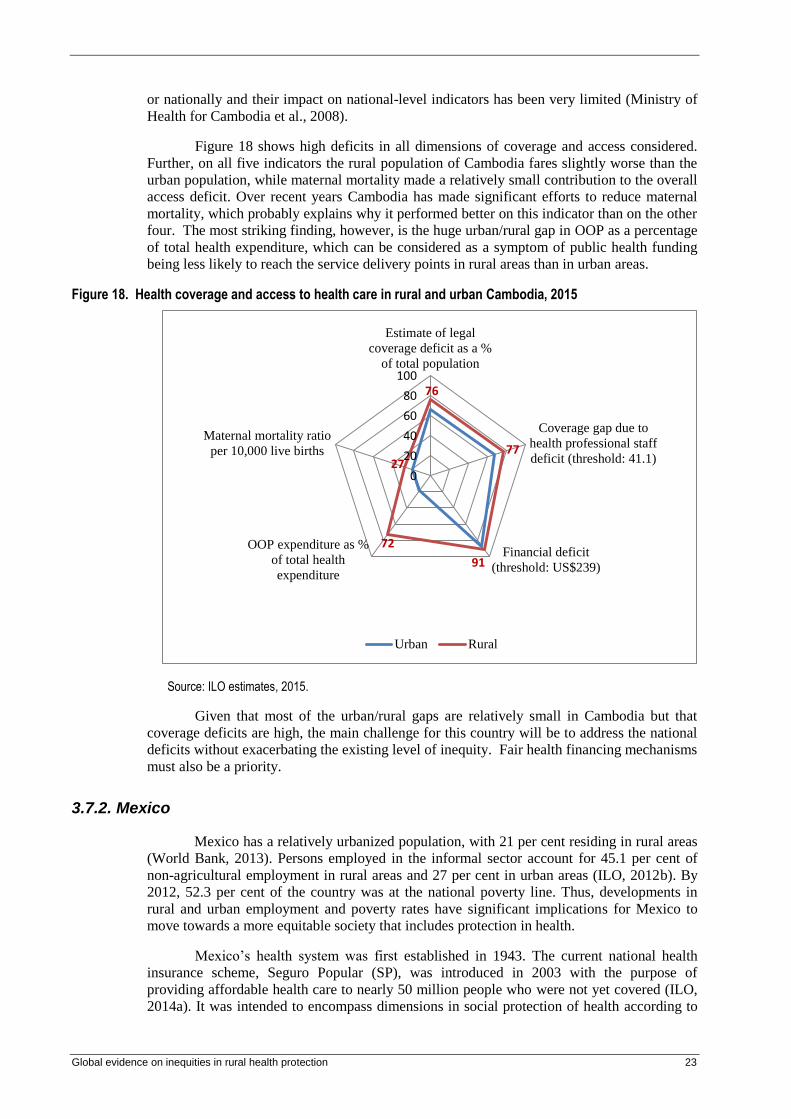
Figure 18 shows high deficits in all dimensions of coverage and access considered.
Further, on all five indicators the rural population of Cambodia fares slightly worse than the
urban population, while maternal mortality made a relatively small contribution to the overall
access deficit. Over recent years Cambodia has made significant efforts to reduce maternal
mortality, which probably explains why it performed better on this indicator than on the other
four. The most striking finding, however, is the huge urban/rural gap in OOP as a percentage
of total health expenditure, which can be considered as a symptom of public health funding
being less likely to reach the service delivery points in rural areas than in urban areas.
Figure 18. Health coverage and access to health care in rural and urban Cambodia, 2015
Source: ILO estimates, 2015.
Given that most of the urban/rural gaps are relatively small in Cambodia but that
coverage deficits are high, the main challenge for this country will be to address the national
deficits without exacerbating the existing level of inequity. Fair health financing mechanisms
must also be a priority.
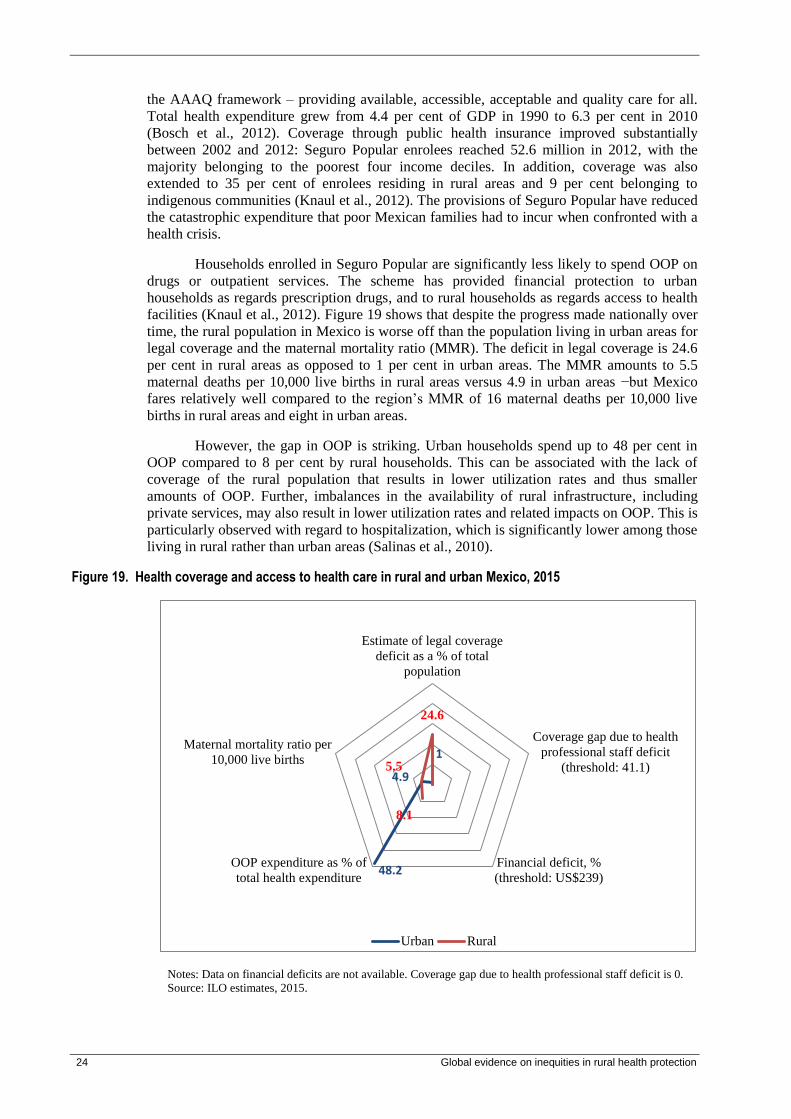
3.7.2. Mexico
Mexico has a relatively urbanized population, with 21 per cent residing in rural areas
(World Bank, 2013). Persons employed in the informal sector account for 45.1 per cent of
non-agricultural employment in rural areas and 27 per cent in urban areas (ILO, 2012b). By
2012, 52.3 per cent of the country was at the national poverty line. Thus, developments in
rural and urban employment and poverty rates have significant implications for Mexico to
move towards a more equitable society that includes protection in health.
Mexico’s health system was first established in 1943. The current national health
insurance scheme, Seguro Popular (SP), was introduced in 2003 with the purpose of
providing affordable health care to nearly 50 million people who were not yet covered (ILO,
2014a). It was intended to encompass dimensions in social protection of health according to
76
77
91
72
27 0
20
40
60
80
100
Estimate of legal
coverage deficit as a %
of total population
Coverage gap due to
health professional staff
deficit (threshold: 41.1)
Financial deficit
(threshold: US$239)
OOP expenditure as %
of total health
expenditure
Maternal mortality ratio
per 10,000 live births
Urban Rural
24 Global evidence on inequities in rural health protection
the AAAQ framework – providing available, accessible, acceptable and quality care for all.
Total health expenditure grew from 4.4 per cent of GDP in 1990 to 6.3 per cent in 2010
(Bosch et al., 2012). Coverage through public health insurance improved substantially
between 2002 and 2012: Seguro Popular enrolees reached 52.6 million in 2012, with the
majority belonging to the poorest four income deciles. In addition, coverage was also
extended to 35 per cent of enrolees residing in rural areas and 9 per cent belonging to
indigenous communities (Knaul et al., 2012). The provisions of Seguro Popular have reduced
the catastrophic expenditure that poor Mexican families had to incur when confronted with a
health crisis.
Households enrolled in Seguro Popular are significantly less likely to spend OOP on
drugs or outpatient services. The scheme has provided financial protection to urban
households as regards prescription drugs, and to rural households as regards access to health
facilities (Knaul et al., 2012). Figure 19 shows that despite the progress made nationally over
time, the rural population in Mexico is worse off than the population living in urban areas for
legal coverage and the maternal mortality ratio (MMR). The deficit in legal coverage is 24.6
per cent in rural areas as opposed to 1 per cent in urban areas. The MMR amounts to 5.5
maternal deaths per 10,000 live births in rural areas versus 4.9 in urban areas −but Mexico
fares relatively well compared to the region’s MMR of 16 maternal deaths per 10,000 live
births in rural areas and eight in urban areas.
However, the gap in OOP is striking. Urban households spend up to 48 per cent in
OOP compared to 8 per cent by rural households. This can be associated with the lack of
coverage of the rural population that results in lower utilization rates and thus smaller
amounts of OOP. Further, imbalances in the availability of rural infrastructure, including
private services, may also result in lower utilization rates and related impacts on OOP. This is
particularly observed with regard to hospitalization, which is significantly lower among those
living in rural rather than urban areas (Salinas et al., 2010).
Figure 19. Health coverage and access to health care in rural and urban Mexico, 2015
Notes: Data on financial deficits are not available. Coverage gap due to health professional staff deficit is 0.
Source: ILO estimates, 2015.
1
48.2
4.9
24.6
8.1
5.5
Estimate of legal coverage
deficit as a % of total
population
Coverage gap due to health
professional staff deficit
(threshold: 41.1)
Financial deficit, %
(threshold: US$239)
OOP expenditure as % of
total health expenditure
Maternal mortality ratio per
10,000 live births
Urban Rural

Global evidence on inequities in rural health protection 25
While only a minority of the total population live in rural areas, rural communities
consist mostly of vulnerable groups, indigenous populations and informal workers. In remote
communities, health centres operate with poor basic apparatus and poor telecommunications
infrastructure, and are often staffed by medical students (Knaul et al, 2012). Having identified
insufficient legal coverage and shortages in affordable quality services in rural areas,
considerable attention must be dedicated to these areas to move towards more equitable
access in health care for rural populations.
3.7.3. Nigeria
Nigeria is a federation of 36 states and the federal capital territory of Abuja. It is
the most populous country in Africa, accounting for about one-sixth of the continent’s
people. In common with many other African countries it is experiencing rapid urbanization,
with about half its current population living in urban areas. The economy largely relies on
the oil and gas sector, but agriculture, mining, light industry, and the banking sector also
contribute significantly to Nigeria’s GDP. Oil resources are concentrated in the southern part
of the country, which is much more developed than the north. Three decades of political
instability and economic crisis have led to a deterioration of the health system and poor
performance on national health indicators. Public spending on health in Nigeria is low, even
relative to other sub-Saharan African countries, and health sector governance is weak, with
the result that a large private sector has developed and the majority of health services are
supplied by private providers. The supply of human resources for health (HRH) is high
relative to other African countries, but HRH planning and management tends to be poor
(Kombe et al., 2009), with the result that the distribution of the available HRH tends to be
inequitable.
National estimates for the five health access indicators reflect these general trends,
with a very high financial deficit, high levels of OOP, high levels of maternal mortality,
extremely low levels of legal coverage and a high staff access deficit in comparison to other
sub-Saharan African countries.
Figure 20 shows that on three of the five indicators (staff access deficit, financial
deficit and maternal mortality) the rural population of Nigeria fares much worse than the
urban population. For the remaining two indicators (legal coverage and OOP) there is
virtually no difference between urban and rural areas. In the case of legal coverage, this is
because hardly any Nigerian citizens have such coverage, whether they live in urban or rural
areas. In the case of OOP, this result may be indicative of an inadequate public health system
in both urban and rural areas, leading to both urban and rural dwellers being dependent on
private providers.

26 Global evidence on inequities in rural health protection
Figure 20. Health coverage and access to health care in rural and urban Nigeria, 2015
Source: ILO estimates, 2015.
Given the extreme deficits in health coverage and the significant urban/rural
inequities concerning the staff access deficit, financial deficit and maternal mortality, policy
efforts must focus on closing these gaps as well as improving overall levels of coverage and
reducing OOP, particularly for rural populations, without increasing inequity.
3.7.4. Zambia
About 60 per cent of Zambia’s population reside in rural areas, and the agricultural
sector accounts for most of the country’s employment. Since gaining independence in 1964,
Zambia has been a peaceful and politically stable country with a history of good strategic
management of its health sector, with the result that most of its health services are provided
within the public sector. Private sector provision tends to be located in urban areas, and in
2006 the country abolished user fees in public health facilities in rural districts. However,
Zambia still has a major shortage of human resources for health and a problem with
inequitable distribution of health resources between urban and rural areas (Ferrinho et al.,
2011).
These general trends are reflected in figure 21: the overall deficits in terms of legal
coverage, human resources for health and health spending are high and the rural population
fares worse than the urban population in terms of staff access, financial deficit and maternal
mortality.
Zambia is one of the countries in which OOP is higher in urban than in rural areas,
and this is most probably due to the fact that most private sector provision is in urban areas,
whereas services for rural populations remain inaccessible, limited and/or of low quality.
99
81.6
90.6 71.2
88.5
0
20
40
60
80
100
Estimate of legal
coverage deficit as a % of
total population
Coverage gap due to
health professional staff
deficit (threshold: 41.1)
Financial deficit
(threshold: US$239)
OOP expenditure as % of
total health expenditure
Maternal mortality ratio
per 10,000 live births
Urban Rural
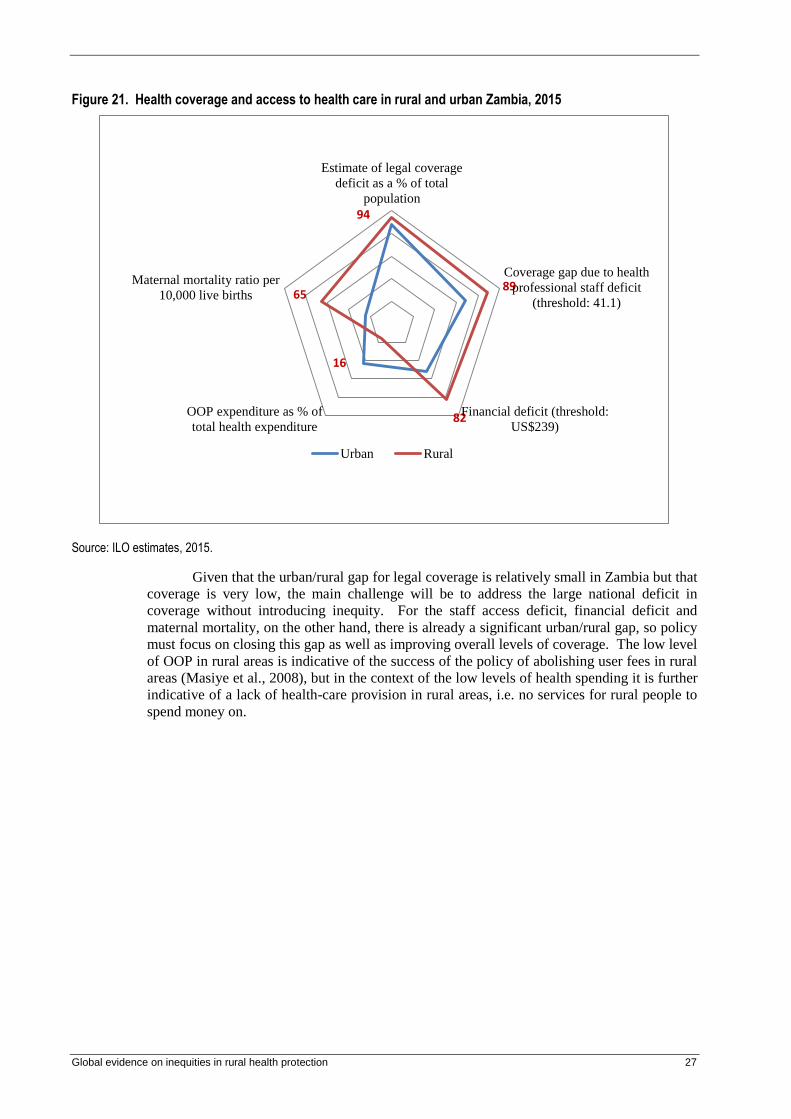
Global evidence on inequities in rural health protection 27
Figure 21. Health coverage and access to health care in rural and urban Zambia, 2015
Source: ILO estimates, 2015.
Given that the urban/rural gap for legal coverage is relatively small in Zambia but that
coverage is very low, the main challenge will be to address the large national deficit in
coverage without introducing inequity. For the staff access deficit, financial deficit and
maternal mortality, on the other hand, there is already a significant urban/rural gap, so policy
must focus on closing this gap as well as improving overall levels of coverage. The low level
of OOP in rural areas is indicative of the success of the policy of abolishing user fees in rural
areas (Masiye et al., 2008), but in the context of the low levels of health spending it is further
indicative of a lack of health-care provision in rural areas, i.e. no services for rural people to
spend money on.
94
89
82
16
65
Estimate of legal coverage
deficit as a % of total
population
Coverage gap due to health
professional staff deficit
(threshold: 41.1)
Financial deficit (threshold:
US$239)
OOP expenditure as % of
total health expenditure
Maternal mortality ratio per
10,000 live births
Urban Rural
28 Global evidence on inequities in rural health protection
4. Policies to end the rural/urban divide: Extending health protection to all and targeting the social determinants of inequities
The above findings suggest that the place of residence largely determines coverage
and access to health care. The rural/urban divide is a consistent feature across the world,
existing in all regions and within all countries. Currently, the place of residence can be
considered as an entry door or a key barrier to accessing better health protection. The root
causes range from a lack of rights to severe deficits in service delivery, as well as poverty,
uneven employment opportunities and social exclusion. Ending the rural/urban dualism
requires efforts to build more adequate structures that are based on a concept of inclusive
societies where everybody can equally receive quality care when in need.
Such a concept needs to aim at extending health coverage and access to all, as well as
addressing the social determinants and main causes of the inequities that impact on access
gaps − such as poverty, discrimination, unemployment, and working in the informal
economy. It needs to acknowledge that the right to health and social protection is a key tool
to prevent and reduce inequalities and at the same time help support a transition to more
sustainable economies. The prioritization of such policies will support social inclusion and
reduce the divergences within and across rural and urban regions.
The most important policies in this context are the establishment and development of
national social protection systems and in particular social protection floors that incorporate
strategies to extend health protection to the rural populations, guided by ILO social security
standards, particularly the ILO Social Security (Minimum Standards) Convention, 1952 (No.
102) and Recommendation No. 202 concerning national floors of social protection.
While it is not possible to outline specific policy approaches that would apply to all
countries, overall objectives and some key principles should be applied in all policies that
allow for accelerating progress towards more and better health protection for rural
populations and eliminating inequalities.
4.1. Key objectives and principles: Removing the leading causes of inequities
Putting into practice the human right to health and social security, as reaffirmed in
ILO Recommendation No. 202, requires an approach characterized by universality that does
not limit coverage to specific target groups, socio-economic groups or groups defined by
place of living, age, gender or ethnicity. It is important to aim at inclusiveness in the
formulation of national legislation, as well as its implementation and enforcement.
Thus, universal health protection should be the key policy objective when aiming to
address inequities in access to health care. It should be anchored in legislation and
implemented according to fixed timelines for the progressive realization of coverage and
access to health care in rural areas. This also includes that entitlements to benefits, such as
quality care services, preventive care, maternal care, medicines and others, are prescribed by
law and meet at least minimum standards of adequate and essential care.
The underlying principle of equitable access requires non-discrimination, including
by place of living and meeting core requirements such as gender equality and responsiveness
Global evidence on inequities in rural health protection 29
to specific needs such as those of the rural population. It also requires respect for all people
and an acknowledgement of their human dignity. In addition, equity requires that legislation
does not implicitly or explicitly favour urban residents over rural. Where such discrimination
exists it should be progressively removed, with a view to achieving equity in coverage and
access.
Universality and equity also call for solidarity in financing and fairness in burden
sharing for health protection. This entails risk pooling based on financing mechanisms such
as tax funding and contribution-based social or national health insurance. Thus, various
financing mechanisms can be chosen, particularly to reach out and best include those living
in rural areas. Particularly important for rural populations is to consider a diversity of
methods and approaches such as national health services, national insurance schemes or
mixed protection mechanisms that complement each other – for example, insurance schemes
with tax subsidies to cover contributions of the vulnerable.
Further, it is vital to avoid financial hardship or an increased risk of poverty for those
who need health care. This might occur if benefit packages are too limited or OOP are
unaffordable, particularly in the case of severe or chronic diseases. Thus, the financial
consequences of accessing health care must be carefully considered in order to avoid barriers
and thus inequities.
Finally, it is imperative to ensure that during sickness income generation is sufficient or
income support available to address the worst forms of health-related impoverishment due
to loss of income or work. This entails coverage for and access to social protection benefits
such as paid sick leave, pension or unemployment schemes or other income support through
social assistance programmes. Such income support is necessary to address the problem of
avoidance, where those who need care do not seek it because it is unaffordable.
4.2. A shared agenda for the future: Addressing inequities in a coherent multi-sectoral approach
Of the developing world’s 5.98 billion people, almost 3.4 billion live in rural areas. It
is estimated that this number will increase during this decade, reach its peak in the 2020s and
decline to 3.2 billion by 2050 (UN Population Division, 2014).The global trend is determined
by rural population growth in Asia and Africa, where nearly 90 per cent of the global rural
population live. India (857 million) and China (635 million) alone account for 45 per cent.
Three other Asian countries − Bangladesh, Indonesia, and Pakistan − also have over 100
million people living in rural areas. In Africa, large rural populations are found particularly in
Nigeria (95 million) and Ethiopia (78 million). And while the number of people living in
rural areas will decline in India and China, those in African countries will significantly
increase until 2050 − by 50 million in Nigeria, 39 million in Ethiopia and 38 million in
Uganda (ibid.). Thus, the highest increase in rural populations is expected to take place in
countries that already today have the largest health access deficits.
Against this background, successful policies towards universal health protection need
to specifically consider access barriers for rural populations in all dimensions of coverage –
be it legislation, financing and funding or making health care available and affordable. In
addition, rural specificities need to be taken into account when it comes to the
implementation of legislation.
30 Global evidence on inequities in rural health protection
4.2.1. Considering rural living and working characteristics
About 70 per cent of the developing world’s 1.4 billion extremely poor people are currently
living in rural areas (IFAD, 2011). In other words, high poverty rates are linked to high
percentages of people living in rural areas compared to urban areas.
Most rural dwellers in developing countries depend on agriculture for their livelihood
and subsistence agriculture is common. However, the rural population also participate in
rural labour markets that are often characterized by informality of work, unemployment,
and significant challenges as regards decent work. For example, among the rural poor in
India casual wage labour is the largest single occupational group (ILO, 2008). This form of
labour is unstable, as wages are paid on a task or piecemeal basis and as a result workers are
highly vulnerable both to risks associated with agriculture (e.g. natural hazards such as
droughts) and to seasonal variations in employment opportunities. The situation is aggravated
by the fact that state-run social protection coverage often focuses only on the organized
sectors of public and industrial employment, leaving the vast majority of rural populations
that operate in the informal economy without any means of income support (ILO, 2011a).
The wages of employed rural populations are frequently low and the often physically
demanding work offers few opportunities to invest in developing skills and building assets to
generate higher incomes. Persistent poverty and limited employment opportunities for decent
jobs are also major “push factors” that are responsible for the migration of formerly rural
dwellers into urban slums (ILO, 2008).
Self-employed small-scale farmers in developing countries also face obstacles in
income generation. Local value chains have high transaction costs and are hampered by
inadequate infrastructure, long distances and restricted access to financial and business
services. As a result, it is difficult for these producers to become suppliers to larger firms,
compete in global value chains and enter higher value markets. Due to their size and lack of
organization in cooperatives or other producer organizations, small enterprises in rural areas
also do not have enough bargaining power to improve their situation (ILO, 2011a).
In addition to economic exclusion and lack of economic opportunities, rural
populations largely remain excluded from participatory processes within the overall
society they live in. Where political representation is absent, legislation and related resource
allocation patterns tend to favour urban areas, particularly for public services including
education and health. This “urban bias” is fuelled by better-off interest groups in cities that
are able to lobby the government to spend money on the services they want, while the poor in
rural areas suffer from underinvestment.
Social exclusion and the lack of access to services are most severe for those who are
most at risk of poverty. Within rural populations, these are particularly women, the elderly,
minority groups and migrants.
These characteristics require specific efforts to include rural populations in
meaningful health protection that results in effective access to health care when needed.
Affordability, availability and financial protection of legally anchored health protection need
to be at the centre of successful policies towards universal health coverage.
Global evidence on inequities in rural health protection 31
4.2.2. Moving from charity to rights
The evidence on rural/urban inequities indicates that in most countries a higher
percentage of the urban population enjoy rights to health protection coverage than the rural
population. As we have seen, the global figures show that while 22 per cent of the population
in urban areas lack legal health coverage, 56 per cent of the rural population are not affiliated
to any health scheme or system. The existing gaps reflect an absence of legislation or
fragmented legislation that concerns more than half the global rural population. While some
people without legal rights to health care may have access if they purchase care on a private
basis, the majority are unable to do so and thus have no entitlement to health services when in
need.
Where legislation is fragmented, it may for instance exclusively cover registered
formal workers while excluding seasonal and migrant workers, family members or those
working in the informal economy. In addition to these gaps, and contrary to the principles of
equity and universality, people living in rural areas often do not enjoy the same rights and
entitlements as those living in cities.
The reasons for low levels of legal coverage relate to the absence or insufficiency of
inclusive legislation. In these cases, charities are often present whose purpose is to serve the
rural population, the poor, the vulnerable or the otherwise excluded. Such charities are well-
meaning and much appreciated, but they cannot serve as an excuse for government to ignore
its responsibility to the population as a whole, providing legal coverage and equitable access
to health care for all.
As a prerequisite for equity and equality, a rights-based approach is the most
appropriate framework for countries to use when considering ways to narrow and eliminate
the urban/rural gap. This is not only in line with the human right to social security and health,
but is also highlighted in various ILO Conventions and Recommendations, most recently in
Recommendation No. 202 which insists on rights-based approaches to social security and
health including the provision of basic guarantees for all irrespective of where they live.
Thus, Recommendation No. 202 requires that inequities be addressed both across and within
countries.
Addressing gaps in rights requires a focus on at least basic guarantees to health
services provided under the roof of universal health protection. Legislation should clearly
specify the range, qualifying conditions and levels of benefits. Further, entitlements should be
regularly and transparently reviewed, so that those making the decisions can be held
accountable.
Finally, the legislation needs to be implemented with a view to achieving equitable
access to health care for all. Poor implementation of legislation is a key concern for rural
populations: The absence of infrastructure, the lack of health workers or high co-payments
are among the main reasons for poor access. Further issues relate to setting up approaches
that match the specificities of rural populations, including personal and work status, or
illiteracy with its related lack of awareness of rights.
4.2.3. Developing fiscal space and allocating resources to rural health protection
The analysis in section 3 revealed that in many countries expenditure on health
protection is currently characterized by underfunding. Financial deficits are found in all
regions and concern mostly low- and lower-middle-income countries, with rural areas more
32 Global evidence on inequities in rural health protection
concerned than urban. The deficit results in a coverage gap of as much as 63 per cent of the
global rural population. This gap is twice the size of the urban gap, which concerns 33 per
cent of the global population living in urban areas. Generating sufficient funds for health
protection that are equally shared between rural and urban populations is thus an important
issue.
When developing the fiscal space needed it should be considered that health
protection is an investment in the human resources of countries and can yield significant
social and economic returns in terms of productivity, economic growth and wealth, due to its
impacts on the health status of the population, including mortality rates, absenteeism and
other issues. Further, since there are also indirect savings through reduced health-related
poverty, funds for poverty alleviation are also appropriate.
Taking these considerations into account, domestic revenues for health protection can
be generated through both
specific health financing mechanisms; and
funds from government budgets that are related to economic development or
broader development policies.
The most frequently used health financing mechanisms for generating domestic
revenues include taxes and income-related contribution payments for national or social
insurances. When applying such mechanisms, the potentially negative impacts for the rural
population should be taken into account. These include the use of value-added taxes that –
given consumption patterns – place a heavier burden on the low-income and poor populations
most frequently found in rural areas. As regards insurance-based income generation, the link
to formal work and related work contracts that are less available in the informal settings
found in rural economies will be of concern. Thus, addressing this issue through contribution
subsidies might be considered.
Unfortunately, OOP are also often used as a financing mechanism despite the
negative impact on accessibility of health care and their regressive impact on income, thereby
further contributing to inequities. Thus, under no circumstances should OOP such as user fees
and co-payments be considered for fiscal space.
Most relevant for the development of fiscal space are the efficiency and effectiveness
of national health services, as well as social and national health insurance schemes.
Frequently, issues relate to:
high administrative costs;
long administrative procedures;
inefficient and/or unequal allocation of funds to urban centres;
fraud or waste of funds.
The World Health Organization estimates that the waste of health-care funds
accounts for 20 to 40 per cent of global health expenditure (WHO, 2010) and may be
significantly higher in specific countries. This is equivalent to US$300 billion which
disappears in corruption or due to error. In addition, it observed that large amounts of money
are wasted through not adequately maintaining equipment. Efficiency savings can also be
achieved by purchasing drugs, medical equipment and other items at competitive prices.
There is consequently a large potential for mobilizing domestic funds and thus fiscal space in
both rural and urban areas through increased efficiency and effectiveness within the health
sector.
Global evidence on inequities in rural health protection 33
Given the returns of health protection in terms of economic growth and wealth,
reallocating domestic revenues from national funds that are foreseen for achieving related
objectives should be considered, such as funds from government budgets related to economic
development or to the broader development agenda. Also considered should be the setting up
or enabling of macroeconomic frameworks that allow for increased fiscal space, for instance
with regard to increasing borrowing from domestic or international sources and debt
reduction.
In addition to these options, fiscal space can be developed by increased international
aid. However, this cannot be seen as sustainable and should not be considered a long-term
solution.
The additional funds gathered from increased fiscal space should be allocated with a
view to addressing inequities in access to health care and health protection for the whole
population. This includes resource allocation that ensures that funds do not flow only to
staffing and infrastructure costs (which tend to benefit urban areas). Both financial
allocations and other resources such as buildings, beds and staff should reflect the population
and disease burden of the diverse areas in the country.
Strategic purchasing can ensure that the resources are used in a cost-effective way to
provide at least essential services reflecting local needs. Passive purchasing – without
supervision of whether services are appropriate – tends to favour areas where utilization is
high, which again may bias public spending towards urban areas. An efficient tool within a
strategic purchasing approach is performance-based financing, which can incentivize specific
types of service as well as their quality. In some countries, higher payments have been made
within schemes to remote areas, recognizing that reaching those populations can require more
effort from providers. For example, the Democratic Republic of Congo allocates 15 per cent
(Witter et al., 2013) higher capitation payments to more remote provinces, while Burundi
allocates 40 per cent higher capitation payments to such areas (Montagu, 2002).
Public/private partnerships and social franchising can also extend the range of services in
rural areas at acceptable cost in some circumstances, and have been used widely for family
planning services.
4.2.4. Making quality health care equally available in rural areas
The availability of quality health care requires that adequate − or at least essential −
health services, quality drugs and other supplies can be accessed by everybody in all areas of
a country. As section 3 has demonstrated, inequities in the availability of health care in rural
as compared to urban areas occur in many countries, although to a different extent and due to
a variety of dysfunctions in the health systems. Some general patterns resulting in inequities
that are frequently observed include:
An overall shortage of health workers that amounts in rural areas to seven
million additional doctors, nurses and midwives out of the global shortfall of
10.3 million needed to provide universal quality services (ILO, 2014a). The
demand for health workers largely outstrips the supply. Some choose to work in
urban areas given the lack of decent working conditions and incentives for
qualified health professionals to live and work in rural areas. Moreover, the lack
of opportunities for career advancement or promotion locally or to combine
public and private practice, feelings of professional and/or personal isolation, the
necessity to work multiple jobs to make up for poor salaries, and not having easy
access to necessary equipment are all factors that have led to greater levels of
voluntary attrition (including “brain drain”) among rural health workers.

34 Global evidence on inequities in rural health protection
The situation is aggravated by labour market and educational institution
admission policies favouring the urban elite, providing more job opportunities in
urban areas and leading to most graduates being urban dwellers who are less
likely to choose the challenge of living and working in rural areas. Further, the
education on offer frequently does not develop the skills needed to work in rural
settings. For example, nursing schools tend not to train nurses to perform tasks
or procedures which have traditionally been within the remit of physicians.
However, if a nurse is the only staff member in a rural community, (s)he may
need to have these skills (and be authorized to use them) in the absence of a
physician. Thus, there may be a need to create a new cadre of health
professionals who are trained in these additional skills.
Poor rural health and transport infrastructure leading to rural dwellers finding
it difficult to attend health facilities, and to health professionals choosing not to
live and work in rural areas. Those with partners and families may be
particularly reluctant to live where they perceive the educational and
employment opportunities for their families to be poor.
Unfair distribution of health spending resulting in lower per capita expenditure
in rural areas than in urban areas, and financial management systems which
restrict local prioritization of such expenditure.
Greater levels of inefficiency in rural areas. This is due to various causes,
including a lack of management information about the numbers and locations of
existing health workers which make it very difficult for planners to deploy
human resources to where they are most needed. Also, poor stock systems
distribution of essential drugs and supplies can result in gaps in stock supplies in
remote areas. Inefficiency can also occur if qualified health professionals have to
spend time on non-clinical tasks such as cleaning, administration and health
education due to the absence of other staff to take on these roles. Finally,
inefficiencies affecting rural health facilities more than urban facilities include a
lack of referral mechanisms, for instance if specialist care is needed but
difficulties are encountered in transporting patients.
Health policy focusing mainly on the public sector, rather than attempting to
better integrate the public and private sectors.
Against this background, policies need to particularly focus on increasing the number
of skilled health workers and distributing them in an equitable way within countries where
they are urgently needed. This requires the consideration of national and global health labour
market dynamics and a particular focus on the low retention rates in rural areas. To meet
(future) needs and ensure the accessibility of health-care services in rural areas it is crucial to
train, employ, remunerate and motivate a rural health workforce that is sufficiently large and
skilled to provide quality health care for all in need.
Related policies often rely on migration and recruiting health workers from other
countries. However, this cannot be considered a satisfactory option, given the large gaps to be
filled. More promising are policies focusing on developing the health workforce in each
country with a view to training and employing more health workers.
In many countries, the rural health worker shortage is more severe for physicians
than for other cadres such as nurses and midwives. If training more physicians to work in
Global evidence on inequities in rural health protection 35
rural areas is not an option or unlikely to be effective, countries could consider “task
shifting”, i.e. changing the scope of practice of other health worker cadres in rural areas. For
example, nurses or midwives could be authorized to prescribe certain types of medication and
conduct certain types of medical procedure which are normally carried out by physicians.
This requires training, as discussed above.
Health workers in rural areas should be provided with job opportunities and decent
working conditions, including adequate wages and incentives to work in these areas. Poor
working conditions lead to difficulties in attracting and retaining high-quality workers and
therefore to poor availability of health care. Poor working environments can also lead to
limitations on the quality of care that health workers are able to provide, even if they have the
necessary knowledge and skills – for example, if the water or power supply is unreliable.
Being able to work effectively and securely is an important motivator for health
workers and increases retention (Henderson and Tulloch, 2008). Although working
conditions are typically more disadvantaged in rural areas, this can be addressed by
conducting facility surveys and prioritizing investment in infrastructure, equipment and
supplies to those levels and areas which fall most short of the norms.
Given the high proportion of women in the health workforce, gender-sensitive
interventions are particularly relevant in rural areas. These may include specific working time
arrangements such as part-time work and special leave in case of family emergencies. The
ILO Nursing Personnel Convention, 1977 (No. 149) and its related Recommendation (No.
157) set out how countries should address issues such as:
nurses’ remuneration, working conditions, career prospects, education and
training;
occupational safety and health regulations;
the involvement of nursing personnel in the planning of health services.
The development of the rural health workforce and its equal distribution across rural
areas should go hand in hand with improvements in rural infrastructure. This particularly
concerns geographical access to health facilities in rural areas, which may be difficult due to
the absence of roads or transportation. It should be recognized that ensuring a sufficient
number of well-equipped health facilities, transport infrastructure and appropriate
accommodation for health workers is a crucial ingredient for access to health care in rural
areas.
Addressing inequalities of the rural compared to the urban population particularly
requires a fair distribution of funds, particularly allocating resources according to needs. This
might include recognizing that it can be more costly to deliver services in remote and rural
areas despite lower population density.
Meeting rural health needs is not just about volume and allocation of funds but also
relates to the efficiency of public financial management, e.g. the ability to deliver resources
reliably, regularly and with sufficient flexibility for local facilities to be able to spend on their
priorities. Improving public financial systems can be especially important for primary and
rural facilities, which have less ability to generate funds from other sources. Kenya, for
example, has experimented with direct facility financing to ensure that funds reach frontline
providers, and studies suggest that relatively small increases in funding may significantly
affect the performance of a health facility when the funds are managed at the periphery
(Opwora et al., 2010).
Increasing efficiency in rural settings also includes the use of IT for health protection
and health services to enhance the potential of access to health care. This may be achieved
36 Global evidence on inequities in rural health protection
through ID-cards for registration in insurance schemes, remote consultation, diagnostic
services stock management and information systems for administrators.
Investment and other policies in health systems often focus on the public sector
without coordinating with the private sector that provides a large and growing proportion of
health care, including in rural areas. However, in countries with a weak public sector health
system and/or a relatively strong private health sector, policies which aim to improve health
outcomes are unlikely to achieve widespread, sustainable success if they focus solely on the
public sector. Thus, when aiming to address rural inequities it is of utmost importance to take
a more integrated approach, particularly to address imbalances of both sectors. For example,
South Africa (like many other countries) has a large imbalance between the public and
private health-care sectors, with the majority of total health expenditure going to the private
sector even though only a minority of the population (mainly relatively wealthy urban
dwellers) can access private sector care (Van Rensburg, 2014).The rest of the population
(including most rural dwellers) experience much lower levels of availability.
Further, policies that include both the public and private sectors can also help to
tackle problems that arise due to the “over-commercialization” that has been observed in
many low- and middle-income countries where under-resourcing of the public health system
has led to the growth of a “fee-for-service” health-care market which has little or no
regulation or consumer protection, and under which it is common for those employed by the
public sector to have a private practice and/or to charge services users with “under-the-
counter” payments (WHO, 2008). Such a system has implications for both the availability
and quality of health care, and has been found to erode public trust in health-care providers.
Regulation of the private sector is much more achievable if that sector is viewed and treated
as an integral part of the country’s health system rather than as something entirely separate.
4.2.5. Guaranteeing affordability of care and financial protection
Deficits in affordability of care and financial protection are often due to gaps in legal
coverage, including eligibility issues and constraints on benefit packages or packages that
involve high co-payments. These factors result in potentially impoverishing OOP and their
related access barriers to health care. Addressing these issues through adequate policies
requires:
Developing inclusive legislation that closes gaps due to no or fragmented
coverage. Fully implementing such legislation is likely to significantly reduce
geographical inequities in OOP. This might include rethinking health financing
mechanisms, e.g. the provision of subsidies to the rural population if gaps in
coverage occur due to employment-based insurance schemes.
In the past, community-based health insurance (CBHI) and micro-health insurance
have also been promoted as mechanisms for enrolling the informal workforce,
particularly in rural areas. However, while such schemes have potential for local-
level improvements and spreading costs over time, they tend to suffer from
adverse selection as membership is voluntary, which leads to financial risks. In
addition, reaching the poorest and scaling up have proved challenging.
Addressing constraints on benefit packages or involvement of high OOP in
benefit take-up through legislation, and ensuring that such legislation is
accordingly implemented, for example through minimizing OOP and developing
benefit packages meeting at least essential needs.
Global evidence on inequities in rural health protection 37
Additionally, there should be protection against loss of earnings due to ill-health, so
that people are able to take time off work when they are unwell. Research has found that the
provision of paid sick leave is self-financing in the longer term, because it reduces the spread
of communicable diseases and maximizes the productivity of those who are at work (Scheil-
Adlung et al., 2010).
Further reasons for lack of affordability and financial protection often include the
patterns of resource distribution within health systems, which commonly favour higher-level
facilities over primary ones, and urban areas over rural. If, for example, supplies do not reach
rural facilities, then households may be forced to purchase medicines in the open market,
generating high OOP. Similarly, access costs are often higher where the network of facilities
is spread more thinly, as is commonly the case in rural areas. In addition to ensuring that rural
areas are not disadvantaged in terms of the financing of health-care systems, needs-based
resource allocation can ensure that funds do not flow according to staffing and infrastructure
only – which as stated above tends to benefit urban areas. Both funding and other resources
such as buildings, beds and staff should reflect the population and disease burden of different
areas.
Also, strategic purchasing can ensure that the resources are used to provide essential
services which reflect local needs and are also cost-effective.
In addition, the design of schemes may need to be adapted to meet different
conditions in rural areas. For the safe motherhood voucher scheme in Kenya, for example, a
range of marketing strategies had to be developed – what worked in rural areas was different
from what worked in urban areas (Bellows et al., 2011).
Other mechanisms with potential to provide financial protection in rural areas include
demand-side financing where resources are transferred to households, sometimes on
condition that they utilize specific services (ILO, 2014a). These can be focused on rural
areas, like the cash transfer scheme in Bolivia which is available to all households in 70 rural
districts with a pregnant woman or young child, conditional on their use of preventive
services (Witter, 2012). Some conditional cash transfer schemes are now on a large scale,
both in terms of households covered and the size of resources transferred. The PROGRESA
scheme in Mexico, for example, covers 40 per cent of rural households and is estimated to
provide an average of 20 per cent of household consumption in recipient households
(Gwatkin et al., 2004; ILO, 2014a).
4.2.6. Addressing the social determinants of inequities: Social protection policies
The above-mentioned policies focus primarily on tools available within the health
sector. They should be complemented by socio-economic and labour market policies that aim
to address inequities in a broader framework to coordinate health, social and developmental
policies with a view to alleviating poverty and achieving universal social protection,
including health protection.
International evidence on social protection cash benefits and transfers such as social
assistance, old-age pensions, child benefits and unemployment benefits has proven their
impact not only on short-term poverty, but also on human capital accumulation in the
medium term (ILO, 2014a). They can also lower the need for the sale of assets and other
38 Global evidence on inequities in rural health protection
negative coping strategies when accessing health care, which have important long-term
consequences for beneficiary households (DFID, 2011).
Addressing income inequalities in rural areas reduces financial barriers to accessing
health care by increasing the ability of households to afford health-care services. Rural
development programmes and any intervention that increases household and community
livelihood assets (financial, natural, social, and so on) and endowments can both improve
purchasing power. Development programmes can include investment in rural education
systems to develop the human capital, as well as to improve the transport infrastructure which
not only supports local livelihoods and markets but also reduces access costs for health.
Among the strategies for rural development are the following (ILO, 2011b):
Establish human resource-based rural development at the core of national and
international development strategies. Economic growth and development
architecture should adopt rural development as a core pillar.
Promote human-resource-based rural development through strengthening: (i) the
“voice” of rural stakeholders so that they can enter into dialogue with key
decision-makers at local and national levels; and (ii) the capacity of rural
stakeholders to engage in high-value-added, high-return activities.
Achieve a balance between farming and non-farming activities through a
combination of support for agricultural productivity and assistance for
diversification into higher-value manufacturing and service activities such as
tourism and water management.
Move from short-term, isolated interventions to longer-term programmes with
strong policy connections to ensure sustainability and integration of programmes
into mainstream national policies.
Focus on women and youth as the main drivers of rural development, in contexts
where their potential remains under-appreciated, under-developed and under-used.
Expand and promote partnerships with other agencies, NGOs, donors, think tanks
and media; the wide range of stakeholders reflects the size and multi-faceted
nature of rural development gaps.
Finally, implementing labour market policies to support the development of rural
employment opportunities is a key tool in reducing rural poverty. Creating decent jobs in
rural areas can contribute to poverty reduction, social inclusion and sustainable socio-
economic development. This particularly requires the transformation of informal into formal
labour markets, and investments in rural areas.
Global evidence on inequities in rural health protection 39
4.3 The implementation process
The number of policies needed to achieve equality in access to health care for rural
populations outlined above, coupled with the complexity of the policy-making, presents an
important challenge. Thus, it is important to take a structured, transparent and evidence-based
approach, but this in itself can be a challenge due to a lack of reliable evidence on which to
base decisions (Youngkong et al., 2009).
However, making policy decisions on an ad hoc basis is likely to maintain or
exacerbate existing inequities and should be avoided: a lack of structured policy processes,
for example those concerning priority-setting and the involvement of different ministries as
well as representatives of employers, employees, NGOs and others is judged to be among the
reasons why there has been only limited progress towards the Millennium Development
Goals (Mirelman et al., 2012).
A structured policy implementation process includes some key steps, starting from
identifying the issues and defining objectives, to developing and coordinating policy options
within and across sectors with a view to policy coherence, holding social and national
dialogue, and strengthening capacity for implementation as well as monitoring. Identifying
the issues and setting the objectives to address them can be based on a matrix that lists the
issues observed in a country and the various dimensions of coverage and access for rural
populations. An example based on the issues discussed above is provided in table 3.

40 Global evidence on inequities in rural health protection
Table 3. Identifying core issues of rural/urban health access deficits
Components of effective access affected by the issue
Issue
Rights to social
security and
health
Availability of health
care
Quality of health care
Financial protection and
affordability
Monitoring health system
outcomes
Issues within the health sector
Fragmented legislation implicitly or explicitly excluding rural populations
Lack of or poor implementation of legislation for guaranteeing access to essential health care
High OOP for rural populations
Overall shortage of human resources for health
Lack of decent working conditions for rural health workers
Poor rural health infrastructure
Health system inefficiency including lack of evidence-based decision-making
Maldistribution of health spending/poor financing mechanisms
Lack of social/national dialogue
Lack of accountability
Issues beyond the health sector impacting on effective access
Rural poverty
Rural unemployment/lack of decent work in rural areas
Large informal economy in rural areas
Gaps in social protection coverage and income support
Neglected rural development policies
Cultural acceptance of inequality/low awareness of rights and entitlements
Poor rural transport infrastructure
Based on the results of such an analysis, policy options within and beyond the health
sector addressing the issues can be developed and prioritized. Clearly stated objectives,
principles and policies should be defined, such as those outlined in ILO Recommendation
No. 202. These may include developing legislation, ensuring effective implementation and
identifying related fiscal space for inclusive coverage, adequate labour market policies and
poverty alleviation in a framework of coherent socio-economic policies. An example
focusing on the policy options discussed above is provided in table 4.

Global evidence on inequities in rural health protection 41
Table 4. Selected policy options for reducing urban/rural health access deficits
Issue
Policy options
Lack of or poor design and implementation of legislation guaranteeing access to health care; cultural acceptance of inequality /low awareness of rights and entitlements; maldistribution of health spending
Establish basic guarantees in legislation and boost rural entitlements, subsidized health insurance or exemption from payments for rural populations
Review existing revenue sources and if appropriate broaden revenue base and/or identify alternative health financing mechanisms
Coordinate health financing mix to avoid fragmentation and maximize coverage
Improve enforcement of tax and contribution obligations
Develop health workforce and infrastructure
Introduce decent working conditions for rural health workers including adequate wages and incentives
Introduce or strengthen demand-side financing, e.g. conditional or unconditional cash transfers, voucher schemes
Create specified budget lines for essential health care
Broaden access to judicial system
Review budget allocation mechanisms to ensure allocation is based on need
Introduce paid sick leave
Include private sector as well as public sector as integral to health policy, planning and regulation
Inefficiency of health system
Establish or strengthen systems for monitoring quality of care at all levels, but especially primary care
Invest in e-health/m-health technology for communications between rural health workers and other parts of the health-care system
Reduce need for health care, e.g. by increasing access to family planning, health education, vaccination, preventive care
Ensure public financial management systems are able to deliver resources reliably, regularly and with flexibility to allow local priority-setting
Establish or strengthen effective referral mechanisms
Introduce strategic purchasing mechanisms for procurement
Lack of evidence-based decision-making and accountability
Ensure political or financial decentralization of the health system
Establish or strengthen health management information systems and build capacity to analyse and use the management information
Establish or strengthen accountability mechanisms at all levels of the health system
Establish or strengthen a national human resources for health observatory
Strengthen the voice and the capacity of rural stakeholders such as workers, employers, women, civil society, etc.
Lack of social protection; rural poverty; unemployment; lack of decent work; large informal economy
Develop/raise national social protection floors focusing on alleviating poverty and increasing household livelihood assets in rural areas
Include rural development as core element of national development strategy
Develop enabling rural labour market policies, including incentivizing employers to offer formal rather than informal employment
Invest in rural transport infrastructure, e.g. road building and maintenance
Implement policies stimulating investments in improving agricultural productivity and assistance for diversification into manufacturing and service industries in rural areas instead of/in addition to agriculture
Following the identification of issues and the development of policy options it is
important to set priorities involving national and social dialogue. All interested parties must
be involved in the design, implementation and periodic review to ensure that policies achieve
their objectives; in the context of urban/rural equity, the local government and rural health

42 Global evidence on inequities in rural health protection
service providers, managers and users as well as workers and employers should be involved.
In the social and national dialogue process the cross-cutting nature of the issues and policies
should be reflected and policy coherence prevail.
In countries with decentralized health protection schemes, local government have
some or all of the responsibility for health services in terms of service provision and
financing. This can effectively make local government into an intermediary between service
users and central government – as for example if the central government allocates a budget
for health to an area, and the local government decides how to spend it. This can result in
problems of accountability, since the local authority is accountable to both the central
government (to account for how it spends central government funding) and the local
population (to account for how well it delivers health services). Such problems are not
insurmountable, but do require the different actors to engage directly with each other. Two
well-known examples follow:
In the Health Agent Programme in the state of Ceará in Brazil, the state health
department set and monitored recruitment procedures for community health
workers, but local authorities actually recruited the workers, which put them in the
position of being accountable to both the state government and local citizens. The
success of the scheme was partly attributed to the fact that the state authorities
engaged directly with communities and explained what they could expect of their
local authority, which empowered civil society to hold the local authorities
accountable (Brinkerhoff, 2003).
India’s National Rural Health Mission (NRHM) was launched in 2005 with the
aim of improving access to health care for the rural population (Government of
India, 2014). One of its policy initiatives was to tackle a lack of accountability
using community-based monitoring (CBM). In group discussions, members of
rural communities − with a particular emphasis on women and marginalized
groups − were asked to rate various elements of primary care and outreach
services, with the results summarized in the form of scorecards. The scores were
presented to public meetings and, where appropriate, issues were referred up to
state-level officials. As one element of a larger accountability effort, CBM
appeared to have been successful in making improvements to these primary care
services (Kakade, 2012).
Efficient and effective implementation frequently requires capacity building at one
or more levels of the health system. Further, regular monitoring of all aspects and
dimensions of coverage and access to health care is a key policy tool for assessing inequities
between rural and urban populations if results are to be taken into account, for example, in
policy reforms. The accurate monitoring of progress towards closing urban/rural gaps will
require more and better quality data than currently exist. This study has revealed that
relatively few countries collect the data that would allow sub-national disaggregation, for
example of the maternal mortality ratio, and even those that do collect the requisite data tend
not to produce sub-national estimates. If policy is to be evidence-based and health system
outcomes are to be reliably monitored, this information gap must be addressed.
Within health systems we find that in most low- and middle-income countries, health
management information systems and vital registration systems are either non-existent or
inadequate (HMN and WHO, 2011) due to insufficient financial and/or human resources to
maintain them and/or insufficient IT infrastructure and/or poor understanding of the potential
benefits. However, a lack of high-quality management information leads to decisions that are
not evidence-based. In some countries, even if management data are available, they are not
always used for the purposes of monitoring and informing decision-making, whether because
decision-makers are not aware of the available data, or have little faith in their reliability, or
are not held accountable for their decisions.
Global evidence on inequities in rural health protection 43
5. Conclusions
This report has provided for the first time comprehensive global evidence on the extent of
inequities in rural health coverage and access compared to the coverage of urban populations.
It indicates that in most countries (including high-, middle- and low-income countries):
In many parts of the world, the global rural population is excluded from rights to
health protection to a greater degree than the urban population.
Globally and regionally, rural populations experience important inequities in
access to needed health care compared to urban populations.
In some countries rural populations are faced with extreme social exclusion from
access to health care as compared to urban populations, due to the absence of
financial protection and professional health staff needed to deliver quality
services.
The rural/urban inequities observed result in higher rural mortality, as indicated by
higher maternal mortality in rural than in urban areas.
Given the evidence provided, this report leaves no room for doubt about the
urban/rural gap in access to health care; the question is more about the size of the deficits
than about whether or not they exist. Even if there is uncertainty about the exact scale of the
deficits, given the scarcity of data, the evidence provided in the report suggests that building
universal health coverage and providing equitable effective access for the rural population
should be among the core obligations and highest priorities of governments throughout the
world.
A human rights and national approach based on the concept of national social
protection floors is an appropriate social protection framework for countries to use when
considering ways of narrowing and eliminating the urban/rural gap. Investments in social and
health protection to develop universal schemes and systems based on sustainable financing
and good governance should be adequate to address inequities in access. Related reforms
should not create additional inequities, for example related to older persons, women or
informal workers, but should close access gaps and deficits.
Guiding principles for establishing health protection should include equity,
particularly achieving equitable access to quality health care characterized by availability,
affordability and financial protection and thus particularly accessible to the poor, informal
workers and other vulnerable groups living in rural areas. Narrowly targeted approaches are
not adequate to protect the rural population sufficiently, given the dynamic processes and
constant changes observed as regards urbanization and impoverishment.
The availability of at least essential health care is dependent on having an efficient
and effective health protection scheme or national health service that provides access to
sufficient health facilities, health workers, drugs and supplies for the rural population. Quality
services and other benefits should be adequate (or at least meeting essential needs) so as to
avoid impoverishment.
An acute shortage of health workers has been identified as a key issue preventing
many countries from achieving equitable access to health care for rural populations, and the
data provided in this report confirm that, in many countries, there is more of a shortage in
rural areas than in urban areas. Improving equity in access for rural populations involves
providing decent jobs and working conditions for health workers in these areas and reviewing
the distribution of funds to rural areas.
44 Global evidence on inequities in rural health protection
Policy options to establish and increase equitable health protection are country-
specific. Generally, they include providing universal health services through tax-funded
national health services or contribution-based national or social health insurances. When
setting up such schemes and services, effective consultation with and involvement of key
stakeholders is important. These include government ministries, trade unions, employers,
health-care providers, social insurance schemes, civil society and health service users.
Dialogue with all these groups will help to ensure that those responsible for the successful
implementation of the policy are supportive of it and aware of what they need to do in order
to achieve it.
Addressing rural/urban inequities requires embedding health protection reforms in
broader social protection and labour market reforms to ensure sustainability of progress in
eliminating inequities in access to health care. Policies that focus on a single issue or that
apply to a single sector are likely to have little, if any, effect on equality in health coverage
and access. It is important to address the root causes of inequitable access, which cut across a
number of different sectors and levels within sectors. In making labour market policy, among
the priorities should be increased inclusiveness and transforming informal into formal labour
markets.
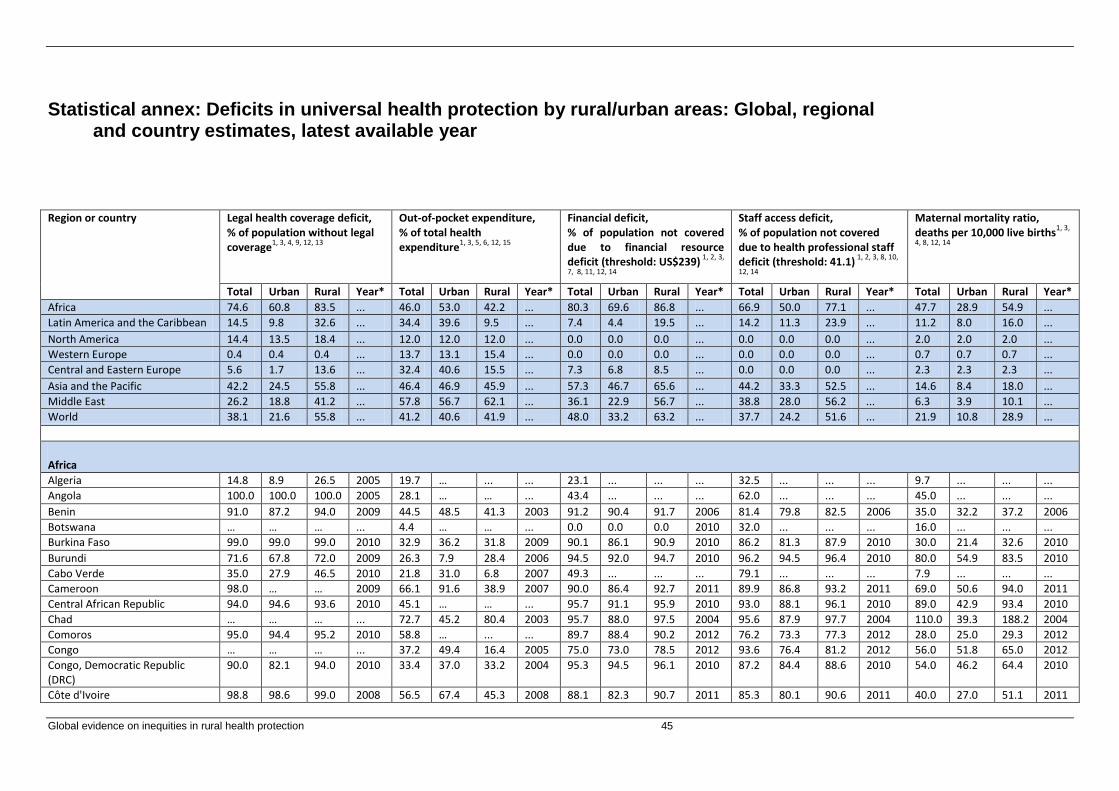
Global evidence on inequities in rural health protection 45
Statistical annex: Deficits in universal health protection by rural/urban areas: Global, regional and country estimates, latest available year
Region or country
Legal health coverage deficit, % of population without legal coverage
1, 3, 4, 9, 12, 13
Out-of-pocket expenditure, % of total health expenditure
1, 3, 5, 6, 12, 15
Financial deficit, % of population not covered due to financial resource deficit (threshold: US$239)
1, 2, 3,
7, 8, 11, 12, 14
Staff access deficit, % of population not covered due to health professional staff deficit (threshold: 41.1)
1, 2, 3, 8, 10,
12, 14
Maternal mortality ratio, deaths per 10,000 live births
1, 3,
4, 8, 12, 14
Total Urban Rural Year* Total Urban Rural Year* Total Urban Rural Year* Total Urban Rural Year* Total Urban Rural Year*
Africa 74.6 60.8 83.5 ... 46.0 53.0 42.2 ... 80.3 69.6 86.8 ... 66.9 50.0 77.1 ... 47.7 28.9 54.9 ...
Latin America and the Caribbean 14.5 9.8 32.6 ... 34.4 39.6 9.5 ... 7.4 4.4 19.5 ... 14.2 11.3 23.9 ... 11.2 8.0 16.0 ...
North America 14.4 13.5 18.4 ... 12.0 12.0 12.0 ... 0.0 0.0 0.0 ... 0.0 0.0 0.0 ... 2.0 2.0 2.0 ...
Western Europe 0.4 0.4 0.4 ... 13.7 13.1 15.4 ... 0.0 0.0 0.0 ... 0.0 0.0 0.0 ... 0.7 0.7 0.7 ...
Central and Eastern Europe 5.6 1.7 13.6 ... 32.4 40.6 15.5 ... 7.3 6.8 8.5 ... 0.0 0.0 0.0 ... 2.3 2.3 2.3 ...
Asia and the Pacific 42.2 24.5 55.8 ... 46.4 46.9 45.9 ... 57.3 46.7 65.6 ... 44.2 33.3 52.5 ... 14.6 8.4 18.0 ...
Middle East 26.2 18.8 41.2 ... 57.8 56.7 62.1 ... 36.1 22.9 56.7 ... 38.8 28.0 56.2 ... 6.3 3.9 10.1 ...
World 38.1 21.6 55.8 ... 41.2 40.6 41.9 ... 48.0 33.2 63.2 ... 37.7 24.2 51.6 ... 21.9 10.8 28.9 ...
Africa
Algeria 14.8 8.9 26.5 2005 19.7 … ... ... 23.1 ... ... ... 32.5 ... ... ... 9.7 ... ... ...
Angola 100.0 100.0 100.0 2005 28.1 … … ... 43.4 ... ... ... 62.0 ... ... ... 45.0 ... ... ...
Benin 91.0 87.2 94.0 2009 44.5 48.5 41.3 2003 91.2 90.4 91.7 2006 81.4 79.8 82.5 2006 35.0 32.2 37.2 2006
Botswana … … … ... 4.4 … … ... 0.0 0.0 0.0 2010 32.0 ... ... ... 16.0 ... ... ...
Burkina Faso 99.0 99.0 99.0 2010 32.9 36.2 31.8 2009 90.1 86.1 90.9 2010 86.2 81.3 87.9 2010 30.0 21.4 32.6 2010
Burundi 71.6 67.8 72.0 2009 26.3 7.9 28.4 2006 94.5 92.0 94.7 2010 96.2 94.5 96.4 2010 80.0 54.9 83.5 2010
Cabo Verde 35.0 27.9 46.5 2010 21.8 31.0 6.8 2007 49.3 ... ... ... 79.1 ... ... ... 7.9 ... ... ...
Cameroon 98.0 … … 2009 66.1 91.6 38.9 2007 90.0 86.4 92.7 2011 89.9 86.8 93.2 2011 69.0 50.6 94.0 2011
Central African Republic 94.0 94.6 93.6 2010 45.1 … … ... 95.7 91.1 95.9 2010 93.0 88.1 96.1 2010 89.0 42.9 93.4 2010
Chad … … … ... 72.7 45.2 80.4 2003 95.7 88.0 97.5 2004 95.6 87.9 97.7 2004 110.0 39.3 188.2 2004
Comoros 95.0 94.4 95.2 2010 58.8 … ... ... 89.7 88.4 90.2 2012 76.2 73.3 77.3 2012 28.0 25.0 29.3 2012
Congo … … … ... 37.2 49.4 16.4 2005 75.0 73.0 78.5 2012 93.6 76.4 81.2 2012 56.0 51.8 65.0 2012
Congo, Democratic Republic (DRC)
90.0 82.1 94.0 2010 33.4 37.0 33.2 2004 95.3 94.5 96.1 2010 87.2 84.4 88.6 2010 54.0 46.2 64.4 2010
Côte d'Ivoire 98.8 98.6 99.0 2008 56.5 67.4 45.3 2008 88.1 82.3 90.7 2011 85.3 80.1 90.6 2011 40.0 27.0 51.1 2011
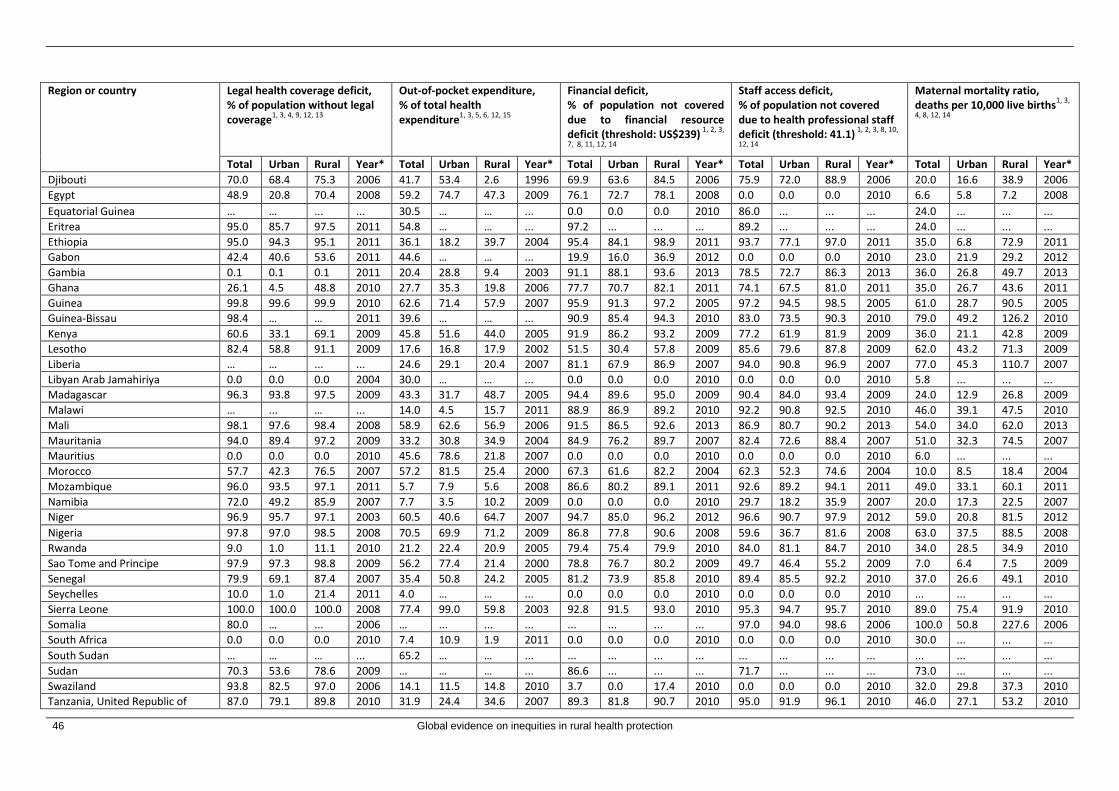
46 Global evidence on inequities in rural health protection
Region or country
Legal health coverage deficit, % of population without legal coverage
1, 3, 4, 9, 12, 13
Out-of-pocket expenditure, % of total health expenditure
1, 3, 5, 6, 12, 15
Financial deficit, % of population not covered due to financial resource deficit (threshold: US$239)
1, 2, 3,
7, 8, 11, 12, 14
Staff access deficit, % of population not covered due to health professional staff deficit (threshold: 41.1)
1, 2, 3, 8, 10,
12, 14
Maternal mortality ratio, deaths per 10,000 live births
1, 3,
4, 8, 12, 14
Total Urban Rural Year* Total Urban Rural Year* Total Urban Rural Year* Total Urban Rural Year* Total Urban Rural Year*
Djibouti 70.0 68.4 75.3 2006 41.7 53.4 2.6 1996 69.9 63.6 84.5 2006 75.9 72.0 88.9 2006 20.0 16.6 38.9 2006
Egypt 48.9 20.8 70.4 2008 59.2 74.7 47.3 2009 76.1 72.7 78.1 2008 0.0 0.0 0.0 2010 6.6 5.8 7.2 2008
Equatorial Guinea … … ... ... 30.5 … … ... 0.0 0.0 0.0 2010 86.0 ... ... ... 24.0 ... ... ...
Eritrea 95.0 85.7 97.5 2011 54.8 … … ... 97.2 ... ... ... 89.2 ... ... ... 24.0 ... ... ...
Ethiopia 95.0 94.3 95.1 2011 36.1 18.2 39.7 2004 95.4 84.1 98.9 2011 93.7 77.1 97.0 2011 35.0 6.8 72.9 2011
Gabon 42.4 40.6 53.6 2011 44.6 … … ... 19.9 16.0 36.9 2012 0.0 0.0 0.0 2010 23.0 21.9 29.2 2012
Gambia 0.1 0.1 0.1 2011 20.4 28.8 9.4 2003 91.1 88.1 93.6 2013 78.5 72.7 86.3 2013 36.0 26.8 49.7 2013
Ghana 26.1 4.5 48.8 2010 27.7 35.3 19.8 2006 77.7 70.7 82.1 2011 74.1 67.5 81.0 2011 35.0 26.7 43.6 2011
Guinea 99.8 99.6 99.9 2010 62.6 71.4 57.9 2007 95.9 91.3 97.2 2005 97.2 94.5 98.5 2005 61.0 28.7 90.5 2005
Guinea-Bissau 98.4 … … 2011 39.6 … … ... 90.9 85.4 94.3 2010 83.0 73.5 90.3 2010 79.0 49.2 126.2 2010
Kenya 60.6 33.1 69.1 2009 45.8 51.6 44.0 2005 91.9 86.2 93.2 2009 77.2 61.9 81.9 2009 36.0 21.1 42.8 2009
Lesotho 82.4 58.8 91.1 2009 17.6 16.8 17.9 2002 51.5 30.4 57.8 2009 85.6 79.6 87.8 2009 62.0 43.2 71.3 2009
Liberia … … ... ... 24.6 29.1 20.4 2007 81.1 67.9 86.9 2007 94.0 90.8 96.9 2007 77.0 45.3 110.7 2007
Libyan Arab Jamahiriya 0.0 0.0 0.0 2004 30.0 … … ... 0.0 0.0 0.0 2010 0.0 0.0 0.0 2010 5.8 ... ... ...
Madagascar 96.3 93.8 97.5 2009 43.3 31.7 48.7 2005 94.4 89.6 95.0 2009 90.4 84.0 93.4 2009 24.0 12.9 26.8 2009
Malawi … ... … ... 14.0 4.5 15.7 2011 88.9 86.9 89.2 2010 92.2 90.8 92.5 2010 46.0 39.1 47.5 2010
Mali 98.1 97.6 98.4 2008 58.9 62.6 56.9 2006 91.5 86.5 92.6 2013 86.9 80.7 90.2 2013 54.0 34.0 62.0 2013
Mauritania 94.0 89.4 97.2 2009 33.2 30.8 34.9 2004 84.9 76.2 89.7 2007 82.4 72.6 88.4 2007 51.0 32.3 74.5 2007
Mauritius 0.0 0.0 0.0 2010 45.6 78.6 21.8 2007 0.0 0.0 0.0 2010 0.0 0.0 0.0 2010 6.0 ... ... ...
Morocco 57.7 42.3 76.5 2007 57.2 81.5 25.4 2000 67.3 61.6 82.2 2004 62.3 52.3 74.6 2004 10.0 8.5 18.4 2004
Mozambique 96.0 93.5 97.1 2011 5.7 7.9 5.6 2008 86.6 80.2 89.1 2011 92.6 89.2 94.1 2011 49.0 33.1 60.1 2011
Namibia 72.0 49.2 85.9 2007 7.7 3.5 10.2 2009 0.0 0.0 0.0 2010 29.7 18.2 35.9 2007 20.0 17.3 22.5 2007
Niger 96.9 95.7 97.1 2003 60.5 40.6 64.7 2007 94.7 85.0 96.2 2012 96.6 90.7 97.9 2012 59.0 20.8 81.5 2012
Nigeria 97.8 97.0 98.5 2008 70.5 69.9 71.2 2009 86.8 77.8 90.6 2008 59.6 36.7 81.6 2008 63.0 37.5 88.5 2008
Rwanda 9.0 1.0 11.1 2010 21.2 22.4 20.9 2005 79.4 75.4 79.9 2010 84.0 81.1 84.7 2010 34.0 28.5 34.9 2010
Sao Tome and Principe 97.9 97.3 98.8 2009 56.2 77.4 21.4 2000 78.8 76.7 80.2 2009 49.7 46.4 55.2 2009 7.0 6.4 7.5 2009
Senegal 79.9 69.1 87.4 2007 35.4 50.8 24.2 2005 81.2 73.9 85.8 2010 89.4 85.5 92.2 2010 37.0 26.6 49.1 2010
Seychelles 10.0 1.0 21.4 2011 4.0 … … ... 0.0 0.0 0.0 2010 0.0 0.0 0.0 2010 ... ... ... ...
Sierra Leone 100.0 100.0 100.0 2008 77.4 99.0 59.8 2003 92.8 91.5 93.0 2010 95.3 94.7 95.7 2010 89.0 75.4 91.9 2010
Somalia 80.0 … ... 2006 … ... ... ... ... ... ... ... 97.0 94.0 98.6 2006 100.0 50.8 227.6 2006
South Africa 0.0 0.0 0.0 2010 7.4 10.9 1.9 2011 0.0 0.0 0.0 2010 0.0 0.0 0.0 2010 30.0 ... ... ...
South Sudan … … … ... 65.2 … … ... ... ... ... ... ... ... ... ... ... ... ... ...
Sudan 70.3 53.6 78.6 2009 … … … ... 86.6 ... ... ... 71.7 ... ... ... 73.0 ... ... ...
Swaziland 93.8 82.5 97.0 2006 14.1 11.5 14.8 2010 3.7 0.0 17.4 2010 0.0 0.0 0.0 2010 32.0 29.8 37.3 2010
Tanzania, United Republic of 87.0 79.1 89.8 2010 31.9 24.4 34.6 2007 89.3 81.8 90.7 2010 95.0 91.9 96.1 2010 46.0 27.1 53.2 2010
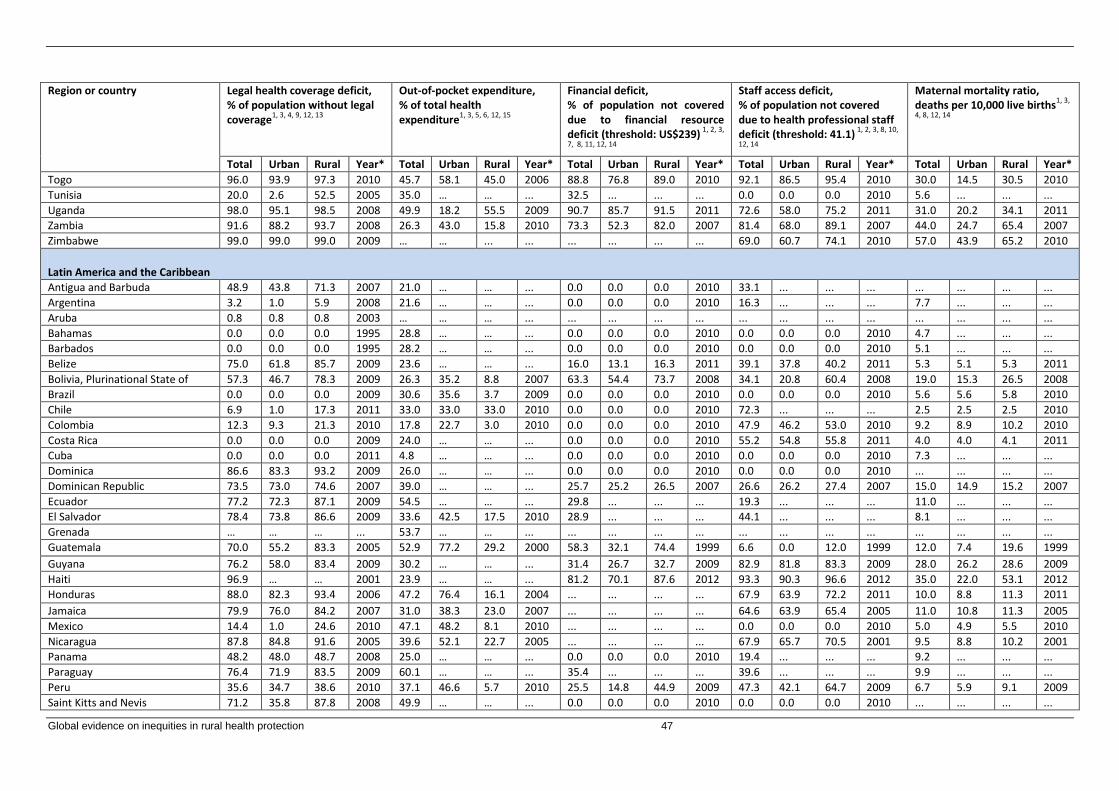
Global evidence on inequities in rural health protection 47
Region or country
Legal health coverage deficit, % of population without legal coverage
1, 3, 4, 9, 12, 13
Out-of-pocket expenditure, % of total health expenditure
1, 3, 5, 6, 12, 15
Financial deficit, % of population not covered due to financial resource deficit (threshold: US$239)
1, 2, 3,
7, 8, 11, 12, 14
Staff access deficit, % of population not covered due to health professional staff deficit (threshold: 41.1)
1, 2, 3, 8, 10,
12, 14
Maternal mortality ratio, deaths per 10,000 live births
1, 3,
4, 8, 12, 14
Total Urban Rural Year* Total Urban Rural Year* Total Urban Rural Year* Total Urban Rural Year* Total Urban Rural Year*
Togo 96.0 93.9 97.3 2010 45.7 58.1 45.0 2006 88.8 76.8 89.0 2010 92.1 86.5 95.4 2010 30.0 14.5 30.5 2010
Tunisia 20.0 2.6 52.5 2005 35.0 … … ... 32.5 ... ... ... 0.0 0.0 0.0 2010 5.6 ... ... ...
Uganda 98.0 95.1 98.5 2008 49.9 18.2 55.5 2009 90.7 85.7 91.5 2011 72.6 58.0 75.2 2011 31.0 20.2 34.1 2011
Zambia 91.6 88.2 93.7 2008 26.3 43.0 15.8 2010 73.3 52.3 82.0 2007 81.4 68.0 89.1 2007 44.0 24.7 65.4 2007
Zimbabwe 99.0 99.0 99.0 2009 … … ... ... ... ... ... ... 69.0 60.7 74.1 2010 57.0 43.9 65.2 2010
Latin America and the Caribbean
Antigua and Barbuda 48.9 43.8 71.3 2007 21.0 … … ... 0.0 0.0 0.0 2010 33.1 ... ... ... ... ... ... ...
Argentina 3.2 1.0 5.9 2008 21.6 … … ... 0.0 0.0 0.0 2010 16.3 ... ... ... 7.7 ... ... ...
Aruba 0.8 0.8 0.8 2003 … … … ... ... ... ... ... ... ... ... ... ... ... ... ...
Bahamas 0.0 0.0 0.0 1995 28.8 … … ... 0.0 0.0 0.0 2010 0.0 0.0 0.0 2010 4.7 ... ... ...
Barbados 0.0 0.0 0.0 1995 28.2 … … ... 0.0 0.0 0.0 2010 0.0 0.0 0.0 2010 5.1 ... ... ...
Belize 75.0 61.8 85.7 2009 23.6 … … ... 16.0 13.1 16.3 2011 39.1 37.8 40.2 2011 5.3 5.1 5.3 2011
Bolivia, Plurinational State of 57.3 46.7 78.3 2009 26.3 35.2 8.8 2007 63.3 54.4 73.7 2008 34.1 20.8 60.4 2008 19.0 15.3 26.5 2008
Brazil 0.0 0.0 0.0 2009 30.6 35.6 3.7 2009 0.0 0.0 0.0 2010 0.0 0.0 0.0 2010 5.6 5.6 5.8 2010
Chile 6.9 1.0 17.3 2011 33.0 33.0 33.0 2010 0.0 0.0 0.0 2010 72.3 ... ... ... 2.5 2.5 2.5 2010
Colombia 12.3 9.3 21.3 2010 17.8 22.7 3.0 2010 0.0 0.0 0.0 2010 47.9 46.2 53.0 2010 9.2 8.9 10.2 2010
Costa Rica 0.0 0.0 0.0 2009 24.0 … … ... 0.0 0.0 0.0 2010 55.2 54.8 55.8 2011 4.0 4.0 4.1 2011
Cuba 0.0 0.0 0.0 2011 4.8 … … ... 0.0 0.0 0.0 2010 0.0 0.0 0.0 2010 7.3 ... ... ...
Dominica 86.6 83.3 93.2 2009 26.0 … … ... 0.0 0.0 0.0 2010 0.0 0.0 0.0 2010 ... ... ... ...
Dominican Republic 73.5 73.0 74.6 2007 39.0 … … ... 25.7 25.2 26.5 2007 26.6 26.2 27.4 2007 15.0 14.9 15.2 2007
Ecuador 77.2 72.3 87.1 2009 54.5 … … ... 29.8 ... ... ... 19.3 ... ... ... 11.0 ... ... ...
El Salvador 78.4 73.8 86.6 2009 33.6 42.5 17.5 2010 28.9 ... ... ... 44.1 ... ... ... 8.1 ... ... ...
Grenada … … … ... 53.7 … … ... ... ... ... ... ... ... ... ... ... ... ... ...
Guatemala 70.0 55.2 83.3 2005 52.9 77.2 29.2 2000 58.3 32.1 74.4 1999 6.6 0.0 12.0 1999 12.0 7.4 19.6 1999
Guyana 76.2 58.0 83.4 2009 30.2 … … ... 31.4 26.7 32.7 2009 82.9 81.8 83.3 2009 28.0 26.2 28.6 2009
Haiti 96.9 … … 2001 23.9 … … ... 81.2 70.1 87.6 2012 93.3 90.3 96.6 2012 35.0 22.0 53.1 2012
Honduras 88.0 82.3 93.4 2006 47.2 76.4 16.1 2004 ... ... ... ... 67.9 63.9 72.2 2011 10.0 8.8 11.3 2011
Jamaica 79.9 76.0 84.2 2007 31.0 38.3 23.0 2007 ... ... ... ... 64.6 63.9 65.4 2005 11.0 10.8 11.3 2005
Mexico 14.4 1.0 24.6 2010 47.1 48.2 8.1 2010 ... ... ... ... 0.0 0.0 0.0 2010 5.0 4.9 5.5 2010
Nicaragua 87.8 84.8 91.6 2005 39.6 52.1 22.7 2005 ... ... ... ... 67.9 65.7 70.5 2001 9.5 8.8 10.2 2001
Panama 48.2 48.0 48.7 2008 25.0 … … ... 0.0 0.0 0.0 2010 19.4 ... ... ... 9.2 ... ... ...
Paraguay 76.4 71.9 83.5 2009 60.1 … … ... 35.4 ... ... ... 39.6 ... ... ... 9.9 ... ... ...
Peru 35.6 34.7 38.6 2010 37.1 46.6 5.7 2010 25.5 14.8 44.9 2009 47.3 42.1 64.7 2009 6.7 5.9 9.1 2009
Saint Kitts and Nevis 71.2 35.8 87.8 2008 49.9 … … ... 0.0 0.0 0.0 2010 0.0 0.0 0.0 2010 ... ... ... ...

48 Global evidence on inequities in rural health protection
Region or country
Legal health coverage deficit, % of population without legal coverage
1, 3, 4, 9, 12, 13
Out-of-pocket expenditure, % of total health expenditure
1, 3, 5, 6, 12, 15
Financial deficit, % of population not covered due to financial resource deficit (threshold: US$239)
1, 2, 3,
7, 8, 11, 12, 14
Staff access deficit, % of population not covered due to health professional staff deficit (threshold: 41.1)
1, 2, 3, 8, 10,
12, 14
Maternal mortality ratio, deaths per 10,000 live births
1, 3,
4, 8, 12, 14
Total Urban Rural Year* Total Urban Rural Year* Total Urban Rural Year* Total Urban Rural Year* Total Urban Rural Year*
Saint Lucia 64.5 17.7 78.5 2003 44.9 … … ... 0.0 0.0 0.0 2010 47.5 ... ... ... 3.5 ... ... ...
Saint Vincent and the Grenadines 90.6 87.9 93.2 2008 18.0 … … ... 0.0 0.0 0.0 2010 0.0 0.0 0.0 2010 4.8 ... ... ...
Suriname … … … ... 13.4 … … ... 0.0 0.0 0.0 2010 0.0 0.0 0.0 2010 13.0 12.1 13.6 2010
Trinidad and Tobago … … … ... 35.5 … … ... 0.0 0.0 0.0 2010 0.0 0.0 0.0 2010 4.6 ... ... ...
Uruguay 2.8 2.2 10.3 2010 17.9 … … ... 0.0 0.0 0.0 2010 0.0 0.0 0.0 2010 2.9 2.9 2.9 2010
Venezuela, Bolivarian Republic of 0.0 0.0 0.0 2010 59.5 … … ... 0.1 ... ... ... 38.3 ... ... ... 9.2 ... ... ...
North America
Canada 0.0 0.0 0.0 2011 14.2 14.2 14.2 2010 0.0 0.0 0.0 2010 0.0 0.0 0.0 2010 1.2 1.2 1.2 2010
United States 16.0 15.0 20.6 2010 11.7 11.7 11.7 2010 0.0 0.0 0.0 2010 0.0 0.0 0.0 2010 2.1 2.1 2.1 2010
Asia
Afghanistan … … … ... 74.3 35.9 86.0 2007 95.2 91.3 96.7 2010 92.3 85.7 94.3 2010 46.0 25.5 67.9 2010
Armenia 0.0 0.0 0.0 2009 55.9 70.2 30.3 2009 74.8 74.7 74.9 2010 0.0 0.0 0.0 2010 3.0 3.0 3.0 2010
Azerbaijan 97.1 96.2 98.0 2006 69.2 80.5 56.2 2008 55.3 51.3 59.3 2006 0.0 0.0 0.0 2010 4.3 3.9 4.7 2006
Bahrain 0.0 0.0 0.0 2006 17.6 … … ... 0.0 0.0 0.0 2010 21.9 ... ... ... 2.0 2.0 2.0 2010
Bangladesh 98.6 97.0 99.2 2003 61.3 30.4 73.3 2010 ... ... ... ... 86.4 77.5 89.9 2011 24.0 15.0 35.0 2011
Bhutan 10.0 1.0 15.2 2009 14.6 14.1 14.8 2007 67.0 49.3 69.3 2010 72.6 61.2 78.7 2010 18.0 11.7 19.3 2010
Brunei Darussalam 0.0 0.0 0.0 2010 7.6 … … ... 0.0 0.0 0.0 2010 0.0 0.0 0.0 2010 2.4 2.4 2.4 2010
Cambodia 73.9 65.7 75.9 2009 61.6 18.7 72.2 2008 90.8 87.7 91.4 2010 75.2 67.3 77.2 2010 25.0 18.7 26.7 2010
China 3.1 1.0 5.1 2010 35.3 55.3 15.9 … 24.1 23.9 24.2 2009 29.0 28.9 29.1 2009 3.7 3.7 3.7 2009
Georgia 75.0 64.4 86.8 2008 69.1 … … ... 54.0 53.7 54.3 2005 0.0 0.0 0.0 2010 6.7 6.7 6.7 2005
Hong Kong (China), Special Administrative Region
0.0 0.0 … 2010 … … … ... ... ... ... ... ... ... ... ... ... ... ... ...
India 87.5 74.9 93.1 2010 61.8 49.8 67.2 2009 90.0 89.0 94.4 2011 62.5 50.5 68.0 2011 20.0 18.1 35.5 2011
Indonesia 41.0 18.4 63.5 2010 47.2 61.2 33.3 2010 80.1 78.0 82.1 2012 61.7 57.7 65.7 2012 22.0 19.9 24.5 2012
Iran, Islamic Republic of 10.0 1.0 19.5 2005 53.6 … … ... 39.8 ... ... ... 49.1 ... ... ... 2.1 2.1 2.1 2010
Iraq … … … ... 26.1 32.7 13.1 2006 0.0 0.0 0.0 2010 52.8 51.2 56.0 2011 6.3 6.1 6.8 2011
Israel 0.0 0.0 0.0 2011 25.0 25.0 25.0 2010 0.0 0.0 0.0 2010 0.0 0.0 0.0 2010 0.7 0.7 0.7 2010
Occupied Palestinian Territory 83.8 … … 2004 … … … ... ... ... ... ... ... ... ... ... ... ... ... ...
Japan 0.0 0.0 0.0 2010 14.4 14.4 14.4 2010 0.0 0.0 0.0 2010 0.0 0.0 0.0 2010 0.5 0.5 0.5 2010
Jordan 25.0 21.7 39.4 2006 25.1 29.8 2.9 2002 0.0 0.0 0.0 2010 0.0 0.0 0.0 2010 6.3 6.3 6.3 2012
Kazakhstan 30.0 6.7 59.3 2001 40.4 56.5 21.8 2003 0.0 0.0 0.0 2010 0.0 0.0 0.0 2010 5.1 5.1 5.1 2010
Korea, Democratic People's Republic
… … … ... … … … ... ... ... ... ... 0.0 0.0 0.0 2010 8.1 ... ... ...

Global evidence on inequities in rural health protection 49
Region or country
Legal health coverage deficit, % of population without legal coverage
1, 3, 4, 9, 12, 13
Out-of-pocket expenditure, % of total health expenditure
1, 3, 5, 6, 12, 15
Financial deficit, % of population not covered due to financial resource deficit (threshold: US$239)
1, 2, 3,
7, 8, 11, 12, 14
Staff access deficit, % of population not covered due to health professional staff deficit (threshold: 41.1)
1, 2, 3, 8, 10,
12, 14
Maternal mortality ratio, deaths per 10,000 live births
1, 3,
4, 8, 12, 14
Total Urban Rural Year* Total Urban Rural Year* Total Urban Rural Year* Total Urban Rural Year* Total Urban Rural Year*
Korea, Republic of 0.0 0.0 0.0 2010 34.2 34.2 34.2 ... 0.0 0.0 0.0 2010 0.0 0.0 0.0 2010 1.6 1.6 1.6 2010
Kuwait 0.0 0.0 0.0 2006 17.5 … … ... 0.0 0.0 0.0 2010 0.0 0.0 0.0 2010 1.4 1.4 1.4 2010
Kyrgyzstan 17.0 7.4 22.2 2001 38.7 29.4 43.7 2010 80.4 80.3 80.4 2012 0.0 0.0 0.0 2010 7.1 7.1 7.1 2012
Lao People's Democratic Republic 88.4 85.2 90.0 2009 41.8 41.4 42.0 2007 90.7 81.5 92.9 2011 76.1 55.8 86.7 2011 47.0 23.7 61.4 2011
Lebanon 51.7 51.6 52.3 2007 44.4 … … ... 0.0 0.0 0.0 2010 0.0 0.0 0.0 2010 2.5 2.5 2.5 2010
Malaysia 0.0 0.0 0.0 2010 32.7 … … ... 15.6 ... ... ... 0.0 0.0 0.0 2010 2.9 2.9 2.9 2010
Maldives 70.0 57.9 78.1 2011 26.1 21.6 29.0 2010 0.0 0.0 0.0 2010 0.0 0.0 0.0 2010 6.0 5.7 6.1 2009
Mongolia 18.1 8.7 37.6 2009 35.2 45.4 14.0 2008 59.5 59.3 59.9 2010 0.0 0.0 0.0 2010 6.3 6.3 6.4 2010
Myanmar … … … ... 76.6 … … ... 98.2 ... ... ... 67.0 ... ... ... 20.0 ... ... ...
Nepal 99.9 99.9 99.9 2010 48.8 14.0 55.8 2010 ... ... ... ... 84.8 70.4 87.7 2011 17.0 8.4 18.9 2011
Oman 3.0 1.0 10.7 2005 10.9 … … ... 0.0 0.0 0.0 2010 0.0 0.0 0.0 2010 3.2 ... ... ...
Pakistan 73.4 56.5 82.8 2009 60.6 42.2 70.9 2010 95.4 93.7 96.1 2012 68.1 57.5 74.0 2012 26.0 19.1 30.5 2012
Philippines 18.0 1.0 35.1 2009 52.5 71.1 34.9 2006 82.2 77.8 86.3 2008 0.0 0.0 0.0 2010 9.9 7.9 12.9 2008
Qatar 0.0 0.0 0.0 2006 16.0 … … ... 0.0 0.0 0.0 2010 0.0 0.0 0.0 2010 0.7 0.7 0.7 2010
Saudi Arabia 74.0 71.5 85.5 2010 20.0 … … ... 0.0 0.0 0.0 2010 31.0 ... ... ... 2.4 2.4 2.4 2010
Singapore 0.0 0.0 … 2010 62.6 … … ... 0.0 0.0 ... 2010 0.0 0.0 ... 2010 0.3 0.3 ... 2010
Sri Lanka 0.0 0.0 0.0 2010 44.8 24.5 80.8 2009 78.2 ... ... ... 41.2 ... ... ... 3.5 ... ... ...
Syrian Arab Republic 10.0 1.0 21.6 2008 54.0 … … ... 79.3 78.3 80.3 2006 23.6 20.1 27.7 2006 7.0 6.7 7.4 2006
Tajikistan 99.7 99.7 99.7 2010 66.5 31.3 79.2 2009 91.0 90.4 91.2 2012 0.0 0.0 0.0 2010 6.5 6.1 6.6 2012
Thailand 2.0 1.0 3.0 2007 14.2 15.3 13.6 2009 27.1 25.5 27.7 2005 57.9 57.0 58.3 2005 4.8 4.7 4.8 2005
Timor-Leste … … … ... 3.7 7.0 2.3 2010 81.4 62.5 86.9 2010 59.1 18.4 74.9 2010 30.0 14.9 42.5 2010
Turkey 14.0 10.8 21.7 2011 16.1 18.3 10.7 2009 0.0 0.0 0.0 2010 3.4 0.0 21.3 2003.0 2.0 2.0 2.0 2010
Turkmenistan 17.7 1.0 34.3 2011 43.7 … … ... 67.2 ... ... ... 0.0 0.0 0.0 2010 6.7 ... ... ...
United Arab Emirates 0.0 0.0 0.0 2010 19.5 … … ... 0.0 0.0 0.0 2010 24.0 ... ... ... 1.2 1.2 1.2 2010
Uzbekistan 0.0 0.0 0.0 2010 45.2 … … ... 79.2 79.2 79.2 2006 0.0 0.0 0.0 2010 2.8 2.8 2.8 2010
Viet Nam 39.0 1.0 56.0 2010 44.8 35.0 49.2 2008 82.4 81.3 82.9 2010 47.7 44.5 49.1 2010 5.9 5.6 6.1 2010
Yemen 58.0 26.8 70.7 2003 73.8 68.0 99.0 2005 91.9 86.0 94.0 2006 78.2 62.7 84.5 2006 20.0 11.6 27.1 2006
Europe
Albania 76.4 70.6 82.8 2008 54.4 59.4 49.0 2008 52.1 51.8 52.2 2009 0.0 0.0 0.0 2010 2.7 2.7 2.7 2010
Andorra … … … ... 19.6 … … ... 0.0 0.0 0.0 2010 0.0 0.0 0.0 2010 ... ... ... ...
Austria 0.7 0.7 0.7 2010 15.2 15.2 15.2 2010 0.0 0.0 0.0 2010 0.0 0.0 0.0 2010 0.4 0.4 0.4 2010
Belarus 0.0 0.0 0.0 2010 19.8 24.6 5.9 2010 5.8 5.9 5.8 2012 0.0 0.0 0.0 2010 0.4 0.4 0.4 2010
Belgium 1.0 1.0 1.0 2010 20.7 20.7 20.7 2010 0.0 0.0 0.0 2010 0.0 0.0 0.0 2010 0.8 0.8 0.8 2010
Bosnia and Herzegovina 40.8 8.5 67.5 2004 28.3 30.0 26.8 2007 0.0 0.0 0.0 2010 0.0 0.0 0.0 2010 0.8 0.8 0.8 2010
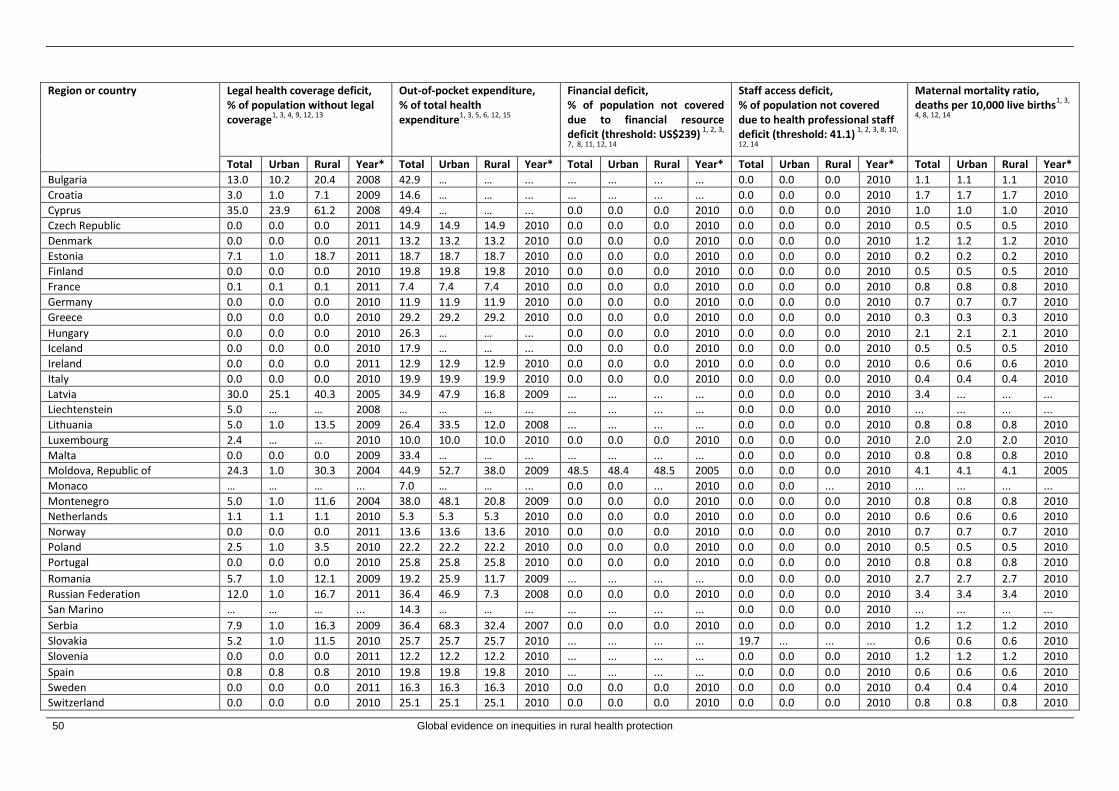
50 Global evidence on inequities in rural health protection
Region or country
Legal health coverage deficit, % of population without legal coverage
1, 3, 4, 9, 12, 13
Out-of-pocket expenditure, % of total health expenditure
1, 3, 5, 6, 12, 15
Financial deficit, % of population not covered due to financial resource deficit (threshold: US$239)
1, 2, 3,
7, 8, 11, 12, 14
Staff access deficit, % of population not covered due to health professional staff deficit (threshold: 41.1)
1, 2, 3, 8, 10,
12, 14
Maternal mortality ratio, deaths per 10,000 live births
1, 3,
4, 8, 12, 14
Total Urban Rural Year* Total Urban Rural Year* Total Urban Rural Year* Total Urban Rural Year* Total Urban Rural Year*
Bulgaria 13.0 10.2 20.4 2008 42.9 … … ... ... ... ... ... 0.0 0.0 0.0 2010 1.1 1.1 1.1 2010
Croatia 3.0 1.0 7.1 2009 14.6 … … ... ... ... ... ... 0.0 0.0 0.0 2010 1.7 1.7 1.7 2010
Cyprus 35.0 23.9 61.2 2008 49.4 … … ... 0.0 0.0 0.0 2010 0.0 0.0 0.0 2010 1.0 1.0 1.0 2010
Czech Republic 0.0 0.0 0.0 2011 14.9 14.9 14.9 2010 0.0 0.0 0.0 2010 0.0 0.0 0.0 2010 0.5 0.5 0.5 2010
Denmark 0.0 0.0 0.0 2011 13.2 13.2 13.2 2010 0.0 0.0 0.0 2010 0.0 0.0 0.0 2010 1.2 1.2 1.2 2010
Estonia 7.1 1.0 18.7 2011 18.7 18.7 18.7 2010 0.0 0.0 0.0 2010 0.0 0.0 0.0 2010 0.2 0.2 0.2 2010
Finland 0.0 0.0 0.0 2010 19.8 19.8 19.8 2010 0.0 0.0 0.0 2010 0.0 0.0 0.0 2010 0.5 0.5 0.5 2010
France 0.1 0.1 0.1 2011 7.4 7.4 7.4 2010 0.0 0.0 0.0 2010 0.0 0.0 0.0 2010 0.8 0.8 0.8 2010
Germany 0.0 0.0 0.0 2010 11.9 11.9 11.9 2010 0.0 0.0 0.0 2010 0.0 0.0 0.0 2010 0.7 0.7 0.7 2010
Greece 0.0 0.0 0.0 2010 29.2 29.2 29.2 2010 0.0 0.0 0.0 2010 0.0 0.0 0.0 2010 0.3 0.3 0.3 2010
Hungary 0.0 0.0 0.0 2010 26.3 … … ... 0.0 0.0 0.0 2010 0.0 0.0 0.0 2010 2.1 2.1 2.1 2010
Iceland 0.0 0.0 0.0 2010 17.9 … … ... 0.0 0.0 0.0 2010 0.0 0.0 0.0 2010 0.5 0.5 0.5 2010
Ireland 0.0 0.0 0.0 2011 12.9 12.9 12.9 2010 0.0 0.0 0.0 2010 0.0 0.0 0.0 2010 0.6 0.6 0.6 2010
Italy 0.0 0.0 0.0 2010 19.9 19.9 19.9 2010 0.0 0.0 0.0 2010 0.0 0.0 0.0 2010 0.4 0.4 0.4 2010
Latvia 30.0 25.1 40.3 2005 34.9 47.9 16.8 2009 ... ... ... ... 0.0 0.0 0.0 2010 3.4 ... ... ...
Liechtenstein 5.0 … … 2008 … … … ... ... ... ... ... 0.0 0.0 0.0 2010 ... ... ... ...
Lithuania 5.0 1.0 13.5 2009 26.4 33.5 12.0 2008 ... ... ... ... 0.0 0.0 0.0 2010 0.8 0.8 0.8 2010
Luxembourg 2.4 … … 2010 10.0 10.0 10.0 2010 0.0 0.0 0.0 2010 0.0 0.0 0.0 2010 2.0 2.0 2.0 2010
Malta 0.0 0.0 0.0 2009 33.4 … … ... ... ... ... ... 0.0 0.0 0.0 2010 0.8 0.8 0.8 2010
Moldova, Republic of 24.3 1.0 30.3 2004 44.9 52.7 38.0 2009 48.5 48.4 48.5 2005 0.0 0.0 0.0 2010 4.1 4.1 4.1 2005
Monaco … … … ... 7.0 … … ... 0.0 0.0 ... 2010 0.0 0.0 ... 2010 ... ... ... ...
Montenegro 5.0 1.0 11.6 2004 38.0 48.1 20.8 2009 0.0 0.0 0.0 2010 0.0 0.0 0.0 2010 0.8 0.8 0.8 2010
Netherlands 1.1 1.1 1.1 2010 5.3 5.3 5.3 2010 0.0 0.0 0.0 2010 0.0 0.0 0.0 2010 0.6 0.6 0.6 2010
Norway 0.0 0.0 0.0 2011 13.6 13.6 13.6 2010 0.0 0.0 0.0 2010 0.0 0.0 0.0 2010 0.7 0.7 0.7 2010
Poland 2.5 1.0 3.5 2010 22.2 22.2 22.2 2010 0.0 0.0 0.0 2010 0.0 0.0 0.0 2010 0.5 0.5 0.5 2010
Portugal 0.0 0.0 0.0 2010 25.8 25.8 25.8 2010 0.0 0.0 0.0 2010 0.0 0.0 0.0 2010 0.8 0.8 0.8 2010
Romania 5.7 1.0 12.1 2009 19.2 25.9 11.7 2009 ... ... ... ... 0.0 0.0 0.0 2010 2.7 2.7 2.7 2010
Russian Federation 12.0 1.0 16.7 2011 36.4 46.9 7.3 2008 0.0 0.0 0.0 2010 0.0 0.0 0.0 2010 3.4 3.4 3.4 2010
San Marino … … … ... 14.3 … … ... ... ... ... ... 0.0 0.0 0.0 2010 ... ... ... ...
Serbia 7.9 1.0 16.3 2009 36.4 68.3 32.4 2007 0.0 0.0 0.0 2010 0.0 0.0 0.0 2010 1.2 1.2 1.2 2010
Slovakia 5.2 1.0 11.5 2010 25.7 25.7 25.7 2010 ... ... ... ... 19.7 ... ... ... 0.6 0.6 0.6 2010
Slovenia 0.0 0.0 0.0 2011 12.2 12.2 12.2 2010 ... ... ... ... 0.0 0.0 0.0 2010 1.2 1.2 1.2 2010
Spain 0.8 0.8 0.8 2010 19.8 19.8 19.8 2010 ... ... ... ... 0.0 0.0 0.0 2010 0.6 0.6 0.6 2010
Sweden 0.0 0.0 0.0 2011 16.3 16.3 16.3 2010 0.0 0.0 0.0 2010 0.0 0.0 0.0 2010 0.4 0.4 0.4 2010
Switzerland 0.0 0.0 0.0 2010 25.1 25.1 25.1 2010 0.0 0.0 0.0 2010 0.0 0.0 0.0 2010 0.8 0.8 0.8 2010

Global evidence on inequities in rural health protection 51
Region or country
Legal health coverage deficit, % of population without legal coverage
1, 3, 4, 9, 12, 13
Out-of-pocket expenditure, % of total health expenditure
1, 3, 5, 6, 12, 15
Financial deficit, % of population not covered due to financial resource deficit (threshold: US$239)
1, 2, 3,
7, 8, 11, 12, 14
Staff access deficit, % of population not covered due to health professional staff deficit (threshold: 41.1)
1, 2, 3, 8, 10,
12, 14
Maternal mortality ratio, deaths per 10,000 live births
1, 3,
4, 8, 12, 14
Total Urban Rural Year* Total Urban Rural Year* Total Urban Rural Year* Total Urban Rural Year* Total Urban Rural Year*
The Former Yugoslav Republic of Macedonia
5.1 1.0 12.5 2006 36.2 42.3 27.3 2003 13.8 13.8 13.8 2011 0.0 0.0 0.0 2010 1.0 1.0 1.0 2010
Ukraine 0.0 0.0 0.0 2011 40.5 50.2 19.3 2010 35.0 34.7 35.4 2007 0.0 0.0 0.0 2010 3.2 ... ... ...
United Kingdom 0.0 0.0 0.0 2010 9.4 9.4 9.4 2010 0.0 0.0 0.0 2010 0.0 0.0 0.0 2010 1.2 1.2 1.2 2010
Oceania
Australia 0.0 0.0 0.0 2011 19.3 19.3 19.3 2010 0.0 0.0 0.0 2010 0.0 0.0 0.0 2010 0.7 0.7 0.7 2010
Cook Islands … … … ... 5.8 … … ... 0.0 0.0 0.0 2010 0.0 0.0 0.0 2010 ... ... ... ...
Fiji 0.0 0.0 0.0 2010 19.7 26.6 12.2 2002 44.5 ... ... ... 35.2 ... ... ... 2.6 2.6 2.6 2010
Kiribati … … … ... … … … ... 26.9 ... ... ... 0.0 0.0 0.0 2010 ... ... ... ...
Marshall Islands … … … ... 12.8 … … ... 0.0 0.0 0.0 2010 26.4 ... ... ... ... ... ... ...
Micronesia … … … ... 8.7 … … ... 0.0 0.0 0.0 2010 7.1 ... ... ... 10.0 ... ... ...
Nauru … … … ... 5.8 … … ... 0.0 0.0 ... 2010 0.0 0.0 ... 2010 ... ... ... ...
New Zealand 0.0 0.0 0.0 2011 10.5 10.5 10.5 2010 0.0 0.0 0.0 2010 0.0 0.0 0.0 2010 1.5 1.5 1.5 2010
Niue ... ... ... ... … … … ... 0.0 0.0 0.0 2010 0.0 0.0 0.0 2010 ... ... ... ...
Palau ... ... ... ... 11.1 … … ... 0.0 0.0 0.0 2010 0.0 0.0 0.0 2010 ... ... ... ...
Papua New Guinea ... ... ... ... 13.8 4.9 15.1 2009 70.9 ... ... ... 89.2 ... ... ... 23.0 ... ... ...
Solomon Islands ... ... ... ... 3.2 … … ... 45.6 ... ... ... 47.0 ... ... ... 11.0 ... ... ...
Tonga ... ... ... ... 12.7 … … ... 18.5 ... ... ... 0.0 0.0 0.0 2010 11.0 ... ... ...
Tuvalu ... ... ... ... … … … ... ... ... ... ... 0.0 0.0 0.0 2010 ... ... ... ...
Vanuatu 0.0 0.0 0.0 2010 6.0 … … ... 48.0 39.0 49.7 2007 60.1 53.7 62.0 2007 11.0 9.4 11.4 2007
Western Samoa … … … ... 7.9 … … ... 3.4 ... ... ... 43.6 ... ... ... 10.0 ... ... ...
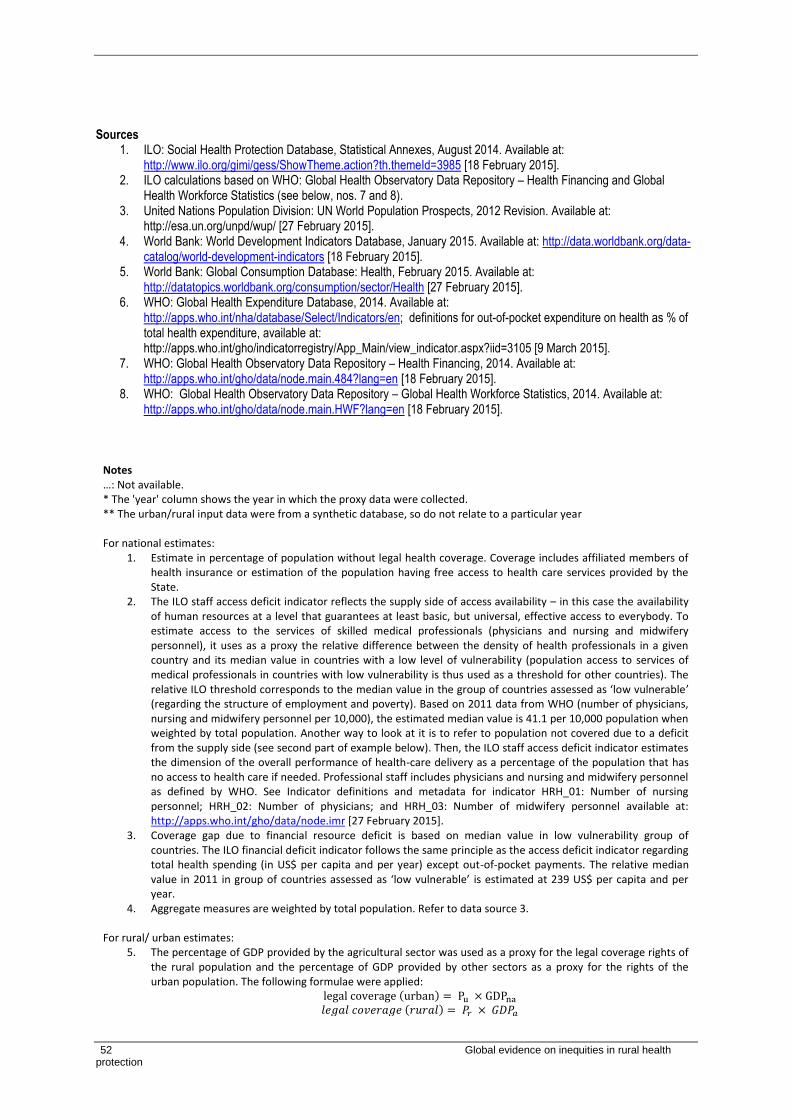
52 Global evidence on inequities in rural health protection
Sources 1. ILO: Social Health Protection Database, Statistical Annexes, August 2014. Available at:
http://www.ilo.org/gimi/gess/ShowTheme.action?th.themeId=3985 [18 February 2015]. 2. ILO calculations based on WHO: Global Health Observatory Data Repository – Health Financing and Global
Health Workforce Statistics (see below, nos. 7 and 8). 3. United Nations Population Division: UN World Population Prospects, 2012 Revision. Available at:
http://esa.un.org/unpd/wup/ [27 February 2015]. 4. World Bank: World Development Indicators Database, January 2015. Available at: http://data.worldbank.org/data-
catalog/world-development-indicators [18 February 2015]. 5. World Bank: Global Consumption Database: Health, February 2015. Available at:
http://datatopics.worldbank.org/consumption/sector/Health [27 February 2015]. 6. WHO: Global Health Expenditure Database, 2014. Available at:
http://apps.who.int/nha/database/Select/Indicators/en; definitions for out-of-pocket expenditure on health as % of total health expenditure, available at: http://apps.who.int/gho/indicatorregistry/App_Main/view_indicator.aspx?iid=3105 [9 March 2015].
7. WHO: Global Health Observatory Data Repository – Health Financing, 2014. Available at: http://apps.who.int/gho/data/node.main.484?lang=en [18 February 2015].
8. WHO: Global Health Observatory Data Repository – Global Health Workforce Statistics, 2014. Available at: http://apps.who.int/gho/data/node.main.HWF?lang=en [18 February 2015].
Notes …: Not available. * The 'year' column shows the year in which the proxy data were collected. ** The urban/rural input data were from a synthetic database, so do not relate to a particular year For national estimates:
1. Estimate in percentage of population without legal health coverage. Coverage includes affiliated members of health insurance or estimation of the population having free access to health care services provided by the State.
2. The ILO staff access deficit indicator reflects the supply side of access availability – in this case the availability of human resources at a level that guarantees at least basic, but universal, effective access to everybody. To estimate access to the services of skilled medical professionals (physicians and nursing and midwifery personnel), it uses as a proxy the relative difference between the density of health professionals in a given country and its median value in countries with a low level of vulnerability (population access to services of medical professionals in countries with low vulnerability is thus used as a threshold for other countries). The relative ILO threshold corresponds to the median value in the group of countries assessed as ‘low vulnerable’ (regarding the structure of employment and poverty). Based on 2011 data from WHO (number of physicians, nursing and midwifery personnel per 10,000), the estimated median value is 41.1 per 10,000 population when weighted by total population. Another way to look at it is to refer to population not covered due to a deficit from the supply side (see second part of example below). Then, the ILO staff access deficit indicator estimates the dimension of the overall performance of health-care delivery as a percentage of the population that has no access to health care if needed. Professional staff includes physicians and nursing and midwifery personnel as defined by WHO. See Indicator definitions and metadata for indicator HRH_01: Number of nursing personnel; HRH_02: Number of physicians; and HRH_03: Number of midwifery personnel available at: http://apps.who.int/gho/data/node.imr [27 February 2015].
3. Coverage gap due to financial resource deficit is based on median value in low vulnerability group of countries. The ILO financial deficit indicator follows the same principle as the access deficit indicator regarding total health spending (in US$ per capita and per year) except out-of-pocket payments. The relative median value in 2011 in group of countries assessed as ‘low vulnerable’ is estimated at 239 US$ per capita and per year.
4. Aggregate measures are weighted by total population. Refer to data source 3. For rural/ urban estimates:
5. The percentage of GDP provided by the agricultural sector was used as a proxy for the legal coverage rights of the rural population and the percentage of GDP provided by other sectors as a proxy for the rights of the urban population. The following formulae were applied:
( ) ( )
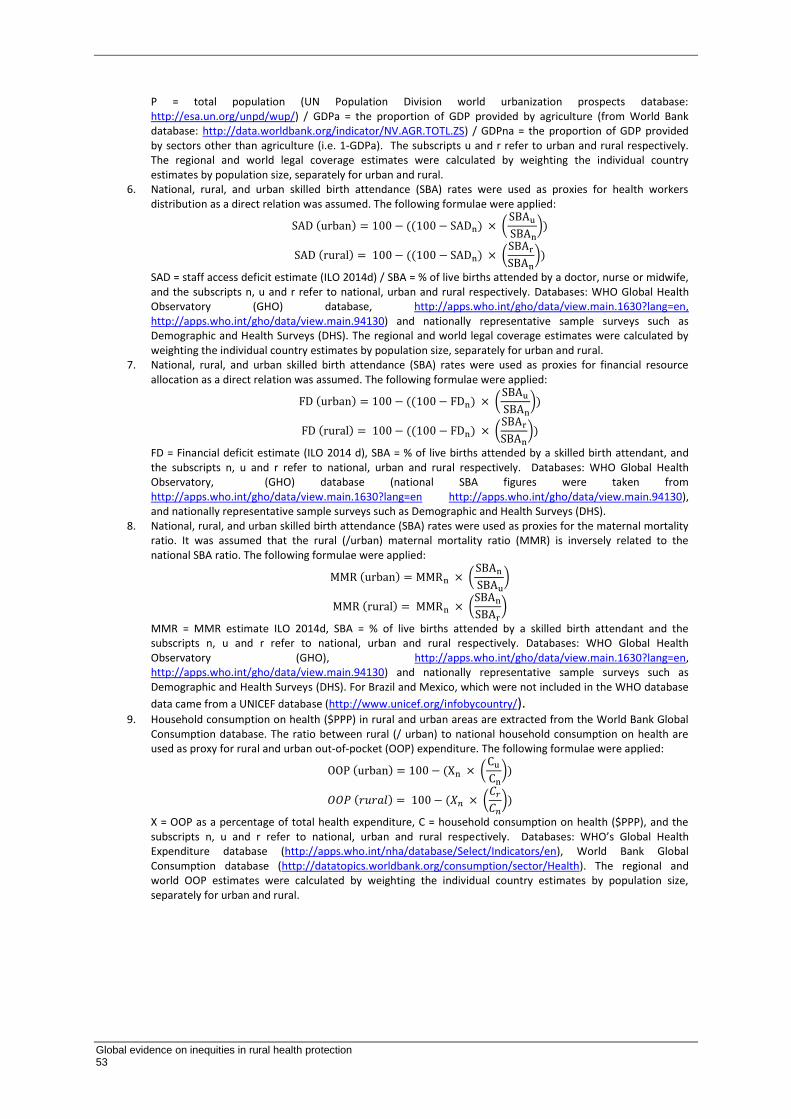
Global evidence on inequities in rural health protection
53
P = total population (UN Population Division world urbanization prospects database: http://esa.un.org/unpd/wup/) / GDPa = the proportion of GDP provided by agriculture (from World Bank database: http://data.worldbank.org/indicator/NV.AGR.TOTL.ZS) / GDPna = the proportion of GDP provided by sectors other than agriculture (i.e. 1-GDPa). The subscripts u and r refer to urban and rural respectively. The regional and world legal coverage estimates were calculated by weighting the individual country estimates by population size, separately for urban and rural.
6. National, rural, and urban skilled birth attendance (SBA) rates were used as proxies for health workers distribution as a direct relation was assumed. The following formulae were applied:
( ) (( ) (
))
( ) (( ) (
))
SAD = staff access deficit estimate (ILO 2014d) / SBA = % of live births attended by a doctor, nurse or midwife, and the subscripts n, u and r refer to national, urban and rural respectively. Databases: WHO Global Health Observatory (GHO) database, http://apps.who.int/gho/data/view.main.1630?lang=en, http://apps.who.int/gho/data/view.main.94130) and nationally representative sample surveys such as Demographic and Health Surveys (DHS). The regional and world legal coverage estimates were calculated by weighting the individual country estimates by population size, separately for urban and rural.
7. National, rural, and urban skilled birth attendance (SBA) rates were used as proxies for financial resource allocation as a direct relation was assumed. The following formulae were applied:
( ) (( ) (
))
( ) (( ) (
))
FD = Financial deficit estimate (ILO 2014 d), SBA = % of live births attended by a skilled birth attendant, and the subscripts n, u and r refer to national, urban and rural respectively. Databases: WHO Global Health Observatory, (GHO) database (national SBA figures were taken from http://apps.who.int/gho/data/view.main.1630?lang=en http://apps.who.int/gho/data/view.main.94130), and nationally representative sample surveys such as Demographic and Health Surveys (DHS).
8. National, rural, and urban skilled birth attendance (SBA) rates were used as proxies for the maternal mortality ratio. It was assumed that the rural (/urban) maternal mortality ratio (MMR) is inversely related to the national SBA ratio. The following formulae were applied:
( ) (
)
( ) (
)
MMR = MMR estimate ILO 2014d, SBA = % of live births attended by a skilled birth attendant and the subscripts n, u and r refer to national, urban and rural respectively. Databases: WHO Global Health Observatory (GHO), http://apps.who.int/gho/data/view.main.1630?lang=en, http://apps.who.int/gho/data/view.main.94130) and nationally representative sample surveys such as Demographic and Health Surveys (DHS). For Brazil and Mexico, which were not included in the WHO database
data came from a UNICEF database (http://www.unicef.org/infobycountry/). 9. Household consumption on health ($PPP) in rural and urban areas are extracted from the World Bank Global
Consumption database. The ratio between rural (/ urban) to national household consumption on health are used as proxy for rural and urban out-of-pocket (OOP) expenditure. The following formulae were applied:
( ) ( ( ))
( ) ( ( ))
X = OOP as a percentage of total health expenditure, C = household consumption on health ($PPP), and the subscripts n, u and r refer to national, urban and rural respectively. Databases: WHO’s Global Health Expenditure database (http://apps.who.int/nha/database/Select/Indicators/en), World Bank Global Consumption database (http://datatopics.worldbank.org/consumption/sector/Health). The regional and world OOP estimates were calculated by weighting the individual country estimates by population size, separately for urban and rural.

54 Global evidence on inequities in rural health protection
Global evidence on inequities in rural health protection
55
Bibliography
Bellows, N.; Bellows, B.; Warren, C. 2011. “The use of vouchers for reproductive health services in
developing countries: Systematic review”, in Tropical Medicine & International Health, Vol.
16, No. 1, pp. 84–96.
Bosch, M.; Cobacho, M. B.; Pagés, C. 2012. Taking stock of eight years of implementation of Seguro
Popular in Mexico. Mimeographed document (Washington, Inter-American Development
Bank). Available at:
http://siteresources.worldbank.org/EXTLACOFFICEOFCE/Resources/870892-
1265238560114/CPagesPaper.pdf [16 March 2015]
Brinkerhoff, D. 2003. Accountability and health systems: Overview, framework, and strategies
(Bethesda, MD, Partners for Health Reformplus).
Department for International Development (DFID) Policy Division. 2011. Cash transfers: Evidence
paper (London).
Ferrinho, P.; Siziya, S.; Goma, F.; Dussault, G. 2011. “The human resource for health situation in
Zambia: Deficit and maldistribution”, in Human Resources for Health, Vol. 9, No. 30.
Government of India. 2014. NRHM Framework for Implementation. Available at:
http://nrhm.gov.in/nhm/nrhm/nrhm-framework-for-implementation.html [17 Dec. 2014].
Gwatkin, D. R.; Bhuiya, A.; Victora, C. G. 2004. “Making health systems more equitable”, in The
Lancet, Vol. 9441, pp. 1273–1280.
Health Metrics Network (HMN); World Health Organization (WHO). 2011. Country Health
Information Systems: A review of the current situation and trends (Geneva).
Henderson, L.N.; Tulloch, J. 2008. “Incentives for retaining and motivating health workers in Pacific
and Asian countries”, in Human Resources for Health, Vol. 6, No. 18, pp. 1−20.
International Fund for Agricultural Development (IFAD). 2011. Rural Poverty Report 2011 (Rome).
Available at: http://www.ifad.org/rpr2011/report/e/rpr2011.pdf [9 March 2015].
International Labour Office (ILO). 2008. Promotion of rural employment for poverty reduction,
Report IV, International Labour Conference, 97th Session, Geneva, 2008 (Geneva). Available
at:
http://www.ilo.org/wcmsp5/groups/public/@ed_norm/@relconf/documents/meetingdocument/
wcms_091721.pdf [9 March 2015].
—. 2010. World Social Security Report 2010−2011: Providing coverage in times of crisis and beyond
(Geneva).
—. 2011a. Supporting rural development through social protection floors, Rural Policy Briefs, Rural
Development through Decent Work (Geneva). Available at:
http://www.ilo.org/employment/units/rural-development/WCMS_165995/lang--en/index.htm [9
March 2015].
56 Global evidence on inequities in rural health protection
—. 2011b. Unleashing rural development through employment and decent work: A pressing need and
timely investment (Geneva). Available at: http://www.ilo.org/wcmsp5/groups/public/---
ed_emp/documents/publication/wcms_158583.pdf [23 Jan. 2015].
—. 2012a. Social Protection Floors Recommendation, 2012 (No. 202). Available at:
http://www.ilo.org/dyn/normlex/en/f?p=NORMLEXPUB:12100:0::NO::P12100_INSTRUME
NT_ID:3065524 [11 June 2014].
—. 2012b. Women and men in the informal economy – Statistical picture, Laborsta Internet
(Geneva). Available at: http://laborsta.ilo.org/informal_economy_E.html [17 March 2015].
—. 2014a. World Social Protection Report 2014/15: Building economic recovery, inclusive
development and social justice (Geneva). Available at:
http://www.ilo.org/global/research/global-reports/world-social-security-
report/2014/WCMS_245201/lang--en/index.htm [9 March 2015].
—. 2014b. Universal health protection: Progress to date and the way forward, Social Protection
Policy Paper No. 10 (Geneva). Available at: http://www.ilo.org/wcmsp5/groups/public/---
ed_protect/---soc_sec/documents/publication/wcms_305947.pdf [9 March 2015].
—. 2014c. Addressing the global health crisis: Universal health protection policies. Social Protection
Policy Paper, No. 13 (Geneva) Available at: http://www.ilo.org/wcmsp5/groups/public/---
ed_protect/---soc_sec/documents/publication/wcms_325647.pdf [9 March 2015].
Kakade, D. 2012. “Community-based monitoring as an accountability tool: Influence on rural health
services in Maharashtra, India”, in BMC Proceedings, Vol. 6, Suppl. 1. Available at:
http://www.biomedcentral.com/1753-6561/6/S1/O9.
Knaul, F. M.; González-Pier, E.; Gómez-Dantés, O.; García-Junco, D.; Arreola-Ornelas, M.; Barraza-
Lloréns, R. S.; Caballero, F.; Hernández-Avila, M.; Juan, M.; Kershenobich, D.; Nigenda, G.;
Ruelas, E.; Sepúlveda, J. 2012. “The quest for universal health coverage: Achieving social
protection for all in Mexico”, in The Lancet, Vol. 380, No. 9849, pp. 1259−1279. Available at:
http://www.thelancet.com/pdfs/journals/lancet/PIIS0140-6736(12)61068-X.pdf [13 March
2015].
Kombe, G.; Fleisher, L.; Kariisa, E.; Arur, A.; Sanjana, P.; Paina, L.; Dare, L.; Abubakar, A.; Baba,
S.; Ubok-Udom, E.; Unom, S. 2009. Nigeria health system assessment 2008 (Bethesda, MD,
Abt Associates)
Masiye, F.; Chitah, B.M.; Chanda, P.; Simeo, F. 2008. Removal of user fees at primary health care
facilities in Zambia: A study of the effects on utilisation and quality of care, Equinet Discussion
Paper No. 57, Harare, Zimbabwe. Available at:
http://www.equinetafrica.org/bibl/docs/Dis57FINchitah.pdf [30 Oct. 2014].
Ministry of Health for Cambodia; WHO Cambodia; Western Pacific Regional Office. 2008.
Cambodia Strategic Framework for Health Financing 2008−2015 (Geneva, WHO).
Mirelman, A.; Mentzakis, E.; Kinter, E.; Paolucci, F.; Fordham, R.; Ozawa, S.; Ferraz, M.;
Baultussen, R.; Niessen, L. W. 2012. “Decision-making criteria among national policymakers
in five countries: A discrete choice experiment eliciting relative preferences for equity and
efficiency”, in Value Health, Vol. 15, No. 3, pp. 534–539.
Global evidence on inequities in rural health protection
57
Montagu, D. 2002. “Franchising of health services in developing countries”, in Health Policy and
Planning, Vol. 17, No. 2, pp. 120−130.
Opwora, A.; Kabare, M.; Molyneux, S.; Goodman, C. 2010. “Direct facility funding as a response to
user fee reduction: Implementation and perceived impact among Kenyan health centres and
dispensaries”, in Health Policy and Planning, Vol. 25, pp. 406–408.
Salinas, J.; Al Snih, S.; Markides, K.; Ray, L.: Angel, R. 2010. “The rural–urban divide: Health
services utilization among older Mexicans in Mexico”, in The Journal of Rural Health, Vol. 26,
No. 4, pp. 333−341.
Scheil-Adlung, X.; Bonnet, F.; Wiechers, T.; Ayangbayi, T. 2010. New approaches to measuring
deficits in social health protection coverage in vulnerable countries, Background Paper No. 56
for the World Health Report 2010 (Geneva, WHO).
United Nations (UN). 2012. Resolution on Universal Health Coverage A /67/L.36, adopted 12
December 2012.
United Nations Population Division. 2014. World Urbanization Prospects: The 2014 revision,
Department of Economic and Social Affairs. Available at: http://esa.un.org/unpd/wup/ [21 Jan.
2015].
Van Rensburg, H. 2014. “South Africa’s protracted struggle for equal distribution and equitable
access – still not there”, in Human Resources for Health, Vol. 12, No. 26, pp. 1−16.
Witter, S.; Toonen, J.; Meessen, B.; Kagubare, J.; Fritsche, G.; Vaughan, K. 2013. “Performance-
based financing as a health system reform: Mapping the key dimensions for monitoring and
evaluation”, in BMC Health Services Research, Vol. 13, No. 367, pp. 1−10.
World Bank. 2013. Global Monitoring Report 2013: Rural−urban dynamics and the Millennium
Development Goals (Washington, DC).
World Health Organization (WHO). 2010. Increasing access to health workers in remote and rural
areas through improved retention: Global policy recommendations (Geneva).
─. 2011. Sustainable health financing structures and universal coverage, Resolution No. WHA64.9
adopted by the 64th World Health Assembly, Geneva, Switzerland, 24 May 2011. Available at:
http://apps.who.int/gb/ebwha/pdf_files/WHA64/A64_R9-en.pdf.
Youngkong, S.; Kapiriri, L.; Baltussen, R. 2009. “Setting priorities for health interventions in
developing countries: A review of empirical studies”, in Tropical Medicine & International
Health, Vol. 14, No. 8, pp. 930–939.
Relevant international databases
ILO Social Health Protection Database, Statistical Annexes, August 2014. Available at:
http://www.ilo.org/gimi/gess/ShowTheme.action?th.themeId=3985 [18 Feb. 2015].

58 Global evidence on inequities in rural health protection
United Nations Population Division, UN World Population Prospects, 2012 Revision. Available at:
http://esa.un.org/unpd/wup/ [27 Feb. 2015].
World Bank. Global Consumption Database: Health, February. 2015. Available at:
http://datatopics.worldbank.org/consumption/sector/Health [27 Feb. 2014].
World Bank. 2015. World Development Indicators Database, January 2015. Available at:
http://data.worldbank.org/data-catalog/world-development-indicators [18 Feb. 2015].
World Health Organization, Global Health Observatory Data Repository – Health Financing, 2014.
Available at: http://apps.who.int/gho/data/node.main.484?lang=en [18 Feb. 2015].
World Health Organization, Global Health Observatory Data Repository – Global Health Workforce
Statistics, 2014. Available at: http://apps.who.int/gho/data/node.main.HWF?lang=en [18 Feb.
2015].
World Health Organization, Global Health Expenditure Database, 2014. Available at:
http://apps.who.int/nha/database/Select/Indicators/en; see also definitions for out-of-pocket
expenditure on health as % of total health expenditure, available at:
http://apps.who.int/gho/indicatorregistry/App_Main/view_indicator.aspx?iid=3105 [9 March
2015].
Global evidence on inequities in rural health protection
59
Further reading
Agency for Healthcare Research and Quality. 2011. Emergency room services: Mean
and median expenses per person with expense and distribution of expenses by
source of payment: United States, 2011, Medical Expenditure Panel Survey
Household Component Data (Rockville, MD). Generated interactively [9 March
2015]
Aragón, T.; Dalnoki-Veress, F.; Shiu, K.; Chawla, C.; Louie, J.; Wagner, G.; Garcia, B.
A. 2012. “Deriving criteria weights for health decision making: A brief tutorial”.
Available at:
http://www.academia.edu/741169/Deriving_Criteria_Weights_for_Health_Decis
ion_Making_A_Brief_Tutorial [9 Jan. 2015].
Asthana, S.; Gibson, A. 2008. Health care equity, health equity and resource allocation:
Towards a normative approach to achieving the core principles of the NHS.
Available at: http://www.radstats.org.uk/no096/AsthanaGibson96.pdf [15 Dec.
2014].
Averting Maternal Death and Disability (AMDD). 2014. AMDD needs assessment toolkit
(New York, Columbia University). Available at:
http://www.amddprogram.org/content/emoc-needs-assessments [28 Nov. 2014].
Badr, E.; Mohamed, N. A.; Afzal, M. M.; Bile, K. M. 2013. “Strengthening human
resources for health through information, coordination and accountability
mechanisms: The case of the Sudan”, in Bulletin of the World Health
Organization, Vol. 91, pp. 868–873.
Baltussen, R.; Mikkelsen, E.; Tromp, N.; Hurtig, A. K.; Byskov, J.; Olsen, Ø.; Bærøe,
K., Hontelez, J. A.; Singh, J.; Norheim, O. F. 2013. “Balancing efficiency, equity
and feasibility of HIV treatment in South Africa: Development of programmatic
guidance”, in Cost Effectiveness and Resource Allocation, Vol. 11, No. 26, pp.
1−9.
Baltussen, R.; Youngkong, S.; Paolucci, F.; Niessen, L. 2010. “Multi-criteria decision
analysis to prioritize health interventions: Capitalizing on first experiences”, in
Health Policy, Vol. 96, No. 3, pp. 262−264.
Bodham-Whetham, L. 2014. Quality of Institutional Care (QuIC), powerpoint presented
at Mamaye evidence for action. Available at:
http://performancebasedfinancing.files.wordpress.com/2014/04/quic-quality-of-
institutional-care.pdf [15 Dec. 2014].
Callaghan, M.; Ford, N.; Schneider, H. 2010. “A systematic review of task-shifting for
HIV treatment and care in Africa”, in Human Resources for Health, Vol. 8, No.
8, pp. 1−9.

60 Global evidence on inequities in rural health protection
Center for Health Market Innovations. 2014. Chipatala Cha Pa Foni. Available at:
http://healthmarketinnovations.org/program/chipatala-cha-pa-foni [28 Nov.
2011].
Countdown to 2015; Health Metrics Network (HMN); United Nations Children’s Fund
(UNICEF); World Health Organization (WHO). 2011. Monitoring maternal,
newborn and child health: Understanding key progress indicators (Geneva).
Devlin, N.; Sussex, J. 2011. Incorporating multiple criteria in HTA: Methods and
processes (London, Office of Health Economics).
Ebener, S.; Guerra-Arias, M.; Campbell, J.; Tatem, A. J.; Moran, A., Johnson, F. A.;
Fogstad, H; Stenberg, K.; Neal, S.; Bailey, P.; Porter, R.; Matthews, Z. 2013.
“Examples of work in progress on mapping for MNH”, table 2 in The geography
of maternal and newborn health: The state of the art. Available at:
http://integrare.es/wp-content/uploads/2013/11/Geography_MNH_Table2.pdf
[15 Dec. 2014].
Escuela Latinamericana de Medicina (ELAM). 2014. Historia de la ELAM (Havana).
Available at: http://instituciones.sld.cu/elam/historia-de-la-elam/ [20 Nov. 2014].
Evans, D. B.; Hsu, J.; Boerma, T. 2013. “Universal health coverage and universal
access”, in Bulletin of the World Health Organization, Vol. 91, pp. 546–546A.
Fitzherbert, A. 2000. FAO Country Pasture/ Forage Resource Profiles: Kyrgyzstan
(Rome). Available at:
http://www.fao.org/ag/AGP/AGPC/doc/counprof/kyrgi.htm#1.5 [24 March
2015].
Frehywot, S.; Vovides, Y.; Talib, Z.; Mikhail, N.; Ross, H.; Wohltjen, H.; Bedada, S.;
Korhumel, K.; Koumare, A. K.; Scott, J. 2013. “E-learning in medical education
in resource constrained low- and middle-income countries”, in Human Resources
for Health, Vol. 11, No. 4, pp. 1−15.
Geodata Institute. 2014. WorldPop. Available at: http://www.worldpop.org.uk/ [15 Dec.
2014].
Giuffrida, A.; Jakab, M.; Dale, E. M. 2011. Toward universal coverage in health: The
case of the state guaranteed benefit package of the Kyrgyz Republic, Universal
Health Coverage Studies Series (UNICO) No. 17 (Washington, DC, World
Bank). Available at: http://www-
wds.worldbank.org/external/default/WDSContentServer/WDSP/IB/2013/02/01/0
00333037_20130201153449/Rendered/PDF/750060NWP0Box30l0Coverage0in
0Health.pdf [20 March 2015].
Global Health Workforce Alliance (GHWA); World Health Organization (WHO). 2013.
A universal truth: No health without a workforce (Geneva).
Government of India. 2013. Janani Suraksha Yojana: Background (New Delhi).
Available at: http://nrhm.gov.in/nrhm-components/rmnch-a/maternal-
health/janani-suraksha-yojana/background.html [9 Jan. 2015].
Global evidence on inequities in rural health protection
61
Harvey, S. A.; Blandon, Y. C. W.; McCaw-Binns, A.; Sandino, I.; Urbina, L.; Rodriguez,
C.; Gómez, I.; Ayabaca, P.; Djibrina, S.; Nicaraguan Maternal and Neonatal
Health Quality Improvement Group. 2007. “Are skilled birth attendants really
skilled? A measurement method, some disturbing results and a potential way
forward”, in Bulletin of the World Health Organization, Vol. 85, No. 10, pp.
783–790.
Hazarika, I. 2013. “Health workforce in India: Assessment of availability, production and
distribution”, in WHO South-East Asia Journal of Public Health, Vol. 2, No. 2,
pp. 106–112.
Health Information Systems Programme (dhis2). 2014. Collect, manage, visualize and
explore your data. Available at: https://www.dhis2.org/ [15 Dec. 2014].
Health Metrics Network (HMN). 2014. The Health Metrics Network Framework
(Geneva). Available at:
http://www.who.int/healthmetrics/documents/framework/en/ [15 Dec. 2014].
Hernandez, P.; Drager, S.; Evans, D. B.; Edejer, T. T. T.; Dal Poz, M. R. 2006.
Measuring expenditure for the health workforce: Evidence and challenges,
Background Paper prepared for the World Health Report 2006 (Geneva, WHO).
Heyen-Perschon, J.; Hertel, C.; Holst, G. 2008. Healthcare and transport in Africa:
Facts and main findings from the ITDP Healthcare Projects in Africa 2003–2007
(Hamburg, European Section of the Institute for Transportation and
Development Policy).
Homer, C. S.; Friberg, I. K.; Bastos Dias, M. A.; Hoope-Bender, P. T.; Sandall, J.;
Speciale, A. M.; Bartlett, L. A. 2014. “The projected impact of scaling up
midwifery”, in The Lancet, Vol. 384, No. 9948, pp.1146–1157.
Hussein, J.; Bell, J.; Dar lang, M.; Mesko, N.; Amery, J.; Graham, W. 2011. “An
appraisal of the maternal mortality decline in Nepal”, in PLoS One, Vol. 6, No.
5, pp. 1−10.
Ibraimova, A.; Akkazieva, B.; Ibraimov, A.; Manzhieva, E.; Rechel, B. 2011.
“Kyrgyzstan health system review”, in Health Systems in Transition, Vol. 13, No
3. Available at:
http://www.euro.who.int/__data/assets/pdf_file/0017/142613/e95045.pdf [20
March 2015].
International Labour Office (ILO). 2008. Can low-income countries afford basic social
security?, Social Security Policy Briefings (Geneva). Available at:
http://www.ilo.org/gimi/gess/ShowRessource.action?ressource.ressourceId=5951
[24 March 2015].
—. 2008. Social health protection: An ILO strategy towards universal access to health
care, Social Security Policy Briefings No. 1 (Geneva). Available at:
http://www.ilo.org/wcmsp5/groups/public/---ed_protect/---
soc_sec/documents/publication/wcms_secsoc_5956.pdf [9 March 2015].

62 Global evidence on inequities in rural health protection
—. 2009. Protecting people, promoting jobs: A survey of country employment and social
protection policy responses to the global economic crisis in 54 countries, ILO
report to the G20 Leaders’ Summit, Pittsburgh, 24–25 Sep. (Geneva).
—. 2010. Extending social security to all: A guide through challenges and options
(Geneva). Available at:
http://www.ilo.org/global/publications/ilobookstore/order-
online/books/WCMS_146616/lang--en/index.htm [24 March 2015].
—. 2010. Maternity at work: A review of national legislation. 2nd ed. (Geneva).
Available at: http://www.ilo.org/global/publications/books/WCMS_124442/lang-
-en/index.htm [24 March 2015].
—. 2011. Value chains for rural development, Rural Policy Briefs, Rural Development
through Decent Work (Geneva). Available at: http://ilo.org/empent/areas/value-
chain-development-vcd/WCMS_161156/lang--en/index.htm [9 March 2015].
—. 2012. China’s latest revolution: Basic health care for all (Geneva). Available at:
http://www.ilo.org/global/about-the-
ilo/newsroom/features/WCMS_188582/lang--en/index.htm [16 Apr. 2014].
—. 2012. Social security for all: Building social protection floors and comprehensive
social security systems (Geneva). Available at: http://www.social-
protection.org/gimi/gess/RessourcePDF.action?ressource.ressourceId=34188 [24
March 2015].
—. 2013. Programme and Budget proposals for 2014–15, Governing Body, 317th
Session, Mar. 2013, PFA/1/1.
—. 2014. The social and solidarity economy: A new enterprise model emerges,
Sustainable Enterprise Programme. (Geneva). Available at:
http://www.ilo.org/wcmsp5/groups/public/---ed_emp/---emp_ent/---
coop/documents/publication/wcms_175515.pdf [9 March 2015].
Jacobs, B.; Bigdeli, M.; van Pelt, M.; Ir, P.; Salze, C.; Criel, B. 2008. “Bridging
community-based health insurance and social protection for health care: A step
in the direction of universal coverage?”, in Tropical Medicine & International
Health, Vol. 13, No. 2, pp. 140−143.
Johri, M.; Norheim, O. F. 2012. “Can cost-effectiveness analysis integrate concerns for
equity? Systematic review”, in International Journal of Technology Assessment
in Health Care, Vol. 28, No. 2, pp. 125−132.
Joint Learning Network. 2015. Kyzgyz Republic: Mandatory Health Insurance Fund
(MHIF) (Washington, DC). Available at:
http://programs.jointlearningnetwork.org/content/mandatory-health-insurance-
fund-mhif [20 March 2015].
Kanashiro, J.; Hollaar, G.; Wright, B.; Nammavongmixay, K.; Roff, S. 2007. “Setting
priorities for teaching and learning: An innovative needs assessment for a new
family medicine program in Lao PDR”, in Academic Medicine, Vol. 82, No. 3,
pp. 231−237.
Global evidence on inequities in rural health protection
63
Kirigia, J. M.; Gbary, A. R.; Muthuri, L. K.; Nyoni, J.; Seddoh, A. 2006. “The cost of
health professionals’ brain drain in Kenya”, in BMC Health Services Research,
Vol. 6, No. 89, pp. 1−10.
Kombe, G.; Fleisher, L.; Kariisa, E.; Arur, A.; Sanjana, P.; Paina, L.; Dare, L.; Abubakar,
A.; Baba, S.; Ubok-Udom, E.; Unom, S. 2010. Nigeria Health System
Assessment 2009 (Bethesda, MD, Abt Associates).
Kruk, M. E.; Johnson, J. C.; Gyakobo, M.; Agyei-Baffour, P.; Asabir, K.; Kotha, S. R.;
Kwansah, J.; Nakua, E.; Snow, R. C.; Dzodzomenyo, M. 2010. “Rural practice
preferences among medical students in Ghana: A discrete choice experiment”, in
Bulletin of the World Health Organization, Vol. 88, No. 5, pp. 333−341.
Lamiraud, K; Booysen, F.; Scheil-Adlung, X. 2005. The impact of social health
protection on access to health care, health expenditure and impoverishment: A
case study of South Africa, ESS Extension of Social Security Paper No. 23
(Geneva, ILO). Available at: http://www.ilo.org/wcmsp5/groups/public/---
ed_protect/---soc_sec/documents/publication/wcms_207709.pdf [9 March 2015].
Laurant, M.; Harmsen, M.; Wollersheim, H.; Grol, R.; Faber, M.; Sibbald, B. 2009. “The
impact of nonphysician clinicians: Do they improve the quality and cost-
effectiveness of health care services?”, in Medical Care Research and Review,
Vol. 66, No. 6, pp. 36S−89S.
Lehmann, U.; Van Damme, W.; Barten, F.; Sanders, D. 2009. “Task shifting: The answer
to the human resources crisis in Africa?”, in Human Resources for Health, Vol.
7, No. 49, pp. 1−4.
Lemaire, J. 2011. Scaling up mobile health: Elements necessary for the successful scale-
up of mhealth in developing countries (Bamako, Mali).
Leonard, K. L.; Masatu, M. C. 2010. “Professionalism and the know-do gap: Exploring
intrinsic motivation among health workers in Tanzania”, in Health Economics,
Vol. 19, No. 12, pp. 1461−1477.
Lewis, T.; Synowiec, C.; Lagomarsino, G.; Schweitzer, J. 2012. “E-health in low- and
middle-income countries: Findings from the Center for Health Market
Innovations”, in Bulletin of the World Health Organization, Vol. 90, No. 5, pp.
321−400.
McIntyre, D.; Meheus, F. 2014. Fiscal space for domestic funding of health and other
social services, Working Group Paper (London, Chatham House). Available at:
http://www.chathamhouse.org/publications/papers/view/198263 [9 Jan. 2015].
McPake, B.; Maeda, A.; Araújo, C.; Lemiere, C.; Maghraby, E. 2013. “Why do health
labour market forces matter?”, in Bulletin of the World Health Organization,
Vol. 91, No. 11, pp. 797–896.
Moran, A. M.; Coyle, J.; Pope, R.; Boxall, D.; Nancarrow, S. A.; Young, J. 2014.
“Supervision, support and mentoring interventions for health practitioners in
rural and remote contexts: An integrative review and thematic synthesis of the

64 Global evidence on inequities in rural health protection
literature to identify mechanisms for successful outcomes”, in Human Resources
for Health, Vol. 12, No. 10, pp. 1−30.
Mueller, B. 2012. The poverty of the smallholder ideal: Highlighting Tanzania’s rural
labour market (London, SOAS, Department of Development Studies). Available
at: https://www.soas.ac.uk/cdpr/publications/dv/the-poverty-of-the-smallholder-
ideal-highlighting-tanzanias-rural-labour-market.html [9 March 2015].
Ng, M.; Misra, A.; Diwan, V.; Agnani, M.; Levin-Rector, A.; De Costa, A. 2014. “An
assessment of the impact of the JSY cash transfer program on maternal mortality
reduction in Madhya Pradesh, India”, in Global Health Action, Vol. 7, pp. 1−10.
Norheim, O. F.; Baltussen, R.; Johri, M.; Chisholm, D.; Nord, E.; Brock, D. W.;
Carlsson, P.; Cookson, R.; Daniels, N.; Danis, M.; Fleurbaey, M.; Johansson, K.
A.; Kapiriri, L.; Littlejohns, P.; Mbeeli, T.; Rao, K. R.; Edejer, T. T. T.; Wikler,
D. 2014. “Guidance on priority setting in health care (GPS-Health): The
inclusion of equity criteria not captured by cost-effectiveness analysis”, in Cost
Effectiveness and Resource Allocation, Vol. 12, No. 18, pp. 1−8.
Nove, A.; Hulton, L.; Martin-Hilber, A.; Matthews, Z. 2014. “Establishing a baseline to
measure change in political will and the use of data for decision-making in
maternal and newborn health in six African countries”, in International Journal
of Gynecology & Obstetrics, Vol. 127, No. 1, pp. 102−107.
Office of the High Commissioner For Human Rights (OHCHR); World Health
Organization (WHO). 2008. Human rights, health and poverty reduction
strategies (Geneva).
Ono, T.; Schoenstein, M.; Buchan, J. 2014. Geographic imbalances in doctor supply and
policy responses, OECD Health Working Paper No. 69 (Paris, OECD).
Oxford Policy Management. 2014. Situational analysis on sustainable financing in the
region, with case studies and best practices, Report for SADC, OPM Africa
(Oxford).
Pearson, T. 2013. First students of Caracas Latin American Medical School graduate,
new university announced. Available at: http://venezuelanalysis.com/news/10196
[20 Nov. 2014].
Phillips, L. D. 2006. Decision conferencing, Operational Research Working Paper No.
LSEOR 06.85 (London School of Economics and Political Science).
Reed, G. 2010. “Cuba answers the call for doctors”, in Bulletin of the World Health
Organization, Vol. 88, pp. 325–326.
Regmi, K.; Randhawa, G. 2013. “Access to healthcare: Issues of measure and method”,
in Primary Health Care, Vol. 3, No. 1, pp. 1−2.
Russell, S. 1996. “Ability to pay for health care: Concepts and evidence”, in Health
Policy and Planning, Vol. 11, No. 3, pp. 219−237.

Global evidence on inequities in rural health protection
65
Ryan, M.; Gerard, K.; Amaya-Amaya, M. (eds.). 2008. Using discrete choice
experiments to value health and health care (Dordrecht, Springer).
Saltman, R. B.; Bankauskaite, V.; Vrangbæk, K. (eds.). 2007. Decentralization in health
care: Strategies and outcomes (Maidenhead, Open University Press).
Scheil-Adlung, X. 2013. “Health protection: More than financial protection”, in A.
Preker et al.: Scaling up affordable health insurance: Staying the course
(Washington, World Bank).
—. 2013. “Revisiting policies on universal coverage in health in low-income countries:
Realizing the payoffs of the national social protection floors”, in International
Social Security Review, Vol. 66, No. 3−4, pp. 145−170.
—. 2013. “Health workforce benchmarks for universal health coverage and sustainable
development”, in Bulletin of the World Health Organization, Vol. 91, No. 11, p.
888.
—; Bonnet, F. 2011. “Beyond legal coverage: Assessing the performance of social health
protection”, in International Social Security Review, Vol. 64, No. 3, pp. 21−38.
Available at:
http://www.researchgate.net/publication/228286113_Beyond_Legal_Coverage_
Assessing_the_Performance_of_Social_Health_Protection [24 March 2015].
—. Booysen, F.; Lamiraud, K.; Reynaud, E. 2006. What is the impact of social health
protection on access to health care, health expenditure and impoverishment? A
comparative analysis of three African countries, ESS Extension of Social
Security Paper No. 24 (Geneva, ILO). Available at:
http://www.ilo.org/wcmsp5/groups/public/---ed_protect/---
soc_sec/documents/publication/wcms_207719.pdf [9 March 2015].
—. Kuhl, C . 2011. Addressing inequities in access to health care for vulnerable groups
in countries of Europe and Central Asia, Social Security Policy Briefing Paper
No. 8 (Geneva, ILO). Available at: http://www.ilo.org/wcmsp5/groups/public/---
ed_protect/---soc_sec/documents/publication/wcms_secsoc_25201.pdf [9 March
2015].
—; —. 2012. Evidence on gender inequities in social health protection: The case of
women living in rural areas, ESS Extension of Social Security Paper No. 29
(Geneva, ILO). Available at: http://www.ilo.org/wcmsp5/groups/public/---
ed_protect/---soc_sec/documents/publication/wcms_secsoc_25201.pdf [9 March
2015].
—. Sandner, L. 2010. Paid sick leave: Incidence, patterns and expenditure in times of
crises, ESS Extension of Social Security Paper No. 27 (Geneva, ILO).
—. —. 2010. Wage continuation during sickness: Observation on paid sick leave
provisions in times of crisis (Geneva, ILO). Available at: http://www.social-
protection.org/gimi/gess/ShowRessource.action?ressource.ressourceId=17463
[24 March 2015].
66 Global evidence on inequities in rural health protection
Semali, I. A.; Minja, G. 2005. Deprivation and the equitable allocation of health care
resources to decentralised districts in Tanzania, Equinet Discussion Paper No.
33 (Harare).
Shaw, C. 2003. How can hospital performance be measured and monitored?, Health
Evidence Network Report (Copenhagen, WHO Regional Office for Europe).
Available at:
http://www.euro.who.int/__data/assets/pdf_file/0009/74718/E82975.pdf [21 Jan.
2015].
Smith, S.; Ross, C. 2006. Organizing out of poverty: Stories from the grass roots: How
the SYNDICOOP approach has worked in East Africa (Manchester, The Co-
operative College).
Strachan, M.; Drake, M.; Rawlins, B.; Dwivedi, V.; Levine, B.; Ly, M.; Ishola, G. 2013.
Strengthening health management information systems for maternal and child
health: Documenting MCHIP’s contributions (Baltimore, MD, USAID and
CHIP).
Tangcharoensathien, V.; Evans, D. B. 2013. “Beyond clinical skills: Key capacities
needed for universal health coverage”, in Bulletin of the World Health
Organization, Vol. 91, No. 11, pp. 801–801A.
The Lancet Commission on Investing in Health. 2013. “Global health 2035: A world
converging within a generation”, in The Lancet, Vol. 382, pp. 1898–1955.
Training for Health Equity Network. 2014. About THEnet. Available at:
http://thenetcommunity.org/about-thenet/ [20 Nov. 2014].
Tromp, N.; Baltussen, R. 2012. “Mapping of multiple criteria for priority setting of
health interventions: An aid for decision makers”, in BMC Health Services
Research, Vol. 12, No. 454, pp. 1−7.
United Nations. 2013. A new global partnership: Eradicate poverty and transform
economies through sustainable development, The Report of the High-Level
Panel of Eminent Persons on the Post-2015 Development Agenda (New York).
UN Committee on Economic Social and Cultural Rights (CESCR). 2000. General
Comment No. 14: The Right to the Highest Attainable Standard of Health (Art.
12 of the Covenant) (Geneva). Available at:
http://www.refworld.org/docid/4538838d0.html [21 Jan. 2015].
UNdata. 2015. Kyrgyzstan. Available at:
https://data.un.org/CountryProfile.aspx?crName=Kyrgyzstan [20 March 2015].
United Nations Population Fund (UNFPA). 2007. State of World Population 2007:
Unleashing the potential of urban growth (New York).
—. 2011. The State of the World’s Midwifery 2011: Delivering health, saving lives (New
York).
Global evidence on inequities in rural health protection
67
—. 2014. Skilled attendance at birth. Available at:
http://web.lb.unfpa.org/mothers/skilled_att.htm [2 Oct. 2014].
—. 2014. The State of the World’s Midwifery 2014: A universal pathway: A woman's
right to health (New York).
—. 2014. Urbanization. Available at: http://www.unfpa.org/urbanization [26 Nov. 2014].
University of Bergen Centre for International Health. 2014. Setting equitable priorities in
health and health care: From theory to practice. Available at:
http://www.uib.no/en/cih/67963/setting-equitable-priorities-health-and-health-
care-theory-practice [19 Dec. 2014].
Van Lerberghe, W.; Matthews, Z.; Achadi, E.; Ancona, C.; Campbell, J.; Channon, A.;
de Bernis, L.; De Brouwere, V.; Fauveau, V.; Fogstad, H.; Koblinsky, M.;
Liljestrand, J.; Mechbal, A.; Murray, S. F.; Rathavay, T.; Rehr, H.; Richard, F.;
Hoope-Bender, P. T.; Turkmani, S. 2014. “Country experience with
strengthening of health systems and deployment of midwives in countries with
high maternal mortality”, in The Lancet, Vol. 384, No. 9949, pp. 1224−1225.
Vargas, V.; Poblete, S. 2008. “Health prioritization: The case of Chile”, in Health
Affairs, Vol. 27, No. 3, pp. 782–792.
Wagstaff, A.; Bredenkamp, C.; Buisman, L. R. 2014. Progress towards the health
MDGs: Are the poor being left behind? World Bank Policy Research Working
Paper No. 6894 (Washington, DC, World Bank).
—; Lindelow, M.; Jun, G.; Ling, X.; Juncheng, Q. 2009. “Extending health insurance to
the rural population: An impact evaluation of China’s new cooperative medical
scheme”, in Journal of Health Economics, Vol. 28, No. 1, pp. 1−19.
Watkins, K. 2014. “Leaving no one behind: An agenda for equity”, in The Lancet, Vol.
6736, No. 13, pp. 1–8.
Wigle, J. 2014. Mamaya: Using data to save mothers and babies in Mchinji District.
Available at: http://www.mamaye.org.mw/en/blog/using-data-save-mothers-and-
babies-mchinji-district [15 Dec. 2014].
Witter, S. 2009. “Service- and population-based exemptions: Are these the way forward
for equity and efficiency in health financing in low-income countries?”, in
Advances in Health Economics and Health Services Research, Vol. 21, pp.
251−288.
—; Somanathan, A. 2012. Demand-side financing for sexual and reproductive health
services in low- and middle-income countries: A review of the evidence, World
Bank Policy Research Working Paper No. 6213 (Washington, DC, World Bank).
Available at: http://elibrary.worldbank.org/doi/abs/10.1596/1813-9450-6213 [24
March 2015].
—; Cometto, G.; Zaman, U. R.; Sheikh, M.; Wibulpolprasert, S. 2013. “Implementing
the agenda for global action on human resources for health: Analysis from an

68 Global evidence on inequities in rural health protection
international tracking survey”, in Journal of Hospital Administration, Vol. 2, No.
1, pp. 77−87.
World Bank. 2013. Mexico increases access to tertiary education, 4 July. Available at:
http://www.worldbank.org/en/results/2013/07/04/mexico-increases-access-to-
tertiary-education [17 March 2015].
World Health Organization (WHO). 2006. Quality of care: A process for making
strategic choices in health systems (Geneva).
—. 2006. World Health Report 2006: Working together for health (Geneva).
—. 2008. World Health Report 2008: Primary health care: Now more than ever
(Geneva).
—. 2010. WHO Global Code of Practice on the International Recruitment of Health
Personnel, 63rd World Health Assembly,WHA63.16 (Geneva).
—. 2010. World Health Report 2010: Health systems financing: The path to universal
coverage (Geneva).
—. 2012. Optimize MNH: WHO Recommendations for optimizing health workers’ roles
to improve access to key maternal and newborn health interventions through task
shifting (Geneva).
—. 2013. Country cooperation strategy at a glance: Kyrgyzstan. Available at:
http://www.who.int/countryfocus/cooperation_strategy/ccsbrief_kgz_en.pdf [20
March 2015].
—. 2013. Transforming and scaling up health professionals’ education and training
(Geneva).
—. 2013. Universal health coverage: Supporting country needs (Geneva).
—. 2013. World Health Report 2013: Research for universal health coverage (Geneva).
—. 2014. Health financing for universal coverage: Tools and guidance. Available at:
http://www.who.int/health_financing/tools/en/ [9 Jan. 2015].
—. 2014. Making fair choices on the path to universal health coverage: Final report of
the WHO Consultative Group on Equity and Universal Health Coverage
(Geneva).
—. 2015. Service availability and readiness assessment (SARA). Available at:
http://www.who.int/healthinfo/systems/sara_introduction/en/ [12 Jan. 2015].
—; Commission on the Social Determinants of Health. 2008. Final Report: Closing the
gap in a generation: Health equity through action on the social determinants of
health (Geneva).
—; United Nations Children’s Fund (UNICEF). 2012. Countdown to 2015: Building a
future for women and children: The 2012 Report (Washington, DC).
Global evidence on inequities in rural health protection
69
—; —; United Nations Population Fund (UNFPA); World Bank. 2012. Trends in
maternal mortality: 1990 to 2010 (Geneva).
World Bank. 2013. Monitoring progress towards universal health coverage at country
and global levels: A framework, Joint WHO/ World Bank Group Discussion
Paper. Available at:
http://www.who.int/healthinfo/country_monitoring_evaluation/UHC_WBG_Dis
cussionPaper_Dec2013.pdf [17 Oct. 2014].
WHO Regional Office for Africa, African Health Observatory. 2014. Community
ownership and participation, Comprehensive analytical profile: Malawi
(Brazzaville/Geneva). Available at:
http://www.aho.afro.who.int/profiles_information/index.php/Malawi:Community
_ownership_and_participation_-_The_Health_System [15 Dec. 2014].
Xu, K.; Saksena, P.; Evans, D. B. 2010. Health financing and access to effective
interventions, Background Paper No. 8 prepared for the World Health Report
2010 (Geneva).
—; Evans, D.; Kawabata, K.; Zeramdini, R.; Klavus, J.; Murray, C. 2003. “Household
catastrophic health expenditure: A multicountry analysis”, in The Lancet, Vol.
362, pp. 111–117.
Yilla, M.; Nam, S. L.; Adeyemo, A.; Karqbo, S. A. 2014. “Using scorecards to achieve
facility improvements for maternal and newborn health”, in International
Journal for Gynecology & Obstetrics, Vol. 127, No. 1, pp. 108–112.
Youngkong, S.; Baltussen, R.; Tantivess, S.; Mohara, A. 2012. “Multicriteria decision
analysis for including health interventions in the universal health coverage
benefit package in Thailand”, in Value in Health, Vol. 15, No. 6, pp. 961–970.
Zhao, F.; Squires, N.; Weakliam, D.; Van Lerberghe, W.; Soucat, A.; Toure, K.;
Sharkarishvili, G.; Quain, E.; Maeda, A. 2013. “Investing in human resources for
health: The need for a paradigm shift”, in Bulletin of the World Health
Organization, Vol. 91, No. 11, pp. 799–799A.