Embed Size (px)
Citation preview
COPYRIGHT © ESKOM HOLDINGS LIMITED NO PUBLICATION OR DISSEMINATION OF ITS CONTENTS IS ALLOWED WITHOUT
WRITTEN PERMISSION
ESKOM
RESEARCH REPORT
INTERNATIONAL BENCHMARKING OF ELECTRICITY TARIFFS
AUTHOR(S) : LTE Energy in association with EA Energy
Analysis, Denmark ORGANISATION : LTE
REPORT Confidential Page No:1
RESEARCH REPORT
INTERNATIONAL BENCHMARKING OF ELECTRICITY TARIFFS
REPORT Confidential Page No:2
EXECUTIVE SUMMARY
INTERNATIONAL BENCHMARKING OF ELECTRICITY TARIFFS
OVERVIEW In the recent past Eskom has implemented a framework of pricing and tariff methodologies guided by the Strategic Pricing Direction for Tariffs documents whose objective in a broad sense is to promote economic efficiency and sustainability, ensure revenue recovery and promote fairness and equity. The current Eskom Tariff Methodology seeks to allocate the costs of its different divisions in a cost reflective manner as well as in conjunction with other parameters essential to each division so as to arrive at a tariff per customer category and account for subsidies in a way such that each cost per division and its tariff component does not affect revenue neutrality. It is with this background, the need arise for an international tariff benchmarking review. With the international benchmarking tariff study, Eskom wishes to contribute to the continued development and refinement of the tariff levels and structures in South Africa. BACKGROUND In the recent past Eskom has implemented a framework of pricing and tariff methodologies guided by the Strategic Pricing Direction for Tariffs documents whose objective in a broad sense is to promote economic efficiency and sustainability, ensure revenue recovery and promote fairness and equity. The utility’s divisions have been unbundled, financially ring-fenced and regulated separately. This allows for the real costs per division to be known and adequately accounted for, and that the tariffs for each division can reflect cost levels and ensure revenue neutrality. This means that the sum of all tariff components is not more than the NERSA approved revenue requirement. The current Eskom Tariff Methodology seeks to allocate the costs of its different divisions in a cost reflective manner as well as in conjunction with other parameters essential to each division so as to arrive at a tariff per customer category and account for subsidies in a way such that each cost per division and its tariff component does not affect revenue neutrality. OBJECTIVES It is with this background, the need arise for an international tariff benchmarking review, which comes at a time of sustained volatility in a number of cost drivers for energy utilities. Increasingly, tariff structures seek to provide an incentive for reducing peak demand, reward customers for lowering their energy us and reduce the need for capacity expansion. To achieve these ends, utilities are increasingly considering alternative tariff structures, which include but are not limited to inclining block tariffs, time-of-use tariffs and controlled load tariffs. With the international benchmarking tariff study, Eskom wishes to contribute to the continued development and refinement of the tariff levels and structures in South Africa. One important aspect is continued comparisons and lessons learned from other countries around the world. It shall be noted that the report primarily provides a 2010 ‘snapshot’ comparison. APPROACH
REPORT Confidential Page No:3
The study covers the following three areas: Comparison of average tariff levels, comparison of tariff structure for selected customer groups, and comparison of tariff setting methodologies. The study compares tariffs in South Africa with a selected group of countries. The study is divided in three parts with the following issues to be included. Part A: Benchmarking of Eskom total average price against a selected group of countries with focus on an apples-versus-apples comparison of Eskom total average tariff (total regulated revenue divided by total sales volume) with that of other similar utilities in selected countries. The overall tariff comparison is provided in chapter 2.1. The following systemic sense-making factors qualify the comparative understanding of the total average tariff levels and have been provided for in chapter 2.2: (i) The trend of the total average tariff, (ii) the contribution of the average tariff to creating sustainable utilities, and (iii) the historical developments in exchange rates. Part B: Benchmarking of Eskom customer tariff categories against regional, developed and developing countries with focus on a comparison of customer categories tariff levels on average: municipality, large and medium industrial, residential, domestic etc. Each charge component comparisons include the consumers’ total average electricity unit cost by assuming typical customer profiles and assumptions. In order to compare price differences for different consumption volumes, typical standard consumers are defined for households and large and small industrial consumers. This is provided for in Chapter 3. Part C: Detailed comparison and discussion of tariff methodologies with a particular focus on a comparison and discussion of different tariff methodologies for a number of selected countries and utilities, see Chapter 4. This part carries out an analysis of selected countries in order to compare the tariff methodologies employed in these countries, the overriding factors in determining tariffs and how the choice of tariff methodology influences consumption for different consumer groups. RESULTS The Eskom tariff benchmarking study has provided a number of interesting findings and results. Of key results, discussions, cautions and lessons learned can the following be highlighted. For Part A the following general results can be noted:
• The benchmarking study of average tariffs is based on comparison of key national energy utilities total revenue and sales (Gwh). The ranking in column three is based on a simple exchange rate conversion of the resulting tariff per kWh in each utility. The benchmarking shows that South Africa (Eskom) is ranked fourth cheapest average tariff of the 15 countries utilities included in the survey. The last four countries (South Africa, India, Australia and China), however, only have marginally different average tariffs (+/- 2 SA cent). Then there is 10-20 SA-cent up to the next group of countries (Argentina, Canada, US, Denmark, South Korea, Thailand, Kenya). The highest average tariffs can be found in Malaysia, Spain and UK
• South Africa (Eskom) is the third largest utility included in the benchmarking based on sales only smaller than the German and South
REPORT Confidential Page No:4
Korean utilities. The smallest utilities included are the utilities from Kenya Argentina and Australia. The ranking show poor relation between sales and revenue
• South Africa (Eskom) is ranked as having the second largest inflation corrected tariff increase of the benchmarked countries during the last 8 years. UK had the biggest average tariff increase, while South Korea, Denmark and Canada had the lowest average increase. None of the countries included had a negative tariff to inflation increase rate over the last 8 years
• South Africa (Eskom) is has the third lowest RoA of the utilities included in the benchmarking. Denmark’s DONG has by far the highest RoA, followed by utilities in India, Spain, Thailand, Germany, UK and Kenya. Only the Chinese and Argentina utilities have lower RoA than Eskom. No correlation between RoA and credit ratings can be seen
• The PPP results show that there is no correlation of the total average tariffs (based on exchange rate calculations) to the corresponding international PPP benchmarking of the national utilities including in the study. The PPP results also show markedly large changes in rankings for some countries, e.g. South Africa. Based on these findings it is found that the interpretation of the PPP results has to be undertaken with care, and it is suggested that further investigations into the use and practicability of the PPP comparison technique for power utilities.
For Part B the following general results can be noted:
• Eskom’s tariffs generally compare favourably with many other countries when considered as a price only comparison. The tariffs were not compared on an affordability basis. Eskom has the third lowest tariff for consumers using 200 kWh/month. Malaysia has the lowest tariff at this level. Tariffs in Vancouver are also lower than in South Africa. Still, the study showed that reducing the amount of kWh in the lowest tariff block or only providing the lowest tariff to households with single phase connections or prepaid meters etc. could be considered for improved financial feasibility and better international market match
• The marginal cost of electricity for South African consumers in the highest tariff block is on a par with tariffs in Australia and the lower European tariffs. The European tariffs generally include high energy taxes
• The average cost per unit for consumption of 1000 kWh/month under the Eskom block tariff is generally higher than tariffs in North America, but lower than in Europe, Australia, Malaysia and Brazil. Most countries have a flat rate tariff for consumers at this level so they do not benefit from the low-income block tariff as consumers do in South Africa
• Malaysia and Brazil have block tariffs that are aimed at assisting low-income households. In Malaysia this is done with a number of small
REPORT Confidential Page No:5
blocks, whilst in Brazil qualification for lifeline tariffs is based on the size of the connection
• Industrial tariffs in South Africa are generally more expensive than tariffs in North America. The South African tariffs are, however, listed prices. Very large industrial consumers in South Africa may well have negotiated their own contracts at a lower rate than those listed
• Cross subsidisation of rural consumers through industrial tariffs should be defined as a levy on transmission in order that wheeling agreements or the introduction of other pricing mechanisms do not circumvent or undermine the rural electrification programme.
For Part C the following general results can be noted:
• There is low transparency in the tariff breakdown for residential consumers in South Africa
• Tariff methodologies are generally most transparent in countries with market systems and regulated monopolies in the transmission and distribution sectors. Generation is not regulated and determined by market economics whilst transmission and distribution is regulated using revenues caps or cost plus methodologies. In parts of the US and some Canadian provinces generation is also regulated through cost plus methodologies
• Important parts of the electricity system have been liberalized in many countries and competition has been introduced. To create the framework for the competitive part of the sector more rules and laws are needed for monopolies. A substantial part of the electricity sector in most countries is still regulated as monopolies. The regulation of monopolies is therefore still very important, also after the introduction of competition. This is so, not only because of the part of the consumer’s prices that are payment to the monopolies, but also because the linkages between the competitive sector and the monopolies are very strong.
CONCLUSIONS As almost always with international benchmarking studies, they raise more questions than they answer (which normally is good, as international benchmarking stimulate innovations, questions business as usual, contribute to competition and improvements). Some of the interesting hypothesis and trends that is raised by the general results for Part A, include amongst others:
• It seems like South Africa has a low average tariff (simple exchange rate) compared to other countries, while the opposite is the case for the PPP comparison. The consequences and implications of this for e.g. tariff setting need to be better understood
REPORT Confidential Page No:6
• It seems like South Africa in relation to PPP ranking is in a middle situation with a number of lower GDP income countries above, and higher GDP income countries below. The implications of this grouping also needs to be better understood
• It seems like there is an uncorrelated relation with utilities key parameters (e.g. sales, revenue, etc) and RoA (Return on Assests). Likewise it seems like there is no correlation between RoA and credit ratings. What are the underlying reasons for these non-correlations?
For Part B the following general conclusions can be made:
• The affordability of electricity in South Africa is a key issue due to the prevalence of energy poverty in many households. A better understanding of the affordability of electricity will provide useful information in designing a lifeline tariff that is directed towards the target group rather than benefitting all consumers. This could lower the cost of supply for the utility and provide greater incentive for energy efficiency in households that can afford these measures
• The lowest block of 200 kWh per month is a high level of consumption. If the intention is to target low-income households then Eskom should consider re-evaluating the size of the first tariff block or attaching a requirement along the line of the size of connection. This would reduce cross subsidisation to those that do not require assistance and bring residential tariffs closer to reflecting the true cost of supply for those that can afford it. It may also allow for the lifeline tariff to be reduced if the affordability of electricity for low-income households is low
• The pricing of industrial tariffs could be based more closely on marginal pricing in order to send the correct price signals to large consumers and provide greater incentives for them to plan consumption according to the cost of supply at the time of consumption. This would provide a more nuanced pricing mechanism and allow for unforeseen system events to influence the electricity price for short periods as required. This could be done in association with offering fixed prices at a premium rather than at a discount as is the tradition in South Africa. Fixed prices should be seen as an insurance against high prices rather than an assurance of low prices. Fixed price contracts place the pricing risk on the utility and the utility should therefore be compensated for this. Variable price contracts place the price risk on the consumer and they are rewarded through low prices in off peak periods. This could be considered for consumers where time interval metering is possible and with a sufficient level of consumption.
For Part C the following general conclusions can be made:
• Rules and regulations for transmission system, access to transmission system, wheeling and system operation should be assessed to find simple yet robust model for transmission pricing and wheeling rules
REPORT Confidential Page No:7
• Greater transparency in the breakdown of costs could be considered for consumers. This will also provide the opportunity for benchmarking distribution companies in South Africa with each other and internationally and should provide incentives to increase efficiency through regulation
• Differentiating between generation, transmission and distribution costs is an important part of unbundling utilities. Eskom is currently in the process of ring fencing generation, transmission and distribution. As in some other countries, this could be reflected in the tariff breakdown
• Transmission and distribution tariffs should represent grid investments that help reduce the overall cost of supply for the end user. The way investments are included in tariffs should be assessed and justified using the principle of least-cost-supply rather than least-cost-investment on a project-by-project basis.
RECOMMENDATIONS Results, hypothesis and cautions leads to a number of key lessons learned and recommendations for the present international benchmarking study, including:
• The market share of the utilities included for each country should be increased to at least 50-60% of the national energy market to improve reliability in comparisons
• The utilities either need to be unbundled in Generation, Transmission, Distribution and Retail or other methodologies needs to be developed to further improve the apple-to-apple comparison. This also include a greater focus on generation technologies for comparisons
• Data collection should be complemented by direct data collection from included utilities. E.g. was China not included in the study due to lack of Annual Report data. China should (of many reasons) be included in the next study and other avenues of getting data from Chinese utilities should be used
• Detailed studies of the hypothesis’ of the study e.g. the use of PPP or the differences between different customer group tariffs, should be initiated to gain further lessons of the international benchmarking study
• A study should be made into the effect of reducing the number of kWh in the lowest tariff block and how this would affect the tariff in other blocks. This is in reality an alternative to large tariff increases. 200 kWh can be considered to be a high level of consumption for a low income household. There are most likely a number of free riders in this programme. A study could be carried out to assess this issue
• A study should be carried out to determine the marginal price of electricity in South Africa hour for hour for the last couple of years and scenarios for future years. This would provide the basis for determining a more nuanced pricing structure for large industrial consumers
REPORT Confidential Page No:8
• Development of a methodology for determining the value of investments for transmission and distribution and how these investments will influence the overall cost of electricity for the end user. This could also be applied for generation, but is best suited for grid companies
• Assess the needs of the market and determine how wheeling should be handled and develop market rules for use of transmission system.
The above would constitute key component in a Terms of Reference for a possible new and expanded international tariff benchmarking study.
INDUSTRY PERSPECTIVE As always with international benchmarking studies, numerous cautions and clarifications is needed in order not to make over-interpretations of the results. In this benchmarking studies attention should be made towards:
• The use of selected national power utilities as base for the international benchmarking. This has provided new results, but also showed the difficulties and need for further detailing of such studies: The different structuring of Annual Reports, the difficulties in separating Generation, Transmission, Distribution and Retail in the figures provided in the Annual Reports, lack of clarity in most Annual Report on what revenue contains, e.g. exploration, market sales, transmission sales delinked from own generation, etc (the lack of correlation between sales and revenues in table 2.3 is an indicator hereof)
• The use of simple exchange and PPP rates contributes to increased nuances in interpretations, but also decreased clarity
• The study attempted to unbundle the utilities in Generation, Transmission, Distribution and Retail costs. This proved to be an almost impossible task based on the information available for the desk study, which was based on Annual Report 2010. This contributes in some instances to difficulties in interpretation of the benchmarking results, e.g. the companies from Australia and Canada are pure generation companies, others are full GTDR companies, others again is even much more than that, e.g. oil exploration etc. as in the case of Germany and Denmark
• Data availability and specificity therefore has to noted as a serious limiting factor in providing ‘bullet-proof’ apple-versus- apple comparisons. One reason for this can be related to the ownership structure of the utilities. There is no doubt that the government-owned companies, like e.g. South Africa, Malaysia and Thailand, provide clearer and more transparent data than private-owned companies that compete on a competitive energy market, e.g. UK, Germany and Spain
• South Africa and Eskom, of the countries and utilities included in the study, provide, with Denmark’s DONG, the most transparent and easy data to analyze. This conclusion is based on the detailed analysis of Annual Reports 2010 published by the Utilities.
REPORT Confidential Page No:9
KEYWORDS Average tariffs Benchmarking Consumer tariffs Data comparisons Exchange rates Industrial tariffs International Power Purchase Parity Power Utilities Tariffs Tariff methodologies Trends FUTURE REVIEW It is recommended that the present study is further detailed and extended whereby Eskom can contribute constructively to the trend and increased effort of international benchmarking of tariffs between power utilities.
REPORT Confidential Page No:10
1 INTRODUCTION
In the recent past Eskom has implemented a framework of pricing and tariff methodologies guided by the Strategic Pricing Direction for Tariffs documents whose objective in a broad sense is to promote economic efficiency and sustainability, ensure revenue recovery and promote fairness and equity. The utility’s divisions have been unbundled, financially ring-fenced and regulated separately. This allows for the real costs per division to be known and adequately accounted for, and that the tariffs for each division can reflect cost levels and ensure revenue neutrality. This means that the sum of all tariff components is not more than the NERSA approved revenue requirement. The current Eskom Tariff Methodology seeks to allocate the costs of its different divisions in a cost reflective manner as well as in conjunction with other parameters essential to each division so as to arrive at a tariff per customer category and account for subsidies in a way such that each cost per division and its tariff component does not affect revenue neutrality. It is with this background, the need arise for an international tariff benchmarking review, which comes at a time of sustained volatility in a number of cost drivers for energy utilities. Increasingly, tariff structures seek to provide an incentive for reducing peak demand, reward customers for lowering their energy us and reduce the need for capacity expansion. To achieve these ends, utilities are increasingly considering alternative tariff structures, which include but are not limited to inclining block tariffs, time-of-use tariffs and controlled load tariffs. With the international benchmarking tariff study, Eskom wishes to contribute to the continued development and refinement of the tariff levels and structures in South Africa. One important aspect is continued comparisons and lessons learned from other countries around the world.
1.1 KEY ISSUES ADDRESSED AND METHODOLOGY UTILISED
The study covers the following three areas: Comparison of average tariff levels, comparison of tariff structure for selected customer groups, and comparison of tariff setting methodologies. The study compares tariffs in South Africa with a selected group of countries. The study is divided in three parts with the following issues to be included. Part A Benchmarking of Eskom total average price ag ainst a selected group of countries with focus on an apples-versus-apples comparison of Eskom total average tariff (total regulated revenue divided by total sales volume) with that of other similar utilities in selected countries. The key overall results of the international benchmarking of average tariffs is presented followed by an outline of trends and hypothesis that can be drawn for these results, cautions and
REPORT Confidential Page No:11
clarifications, and finally, by lessons learned and recommendations for the international average benchmarking study. The overall tariff comparison is provided in chapter 2.1. The following systemic sense-making factors qualify the comparative understanding of the total average tariff levels and have been provided for in country-to-country comparisons in chapter 2.2: (i) The trend of the total average tariff. Has the tariff increased or decreased relatively to inflation during the last decade? What is the expected trend for the tariff the next 3 years? (ii) the contribution of the average tariff to creating sustainable utilities, (iii) the historical developments in exchange rates, and (iv) the historical development of the power purchase parity (PPP). These four contextual sense-making background factors provide a systemic approach to understanding the average total tariff levels and making relevant comparisons between the selected countries and utilities. Part A of the study has been carried out as a desk top study using statistical data available from mainly the selected utilities annual reports (chapter 2.1), International Energy Agency, United Nations, European Union and other relevant national and international authorities (chapter 322). These data make it possible to compare total average utility tariffs in South Africa with utilities in selected countries. The study, besides a number of more well-known comparisons parameters, utilises Power Purchase Parity and Credit Ratings for comparisons purposes. Part B Benchmarking of Eskom customer tariff categories against regional, developed and developing countries with focus on a comparison of customer categories tariff levels on average: municipality, large and medium industrial, residential, domestic etc. Each charge component comparisons include the consumers’ total average electricity unit cost by assuming typical customer profiles and assumptions. In order to compare price differences for different consumption volumes, typical standard consumers are defined for households and large and small industrial consumers. The standard consumers used are based on the standard consumers used by EU Statistics for comparing tariffs between member countries. This is provided for in Chapter 3. Part C Detailed comparison and discussion of tariff methodologies with a particular focus on a comparison and discussion of different tariff methodologies for a number of selected countries and utilities, see Chapter 4. This part carries out an analysis of selected countries in order to compare the tariff methodologies employed in these countries, the overriding factors in determining tariffs and how the choice of tariff methodology influences consumption for different consumer groups. Correct pricing is essential in the electricity sector in order to ensure an efficient allocation of new capacity and reduced demand. Tariffs should send the correct price signals to consumers, but remain practical for utilities and consumers. An appropriate or effective electricity tariff is not in itself capable of stimulating investment in the electricity sector, however, a poorly conceived pricing structure is often sufficient to depress investments. There are four criteria that should be met to achieve an effective tariff: Marginal costs are reflected in the tariff; Recovery of total costs; Ease of computation and transparency; and Fairness. Chapter 5 includes conclusion and a discussion of the findings, while chapter 6 include references.
REPORT Confidential Page No:12
1.2 COUNTRY SELECTION
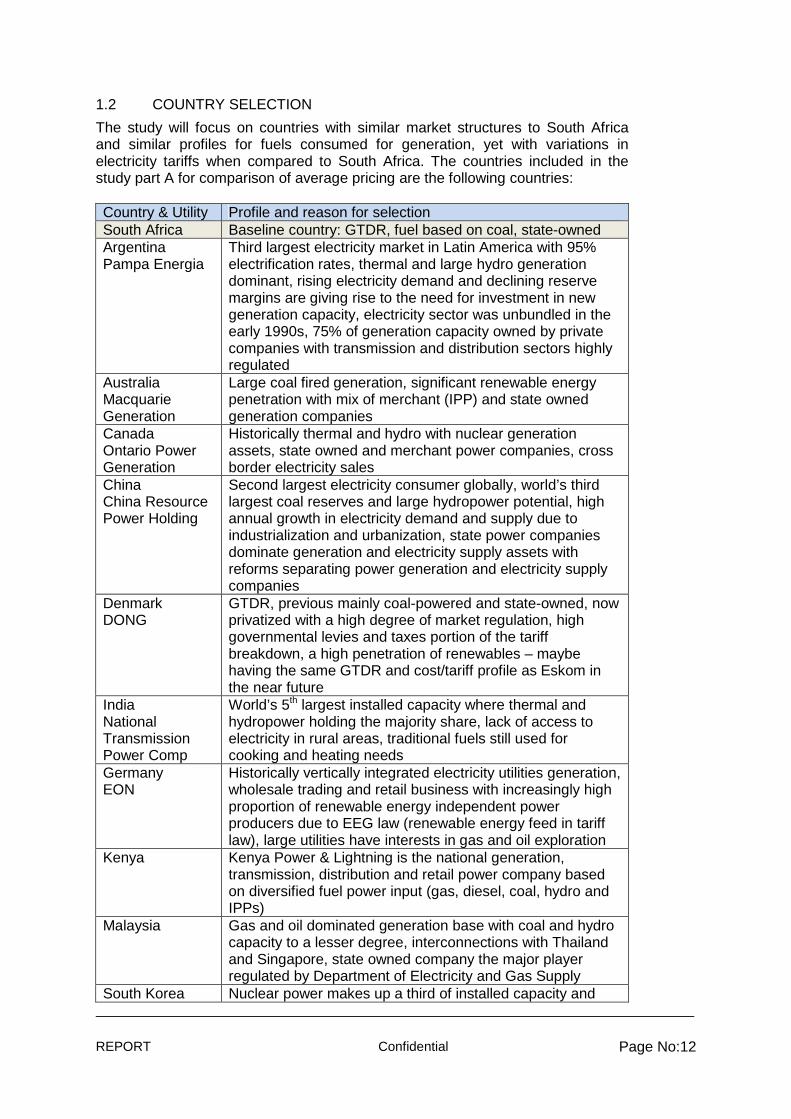
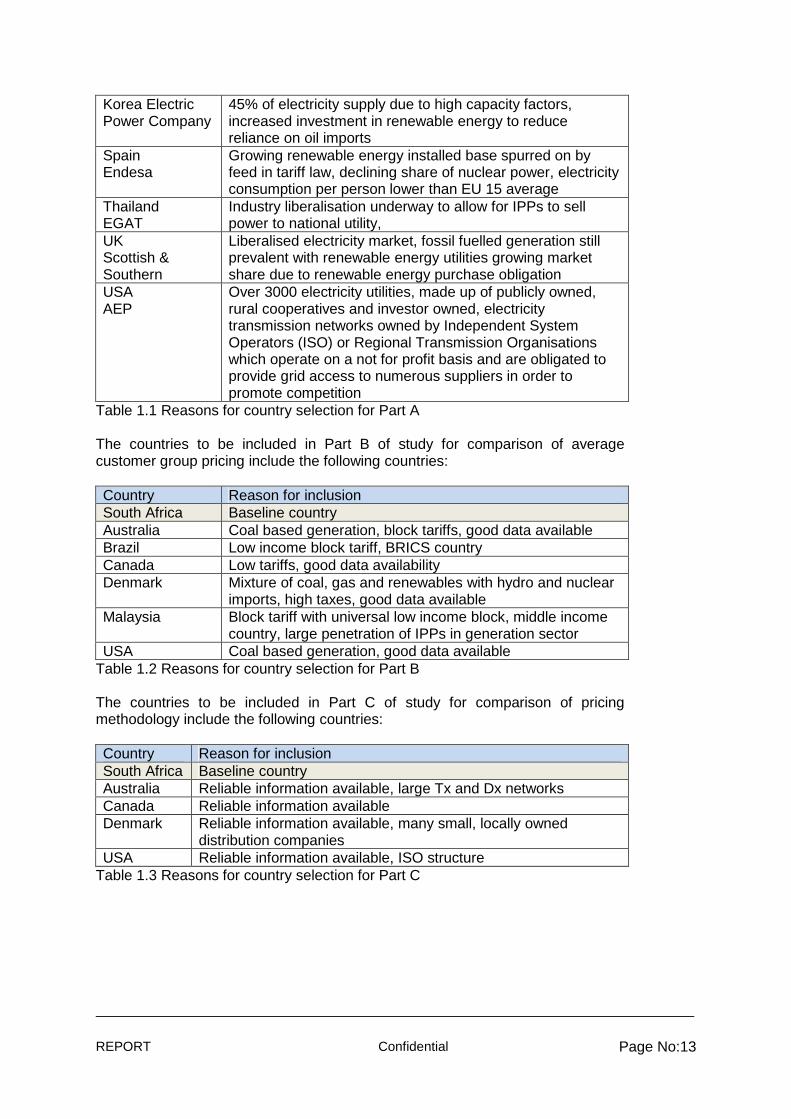
The study will focus on countries with similar market structures to South Africa and similar profiles for fuels consumed for generation, yet with variations in electricity tariffs when compared to South Africa. The countries included in the study part A for comparison of average pricing are the following countries: Country & Utility Profile and reason for selection South Africa Baseline country: GTDR, fuel based on coal, state-owned Argentina Pampa Energia
Third largest electricity market in Latin America with 95% electrification rates, thermal and large hydro generation dominant, rising electricity demand and declining reserve margins are giving rise to the need for investment in new generation capacity, electricity sector was unbundled in the early 1990s, 75% of generation capacity owned by private companies with transmission and distribution sectors highly regulated
Australia Macquarie Generation
Large coal fired generation, significant renewable energy penetration with mix of merchant (IPP) and state owned generation companies
Canada Ontario Power Generation
Historically thermal and hydro with nuclear generation assets, state owned and merchant power companies, cross border electricity sales
China China Resource Power Holding
Second largest electricity consumer globally, world’s third largest coal reserves and large hydropower potential, high annual growth in electricity demand and supply due to industrialization and urbanization, state power companies dominate generation and electricity supply assets with reforms separating power generation and electricity supply companies
Denmark DONG
GTDR, previous mainly coal-powered and state-owned, now privatized with a high degree of market regulation, high governmental levies and taxes portion of the tariff breakdown, a high penetration of renewables – maybe having the same GTDR and cost/tariff profile as Eskom in the near future
India National Transmission Power Comp
World’s 5th largest installed capacity where thermal and hydropower holding the majority share, lack of access to electricity in rural areas, traditional fuels still used for cooking and heating needs
Germany EON
Historically vertically integrated electricity utilities generation, wholesale trading and retail business with increasingly high proportion of renewable energy independent power producers due to EEG law (renewable energy feed in tariff law), large utilities have interests in gas and oil exploration
Kenya Kenya Power & Lightning is the national generation, transmission, distribution and retail power company based on diversified fuel power input (gas, diesel, coal, hydro and IPPs)
Malaysia Gas and oil dominated generation base with coal and hydro capacity to a lesser degree, interconnections with Thailand and Singapore, state owned company the major player regulated by Department of Electricity and Gas Supply
South Korea Nuclear power makes up a third of installed capacity and
REPORT Confidential Page No:13
Korea Electric Power Company
45% of electricity supply due to high capacity factors, increased investment in renewable energy to reduce reliance on oil imports
Spain Endesa
Growing renewable energy installed base spurred on by feed in tariff law, declining share of nuclear power, electricity consumption per person lower than EU 15 average
Thailand EGAT
Industry liberalisation underway to allow for IPPs to sell power to national utility,
UK Scottish & Southern
Liberalised electricity market, fossil fuelled generation still prevalent with renewable energy utilities growing market share due to renewable energy purchase obligation
USA AEP
Over 3000 electricity utilities, made up of publicly owned, rural cooperatives and investor owned, electricity transmission networks owned by Independent System Operators (ISO) or Regional Transmission Organisations which operate on a not for profit basis and are obligated to provide grid access to numerous suppliers in order to promote competition
Table 1.1 Reasons for country selection for Part A The countries to be included in Part B of study for comparison of average customer group pricing include the following countries: Country Reason for inclusion South Africa Baseline country Australia Coal based generation, block tariffs, good data available Brazil Low income block tariff, BRICS country Canada Low tariffs, good data availability Denmark Mixture of coal, gas and renewables with hydro and nuclear
imports, high taxes, good data available Malaysia Block tariff with universal low income block, middle income
country, large penetration of IPPs in generation sector USA Coal based generation, good data available
Table 1.2 Reasons for country selection for Part B The countries to be included in Part C of study for comparison of pricing methodology include the following countries: Country Reason for inclusion South Africa Baseline country Australia Reliable information available, large Tx and Dx networks Canada Reliable information available Denmark Reliable information available, many small, locally owned
distribution companies USA Reliable information available, ISO structure
Table 1.3 Reasons for country selection for Part C
REPORT Confidential Page No:14
2 PART A: BENCHMARKING OF ESKOM TOTAL AVERAGE TARIF F
The objective in this chapter is to benchmark Eskom total average tariff against regional, developed and developing countries with focus on an apples-versus-apples comparison of Eskom total average tariff (total regulated revenue divided by total sales volume) with that of other similar utilities in selected countries. Data from Annual Reports 2010 has been utilized1. This overall tariff comparison is provided in chapter 2.1. Four systemic sense-making factors qualify the comparative understanding of the total and GTDR average tariff levels and have been provided for in chapter 2.2. These contextual sense-making background factors provide a systemic approach to understanding the average total tariff levels and making relevant comparisons between the selected countries and utilities.
2.1 INTERNATIONAL AVERAGE TARIFF BENCHMARKING
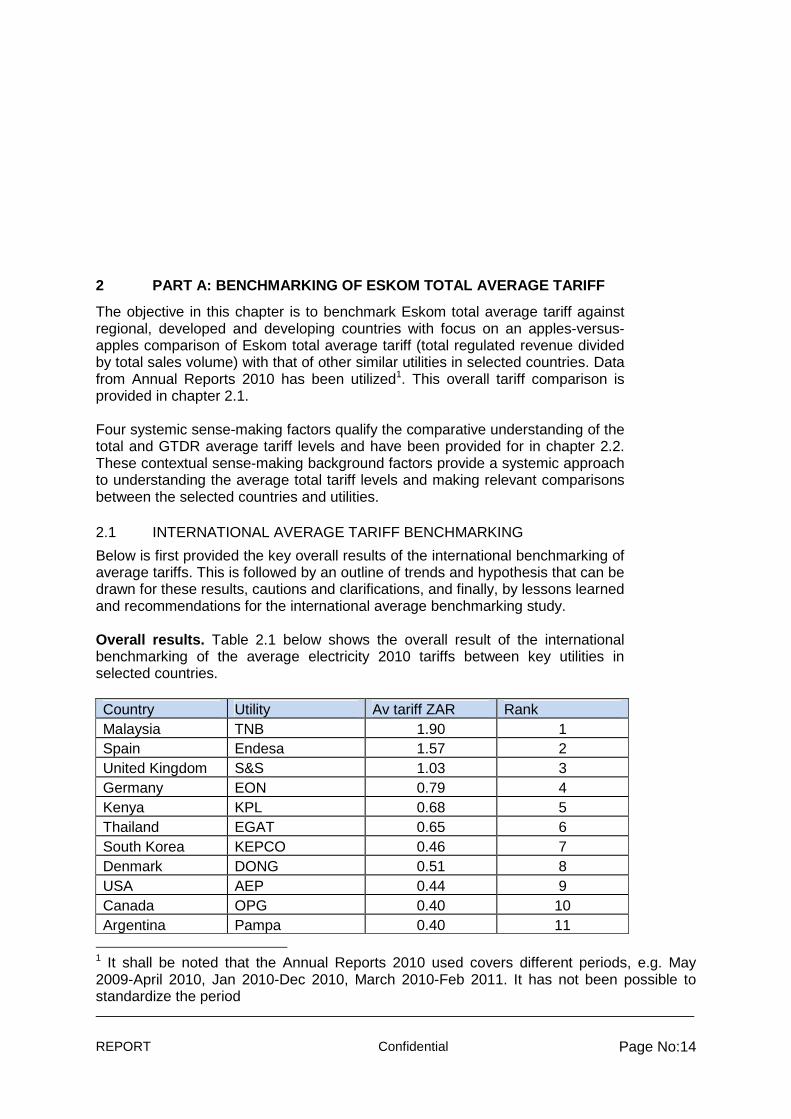
Below is first provided the key overall results of the international benchmarking of average tariffs. This is followed by an outline of trends and hypothesis that can be drawn for these results, cautions and clarifications, and finally, by lessons learned and recommendations for the international average benchmarking study. Overall results. Table 2.1 below shows the overall result of the international benchmarking of the average electricity 2010 tariffs between key utilities in selected countries. Country Utility Av tariff ZAR Rank Malaysia TNB 1.90 1 Spain Endesa 1.57 2 United Kingdom S&S 1.03 3 Germany EON 0.79 4 Kenya KPL 0.68 5 Thailand EGAT 0.65 6 South Korea KEPCO 0.46 7 Denmark DONG 0.51 8 USA AEP 0.44 9 Canada OPG 0.40 10 Argentina Pampa 0.40 11
1 It shall be noted that the Annual Reports 2010 used covers different periods, e.g. May 2009-April 2010, Jan 2010-Dec 2010, March 2010-Feb 2011. It has not been possible to standardize the period
REPORT Confidential Page No:15
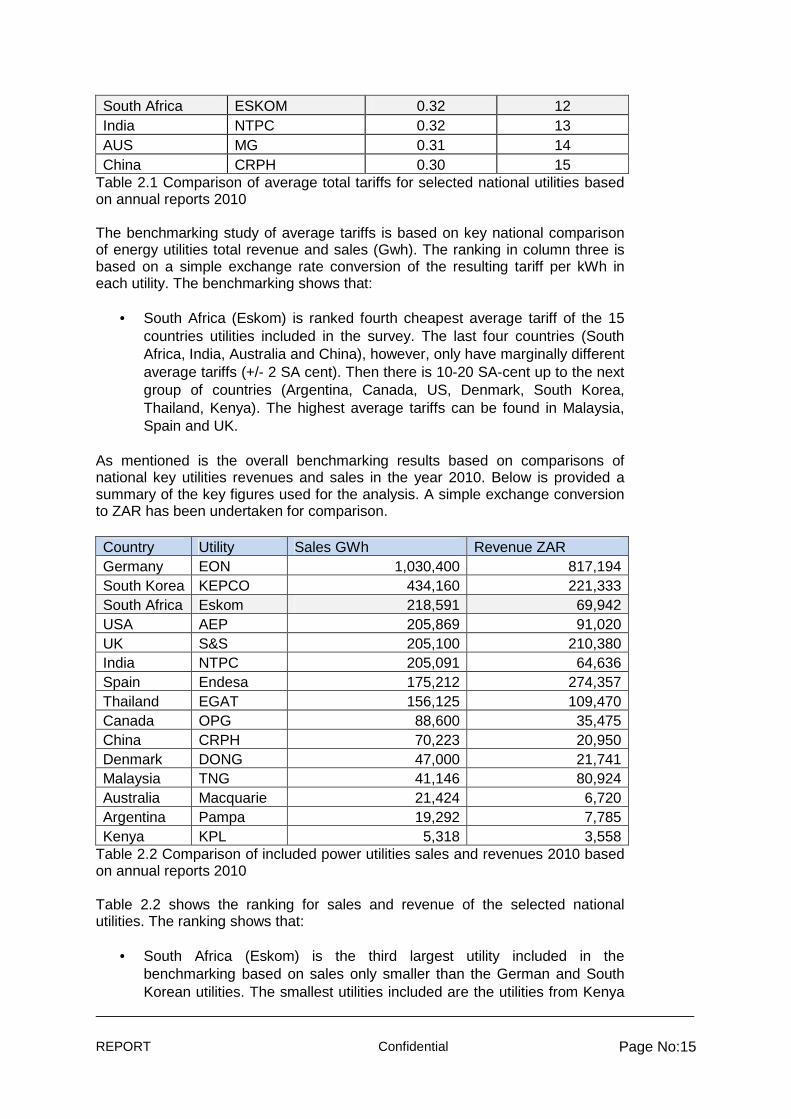
South Africa ESKOM 0.32 12 India NTPC 0.32 13 AUS MG 0.31 14 China CRPH 0.30 15
Table 2.1 Comparison of average total tariffs for selected national utilities based on annual reports 2010 The benchmarking study of average tariffs is based on key national comparison of energy utilities total revenue and sales (Gwh). The ranking in column three is based on a simple exchange rate conversion of the resulting tariff per kWh in each utility. The benchmarking shows that:
• South Africa (Eskom) is ranked fourth cheapest average tariff of the 15 countries utilities included in the survey. The last four countries (South Africa, India, Australia and China), however, only have marginally different average tariffs (+/- 2 SA cent). Then there is 10-20 SA-cent up to the next group of countries (Argentina, Canada, US, Denmark, South Korea, Thailand, Kenya). The highest average tariffs can be found in Malaysia, Spain and UK.
As mentioned is the overall benchmarking results based on comparisons of national key utilities revenues and sales in the year 2010. Below is provided a summary of the key figures used for the analysis. A simple exchange conversion to ZAR has been undertaken for comparison. Country Utility Sales GWh Revenue ZAR Germany EON 1,030,400 817,194 South Korea KEPCO 434,160 221,333 South Africa Eskom 218,591 69,942 USA AEP 205,869 91,020 UK S&S 205,100 210,380 India NTPC 205,091 64,636 Spain Endesa 175,212 274,357 Thailand EGAT 156,125 109,470 Canada OPG 88,600 35,475 China CRPH 70,223 20,950 Denmark DONG 47,000 21,741 Malaysia TNG 41,146 80,924 Australia Macquarie 21,424 6,720 Argentina Pampa 19,292 7,785 Kenya KPL 5,318 3,558
Table 2.2 Comparison of included power utilities sales and revenues 2010 based on annual reports 2010 Table 2.2 shows the ranking for sales and revenue of the selected national utilities. The ranking shows that:
• South Africa (Eskom) is the third largest utility included in the benchmarking based on sales only smaller than the German and South Korean utilities. The smallest utilities included are the utilities from Kenya
REPORT Confidential Page No:16
Argentina and Australia. The ranking show poor relation between sales and revenue
• South Africa’s sales / revenue factor is around 3, while most of the remaining have a factor 2 or even (much) lower.
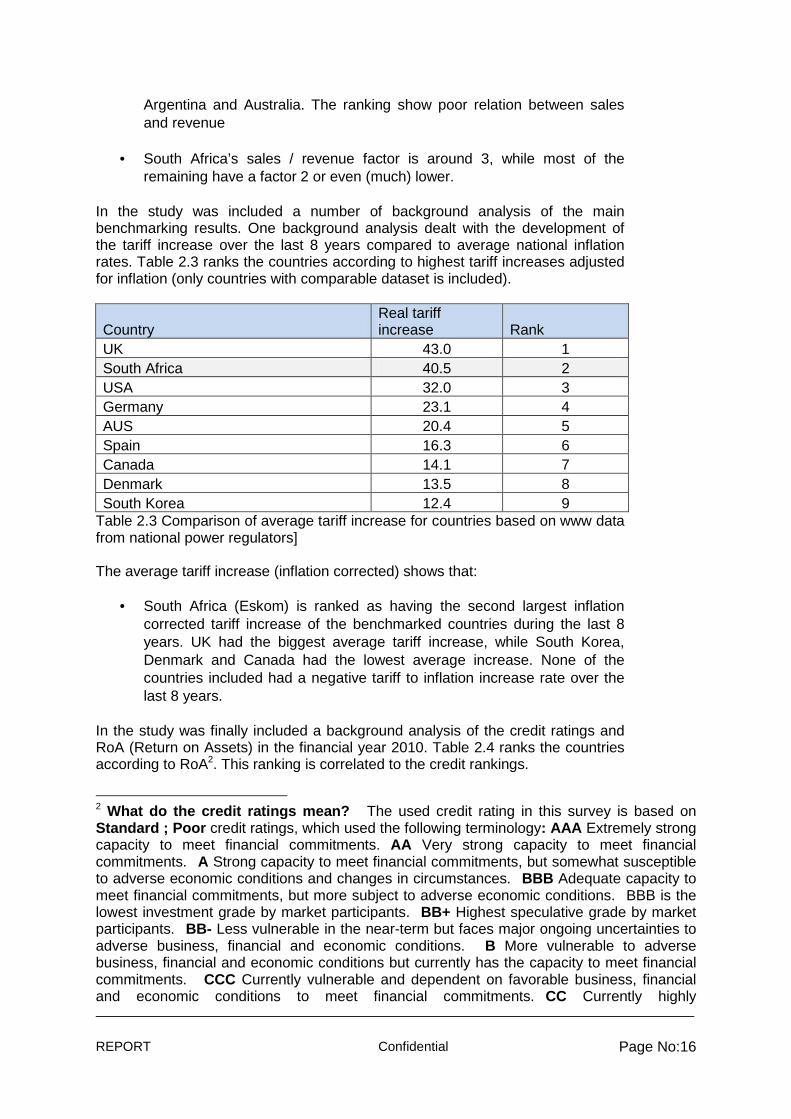
In the study was included a number of background analysis of the main benchmarking results. One background analysis dealt with the development of the tariff increase over the last 8 years compared to average national inflation rates. Table 2.3 ranks the countries according to highest tariff increases adjusted for inflation (only countries with comparable dataset is included).
Country Real tariff increase Rank
UK 43.0 1 South Africa 40.5 2 USA 32.0 3 Germany 23.1 4 AUS 20.4 5 Spain 16.3 6 Canada 14.1 7 Denmark 13.5 8 South Korea 12.4 9
Table 2.3 Comparison of average tariff increase for countries based on www data from national power regulators] The average tariff increase (inflation corrected) shows that:
• South Africa (Eskom) is ranked as having the second largest inflation corrected tariff increase of the benchmarked countries during the last 8 years. UK had the biggest average tariff increase, while South Korea, Denmark and Canada had the lowest average increase. None of the countries included had a negative tariff to inflation increase rate over the last 8 years.
In the study was finally included a background analysis of the credit ratings and RoA (Return on Assets) in the financial year 2010. Table 2.4 ranks the countries according to RoA2. This ranking is correlated to the credit rankings.
2 What do the credit ratings mean? �The used credit rating in this survey is based on Standard ; Poor credit ratings, which used the following terminology: AAA Extremely strong capacity to meet financial commitments. AA Very strong capacity to meet financial commitments.�A Strong capacity to meet financial commitments, but somewhat susceptible to adverse economic conditions and changes in circumstances.�BBB Adequate capacity to meet financial commitments, but more subject to adverse economic conditions.�BBB is the lowest investment grade by market participants.�BB+ Highest speculative grade by market participants.�BB- Less vulnerable in the near-term but faces major ongoing uncertainties to adverse business, financial and economic conditions. �B More vulnerable to adverse business, financial and economic conditions but currently has the capacity to meet financial commitments. �CCC Currently vulnerable and dependent on favorable business, financial and economic conditions to meet financial commitments.�CC Currently highly
REPORT Confidential Page No:17
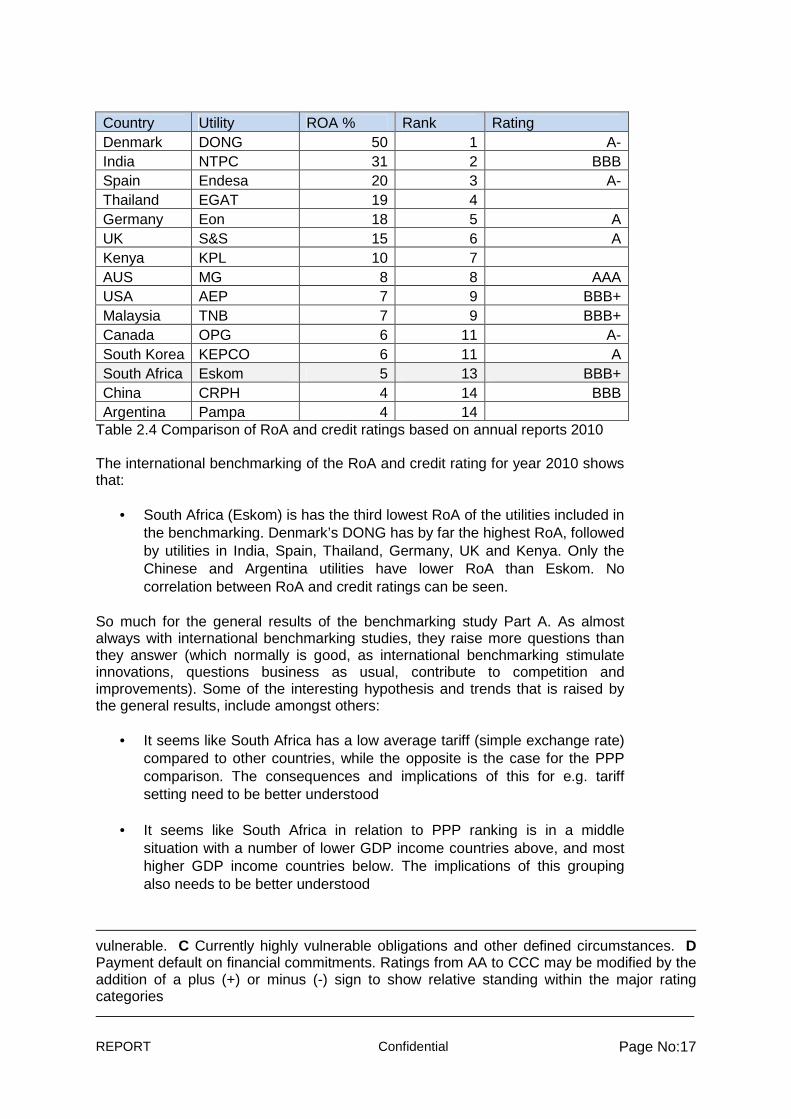
Country Utility ROA % Rank Rating Denmark DONG 50 1 A- India NTPC 31 2 BBB Spain Endesa 20 3 A- Thailand EGAT 19 4 Germany Eon 18 5 A UK S&S 15 6 A Kenya KPL 10 7 AUS MG 8 8 AAA USA AEP 7 9 BBB+ Malaysia TNB 7 9 BBB+ Canada OPG 6 11 A- South Korea KEPCO 6 11 A South Africa Eskom 5 13 BBB+ China CRPH 4 14 BBB Argentina Pampa 4 14
Table 2.4 Comparison of RoA and credit ratings based on annual reports 2010 The international benchmarking of the RoA and credit rating for year 2010 shows that:
• South Africa (Eskom) is has the third lowest RoA of the utilities included in the benchmarking. Denmark’s DONG has by far the highest RoA, followed by utilities in India, Spain, Thailand, Germany, UK and Kenya. Only the Chinese and Argentina utilities have lower RoA than Eskom. No correlation between RoA and credit ratings can be seen.
So much for the general results of the benchmarking study Part A. As almost always with international benchmarking studies, they raise more questions than they answer (which normally is good, as international benchmarking stimulate innovations, questions business as usual, contribute to competition and improvements). Some of the interesting hypothesis and trends that is raised by the general results, include amongst others:
• It seems like South Africa has a low average tariff (simple exchange rate) compared to other countries, while the opposite is the case for the PPP comparison. The consequences and implications of this for e.g. tariff setting need to be better understood
• It seems like South Africa in relation to PPP ranking is in a middle situation with a number of lower GDP income countries above, and most higher GDP income countries below. The implications of this grouping also needs to be better understood
vulnerable.�C Currently highly vulnerable obligations and other defined circumstances.�D Payment default on financial commitments. Ratings from AA to CCC may be modified by the addition of a plus (+) or minus (-) sign to show relative standing within the major rating categories
REPORT Confidential Page No:18
• It seems like there is an uncorrelated relation with utilities key parameters (e.g. sales, revenue, etc) and RoA. Likewise it seems like there is no correlation between RoA and credit ratings. What are the underlying reasons for these non-correlations?
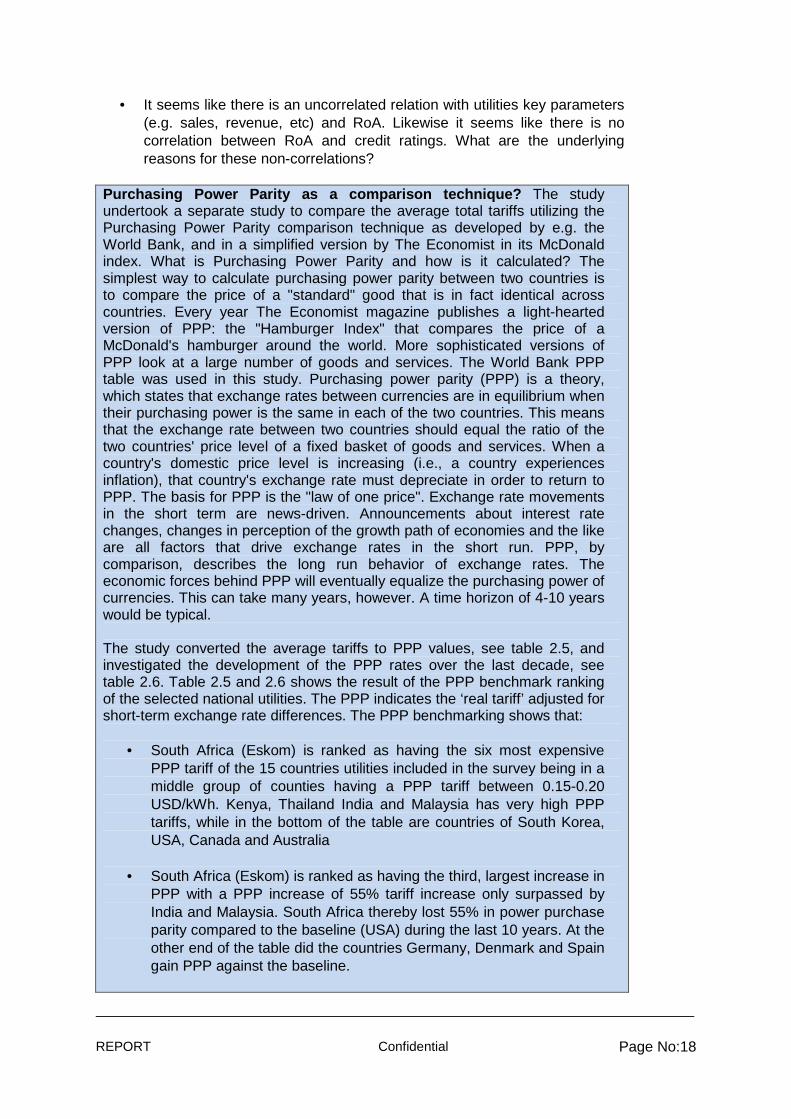
Purchasing Power Parity as a comparison technique? The study undertook a separate study to compare the average total tariffs utilizing the Purchasing Power Parity comparison technique as developed by e.g. the World Bank, and in a simplified version by The Economist in its McDonald index. What is Purchasing Power Parity and how is it calculated? The simplest way to calculate purchasing power parity between two countries is to compare the price of a "standard" good that is in fact identical across countries. Every year The Economist magazine publishes a light-hearted version of PPP: the "Hamburger Index" that compares the price of a McDonald's hamburger around the world. More sophisticated versions of PPP look at a large number of goods and services. The World Bank PPP table was used in this study. Purchasing power parity (PPP) is a theory, which states that exchange rates between currencies are in equilibrium when their purchasing power is the same in each of the two countries. This means that the exchange rate between two countries should equal the ratio of the two countries' price level of a fixed basket of goods and services. When a country's domestic price level is increasing (i.e., a country experiences inflation), that country's exchange rate must depreciate in order to return to PPP. The basis for PPP is the "law of one price". Exchange rate movements in the short term are news-driven. Announcements about interest rate changes, changes in perception of the growth path of economies and the like are all factors that drive exchange rates in the short run. PPP, by comparison, describes the long run behavior of exchange rates. The economic forces behind PPP will eventually equalize the purchasing power of currencies. This can take many years, however. A time horizon of 4-10 years would be typical. The study converted the average tariffs to PPP values, see table 2.5, and investigated the development of the PPP rates over the last decade, see table 2.6. Table 2.5 and 2.6 shows the result of the PPP benchmark ranking of the selected national utilities. The PPP indicates the ‘real tariff’ adjusted for short-term exchange rate differences. The PPP benchmarking shows that:
• South Africa (Eskom) is ranked as having the six most expensive PPP tariff of the 15 countries utilities included in the survey being in a middle group of counties having a PPP tariff between 0.15-0.20 USD/kWh. Kenya, Thailand India and Malaysia has very high PPP tariffs, while in the bottom of the table are countries of South Korea, USA, Canada and Australia
• South Africa (Eskom) is ranked as having the third, largest increase in PPP with a PPP increase of 55% tariff increase only surpassed by India and Malaysia. South Africa thereby lost 55% in power purchase parity compared to the baseline (USA) during the last 10 years. At the other end of the table did the countries Germany, Denmark and Spain gain PPP against the baseline.
REPORT Confidential Page No:19
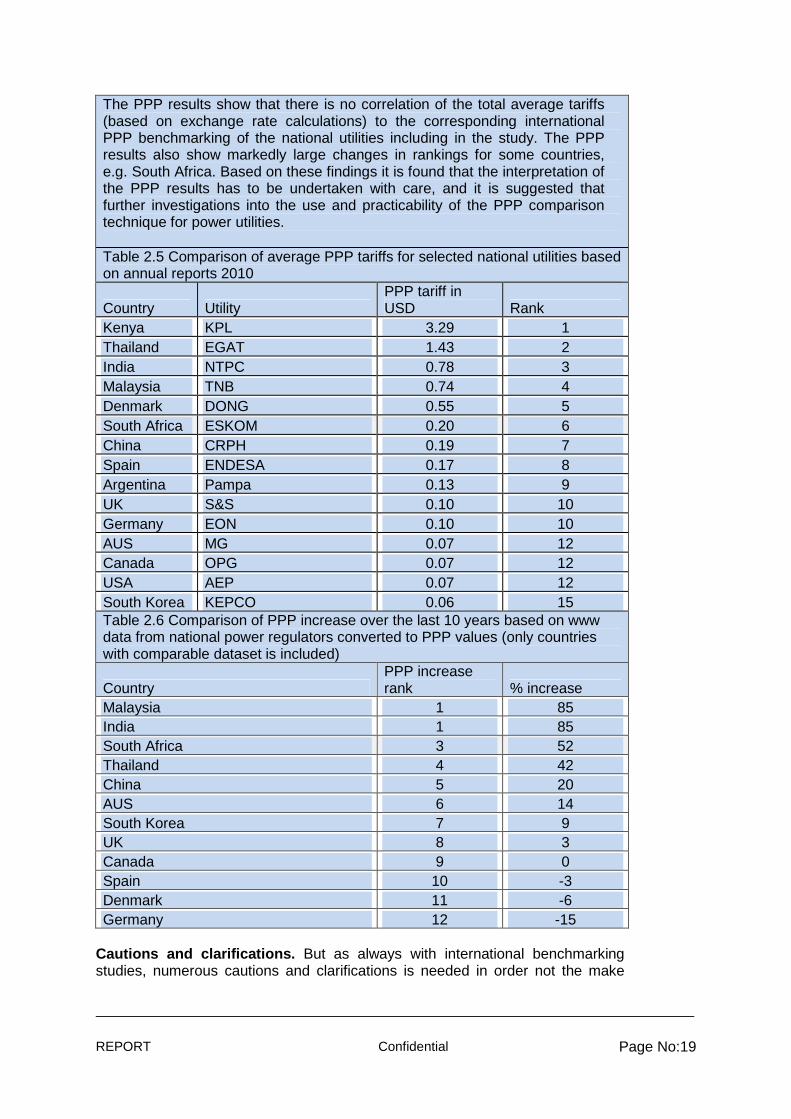
The PPP results show that there is no correlation of the total average tariffs (based on exchange rate calculations) to the corresponding international PPP benchmarking of the national utilities including in the study. The PPP results also show markedly large changes in rankings for some countries, e.g. South Africa. Based on these findings it is found that the interpretation of the PPP results has to be undertaken with care, and it is suggested that further investigations into the use and practicability of the PPP comparison technique for power utilities. Table 2.5 Comparison of average PPP tariffs for selected national utilities based on annual reports 2010
Country Utility PPP tariff in USD Rank
Kenya KPL 3.29 1 Thailand EGAT 1.43 2 India NTPC 0.78 3 Malaysia TNB 0.74 4 Denmark DONG 0.55 5 South Africa ESKOM 0.20 6 China CRPH 0.19 7 Spain ENDESA 0.17 8 Argentina Pampa 0.13 9 UK S&S 0.10 10 Germany EON 0.10 10 AUS MG 0.07 12 Canada OPG 0.07 12 USA AEP 0.07 12 South Korea KEPCO 0.06 15 Table 2.6 Comparison of PPP increase over the last 10 years based on www data from national power regulators converted to PPP values (only countries with comparable dataset is included)
Country PPP increase rank % increase
Malaysia 1 85 India 1 85 South Africa 3 52 Thailand 4 42 China 5 20 AUS 6 14 South Korea 7 9 UK 8 3 Canada 9 0 Spain 10 -3 Denmark 11 -6 Germany 12 -15
Cautions and clarifications. But as always with international benchmarking studies, numerous cautions and clarifications is needed in order not the make
REPORT Confidential Page No:20
miss-interpretations of the results. In this benchmarking studies attention should be guided towards:
• The (new/innovative) use of selected national power utilities as base for the international benchmarking. This has provided new results, but also showed the difficulties and need for further detailing of such studies: The different structuring of Annual Reports, the difficulties in separating Generation, Transmission, Distribution and Retail in the figures provided in the Annual Reports, lack of clarity in most Annual Report on what revenue contains, e.g. exploration, market sales, transmission sales delinked from own generation, etc (the lack of correlation between sales and revenues in table 2.3 is an indicator hereof)
• The use of simple exchange rate and PPP rates in the benchmarking contributes to increased nuances in interpretations, but also decreased clarity
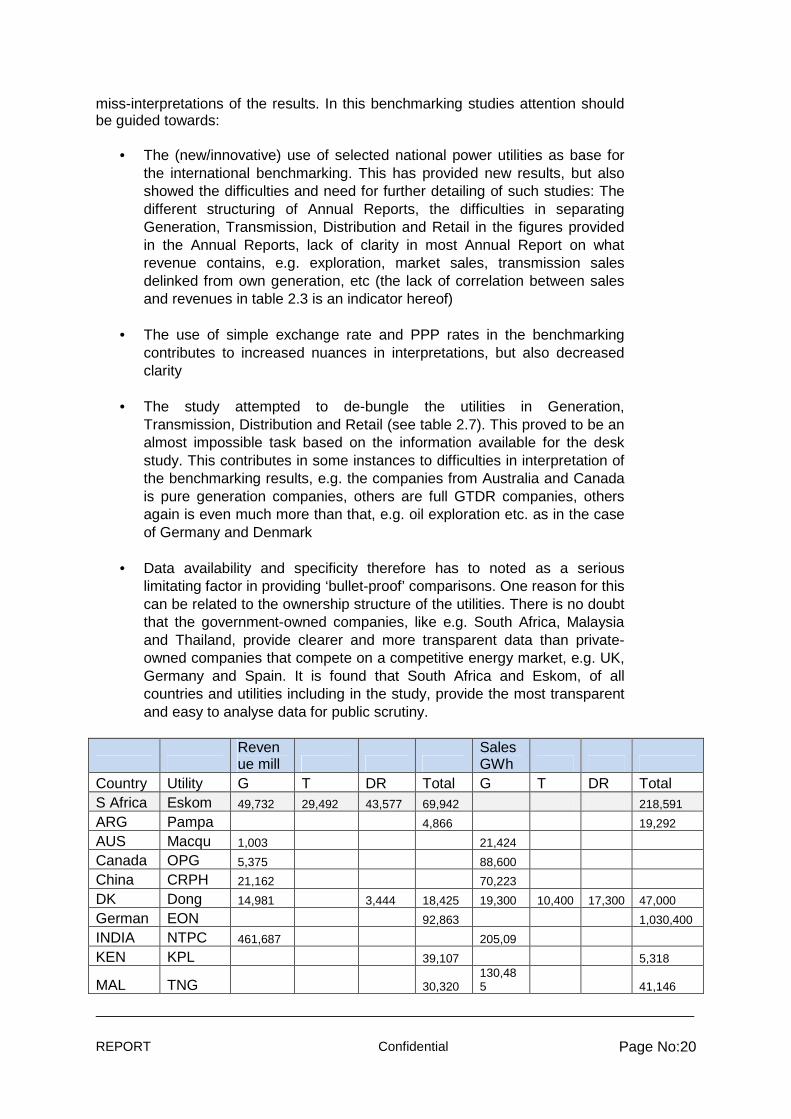
• The study attempted to de-bungle the utilities in Generation, Transmission, Distribution and Retail (see table 2.7). This proved to be an almost impossible task based on the information available for the desk study. This contributes in some instances to difficulties in interpretation of the benchmarking results, e.g. the companies from Australia and Canada is pure generation companies, others are full GTDR companies, others again is even much more than that, e.g. oil exploration etc. as in the case of Germany and Denmark
• Data availability and specificity therefore has to noted as a serious limitating factor in providing ‘bullet-proof’ comparisons. One reason for this can be related to the ownership structure of the utilities. There is no doubt that the government-owned companies, like e.g. South Africa, Malaysia and Thailand, provide clearer and more transparent data than private-owned companies that compete on a competitive energy market, e.g. UK, Germany and Spain. It is found that South Africa and Eskom, of all countries and utilities including in the study, provide the most transparent and easy to analyse data for public scrutiny.
Revenue mill
Sales GWh
Country Utility G T DR Total G T DR Total S Africa Eskom 49,732 29,492 43,577 69,942 218,591
ARG Pampa 4,866 19,292
AUS Macqu 1,003 21,424
Canada OPG 5,375 88,600
China CRPH 21,162 70,223
DK Dong 14,981 3,444 18,425 19,300 10,400 17,300 47,000
German EON 92,863 1,030,400
INDIA NTPC 461,687 205,09
KEN KPL 39,107 5,318
MAL TNG 30,320 130,485 41,146
REPORT Confidential Page No:21
S Korea KEPCO 38,161 434,160
Spain Endesa 31,177 175,212
Thai EGAT 405,445 71,205 156125
UK S&S 20,465 205,100
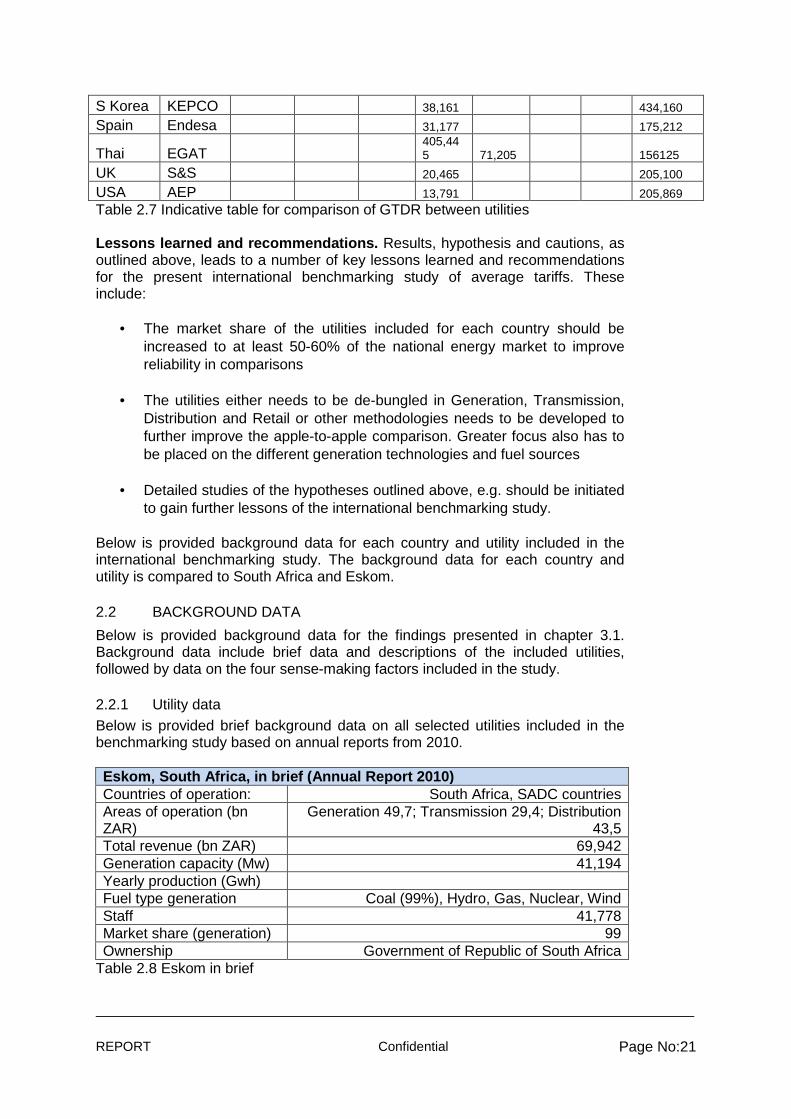
USA AEP 13,791 205,869 Table 2.7 Indicative table for comparison of GTDR between utilities Lessons learned and recommendations. Results, hypothesis and cautions, as outlined above, leads to a number of key lessons learned and recommendations for the present international benchmarking study of average tariffs. These include:
• The market share of the utilities included for each country should be increased to at least 50-60% of the national energy market to improve reliability in comparisons
• The utilities either needs to be de-bungled in Generation, Transmission, Distribution and Retail or other methodologies needs to be developed to further improve the apple-to-apple comparison. Greater focus also has to be placed on the different generation technologies and fuel sources
• Detailed studies of the hypotheses outlined above, e.g. should be initiated to gain further lessons of the international benchmarking study.
Below is provided background data for each country and utility included in the international benchmarking study. The background data for each country and utility is compared to South Africa and Eskom.
2.2 BACKGROUND DATA
Below is provided background data for the findings presented in chapter 3.1. Background data include brief data and descriptions of the included utilities, followed by data on the four sense-making factors included in the study.
2.2.1 Utility data Below is provided brief background data on all selected utilities included in the benchmarking study based on annual reports from 2010. Eskom, South Africa, in brief (Annual Report 2010) Countries of operation: South Africa, SADC countries Areas of operation (bn ZAR)
Generation 49,7; Transmission 29,4; Distribution 43,5
Total revenue (bn ZAR) 69,942 Generation capacity (Mw) 41,194 Yearly production (Gwh) Fuel type generation Coal (99%), Hydro, Gas, Nuclear, Wind Staff 41,778 Market share (generation) 99 Ownership Government of Republic of South Africa
Table 2.8 Eskom in brief
REPORT Confidential Page No:22
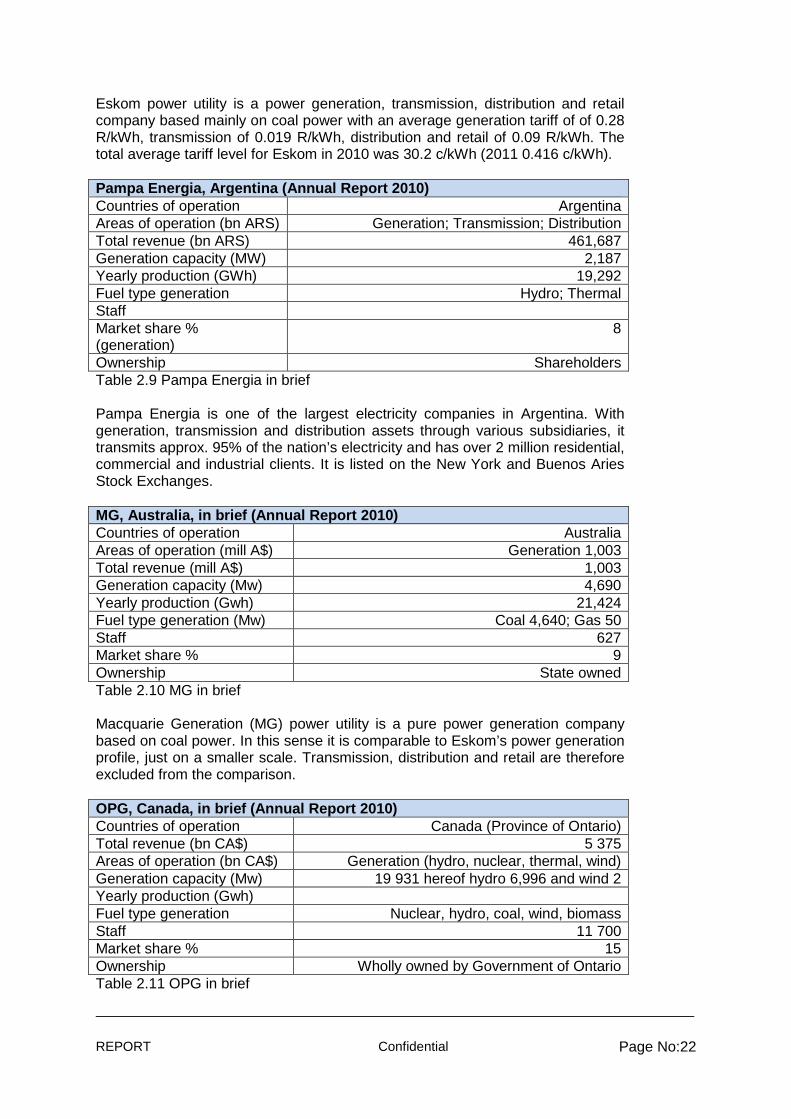
Eskom power utility is a power generation, transmission, distribution and retail company based mainly on coal power with an average generation tariff of of 0.28 R/kWh, transmission of 0.019 R/kWh, distribution and retail of 0.09 R/kWh. The total average tariff level for Eskom in 2010 was 30.2 c/kWh (2011 0.416 c/kWh). Pampa Energia, Argentina (Annual Report 2010) Countries of operation Argentina Areas of operation (bn ARS) Generation; Transmission; Distribution Total revenue (bn ARS) 461,687 Generation capacity (MW) 2,187 Yearly production (GWh) 19,292 Fuel type generation Hydro; Thermal Staff Market share % (generation)
8
Ownership Shareholders Table 2.9 Pampa Energia in brief Pampa Energia is one of the largest electricity companies in Argentina. With generation, transmission and distribution assets through various subsidiaries, it transmits approx. 95% of the nation’s electricity and has over 2 million residential, commercial and industrial clients. It is listed on the New York and Buenos Aries Stock Exchanges. MG, Australia, in brief (Annual Report 2010) Countries of operation Australia Areas of operation (mill A$) Generation 1,003 Total revenue (mill A$) 1,003 Generation capacity (Mw) 4,690 Yearly production (Gwh) 21,424 Fuel type generation (Mw) Coal 4,640; Gas 50 Staff 627 Market share % 9 Ownership State owned Table 2.10 MG in brief Macquarie Generation (MG) power utility is a pure power generation company based on coal power. In this sense it is comparable to Eskom’s power generation profile, just on a smaller scale. Transmission, distribution and retail are therefore excluded from the comparison. OPG, Canada, in brief (Annual Report 2010) Countries of operation Canada (Province of Ontario) Total revenue (bn CA$) 5 375 Areas of operation (bn CA$) Generation (hydro, nuclear, thermal, wind) Generation capacity (Mw) 19 931 hereof hydro 6,996 and wind 2 Yearly production (Gwh) Fuel type generation Nuclear, hydro, coal, wind, biomass Staff 11 700 Market share % 15 Ownership Wholly owned by Government of Ontario Table 2.11 OPG in brief
REPORT Confidential Page No:23
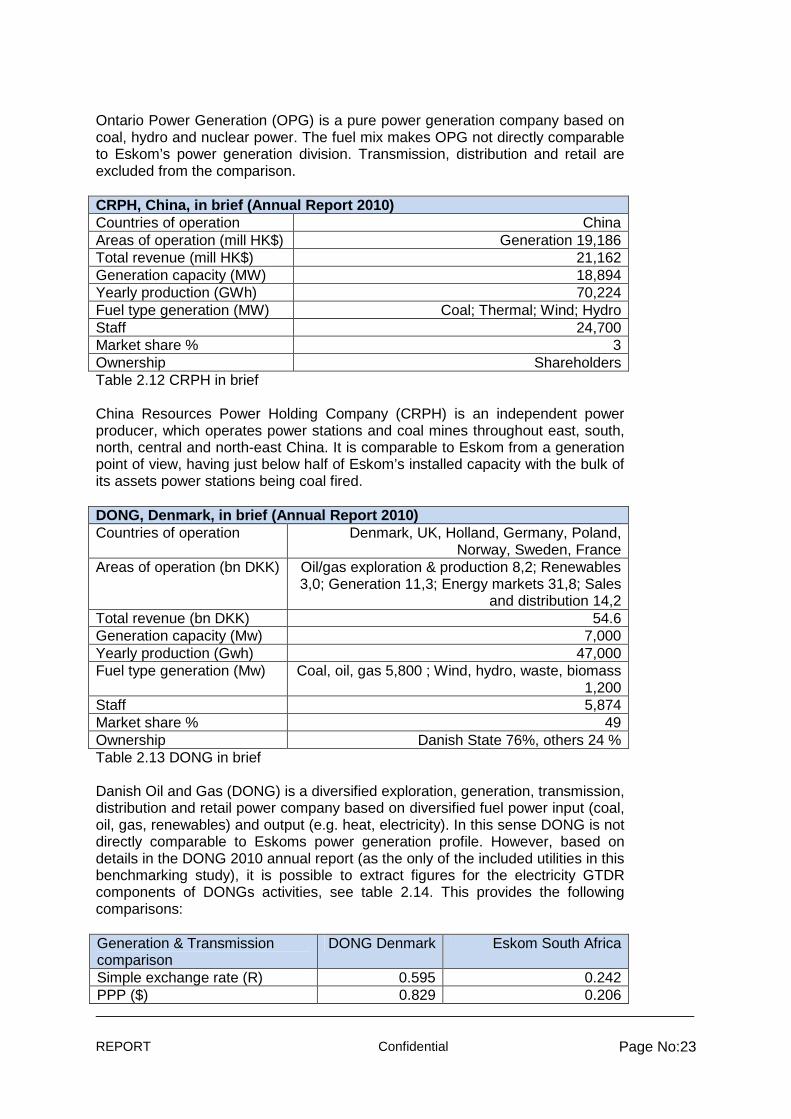
Ontario Power Generation (OPG) is a pure power generation company based on coal, hydro and nuclear power. The fuel mix makes OPG not directly comparable to Eskom’s power generation division. Transmission, distribution and retail are excluded from the comparison. CRPH, China, in brief (Annual Report 2010) Countries of operation China Areas of operation (mill HK$) Generation 19,186 Total revenue (mill HK$) 21,162 Generation capacity (MW) 18,894 Yearly production (GWh) 70,224 Fuel type generation (MW) Coal; Thermal; Wind; Hydro Staff 24,700 Market share % 3 Ownership Shareholders Table 2.12 CRPH in brief China Resources Power Holding Company (CRPH) is an independent power producer, which operates power stations and coal mines throughout east, south, north, central and north-east China. It is comparable to Eskom from a generation point of view, having just below half of Eskom’s installed capacity with the bulk of its assets power stations being coal fired. DONG, Denmark, in brief (Annual Report 2010) Countries of operation Denmark, UK, Holland, Germany, Poland,
Norway, Sweden, France Areas of operation (bn DKK) Oil/gas exploration & production 8,2; Renewables
3,0; Generation 11,3; Energy markets 31,8; Sales and distribution 14,2
Total revenue (bn DKK) 54.6 Generation capacity (Mw) 7,000 Yearly production (Gwh) 47,000 Fuel type generation (Mw) Coal, oil, gas 5,800 ; Wind, hydro, waste, biomass
1,200 Staff 5,874 Market share % 49 Ownership Danish State 76%, others 24 % Table 2.13 DONG in brief Danish Oil and Gas (DONG) is a diversified exploration, generation, transmission, distribution and retail power company based on diversified fuel power input (coal, oil, gas, renewables) and output (e.g. heat, electricity). In this sense DONG is not directly comparable to Eskoms power generation profile. However, based on details in the DONG 2010 annual report (as the only of the included utilities in this benchmarking study), it is possible to extract figures for the electricity GTDR components of DONGs activities, see table 2.14. This provides the following comparisons: Generation & Transmission comparison
DONG Denmark Eskom South Africa
Simple exchange rate (R) 0.595 0.242 PPP ($) 0.829 0.206
REPORT Confidential Page No:24
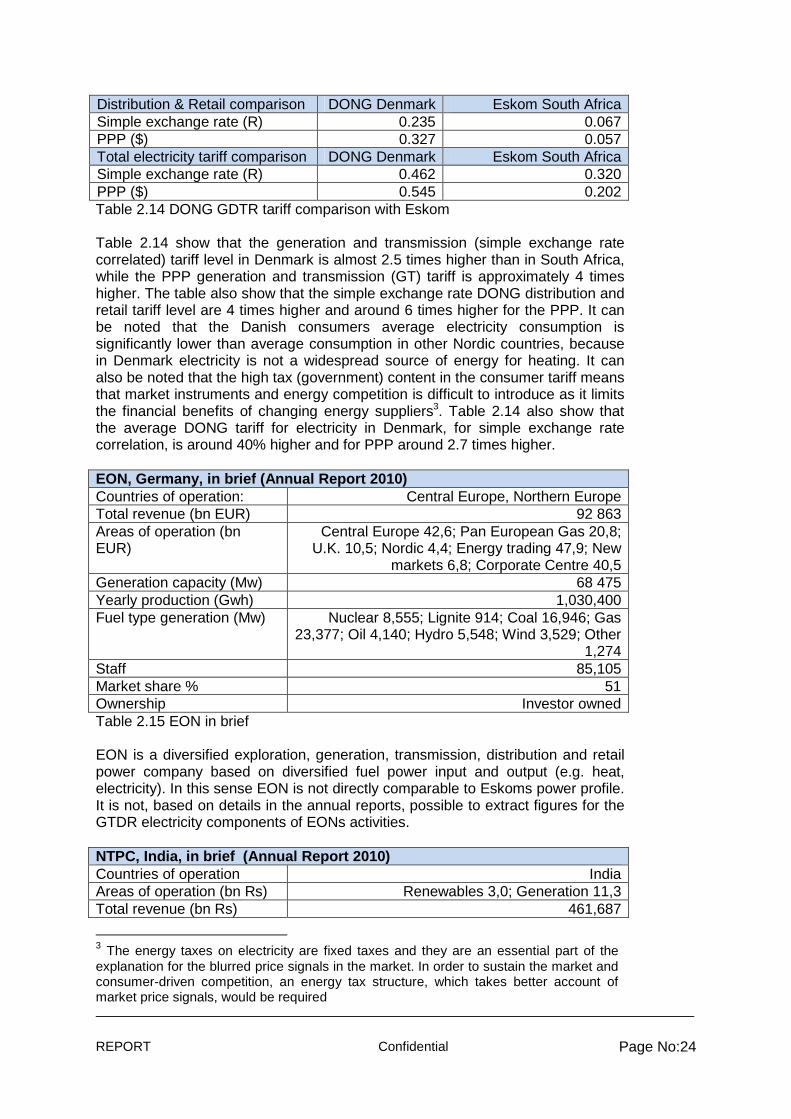
Distribution & Retail comparison DONG Denmark Eskom South Africa Simple exchange rate (R) 0.235 0.067 PPP ($) 0.327 0.057 Total electricity tariff comparison DONG Denmark Eskom South Africa Simple exchange rate (R) 0.462 0.320 PPP ($) 0.545 0.202 Table 2.14 DONG GDTR tariff comparison with Eskom Table 2.14 show that the generation and transmission (simple exchange rate correlated) tariff level in Denmark is almost 2.5 times higher than in South Africa, while the PPP generation and transmission (GT) tariff is approximately 4 times higher. The table also show that the simple exchange rate DONG distribution and retail tariff level are 4 times higher and around 6 times higher for the PPP. It can be noted that the Danish consumers average electricity consumption is significantly lower than average consumption in other Nordic countries, because in Denmark electricity is not a widespread source of energy for heating. It can also be noted that the high tax (government) content in the consumer tariff means that market instruments and energy competition is difficult to introduce as it limits the financial benefits of changing energy suppliers3. Table 2.14 also show that the average DONG tariff for electricity in Denmark, for simple exchange rate correlation, is around 40% higher and for PPP around 2.7 times higher. EON, Germany, in brief (Annual Report 2010) Countries of operation: Central Europe, Northern Europe Total revenue (bn EUR) 92 863 Areas of operation (bn EUR)
Central Europe 42,6; Pan European Gas 20,8; U.K. 10,5; Nordic 4,4; Energy trading 47,9; New
markets 6,8; Corporate Centre 40,5 Generation capacity (Mw) 68 475 Yearly production (Gwh) 1,030,400 Fuel type generation (Mw) Nuclear 8,555; Lignite 914; Coal 16,946; Gas
23,377; Oil 4,140; Hydro 5,548; Wind 3,529; Other 1,274
Staff 85,105 Market share % 51 Ownership Investor owned Table 2.15 EON in brief EON is a diversified exploration, generation, transmission, distribution and retail power company based on diversified fuel power input and output (e.g. heat, electricity). In this sense EON is not directly comparable to Eskoms power profile. It is not, based on details in the annual reports, possible to extract figures for the GTDR electricity components of EONs activities. NTPC, India, in brief (Annual Report 2010) Countries of operation India Areas of operation (bn Rs) Renewables 3,0; Generation 11,3 Total revenue (bn Rs) 461,687
3 The energy taxes on electricity are fixed taxes and they are an essential part of the explanation for the blurred price signals in the market. In order to sustain the market and consumer-driven competition, an energy tax structure, which takes better account of market price signals, would be required
REPORT Confidential Page No:25
Generation capacity (MW) 28,840 Year production (mill units) 205091 Fuel type generation Coal, gas, liquid fuel Staff 23,743 Market share % 16 Ownership State owned (84.5%) shareholders (15.5%) Table 2.16 NTPC in brief NTPC, the largest state owned energy provider’s business area is power generation. The bulk of its generation assets are thermal fired with its geographic footprint being nationwide. Increasingly it is looking to diversify its fuel composition by introducing hydro and nuclear. KPL, Kenya, in brief (Annual report 2010) Countries of operation Kenya Total revenue (mil Kshs) 39,107 Areas of operation Generation, Transmission, Distribution, Retail Generation capacity (Mw) 1,593 Yearly production (Gwh) 5,318 Fuel type generation MW Gas/diesel 259; Hydro 763; IPPs 347; Others Staff 7,279 Market share % Ownership State owned Table 2.17 KPL in brief Kenya Power & Lightning (KPL) power utility is a national generation, transmission, distribution and retail power company based on diversified fuel power input (gas, diesel, coal, hydro and IPPs). In this sense KPL is comparable to Eskoms power profile. It is not, based on details in the annual reports, possible to extract figures for the GTDR electricity components of KPLs activities. TNB, Malaysia, in brief (Annual report 2010) Countries of operation: Malaysia Total revenue (bil MYR) 30,320 Areas of operation Generation, Transmission, Distribution Generation capacity (Mw) 9,109 Yearly production (Gwh) 41,146 Fuel type generation MW - %
Thermal 7,199; Hydro 1,911; Gas 53.1%; Coal 34.1%; Hydro 12.5%
Staff 30,535 Market share % 49 Ownership Investor owned Table 2.18 TNB in brief Tenara Nasional Berhad (TNB) power utility is a national generation, transmission, distribution and retail power company based on diversified fuel power input (gas, coal, hydro). In this sense TNB is comparable to Eskoms power profile. It is not, based on details in the annual reports, possible to extract figures for the GTDR electricity components of TNBs activities. KEPCO, South Korea, in brief (Annual report 2 010) Countries of operation South Korea, overseas
REPORT Confidential Page No:26
Areas of operation Generation, Transmission, Distribution, Retail Total revenue (trill won) 38,161,292 Generation capacity (Mw) 73,470 Yearly production (Gwh) 434,214 Fuel type generation (Gwh) Coal 193,216; Nuclear 147,771; Gas 65,274; Oil
19,911; Hydro 5,641; Other 1,791 Staff 8,000 Market share % 93 Ownership Private listed company Table 2.19 KEPCO in brief KEPCO (South Korea) is a diversified generation, transmission, distribution and retail power company based on diversified fuel power input (e.g. nuclear). In this sense KEPCO is not directly comparable to Eskom’s power generation profile. In this sense KEPCO is not directly comparable to Eskoms power profile. It is not, based on details in the annual reports, possible to extract figures for the GTDR electricity components of KEPCOs activities. ENDESA, Spain, in Brief (Annual report 2010) Countries of operation Spain/Portugal 50%, Latin America 50% Areas of operation Generation, Transmission, Distribution, Supply Total revenue (mill eur) 31,177 Generation capacity (Mw) Yearly production (Gwh) 175,212 Fuel type generation (Gwh)
Spain 68,546; Coal 10,786; Nuclear 27,619; Hydro 9,208; Others
Staff 24,732 Market share % (largest) Ownership Private listed company Table 2.20 ENDESA in brief ENDESA (Spain) power utility is a generation, transmission, distribution and retail power company based on diversified fuel power input (e.g. coal, nuclear, hydro). In relation to fuel input is ENDESA not directly comparable to Eskom’s power generation profile, but in relation to areas of operation and size ENDESA is. It is not, based on details in the annual reports, possible to extract figures for the GTDR electricity components of ENDESAs activities. EGAT, Thailand, in brief (Annual report 2010) Countries of operation Thailand, Cambodia Total revenue (mil THB) 405,445 Areas of operation Generation, Transmission Generation capacity (Mw) 14,998 Yearly production (Gwh) 156,125 Fuel type generation MW Gas 6,866; Coal 4,699; Hydro 3,424; RE 4,5;
Diesel 4,4 Staff Marketshare % 48,5 Ownership State owned Table 2.21 EGAT in brief
REPORT Confidential Page No:27
Electricity Generation Authority of Thailand (EGAT) is a national generation and transmission power utility based on diversified fuel power input (gas, coal and hydro). EGAT is comparable to Eskoms generation and transmission profile. It is not, based on details in the annual reports, possible to extract figures for the GTDR electricity components of EGATs activities. Scottish & Southern, UK, in brief (Annual report 20 10) Countries of operation: Great Britain Total revenue (bn GBP) 21 550 Areas of operation (bn GBP)
Power systems 0,782; Retail 8,234.4; Wholesale and trading 12; Other 0,216
Other businesses 1,173.9 Generation capacity (MW) 11 330 Yearly production (Gwh) 59,700 Fuel type generation Coal, gas, oil, hydro, wind biomass Staff 20 117 Market share % 13 Ownership Investor owned Table 2.22 S&S in brief Scottish & Southern (UK) is a diversified exploration, generation, transmission, distribution and retail power company based on diversified fuel power input and output (e.g. heat, electricity). In this sense S&S is not directly comparable to Eskoms power generation profile. It is not, based on details in the annual reports, possible to extract figures for the GTDR electricity components of S&Ss activities. AEP, US, in brief (Annual report 2010) Countries of operation: United States – Texas, Virginia, Ohio,
Tennessee, Indiana, Kentucky, Oklahoma, Arkansas, Louisiana
Total revenue (bn USD) 21 550 Areas of operation (bn USD) Utility operations 13,791; Other 0,740 Generation capacity (MW) 38 000 Yearly production (Gwh) 205,869 Fuel type generation Coal, gas, nuclear, hydro, wind Staff 18 712 Market share % 4 Ownership Investor owned Table 2.23 AEP in brief American Energy Power utility is a diversified generation, transmission, distribution and retail power company based on diversified fuel power input. In this sense AEP is not directly comparable to Eskoms power profile. It is not, based on details in the annual reports, possible to extract figures for the GTDR electricity components of AEPs activities. Below are described contextual sense-making elements to compare average international tariffs with the similar Eskom (South Africa) average tariff.
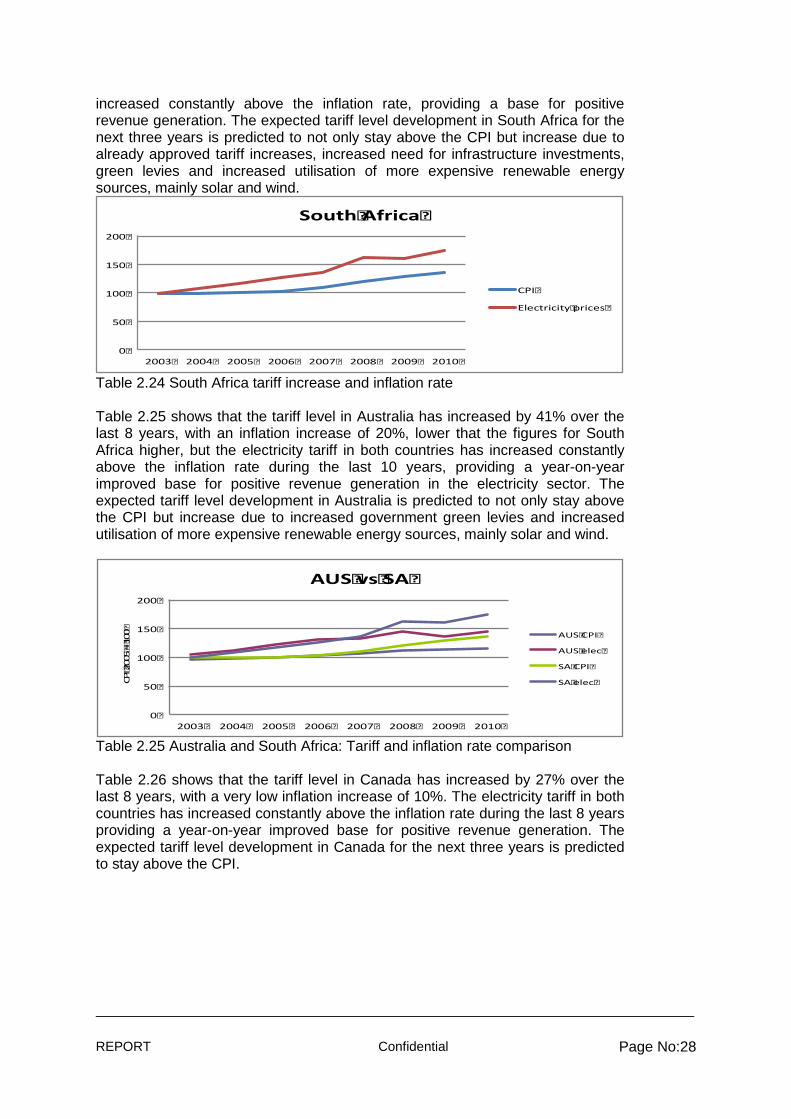
2.2.2 Tariff development of the last 8 years Table 2.24 shows that the tariff level in South Africa has increased by 77% over the last 8 years, with an inflation increase of 36%. The energy tariff therefore has
REPORT Confidential Page No:28
increased constantly above the inflation rate, providing a base for positive revenue generation. The expected tariff level development in South Africa for the next three years is predicted to not only stay above the CPI but increase due to already approved tariff increases, increased need for infrastructure investments, green levies and increased utilisation of more expensive renewable energy sources, mainly solar and wind.
Table 2.24 South Africa tariff increase and inflation rate Table 2.25 shows that the tariff level in Australia has increased by 41% over the last 8 years, with an inflation increase of 20%, lower that the figures for South Africa higher, but the electricity tariff in both countries has increased constantly above the inflation rate during the last 10 years, providing a year-on-year improved base for positive revenue generation in the electricity sector. The expected tariff level development in Australia is predicted to not only stay above the CPI but increase due to increased government green levies and increased utilisation of more expensive renewable energy sources, mainly solar and wind.
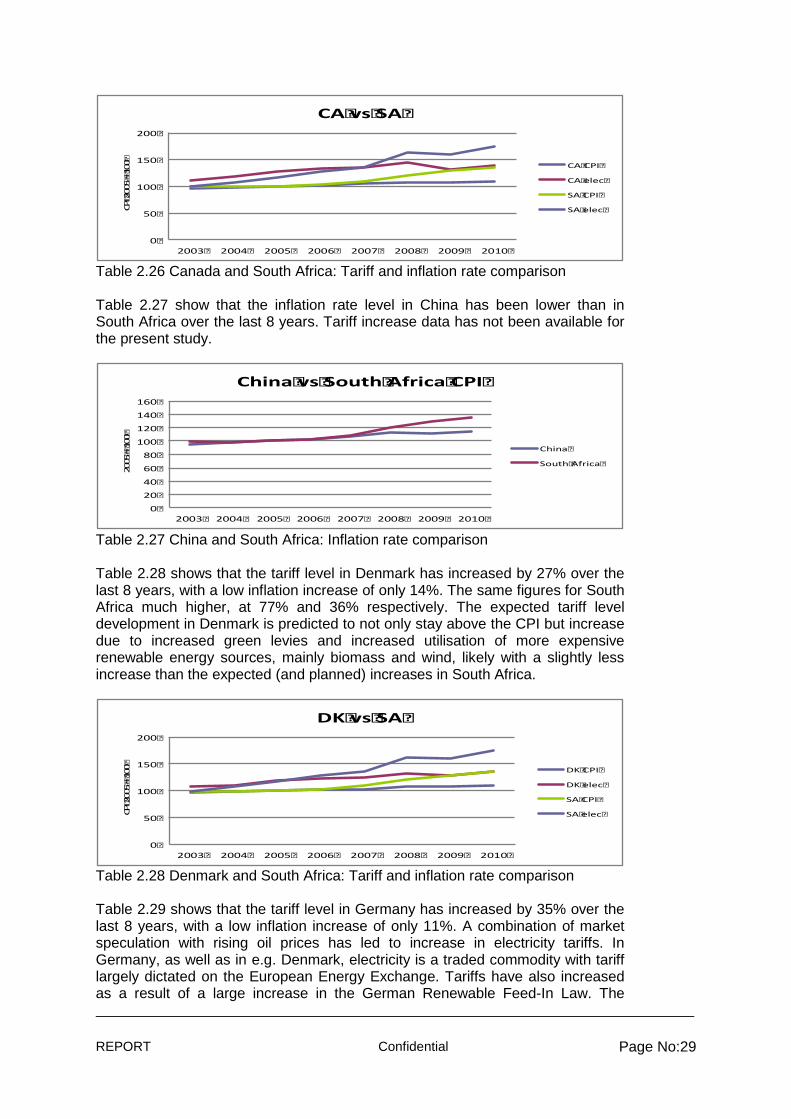
Table 2.25 Australia and South Africa: Tariff and inflation rate comparison Table 2.26 shows that the tariff level in Canada has increased by 27% over the last 8 years, with a very low inflation increase of 10%. The electricity tariff in both countries has increased constantly above the inflation rate during the last 8 years providing a year-on-year improved base for positive revenue generation. The expected tariff level development in Canada for the next three years is predicted to stay above the CPI.
0
50
100
150
200
2003 2004 2005 2006 2007 2008 2009 2010
SouthAfrica
CPI
Electricityprices
0
50
100
150
200
2003 2004 2005 2006 2007 2008 2009 2010
CPI2005=
100
AUSvsSA
AUSCPI
AUSelec
SACPI
SAelec
REPORT Confidential Page No:29
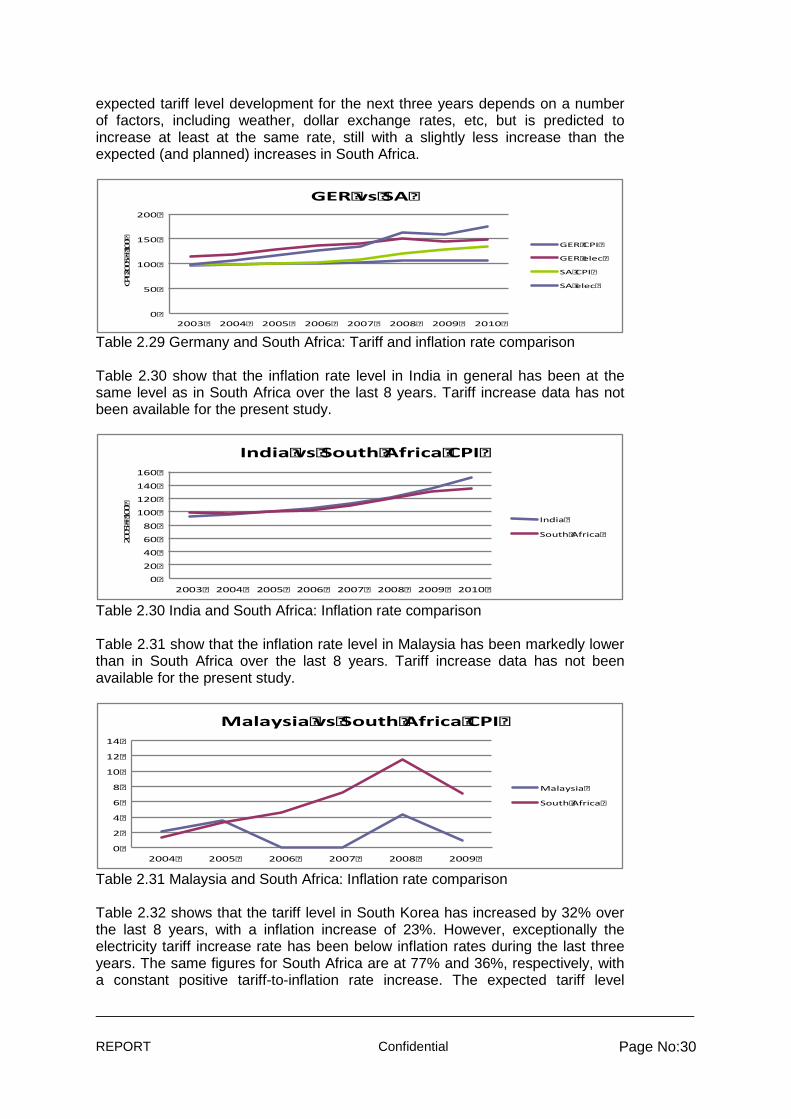
Table 2.26 Canada and South Africa: Tariff and inflation rate comparison Table 2.27 show that the inflation rate level in China has been lower than in South Africa over the last 8 years. Tariff increase data has not been available for the present study.
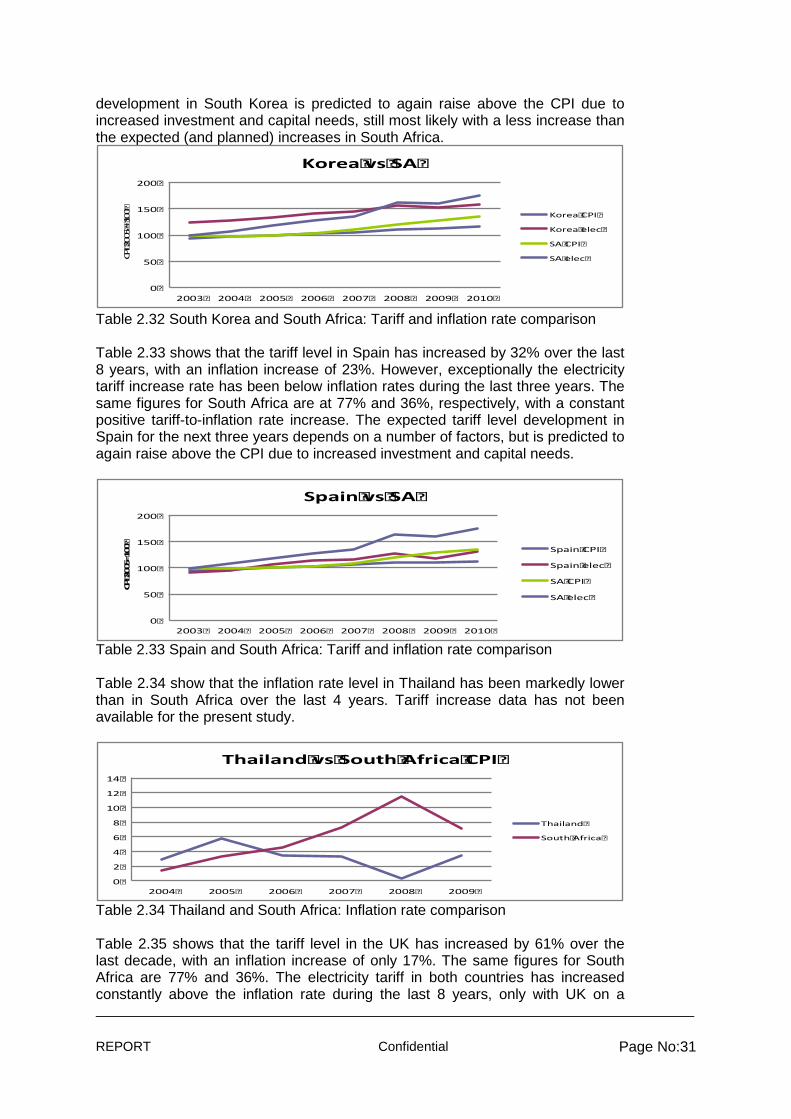
Table 2.27 China and South Africa: Inflation rate comparison Table 2.28 shows that the tariff level in Denmark has increased by 27% over the last 8 years, with a low inflation increase of only 14%. The same figures for South Africa much higher, at 77% and 36% respectively. The expected tariff level development in Denmark is predicted to not only stay above the CPI but increase due to increased green levies and increased utilisation of more expensive renewable energy sources, mainly biomass and wind, likely with a slightly less increase than the expected (and planned) increases in South Africa.
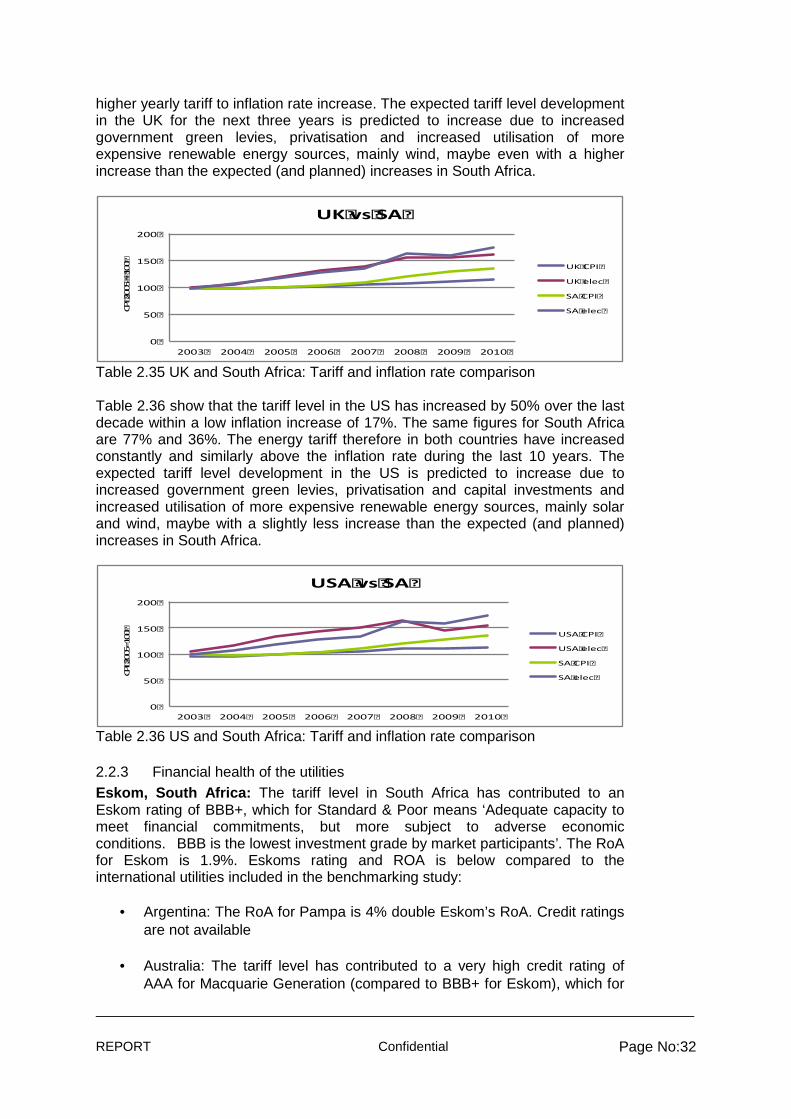
Table 2.28 Denmark and South Africa: Tariff and inflation rate comparison Table 2.29 shows that the tariff level in Germany has increased by 35% over the last 8 years, with a low inflation increase of only 11%. A combination of market speculation with rising oil prices has led to increase in electricity tariffs. In Germany, as well as in e.g. Denmark, electricity is a traded commodity with tariff largely dictated on the European Energy Exchange. Tariffs have also increased as a result of a large increase in the German Renewable Feed-In Law. The
0
50
100
150
200
2003 2004 2005 2006 2007 2008 2009 2010
CPI2005=1
00
CAvsSA
CACPI
CAelec
SACPI
SAelec
0
20
40
60
80
100
120
140
160
2003 2004 2005 2006 2007 2008 2009 2010
2005=1
00
ChinavsSouthAfricaCPI
China
SouthAfrica
0
50
100
150
200
2003 2004 2005 2006 2007 2008 2009 2010
CPI2005=1
00
DKvsSA
DKCPI
DKelec
SACPI
SAelec
REPORT Confidential Page No:30
expected tariff level development for the next three years depends on a number of factors, including weather, dollar exchange rates, etc, but is predicted to increase at least at the same rate, still with a slightly less increase than the expected (and planned) increases in South Africa.
Table 2.29 Germany and South Africa: Tariff and inflation rate comparison Table 2.30 show that the inflation rate level in India in general has been at the same level as in South Africa over the last 8 years. Tariff increase data has not been available for the present study.
Table 2.30 India and South Africa: Inflation rate comparison Table 2.31 show that the inflation rate level in Malaysia has been markedly lower than in South Africa over the last 8 years. Tariff increase data has not been available for the present study.
Table 2.31 Malaysia and South Africa: Inflation rate comparison Table 2.32 shows that the tariff level in South Korea has increased by 32% over the last 8 years, with a inflation increase of 23%. However, exceptionally the electricity tariff increase rate has been below inflation rates during the last three years. The same figures for South Africa are at 77% and 36%, respectively, with a constant positive tariff-to-inflation rate increase. The expected tariff level
0
50
100
150
200
2003 2004 2005 2006 2007 2008 2009 2010
CPI2005=100
GERvsSA
GERCPI
GERelec
SACPI
SAelec
0
20
40
60
80
100
120
140
160
2003 2004 2005 2006 2007 2008 2009 2010
2005=1
00
IndiavsSouthAfricaCPI
India
SouthAfrica
0
2
4
6
8
10
12
14
2004 2005 2006 2007 2008 2009
MalaysiavsSouthAfricaCPI
Malaysia
SouthAfrica
REPORT Confidential Page No:31
development in South Korea is predicted to again raise above the CPI due to increased investment and capital needs, still most likely with a less increase than the expected (and planned) increases in South Africa.
Table 2.32 South Korea and South Africa: Tariff and inflation rate comparison Table 2.33 shows that the tariff level in Spain has increased by 32% over the last 8 years, with an inflation increase of 23%. However, exceptionally the electricity tariff increase rate has been below inflation rates during the last three years. The same figures for South Africa are at 77% and 36%, respectively, with a constant positive tariff-to-inflation rate increase. The expected tariff level development in Spain for the next three years depends on a number of factors, but is predicted to again raise above the CPI due to increased investment and capital needs.
Table 2.33 Spain and South Africa: Tariff and inflation rate comparison Table 2.34 show that the inflation rate level in Thailand has been markedly lower than in South Africa over the last 4 years. Tariff increase data has not been available for the present study.
Table 2.34 Thailand and South Africa: Inflation rate comparison Table 2.35 shows that the tariff level in the UK has increased by 61% over the last decade, with an inflation increase of only 17%. The same figures for South Africa are 77% and 36%. The electricity tariff in both countries has increased constantly above the inflation rate during the last 8 years, only with UK on a
0
50
100
150
200
2003 2004 2005 2006 2007 2008 2009 2010
CPI2005=100
KoreavsSA
KoreaCPI
Koreaelec
SACPI
SAelec
0
50
100
150
200
2003 2004 2005 2006 2007 2008 2009 2010
CPI2005=100
SpainvsSA
SpainCPI
Spainelec
SACPI
SAelec
0
2
4
6
8
10
12
14
2004 2005 2006 2007 2008 2009
ThailandvsSouthAfricaCPI
Thailand
SouthAfrica
REPORT Confidential Page No:32
higher yearly tariff to inflation rate increase. The expected tariff level development in the UK for the next three years is predicted to increase due to increased government green levies, privatisation and increased utilisation of more expensive renewable energy sources, mainly wind, maybe even with a higher increase than the expected (and planned) increases in South Africa.
Table 2.35 UK and South Africa: Tariff and inflation rate comparison Table 2.36 show that the tariff level in the US has increased by 50% over the last decade within a low inflation increase of 17%. The same figures for South Africa are 77% and 36%. The energy tariff therefore in both countries have increased constantly and similarly above the inflation rate during the last 10 years. The expected tariff level development in the US is predicted to increase due to increased government green levies, privatisation and capital investments and increased utilisation of more expensive renewable energy sources, mainly solar and wind, maybe with a slightly less increase than the expected (and planned) increases in South Africa.
Table 2.36 US and South Africa: Tariff and inflation rate comparison
2.2.3 Financial health of the utilities Eskom, South Africa: The tariff level in South Africa has contributed to an Eskom rating of BBB+, which for Standard & Poor means ‘Adequate capacity to meet financial commitments, but more subject to adverse economic conditions.�BBB is the lowest investment grade by market participants’. The RoA for Eskom is 1.9%. Eskoms rating and ROA is below compared to the international utilities included in the benchmarking study:
• Argentina: The RoA for Pampa is 4% double Eskom’s RoA. Credit ratings are not available
• Australia: The tariff level has contributed to a very high credit rating of AAA for Macquarie Generation (compared to BBB+ for Eskom), which for
0
50
100
150
200
2003 2004 2005 2006 2007 2008 2009 2010
CPI2005=1
00
UKvsSA
UKCPI
UKelec
SACPI
SAelec
0
50
100
150
200
2003 2004 2005 2006 2007 2008 2009 2010
CPI2005=100
USAvsSA
USACPI
USAelec
SACPI
SAelec
REPORT Confidential Page No:33
Standard & Poor means ‘extremely strong capacity to meet financial commitments’. This is one of the best ratings for the utilities included in this benchmarking study indicating a tariff level contributing to a very sustainable financial electricity utility. The RoA4 for Macquarie Generation is 3.1%, slightly higher than Eskoms RoA of 1.9%
• Canada: The tariff level has contributed to a good OPG rating of A- (compared to BBB+ for Eskom), which for Standard & Poor means a ‘strong capacity to meet financial commitments, but somewhat susceptible to adverse economic conditions and changes in circumstances’. This is one of the better ratings for the utilities included in this benchmarking study indicating a tariff level contributing to a sustainable financial electricity utility. The RoA5 for OPG is 2.19%; similar to the Eskoms RoA
• China: CRPH has a rating of BBB (compared to BBB+ for Eskom), with a revised negative outlook by S&P, due to rising fuel costs. With state capped electricity prices, its financial profile will come under pressure and price increases are expected. The RoA6 for CRPH is 3.1%, slightly higher than Eskom’s RoA
• Denmark: The tariff level has contributed to creating a rating of A- 7 for DONG (compared to BBB+ for Eskom), which for Standard & Poor means ‘strong capacity to meet financial commitments, but somewhat susceptible to adverse economic conditions and changes in circumstances’. This is one of the best ratings for the utilities included in this benchmarking study. The RoA8 for DONG is 3.3% almost double of Eskoms RoA
• Germany The tariff level has contributed to a very good A rating for EON (compared to BBB+ for Eskom), which for Standard & Poor means a ‘strong capacity to meet financial commitments, but somewhat susceptible to adverse economic conditions and changes in circumstances’. This is one of the best ratings for the utilities included in this benchmarking study indicating a tariff level contributing to a sustainable financial electricity utility. The RoA9 for EON is 4.1% double of Eskoms RoA of 1.9%
• India: The tariff level has contributed to creating a rating of BBB for NTPC (compared to BBB+ for Eskom). Given the expected government support for NTPC as a state owned company, rating agencies perceive intervention by the government to occur in the event financial pressure, reflecting its critical role in the provision of electricity to the nation. The RoA for NTPC is remarkedly high at 31%
4 Return on Assets: Total net profit / total assets: 125,7 mill / 4,033 mill 5 Annual report 2010: Return on Assets: Total net profit / total assets: 649 mill C$/ 29,577 mill C$ 6Return on Assets: Total net profit / total assets: 2,880 mill / 97,452 mill 7To secure financing on attractive terms, DONG has set targets for credit rating and capital structure. The target is at least BBB+ (Standard ; Poor’s) 8 Return on Assets: Total net profit / total assets: 4,464 mill DKK/ 135,3 mill DKK 9 Return on Assets: Total net profit / total assets: 6,281 mill Euro/ 152,881 mill Euro
REPORT Confidential Page No:34
• Kenya: No credit rating is available for KPL. The RoA10 for KPL is 4.3% double Eskoms RoA of 1.9%
• Malaysia: The tariff level has contributed to a rating a TNB rating of BBB+ (similar to Eskoms BBB+). This is one of the lower ratings for the utilities included in this benchmarking study indicating a tariff level contributing to a medium sustainable financial electricity utility. However, the RoA11 for TNB is 4.7% more than double of Eskoms RoA of 1.9%
• South Korea: The tariff level has contributed to a rating of A for KEPCO (compared to BBB+ for Eskom), which for Standard & Poor means ‘strong capacity to meet financial commitments, but somewhat susceptible to adverse economic conditions and changes in circumstances’. This is one of the better ratings for the utilities included in this benchmarking study. However, the RoA12 for KEPCO is -0.2% compared to Eskom’s positive RoA
• Spain: The tariff level has contributed to a rating of A- for ENDESA (compared to BBB+ for Eskom), which for Standard & Poor means ‘strong capacity to meet financial commitments, but somewhat susceptible to adverse economic conditions and changes in circumstances’. This is one of the better ratings for the utilities included in this benchmarking study. The RoA13 for ENDESA is 8.2%, which is more than 4 times higher than Eskom’s RoA
• Thailand: No credit rating is available for EGAT. The RoA14 for EGAT is 7,9%, which is considerable higher (4 times) than Eskoms RoA
• UK: The tariff level has contributed to creating a rating of A (compared to BBB+) with a stable outlook, which for Standard & Poor means a ‘strong capacity to meet financial commitments, but somewhat susceptible to adverse economic conditions and changes in circumstances’. This is above average ratings for the utilities included in this benchmarking study. The RoA15 for SS is 6.8%, which is considerably higher than Eskoms RoA
• US: The tariff level has contributed to creating a rating of BBB+ for AEP (similar to Eskoms rating), which for Standard & Poor means it has ‘adequate capacity to meet financial commitments. However adverse economic conditions or changes in circumstances are more likely to lead to a weakened capacity of the obligor to meet its financial commitments’.
10 Annual report 2010: Return on Assets: Total net profit / total assets: 3,716 mill / 85,025 mill Kshs 11 Annual report 2010: Return on Assets: Total net profit / total assets: 3,201 mill / 49,507 mill MYR 12 Return on Assets: Total net profit / total assets: -77,000 mill won/ 34,346 bill won 13 Return on Assets: Total net profit / total assets: 5,118 mill eur/ 62,588 mill eur 14 Annual report 2010: Return on Assets: Total net profit / total assets: 37,355 mill / 469,415 mill thb 15 Annual Report 2010: Return on Assets: Total net profit / total assets: 1,235 bill pound / 18,127 bill pound (p80)
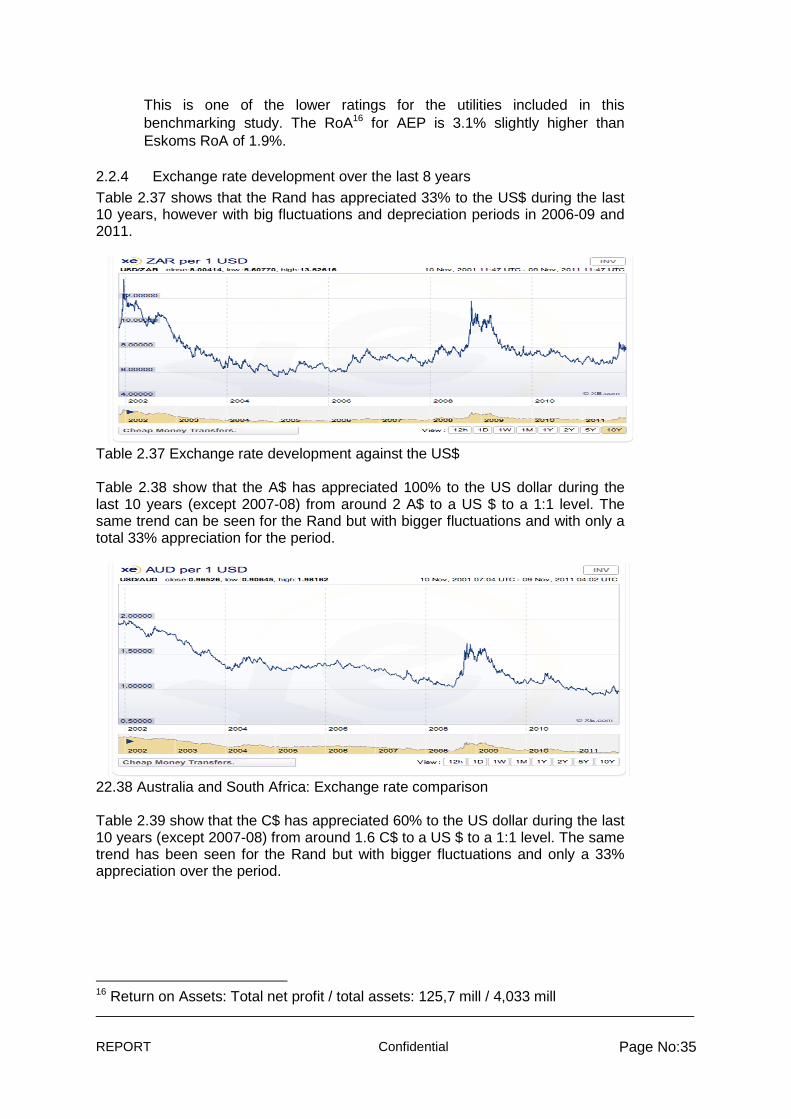
REPORT Confidential Page No:35
This is one of the lower ratings for the utilities included in this benchmarking study. The RoA16 for AEP is 3.1% slightly higher than Eskoms RoA of 1.9%.
2.2.4 Exchange rate development over the last 8 years
Table 2.37 shows that the Rand has appreciated 33% to the US$ during the last 10 years, however with big fluctuations and depreciation periods in 2006-09 and 2011.
Table 2.37 Exchange rate development against the US$ Table 2.38 show that the A$ has appreciated 100% to the US dollar during the last 10 years (except 2007-08) from around 2 A$ to a US $ to a 1:1 level. The same trend can be seen for the Rand but with bigger fluctuations and with only a total 33% appreciation for the period.
22.38 Australia and South Africa: Exchange rate comparison Table 2.39 show that the C$ has appreciated 60% to the US dollar during the last 10 years (except 2007-08) from around 1.6 C$ to a US $ to a 1:1 level. The same trend has been seen for the Rand but with bigger fluctuations and only a 33% appreciation over the period.
16 Return on Assets: Total net profit / total assets: 125,7 mill / 4,033 mill
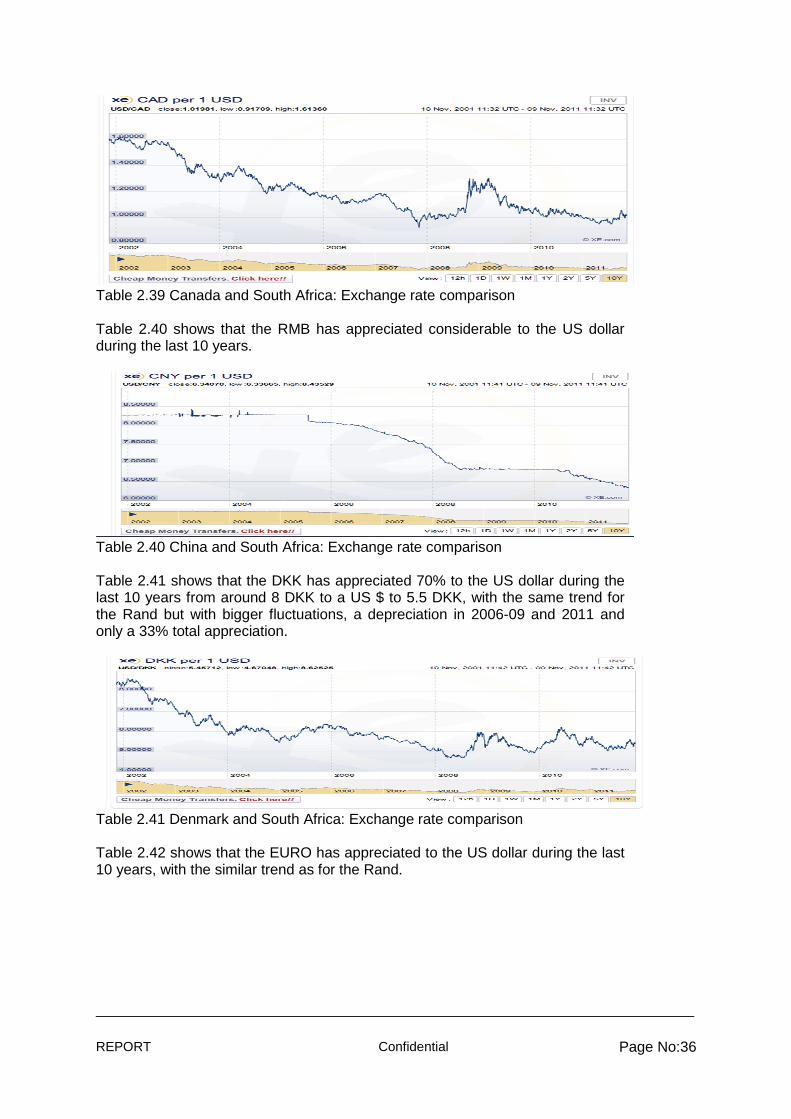
REPORT Confidential Page No:36
Table 2.39 Canada and South Africa: Exchange rate comparison Table 2.40 shows that the RMB has appreciated considerable to the US dollar during the last 10 years.
Table 2.40 China and South Africa: Exchange rate comparison Table 2.41 shows that the DKK has appreciated 70% to the US dollar during the last 10 years from around 8 DKK to a US $ to 5.5 DKK, with the same trend for the Rand but with bigger fluctuations, a depreciation in 2006-09 and 2011 and only a 33% total appreciation.
Table 2.41 Denmark and South Africa: Exchange rate comparison Table 2.42 shows that the EURO has appreciated to the US dollar during the last 10 years, with the similar trend as for the Rand.
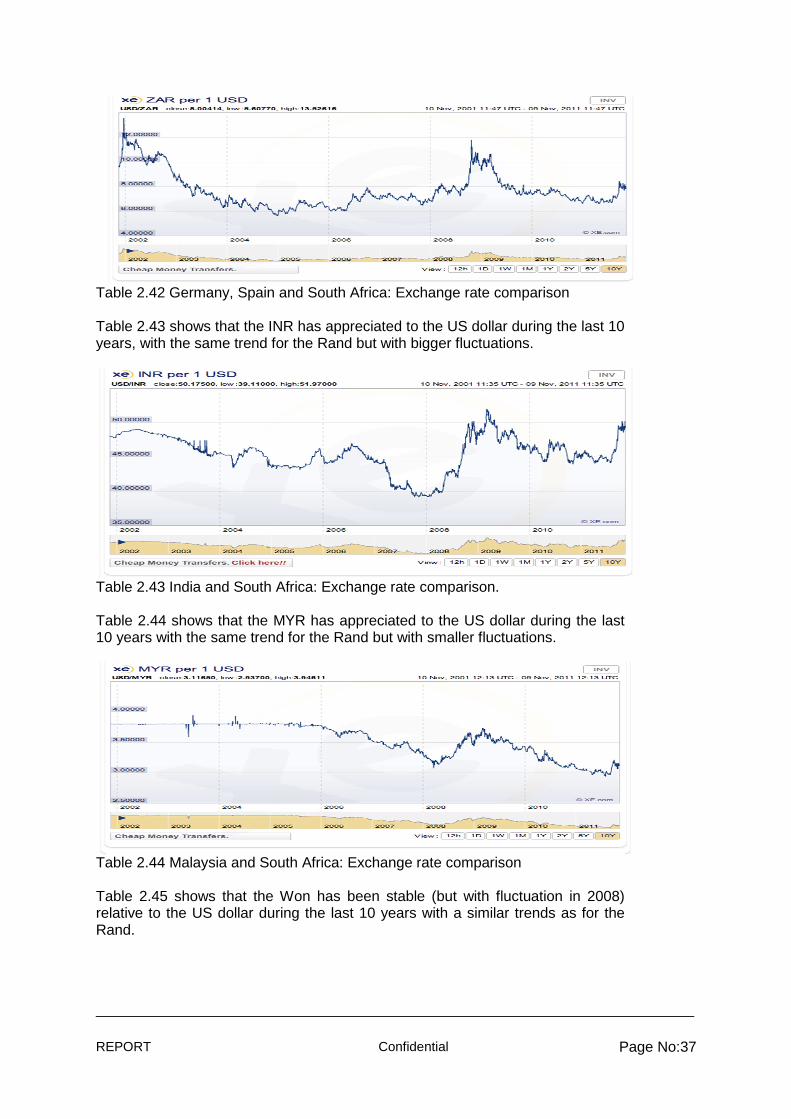
REPORT Confidential Page No:37
Table 2.42 Germany, Spain and South Africa: Exchange rate comparison Table 2.43 shows that the INR has appreciated to the US dollar during the last 10 years, with the same trend for the Rand but with bigger fluctuations.
Table 2.43 India and South Africa: Exchange rate comparison. Table 2.44 shows that the MYR has appreciated to the US dollar during the last 10 years with the same trend for the Rand but with smaller fluctuations.
Table 2.44 Malaysia and South Africa: Exchange rate comparison Table 2.45 shows that the Won has been stable (but with fluctuation in 2008) relative to the US dollar during the last 10 years with a similar trends as for the Rand.
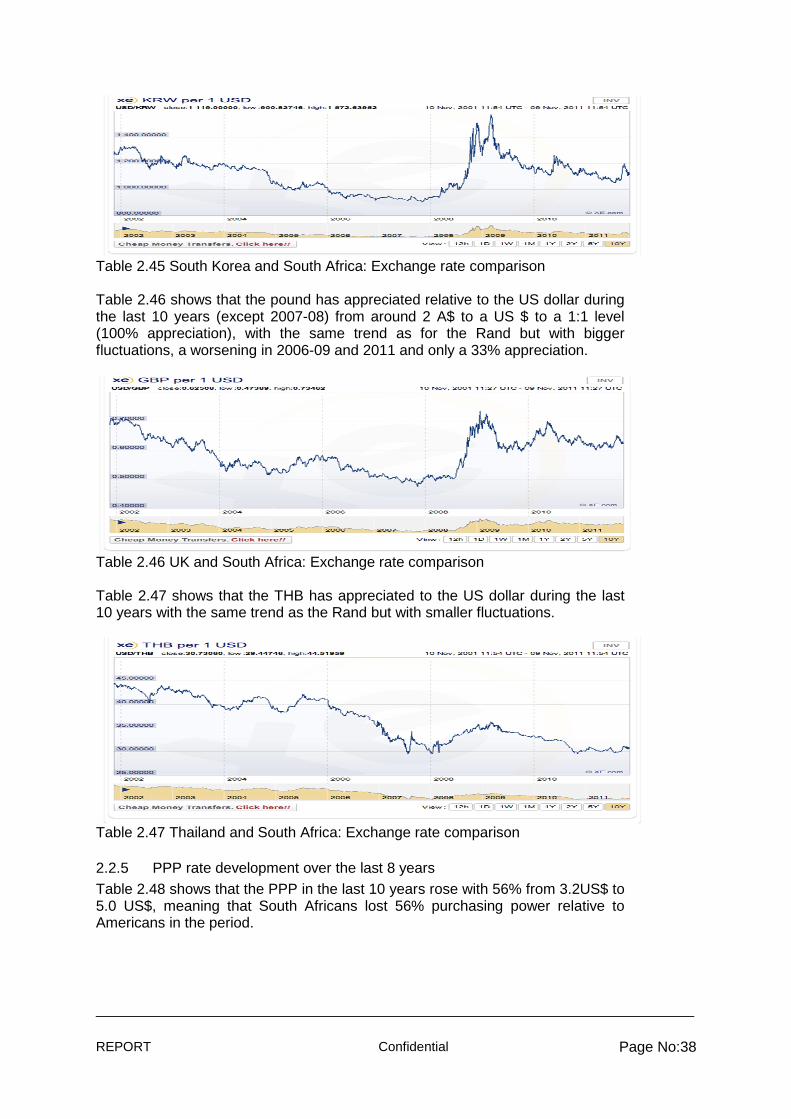
REPORT Confidential Page No:38
Table 2.45 South Korea and South Africa: Exchange rate comparison Table 2.46 shows that the pound has appreciated relative to the US dollar during the last 10 years (except 2007-08) from around 2 A$ to a US $ to a 1:1 level (100% appreciation), with the same trend as for the Rand but with bigger fluctuations, a worsening in 2006-09 and 2011 and only a 33% appreciation.
Table 2.46 UK and South Africa: Exchange rate comparison Table 2.47 shows that the THB has appreciated to the US dollar during the last 10 years with the same trend as the Rand but with smaller fluctuations.
Table 2.47 Thailand and South Africa: Exchange rate comparison
2.2.5 PPP rate development over the last 8 years Table 2.48 shows that the PPP in the last 10 years rose with 56% from 3.2US$ to 5.0 US$, meaning that South Africans lost 56% purchasing power relative to Americans in the period.
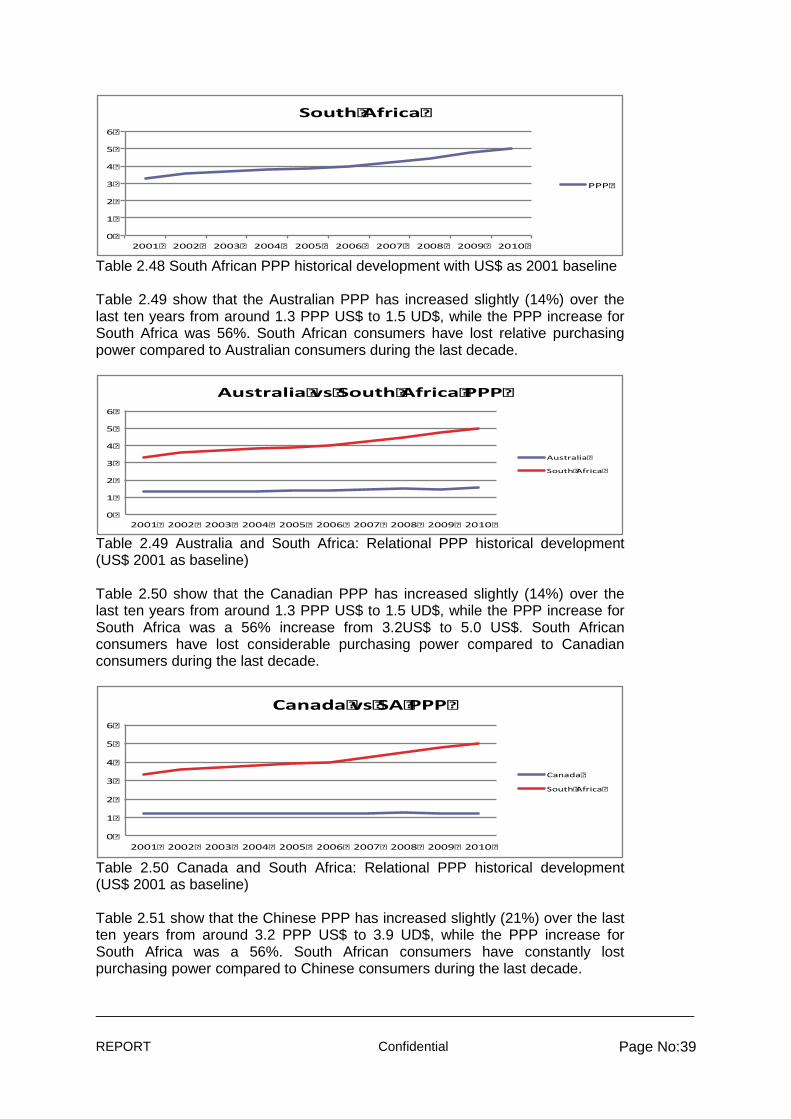
REPORT Confidential Page No:39
Table 2.48 South African PPP historical development with US$ as 2001 baseline Table 2.49 show that the Australian PPP has increased slightly (14%) over the last ten years from around 1.3 PPP US$ to 1.5 UD$, while the PPP increase for South Africa was 56%. South African consumers have lost relative purchasing power compared to Australian consumers during the last decade.
Table 2.49 Australia and South Africa: Relational PPP historical development (US$ 2001 as baseline) Table 2.50 show that the Canadian PPP has increased slightly (14%) over the last ten years from around 1.3 PPP US$ to 1.5 UD$, while the PPP increase for South Africa was a 56% increase from 3.2US$ to 5.0 US$. South African consumers have lost considerable purchasing power compared to Canadian consumers during the last decade.
Table 2.50 Canada and South Africa: Relational PPP historical development (US$ 2001 as baseline) Table 2.51 show that the Chinese PPP has increased slightly (21%) over the last ten years from around 3.2 PPP US$ to 3.9 UD$, while the PPP increase for South Africa was a 56%. South African consumers have constantly lost purchasing power compared to Chinese consumers during the last decade.
0
1
2
3
4
5
6
2001 2002 2003 2004 2005 2006 2007 2008 2009 2010
SouthAfrica
PPP
0
1
2
3
4
5
6
2001 2002 2003 2004 2005 2006 2007 2008 2009 2010
AustraliavsSouthAfricaPPP
Australia
SouthAfrica
0
1
2
3
4
5
6
2001 2002 2003 2004 2005 2006 2007 2008 2009 2010
CanadavsSAPPP
Canada
SouthAfrica
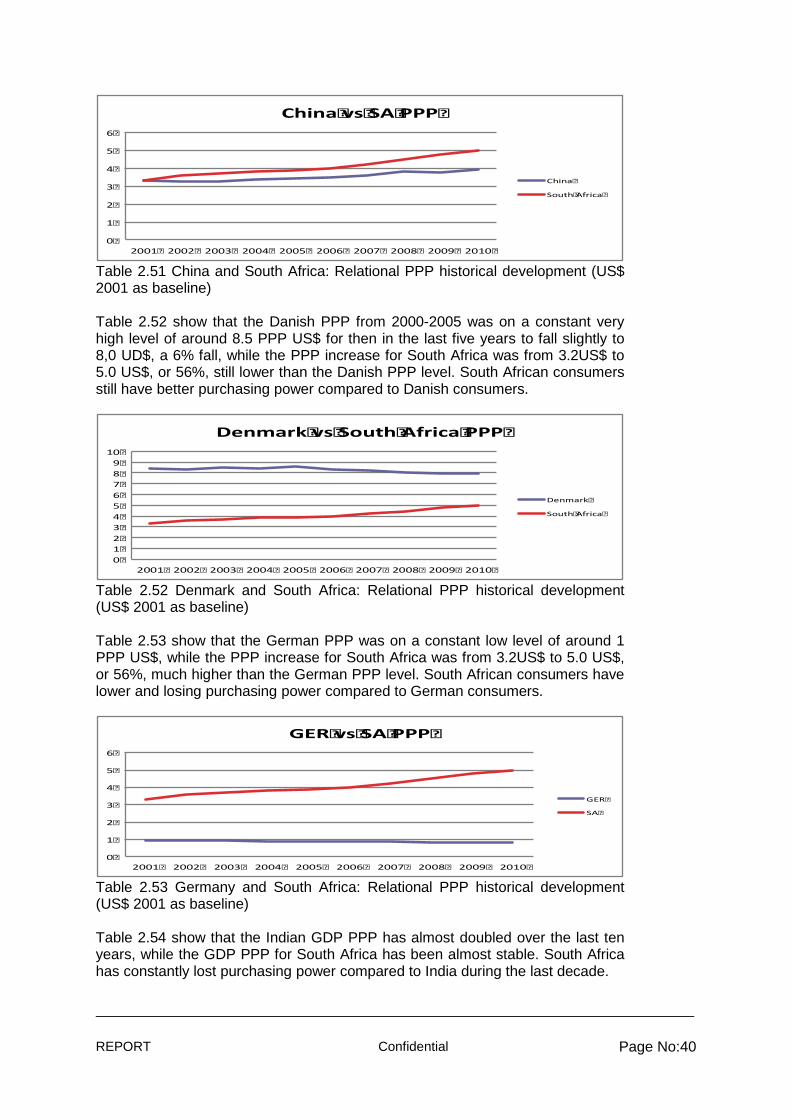
REPORT Confidential Page No:40
Table 2.51 China and South Africa: Relational PPP historical development (US$ 2001 as baseline) Table 2.52 show that the Danish PPP from 2000-2005 was on a constant very high level of around 8.5 PPP US$ for then in the last five years to fall slightly to 8,0 UD$, a 6% fall, while the PPP increase for South Africa was from 3.2US$ to 5.0 US$, or 56%, still lower than the Danish PPP level. South African consumers still have better purchasing power compared to Danish consumers.
Table 2.52 Denmark and South Africa: Relational PPP historical development (US$ 2001 as baseline) Table 2.53 show that the German PPP was on a constant low level of around 1 PPP US$, while the PPP increase for South Africa was from 3.2US$ to 5.0 US$, or 56%, much higher than the German PPP level. South African consumers have lower and losing purchasing power compared to German consumers.
Table 2.53 Germany and South Africa: Relational PPP historical development (US$ 2001 as baseline) Table 2.54 show that the Indian GDP PPP has almost doubled over the last ten years, while the GDP PPP for South Africa has been almost stable. South Africa has constantly lost purchasing power compared to India during the last decade.
0
1
2
3
4
5
6
2001 2002 2003 2004 2005 2006 2007 2008 2009 2010
ChinavsSAPPP
China
SouthAfrica
0
1
2
3
4
5
6
7
8
9
10
2001 2002 2003 2004 2005 2006 2007 2008 2009 2010
DenmarkvsSouthAfricaPPP
Denmark
SouthAfrica
0
1
2
3
4
5
6
2001 2002 2003 2004 2005 2006 2007 2008 2009 2010
GERvsSAPPP
GER
SA
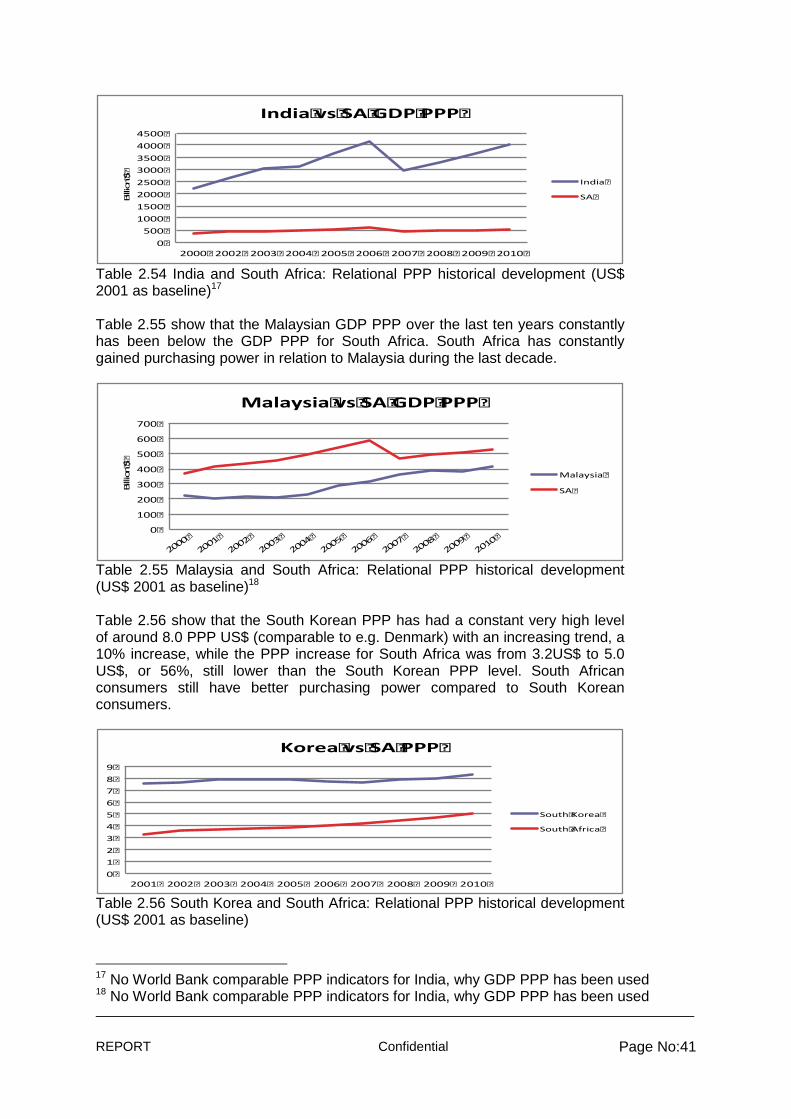
REPORT Confidential Page No:41
Table 2.54 India and South Africa: Relational PPP historical development (US$ 2001 as baseline)17 Table 2.55 show that the Malaysian GDP PPP over the last ten years constantly has been below the GDP PPP for South Africa. South Africa has constantly gained purchasing power in relation to Malaysia during the last decade.
Table 2.55 Malaysia and South Africa: Relational PPP historical development (US$ 2001 as baseline)18 Table 2.56 show that the South Korean PPP has had a constant very high level of around 8.0 PPP US$ (comparable to e.g. Denmark) with an increasing trend, a 10% increase, while the PPP increase for South Africa was from 3.2US$ to 5.0 US$, or 56%, still lower than the South Korean PPP level. South African consumers still have better purchasing power compared to South Korean consumers.
Table 2.56 South Korea and South Africa: Relational PPP historical development (US$ 2001 as baseline)
17 No World Bank comparable PPP indicators for India, why GDP PPP has been used 18 No World Bank comparable PPP indicators for India, why GDP PPP has been used
0
500
1000
1500
2000
2500
3000
3500
4000
4500
2000 2002 2003 2004 20052006 2007 2008 20092010
Billion$
IndiavsSAGDPPPP
India
SA
0
100
200
300
400
500
600
700
2000
2001
2002
2003
2004
2005
2006
2007
2008
2009
2010
Bill
ion$
MalaysiavsSAGDPPPP
Malaysia
SA
0
1
2
3
4
5
6
7
8
9
2001 2002 2003 2004 2005 2006 2007 2008 2009 2010
KoreavsSAPPP
SouthKorea
SouthAfrica
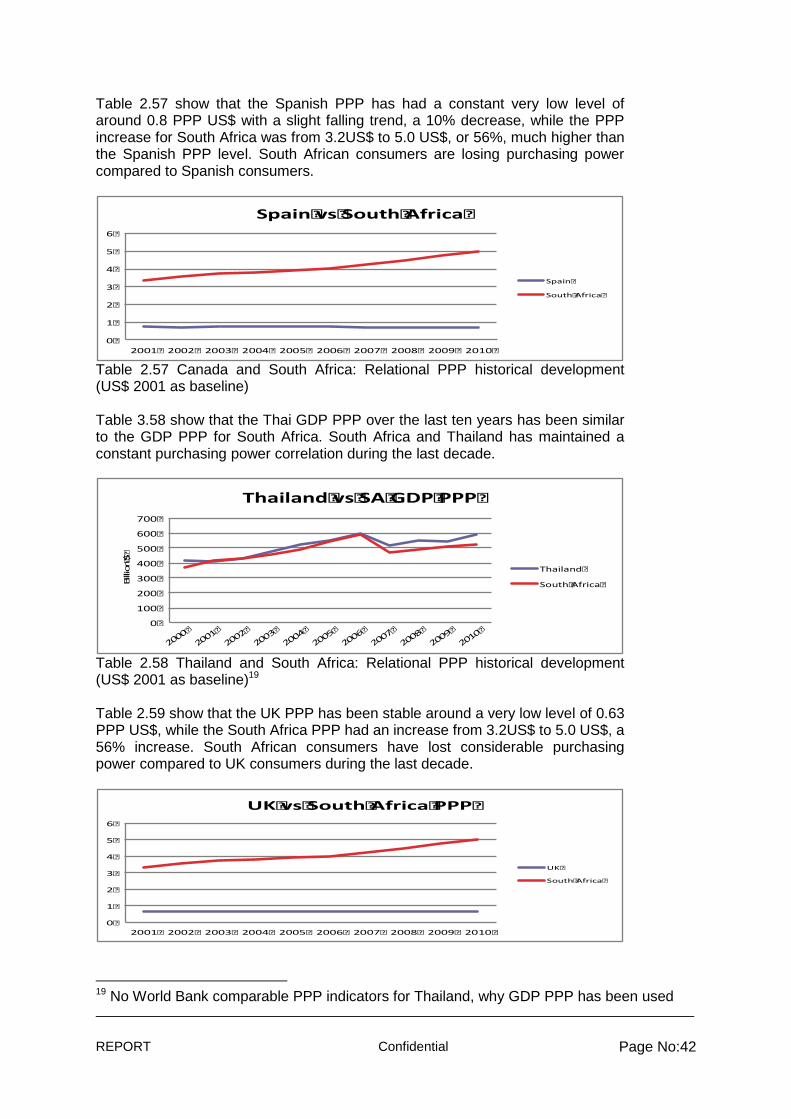
REPORT Confidential Page No:42
Table 2.57 show that the Spanish PPP has had a constant very low level of around 0.8 PPP US$ with a slight falling trend, a 10% decrease, while the PPP increase for South Africa was from 3.2US$ to 5.0 US$, or 56%, much higher than the Spanish PPP level. South African consumers are losing purchasing power compared to Spanish consumers.
Table 2.57 Canada and South Africa: Relational PPP historical development (US$ 2001 as baseline) Table 3.58 show that the Thai GDP PPP over the last ten years has been similar to the GDP PPP for South Africa. South Africa and Thailand has maintained a constant purchasing power correlation during the last decade.
Table 2.58 Thailand and South Africa: Relational PPP historical development (US$ 2001 as baseline)19 Table 2.59 show that the UK PPP has been stable around a very low level of 0.63 PPP US$, while the South Africa PPP had an increase from 3.2US$ to 5.0 US$, a 56% increase. South African consumers have lost considerable purchasing power compared to UK consumers during the last decade.
19 No World Bank comparable PPP indicators for Thailand, why GDP PPP has been used
0
1
2
3
4
5
6
2001 2002 2003 2004 2005 2006 2007 2008 2009 2010
SpainvsSouthAfrica
Spain
SouthAfrica
0
100
200
300
400
500
600
700
2000
2001
2002
2003
2004
2005
2006
2007
2008
2009
2010
Billio
n$
ThailandvsSAGDPPPP
Thailand
SouthAfrica
0
1
2
3
4
5
6
2001 2002 2003 2004 2005 2006 2007 2008 2009 2010
UKvsSouthAfricaPPP
UK
SouthAfrica
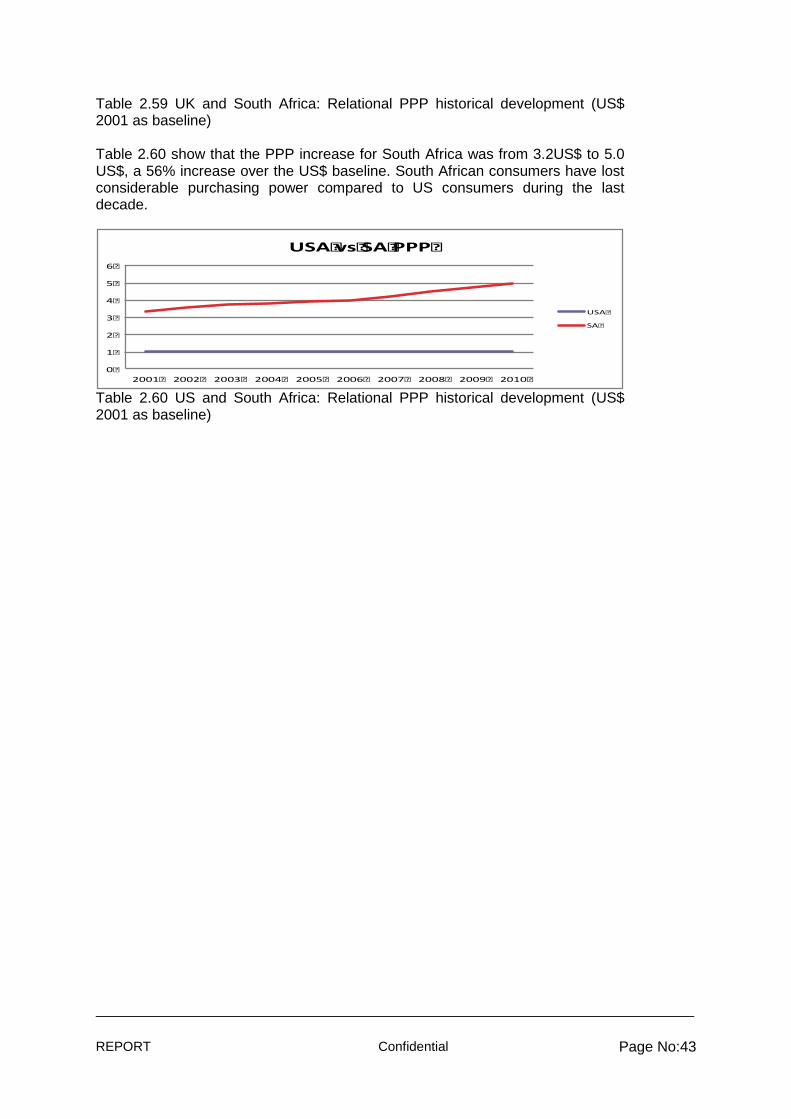
REPORT Confidential Page No:43
Table 2.59 UK and South Africa: Relational PPP historical development (US$ 2001 as baseline) Table 2.60 show that the PPP increase for South Africa was from 3.2US$ to 5.0 US$, a 56% increase over the US$ baseline. South African consumers have lost considerable purchasing power compared to US consumers during the last decade.
Table 2.60 US and South Africa: Relational PPP historical development (US$ 2001 as baseline)
0
1
2
3
4
5
6
2001 2002 2003 2004 2005 2006 2007 2008 2009 2010
USAvsSAPPP
USA
SA
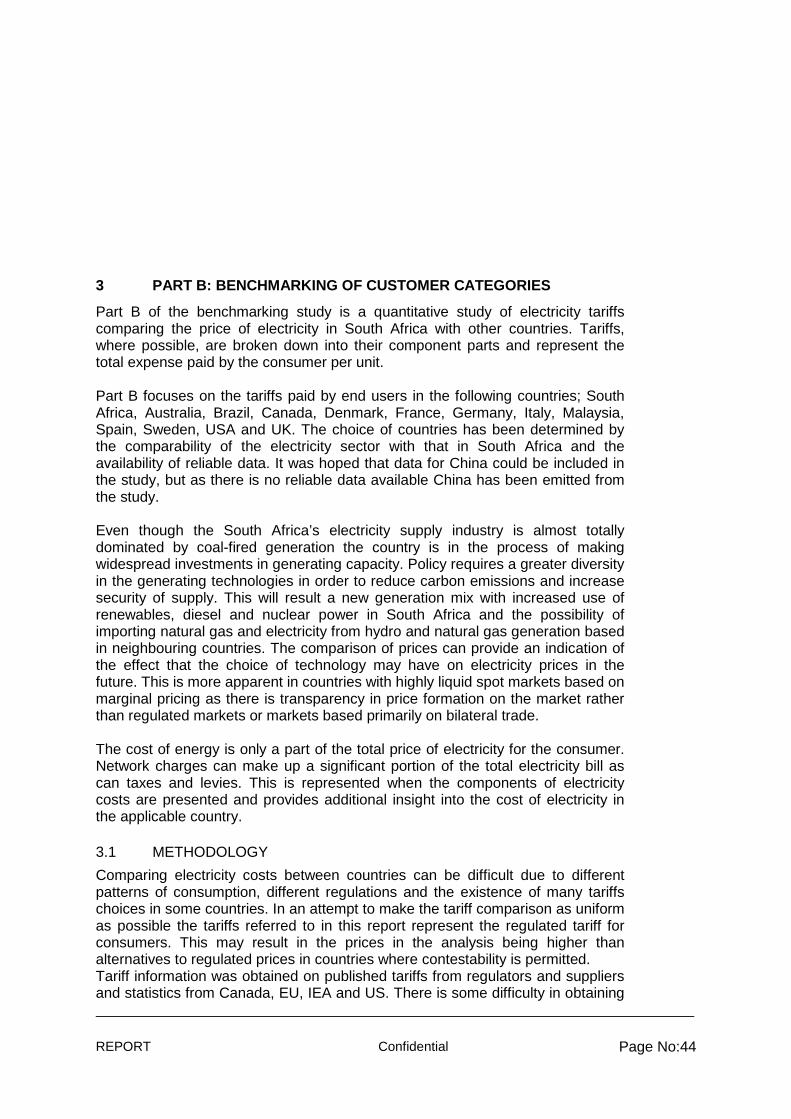
REPORT Confidential Page No:44
3 PART B: BENCHMARKING OF CUSTOMER CATEGORIES
Part B of the benchmarking study is a quantitative study of electricity tariffs comparing the price of electricity in South Africa with other countries. Tariffs, where possible, are broken down into their component parts and represent the total expense paid by the consumer per unit. Part B focuses on the tariffs paid by end users in the following countries; South Africa, Australia, Brazil, Canada, Denmark, France, Germany, Italy, Malaysia, Spain, Sweden, USA and UK. The choice of countries has been determined by the comparability of the electricity sector with that in South Africa and the availability of reliable data. It was hoped that data for China could be included in the study, but as there is no reliable data available China has been emitted from the study. Even though the South Africa’s electricity supply industry is almost totally dominated by coal-fired generation the country is in the process of making widespread investments in generating capacity. Policy requires a greater diversity in the generating technologies in order to reduce carbon emissions and increase security of supply. This will result a new generation mix with increased use of renewables, diesel and nuclear power in South Africa and the possibility of importing natural gas and electricity from hydro and natural gas generation based in neighbouring countries. The comparison of prices can provide an indication of the effect that the choice of technology may have on electricity prices in the future. This is more apparent in countries with highly liquid spot markets based on marginal pricing as there is transparency in price formation on the market rather than regulated markets or markets based primarily on bilateral trade. The cost of energy is only a part of the total price of electricity for the consumer. Network charges can make up a significant portion of the total electricity bill as can taxes and levies. This is represented when the components of electricity costs are presented and provides additional insight into the cost of electricity in the applicable country.
3.1 METHODOLOGY
Comparing electricity costs between countries can be difficult due to different patterns of consumption, different regulations and the existence of many tariffs choices in some countries. In an attempt to make the tariff comparison as uniform as possible the tariffs referred to in this report represent the regulated tariff for consumers. This may result in the prices in the analysis being higher than alternatives to regulated prices in countries where contestability is permitted. Tariff information was obtained on published tariffs from regulators and suppliers and statistics from Canada, EU, IEA and US. There is some difficulty in obtaining
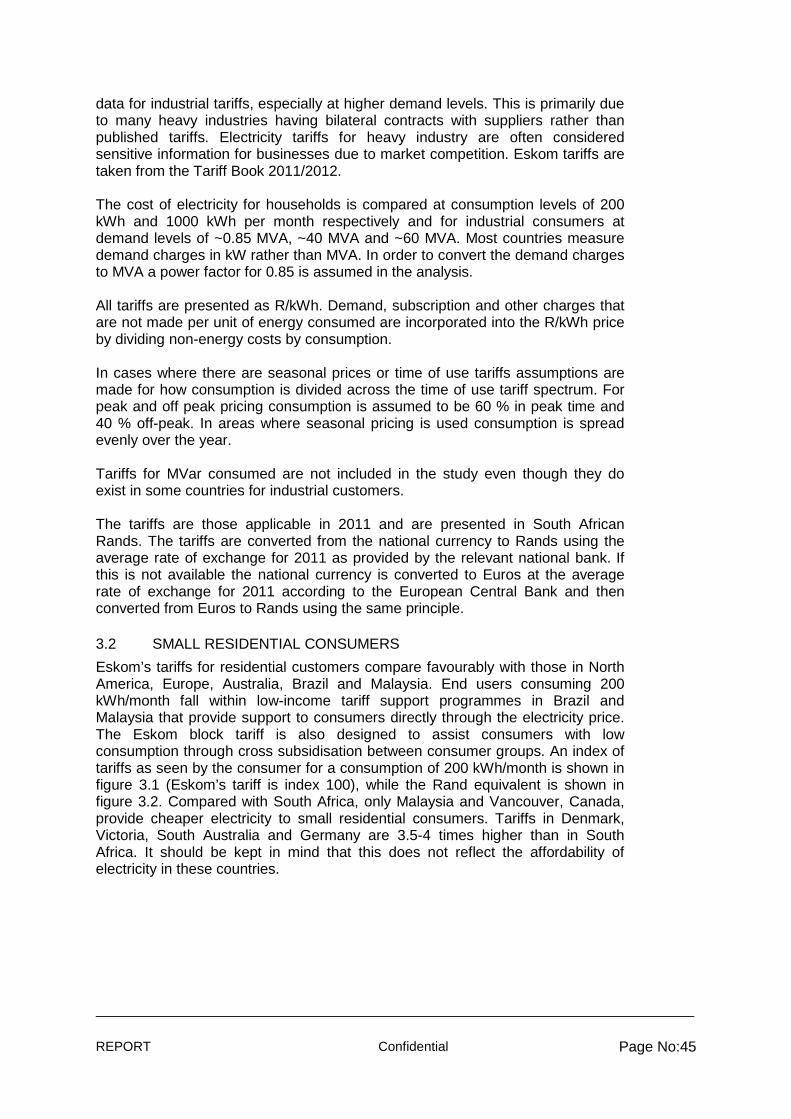
REPORT Confidential Page No:45
data for industrial tariffs, especially at higher demand levels. This is primarily due to many heavy industries having bilateral contracts with suppliers rather than published tariffs. Electricity tariffs for heavy industry are often considered sensitive information for businesses due to market competition. Eskom tariffs are taken from the Tariff Book 2011/2012. The cost of electricity for households is compared at consumption levels of 200 kWh and 1000 kWh per month respectively and for industrial consumers at demand levels of ~0.85 MVA, ~40 MVA and ~60 MVA. Most countries measure demand charges in kW rather than MVA. In order to convert the demand charges to MVA a power factor for 0.85 is assumed in the analysis. All tariffs are presented as R/kWh. Demand, subscription and other charges that are not made per unit of energy consumed are incorporated into the R/kWh price by dividing non-energy costs by consumption. In cases where there are seasonal prices or time of use tariffs assumptions are made for how consumption is divided across the time of use tariff spectrum. For peak and off peak pricing consumption is assumed to be 60 % in peak time and 40 % off-peak. In areas where seasonal pricing is used consumption is spread evenly over the year. Tariffs for MVar consumed are not included in the study even though they do exist in some countries for industrial customers. The tariffs are those applicable in 2011 and are presented in South African Rands. The tariffs are converted from the national currency to Rands using the average rate of exchange for 2011 as provided by the relevant national bank. If this is not available the national currency is converted to Euros at the average rate of exchange for 2011 according to the European Central Bank and then converted from Euros to Rands using the same principle.
3.2 SMALL RESIDENTIAL CONSUMERS
Eskom’s tariffs for residential customers compare favourably with those in North America, Europe, Australia, Brazil and Malaysia. End users consuming 200 kWh/month fall within low-income tariff support programmes in Brazil and Malaysia that provide support to consumers directly through the electricity price. The Eskom block tariff is also designed to assist consumers with low consumption through cross subsidisation between consumer groups. An index of tariffs as seen by the consumer for a consumption of 200 kWh/month is shown in figure 3.1 (Eskom’s tariff is index 100), while the Rand equivalent is shown in figure 3.2. Compared with South Africa, only Malaysia and Vancouver, Canada, provide cheaper electricity to small residential consumers. Tariffs in Denmark, Victoria, South Australia and Germany are 3.5-4 times higher than in South Africa. It should be kept in mind that this does not reflect the affordability of electricity in these countries.
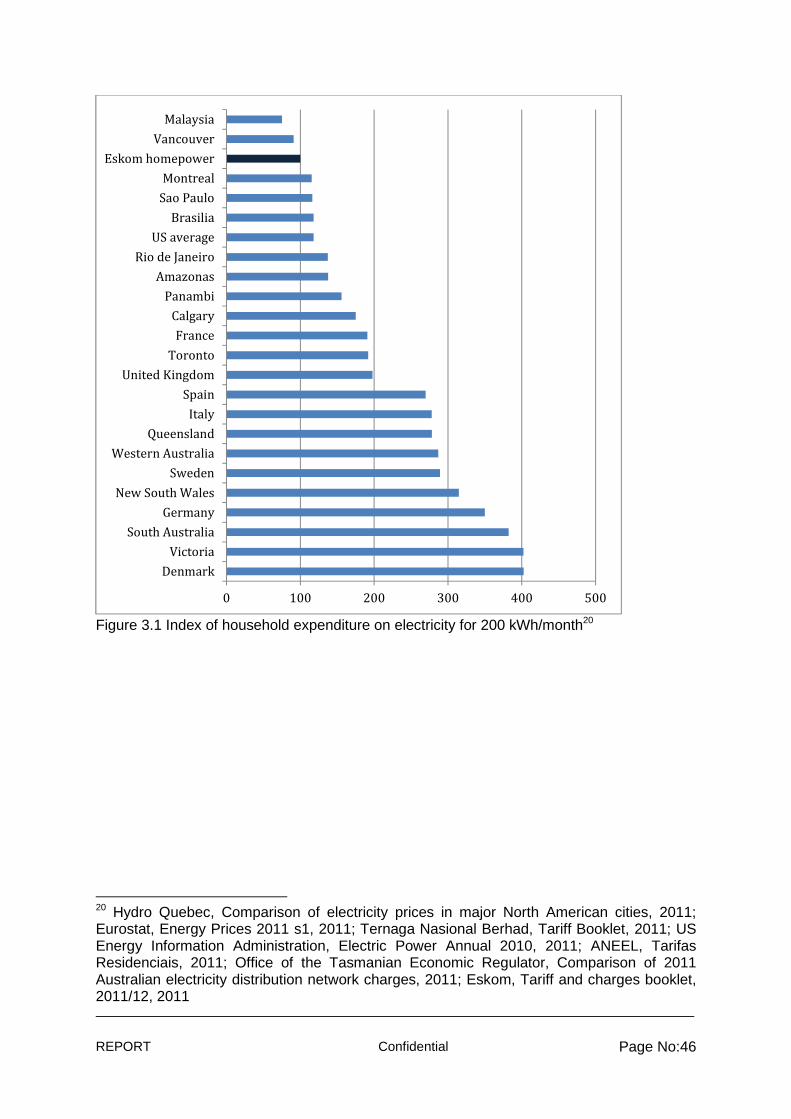
REPORT Confidential Page No:46
Figure 3.1 Index of household expenditure on electricity for 200 kWh/month20
20 Hydro Quebec, Comparison of electricity prices in major North American cities, 2011; Eurostat, Energy Prices 2011 s1, 2011; Ternaga Nasional Berhad, Tariff Booklet, 2011; US Energy Information Administration, Electric Power Annual 2010, 2011; ANEEL, Tarifas Residenciais, 2011; Office of the Tasmanian Economic Regulator, Comparison of 2011 Australian electricity distribution network charges, 2011; Eskom, Tariff and charges booklet, 2011/12, 2011
0 100 200 300 400 500
Denmark
Victoria
South Australia
Germany
New South Wales
Sweden
Western Australia
Queensland
Italy
Spain
United Kingdom
Toronto
France
Calgary
Panambi
Amazonas
Rio de Janeiro
US average
Brasilia
Sao Paulo
Montreal
Eskom homepower
Vancouver
Malaysia
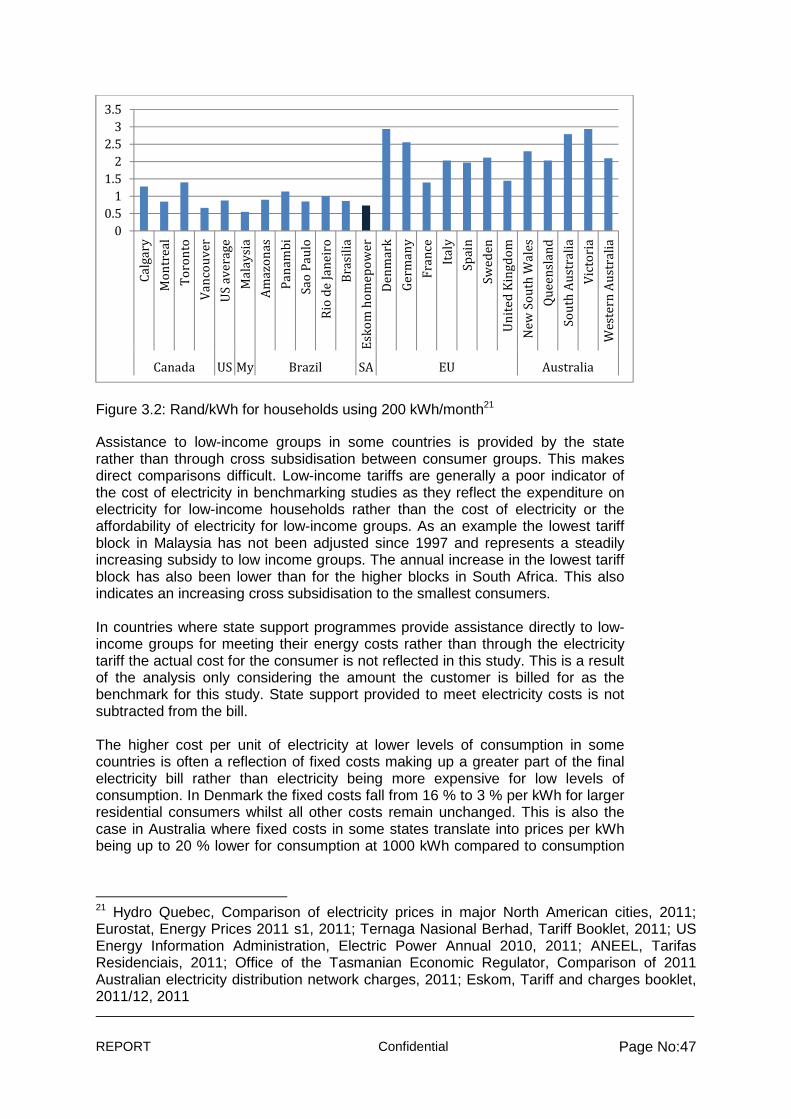
REPORT Confidential Page No:47
Figure 3.2: Rand/kWh for households using 200 kWh/month21
Assistance to low-income groups in some countries is provided by the state rather than through cross subsidisation between consumer groups. This makes direct comparisons difficult. Low-income tariffs are generally a poor indicator of the cost of electricity in benchmarking studies as they reflect the expenditure on electricity for low-income households rather than the cost of electricity or the affordability of electricity for low-income groups. As an example the lowest tariff block in Malaysia has not been adjusted since 1997 and represents a steadily increasing subsidy to low income groups. The annual increase in the lowest tariff block has also been lower than for the higher blocks in South Africa. This also indicates an increasing cross subsidisation to the smallest consumers. In countries where state support programmes provide assistance directly to low-income groups for meeting their energy costs rather than through the electricity tariff the actual cost for the consumer is not reflected in this study. This is a result of the analysis only considering the amount the customer is billed for as the benchmark for this study. State support provided to meet electricity costs is not subtracted from the bill. The higher cost per unit of electricity at lower levels of consumption in some countries is often a reflection of fixed costs making up a greater part of the final electricity bill rather than electricity being more expensive for low levels of consumption. In Denmark the fixed costs fall from 16 % to 3 % per kWh for larger residential consumers whilst all other costs remain unchanged. This is also the case in Australia where fixed costs in some states translate into prices per kWh being up to 20 % lower for consumption at 1000 kWh compared to consumption
21 Hydro Quebec, Comparison of electricity prices in major North American cities, 2011; Eurostat, Energy Prices 2011 s1, 2011; Ternaga Nasional Berhad, Tariff Booklet, 2011; US Energy Information Administration, Electric Power Annual 2010, 2011; ANEEL, Tarifas Residenciais, 2011; Office of the Tasmanian Economic Regulator, Comparison of 2011 Australian electricity distribution network charges, 2011; Eskom, Tariff and charges booklet, 2011/12, 2011
0
0.5
1
1.5
2
2.5
3
3.5
Ca
lga
ry
Mo
ntr
ea
l
To
ron
to
Va
nco
uv
er
US
av
era
ge
Ma
lay
sia
Am
azo
na
s
Pa
na
mb
i
Sa
o P
au
lo
Rio
de
Ja
ne
iro
Bra
sili
a
Esk
om
ho
me
po
we
r
De
nm
ark
Ge
rma
ny
Fra
nce
Ita
ly
Sp
ain
Sw
ed
en
Un
ite
d K
ing
do
m
Ne
w S
ou
th W
ale
s
Qu
ee
nsl
an
d
So
uth
Au
stra
lia
Vic
tori
a
We
ste
rn A
ust
rali
a
Canada US My Brazil SA EU Australia
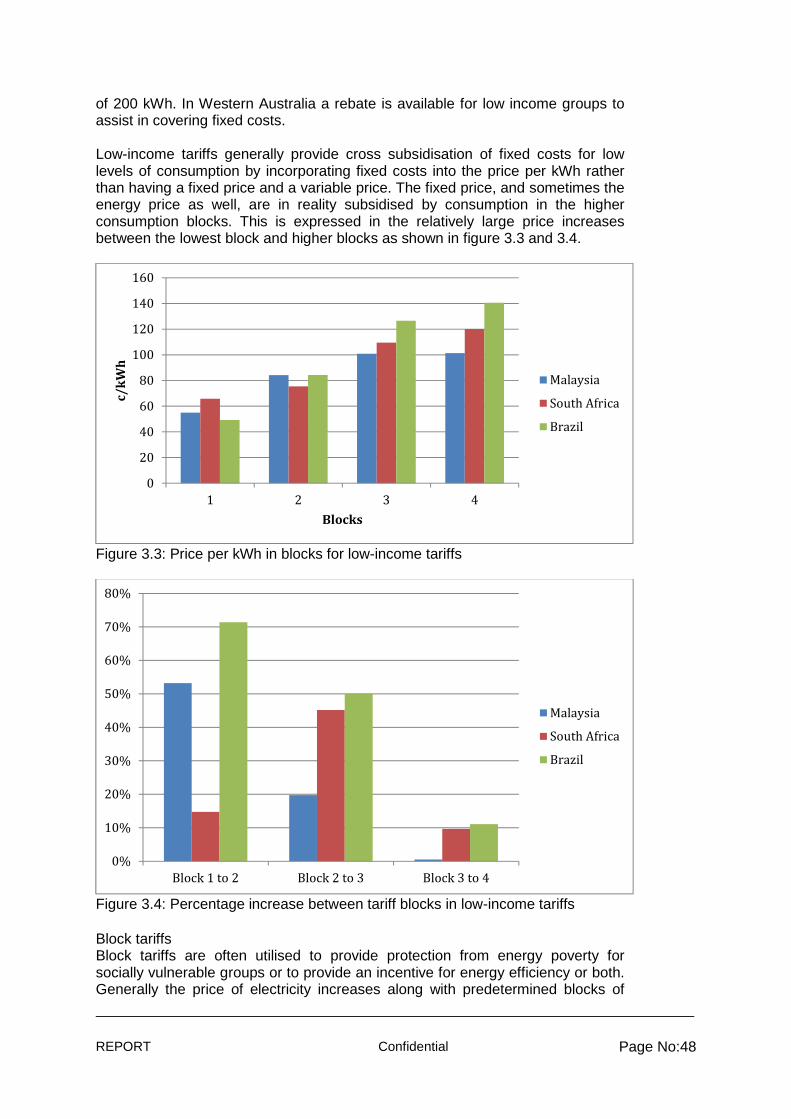
REPORT Confidential Page No:48
of 200 kWh. In Western Australia a rebate is available for low income groups to assist in covering fixed costs. Low-income tariffs generally provide cross subsidisation of fixed costs for low levels of consumption by incorporating fixed costs into the price per kWh rather than having a fixed price and a variable price. The fixed price, and sometimes the energy price as well, are in reality subsidised by consumption in the higher consumption blocks. This is expressed in the relatively large price increases between the lowest block and higher blocks as shown in figure 3.3 and 3.4.
Figure 3.3: Price per kWh in blocks for low-income tariffs
Figure 3.4: Percentage increase between tariff blocks in low-income tariffs Block tariffs Block tariffs are often utilised to provide protection from energy poverty for socially vulnerable groups or to provide an incentive for energy efficiency or both. Generally the price of electricity increases along with predetermined blocks of
0
20
40
60
80
100
120
140
160
1 2 3 4
c/kWh
Blocks
Malaysia
South Africa
Brazil
0%
10%
20%
30%
40%
50%
60%
70%
80%
Block 1 to 2 Block 2 to 3 Block 3 to 4
Malaysia
South Africa
Brazil
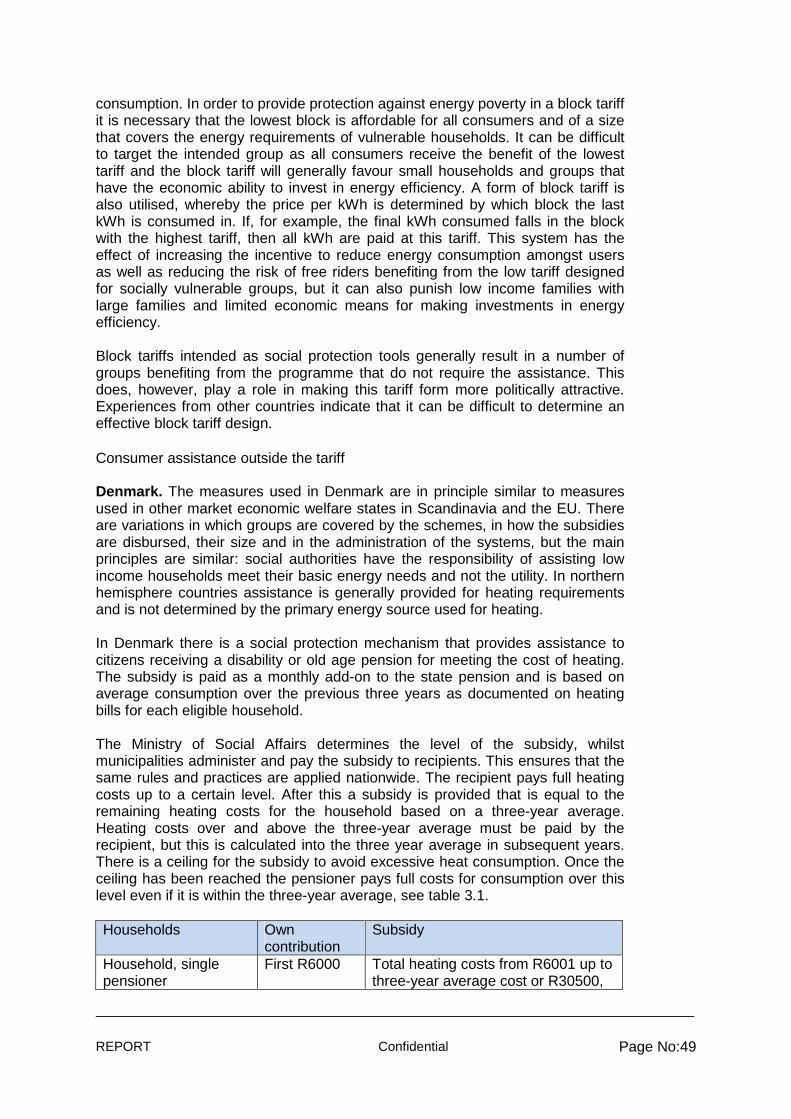
REPORT Confidential Page No:49
consumption. In order to provide protection against energy poverty in a block tariff it is necessary that the lowest block is affordable for all consumers and of a size that covers the energy requirements of vulnerable households. It can be difficult to target the intended group as all consumers receive the benefit of the lowest tariff and the block tariff will generally favour small households and groups that have the economic ability to invest in energy efficiency. A form of block tariff is also utilised, whereby the price per kWh is determined by which block the last kWh is consumed in. If, for example, the final kWh consumed falls in the block with the highest tariff, then all kWh are paid at this tariff. This system has the effect of increasing the incentive to reduce energy consumption amongst users as well as reducing the risk of free riders benefiting from the low tariff designed for socially vulnerable groups, but it can also punish low income families with large families and limited economic means for making investments in energy efficiency. Block tariffs intended as social protection tools generally result in a number of groups benefiting from the programme that do not require the assistance. This does, however, play a role in making this tariff form more politically attractive. Experiences from other countries indicate that it can be difficult to determine an effective block tariff design. Consumer assistance outside the tariff Denmark. The measures used in Denmark are in principle similar to measures used in other market economic welfare states in Scandinavia and the EU. There are variations in which groups are covered by the schemes, in how the subsidies are disbursed, their size and in the administration of the systems, but the main principles are similar: social authorities have the responsibility of assisting low income households meet their basic energy needs and not the utility. In northern hemisphere countries assistance is generally provided for heating requirements and is not determined by the primary energy source used for heating. In Denmark there is a social protection mechanism that provides assistance to citizens receiving a disability or old age pension for meeting the cost of heating. The subsidy is paid as a monthly add-on to the state pension and is based on average consumption over the previous three years as documented on heating bills for each eligible household. The Ministry of Social Affairs determines the level of the subsidy, whilst municipalities administer and pay the subsidy to recipients. This ensures that the same rules and practices are applied nationwide. The recipient pays full heating costs up to a certain level. After this a subsidy is provided that is equal to the remaining heating costs for the household based on a three-year average. Heating costs over and above the three-year average must be paid by the recipient, but this is calculated into the three year average in subsequent years. There is a ceiling for the subsidy to avoid excessive heat consumption. Once the ceiling has been reached the pensioner pays full costs for consumption over this level even if it is within the three-year average, see table 3.1. Households Own
contribution Subsidy
Household, single pensioner
First R6000 Total heating costs from R6001 up to three-year average cost or R30500,
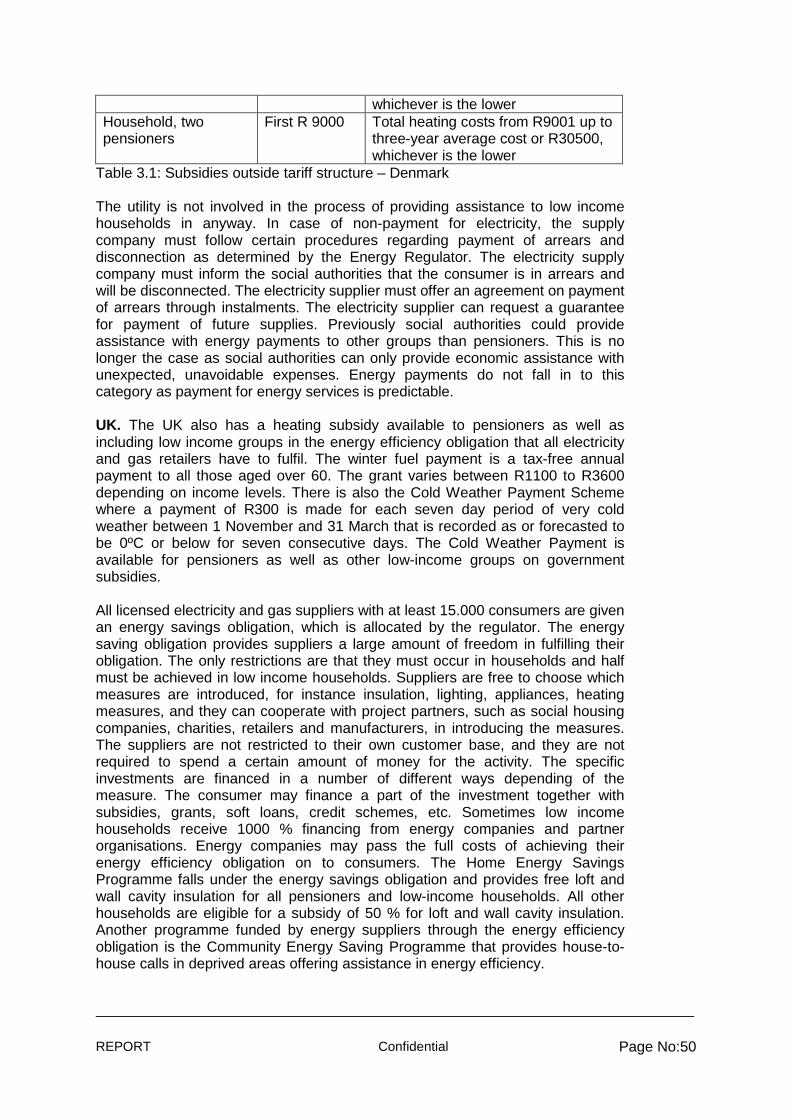
REPORT Confidential Page No:50
whichever is the lower Household, two pensioners
First R 9000 Total heating costs from R9001 up to three-year average cost or R30500, whichever is the lower
Table 3.1: Subsidies outside tariff structure – Denmark The utility is not involved in the process of providing assistance to low income households in anyway. In case of non-payment for electricity, the supply company must follow certain procedures regarding payment of arrears and disconnection as determined by the Energy Regulator. The electricity supply company must inform the social authorities that the consumer is in arrears and will be disconnected. The electricity supplier must offer an agreement on payment of arrears through instalments. The electricity supplier can request a guarantee for payment of future supplies. Previously social authorities could provide assistance with energy payments to other groups than pensioners. This is no longer the case as social authorities can only provide economic assistance with unexpected, unavoidable expenses. Energy payments do not fall in to this category as payment for energy services is predictable. UK. The UK also has a heating subsidy available to pensioners as well as including low income groups in the energy efficiency obligation that all electricity and gas retailers have to fulfil. The winter fuel payment is a tax-free annual payment to all those aged over 60. The grant varies between R1100 to R3600 depending on income levels. There is also the Cold Weather Payment Scheme where a payment of R300 is made for each seven day period of very cold weather between 1 November and 31 March that is recorded as or forecasted to be 0ºC or below for seven consecutive days. The Cold Weather Payment is available for pensioners as well as other low-income groups on government subsidies. All licensed electricity and gas suppliers with at least 15.000 consumers are given an energy savings obligation, which is allocated by the regulator. The energy saving obligation provides suppliers a large amount of freedom in fulfilling their obligation. The only restrictions are that they must occur in households and half must be achieved in low income households. Suppliers are free to choose which measures are introduced, for instance insulation, lighting, appliances, heating measures, and they can cooperate with project partners, such as social housing companies, charities, retailers and manufacturers, in introducing the measures. The suppliers are not restricted to their own customer base, and they are not required to spend a certain amount of money for the activity. The specific investments are financed in a number of different ways depending of the measure. The consumer may finance a part of the investment together with subsidies, grants, soft loans, credit schemes, etc. Sometimes low income households receive 1000 % financing from energy companies and partner organisations. Energy companies may pass the full costs of achieving their energy efficiency obligation on to consumers. The Home Energy Savings Programme falls under the energy savings obligation and provides free loft and wall cavity insulation for all pensioners and low-income households. All other households are eligible for a subsidy of 50 % for loft and wall cavity insulation. Another programme funded by energy suppliers through the energy efficiency obligation is the Community Energy Saving Programme that provides house-to-house calls in deprived areas offering assistance in energy efficiency.
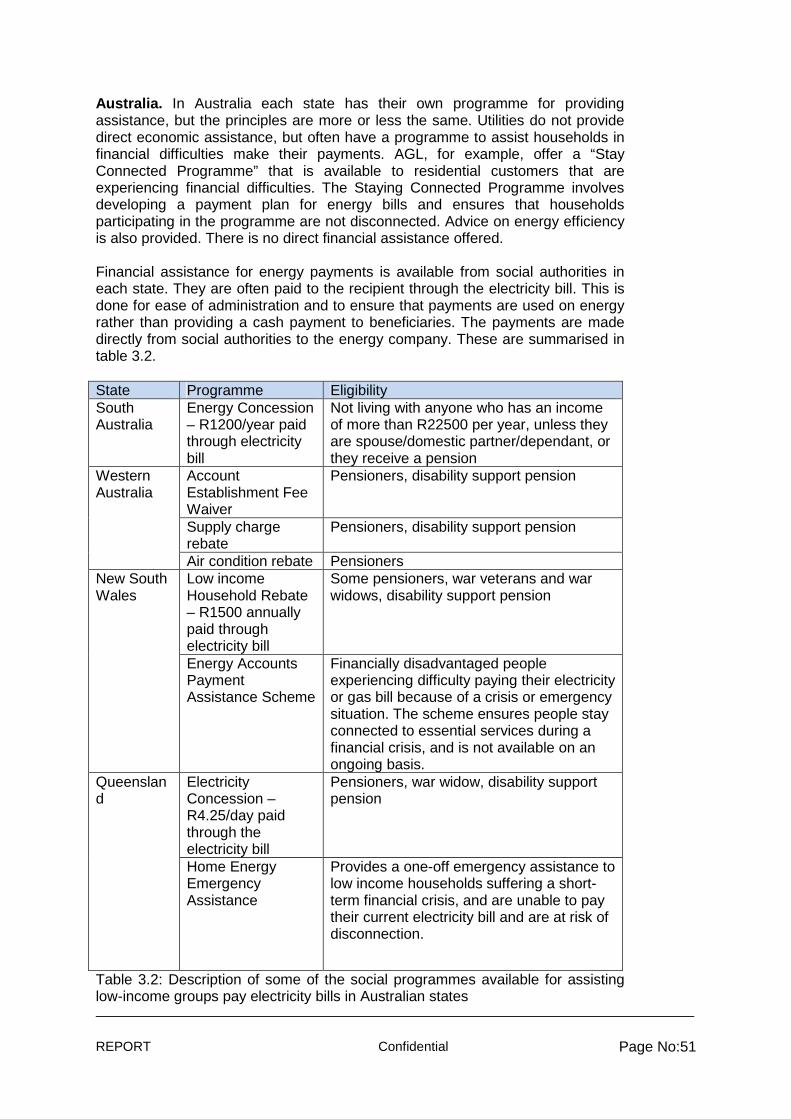
REPORT Confidential Page No:51
Australia. In Australia each state has their own programme for providing assistance, but the principles are more or less the same. Utilities do not provide direct economic assistance, but often have a programme to assist households in financial difficulties make their payments. AGL, for example, offer a “Stay Connected Programme” that is available to residential customers that are experiencing financial difficulties. The Staying Connected Programme involves developing a payment plan for energy bills and ensures that households participating in the programme are not disconnected. Advice on energy efficiency is also provided. There is no direct financial assistance offered. Financial assistance for energy payments is available from social authorities in each state. They are often paid to the recipient through the electricity bill. This is done for ease of administration and to ensure that payments are used on energy rather than providing a cash payment to beneficiaries. The payments are made directly from social authorities to the energy company. These are summarised in table 3.2. State Programme Eligibility South Australia
Energy Concession – R1200/year paid through electricity bill
Not living with anyone who has an income of more than R22500 per year, unless they are spouse/domestic partner/dependant, or they receive a pension
Western Australia
Account Establishment Fee Waiver
Pensioners, disability support pension
Supply charge rebate
Pensioners, disability support pension
Air condition rebate Pensioners New South Wales
Low income Household Rebate – R1500 annually paid through electricity bill
Some pensioners, war veterans and war widows, disability support pension
Energy Accounts Payment Assistance Scheme
Financially disadvantaged people experiencing difficulty paying their electricity or gas bill because of a crisis or emergency situation. The scheme ensures people stay connected to essential services during a financial crisis, and is not available on an ongoing basis.
Queensland
Electricity Concession – R4.25/day paid through the electricity bill
Pensioners, war widow, disability support pension
Home Energy Emergency Assistance
Provides a one-off emergency assistance to low income households suffering a short-term financial crisis, and are unable to pay their current electricity bill and are at risk of disconnection.
Table 3.2: Description of some of the social programmes available for assisting low-income groups pay electricity bills in Australian states
REPORT Confidential Page No:52
3.3 LARGE RESIDENTIAL CONSUMERS
Eskom’s residential tariff for higher levels of consumption is also favourable relative to most countries considered in this study. Consumption of 1000 kWh per month for a household is sizeable in countries where electric heating or cooling is not widespread. This results in the tariff level providing an indication of the level of consumption and what electricity in households is used for. The highest electricity price reported in the study is in Denmark where the average consumption for residential consumers living in houses is 350 kWh/month. In contrast the average consumption for households in the US is 1000 kWh/month. The average US price for electricity is also low by international standards, but in California and New York State, where the weighted average price22 is substantially higher, the average level of consumption is 600 kWh/month. This is not necessarily an indication of elasticity of demand. Despite the very high unit price of electricity for Danish consumers there is still very little elasticity of demand over the short term. However it may indicate that the use of electricity in households has developed differently over time in areas with different price levels. There have been substantial price increases for South African households with a near doubling of tariffs over the last three years. In an international perspective the electricity bill paid by end users with a consumption of 1000 kWh is still relatively low; however, the introduction of a block tariff has made the marginal cost of consumption for large residential consumers substantially higher. This may result in an increased long term elasticity of demand resulting in the introduction of alternatives to electricity such as solar water heating that in the long run may result in reducing the average consumption amongst larger household consumers. Figure 3.5 shows an index of the price of electricity for consumers using 1000 kWh/month. Here the Eskom tariff compares favourably when translating other prices into Rands. This does not take the affordability or differences in income into account. Figure 3.6 shows the actual monthly cost in Rands for electricity in the applicable country or area.
22 The weighted average price of electricity in California is R1,07 and R1,34
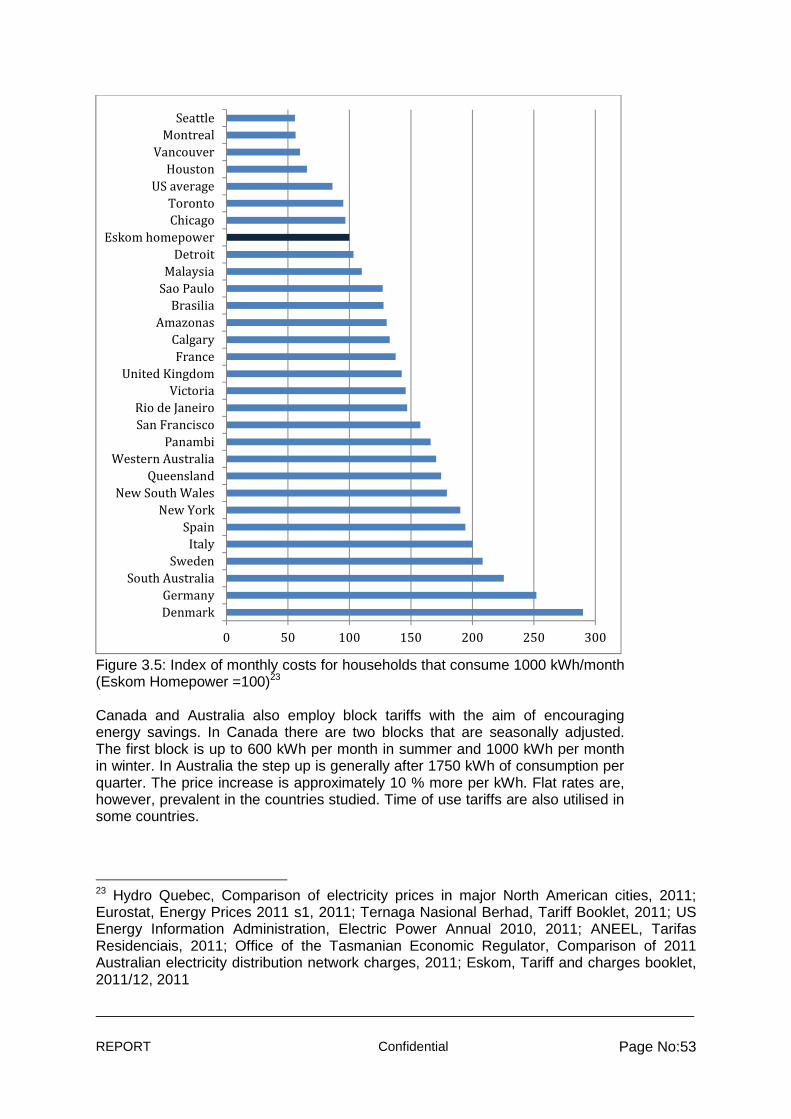
REPORT Confidential Page No:53
Figure 3.5: Index of monthly costs for households that consume 1000 kWh/month (Eskom Homepower =100)23 Canada and Australia also employ block tariffs with the aim of encouraging energy savings. In Canada there are two blocks that are seasonally adjusted. The first block is up to 600 kWh per month in summer and 1000 kWh per month in winter. In Australia the step up is generally after 1750 kWh of consumption per quarter. The price increase is approximately 10 % more per kWh. Flat rates are, however, prevalent in the countries studied. Time of use tariffs are also utilised in some countries.
23 Hydro Quebec, Comparison of electricity prices in major North American cities, 2011; Eurostat, Energy Prices 2011 s1, 2011; Ternaga Nasional Berhad, Tariff Booklet, 2011; US Energy Information Administration, Electric Power Annual 2010, 2011; ANEEL, Tarifas Residenciais, 2011; Office of the Tasmanian Economic Regulator, Comparison of 2011 Australian electricity distribution network charges, 2011; Eskom, Tariff and charges booklet, 2011/12, 2011
0 50 100 150 200 250 300
Denmark
Germany
South Australia
Sweden
Italy
Spain
New York
New South Wales
Queensland
Western Australia
Panambi
San Francisco
Rio de Janeiro
Victoria
United Kingdom
France
Calgary
Amazonas
Brasilia
Sao Paulo
Malaysia
Detroit
Eskom homepower
Chicago
Toronto
US average
Houston
Vancouver
Montreal
Seattle
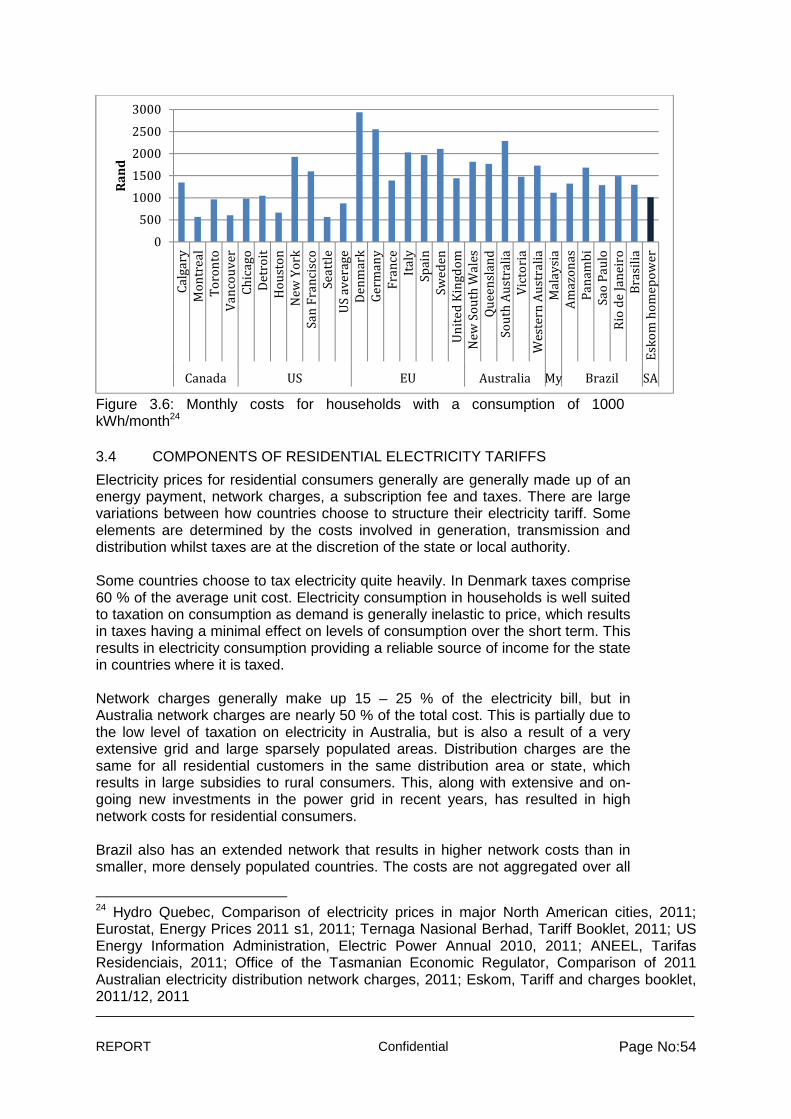
REPORT Confidential Page No:54
Figure 3.6: Monthly costs for households with a consumption of 1000 kWh/month24
3.4 COMPONENTS OF RESIDENTIAL ELECTRICITY TARIFFS
Electricity prices for residential consumers generally are generally made up of an energy payment, network charges, a subscription fee and taxes. There are large variations between how countries choose to structure their electricity tariff. Some elements are determined by the costs involved in generation, transmission and distribution whilst taxes are at the discretion of the state or local authority. Some countries choose to tax electricity quite heavily. In Denmark taxes comprise 60 % of the average unit cost. Electricity consumption in households is well suited to taxation on consumption as demand is generally inelastic to price, which results in taxes having a minimal effect on levels of consumption over the short term. This results in electricity consumption providing a reliable source of income for the state in countries where it is taxed. Network charges generally make up 15 – 25 % of the electricity bill, but in Australia network charges are nearly 50 % of the total cost. This is partially due to the low level of taxation on electricity in Australia, but is also a result of a very extensive grid and large sparsely populated areas. Distribution charges are the same for all residential customers in the same distribution area or state, which results in large subsidies to rural consumers. This, along with extensive and on-going new investments in the power grid in recent years, has resulted in high network costs for residential consumers. Brazil also has an extended network that results in higher network costs than in smaller, more densely populated countries. The costs are not aggregated over all
24 Hydro Quebec, Comparison of electricity prices in major North American cities, 2011; Eurostat, Energy Prices 2011 s1, 2011; Ternaga Nasional Berhad, Tariff Booklet, 2011; US Energy Information Administration, Electric Power Annual 2010, 2011; ANEEL, Tarifas Residenciais, 2011; Office of the Tasmanian Economic Regulator, Comparison of 2011 Australian electricity distribution network charges, 2011; Eskom, Tariff and charges booklet, 2011/12, 2011
0
500
1000
1500
2000
2500
3000
Ca
lga
ry
Mo
ntr
ea
l
To
ron
to
Va
nco
uv
er
Ch
ica
go
De
tro
it
Ho
ust
on
Ne
w Y
ork
Sa
n F
ran
cisc
o
Se
att
le
US
av
era
ge
De
nm
ark
Ge
rma
ny
Fra
nce
Ita
ly
Sp
ain
Sw
ed
en
Un
ite
d K
ing
do
m
Ne
w S
ou
th W
ale
s
Qu
ee
nsl
an
d
So
uth
Au
stra
lia
Vic
tori
a
We
ste
rn A
ust
rali
a
Ma
lay
sia
Am
azo
na
s
Pa
na
mb
i
Sa
o P
au
lo
Rio
de
Ja
ne
iro
Bra
sili
a
Esk
om
ho
me
po
we
r
Canada US EU Australia My Brazil SA
Rand
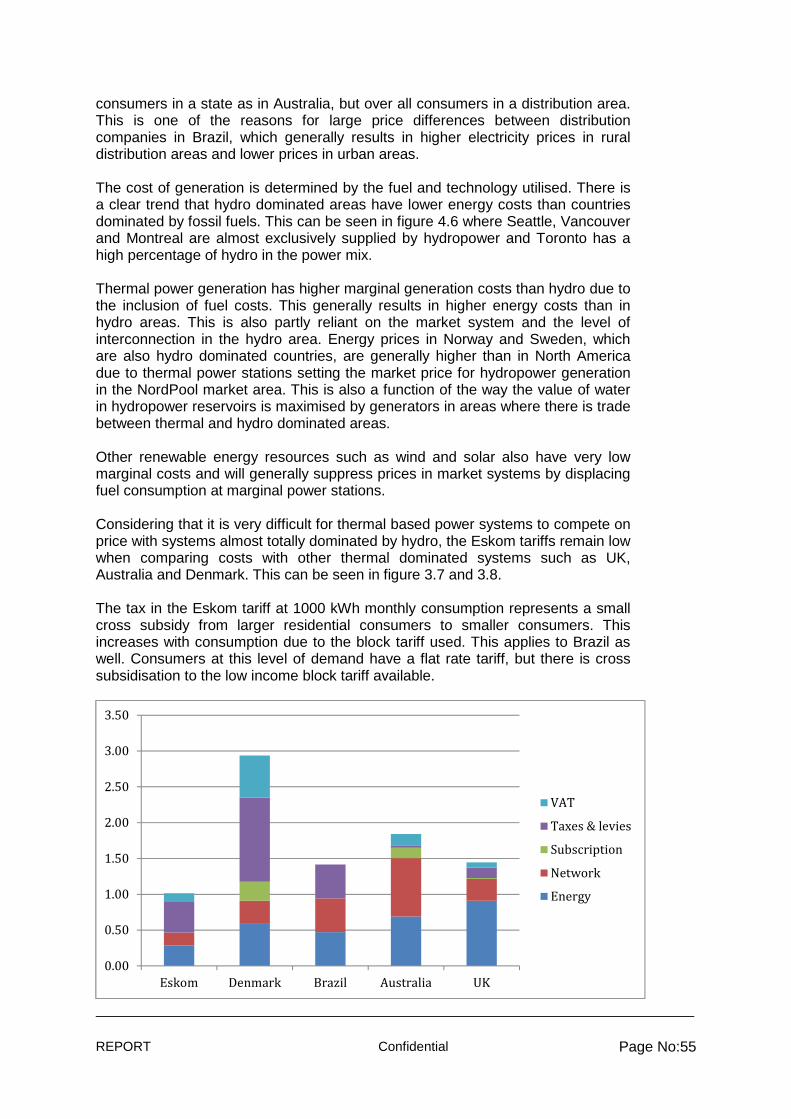
REPORT Confidential Page No:55
consumers in a state as in Australia, but over all consumers in a distribution area. This is one of the reasons for large price differences between distribution companies in Brazil, which generally results in higher electricity prices in rural distribution areas and lower prices in urban areas. The cost of generation is determined by the fuel and technology utilised. There is a clear trend that hydro dominated areas have lower energy costs than countries dominated by fossil fuels. This can be seen in figure 4.6 where Seattle, Vancouver and Montreal are almost exclusively supplied by hydropower and Toronto has a high percentage of hydro in the power mix. Thermal power generation has higher marginal generation costs than hydro due to the inclusion of fuel costs. This generally results in higher energy costs than in hydro areas. This is also partly reliant on the market system and the level of interconnection in the hydro area. Energy prices in Norway and Sweden, which are also hydro dominated countries, are generally higher than in North America due to thermal power stations setting the market price for hydropower generation in the NordPool market area. This is also a function of the way the value of water in hydropower reservoirs is maximised by generators in areas where there is trade between thermal and hydro dominated areas. Other renewable energy resources such as wind and solar also have very low marginal costs and will generally suppress prices in market systems by displacing fuel consumption at marginal power stations. Considering that it is very difficult for thermal based power systems to compete on price with systems almost totally dominated by hydro, the Eskom tariffs remain low when comparing costs with other thermal dominated systems such as UK, Australia and Denmark. This can be seen in figure 3.7 and 3.8. The tax in the Eskom tariff at 1000 kWh monthly consumption represents a small cross subsidy from larger residential consumers to smaller consumers. This increases with consumption due to the block tariff used. This applies to Brazil as well. Consumers at this level of demand have a flat rate tariff, but there is cross subsidisation to the low income block tariff available.
0.00
0.50
1.00
1.50
2.00
2.50
3.00
3.50
Eskom Denmark Brazil Australia UK
VAT
Taxes & levies
Subscription
Network
Energy
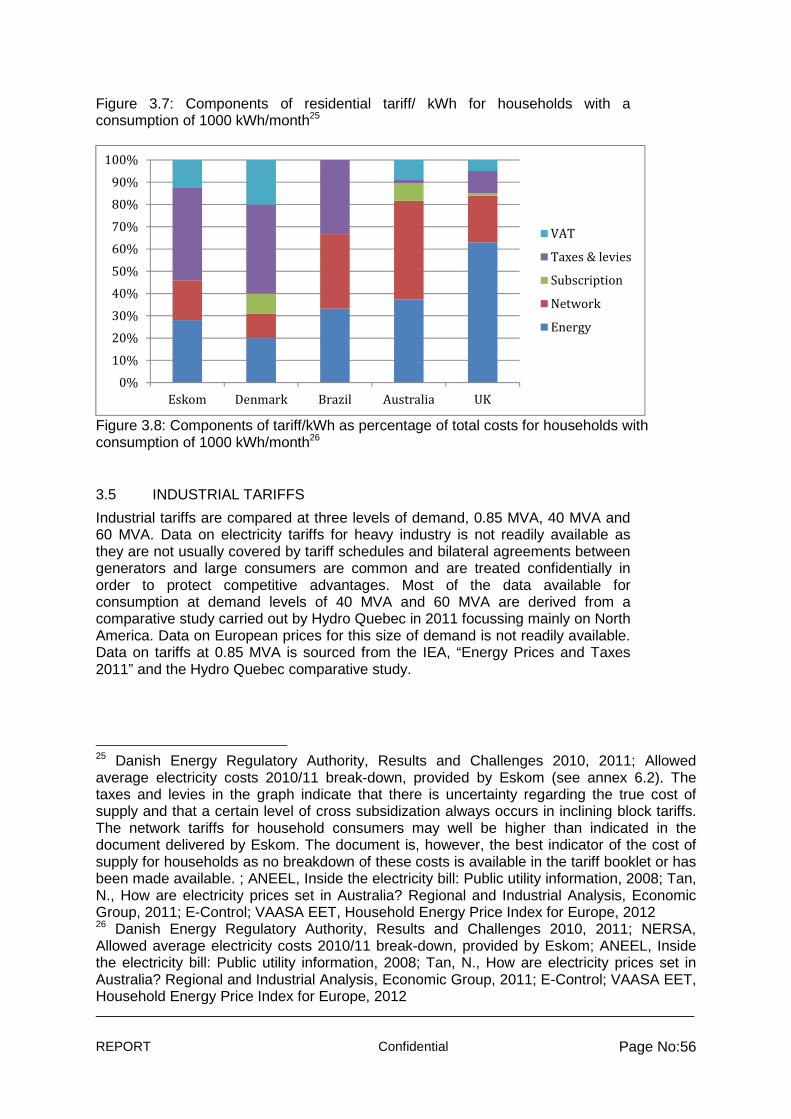
REPORT Confidential Page No:56
Figure 3.7: Components of residential tariff/ kWh for households with a consumption of 1000 kWh/month25
Figure 3.8: Components of tariff/kWh as percentage of total costs for households with consumption of 1000 kWh/month26
3.5 INDUSTRIAL TARIFFS
Industrial tariffs are compared at three levels of demand, 0.85 MVA, 40 MVA and 60 MVA. Data on electricity tariffs for heavy industry is not readily available as they are not usually covered by tariff schedules and bilateral agreements between generators and large consumers are common and are treated confidentially in order to protect competitive advantages. Most of the data available for consumption at demand levels of 40 MVA and 60 MVA are derived from a comparative study carried out by Hydro Quebec in 2011 focussing mainly on North America. Data on European prices for this size of demand is not readily available. Data on tariffs at 0.85 MVA is sourced from the IEA, “Energy Prices and Taxes 2011” and the Hydro Quebec comparative study.
25 Danish Energy Regulatory Authority, Results and Challenges 2010, 2011; Allowed average electricity costs 2010/11 break-down, provided by Eskom (see annex 6.2). The taxes and levies in the graph indicate that there is uncertainty regarding the true cost of supply and that a certain level of cross subsidization always occurs in inclining block tariffs. The network tariffs for household consumers may well be higher than indicated in the document delivered by Eskom. The document is, however, the best indicator of the cost of supply for households as no breakdown of these costs is available in the tariff booklet or has been made available. ; ANEEL, Inside the electricity bill: Public utility information, 2008; Tan, N., How are electricity prices set in Australia? Regional and Industrial Analysis, Economic Group, 2011; E-Control; VAASA EET, Household Energy Price Index for Europe, 2012 26 Danish Energy Regulatory Authority, Results and Challenges 2010, 2011; NERSA, Allowed average electricity costs 2010/11 break-down, provided by Eskom; ANEEL, Inside the electricity bill: Public utility information, 2008; Tan, N., How are electricity prices set in Australia? Regional and Industrial Analysis, Economic Group, 2011; E-Control; VAASA EET, Household Energy Price Index for Europe, 2012
0%
10%
20%
30%
40%
50%
60%
70%
80%
90%
100%
Eskom Denmark Brazil Australia UK
VAT
Taxes & levies
Subscription
Network
Energy
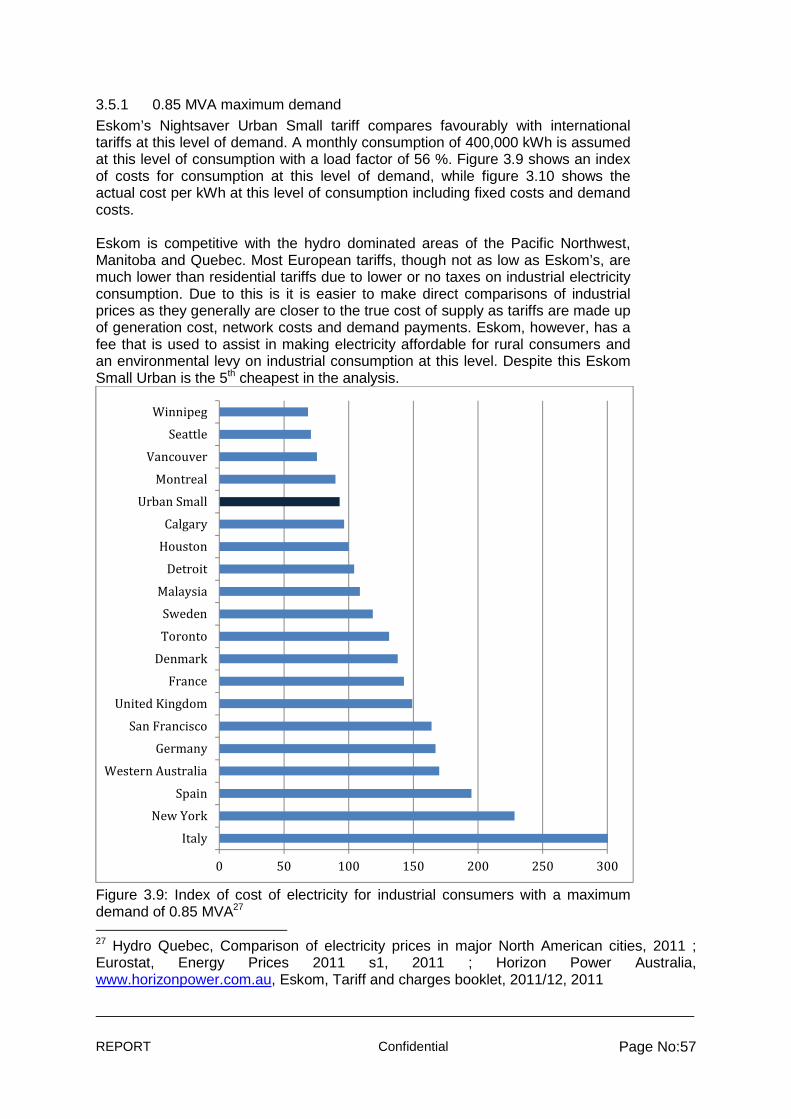
REPORT Confidential Page No:57
3.5.1 0.85 MVA maximum demand Eskom’s Nightsaver Urban Small tariff compares favourably with international tariffs at this level of demand. A monthly consumption of 400,000 kWh is assumed at this level of consumption with a load factor of 56 %. Figure 3.9 shows an index of costs for consumption at this level of demand, while figure 3.10 shows the actual cost per kWh at this level of consumption including fixed costs and demand costs. Eskom is competitive with the hydro dominated areas of the Pacific Northwest, Manitoba and Quebec. Most European tariffs, though not as low as Eskom’s, are much lower than residential tariffs due to lower or no taxes on industrial electricity consumption. Due to this is it is easier to make direct comparisons of industrial prices as they generally are closer to the true cost of supply as tariffs are made up of generation cost, network costs and demand payments. Eskom, however, has a fee that is used to assist in making electricity affordable for rural consumers and an environmental levy on industrial consumption at this level. Despite this Eskom Small Urban is the 5th cheapest in the analysis.
Figure 3.9: Index of cost of electricity for industrial consumers with a maximum demand of 0.85 MVA27 27 Hydro Quebec, Comparison of electricity prices in major North American cities, 2011 ; Eurostat, Energy Prices 2011 s1, 2011 ; Horizon Power Australia, www.horizonpower.com.au, Eskom, Tariff and charges booklet, 2011/12, 2011
0 50 100 150 200 250 300
Italy
New York
Spain
Western Australia
Germany
San Francisco
United Kingdom
France
Denmark
Toronto
Sweden
Malaysia
Detroit
Houston
Calgary
Urban Small
Montreal
Vancouver
Seattle
Winnipeg
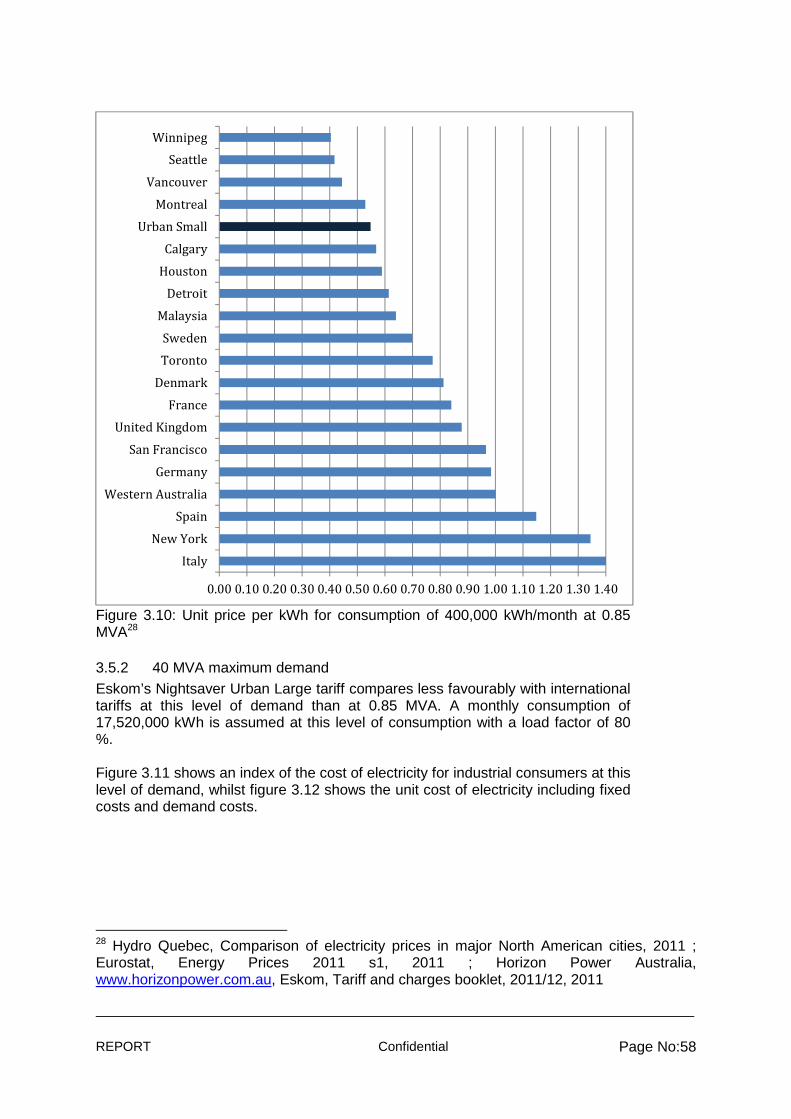
REPORT Confidential Page No:58
Figure 3.10: Unit price per kWh for consumption of 400,000 kWh/month at 0.85 MVA28
3.5.2 40 MVA maximum demand Eskom’s Nightsaver Urban Large tariff compares less favourably with international tariffs at this level of demand than at 0.85 MVA. A monthly consumption of 17,520,000 kWh is assumed at this level of consumption with a load factor of 80 %. Figure 3.11 shows an index of the cost of electricity for industrial consumers at this level of demand, whilst figure 3.12 shows the unit cost of electricity including fixed costs and demand costs.
28 Hydro Quebec, Comparison of electricity prices in major North American cities, 2011 ; Eurostat, Energy Prices 2011 s1, 2011 ; Horizon Power Australia, www.horizonpower.com.au, Eskom, Tariff and charges booklet, 2011/12, 2011
0.00 0.10 0.20 0.30 0.40 0.50 0.60 0.70 0.80 0.90 1.00 1.10 1.20 1.30 1.40
Italy
New York
Spain
Western Australia
Germany
San Francisco
United Kingdom
France
Denmark
Toronto
Sweden
Malaysia
Detroit
Houston
Calgary
Urban Small
Montreal
Vancouver
Seattle
Winnipeg
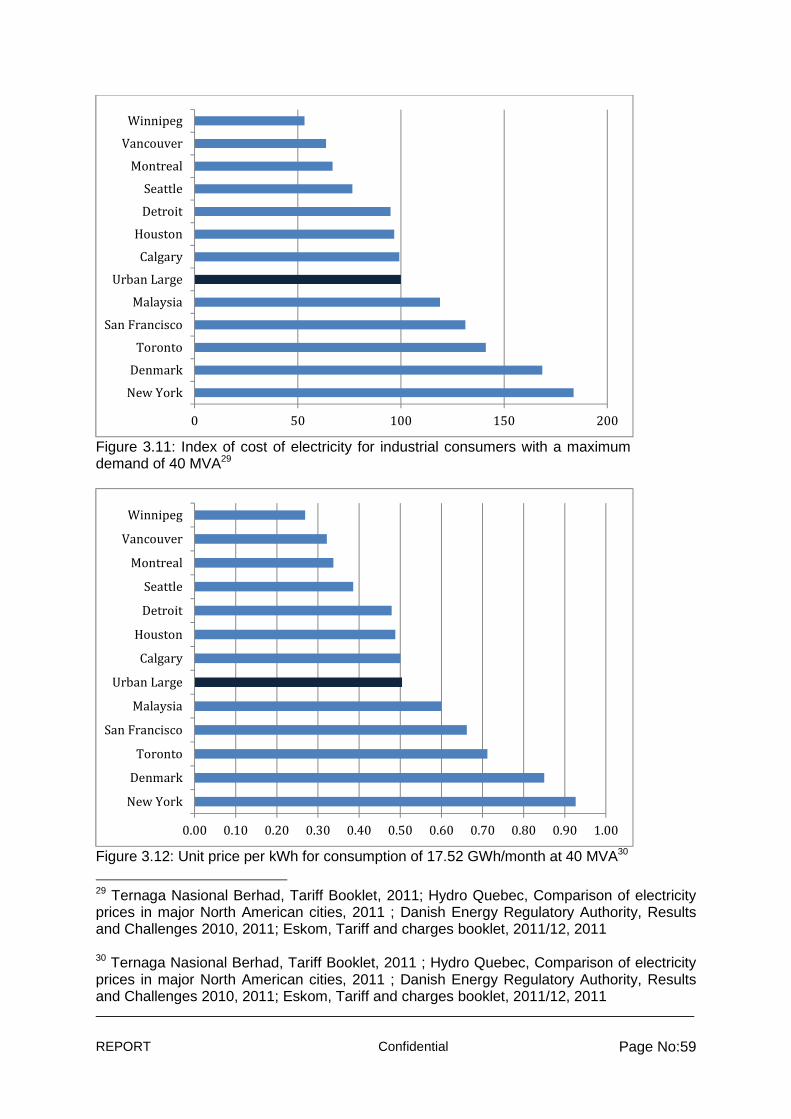
REPORT Confidential Page No:59
Figure 3.11: Index of cost of electricity for industrial consumers with a maximum demand of 40 MVA29
Figure 3.12: Unit price per kWh for consumption of 17.52 GWh/month at 40 MVA30
29 Ternaga Nasional Berhad, Tariff Booklet, 2011; Hydro Quebec, Comparison of electricity prices in major North American cities, 2011 ; Danish Energy Regulatory Authority, Results and Challenges 2010, 2011; Eskom, Tariff and charges booklet, 2011/12, 2011 30 Ternaga Nasional Berhad, Tariff Booklet, 2011 ; Hydro Quebec, Comparison of electricity prices in major North American cities, 2011 ; Danish Energy Regulatory Authority, Results and Challenges 2010, 2011; Eskom, Tariff and charges booklet, 2011/12, 2011
0 50 100 150 200
New York
Denmark
Toronto
San Francisco
Malaysia
Urban Large
Calgary
Houston
Detroit
Seattle
Montreal
Vancouver
Winnipeg
0.00 0.10 0.20 0.30 0.40 0.50 0.60 0.70 0.80 0.90 1.00
New York
Denmark
Toronto
San Francisco
Malaysia
Urban Large
Calgary
Houston
Detroit
Seattle
Montreal
Vancouver
Winnipeg
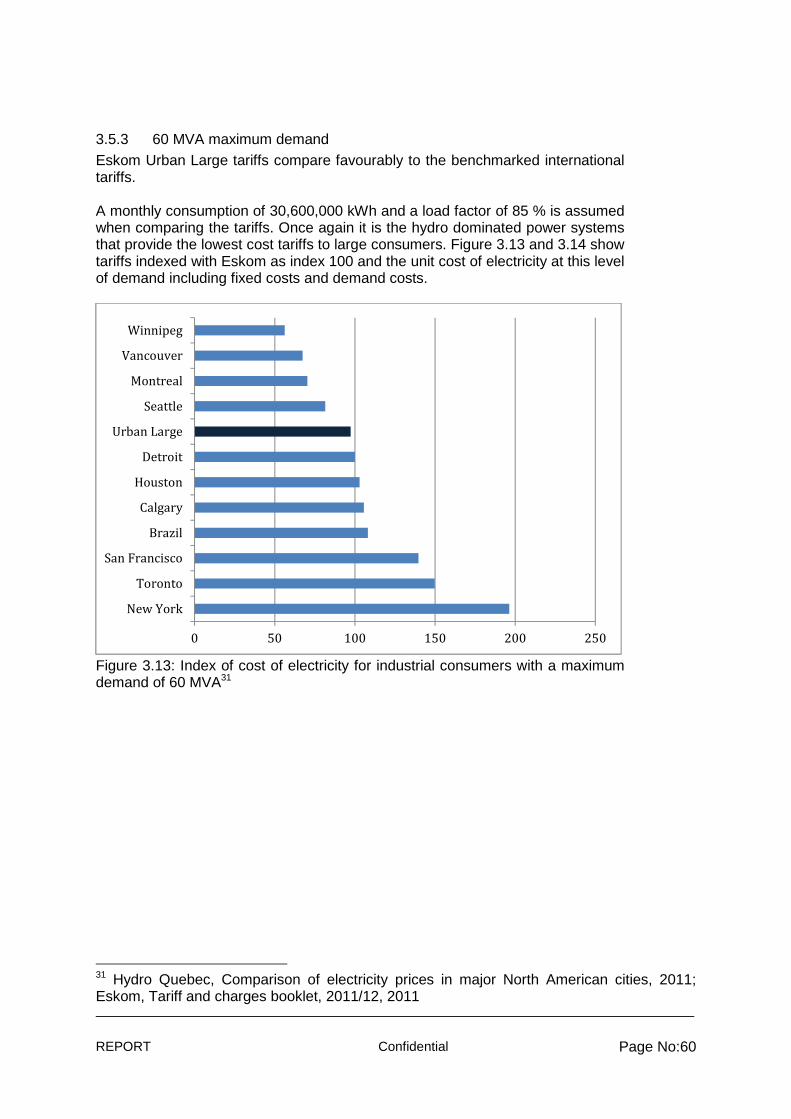
REPORT Confidential Page No:60
3.5.3 60 MVA maximum demand Eskom Urban Large tariffs compare favourably to the benchmarked international tariffs. A monthly consumption of 30,600,000 kWh and a load factor of 85 % is assumed when comparing the tariffs. Once again it is the hydro dominated power systems that provide the lowest cost tariffs to large consumers. Figure 3.13 and 3.14 show tariffs indexed with Eskom as index 100 and the unit cost of electricity at this level of demand including fixed costs and demand costs.
Figure 3.13: Index of cost of electricity for industrial consumers with a maximum demand of 60 MVA31
31 Hydro Quebec, Comparison of electricity prices in major North American cities, 2011; Eskom, Tariff and charges booklet, 2011/12, 2011
0 50 100 150 200 250
New York
Toronto
San Francisco
Brazil
Calgary
Houston
Detroit
Urban Large
Seattle
Montreal
Vancouver
Winnipeg
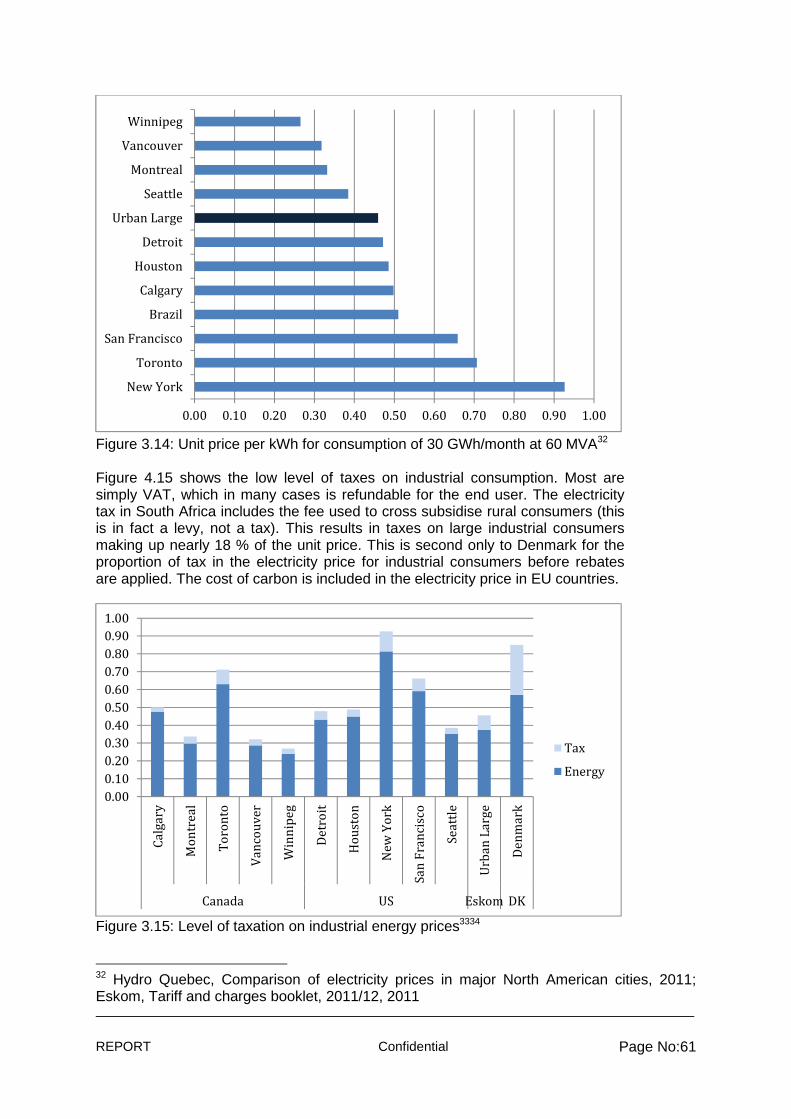
REPORT Confidential Page No:61
Figure 3.14: Unit price per kWh for consumption of 30 GWh/month at 60 MVA32 Figure 4.15 shows the low level of taxes on industrial consumption. Most are simply VAT, which in many cases is refundable for the end user. The electricity tax in South Africa includes the fee used to cross subsidise rural consumers (this is in fact a levy, not a tax). This results in taxes on large industrial consumers making up nearly 18 % of the unit price. This is second only to Denmark for the proportion of tax in the electricity price for industrial consumers before rebates are applied. The cost of carbon is included in the electricity price in EU countries.
Figure 3.15: Level of taxation on industrial energy prices3334
32 Hydro Quebec, Comparison of electricity prices in major North American cities, 2011; Eskom, Tariff and charges booklet, 2011/12, 2011
0.00 0.10 0.20 0.30 0.40 0.50 0.60 0.70 0.80 0.90 1.00
New York
Toronto
San Francisco
Brazil
Calgary
Houston
Detroit
Urban Large
Seattle
Montreal
Vancouver
Winnipeg
0.00
0.10
0.20
0.30
0.40
0.50
0.60
0.70
0.80
0.90
1.00
Ca
lga
ry
Mo
ntr
ea
l
To
ron
to
Va
nco
uv
er
Win
nip
eg
De
tro
it
Ho
ust
on
Ne
w Y
ork
Sa
n F
ran
cisc
o
Se
att
le
Urb
an
La
rge
De
nm
ark
Canada US Eskom DK
Tax
Energy
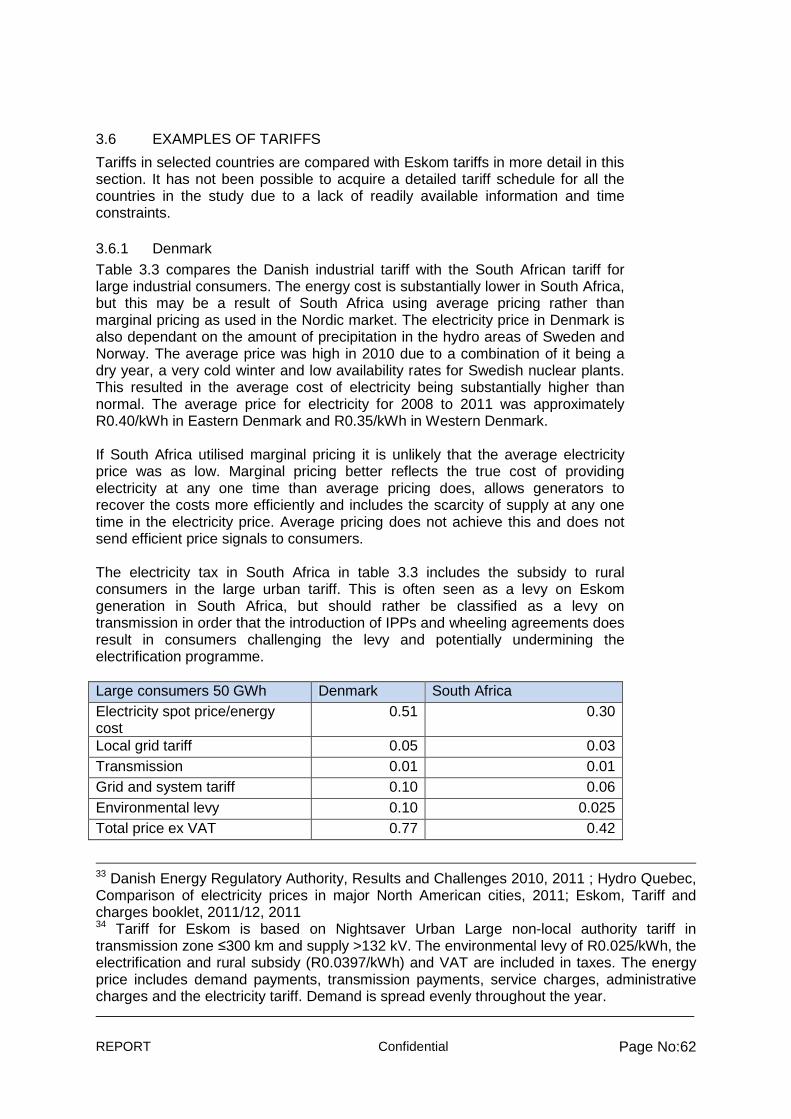
REPORT Confidential Page No:62
3.6 EXAMPLES OF TARIFFS
Tariffs in selected countries are compared with Eskom tariffs in more detail in this section. It has not been possible to acquire a detailed tariff schedule for all the countries in the study due to a lack of readily available information and time constraints.
3.6.1 Denmark Table 3.3 compares the Danish industrial tariff with the South African tariff for large industrial consumers. The energy cost is substantially lower in South Africa, but this may be a result of South Africa using average pricing rather than marginal pricing as used in the Nordic market. The electricity price in Denmark is also dependant on the amount of precipitation in the hydro areas of Sweden and Norway. The average price was high in 2010 due to a combination of it being a dry year, a very cold winter and low availability rates for Swedish nuclear plants. This resulted in the average cost of electricity being substantially higher than normal. The average price for electricity for 2008 to 2011 was approximately R0.40/kWh in Eastern Denmark and R0.35/kWh in Western Denmark. If South Africa utilised marginal pricing it is unlikely that the average electricity price was as low. Marginal pricing better reflects the true cost of providing electricity at any one time than average pricing does, allows generators to recover the costs more efficiently and includes the scarcity of supply at any one time in the electricity price. Average pricing does not achieve this and does not send efficient price signals to consumers. The electricity tax in South Africa in table 3.3 includes the subsidy to rural consumers in the large urban tariff. This is often seen as a levy on Eskom generation in South Africa, but should rather be classified as a levy on transmission in order that the introduction of IPPs and wheeling agreements does result in consumers challenging the levy and potentially undermining the electrification programme. Large consumers 50 GWh Denmark South Africa Electricity spot price/energy cost
0.51 0.30
Local grid tariff 0.05 0.03 Transmission 0.01 0.01 Grid and system tariff 0.10 0.06 Environmental levy 0.10 0.025 Total price ex VAT 0.77 0.42
33 Danish Energy Regulatory Authority, Results and Challenges 2010, 2011 ; Hydro Quebec, Comparison of electricity prices in major North American cities, 2011; Eskom, Tariff and charges booklet, 2011/12, 2011 34 Tariff for Eskom is based on Nightsaver Urban Large non-local authority tariff in transmission zone ≤300 km and supply >132 kV. The environmental levy of R0.025/kWh, the electrification and rural subsidy (R0.0397/kWh) and VAT are included in taxes. The energy price includes demand payments, transmission payments, service charges, administrative charges and the electricity tariff. Demand is spread evenly throughout the year.
REPORT Confidential Page No:63
Electricity tax35 0.02 0.04 CO2 tax 0.07 0.00 VAT 0.00 0.06 Total price incl. VAT 0.85 0.48 Table 3.3: Detailed comparison of Danish and South African tariff components for large industrial consumers36 For residential consumers in Denmark one can see the very high taxes placed on electricity consumption by households. The energy price is higher than for industrial consumers as the default supply tariff is regulated as a quarterly spot price plus expenses for the supplier of last resort. If the consumer were active on the retail market they would be able to secure a lower energy charge, but the taxes would remain unchanged. The high taxation on electricity is one of the main reasons why Danish households are not active on the electricity market as the benefit of changing supplier and paying a lower energy charge is minimal compared to the overall cost of electricity. It does however make investments in energy efficient appliances more attractive. The electricity tax in the Eskom tariff is a result of the block tariff and represents the cross subsidisation of tariffs in the lower blocks. This assumes that the highest block tariff reflects the true cost of supply. The Eskom tariff only consists of a per kWh cost. The fixed costs are included in the tariff. If fixed costs were charged per connection, as they are in many of the countries included in this analysis, then they would decrease per kWh consumed each month. This is not the case in the Eskom tariff as the proportion of the tariff designated to fixed costs is the same for each kWh consumed in each tariff block. It can, therefore, be assumed that fixed costs for consumers with lower consumption are subsidised by consumers in the higher tariff blocks. Household consumers (avg. price for 1000kWh/month)
Denmark South Africa
Electricity price 0.6337 0.29 Subscription 0.04 0.011 Local grid tariff 0.20 0.079 Grid subscription 0.21 - Transmission 0.01 0.019 Grid and system tariff 0.10 -
Environmental levy 0.10 0.025 Total price ex VAT 1.30 0.42 Electricity tax 0.92 0.47 Distribution tax 0.05 -
Energy savings contribution 0.01 -
CO2 tax 0.09 -
VAT 0.59 0.12
35 The electricity tax in South Africa in is the fee used to cross subsidise rural consumers. 36 Danish Energy Regulatory Authority, Results and Challenges 2010, 2011; NERSA, Allowed average electricity costs 2010/11 break-down, provided by Eskom 37 Supplier of last resort
REPORT Confidential Page No:64
Total price incl. VAT 2.96 1.01 Table 3.4: Detailed comparison of Danish and South African tariff components for residential consumers38
3.6.2 Western Australia Table 3.5 shows the residential and industrial tariffs in Western Australia. The tariff is a flat rate with a daily supply charge. There is no low income tariff. Industrial consumers have a supply charge, demand charge and energy charge. There are peak and off-peak rates. Tariff Charge Unit cost
Residential Supply R3/day
Electricity R1.63/kWh
Large business, low voltage, 0,4kV
Supply R3000/day
Electricity Peak R1.09/kWh Off peak R0.69/kWh
Demand R7.62/kW (per day multiplied by (i) the on-peak half-hourly maximum demand; or (ii) 30% of the off-peak half hourly maximum
demand; whichever is the greater) Large business, high voltage, 6.6 – 33kV
Supply R4257/day Electricity Peak R1.97/kWh
Off peak R0.73/kWh Demand R7.50/kW (per day multiplied by (i) the on-
peak half-hourly maximum demand; or (ii) 30% of the off-peak half hourly maximum
demand; whichever is the greater) Table 3.5: Regulated tariffs for residential and industrial consumers in Western Australia
3.6.3 South Australia South Australia uses a block tariff with a peak season and an off-peak season. Even though there is a block tariff there is still a daily supply charge. The block tariff is aimed at making energy efficiency more attractive rather than providing low income households with a lower tariff. Inclining monthly block tariff
Energy charge (c/kWh) 1 Jan - 31 March
Energy charge (c/kWh) rest of year
0 – 100 kWh R 2.14 R 2.03 101 – 333 kWh R 2.34 R 2.07 334 – 833 kWh R 2.64 R 2.37 >833 kWh R 2.84 R 2.57 Service charge/day
R 4.58 R 4.58
38 Danish Energy Regulatory Authority, Results and Challenges 2010, 2011; NERSA, Allowed average electricity costs 2010/11 break-down, provided by Eskom
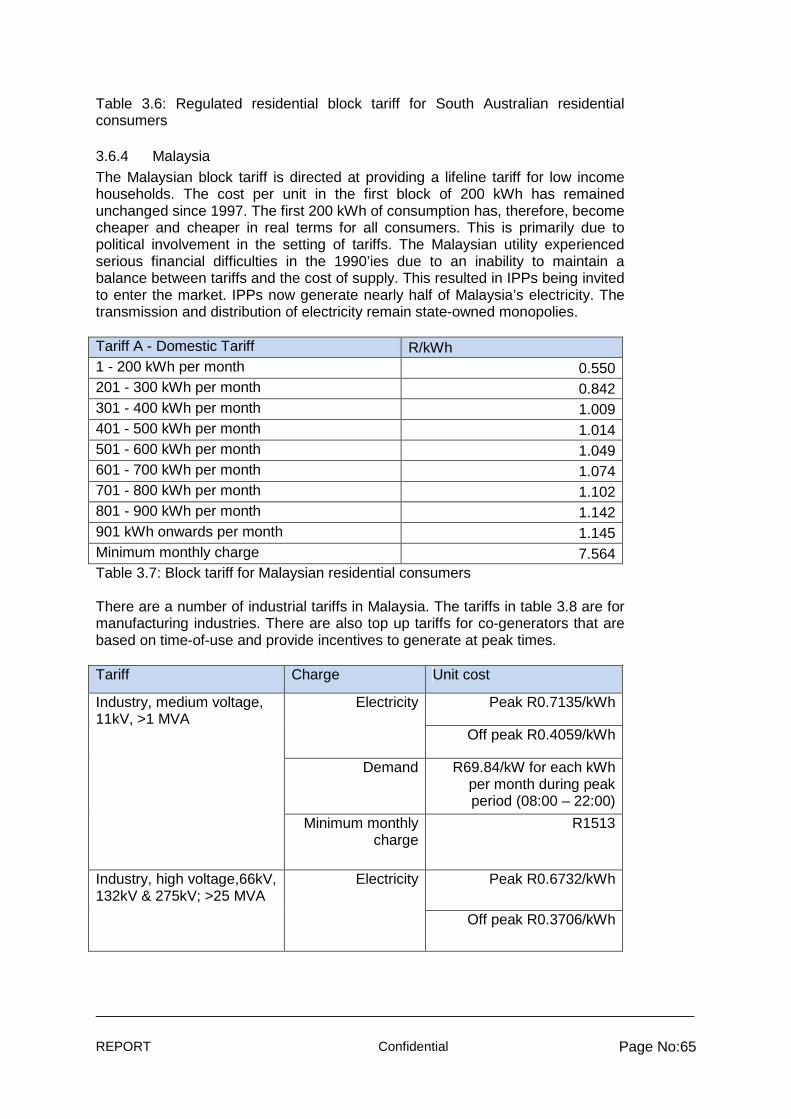
REPORT Confidential Page No:65
Table 3.6: Regulated residential block tariff for South Australian residential consumers
3.6.4 Malaysia The Malaysian block tariff is directed at providing a lifeline tariff for low income households. The cost per unit in the first block of 200 kWh has remained unchanged since 1997. The first 200 kWh of consumption has, therefore, become cheaper and cheaper in real terms for all consumers. This is primarily due to political involvement in the setting of tariffs. The Malaysian utility experienced serious financial difficulties in the 1990’ies due to an inability to maintain a balance between tariffs and the cost of supply. This resulted in IPPs being invited to enter the market. IPPs now generate nearly half of Malaysia’s electricity. The transmission and distribution of electricity remain state-owned monopolies. Tariff A - Domestic Tariff R/kWh 1 - 200 kWh per month 0.550 201 - 300 kWh per month 0.842 301 - 400 kWh per month 1.009 401 - 500 kWh per month 1.014 501 - 600 kWh per month 1.049 601 - 700 kWh per month 1.074 701 - 800 kWh per month 1.102 801 - 900 kWh per month 1.142 901 kWh onwards per month 1.145 Minimum monthly charge 7.564 Table 3.7: Block tariff for Malaysian residential consumers There are a number of industrial tariffs in Malaysia. The tariffs in table 3.8 are for manufacturing industries. There are also top up tariffs for co-generators that are based on time-of-use and provide incentives to generate at peak times. Tariff Charge Unit cost
Industry, medium voltage, 11kV, >1 MVA
Electricity
Peak R0.7135/kWh
Off peak R0.4059/kWh
Demand R69.84/kW for each kWh per month during peak period (08:00 – 22:00)
Minimum monthly charge
R1513
Industry, high voltage,66kV, 132kV & 275kV; >25 MVA
Electricity
Peak R0.6732/kWh
Off peak R0.3706/kWh
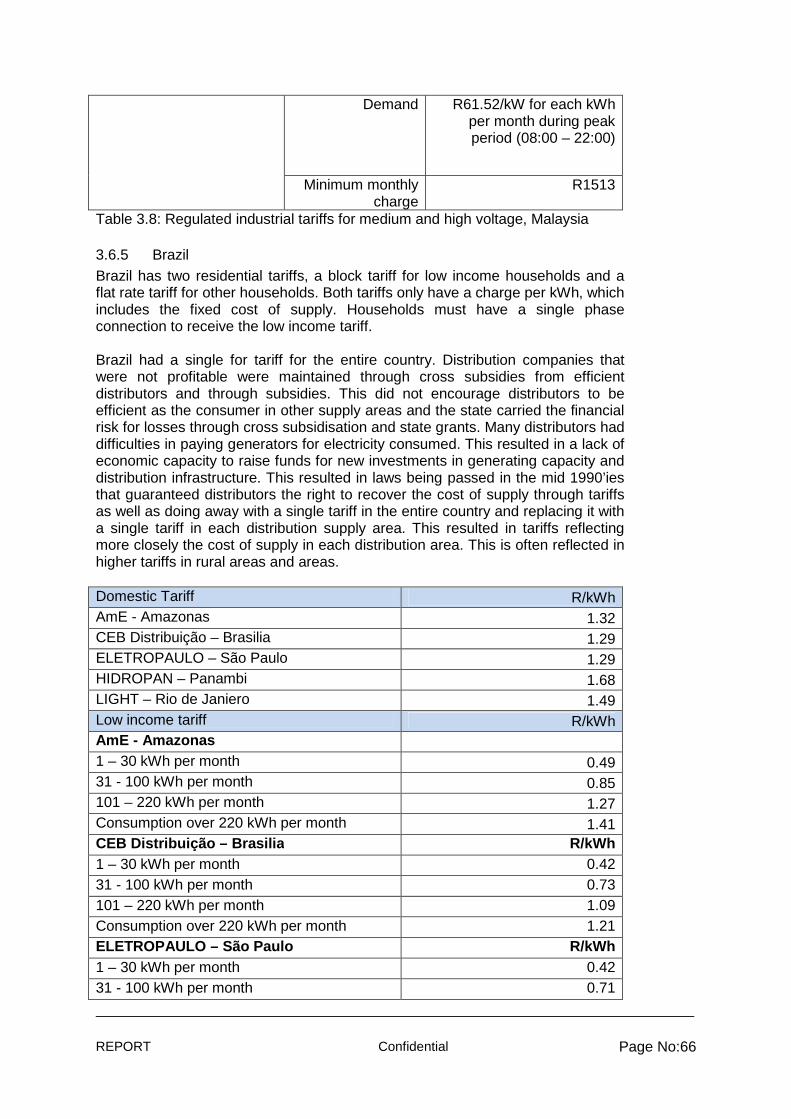
REPORT Confidential Page No:66
Demand R61.52/kW for each kWh per month during peak period (08:00 – 22:00)
Minimum monthly charge
R1513
Table 3.8: Regulated industrial tariffs for medium and high voltage, Malaysia
3.6.5 Brazil Brazil has two residential tariffs, a block tariff for low income households and a flat rate tariff for other households. Both tariffs only have a charge per kWh, which includes the fixed cost of supply. Households must have a single phase connection to receive the low income tariff. Brazil had a single for tariff for the entire country. Distribution companies that were not profitable were maintained through cross subsidies from efficient distributors and through subsidies. This did not encourage distributors to be efficient as the consumer in other supply areas and the state carried the financial risk for losses through cross subsidisation and state grants. Many distributors had difficulties in paying generators for electricity consumed. This resulted in a lack of economic capacity to raise funds for new investments in generating capacity and distribution infrastructure. This resulted in laws being passed in the mid 1990’ies that guaranteed distributors the right to recover the cost of supply through tariffs as well as doing away with a single tariff in the entire country and replacing it with a single tariff in each distribution supply area. This resulted in tariffs reflecting more closely the cost of supply in each distribution area. This is often reflected in higher tariffs in rural areas and areas. Domestic Tariff R/kWh AmE - Amazonas 1.32 CEB Distribuição – Brasilia 1.29 ELETROPAULO – São Paulo 1.29 HIDROPAN – Panambi 1.68 LIGHT – Rio de Janiero 1.49 Low income tariff R/kWh AmE - Amazonas
1 – 30 kWh per month 0.49 31 - 100 kWh per month 0.85 101 – 220 kWh per month 1.27 Consumption over 220 kWh per month 1.41 CEB Distribuição – Brasilia R/kWh 1 – 30 kWh per month 0.42 31 - 100 kWh per month 0.73 101 – 220 kWh per month 1.09 Consumption over 220 kWh per month 1.21 ELETROPAULO – São Paulo R/kWh 1 – 30 kWh per month 0.42 31 - 100 kWh per month 0.71
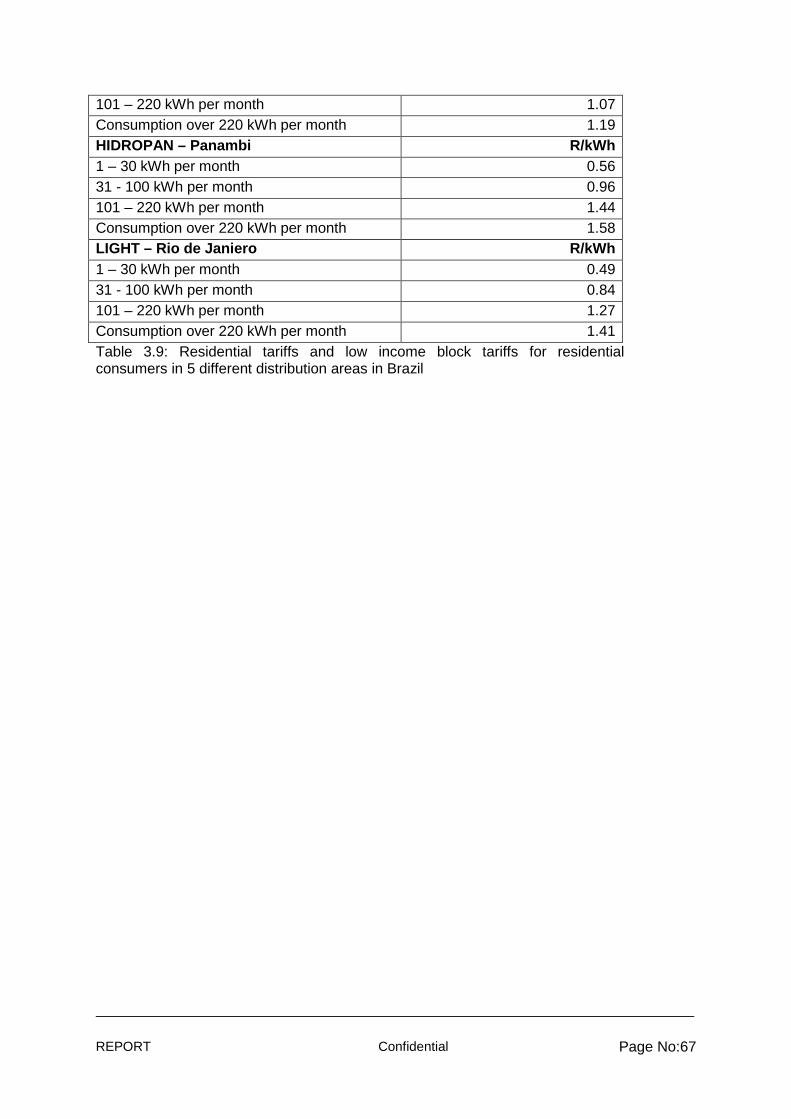
REPORT Confidential Page No:67
101 – 220 kWh per month 1.07 Consumption over 220 kWh per month 1.19 HIDROPAN – Panambi R/kWh 1 – 30 kWh per month 0.56 31 - 100 kWh per month 0.96 101 – 220 kWh per month 1.44 Consumption over 220 kWh per month 1.58 LIGHT – Rio de Janiero R/kWh 1 – 30 kWh per month 0.49 31 - 100 kWh per month 0.84 101 – 220 kWh per month 1.27 Consumption over 220 kWh per month 1.41 Table 3.9: Residential tariffs and low income block tariffs for residential consumers in 5 different distribution areas in Brazil
REPORT Confidential Page No:68
4 PART C: COMPARISON OF TARIFF METHODOLOGIES
This chapter contains a short description of the tariff methodologies in the following countries: Denmark, Australia, Canada and USA. There are in general two main principles of monopoly regulation. (i) The cost of service, and (ii) Price or budget cap regulation. Perfectly executed the cost of service makes it possible to assure that the monopolies recover their total cost incl. a return on investment, no matter what; cabling, exogenous and endogenous efficiency gains etc. The cost of service regulation holds cost down to long run cost, but does not give incentives to reduce cost to the marginal cost as in a theoretical competitive market. Price cap regulation (if kept constant over years) gives a strong incentive to reduce the cost, in theory to the marginal cost; since a Rand cost reduction for the monopoly is an extra Rand to the shareholders. But the cap unfortunately needs to allow prices that are well above long run cost to avoid accidentally bankrupting the regulated companies. There are of course lot of different perspectives on the choice of optimal monopoly regulation. One perspective has to do with the necessary information for the regulator. The argument would typically be that the regulator needs more information with a price-cap regulation than with cost of service regulation. But this of course depends on how the regulation is actually carried out. In all the Nordic countries the regulation of distribution and transmission companies are carried out as a price or budget cap regulation. The calculation of the cap varies a lot, and has been changed in all the countries. Even if the principles of the price/budget cap regulation are the same for the distribution and transmission companies in the countries, the data differs and so might the exact model also. The system operator is in all countries regulated in a cost of service regulation. This is also due to practical reasons because there is only one system operator in each country: It is therefore impossible to compare and benchmark. A cross-European analysis has been made. But it is a time consuming procedure and furthermore legally complicated to use international comparisons as basis for national regulation of system operation. It is probably fair to say that the monopoly regulation in many OECD countries and for that matter also the framework for the competitive part of the electricity market is based on an ‘old’ top-down perspective of the electricity system. It is furthermore based on a historic situation with surplus capacity as well in production as in distribution and transmission. When the capacity becomes
REPORT Confidential Page No:69
tighter a discussion of if the various regulation systems and market frameworks give the right investment incentives becomes ever more important.
4.1 DENMARK In Denmark electricity production, distribution and transmission are unbundled and thus handled in separate companies. The consumer paid electricity bill consists of the costs for all three services plus taxed and public service obligations. The composition of the Danish electricity price for households is discussed in chapters 3.4 and 3.6. The tariff methodologies in Denmark vary between the three divisions of electricity, distribution and transmission. The amount of the tariffs is somewhat regulated as shown in table 4.1. Denmark Regulation Electricity Free market prices Distribution Revenue cap + rate of return cap Transmission Cost based regulation
Table 4.1: Regulation of sectors in electricity supply industry in Denmark
4.1.1 Electricity tariffs In Denmark electricity production is liberalized and the tariffs electricity generation is a result of the free market prices. Denmark is part of the Nord Pool Spot Market where a daily competitive auction establishes a price for each hour of the next day determined by the balance between supply and demand, taking into account transmission capacity. The Nordic electricity market consists of a number of specific underlying markets based on a timeline for the bidding offers, the most important in this connection being the day-ahead spot market. The trading horizon in the day-ahead spot market is 12- 36 hours ahead and is done in the context of the next day’s 24 hour period. The system price and the area prices are calculated after all participants bids have been received before gate closure at 12:00. Participants’ bids consist of price and an hourly volume in a certain bidding area. Retailers bid in with expected consumption while the generators bid in with their production capacity and their associated production costs. The price is determined as the intersection between the aggregated curves for demand and supply for each hour – taking the restriction imposed by transmission lines into account. Figure 4.2 illustrates the formation of the system price on the spot market as a price intersection between the purchase and sale of electricity.
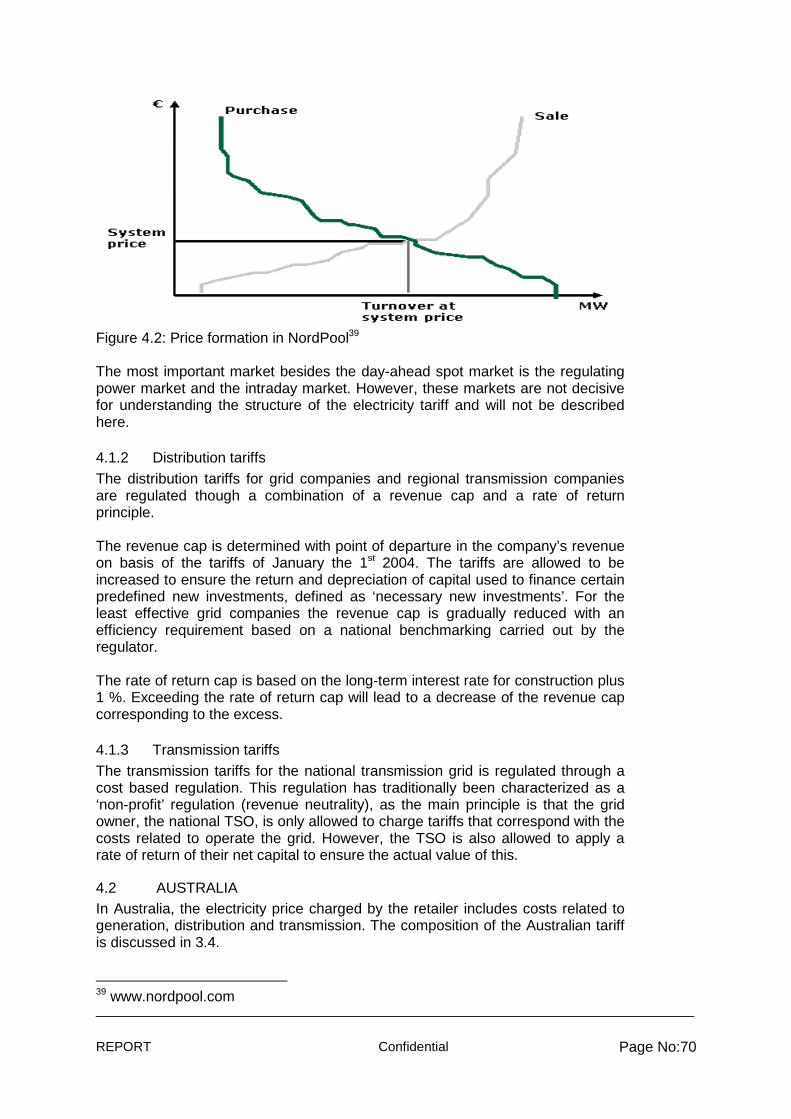
REPORT Confidential Page No:70
Figure 4.2: Price formation in NordPool39 The most important market besides the day-ahead spot market is the regulating power market and the intraday market. However, these markets are not decisive for understanding the structure of the electricity tariff and will not be described here.
4.1.2 Distribution tariffs The distribution tariffs for grid companies and regional transmission companies are regulated though a combination of a revenue cap and a rate of return principle. The revenue cap is determined with point of departure in the company’s revenue on basis of the tariffs of January the 1st 2004. The tariffs are allowed to be increased to ensure the return and depreciation of capital used to finance certain predefined new investments, defined as ‘necessary new investments’. For the least effective grid companies the revenue cap is gradually reduced with an efficiency requirement based on a national benchmarking carried out by the regulator. The rate of return cap is based on the long-term interest rate for construction plus 1 %. Exceeding the rate of return cap will lead to a decrease of the revenue cap corresponding to the excess.
4.1.3 Transmission tariffs The transmission tariffs for the national transmission grid is regulated through a cost based regulation. This regulation has traditionally been characterized as a ‘non-profit’ regulation (revenue neutrality), as the main principle is that the grid owner, the national TSO, is only allowed to charge tariffs that correspond with the costs related to operate the grid. However, the TSO is also allowed to apply a rate of return of their net capital to ensure the actual value of this.
4.2 AUSTRALIA In Australia, the electricity price charged by the retailer includes costs related to generation, distribution and transmission. The composition of the Australian tariff is discussed in 3.4. 39 www.nordpool.com
REPORT Confidential Page No:71
In Australia the total length of the distribution infrastructure is app. 17 times longer than the length of the transmission grid. That explains why the distribution costs amounts to almost 40 % of the consumer’s electricity bill while transmission costs amounts to only 8 %. The wholesale electricity price amounts to almost 40 % of the electricity bill. With regard to the regulation of the size of the tariffs, table 4.2 shows a division between the market-based electricity tariff and the distribution and transmission tariffs. Australia Regulation Electricity tariffs Free market/Cost allowances for retailers Distribution tariffs Revenue cap Transmission tariffs Revenue cap
Table 4.2: Regulation of sectors in electricity supply industry in Australia
4.2.1 Electricity tariffs The National Energy Market (NEM) in Australia is characterized as a wholesale market. A price cap exists but it is very high and only binding when demand is at its highest peak – perhaps a few times a year. Prices in the NEM are determined every five minutes as a result of supply and demand, and averaged over each half hour period to set the spot price. However, the wholesale electricity component of residential electricity bill is somewhat regulated by jurisdictional regulators. The jurisdictional regulators determine an energy purchase cost allowance for each retailer within each jurisdiction to reflect an estimate of the costs they would face in purchasing energy from the wholesale market and managing associated risks. Western Australia and the Northern Territory is not part of the NEM. In Western Australia a wholesale market exists but 95 % of electricity is traded through bilateral contracts, and in the Northern Territory there is no wholesale electricity market.
4.2.2 Transmission and distribution tariffs All network charges (transmission and distribution) connected to the National Energy Market are regulated by the Australian Energy Regulator (AER). The tariffs are designed as a revenue cap and are based on the amount of revenue required to cover the network provider’s costs over a five-year period. The costs included in the revenue cap are O&M, return on capital, asset deprecation costs and tax liabilities. The revenue requirements include a ‘return of capital’ which take into account the borrowing costs in investments. The return of capital is typically the largest component of the tariff composition. Both demand and generation pays transmission tariffs. The tariffs vary according to connection points, and Exit and Entry tariffs are fixed for each generator or consumer at each geographical connection point. The demand tariffs contain exit, usage and general services, while the generation tariffs only include entry charges.
REPORT Confidential Page No:72
4.3 CANADA The federal state of Canada is comprised of ten provinces that are given significant jurisdictional responsibility. The judicial independence of the provinces also applies to the energy sector. Hence, electricity pricing in Canada varies by province or territory according to the volume and type of available generation and whether prices are market-based or regulated. The province of Alberta has moved the furthest in restructuring its electricity market and its electricity prices are more market-based compared to other provinces and territories. Ontario has chosen to partially restructure its electricity market. Prices in other provinces and territories are set by the electricity regulator to cover costs and allow for a reasonable rate of return to investors. In the following passage British Colombia and Alberta are described separately as examples of respectively market based and cost regulated electricity tariffs.
4.3.1 British Columbia (BC) Like the majority of Canadian provinces, the province of British Columbia (BC) has a cost based electricity pricing system. Describing the structure of the electricity pricing in BC is a fine way to illustrate why prices and methodology varies greatly from one province to another. The energy sector in BC is characterized by publicity-owned generation and transmission assets. The dominant power generator, BC Hydro, accounts for roughly 80% of the total electric generation capacity in the province and is owned by the Government of BC. Likewise, the TSO, the British Columbia Transmission Corporation (BCTC), is owned by the Government. The activities of both BC Hydro and BCTC are regulated by the BC Utilities Commission. As roughly 95% of the electricity production comes from hydroelectric dams that were built decades ago, the electricity price in BC is very low compared to other provinces. The introduction of new sources of power production and new actors will undoubtedly lead to an increase of prices. Electricity tariffs The electricity tariffs in BC are cost-regulated. The tariffs are primarily influenced by stipulations within the “Heritage Contract,” which guarantees that BC customers continue to benefit from low-cost Heritage Resources, defined as the legacy of existing generation, transmission and distribution infrastructure. The purpose of the Heritage Contract is to maintain low electricity rates for customers while maintaining a secure and reliable energy supply. The Heritage Contract also stipulates that tariffs are to be maintained at a level consistent with the power producer’s annual revenue requirements while still remaining affordable to consumers. The most common form of tariff determination in BC is known as “historical average cost pricing”, which is the method used by the dominating power producer BC Hydro to determine the price of the guaranteed quantity of electricity to be provided by its Heritage Resources. Under this pricing scheme electricity tariffs equal the average cost of producing one unit of electricity over the lifetime of a given generating facility. The average cost is determined through calculation of the “levelised unit cost” (LUC), which divides the capital and operating costs of a facility by the total energy that is projected to be produced by the facility over its lifetime.
REPORT Confidential Page No:73
A high level of electricity consumption in BC has lead to a concern that the low electricity prices are encouraging the consumers to use more electricity than necessary. Therefore, in 2008 BC Hydro brought in a stepped electricity tariff in order to promote conservation, charging residential customers 6.27 cents/kWh for the first 1,350 kWh they use over a two-month billing period, while charging 8.78 cents/kWh for any quantity of electricity above that initial amount. Electricity tariffs set by BC Hydro or alternative actors must be approved by the BC Utilities Commission. Transmission tariffs The transmission network of BC is operated and maintained by the publicity-owned British Columbia Transmission Corporation (BCTC). The open access transmission tariffs are established as a stepped rate, a time-of-use rate and a retail access.
4.3.2 Alberta As mentioned above, Alberta is the only province in Canada with a fully competitive wholesale electricity market. The Power Pool of Alberta was created in 1996 and provides a competitive real-time market for electricity, at all power is sold through the Power Pool. The Power Pool is operated and managed by the system operator AESO, who is established through the independent jurisdictional agency of the Alberta Government, Alberta Energy and Utilities Board (EUB). Electricity tariffs The electricity tariffs paid by the customers in Alberta are settled each hour at a single market spot price based on the balance of supply and demand. Transmission tariffs The transmission tariffs charged by the TSO, AESO, are approved by the Energy and Utilities Board (EUB) to achieve a fair allocation among stakeholders and to support the competitive electricity market. The transmission tariffs cover the costs of building, maintaining and operating the transmission system and are set by an application from the TSO to the EUB according to a two-step process: The Phase I application determines the revenue requirements for the TSO, and the approval from EUB is based on the expected incurred costs necessary to operate and manage the transmission system. The Phase II application determines the allocation of costs between different classes of customers for the provision of system access service by the TSO. The EUB decision on this phase determines the rates charged to the customers to recover the revenue requirements determined in Phase I. Distribution tariffs The EUB regulates the distribution system in order to ensure the customer a safe and reliable electricity supply at just and reasonable rates. The distribution rates consist of two components: The charges for the electricity commodity itself and the charges related to the delivery of electricity to the home of the customer. The charges for the electricity itself are determined through the Power Pool spot market, whereas the delivery charges are fully regulated. As it was the case of
REPORT Confidential Page No:74
transmission tariffs, the terms and conditions for the delivery services and charges are approved by the EUB in rate applications.
4.4 USA The electricity regulation of the USA is divided between federal regulation and state jurisdiction. Interstate transmission and whole sale of power are federal regulated, whereas retail rates and distribution services are state regulated. The regulation of tariffs varies greatly from state to state (the federal law says that rates should be “fair, just and reasonable”). USA Tariff regulation Electricity tariffs Cost-of-service regulated (state authority) Transmission Cost-of-service regulated (federal authority) Distribution Regulated by state authority
Table 4.3: Regulation of sectors in USA
4.4.1 Electricity tariffs The electricity tariffs are regulated within the state jurisdictions on basis of a cost-of-service principle. Within each state, a state commission determines each utility’s revenue requirements and the rate of tariffs for each class of consumers. The state commission publishes its approved conditions, terms and prices of utility services in are document called a “tariff”. The allowed tariffs/rates that the utility can charge are based on their associated costs (investment costs, operational costs etc.) and a “reasonable” rate of return. The state commission, in determining the tariff levels for each utility, first determines the utility’s costs for providing their services. These include investment I facilities and related capital costs and operating expenses. After determining the necessary costs, the state commission determines a reasonable rate of return to add to the costs, and thereby the total amount of the allowed tariff is settled. According to federal law the rate of return shall be sufficient to allow the utility to attract additional capital under the prudent management, given the level of risk that the utility business faces. In case of adjustments for specific utilities, this procedure usually consists in the state commission reviewing the utility rates and other service elements in “general rate cases”. On the basis of this the state commission determines a new rate base, a new rate of return and new rates for all customer classes. General rate cases occur when a utility files for increased rates or, more rarely, when a customer forms a formal complaint that the utility’s rates are not in compliance with the requirements of law.
4.4.2 Transmission tariffs Most transmission facilities in the US are owned by individual utilities. The interstate transmission lines (which account for most transmission lines) are regulated on a federal level by the Federal Energy Regulatory Commission (FERC). Few transmission entities operate within a single state and are thus regulated by the state commission. However, entities not subject to regulation by FERC generally consider FERC policy and adhere to similar standards. FERC regulates the pricing of wholesale interstate transmission transactions, both what is charged to utilities and what is charged to individual industrial consumers who buy power directly at transmission voltages. The FERC approved
REPORT Confidential Page No:75
rates are based on the same principle as the state commission’s electricity tariffs and form a type of cost-of-service price cap for the transmission companies. The regulation of the transmission tariffs takes several forms, including “postage stamp pricing” (one rate regardless of distance), “license plate rating” (a price within specified zones) and “point-to-point-distance-sensitive pricing”. Transmission rates are also often “pancaked”, which means that as electricity moves across multiple lines, from one transmission owner to another, each owner gets paid for the use of its facilities. To avoid that these layers add up to substantially more than they would if a single owner controlled all facilities, regional power pools are created to develop joint prices for transmission services.
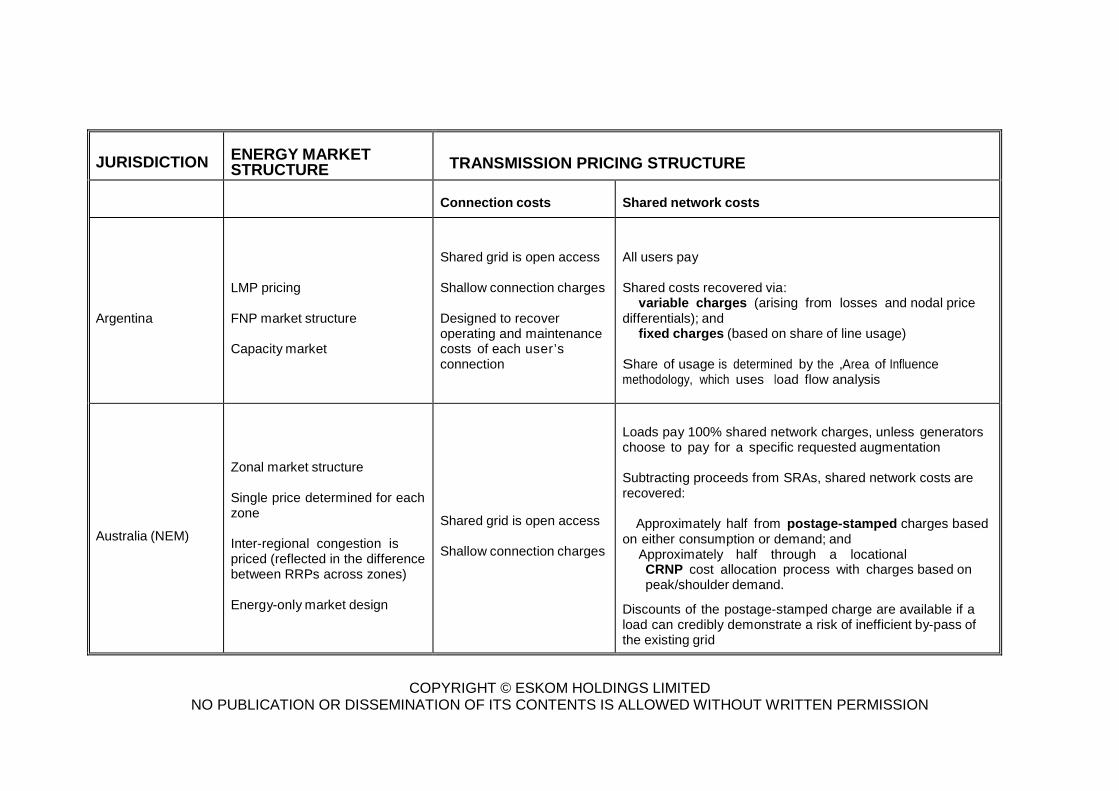
COPYRIGHT © ESKOM HOLDINGS LIMITED NO PUBLICATION OR DISSEMINATION OF ITS CONTENTS IS ALLOWED WITHOUT WRITTEN PERMISSION
JURISDICTION
ENERGY MARKET STRUCTURE
TRANSMISSION PRICING STRUCTURE
Connection costs
Shared network costs
Argentina
LMP pricing FNP market structure Capacity market
Shared grid is open access Shallow connection charges Designed to recover operating and maintenance costs of each user’s connection
All users pay Shared costs recovered via: � variable charges (arising from losses and nodal price differentials); and � fixed charges (based on share of line usage) Share of usage is determined by the „Area of Influence� methodology, which uses load flow analysis
Australia (NEM)
Zonal market structure Single price determined for each zone Inter-regional congestion is priced (reflected in the difference between RRPs across zones) Energy-only market design
Shared grid is open access Shallow connection charges
Loads pay 100% shared network charges, unless generators choose to pay for a specific requested augmentation Subtracting proceeds from SRAs, shared network costs are recovered: � Approximately half from postage-stamped charges based on either consumption or demand; and � Approximately half through a locational
CRNP cost allocation process with charges based on peak/shoulder demand.
Discounts of the postage-stamped charge are available if a load can credibly demonstrate a risk of inefficient by-pass of the existing grid
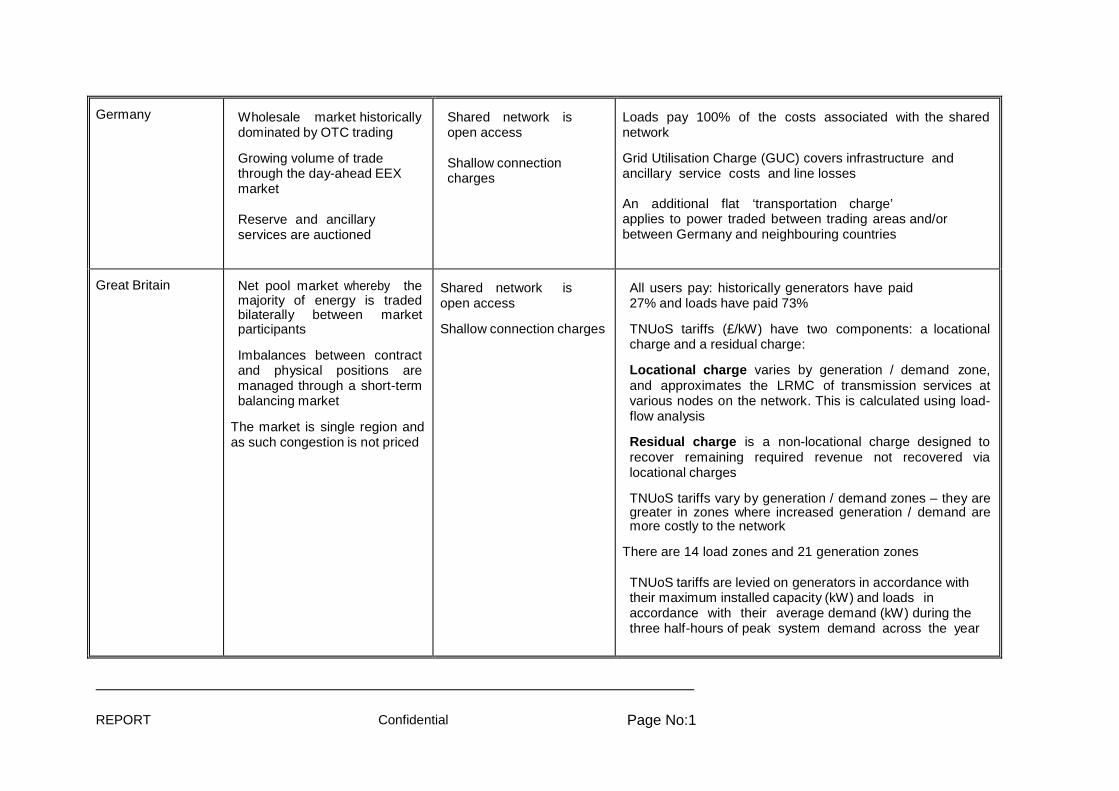
REPORT Confidential Page No:1
Germany Wholesale market historically dominated by OTC trading
Growing volume of trade through the day-ahead EEX market Reserve and ancillary services are auctioned
Shared network is open access Shallow connection charges
Loads pay 100% of the costs associated with the shared network Grid Utilisation Charge (GUC) covers infrastructure and ancillary service costs and line losses An additional flat ‘transportation charge’ applies to power traded between trading areas and/or between Germany and neighbouring countries
Great Britain
Net pool market whereby the majority of energy is traded bilaterally between market participants
Imbalances between contract and physical positions are managed through a short-term balancing market
The market is single region and as such congestion is not priced
Shared network is open access Shallow connection charges
All users pay: historically generators have paid 27% and loads have paid 73%
TNUoS tariffs (£/kW) have two components: a locational charge and a residual charge:
Locational charge varies by generation / demand zone, and approximates the LRMC of transmission services at various nodes on the network. This is calculated using load-flow analysis
Residual charge is a non-locational charge designed to recover remaining required revenue not recovered via locational charges
TNUoS tariffs vary by generation / demand zones – they are greater in zones where increased generation / demand are more costly to the network
There are 14 load zones and 21 generation zones TNUoS tariffs are levied on generators in accordance with their maximum installed capacity (kW) and loads in accordance with their average demand (kW) during the three half-hours of peak system demand across the year
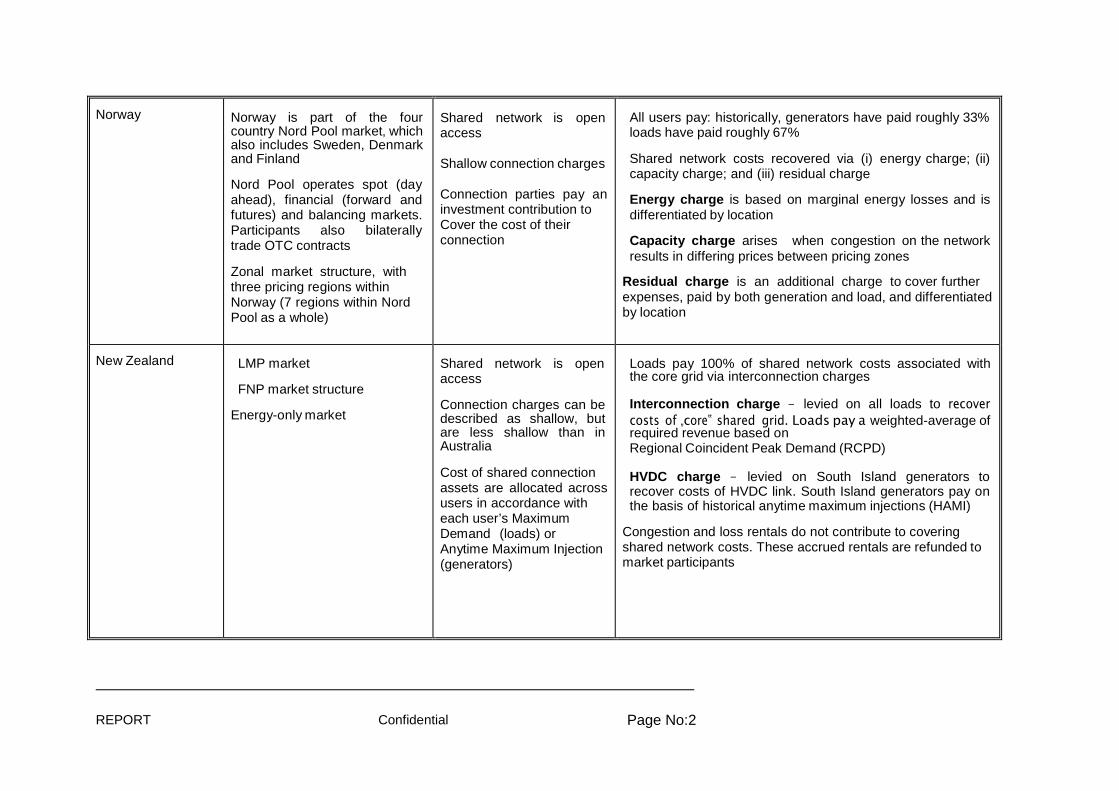
REPORT Confidential Page No:2
Norway Norway is part of the four country Nord Pool market, which also includes Sweden, Denmark and Finland Nord Pool operates spot (day ahead), financial (forward and futures) and balancing markets. Participants also bilaterally trade OTC contracts Zonal market structure, with three pricing regions within Norway (7 regions within Nord Pool as a whole)
Shared network is open access Shallow connection charges Connection parties pay an investment contribution to Cover the cost of their connection
All users pay: historically, generators have paid roughly 33% loads have paid roughly 67%
Shared network costs recovered via (i) energy charge; (ii) capacity charge; and (iii) residual charge
Energy charge is based on marginal energy losses and is differentiated by location
Capacity charge arises when congestion on the network results in differing prices between pricing zones
Residual charge is an additional charge to cover further expenses, paid by both generation and load, and differentiated by location
New Zealand LMP market
FNP market structure
Energy-only market
Shared network is open access Connection charges can be described as shallow, but are less shallow than in Australia Cost of shared connection assets are allocated across users in accordance with each user’s Maximum Demand (loads) or Anytime Maximum Injection (generators)
Loads pay 100% of shared network costs associated with the core grid via interconnection charges
Interconnection charge – levied on all loads to recover costs of „core‟ shared grid. Loads pay a weighted-average of required revenue based on Regional Coincident Peak Demand (RCPD)
HVDC charge – levied on South Island generators to recover costs of HVDC link. South Island generators pay on the basis of historical anytime maximum injections (HAMI)
Congestion and loss rentals do not contribute to covering shared network costs. These accrued rentals are refunded to market participants
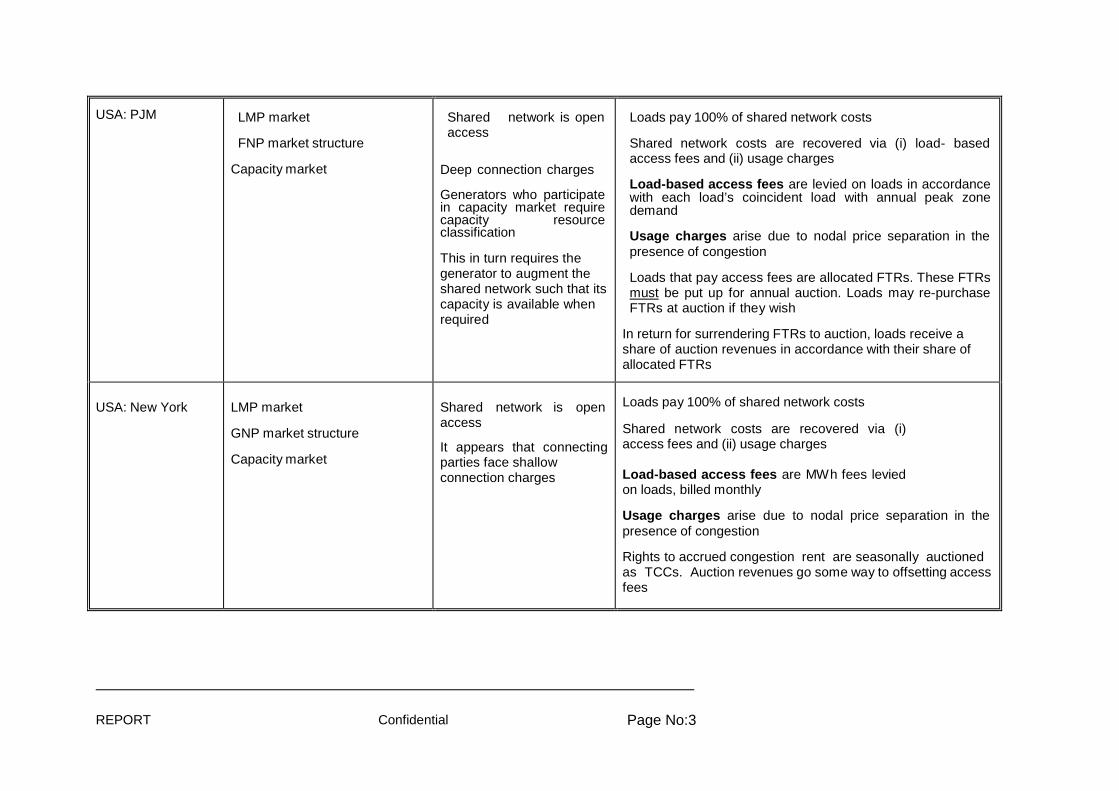
REPORT Confidential Page No:3
USA: PJM LMP market
FNP market structure
Capacity market
Shared network is open access
Deep connection charges
Generators who participate in capacity market require capacity resource classification This in turn requires the generator to augment the shared network such that its capacity is available when required
Loads pay 100% of shared network costs
Shared network costs are recovered via (i) load- based access fees and (ii) usage charges
Load-based access fees are levied on loads in accordance with each load’s coincident load with annual peak zone demand
Usage charges arise due to nodal price separation in the presence of congestion
Loads that pay access fees are allocated FTRs. These FTRs must be put up for annual auction. Loads may re-purchase FTRs at auction if they wish
In return for surrendering FTRs to auction, loads receive a share of auction revenues in accordance with their share of allocated FTRs
USA: New York
LMP market
GNP market structure
Capacity market
Shared network is open access
It appears that connecting parties face shallow connection charges
Loads pay 100% of shared network costs
Shared network costs are recovered via (i) access fees and (ii) usage charges Load-based access fees are MWh fees levied on loads, billed monthly Usage charges arise due to nodal price separation in the presence of congestion Rights to accrued congestion rent are seasonally auctioned as TCCs. Auction revenues go some way to offsetting access fees
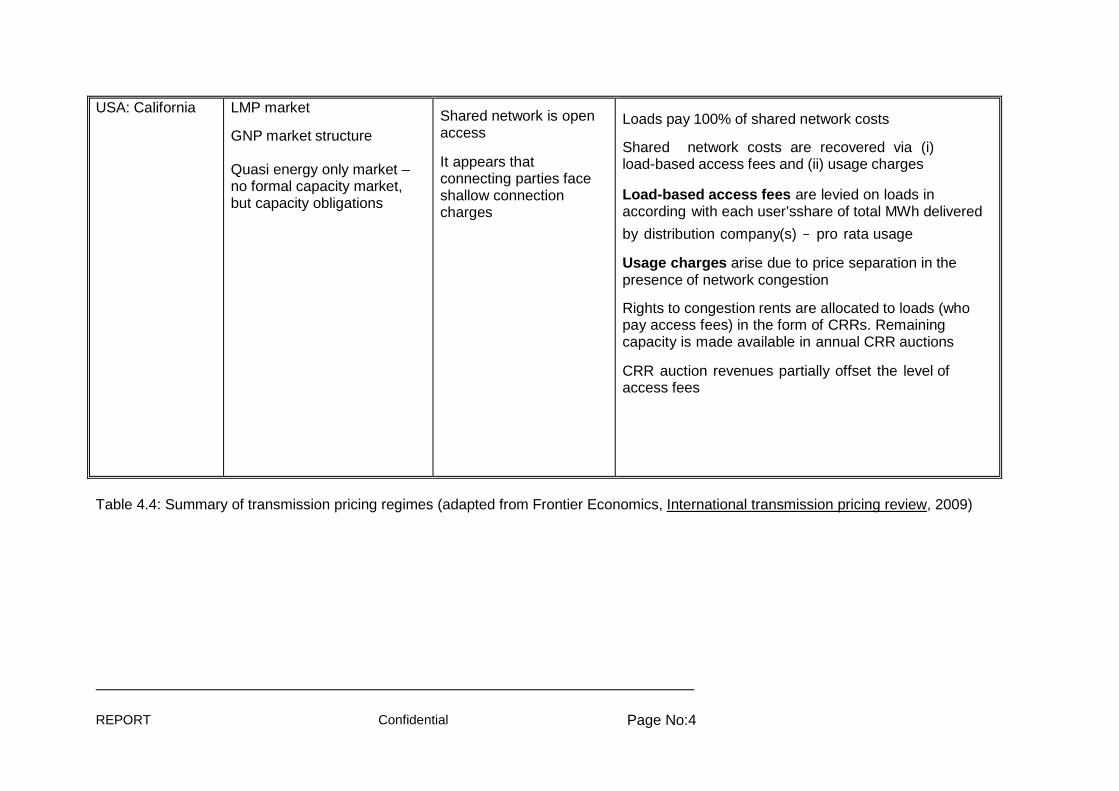
REPORT Confidential Page No:4
USA: California LMP market
GNP market structure Quasi energy only market – no formal capacity market, but capacity obligations
Shared network is open access
It appears that connecting parties face shallow connection charges
Loads pay 100% of shared network costs
Shared network costs are recovered via (i) load-based access fees and (ii) usage charges Load-based access fees are levied on loads in according with each user’sshare of total MWh delivered
by distribution company(s) – pro rata usage
Usage charges arise due to price separation in the presence of network congestion
Rights to congestion rents are allocated to loads (who pay access fees) in the form of CRRs. Remaining capacity is made available in annual CRR auctions
CRR auction revenues partially offset the level of access fees
Table 4.4: Summary of transmission pricing regimes (adapted from Frontier Economics, International transmission pricing review, 2009)
COPYRIGHT © ESKOM HOLDINGS LIMITED NO PUBLICATION OR DISSEMINATION OF ITS CONTENTS IS ALLOWED WITHOUT
WRITTEN PERMISSION
5 CONCLUSIONS AND DISCUSSION
The Eskom tariff benchmarking study has provided a number of interesting findings and results. Of key results, discussions, cautions and lessons learned can the following be highlighted: Overall results For Part A the following general conclusions can be made:
• The benchmarking study of average tariffs is based on comparison of key national energy utilities total revenue and sales (Gwh). The ranking in column three is based on a simple exchange rate conversion of the resulting tariff per kWh in each utility. The benchmarking shows that South Africa (Eskom) is ranked fourth cheapest average tariff of the 15 countries utilities included in the survey. The last four countries (South Africa, India, Australia and China), however, only have marginally different average tariffs (+/- 2 SA cent). Then there is 10-20 SA-cent up to the next group of countries (Argentina, Canada, US, Denmark, South Korea, Thailand, Kenya). The highest average tariffs can be found in Malaysia, Spain and UK
• South Africa (Eskom) is the third largest utility included in the benchmarking based on sales only smaller than the German and South Korean utilities. The smallest utilities included are the utilities from Kenya Argentina and Australia. The ranking show poor relation between sales and revenue. South Africa’s sales / revenue factor is around 3, while most of the remaining have a factor 2 or even lower
• South Africa (Eskom) is ranked as having the second largest inflation corrected tariff increase of the benchmarked countries during the last 8 years. UK had the biggest average tariff increase, while South Korea, Denmark and Canada had the lowest average increase. None of the countries included had a negative tariff to inflation increase rate over the last 8 years
• South Africa (Eskom) is has the third lowest RoA of the utilities included in the benchmarking. Denmark’s DONG has by far the highest RoA, followed by utilities in India, Spain, Thailand, Germany, UK and Kenya. Only the Chinese and Argentina utilities have lower RoA than Eskom. No correlation between RoA and credit ratings can be seen
REPORT Confidential Page No:1
• The PPP results show that there is no correlation of the total average tariffs (based on exchange rate calculations) to the corresponding international PPP benchmarking of the national utilities including in the study. The PPP results also show markedly large changes in rankings for some countries, e.g. South Africa. Based on these findings it is found that the interpretation of the PPP results has to be undertaken with care, and it is suggested that further investigations into the use and practicability of the PPP comparison technique for power utilities.
As almost always with international benchmarking studies, they raise more questions than they answer (which normally is good, as international benchmarking stimulate innovations, questions business as usual, contribute to competition and improvements). Some of the interesting hypothesis and trends that is raised by the general results for Part A, include amongst others:
• It seems like South Africa has a low average tariff (simple exchange rate) compared to other countries, while the opposite is the case for the PPP comparison. The consequences and implications of this for e.g. tariff setting need to be better understood
• It seems like South Africa in relation to PPP ranking is in a middle situation with a number of lower GDP income countries above, and higher GDP income countries below. The implications of this grouping also needs to be better understood
• It seems like there is an uncorrelated relation with utilities key parameters (e.g. sales, revenue, etc.) and RoA. Likewise it seems like there is no correlation between RoA and credit ratings. What are the underlying reasons for these non-correlations?
For Part B the following general conclusions can be made:
• Eskom’s tariffs generally compare favourably with many other countries when considered as a price only comparison. The tariffs were not compared on an affordability basis.
• Eskom should consider reducing the amount of kWh in the lowest tariff block or only providing the lowest tariff to households with single phase connections or prepaid meters etc.
• Eskom has the third lowest tariff for consumers using 200 kWh/month. Malaysia has the lowest tariff at this level. Tariffs in Vancouver are also lower than in South Africa. This is not a lifeline tariff as the Malaysian tariff is
• The marginal cost of electricity for South African consumers in the highest tariff block is on a par with tariffs in Australia and the lower European tariffs. The European tariffs generally include high energy taxes
• The average cost per unit for consumption of 1000 kWh/month under the Eskom block tariff is generally higher than tariffs in North America, but
REPORT Confidential Page No:2
lower than in Europe, Australia, Malaysia and Brazil. Most countries have a flat rate tariff for consumers at this level so they do not benefit from the low-income block tariff as consumers do in South Africa
• Malaysia and Brazil have block tariffs that are aimed at assisting low-income households. In Malaysia this is done with a number of small blocks, whilst in Brazil qualification for lifeline tariffs is based on the size of the connection
• Industrial tariffs in South Africa are generally more expensive than tariffs in North America. The South African tariffs are, however, listed prices. Very large industrial consumers in South Africa may well have negotiated their own contracts at a lower rate than those listed
• Cross subsidisation of rural consumers through industrial tariffs should be defined as a levy on transmission in order that wheeling agreements or the introduction of other pricing mechanisms do not circumvent or undermine the rural electrification programme.
For Part C the following general conclusions can be made:
• There is no transparency in the tariff breakdown for residential consumers in South Africa
• Tariff methodologies are generally only transparent in countries with an energy market and regulated grid companies. The cost of electricity is not regulated and determined by market economics whilst transmission and distribution is regulated using revenues caps or cost plus methodologies. In parts of the US and some Canadian provinces generation is also regulated through cost plus methodologies
• Important parts of the electricity system have been liberalised in many countries and competition has been introduced. To create the framework for the competitive part of the sector more rules and laws are needed for monopolies. A substantial part of the electricity sector in most countries is still regulated as monopolies. The regulation of monopolies is therefore still very important, also after the introduction of competition. This is so, not only because of the part of the consumer’s prices that are payment to the monopolies, but also because the linkages between the competitive sector and the monopolies are very strong.
Cautions and clarifications As always with international benchmarking studies, numerous cautions and clarifications are needed in order not to make mis- or over-interpretations of the results. In this benchmarking studies attention should be made towards:
• The use of selected national power utilities as base for the international benchmarking. This has provided new results, but also showed the difficulties and need for further detailing of such studies: The different
REPORT Confidential Page No:3
structuring of Annual Reports, the difficulties in separating Generation, Transmission, Distribution and Retail in the figures provided in the Annual Reports, lack of clarity in most Annual Report on what revenue contains, e.g. exploration, market sales, transmission sales delinked from own generation, etc (the lack of correlation between sales and revenues in table 3.3 is an indicator hereof)
• The use of simple exchange rate and PPP rates in the benchmarking contributes to increased nuances in interpretations, but also decreased clarity
• The study attempted to de-bungled the utilities in Generation, Transmission, Distribution and Retail (see table 3.7). This proved to be an almost impossible task based on the information available for the desk study. This contributes in some instances to difficulties in interpretation of the benchmarking results, e.g. the companies from Australia and Canada are pure generation companies, others are full GTDR companies, others again is even much more than that, e.g. oil exploration etc. as in the case of Germany and Denmark
• Data availability and specificity therefore has to be underlined as a serious limiting factor in providing ‘bullet-proof’ comparisons. One reason for this can be related to the ownership structure of the utilities. There is no doubt that the government-owned companies, like e.g. South Africa, Malaysia and Thailand, provide clearer and more transparent data than private-owned companies that compete on a competitive energy market, e.g. UK, Germany and Spain
• South Africa and Eskom, of all countries and utilities including in the study, provide some of the most transparent and easy to analyse data for public scrutiny.
Lessons learned and recommendations Results, hypothesis and cautions, as outlined above, leads to a number of key lessons learned and recommendations for the present international benchmarking study of average tariffs. These include:
• The market share of the utilities included for each country should be increased to at least 50-60% of the national energy market to improve reliability in comparisons
• The utilities either needs to be unbundled in Generation, Transmission, Distribution and Retail or other methodologies needs to be developed to further improve the apple-to-apple comparison
• Detailed studies of the hypothesis’ outlined in 6.2, e.g. the use of PPP, should be initiated to gain further lessons of the international benchmarking study.
REPORT Confidential Page No:4
6 ANNEXES
6.1 LIST OF DOCUMENTS REVIEWED
Below are provided a long-list of documents reviewed for the preparation of the study. Addepalli, R., Incentive based regulation, 2011 AEP (American Electric Power), US, Annual report 2010 AEP, (American Electric Power), US, Corporate Accountability Report, 2011 AEP, (American Electric Power), US, Fact Book, 2011 AGL, Australia, Annual report 2010 Ajodhia, V., et.al., Benchmarking and its application, 2003 Ajodhia, V., et.al., Quality, regulation and benchmarking, and application to electricity distribution networks, 2004 ANEEL, Inside the electricity bill: Public utility information, 2008 ANEEL, Tarifas Residenciais, 2011 Arizu, P. et.al., Pass through of power purchase costs – Regulatory challenges and international practices, 2004 Australian Government, Australia Energy Resource Outlook, 2010 Australian Government, Electricity Generation, major development projects, 2010 Australian Government, Energy in Australia, 2011 CSEM, Lessons from international experience with electricity market monitoring, 2004 CEER, Regulatory benchmarking report, 2004 CRE, Mexico, Annual report 2010 Danish Energy Regulatory Authority, Results and Challenges 2010, 2011 Dansk Elforsyning, Statistik (in Danish), 2008 Department of Minerals and Energy, Electricity Pricing Policy (EPP) of the South African Electricity Supply Industry, 31 March 2008 Dong Energy, Denmark Annual report 2010 EA Energianalyse, Development of electricity prices (Udviklingen af elpriserne), in Danish, February 2011 E-Control & VAASA EET, Household Energy Price Index for Europe, 2012 EGAT, Thailand, Annual report 2010 Electrobas, Brazil, Administration Report, 2009 Elpristavlen, www.elpristavlen.dk, electricity pricing in Denmark, 2011 Endesa, Spain, Annual report 2010 Energinet.dk, Regulation A: Principles for the electricity market, 2007 Energitilsynet Danmark, www.energitilsynet.dk/el, the Danish Energy Regulator, 2011 EPRI, Electricity Sector Framework for the future, 2003 Eskom, Strategic pricing direction for standard tariffs, 2007
REPORT Confidential Page No:5
Eskom, Connection Charges Methodology, 13 November, 2007 Eskom, Distribution Tariff Code, version 5.1, September, 2007 Eskom, Distribution Code Definitions, version 5, September 2007 Eskom, Distribution System Operation Code, rev 5, September 2007 Eskom, Distribution Metring Code, version 5.1 September 2007 Eskom, Distribution Network Code, version 8, July, 2010 Eskom, Eskoms tariff design methodology, 2008/09 Eskom, Distribution Information Exchange Code, version 8, July 2010 Eskom, The South Grid Code; Governance Code, rev 8.0, July 2010 Eskom, The South Grid Code; Preamble, rev 8.0, July 2010 Eskom, The South Grid Code; the System Operation Code, rev 8.0, July 2010 Eskom, The South Grid Code; The Metering Code, rev 8.0, July 2010 Eskom, The South African Grid Code – The Transmission Tariff Code, Version 8.0, July 2010 Eskom, Electricity Pricing Definitions (Standard), 2010 Eskom, Tariffs & Charges 2010/11, 2011 Eskom, Generation Pricing policy and charge methodology, version 1.1, June 2011 Eurelectric, Review of European Electricy Prices, KEMA, 2005 Eurostat, www.eurostat.eu, 2011 Eurostat, Energy Prices 2011 s1, 2011 Exchange rates, www.xe.com, 2011 Gonzalez, A.E., et. al, Strategies of diversification in regulated energy markets: The natural gas and elelctric power industries in Mexico, 2010 Government Gazette, Electricity Regulation Act, South Africa, 2006 Hydro Quebec, Comparison of electricity prices in major North American cities, 2011 IEA, Monthly Energy Statistics, 2010-2011 Jamasb, T. et al., Benchmarking and regulation of electricity transmission and distribution utilities; lessons from international experience, 2000 KEPCO, Korea, Annual report 2010 KENGEN, Kenya, Annual report 2010 MBendi, Electrical Power in South Africa, 2011 Macquaire, Annual report 2010 Nordreg, Nordic Market Report, 2011 NERSA, Allowed average electricity costs 2010/11 break-down, slide provided by Eskom NUS, 2010-2011 International Electricity & Natural Gas Report and Price Survey, June 2011 OECD, www.OECD.org/OECDstat_metadata, 2011 OECD, www.stats.oecd.org - PPP benchmark results, 2011 Office of the Tasmanian Economic Regulator, Comparison of 2011 Australian electricity distribution network charges, 2011 O’Niell et.al., Regulatory evolution, market design and unit commitment, 2000 Pampa Energia, Brazil, Annual report, 2010 PPP (Power Purcharge Parity, OECD calculation table, www.oecdstats.com, 2011 PWC, Financial reporting in the power and utilities industry, 2011 Sotkiewicz, P.M., Consideration for the design of restructuring electricity markets and institutions, 2010 SST, UK, Annual report 2010 Standards&Poors, US regulated electric utilities, strongest to weakest, ranking, 2009
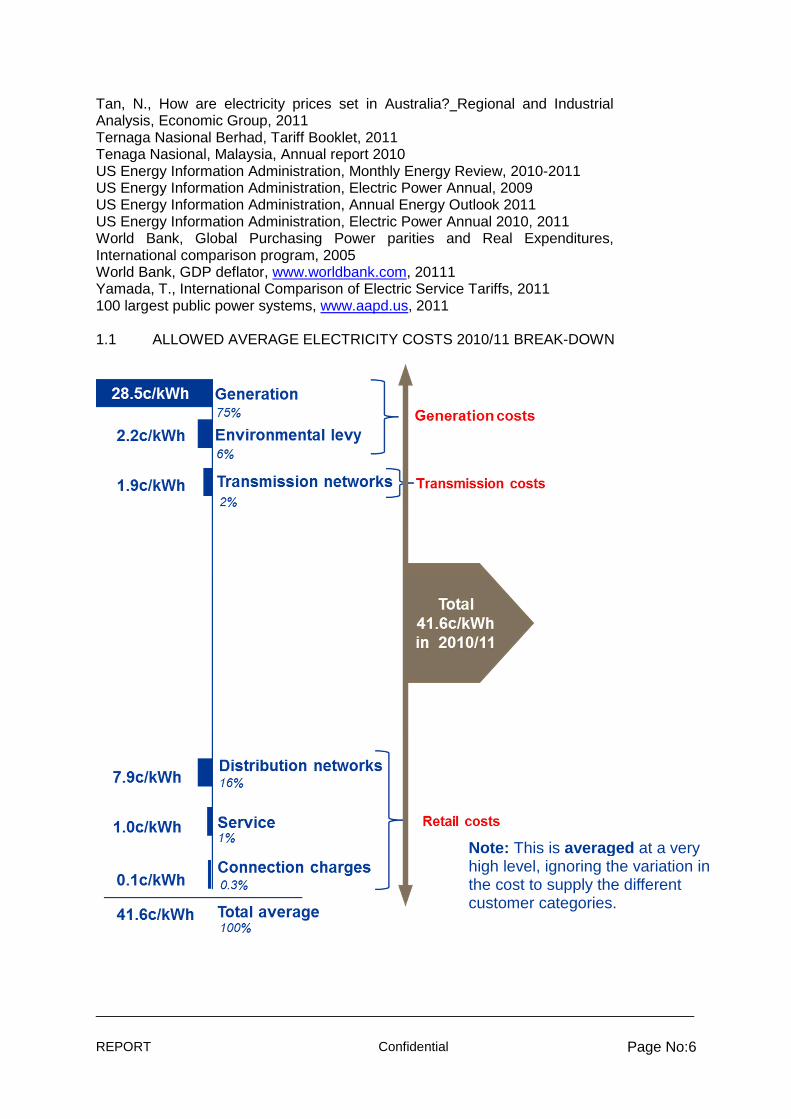
REPORT Confidential Page No:6
Tan, N., How are electricity prices set in Australia? Regional and Industrial Analysis, Economic Group, 2011 Ternaga Nasional Berhad, Tariff Booklet, 2011 Tenaga Nasional, Malaysia, Annual report 2010 US Energy Information Administration, Monthly Energy Review, 2010-2011 US Energy Information Administration, Electric Power Annual, 2009 US Energy Information Administration, Annual Energy Outlook 2011 US Energy Information Administration, Electric Power Annual 2010, 2011 World Bank, Global Purchasing Power parities and Real Expenditures, International comparison program, 2005 World Bank, GDP deflator, www.worldbank.com, 20111 Yamada, T., International Comparison of Electric Service Tariffs, 2011 100 largest public power systems, www.aapd.us, 2011 1.1 ALLOWED AVERAGE ELECTRICITY COSTS 2010/11 BREAK-DOWN
Note: This is averaged at a very high level, ignoring the variation in the cost to supply the different customer categories.