Embed Size (px)
Citation preview

34 www.tdworld.com
SCADAChange
Eskom IntegratesArea SCADA Systems
IN SEPTEMBER 2004, ESKOM’S DISTRIBUTION DIVISION COMMENCED A PROGRAM TO REPLACE FIVE OF ITS REGIONAL SCADA SYSTEMS. The objec-tive of the program was to procure and commission fi ve com-mercially off-the-shelf (COTS) supervisory control and data acquisition (SCADA) systems, which included SCADA en-terprise architecture integration and business-process align-ment. It was extremely important that existing Eskom Distri-bution Division processes be supported.
A South African state-owned electric utility, Eskom (Johan-nesburg, South Africa) is a vertically integrated generation, transmission and distribution organization. Eskom generates and transmits 95% of the electricity used in South Africa. The Eskom Distribution Division is one of 187 electric utilities within the country responsible for distribution. This division is comprised of six organizations, or regions, each accountable for a specifi c geographic area. Through their wires and retail business units, the regions collectively provide pow-er to 3.5 million customers.
CHANGE DRIVERSThe rationale for replacing the
SCADA systems was a strategically driven initiative with three strong economic and business-enhance-ment drivers. Firstly, in the original SCADA systems, plant and asset data are captured and maintained in the respective regional geographic in-formation systems (GIS), and are separately captured and maintained in the regional SCADA systems. SCADA-GIS integration would eliminate the second data capture and maintenance overhead.
Secondly, network operating schematics are prepared and main-
tained in the GIS and its supplementary Engineering Net-work Schematic (ENS) application, and are separately drawn and maintained in the regional SCADA systems. As with the fi rst item, SCADA-ENS (SENS) integration would eliminate the need for the second diagram capture and maintenance overhead.
Thirdly, the replacement of the existing SCADA fault-man-agement system and various other point-to-point interfaces with an enterprise-wide middleware alternative would reduce the long-term maintenance cost and complexity associated with the existing point-to-point integration requirements.
Importantly, a single source for plant and asset data and network schematics would improve network operational safe-ty and lead to enhanced data quality. These are signifi cant downstream benefi ts obtained through SCADA integration.
The conceptual design shows three paths to system integration.
�����������������������
�����
���
�������������� �
�����������������������
�����������������������
�����������
�
� �
�
�
���
��������
���������������
�
��������
���������������
�
����
��������
������������������
���������������
���
���
���
���
���
���
��
���
���
���
��
���
�
������������������
��������������
�������������������
��
���
���
����
��
���
���
���
���
�
���
��
��
����
���
��
���
����
���
���
��
����������������
���������������������������������
������������������������������������������������������������
���������������������������������������������
���
����
�����
���
�������������������������
���
������������������������
�������������������������
���������������
�����������
The common information model used by Eskom Distribution includes fault events, historical data and equipment condition.
By John Hope-Sotherton, Shannon Naidoo and Johann Marx, Eskom South Africa, and Phillip Jones, Xtensible Solutions Inc.
900_Siemens.indd 1 7/11/07 3:27:28 PM

SCADAChange
SYSTEM ARCHITECTURAL PRINCIPALSEnterprise architecture (information systems) in Eskom
Distribution strives to implement process-driven integration to enable business-process management. Establishing a se-mantic layer through the use of the Eskom Canonical Model was key to this implementation. Specifi cally, the Distribution Division decided to leverage the IEC TC57 WG14 common in-formation model (CIM).
The CIM approach led to an integration solution with loosely coupled applications, thereby insulating application specifi cs from integration orchestration and transformation. Such an approach also minimizes the development of inter-
dependencies arising between the application and system integration teams, between applications and the integration solution, and between the integration solution and external projects and/or initiatives. The fi gure on page 34 shows the conceptual design, including the three integration paths of the solution.
MODEL-DRIVEN INTEGRATIONThe Distribution Division’s integration design was based
on a model-driven architecture and integration methodology. This was done to provide the following tactical and strategic advantages to the project as well as to the business as a whole:
The Klipspruit (Rocky River) 88/22-kV substation is situated in rural Kwazulu Natal. The substation supplies power to the surrounding villages and farms and is typical of the type of substation modeled on the Eskom DMS.The Klipspruit (Rocky River) 88/22-kV substation is situated in rural Kwazulu Natal. The substation supplies power to the surrounding villages
900_Siemens.indd 1 7/11/07 3:27:28 PM
36 www.tdworld.com
SCADAChange
● To ensure consistency and scalability of the integration bus approach
● To reduce the overall cost of integration● To introduce fl exibility and agility in the architecture
and processes● To ensure the business process theory and the imple-
mentation thereof are consistent (bridging the gap between the design-time and run-time environments).
To this end, we used a model-driven integration frame-work and tools to model the business, business processes and information exchange.
For instance, integration path No. 1 (see fi gure on page 34), whose design components included GE Energy’s Small-world, ENS and SENS data engineering (DE400), manages the information exchange pertaining to network asset data changes in the Smallworld application. The ENS-DE400 in-tegration path ensures that new or modifi ed network op-erating diagrams and SCADA operating diagrams (SODs) are transferred to the DE400 through the SENS interface. The information exchange primarily adopts a publish and subscribe messaging protocol, with acknowledgement of successful message delivery.
MESSAGE ARCHITECTUREThe geographic spread of the Eskom Distribution organi-
zation is such that applications exchanging information are regionally based. That is, systems are deployed regionally, running on hardware that is deployed regionally. The imple-mentation of each regional solution required a distributed approach, which included SeeBeyond components being ex-ecuted with distributed applications and application instanc-es. Therefore, routing formed an important part of message design and construction. The publishing of messages to the respective regional application instances resulted in the need
to create business routers (internal adapters) within the vari-ous SeeBeyond schemas.
SCADA DATA INTERFACE Smallworld is the source of power-system resources and as-
sociated topology (connectivity) information. The ENS and the SENS applications will be used to generate and maintain all engineering schematic diagrams. Consequently, ENS will be the source for all SCADA diagrams and, in addition, will manage the diagram approval process.
The SCADA interface is characterized by two data types, the fi rst of which is essentially “static” data. These long-cycle,
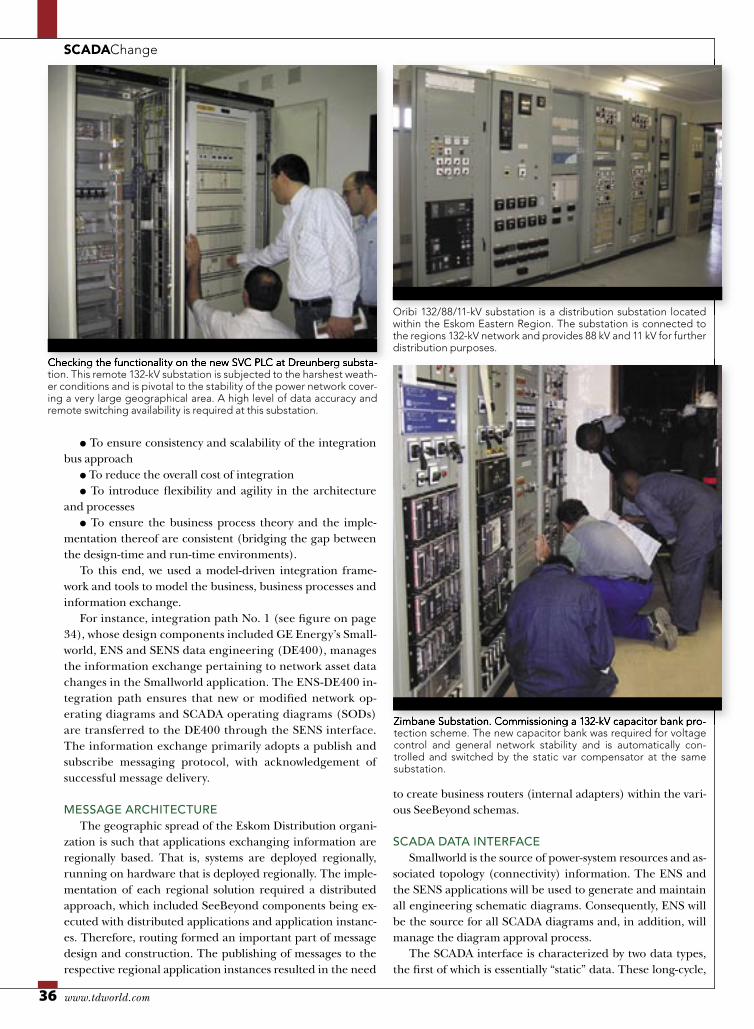
Zimbane Substation. Commissioning a 132-kV capacitor bank pro-tection scheme. The new capacitor bank was required for voltage control and general network stability and is automatically con-trolled and switched by the static var compensator at the same substation.
Zimbane Substation. Commissioning a 132-kV capacitor bank pro-
Checking the functionality on the new SVC PLC at Dreunberg substa-tion. This remote 132-kV substation is subjected to the harshest weath-er conditions and is pivotal to the stability of the power network cover-ing a very large geographical area. A high level of data accuracy and remote switching availability is required at this substation.
Checking the functionality on the new SVC PLC at Dreunberg substa-
Oribi 132/88/11-kV substation is a distribution substation located within the Eskom Eastern Region. The substation is connected to the regions 132-kV network and provides 88 kV and 11 kV for further distribution purposes.

37November 2007
SCADAChange
Information and diagram data changes from different sources are tagged as different “change sets.” Network model data and diagram data related to the same change event will be tagged as different change sets and rely on the relational references to update data accordingly. The challenge is not in the addition of new power-system resources, but in the chang-es and deletions that occur to ensure the process supports the above referential integrity.
At the Amatikulu 22/6.6-kV substation, the switchgear is housed in fi berglass cubicle. This is typical of substations supplying 6.6 kV to a single industrial customer.At the Amatikulu 22/6.6-kV substation, the switchgear is housed in fi berglass cubicle. This is typical of substations supplying 6.6 kV to a single At the Amatikulu 22/6.6-kV substation, the switchgear is housed in fi berglass cubicle. This is typical of substations supplying 6.6 kV to a single
low-frequency data transactions typically include network-type data (attributes and diagrams), insertions, updates or deletions.
To preserve the referential integrity of the SCADA data-base and diagrams, any modifi cation (inserting, deleting or updating data) must be preceded by a relevant network model change. The logic to manage and enforce the required data integrity had to be incorporated in the design.

38 www.tdworld.com
SCADAChange
mation logic within a dynamic environment was an ongoing challenge. Implementing confi guration and version manage-ment proved crucial to manage this continuous change.
The requirement for a persistent (connectivity) topology (switch-node) model in the GIS was identifi ed and had to be implemented in the GIS data model. Therefore, the GIS also did not provide a graphic representation with suitable view of topology errors. So, we had to make a topology viewer avail-able, expressing the topology in a GXL format that was view-able through graphical viewers.
The solution also required the development of a Change Set Manager application for the management, synchroniza-
The second SCADA data type is more dynamic in nature (high-frequency transactions). These short-cycle data trans-actions typically include alarms, events and status changes.
The message payload for these events is relatively small and does not compromise performance. It also requires that a guaranteed delivery of messages exists. This is essentially only a push of information to subscribing applications. Aside from the guaranteed-delivery requirement, no other BPM require-ment or constraint exists.
A GREAT MANY CHALLENGESThe challenges the organization needed to overcome were
greater than just the technology (systems, applications and data). To be a success, the three legs of the Eskom Informa-tion Management platform needed to exist:
Leg 1. Technology systems. From a SCADA perspective, inte-gration required the subscription to and publishing of data to and from the enterprise middleware (SeeBeyond/Sun JavaCAPS). Signifi cant challenges were experienced with the SCADA subscribing component of the integration initiative. Apart from these technical and organizational challenges, the publishing aspect presented few other challenges and was implemented on schedule.
Leg 2. Business processes. A timely and accurate delivery of data and network schematics required process realignment, accompanied with a signifi cant stakeholder training interven-tion. An analysis and redesign of business events and triggers, timing and sequence issues, and information exchange mod-eling needed to be done. Issues around existing inconsistent deployment with consequential impact on data maintenance between regions posed a challenge. The business process also needed to ensure support of the 24/7 nature of the network operations environment, while the GIS organizational unit in-volved had a totally different (eight to fi ve) paradigm.
Leg 3. Organization structure. Signifi cant challenges pertain-ing to change management were encountered involving the embedded culture and a “not-invented-here” syndrome. The organizational structure had to be aligned with business-pro-cess changes. In some cases, questions about which organiza-tional unit has what responsibility had to be resolved.
GIS INTEGRATIONExtraneous changes to GIS data structures and interfaces
created a moving target that had huge impact on timelines. Managing and pegging the message defi nitions and transfor-
INTEGRATION CHALLENGE
The Smallworld (SW) schema represented 149 objects in a 35,000-line XML schema. The challenge was to map to and transform this schema to a CIM-based schema (NetworkDataSet). The SW schema was generated by code, but due to an unfi nalized data model, it was based on conceptual objects. Data-model changes were driven by external projects, and together with the need to continuously improve the quality of the generated schema, resulted in the creation of a new schema every other week. This created a constantly moving target. Delaying the SCADA project until the GIS system was fi nalized was also not an option.
Due to the sheer size of the SW schema, several tests and experiments were conducted before a specifi c tool or methodology was selected. The initial intent was to use XSLT as the medium to develop and store the transformation logic, thereby giving the adapter a much more adaptive and fl exible design. The SW team was not familiar with XSLT technology and the particular design pattern, and at fi rst preferred to stick with a Java code-based approach. The team agreed to do some real-world testing before making a fi nal decision.
The EAI design tool creates a Java “data model” from the respective schema, which creates a list of nodes, each with its own Object ID. The SW team experienced some corruption problems with the transformation code (when the number of elements mapped got too high), which required restarting the work each time. Changes to the SW schema also meant restarting the mapping effort each time. This became unsustainable.
Using XSLT provided more fl exibility to deal with constant changes. Non-EAI (nonproprietary) tools could be used for the mapping to overcome EAI designer problems. These included Altova Mapforce, which captures the mapping rules in XML format.
A further issue was the generation of large temporal Java classes, which caused the Java Virtual Machine to crash. No amount of setting changes could fi x this, so the team had to use the XSLT Template option to overcome this problem.
Adapter transformation logic was easy to update via XSLT. Confi guration management of artefacts is now easier to do as well (XSLT and XML schema). This also ties into the enterprise information management strategy.
The three legs of information management’s platform: interface between technology, business and organization.
����������������������
�����������������
�����������������
���������������������

39November 2007
SCADAChange
tion and dissemination of incremental network data and net-work schematic diagram changes.
GOING FORWARDWith the development phase now complete, implementa-
tion will be commencing soon. When this occurs, the inte-gration solution will be exposed to the rigors and constraints of the organization’s business processes. We anticipate meet-ing the ultimate challenge: The integra-tion solution will enhance the business processes and, as a consequence, service levels.
John Hope-Sotherton is currently project manager for the Eskom Distribution DMS project. He is member of the Eskom Enterprises Protection, Telecontrol and Measurements organization and is responsible for the provision of SCADA services to the Eskom line businesses. [email protected]
Shannon Naidoo is chief integration architect in the Eskom Distribution Information Management organization, where she is responsible for the development and execution of distribution information management strategy. [email protected]
Johann Marx is an integration architect in the Eskom Distribution Information Management organization, where he is responsible for all aspects of the distribution network asset creation business process. [email protected]
Phillip Jones specializes in the design, development and implementation of integration solutions for Xtensible Solutions Inc. He is contracted by Eskom as an integration consultant, and is accountable for the design and development of the distribution SCADA integration solution. [email protected]
Carrickmore substation 132-kV bay showing the current transformers and breaker. This substation is situated on a traction supply network and is subject to large voltage and current fl uctuations. Obtaining the balance between data accuracy reporting and telecommunication traf-fi c is very diffi cult. DMS process values will be used in these cases.
NonmetallicWill Not Rust or CorrodeHigh LoadCapacityNoGrounding or BondingMolded fromULListed
Glass Reinforced PolymerInsulators Not RequiredExcellent Dielectric Properties
NONMETALLIC
CABLE RACKSFor Power & Communications
Manholes and Vaults
NoWiWiWiiHigNoMoooo
InsExExExx
MaaaMaM nnnho
UNDERGROUNDDE VICE S , INC .
3304 COMMERCIAL AVENUE NORTHBROOK, ILLINOIS 60062Phone: (847) 205-9000 Fax: (847) 205-9004Websi t e : ht t p : \ \www.ud evices .com
I N C O R P O R A T E DUNDERGROUND DEVICES
Hydra substation showing a section of the new 765/400-kV yard. It forms part of the Cape network strengthening plan.