Embed Size (px)
Citation preview
ESG in Investment Grade Corporate Bonds
This whitepaper is aimed for external use and geared to demonstrate AllianzGI ESG Thought Leadership.
It aims to determine the evidence for materiality of ESG dimensions and ESG criteria with respect to financial performance and risk for listed, publicly traded corporate bonds. We focus our analysis on Investment Grade Bonds in European and Global markets.
Similar to the 2015 whitepapers on ‘ESG in Equities’ and ‘ESG in Real Estate’ we perform a meta-analysis which evaluates recent, selected, high-quality industry and academic research. The format of a meta-analysis builds on a diversified research view and aims to avoid research bias.
Allianz Global Investors GmbH
FOR INSTITUTIONAL AND PROFESSIONAL INVESTORS ONLY
Please note: the conclusions from the research studies analysed and summarised in this report do not necessarily reflect Allianz Global Investors’ investment opinion. The research does not imply investment advice or investment performance related forecasts.
We suggest readers interested in a concise overview on our findings to take a look at the Executive Summary. We recommend the latter sections (including the appendices) to readers who want to gain a deeper insight into ESG in Investment Grade Corporate Bonds. By clicking on the headline you are interested in, you will be redirected to the corresponding section.
Key contact
Dr. Steffen HörterGlobal Head of ESGAllianz Global Investors GmbHSeidlstraße 24-24aD-80335 Munich
Phone: +49 - (0)89 - 1220 – 7704Mobile +49 - (0)160 - 586 - 3302Email: [email protected]
2
ESG in Investment Grade Corporate Bonds
Content
3 Executive summary
6 How does ESG affect the credit rating of corporate bonds?
8 Standard & Poor’s approach to ESG10 Moody’s approach to ESG risks in credit ratings12 Fitch ratings
13 What ESG dimensions are most performance relevant for corporate bonds?
13 Governance matters, but so do environmental issues16 Further evidence that good corporate governance pays off for bonds17 Considerable differences between industries 17 Social strength matters as well
18 How does ESG affect the performance of corporate bonds in different market environments?
18 Issuer resilience: ESG corporate bonds outperform during market downturns19 Regional investment universe view
20 Which are promising ESG integration strategies for corporate bonds portfolios?
20 Capitalize on corporate ESG Momentum21 SRI filter seem to have a neutral performance impact
22 Glossary
24 APPENDIX 1: Details on ESG in Corporate Bond studies investigated - Overview: Studies examined
25 A. Attig et al., 201426 B. Barclays, 201529 C. Bauer & Hann, 201131 D. Cheng et al., 201432 E. Derwall & Koedijk, 200933 F. Deutsche Bank, 201234 G. Flammer, 201335 H. Henke, 201639 I. Leite & Céu Cortez, 201640 J. Menz, 201041 K. Newton Investment Management, 201642 L. Oikonomou et al., 201243 M. Oikonomou et al., 201444 N. Stellner et al., 201545 O. Switzer & Wang, 201346 P. UN PRI, 201247 Q. UN PRI, 2013
48 APPENDIX 2: Overview of academic literature review by the UN PRI
49 APPENDIX 3: Overview of studies examined: Credit Rating Agencies
3
ESG in Investment Grade Corporate Bonds
ESG in Investment Grade Corporate BondsCorporate bonds are a distinct part of the fixed income (FI) universe with specific yield and risk profiles. From an investment perspective, regional universe, credit quality, market liquidity, and duration are important parameters. There is a focus in the long-term preservation of capital and the consideration of all pertinent risk factors. Therefore, integrating ESG into a fixed income portfolio strategy requires a differentiated investment view that also takes into account the specific investment signals needed for this asset class.
Executive summary
ObjectiveThe main goal of this research is to determine the materiality of ESG dimensions and criteria with respect to their possible benefit to optimize the financial performance and credit risk for Investment Grade Corporate Bonds (IG FI). On the one hand, such value add could be to create additional returns and alpha through the capitalization of an ESG factor premium. On the other hand, ESG investment signals could be useful to decrease investment risks. As an asset class, IG FI is assumed to bear little credit risk for investors. We therefore look for research evidence that the integration of ESG criteria into the fixed income investment process can contribute to mitigate tail risks such as to avoid unexpected, severe multi-notch credit rating deteriorations or effective defaults of issuers in extreme cases.
Our research builds on 17 selected core studies including one meta study (comprising of 24 relevant studies) with focus on ESG, credit risk and corporate bonds. We believe that condensing the latest research evidence will provide us with a comparatively more objective insight into the financial materiality of ESG for corporate bond investment strategies.
As a guidance for this research we have formulated a set of investment hypotheses which we strive to answer throughout this analysis:
1. Material, corporate issuer related ESG factors should be integrated into the credit rating analysis because they may substantially contribute to the explanation of credit risk.
2. The integration of ESG research signals into bond portfolios may contribute to the mitigation of portfolio (tail) risks.
3. Markets price ESG risk into corporate bonds: corporate issuers which experience a positive ESG momentum will progressively show lower credit spreads and higher bond prices (all other pricing parameters being equal).
4. Material ESG factors may serve as an alpha source.
5. Due to the comparatively similar idiosyncratic risk of issuers in an IG FI portfolio, applying a risk-based or norms-/ value based exclusion filter leads to negligible impairments of the portfolio’s yield-risk profile.
ResultsIn summary, based on this study’s findings, an optimal IG FI investment strategy concept aims to avoid issuers with material ESG risks and persistently low ESG ratings. From a performance enhancing perspective, such ESG integration may want to capitalize on positive ESG momentum. This means an overweighing of bonds of issuers which are expected to experience a positive ESG strength momentum that has not been priced yet by markets (vice versa underweight or exclude negative ESG drifting corporates). Applying an exclusion filter on a corporate bond portfolio seems to lead to no significant performance impairment.1
1 It has to be noted that evidence for ESG portfolio strategies in corporate bonds to date seems modest, though the number of publications has increased substantially in the recent years.
4
ESG in Investment Grade Corporate Bonds
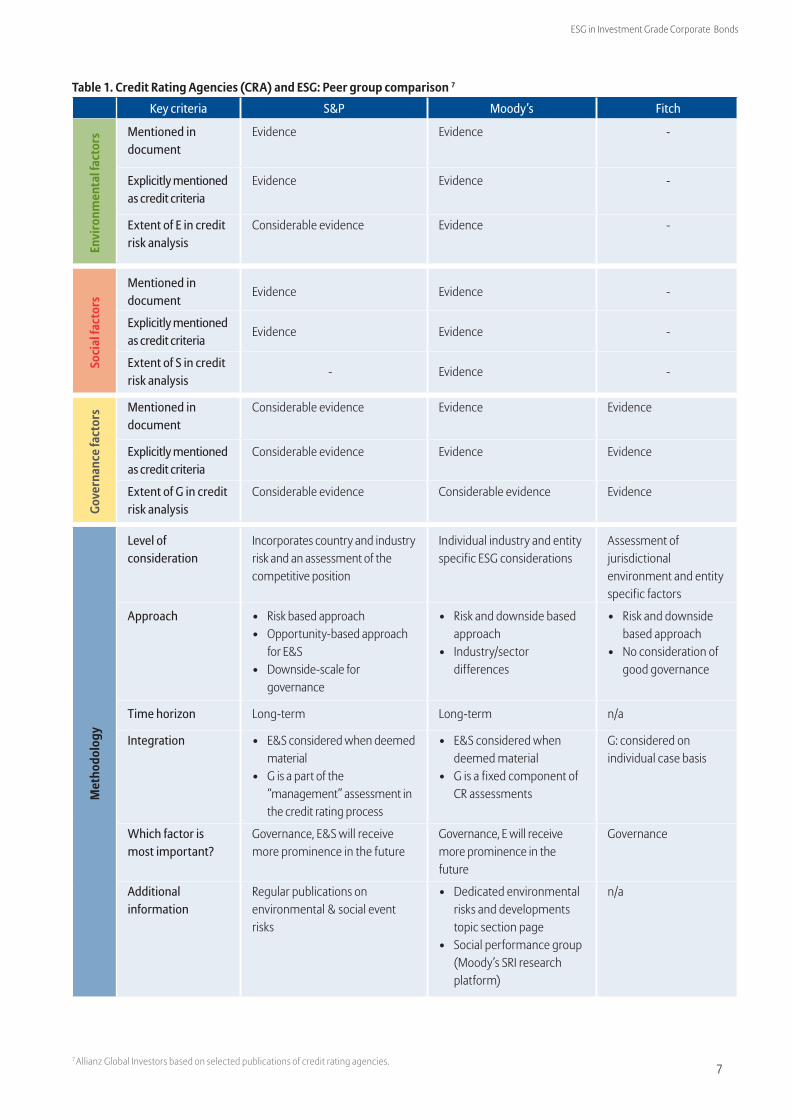
Guidance 1. ESG integration into credit risk analysisMost recently, Moody’s and S&P, two authorities in the area of credit risk analysis, have started to incorporate ESG factors into their credit rating methodologies. By signing the UN PRI Statement on “ESG in Credit Ratings”, these two and four other rating agencies affirmed their commitment towards a more systematic and transparent consideration of sustainability and governance factors in credit analyses and ratings.
ESG analysis is focused on issuer, industry sector and country specific key credit factors. Next to an explicit focus on selected high-risk ESG factors, ESG risk is indirectly scored through the analysis of the business environment and financial strength of a corporate. While ESG factors can be material to the credit rating, other criteria such as financial strength are generally perceived to be of more importance – not only because they may facilitate an issuer to adjust to ESG risks over-time through enterprise risk-management, but also because they already may be a good proxy on the corporate management of ESG risks.
Specific examples of ESG factors analyzed by Moody’s and S&P are the impact of global anti-bribery and corruption efforts for certain industries, carbon regulation policies on utilities and drought risks on public finance issuers in California and in India.2 S&P states that, over a period from November 2013 to November 2015, in roughly 8.8% out of approximately 3,400 credit cases analyzed, climate and environmental factors were relevant for rating revisions and a significant determinant in their analysis.3
Guidance 2. Mitigation of tail risk through ESG integration into IG FI portfoliosThe majority of the studies we covered in our analysis identify that better ESG ratings correlate with lower credit risk of corporate bonds. IG FI portfolios with higher ESG rated corporate issuers often show comparatively lower volatility. There is also research evidence which shows that ESG risk optimized corporate fixed income strategies may perform better during times of financial distress i.e. show better resilience during financial crises and times of high volatility. Investors may utilize this wealth-protecting behavior and
add resilience to their portfolios through ESG risk integration. One large scale academic study shows that SRI portfolios excluding issuers with low ESG ratings can have an excess return of up to 65-92 basis points (bps) on an annualized basis during bear markets and financial crises.4
Guidance 3. Markets reward better ESG performing bond issuersThe research analyzed shows evidence that markets are in the process of rewarding higher ESG performing corporates with higher credit contingency, lower cost of refinancing, i.e. smaller credit spreads as well as higher credit ratings.
Governance and environmental risks are often identified as the most important ESG domains. The importance of governance is underlined by a Barclays (2015) study which found that an IG FI portfolio scoring on average higher on governance, outperforms a lower rated peer over a stretch of 9 years from January 2007 to September 2015 by over 500bps in sum.
Guidance 4. ESG integration may serve alpha creation in IG FI portfoliosJudging from a research perspective, several studies show that ESG integration does not translate into a loss of performance. On the contrary, the Barclays (2015) study finds a modest but incremental long-term return amounting to 30bps p.a. of high ESG scoring corporate bond portfolios over conventional peers. A recent Barclays study argues that ESG scores for corporate bonds might capture risk factors that have not been fully priced so far, including the possibility of significant changes in the regulatory business environment. For US IG bonds, Barclays estimates that credit spreads of issuers with an overall higher ESG score have been on average 33.6bps p.a. per std. dev. lower.5 A back-of-the envelope calculation would suggest that this corresponds to a credit spread reduction of roughly 15% of a high rated ESG portfolio compared to the Barclays US Corporate Aggregate Index over duration-matched treasuries, which was used as a benchmark in their analysis, between January 2007 and September 2015.6
2 Moody’s: “Moody’s Approach to Assessing ESG Risks in Ratings and Research” and “Environmental Risks and Developments”.3 Based on S&P Global: “How Environmental And Climate Risks Factor Into Global Corporate Ratings” and “2015 Annual Global Corporate default study and rating transi-tions”.4 Academic evidence by Henke (2016).5 Barclays itself does not give a reason for this effect in their paper. Conceivable reasons include: Higher liquidity of high scoring ESG bonds, relatively cheap price of high rated ESG bonds etc.6 Own calculation based on Barclays “ESG Ratings and Performance of Corporate Bonds”: Average spread reduction per year divided through historic option adjusted spread: 2.8 bp/month *12 month )
191bp/y≈15% p.a.

5
ESG in Investment Grade Corporate Bonds
Guidance 5. Comparatively to equities exclusions may not impact risk/ return profiles of IG FI portfolios as muchCompared to riskier asset classes such as equities, convertibles bonds, high yield etc. we would expect exclusion filters to be of less concern to impact the yield-risk profile of IG bond strategies. The main reason is the expected higher risk homogeneity in this investment universe. Hence, exclusion filters should have a negligible tracking error impact on IG corporate bond strategies. A Newton Investment Management (2016) study underlines this by investigating the performance impact of fossil fuel and sin-screen filters on a US IG corporate bond portfolio comprising of 1,283 issuers in a period under review of 2004 to 2015. They find a minimal negative impact on returns with the sin screen not affecting performance at all and the fossil-fuel reducing the yield by 1bps p.a.
However, IG FI portfolio risk and return characteristics may significantly change in the context of broader exclusion lists that eliminate complete sectors or countries of domicile of issuers. This may impact the credit risk diversification in the portfolio too much.
6
ESG in Investment Grade Corporate Bonds
One step deeper How does ESG affect the credit rating of corporate bonds?
What ESG dimensions are most performance relevant for corporate bonds?
Which are promising ESG integration strategies for corporate bonds portfolios?
How does ESG affect the credit rating of corporate bonds?
Generally speaking, corporate bond performance is determined by a multitude of factors. These are, for example, the bond’s payment structure and duration, market risks such as interest rates and liquidity fluctuations as well as credit risk. On a portfolio level, issuer selection and diversification are relevant factors. We investigate the financial materiality of ESG for corporate bonds and portfolios with some of these factors by analyzing several selected research studies and methodologies. We investigate how and to what extent ESG ratings can complement credit ratings.
The link between ESG and corporate credit riskFor Investment Grade Corporate Bonds portfolios it is important to identify issuers with high credit quality. Credit risk may be measured in various ways: credit ratings and rating migrations, bond price volatility, credit default swap prices, credit spreads etc. Since many bond portfolio managers use the credit opinions of rating agencies it is important to understand if and how ESG is incorporated in their credit assessment. In May 2016, the UN PRI launched an initiative to develop practical solutions for more systemic and transparent incorporation of ESG in credit ratings and analyses. In this context a statement was produced on ‘ESG in credit ratings and analyses’ which was signed by over 100 investors and six of the leading credit rating agencies (Moody’s, S&P global ratings, RAM ratings, scope, Liberum ratings, Dagong Ratings Group). In our analysis we focus on the evidence of ESG integration by the ‘big three’ agencies, namely S&P, Moody’s and Fitch ratings.
ResultsWe find evidence that ESG risks are increasingly considered as part of the credit rating processes when the rating agencies perceive them to be material for changes in ratings or rating outlooks. To our perception rating agencies usually do not explicitly score companies or sovereigns concerning ESG risks or strengths such as it is done by ESG research providers to construct dedicated ESG issuer ratings. Material ESG factors are considered as part of the standard credit risk assessment model. Credit risk materiality of ESG is subject to industry sector, company and time horizon. Generally, in the past and up until now, all rating agencies have considered ‘governance / management strength’ as part of their standard credit risk assessment framework.
Corporate governance is perceived to be the strongest credit risk contributor along the ESG dimensions. Environmental risks, such as climate change or industry regulations are perceived to be more of a macro/industry risk in the long-term. Rating agencies seem to assess environmental issues indirectly through other factors, such as solvency or liquidity.
Concerning severity and frequency, rating agencies expect the number of ESG-related rating incidents to continue to rise, as the materiality and corporate exposure towards these risks is expected to pick up. Growing public attention towards ESG issues and ESG trends such as demographic change, corporate transparency, carbon regulations etc. are expected to be continuous drivers of this development.
7
ESG in Investment Grade Corporate Bonds
Key criteria S&P Moody’s FitchEn
viro
nmen
tal f
acto
rs Mentioned in document
Evidence Evidence -
Explicitly mentioned as credit criteria
Evidence Evidence -
Extent of E in credit risk analysis
Considerable evidence Evidence -
Soci
al fa
ctor
s
Mentioned in document
Evidence Evidence -
Explicitly mentioned as credit criteria
Evidence Evidence -
Extent of S in credit risk analysis
- Evidence -
Gove
rnan
ce fa
ctor
s Mentioned in document
Considerable evidence Evidence Evidence
Explicitly mentioned as credit criteria
Considerable evidence Evidence Evidence
Extent of G in credit risk analysis
Considerable evidence Considerable evidence Evidence
Met
hodo
logy
Level of consideration
Incorporates country and industry risk and an assessment of the competitive position
Individual industry and entity specific ESG considerations
Assessment of jurisdictional environment and entity specific factors
Approach • Risk based approach• Opportunity-based approach
for E&S• Downside-scale for
governance
• Risk and downside based approach
• Industry/sector differences
• Risk and downside based approach
• No consideration of good governance
Time horizon Long-term Long-term n/a
Integration • E&S considered when deemed material
• G is a part of the “management” assessment in the credit rating process
• E&S considered when deemed material
• G is a fixed component of CR assessments
G: considered on individual case basis
Which factor is most important?
Governance, E&S will receive more prominence in the future
Governance, E will receive more prominence in the future
Governance
Additional information
Regular publications on environmental & social event risks
• Dedicated environmental risks and developments topic section page
• Social performance group (Moody’s SRI research platform)
n/a
7 Allianz Global Investors based on selected publications of credit rating agencies.
Table 1. Credit Rating Agencies (CRA) and ESG: Peer group comparison 7

8
ESG in Investment Grade Corporate Bonds
Standard & Poor’s approach to ESG
In its 2015 report “ESG Risks In Corporate Credit Ratings — An Overview” Standard & Poor’s (S&P) documents their ESG methodology for credit assessment. ESG risks are seen as an essential element in their credit analysis and are already incorporated into their corporate credit criteria framework. While the main focus of S&P’s ESG intake is to identify downside credit risk any favorable environmental or social factors that may contribute to an improved credit rating outlook are considered as well. Governance is only scored on a neutral or negative scale though. ESG risks are incorporated throughout their credit rating research process. Factors that are assessed in the analysis include for instance climate change policies, environmental pollution, resource depletion, employee-, customer- and community relations, adherence to legal and regulatory requirements etc.
As mentioned, ESG factors do not receive an explicit score but are incorporated into the overall credit rating analysis to provide a holistic view of an issuer’s profile. Governance is the most frequent and material factor for rating changes.8 It is the only ESG dimension that is explicitly and exhaustively examined. Observed changes in Management & Governance can substantially influence the credit rating. This is especially true for lower rated issuers. Yet, S&P argues that environmental and social factors are implicitly covered by their assessment of a company’s management of other credit factors.
8 See ”Standard & Poor’s (2012). Methodology: Management and Governance credit factors for corporate entities and insurers“. *This adjustment is one notch if S&P have not already captured benefits of strong management and governance in the analysis of the issuer’s competitive posi-tion. **Number of notches depends on the degree of negative effect on the enterprise’s risk profile.
Table 2. Impact of Management & Governance on the anchor rating 9
Anchor range
Factor/ranking ‘a-’ and higher ‘bbb+’ to ‘bbb-’ ‘bb+’ to ‘bb-’ ‘b+’ and lower
Management and Governance (M&G)
1. Strong 0 notches (see positive FP) 0 notches (see positive FP) 0 or +1 notch* 0 or +1 notch*
2. Satisfactory 0 notches (see positive FP) 0 notches (see positive FP) 0 notches (see positive FP) 0 notches
3. Fair - 1 notches 0 notches 0 notches 0 notches
4. Weak - 2 or more notches ** - 2 or more notches ** - 1 or more notches ** - 1 or more notches **
9
ESG in Investment Grade Corporate Bonds
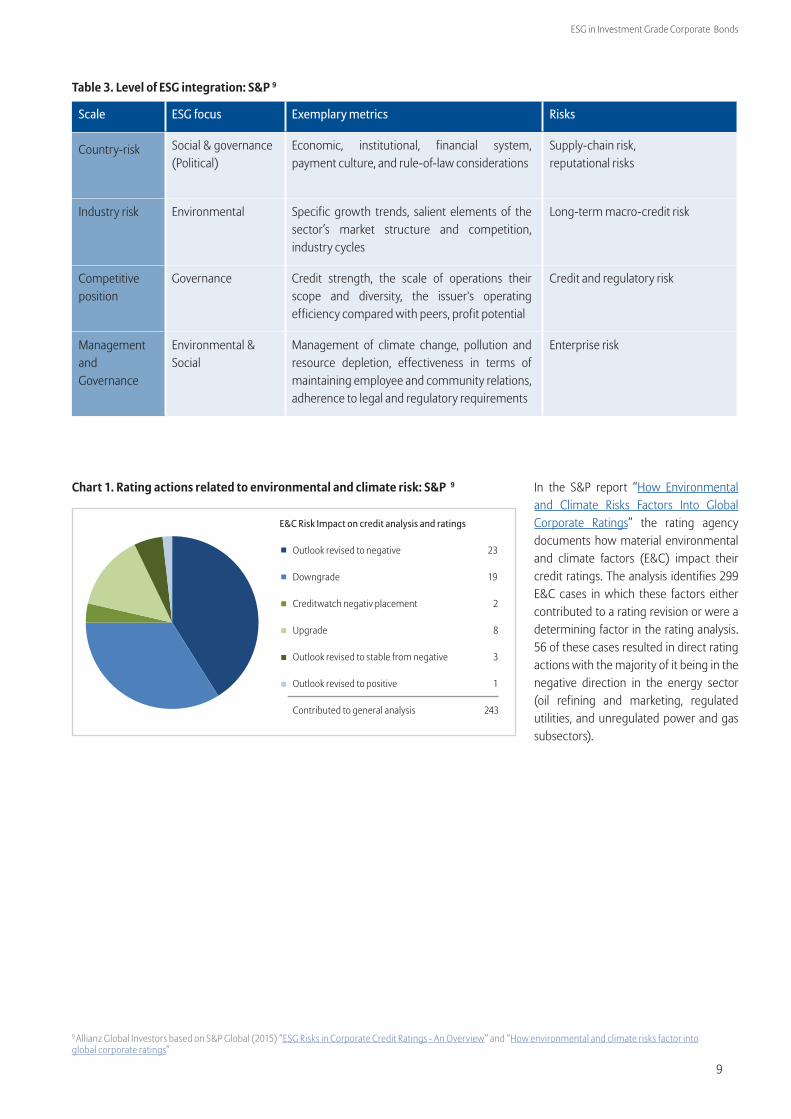
In the S&P report “How Environmental and Climate Risks Factors Into Global Corporate Ratings” the rating agency documents how material environmental and climate factors (E&C) impact their credit ratings. The analysis identifies 299 E&C cases in which these factors either contributed to a rating revision or were a determining factor in the rating analysis. 56 of these cases resulted in direct rating actions with the majority of it being in the negative direction in the energy sector (oil refining and marketing, regulated utilities, and unregulated power and gas subsectors).
9 Allianz Global Investors based on S&P Global (2015) “ESG Risks in Corporate Credit Ratings - An Overview” and “How environmental and climate risks factor into global corporate ratings”
Chart 1. Rating actions related to environmental and climate risk: S&P 9
Outlook revised tonegative
Downgrade
Creditwatch Negativeplacement
Upgrade
Outlook revised to stablefrom negative
Outlook revised topositive
E&C Risk Impact on credit analysis and ratings
Outlook revised to negative 23
Downgrade 19
Creditwatch negativ placement 2
Upgrade 8
Outlook revised to stable from negative 3
Outlook revised to positive 1
Contributed to general analysis 243
Table 3. Level of ESG integration: S&P 9
Scale ESG focus Exemplary metrics Risks
Country-risk Social & governance (Political)
Economic, institutional, financial system, payment culture, and rule-of-law considerations
Supply-chain risk, reputational risks
Industry risk Environmental Specific growth trends, salient elements of the sector’s market structure and competition, industry cycles
Long-term macro-credit risk
Competitive position
Governance Credit strength, the scale of operations their scope and diversity, the issuer's operating efficiency compared with peers, profit potential
Credit and regulatory risk
Management and Governance
Environmental & Social
Management of climate change, pollution and resource depletion, effectiveness in terms of maintaining employee and community relations, adherence to legal and regulatory requirements
Enterprise risk

10
ESG in Investment Grade Corporate Bonds
Moody’s approach to ESG risks in credit ratings
In the report “Moody’s Approach to Assessing ESG risks in Rating and Research” the rating agency illustrates through which direct and indirect paths ESG risks are incorporated into their credit risk research and ratings. ESG considerations are captured in Moody’s long-term credit risk analyses when the agency believes they will materially affect the primary focus of their ratings systems – to assess the probability of default of a debt issuer and expected credit loss in the event of default. Consequently, Moody’s credit research and ratings consider material ESG factors with potentially large impact on credit default risk or size of loss in case of default.
ESG risks are differentiated along industries, sectors and single issuers.
Table 4. Example of Moody’s ESG considerations 10
Scale ESG focus Exemplary metrics
Environmental Adverse effects of direct environmental hazards
Pollution, drought or severe natural and man-made disasters
Regulatory and other policy initiatives that seek to mitigate or prevent direct environmental hazards or perceived hazards
German “Energiewende”
Social Social issues Health and safety, health care, employee relations, changing consumer food practices, and the impact of technology on social trends
Corporate covernance
Companies Board oversight and risk management executive compensation, board composition, board practices and management quality
Sovereigns and sub-sovereigns (states and local governments)
Incidence of corruption and the related impact on institutional strength, or the quality of financial decision-making and management.
10 Allianz Global Investors based on Moody’s (2015): “Moody’s approach to assessing ESG risks in ratings and research”.
In some of Moody’s credit rating methodologies ESG risks are even explicitly scored, e.g. governance risk for sovereign bond issuers and banks. For the ultimate credit risk assessment, Moody’s puts ESG risks into the overall credit risk analysis picture. In doing so, factors like high financial strength of an issuer may, however, off-set ESG risk concerns.
Moreover, Moody’s rating outlooks are enriched by important ESG risk trends identified by Moody’s credit research. A 2015 example is the analysis of the potential impact of the ongoing Californian drought on public Californian finance.
Recent reports further include: Global anti-bribery and corruption enforcement efforts, upcoming regulations on Europe’s electricity markets, and the rising impact of carbon reduction policies.
Table 5. Individual sectors and corresponding metrics 10
Sector/industry Key credit criteria Exemplary metrics ESG issue
Banks Corporate behavior Key man risk, insider and related party risk, strategy and management, dividend policy, compensation policy, and accounting policies, etc.
Governance
Unregulated utilities & power companies
Market framework and positioning
Effects of changes in environmental policies, energy-efficiency legislation, government policies, etc.
Environmental
Capital requirements and Operational performance
Environmental-related expenditures Environmental
Sovereigns Institutional strength Government effectiveness, rule of law, control of corruption, etc.
Governance
11
ESG in Investment Grade Corporate Bonds
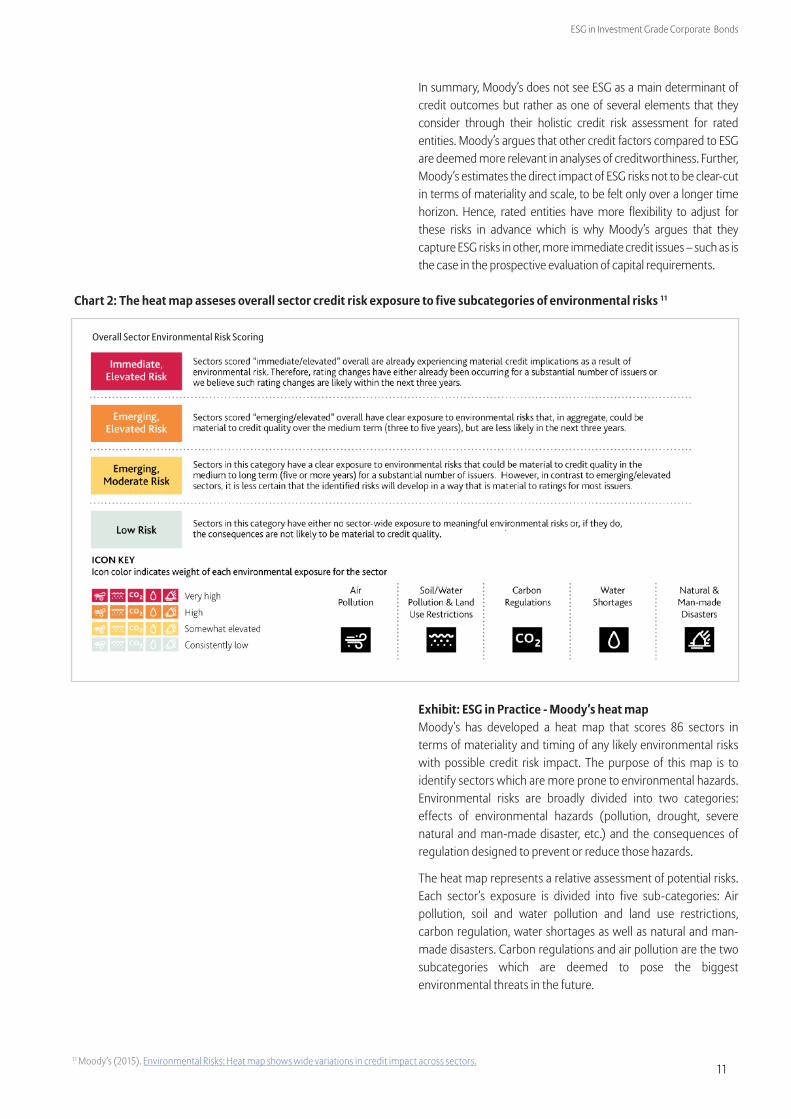
11 Moody’s (2015). Environmental Risks: Heat map shows wide variations in credit impact across sectors.
In summary, Moody’s does not see ESG as a main determinant of credit outcomes but rather as one of several elements that they consider through their holistic credit risk assessment for rated entities. Moody’s argues that other credit factors compared to ESG are deemed more relevant in analyses of creditworthiness. Further, Moody’s estimates the direct impact of ESG risks not to be clear-cut in terms of materiality and scale, to be felt only over a longer time horizon. Hence, rated entities have more flexibility to adjust for these risks in advance which is why Moody’s argues that they capture ESG risks in other, more immediate credit issues – such as is the case in the prospective evaluation of capital requirements.
Exhibit: ESG in Practice - Moody’s heat mapMoody’s has developed a heat map that scores 86 sectors in terms of materiality and timing of any likely environmental risks with possible credit risk impact. The purpose of this map is to identify sectors which are more prone to environmental hazards. Environmental risks are broadly divided into two categories: effects of environmental hazards (pollution, drought, severe natural and man-made disaster, etc.) and the consequences of regulation designed to prevent or reduce those hazards.
The heat map represents a relative assessment of potential risks. Each sector’s exposure is divided into five sub-categories: Air pollution, soil and water pollution and land use restrictions, carbon regulation, water shortages as well as natural and man-made disasters. Carbon regulations and air pollution are the two subcategories which are deemed to pose the biggest environmental threats in the future.
Chart 2: The heat map asseses overall sector credit risk exposure to five subcategories of environmental risks 11
Overall Sector Environmental Risk Scoring

12
ESG in Investment Grade Corporate Bonds
Fitch ratings
The report “Evaluating Corporate Governance” 12 by Fitch outlines their approach. Within the ESG domains, Fitch focuses mostly on corporate governance. As Fitch states: “poor governance practices, including country-specific and issuer-specific corporate governance matters, can result in lower ratings than typical quantitative and qualitative credit factors may otherwise imply”. Corporate governance is identified through key analytics along two dimensions: country- and issuer-specific factors. When evaluating corporate governance on a country level, Fitch will focus on systematic characteristics such as jurisdictional considerations, the quality and quantity of financial information available in the market and whether the regulatory and operational environment supports or undermines the overall transparency. Issuer-specific governance characteristics are for instance board effectiveness, management effectiveness, transparency of financial information and related-party transactions. Governance characteristics are respectively divided into three impact categories: ratings neutral, those that may constrain ratings and ratings negative. Fitch states that good governance will not, in isolation, positively affect a credit rating.
12 Fitch (2016) “Evaluating corporate governance”.
13
ESG in Investment Grade Corporate Bonds
What ESG dimensions are most performance relevant for corporate bonds?
Governance matters, but so do environmental issues
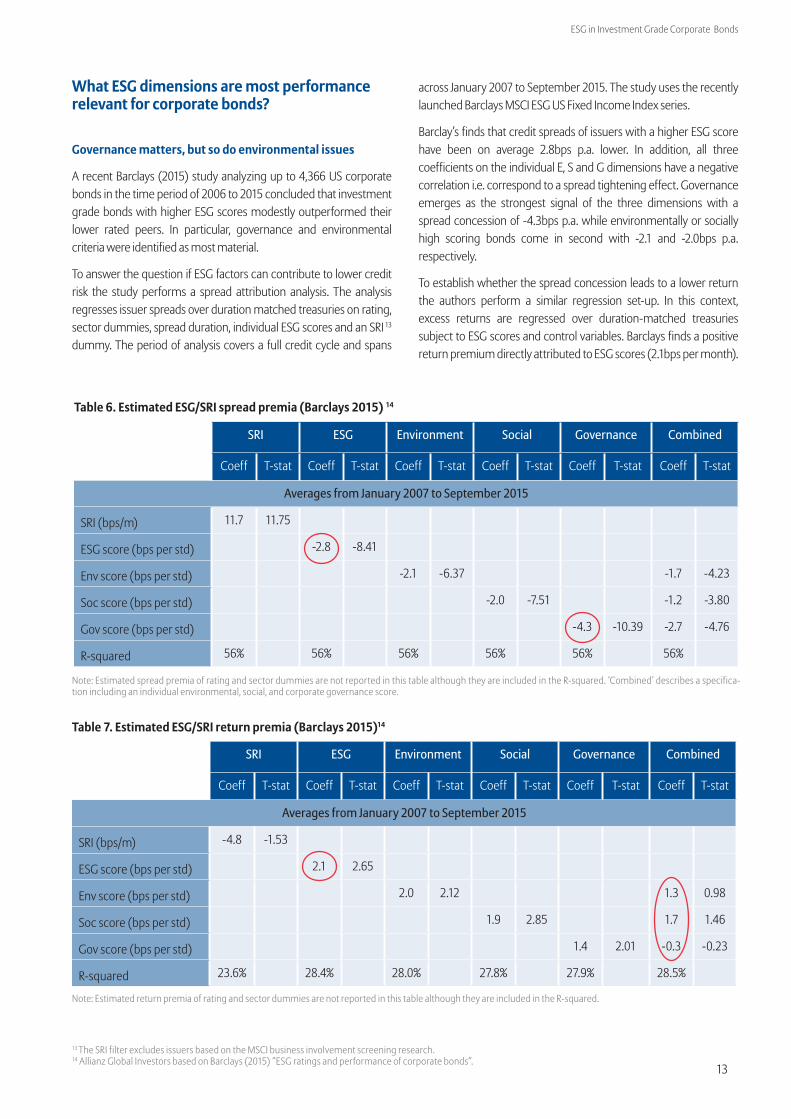
A recent Barclays (2015) study analyzing up to 4,366 US corporate bonds in the time period of 2006 to 2015 concluded that investment grade bonds with higher ESG scores modestly outperformed their lower rated peers. In particular, governance and environmental criteria were identified as most material.
To answer the question if ESG factors can contribute to lower credit risk the study performs a spread attribution analysis. The analysis regresses issuer spreads over duration matched treasuries on rating, sector dummies, spread duration, individual ESG scores and an SRI 13 dummy. The period of analysis covers a full credit cycle and spans
13 The SRI filter excludes issuers based on the MSCI business involvement screening research. 14 Allianz Global Investors based on Barclays (2015) “ESG ratings and performance of corporate bonds”.
across January 2007 to September 2015. The study uses the recently launched Barclays MSCI ESG US Fixed Income Index series.
Barclay’s finds that credit spreads of issuers with a higher ESG score have been on average 2.8bps p.a. lower. In addition, all three coefficients on the individual E, S and G dimensions have a negative correlation i.e. correspond to a spread tightening effect. Governance emerges as the strongest signal of the three dimensions with a spread concession of -4.3bps p.a. while environmentally or socially high scoring bonds come in second with -2.1 and -2.0bps p.a. respectively.
To establish whether the spread concession leads to a lower return the authors perform a similar regression set-up. In this context, excess returns are regressed over duration-matched treasuries subject to ESG scores and control variables. Barclays finds a positive return premium directly attributed to ESG scores (2.1bps per month).
Table 7. Estimated ESG/SRI return premia (Barclays 2015)14
SRI ESG Environment Social Governance Combined
Coeff T-stat Coeff T-stat Coeff T-stat Coeff T-stat Coeff T-stat Coeff T-stat
Averages from January 2007 to September 2015
SRI (bps/m) -4.8 -1.53
ESG score (bps per std) 2.1 2.65
Env score (bps per std) 2.0 2.12 1.3 0.98
Soc score (bps per std) 1.9 2.85 1.7 1.46
Gov score (bps per std) 1.4 2.01 -0.3 -0.23
R-squared 23.6% 28.4% 28.0% 27.8% 27.9% 28.5%
Note: Estimated return premia of rating and sector dummies are not reported in this table although they are included in the R-squared.
SRI ESG Environment Social Governance Combined
Coeff T-stat Coeff T-stat Coeff T-stat Coeff T-stat Coeff T-stat Coeff T-stat
Averages from January 2007 to September 2015
SRI (bps/m) 11.7 11.75
ESG score (bps per std) -2.8 -8.41
Env score (bps per std) -2.1 -6.37 -1.7 -4.23
Soc score (bps per std) -2.0 -7.51 -1.2 -3.80
Gov score (bps per std) -4.3 -10.39 -2.7 -4.76
R-squared 56% 56% 56% 56% 56% 56%
Table 6. Estimated ESG/SRI spread premia (Barclays 2015) 14
Note: Estimated spread premia of rating and sector dummies are not reported in this table although they are included in the R-squared. ‘Combined’ describes a specifica-tion including an individual environmental, social, and corporate governance score.
14
ESG in Investment Grade Corporate Bonds
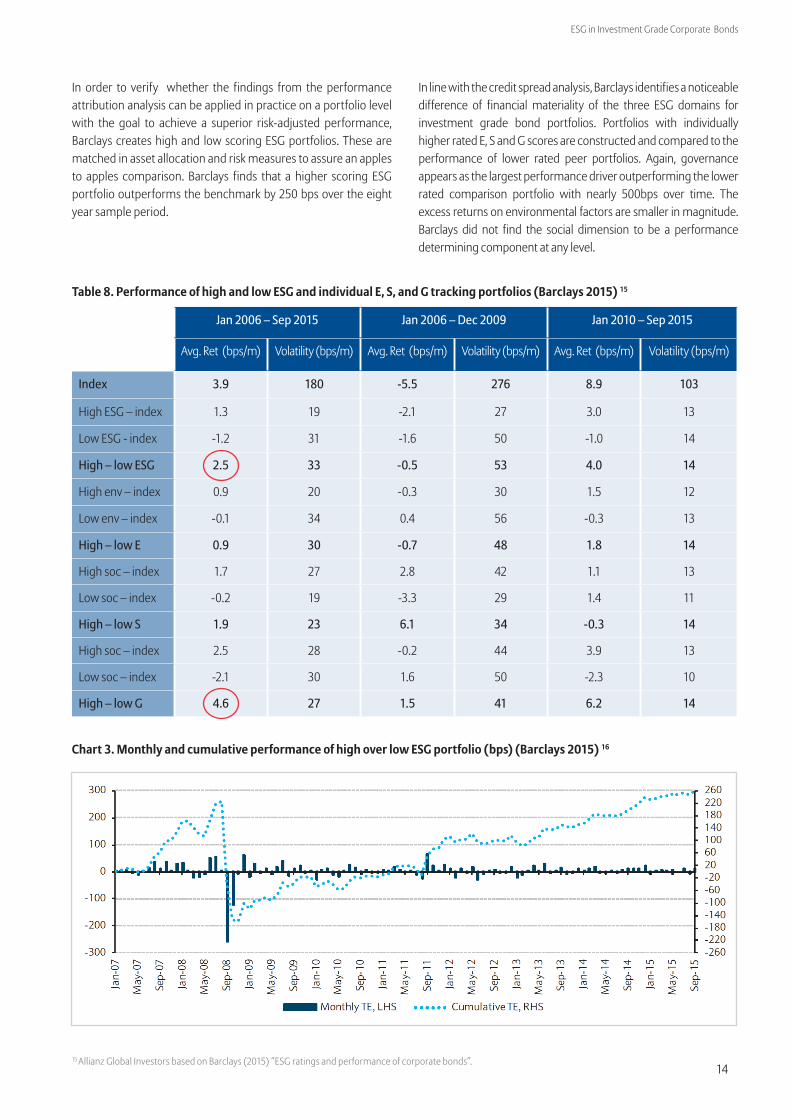
In order to verify whether the findings from the performance attribution analysis can be applied in practice on a portfolio level with the goal to achieve a superior risk-adjusted performance, Barclays creates high and low scoring ESG portfolios. These are matched in asset allocation and risk measures to assure an apples to apples comparison. Barclays finds that a higher scoring ESG portfolio outperforms the benchmark by 250 bps over the eight year sample period.
15 Allianz Global Investors based on Barclays (2015) “ESG ratings and performance of corporate bonds”.
Table 8. Performance of high and low ESG and individual E, S, and G tracking portfolios (Barclays 2015) 15
Jan 2006 – Sep 2015 Jan 2006 – Dec 2009 Jan 2010 – Sep 2015
Avg. Ret (bps/m) Volatility (bps/m) Avg. Ret (bps/m) Volatility (bps/m) Avg. Ret (bps/m) Volatility (bps/m)
Index 3.9 180 -5.5 276 8.9 103
High ESG – index 1.3 19 -2.1 27 3.0 13
Low ESG - index -1.2 31 -1.6 50 -1.0 14
High – low ESG 2.5 33 -0.5 53 4.0 14
High env – index 0.9 20 -0.3 30 1.5 12
Low env – index -0.1 34 0.4 56 -0.3 13
High – low E 0.9 30 -0.7 48 1.8 14
High soc – index 1.7 27 2.8 42 1.1 13
Low soc – index -0.2 19 -3.3 29 1.4 11
High – low S 1.9 23 6.1 34 -0.3 14
High soc – index 2.5 28 -0.2 44 3.9 13
Low soc – index -2.1 30 1.6 50 -2.3 10
High – low G 4.6 27 1.5 41 6.2 14
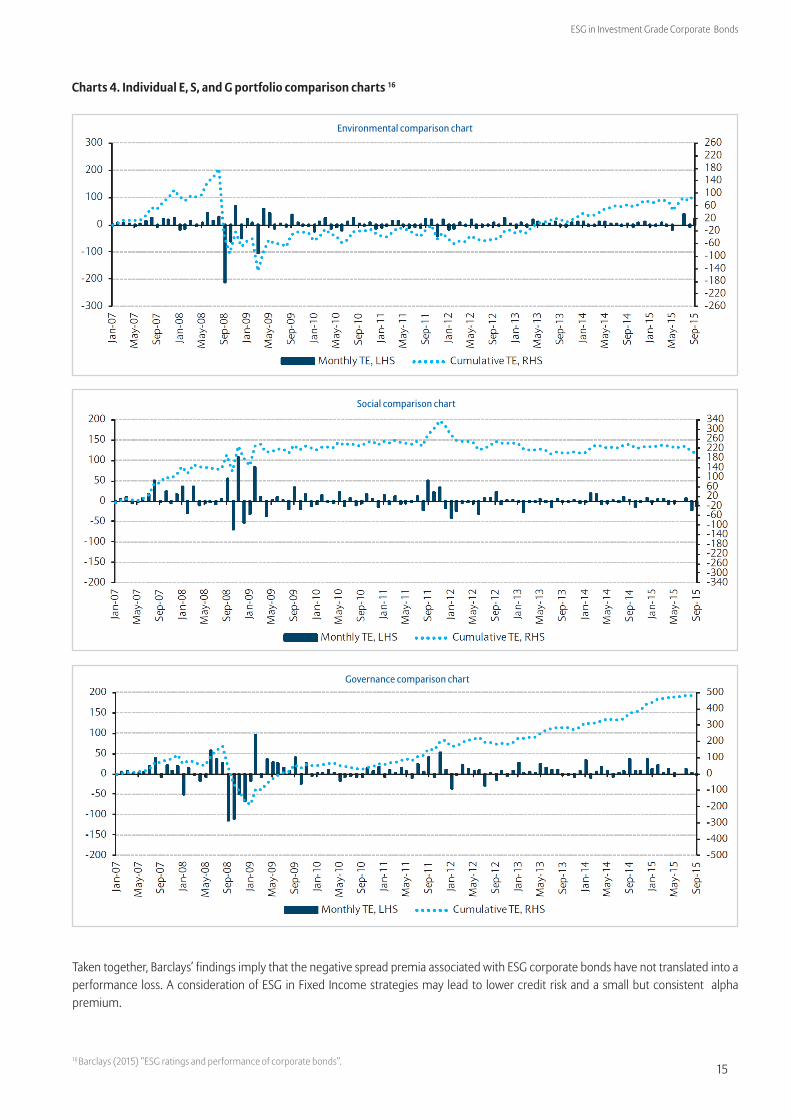
In line with the credit spread analysis, Barclays identifies a noticeable difference of financial materiality of the three ESG domains for investment grade bond portfolios. Portfolios with individually higher rated E, S and G scores are constructed and compared to the performance of lower rated peer portfolios. Again, governance appears as the largest performance driver outperforming the lower rated comparison portfolio with nearly 500bps over time. The excess returns on environmental factors are smaller in magnitude. Barclays did not find the social dimension to be a performance determining component at any level.
Chart 3. Monthly and cumulative performance of high over low ESG portfolio (bps) (Barclays 2015) 16
15
ESG in Investment Grade Corporate Bonds
Charts 4. Individual E, S, and G portfolio comparison charts 16
16 Barclays (2015) “ESG ratings and performance of corporate bonds”.
Taken together, Barclays’ findings imply that the negative spread premia associated with ESG corporate bonds have not translated into a performance loss. A consideration of ESG in Fixed Income strategies may lead to lower credit risk and a small but consistent alpha premium.
Environmental comparison chart
Social comparison chart
Governance comparison chart
16
ESG in Investment Grade Corporate Bonds
Further evidence that good corporate governance pays off for bonds
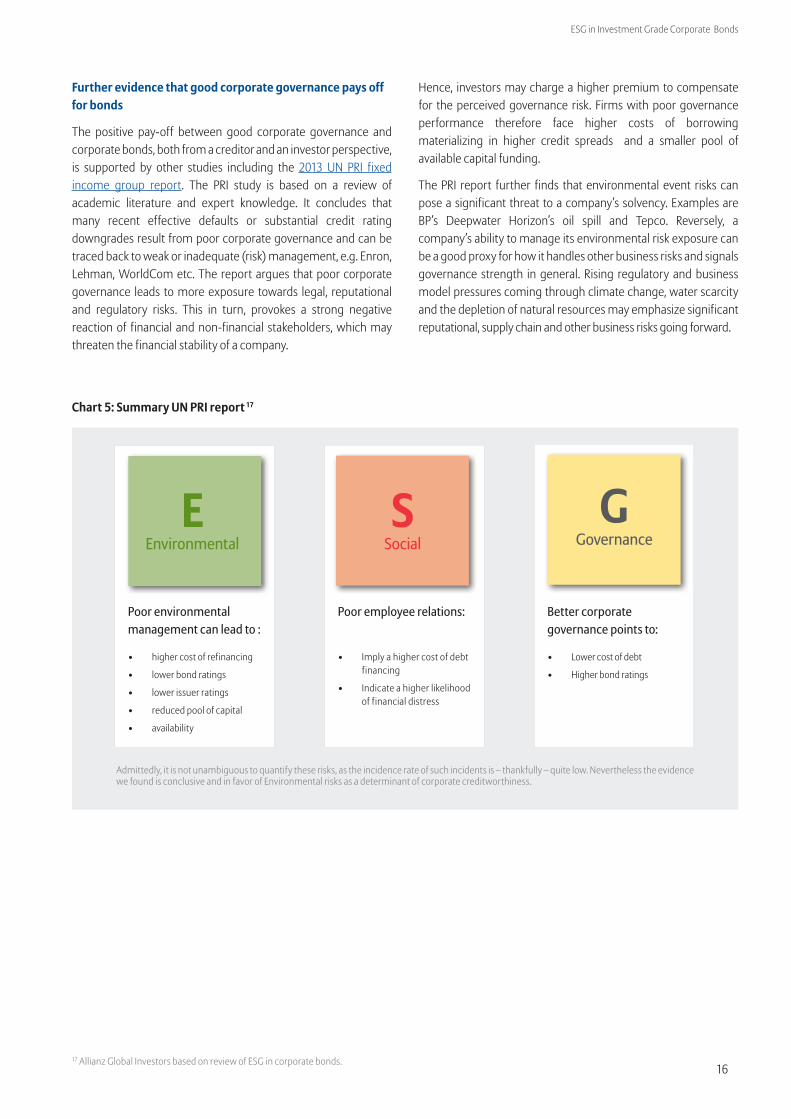
The positive pay-off between good corporate governance and corporate bonds, both from a creditor and an investor perspective, is supported by other studies including the 2013 UN PRI fixed income group report. The PRI study is based on a review of academic literature and expert knowledge. It concludes that many recent effective defaults or substantial credit rating downgrades result from poor corporate governance and can be traced back to weak or inadequate (risk) management, e.g. Enron, Lehman, WorldCom etc. The report argues that poor corporate governance leads to more exposure towards legal, reputational and regulatory risks. This in turn, provokes a strong negative reaction of financial and non-financial stakeholders, which may threaten the financial stability of a company.
Hence, investors may charge a higher premium to compensate for the perceived governance risk. Firms with poor governance performance therefore face higher costs of borrowing materializing in higher credit spreads and a smaller pool of available capital funding.
The PRI report further finds that environmental event risks can pose a significant threat to a company’s solvency. Examples are BP’s Deepwater Horizon’s oil spill and Tepco. Reversely, a company’s ability to manage its environmental risk exposure can be a good proxy for how it handles other business risks and signals governance strength in general. Rising regulatory and business model pressures coming through climate change, water scarcity and the depletion of natural resources may emphasize significant reputational, supply chain and other business risks going forward.
17 Allianz Global Investors based on review of ESG in corporate bonds.
Poor environmental management can lead to :
• higher cost of refinancing
• lower bond ratings
• lower issuer ratings
• reduced pool of capital
• availability
EEnvironmental
Better corporate governance points to:
• Lower cost of debt
• Higher bond ratings
GGovernance
Poor employee relations:
• Imply a higher cost of debt
financing
• Indicate a higher likelihood of financial distress
SSocial
Admittedly, it is not unambiguous to quantify these risks, as the incidence rate of such incidents is – thankfully – quite low. Nevertheless the evidence we found is conclusive and in favor of Environmental risks as a determinant of corporate creditworthiness.
Chart 5: Summary UN PRI report 17
17
ESG in Investment Grade Corporate Bonds
Considerable differences between industries
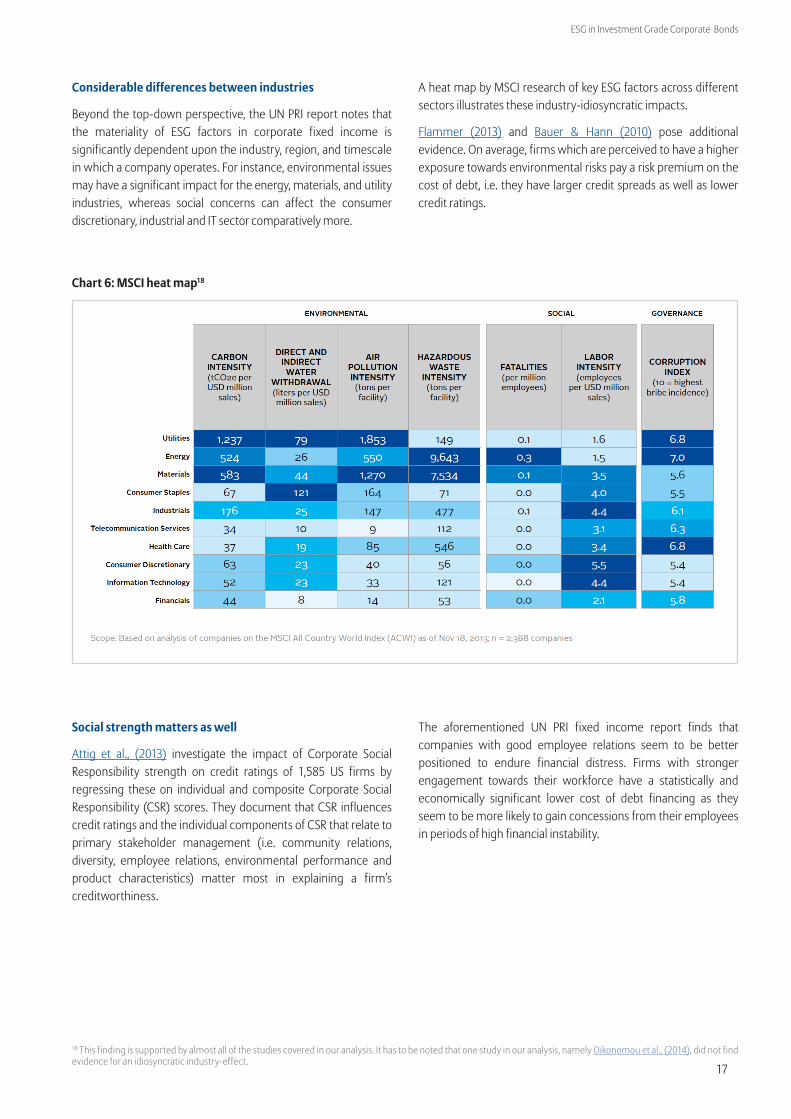
Beyond the top-down perspective, the UN PRI report notes that the materiality of ESG factors in corporate fixed income is significantly dependent upon the industry, region, and timescale in which a company operates. For instance, environmental issues may have a significant impact for the energy, materials, and utility industries, whereas social concerns can affect the consumer discretionary, industrial and IT sector comparatively more.
Social strength matters as well
Attig et al., (2013) investigate the impact of Corporate Social Responsibility strength on credit ratings of 1,585 US firms by regressing these on individual and composite Corporate Social Responsibility (CSR) scores. They document that CSR influences credit ratings and the individual components of CSR that relate to primary stakeholder management (i.e. community relations, diversity, employee relations, environmental performance and product characteristics) matter most in explaining a firm’s creditworthiness.
18 This finding is supported by almost all of the studies covered in our analysis. It has to be noted that one study in our analysis, namely Oikonomou et al., (2014), did not find evidence for an idiosyncratic industry-effect.
A heat map by MSCI research of key ESG factors across different sectors illustrates these industry-idiosyncratic impacts.
Flammer (2013) and Bauer & Hann (2010) pose additional evidence. On average, firms which are perceived to have a higher exposure towards environmental risks pay a risk premium on the cost of debt, i.e. they have larger credit spreads as well as lower credit ratings.
Chart 6: MSCI heat map18
The aforementioned UN PRI fixed income report finds that companies with good employee relations seem to be better positioned to endure financial distress. Firms with stronger engagement towards their workforce have a statistically and economically significant lower cost of debt financing as they seem to be more likely to gain concessions from their employees in periods of high financial instability.
18
ESG in Investment Grade Corporate Bonds
How does ESG affect the performance of corporate bonds in different market environments?
The majority of the studies we covered in our analysis, identify that a high ESG rating significantly reduces the credit risk of corporate bonds.19 This poses the question of whether the effect is stronger in times of more pronounced credit market risk such as financial crises & bear markets.
Issuer resilience: ESG corporate bonds outperform during market downturns
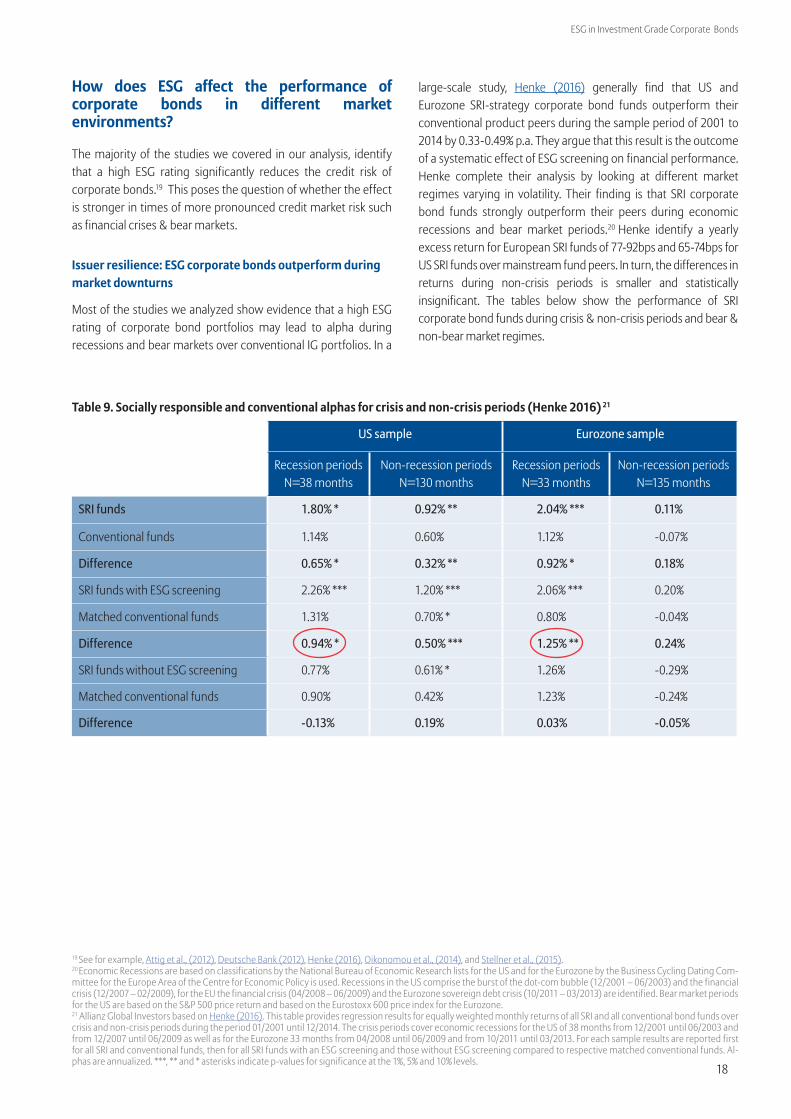
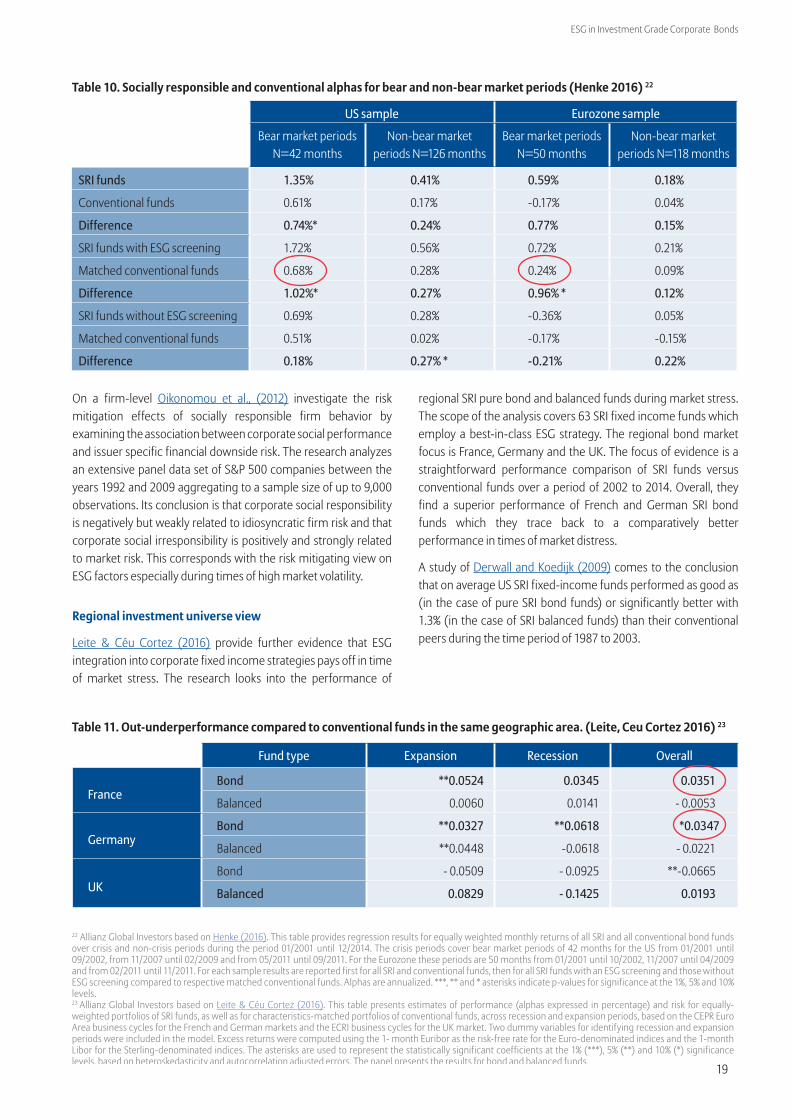
Most of the studies we analyzed show evidence that a high ESG rating of corporate bond portfolios may lead to alpha during recessions and bear markets over conventional IG portfolios. In a
large-scale study, Henke (2016) generally find that US and Eurozone SRI-strategy corporate bond funds outperform their conventional product peers during the sample period of 2001 to 2014 by 0.33-0.49% p.a. They argue that this result is the outcome of a systematic effect of ESG screening on financial performance. Henke complete their analysis by looking at different market regimes varying in volatility. Their finding is that SRI corporate bond funds strongly outperform their peers during economic recessions and bear market periods.20 Henke identify a yearly excess return for European SRI funds of 77-92bps and 65-74bps for US SRI funds over mainstream fund peers. In turn, the differences in returns during non-crisis periods is smaller and statistically insignificant. The tables below show the performance of SRI corporate bond funds during crisis & non-crisis periods and bear & non-bear market regimes.
Table 9. Socially responsible and conventional alphas for crisis and non-crisis periods (Henke 2016) 21
US sample Eurozone sample
Recession periods N=38 months
Non-recession periods N=130 months
Recession periods N=33 months
Non-recession periods N=135 months
SRI funds 1.80% * 0.92% ** 2.04% *** 0.11%
Conventional funds 1.14% 0.60% 1.12% -0.07%
Difference 0.65% * 0.32% ** 0.92% * 0.18%
SRI funds with ESG screening 2.26% *** 1.20% *** 2.06% *** 0.20%
Matched conventional funds 1.31% 0.70% * 0.80% -0.04%
Difference 0.94% * 0.50% *** 1.25% ** 0.24%
SRI funds without ESG screening 0.77% 0.61% * 1.26% -0.29%
Matched conventional funds 0.90% 0.42% 1.23% -0.24%
Difference -0.13% 0.19% 0.03% -0.05%
19 See for example, Attig et al., (2012), Deutsche Bank (2012), Henke (2016), Oikonomou et al., (2014), and Stellner et al., (2015).20 Economic Recessions are based on classifications by the National Bureau of Economic Research lists for the US and for the Eurozone by the Business Cycling Dating Com-mittee for the Europe Area of the Centre for Economic Policy is used. Recessions in the US comprise the burst of the dot-com bubble (12/2001 – 06/2003) and the financial crisis (12/2007 – 02/2009), for the EU the financial crisis (04/2008 – 06/2009) and the Eurozone sovereign debt crisis (10/2011 – 03/2013) are identified. Bear market periods for the US are based on the S&P 500 price return and based on the Eurostoxx 600 price index for the Eurozone. 21 Allianz Global Investors based on Henke (2016). This table provides regression results for equally weighted monthly returns of all SRI and all conventional bond funds over crisis and non-crisis periods during the period 01/2001 until 12/2014. The crisis periods cover economic recessions for the US of 38 months from 12/2001 until 06/2003 and from 12/2007 until 06/2009 as well as for the Eurozone 33 months from 04/2008 until 06/2009 and from 10/2011 until 03/2013. For each sample results are reported first for all SRI and conventional funds, then for all SRI funds with an ESG screening and those without ESG screening compared to respective matched conventional funds. Al-phas are annualized. ***, ** and * asterisks indicate p-values for significance at the 1%, 5% and 10% levels.
19
ESG in Investment Grade Corporate Bonds
22 Allianz Global Investors based on Henke (2016). This table provides regression results for equally weighted monthly returns of all SRI and all conventional bond funds over crisis and non-crisis periods during the period 01/2001 until 12/2014. The crisis periods cover bear market periods of 42 months for the US from 01/2001 until 09/2002, from 11/2007 until 02/2009 and from 05/2011 until 09/2011. For the Eurozone these periods are 50 months from 01/2001 until 10/2002, 11/2007 until 04/2009 and from 02/2011 until 11/2011. For each sample results are reported first for all SRI and conventional funds, then for all SRI funds with an ESG screening and those without ESG screening compared to respective matched conventional funds. Alphas are annualized. ***, ** and * asterisks indicate p-values for significance at the 1%, 5% and 10% levels.23 Allianz Global Investors based on Leite & Céu Cortez (2016). This table presents estimates of performance (alphas expressed in percentage) and risk for equally-weighted portfolios of SRI funds, as well as for characteristics-matched portfolios of conventional funds, across recession and expansion periods, based on the CEPR Euro Area business cycles for the French and German markets and the ECRI business cycles for the UK market. Two dummy variables for identifying recession and expansion periods were included in the model. Excess returns were computed using the 1- month Euribor as the risk-free rate for the Euro-denominated indices and the 1-month Libor for the Sterling-denominated indices. The asterisks are used to represent the statistically significant coefficients at the 1% (***), 5% (**) and 10% (*) significance levels, based on heteroskedasticity and autocorrelation adjusted errors. The panel presents the results for bond and balanced funds.
On a firm-level Oikonomou et al., (2012) investigate the risk mitigation effects of socially responsible firm behavior by examining the association between corporate social performance and issuer specific financial downside risk. The research analyzes an extensive panel data set of S&P 500 companies between the years 1992 and 2009 aggregating to a sample size of up to 9,000 observations. Its conclusion is that corporate social responsibility is negatively but weakly related to idiosyncratic firm risk and that corporate social irresponsibility is positively and strongly related to market risk. This corresponds with the risk mitigating view on ESG factors especially during times of high market volatility.
Regional investment universe view
Leite & Céu Cortez (2016) provide further evidence that ESG integration into corporate fixed income strategies pays off in time of market stress. The research looks into the performance of
regional SRI pure bond and balanced funds during market stress. The scope of the analysis covers 63 SRI fixed income funds which employ a best-in-class ESG strategy. The regional bond market focus is France, Germany and the UK. The focus of evidence is a straightforward performance comparison of SRI funds versus conventional funds over a period of 2002 to 2014. Overall, they find a superior performance of French and German SRI bond funds which they trace back to a comparatively better performance in times of market distress.
A study of Derwall and Koedijk (2009) comes to the conclusion that on average US SRI fixed-income funds performed as good as (in the case of pure SRI bond funds) or significantly better with 1.3% (in the case of SRI balanced funds) than their conventional peers during the time period of 1987 to 2003.
Table 10. Socially responsible and conventional alphas for bear and non-bear market periods (Henke 2016) 22
US sample Eurozone sample
Bear market periods N=42 months
Non-bear market periods N=126 months
Bear market periods N=50 months
Non-bear market periods N=118 months
SRI funds 1.35% 0.41% 0.59% 0.18%
Conventional funds 0.61% 0.17% -0.17% 0.04%
Difference 0.74%* 0.24% 0.77% 0.15%
SRI funds with ESG screening 1.72% 0.56% 0.72% 0.21%
Matched conventional funds 0.68% 0.28% 0.24% 0.09%
Difference 1.02%* 0.27% 0.96% * 0.12%
SRI funds without ESG screening 0.69% 0.28% -0.36% 0.05%
Matched conventional funds 0.51% 0.02% -0.17% -0.15%
Difference 0.18% 0.27% * -0.21% 0.22%
Table 11. Out-underperformance compared to conventional funds in the same geographic area. (Leite, Ceu Cortez 2016) 23
Fund type Expansion Recession Overall
FranceBond **0.0524 0.0345 0.0351
Balanced 0.0060 0.0141 - 0.0053
GermanyBond **0.0327 **0.0618 *0.0347
Balanced **0.0448 -0.0618 - 0.0221
UKBond - 0.0509 - 0.0925 **-0.0665
Balanced 0.0829 - 0.1425 0.0193
20
ESG in Investment Grade Corporate Bonds
Which are promising ESG integration strategies for corporate bonds portfolios?
Beyond the various evidence on financial materiality of ESG for bonds we also have looked into studies that analyze successful ESG integration into corporate bond portfolio strategies. Generally, we observe that research material on this question is comparatively small. ESG portfolio strategies need to be (back-)tested further. The evidence on worst-in-class exclusion, best-in-class, ESG tilting, ESG momentum strategies etc. do not deliver fully conclusive results to date.
From a portfolio risk mitigation perspective, a worst-in-class exclusion strategy, which eliminates the worst ESG rated corporate issuers, seems to deliver comparatively good results. According to the research we have analyzed the risk mitigation effect appears even stronger during recession phases and times of market distress.24
Exclusion filters based on ESG risk factors such as fossil risk based or norm-based value screens seem to have a comparatively smaller negative effect on a corporate bond portfolio’s risk and return profile, as the study by Newton Investment Management (2016) shows.
Chart 7. Overview Barclays MSCI fixed income Index strategies (Barclays 2013) 25
Approach/index ESG filter applied
Launched in
June 2013
Best in class-approach
(Barclays MSCI Corporate Sustainability Index)
Market capitalization weighted approach that includes the constituents of the standard Barclays Corporate Bond Index with a BBB or higher MSCI ESG rating. (Market-capitalization weighted)
ESG-weighted best in class-approach
(Barclays MSCI Corporate ESG-Weighted Index)
Market capitalization weighted approach that includes the constituents of the standard Barclays Corporate Bond Index with a BBB or higher MSCI ESG rating. This index overweighs issuers that have higher ESG ratings and/or positive rating momentum.
Negative filter of controversial companies
(Barclays MSCI SRI Corporate Index)
Excludes issuers flagged as non-SRI compliant, meaning that companies involved in controversial business activities according to MSCI Business Involvement Screening Research (BISR) are excluded. This contains industries such as: tobacco, alcohol, gambling, adult entertainment, nuclear power, genetically modified organisms, stem cell research, firearms, and weapon systems (market-capitalization weighted).
From a general ESG integration perspective the covered studies suggest that investors may profit in two ways: First, a corporate bond portfolio considering ESG factors will be less affected by corporate defaults and credit rating downgrades over a long-term horizon. That is, ESG may lead to long-term capital appreciation through tail-risk mitigation. Secondly, a promising strategy for bond investors seems to be a positive ESG momentum strategy. Investors increasingly seem to value that corporate bonds issued by companies with high ESG ratings may have lower idiosyncratic risk. ESG strengths or a proficient management of ESG risks are increasingly accredited by capital markets and in turn factored into asset prices. Bond strategies may capitalize alpha by investing in bonds issued by corporates experiencing improvements in their ESG ratings which have not been priced in yet. This is similar to a pre-existing strategy in the FI universes which seeks to profit by expected changes in credit ratings and corresponding rising or falling bond prices.
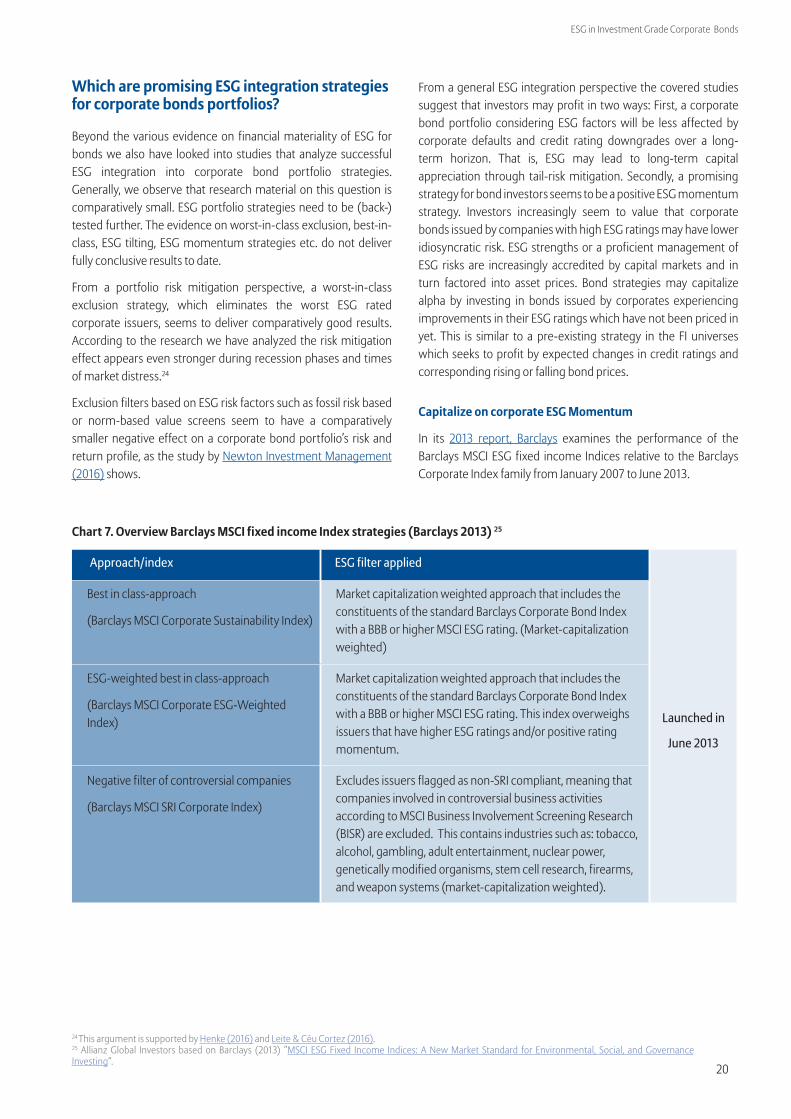
Capitalize on corporate ESG Momentum
In its 2013 report, Barclays examines the performance of the Barclays MSCI ESG fixed income Indices relative to the Barclays Corporate Index family from January 2007 to June 2013.
24 This argument is supported by Henke (2016) and Leite & Céu Cortez (2016). 25 Allianz Global Investors based on Barclays (2013) ”MSCI ESG Fixed Income Indices: A New Market Standard for Environmental, Social, and Governance Investing“.

21
ESG in Investment Grade Corporate Bonds
While all ESG fixed income indices achieve a positive return, the ESG weighted strategy seems to work best. It outperforms the Barclays Corporate Index throughout all market regimes included in the time-frame of the analysis. The SRI and sustainability strategy slightly underperform the traditional index which the authors think results out of differences in systematic risk exposure compared to the Barclays Corporate Aggregate Indices.
Table 12. Performance of Barclays MSCI ESG Corporate Indices vs. Barclays Corporate Index between 2007 - 2012 (Barclays 2013) 26
Table 13. Impact of sin-screening & fossil-fuel screening in US bond markets between 2004-2015 (Newton Investment Management (2016) 27
Market Barclays Corporate Index
SRI (SRI filter)
Sustainability (Best-in-class)
ESG weighted (ESG-momentum)
World 6.10 5.92 6.00 6.23
US 7.31 7.20 7.09 7.37
UK 5.63 5.32 5.87 5.87
Euro 5.06 4.97 5.08 5.11
Sin-screening Yield Coupon rate
Rating
Universe 4.64 4.64 22.97
Screened by sector 4.64 4.63 23.00
Difference 0.00 -0.01 0.03
Euro 5.06 4.97 5.08
Fossil-fuel Yield Coupon rate
Rating
Universe 4.64 4.64 22.97
Ex- fossil fuel core 4.63 4.62 23.00
Difference -0.01 -0.02 0.06
Ex fossil fuel extended 4.63 4.62 23.03
Difference -0.01 -0.02 0.06
26 Allianz Global Investors based on Barclays (2013) “MSCI ESG Fixed Income Indices, A New Market Standard for Environmental, Social, and Governance Investing”.27 Allianz Global Investors based on Newton Investment Management (2016). The impact of ethical investing on returns, volatility and income.
Fossil fuel core: Coal, oil & gas.Fossil fuel extended: Fossil fuel core + coal, oil & gas services.
SRI filter seem to have a neutral performance impact
A recent study commissioned by Newton Investment Management (2016) and executed by the Warwick Business School determines the effect of ethical & impact filters in terms of performance, yield and volatility by applying negative filters (sin stock & fossil fuel screen) on portfolios. Their sample consists of 1,283 US corporate bonds and over 10,000 stocks in 28 developed and emerging markets. The period under review is 2004 to 2015. While the ratings of the portfolios improve modestly with both filter strategies they find a minimal yet negative performance effect of US corporate bond portfolios ranging from 1 to 2bps. It has to be remarked that neither of those effects is statistically significant.

22
ESG in Investment Grade Corporate Bonds
Glossary
Term Definition
Best-in-class strategy Best-in-class means focusing on investments in companies that perform better on ESG dimensions than their peers within a particular industry sector or region.
CRA Credit Rating Agency.
Credit rating Forward-looking opinion about the creditworthiness of a debtor/ obligator.
Credit rating agency Credit rating agencies such as S&P, Moody’s and Fitch specialize in the evaluation of credit risk by collecting information about corporate and soverign issuers, and assign an alphabetical value called a credit rating that indicates the borrower’s creditworthiness.
Credit risk Credit risk describes the risk of loss of principal or loss of any other financial reward resulting from a borrower’s failure to repay a loan or otherwise meet a contractual obligation. Investors are compensated for assuming credit risk by way of interest payments from the borrower or issuer of a debt obligation credit spread. The higher the perceived credit risk, the higher the rate of interest that investors will demand for lending their capital.Credit risk is arguably the determining component of fixed-income investing.
Credit spread Difference in yield between any type of bond and a treasury bond of the same maturity. Market price indication of perceived credit risk.
Credit default Debtor does not meet payment obligations.
Credit rating agency Credit rating agencies such as S&P, Moody’s and Fitch specialize in the evaluation of credit risk by collecting information about corporate and soverign issuers, and assign an alphabetical value called a credit rating that indicates the borrower’s creditworthiness.
ESG Environmental, Social, (Corporate) Governance . Extra-financial factors that may have a material impact on the financial performance of portfolios.
ESG Integration Integration of ESG criteria into traditional investments products with a focus on ESG risks and opportunities.
ESG rating Opinion on ESG strength of a corporate or sovereign issuer. Usually results from scoring of ESG factors. Depending on the research provider’s methodology an ESG rating may express different things. Some providers aim to express a forward looking opinion on material ESG risks and opportunities.
FI Fixed Income.
IG Investment Grade.
Negative Screening Negative screening involves the exclusion of companies and/ or countries from the investment universe on the basis of ESG norms and criteria such as product involvement.
SRI Sustainable and Responsible Investing. This is a combination of long-term economic value creation and a forward-thinking approach to corporate governance, environmental stewardship and social responsibility.
UN PRI United Nations Principles of Responsible Investing. The PRI is the world's leading proponent of responsible investment. It works to understand the investment implications of environmental, social and governance (ESG) factors and to support its international network of investor signatories in integrating these factors into their investment and ownership decisions.

23
ESG in Investment Grade Corporate Bonds
Appendices
APPENDIX 1: Details on ESG in Corporate Bond studies investigated: Overview: Studies examined
APPENDIX 2: Overview of Academic Literature review by the UN PRI
APPENDIX 3: Overview of studies examined: Credit Rating Agencies
24
ESG in Investment Grade Corporate Bonds
APPENDIX 1: Details on ESG in Corporate Bond studies investigated - Overview: Studies examined
Study Time
period
Region Data Methodology ESG
dimension
Level Result
AAttig et al., (2014) 1991-2010 US 1,585 publicly
listed US firmsCredit ratings: Regression of credit ratings on composite and individual CSR scores while controlling for size, EBIT, leverage and market beta
ESG Firm Positive
BBarclays, (2015) 2006-2015 US 4,366 US
corporate bondsBond Performance: Comparison of sustainable vs. traditional benchmark corporate bond indices; Performance attribution analysis; Historical correlation between ESG and credit ratings
ESG Portfolio Mixed
C Bauer & Hann, (2010)
1995-2006 US 2,242 corporate bonds
Cost of Debt: Regression of CoD on measures of environmental management and control variables E Bond Positive
DCheng et al., (2014) 2002-2009 World 2,439 publicly
listed firmsCapital Constraint Index: Panel data regression; two-stage efficient Generalized Method of Moments (GMM) estimation; three-stage least squares simultaneous equations
ESG Firm Positive
EDerwall & Koedijk, (2009)
1987 – 2003 US 15 SRI bond & 9 SRI balanced funds
Performance: Four-factor model/ Fama-Macbeth regressions SRI Portfolio Neutral
F Deutsche Bank, (2012)
Various Various Various Cost of Debt: Meta-Study ESG Bond Positive
G Flammer, (2013) 1997-2012 US 2,793 CSR proposals
Shareholder Proposals: Regression Discontinuity framework ESG Firm Positive
HHenke, (2016) 2001-2014 US & EU 412 funds (thereof
103 SRI)Performance: Five-factor-regression model with an ESG screening-related return factor during distinct market regimes; Multi-univariate time-series regression performance attribution
ESG Portfolio Positive
ILeite & Céu Cortez, (2016)
2002 - 2014 France, German, UK
63 SRI funds Performance: Four-Factor performance attribution analysis E Portfolio Positive
JMenz, (2010) 2004-2007 EU 498 bonds Bond Yield: Pooled Ordinary least squares, fixed-effects
and random effects model regression of the yield spread on CSR measures
E Bond Negative
KNewton Investment Management, (2016)
2004-2015 US 1,283 bonds Performance: Comparison of constructed SRI vs. non-SRI portfolios SRI Portfolio Neutral
LOikonomou et al., (2012)
1992-2009 US S&P 500 companies; 9,000 observations
Market risk: Fixed-effects regression of alternative risk/ investor utility on individual/ aggregate CSP components and control variables; distinct analyses for low and high volatility periods
E&S Firm Positive
MOikonomou et al., 2014)
1992-2008 US 3,240 bond issues by 742 firms
Spread & Issuer rating: Clustered panel data regression analysis: Three factor model (credit spread, issuer rating and speculative credit rating) on CSR-score, firm and bond characteristics
E&S Bond Positive
NStellner et al., (2015) 2006-2012 EU 872 corporate
bondsSpread & Issuer rating: Ordered logistic panel regression analysis: Z-spread/credit ratings on ESG rating, company and industry-level specific control variables and sovereign ESG performance
ESG Bond Positive
OSwitzer & Wang, (2013)
2001-2010 US 228 banks Governance: OLS Regression of default probability on firm level controls and various governance proxy variables
G Firm (Banks) Positive
P UN PRI, (2012) 1990-2007 Various 15 academic studies
Cost of debt: Academic literature review by the UN PRI FI working group ESG Firm Positive
QUN PRI, (2013) 1990-2013 Various UN PRI academic
literature review; expert opinions
Materiality: Meta-study of fifteen studiesESG Firm Positive
The overview illustrates the research studies we examined during our analysis of ESG materiality in Corporate Bonds. Details on selected studies are provided on the following pages. In total, 18 selected core studies including one meta study comprising of 24 relevant studies with focus on ESG, credit risk and corporate bonds were analyzed.

25
ESG in Investment Grade Corporate Bonds
Details of selected studies investigated
A. Attig et al., 2014
Corporate social responsibility and credit ratings 28
Period 1991 - 2010
Scope 1,585 publicly listed firms
Region US
Key issue Credit ratings
MethodRegression of Credit Ratings on composite and individual CSR scores while controlling for size, EBIT, leverage and market beta
Approach:Attig et al. argue that CSR activities can increase a firm’s credit rating by reducing the firm’s perceived risk of financial distress through at least one of the following three channels:
1. By improving relations with firm stakeholders and in turn increasing the firm’s long-term sustainability
2. By signaling the firm’s efficient use of internal resources and sound financial performance
3. By reducing the firm’s likelihood of incurring the costs associated with socially irresponsible behavior
Key findings:
• Credit rating agencies tend to award higher ratings to firms with good social performance
• CSR strengths and concerns influence credit ratings especially the individual components of CSR that relate to primary stakeholder management and are socially desired, e.g. employee relations, diversity issues, product issues, community relations and environmental issues
• CSR performance translates important non-financial information
Strengths: Pollution prevention; Recycling; Clean energy; Property, plant, and equipment
Concerns: Regulatory problems; Substantial emissions; Agricultural chemicals
EEnvironmental
Strengths: Charitable giving; Support for housing and education; Volunteer programs; Work-life-benefits; Union relations; Employee involvement; Gender equality
Concerns: Health & safety concerns; Labor right violations; Human rights controversies
SSocial
Chart 8. Corporate social responsibility and credit ratings (Attig et al., 2013) 28
28 Allianz Global Investors based on Attig et al., (2013) Corporate Social Responsibility and Credit Ratings. Fossil fuel extended: Fossil fuel core + coal, oil & gas services.
26
ESG in Investment Grade Corporate Bonds
B. Barclays, 2015
ESG ratings and performance of corporate bonds
Period 2006-2015
Scope 4,366 corporate bonds
Region US
Key issue Bond Performance
Method
Comparison of sustainable vs. traditional benchmark corporate bond indices; Performance attribution analysis; Historical correlation between ESG and credit ratings
Background:• Launch of new ESG/SRI fixed income indices to incorporate
ESG considerations in benchmark designs: The Barclays MSCI ESG fixed income indices
• Increasing investor demand for research on ESG in fixed income
29Allianz Global Investors based on Barclays (2015) “ESG ratings and performance of Corporate Bonds”.Note: Estimated spread premia of rating and sector dummies are not reported in this table although they are included in the R-squared.
Investigation of ESG impact on the financial performance of Investment Grade Corporate Bonds
Spreads:
Approach: Barclays regresses the credit spread of the Barclays MSCI ESG/ SRI Indices on ESG scores or SRI dummy and control variables, such as spread duration, bond rating and industry sector dummy variables.
Barclays seeks to test two hypotheses concerning ESG in corporate fixed income:
• High ESG higher spread (ESG faces a high demand and is more expensive)
• High ESG lower spread (ESG risk incorporation leads to lower risks)
Table 14. Estimated ESG/SRI spread premia (Barclays 2015) 29
SRI ESG Environment Social Governance Combined
Coeff T-stat Coeff T-stat Coeff T-stat Coeff T-stat Coeff T-stat Coeff T-stat
30 September 2015
SRI (bps/m) 11.3 1.80
ESG score (bps per std) -2.3 -1.34
Env score (bps per std) -1.5 -0.84 -1.7 -0.99
Soc score (bps per std) 1.4 0.83 1.6 0.95
Gov score (bps per std) -2.5 -1.53 -2.7 -1.61
R-squared 60% 60% 60% 60% 60% 60%
Averages from January 2007 to September 2015
SRI (bps/m) 11.7 11.75
ESG score (bps per std) -2.8 -8.41
Env score (bps per std) -2.1 -6.37 -1.7 -4.23
Soc score (bps per std) -2.0 -7.51 -1.2 -3.80
Gov score (bps per std) -4.3 -10.39 -2.7 -4.76
R-squared 56% 56% 56% 56% 56% 56%

27
ESG in Investment Grade Corporate Bonds
30 Allianz Global Investors based on Barclays (2015) “ESG ratings and performance of Corporate Bonds”. Note: Estimated return premia of rating and sector dummies are not reported in this table although they are included in the R-squared.
Results: 1. The spread premium associated with the SRI strategy
(negative filter) is on average positive. SRI issuers tend to trade at higher spreads (positive SRI premium) than non-SRI issuers.
2. The average spread premium associated with ESG scores is negative i.e. spreads of issuers with high composite ESG scores have been on average 2.8bps lower than those of their peers.
3. All individual ESG factors have a negative effect on credit spread, governance has the largest coefficient of the three.
From an issuer perspective, Barclays (2015) finds that demonstrating high governance capabilities has been associated with a slightly lower cost of funding than Environment or Social credentials.
Their analysis suggests, that investors generally paid a small price premium and gave up spread income to buy bonds of sustainable companies with high ESG scores. ESG scores seem to have had only a marginal effect on credit valuation.
Table 15. Estimated ESG/SRI return premia (Barclays 2015) 30
SRI ESG Environment Social Governance Combined
Coeff T-stat Coeff T-stat Coeff T-stat Coeff T-stat Coeff T-stat Coeff T-stat
Averages from January 2007 to September 2015
SRI (bps/m) -4.8 -1.53
ESG score (bps per std) 2.1 2.65
Env score (bps per std) 2.0 2.12 1.3 0.98
Soc score (bps per std) 1.9 2.85 1.7 1.46
Gov score (bps per std) 1.4 2.01 -0.3 -0.23
Average R-squared 23.6% 28.4% 28.0% 27.8% 27.9% 28.5%
Return premium:
Approach: Regress monthly realized excess return (over duration-matched Treasuries) of individual bond issuers on their normalized ESG score controlling for credit spread, duration and DTS by sector. Consequently, attributed returns are averaged over the whole time period.
Results: 1. Negative average return for SRI (-4.8bps/m), although this is not
statistically significant and the evidence appears weak
2. Positive return premium attributed to ESG scores 2.1bps/month (per standard deviation increase in ESG score)
Including sectors in the regression shows: There are positive return premia for all of the sectors.
28
ESG in Investment Grade Corporate Bonds
31 Barclays research (2015) “ESG ratings and performance of Corporate Bonds”.
Practical application – simulating ESG portfolios:
Approach: Barclays constructed high and low ESG-rated portfolios that match the Barclays US Corporate index and measure their tracking error over time. The portfolios have to match in multiple risk dimensions (same average spread, duration, DTS, average liquidity) and various allocation constraints (maturity, industry sectors) in order to deliver conclusive results.
Results: Composite ESG portfolio: The high ESG portfolio outperforms the index over the entire period and by 3.0bps/m since January 2010. The cumulative outperformance amounts to 250bps over the sample period.
Individual E, S & G portfolios: Governance emerges as the largest performance driver of the three factors with the portfolio scoring high on governance cumulatively outperforming its lower rated peer with nearly 500bps over time. The returns on environmental and social factors are smaller in magnitude.
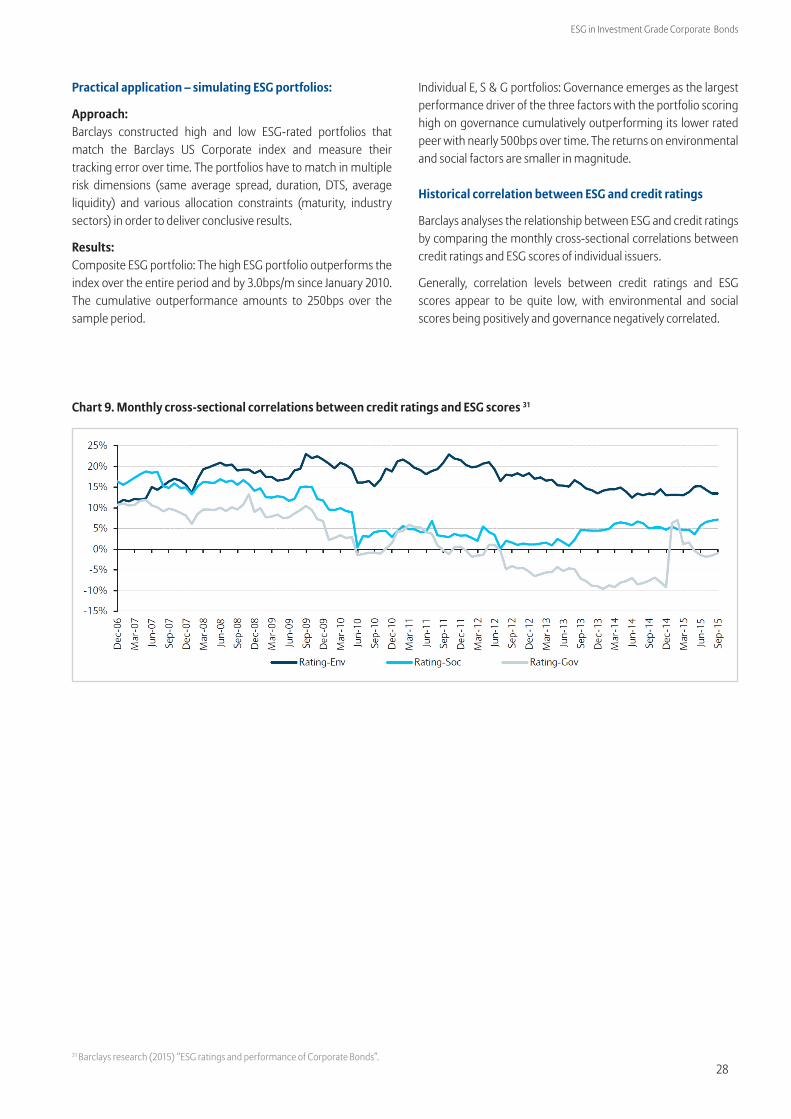
Historical correlation between ESG and credit ratings
Barclays analyses the relationship between ESG and credit ratings by comparing the monthly cross-sectional correlations between credit ratings and ESG scores of individual issuers.
Generally, correlation levels between credit ratings and ESG scores appear to be quite low, with environmental and social scores being positively and governance negatively correlated.
Chart 9. Monthly cross-sectional correlations between credit ratings and ESG scores 31

29
ESG in Investment Grade Corporate Bonds
C. Bauer & Hann, 2011
Corporate environmental management and credit risk 32
Period 1995-2006
Scope 2,242 corporate bonds
Region US
Key issue Cost of debt
MethodRegression of cost of debt on measures of environmental management performance and control variables
Framework:Bauer & Hann investigate the credit risk implications of corporate environmental management for bond investors. Their conceptual framework is based on the view that environmental practices influence the solvency of borrowing firms by determining their exposure to legal, reputational, and regulatory risks. Firms that engage in environmental misconduct can incur costly penalties and evoke strong negative reactions from both financial and non-financial stakeholder, all of which affect default risk and thus impair the value of their fixed income securities. Bauer & Hann create aggregate measures for environmental strengths and concerns of firms, and test their relation with the yield spread of newly issued bonds, bond ratings, and long-term issuer ratings.
32 Allianz Global Investors based on Bauer & Hann (2010) “Corporate environmental management and credit risk”.
Results:Their findings suggest that
1. Environmental concerns are associated with a higher cost of debt;
2. Proactive environmental practices are associated with a lower cost of debt;
3. A maximum environmental performance effect on the cost of debt amounts up to 53bps p.a.;
4. The impact of environmental management is not consistently higher for firms in high risk industries, but rather propose that it is necessary to account for heterogeneity across these industries;
5. The supply of innovative products and services with environmental benefits, and the firm’s efforts to reduce its impact on climate change and air pollution through the use of clean energy, energy efficiency, or its commitment to climate-friendly policies and practices, are associated with lower bond spreads; and
6. The relevance of environmental management concerns for bond investors has increased over the recent decade, corresponding with the view that widespread climate change concerns have heightened investors’ awareness of potential regulatory changes and other associated financial risks.
Chart 10. Environmental strengths (Bauer and Hann 2010) 32
Environmental strength
Beneficial products and services The company derives substantial revenues from innovative remediation products, environmental services, or products with environmental benefits.
Pollution prevention The company has notably strong pollution prevention programs including both emissions reductions and toxic-use reduction programs.
Recycling The company either is a substantial user of recycled materials as raw materials in its manufacturing processes, or a major factor in the recycling industry.
Clean energy
The company has taken significant measures to reduce its impact on climate change and air pollution through use of renewable energy and clean fuels or through energy efficiency. The company has demonstrated a commitment to promoting climate friendly policies and practices outside its own operations.
Other strengthThe company has demonstrated a superior commitment to management systems, voluntary programs, or other environmentally proactive activities.
30
ESG in Investment Grade Corporate Bonds
33 Allianz Global Investors based on Bauer & Hann (2010) “Corporate environmental management and credit risk”.
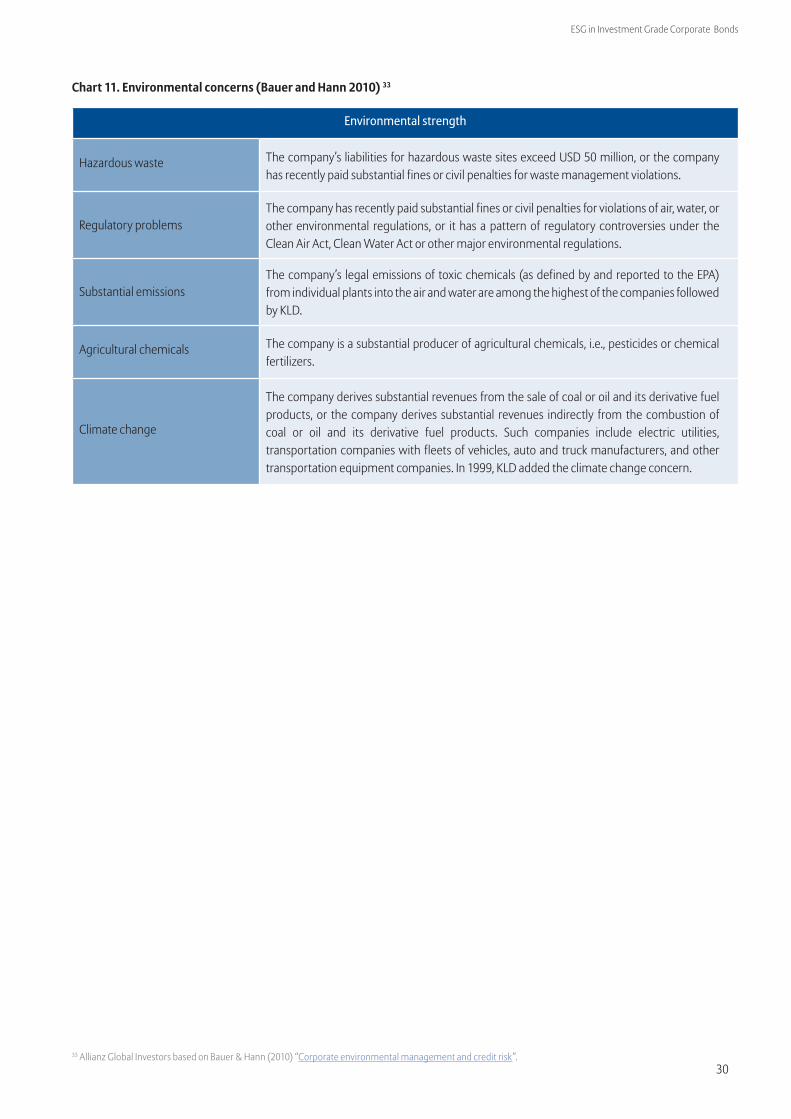
Chart 11. Environmental concerns (Bauer and Hann 2010) 33
Environmental strength
Hazardous waste The company’s liabilities for hazardous waste sites exceed USD 50 million, or the company has recently paid substantial fines or civil penalties for waste management violations.
Regulatory problemsThe company has recently paid substantial fines or civil penalties for violations of air, water, or other environmental regulations, or it has a pattern of regulatory controversies under the Clean Air Act, Clean Water Act or other major environmental regulations.
Substantial emissionsThe company’s legal emissions of toxic chemicals (as defined by and reported to the EPA) from individual plants into the air and water are among the highest of the companies followed by KLD.
Agricultural chemicals The company is a substantial producer of agricultural chemicals, i.e., pesticides or chemical fertilizers.
Climate change
The company derives substantial revenues from the sale of coal or oil and its derivative fuel products, or the company derives substantial revenues indirectly from the combustion of coal or oil and its derivative fuel products. Such companies include electric utilities, transportation companies with fleets of vehicles, auto and truck manufacturers, and other transportation equipment companies. In 1999, KLD added the climate change concern.
31
ESG in Investment Grade Corporate Bonds
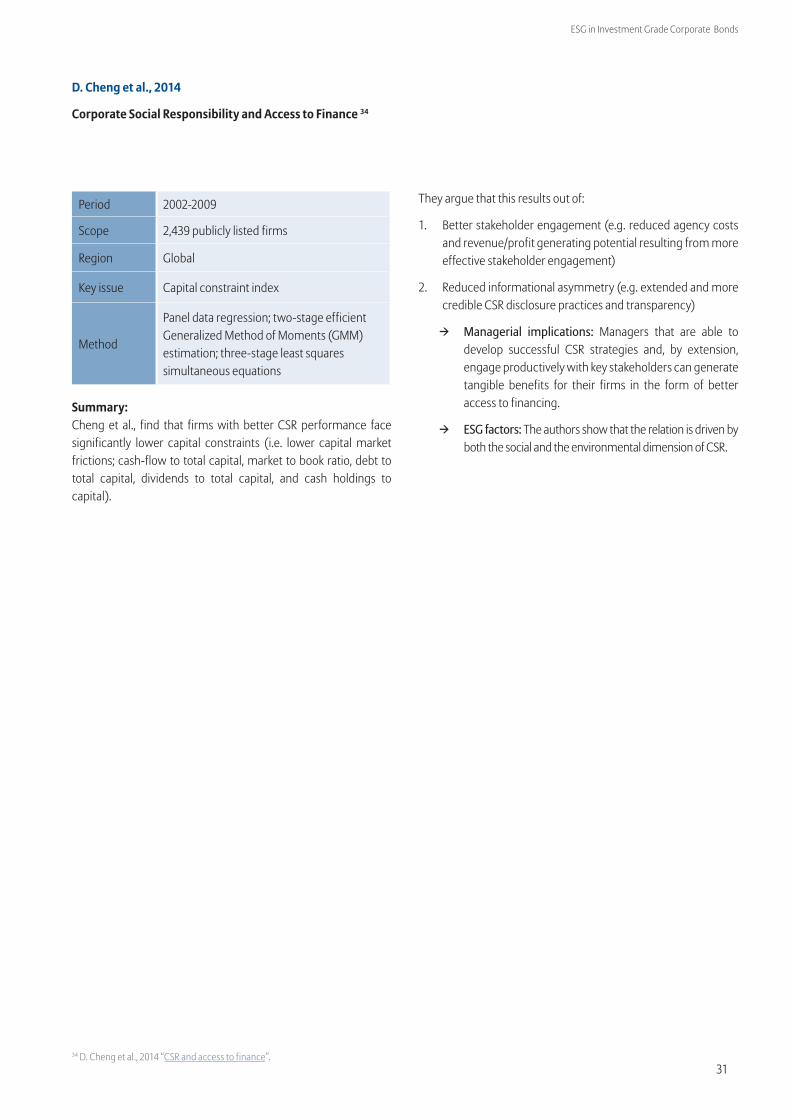
D. Cheng et al., 2014
Corporate Social Responsibility and Access to Finance 34
Period 2002-2009
Scope 2,439 publicly listed firms
Region Global
Key issue Capital constraint index
Method
Panel data regression; two-stage efficient Generalized Method of Moments (GMM) estimation; three-stage least squares simultaneous equations
Summary:Cheng et al., find that firms with better CSR performance face significantly lower capital constraints (i.e. lower capital market frictions; cash-flow to total capital, market to book ratio, debt to total capital, dividends to total capital, and cash holdings to capital).
They argue that this results out of:
1. Better stakeholder engagement (e.g. reduced agency costs and revenue/profit generating potential resulting from more effective stakeholder engagement)
2. Reduced informational asymmetry (e.g. extended and more credible CSR disclosure practices and transparency)
→ Managerial implications: Managers that are able to develop successful CSR strategies and, by extension, engage productively with key stakeholders can generate tangible benefits for their firms in the form of better access to financing.
→ ESG factors: The authors show that the relation is driven by both the social and the environmental dimension of CSR.
34 D. Cheng et al., 2014 “CSR and access to finance”.
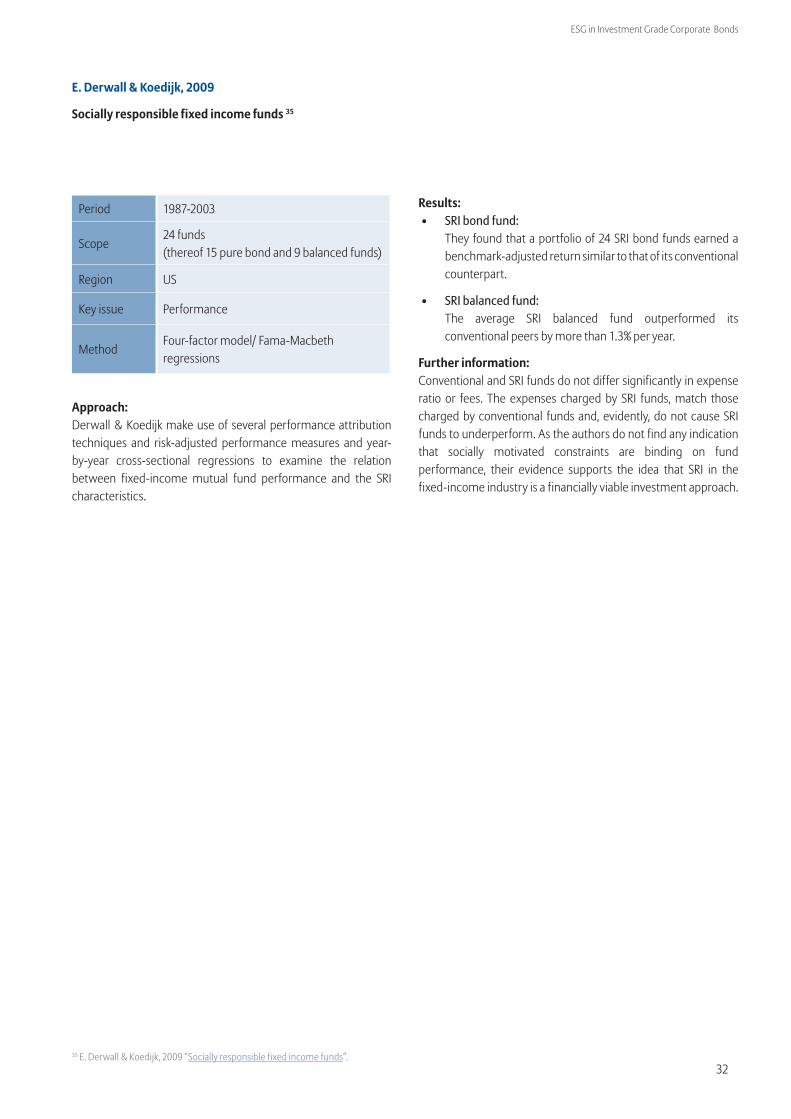
32
ESG in Investment Grade Corporate Bonds
E. Derwall & Koedijk, 2009
Socially responsible fixed income funds 35
Period 1987-2003
Scope24 funds (thereof 15 pure bond and 9 balanced funds)
Region US
Key issue Performance
MethodFour-factor model/ Fama-Macbeth regressions
Approach:Derwall & Koedijk make use of several performance attribution techniques and risk-adjusted performance measures and year-by-year cross-sectional regressions to examine the relation between fixed-income mutual fund performance and the SRI characteristics.
Results: • SRI bond fund:
They found that a portfolio of 24 SRI bond funds earned a benchmark-adjusted return similar to that of its conventional counterpart.
• SRI balanced fund: The average SRI balanced fund outperformed its conventional peers by more than 1.3% per year.
Further information:Conventional and SRI funds do not differ significantly in expense ratio or fees. The expenses charged by SRI funds, match those charged by conventional funds and, evidently, do not cause SRI funds to underperform. As the authors do not find any indication that socially motivated constraints are binding on fund performance, their evidence supports the idea that SRI in the fixed-income industry is a financially viable investment approach.
35 E. Derwall & Koedijk, 2009 “Socially responsible fixed income funds”.
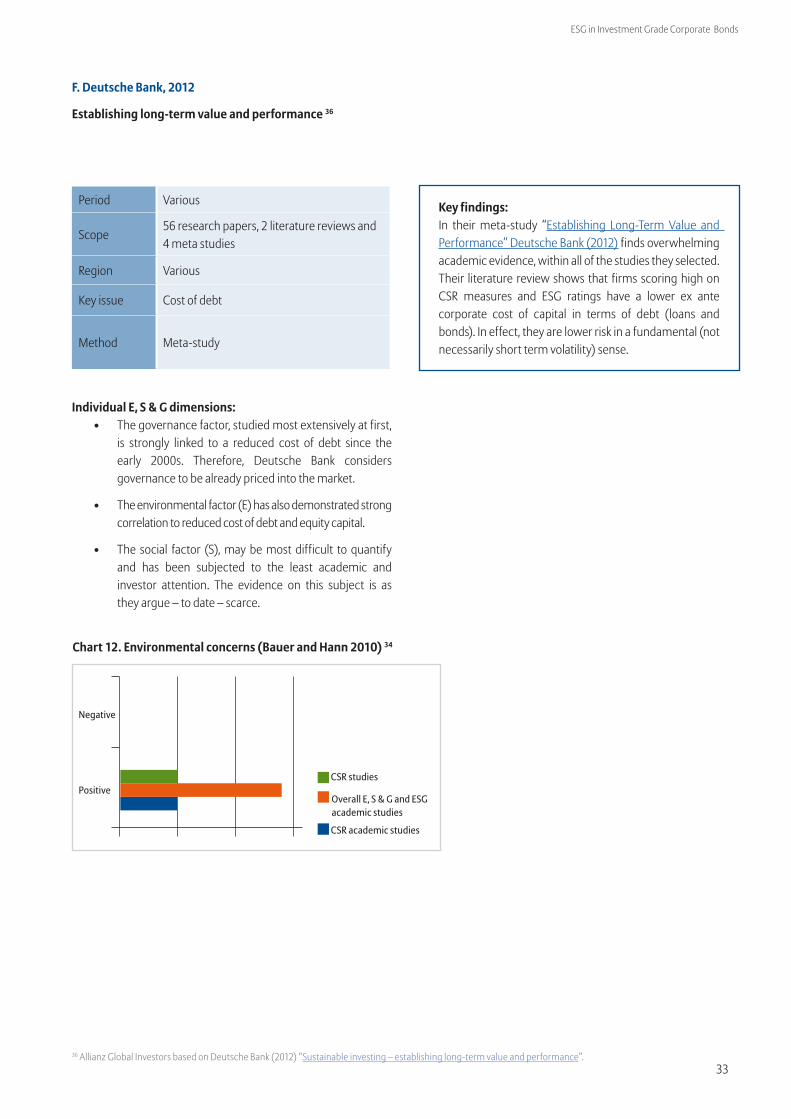
33
ESG in Investment Grade Corporate Bonds
F. Deutsche Bank, 2012
Establishing long-term value and performance 36
Period Various
Scope56 research papers, 2 literature reviews and 4 meta studies
Region Various
Key issue Cost of debt
Method Meta-study
36 Allianz Global Investors based on Deutsche Bank (2012) “Sustainable investing – establishing long-term value and performance”.
Individual E, S & G dimensions:• The governance factor, studied most extensively at first,
is strongly linked to a reduced cost of debt since the early 2000s. Therefore, Deutsche Bank considers governance to be already priced into the market.
• The environmental factor (E) has also demonstrated strong correlation to reduced cost of debt and equity capital.
• The social factor (S), may be most difficult to quantify and has been subjected to the least academic and investor attention. The evidence on this subject is as they argue – to date – scarce.
Negative
PositiveCSR studies
CSR academic studies
Overall E, S & G and ESG academic studies
Chart 12. Environmental concerns (Bauer and Hann 2010) 34
Key findings:In their meta-study “Establishing Long-Term Value and Performance” Deutsche Bank (2012) finds overwhelming academic evidence, within all of the studies they selected. Their literature review shows that firms scoring high on CSR measures and ESG ratings have a lower ex ante corporate cost of capital in terms of debt (loans and bonds). In effect, they are lower risk in a fundamental (not necessarily short term volatility) sense.
34
ESG in Investment Grade Corporate Bonds
G. Flammer, 2013
Does corporate social responsibility lead to superior financial performance? 37
Period 1997-2012
Scope2,973 Environmental-/socially themed shareholder proposals
Region US
Key issue Shareholder proposals
Method Regression continuity framework
Approach:G. Flammer, 2013 Corporate Social Responsibility activities are likely to correlate with unobservable firm characteristics that also may affect CFP. For instance, it could be the case that more profitable companies engage in CSR activities or that a company promises itself higher earnings because of its newly adopted CSR policies. The previously found positive correlation between CSR and CFP is interesting, albeit it does not warrant a causal interpretation. From an empirical perspective it would be interesting to have a random variation in companies engaging in CSR activities. Flammer uses CSR-related shareholder proposals that pass or fail by a small margin of votes as a random assignment (i.e. a quasi-natural experiment with exogenous variation) of CSR to companies and hence can provide a clean causal estimate in her study.
Results: • The adoption of CSR proposals leads to positive
announcement returns and superior accounting performance (abnormal returns of 0.92% and shareholder returns of 1.77%).
• This positive return is driven by an increase in labor productivity and sales growth.
• Value gains are stronger for companies operating in industries with higher institutional norms of CSR (i.e. “clean” industries). Arguably, stakeholders in these industries are more responsive to companies’ social engagement, which translates in higher payoffs of CSR initiatives, again translating into higher returns.
37 G. Flammer, 2013 “Does corporate social responsibility lead to superior financial performance”.
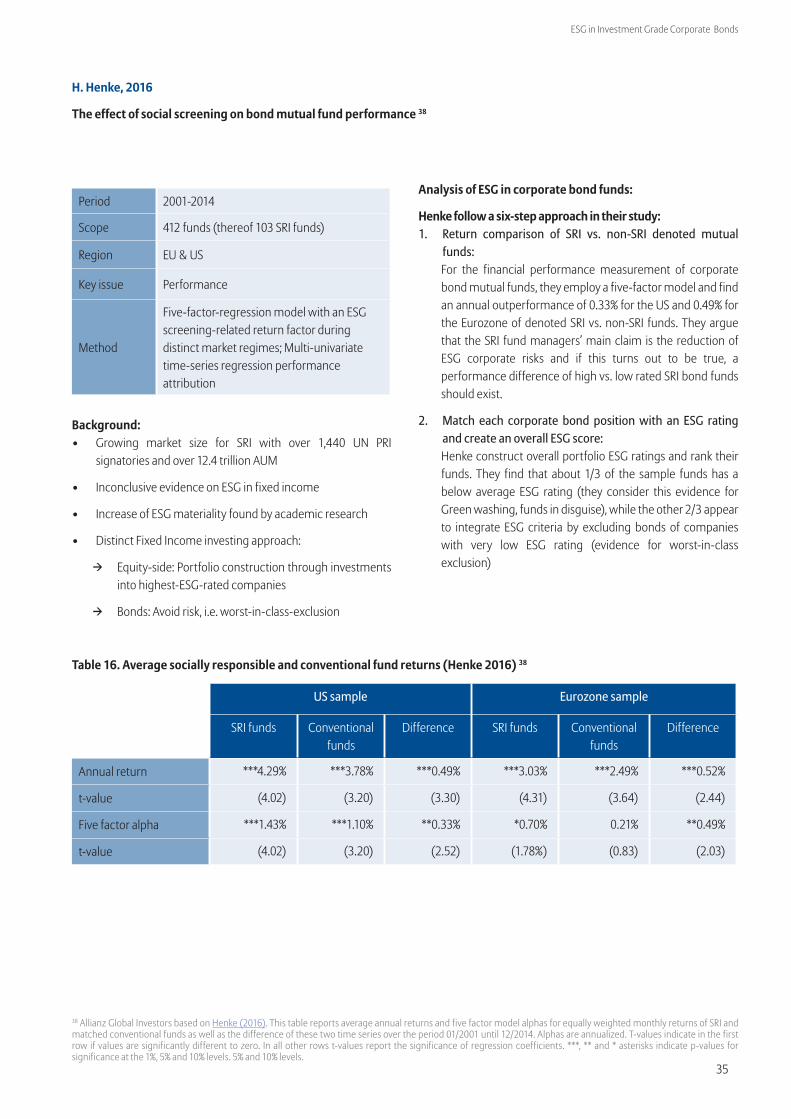
35
ESG in Investment Grade Corporate Bonds
H. Henke, 2016
The effect of social screening on bond mutual fund performance 38
Period 2001-2014
Scope 412 funds (thereof 103 SRI funds)
Region EU & US
Key issue Performance
Method
Five-factor-regression model with an ESG screening-related return factor during distinct market regimes; Multi-univariate time-series regression performance attribution
Background:• Growing market size for SRI with over 1,440 UN PRI
signatories and over 12.4 trillion AUM
• Inconclusive evidence on ESG in fixed income
• Increase of ESG materiality found by academic research
• Distinct Fixed Income investing approach:
→ Equity-side: Portfolio construction through investments into highest-ESG-rated companies
→ Bonds: Avoid risk, i.e. worst-in-class-exclusion
Analysis of ESG in corporate bond funds:
Henke follow a six-step approach in their study:1. Return comparison of SRI vs. non-SRI denoted mutual
funds: For the financial performance measurement of corporate bond mutual funds, they employ a five-factor model and find an annual outperformance of 0.33% for the US and 0.49% for the Eurozone of denoted SRI vs. non-SRI funds. They argue that the SRI fund managers’ main claim is the reduction of ESG corporate risks and if this turns out to be true, a performance difference of high vs. low rated SRI bond funds should exist.
2. Match each corporate bond position with an ESG rating and create an overall ESG score:Henke construct overall portfolio ESG ratings and rank their funds. They find that about 1/3 of the sample funds has a below average ESG rating (they consider this evidence for Green washing, funds in disguise), while the other 2/3 appear to integrate ESG criteria by excluding bonds of companies with very low ESG rating (evidence for worst-in-class exclusion)
Table 16. Average socially responsible and conventional fund returns (Henke 2016) 38
US sample Eurozone sample
SRI funds Conventional funds
Difference SRI funds Conventional funds
Difference
Annual return ***4.29% ***3.78% ***0.49% ***3.03% ***2.49% ***0.52%
t-value (4.02) (3.20) (3.30) (4.31) (3.64) (2.44)
Five factor alpha ***1.43% ***1.10% **0.33% *0.70% 0.21% **0.49%
t-value (4.02) (3.20) (2.52) (1.78%) (0.83) (2.03)
38 Allianz Global Investors based on Henke (2016). This table reports average annual returns and five factor model alphas for equally weighted monthly returns of SRI and matched conventional funds as well as the difference of these two time series over the period 01/2001 until 12/2014. Alphas are annualized. T-values indicate in the first row if values are significantly different to zero. In all other rows t-values report the significance of regression coefficients. ***, ** and * asterisks indicate p-values for significance at the 1%, 5% and 10% levels. 5% and 10% levels.
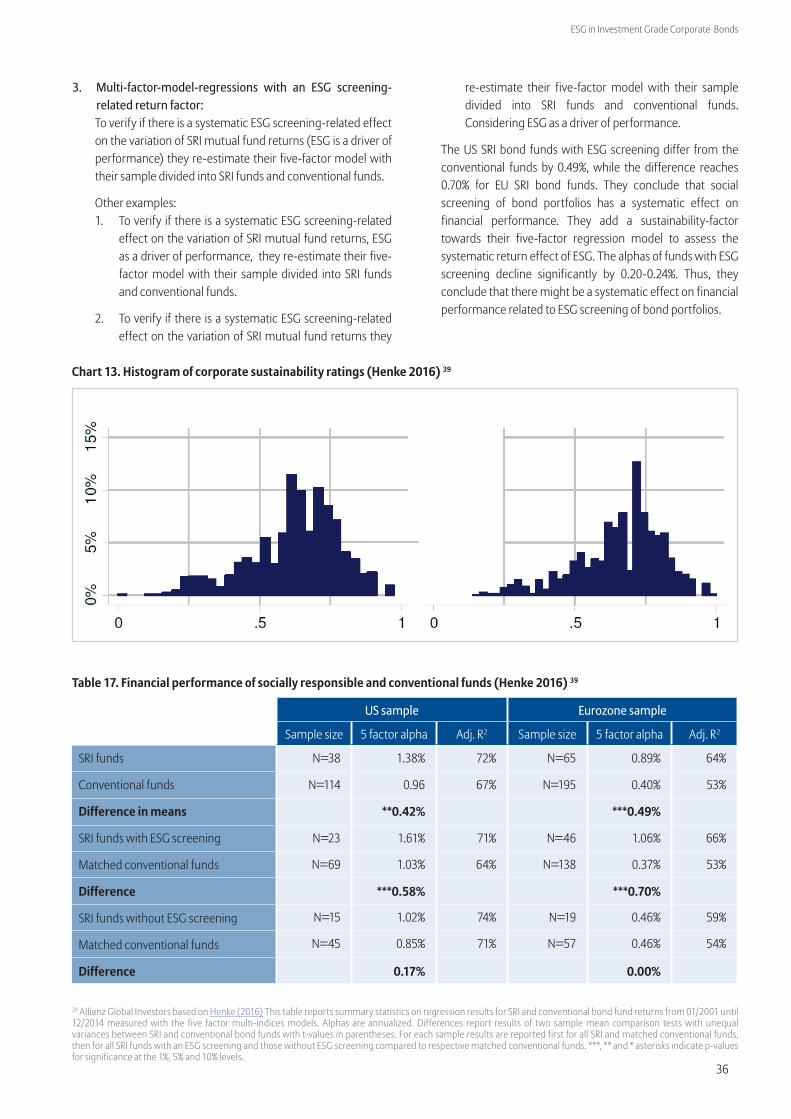
36
ESG in Investment Grade Corporate Bonds
3. Multi-factor-model-regressions with an ESG screening-related return factor:To verify if there is a systematic ESG screening-related effect on the variation of SRI mutual fund returns (ESG is a driver of performance) they re-estimate their five-factor model with their sample divided into SRI funds and conventional funds.
Other examples:1. To verify if there is a systematic ESG screening-related
effect on the variation of SRI mutual fund returns, ESG as a driver of performance, they re-estimate their five-factor model with their sample divided into SRI funds and conventional funds.
2. To verify if there is a systematic ESG screening-related effect on the variation of SRI mutual fund returns they
39 Allianz Global Investors based on Henke (2016) This table reports summary statistics on regression results for SRI and conventional bond fund returns from 01/2001 until 12/2014 measured with the five factor multi-indices models. Alphas are annualized. Differences report results of two sample mean comparison tests with unequal variances between SRI and conventional bond funds with t-values in parentheses. For each sample results are reported first for all SRI and matched conventional funds, then for all SRI funds with an ESG screening and those without ESG screening compared to respective matched conventional funds. ***, ** and * asterisks indicate p-values for significance at the 1%, 5% and 10% levels.
Chart 13. Histogram of corporate sustainability ratings (Henke 2016) 39
re-estimate their five-factor model with their sample divided into SRI funds and conventional funds. Considering ESG as a driver of performance.
The US SRI bond funds with ESG screening differ from the conventional funds by 0.49%, while the difference reaches 0.70% for EU SRI bond funds. They conclude that social screening of bond portfolios has a systematic effect on financial performance. They add a sustainability-factor towards their five-factor regression model to assess the systematic return effect of ESG. The alphas of funds with ESG screening decline significantly by 0.20-0.24%. Thus, they conclude that there might be a systematic effect on financial performance related to ESG screening of bond portfolios.
Table 17. Financial performance of socially responsible and conventional funds (Henke 2016) 39
US sample Eurozone sample
Sample size 5 factor alpha Adj. R2 Sample size 5 factor alpha Adj. R2
SRI funds N=38 1.38% 72% N=65 0.89% 64%
Conventional funds N=114 0.96 67% N=195 0.40% 53%
Difference in means **0.42% ***0.49%
SRI funds with ESG screening N=23 1.61% 71% N=46 1.06% 66%
Matched conventional funds N=69 1.03% 64% N=138 0.37% 53%
Difference ***0.58% ***0.70%
SRI funds without ESG screening N=15 1.02% 74% N=19 0.46% 59%
Matched conventional funds N=45 0.85% 71% N=57 0.46% 54%
Difference 0.17% 0.00%

37
ESG in Investment Grade Corporate Bonds
4. ESG performance attribution analysis:
Making use of a performance-attribution analysis by running univariate time-series regressions for each fund on five different factor exposures, Henke (2016) investigate whether there is a systematic ESG screening-related effect on the variation of SRI fund returns. They find that an ESG factor premium explains on average 10.48% of SRI bond fund returns compared to 35.99% by market direction, 29.23% by asset allocation and 31.38% through active management. Thus, they conclude that the systematic return effect related to social screening of bond portfolios is both measurable and significant.
5. Market regime analysis:Henke test if the hypothesized risk-mitigating effect of ESG, which argues that companies with the highest ESG ratings are less exposed to certain risks, holds true for market regimes with either weak or more pronounced influences of risk factors. They divide their sample time period into crisis and non-crisis periods as well as bear and non-bear market periods40 and compare the risk-adjusted financial
40 Economic Recessions are based on classifications by the National Bureau of Economic Research lists for the US and for the Eurozone by the Business Cycling Dating Committee for the Europe Area of the Centre for Economic Policy is used. Recessions in the US comprise the burst of the dot-com bubble (12/2001 – 06/2003) and the financial crisis (12/2007 – 02/2009), for the EU the financial crisis (04/2008 – 06/2009) and the Eurozone sovereign debt crisis (10/2011 – 03/2013) are identified. Bear market periods for the US are based on the S&P 500 price return. First, the index dropped from 1.521 to 815 points by 41% from 09/2000 until 09/2002. The second and third drops happened from 11/2007 until 02/2009 and from May until September 2011 with index declines of 55% and 19.5%. The three bear markets for the Eurozone are based on the Eurostoxx 600 price index. The three periods with price returns of -52%, -60% and -24% are 09/2000 until 09/2002, 10/2007 until 04/2009 and 02/2011 until 11/2011.41 Allianz Global Investors based on Henke (2016). This table lists average & values of univariate regressions for each SRI bond fund over the period 01/2007 until 12/2014. Market, asset allocation specific and ESG benchmark returns are measured in excess of respective one month US or German government bond returns. The market factor in the upper half of the table consists of the excess return of US and Eurozone Barclays Aggregate Corporate Bond Indices and in the lower half of the table of the equally weighted conventional bond fund returns. Asset allocation specific return factors are either investment grade or high yield Barclays corporate bond indices minus the respective market factor. The return factor for the ESG screening effect are excess returns of the US and Eurozone Barclays MSCI Corporate Sustainability Indices over the respective asset allocation factor. Active management returns are generated for each fund as difference of fund returns to US and Eurozone Barclays MSCI Sustainability Indices returns. The interaction effect covers the residual between the other four R2 & values and 100%.
US sample Eurozone sample
Sample size Sample size
Market = Aggregate Bond Index 35.99% 46.53%
Asset allocation 29.23% 19.57%
ESG screening 10.48% 7.78%
t-value ***(3.72) ***(6.94)
Active management 31.38% 30.78%
Interaction effect -7.09% -5.10%
Total 100.00% 100.00%
Table 18. Performance attribution for SRI bond funds (Henke 2016) 41
performance of SRI and conventional funds in both recession and non-recession periods.
SRI corporate bond funds outperform their peers in all market regime constellations. This becomes more pronounced for SRI funds with ESG screening and during times of recession, when these funds significantly outperform their peers. Henke find strong SRI fund alphas during recessions and bear market periods.
6. Robustness checks:They perform various robustness checks to verify the validity of their findings. First, they examine if the ESG-driven outperformance is wrongly attributed and results out of fund manager skills by conducting a similar performance comparison analysis with the passively managed Barclays Corporate Bond Indices. Further, they test their previous findings on cross-sectional differences in fund characteristics, SRI differences over time, different SRI screening approaches and SRI label effects which all do not effectively change their results.

38
ESG in Investment Grade Corporate Bonds
US sample Eurozone sample
Recession periods N=38 months
Non-recession periods N=130
months
Recession periods N=33 months
Non-recession periods N=135
months
SRI funds 1.35% 0.41% 0.59% 0.18%
Conventional funds 0.61% 0.17% -0.17% 0.04%
Difference *0.74% 0.24% 0.77% 0.15%
SRI funds with ESG screening 1.72% 0.56% 0.72% 0.21%
Matched conventional funds 0.68% 0.28% 0.24% 0.09%
Difference *1.02% 0.27% *0.96% 0.12%
SRI funds without ESG screening 0.69% 0.28% -0.36% 0.05%
Matched conventional funds 0.51% 0.02% -0.17% -0.15%
Difference 0.18% *0.27% -0.21% 0.22%
Table 20. Socially responsible and conventional alphas for bear and non-bear market periods (Henke 2016) 42
42 Allianz Global Investors based on Henke (2016). This table provides regression results for equally weighted monthly returns of all SRI and all conventional bond funds over crisis and non-crisis periods during the period 01/2001 until 12/2014. The crisis periods cover bear market periods of 42 months for the US from 01/2001 until 09/2002, from 11/2007 until 02/2009 and from 05/2011 until 09/2011. For the Eurozone these periods are 50 months from 01/2001 until 10/2002, 11/2007 until 04/2009 and from 02/2011 until 11/2011. For each sample results are reported first for all SRI and conventional funds, then for all SRI funds with an ESG screening and those without ESG screening compared to respective matched conventional funds. Alphas are annualized. ***, ** and * asterisks indicate p-values for significance at the 1%, 5% and 10% levels.
Table 19. Socially responsible and conventional alphas for crisis and non-crisis periods (Henke 2016) 42
US sample Eurozone sample
Recession periods N=38 months
Non-recession periods N=130
months
Recession periods N=33 months
Non-recession periods N=135
months
SRI funds *+1.80% **0.92% ***2.04% 0.11%
Conventional funds 1.14% 0.60% 1.12% -0.07%
Difference *0.65% **0.32% *0.92% 0.18%
SRI funds with ESG screening ***2.26% ***1.20% ***2.06% 0.20%
Matched conventional funds 1.31% *0.70% 0.80% -0.04%
Difference *0.94% ***0.50% **1.25% 0.24%
SRI funds without ESG screening 0.77% *0.61% 1.26% -0.29%
Matched conventional funds 0.90% 0.42% 1.23% -0.24%
Difference -0.13% 0.19% 0.03% -0.05%
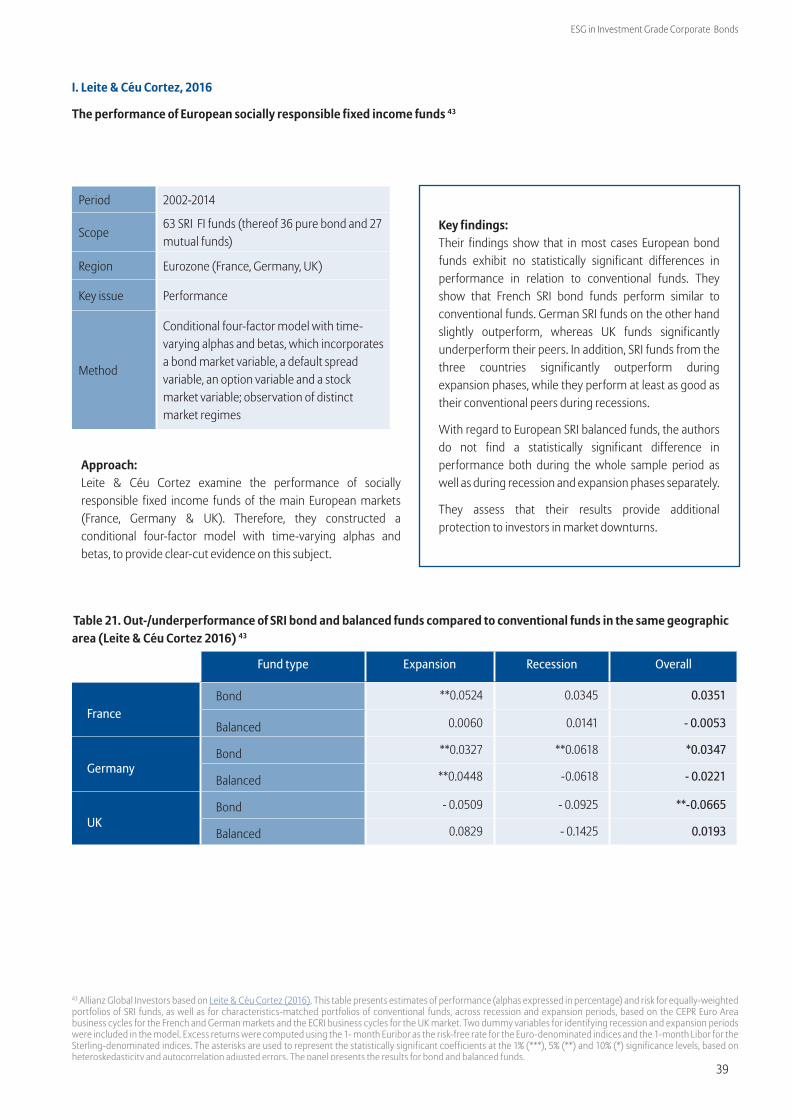
39
ESG in Investment Grade Corporate Bonds
I. Leite & Céu Cortez, 2016
The performance of European socially responsible fixed income funds 43
Period 2002-2014
Scope63 SRI FI funds (thereof 36 pure bond and 27 mutual funds)
Region Eurozone (France, Germany, UK)
Key issue Performance
Method
Conditional four-factor model with time-varying alphas and betas, which incorporates a bond market variable, a default spread variable, an option variable and a stock market variable; observation of distinct market regimes
Approach:Leite & Céu Cortez examine the performance of socially responsible fixed income funds of the main European markets (France, Germany & UK). Therefore, they constructed a conditional four-factor model with time-varying alphas and betas, to provide clear-cut evidence on this subject.
43 Allianz Global Investors based on Leite & Céu Cortez (2016). This table presents estimates of performance (alphas expressed in percentage) and risk for equally-weighted portfolios of SRI funds, as well as for characteristics-matched portfolios of conventional funds, across recession and expansion periods, based on the CEPR Euro Area business cycles for the French and German markets and the ECRI business cycles for the UK market. Two dummy variables for identifying recession and expansion periods were included in the model. Excess returns were computed using the 1- month Euribor as the risk-free rate for the Euro-denominated indices and the 1-month Libor for the Sterling-denominated indices. The asterisks are used to represent the statistically significant coefficients at the 1% (***), 5% (**) and 10% (*) significance levels, based on heteroskedasticity and autocorrelation adjusted errors. The panel presents the results for bond and balanced funds.
Key findings:Their findings show that in most cases European bond funds exhibit no statistically significant differences in performance in relation to conventional funds. They show that French SRI bond funds perform similar to conventional funds. German SRI funds on the other hand slightly outperform, whereas UK funds significantly underperform their peers. In addition, SRI funds from the three countries significantly outperform during expansion phases, while they perform at least as good as their conventional peers during recessions.
With regard to European SRI balanced funds, the authors do not find a statistically significant difference in performance both during the whole sample period as well as during recession and expansion phases separately.
They assess that their results provide additional protection to investors in market downturns.
Table 21. Out-/underperformance of SRI bond and balanced funds compared to conventional funds in the same geographic area (Leite & Céu Cortez 2016) 43
Fund type Expansion Recession Overall
FranceBond **0.0524 0.0345 0.0351
Balanced 0.0060 0.0141 - 0.0053
GermanyBond **0.0327 **0.0618 *0.0347
Balanced **0.0448 -0.0618 - 0.0221
UKBond - 0.0509 - 0.0925 **-0.0665
Balanced 0.0829 - 0.1425 0.0193
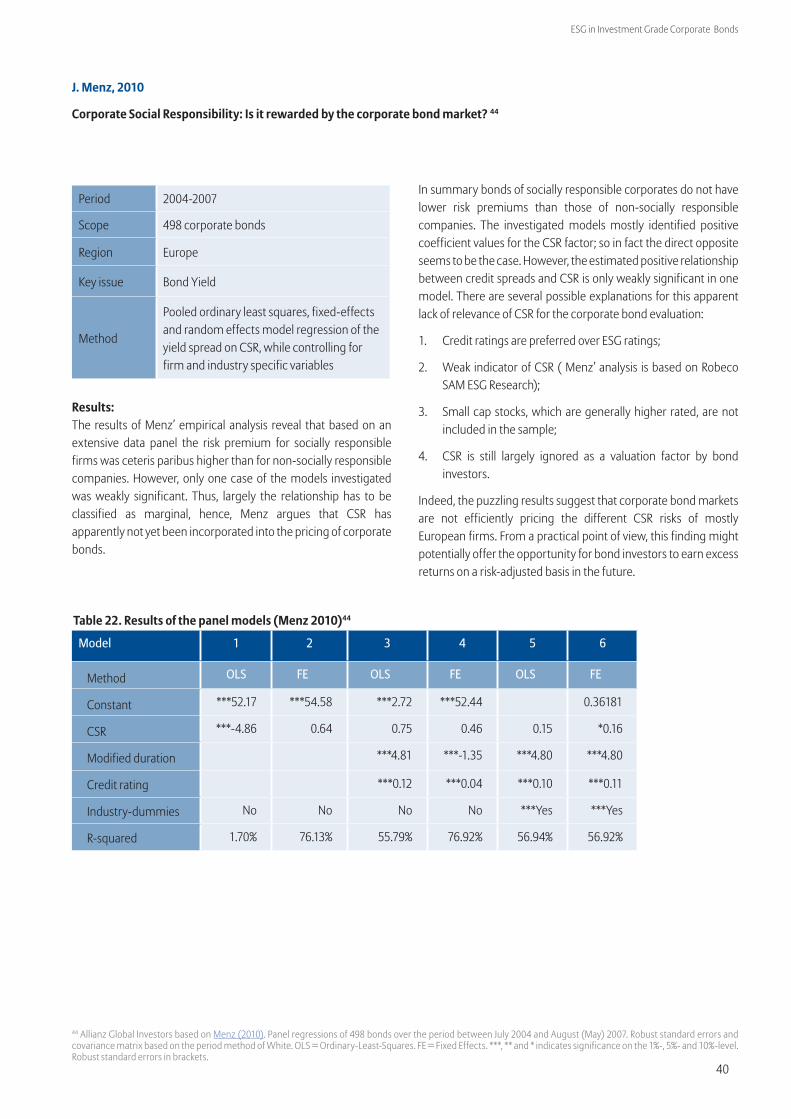
40
ESG in Investment Grade Corporate Bonds
J. Menz, 2010
Corporate Social Responsibility: Is it rewarded by the corporate bond market? 44
Period 2004-2007
Scope 498 corporate bonds
Region Europe
Key issue Bond Yield
Method
Pooled ordinary least squares, fixed-effects and random effects model regression of the yield spread on CSR, while controlling for firm and industry specific variables
Results:The results of Menz’ empirical analysis reveal that based on an extensive data panel the risk premium for socially responsible firms was ceteris paribus higher than for non-socially responsible companies. However, only one case of the models investigated was weakly significant. Thus, largely the relationship has to be classified as marginal, hence, Menz argues that CSR has apparently not yet been incorporated into the pricing of corporate bonds.
44 Allianz Global Investors based on Menz (2010). Panel regressions of 498 bonds over the period between July 2004 and August (May) 2007. Robust standard errors and covariance matrix based on the period method of White. OLS = Ordinary-Least-Squares. FE = Fixed Effects. ***, ** and * indicates significance on the 1%-, 5%- and 10%-level. Robust standard errors in brackets.
In summary bonds of socially responsible corporates do not have lower risk premiums than those of non-socially responsible companies. The investigated models mostly identified positive coefficient values for the CSR factor; so in fact the direct opposite seems to be the case. However, the estimated positive relationship between credit spreads and CSR is only weakly significant in one model. There are several possible explanations for this apparent lack of relevance of CSR for the corporate bond evaluation:
1. Credit ratings are preferred over ESG ratings;
2. Weak indicator of CSR ( Menz’ analysis is based on Robeco SAM ESG Research);
3. Small cap stocks, which are generally higher rated, are not included in the sample;
4. CSR is still largely ignored as a valuation factor by bond investors.
Indeed, the puzzling results suggest that corporate bond markets are not efficiently pricing the different CSR risks of mostly European firms. From a practical point of view, this finding might potentially offer the opportunity for bond investors to earn excess returns on a risk-adjusted basis in the future.
Model 1 2 3 4 5 6
Method OLS FE OLS FE OLS FE
Constant ***52.17 ***54.58 ***2.72 ***52.44 0.36181
CSR ***-4.86 0.64 0.75 0.46 0.15 *0.16
Modified duration ***4.81 ***-1.35 ***4.80 ***4.80
Credit rating ***0.12 ***0.04 ***0.10 ***0.11
Industry-dummies No No No No ***Yes ***Yes
R-squared 1.70% 76.13% 55.79% 76.92% 56.94% 56.92%
Table 22. Results of the panel models (Menz 2010)44
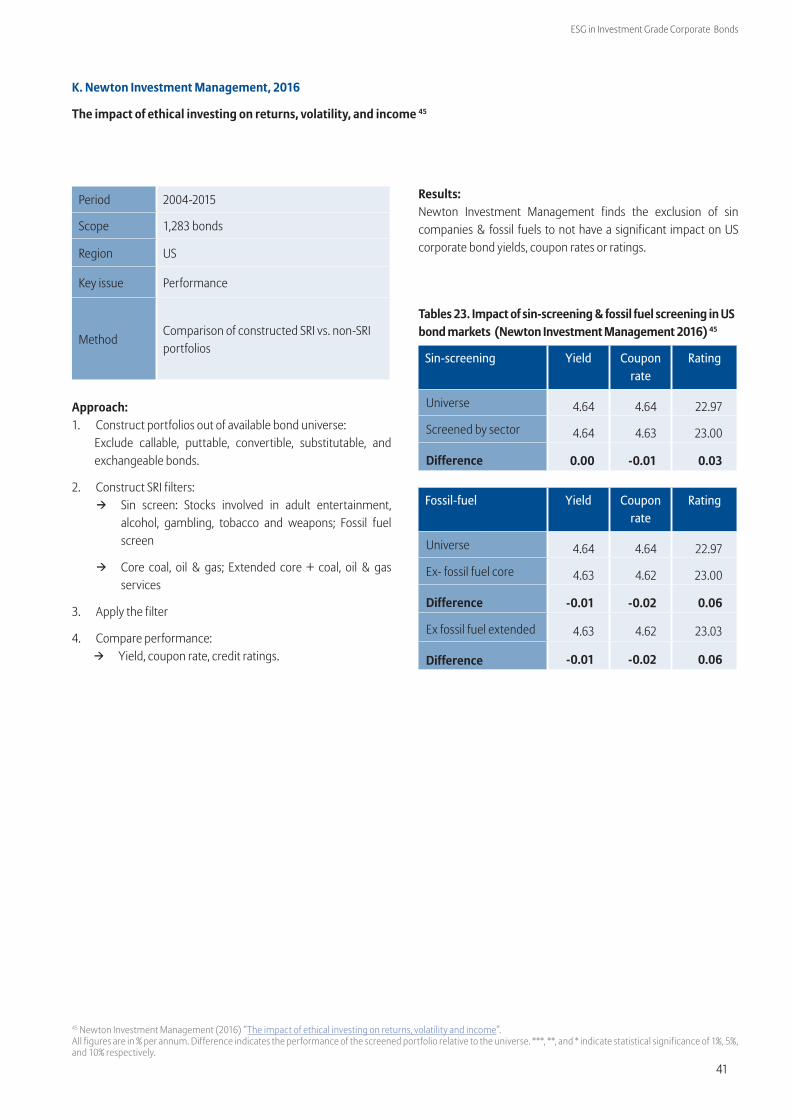
41
ESG in Investment Grade Corporate Bonds
K. Newton Investment Management, 2016
The impact of ethical investing on returns, volatility, and income 45
Period 2004-2015
Scope 1,283 bonds
Region US
Key issue Performance
MethodComparison of constructed SRI vs. non-SRI portfolios
Approach:1. Construct portfolios out of available bond universe:
Exclude callable, puttable, convertible, substitutable, and exchangeable bonds.
2. Construct SRI filters: → Sin screen: Stocks involved in adult entertainment,
alcohol, gambling, tobacco and weapons; Fossil fuel screen
→ Core coal, oil & gas; Extended core + coal, oil & gas services
3. Apply the filter
4. Compare performance: → Yield, coupon rate, credit ratings.
45 Newton Investment Management (2016) “The impact of ethical investing on returns, volatility and income”. All figures are in % per annum. Difference indicates the performance of the screened portfolio relative to the universe. ***, **, and * indicate statistical significance of 1%, 5%, and 10% respectively.
Results:Newton Investment Management finds the exclusion of sin companies & fossil fuels to not have a significant impact on US corporate bond yields, coupon rates or ratings.
Sin-screening Yield Coupon rate
Rating
Universe 4.64 4.64 22.97
Screened by sector 4.64 4.63 23.00
Difference 0.00 -0.01 0.03
Fossil-fuel Yield Coupon rate
Rating
Universe 4.64 4.64 22.97
Ex- fossil fuel core 4.63 4.62 23.00
Difference -0.01 -0.02 0.06
Ex fossil fuel extended 4.63 4.62 23.03
Difference -0.01 -0.02 0.06
Tables 23. Impact of sin-screening & fossil fuel screening in US bond markets (Newton Investment Management 2016) 45
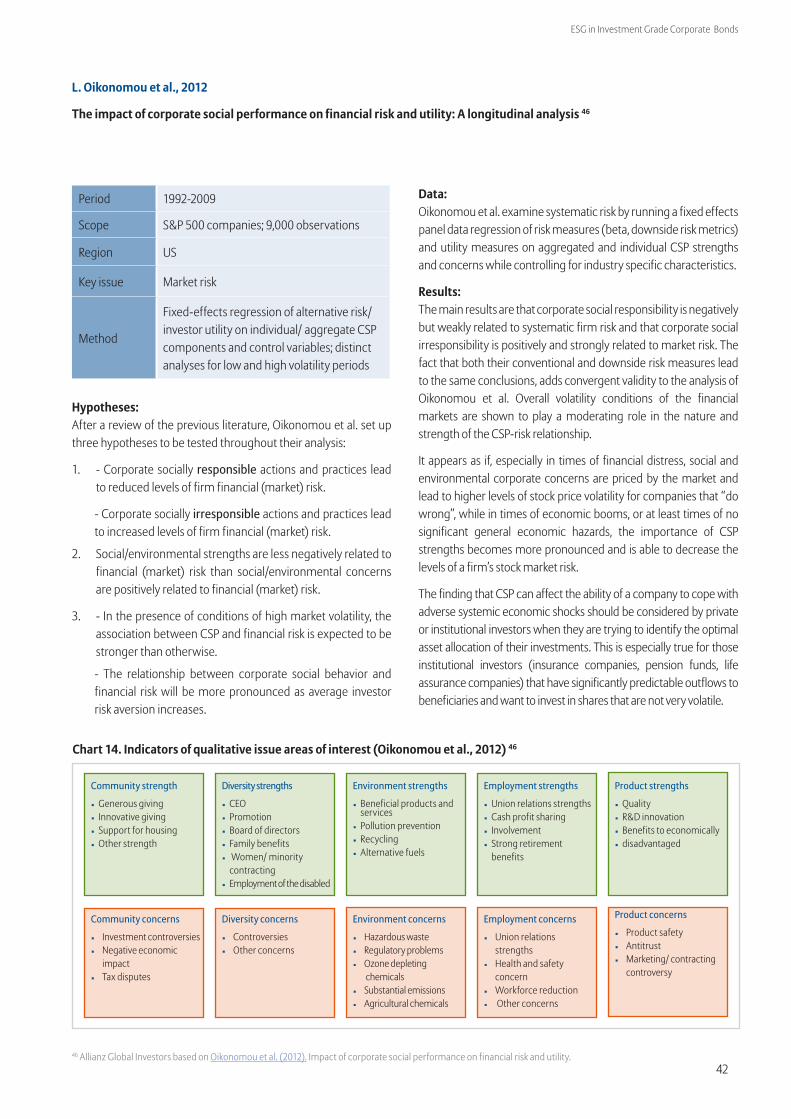
42
ESG in Investment Grade Corporate Bonds
L. Oikonomou et al., 2012
The impact of corporate social performance on financial risk and utility: A longitudinal analysis 46
Period 1992-2009
Scope S&P 500 companies; 9,000 observations
Region US
Key issue Market risk
Method
Fixed-effects regression of alternative risk/ investor utility on individual/ aggregate CSP components and control variables; distinct analyses for low and high volatility periods
Hypotheses:After a review of the previous literature, Oikonomou et al. set up three hypotheses to be tested throughout their analysis:
1. - Corporate socially responsible actions and practices lead to reduced levels of firm financial (market) risk.
- Corporate socially irresponsible actions and practices lead to increased levels of firm financial (market) risk.
2. Social/environmental strengths are less negatively related to financial (market) risk than social/environmental concerns are positively related to financial (market) risk.
3. - In the presence of conditions of high market volatility, the association between CSP and financial risk is expected to be stronger than otherwise.
- The relationship between corporate social behavior and financial risk will be more pronounced as average investor risk aversion increases.
Data:Oikonomou et al. examine systematic risk by running a fixed effects panel data regression of risk measures (beta, downside risk metrics) and utility measures on aggregated and individual CSP strengths and concerns while controlling for industry specific characteristics.
Results: The main results are that corporate social responsibility is negatively but weakly related to systematic firm risk and that corporate social irresponsibility is positively and strongly related to market risk. The fact that both their conventional and downside risk measures lead to the same conclusions, adds convergent validity to the analysis of Oikonomou et al. Overall volatility conditions of the financial markets are shown to play a moderating role in the nature and strength of the CSP-risk relationship.
It appears as if, especially in times of financial distress, social and environmental corporate concerns are priced by the market and lead to higher levels of stock price volatility for companies that “do wrong”, while in times of economic booms, or at least times of no significant general economic hazards, the importance of CSP strengths becomes more pronounced and is able to decrease the levels of a firm’s stock market risk.
The finding that CSP can affect the ability of a company to cope with adverse systemic economic shocks should be considered by private or institutional investors when they are trying to identify the optimal asset allocation of their investments. This is especially true for those institutional investors (insurance companies, pension funds, life assurance companies) that have significantly predictable outflows to beneficiaries and want to invest in shares that are not very volatile.
Chart 14. Indicators of qualitative issue areas of interest (Oikonomou et al., 2012) 46
Community strength
◾ Generous giving ◾ Innovative giving ◾ Support for housing ◾ Other strength
Diversity strengths
◾ CEO ◾ Promotion ◾ Board of directors ◾ Family benefits ◾ Women/ minority contracting
◾ Employment of the disabled
Environment strengths
◾ Beneficial products and services
◾ Pollution prevention ◾ Recycling ◾ Alternative fuels
Employment strengths
◾ Union relations strengths ◾ Cash profit sharing ◾ Involvement ◾ Strong retirement benefits
Product strengths
◾ Quality ◾ R&D innovation ◾ Benefits to economically ◾ disadvantaged
Community concerns
◾ Investment controversies ◾ Negative economic
impact ◾ Tax disputes
Diversity concerns
◾ Controversies ◾ Other concerns
Environment concerns
◾ Hazardous waste ◾ Regulatory problems ◾ Ozone depleting
chemicals ◾ Substantial emissions ◾ Agricultural chemicals
Employment concerns
◾ Union relations strengths
◾ Health and safety concern
◾ Workforce reduction ◾ Other concerns
Product concerns
◾ Product safety ◾ Antitrust ◾ Marketing/ contracting
controversy
46 Allianz Global Investors based on Oikonomou et al. (2012). Impact of corporate social performance on financial risk and utility.
43
ESG in Investment Grade Corporate Bonds
M. Oikonomou et al., 2014
The effects of corporate social performance on the cost of corporate debt and credit ratings 47
Period 1992-2008
Scope 3,240 bond issues by 742 firms
Region US
Key issue Spread & issuer rating
Method
Clustered panel data regression analysis: Three factor model (credit spread, issuer rating and speculative credit rating) on CSR-score, firm and bond characteristics
Research questions:1. Do firms with more social and environmental strengths
have lower credit spreads (i.e. lower cost of debt financing) and higher corporate bond credit ratings (i.e. lower default risk)?
2. Do firms with more social and environmental concerns have higher credit spreads (i.e. lower cost of debt financing) and lower corporate bond ratings (i.e. higher default risk)?
3. Is the risk-mitigating effect of CSP on corporate spreads more pronounced in bonds of longer maturities?
Method:1. Regression of credit spread on lagged CSP indicators, firm
and bond characteristics.
2. Ordered probit regression of credit rating on lagged CSP indicators, firm and bond characteristics.
3. Binary regression of the probability to be a high yield bond on lagged CSP, firm and bond characteristics.
Results:• Good CSR performance is rewarded and corporate social
transgressions are penalized through lower and higher corporate bond yield spreads, respectively.
• Similar conclusions can be drawn when focusing on either the bond rating assigned to a specific debt issue or the probability of it considered to be an asset of speculative (lower) grade. Strengths reduce the risk premia and thus decrease the cost of corporate debt.
• Intuitively, they find these relationships to be more noticeable for longer-term bonds than for their shorter-term peers.
Implications for managerial practices:A company’s social posture is relevant to the cost of debt financing and the credit quality of its bond issues.
Efficient, strategic management of the relationships between the corporation and specific stakeholder groups:
→ Cheaper funds from fixed income markets.
→ Avoid liquidity squeezes and possible viability issues.
47 M. Oikonomou et al., 2014 “The effects of corporate social performance on the cost of corporate debt and credit ratings”.
44
ESG in Investment Grade Corporate Bonds
N. Stellner et al., 2015
Corporate social responsibility and Eurozone corporate bonds: The moderating role of country sustainability 48
Period 2006-2012
Scope 872 corporate bonds
Region US
Key issue Spread & issuer rating
Method
Ordered logistic panel regression analysis:
Z-spread/credit ratings on ESG rating, company and industry-level specific control variables and sovereign ESG performance
Background:1. The literature review of Stellner et al. reveals ambiguous
evidence on ESG risk reward, i.e. risk mitigation & overinvestment view.
2. The materiality of ESG factors is influenced by the awareness in the respective environment (industrial, regional etc.)
Research question:1. Does superior performance in CSR result in lower credit risk?
2. Is the relationship between corporate credit ratings, spreads and ESG scores conditional on a country’s ESG performance?
Approach:Stellner et al. run two separate ordered logistic regressions of yearly corporate bond ratings and Z-spread on ESG ratings and control variables, such as: company factors (revenue, EBIT margin, debt/capital ratio, capex/revenue, ROIC, EBITDA…); global external factors (EURO Stoxx 50, VAX, German risk-free interest rate…) and bond characteristics (maturity, bid-ask spread).
To test if the relationship between ESG and credit risk is dependent on a country’s ESG performance, the authors split the sample into above average and below average ESG rated countries.
Subsequently, several robustness checks are conducted. (Year and industry dummies are included; different ESG research is used; lag independent variables avoid reverse causality between CSP and CFP; IV estimate).
Results:Companies benefitted from CSR investments if they operated in a country with superior ESG performance in which their CSR-related efforts are recognized and finally transferred to credit risk-reducing economic advantages. Firms investing in CSR and operating in lower rated ESG countries are penalized with lower credit ratings and modestly higher spreads. This is in line with the overinvestment view, which states that investments in CSR are considered value destroying in these countries
Being assigned to the group of corporate bonds in which the high company ESG score matches the country ESG performance reduced credit spreads by approximately 7.7% compared to the reference group. Based on the mean value of corporate z-spreads in their sample of 125.5bps, this would transfer to a decrease in spread of approximately 9.6bps.
48 N. Stellner et al., 2015 “Corporate social responsibility and Eurozone corporate bonds: The moderating role of country sustainability”.

45
ESG in Investment Grade Corporate Bonds
O. Switzer & Wang, 2013
Default risk estimation, bank credit risk and corporate governance 49
Period 2001-2010
Scope 228 banks
Region US
Key issue Governance
MethodOLS regression of default probability on firm level controls and various governance proxy variables
Research question:Does the governance structure of commercial and savings banks measure their risk taking behavior?
Approach:Switzer & Wang examine corporate governance more from the creditors’ rather than from shareholders’ perspective, as they analyze the relationship between credit risk levels of banks and the corporate governance structures (CEO/CFO age, board size/independence, institutional/insider holding, etc.) of these banks.
Results:Corporate governance structures have a greater impact on US commercial banks than on savings institutions. After controlling for firm specific characteristics, commercial banks with larger boards and older CFOs and less busy directors are associated with significantly lower credit risk levels. Their paper provides further evidence for the importance of governance.
49 O. Switzer & Wang, 2013 “Default risk estimation, bank credit risk and corporate governance”.
46
ESG in Investment Grade Corporate Bonds
P. UN PRI, 2012
Academic Readings Summary 50
Period 1990-2007
Scope 15 academic studies
Region US
Key issue Cost of debt
MethodLiterature review by the UN PRI fixed income working group
Description:The 2012 academic readings summary published by the UN PRI - Fixed Income Working Group examines the effect of Environmental, Social and Governance (ESG) factors on cost of debt. The review focusses on academic studies, which examine individual ESG factors. It complements the UN PRI report “Corporate Bonds: Spotlight on ESG risks”.
Results:Good ESG management leads to credit strength. The evidence shows that industries with a high exposure to composite/individual ESG risks profit from a skilled ESG management through significantly lower cost of debt capital. The review further finds that ESG factors for firms with lower levels of creditworthiness are more material. The UN PRI agrees on the strong materiality of ESG factors in corporate bonds in consensus. Fourteen studies find a positive relationship between individual ESG factors and just one a neutral effect. A good understanding of a company’s ESG exposure leads to a crucial understanding of the company’s fixed income down-side risks.
→ Environmental: On the environmental dimension, firms with less exposure to environmental risks or the ability to manage environmental risks are rewarded with a decrease in credit spreads compared to their peers.
→ Social: The literature shows that firms with strong employee relations have a statistically and economically significant lower cost of debt financing.
→ Governance: Anti-takeover measures such as a democratic shareholder base or poison pills contribute to a decrease in bond yields and an increase in credit ratings.
ESC Number of articles
ESG factors and themes ESG indicators used Creditworthiness indica-tors used
E 7 Environmental externalities, environmental management
EPA environmental protection data, public disclosure on environmental risk, environmental liabilities
Cost of capital/bank loans, CDS spreads, credit ratings, bond yields, bond indices, volatility, default rates.
S 2 Employee relationsUnion relations, profit sharing and cooperative governance structures
G 6Corruption, transparency, agency risk, remuneration incentives
Corporate disclosure quality, anti-takeover provisions, stakeholder management
Chart 15. Overview over UN PRI academic readings summary 43
50 Allianz Global Investors based on UN PRI – Fixed Income Working Group.
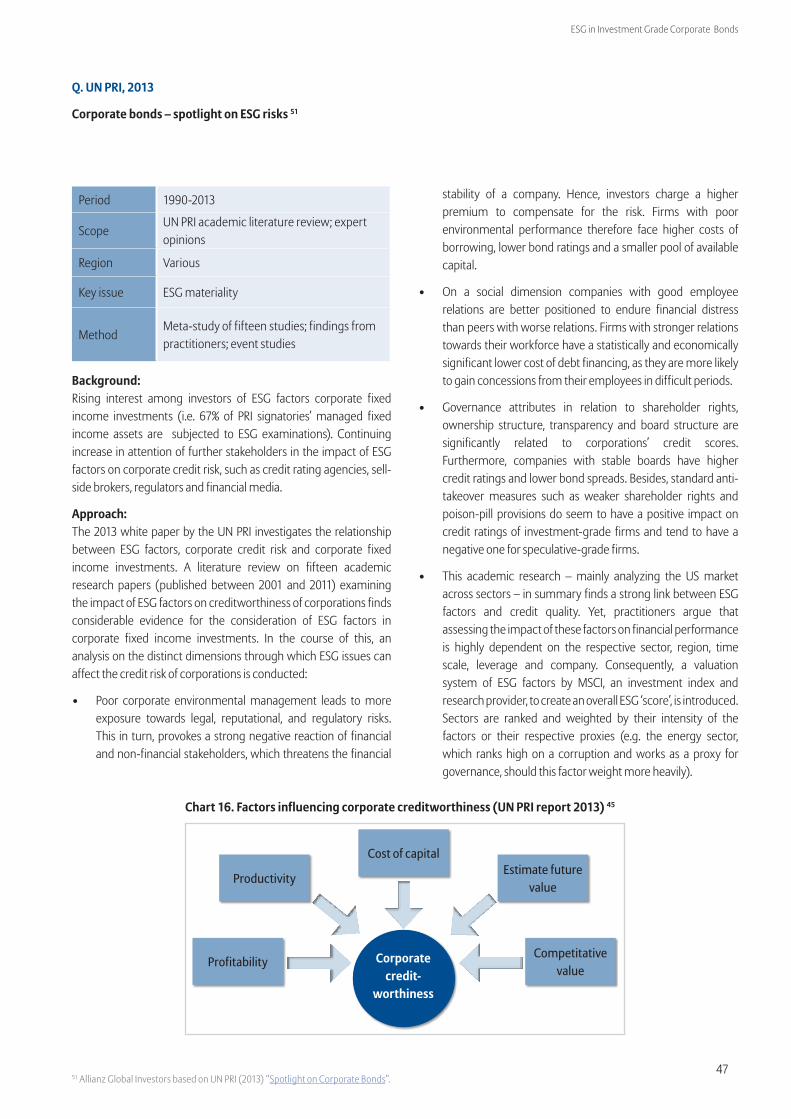
47
ESG in Investment Grade Corporate Bonds
Q. UN PRI, 2013
Corporate bonds – spotlight on ESG risks 51
Period 1990-2013
ScopeUN PRI academic literature review; expert opinions
Region Various
Key issue ESG materiality
MethodMeta-study of fifteen studies; findings from practitioners; event studies
Background:Rising interest among investors of ESG factors corporate fixed income investments (i.e. 67% of PRI signatories’ managed fixed income assets are subjected to ESG examinations). Continuing increase in attention of further stakeholders in the impact of ESG factors on corporate credit risk, such as credit rating agencies, sell-side brokers, regulators and financial media.
Approach:The 2013 white paper by the UN PRI investigates the relationship between ESG factors, corporate credit risk and corporate fixed income investments. A literature review on fifteen academic research papers (published between 2001 and 2011) examining the impact of ESG factors on creditworthiness of corporations finds considerable evidence for the consideration of ESG factors in corporate fixed income investments. In the course of this, an analysis on the distinct dimensions through which ESG issues can affect the credit risk of corporations is conducted:
• Poor corporate environmental management leads to more exposure towards legal, reputational, and regulatory risks. This in turn, provokes a strong negative reaction of financial and non-financial stakeholders, which threatens the financial
stability of a company. Hence, investors charge a higher premium to compensate for the risk. Firms with poor environmental performance therefore face higher costs of borrowing, lower bond ratings and a smaller pool of available capital.
• On a social dimension companies with good employee relations are better positioned to endure financial distress than peers with worse relations. Firms with stronger relations towards their workforce have a statistically and economically significant lower cost of debt financing, as they are more likely to gain concessions from their employees in difficult periods.
• Governance attributes in relation to shareholder rights, ownership structure, transparency and board structure are significantly related to corporations’ credit scores. Furthermore, companies with stable boards have higher credit ratings and lower bond spreads. Besides, standard anti-takeover measures such as weaker shareholder rights and poison-pill provisions do seem to have a positive impact on credit ratings of investment-grade firms and tend to have a negative one for speculative-grade firms.
• This academic research – mainly analyzing the US market across sectors – in summary finds a strong link between ESG factors and credit quality. Yet, practitioners argue that assessing the impact of these factors on financial performance is highly dependent on the respective sector, region, time scale, leverage and company. Consequently, a valuation system of ESG factors by MSCI, an investment index and research provider, to create an overall ESG ‘score’, is introduced. Sectors are ranked and weighted by their intensity of the factors or their respective proxies (e.g. the energy sector, which ranks high on a corruption and works as a proxy for governance, should this factor weight more heavily).
51 Allianz Global Investors based on UN PRI (2013) “Spotlight on Corporate Bonds”.
Chart 16. Factors influencing corporate creditworthiness (UN PRI report 2013) 45
Corporate credit-
worthiness
Productivity
Cost of capitalEstimate future
value
Competitative value
Profitability
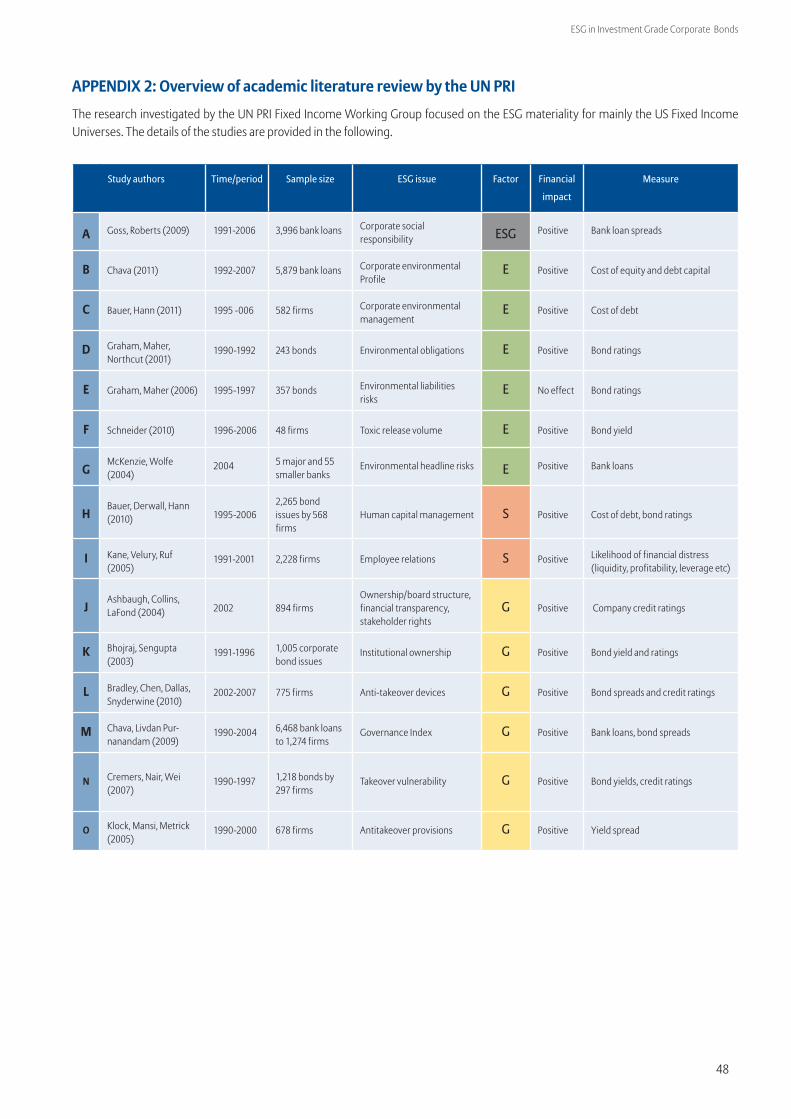
48
ESG in Investment Grade Corporate Bonds
APPENDIX 2: Overview of academic literature review by the UN PRI
Study authors Time/period Sample size ESG issue Factor Financial
impact
Measure
A Goss, Roberts (2009) 1991-2006 3,996 bank loans Corporate social responsibility ESG Positive Bank loan spreads
B Chava (2011) 1992-2007 5,879 bank loans Corporate environmental Profile
E Positive Cost of equity and debt capital
C Bauer, Hann (2011) 1995 -006 582 firms Corporate environmental management
E Positive Cost of debt
D Graham, Maher, Northcut (2001)
1990-1992 243 bonds Environmental obligations E Positive Bond ratings
E Graham, Maher (2006) 1995-1997 357 bonds Environmental liabilities risks
E No effect Bond ratings
F Schneider (2010) 1996-2006 48 firms Toxic release volume E Positive Bond yield
GMcKenzie, Wolfe (2004)
2004 5 major and 55 smaller banks
Environmental headline risks E Positive Bank loans
HBauer, Derwall, Hann (2010) 1995-2006
2,265 bond issues by 568 firms
Human capital management S Positive Cost of debt, bond ratings
I Kane, Velury, Ruf (2005)
1991-2001 2,228 firms Employee relations S Positive Likelihood of financial distress (liquidity, profitability, leverage etc)
JAshbaugh, Collins, LaFond (2004) 2002 894 firms
Ownership/board structure, financial transparency, stakeholder rights
G Positive Company credit ratings
K Bhojraj, Sengupta (2003)
1991-1996 1,005 corporate bond issues
Institutional ownership G Positive Bond yield and ratings
L Bradley, Chen, Dallas, Snyderwine (2010)
2002-2007 775 firms Anti-takeover devices G Positive Bond spreads and credit ratings
M Chava, Livdan Pur-nanandam (2009)
1990-2004 6,468 bank loans to 1,274 firms
Governance Index G Positive Bank loans, bond spreads
N Cremers, Nair, Wei (2007)
1990-1997 1,218 bonds by 297 firms
Takeover vulnerability G Positive Bond yields, credit ratings
O Klock, Mansi, Metrick (2005)
1990-2000 678 firms Antitakeover provisions G Positive Yield spread
The research investigated by the UN PRI Fixed Income Working Group focused on the ESG materiality for mainly the US Fixed Income Universes. The details of the studies are provided in the following.

49
ESG in Investment Grade Corporate Bonds
APPENDIX 3: Overview of studies examined: Credit Rating Agencies
Date Author Study ESG dimension Content Access
A 2016 Fitch Fitch : Evaluating orporate Governance G Methodology Restricted
B 2015 Moody’s Heat Map Shows Wide Variations in Credit Impact Across Sectors E Illustration Public
C 2015 Moody’s Moody’s Approach to Assessing ESG Risks in Rating and Research
ESG Methodology Restricted
D 2012 Standard & Poor’s Ratings Services
Management And Governance Credit Factors For Corpo-rate Entities And Insurers
G Methodology Public
E 2015 Standard & Poor’s Ratings Services
ESG Risks In Corporate Credit Ratings-An Overview ESG Methodology Restricted
F 2015 Standard & Poor’s Ratings Services
How Environmental And Climate Risks Factor Into Global Corporate Ratings
E Methodology Restricted
G 2016 UN PRI Statement on ESG in Credit Ratings ESG Statement Public
The following overview highlights the studies which were made available publicly or sent to us on request by the big three credit rating agencies. Our focus was on ESG methodology by the different credit rating agencies.

50
ESG in Investment Grade Corporate Bonds
LEGAL DISCLAIMER
Investing involves risk. The value of an investment and the income from it could fall as well as rise and investors might not get back the full amount invested. Past perfor-mance is not indicative of future performance.
Please note: the conclusions from the research studies analysed and summarised do not necessarily reflect AllianzGI‘s investment opinion. The research does not imply investment advice or investment performance related forecasts. Past performance is not indicative of future performance. This is a marketing communication. It is forinformational purposes only. This document does not constitute investment advice or a recommendation to buy, sell or hold any security and shall not be deemed an offer to sell or a solicitation of an offer to buy any security.
Unlike actual performance data, simulations are not based on actual transactions; thus, their significance underlies inherent limitations. Simulations are not able to account for the impact of actual portfolio trading as it may have been affected by economic and market factors, such as a lack of liquidity. If the currency in which the past perfor-mance is displayed differs from the currency of the country in which the investor resides, then the investor should be aware that due to the exchange rate fluctuations the performance shown may be higher or lower if converted into the investor’s local currency.
This is a marketing communication. It is for informational purposes only. This document does not constitute investment advice or a recommendation to buy, sell or hold any security and shall not be deemed an offer to sell or a solicitation of an offer to buy any security.
The views and opinions expressed herein, which are subject to change without notice, are those of the issuer or its affiliated companies at the time of publication. Certain data used are derived from various sources believed to be reliable, but the accuracy or completeness of the data is not guaranteed and no liability is assumed for any direct or consequential losses arising from their use. The duplication, publication, extraction or transmission of the contents, irrespective of the form, is not permitted.
This material has not been reviewed by any regulatory authorities. In mainland China, it is used only as supporting material to the offshore investment products offered by commercial banks under the Qualified Domestic Institutional Investors scheme pursuant to applicable rules and regulations.
This material is being distributed by the following Allianz Global Investors companies: Allianz Global Investors U.S. LLC, an investment adviser registered with the U.S. Secu-rities and Exchange Commission; Allianz Global Investors GmbH, an investment company in Germany, authorized by the German Bundesanstalt für Finanzdienstleistung-saufsicht (BaFin); Allianz Global Investors Asia Pacific Ltd., licensed by the Hong Kong Securities and Futures Commission; Allianz Global Investors Singapore Ltd., regulated by the Monetary Authority of Singapore [Company Registration No. 199907169Z]; Allianz Global Investors Japan Co., Ltd., registered in Japan as a Financial Instruments Business Operator [Registered No. The Director of Kanto Local Finance Bureau (Financial Instruments Business Operator), No. 424, Member of Japan Investment AdvisersAssociation]; Allianz Global Investors Korea Ltd., licensed by the Korea Financial Services Commission; and Allianz Global Investors Taiwan Ltd., licensed by Financial Super-visory Commission in Taiwan.
As at May 2017
Key contact
Dr. Steffen HörterGlobal Head of ESGAllianz Global Investors GmbHSeidlstraße 24-24aD-80335 Munich
Phone: +49 - (0)89 - 1220 – 7704Mobile +49 - (0)160 - 586 - 3302Email: [email protected]