Embed Size (px)
Citation preview
Escaping and Falling into Poverty in India Today
Amit Thorat Jawaharlal Nehru University
Reeve Vanneman University of Maryland
Sonalde Desai
University of Maryland and National Council of Applied Economic Research
Amaresh Dubey
Jawaharlal Nehru University [email protected]
November 10, 2016
We gratefully acknowledge support vide grants R01HD041455, R01HD046166, and R01HD061408 from the National Institutes of Health, and a supplementary grant from the Ford Foundation. Data management was funded by the UK government as part of its Knowledge Partnership Programme (KPP), and analysis was carried out with the aid of a grant from the International Development Research Centre, Ottawa, Canada. We thank Anupma Mehta for many useful suggestions.
Abstract
The study examines the dynamic nature of movements into and out of poverty over a
period when poverty has fallen substantially in India. The analysis identifies people
who escaped poverty and those who fell into it over the period 2005 to 2012. The
analysis identifies people who escaped poverty and those who fell into it over the
period 2005 to 2012. Using panel data from the India Human Development Survey
for 2005 and 2012, we find that the risks of marginalized communities such as Dalits
and Adivasis of falling into or remaining in poverty were higher than those for more
privileged groups. Some, but not all of these higher risks are explained by
educational, financial, and social disadvantages of these groups in 2005. Results from
a logistic regression show that some factors that help people escape poverty differ
from those that push people into it and that the strength of their effects varies.
Key words: India, Poverty, Panel, Escaping, Falling, Social Groups, Religious groups
and Education.
*AbstractClick here to view linked References
Acknowledgements
We are grateful to our colleagues at the National Council of Applied Economic
Research (NCAER), New Delhi, and especially the IHDS team there for helpful
comments, throughout the preparation of this paper. An earlier version of the paper
was presented at Jawaharlal Nehru University where we received several useful
suggestions. We are also grateful for several useful ideas from World Development
reviewers. Our data are from the India Human Development Surveys, 2005 and 2012.
These surveys were jointly organized by researchers at the University of Maryland
and NCAER. The data collection was funded by grants R01HD041455,
R01HD046166, and R01HD061408 from the National Institutes of Health and by a
supplementary grant from the Ford Foundation. Data management was funded by the
UK government as part of its Knowledge Partnership Program (KPP) and analysis
was carried out with the aid of a grant from the International Development Research
Centre, Ottawa, Canada.
*Acknowledgements
Highlights
1. The study examines all India panel data for 2005 & 2012.
2. It identifies people who escaped or fell into poverty over this period.
3. Dalits and Adivasis face higher risk of falling into poverty then the rest
4. Regression shows factors helping escape & falling are different from each
other
*Highlights (WITHOUT author details)
Introduction
The Indian economy has grown by leaps and bounds over the last two decades of its liberalized
journey. The world economic crisis notwithstanding, both rural and urban poverty fell
substantially over this time period although some debate remains over the magnitude of this fall.
Official estimates show a decline from a high of 37% in 1993-94 to 22% in 2011-12, a decline of
15 percentage points1.
Though everyone agrees poverty rates have fallen over time, we are less certain about who are
the people who have risen out of poverty most rapidly and what advantages they enjoyed that
might have helped explain their upward mobility. Moreover, despite the overall decline in net
poverty rates, many others have newly fallen into poverty but have been almost forgotten in
academic and policy discourse (Krishna 2010).
Poverty analysis in India has largely depended upon cross sectional data, relying on the ‘thick’
quinquennial and the ‘thin’ annual consumption expenditure surveys by the NSSO. Though
highly useful for a continuous monitoring of national progress, these cross-sectional surveys do
not allow for examining the dynamics of household outcomes. The lack of national panel data
has prevented us from asking what household characteristics increase the odds of exiting or
entering poverty? How does occupational diversification affect the risks of poverty? Are
historical caste disadvantages reproduced in recent poverty dynamics?
The completion of the second wave of the India Human Development Survey (IHDS 2016)
presents a unique opportunity to observe the movements into and out of poverty by Indian
1 These estimates are based on the ‘thick’ rounds of Consumption Expenditure Survey for 2004/05 and 2011/12 conducted by the National Sample Survey Organisation. Planning Commission of India Press Release
*Manuscript (WITHOUT Author Details)Click here to view linked References
Escaping and Falling into Poverty in India 2
households across the country during a rapidly changing economy. We find that traditional
caste and religious differences remain a major impediment for escaping poverty and an equally
strong risk for falling into poverty. Educational attainment and a salaried position offer
protection against the danger of falling into poverty but somewhat less help in escaping once
there. Urban location offers similar protections against falling into poverty but almost no
advantage in escaping poverty after holding constant the educational and occupational
advantages typical of urban households.
Background and motivation
Contemporary poverty in India has always been underpinned by the age-old divisions of caste
and religious differences. Patterns of poverty and underdevelopment show consistent intergroup
variations over time, even during phases of growth and development. India’s class differentials
have historically mirrored the traditional caste differentials. Brahmins and other forward castes
have been the traditional decision makers through their ownership of land and capital, while
Dalits (Scheduled Castes) have more often worked as landless labourers. Indigenous tribal
groups (Adivasis), often set apart geographically and socially from the rest of India, have
typically been the poorest of the poor.
Despite aggressive affirmative action policies by the Government of India and despite substantial
improvements in incomes among all Indians, poverty continues to be concentrated among these
most traditionally disadvantaged groups. A recent report based on the 2004-2005 India Human
Development Survey (Desai et al. 2010) found that while Forward Caste Hindus experienced a
12% poverty rate, Dalit poverty was more than two and half times as high (32%) and a crippling
50% of Adivasis were poor. Intermediate castes (OBCs – Other Backward Classes) had, not
surprisingly, intermediate levels of poverty (23%). Comparable estimates of poverty (Thorat &
Dubey, 2012) based on NSS CES data also show similar inter group differences. While the head
Escaping and Falling into Poverty in India 3
count ratio (HCR) for the Dalits and Adivasis were as high as 32% and 30%, they are only 17%
for the Forward caste Hindus.
Religious differences in poverty are more complex owing to different levels of urbanization,
education, and non-agricultural employment. Nevertheless, 31% of minority Muslims were
poor, a rate not much different from Dalits (IHDS, 2005). Other minority religious groups, Jains,
Sikhs, and to a lesser extent Christians, have been relatively prosperous; together their 2005
poverty rate was only 12%, about the same as Forward Caste Hindus.
Panel literature and analysis
Poverty analyses in India have depended largely on the cross sectional National Sample Surveys
(NSS) consumption expenditure data collected every five years2 by the Ministry of Statistics and
Program Implementation. Panel data analysis has been less common; what has been available has
used mostly selected rural samples from NCAER (Mehta and Bhide 2003) and ICRISAT, the
International Crops Research Institute for the Semi-Arid Tropics (Singh and Binswanger 1993;
Gaiha and Imai 2004) data. The last available year from ICRISAT is 2008 and from NCAER,
1998-99. Lacking sufficient panel data, others (Krishna 2010, Hattlebakk 2014) have developed
retrospective methods for inquiring about transitions into and out of poverty.
Social Background
These earlier panel analyses of rural poverty persistence confirmed that the most disadvantaged
groups also realized the lowest rates of escape from poverty. The evidence is clearest for
Adivasis while Dalits and especially OBCs occasionally show escape rates more similar to
2 NSS - Consumption Expenditure Data is a large countrywide sample survey conducted every 5 years and
collects household level information on rupee expenditure on consumed items. This household consumption
expenditure is then used as a proxy for the household’s monthly income.
Escaping and Falling into Poverty in India 4
forward castes. For example, Mehta and Bhide (2003) studying 3139 rural households found
that while 63% of “Upper Caste” households who were poor in 1970-71 were no longer poor a
decade later, only 37% of Dalits and, even fewer, 30%, of Adivasis had managed to escape
poverty during that time. Escape rates for OBC households, 43%, fell between these two
extremes. Dhamija and Bhide (2013) extended the analysis of the same NCAER data to 1998-99
data and also found that both Dalits and Adivasis were less likely to escape poverty, although
their coefficient estimating the odds of escape for Adivasis, -1.18, was over twice that for Dalits,
-0.56 (2013: 692).
Krishna (2003) using retrospective accounts for 6,376 Rajasthan households found that while
45% of previously poor Upper Caste households had escaped poverty a generation later, 42% of
poor OBC households, 33% of Dalit households, and only 31% of Adivasi households had been
able to escape. Using similar methods with 2245 Gujarat households, Krishna et al (2005) found
escape rates of 22% for “General” Hindu households, 18%, for Dalits, and 15% for Adivasis.
More surprisingly, the lowest rates of escape in Gujarat were found among poor OBC
households, only 12% of whom escaped poverty. Hattlebakk (2014) using a similar
retrospective method with 754 households in two Orissa districts found similar rates of escape
for poor OBCs (50%) and Dalits (58%) but much lower for poor Adivasis (17%). Unfortunately,
the sample size of poor forward castes was too small to estimate escape rates.
The analyses most similar to what we report here were calculated by Krishna and Shariff (2011)
using income, not expenditure data, from a national panel of 13,593 rural households interviewed
in 1993-94 and 2004-05. They found the familiar hierarchy of escapes associated with higher
caste status: Dalits and Adivasis (46%), OBCs (53%), and forward castes (60%). Interestingly,
in a multivariate state fixed effects regression controlling for other household characteristics,
these caste differences proved to be not statistically significant. Their results do not indicate so
Escaping and Falling into Poverty in India 5
much a lack of caste differences in escaping poverty but rather that a reasonably comprehensive
set of intervening variables can explain much of why caste status is related to escapes from
poverty.
There has been less research attention to caste differences in falling into poverty, despite
widespread acknowledgement that poverty rates are a product of both escapes and descents.
Bhide and Methta (2008) using the NCAER data found evidence for higher rates for Adivasis
falling into severe poverty and for Dalits falling into moderate poverty. Dhamija and Bhide
(2013), analyzing the same data in a multivariate model, found only non-significant caste
differences after controlling for other household and area characteristics. The retrospective
methods in smaller state-specific samples generally find higher descent rates for disadvantaged
castes than for forward castes although the differences among the disadvantaged castes varies
from one location to another. Krishna and Shariff’s all-India data found large caste differences
for falling into poverty with 43% of non-poor Adivasis and Dalits falling into poverty a decade
later, 36% of OBCs and 23% of forward castes.
Religious differences have usually been smaller. Mehta and Bhide (2003) found 48% of poor
Hindus had escaped poverty compared to 40% of poor Muslims. Krishna and Shariff found only
45% of Muslims escaped poverty between 1994 and 2005, comparable to the low rates for Dalits
and Adivasis (46%). And 39% of nonpoor Muslims fell into poverty during this period, only
slightly less than for Dalits and Adivasis (43%) and well below the higher caste risk (23%).
Economic and Educational Background
A review of the existing panel data literature on India as well as other countries suggests that in
rural areas, households that escaped poverty over time, were those that managed to increase their
land holding or to use existing land more intensively either by increasing irrigation or crop
Escaping and Falling into Poverty in India 6
diversification, found off-farm work, increased skill or education, acquired more assets, or
reduced family size. At the same time those households that fell into poverty were the ones that
lost land or operational area, experienced cropping shocks, increased family size, did not
accumulate wealth, did not reduce liabilities, had members who fell ill, suffered a natural
calamity, beloged to lower caste, were landless, mostly less educated and could not easily change
occupation Adelman, Subbarao and Vashishtha, 1985; Baulch and McCulloch 2002; Gaiha
1989).
Objective
The panel studies reviewed above, while suggestive, have various limitations: all are rural,
several are based on small or local samples, and poverty definitions vary widely from one study
to another and rarely conform to the standard NSS definition. This study will use a nationally
representative panel data of 38,853 households for India, the India Human Development Survey
(Desai et al., 2010), fielded in two waves, 2004-05 and 2011-12. This is the only nationally
representative panel that has collected data on household incomes and consumption
expenditures, and also includes data on many other socio-economic indicators that might protect
households from poverty.
We concentrate on the prior characteristics of households that would predispose them to escape
from or descend into poverty, particularly the socio-religious profile of these households. We
also try to identify the economic and social resources households have to resist poverty: the
household’s main source of income, level of education, land ownership, social and financial
capital, and household composition. For caste and religion, we first report reduced form
differences in exits and entrances and then use lagged logistic regressions to investigate the
conditional effects of household characteristics in exposing households to risks of falling into
Escaping and Falling into Poverty in India 7
poverty or chances of escaping it. We are also interested in understanding how much of the
caste and community disadvantages are explained by these household characteristics.
When considering poverty transitions, we need to take account not only of the levels of income
and its determinants, but also the steadiness of that income. Steadiness and high levels are easily
conflated because they often (but not always) co-occur. Salaried positions in India usually pay
better than wage labour, but their advantage in poverty transitions stems also from the greater
steadiness of that income as compared to hourly wages. Households with steady incomes avoid
the poverty transitions that comes from more volatile income sources. Cross-sectional analyses
of poverty that miss the churning of exits from and entrances into poverty also miss the
importance of steady incomes for protecting households from poverty.
Household characteristics that are relatively enduring properties should be especially important
in protecting against falling into poverty: capital of all types – financial, physical, human, and
social – can buffer a household against the risks of falling into poverty during bad years.
Agricultural capital might seem to be an exception to that benefit because of the inherent
volatility of agricultural production due to weather and climatic conditions. But even in
agriculture, landowners are better protected from falling into poverty than are agricultural
labourers who are the first to suffer from failed crops. Perhaps, more importantly, irrigation can
buffer the consequences of rainfall failures and protect cultivators from falling into poverty.
Bank accounts can also provide protection against the volatility of Indian incomes; they not only
can hold savings to smooth consumption spending, they can provide better access to credit.
Access to banking continues to expand in India, but at the time of the first IHDS survey only a
third of Indian households had an account, making this a potentially important difference for
families avoiding falling into poverty. And while access to future borrowing may provide a
means for households to maintain their living standards, current debt may also create a risk for
Escaping and Falling into Poverty in India 8
falling further behind. The retrospective studies described above frequently identify debts as a
common path into household poverty.
Human capital, because it remains with a worker through good times and bad, can act also as
insurance against descents into poverty just as physical capital can. A college degree or a
secondary school diploma remains a credential workers take with them from position to position.
Finally, social capital, like financial and human capital, can be a household resource that may
help protect households from falling into poverty during bad times or help efforts to rise out of
poverty after setbacks. Memberships in formal organizations, especially micro-credit societies,
can provide specifically economic assistance for upward mobility; and more general informal
contacts with local influentials can provide the social safety nets that protect against sudden
descents or that extend a hand up when trying to recover from a setback.
Of course, the steadiness of income, the buffer of a stock of capital, or the credential that protects
employment is not as much assistance if that income hasn’t been sufficient to prevent poverty in
the first place. A steady but poverty-level income is poor consolation. For this reason, we
expect these predictors of steady income to be more important as protection against falling into
poverty than assistance in escaping poverty.
Methods
Data Source:
IHDS began as a multi-topic panel study of 41,554 households from 33 states and union
territories across 1503 villages and 971 urban neighbourhoods. The survey was designed to be
nationally representative at its inception. In 2011-12, all of the 2004-5 households as well as any
Escaping and Falling into Poverty in India 9
households separating from the root household but residing in the same area were selected for
re-interviews.
Comparison of IHDS data with other reputable data sources such as the Census, National Sample
Surveys (NSS) and National Family Health Survey (NFHS) shows that the IHDS compares well
with these sources on common items (Desai et al. 2010). For example, the NSS estimates poverty
rate to be 37 per cent in 2004-5 and 22 percent in 2011-12; IHDS estimates are similar at 38
percent in 2004-5 and 21 percent in 2011-12.
IHDS2 reinterviewed 83 percent of the original IHDS1 households that housed 85 percent of the
Indian population -- 92 per cent of households in rural areas and 76 per cent in urban areas.
Attrition was lower among larger, rural households, especially those who owned agricultural
land. Attrition was also slightly higher for the non-poor, 13 percent, than for the poor, 9 percent.
These differences raise the question of a possible selection bias in our results since we can
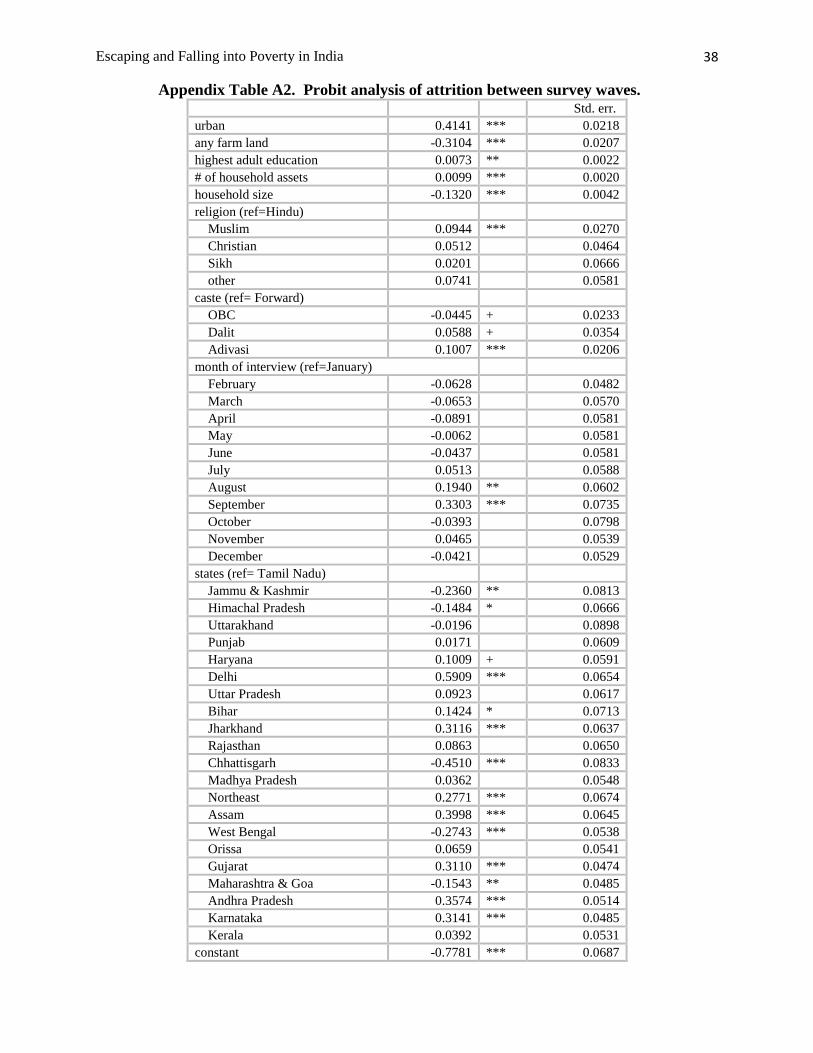
analyse poverty transitions only for households interviewed in both surveys. Appendix Table 2
presents results from a probit analysis of attrition from which we calculated the inverse Mills’
ratio included in all the analyses of poverty transitions.
Poverty:
The IHDS panel collected data on household consumption expenditures using an abridged
schedule, similar to the one used by the NSS for their Employment Survey. We convert reported
consumption of 47 different items (slightly revised to 52 items in 2012) to monthly per capita
consumption expenditures. Head count poverty ratios have been calculated using per capita
household consumption and the official poverty line (Tendulkar Committee poverty lines3).
3 The Government of India appointed a committee under the chairmanship of the Suresh Tendulkar. The
Committee reviewed the existing methodology of estimating poverty in India and recommended new poverty lines for the rural and urban areas. (GOI, 2009). For details of methodology, click link to online the report (Tendulkar Committee Report Online)
Escaping and Falling into Poverty in India 10
These poverty line have been used by the Planning Commission, Government of India fro
estimating poverty ratios. (2009, see also Himanshu 2010). While the Planning Commission
acknowledged the multi-dimensionality of poverty, it maintained the historical reliance on
survey consumption data but revised the Rupee cutoff values away from a calorie criterion
towards a broader basket of food, health, and education expenditures.
Our analysis compares the poverty status of a household in 2012 (round two) to its status in 2005
(round one). For poor households in round one, we investigate whether they escaped poverty or
remained poor; for non-poor households, we investigate whether they fell into poverty or
remained non-poor. Thus our dependent variable is the poor or non-poor statuses of a household
in round two given that the household was non-poor or poor in round one. For new household
splits in round two, we trace back their poverty status to the origin household in round one.
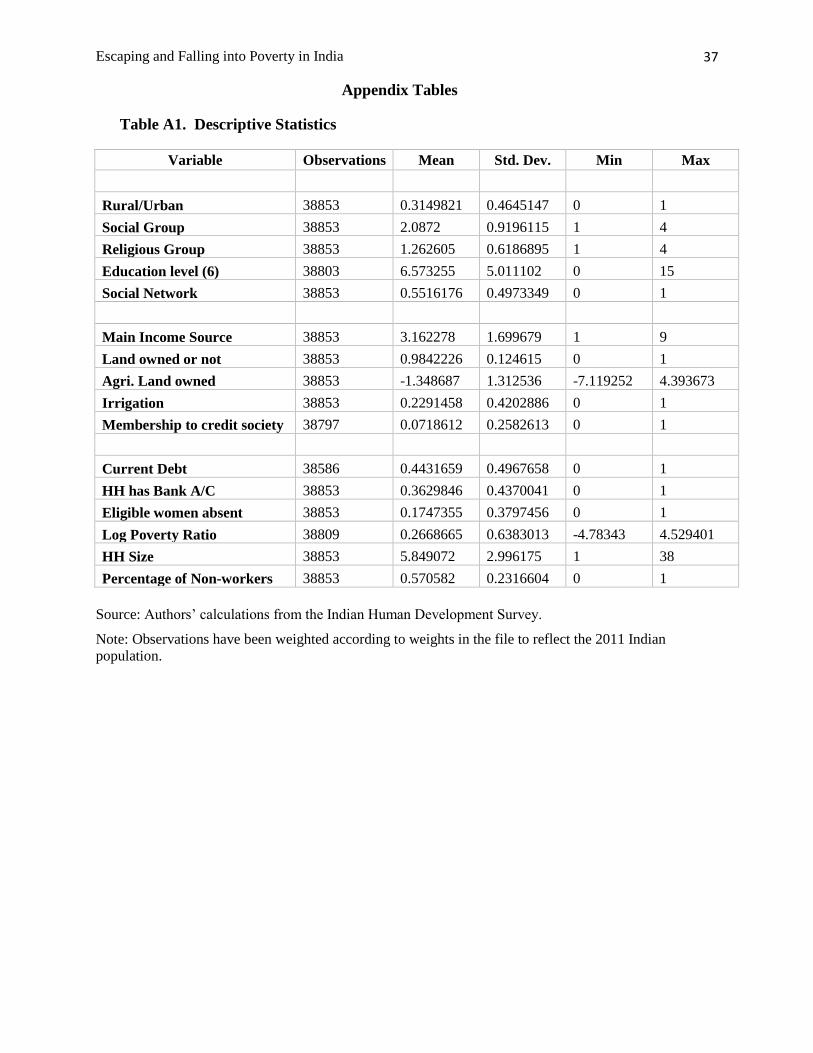
Variables:
We investigate round one household characteristics, focusing especially on caste and religion. In
the multivariate models, we add highest adult education in the household, main source of
income, land owned, irrigated land or not, household composition, social networks, and state
dummies (see means in Appendix Table 1).
i. Caste – We divide all households into four groups, Adivasis (Scheduled Tribes), Dalits
(Scheduled Castes), OBCs (Other Backward Classes) and Forward Castes (all others).
We use this fourfold classification for both Hindu and non-Hindu households because in
other analyses not reported here we find that the differences between self-reported caste
groups among Muslims, Sikhs, Christians, and others largely parallel those among
Hindus.
Escaping and Falling into Poverty in India 11
ii. Religion– We include four groups: Hindus, Muslims, Sikhs and Christians, and all
others which includes Buddhists, Jains, Zoroastrians, Tribals, others, and none (not
reporting any religious affiliations)
iii. Highest Educated Adult – This variable gives the highest level of education attained by
any adult aged 21 or over in the household; for the few households with no adult, we used
the education of the person designated as the household head. We divide years of
educational attainment into six groups.
iv. Main Income Source – IHDS collected detailed income data from over 50 possible
sources. We group these into eight major sources (farm, agricultural wage labour, non-
agricultural labour, regular salaried, self employment, family business, property or
pension income, remittances, and government benefits) and classify the household
according to the source of the largest income share.
v. Land Class – We first divide households into those who do and do not own agricultural
land, and then for those with land, we calculate the logarithm of hectares owned. In order
to avoid missing values, non-landed households are assigned a low value on landsize (0.1
hectares), thus constraining the landed/landless dummy coefficient to compare non-
landowners with very small landowners and reserving the analysis of land size only to
households with some land. We also included a dummy variable for whether any of the
household’s land was irrigated.
vi. Bank account – An “eligible woman” in the household, an ever-married woman 15-49,
was asked whether the household had a bank account and whether her name was on the
account. Approximately 1 in 6 households did not include an eligible woman so the
survey has no information on whether the household had a bank account or not. This
Escaping and Falling into Poverty in India 12
information is important enough that we tested the role of bank accounts for these
eligible woman households, substituting the mean (0.36) for missing data and adding a
dummy variable to identify the households with missing data.4
vii. Member of credit/ savings group – IHDS asked whether a household was a member of
any of nine different types of organizations; we focus on membership in a “credit/
savings group”.
viii. Debts – Households were asked to report how much they currently owed others, from
which we calculated a simple dichotomy of any debt versus no debt.
ix. Social Networks – This variable captures whether a household is acquainted with a
government official, a teacher or school staff, or a medical official.
x. Household structure – Household size is the total number of persons in the household and
the dependency ratio is the number of non-working household members per working
members of the household.
xi. We also included 21 state dummies to control for the wide range of regional differences
in levels of and changes in poverty. We collapse several smaller states with small survey
samples into regional groups, narrowing the number of states from 31 to 22.
Analyses:
We begin by reporting simple cross-tabulations of poverty rates, exits, and entrances by caste,
religion, and other background variables. We compare groups using simple percentage
4 Thus, the coefficient for having a bank account reflects the importance of banks only for the 82 percent of
households with eligible women; we cannot test whether the estimate would be different in other households. The value of the substituted mean, 0.36, has no effect on this coefficient but determines the size of the eligible woman dummy coefficient.
Escaping and Falling into Poverty in India 13
differences, but as will be quickly apparent, those statistics can be misleading when groups are
starting at such different levels of poverty.
The more analytic part of the paper uses a dynamic logistic regression model that takes as the
dependent variable the poverty status (0/1) of households in time (the 2012 IHDS survey)
separately for households who were poor or nonpoor at time period , factoring in a range of
control.
=Poverty status in current period.
= Poverty status in initial time period.
= Set of controls in initial time period (social group, education etc.)
t-1 = Inverse Mills’ ratio
= Error term
The logistic regressions have the advantage of comparing groups by their log odds of escaping or
entering poverty, comparisons that are not so closely determined by their initial poverty levels, as
are percentages differences. For example, a group with a 20% poverty head count ratio that fell
to 10% experienced the same change in log odds as a group that began with a 50% poverty rate
that fell to 31%. Although the former group changed by only 10 percentage points, its poverty
rate was cut in half; while the latter group had a 19 percentage point change but its poverty rate
was reduced by only 38%.
All analyses are weighted by the sample weights in the IHDS2 files to reflect the national
population. We also correct the standard errors to account for clustering into the 2435 primary
sampling units.
tY
1tY
1tX
t
Escaping and Falling into Poverty in India 14
Robustness checks:
Our main analyses use the conventional Indian measure of household poverty which is based on
consumption expenditures per capita using a poverty line drawn by the Tendulkar Commission.
There are many other possible ways of identifying Indian poverty, and it is possible that our
results would differ with different poverty definitions. We re-compute the analysis for some
although certainly not all of these possibilities. Instead of adjusting for household size by using
a per capita measure of consumption, we also use an “equivalenced” measure that divides total
household consumption by the square root of the number of persons in the household – an
adjustment more common in poverty measures in high income countries. We also construct a
measure of “severe poverty” with a cutoff at 80 percent of the official line and a measure of
“near poverty” with a cutoff at 125 percent of the poverty line. Finally, we take advantage of the
wide range of economic indicators available in the IHDS by using household income and
household assets as measures of economic standing, drawing the poverty lines at a level to
identify an equivalent percentage of the population as with the more conventional consumption
measure.
Results
Descriptive statistics
Poverty Decline
As with other data sources, we find that the head count ratio fell substantially over time from a
high of 38 percent in 2004/05 to 21 percent in 2011/12, a drop of 17 percentage points. The
decline was pervasive: all groups showed declining poverty over this period, although not always
by equal amounts. By one measure, more poverty reduction happened in rural areas, which saw a
17 percentage point fall from 42 percent to 25 percent, as compared to 15 points in urban areas
Escaping and Falling into Poverty in India 15
from 28 percent to 13 percent. However, the urban rate fell by more than half while the rural
rate fell by slightly less than half so by that metric urban areas did better. The simplest overall
summary is that poverty fell substantially in both rural and urban areas although the urban
advantage was maintained.
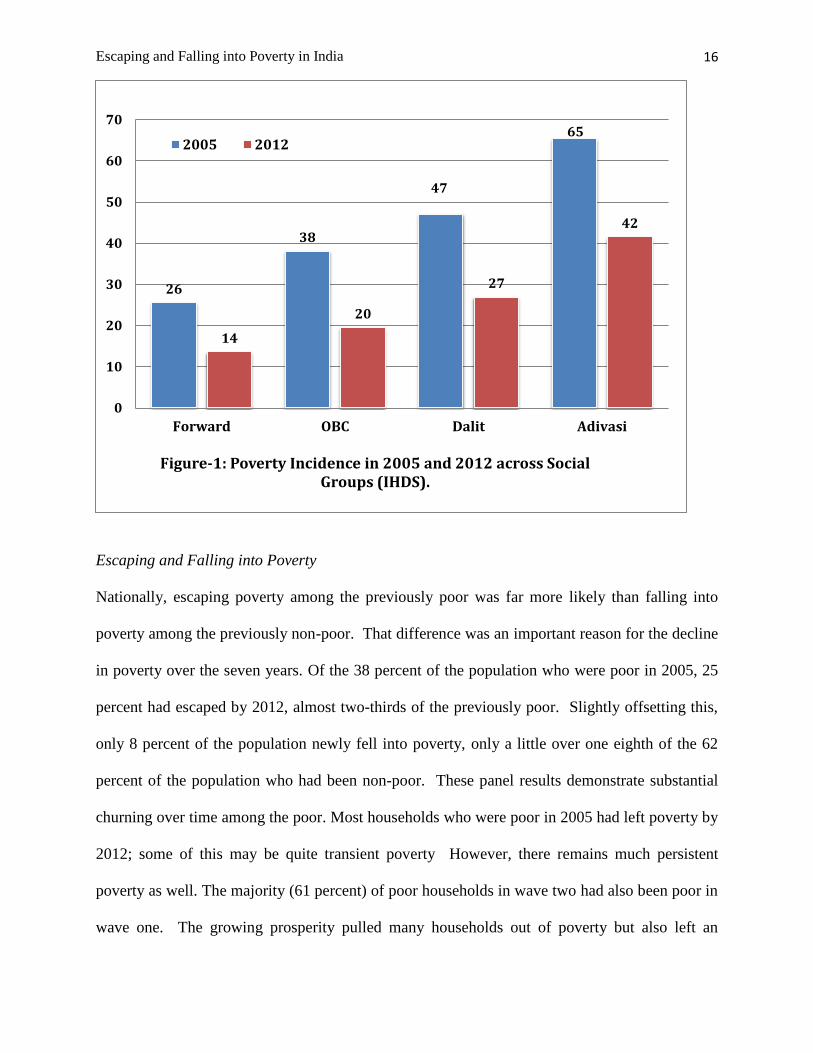
A comparison across caste groups also shows substantial drops for all groups but the largest
percentage point fall for Adivasis (23 points, see Figure 1). Dalits and those from other
backward classes (OBC) experienced similar percentage drops of 18 to 20 points while Forward
castes experienced only a 12 percentage point drop. The most vulnerable groups have had larger
percentage point declines than the better-off groups, though these reductions are from very high
poverty levels in the first round. So, while Forward castes and OBCs have had poverty rates fall
almost in half, for Adivasis poverty declined by only a little over a third. And despite the major
reductions, poverty levels are still very high for the Adivasis. Similarly, despite significant
reductions for OBCs and Dalits, the caste differentials persist.
We find that Muslims have done well, registering a 21percentage point reduction, 4 percentage
points more than the Hindus. Close behind are the other minority religions and the Hindus with
16 and 17 percentage point reduction. Sikhs and Christians together show low reductions; this is
not unexpected as these are already low poverty communities.
Escaping and Falling into Poverty in India 16
Escaping and Falling into Poverty
Nationally, escaping poverty among the previously poor was far more likely than falling into
poverty among the previously non-poor. That difference was an important reason for the decline
in poverty over the seven years. Of the 38 percent of the population who were poor in 2005, 25
percent had escaped by 2012, almost two-thirds of the previously poor. Slightly offsetting this,
only 8 percent of the population newly fell into poverty, only a little over one eighth of the 62
percent of the population who had been non-poor. These panel results demonstrate substantial
churning over time among the poor. Most households who were poor in 2005 had left poverty by
2012; some of this may be quite transient poverty However, there remains much persistent
poverty as well. The majority (61 percent) of poor households in wave two had also been poor in
wave one. The growing prosperity pulled many households out of poverty but also left an
26
38
47
65
14
20
27
42
0
10
20
30
40
50
60
70
Forward OBC Dalit Adivasi
Figure-1: Poverty Incidence in 2005 and 2012 across Social Groups (IHDS).
2005 2012
Escaping and Falling into Poverty in India 17
unfortunate minority who benefited little from the economic growth. Altogether, 13 percent of
all Indians were poor in both surveys.
In what follows, we focus on the escape rates of those who were previously poor, and the descent
rates of those who were previously non-poor. These rates provide a better comparison of caste
and other differences in the relative chances of poverty transitions than do the total population
percentages which are more strongly determined by the initial, often very different, poverty rates.
Escape and descent rates are similar for rural and urban India, although urban areas enjoy an
advantage of higher rates of escape and lower rates of falling into poverty. In urban India 71
percent of the poor in 2004-05 escaped poverty by 2011-12, whereas only 64 percent of the rural
poor escaped poverty over the same period. At the same time about 16 percent of the rural
nonpoor in 2004-05 had fallen into poverty by 2011-12, as compared to only 8 percent in urban
areas.
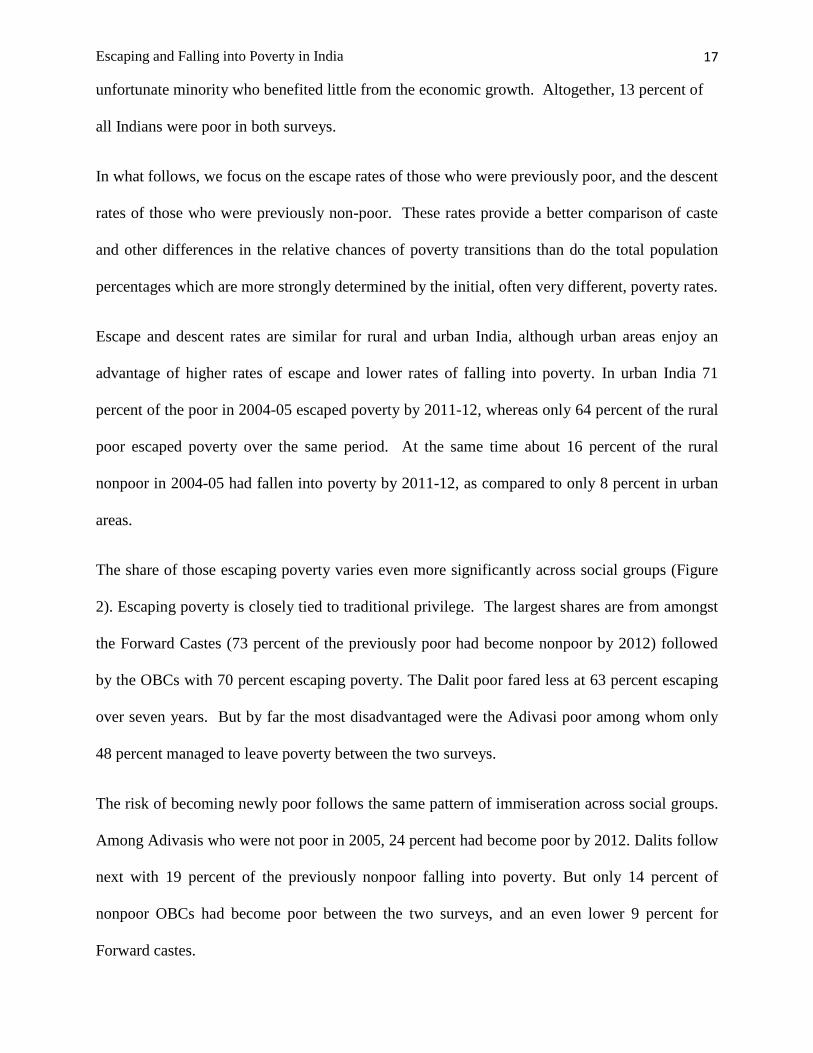
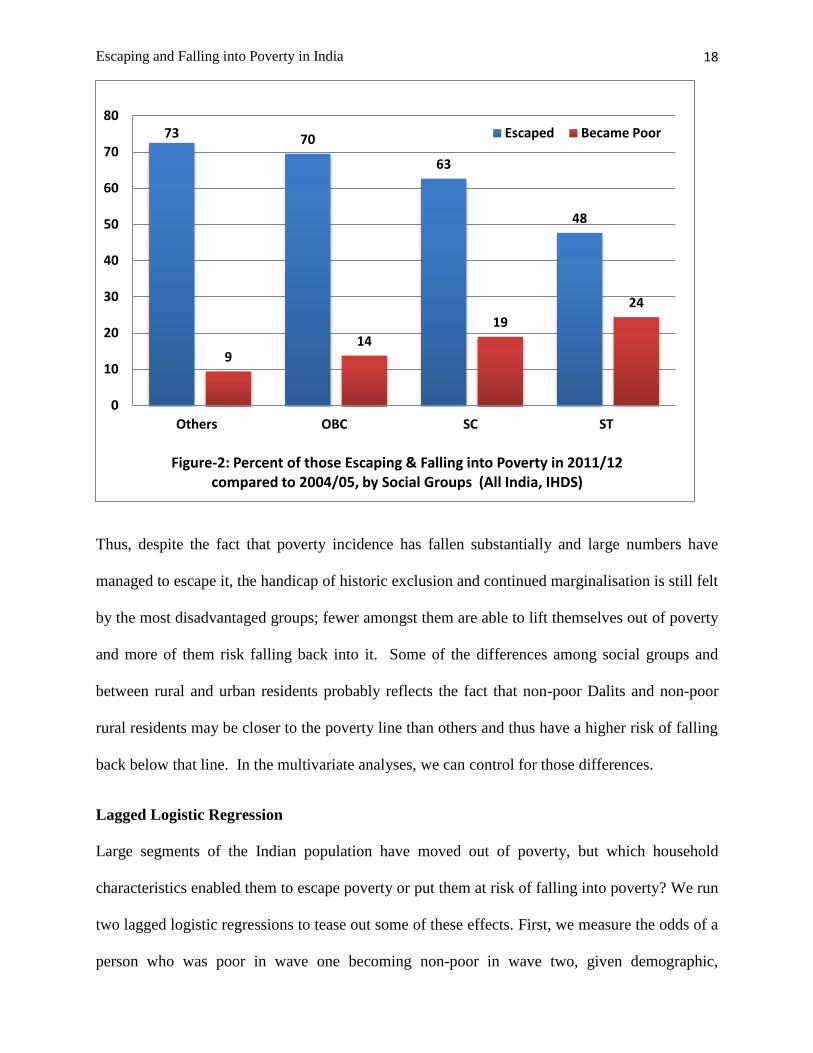
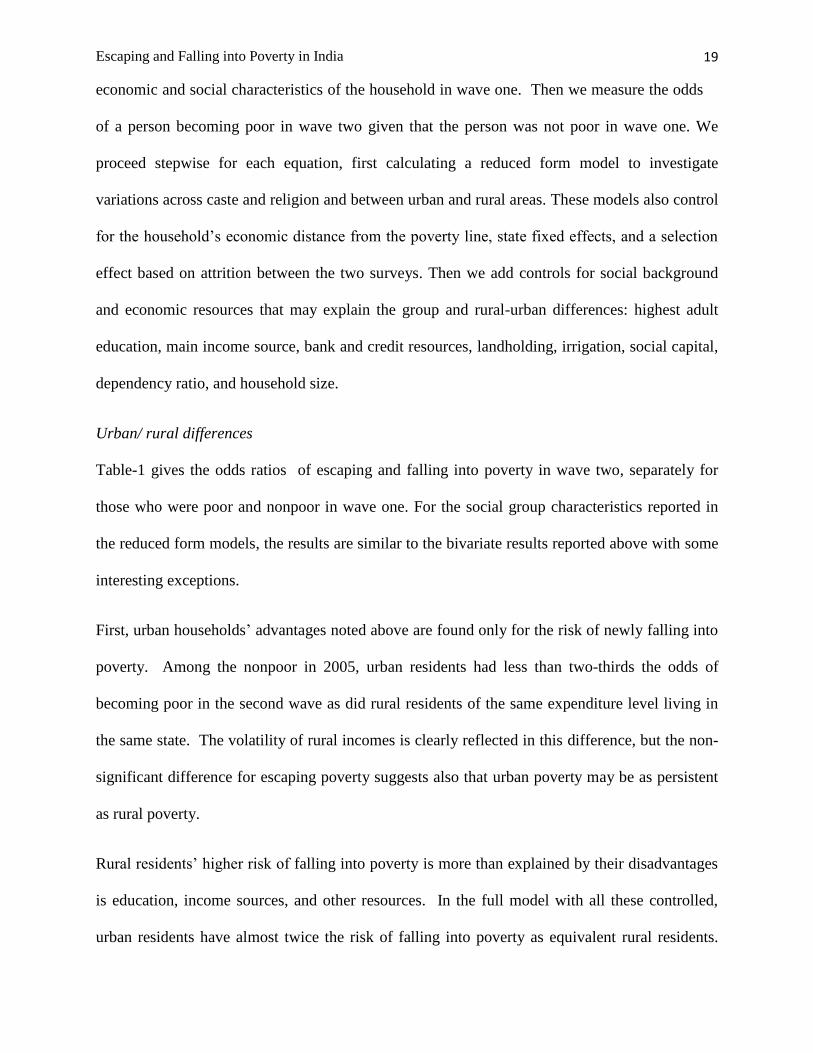
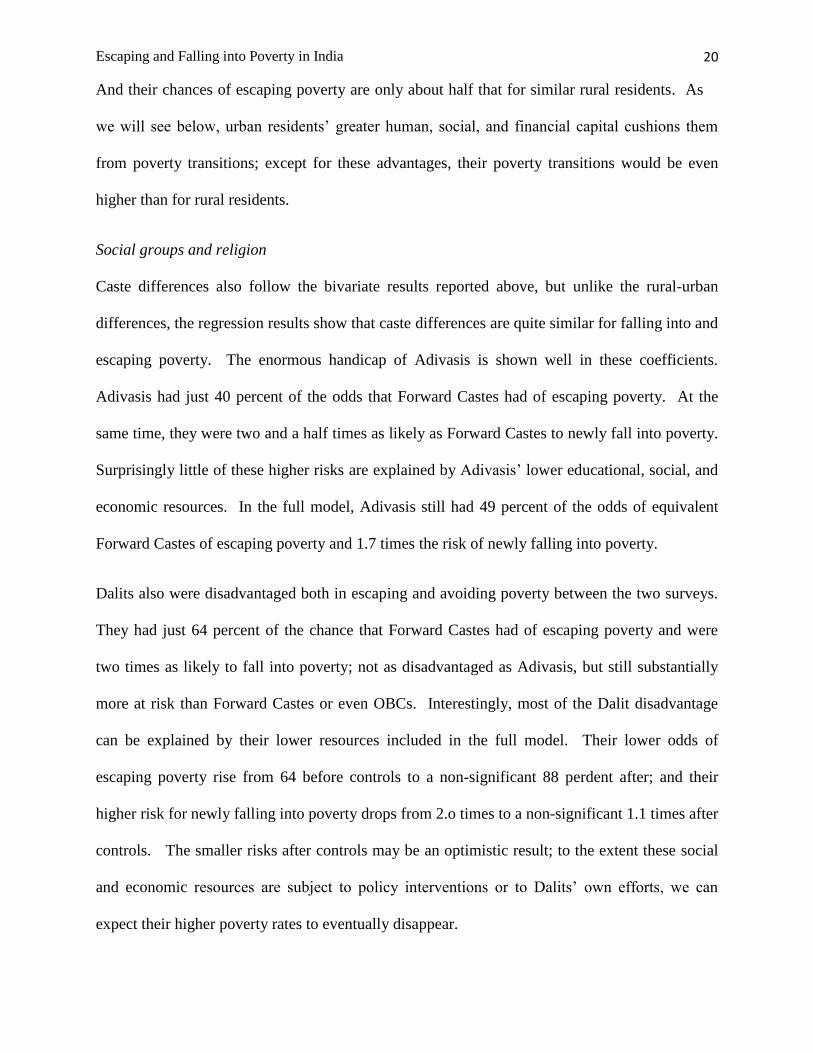
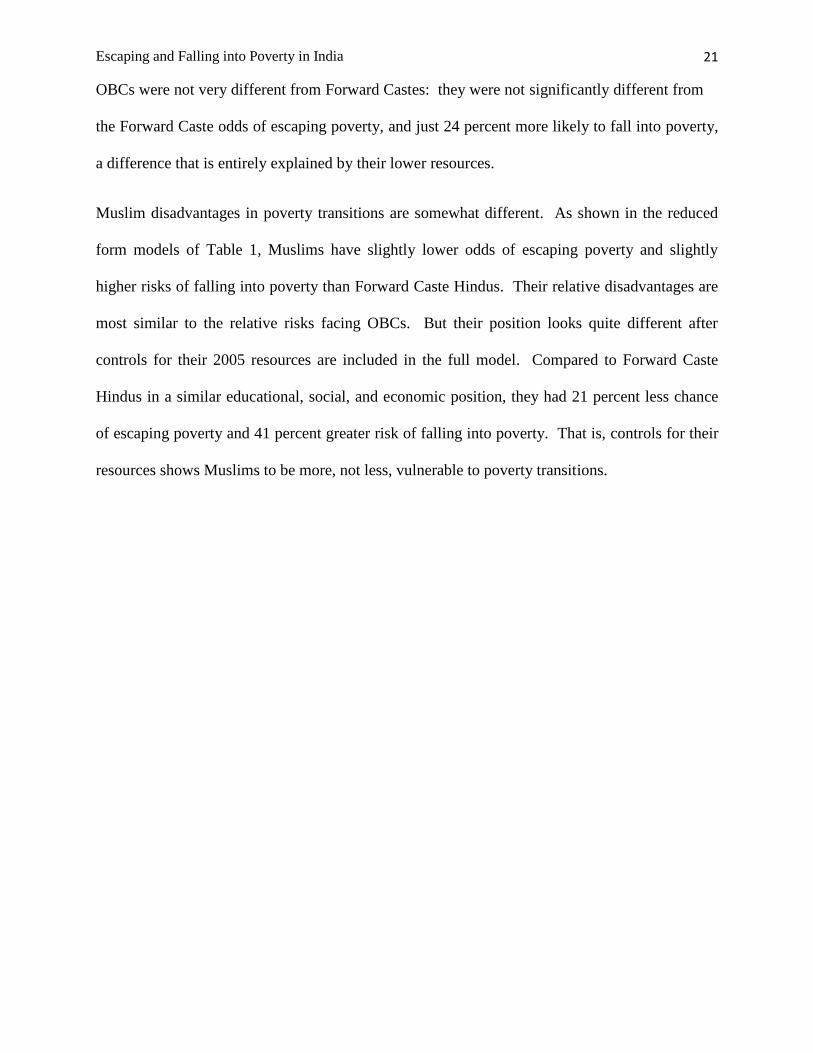
The share of those escaping poverty varies even more significantly across social groups (Figure
2). Escaping poverty is closely tied to traditional privilege. The largest shares are from amongst
the Forward Castes (73 percent of the previously poor had become nonpoor by 2012) followed
by the OBCs with 70 percent escaping poverty. The Dalit poor fared less at 63 percent escaping
over seven years. But by far the most disadvantaged were the Adivasi poor among whom only
48 percent managed to leave poverty between the two surveys.
The risk of becoming newly poor follows the same pattern of immiseration across social groups.
Among Adivasis who were not poor in 2005, 24 percent had become poor by 2012. Dalits follow
next with 19 percent of the previously nonpoor falling into poverty. But only 14 percent of
nonpoor OBCs had become poor between the two surveys, and an even lower 9 percent for
Forward castes.
Escaping and Falling into Poverty in India 18
Thus, despite the fact that poverty incidence has fallen substantially and large numbers have
managed to escape it, the handicap of historic exclusion and continued marginalisation is still felt
by the most disadvantaged groups; fewer amongst them are able to lift themselves out of poverty
and more of them risk falling back into it. Some of the differences among social groups and
between rural and urban residents probably reflects the fact that non-poor Dalits and non-poor
rural residents may be closer to the poverty line than others and thus have a higher risk of falling
back below that line. In the multivariate analyses, we can control for those differences.
Lagged Logistic Regression
Large segments of the Indian population have moved out of poverty, but which household
characteristics enabled them to escape poverty or put them at risk of falling into poverty? We run
two lagged logistic regressions to tease out some of these effects. First, we measure the odds of a
person who was poor in wave one becoming non-poor in wave two, given demographic,
73 70
63
48
9 14
19
24
0
10
20
30
40
50
60
70
80
Others OBC SC ST
Figure-2: Percent of those Escaping & Falling into Poverty in 2011/12 compared to 2004/05, by Social Groups (All India, IHDS)
Escaped Became Poor
Escaping and Falling into Poverty in India 19
economic and social characteristics of the household in wave one. Then we measure the odds
of a person becoming poor in wave two given that the person was not poor in wave one. We
proceed stepwise for each equation, first calculating a reduced form model to investigate
variations across caste and religion and between urban and rural areas. These models also control
for the household’s economic distance from the poverty line, state fixed effects, and a selection
effect based on attrition between the two surveys. Then we add controls for social background
and economic resources that may explain the group and rural-urban differences: highest adult
education, main income source, bank and credit resources, landholding, irrigation, social capital,
dependency ratio, and household size.
Urban/ rural differences
Table-1 gives the odds ratios of escaping and falling into poverty in wave two, separately for
those who were poor and nonpoor in wave one. For the social group characteristics reported in
the reduced form models, the results are similar to the bivariate results reported above with some
interesting exceptions.
First, urban households’ advantages noted above are found only for the risk of newly falling into
poverty. Among the nonpoor in 2005, urban residents had less than two-thirds the odds of
becoming poor in the second wave as did rural residents of the same expenditure level living in
the same state. The volatility of rural incomes is clearly reflected in this difference, but the non-
significant difference for escaping poverty suggests also that urban poverty may be as persistent
as rural poverty.
Rural residents’ higher risk of falling into poverty is more than explained by their disadvantages
is education, income sources, and other resources. In the full model with all these controlled,
urban residents have almost twice the risk of falling into poverty as equivalent rural residents.
Escaping and Falling into Poverty in India 20
And their chances of escaping poverty are only about half that for similar rural residents. As
we will see below, urban residents’ greater human, social, and financial capital cushions them
from poverty transitions; except for these advantages, their poverty transitions would be even
higher than for rural residents.
Social groups and religion
Caste differences also follow the bivariate results reported above, but unlike the rural-urban
differences, the regression results show that caste differences are quite similar for falling into and
escaping poverty. The enormous handicap of Adivasis is shown well in these coefficients.
Adivasis had just 40 percent of the odds that Forward Castes had of escaping poverty. At the
same time, they were two and a half times as likely as Forward Castes to newly fall into poverty.
Surprisingly little of these higher risks are explained by Adivasis’ lower educational, social, and
economic resources. In the full model, Adivasis still had 49 percent of the odds of equivalent
Forward Castes of escaping poverty and 1.7 times the risk of newly falling into poverty.
Dalits also were disadvantaged both in escaping and avoiding poverty between the two surveys.
They had just 64 percent of the chance that Forward Castes had of escaping poverty and were
two times as likely to fall into poverty; not as disadvantaged as Adivasis, but still substantially
more at risk than Forward Castes or even OBCs. Interestingly, most of the Dalit disadvantage
can be explained by their lower resources included in the full model. Their lower odds of
escaping poverty rise from 64 before controls to a non-significant 88 perdent after; and their
higher risk for newly falling into poverty drops from 2.o times to a non-significant 1.1 times after
controls. The smaller risks after controls may be an optimistic result; to the extent these social
and economic resources are subject to policy interventions or to Dalits’ own efforts, we can
expect their higher poverty rates to eventually disappear.
Escaping and Falling into Poverty in India 21
OBCs were not very different from Forward Castes: they were not significantly different from
the Forward Caste odds of escaping poverty, and just 24 percent more likely to fall into poverty,
a difference that is entirely explained by their lower resources.
Muslim disadvantages in poverty transitions are somewhat different. As shown in the reduced
form models of Table 1, Muslims have slightly lower odds of escaping poverty and slightly
higher risks of falling into poverty than Forward Caste Hindus. Their relative disadvantages are
most similar to the relative risks facing OBCs. But their position looks quite different after
controls for their 2005 resources are included in the full model. Compared to Forward Caste
Hindus in a similar educational, social, and economic position, they had 21 percent less chance
of escaping poverty and 41 percent greater risk of falling into poverty. That is, controls for their
resources shows Muslims to be more, not less, vulnerable to poverty transitions.
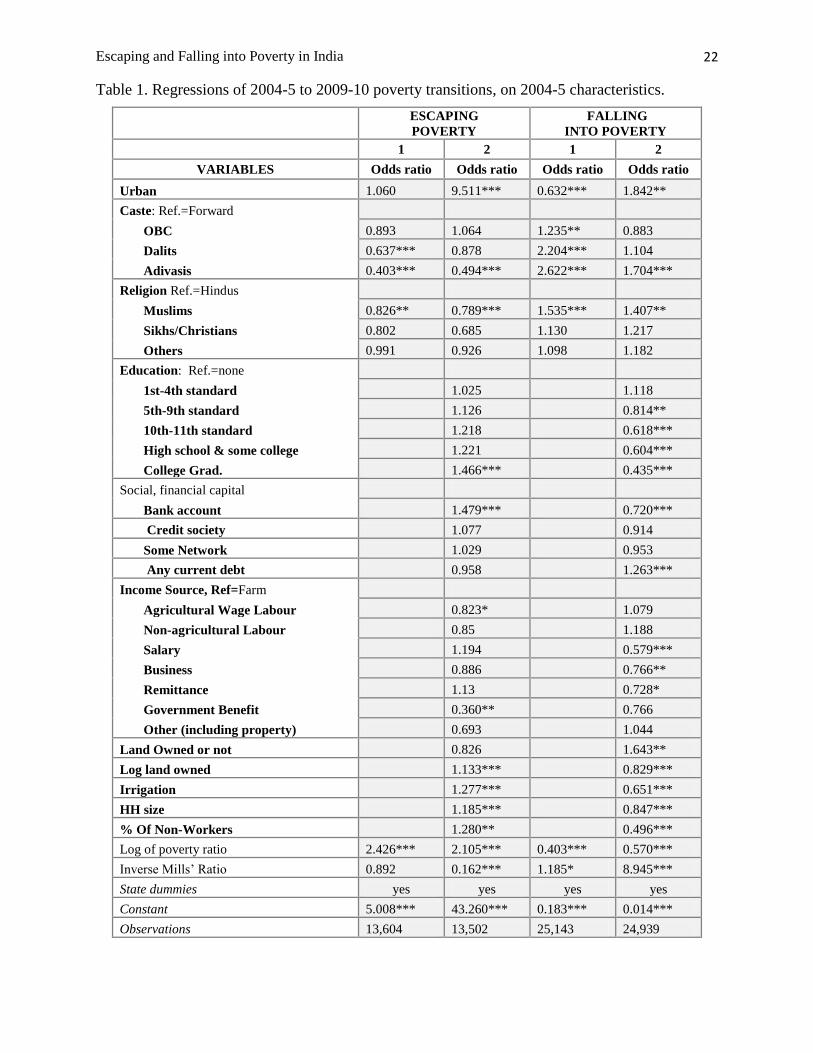
Escaping and Falling into Poverty in India 22
Table 1. Regressions of 2004-5 to 2009-10 poverty transitions, on 2004-5 characteristics.
ESCAPING
POVERTY
FALLING
INTO POVERTY
1 2 1 2
VARIABLES Odds ratio Odds ratio Odds ratio Odds ratio
Urban 1.060 9.511*** 0.632*** 1.842**
Caste: Ref.=Forward
OBC 0.893 1.064 1.235** 0.883
Dalits 0.637*** 0.878 2.204*** 1.104
Adivasis 0.403*** 0.494*** 2.622*** 1.704***
Religion Ref.=Hindus
Muslims 0.826** 0.789*** 1.535*** 1.407**
Sikhs/Christians 0.802 0.685 1.130 1.217
Others 0.991 0.926 1.098 1.182
Education: Ref.=none
1st-4th standard 1.025 1.118
5th-9th standard 1.126 0.814**
10th-11th standard 1.218 0.618***
High school & some college 1.221 0.604***
College Grad. 1.466*** 0.435***
Social, financial capital
Bank account 1.479*** 0.720***
Credit society 1.077 0.914
Some Network 1.029 0.953
Any current debt 0.958 1.263***
Income Source, Ref=Farm
Agricultural Wage Labour 0.823* 1.079
Non-agricultural Labour 0.85 1.188
Salary 1.194 0.579***
Business 0.886 0.766**
Remittance 1.13 0.728*
Government Benefit 0.360** 0.766
Other (including property) 0.693 1.044
Land Owned or not 0.826 1.643**
Log land owned 1.133*** 0.829***
Irrigation 1.277*** 0.651***
HH size 1.185*** 0.847***
% Of Non-Workers 1.280** 0.496***
Log of poverty ratio 2.426*** 2.105*** 0.403*** 0.570***
Inverse Mills’ Ratio 0.892 0.162*** 1.185* 8.945***
State dummies yes yes yes yes
Constant 5.008*** 43.260*** 0.183*** 0.014***
Observations 13,604 13,502 25,143 24,939
Escaping and Falling into Poverty in India 23
Source: Authors’ analysis of India Human Development Surveys.
Note: *** = p< .001; ** = p< .01; * = p< .05; + = p< .10.
Resources: Education
Education is the quintessential human capital credential and provides strong and consistent
protection against falling into poverty. A household with a college graduate is 56 percent less
likely to fall into poverty than an equivalent illiterate household (i.e., illiterate households are
over two times as likely to fall into poverty as a household with a college graduate). Even for
households who were poor in 2005, those with higher education were able to escape more often,
but the education effect on avoiding poverty is larger and extends further down the schooling
ladder than the education effect on escaping poverty.
More education is also part of the reason why urban residents escape poverty more often than
rural residents and why Forward Castes escape more often than Dalits. None of these differences
are completely explained by education. Logistic regressions controlling only for education (not
shown) suggest that substantial differences would remain even if the groups had equal education.
But educational differences are perhaps the most susceptible to policy intervention among the
resources we study so their importance in reducing (although not eliminating) age-old social
disadvantages should not be understated.
Income sources
Part of the reason education provides protection against poverty is that it provides entrance to
stable jobs. Employees with a regular monthly salary have lower odds of falling into poverty
than all other households. These salaried jobs have the dual advantage of paying well and
paying steadily. Only 20% percent of salaried households were in poverty to begin with in 2005.
And the chances of the other 80% percent entering poverty after seven years were among the
smallest for any type of household.
Escaping and Falling into Poverty in India 24
However, for the 20% percent of salaried households already in poverty in 2005, their salaried
positions were not nearly as good a benefit for escaping poverty by 2012. Poor salaried
households were not significantly more likely to exit poverty than were poor cultivating
households. For the poor, a steady salary may also mean steady poverty. The salaried advantage
is a low frequency of initial poverty because of higher than average incomes and low risk of
falling into poverty because of the steadiness of incomes, but a steady salary is not much comfort
if a household is already at a poverty level.
There are surprisingly few differences among other sources of income in households’ odds of
transitioning into or out of poverty once initial economic and social levels are held constant.
Cultivators appear to have no more nor no less chance of falling into or escaping from poverty
than do business households or those depending on wage labour. Wage labour households are
more likely to start out poor, but holding constant that initial level, they are no less likely than
equivalent cultivating or business households to escape poverty – nor no more likely to fall into
poverty if starting as non-poor. Nor are households primarily receiving remittances, government
benefits, or property income very different, although our samples of those households are
especially small so any conclusions about their transitions must be especially tentative.
Among cultivators, there is some evidence that larger landowners may have been better off due
to their asset stability; the more land owned the lower the risks of falling into poverty and the
greater the chances of escaping poverty. But more importantly, access to irrigation reduced
subsequent poverty risks for cultivators as they are not dependant on seasonal rains for their
water needs. Landowners with irrigation have 17% lower odds of falling into poverty as
compared to those landowners who depend on seasonal rains. Irrigation was even helpful for
cultivators escaping poverty, increasing their chances of escaping poverty by 13% over more
rain-dependent cultivators.
Escaping and Falling into Poverty in India 25
Finances
As would be expected, bank accounts help prevent falls into consumption poverty and are
significant also for rising out of poverty. The expansion of banking across India offers a major
opportunity to reduce the volatility of poverty transitions. Membership in a credit society
appears less successful in smoothing out consumption volatility in order to avoid poverty. The
IHDS results also confirm the importance of debt as a source of falling into poverty: Nonpoor
households who report having some debt in 2004-5 have a 26 percent greater chance of having
fallen into poverty seven years later; debts did not lower or raise the chances of poor households
escaping poverty between the two surveys.
Household Structure
Larger households have less chance of falling into poverty and more chance of escaping poverty
once there. More people may mean more labour resources for the future and a greater flexibility
to utilize all household resources. Similarly, a higher dependency ratio in 2005 also raises the
chances of escaping poverty or not falling into poverty in the next seven years. This may seem
counter-intuitive at first since cross-sectionaly, the fewer household members who work, the
more likely the household is to be in poverty. But some of these dependents in 2005 can later
enter the labour force, especially young men who finish their education, thus enabling the
household to escape poverty or to avoid falling back into poverty. And young women may finish
their schooling and marry out of the household thus raising the per capita consumption levels.
Measurement issues may play a role in the household size relationship since the poverty line is
drawn on the basis of consumption per capita, so that larger households have a larger
denominator. But, as we see in the robustness checks, poverty measures with lower penalties for
household size also show larger households had higher rates of transition out of poverty and less
chance of falling into poverty.
Escaping and Falling into Poverty in India 26
Selection effects and distance from the poverty line
Not surprisingly, the further above the poverty line a household is, the lower its risk of falling
into poverty seven years later. And poor households closest to the poverty line are the ones most
likely to escape poverty. Some of this beneficial effect can be attributed to other characteristics
of those households higher in per capita consumption: they tend to be better educated, more
likely to have a salaried job, and more likely to own irrigated land. But the remaining
importance of absolute levels of per capita consumption reminds us that the poor and the non-
poor are not discrete categories but necessarily somewhat arbitrary lines drawn in a consumption
continuum. Controlling for the a household position on this continuum is nevertheless important
since other differences, for instance, between Dalit and Forward Caste households, are often
more a result of the fact that poor Dalit households are much poorer than the poor Forward Caste
households. It is as much their greater poverty than their Dalit status that holds them back from
escaping poverty or increases their risks of falling back into poverty.
The probability of a household being re-interviewed is positively related to a higher risk of
falling into poverty or not escaping poverty. Re-interviewed households are in some ways
similar to households at greater risk. This may be somewhat surprising since poverty in 2004-5
is correlated with attrition between the two surveys. Re-interviewed households have much in
common with the measured social and economic characteristics of households at less risk of
falling into poverty. Larger rural households with more land were more often re-interviewed in
2011-12; households with less property ties to their villages and neighbourhoods were more
likely to have left after even years. The positive association between likelihood of attrition and
escapes from poverty only appears after these other factors are held constant. The types of
households who were not found – who had migrated out of their original villages or urban
neighbourhoods – resembled households who improved their economic position over the next
Escaping and Falling into Poverty in India 27
seven years. This resemblance may also suggest that unmeasured characteristics of
households who improved may be similar to the unmeasured characteristics of households who
left their original homes to make a better life somewhere else. In any case, the results show
some evidence of selection effects that temper our results somewhat because out-migrants are
not included in the sample.
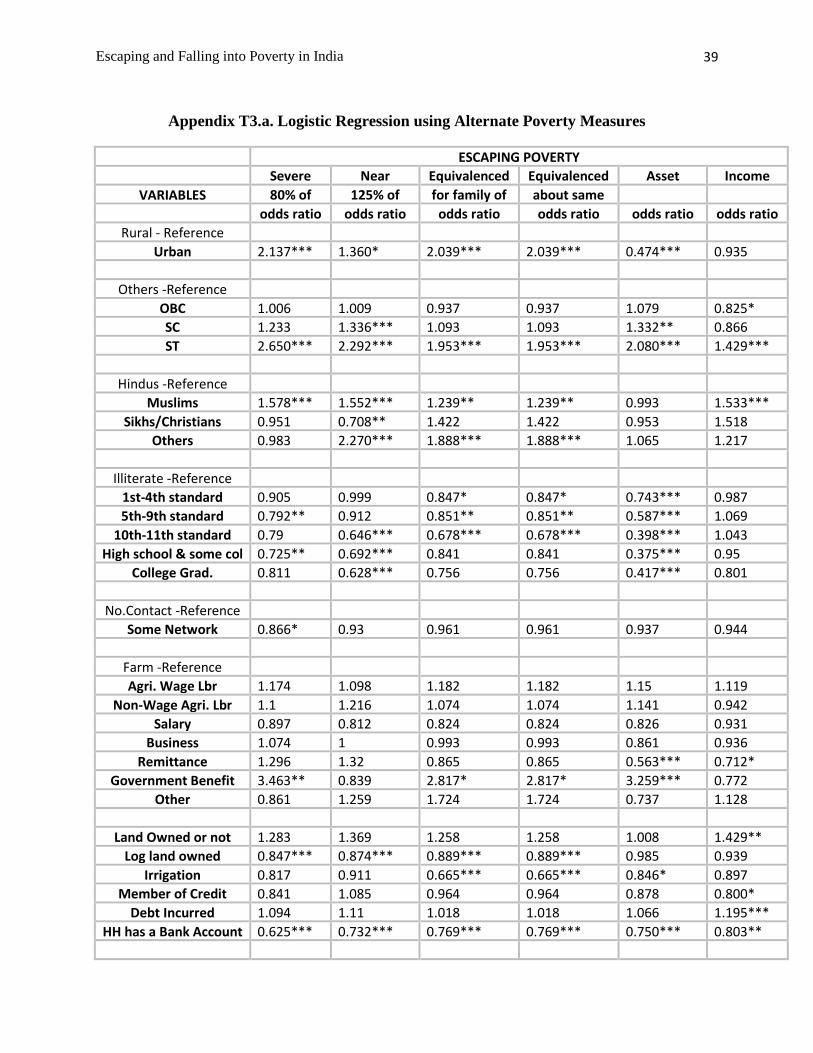
Robustness checks
Poverty definitions have long been an intense focus of debate both internationally (Atkinson,
forthcoming) and in India (Deaton and Kozel 2005). For our analysis of transitions into and out
of poverty, the important question is whether different definitions would yield different
conclusions. Our robustness checks vary assumptions about economies of scale, about where to
draw the poverty line, and about which economic dimension (consumption, income, or assets) is
used to define poverty. Results for each of these measures are reported in Appendix Table 3.
For the most part, the main conclusions described above are not affected by the choice of poverty
measure. For example, salaried employment protects against falls into severe poverty or into
near poverty; whether consumption, income, or assets are used to rank households; and whether
household size is adjusted to a per capita measure or less drastically to an “equivalenced”
measure using the square root of household size. Nor do any of these alternative poverty
measures reveal much effect of salaried employment on the odds of escaping poverty once there.
Some exceptions to the main patterns are understandable. For example, having a bank account
protects against falls into consumption poverty or into asset poverty, but not so clearly against
falls into income poverty. Also, poverty status between the two surveys is more stable when
poverty is measured in terms of household assets rather than household consumption: using asset
poverty, only 4 percent of Indians became newly poor between the two surveys and only 19
Escaping and Falling into Poverty in India 28
percent left poverty. The corresponding percentages for consumption poverty were 7 percent
and 29 percent.
Discussion
Our IHDS results reaffirm the conclusions that poverty has indeed fallen substantially over this
seven year period. In addition, they enable us to quantify the household transitions both out of
but also into poverty despite the overall trend. We find that the majority (65%) of households
who were poor in 2005 had escaped poverty by 2012. This is a remarkable achievement that
documents how even the poor shared economic prosperity during these times.
Their successes were only partially offset by the 14% of the non-poor who fell into poverty
during this period. These newly poor, however, raise the issue of transient poverty. Not all the
poor have always been poor, and public policy responses to the transient poor may need to be
quite different from policies for the long-term poor (Krishna 2007). Nevertheless, long-term
poverty remains a problem. Despite the fact that most of the 2005 poor had escaped poverty by
2012, most of the households who were poor in 2012 had also been poor in 2005.
Falling into poverty versus Exiting from poverty
A household’s level of human and physical capital is more important in explaining who avoids
falling into poverty than explaining which poor households escape poverty. Not surprisingly,
more education reduces not only levels of poverty but also especially new entrances into poverty.
Higher education also enhances exits from poverty but at a lower rate than reducing new
entrants. While neither entering nor remaining in poverty is common among the best educated,
education reduces poverty more because it reduces falls into poverty rather than helping families
escape. The best educated never experience poverty at all. Or, to observe from the other end,
illiteracy both raises the risk of falling into poverty and reduces the chances of escaping, but the
Escaping and Falling into Poverty in India 29
effect on falling into poverty is much greater than the effect on remaining in poverty. As a
consequence, the illiterate are especially vulnerable to spells of poverty.
Salaried employment reduces poverty in much the same way. Households with a salary income
have a steady and reliable source of support that cushions them against economic misfortune.
They rarely fall into poverty although on the rare instance when that happens, they are little more
likely to emerge quickly than are farmers or business owners.
Irrigated land protects farmers in much the same way as higher education or a salaried income
protects all households. Farmers with irrigation are less likely to fall into poverty than small
farmers without irrigation, but for the minority who have become poor, these assets are
somewhat helpful in escaping poverty.
Rural areas also have higher poverty rates primarily because rural households are more likely to
fall into poverty. An agricultural base induces dependency on the fluctuations of seasonal
weather patterns, and these fluctuations drive rural households into poverty more frequently than
urban households. These fluctuations may be increasing in frequency, such as fluctuations in the
Indian monsoon rains, and could be a manifestation of global climate change. However, rural
households escape poverty at rates not much different than urban households; in fact in the
reduced form model the rural-urban difference is not statistically significant. So, rural poverty
is disproportionately a problem of higher risks of falling into poverty. This higher risk is
explained by the opportunities available to rural households: less educated, less of a chance for
salaried jobs, fewer bank accounts; these and other differences are important enough that in the
full model comparing urban and rural households with equivalent characteristics, it is the urban
residents who have a higher risk of falling into poverty.
Escaping and Falling into Poverty in India 30
These background factors in 2005 are somewhat better at predicting which households avoid
falling into poverty than identifying households who escape from poverty. For the most part, the
measures which predict exiting poverty, also predict not falling into poverty, but the odds are
generally lower and sometimes not statistically significant. The caste variables are a partial
exception to these stronger effects on entrances than exits. Our analysis shows that while Dalits
and Adivasis have experienced major movements out of poverty, they still lag behind OBCs and
Forward Castes in both rates of exit from poverty and avoiding new falls into poverty. Dalits
and especially Adivasis suffer from the worst of both worlds: they have lower rates of escape and
higher rates of entry. Much of the disadvantage for Dalits can be explained by their lower levels
of human capital, especially their lower education, the lack of salaried employment, and their
smaller households. But these same factors do not explain as much of the Adivasi disadvantage.
Adivasis remain at a higher risk of poverty – both entries and lack of exits – than equivalent
Forward Caste Hindus. They suffer equally from the risks of falling into transient poverty and of
remaining there, permanently poor.
Further research
The availability of panel data greatly expands our ability to understand the dynamics of poverty.
In this paper, we have concentrated on the prior characteristics of households who escape or fall
into poverty. The results help answer the question of who is most at risk of falling into poverty
and who has the best prospects of escaping poverty. Many other questions can be asked of these
panel data that are beyond the scope of the current paper. One fruitful area for exploration would
be to investigate the intervening events between the two surveys that distinguish households who
escaped poverty from those who remained; and households who fell into poverty from those who
avoided that fate (e.g, Bane and Ellwood 1986). Household divisions, deaths and illnesses, new
sources of income are among the many events that may propel households out of or into poverty.
Escaping and Falling into Poverty in India 31
Our analyses have also concentrated on the household characteristics that predict entrances
into and exits from poverty, but households’ poverty transitions also depend on economic and
social factors beyond the borders of the household itself. Transportation connections to
employment, climate patterns, industry structure, and civil unrest are examples of the many
contextual forces that need to be studied. Differences in public policies and in the
implementation of those policies are especially important for poverty transitions. Other research
using the IHDS data has shown that participation in the Mahatma Gandhi National Rural
Employment Program may have played a useful role in reducing poverty (Desai, Vashistha, and
Joshi 2015).
Transient and Chronic Poverty
A growing literature on the dynamics of poverty has focused more on the questions of chronic
poverty and poverty traps than on the questions of entries and exits that we have emphasized
(Shepherd and Mehta 2006; Glauben et al., 2012; Naschold 2012). While analyses of poverty
durations are an obvious advance over earlier research that could look only at a single moment of
poverty, we believe that identifying which households exit or enter into poverty offers a useful,
more dynamic, alternative to earlier work on poverty durations. The characteristics of
households who remain poor over the two IHDS waves identify the factors that raise the risk of
chronic poverty. Similarly, the characteristics of nonpoor households who subsequently fall into
poverty identify who is most at risk of transient poverty.
We also believe that the past poverty literature often pays insufficient attention to transient
poverty, as if falling into poverty was less worrisome than remaining in poverty. Is it really
worse for one household to be poor for two years than for two households to be poor for a year?
Certainly, few have asked the poor themselves which experience is worse (although see Davis
2007). One can imagine that under some circumstances, transient poverty might be more
Escaping and Falling into Poverty in India 32
distressing for previously nonpoor households than is persistent poverty for the long-term
poor. Anirudh Krishna has been especially insistent that we should not neglect falling into
poverty: “Falling into poverty is frequent, traumatic, frequently irreversible, and therefore
serious enough to merit separate policy attention” (Krishna 2007: 1951).
Nor has there been enough research on the consequences of transient versus persistent poverty,
for the children being raised in those households, for the physical and mental health of all the
household members, or for the marriage bonds that hold nuclear households together or for the
filial and fraternal bonds that hold together more extended households (but see Benzeval and
Judge 2001, Baevrea and Kravdal 2013). The sometimes too casual dismissal of transient
poverty in the research literature (“being poor at a few moments in time” Barrett and Carter
2013) seems to suggest that poverty consequences must accumulate over time making persistent
poverty more of the problem, but that is a largely unexamined assumption. Until we have better
data on these consequences, a more balanced approach between new entries into poverty and the
inability to escape poverty would leave us in a better position for future understanding.
Conclusion
Poverty research in India has enjoyed a long and distinguished history. We are ready to move to
the next stage by better investigating the dynamics of entries and exits into poverty. Poverty is
always a misfortune, but because different types of poverty may have different causes and
consequences, we need to move beyond more static investigations or even analyses of trends
based on repeated cross-sections.
This first look at IHDS panel data suggests that traditional social and economic disadvantage are
reproduced in both types of poverty transitions: Dalits and Adivasis are more susceptible both to
entry into and lack of escape from poverty than are Forward Castes or even OBCs. But other
Escaping and Falling into Poverty in India 33
characteristics prove more important for one type of transition than another. Salaried work
and more education are especially important for avoiding falls into poverty but they have less or
even no role in predicting escapes from poverty. Our results demonstrate each of these possible
relationships and thus reinforce the need to explore poverty dynamics more fully.
Escaping and Falling into Poverty in India 34
References
Aldeman, Irma., K. Subbarao, and Prem Vashishtha. "Some dynamic aspects of rural poverty
in India." Economic and Political Weekly 20.39 (1985): A103-A116.
Atkinson, Tony et al., Commission on Global Poverty: Report on Measuring Poverty.
Washington DC: World Bank (forthcoming).
Baevrea, Kare and Oystein Kravdal. "The effects of earlier income variation on mortality: An
analysis of Norwegian register data." Population Studies 68.1 (2014): 81‐ 94.
Bane, Mary Jo, and David T. Ellwood. "Slipping into and out of poverty: The dynamics of
spells." Journal of Human Resources 21.1 (1986): 1‐ 23.
Baulch, Bob, and Neil McCulloch. "Being poor and becoming poor: Poverty status and
poverty transitions in rural Pakistan." Journal of Asian and African Studies 37.2 (2002): 168-
185.
Benzeval, Michaela, and Ken Judge. "Income and health: the time dimension." Social science
& medicine 52.9 (2001): 1371-1390.
Bhide, Shashanka and Aasha Kapur Mehta. "Economic growth and poverty
dynamics." Chronic Poverty Research Centre Working Paper 120 (2008).
Binswanger, Hans P., and R. P. Singh. "Intergenerational Transmission of Wealth in India's
Semi-Arid Tropics." Indian Journal of Agricultural Economics49.1 (1994): 46.
Davis, Peter. "Discussions among the poor: Exploring poverty dynamics with focus groups in
Bangladesh." Working paper, London: Chronic Poverty Research Centre, Number 84
(2007).
Deaton, Angus and Valerie Kozel. "Data and Dogma: The Great Indian Poverty Debate."
World Bank Research Observer 20.2 (2005): 177‐ 99.
Desai Desai, Sonalde B, Amaresh Dubey, Brij Lal Joshi, Mitali Sen, Abusaleh Shariff, and
Reeve Vanneman. 2010. Human Development in India: Challenges for a Society in
Transition. New Delhi: Oxford University Press (2010)
Desai, Sonalde, Prem Vashishtha, and Omkar Joshi. Mahatma Gandhi National Rural
Employment Guarantee Act: A Catalyst for Rural Transformation. New Delhi: National
Council of Applied Economic Research (2015).
Dhamija, Nidhi and Shashanka Bhide. "Poverty in rural India: variations in factors
influencing dynamics of chronic poverty." Journal of International Development 25.5
(2013): 674-695.
Escaping and Falling into Poverty in India 35
Gaiha, Raghav. "Are the chronically poor also the poorest in rural India?." Development
and Change 20.2 (1989): 295-322.
Gaiha, Raghav and Katsushi Imai. ‘Vulnerability, shocks and persistence of poverty:
estimates for semi‐ arid rural South India. Oxford Development Studies, 32.2 (2004), 261-
281.
Gaiha, Raghav and Anil B. Deolalikar. "Persistent, expected and innate poverty: estimates
for semi-arid rural South India, 1975—1984." Cambridge Journal of Economics 17.4 (1993):
409-421.
Glauben, Thomas, Thomas Herzfeld, Scott Rozelle, and Xiaobing Wang. "Persistent poverty
in rural China: Where, why, and how to escape?." World Development 40.4 (2012): 784-795.
Hatlebakk, Magnus. "Poverty dynamics in rural Orissa: Transitions in assets and occupations
over generations." Journal of Development Studies 50.6 (2014): 877-893.
Himanshu 2010 Planning Commission, Report on Construction of Tendulkar Poverty Lines
http://planningcommission.nic.in/reports/genrep/himanshu.pdf
India Human Development Survey. http://ihds.info/IHDS-II (2016).
Krishna, Anirudh. "Falling into Poverty: Other Side of Poverty Reduction" Economic and
Political Weekly 38.6 (2003): 533‐ 542.Krishna, Anirudh. "For reducing poverty faster:
Target reasons before people." World development 35.11 (2007): 1947-1960.
Krishna, Anirudh. One Illness Away: Why People Become Poor and How They Escape
Poverty. New York: Oxford University Press (2010).
Krishna, Anirudh, and Abusaleh Shariff. "The irrelevance of national strategies? Rural
poverty dynamics in states and regions of India, 1993–2005." World Development 39.4
(2011): 533-549.
Krishna, Anirudh, Mahesh Kapila, Mahendra Porwal, and Virpal Singh. "Why growth is not
enough: Household poverty dynamics in Northeast Gujarat, India." Journal of Development
Studies 41.7 (2005): 1163-1192.
McCulloch, Neil, and Bob Baulch. "Simulating the impact of policy upon chronic and
transitory poverty in rural Pakistan." The Journal of Development Studies 36.6 (2000): 100-
130.
Mehta, Aasha Kapur, and Andrew Shepherd. Chronic poverty and development policy in
India. Sage, 2006.
Mehta, Aasha Kapur, and Shashanka Bhide. "Issues in Chronic Poverty: Panel Data based
Analysis." Chronic Poverty Research Centre Working Paper (2003).
Escaping and Falling into Poverty in India 36
Naschold, Felix. "“The poor stay poor”: Household asset poverty traps in rural semi-arid
India." World Development 40.10 (2012): 2033-2043.
Planning Commission. “Report of the Expert Group to Review the Methodology for
Estimation of Poverty.” Government of India, 2009.
Shepherd, Andrew and Aasha Kapur Mehta. "Chronic Poverty in India." Pp. 23‐ 52 in Aasha
Kapur Mehta and Andrew Shepherd (ed.), Chronic Poverty and Development Policy in India.
New Delhi: Sage (2006).
Singh, Rajendra Pal, and Hans P. Binswanger. "Income growth in poor dryland areas of
India's semi-arid tropics." Indian Journal of Agricultural Economics 48.1 (1993): 51.
Thorat, Sukhadeo, and Amaresh Dubey. "Has growth been socially inclusive during 1993–
94–2009–10." Economic and Political Weekly 47.10 (2012): 43-53.
Escaping and Falling into Poverty in India 37
Appendix Tables
Table A1. Descriptive Statistics
Variable Observations Mean Std. Dev. Min Max
Rural/Urban 38853 0.3149821 0.4645147 0 1
Social Group 38853 2.0872 0.9196115 1 4
Religious Group 38853 1.262605 0.6186895 1 4
Education level (6) 38803 6.573255 5.011102 0 15
Social Network 38853 0.5516176 0.4973349 0 1
Main Income Source 38853 3.162278 1.699679 1 9
Land owned or not 38853 0.9842226 0.124615 0 1
Agri. Land owned 38853 -1.348687 1.312536 -7.119252 4.393673
Irrigation 38853 0.2291458 0.4202886 0 1
Membership to credit society 38797 0.0718612 0.2582613 0 1
Current Debt 38586 0.4431659 0.4967658 0 1
HH has Bank A/C 38853 0.3629846 0.4370041 0 1
Eligible women absent 38853 0.1747355 0.3797456 0 1
Log Poverty Ratio 38809 0.2668665 0.6383013 -4.78343 4.529401
HH Size 38853 5.849072 2.996175 1 38
Percentage of Non-workers 38853 0.570582 0.2316604 0 1
Source: Authors’ calculations from the Indian Human Development Survey.
Note: Observations have been weighted according to weights in the file to reflect the 2011 Indian
population.
Escaping and Falling into Poverty in India 38
Appendix Table A2. Probit analysis of attrition between survey waves.
Coeff.
Std. err.
urban 0.4141 *** 0.0218
any farm land -0.3104 *** 0.0207
highest adult education 0.0073 ** 0.0022
# of household assets 0.0099 *** 0.0020
household size -0.1320 *** 0.0042
religion (ref=Hindu)
Muslim 0.0944 *** 0.0270
Christian 0.0512
0.0464
Sikh 0.0201
0.0666
other 0.0741
0.0581
caste (ref= Forward)
OBC -0.0445 + 0.0233
Dalit 0.0588 + 0.0354
Adivasi 0.1007 *** 0.0206
month of interview (ref=January)
February -0.0628
0.0482
March -0.0653
0.0570
April -0.0891
0.0581
May -0.0062
0.0581
June -0.0437
0.0581
July 0.0513
0.0588
August 0.1940 ** 0.0602
September 0.3303 *** 0.0735
October -0.0393
0.0798
November 0.0465
0.0539
December -0.0421
0.0529
states (ref= Tamil Nadu)
Jammu & Kashmir -0.2360 ** 0.0813
Himachal Pradesh -0.1484 * 0.0666
Uttarakhand -0.0196
0.0898
Punjab 0.0171
0.0609
Haryana 0.1009 + 0.0591
Delhi 0.5909 *** 0.0654
Uttar Pradesh 0.0923
0.0617
Bihar 0.1424 * 0.0713
Jharkhand 0.3116 *** 0.0637
Rajasthan 0.0863
0.0650
Chhattisgarh -0.4510 *** 0.0833
Madhya Pradesh 0.0362
0.0548
Northeast 0.2771 *** 0.0674
Assam 0.3998 *** 0.0645
West Bengal -0.2743 *** 0.0538
Orissa 0.0659
0.0541
Gujarat 0.3110 *** 0.0474
Maharashtra & Goa -0.1543 ** 0.0485
Andhra Pradesh 0.3574 *** 0.0514
Karnataka 0.3141 *** 0.0485
Kerala 0.0392
0.0531
constant -0.7781 *** 0.0687
Escaping and Falling into Poverty in India 39
Appendix T3.a. Logistic Regression using Alternate Poverty Measures
ESCAPING POVERTY
Severe
Poverty
Near
Poverty
Equivalenced
Poverty cut
off
Equivalenced
Poverty cut
off
Asset
Poverty
Income
Poverty VARIABLES 80% of
Poverty
Line
125% of
Poverty
Line
for family of
5
about same
as Poverty
line
odds ratio odds ratio odds ratio odds ratio odds ratio odds ratio
Rural - Reference
Urban 2.137*** 1.360* 2.039*** 2.039*** 0.474*** 0.935
Others -Reference
OBC 1.006 1.009 0.937 0.937 1.079 0.825*
SC 1.233 1.336*** 1.093 1.093 1.332** 0.866
ST 2.650*** 2.292*** 1.953*** 1.953*** 2.080*** 1.429***
Hindus -Reference
Muslims 1.578*** 1.552*** 1.239** 1.239** 0.993 1.533***
Sikhs/Christians 0.951 0.708** 1.422 1.422 0.953 1.518
Others 0.983 2.270*** 1.888*** 1.888*** 1.065 1.217
Illiterate -Reference
1st-4th standard 0.905 0.999 0.847* 0.847* 0.743*** 0.987
5th-9th standard 0.792** 0.912 0.851** 0.851** 0.587*** 1.069
10th-11th standard 0.79 0.646*** 0.678*** 0.678*** 0.398*** 1.043
High school & some col 0.725** 0.692*** 0.841 0.841 0.375*** 0.95
College Grad. 0.811 0.628*** 0.756 0.756 0.417*** 0.801
No.Contact -Reference
Some Network 0.866* 0.93 0.961 0.961 0.937 0.944
Farm -Reference
Agri. Wage Lbr 1.174 1.098 1.182 1.182 1.15 1.119
Non-Wage Agri. Lbr 1.1 1.216 1.074 1.074 1.141 0.942
Salary 0.897 0.812 0.824 0.824 0.826 0.931
Business 1.074 1 0.993 0.993 0.861 0.936
Remittance 1.296 1.32 0.865 0.865 0.563*** 0.712*
Government Benefit 3.463** 0.839 2.817* 2.817* 3.259*** 0.772
Other 0.861 1.259 1.724 1.724 0.737 1.128
Land Owned or not 1.283 1.369 1.258 1.258 1.008 1.429**
Log land owned 0.847*** 0.874*** 0.889*** 0.889*** 0.985 0.939
Irrigation 0.817 0.911 0.665*** 0.665*** 0.846* 0.897
Member of Credit
Society
0.841 1.085 0.964 0.964 0.878 0.800*
Debt Incurred 1.094 1.11 1.018 1.018 1.066 1.195***
HH has a Bank Account 0.625*** 0.732*** 0.769*** 0.769*** 0.750*** 0.803**
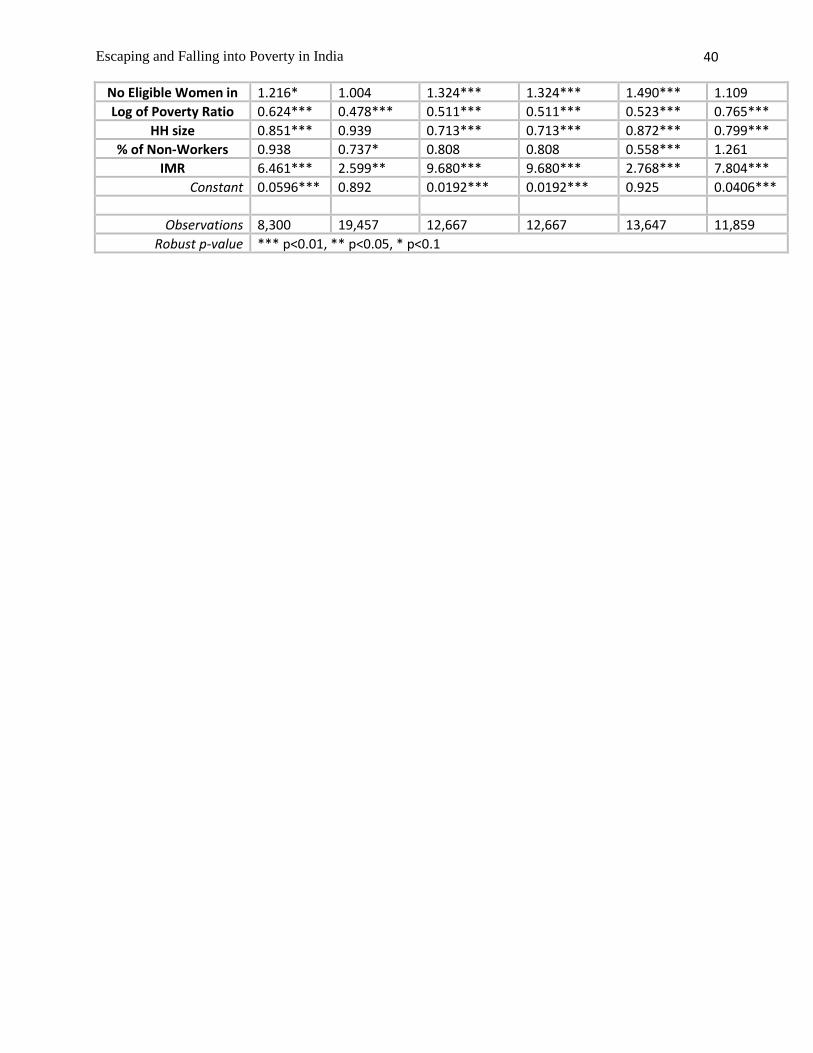
Escaping and Falling into Poverty in India 40
No Eligible Women in
Household
1.216* 1.004 1.324*** 1.324*** 1.490*** 1.109
Log of Poverty Ratio 0.624*** 0.478*** 0.511*** 0.511*** 0.523*** 0.765***
HH size 0.851*** 0.939 0.713*** 0.713*** 0.872*** 0.799***
% of Non-Workers 0.938 0.737* 0.808 0.808 0.558*** 1.261
IMR 6.461*** 2.599** 9.680*** 9.680*** 2.768*** 7.804***
Constant 0.0596*** 0.892 0.0192*** 0.0192*** 0.925 0.0406***
Observations 8,300 19,457 12,667 12,667 13,647 11,859
Robust p-value *** p<0.01, ** p<0.05, * p<0.1
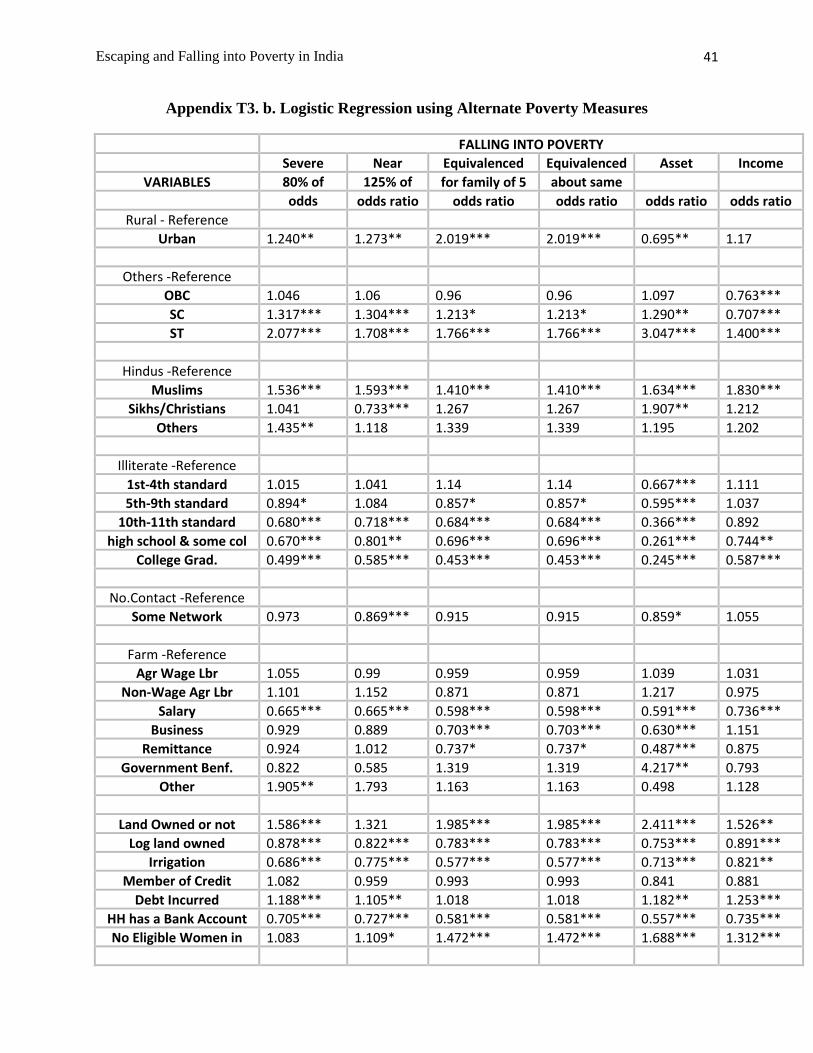
Escaping and Falling into Poverty in India 41
Appendix T3. b. Logistic Regression using Alternate Poverty Measures
FALLING INTO POVERTY
Severe
Poverty
Near
Poverty
Equivalenced
Poverty cut off
Equivalenced
Poverty cut
off
Asset
Poverty
Income
Poverty VARIABLES 80% of
Poverty
Line
125% of
Poverty
Line
for family of 5 about same
as Poverty
line
odds
ratioratio
odds ratio odds ratio odds ratio odds ratio odds ratio
Rural - Reference
Urban 1.240** 1.273** 2.019*** 2.019*** 0.695** 1.17
Others -Reference
OBC 1.046 1.06 0.96 0.96 1.097 0.763***
SC 1.317*** 1.304*** 1.213* 1.213* 1.290** 0.707***
ST 2.077*** 1.708*** 1.766*** 1.766*** 3.047*** 1.400***
Hindus -Reference
Muslims 1.536*** 1.593*** 1.410*** 1.410*** 1.634*** 1.830***
Sikhs/Christians 1.041 0.733*** 1.267 1.267 1.907** 1.212
Others 1.435** 1.118 1.339 1.339 1.195 1.202
Illiterate -Reference
1st-4th standard 1.015 1.041 1.14 1.14 0.667*** 1.111
5th-9th standard 0.894* 1.084 0.857* 0.857* 0.595*** 1.037
10th-11th standard 0.680*** 0.718*** 0.684*** 0.684*** 0.366*** 0.892
high school & some col 0.670*** 0.801** 0.696*** 0.696*** 0.261*** 0.744**
College Grad. 0.499*** 0.585*** 0.453*** 0.453*** 0.245*** 0.587***
No.Contact -Reference
Some Network 0.973 0.869*** 0.915 0.915 0.859* 1.055
Farm -Reference
Agr Wage Lbr 1.055 0.99 0.959 0.959 1.039 1.031
Non-Wage Agr Lbr 1.101 1.152 0.871 0.871 1.217 0.975
Salary 0.665*** 0.665*** 0.598*** 0.598*** 0.591*** 0.736***
Business 0.929 0.889 0.703*** 0.703*** 0.630*** 1.151
Remittance 0.924 1.012 0.737* 0.737* 0.487*** 0.875
Government Benf. 0.822 0.585 1.319 1.319 4.217** 0.793
Other 1.905** 1.793 1.163 1.163 0.498 1.128
Land Owned or not 1.586*** 1.321 1.985*** 1.985*** 2.411*** 1.526**
Log land owned 0.878*** 0.822*** 0.783*** 0.783*** 0.753*** 0.891***
Irrigation 0.686*** 0.775*** 0.577*** 0.577*** 0.713*** 0.821**
Member of Credit
Society
1.082 0.959 0.993 0.993 0.841 0.881
Debt Incurred 1.188*** 1.105** 1.018 1.018 1.182** 1.253***
HH has a Bank Account 0.705*** 0.727*** 0.581*** 0.581*** 0.557*** 0.735***
No Eligible Women in
Household
1.083 1.109* 1.472*** 1.472*** 1.688*** 1.312***
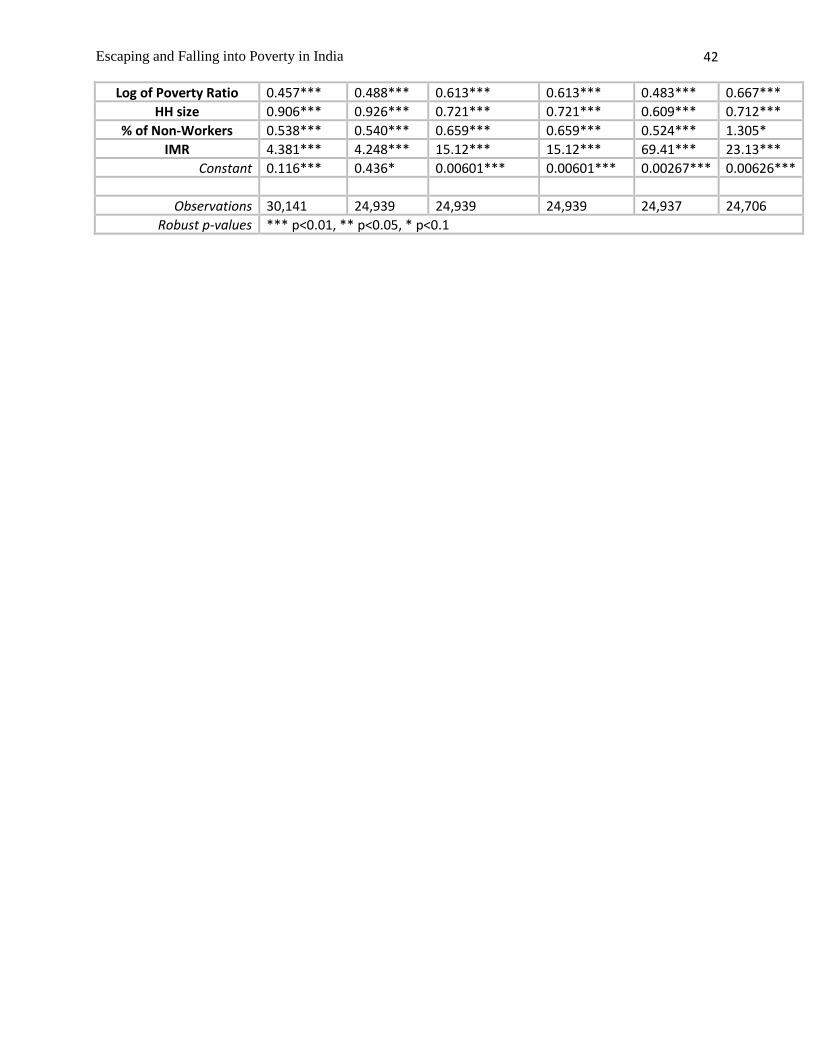
Escaping and Falling into Poverty in India 42
Log of Poverty Ratio 0.457*** 0.488*** 0.613*** 0.613*** 0.483*** 0.667***
HH size 0.906*** 0.926*** 0.721*** 0.721*** 0.609*** 0.712***
% of Non-Workers 0.538*** 0.540*** 0.659*** 0.659*** 0.524*** 1.305*
IMR 4.381*** 4.248*** 15.12*** 15.12*** 69.41*** 23.13***
Constant 0.116*** 0.436* 0.00601*** 0.00601*** 0.00267*** 0.00626***
Observations 30,141 24,939 24,939 24,939 24,937 24,706
Robust p-values *** p<0.01, ** p<0.05, * p<0.1