Embed Size (px)
Citation preview

ESB Moneypoint
ANNUAL ENVIRONMENTAL REPORT 2013.
1

Moneypoint Generating Station AER 2013 Table of Contents
Introduction ........................................................................................................................................................ 3
1.2 Name and Location .................................................................................................................................. 3 1.3 Description of Activities ............................................................................................................................ 3 1.4 Moneypoint Environmental Policy and Key Objectives. ........................................................................... 4 1.5 Environmental Management Structure and Responsibility ...................................................................... 5 1.6 Organisational Chart ................................................................................................................................ 6
3 Emissions to Water ......................................................................................................................................... 7 3.1 Surface discharges to water .................................................................................................................... 7 3.2 Toxicity/ Leachate Analysis: ................................................................................................................... 10 3.3 Annual Metals ........................................................................................................................................ 11 Ash Leachate Results 2013 ......................................................................................................................... 11 3.5 Comparison between EPA and ESB surface water monitoring results ................................................. 13 4 Emissions to Atmosphere ......................................................................................................................... 14 4.1 Iso-kinetic Dust sample results 2013 ..................................................................................................... 14 4.2 Emission Summary Report - Calendar monthly mean values ............................................................... 15
5 Waste Management Report .......................................................................................................................... 17 6 Energy and Water Consumption .................................................................................................................. 20
6.1 Energy Consumption MW ...................................................................................................................... 20 6.2 Energy Generated MW .......................................................................................................................... 20 6.3 Water Consumption m3 .......................................................................................................................... 20 7.1 Complaints Summary ............................................................................................................................. 21 7.2 Incidents Summary ................................................................................................................................ 21 7.3 Queries received Summary ................................................................................................................... 21
8.0 Management of the Activity ....................................................................................................................... 22 8.1 Environmental Management Programme 2013 ..................................................................................... 22 8.2 Environmental Management Programme 2014 ..................................................................................... 23
9.0 PER Report for 2013 ................................................................................................................................. 23
10.0 Licence Specific Reports ......................................................................................................................... 26 10.1 Noise Monitoring Reports .................................................................................................................... 26 10.2 Report on List I and List II Substance Reductions ............................................................................... 26 10.3 Review of Environmental Liabilities Insurance Cover .......................................................................... 26 10.4 Bund Testing ........................................................................................................................................ 26 10.5 Tank and Pipeline Test & Inspection Report ....................................................................................... 26 10.6 Groundwater Monitoring ...................................................................................................................... 27 10.8 FGD By-Product Landfill Status Report ............................................................................................... 57
Appendix 1 Noise Report 2013 ........................................................................................................................ 58
Appendix 2 Site map ........................................................................................................................................ 61
Appendix 3 Location of Surface water sample locations ................................................................................ 62
2

Moneypoint Generating Station AER 2013 Introduction IPPC Licence Number 605-03
1.2 Name and Location Electricity Supply Board Moneypoint Generating Station Kilrush Co Clare.
1.3 Description of Activities The production of energy in combustion plant, rated thermal input of which is greater than 50 MW. Moneypoint Station has three identical generating units, each of which generate 305MW giving a total electricity generating capacity of 915MWe. These units are conventional, independent steam generating units, each with boiler, turbine and auxiliary plant. The boilers can operate on either coal or heavy fuel oil. In practice, HFO is only used as an occasional supplement for coal (approximately 30,000 tonnes of HFO pa. Approximately 2,000,000 tonnes of coal are consumed each year. Note: This report covers Environmental activities for the period of January 2013 to December 2013. We had one EPA audit in 2013 and two minor non conformances resulting due to setting of trigger levels for emissions to water; All non conformances were closed out and the EPA notified. We had two SGS ISO 14001 surveillance audits in 2013. In total we had 2 minor non-conformances; relating to the control of actions within the Environmental Management System and the Environmental control in relation to the Mobile Plant workshop on site.
3

Moneypoint Generating Station AER 2013
1.4 Moneypoint Environmental Policy and Key Objectives. Moneypoint Generating Station is part of ESB Power Generation Business Unit. It exports approximately 855 Megawatts of electricity produced from steam generation plant burning coal and /or heavy fuel oil. The station location, on the Shannon Estuary, encompasses areas of significant environmental importance. Environmental monitoring stations are strategically placed at external locations. These demonstrate that the operation of Moneypoint does not have a significant impact on the environment.
In Moneypoint, we believe that: • The protection of the environment is an integral part of good business practice. • We have a duty to behave as a good corporate citizen and we must produce electricity with the
minimum impact on our neighbours. • We must be committed to the minimisation of waste production and to the safe and efficient
recycling of the ash produced as a product of combustion. • We must produce electricity as efficiently as possible and optimise plant operation to minimise
losses. • We must be open in all our dealings and be responsive to the public in relation to our
operations. To this end, we will: • Establish and regularly review environmental performance for our business to ensure full
compliance with ESB standards and E.U./ National legislation on the environment. • Take account of environmental considerations in all planning and decision making. • Review our environmental programme annually to ensure continual improvement in our
environmental performance. • Operate according to IPCL No: 605-03 and GHG Permit No. IE-GHG 070-10381 • Develop and maintain an Environmental Management System to ISO 14001. • Develop and regularly review management processes, operational procedures and audit
capabilities to ensure that the systems put in place to prevent environmental damage function effectively.
• Put in place systems to reduce waste production and to monitor and ensure the safe disposal of waste produced.
• Put in place systems and resources to minimise the risk of environmental accidents. • Draw up emergency response plans to deal with accidental pollution. • Ensure that suppliers of goods and services are considerate of the environmental impact of
their dealings with Moneypoint by advising them of our environmental policy and the environmental standards required of them.
• Seek to actively promote environmental awareness among our staff. • Provide the necessary training and support for staff on environmental matters. • Publicly report on an annual basis on our environmental performance. • Record and respond swiftly to all complaints on environmental matters. • This policy has corporate body endorsement. • Comply the ESB Group Biodiversity policy. • Comply with the statutory and regulatory biodiversity requirements • Support the National Biodiversity Plan. • Minimise the impacts of our activities on biodiversity • Conserve and, if possible, enhance the biological diversity of the ESB Moneypoint Site
Signed: Brendan Kennedy Date: 30.08.2013 Station Manager
4

Moneypoint Generating Station AER 2013
1.5 Environmental Management Structure and Responsibility Environmental Management is fully integrated into all aspects of management on site. The management structure is shown in figure 1.1. The Environmental Co-ordinator is responsible for the co-ordination of all environmental activity at the station. The Environmental Co-ordinator along with the environmental specialist works with the management team and environmental management group to ensure that: • The station complies with or betters the requirements of any environmental provisions specified
under its IPC licence, other licences, planning permission and environmental legislation. • The Station’s EMS is operated and maintained to the required standard. • By way of audit and review cycle, the EMS is effective, is adaptive to changing circumstances
and is delivering continuous improvement.
5

Moneypoint Generating Station AER 2013
1.6 Organisational Chart FIGURE 1.1
Station Manager
Brendan Kennedy
Station Chemist/ BM Ops. Manager
John Wall
Financial Controller
Martina Malone
Safety & Plant Operation
Aodhan McAleer
Asset, Engineering and Environmental Co-
ordinator
John Casey
BM maintenance
Ciaran McManus
Station Maintenance
Barry O Donoghue
6

Moneypoint Generating Station AER 2013
3 Emissions to Water ESB Moneypoint has ten licensed emission points discharging to the Shannon Estuary. • SW1 Ash Disposal Area – Surface Drain • SW2 Surface Drain No 2 • SW3 Foul Drain No 1 • SW4 Surface Drain No 3 • SW4A Band Screen Wash Water • SW5 Surface Drain No 4 • SW6 Surface Drain No 5 • SW7 Surface Drain No 6 • SW8 Cooling Water Outfall • SW9 Surface Drain No 9 • SW10 Foul Drain No 2 • SW11 Foul Drain No 11 • SW13 Surface Drain No 8 • SW14 Coal yard FGD lagoon • SW15 To be agreed Drawing Ref: Station Drains MP325727 Appendix 4 Monitoring of these emission points is carried out in accordance with Schedule B2 of Moneypoints IPC license. A summary of the monitoring results for emissions to water at each of the above emission points is presented in the following tables. The analytical data contained in the following tables has been generated by completing a routine discharge point sampling and analysis programme. The analysis is completed by a combination of ESB laboratory staff and contract laboratories. A database is maintained on-site from which the summary data has been extracted.
3.1 Surface discharges to water SW1: This discharge point collects water from the ash Storage area located to the north of the main station. 2013
Date pH Conducti
vity µS/cm
S.S(mg/l) CO
D TOC Tot N2 Orthophosphates- SO4
Chloride
1st quarter
23-Jan-13
6.5 795 0 New Licence requirements – not required in first quarter
2nd quarter
11-Apr-
13
6.6 865 16
3rd quarter
29-Jul-13
6.6 16620 122 220 9.76 6.34 0.010 1224.5 5107.82
4th quarter
31-Oct-13
6.6 5890 12 10 3.15 3.65 0.010 555.95 1877.05
No ELV
NF= No Flow
7

Moneypoint Generating Station AER 2013
SW2: This discharge point collects water from unit 3 sample rack, unit 3 blow down tank and the area north east of the waste storage compound. There is also surface water from north side of the boilers between the main plant and the FGD plant.
2013 Date pH S.S(mg/l) Min.oil(ppm) Conductivity Ammonia 1st quarter 23-Jan-13 7.8 68 0.0025 1850 0.05 2nd quarter 11-Apr-13 8.1 4 <0.01 842 0.04 3rd quarter 29-Jul-13 8.2 30 <0.01 1031 0.29 4th quarter 31-Oct-13 8.3 9 <0.01 997 0.27 Emission limit value
6.0-10 100 20 0.6
SW 3: This discharge point manages water from the temporary canteen septic tank. This is currently out of service.
2013 Date BOD S.S(mg/l) Comment 1st quarter 23-Jan-13 No flow Septic Tank is out of service 2nd quarter 11-Apr-13 No flow 3rd quarter 29-Jul-13 No flow 4th quarter 31-Oct-13 No flow Emission limit value 20 30
NF= No Flow SW 4: This discharge point collects water from the band screen wash water discharge and the area around the hydrogen plant located to the south
2013 Date pH S.S(mg/l) Conductivity Comment 1st quarter 23-Jan-13 No Flow - - No flow at this
point – water now being recycled back to Turbine Hall
2nd quarter 11-Apr-13 No Flow - - 3rd quarter 29-Jul-13 No Flow - - 4th quarter 31-Oct-13 No Flow - -
Emission limit value 6.0-10 100 SW 5: This discharge point collects water from the area around unit 3 cascade building sump and surrounding surface drains. The cascade sump captures drains associated with the turbine hall and due to its position below sea level is a pumped drainage system
2013 Date pH S.S(mg/l) Min.oil(ppm) Conductivity Comment 1st quarter 23-Jan-13 No Flow Water being
recycled back to Turbine Hall
2nd quarter 11-Apr-13 No Flow - - - 3rd quarter 29-Jul-13 No Flow - - - 4th quarter 31-Oct-13 No Flow - - -
Emission limit value 20
8

Moneypoint Generating Station AER 2013
SW 6: This discharge point collects water from the area around units 1 and 2 cascade buildings and associated surface drains. The cascade sump captures drains associated with the turbine hall and due to its position below sea level is a pumped drainage system
2013 Date pH S.S(mg/l) Min.oil(ppm) Conductivity Ammonia(mg/l) 1st quarter 23-Jan-13 7.6 14 0.941 226 0.0 2nd quarter 11-Apr-13 8.2 12 0.38 3855 0.01 3rd quarter 29-Jul-13 8.3 50 0.33 36100 0.12 4th quarter 31-Oct-13 7.8 32 0.0025 6290 0.07 Emission limit value
20
SW 7: This discharge point collects water from several areas including units 1 & 2 sample rack, units 1 & 2 ash tank overflow pipe, area around administration courtyard, around fire pump house and compressor house.
2013 Date
pH S.S(mg/l) Min.oil(ppm)
Conductivity Ammonia(mg/l)
Chlorine(mg/l)
TDS(mg/l)
1st quarter 23-Jan-13 7.7 3 0.0025 362 0.0 Not
required in Old licence
2nd quarter 11-Apr-
13 8 5 <0.01 481 0.45
3rd quarter 29-Jul-13 8.6 50 0.5 1320 0.09 0.21 Not
read 4th quarter 31-Oct-
13 7.9 19 0.0025 398 0.07 0.19 Not Read
Emission limit value
6.0-9.5
20 0.6 0.5 10,000
SW 8: This discharge point manages water from condenser cooling water outfall. Figure is average throughout the year.
2013 Chlorine(ppm) Temp rise (ºc) Average 0.08 8.1 Max 0.25 15.1 (MWth < 1590) Min 0 4.7 Emission limit value 0.5 15 or 1590 MWth
*Average Temperature recorded over year. SW 9: This discharge point collects water from the area north east of the water treatment building also water drainage from the main coal stockpile
2013 Date pH S.S(mg/l) Min.oil(ppm) Conductivity Comment 1st quarter 23-Jan-13 Nf Nf Nf Nf No access
due to ongoing works in
9

Moneypoint Generating Station AER 2013
area 2nd quarter 11-Apr-13 7.5 20 0.0025 1112 3rd quarter 29-Jul-13 8.2 14 <0.01 1452 4th quarter 31-Oct-13 8.3 14 0.0025 0 Emission limit value
6.0-9.5 100 20
SW 10: This discharge point manages water from the station septic tank outlet.
2013 Date BOD S.S(mg/l) Comment 1st quarter 23-Jan-13 8 17 2nd quarter 11-Apr-13 2 12 3rd quarter 29-Jul-13 Nf Nf Discharge pump o/o/o – now
resolved 4th quarter 31-Oct-13 nf nf Discharge pump o/o/o – now
resolved Emission limit value 20 30
SW 11: This discharge point collects water from the jetty septic tank outlet. This system is no longer in service
2013 Date BOD S.S(mg/l) Comment 1st quarter 23-Jan-13 No flow Unit no longer in service 2nd quarter 11-Apr-13 No flow 3rd quarter 29-Jul-13 No flow 4th quarter 31-Oct-13 No flow Emission limit value
NF= No Flow SW 13: This discharge point collects water from the area around the strategic coal stockpile. This is located at the eastern end of the main coal yard.
2013 Date pH S.S(mg/l) Conductivity 1st quarter 23-Jan-13 7 1.4 1447 2nd quarter 11-Apr-13 7.1 7 3910 3rd quarter 29-Jul-13 7.5 11 - 4th quarter 31-Oct-13 7.1 7 - Emission limit value 6.0-9.5 100
Note: NF = No Flow
3.2 Toxicity/ Leachate Analysis:
10

Moneypoint Generating Station AER 2013
Annual Toxicity SW1 Results 2013 Parameter Test Species Limits 2012 Results Toxicity Tisbe Battagliai n/a <3.1 TU 16/01/13 Vibrio Fischeri n/a <2.2 TU Parameter Test Species Limits 2012 Results Toxicity Tisbe Battagliai n/a <3.1 TU 28 & 29/8/13 Vibrio Fischeri n/a <2.2 TU
3.3 Annual Metals
Ash Leachate Results 2013 Lead µg/l 0.046 Dissolved Aluminium µg/l 20.1 Dissolved Arsenic µg/l 2.93 Dissolved Barium mg/ 16.2 Dissolved Boron µg/l 3180 Dissolved Cadmium µg/l 0.592 Dissolved Chromium µg/l 49 Dissolved Copper µg/l 1.97 Dissolved Iron mg/l <0.019 Dissolved Mercury µg/l <0.01 Dissolved Molybdenum µg/l 622 Dissolved Nickel µg/l 1.99 Dissolved Selenium µg/l 34.4 Dissolved Tin µg/l <0.36 Dissolved Zinc µg/l 1.67 pH 6.73 3.3 Ash farm Metals 2013 Quarterly samples of PFA (pulverised Fuel Ash) and Bottom ash are taken and analysed in an accredited labs off site, all analysis reports are maintained at the station.
Component Units BottomAsh
FGDProduct
FlyAsh
BottomAsh
FGDProduct
FlyAsh
BottomAsh
FGDProduct
FlyAsh
BottomAsh
FGDProduct
FlyAsh
pH mg/kg 9.33 9.13 8.84 8.61 11.3 10.2 12.7 10.1 9.69 11.6 10.8Aluminium mg/kg 6440 21900 2990 14900 20100 13200 11100 19500 9000 9250 24300Arsenic mg/kg 4.03 31 3.04 23.9 28.4 6.22 18.3 29.4 3.35 9.69 33.3Barium mg/kg 186 460 88 96.5 486 324 147 485 213 101 1130Boron mg/kg 46 97.7 11.8 130 229 53.7 142 198 35 326 292Cadmium mg/kg 0.425 1.4 0.168 0.742 0.922 0.29 1.02 1.14 0.146 0.415 0.681Chromium mg/kg 15 50.7 10.4 20 42.2 14.6 33.8 41.5 9.66 14.6 33Copper mg/kg 6.32 25 3.94 18.6 23.9 11.2 181 23.1 7.15 9.37 27.1Iron mg/kg 15900 29400 10200 13600 24400 12700 29500 24600 10400 8110 23700Lead mg/kg 4.4 14.8 1.5 7.44 9.52 5 164 8.74 4 4.71 13Mercury mg/kg <0.14 0.241Molybdenum mg/kg 2.24 3.78 0.894 4.52 15.2 3 22.8 7.66 0.966 3.44 8.53Nickel mg/kg 11.9 28.2 9.15 24.2 27.8 12.5 33.3 25.7 10.4 19.1 26.6Selenium mg/kg <1 19.6 <1 37.3 24 <1 21.9 17.1 <1 37.2 7.21Tin mg/kg <0.24 0.992 <0.24 2.6 1.22 0.615 49.7 1.16 <0.24 <0.24 1.48Zinc mg/kg 16.2 74.9 9.67 35.3 70.5 35 1960 67.2 14.8 28.7 68.4
Not
Tes
ted
in Q
1
14/01/2013 16/06/2013 10/09/2013 16/10/2013Date Sampled Date Sampled Date Sampled Date Sampled
11

Moneypoint Generating Station AER 2013
3.4 Emissions to Water Non-Compliance Summary The table below highlights the exceedences in relation to suspended solids, Ammonia and pH for 2013, it can be seen that a notable reduction in suspended solids resulted upon implementation of control measures as proposed to the EPA in 2010/2011. Discharge Point
SW1
SW2
SW3
SW4
SW4a
SW5
SW6
SW 7
SW 8
SW 9
SW 10
SW 11
SW 13
TOTAL
JAN FEB MAR APR MAY JUNE 1* 1* 2 JULY AUG SEPT OCT NOV DEC TOTAL /YEAR
2
* EPA Tested - The methodology of these tests is under discussion Note: Reports for all above have been forwarded to the EPA and closed out.
12

Moneypoint Generating Station AER 2013
3.5 Comparison between EPA and ESB surface water monitoring results During the year the EPA paid the site a number of visits to collect samples from the surface water discharge points, parallel samples were taken each time and the comparison of the results are listed below.
Date Sample Number pH Suspended
Solids ppm Ammonia
ppm N Results
26-Jun-13 SW1P 7.3 15.2 Mpt Results
26-Jun-13 SW1P 7.4 16 0.14 EPA Results
26-Jun-13 SW2DP 7.4 17.8 0.045 Mpt Results
26-Jun-13 SW2DP 7.5 17 8.1 EPA Results
26-Jun-13 SW4AP 7.9 Mpt Results
26-Jun-13 SW4AP 8 EPA Results
26-Jun-13 SW6DP 8.2 Mpt Results
26-Jun-13 SW6DP 8.1 EPA Results
26-Jun-13 SW7DP 7.4 0.4 0.069 Mpt Results
26-Jun-13 SW7DP 7.6 6 EPA Results
26-Jun-13 SW8P 8.1 Mpt Results
26-Jun-13 SW8P 8 EPA Results
26-Jun-13 SW9DP 7.5 14 Mpt Results
26-Jun-13 SW9DP 7.4 16 EPA Results
26-Jun-13 SW13DP 7.1 7.4 Mpt Results
26-Jun-13 SW13DP 7 8 EPA Results
13

Moneypoint Generating Station AER 2013
Date Sample Number pH Suspended
Solids ppm Ammonia
ppm N Results
04-Sep-13 SW1P 6.8 7.6 0.41 Mpt Results
04-Sep-13 SW1P 6.9 6 0.53 EPA Results
04-Sep-13 SW2DP 7.6 9.8 0.29 Mpt Results
04-Sep-13 SW2DP 7.8 9 0.27 EPA Results
04-Sep-13 SW4AP 8 0.09 Mpt Results
04-Sep-13 SW4AP 7.9 EPA Results
04-Sep-13 SW6DP 7.9 19 0.12 Mpt Results
04-Sep-13 SW6DP 8 EPA Results
04-Sep-13 SW7DP 8 0.2 0.09 Mpt Results
04-Sep-13 SW7DP 8.1 0.11 EPA Results
04-Sep-13 SW8P 7.9 0.04 Mpt Results
04-Sep-13 SW8P 7.9 EPA Results
04-Sep-13 SW9DP 8 7.2 0.47 Mpt Results
04-Sep-13 SW9DP 7.9 8 EPA Results
04-Sep-13 SW13DP 7.4 9.8 0.34 Mpt Results
04-Sep-13 SW13DP 7.5 11 EPA Results
4 Emissions to Atmosphere
4.1 Iso-kinetic Dust sample results 2013 A number of iso-kinetic dust monitors are located around the site at dust sensitive locations the results of this monitoring are listed below, Additional dust monitoring stations were installed in 2011.
14

Moneypoint Generating Station AER 2013
Site
Undissolved Solids Based on 12 Month's Avg mg/m2/day
Ash Farm 1 47.80 12 Ash Farm 2 62.93 12 Ash Farm 3 60.77 12 Gate A 38.23 12 Coal-yard1 64.76 12 Coal-yard 2 66.32 12 Coal-yard 3 72.72 12 Coal-yard 4 75.19 12
4.2 Emission Summary Report - Calendar monthly mean values Unit 1 (A1 - 1) Period End Date Units NOx SO2 Dust Average 31/01/2013 kg/hr 101 162 7 Average 28/02/2013 kg/hr 137 198 8 Average 31/03/2013 kg/hr 331 259 10 Average 30/04/2013 kg/hr 297 220 9 Average 31/05/2013 kg/hr 209 133 7 Average 30/06/2013 kg/hr 283 284 8 Average 31/07/2013 kg/hr 287 219 8 Average 31/08/2013 kg/hr 234 107 8 Average 30/09/2013 kg/hr 450 444 18 Average 31/10/2013 kg/hr 191 95 8 Average 30/11/2013 kg/hr 240 179 12 Average 31/12/2013 kg/hr 299 255 14 Unit 2 (A1 - 2) Period End Date Units NOx SO2 Dust Average 31/01/2013 kg/hr 178 914 30 Average 28/02/2013 kg/hr 114 852 34 Average 31/03/2013 kg/hr 71 773 41 Average 30/04/2013 kg/hr 118 890 70 Average 31/05/2013 kg/hr 147 764 4 Average 30/06/2013 kg/hr 196 722 4 Average 31/07/2013 kg/hr 471 730 12 Average 31/08/2013 kg/hr 571 461 20 Average 30/09/2013 kg/hr 599 486 23 Average 31/10/2013 kg/hr 359 693 7 Average 30/11/2013 kg/hr 0 0 0 Average 31/12/2013 kg/hr 0 0 0 Unit 3 (A1 - 3) Period End Date Units NOx SO2 Dust Average 31/01/2013 kg/hr 119 128 2 Average 28/02/2013 kg/hr 150 146 2 Average 31/03/2013 kg/hr 275 155 2 Average 30/04/2013 kg/hr 214 270 3 Average 31/05/2013 kg/hr 155 94 2 Average 30/06/2013 kg/hr 246 231 4 Average 31/07/2013 kg/hr 210 297 5 Average 31/08/2013 kg/hr 0 0 0
15

Moneypoint Generating Station AER 2013
Average 30/09/2013 kg/hr 0 0 0 Average 31/10/2013 kg/hr 199 375 7 Average 30/11/2013 kg/hr 176 170 2 Average 31/12/2013 kg/hr 151 232 2 4.3 Emissions to Atmosphere Non-compliance Summary Year Non-compliance Cause Corrective Action
2010 Failure to control dust in ash storage area.
Ash dust blown off surface of ash storage area
Revised ash storage area management.
2011 No Non compliances
2012 No Non compliances
2013 No Non compliances
Mass emissions for 2013 NOx SO2 Dust Unit 1 2004.7 1682.6 77.6
Unit 2 1758.7 4279.1 133.8
Unit 3 1128.1 1201.5 13
The station mass emissions were within the limits as set out in our licence and also within the NERP limits as set out in 2008 NERP national agreement.
16
Moneypoint Generating Station AER 2013
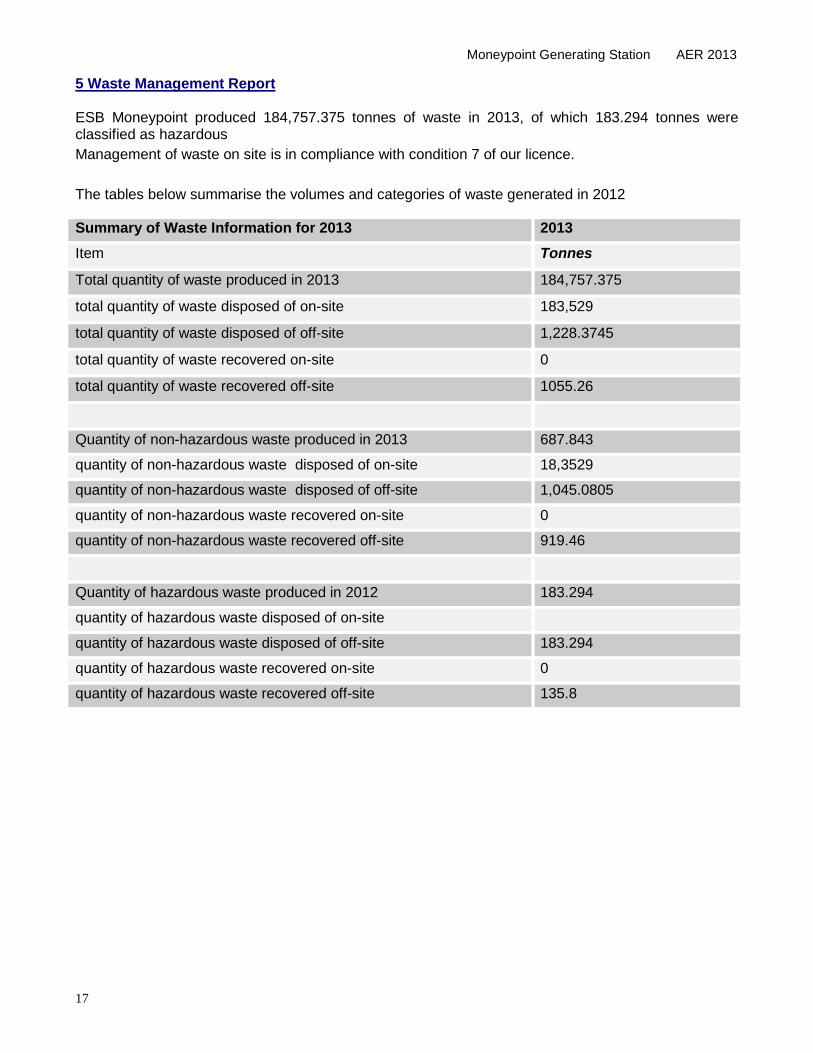
5 Waste Management Report ESB Moneypoint produced 184,757.375 tonnes of waste in 2013, of which 183.294 tonnes were classified as hazardous Management of waste on site is in compliance with condition 7 of our licence. The tables below summarise the volumes and categories of waste generated in 2012 Summary of Waste Information for 2013 2013 Item Tonnes
Total quantity of waste produced in 2013 184,757.375
total quantity of waste disposed of on-site 183,529
total quantity of waste disposed of off-site 1,228.3745
total quantity of waste recovered on-site 0
total quantity of waste recovered off-site 1055.26
Quantity of non-hazardous waste produced in 2013 687.843
quantity of non-hazardous waste disposed of on-site 18,3529
quantity of non-hazardous waste disposed of off-site 1,045.0805
quantity of non-hazardous waste recovered on-site 0
quantity of non-hazardous waste recovered off-site 919.46
Quantity of hazardous waste produced in 2012 183.294
quantity of hazardous waste disposed of on-site
quantity of hazardous waste disposed of off-site 183.294
quantity of hazardous waste recovered on-site 0
quantity of hazardous waste recovered off-site 135.8
17

Moneypoint Generating Station AER 2013
Hazardous Waste 2013
Hazardous Waste 2013
Waste EWC Code Qty (Tonnes) Collected By Destination Licence
Reg No
Oily Water 13 05 07 135.8 ENVA Portlaoise, Co. Laois 184-1 Solid Oily Waste 15 02 02 27.11 ENVA Portlaoise, Co. Laois 184-1 Oily Waste 13 08 02 16.34 ENVA Portlaoise, Co. Laois 184-1 Empty Drums 15 01 10 1.746 ENVA Portlaoise, Co. Laois 184-1 UN Drums 15 01 10 0.18 ENVA Portlaoise, Co. Laois 184-1 Fluorescent Tubes 20 01 21* 0.392 Irish Lamp Recycling Athy, Co. Kildare WFP-KE-14-0072-01 Light Fittings 20 01 35* 1.726 Irish Lamp Recycling Athy, Co. Kildare WFP-KE-14-0072-01
183.294 Tonnes
18

Moneypoint Generating Station AER 2013
Non-Hazardous Waste 2013
Non-Hazardous Waste 2013
Waste EWC Code
Qty (Tonnes)
Disposed Reused
Recycled Collected By Destination Collection
Permit
BROWN BIN 20 01 08 2.7225 Disposed Clean Ireland Cree, Co. Clare WCP/LK073/04c DRY RECYCABLES 20 01 01 16.262 Recycled Clean Ireland Cree, Co. Clare WCP/LK073/04c METAL 17 04 05 0.199 Recycled Clean Ireland Cree, Co. Clare WCP/LK073/04c METAL 17 04 05 121.405 Recycled United Metals Eastway, Limerick WFP/LK/2010/147/R1 METAL 17 04 05 332.541 Recycled ClearCircle Ballysimon, Limerick WCP-LK-08-589-01 MIXED WASTE 20 03 01 122.902 Disposed Clean Ireland Cree, Co. Clare WCP/LK073/04c PAPER 15 01 01 2 Recycled Clean Ireland Cree, Co. Clare WCP/LK073/04c SKIP WASTE 20 03 01 395.437 Recycled Clean Ireland Cree, Co. Clare WCP/LK073/04c TIMBER 15 01 03 51.612 Reused Clean Ireland Cree, Co. Clare WCP/LK073/04c PULVERISED FUEL ASH 10 01 02 105580 Disposed Moneypoint Landfill Mpt. Landfill Licence 605-03 FURNACE BOTTOM ASH 10 01 01 16736 Disposed Moneypoint Landfill Mpt. Landfill Licence 605-03 FGD PULVERISED FUEL ASH 10 01 02 14003 Disposed Moneypoint FGD Landfill Mpt. Landfill Licence 605-03 FGD BY-PRODUCT 10 01 05 46678 Disposed Moneypoint FGD Landfill Mpt. Landfill Licence 605-03 CEMENT 10 13 01 502 Disposed Moneypoint FGD Landfill Mpt. Landfill Licence 605-03 COMPOST 30 Disposed Moneypoint Landfill Mpt. Landfill Licence 605-03
184574.0805 Tonnes
19

Moneypoint Generating Station AER 2013
6 Energy and Water Consumption Energy and water consumption figures for 2013 are shown in following Tables below.
6.1 Energy Consumption MW Year Coal Distillate Oil HFO House Load 2010 3,756,872 3,441 63,086 400,620 2011 3,805,774 3,365 72,279 465,840 2012 4,795,411 1,679 73,217 506,270 2013 4,039,998 4,521 101,305 431,287
6.2 Energy Generated MW Year MW hrs Generated 2010 3,823,400 2011 3,882,000 2012 4,869,180 2013 4577112
6.3 Water Consumption m3
Breakdown of water usage (2013) Quantity (m3) Domestic Water 77590 Towns Water 2752 Fire fighting system 48433 Boiler Water 405000 FGD Abatement Water 429813 Other Water 417497 Recycled Water 90000 Total Water used on site m3 1381085 Total water used from council supply m3 1291085
20

Moneypoint Generating Station AER 2013
7. Environmental Incidents and Complaints
7.1 Complaints Summary Summary of complaints by category during 2013
Category Dust Air Odour Noise Water Procedural Misc. Total
January 1 1
February
March
April 1 1
May 1 1
June
July 1 1 2
August
September
October
November
December
TOTAL/YEAR 5
Note: Reports for all above have been forwarded to the EPA and closed out.
7.2 Incidents Summary There was one incidents of significant environmental impact on site in 2013, there were a number of environmental exceedences as per the ELV’s set out in the IPPC licence a report for each of these was sent to the EPA throughout the 2013 year -up operation.
7.3 Queries received Summary A number of queries were made to the station in relation to the operation and performance of the emissions abatement equipment installed on site; these queries were answered with information forwarded on. Site tours were given to a number of schools and colleges.
21

Moneypoint Generating Station AER 2013
8.0 Management of the Activity
8.1 Environmental Management Programme 2013 ENVIRONMENTAL MANAGEMENT PROGRAMME 2013
Description ENERGY MANAGEMENT Lighting energy reduction-SG rooms 30% Further works planned for 2014 Implement sustainability projects 70% Continue use of energy efficient devices 40% Further works planned for 2014 Influence Energy use behaviour 100% Energy Audit 40% Further audits planned WASTE MANAGEMENT Maintain waste segregation to < 10 % Mixed waste 80%
Delays in waste shed construction. Commissioned Q1 2014.
Continue to investigate market for ash 80% Discussions ongoing with potential customers. Investigate market for FGD product 50% Initial discussions have taken place. New waste recycling centre 100% Packaging reduction 70% Discussions ongoing with suppliers. Water Management Water usage audit 100% Turbine Drains water recycle project 50% Materials purchased. Installation 2014. Continue project to repairs on Domestic water supply 100% Air Emissions Management Monitor new CEMS equipment 100% Proactive management of fugitive dust 80% Equipment installed. Optimise emissions abatement equipment 90% Preperation for IED 100% Plant being proven at present. Misc IPPCL Compliance Ongoing ISO 14001 compliance Ongoing Continue community project With local schools Ongoing Support SEAPT exercise Ongoing Maintain local forum Ongoing
22

Moneypoint Generating Station AER 2013
8.2 Environmental Management Programme 2014
9.0 PER Report for 2013 Facility Identification Name ESB Moneypoint IPC Register Number 605-03
ENVIRONMENTAL MANAGEMENT PROGRAMME 2014
ENERGY MANAGEMENT Lighting energy reduction projects in switch gear rooms Continue Biodiversity Project Influence Energy conservation use behaviour Lighting energy reduction projects in switch gear rooms WASTE MANAGEMENT Maintain waste segregation to < 10 % Mixed waste Continue to Investigate market for Ash Continue to Investigate market for FGD product Repairs to Bunds identified in 2013 Inspection and 2014 Testing Drains Improvement works Water Management Water usage audit Turbine Drains water recycle project Air Emissions Management Monitor New CEMS equipment Proactive management of fugitive dust Abatement Plant Availability Improvement Project Misc IPPCL Compliance ISO 14001 compliance Continue community project With local schools Support SEAPT Maintain Local Forum
23

Moneypoint Generating Station AER 2013
Reporting Period 1st January - 31st December 2013 National Grid Reference E 103555 N 151533 Employee No. 237 Pollutant Summary Pollutant Name Output to Air (tonnes)
NERP Data A1-1 A1-2 A1-3 Total
Sulphur Dioxide (SO2) 1682.6 4279.1 1201.5 Nitrogen Oxides (as NO2) 2004.7 1758.7 1128.1 Carbon Dioxide See total See total See total 3,885,991 Particulate 77.6 133.8 13 NCV of fuels used Moneypoint Year Coal NCV MJ/kg HFO NCV MJ/kg LFO NCV MJ/kg 2013 24.65 40.43 43.31 2012 24.69 40.60 43.31 2011 24.67 40.67 43.31 2010 24.73 40.48 43.31
24

Moneypoint Generating Station AER 2013
Estimated Heavy Metals Emission for Moneypoint in 2013 based on;
• Fuel burn in 2013 and KEMA test results in 2003 • E’on Testing carried out in conjunction with the acceptance tests for the NOx and SOx
abatement equipment • Further station testing carried out during the operation of the plant throughout 2010
Heavy metals emissions are conservatively based on results of a 2003 study carried out by KEMA, this calculation methodology is utilised at periods where no emissions abatement is being carried out. For all other periods in the plants operation additional data will be used in the calculation methodology used for emissions reporting. Because of the new emissions abatement equipment the heavy metals emissions have been reduced partially due to the increased efficiency of the bag filtration system employed in the SOx abatement plant but also due to the chemical reactions involved in both the NOx SCR process and the SOx FGD process . To be updated Trace Element Emission kg/yr
As 26.1
B 18615.4
Cd 1.4
Cr 28.4
Cu 15.4
Hg 13.3
Mo 10.9
Ni 26.8
Pb 11.8
Se 691.4
V 94.3
Zn 105.6
25

Moneypoint Generating Station AER 2013
10.0 Licence Specific Reports
10.1 Noise Monitoring Reports All results of these tests show that the station is clearly compliant with the requirements of its noise IPPCL set at (Leq30) 55db Day and 45db Night. Summary of report at end of AER
10.2 Report on List I and List II Substance Reductions The use of hydrazine for water treatment was replaced with an alternative Carbohydrazide based product in 2011 thereby removing the list II substance from site.
10.3 Review of Environmental Liabilities Insurance Cover Environmental liabilities Risk assessment was submitted to the EPA in September of 2012.
10.4 Bund Testing Moneypoint completed year three of the three yearly cycles of bund tests in 2013 and all repairs identified are on a programme for completion in 2014. Future testing will use the guidance form provided by the agency.
10.5 Tank and Pipeline Test & Inspection Report Drains survey completed in 2012, a number of drain sections were identified as requiring repair work and this repair work will be carried out during 2014
26
Moneypoint Generating Station AER 2013
10.6 Groundwater Monitoring
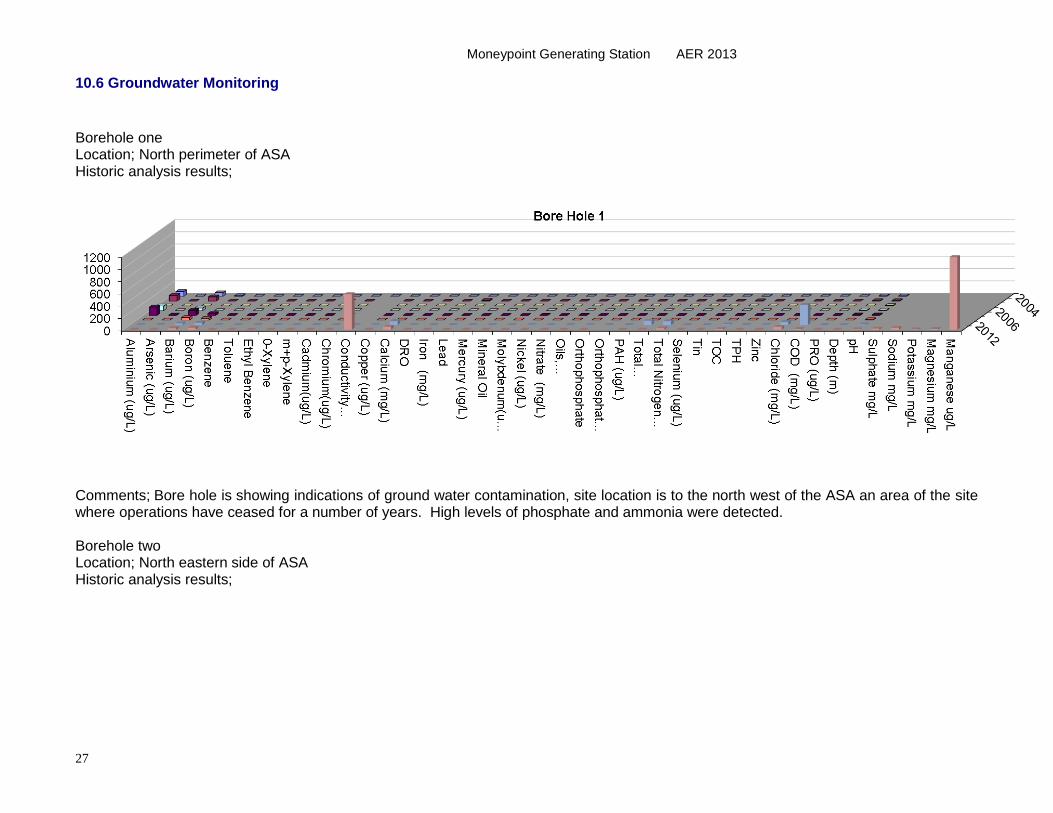
Borehole one Location; North perimeter of ASA Historic analysis results;
Comments; Bore hole is showing indications of ground water contamination, site location is to the north west of the ASA an area of the site where operations have ceased for a number of years. High levels of phosphate and ammonia were detected. Borehole two Location; North eastern side of ASA Historic analysis results;
27

Moneypoint Generating Station AER 2013
Comments; ???? Manganese – query with JW - All analysis results within guideline values
28

Moneypoint Generating Station AER 2013
Borehole three Location; Adjacent to BH 2 Historic analysis results;
0100
200300400
500
Aluminium (ug/L)
Arsenic (ug/L)
Barium (ug/L)
Boron (mg/L)
Benzene
Toluene
Ethyl Benzene
0-Xylene
m+p-Xylene
Cadmium(ug/L)
Chromium(ug/L)
Conductivity(mS/cm @
20'C)
Copper (ug/L)
Calcium (mg/L)
DRO
Iron (mg/L)
Lead
Mercury (ug/L)
Mineral Oil
Molybdenum(ug/L)
Nickel (ug/L)
Nitrate (mg/L)
Oils,Fats&Grease
Orthophosphate(mg/L)
Orthophosphateby colourimetry
PAH (ug/L)
Total Ammonia asNH3
Total Nitrogen (mg/L)
Selenium (ug/L)
Tin TOC
TPH
Zinc
Chloride (mg/L)
COD (mg/L)
PRO (ug/L)
20042008
2011
Bore Hole 3
Comments; Chloride and Ammonia levels are marginally above guideline limits. Suggested saline influence. Borehole no longer accessible. Borehole four Location; South perimeter of ASA Historic analysis results;
29

Moneypoint Generating Station AER 2013
Comments; Boron and chloride are above guideline limits, this is indicative of a saline influence.
30

Moneypoint Generating Station AER 2013
Borehole five Location; Outside the ASA adjacent to BH4 Historic analysis results;
Comments; Boron and chloride are above guideline limits, this is indicative of a saline influence. Borehole six Location; North area within ASA Historic analysis results;
31

Moneypoint Generating Station AER 2013
Comments; Chloride are above guideline limits
32

Moneypoint Generating Station AER 2013
Borehole seven Location; Within 400kv electrical compound Historic analysis results;
0100200300400500600700
Alum
inium (ug/L)
Arsenic (ug/L)
Barium
(ug/L)
Boron (m
g/L)
Benzene
Toluene
Ethyl B
enzene
0-Xylene
m+p-X
ylene
Cadm
ium(ug/L)
Chrom
ium(ug/L)
Conductivity
(mS
/cm @
20'C)
Copper (ug/L)
Calcium
(mg/L)
DR
O
Iron (mg/L)
Lead
Mercury (ug/L)
Mineral O
il
Molybdenum
(ug/L)
Nickel (ug/L)
Nitrate (m
g/L)
Oils,
Fats&G
rease
Orthophosphate
(mg/L)
Orthophosphate
by colourimetry
PA
H (ug/L)
Total Am
monia as
NH
3
Total Nitrogen
(mg/L)
Selenium
(ug/L)
Tin
TOC
TPH
Zinc
Chloride (m
g/L)
CO
D (m
g/L)
PR
O (ug/L)
20042005200620072008200920102011
Bore Hole 7
Comments; Borehole no longer accessible. Borehole eight Location; West of FGD landfill area A Historic analysis results;
33

Moneypoint Generating Station AER 2013
Comments; Chloride levels above guideline limits
34

Moneypoint Generating Station AER 2013
Borehole nine Location; South east of the site adjacent to foreshore Historic analysis results;
Comments; Chloride levels above guideline limits Borehole ten Location; Under coal transfer towers to the south east of the site. Historic analysis results;
35

Moneypoint Generating Station AER 2013
Comments; Bore hole provided no sample for 2012
36

Moneypoint Generating Station AER 2013
;
Borehole eleven Location; North of Stack A1-2 Historic analysis results;
0
20
40
60
80
Alum
inium (ug/L)
Arsenic (ug/L)
Barium
(ug/L)
Boron (m
g/L)
Benzene
Toluene
Ethyl B
enzene
0-Xylene
m+p-X
ylene
Cadm
ium(ug/L)
Chrom
ium(ug/L)
Conductivity
(mS
/cm @
20'C)
Copper (ug/L)
Calcium
(mg/L)
DR
O
Iron (mg/L)
Lead
Mercury (ug/L)
Mineral O
il
Molybdenum
(ug/L)
Nickel (ug/L)
Nitrate (m
g/L)
Oils,
Fats&G
rease (m
g/L)
Orthophosphate
(mg/L)
Orthophosphate
by colourimetry
PA
H (ug/L)
Total Am
monia as
NH
3
Total Nitrogen
(mg/L)
Selenium
(ug/L)
Tin
TOC
TPH
Zinc
Chloride (m
g/L)
CO
D (m
g/L)
PR
O (ug/L)
200420052007
Bore Hole 11
Comments; Borehole no longer available Borehole twelve Location; Contractor lay-down area to the west of the main station Historic analysis results
Comments; Chloride is above guideline limits
37

Moneypoint Generating Station AER 2013
Borehole fourteen Location; At the foreshore directly in front of the main station Historic analysis results;
Comments; No sample available in 2012 Borehole fifteen Location; Carpark beside main canteen Historic analysis results;
38

Moneypoint Generating Station AER 2013
Comments; Chloride is above guideline limits
39
Moneypoint Generating Station AER 2013
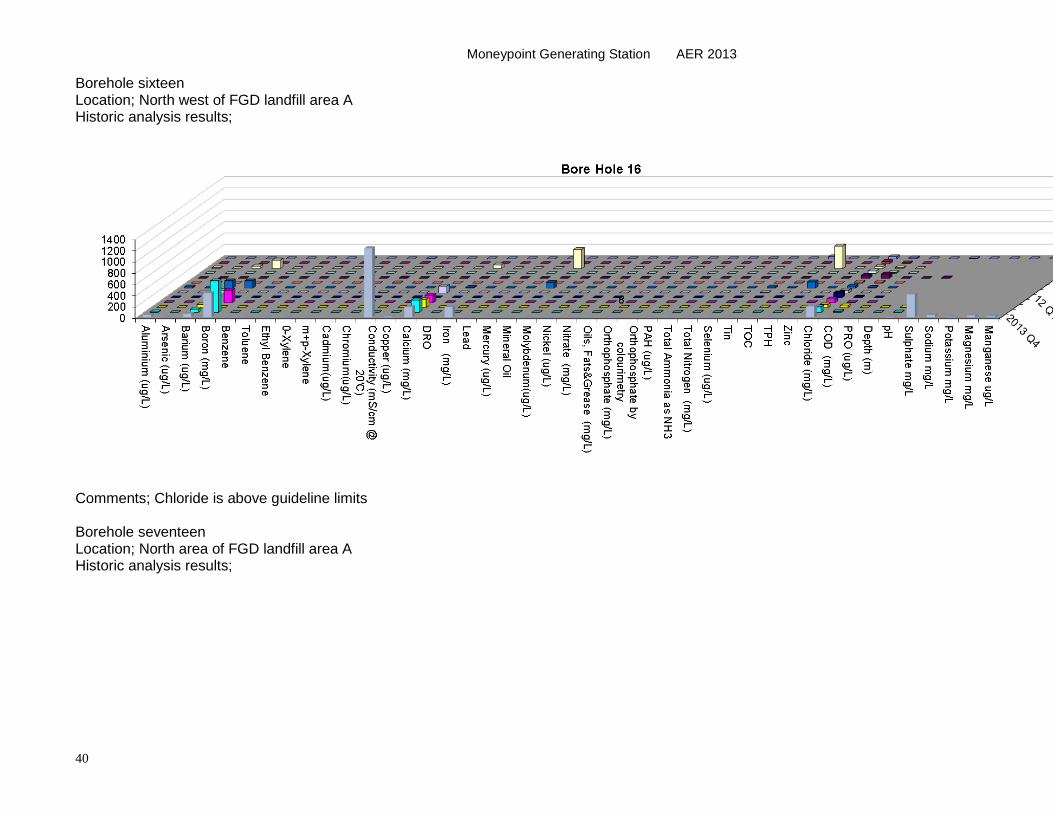
Borehole sixteen Location; North west of FGD landfill area A Historic analysis results;
Comments; Chloride is above guideline limits Borehole seventeen Location; North area of FGD landfill area A Historic analysis results;
40

Moneypoint Generating Station AER 2013
Comments; Chloride is above guideline limits
41

Moneypoint Generating Station AER 2013
Borehole eighteen Location; North west of FGD landfill area A Historic analysis results;
Comments; Chloride is above guideline limits Borehole nineteen Location; East of FGD landfill area A Historic analysis results;
42

Moneypoint Generating Station AER 2013
Comments; Alluminium and Chloride are above guideline limits Borehole twenty-one Location; Beside contractors building to the east of the coal stocks Historic analysis results;
43

Moneypoint Generating Station AER 2013
Comments; Chloride levels are above guideline limits Borehole twenty two Location; The south of the site beside the foreshore Historic analysis results;
44

Moneypoint Generating Station AER 2013
Comments; Boron, chloride and conductivity are above guideline limits. Possible saline influence. Borehole twenty three Location; Foreshore to the south west of the station Historic analysis results;
Comments; Boron, chloride and conductivity are above guideline limits. Possible saline influence. Borehole twenty six Location; Foreshore to the south west of the station Historic analysis results;
45

Moneypoint Generating Station AER 2013
Comments; Boron, chloride and conductivity are above guideline limits. Possible saline influence. Borehole twenty seven A Location; Beside entrance gate Historic analysis results;
46

Moneypoint Generating Station AER 2013
Comments; Chloride and conductivity are above guideline limits. Possible saline influence. Borehole twenty eight Location; Site lay down area to the west of the station Historic analysis results;
47

Moneypoint Generating Station AER 2013
Comments; Chloride and conductivity are above guideline limits. Possible saline influence. Borehole thirty Location; Western perimeter of ASA Historic analysis results;
0500
100015002000250030003500
Alum
inium (ug/L)
Arsenic (ug/L)
Barium
(ug/L)
Boron (m
g/L)
Benzene
Toluene
Ethyl B
enzene
0-Xylene
m+p-X
ylene
Cadm
ium(ug/L)
Chrom
ium(ug/L)
Conductivity
(mS
/cm @
20'C)
Copper (ug/L)
Calcium
(mg/L)
DR
O
Iron (mg/L)
Lead
Mercury (ug/L)
Mineral O
il
Molybdenum
(ug/L)
Nickel (ug/L)
Nitrate (m
g/L)
Oils,
Fats&G
rease
Orthophosphate
(mg/L)
Orthophosphate
by colourimetry
PA
H (ug/L)
Total Am
monia as
NH
3
Total Nitrogen
(mg/L)
Selenium
(ug/L)
Tin
TOC
TPH
Zinc
Chloride (m
g/L)
CO
D (m
g/L)
PR
O (ug/L)
200420052006200720082009201020112012
Bore Hole 30
8
Comments; No results for 2013. Aluminium and chloride levels are above guideline limits. Borehole thirty one Location; Western perimeter of ASA Historic analysis results;
48

Moneypoint Generating Station AER 2013
49

Moneypoint Generating Station AER 2013
Borehole Analysis 2013
Borehole BH 1 BH 2 BH 4 BH 5 BH 6 Aluminium (ug/L) 1.495 156.7 106.4 65.46 2.034
Arsenic (ug/L) 1.44 0.468 0.302 0.571 <0.10 Barium (ug/L) 23.74 12.89 34.61 26.58 5.049 Boron (ug/L) 32.65 15.02 721.3 2107 39.79
Cadmium(ug/L) <0.09 0.103 0.098 0.29 <0.09 Chromium(ug/L) <2.14 <2.14 11.21 16.97 <2.14
Conductivity (mS/cm @ 20'C) 577 295 414 10100 376 Copper (ug/L) 0.234 2.267 16.76 10.61 <0.11
Calcium (mg/L) 48.2 21.44 20.22 134.3 36.85 Iron (mg/L) 0.1456 0.208 339.3 63.86 23.62 Lead(ug/l) <0.02 0.603 12.27 0.643 <0.02
Mercury (ug/L) <0.04 <0.04 <0.04 <0.04 <0.04 Molybdenum(ug/L) <5 <5 11.85 376.3 <5
Nickel (ug/L) 0.234 24.47 2.033 0.363 <0.14 Nitrate (mg/L) <0.110 2.310 <0.110 4.780 <0.110
Orthophosphate 0.102 <0.005 2.283 0.006 0.005 PAH (ug/L) <0.10 <0.10 <0.10 <0.10 <0.10
Total Ammonia as NH3 (mg/l) 2.246 <0.01 0.011 0.304 <0.01 Total Nitrogen (mg/L) 22.96 2.87 1.12 5.37 1.21
Selenium (ug/L) <0.47 <0.47 3.586 8.08 <0.47 Tin <2.8 15.85 <2.8 <2.8 <2.8 TOC 10.90 3.87 12.0 6.43 4.40
TPH <1 <1 <1 <1 <1 Zinc 1.153 5.838 2.426 <0.41 <0.41
Chloride (mg/L) 45.51 41.41 42.22 2778.03 45.94 COD (mg/L) 11 13 30 30 <5
pH 6.9 6.1 6.9 6.7 7.2 Sulphate mg/L 19.07 31.84 61.09 750.32 18.96 Sodium mg/L 29.31 24.5 27.09 2048 32.49
Potassium mg/L 6.125 2.849 7.217 77.31 2.06 Magnesium mg/L 11.66 9.988 12.45 204.6 15.25 Manganese ug/L 1183 256.4 282.4 115 1.175
50

Moneypoint Generating Station AER 2013
Borehole Analysis 2013
Borehole BH 8 BH 9 BH 10 BH 12 BH 14 Aluminium (ug/L) 57.34 27.48 1958 143.7 217.6
Arsenic (ug/L) <0.10 <0.10 11.23 0.757 1.267 Barium (ug/L) 18.56 75.67 55.63 42.94 32.855 Boron (ug/L) 394.5 <4.33 3090 17.09 1964
Cadmium(ug/L) <0.09 <0.09 0.096 <0.09 <0.09 Chromium(ug/L) <2.14 <2.14 3.522 <2.14 <2.14
Conductivity (mS/cm @ 20'C) 2010 1020 38500 332 36400 Copper (ug/L) 0.205 0.551 25.2 6.775 0.54
Calcium (mg/L) 292.6 121.1 385.3 36.28 317.5 Iron (mg/L) 40.18 0.025 6.351 0.6488 59.91 Lead(ug/l) 0.032 0.06 19.79 7.185 <0.02
Mercury (ug/L) <0.04 <0.04 <0.04 <0.04 <0.04 Molybdenum(ug/L) <5 <5 9.358 <5 11.48
Nickel (ug/L) 0.254 1.003 4.254 1.412 1.412 Nitrate (mg/L) <0.110 <0.110 <0.110 0.440 <0.110
Orthophosphate <0.005 <0.005 0.019 <0.005 0.018 PAH (ug/L) <0.10 <0.10 <0.10 <0.10 <0.10
Total Ammonia as NH3 (mg/l) 0.021 0.011 0.341 0.055 0.319 Total Nitrogen (mg/L) 1.18 <1.00 <1.00 1.01 1.68
Selenium (ug/L) 1.831 <0.47 0.765 <0.47 0.856 Tin <2.8 49.15 2158 10.78 <2.8 TOC 2.73 3.70 31.5 4.13 19.7
TPH 1318.96 ug/L <1 <1 <1
4307.98 ug/L
Zinc <0.41 7.802 49.19 42.12 0.54 Chloride (mg/L) 66 109.34 11583.94 27.05 11841.9
COD (mg/L) <5 <5 52 6 165 pH 7.0 7.0 7.3 7.0 7.7
Sulphate mg/L 1011.73 314.35 2149.88 61.37 1715.69 Sodium mg/L 108.7 72.28 7950 21.92 6891
Potassium mg/L 4.855 3.551 315.2 2.98 238.1 Magnesium mg/L 97.18 39.96 951.3 12.27 804.7 Manganese ug/L 1.931 2256 688.5 248.5 4.109
51

Moneypoint Generating Station AER 2013
Borehole Analysis 2013
Borehole BH 15 BH 16 Q2 BH 16 Q3 BH 16 Q4
Aluminium (ug/L) 116.4 8.417 326.1 44.8 Arsenic (ug/L) 0.5 <0.10 1.298 <0.10 Barium (ug/L) 14.54 69.92 129.5 62.94 Boron (ug/L) 1590 397 154.9 428.9
Cadmium(ug/L) <0.09 <0.09 0.388 <0.09 Chromium(ug/L) <2.14 <2.14 <2.14 2.163
Conductivity (mS/cm @ 20'C) 30100 1150 725 1225 Copper (ug/L) 13.19 0.644 9.292 14.9
Calcium (mg/L) 256.9 166.70 101.4 182.5 Iron (mg/L) 71.4 9.731 2.057 184.3 Lead(ug/l) 0.396 <0.02 3.42 1.172
Mercury (ug/L) <0.04 <0.04 <0.04 <0.04 Molybdenum(ug/L) <5 <5 <5 <5
Nickel (ug/L) 0.239 0.743 4.032 1.503 Nitrate (mg/L) 1.110 <0.110 <0.110 <0.110
Orthophosphate 0.037 <0.005 <0.005 <0.005 PAH (ug/L) <0.10 <0.10 <0.10 <0.10
Total Ammonia as NH3 (mg/l) 0.253 0.068 0.17 0.199 Total Nitrogen (mg/L) 1.67 <1.00 <1.00 <1.00
Selenium (ug/L) <0.47 0.96 0.531 <0.47 Tin 3.634 <2.8 4.37 <2.8 TOC 8.71 5.38 4.37 3.73
TPH <1 <1 1442.09 ug/L <1
Zinc 2.18 <0.41 26.62 0.549 Chloride (mg/L) 10076.18 166.14 73.86 193.35
COD (mg/L) 25 <5 11 <5 pH 6.9 7.1 6.8 7.0
Sulphate mg/L 1716.47 240.34 168.85 407.41 Sodium mg/L 6275 55.52 33.51 38.47
Potassium mg/L 208.2 8.547 5.36 6.393 Magnesium mg/L 780.7 35.89 18 31.37 Manganese ug/L 2.426 8.543 2444 19.45
52

Moneypoint Generating Station AER 2013
Borehole Analysis 2013
Borehole BH 17 Q2
BH 17 Q3 BH 17 Q4
BH 18 Q2
BH 18 Q3 BH 18 Q4
Aluminium (ug/L) 48.27 3342 106.2 35.27 680.3 34.67 Arsenic (ug/L) 0.58 35.43 0.173 0.791 5.779 <0.10 Barium (ug/L) 172 380.6 141.2 125.8 157 129 Boron (ug/L) 99.36 <4.33 56.15 380.1 <4.33 92.47
Cadmium(ug/L) 0.249 0.456 0.157 <0.09 0.38 0.428 Chromium(ug/L) <2.14 6.09 <2.14 <2.14 <2.14 <2.14
Conductivity (mS/cm @ 20'C) 16620 13340 13900 1229 2320 1283 Copper (ug/L) 0.76 56.84 12.47 2.65 23.31 14.91
Calcium (mg/L) 1505 1203 1106.0 202.4 197.2 246.10 Iron (mg/L) 47.11 19.59 564.1 32.83 1.644 84.19 Lead(ug/l) <0.02 91.12 1.588 0.102 7.377 1.246
Mercury (ug/L) <0.04 <0.04 <0.04 <0.04 <0.04 <0.04 Molybdenum(ug/L) 34.27 75.84 43.01 5.77 <5 <5
Nickel (ug/L) 3.962 14.06 3.2 2.034 9.893 1832 Nitrate (mg/L) 4.670 8.640 3.710 0.800 1.330 1.310
Orthophosphate <0.005 <0.005 <0.005 <0.005 <0.005 <0.005 PAH (ug/L) <0.10 <0.10 <0.10 <0.10 <0.10 <0.10
Total Ammonia as NH3 (mg/l) 1.161 0.823 1.469 <0.01 0.012 0.015 Total Nitrogen (mg/L) 6.39 10.35 5.40 1.93 1.9 1.88
Selenium (ug/L) 6.385 9.727 1.337 3.162 1.376 0.642 Tin <2.8 509.5 <2.8 <2.8 73.57 <2.8 TOC 5.55 14 8.36 4.82 4.34 5.16
TPH <1 <1 <1 475.31 <1 <1 Zinc 5.74 56.88 <0.41 <0.41 75.73 5.049
Chloride (mg/L) 5257 3045.1 3171.76 274.2 735.04 315.91 COD (mg/L) 124 44 35 6 13 <5
pH 6.8 6.8 6.3 7.1 6.9 7.0 Sulphate mg/L 1167.03 1083.69 908.85 94.75 150.01 96.36 Sodium mg/L 1498 1101.01 1159 114.1 84.41 141.8
Potassium mg/L 1251 1179 1111 54.74 26.74 65.84 Magnesium mg/L 34.05 18.04 24.05 30.25 19.79 23.59 Manganese ug/L 3195 8233 3762 12.7 1538 504.2
53

Moneypoint Generating Station AER 2013
Borehole Analysis 2013
Borehole
BH 19 Q2
BH 19 Q3 BH 19 Q4 BH 21 BH 22
Aluminium (ug/L) 279 2838 341.8 68.71 70 Arsenic (ug/L) 0.619 5.553 <0.10 <0.10 0.346 Barium (ug/L) 354.8 1065 118.6 68.38 14.46 Boron (ug/L) 72.24 <4.33 45.29 338.6 1496
Cadmium(ug/L) <0.09 0.53 <0.09 0.117 <0.09 Chromium(ug/L) <2.14 <2.14 12.47 21.7 <2.14
Conductivity (mS/cm @ 20'C) 922 517 376 1968 34900 Copper (ug/L) 2.276 35.84 18.18 10.61 7.774
Calcium (mg/L) 116.2 71.99 44.82 248.6 90.59 Iron (mg/L) 159.6 16.89 358.8 348 176.8 Lead(ug/l) 0.191 39.37 1.5 1.157 0.406
Mercury (ug/L) <0.04 <0.04 <0.04 <0.04 <0.04 Molybdenum(ug/L) <5 <5 <5 <5 <5
Nickel (ug/L) 0.41 8.728 <0.14 2.969 <0.14 Nitrate (mg/L) 1.420 <0.110 0.690 1.780 0.110
Orthophosphate 0.009 <0.005 <0.005 <0.005 0.014 PAH (ug/L) <0.10 <0.10 <0.10 <0.10 <0.10
Total Ammonia as NH3 (mg/l) <0.01 <0.01 <0.01 1.603 0.285 Total Nitrogen (mg/L) 2.54 <1.00 1.25 3.66 <1.00
Selenium (ug/L) 0.809 1.067 <0.47 <0.47 <0.47 Tin <2.8 68.37 <2.8 <2.8 8.208 TOC 3.75 4.87 7.18 5.89 13.80
TPH <1 <1 <1 <1 <1 Zinc <0.41 43.1 <0.41 <0.41 <0.41
Chloride (mg/L) 206.94 82.14 36.14 477.18 10898.83 COD (mg/L) <5 7 <5 <5 40
pH 7.5 7.4 7.7 6.5 7.7 Sulphate mg/L 125 34.54 60.95 361.79 1943.13 Sodium mg/L 75.05 35.21 24.46 100.8 164.3
Potassium mg/L 9.335 5.523 3.532 9.653 33.4 Magnesium mg/L 27.17 16.67 10.15 47.22 50.16 Manganese ug/L 3.281 3378 20.72 6161 1.804
54

Moneypoint Generating Station AER 2013
Borehole Analysis 2013
Borehole BH 23 BH 26 BH 27 BH 28 BH 31 Aluminium (ug/L) 15.33 92.92 188.5 119 230.5
Arsenic (ug/L) 0.721 0.33 <0.1 <0.1 <0.1 Barium (ug/L) 10.24 15.3 16.98 64.61 53.09 Boron (ug/L) 2380 3292 52.13 103.7 63.31
Cadmium(ug/L) <0.09 0.094 <0.09 0.099 <0.09 Chromium(ug/L) <2.14 3.121 3.64 5.529 <2.14
Conductivity (mS/cm @ 20'C) 36500 36600 271 462 472 Copper (ug/L) 9.125 13.24 12.74 8.864 13.72
Calcium (mg/L) 291.8 308.9 16.79 88.54 71.67 Iron (mg/L) 68.2 159 376.9 181.5 328.4 Lead(ug/l) <0.02 0.791 1.027 0.644 0.814
Mercury (ug/L) <0.04 <0.04 <0.04 <0.04 <0.04 Molybdenum(ug/L) <5 6.689 <5 <5 <5
Nickel (ug/L) <0.14 0.672 1.031 0.824 1.092 Nitrate (mg/L) <0.110 <0.110 0.940 0.440 <0.110
Orthophosphate 0.012 0.006 <0.005 <0.005 <0.005 PAH (ug/L) <0.10 <0.10 <0.10 <0.10 <0.10
Total Ammonia as NH3 (mg/l) 0.355 0.339 0.029 0.114 0.115 Total Nitrogen (mg/L) <1.00 <1.00 1.50 1.00 <1.00
Selenium (ug/L) <0.47 0.624 <0.47 <0.47 <0.47 Tin 6.265 7.32 <2.8 <2.8 <2.8 TOC 1.43 6.72 2.90 4.05 3.87
TPH <1 <1 <1 <1 <1 Zinc <0.41 <0.41 411 <0.41 <0.41
Chloride (mg/L) 11242.03 11236.19 58.12 36.7 34.52 COD (mg/L) 20 35 <5 <5 9
pH 7.8 7.6 6.4 7.3 7.0 Sulphate mg/L 2138.78 2180.24 10.61 16.78 33.31 Sodium mg/L 7446 7606 23.35 19.19 20.36
Potassium mg/L 247.3 255 5.019 13.31 4.602 Magnesium mg/L 949.3 962.3 6.236 5.143 10.9 Manganese ug/L 1.98 3.006 314.8 10.01 116.5
55

Moneypoint Generating Station AER 2013
10.7 Annual Landfill Status Report Landfill Name Ash Storage Area Licence Number 605-03 Landfill Location Moneypoint, Kilrush, Co Clare Owner and Operator ESB Area occupied by waste 387,000 m2 Volume and composition of waste deposited in the preceding year
Pulverised Fuel Ash ~ 105,580 tonnes
Furnace Bottom Ash ~ 16,736 tonnes
Methods of Depositing Fill, Compact and Cover Time and duration of depositing Varies:
minimum 8AM to 5PM 5 days a week maximum 8AM to 8PM 7 days a week
Total Accumulated quantities of waste deposited
2.854 m3 (estimated)
Stability Checks Undertaken None required Results of Monitoring Programme: a) Surface Water Monitoring Refer to Section 3.1 b) Groundwater Monitoring Refer to Section 10.6 c) Leachate Monitoring Refer to Section 3.2 d) Waste Stability ,levels, Void Monitoring
None
e) Meteorological Monitoring 2013 Rainfall 930 mm f) Dust Monitoring – in ASA 51.7 mg/m2/day (yearly ave) Summary of Monitoring Non Compliance & Corrective Actions
Refer to Section 2.3 and 7.1
Revisions to Landfill Operational Plan None in 2013 Summary of any developmental / remedial works carried out in the preceding year
Calculated Remaining Capacity 145,000m3 Calculated final capacity of site 3 m3 (estimated) Year in which final capacity of site is expected to be reached
It is not possible to predict an exact date in which the ASA will reach capacity as ash markets dictate the level of ash storage
Progress on restoration of completed cells
In accordance with the current license a new restoration and closure plan for the completed cells will be produced.
56

Moneypoint Generating Station AER 2013
10.8 FGD By-Product Landfill Status Report Landfill Name FGD By-Product Landfill Licence Number 605-03 Landfill Location Moneypoint, Kilrush, Co Clare Owner and Operator ESB Area occupied by waste 160,000 m2 Volume and composition of waste deposited in the preceding year
Pulverised Fuel Ash ~ 14,003 tonnes
FGD By-Product ~ 46,678 tonnes Cement ~ 502 tonnes
Methods of Depositing Fill, Compact and Cover Time and duration of depositing 8AM to 5PM 5 to 7 days a week
Total Accumulated quantities of waste deposited
395,000 tonnes (estimated)
Stability Checks Undertaken Report submitted for first sub-cell Results of Monitoring Programme: Bund containment layer sufficient b) Groundwater Monitoring Refer to Section 10.6 e) Meteorological Monitoring 2013 Rainfall 930 mm f) Dust Monitoring – in FGD by-product landfill
69.8 mg/m2/day (yearly avg)
Summary of Monitoring Non Compliance & Corrective Actions
Refer to section 2.3 and 7.1
Revisions to Landfill Operational Plan None in 2013 Summary of any developmental / remedial works carried out in the preceding year
Cell 1d has reached 90% capacity with work due to commence on final capping of the remainder of cell 1
Calculated Remaining Capacity 653,000 m3 (for area A) and 3,000,000 m3 (for area B)
Year in which final capacity of site is expected to be reached
2025
4.9 Review of Residuals Management Plan The revised ELRA submitted to the EPA in January of 2014.
57

Moneypoint Generating Station AER 2013
Appendix 1 Noise Report 2013
Meas
Date
of Mo
nitori
ngPe
riod
Start T
ime
Monit
oring
Lo
cation
Monit
oring
Lo
cation
LAeq
LA90
LA10
LAma
xLA
min
Tona
l or
Impu
lsive
If Ton
al or
Impu
lsive,
was p
enalt
y ap
plied
?
Comm
ents
Is site
co
mplian
t wit
h Nois
e Lim
its?
On Si
teNS
LdB
dBdB
dBdB
Meas0
0219
/11/20
13Da
y17
:42-
NSL1
49.7
41.6
54.1
64.4
38.7
No-
Low l
evel st
eady
state
backg
round
noise
from
the
Powe
r Stat
ion, o
ccasio
nal re
versin
g sire
ns on
site.
HGV t
raffic
on N6
7.Ye
s
Meas0
0619
/11/20
13Ev
e20
:31-
NSL1
47.1
38.8
50.4
63.9
36.5
No-
Low l
evel st
eady
state
backg
round
noise
from
the
Powe
r Stat
ion, o
ccasio
nal re
versin
g sire
ns on
site.
HGV t
raffic
on N6
7.Ye
s
Meas0
0719
/11/20
13Nig
ht22
:02-
NSL1
46.5
40.3
49.1
62.4
37.7
No-
Low l
evel st
eady
state
backg
round
noise
from
the
Powe
r Stat
ion, o
ccasio
nal re
versin
g sire
ns on
site.
HGV t
raffic
on N6
7. Fo
liage n
oise f
rom inc
reasin
g wind
.Ye
s
Meas0
0319
/11/20
13Da
y18
:19-
NSL2
54.5
34.6
48.9
83.2
32.3
No-
Powe
r Stat
ion au
dible i
n traf
fic lull
s as lo
w leve
l stea
dy sta
te ba
ckgrou
nd no
ise, b
usy tra
ffic on
N67 is
domin
ant
source
.Ye
s
Meas0
0419
/11/20
13Ev
e19
:03-
NSL2
44.5
37.3
46.1
67.7
32.2
No-
Powe
r Stat
ion au
dible i
n traf
fic lull
s as lo
w leve
l stea
dy sta
te ba
ckgrou
nd no
ise, b
usy tra
ffic on
N67 is
domin
ant
source
.Ye
s
Meas0
0919
/11/20
13Nig
ht23
:15-
NSL2
52.2
48.2
54.8
66.8
45.6
No-
Powe
r Stat
ion au
dible i
n traf
fic lull
s as lo
w leve
l stea
dy sta
te ba
ckgrou
nd no
ise, b
usy tra
ffic on
damp
N67 is
do
minan
t sourc
e. Fo
liage n
oise is
a sig
nifican
t sourc
e ove
r Pow
er Sta
tion no
ise fro
m inc
reasin
g wind
.
Yes
Meas0
0119
/11/20
13Da
y17
:09-
NSL3
55.3
46.4
57.3
79.4
41.5
No-
Vane
s on F
GD pla
nt wit
hin Po
wer S
tation
domin
ant
source
until t
urned
off a
fter 2
2 mins
. Afte
r this,
stead
y sta
te low
level n
oise f
rom Po
wer S
tation
and
occasi
onal r
eversin
g sire
ns au
dible i
n site.
Yes
Meas0
0519
/11/20
13Ev
e19
:50-
NSL3
49.7
40.4
53.6
70.7
36.6
No-
Powe
r Stat
ion au
dible i
n traf
fic lull
s as lo
w leve
l stea
dy sta
te ba
ckgrou
nd no
ise, b
usy tra
ffic on
N67 is
domin
ant
source
. Occa
siona
l rever
sing s
irens
audib
le on s
iteYe
s
Meas0
0819
/11/20
13Nig
ht22
:36-
NSL3
47.4
41.4
5064
38.9
No-
Powe
r Stat
ion au
dible i
n traf
fic lull
s as lo
w leve
l stea
dy sta
te ba
ckgrou
nd no
ise, b
usy tra
ffic on
N67 is
domin
ant
source
. Occa
siona
l rever
sing s
irens
audib
le on s
ite.
Foliag
e nois
e dom
inant
to Po
wer S
tation
noise
in inc
reasin
g bree
ze.
Yes
58

Moneypoint Generating Station AER 2013
INTRODUCTION Allegro Acoustics was retained by ESB – Moneypoint Power Station to undertake day, evening and night time environmental noise monitoring at three locations in the vicinity of Moneypoint Power Station in Kilrush, Co. Clare. Moneypoint Power Station is operational 24 hours per day, seven days per week when “on line” and generating power. Otherwise, the facility occasionally comes off line during which time it is shut down. Environmental noise monitoring was carried out to determine if the power station is in compliance with the noise limits as applicable to the facility by the IPPC License P0605-03 and the EPA document NG4 (Reference 1). The site on which the power station is located is bordered to the South and East by the River Shannon and to the West and North by agricultural lands. SCOPE OF WORKS Noise monitoring was undertaken to verify compliance or otherwise with IPPC License P0605-03 for the facility. Cognisance was also paid to the methodologies and noise emission limits as outlined in Guidance Note for Noise: License Applications, Surveys and Assessments in Relation to Scheduled Activities (NG4) (Reference 1). Noise monitoring was undertaken by Mr Barry Sheridan of Allegro Acoustics on the 19th of November 2013. This report presents the results of the noise monitoring and discusses the findings. Noise Monitoring Locations Noise monitoring was undertaken at a total of three locations during day, evening and night time. The noise measurement locations are detailed in Table 1 and outlined on a schematic for the facility in Figure 1 below. Monitoring Points
• NSL1 North East of Power Station - Residential • NSL2 North of Power Station - Residential • NSL3 North East of Power Station at Y junction - Residential
Figure 1: Noise Monitoring Locations. Survey Instrumentation and Methodology The precise noise monitoring locations were chosen according to the guidelines in Guidance Note for Noise: NG4 (Reference 1) and ISO 1996: Acoustics – Description and Measurement of Environmental Noise (Reference 2). In all cases, the sound level meter (SLM) was mounted
59

Moneypoint Generating Station AER 2013
on a tripod at 1.5m above ground level and at least 3.5m away from any sound reflecting surfaces. The SLM was oriented towards the facility of interest for each measurement taken. A Bruel and Kjaer UA-1650 windshield with auto detect was placed on the microphone to reduce any wind interference during measurements. The measurements were made using a Bruel and Kjaer Type 2250 Sound Level Meter (SLM) which measures simultaneously in every 1/3rd octave frequency band from 12.5Hz to 20 kHz. The SLM was calibrated before, during and after the noise monitoring survey was carried out using a Bruel and Kjaer acoustic calibrator. Calibration certification, SLM serial number, calibrator used and microphone serial number for the SLM are presented in the factory calibration certificate as displayed in Appendix C. The Bruel and Kjaer Type 2250 SLM is a Class 1 instrument in accordance with IEC 61672 regulations. The Time Weighting used was Fast and the Frequency Weighting was A-weighted as per IEC 61672.
60

Moneypoint Generating Station AER 2013
Appendix 2 Site map
61

Moneypoint Generating Station AER 2013
Appendix 3 Location of Surface water sample locations
1
Sw14
62