Embed Size (px)
Citation preview

Exploring Projects
ERRTHUM, MASTROMATTEO, O'CONNOR, SCHEAFFER
DATA-DRIVEN MATHEMATICS
• ,, "1' ••
D A L E S E Y M 0 U R P U B L I C A T I 0 N S®
Exploring Projects= Planning and Conducting Surveys and Experiments
DATA-DRIVEN MATHEMATICS
Emily Errthum, Richard Scheaffer, Maria Mastromatteo, and Vince O'Connor
Dale Seymour Pullllcatlons® White Plains, New York
This material was produced as a part of the American Statistical Association's Project "A Data-Driven Curriculum Strand for High School" with funding through the National Science Foundation, Grant #MDR-9054648. Any opinions, findings, conclusions, or recommendations expressed in this publication are those of the authors and do not necessarily reflect the views of the National Science Foundation.
This book is published by Dale Seymour Publications®, an imprint of Addison Wesley Longman, Inc.
Dale Seymour Publications 10 Bank Street White Plains, NY 10602 Customer Service: 800-872-1100
Copyright© 1999 by Addison Wesley Longman, Inc. All rights reserved. No part of this publication may be reproduced in any form or by any means without the prior written permission of the publisher.
Printed in the United States of America.
Order number DS21164
ISBN 1-57232-397-3
1 2 3 4 5 6 7 8 9 10-ML-02 01 00 99 98
This Book ls Printed On Recycled Paper
DALE SEVMDUR PUBLICATIONS®
Managing Editor: Alan MacDonell
Senior Mathematics Editor: Carol Zacny
Project Editor: Nancy R. Anderson
Production/Manufacturing Director: Janet Yearian
Senior Production Coordinator: Fiona Santoianni
Design Manager: Jeff Kelly
Cover and Text Design: Christy Butterfield
Cover Photo: Uniphoto, Inc.
Acknowledgments
The authors would like to thank the following people for their assistance during the preparation of this module:
• The many teachers who reviewed drafts and participated in field tests of the manuscripts
• The members of the Data-Driven Mathematics leadership team, the consultants and writers
• Nancy Kinard, for her advice and suggestions in the early stages of the writing
• Kathryn Rowe and Wayne Jones for their help in organizing the field-test process and the Leadership Workshops
Authors
Emily Errthum Homestead High School Mequon, Wisconsin
Richard Scheaffer University of Florida Gainesville, Florida
Consultants
.Jack Burrill National Center for Mathematics Sciences Education University of Wisconsin-Madison Madison, Wisconsin
Henry Kranendonk Rufus King High School Milwaukee, Wisconsin
Maria Mastromatteo Brown Middle School Ravenna, Ohio
Vince O'Connor Milwaukee Public Schools Milwaukee, Wisconsin
Pat Hopfensperger Homestead High School Mequon, Wisconsin
.Jeffrey Witmer Oberlin College Oberlin, Ohio
Data-Driven •alllemancs Leadership Team
Gail F. Burrill National Center for Mathematics Sciences Education University of Wisconsin-Madison Madison, Wisconsin
Kenneth Sherrick Berlin High School Berlin, Connecticut
Richard Scheaffer University of Florida Gainesville, Florida
.James M. Landwehr Bell Laboratories Lucent Technologies Murray Hill, New Jersey
Miriam Clifford Nicolet High School Glendale, Wisconsin
Table of Contents
About Data-Driven Mathematics vi
Using This Module vii
Unit I: Censuses
Exploratory Lesson: Collecting and Analyzing Data 3
Lesson 1 : Conducting a Census 8
Lesson 2: Looking at the U.S. Census 11
Unit I Activity: Taking Your Own Census 14
Unit II: Surveys
Lesson 3: Conducting a Survey 19
Lesson 4: Asking Questions 23
Lesson 5: Selecting a Sample 27
Lesson 6: Studying Randomization 32
Lesson 7: Sampling in the Real World 35
Lesson 8: Critiquing a Printed Article 44
Lesson 9: Understanding Sampling Error (Extension) 49
Unit II Activity: Conducting Your Own Survey 54
Unit Ill: Experiments
Lesson 10: Conducting an Experiment 57
Lesson 11 : Experimenting to Answer a Question 60
Lesson 12: Measurement Variability and Bias 64
Lesson 13: Experiments in the Real World 67
Unit Ill Activity: Conducting Your Own Experiment 71
Unit IV: Projects
Lesson 14: A Reference Guide 79
Lesson 15: Doing a Project 89
Lesson 16: Representing the Same Data in Different Ways 94
Information Sheet: Informing Others 100
TABLE OF CONTENTS v

Abaut Data-Dri11en Wlatllemalics
Historically, the purposes of secondary-school mathematics have been to provide students with opportunities to acquire the mathematical knowledge needed for daily life and effective citizenship, to prepare students for the workforce, and to prepare students for postsecondary education. In order to accomplish these purposes today, students must be able to analyze, interpret, and communicate· information from data.
Data-Driven Mathematics is a series of modules meant to complement a mathematics curriculum in the process of reform. The modules offer materials that integrate data analysis with high-school mathematics courses. Using these materials will help teachers motivate, develop, and reinforce concepts taught in current texts. The materials incorporate major concepts from data analysis to provide realistic situations for the development of mathematical knowledge and realistic opportunities for practice. The extensive use of real data provides opportunities for students to engage in meaningful mathematics. The use of real-world examples increases student motivation and provides opportunities to apply the mathematics taught in secondary school.
The project, funded by the National Science Foundation, included writing and field testing the modules, and holding conferences for teachers to introduce them to the materials and to seek their input on the form and direction of the modules. The modules are the result of a collaboration between statisticians and teachers who have agreed on statistical concepts most important for students to know and the relationship of these concepts to the secondary mathematics curriculum.
vi ABOUT DATA-DRIVEN MATHEMATICS
Using Tllis Module
For a large part of the population today, the most important application of mathematics involves both the collection and the analysis of data. The lessons in this module will lead you step by step through the process of creating and carrying out a survey or an experiment. They will help you develop both an overall framework and an understanding of the key components of a project: problem formation, data collection, data analysis, and data interpretation. In the process, you will gain practical experience in working on a team, organizing field work, and managing data.
This module is divided into four units.
Unit I deals with conducting a census. You will be introduced to the concept of a census and do exercises that help you understand what a census is. This unit specifically discusses the U.S. Census as perhaps the most important and most wellknown census.
Unit II gives information about sample surveys. After discussing the need to conduct sample surveys, it explains the concepts of bias and randomization. You will do exercises that help to clarify these concepts. This unit stresses the need to critically read the results of sample surveys.
Unit III deals with experiments. The concepts of variability and bias are stressed as you see how questions are answered through the use of experiments.
Unit IV will help you complete a project of your own. Lesson 15 gives specific directions about conducting your project. You will also do exercises that show how information can be graphically displayed in several ways. Lessons 14 and 16 tell you about the types of graphs you can use and how to make them. There is also an Information Sheet, Informing Others, that reviews the writing process.
Each lesson begins with an introduction and an opening section that can be discussed by the class; a section titled Investigate, which includes material that can be completed by the class as a whole, by small groups, or by individual students; and two exercise sections, which include work to be done individually or in groups.
USING THIS MODULE vii
Content
Mathematics
• representations of data in tables and graphs
• percentages, proportions, and rates
• elementary probability
• estimation
• whatever math is necessary to complete your projects
• evaluation of expressions and formulas
Statistics
• census
• sample survey: questionnaire design, randomization, data management, estimates of population quantities
• experiments: treatment, control, randomization, data management, drawing conclusions
• variability
• bias
viii CONTENT

Unit I
Censuses

EXPLORATORY LESSON
Collecting and Analyzing Data
What is a census?
What is a survey?
What is an experiment?
T he practice of statistics involves both collecting and analyzing data. Data is usually collected through a census,
a survey, or an experiment.
EXPLORE
In a census, you must obtain information on every person in the group (population) you wish to study. A population can be a very large group, such as in the U.S. Census where the group under investigation is the people of the United States. Your population could also be a smaller group, such as the student body of your school or the fish in your tank.
When gathering opinions or facts about an issue, data collectors usually find it impossible to study an entire population. For example, to find the most popular television show in the U.S., you might interview a small group and generalize your findings to the entire population. When you interview only a portion of the population, you are conducting a sample survey. The purpose of a sample survey is to estimate some characteristics of a population, such as the percentage of television viewers watching a specific show.
A third way to gather information is through experiments. Experiments are controlled studies of a topic or problem to answer a specific question concerning the effect of one or more treatments. For example, you might be concerned about whether plants grow better in salt water or fresh water.
OBJECTIVES
Study the characteristics of a census, a survey, and an experiment.
Review data-analysis techniques.
Carry out a data-analysis project.
COLLECTING AND ANALYZING DATA :J
Throughout this module, you will study these three methods of collecting data. You will discover important ideas that will help you analyze studies and determine if a survey or an experiment is accurate. You will look at surveys and experiments that experts have done, and you may design and carry out a survey or an experiment of your own.
Your class will tie together a full menu of statistical ideas including problem formation, data collection, data analysis, and data interpretation-all built around a theme that interests you.
Data Collection and Analysis
Read the following articles and graphs and determine whether each is a census, a survey, or an experiment.
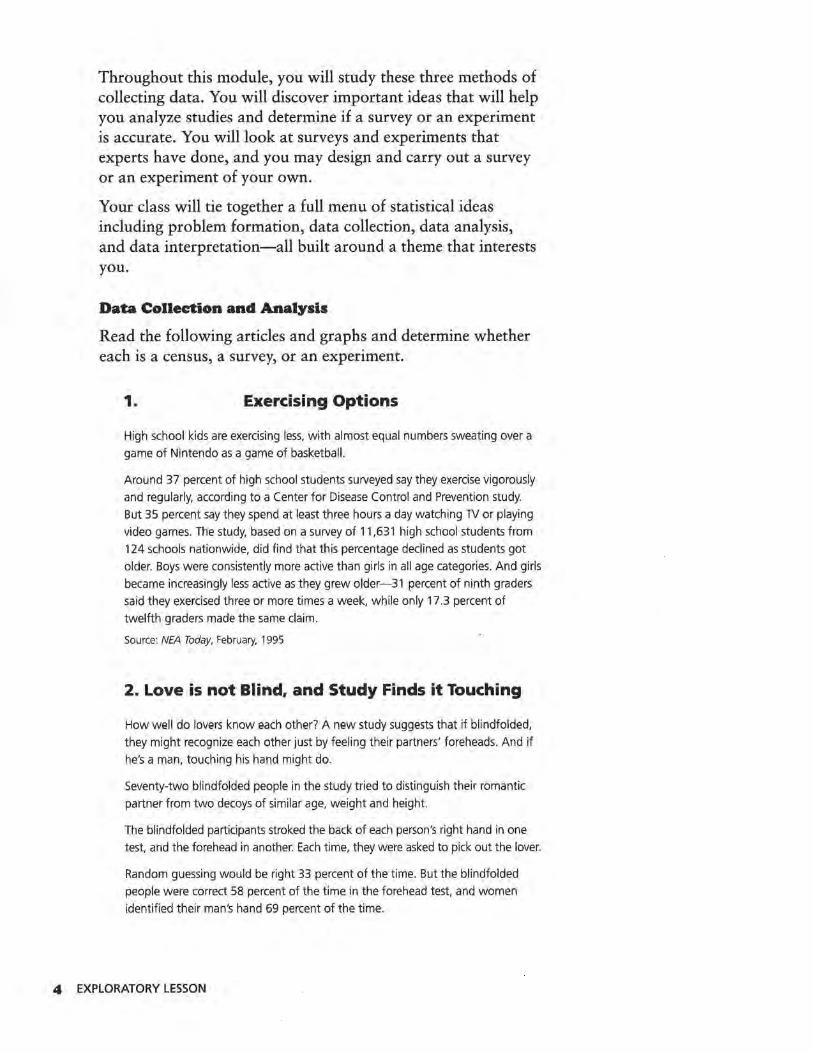
1. Exercising Options
High school kids are exercising less, with almost equal numbers sweating over a
game of Nintendo as a game of basketball.
Around 37 percent of high school students surveyed say they exercise vigorously
and regularly, according to a Center for Disease Control and Prevention study.
But 35 percent say they spend at least three hours a day watching 1V or playing
video games. The study, based on a survey of 11,631 high school students from
124 schools nationwide, did find that this percentage declined as students got
older. Boys were consistently more active than girls in all age categories. And girls
became increasingly less active as they grew older-31 percent of ninth graders
said they exercised three or more times a week, while only 17.3 percent of
twelfth graders made the same claim.
Source: NEA Today, February, 1995
2. Love is not Blind, and Study Finds it Touching
How well do lovers know each other? A new study suggests that if blindfolded,
they might recognize each other just by feeling their partners' foreheads. And if
he's a man, touching his hand might do.
Seventy-two blindfolded people in the study tried to distinguish their romantic
partner from two decoys of similar age, weight and height.
The blindfolded participants stroked the back of each person's right hand in one
test, and the forehead in another. Each time, they were asked to pick out the lover.
Random guessing would be right 33 percent of the time. But the blindfolded
people were correct 58 percent of the time in the forehead test, and women
identified their man's hand 69 percent of the time.
4 EXPLORATORY LESSON
3.
"I think that in real life we could probably do a whole lot better" said researcher
Marsha Kaitz. The stress of being in a laboratory experiment and the carefully
matched decoys probably hindered the real-world ability of recognition by touch,
she said.
"I think that probably everyone can do it," Kaitz, a psychologist at Hebrew
University in Jerusalem, said in a telephone interview. Touch recognition is "just a
skill that has not been tapped before," she said.
Source: Associated Press, June 22, 1992
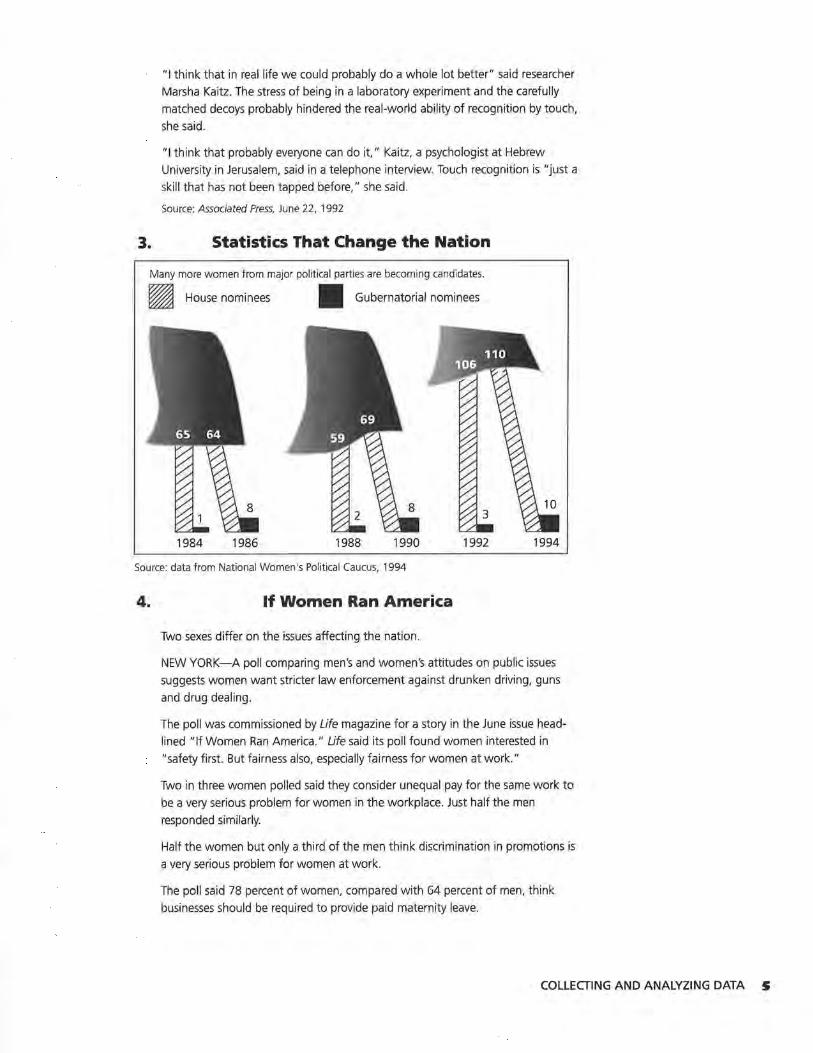
Statistics That Change the Nation
Many more women from major political parties are becoming candidates.
~ House nominees II Gubernatorial nominees
1984 1986 1988 1990 1992 1994
Source: data from National Women's Political Caucus, 1994
4. If Women Ran America
Two sexes differ on the issues affecting the nation.
NEW YORK-A poll comparing men's and women's attitudes on public issues
suggests women want stricter law enforcement against drunken driving, guns
and drug dealing.
The poll was commissioned by Life magazine for a story in the June issue head
lined "If Women Ran America." Life said its poll found women interested in
"safety first. But fairness also, especially fairness for women at work."
Two in three women polled said they consider unequal pay for the same work to
be a very serious problem for women in the workplace. Just half the men
responded similarly.
Half the women but only a third of the men think discrimination in promotions is
a very serious problem for women at work.
The poll said 78 percent of women, compared with 64 percent of men, think
businesses should be required to provide paid maternity leave.
COLLECTING AND ANALYZING DATA S
The poll was taken by the Gallup Organization, which surveyed a national sample
of 614 women and 608 men by phone March 30-April 5.
The margin of error ranges from plus or minus 3 percentage points for the whole
sample, up to 6 points for comparisons of results of men and women.
In other words, the poll indicates a gender gap, rather than chance variation,
accounts for differences of opinion such as this: 55 percent of women but only
46 percent of men said the government should make fighting crime and violence
an extremely important priority.
Seventy-six percent of women and only 58 percent of men said the justice sys
tem wasn't hard enough on drunken drivers. On drug dealing, 88 percent of
women and 77 percent of men wanted the system to be tougher. Seventy per
cent of women and 63 percent of men wanted to be tougher on illegal gun pos
session.
Women were more compassionate than men on some issues: 85 percent would
approve of a law requiring businesses to allow employees an unpaid 12-week
family medical leave. Women were more likely than men to approve of such a
leave for homosexual couples, and to say they would vote for a gay candidate.
Source: Gainesville Sun, May 5, 1992
5. Back Treatment: Lay Off
By Tim Friend, USA Today
Less may be best when it comes to treating back pain.
A study out today suggests that people whose doctors prescribe the least pain
medicine or physical restriction get as much relief as those treated with more
pain medicine and bed rest.
The researchers, writing in the Annals of Internal Medicine, studied 1,213 people
with back pain and the 44 doctors who treat them at the Group Health
Cooperative of Puget Sound, Seattle.
They divided doctors into groups-those prescribing the most medicine and rest,
those in the middle, and those prescribing the least. Outcomes of patients one
and two years after the initial visit reveal:
• No difference in how patients rated their care, and none in their level of
pain.
• Those who took the least medicine and restriction were the most satisfied
with efforts to each them how to deal with pain.
• Total cost of care was 79% higher in patients prescribed the most medi
cine and bed rest.
• About 85% of people have back pain at some time, making it the second
leading reason to see a doctor, behind colds.
Source: USA Today, 1993
• EXPLORATORY LESSON
LESSON 1
Conducting a Census
How do all the students in your school feel about the daily schedule?
How do all the people in your state feel about highway speed laws?
OBJECTIVE
Recognize a census and give some of its characteristics.
Address problems associated with taking
a census.
A t the beginning of a data-gathering project, it is important to identify the population of people, animals, or objects
that you will study. When data are collected from the entire population, the study is referred to as a census. Some examples of a census could be a study of the entire student body in your school or all the students in a particular grade level, a study of all the mammals in a zoo, or an investigation into all the tennis balls a team uses to practice.
In one sense, your teachers conduct a census daily when they take attendance. Taking a census at a hospital or taking an inventory at a business are two more census like procedures that occur rather frequently and have been developed into routine events. Each procedure has prescribed times and methods established to ensure accuracy.
Taking a census can be a very difficult task. The difficulty in doing a census, even within your school, is to be sure that every person is counted once and only once. For example, suppose you want to know how many students in your school sang the school song at a pep rally yesterday. This becomes difficult because some of those students are not present today and yet those students must be included in the data collection.
INVESTIGATE
The U.S. Census
One of the most familiar censuses is the U.S. Census, provided for by the original draft of the Constitution in 1787. What do you know about the U.S. Census?
CONDUCTING A CENSUS 7
Discussion and Praetiee
I. Why is the U.S. Census conducted?
z. What questions are asked?
3. How often is the U.S. Census conducted?
You can imagine the difficulties involved in conducting a census of the United States.
4. Answer the following questions and be prepared to report to the class.
a. What are some problems involved in conducting a census?
b. What are some possible consequences of missing people or counting them twice?
c. Find out how long it takes to count the population of the United States.
The difficulties in conducting the U.S. Census are enormous. People are not going to stand still while officials come by to count them. Life goes on. How can the government get areasonable count of the actual population? This "nightmare" task can be handled if you consider some essential factors.
Prac:tiee and Applications
Make some decisions on the following issues involved in taking a census of the United States. Be prepared to present your ideas to the class.
Counting People
s. Decisions about who should be counted and who should not be counted must be made.
a. Give some categories of people that might be difficult to count.
b. Give a description, specifying who will be counted, that could be used in the next U.S. Census to be taken on April 1, 2000.
Counting Everyone Just Once
6. Mailing a form to each residence might seem to be an easy
8 LESSON 1
and accurate task, but there are difficulties with this proce-dure as well. ·
a. List some difficulties in counting people by mailing a form.
b. Write a paragraph explaining how you would count everyone just once.
Controlline Errors
7. Following up on incomplete questionnaires, missing questionnaires, and other sources of error is an important feature of the U.S. Census effort.
a. Many political decisions are made by using the data the census provides. What are some of those decisions? How would errors affect them?
b. What other errors might occur?
c. How would you check for errors and locate missing questionnaires?
8. Extend Design a census you could use to count the number of people living on your block on April 1 of next year. Be sure your questionnaire makes clear exactly who should be counted.
CONDUCTING A CENSUS 9
LESSON 2
Looking at the U.S. Census
What kind of information is collected by the U.S. Census?
Why is it collected?
Who uses the information?
U .S. Census data provide a wealth of information. These data help determine housing needs, state and local fund
ing, education levels, and gender- and race-equity issues. They are also valuable for making predictions and forecasting events: where people are moving; how many elderly people will be in the United States in ten years; and how many new schools will be needed. Census data are used to report changes in population after each decade. These data also determine the number of representatives each state has in Congress and the amount of funds states receive for federal programs, such as grants for low-cost housing.
INVESTIGATE
Population Density
Census data can be used to study population density. Population density is the average number of people living in a specified unit of area. The density is calculated by dividing the number of people in the population by the area covered by that population.
Discussion and Practice
1.. Why do you think population density might be an important issue?
1.0 LESSON 2
OBJECTIVE
Recognize the uses of U.S. Census data .
Calculate population increase and decrease. Understand population
density and how it is calculated.
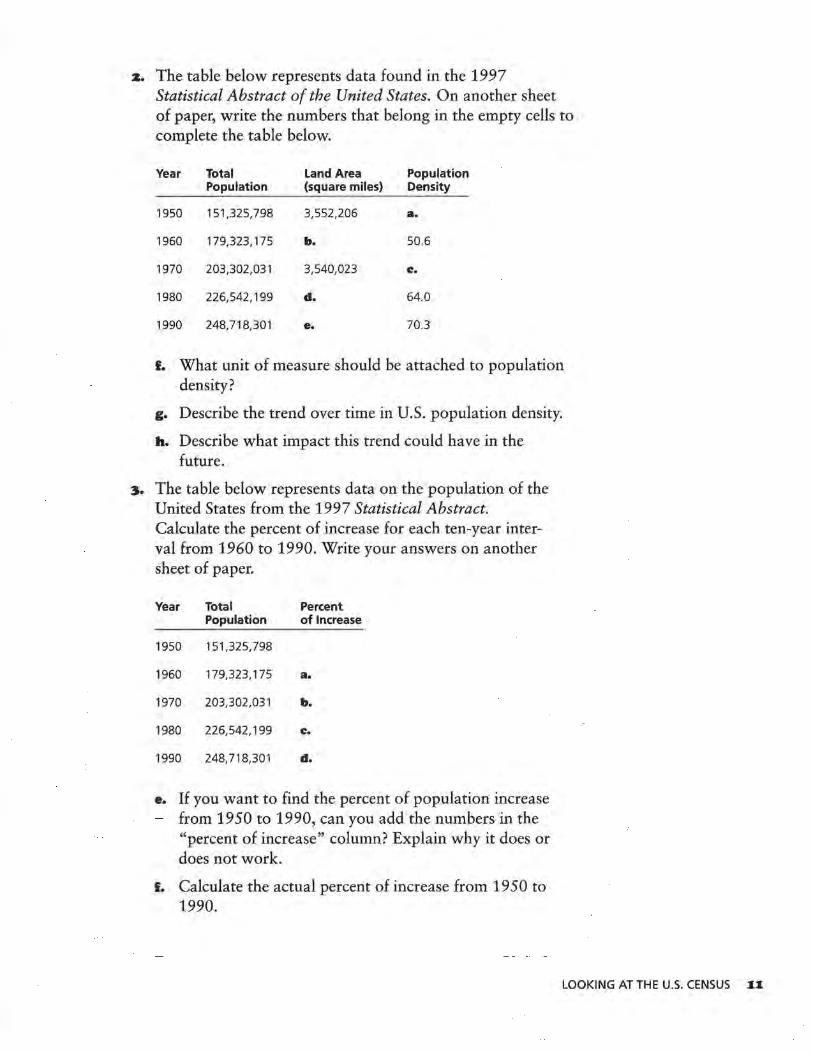
z. The table below represents data found in the 1997 Statistical Abstract of the United States. On another sheet of paper, write the numbers that belong in the empty cells to complete the table below.
Year Total Land Area Population Population (square miles) Density
1950 151,325,798 3,552,206 a.
1960 179,323, 175 b. 50.6
1970 203,302,031 3,540,023 e.
1980 226,542, 199 d. 64.0
1990 248,718,301 e. 70.3
I. What unit of measure should be attached to population density?
g. Describe the trend over time in U.S. population density.
h. Describe what impact this trend could have in the future.
3. The table below represents data on the population of the United States from the 1997 Statistical Abstract. Calculate the percent of increase for each ten-year interval from 1960 to 1990. Write your answers on another sheet of paper.
Year Total Percent Population of Increase
1950 151,325,798
1960 179,323, 175 a.
1970 203,302,031 b.
1980 226,542, 199 e.
1990 248,718,301 d.
e. If you want to find the percent of population increase from 1950 to 1990, can you add the numbers in the "percent of increase" column? Explain why it does or does not work.
I. Calculate the actual percent of increase from 1950 to 1990.
LOOKING AT THE U.S. CENSUS II
SUMMARY
• In a census, you must obtain information on every member of the population you are studying.
• The group you are interested in studying is called the population.
• The U.S. Census, which is conducted every ten years, is an official enumeration, or count, of the number of people living in the United States. It is used for political, social, and economic purposes.
Practice and Applications
4. Find the population density of your classroom or the school auditorium using the number of people per square yard.
1Z LESSON 2
UNIT I ACTIVITY
Taking Your Own Census
OBJECTIVE
Demonstrate through hands-on experience the
aspects of planning, conducting, and
reporting a census.
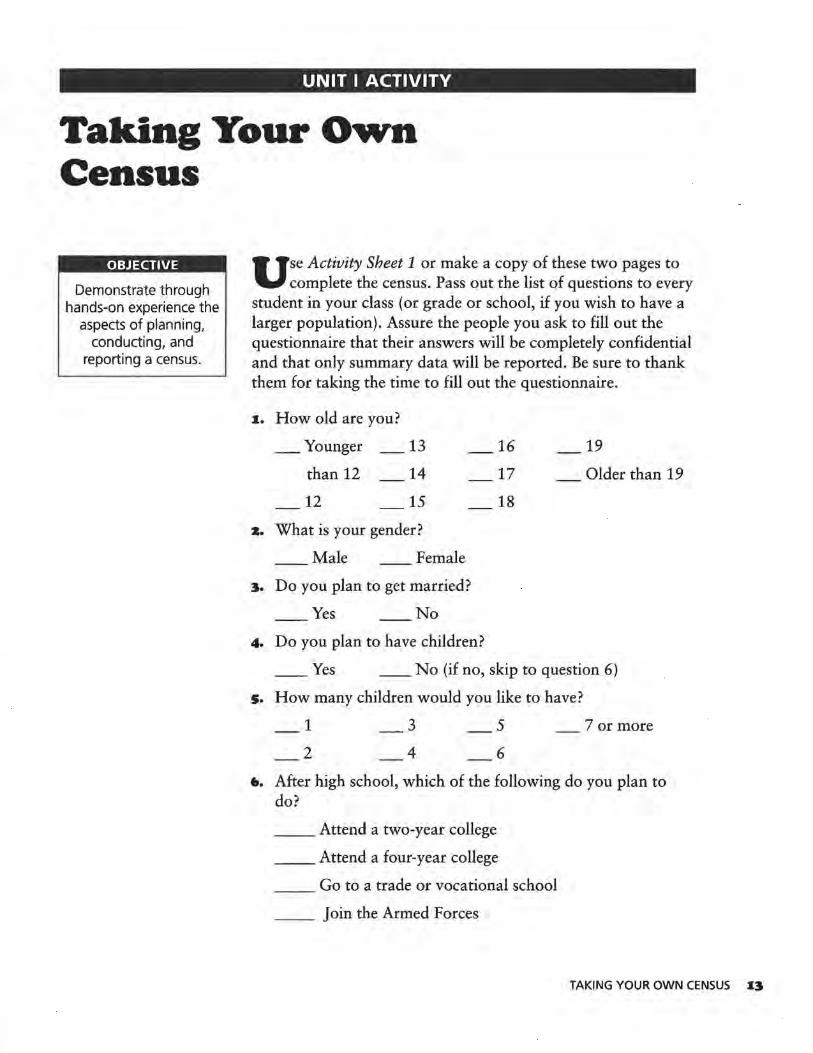
U se Activity Sheet 1 or make a copy of these two pages to complete the census. Pass out the list of questions to every
student in your class (or grade or school, if you wish to have a larger population). Assure the people you ask to fill out the questionnaire that their answers will be completely confidential and that only summary data will be reported. Be sure to thank them for taking the time to fill out the questionnaire.
~. How old are you?
_Younger 13 16 19
than 12 14 17 Older than 19
12 15 18
z. What is your gender?
Male Female
3. Do you plan to get married?
Yes No
4. Do you plan to have children?
Yes __ No (if no, skip to question 6)
s. How many children would you like to have?
1
2
3
4
5
6
7 or more
6. After high school, which of the following do you plan to do?
__ Attend a two-year college
__ Attend a four-year college
__ Go to a trade or vocational school
__ Join the Armed Forces
TAKING YOUR OWN CENSUS ~3
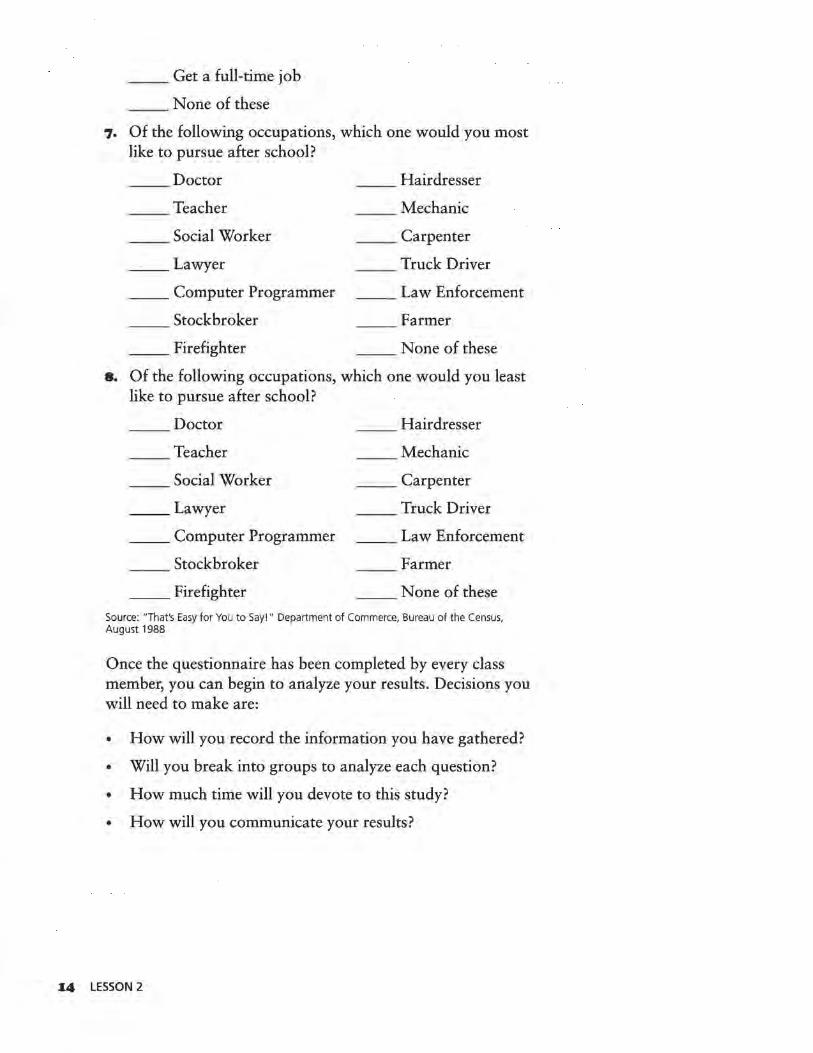
_ _ Get a full-time job
None of these
7. Of the following occupations, which one would you most like to pursue after school?
Doctor Hairdresser
Teacher Mechanic
Social Worker _ _ Carpenter
_. _ Lawyer Truck Driver
__ Computer Programmer Law Enforcement
Stockbroker Farmer
__ Firefighter None of these
8. Of the following occupations, which one would you least like to pursue after school?
Doctor Hairdresser
Teacher Mechanic
Social Worker _ _ Carpenter
__ Lawyer Truck Driver
__ Computer Programmer Law Enforcement
Stockbroker Farmer
__ Firefighter None of these
Source: "That's Easy for You to Say!" Department of Commerce, Bureau of the Census, August 1988
Once the questionnaire has been completed by every class member, you can begin to analyze your results. Decisions you will need to make are:
• How will you record the information you have gathered?
• Will you break into groups to analyze each question?
• How much time will you devote to this study?
• How will you communicate your results?
14 LESSON 2

Unit II
Surveys

LESSON 3
Conducting a Survey
In the last section, you learned about taking a census. Is it always possible to take a census?
If you have your blood tested, does the doctor use all of your blood for the test?
B ecause taking a census is a difficult and sometimes impossible task, it is often necessary to take a portion of the
population and to study that group. Collecting information from a portion of a group is referred to as a sample survey.
INVESTIGATE
Survey Methods
Frequently, people want to gather opinions or facts about an issue or an idea. One method of gathering this information is to stop people at grocery stores, malls, bus stations; and so on, and to ask them the desired question(s). Another method is to call people on the phone. You or someone in your family may have answered sample-survey questions before.
Discussion and Practice
I. The survey below deals with soda (or soft-drink) consumption. It is a first attempt at designing survey questions. Your goal is to find out how much soda is consumed by your class. Individually, write a response to each of the following survey questions.
a. What is your name?
b. Are you male or female?
c. How much soda do you drink?
d. Are you an athlete or a nonathlete?
OBJECTIVES
Recognize a sample survey.
Design a sample survey.
CONDUCTING A SURVEY I7
e. What is your favorite soda?
f. Do you prefer caffeinated or noncaffeinated soda?
2. In your group, work together to answer the following questions. Collect and organize the data from your group. Select one person to report your conclusions to the class.
a. Which questions were difficult to answer? Why?
b. A survey usually is taken to determine how many people hold a certain opinion or act in a certain way. Does that appear to be what this survey is about? Explain.
c. Were all of the questions necessary? Why or why not?
d. Which questions would you eliminate? Explain.
e. Which questions would you add? Explain.
f. Which questions would you reword? Write these questions more clearly.
You probably found that you didn't need all of the questions. Some information you gathered was not helpful in finding out how much soda your class consumes. Some questions were very vague and unclear, and students answered using different units. Collecting or organizing the data became difficult.
Being able to design good survey questions is an important skill to develop. In this lesson, you will experience firsthand the difficulties of designing survey questions. Then you will learn the techniques of writing good survey questions.
3. Here is another situation that calls for a survey. Your school principal needs to know how many students will attend the football game on the weekend so she can reserve enough student seats. You need to gather reliable information on this issue. One way is to ask each student if he or she will attend the game. Another is for the principal to assume that the amount of space needed would be the same as the number of seats needed last week.
a. Do you think either of these is a good strategy? Why or why not?
b. What factors might affect the attendance at the game?
4. Another technique is to conduct a sample survey of the students and ask the sample students if they will be requesting a seat for the game. Calculate the proportion of "yes" responses to the number of students in the sample. Then use
18 LESSON 3
that proportion to estimate the number of seats required for next week. Do you think this is a good strategy? Why or why not?
This scenario is typical of sample survey problems. A question related to "how many?" or "how much?" is asked about a specific group of objects. Remember, the group of objects is called the population. In the seating problem, the entire student body is the population. An approximate answer to the question is found by surveying a sample of the population.
The answer based on the sample will be a close (or good) approximation only if the sample actually represents the population. One method of making sure a sample does represent a population is called randomization. Randomization means the sample is selected at random from the population. This means that every member of the population has an equal chance of being included in the sample;
Here are the key steps in conducting a survey:
• State the objectives clearly.
• Define the target population carefully.
• Develop good survey questions.
• Use a field test to try out the questionnaire. (You fieldtested a questionnaire when you completed Problem 1.)
• Design the sample selection plan using randomization. (Remember, randomization means that every member of the population has an equal chance of being included in the sample.)
• Choose an appropriate sample size.
• Organize the data collection and data management.
• Plan for careful and thorough data analysis.
• Write conclusions based on the original objectives.
Practice and Applications
s. Why do you think each of the key steps outlined above is important?
6. Designing and conducting a good survey involves many steps. Use the questions and statements below as a guide to design your own sample survey for soda consumption.
CONDUCTING A SURVEY 19
a. What is it you want to find out? State your question clearly.
b. Whom do you want to survey? Define the target population carefully.
c. Develop a few good questions. Remember, a survey often is taken to determine how many or how much. (How many people prefer diet drinks?) It may be that each question may only ask for an opinion. (Do you prefer diet drinks?) The questions must be clearly stated so the answers are as accurate as possible, and so the answers are comparable across the respondents. (Does family mean the same to everyone?)
d. Field-test your survey with five to ten people. Write a paragraph that tells how your survey worked. Indicate whether your questions were clear and had acceptable answers. What difficulties did you have? Proofread and correct grammar and spelling.
e. Conduct your survey and report your results.
20 LESSON 3
LESSON 4
Asking Questions
How many people are in your family?
Would you prefer to have class in a large new building or in an old run-down school?
T here are many things to watch for when creating a survey questionnaire. Questions need to be well-stated to get
exactly the information you want. When the respondent does not understand the question, it may be that the question is ambiguous. In the question, "How many people are in your family?" the word family can be interpreted in many different ways. If the goal is to know how many family members are living in your home, you first have to agree on a definition of family. If the goal is to know how many brothers a person has, then the question might be, "How many living brothers and stepbrothers do you have?" You, as the survey designer, have to understand clearly what question you want to be answered.
INVESTIGATE
Bias in Surveys
Bias, too, is a very important issue that needs to be understood. Questions should not be asked in ways that influence their answers. If responses to a question tend to lean toward one side of the "truth," then the responses are said to be biased. For example, if the bathroom scale is set 5 pounds light, the measurements produced by the scale will be biased. Anyone who gets on the scale will see a reading that is on the light side of the truth.
Discussion and Practice
When analyzing statistics, bias can interfere with a true picture of what is happening in the population. You must minimize all types of bias. Here are some examples.
OBJECTIVE
Learn to minimize bias in constructing survey
questions.
ASKING QUESTIONS Z~
I. Biased question: The question, "You don't drink Coke®, do you?" is a leading question and is considered biased. Why do you think this is a biased question?
z. Biased response: Bias can also occur when the people surveyed do not tell the truth in their responses to a given question. There is more to this than lying. Some people cannot recall the truth, and others may intentionally try to mislead.
a. Why might someone lie when responding to a survey?
b. Would the following question lead to a biased response? The teacher asks a student, "How much time do you spend doing your math homework each week?" Explain your reasomng.
It is important to keep in mind that if a survey involves people, the questions become very important. Responses to questions are greatly influenced by the wording of the questions. This fact has been observed over and over in actual studies of survey questions.
3. Do you think the following questions are biased?
a. Do you favor the use of capital punishment? Why or why not?
b. Do you favor or oppose the use of capital punishment?
Responses to questions can be drastically altered by the choice of words. This can be seen in a study by Schuman and Presser (Questions and Answers in Attitude Surveys, Academic Press, 1981). Consider the following questions:
• Do you think the United States should forbid public speeches against democracy?
• Do you think the United States should allow public speeches against democracy?
In one study, those presented with the first question gave 21.4% yes responses, while those presented with the second question gave 47.8% no responses. People are somewhat reluctant to forbid public speeches against democracy, but they are much more willing to not allow such speeches. "Forbid" is a strong word that brings out a negative feeling that many people cannot favor. "Allow" is a much milder word that does not elicit such strong feelings. The important point to remember is
ZZ LESSON 4
that the tone of the question set by the words employed can have a significant impact on the responses.
Practice and Applications
4. Think of a survey topic.
a. Write an intentionally biased question about your topic. Ask 30 people to respond to your biased question and record the results.
b. Write the same question in what you consider a nonbiased way. Ask 30 different people to respond to your nonbiased question and record the results.
c. Compare the results of the two versions.
s. Indicate if there is bias in the sample survey questions below. Rewrite the question to eliminate the bias if it exists.
a. The Groton Police Department would like to know if the students respect methods the police use to enforce the laws of the community. Officers in full uniform survey a sample of students in person.
b. Annette Smith, a girl at Steffen Middle School, wants to find out if any of her classmates like Bob Bellrichard. In conversation with all the girls in her class, she says, "Isn't Bob Bellrichard a creep? What do you think about him?"
c. "How much money do you earn?"
d. Nancy French had each member of her English class fill out an unsigned sample survey that posed the following question, "Do you drink alcohol?" She had their responses put in a large collection box.
6. Sam Sinclair wants to find out how people feel about political demonstrations. Select the best question or write your own. Defend your choice.
a. Should political demonstqtions be allowed?
b. Should all political demonstrations be outlawed?
c. Should people who participate in political demonstrations be prosecuted?
d. Should all citizens have the freedom to express their political views through public demonstrations?
ASKING QUESTIONS Z3

7. Write two sample survey questions that contain bias. Share your questions with another group. Have the members of that group rewrite them to minimize bias.
•· Find an article in a magazine that contains the actual questions in a survey. Many teen magazines such as Seventeen include such articles. Other magazines, such as Time or Newsweek, often contain polls. Decide if the questions are biased.
S4 LESSON4
LESSON 5
Selecting a Sample
Can just anyone be asked to participate in a survey?
How should you choose people to participate?
C hoosing a sample that does not represent the target population is sampling bias. Randomization is a statistical
method that is used to minimize sampling bias.
INVESTIGATE
Sampling Bias
When a survey reflects sampling bias, its results cannot be considered valid. So it is very important to ensure against this type of bias when constructing and conducting a survey.
Discussion and Practice
Cheerleaders of one school wanted to recognize the most popular activity in the school. They decided to interview the first 25 students they met. Their survey results indicated that band was the most popular activity. The only problem was that band practice had just ended, and the 25 people they asked were all members of the band.
1. Were the methods used in this survey likely to produce a sample that was representative of all the students in the school? Why or why not?
z. Did the methods reflect sampling bias?
3. Describe the sampling bias in these examples:
a. Frankie Rivera wants to find out what type of fish are in Lake Michigan. His method of data collection is standing on the shoreline and scooping up the fish in a net.
OBJECTIVES
Apply randomization in sample selection.
Recognize and analyze sampling bias.
SELECTING A SAMPLE ZS
b. Alicia Ball wants to find out what percentage of people are baseball fans. Her method of data collection is to survey people in a shopping mall during a World Series game.
There are many ways to reduce sampling bias. If you want a sample from a particular grade level, you might go to the classroom of a specific grade and ask every third person who enters. If the classes are arranged randomly by a central computer, you might be able to use an entire class as a sample of the population.
Randomization allows all elements in the population to have an equal chance of being selected. In other words, with randomization you are able to obtain a sample that is representative of the target population and to reduce sampling bias.
One of the best ways to minimize sampling bias is to use a random-number table as part of the process of selecting a sample. The numbers in the random-number table below have been randomly generated by a computer. Random-number tables are easy to use. A much larger Table of Random Numbers is shown at the end of this lesson on page 29.
39634 62349 73088 65564 16379 19713 39153 69459 17986 24537
14595 15050 40469 27478 44526 67331 93365 54526 22356 93208
30734 71571 83722 79712 25775 65178 07763 82928 31131 30196
64628 89126 91254 24090 25752 03091 39411 73146 06089 15630
42831 95113 43511 42082 15140 34733 68076 18292 69486 80468
80583 70361 41047 26792 78466 03395 17635 09697 82447 31405
00209 90404 99457 72570 42194 49043 24330 14939 09865 45906
How to use random numbers:
T. Drop your pencil randomly on page 29 and begin reading at the number closest to the point of the pencil.
II. Choose a direction and read the numbers in that direction. The numbers can be read up or down, or to the right or left.
III. If you want one-digit numbers from 0 to 9, use each single digit in the order that you choose.
IV. If you want two-digit numbers, group the numbers in pairs and read in whatever order you choose.
Z6 LESSON 5
Suppose you want to give prizes to the 30 students in your class in random order. Assign each student a two-digit number. Then use the random-number table to select the number of the student who will receive a particular prize. Student number 1 will be 01, student number 2 will be 02, and so on, for each of the 30 students in your class.
You might have started with the numbers below for your class of 30 students.
73088 65564 16379
40469 27478 44526
You can read these data horizontally as 73, 08, 86, 55, 64, 16, 37, 94, 04, and so on. Since there is no student 73, disregard that number. Student number 8 is then selected. Disregard 86, 55, and 64. Student 16 is the next person to be selected. Continue selecting in this manner. You can also generate random numbers using a calculator.
Practice and Applications
4. You might have read the table by reading the numbers in the small sample above vertically: 74, 30, 04, 86, 89, 62, 57, and so on. Which student(s) would receive a prize from this set?
s. a. Besides reading left and right, or up and down, what other patterns can you use to generate numbers from the random-number table?
b. In what ways might a random-number table be useful?
c. What other methods could be used to choose a random sample?
6. In Ohio, there are 4 7 numbers in the weekly lottery. Six numbers are selected.
a. Use a random-number table to select six numbers. Explain how you did this.
b. How likely do you think it will be to have an overlap (the same number repeated within a set of six)? How large was the overlap? Compare your six numbers to numbers someone else generated.
Determine whether or not the samples in Problems 7-12 are randomly generated. If not randomly generated, explain why not.
SELECTING A SAMPLE Z7
7. Nick Lilja wants to sample a portion of the senior class to find out how many will attend college next year. He asks calculus students.
8. Lakisha wants to do a survey to find out how many students eat the food prepared by the cafeteria staff. She stands at the end of the serving line and conducts her survey.
9. Marie is collecting data to find out how many people in her community recycle. She stands outside the main entrance of a town mall and asks every fifth person three questions.
10. Ms. Madonio teaches fourth grade at Oriole Lane. She needs three volunteers to help the principal, Ms. Matuk, deliver mail. Almost all of the students eagerly want to help Ms. Matuk. To select her three volunteers, Ms. Madonio pulls out her class list and without looking points to three student names.
11. Chris is designing a project to estimate the percentage of American-made vehicles in her community. She decides to count the cars at the local shopping mall on Friday evening and observe how many of them are American-made.
1z. A city government needs to estimate the number of diseased trees in the city. A city crew drives down two city streets that intersect. They count diseased trees in each block. The average number of diseased trees per block can then be multiplied by the total number of blocks in the city to produce the final estimate.
13. Extend You wish to find out if permitting students to wear shorts should be part of your school's dress code. Have each group member explain how the collection of the data to answer this question could be randomized. Share your datacollection methods with another group.
28 LESSON 5

Table ol Random Numbers
59718 77768 50032 53440 41359 33021 01938 86092 87426 80010 91977 35682 34043 26290 40447 12411 32837 12151 21227 81491 88224 92826 92683 66928 95518 70106 92397 62132 97206 26324 01288 56565 78378 72344 12566 58325 40257 93212 49208 51320 19483 45024 12857 46267 94007 98674 54199 29738 24084 91964
33652 12588 55326 05702 43815 61284 13606 65461 70415 91440 32207 57357 18841 61415 57755 46846 41422 35285 37870 55929 99945 87321 41676 70537 39341 45154 93823 14053 81888 11464 29773 64388 95180 80750 12815 77661 89578 42194 99329 21247 92329 55414 05162 94197 19267 68846 27895 12005 80292 49745
75834 71767 45378 40316 61259 13140 66115 61564 76757 62599 22755 89933 41019 18996 13005 31853 72795 22193 59897 62049 09056 73260 95209 33157 15608 37565 93590 85486 80932 76059 66250 96883 74585 74550 89984 28356 77938 69704 19034 19744 37052 83115 38995 52825 93308 75276 21274 48777 75400 62004
81653 74197 85789 50614 52742 48213 94759 80701 08234 44686 41417 37426 42282 34323 83341 38345 83018 25015 68282 94820 27862 25188 15227 90981 06296 86815 04322 44750 01554 91302 85083 13673 29208 17587 12217 24032 52318 83860 81936 29114 05649 48381 63320 11822 11590 75112 54027 56579 81397 14691
91654 28637 01627 24482 33119 29924 69390 85040 66927 63521 43540 82299 18928 35588 55113 78385 61536 49596 05202 40993 33276 99974 62800 97999 56683 61505 85617 32656 16834 88980 18139 96384 07488 32049 53532 12159 75508 10924 25298 96474 07403 42795 55422 49346 44612 61632 81241 04660 95163 16285
05374 34289 66087 74636 64247 73598 42730 79472 79834 72702 63121 17926 84377 16927 91950 26475 10086 61879 03475 64750 66148 59081 34743 69023 50306 63739 14717 32374 19119 96284 92153 23320 34180 78025 42391 35908 73996 49173 47360 92856 06629 93991 80847 49133 45105 34818 10122 31369 33312 94856
74784 07080 13104 64110 98440 56468 88959 67988 58764 70414 59043 74797 24791 65130 97918 99820 32673 44512 36847 14028 58572 79127 74870 47218 03752 92434 71791 28040 60536 37429 75069 76687 43795 50161 20794 95015 42376 33178 10265 03394 72258 09820 54814 84454 32761 59316 14974 80017 37524 25760
16186 64983 27652 53966 75826 16790 13767 52267 65505 56954 54047 17961 92967 27968 12463 85270 13763 96297 43279 93087 42301 36874 19357 14982 22806 69213 79929 48973 21969 28172 87940 43389 26009 52702 03148 70789 88539 19084 59200 88168 91551 24267 81423 17461 09300 11928 98793 97748 95430 11644
03166 69589 65596 56997 70092 63418 92825 91586 76847 51167 64280 45356 96248 79274 15733 72317 44107 80124 99627 44523 28464 37825 88800 20180 28989 75914 46882 28736 60408 63180 36861 76806 80789 30886 71013 56044 52405 81063 04283 41256 43125 34876 18177 22382 37920 77067 93319 29881 37050 32533
SELECTING A SAMPLE Z9
LESSON 6
Studying Randomization
Why do newspapers and magazines often emphasize that samples used in polls (sample surveys) have been randomly selected?
Could an intelligent person do better than a random sample by carefully choosing respondents to represent various groups?
OBJECTIVE
Recognize that randomization reduces
sampling bias.
30 LESSON 6
INVESTIGATE
The Importance of Randomization
The following activity deals with the average area of 100 rectangles. This lesson will emphasize why randomization is important in a sample selection.
Discussion and Practice
Suppose you want to estimate the average area of 100 rectangles. How can you do this without calculating the area of each rectangle?
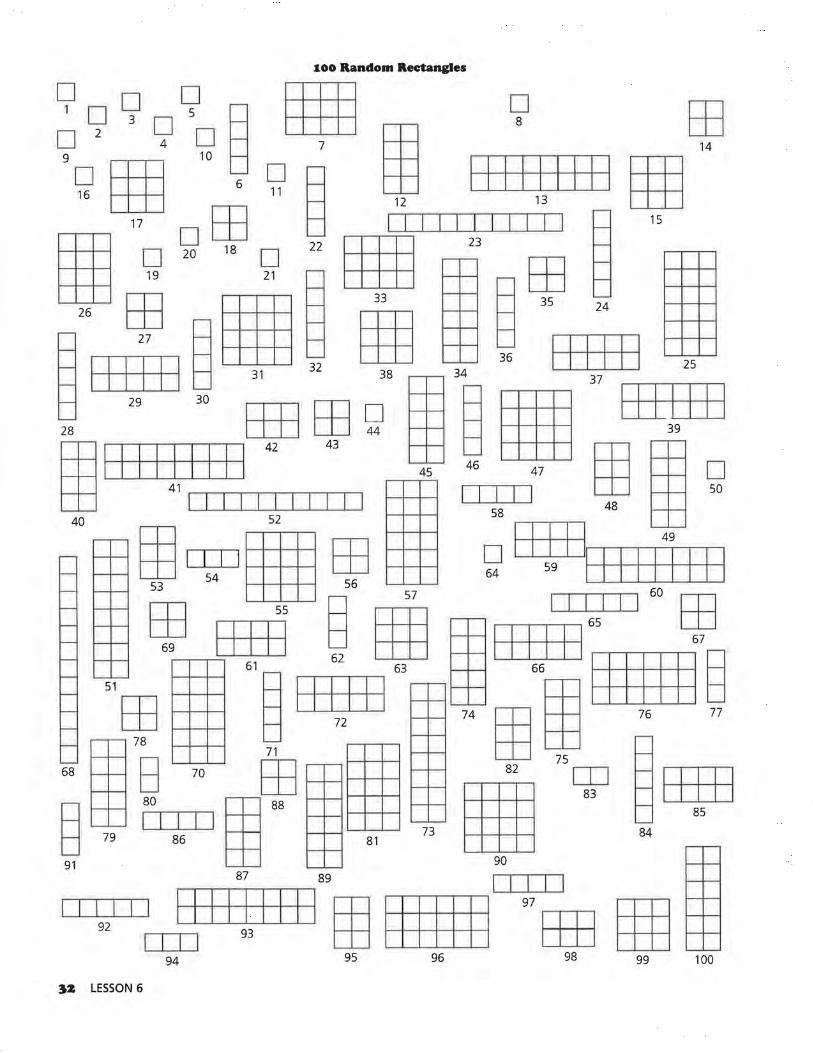
1. Estimate the average area for all the rectangles pictured on page 32. Use each of the methods listed below. Note that rectangle 45 has area of 2 x 5 = 10 square units.
a. Guess Write your guess for the average area of the rectangles on the sheet.
b. Judgmental Sample Select five rectangles you think are representative of the rectangles on the page. Write the rectangle numbers and their areas. Compute the average of the five areas and compare it to the average you guessed.
c. Random Sample Use the random-number table (reproduced on Activity Sheet 2) to select five different twodigit numbers. These random numbers will represent 5 of the 100 rectangles. Use 00 to represent rectangle 100. Write the rectangle numbers and their areas. Compute the average of the five areas and compare it to your guess and judgmental-sample average.
Practice and Applications
z. Collect the data from all students for each of the three methods so you will have one set of data that includes the guesses, one set that includes the averages from the judgmental samples, and one set that includes the averages from the random samples. Then construct line plots of the data from each method using the answers from everyone in class.
3. Compare the three line plots. Describe any similarities and differences in the patterns.
4. Get the actual mean value for the areas of rectangles from your teacher.
a. Describe any sampling bias in the three methods.
b. Explain why visual selection is not random.
c. Suppose someone tells you that it is not necessary to select the respondents to a survey randomly because personal judgment is just as good. What would you tell this person?
s. How would the pattern of the line plots change if you selected random samples of n = 10 and n = 15 rectangles instead of n = 5?
6. Describe another method you could use to produce a random sample for the average area of the rectangles.
STUDYING RANDOMIZATION 31
100 Random Rectangles
99 909 §±E 9 EB D 4 D 7 14
17 D EB § 111 I I I I I I 1
1! 1 15 ; ~20 18 g 22 §±E 23
EB ~
26 tp m 33 § 35 24
I I I I I I § 31 32 ~ 34 36 I I u I I 25 .
29 30
ITIJ EB D El EEEE I I I I I I I 28 ITIJ 44 t=l EEEE 39
EB I ! I I I I I I I 42 43
45 46
47 ~ D EB
41 I I I I I I I I I I I I I I I I ~ 50
40 w I 1541 I RfEl tp ~ EqEI I I I 14
1 I I I EqEH 57 i 11111 60 EB
~ rrEE ~ ~ 111 1 1 165
67
51 EB 61 Fl I I I I 1163 66; §±±ffi § a 72 74 rn 76 77
78 ,__,____,__. 71
68 El 70 EB 82 75 rn rrEE H i"ol I I I EB 88 FEEE 83 85 ~ 79 86 ta 81 73 EqE 84
87 89 I I I I I I I 1921 I I I I I I I I I I I ~ P++H=1 97
ITIJ H=H I I I I 93 tij l±tt±jj ITIJ [jjj
94 95 96 98 99 100
:JZ LESSON 6
LESSON 7
Sampling in the Real World
What should you look for when reading about a survey?
Do all surveys really have the results they claim?
Read the following article about what Americans believe.
Faith in God at Heavenly Heights
By Leslie Miller, USA Today
When it comes to religion, the USA is a land of believers. Not only do 96%
believe in God, but a new USA Today/CNN/Gallup Poll shows most Americans
also believe in:
Heaven, 90%.
Miracles, 79%.
Angels, 72%.
Belief in heaven is up 6% from 1981; angels and miracles were asked about just
this year. Do findings reflect wishful thinking? Not necessarily. Belief in hell and
the devil also were up from past years. Results don't surprise religion researchers.
"Americans have a tendency to take their religion straight, like their whiskey.
That means don't water it down with an awful lot of intellectualism," says
Conrad Cherry, Center for the Study of Religion and American Culture at Indiana
University and Purdue University, Indianapolis. The poll of 1,016 adults also
shows more believe in:
Reincarnation, 27% (up from 21 % in 1990)
Contact with the dead, 28% (18% in 1990)
This seems consistent with other surveys, says Jeffrey S. Levin, Eastern Virginia
Medical School, Norfolk. He's found "mystical" beliefs appear "more common
with each successive generation." But increases don't necessarily mean people
didn't believe before, Levin says. "Over the last decade or two, there's
OBJECTIVES
Understand how surveys are conducted in the
real world.
Find similarities and differences among real-world surveys.
Use proportions and percents to make
comparisons.
SAMPLING IN THE REAL WORLD 33
less of a social stigma to talking about one's faith," he says, including religious experiences. "Mystical things are more openly acknowledged."
Source: USA Today, December 21, 1994
INVESTIGATE
Analyzing Results
When reading an article like the one above, you need to consider a number of things in order to evaluate the validity of the results.
Discussion and Practice
1. How did the authors get their information?
z. What questions did they ask?
3. Who cares about the results?
4. Polling organizations conduct most national surveys either by telephone interviews or by personal interviews.
a. Brainstorm ideas concerning the advantages and disadvantages of each method.
b. Can you think of another method they might use?
Large survey organizations print explanations of their polling methods. The task of polling is not an easy one. A great deal of planning, organizing, and time is spent on conducting a survey. One good example is the compilation of information for the Nielsen ratings of television programs.
Almost everyone watches television and, as a result, has some awareness of the fact that the Nielsen ratings help determine what is broadcast. A show that does poorly in the Nielsens is not going to be on a major network very long. The article "NBC sitcoms still dominate Thursday night" reprinted in part below shows the Nielsen ratings for a week in March 1995. Read the explanation in this article before reading the discussion that follows.
NBC Sitcoms Still Dominate Thursday Night
The Peacock can strut again. For the fifth consecutive week, NBC won the prime
time ratings crown behind top-rated Seinfeld and Top 10 performances from
four other shows in its Thursday lineup.
For the week, NBC averaged an 11.5 rating and a 19 percent audience share.
ABC, the season-to-date frontrunner, finished second with an 11.1 rating, 19
share. CBS was third, with a 9.2 rating, 16 share.
34 LESSON 7
Top 20 listings include the week's ranking, with rating for the week, season-to
date rankings in parentheses, and total homes. An "x" in parentheses denotes
one-time-only presentation. A rating measures the percentage of the nation's
95.4 million 1V homes. Each rating point represents 954,000 households, as esti
mated by Nielsen Media Research.
I. (1) Seinfeld NBC, 21.4, 20.4 million homes
z. (2) Home Improvement ABC, 20.5, 19.6 million homes
3. (3) E.R. NBC, 19.8, 18.9 million homes
4. (11) Friends NBC, 19.8, 18.9 million homes
s. (4) Grace Under Fire ABC, 19.6, 18. 7 million homes
Source: Gainesville Sun, March 26, 1995
Of the 95.4 million households in the United States, Nielsen Media Research randomly samples approximately 4,000 households on which to base ratings. This is accomplished by randomly selecting city blocks (or equivalent units in rural areas), having an enumerator (person who counts) visit the sampled blocks to list the housing units, and then randomly selecting one housing unit per block. These sampled housing units are the basic unit for all of the ratings data.
After a housing unit is selected, an electronic device is attached to each television set in the house. This device records when the set is turned on and the network it is tuned to. Information from the network determines which show is actually playing at any time.
This device gives information on what is happening on the television set, but it doesn't tell which or how many people are viewing_ the programs. For viewer information, Nielsen must rely on individuals in the household to keep a record of these details.
The rating for a program is the percentage of the sampled households that have television sets on and tuned to that program. In the estimated ratings, the denominator of the sample proportion is always 4,000. So a rating is an estimate of the percentage of households tuned to a particular program.
But not all households have a television turned on at a particular time. Those that do are called viewing households. A share for a program is an estimate of the percentage of viewing households that have a television tuned to that particular program. When shares are calculated, the denominator varies from show to show and is less than 4,000.
SAMPLING IN THE REAL WORLD 35
In reality, the ratings and shares are slightly more complicated. A rating for any program is taken minute by minute and then averaged over the length of the program. This average attempts to adjust for the fact that not all viewers watch all of a program. Thus, the final rating for 60 Minutes would be the average of all ratings taken over the hour duration of the show. The final rating for a basketball game would be the average ratings taken over the entire time-perhaps several hours-the game was on the air.
Review the Nielsen article once again. Discuss any points that are misleading or unclear, specifically the following:
s. Why are the shares always greater than the ratings?
6. Are there sources of potential bias in the data collection plan?
Practice and Applications
Two articles that tell about the processes used by local and national surveys are on pages 37-39.
7. To understand and appreciate the survey process better, your group will be responsible for reading one of the following articles, answering the questions, and reporting to the class. The report should include answers to the following:
a. Which poll did your group investigate?
b. How was the poll or survey conducted?
c. What sample size did the poll use?
d. What sampling error did your poll report? Sampling error means the amount by which the survey may differ from the actual population.
e. When a person being surveyed did not respond, what happened?
f. Assuming that 250 million adults live in the United States, what is the probability that a person would have been interviewed in the poll?
g. Select someone from your group to report your findings.
8. After listening to the reports, answer each question.
a. How are the surveys alike?
b. How are the surveys different?
~6 LESSON 7
Articles About Gallup Poll Surveys
The Sample
Although most Gallup Poll findings are based on telephone interviews, a signifi
cant proportion is based on interviews conducted in person in the home. The
majority of the findings reported in Gallup Poll surveys is based on samples con
sisting of a minimum of 1,000 interviews. The total number, however, may
exceed 1,000, or even 1,500 interviews, where the survey specifications call for
reporting the responses of low-incidence population groups such as young pub
lic-school parents or Hispanics.
Design of the Sample for Telephone Surveys
The findings from the telephone surveys are based on Gallup's standard national
telephone samples, consisting of unclustered directory-assisted, random-digit
telephone samples. The random-digit aspect of the sample is used to avoid "list
ing" bias. Numerous studies have shown that households with unlisted tele
phone numbers are different from listed households. "Unlistedness" is due to
household mobility or to customer requests to prevent publication of the tele
phone number. To avoid this source of bias, a random-digit procedure designed
to provide representation of both listed and unlisted (including not-yet-listed)
numbers is used.
Telephone numbers for continental United States are organized into four regions
of the country, and, within each region, further arranged into three strata based
on the size of the community. The sample of telephone numbers produced by
the described method is representative of all telephone households within the
continental United States.
Within each contacted household, an interview is sought with the youngest man
18 years of age or older who is at home. If no man is home, an interview is
sought with the oldest woman at home. This method of respondent selection
within households produces an age distribution by sex that closely approximates
the age distribution by sex of the total population.
Up to three calls are made to each selected telephone number to complete an
interview. The time of day and the day of the week for callbacks are varied to
maximize the chances of finding a respondent at home. All interviews are con
ducted on weekends or weekday evenings in order to contact potential respon
dents among the working population.
Design of the Sample for Personal Surveys
The design of a sample for personal (face-to-face) surveys is that of a probability
sample down to the block level in the case of urban areas and to segments of
townships in the case of rural areas.
After stratifying the nation geographically and by size of community according to
information derived from the most recent census, over 350 different sampling
locations are selected on a mathematically random basis from within cities,
towns, and counties that, in turn, have been selected on a mathematically ran
dom basis.
SAMPLING IN THE REAL WORLD 37
The interviewers are given no leeway in selecting the areas in which they are to
conduct their interviews. Each interviewer is given a map on which a specific
starting point is marked and is instructed to contact households according to a
predetermined travel pattern. At each occupied dwelling unit, the interviewer
selects respondents by following a systematic procedure that is repeated until the
assigned number of interviews has been completed.
Sampling Tolerances
Readers are cautioned that all sample surveys are subject to the potential effects
of sampling error, a divergence between the survey results based on a selected
sample and the results that would be obtained by interviewing the entire popula
tion in the same way. The risk of this kind of divergence is necessary if probability
sampling is used, and probability sampling is the basis for confidence in the rep
resentativeness of sample survey results.
The chance that sampling error will affect a percentage based on survey results is
mainly dependent upon the number of interviews on which the percentage is
based. In 95 out of 100 cases, results based on national samples of 1,000 inter
views can be expected to vary by no more than 4 percentage points (plus or
minus the figure obtained) from the results that would be obtained if all qualified
adults were interviewed in the same way. For results based on smaller national
samples or on sub-samples (such as men or persons over the age of fifty), the
chance of sampling error is greater and therefore larger margins of sampling
error are necessary in order to be equally confident of our survey conclusions.
In addition to sampling error, readers should bear in mind that question wording,
and practical difficulties encountered in conducting surveys, can introduce addi
tional systematic error or "bias" into the results of opinion polls. Unlike sampling
error, it is not possible to estimate the risk of this kind of error in a direct way,
but survey organizations can protect against the effects of bias on survey conclu
sions by focusing careful attention on sampling, questionnaire construction, and
data collection procedures and by allowing adequate time for the completion of
data collection.
Source: The Gallup Poll Monthly, October 1993
The Teenage Attitudes and Practices Survey (TAPS)
The TAPS was a targeted population study of U.S. teenagers 12-18 years of age.
The study was conducted by the National Center for Health Statistics' National
Health Interview Survey (NHIS) and cosponsored by the Centers for Disease
Control Office on Smoking and Health (OSH) and the National Cancer Institute
(NCI).
The TAPS was designed to obtain national household data about current ciga
rette-smoking behavior and lifetime smoking practices of adolescents and their
beliefs about smoking. Selected correlates of smoking uptake were also
addressed in the study.
The TAPS sample was derived from NHIS's household interviews conducted dur
ing the final two quarters of 1988 and the first two quarters of 1989. All
38 LESSON 7
teenagers living in households contacted and interviewed during this period who
were 12-18 years of age as of November 1, 1989, were included in the sample.
The eligible sample for the TAPS was 12,097 persons.
The TAPS utilized two modes of data collection. The primary method consisted of
computer-assisted telephone interviewing (CATI) in households where a tele
phone number was provided during the original NHIS interview. In addition, self
administered questionnaires were mailed to sample teenagers living in house
holds without telephones or an available telephone number. Mail questionnaires
were also sent to those teenagers living in households with an original telephone
number but who were never reached using the CATI method. Telephone inter
views and all other data collection activities were performed by U.S. Bureau of
the Census personnel. Data collection began in August 1989 and, except for late
receipt of some mail questionnaires, concluded in December 1989 . .
Unlike the original NHIS interview, all teenagers responded for themselves.
However, prior to the initial telephone contact, advance letters were mailed
to a responsible related adult and to each eligible teenager in the household
explaining the sponsorship and objectives of the upcoming survey and assuring
confidentiality.
The total interviewed TAPS sample included 9,965 adolescents, 9, 135 from CATI
interviews and the remaining 830 cases from completed mail questionnaires. The
total combined response rate for the TAPS from these 2 data-collection proce
dures was 82 percent. Most of the nonresponse resulted from teenagers' failure
to return the mail questionnaire. Only 3.7 percent of interviews of adolescents
reached by telephone ended in a refusal either because of the parent's or
teenager's initial refusal and subsequent termination of the interview. Item non
response was less than 1 percent for the questions discussed in this report.
Because estimates shown in this report are based on a sample of the population
rather than on the entire population, they are subject to sampling error. When an
estimate of the numerator or denominator of a percent is small, the sampling
error may be relatively high. In addition, the complex sample design of the NHIS
has the effect of making the sampling errors larger than they would be had a
simple random sample of equal size been used.
Source: u.s_ Department of Health and Human Services Center for Disease Control
and Prevention, 1993
SAMPLING IN THE REAL WORLD 39
LESSON 8
Critiquing a Printed Article
What should you think about as you read the results of surveys described in a newspaper or magazine?
Is there any specific information you should look for?
OBJECTIVES
Critically analyze surveys reported in the real
world.
Use proportions and percents to make
comparisons.
Read a graph.
40 LESSON 8
I n previous lessons, your group compared two surveys that were done at the national level. You looked at how the sur
vey was designed and conducted, who was polled, and the sample size. Now you will have the opportunity to critique, or analyze, an article reprinted from a newspaper.
INVESTIGATE
The Printed Word
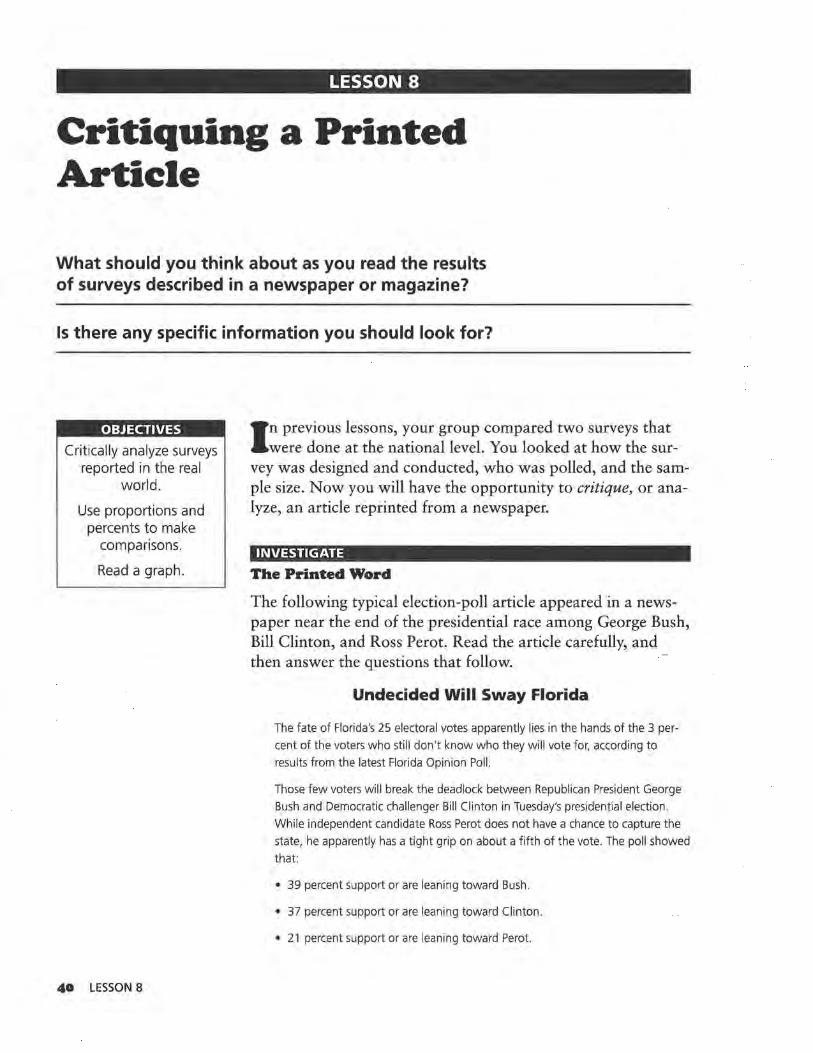
The following typical election-poll article appeared in a newspaper near the end of the presidential race among George Bush, Bill Clinton, and Ross Perot. Read the article carefully, and then answer the questions that follow.
Undecided Will Sway Florida
The fate of Florida's 25 electoral votes apparently lies in the hands of the 3 per
cent of the voters who still don't know who they will vote for, according to
results from the latest Florida Opinion Poll.
Those few voters will break the deadlock between Republican President George
Bush and Democratic challenger Bill Clinton in Tuesday's presidential election.
While independent candidate Ross Perot does not have a chance to capture the
state, he apparently has a tight grip on about a fifth of the vote. The poll showed
that:
• 39 percent support or are leaning toward Bush.
• 37 percent support or are leaning toward Clinton .
• 21 percent support or are leaning toward Perot.
• 3 percent are undecided.
The Florida Opinion Poll, which is sponsored by the New York Times newspapers
in Florida, contacted state residents in a random telephone sample. Along the
political spectrum, Bush is heavily dependent on conservatives in Florida, while
Clinton captures nearly half the moderate voters and nearly three quarters of the
liberals. Perot pulls almost identical support from liberals and conservatives, while
drawing a quarter of moderates.
The poll found that among conservative voters:
• 63 percent back Bush.
• 18 percent back Clinton.
• 19 percent back Perot.
Among moderate voters:
• 28 percent back Bush.
• 46 percent back Clinton.
• 26 percent back Perot.
Among liberal voters:
• 11 percent back Bush.
• 71 percent back Clinton.
• 18 percent back Perot.
While Perot pulls support from across the political spectrum, he is taking away
more of Bush's Republicans than Clinton's Democrats.
Among Republicans:
• 64 percent back Bush.
• 12 percent back Clinton.
• 22 percent back Perot.
• 2 percent were undecided.
But Perot takes Democratic votes from Clinton, but not as many, and there are
more registered Democrats in Florida than Republicans.
Among Democrats:
• 20 percent back Bush.
• 61 Percent back Clinton.
• 17 percent back Perot.
• 2 percent were undecided.
Of the 6.5 million registered voters in Florida, 3.3 million, or 51 percent,
are registered as Democrats, while 2.7 million voters, or 41 percent, are regis
tered as Republicans and 550,292 or 8 percent are registered as independents or
members of third parties.
CRITIQUING A PRINTED ARTICLE 4I
By age, candidates seem to appeal equally across all age groups, with each drawing in the 30 percent range, except for the 45-64 year-olds.
By gender, there appears to be no major difference in the number of women or men going for one candidate more than the others.
Source: The Gainsville Sun, October 30, 1992
How the Polls Were Conducted
The latest Florida Opinion Poll was conducted by telephone from Oct. 24 to 27 with 773 voters considered most likely to go to the polls on Election Day. The telephone numbers used in the survey were formed at random by a computer programmed to ensure that each area of the state was represented in proportion to its population. The results based on responses from all 773 most likely voters have a margin of sampling error of 3.5 percentage points. That means if the New York Times newspapers in Florida asked every voter in the state the same questions, in most cases, the results would be within 3.5 percentage points of the results obtained by the survey. Interviewers used a series of three questions to determine voters who were most likely to go to cast their ballots Tuesday. In questions where only the answers of smaller groups are used, the margin of sampling error is larger. For example, the margin of sampling error for just registered Democrats or only registered Republicans will be higher.
In addition to sampling error, the practical difficulties of conducting any poll can induce other forms of error.
Source: The Gainsville Sun, October 30, 1992
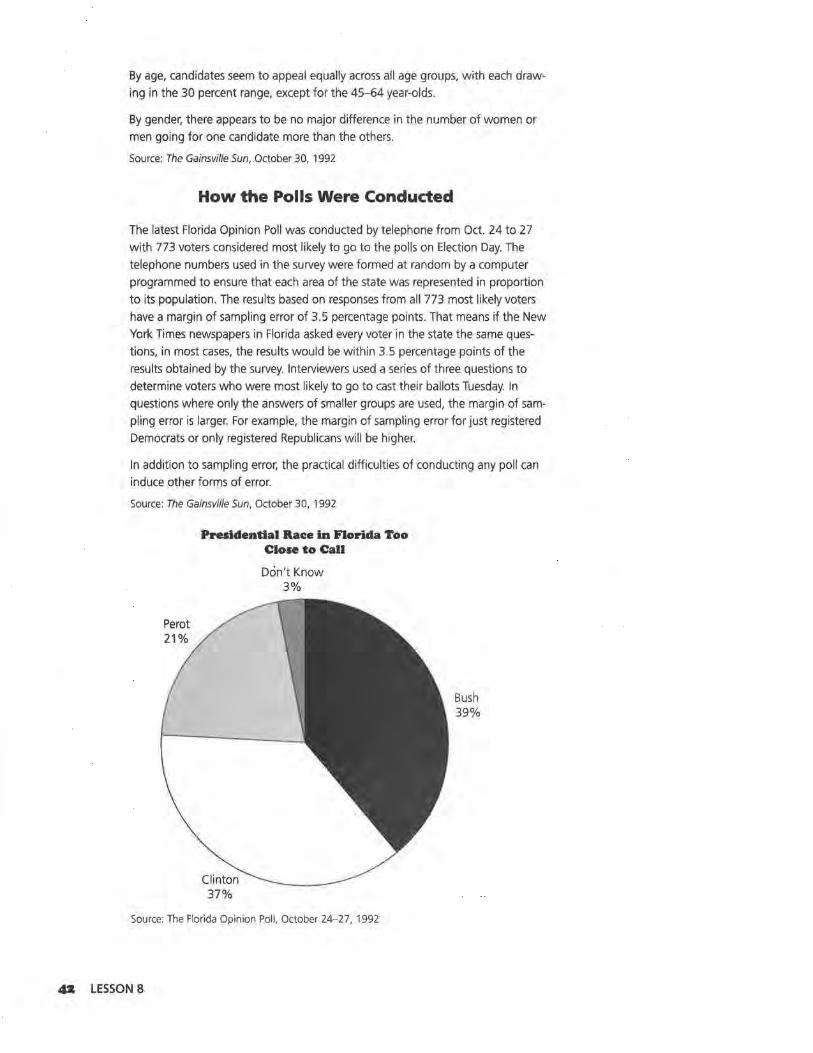
Presidential Race in norida Too Close to Call
Clinton 37%
Don't Know 3%
Source: The Florida Opinion Poll, October 24-27, 1992
4Z LESSON 8
Bush 39%
Discussion and Practice
I. Who conducted the poll? Do you think they had a special interest in the outcome?
z. What main questions did the survey address?
3. What was the population?
4. Did the article describe a census or a sample survey?
s. How was the sample selected?
6. How large was the sample?
7. How were the data presented?
8. How were the data analyzed?
9. Were the conclusions stated fairly in light of the original question?
IO. What would you like to know that was not reported?
II. a. What questions might have been asked to determine if a person were a "likely" voter?
b. How do you think randomization might have been accomplished?
c. Why was the state divided into areas, with randomization done within the areas?
d. How do you think 773 was chosen as the number of people to be surveyed?
Information was collected by telephone conversations. The question was straightforward, so bias does not appear to be a problem. The data are nicely summarized using percents and presented on a pie chart. Little analysis is presented beyond this summary. The principle conclusion is that the race between Bush and Clinton was too close to call.
Practice and Applications
IZ. Why would the pollsters make the conclusion that the race was too close to call when it is clear that Bush had the highest percentage of votes in the sample?
I3. What would you change if you were doing the survey?
I4. Problems 1-10 in this lesson cover all the important points of a critique. Use them to help you write a critique of the poll.
IS. Use a printed article that contains the results of a survey. Write a critique of the article.
CRITIQUING A PRINTED ARTICLE 43
LESSON 9
Understanding Sampling Error
How do you know how well a sample reflects the population?
Is there any way to tell?
OBJECTIVES
Identify characteristics of sampling error.
Compute sampling error.
44 LESSON 9
R andomization is used in selecting samples to ensure that the samples have a good chance of accurately representing
the population from which they were selected. The sample data will not, however, look exactly like the population data.
INVESTIGATE
Sampling Error
How can you tell, then, how close sample quantities will be to their corresponding population quantities? In general, this is a difficult question, but there is a reasonably simple answer if proportions are used. The answer will be given after you've had a little practice thinking about sampling error.
Discussion and Practice
I. Suppose you randomly sample 50 students from your school and find that 20 of the 50, or 40%, like the cafeteria hours. The sampling error is the difference between this sample proportion of 40% and the true proportion of students in your school who like the cafeteria hours.
a. What is the maximum value the sampling error could be?
b. What is the minimum value the sampling error could be?
2. What if you did many school surveys? Each time, you ask only a sample of students out of the entire student body. You will have different sampling errors. For these sampling errors, will most of them be
a. close to the minimum you selected?
b. close to the maximum you selected?
c. evenly distributed between the minimum and the maximum?
d. Explain your reasoning.
Read the following article from the June 5, 1985, New York Times. A New York Times/CBS News poll was based on interviews conducted May 29, 1985, through June 2, 1985, with 1,500 adults around the United States, excluding Alaska and Hawaii.
The sample of telephone exchanges called was selected by a computer from a
complete list of exchanges in the country. The exchanges were chosen to insure
that each region of the country was represented in proportion to its population.
For each exchange, the telephone numbers were formed by random digits, so
both listed and unlisted residential numbers could be called .
In theory, in 19 cases out of 20, the results based on such samples will differ by
no more than 3 percentage points in either direction from what would have
been obtained by interviewing all adult Americans. In other words, the difference
between the sample percentage and the population percentage is less than 3%
with probability;~ or 0.95 .
The article from the New York Times states that, in addition to sampling error, the practical difficulties of conducting any survey of public opinion may introduce other sources of error into the poll.
3. a. For random samples of size 1,500, will the sampling error always be less than 0.03? Explain.
b. Suppose a New York Times poll says that 40% of the 1,500 people interviewed think the school year should be lengthened. What can you say about the true percentage of Americans who think the school year should be lengthened?
4. Read the part of the Gallup Poll article from Lesson 7 dealing with sampling error, called sampling tolerances.
a. For random samples of size 1,000, will the sampling error always be less than 4 % ? Explain.
UNDERSTANDING SAMPLING ERROR 45
b. Suppose a Gallup poll says 40% of the 1,000 people interviewed think the school year should be lengthened. What can you say about the true percentage of Americans who think the school year should be lengthened?
s. Refer to both the New York Times and Gallup statements on sampling error and explain how sampling error is affected by the sample size.
6. A handy rule of thumb for sampling error when estimating proportions through random samples is that sampling error will be less than fn about 95% of the time. .
a. Is this rule of thumb consistent with the New York Times and Gallup Poll statements on sampling error?
b. In Question 1, your poll involved only 50 students. What would you estimate the sampling error to be in a poll of this size?
You are now going to investigate the formula for sampling error. Refer to the article in Lesson 8 on a typical election poll. To understand that Bush has the highest percentage of votes in the sample but that the conclusion is too close to call requires study of the "margin of sampling error." From earlier studies of statistics and probability, you may recall that sample proportions will vary from sample to sample according to a definite and predictable pattern (in the long run). In fact, 95% of all sample proportions will fall within two standard deviations of the true population proportion. If a sample proportion is denoted by p, then the standard deviation of the sample proportions is given by
"1P (ln-p)
and 95% of the potential sample proportions will fall within
... IP (1 - P) 2 \.J 11
of the true population proportion. This two-standard-deviation interval is the margin of sampling error. Substituting 0.39, the percent support that Bush received, for p and 773 for n results in a calculated margin of error equal to 0.035. Thus, the true proportion of voters favoring Bush may well be anywhere in the interval 0.39 - 0.035 to 0.39 + 0.035, or (0.355, 0.425).
46 LESSON 9
7. a. Find the corresponding two-standard-deviation interval for Clinton.
b. Explain why the pollsters do not want to call this race.
c. Find the corresponding interval for Perot.
d. Why did the writers of the article report only one value for the margin of error?
8. Notice that the sample size is the denominator of the margin of sampling error formula.
a. Would increasing the number in the sample size reduce the margin of error? Explain why or why not.
b. Look back at one of the surveys you conducted earlier in this unit. Find the margin of error for a proportion in that survey and then find the sample size that would be required to cut this margin of error in half.
9. Study the article in Lesson 8 carefully to determine the breakdowns of the percentages among conservative, moderate, and liberal voters.
a. Is there any way to attach a margin of sampling error to these percentages?
b. If you could find these margins of error, would they be greater or less than 0.035?
c. Can you attach a meaningful margin of error to the percentage of Democrats and Republicans who backed Clinton?
10. It would be nice to know more about the sampling scheme used in that political poll.
a. How do you think randomization might have been achieved?
b. Do you think the questions that were used or the phone calls that were rejected might have caused a bias in the results?
UNDERSTANDING SAMPLING ERROR 47
SUMMARY
• To have a representative sample, you must design a fair and random method of choosing the sample, using randomization techniques.
• You need to minimize bias in the questions you ask.
• Many large professional organizations select samples and conduct surveys.
• There are ways to critique reports of sample surveys given in newspapers, magazines, and other media.
A sample survey measures only a portion of the population in order to make generalizations about the entire population. For a good survey, you must be careful to do the following:
• Be clear about your objective. Know precisely what you want to find out.
• Define your target population carefully.
• Develop good survey questions that minimize bias.
• Design the sample-selection plan using randomization to minimize bias.
• Choose an appropriate sample size.
It is important be critical when you read a printed survey. Always ask yourself if the survey is accurate and unbiased.
48 LESSON 9
UNIT II ACTIVITY
Conducting Your Own Survey
OBJECTIVE
Practice designing and conducting surveys.
Y ou have read about surveys. Now try your hand at one. The Statistical Sample Survey Plan on Activity Sheet 4
will help you get started. Further help in working through your survey is offered in Unit 4 of this module.
Survey Ideas
I. Favorite NFL, NBA, NHL, or NCAA team at your school
z. Trends in clothing, including styles, shoe types, and brand names
3. Students' food preferences
4. Family issues, such as required chores, dating rules, and allowances (You can compare what goes on in your family to families of other students at your school.)
s. Political preferences, particularly at election time
6. Religious and moral issues, such as feelings about abortion, birth control, cheating, or prejudice
7. School issues, such as dress codes, school rules, and cafeteria menus
Remember the concepts you learned in this unit as you plan your survey. Keep the concept of bias in mind when you decide on your survey questions, and remember that randomness is very important when selecting your sample.
CONDUCTING YOUR OWN SURVEY 49


Unit Ill
Experiments

LESSON 10
Conducting an Experiment
What is an experiment?
Do surveys and experiments have anything in common?
A n experiment is different from a survey. In an experiment, the objective is to see if a set of experimental units treated
one way behave differently from a set of similar experimental units treated another way. For example, does a heated tennis ball bounce higher than a cold one? The objective of a survey is to estimate certain characteristics of a population, such as how many people hold a certain opinion.
Just as in a survey, an experiment must involve a good datacollection plan. If you want to find out how many times a ball bounces before it comes to rest, you bounce a ball and count the bounces. If you want a measure of how fast an ice cube freezes, you put water into the freezer and determine the length of time it takes to freeze. Both of these are experiments you might repeat several times to be sure you have consistent results.
INVESTIGATE
Cheeking Pulses
Everyone should find his or her own pulse rate and record the number of heartbeats per minute.
You will then use the collected data for your class to make two visible displays of the data. One will be a human line plot, and the other will be a sticky note (such as Post-it™) line plot on a wall.
OBJECTIVES
Conduct an experiment, and reflect on the results.
Analyze data for clusters, gaps, and
outliers.
Make graphs from collected data.
CONDUCTING AN EXPERIMENT S3
Discussion and Practice
Your teacher will make a number line along one side of the room. When instructed to do so, bring your pencil and the sticky note you have been given to the number line. Place the note on the wall over the number that corresponds to your pulse rate. Then, stand in front of the line at the number that corresponds to your pulse rate. When the class has completed this task, you will answer several questions.
I. Use the class data to answer each question.
a. What was the highest pulse rate? What might account for that?
b. What was the lowest pulse rate? What might account for that?
c. Where are the clusters and gaps in the line plot?
d. Do there appear to be any outliers in the line plot?
e. Where does the line plot appear to center?
f. What other observations can you make about the shape of the line plot?
2. Consider the process used in making the measurements.
a. How did you count? Did everyone count for a full minute?
b. Is it better to count for a full minute or to count for 15 seconds and multiply by 4?
c. Discuss other possibilities for measuring pulse rate.
d. Come to a consensus on how to measure pulse rate.
Practice and Applications
3. Take your pulse rate again, using the measurement method decided upon by the class.
a. Are your results the same as the first time? Why might the two measurements for the same person differ?
b. Suppose a student just came from gym class. Where might that student's pulse rate fit on the line plot and why?
c. Suppose a student is late for class. Where might that student's pulse rate fit on the line plot? Explain.
S4 LESSON 10
d. Suppose a student just came from a class next door. Where might that student's pulse rate fit on the line plot? Explain.
4. Make a plot based on the data you collected.
a. From the data you collected, can you obtain a good answer to the question of whether or not those who came from gym class tend to have higher pulse rates than those who came from the classrooms nearby? Why or why not?
b. Pose other questions you might like to answer. Do you think the data already collected would provide a good answer for these questions?
CONDUCTING AN EXPERIMENT 55
· LESSON 11
Experimenting to Answer a Question
What makes a good experiment?
Why do people conduct experiments?
OBJECTIVE
Design and conduct an experiment to answer
specific questions.
S6 LESSON 11
O ne key variable in an experiment is the response in which you are interested, such as pulse rate. If you want to study
the effect of exercise, then the variable "exercise" is called a treatment and is intentionally set at different levels. Other variables that might affect the response, such as gender, are balanced across treatments in the design.
Consider the following example and think about the elements involved in carrying out a good experiment.
Does listening to radio music while doing homework help or hinder? What variable might affect the outcome? A carefully planned experiment can help to answer specific questions like this. What is the response? Help or hinder what? This question could be made more specific by choosing to measure scores on a history quiz as the response of interest.
This experiment has one treatment-status of the radio, with two levels: the radio is on or the radio is off. Some students are directed to study with the radio on and some with the radio off. Treatment levels are to be compared by scores on a history quiz given to all students in the experiment.
There are other variables that might affect the outcome, as well. Perhaps those who study in the afternoon learn more than those who study in the evening. The effect of time of day can be eliminated by having all students study in the evening. Perhaps girls do better than boys in this course. The effect of gender can be balanced by having equal (or nearly equal) numbers of girls at each treatment level. Then the difference in
average score for the two treatment groups cannot be attributed to gender. You are controlling for gender. Ability levels could affect outcomes. Even though all students might be from the same-level history class, there are still differences in ability. Since it is difficult to directly control the assignment of students based on ability, you could randomly assign boys and girls to the treatments. This should help to balance out any differences in ability among the students.
INVESTIGATE
Key Elements in an Experiment
The key elements to be considered in any experiment are listed below.
• Both the question to be investigated and the response variable must be clearly defined.
• Key variables to be used as treatments must be identified.
• Other important variables that can be controlled directly must also be identified.
• Important background, or lurking, variables that cannot be controlled directly should be identified and then balanced by randomization.
• Treatments should be randomly assigned to the experimental units.
• The method of measurement should minimize measurement bias. (Measurement bias will be discussed in the next lesson.)
• Data collection and data management should be organized.
• Careful and thorough data analysis should be included.
• Conclusions should be written in light of the original question.
• A follow-up study to answer the question more completely or to answer the next logical question about the issue should be planned.
Discussion and Practice
To determine why the key elements are important, answer the following questions.
EXPERIMENTING TO ANSWER A QUESTION S7
I. a. Compare the key elements for an experiment with those for a sample survey in Lesson 3, pages 17-20. What are the similarities between sample surveys and experiments? What are the differences?
b. A student is planning to enter the school science fair with an experiment on the effect of light on plant growth. Help this student design the experiment by discussing each of the key elements.
Practice and Applications
Think back over the earlier discussion on pulse rates. How would pulse rates differ after exercising for one minute? After exercising for three minutes? Your next task is to carefully design and conduct an experiment on pulse rates.
2. a. Clearly define a question about exercise and pulse rate.
b. From the question, identify the key variable to be used as a treatment.
c:. Identify factors that might influence the experiment and that can be controlled.
d. Identify other factors that cannot be easily controlled directly, but may be balanced by randomization. Is it important to randomize the students to the treatments in this study?
e. Outline how you would carry out a study to answer your question.
3. Suppose you want to know if a longer period of exercise, for instance, three minutes, will elevate pulse rate more than a short period of exercise of one minute.
a. The physical process of conducting the experiment begins with the random assignment of treatments to the experimental units, namely the students in the class. But results might differ for athletes and nonathletes. How can you control the experiment to account for athletes and nonathletes? If this experiment is done in a short time frame, such as within the first ten minutes of class, you need different people for each part of the experiment. Why?
b. Agree on the method of measurement for pulse rates. The method should provide an accurate measure of
S8 LESSON 11
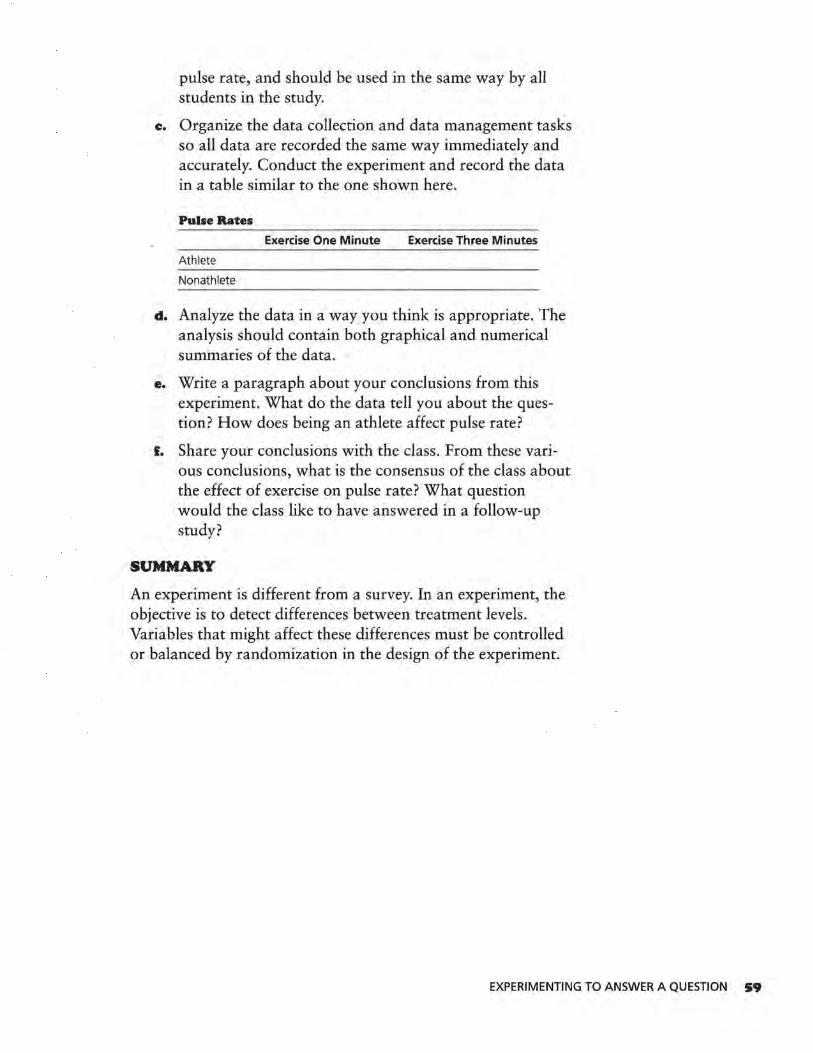
pulse rate, and should be used in the same way by all students in the study.
c. Organize the data collection and data management tasks so all data are recorded the same way immediately and accurately. Conduct the experiment and record the data in a table similar to the one shown here.
Pulse Rates
Exercise One Minute Exercise Three Minutes
Athlete
Nonathlete
d. Analyze the data in a way you think is appropriate. The analysis should contain both graphical and numerical summaries of the data. ·
e. Write a paragraph about your conclusions from this experiment. What do the data tell you about the question? How does being an athlete affect pulse rate?
£. Share your conclusions with the class. From these various conclusions, what is the consensus of the class about the effect of exercise on pulse rate? What question would the class like to have answered in a follow-up study?
SUMMARY
An experiment is different from a survey. In an experiment, the objective is to detect differences between treatment levels. Variables that might affect these differences must be controlled or balanced by randomization in the design of the experiment.
EXPERIMENTING TO ANSWER A QUESTION S9
LESSON 12
Measurement Variability and Bias
While surveys can be biased, is it possible to have biased experiments?
What is the main cause of bias in experiments?
OBJECTIVES
Understand that all measurement processes are subject to variability
and bias.
Estimate lengths and measure in inches and
quarter inches.
Graph and interpret collected data.
•o LESSON 12
W hen you do an experiment, you must think about the variables that might affect the outcome.
INVESTIGATE
Recall from Lesson 11 some of the variables that might affect the outcome of the pulse-rate experiment. Others might include room temperature, time of day, and type of clothing students are weanng.
Discussion and Practice
I. The pulse rates of students in the class produced a line plot that showed variability in the data. That was not surprising, since students differ in physical size and condition as well as in emotional status at the time the pulse was taken. Now, suppose five students measure the length of the teacher's desk to the nearest quarter inch. Would all five get the same measurement?
a. Discuss whether or not all five students would tend to get the same measurement of the length of the teacher's desk, and why or why not. Record your conclusion.
b. Describe the differences between the variability produced by the pulse-rate measurements and the variability obtained by the measurements of desk length.
c. Suppose the students measure the desk length with a yardstick that has a fraction of an inch worn off both ends. In addition to being variable, what other feature will the desk-length measurements possess?
d. Measurements that systematically and regularly deviate from the truth in one direction or another are said to be biased. Provide examples of typical measurement processes you think might be biased.
Practice and Applications
2. Estimate the length, to the nearest inch, of the two strings your teacher is holding.
a. The first string, string A, is about inches long.
b. The second string, string B, which is at least 36 inches long, is about inches long.
3. When instructed to do so, record your "measurements" on numbered line plots for the class data, one plot for each string.
a. Describe any patterns you see in the data from string A.
b. Describe any patterns you see in the data from string B. What are the differences between the patterns for the length of string A and that of string B?
c. The teacher will provide the correct lengths for each string. How did the estimated lengths compare to the true lengths?
d. Make a general statement about variability and bias in these processes for "measuring" string length. Can you suggest possible reasons for the bias, if it exists?
4. For this activity, each group will use Activity Sheet 5.
a. Construct the card, following the directions given- on the Activity Sheet.
b. Each member of the group should do the following. Pull the slide until the line on the slide looks as if it is the same length as the line on the face of the card, or jacket. Then, turn the jacket over and read the length of the extended line from the ruler on the back. Record this measurement without revealing it to the other members of the group.
MEASUREMENT VARIABILITY AND BIAS 6I
c. After everyone has made a measurement, measure the length of the line on the surface of the card. Share the results in the group and briefly discuss what happened.
d. The teacher will instruct you where to place your measurements so the data set can be collected for the class. Make a line plot of the data.
s. a. Do the lengths of the extended line all tend to be the same? What does this say about variability in the way we view things?
b. Do the lengths of the extended lines appear to be systematically too long or too short? What does this say about bias in our viewing?
•· Describe two real-life situations in which measurement bias might occur.
7. Do you see the possibility of bias in any of the following scenarios?
a. The heights of players on the basketball team are being measured by an assistant coach.
b. The lengths of time to repair cars are being recorded by a mechanic who is paid according to the length of the job.
c. Students trying out for the wrestling team are reporting their weights to the coach.
d. A hospital is attempting to predict the lengths of time current patients will remain in the hospital.
Sometimes, things appear to be different from what they actually are. If someone interprets an event only in terms of personal experience, this interpretation would be a biased view.
flZ LESSON 12
LESSON 13
Experiments in the Real World
Who conducts experiments?
What do they do with the results?
E xperiments in the real world take place all the time. Use your knowledge of experiments and consider what a real
world experiment might be like.
What follows is a summary of the article, The Physicians' Health Study-Does Aspirin Help Prevent Heart Attacks?
During the 1980s, approximately 22,000 male physicians over the age of 40 agreed to participate in a long-term health study for which one important question was to determine whether or not aspirin helps to lower the rate of heart attacks, or myocardial infarctions. The treatments for this part of the study were aspirin or a placebo, which looks like aspirin but contains no aspirm.
One group in the study took aspirin, and the other took the placebo. The physicians were randomly assigned to one med-
' ication or the other by a randomization device equivalent to the toss of a coin. Neither the medical examiners nor the participants knew to which group the physicians were assigned. This is called a double blind experiment. The method of measurement was to observe the physicians carefully for an extended period of time and to document all heart attacks, as well as other problems, that occurred.
The following table shows how the randomization divided the subjects according to exercise and to cigarette smoking.
OBJECTIVES
Appreciate how experiments are
conducted.
Recognize how results of an experiment are
used in the real world .
Calculate percents and proportions, standard deviation of a sample
proportion, and confidence intervals.
EXPERIMENTS IN THE REAL WORLD ·~
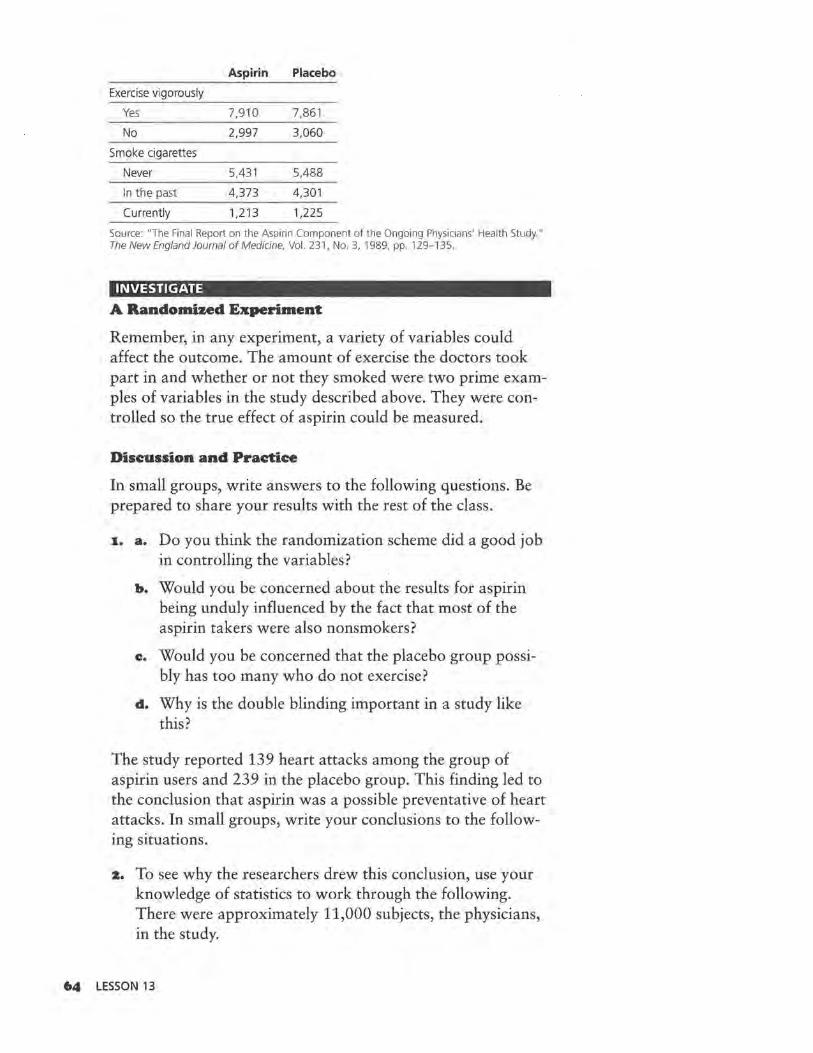
Aspirin Placebo
Exercise vigorously
Yes 7,910 7,861
No 2,997 3,060
Smoke cigarettes
Never 5,431 5,488
In the past 4,373 4,301
Currently 1,213 1,225
Source: "The Final Report on the Aspirin Component of the Ongoing Physicians' Health Study." The New England Journal of Medicine, Vol. 231, No. 3, 1989, pp . 129-135.
INVESTIGATE
A Randomized Experiment
Remember, in any experiment, a variety of variables could affect the outcome. The amount of exercise the doctors took part in and whether or not they smoked were two prime examples of variables in the study described above. They were controlled so the true effect of aspirin could be measured.
Discussion and Practice
In small groups, write answers to the following questions. Be prepared to share your results with the rest of the class.
1.. a. Do you think the randomization scheme did a good job in controlling the variables?
b. Would you be concerned about the results for aspirin being unduly influenced by the fact that most of the aspirin takers were also nonsmokers?
c. Would you be concerned that the placebo group possibly has too many who do not exercise?
d. Why is the double blinding important in a study like this?
The study reported 139 heart attacks among the group of aspirin users and 239 in the placebo group. This finding led to the conclusion that aspirin was a possible preventative of heart attacks. In small groups, write your conclusions to the following situations.
2. To see why the researchers drew this conclusion, use your knowledge of statistics to work through the following. There were approximately 11,000 subjects, the physicians, in the study.
64 LESSON 13
a. Calculate the proportion of heart attacks among those taking aspirin.
b. Calculate the proportion of heart attacks among those taking the placebo.
3. a. How was randomization used in this experiment?
b. Was it important to use randomization?
4. a. What is the difference between a treatment and a factor to be controlled?
b. Is exercise a treatment or a factor to be controlled?
s. Could the data from this experiment be used to find a good estimate of the proportion of males who smoke? Explain.
Practice and Applications
6. Find another printed article that explains the results of an experiment. Identify the key elements, state the evidence used to verify the conclusions, and write a summary of the experiment and its main results. The summary may contain comments on how you think the experiment or the report of it could have been improved.
Extend If you have studied confidence intervals for proportions, you can do Problems 7 and 8 for the aspirin study.
7. Calculate the standard deviation for each of the proportions of heart-attack victims in the two groups. Use the results to form confidence intervals for each group.
8. Looking at the two confidence intervals, can you see why the researchers in this study declared that aspirin had a significant effect in reducing heart attacks? Explain.
SUMMARY
• You can design and conduct an experiment to answer specific questions.
• All measurement processes are subject to variability and bias.
• Results of an experiment can be used in the real world.
An experiment is different from a survey. In an experiment, the objective is to detect differences between treatment levels. Variables that might affect these differences must be controlled
EXPERIMENTS IN THE REAL WORLD 6S
or balanced by randomization in the design of an experiment. A good experiment utilizes the following steps:
• Clearly define the question to be investigated and the response to be measured.
• Identify the key variables to be investigated.
• Identify other important variables that can be controlled directly.
• Identify important background variables that cannot be controlled directly but that should be balanced by randomization.
• Randomly assign treatments to the experimental units.
• Decide on a method of measurement that will minimize measurement bias.
66 LESSON 13
UNIT Ill ACTIVITY
Conducting Your Own Experiment
How fast are student reaction times?
Can a person react with his or her dominant hand faster than with the nondominant hand?
Do females have faster reaction times than males?
T hese questions, and others, can be investigated with a simple experiment that consists of measuring how far a
dropped ruler falls before it is caught. The length the ruler falls is directly proportional to the length of time it takes to catch the ruler. The key elements of an experiment provide the guide for our discussion of how to conduct such an experiment. The details on how to set up the experiment are provided below.
x. What are the questions the class would like to answer about reaction times?
2. From the questions raised, what are the variables to be used as treatments?
3. What variables that might affect the results can be controlled directly in the design of the experiment?
4. What variables that might affect the results cannot be controlled directly but might be partially controlled by randomization?
s. Now, you must randomly assign treatments to the experimental units. Suppose, for example, the treatment of interest is dominant versus nondominant hand. A controllable factor is the gender of the person being tested. Thus, we need some males and some females in each of the two treatment groups, and the assignment of students to the groups
OBJECTIVE
Design, implement, and analyze the results of an
experiment.
CONDUCTING YOUR OWN EXPERIMENT 67
should be random. How might this be done? NOTE: It is convenient, but not necessary, to have the same number of subjects in each treatment-gender combination.
•· What method of measurement will minimize bias and allow for fair comparisons among the treatment groups? The ruler should be above the opening between the thumb and forefinger of the subject being tested, and then dropped without warning the subject. The subject then catches the ruler as quickly as possible, and the distance the ruler drops is recorded. Should practice runs be allowed? Should other distractions be used to make sure the subject does not know when the ruler will fall? What other issues should be considered in trying to get a fair measurement of reaction time for all the subjects being tested?
7. The data management should be organized so data is correctly recorded on a chart. Should the subjects being tested record their own data?
8. Analyze the data recorded from the experiment. What graphical and numerical summaries provide the best descriptions of interesting features of the data?
9. What conclusions did your group reach in light of the original question( s)? Prepare a presentation to share these conclusions with the remainder of the class.
10. If your group were to design a follow-up study on the issue of student reaction times, what question might you investigate? How would you change the design of the experiment?
Now try your hand at one of the seven experiments described below. Remember experiments are best if they allow a fair amount of data to be collected. If you need help working through your experiment, refer to Unit 4 of this module.
FLY RIGHT
Materials: at least three sheets of paper
Description: Make three airplanes using different designs. Which is the best airplane design? It may depend on what is meant by "best." Work in groups to define at least two different outcome measures of flight performance, such as length of time in the air and accuracy at hitting a target. Then, decide on acceptable ways to measure these outcomes in an experimental situation. Each design/paper combination should be tested at least three times on each of the two outcome measures of
M UNIT Ill ACTIVITY
quality. How can bias in the measurement process be reduced? Where should randomization be used?
HOPPING ALONG
Materials: a stopwatch or watch with a second hand
Description: What is your hopping rate? Do you hop faster on your dominant foot? What physical attributes make us fast hoppers? This experiment is to be designed to answer these questions. Work in teams of two. One hops along the marked distance, about 20 meters, and is timed by the other; the return hop is on the other foot. Then, the roles are reversed; the original hopper times while the timer hops. The whole process should be repeated so you have two measures of time on each foot for each person. The times along a specified distance may be turned into rates for further analysis.
Brainstorm and agree on another factor, such as a physical attribute, that could affect hopping speed. Then, analyze the data to see if the foot used, dominant or nondominant, makes any difference or if the other physical attribute, such as height perhaps, makes any difference in hopping rates. Where does randomization come into the design of this experiment?
POPPING OUT
Materials: two popcorn poppers, one a hot-air and one of another type, such as an oil popper; two different brands of popcorn
Description: I am about to purchase a new popcorn popper. Should I buy a hot-air popper or some other type? Get some data on which to base a decision. Try equal amounts of popcorn in each popper and see what happens. Before doing the popping, however, decide upon a meaningful outcome to measure quality. Are you looking for high volume of popped corn, low number of unpopped kernels, or some other measure of popcorn quality? Make sure each brand is tested in each popper. Set up a data recording sheet, collect the data, and analyze them. Write a report of your findings, including a recommendation on which popper to purchase.
BOAT FLOAT
Materials: two equal sized pieces of aluminum foil; two trays of water; salt; a bag of beans
CONDUCTING YOUR OWN EXPERIMENT ft9
Description: Do things actually float better in salt water? Does the surface area between a boat and the water or the shape of the boat make a difference in the boat's ability to float? To help answer these questions, design two different boats to be constructed out of the sheets of aluminum foil. Each will be floated on both fresh and salt water. The salt water should contain a large dose of salt, so that there is a definite difference in the water types. The measure of floating ability is the number of beans the boat can carry before it sinks. Before carrying out this experiment, think carefully about how to order the steps in the data collection process and how to reduce bias.
HOT STUFF
Materials: two disposable hot cups, one plastic foam and one paper; hot water; two thermometers
Description: Which cup is the better insulator? An experiment will help you find the answer. Heat water to boiling and place equal amounts in a plastic foam cup and a paper cup. Quickly place a thermometer into each cup; the thermometers should have nearly equal readings at the outset. Now, how should insulation effectiveness be measured? Is it the amount by which the temperature decreases in a certain period of time such as ten minutes, or the time it takes to drop a fixed number of degrees such as 20 degrees, or something else? Agree on an appropriate measure and make sure you have at least five such measurements for each type of cup. How can you start the measurement process at the same water temperature each time? What happens if you do not have the same initial water temperature each time? Analyze your data and write up an answer to the original question.
SEEING NEAR AND FAR
Materials: measuring tape or some other method of measuring longer distances
Description: Place one object at a distance of about 20 meters from a designated spot and a similar object at a distance of about 200 meters from the same spot. Do people with a great deal of outdoor experiences, such as hiking, camping, hunting, and skiing, have a better perception of distance than those without that experience? To shed some light on this question, conduct this experiment. First, you must agree on a definition of "experienced outdoor person." Then, a number of students from each group, experienced and not experienced, should be
70 UNIT Ill ACTIVITY
asked to judge the distances to the two objects. After collecting their guesses, what could be used as the outcome measure of accuracy? When analyzing the data to answer the question on perception of distance, keep in mind there will be much difference in the responses gathered. Can randomization be used here? Write a brief report on the results of this experiment.
THE GRAVITY OF THE ISSUE
Materials: two pairs of identical objects such as two tabletennis balls or two small wooden blocks; a device to accelerate an object horizontally, such as a rubber band
Description: How does the effect of gravity on an accelerated object compare to its effect on free-falling objects? To check this out, construct a device that will accelerate a small object, such as a table-tennis ball, horizontally at the same time an identical object is dropped. Start both objects at the same time and from the same height, such as from the top of a stepladder. To measure the outcome, you might try timing how long it takes the object to hit the floor, but this is a difficult task, as you must be very quick. As an alternative, just record which object hits the floor first. Collect data on the same pair of objects at least ten times, and try the experiment with at least two types of paired items. What did you discover?
CONDUCTING YOUR OWN EXPERIMENT 7I


Unit IV
Projects

LESSON 14
A Reference Guide
What are some graphical representations that can display data in a meaningful way? What are the measures of center? of variability?
How do these two measures help you to understand the data?
T his section will help refresh your memory about these topics and ideas you have covered:
• types of variables you will be using
• measures of center and spread
• types of graphical displays
Types of Variables
You may recall learning about two types of variables: measurement variables (quantitative) and categorical variables (qualitative).
• Measurement data result when you determine the extent, size, quantity, or capacity of something. An example is your height or weight. You can also use measurement variables to determine how far you can jump, to determine how long you can hold your breath, or to make a guess as to how many candies are in a bag.
• Categorical data tend to be information about classification of objects or people, for example, males or females; lefthanded or right-handed people; or brands of shoes students are weanng.
Measures of Center and of Spread
When thinking about the measurements you gather in your project, you may want to consider using tools that help you
OBJECTIVE
Use a reference guide as a tool when working on individual projects.
A REFERENCE GUIDE 75
think about the center of your data and the variables in your data. This may help you analyze the information you have gathered. Measures coinmonly used are
Center
• mean
• median
Variability
•
•
•
range
interquartile range
standard deviation
Types of Graphical Displays
The type of data you collect and the questions you are trying to answer should help you to determine the types of tables, graphs, and charts you will use to display your data.
When using measurement data, you may want to consider making
• stem-and-leaf plots
• line plots
• box plots
• histograms
• picture graphs
• scatter plots
When using categorical data, you may want to consider making
• bar graphs
• circle graphs
• picture graphs
The following example shows the measures of center and spread and the types of graphs and plots you can use. Today many people are very health-conscious. People are watching calories and fat grams. The Mars® candy company has been watching this trend and has created a new low-calorie, low-fat bar called Milky Way II®.
7ft LESSON 14
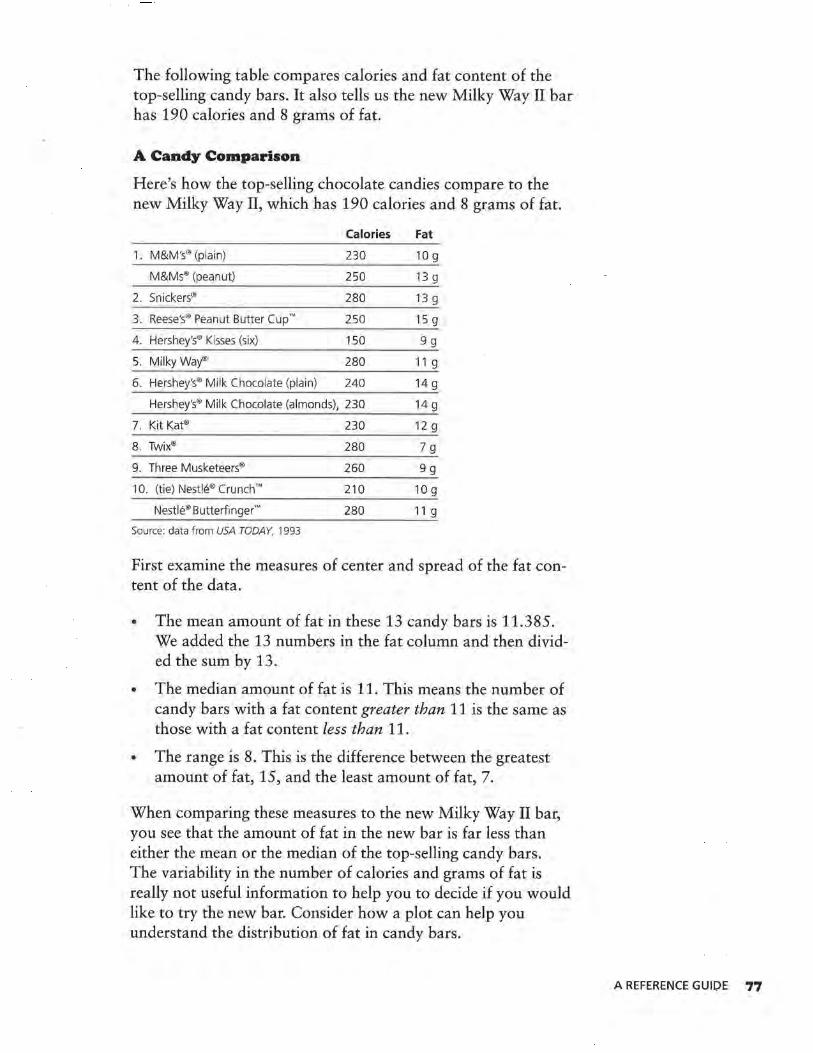
The following table compares calories and fat content of the top-selling candy bars. It also tells us the new Milky Way II bar has 190 calories and 8 grams of fat.
A Candy Comparison
Here's how the top-selling chocolate candies compare to the new Milky Way II, which has 190 calories and 8 grams of fat.
Calories Fat
1. M&M's® (plain) 230 10 g
M&Ms® (peanut) 250 13 g
2. Snickers® 280 13 g
3. Reese's® Peanut Butter Cup '" 250 15 g
4. Hershey's® Kisses (six) 150 9g
5. Milky Way® 280 11 g
6. Hershey's® Milk Chocolate (plain) 240 14 g
Hershey's® Milk Chocolate (almonds), 230 14 g
7. Kit Kat® 230 12 g
8. Twix® 280 7g
9. Three Musketeers® 260 9g
10. (tie) Nestle® Crunch'" 210 10 g
Nestle® B utterfi nger'" 280 11 g
Source: data from USA TODAY, 1993
First examine the measures of center and spread of the fat content of the data.
• The mean amount of fat in these 13 candy bars is 11.385. We added the 13 numbers in the fat column and then divided the sum by 13.
• The median amount of fat is 11. This means the number of candy bars with a fat content greater than 11 is the same as those with a fat content less than 11.
• The range is 8. This is the difference between the greatest amount of fat, 15, and the least amount of fat, 7.
When comparing these measures to the new Milky Way II bar, you see that the amount of fat in the new bar is far less than either the mean or the median of the top-selling candy bars. The variability in the number of calories and grams of fat is really not useful information to help you to decide if you would like to try the new bar. Consider how a plot can help you understand the distribution of fat in candy bars.
A REFERENCE GUIOE 77
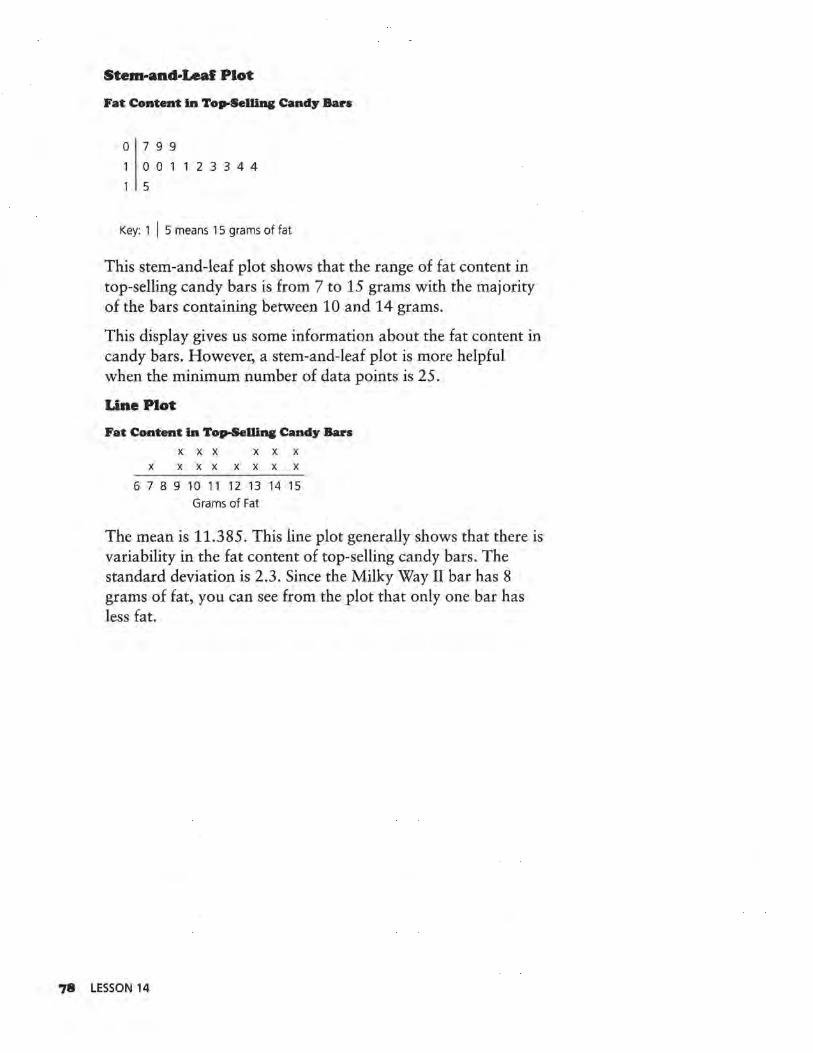
Stem-and-Leal Plot
Fat Content in Top-Selling Candy Bars
0 7 9 9
0 0 1 1 2 3 3 4 4
5
Key: 1 I 5 means 15 grams of fat
This stem-and-leaf plot shows that the range of fat content in top-selling candy bars is from 7 to 15 grams with the majority of the bars containing between 10 and 14 grams.
This display gives us some information about the fat content in candy bars. However, a stem-and-leaf plot is more helpful when the minimum number of data points is 25.
line Plot
Fat Content in Top-Sellin& Candy Bars x x x x x x
x xxxxxxx 6 7 8 9 10 11 12 13 14 15
Grams of Fat
The mean is 11.385. This line plot generally shows that there is variability in the fat content of top-selling candy bars. The standard deviation is 2.3. Since the Milky Way II bar has 8 grams of fat, you can see from the plot that only one bar has less fat.
'78 LESSON 14
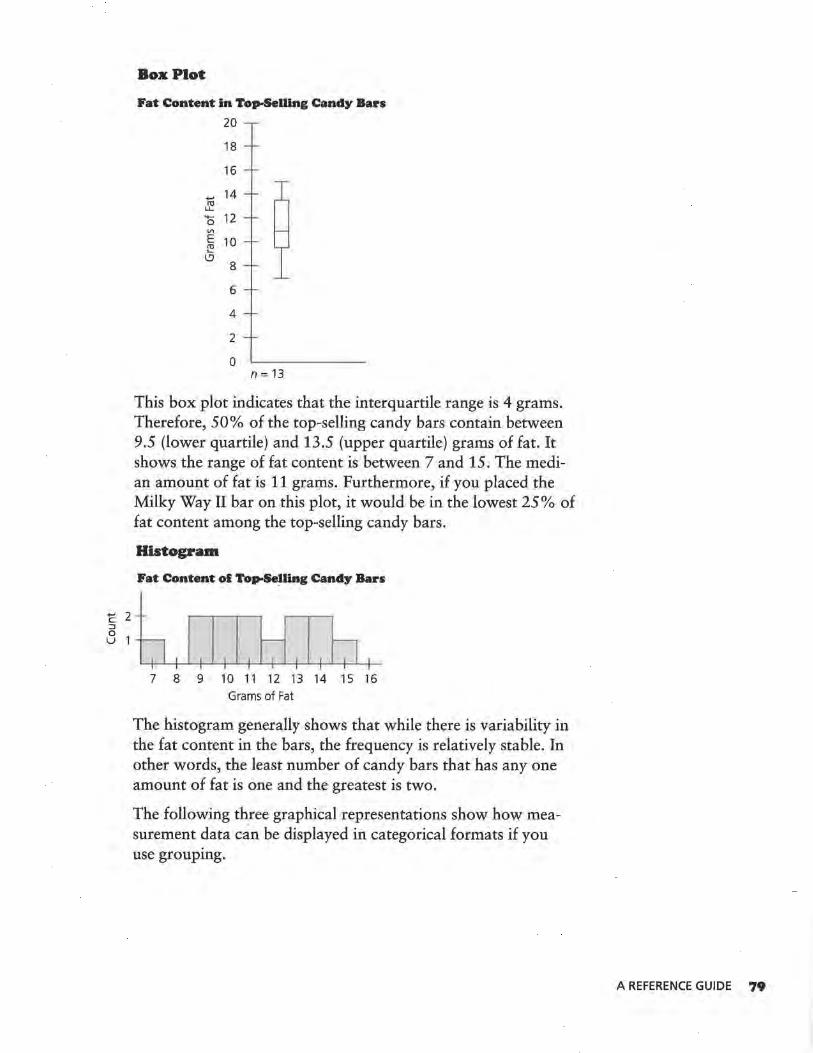
Box Plot
Fat Content in Top-Selling Candy Bars
20
18
16
...., 14 ro
LL
0 12 Vl
E 10 ~
\.'.)
8
6
4
2
0 n = 13
This box plot indicates that the interquartile range is 4 grams. Therefore, 50% of the top-selling candy bars contain between 9.5 (lower quartile) and 13.5 (upper quartile) grams of fat. It shows the range of fat content is between 7 and 15. The median amount of fat is 11 grams. Furthermore, if you placed the Milky Way II bar on this plot, it would be in the lowest 25 % of fat content among the top-selling candy bars.
Histogram
Fat Content ol Top-Selling Candy Bars
) ~6 I I I I I I I ~ I I I b 7 8 9 10 11 12 13 14 15 16
Grams of Fat
The histogram generally shows that while there is variability in the fat content in the bars, the frequency is relatively stable. In other words, the least number of candy bars that has any one amount of fat is one and the greatest is two.
The following three graphical representations show how measurement data c~n be displayed in categorical formats if you use groupmg.
A REFERENCE GUIDE 79
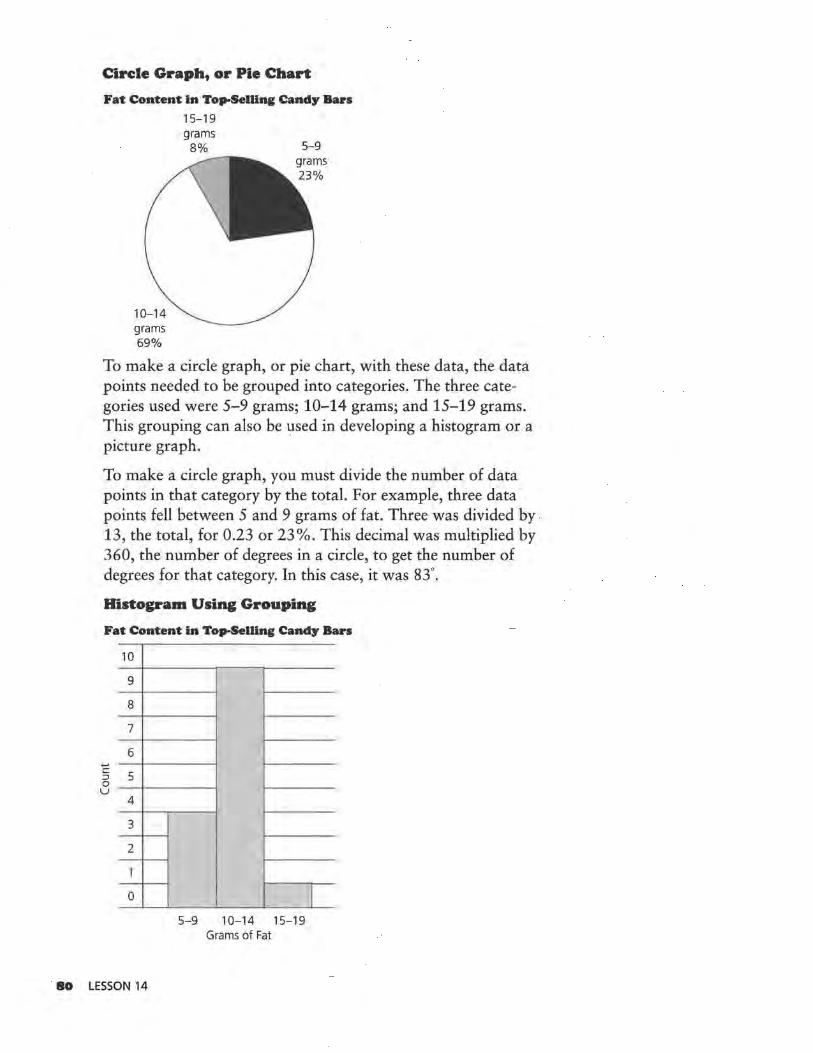
Circle Graph, or Pie Chart
Fat Content in Top-Selling Candy Bars
15-19
10-14 grams 69%
grams 8% 5-9
To make a circle graph, or pie chart, with these data, the data points needed to be grouped into categories. The three categories used were 5-9 grams; 10-14 grams; and 15-19 grams. This grouping can also be used in developing a histogram or a picture graph.
To make a circle graph, you must divide the number of data points in that category by the total. For example, three data points fell between 5 and 9 grams of fat. Three was divided by . 13, the total, for 0.23 or 23%. This decimal was multiplied by 360, the number of degrees in a circle, to get the number of degrees for that category. In this case, it was 83°.
Histogram Using Grouping
Fat Content in Top-Selling Candy Bars
+-' c ::J 0 u
10
9
8
7
6
5
4
3
2
1
0
80 LESSON 14
I 5-9 10-14 15-19
Grams of Fat
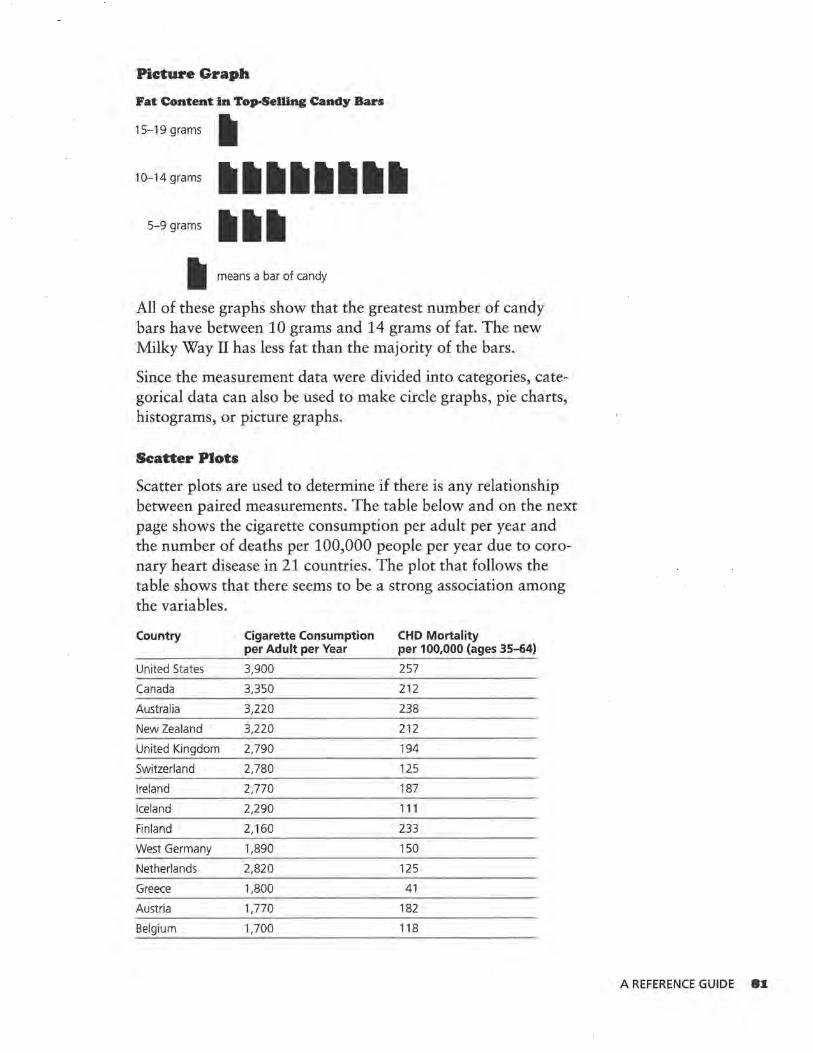
Picture Graph
Fat Content in Top-Selling Candy Bars
15-19grams II 10
-14
grams 11111111111111111 5-9 grams 111111
II means a bar of candy
All of these graphs show that the greatest number of candy bars have between 10 grams and 14 grams of fat. The new Milky Way II has less fat than the majority of the bars.
Since the measurement data were divided into categories, categorical data can also be used to make circle graphs, pie charts, histograms, or picture graphs.
Scatter Plots
Scatter plots are used to determine if there is any relationship between paired measurements. The table below and on the next page shows the cigarette consumption per adult per year and the number of deaths per 100,000 people per year due to coronary heart disease in 21 countries. The plot that follows the table shows that there seems to be a strong association among the variables.
Country Cigarette Consumption CHO Mortality per Adult per Year per 100,000 (ages 35-64)
United States 3,900 257
Canada 3,350 212
Australia 3,220 238
New Zealand 3,220 212
United Kingdom 2,790 194
Switzerland 2,780 125
Ireland 2,770 187
Iceland 2,290 111
Finland 2, 160 233
West Germany 1,890 150
Netherlands 2,820 125
Greece 1,800 41
Austria 1,770 182
Belgium 1,700 118
A REFERENCE GUIDE 8I
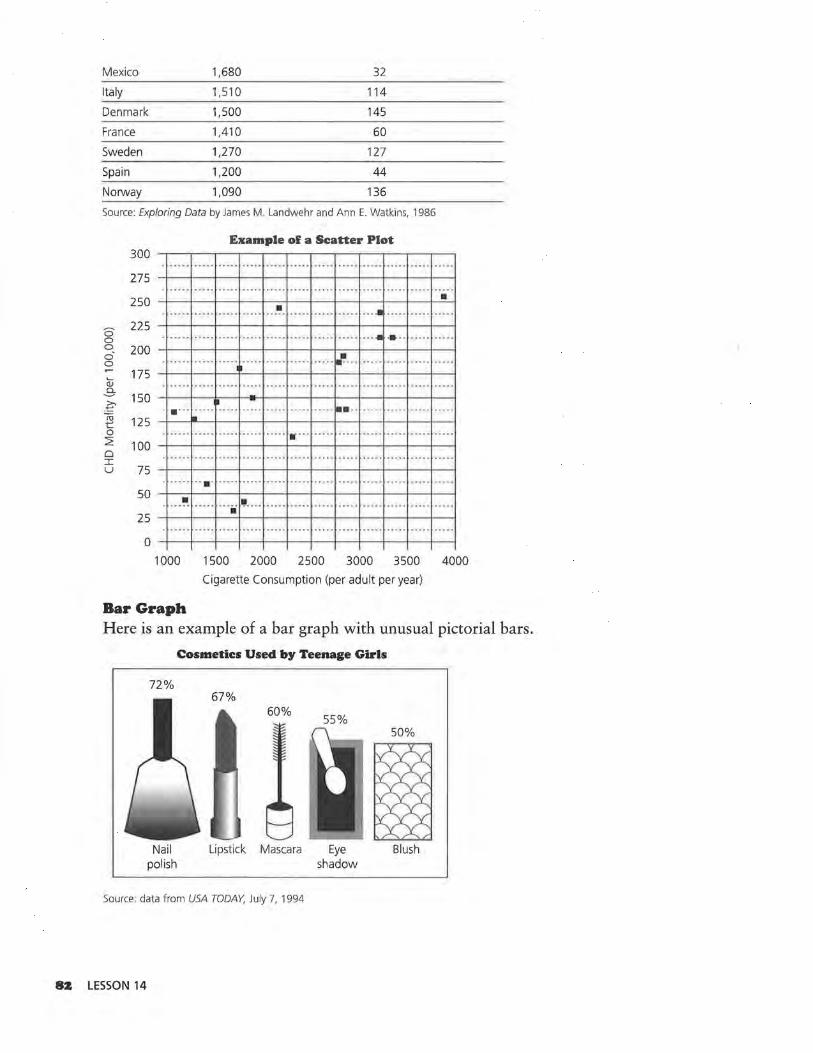
Mexico 1,680 32
Italy 1,510 114
Denmark 1,500 145
France 1,410 60
Sweden 1,270 127
Spain 1,200 44
Norway 1,090 136
Source: Exploring Data by James M. Landwehr and Ann E. Watkins, 1986
0 0 0 6 0
w .3 -~ ~ 0 2 0 I u
Example of a Scatter Plot 300 ---.--~-r-----r~-r-----r~-r-----r~-r-----r~..-----r~..-----.
275
250 • . ..... ..... ..... ..... · --~- ..... .. ..... ... .. .• ..... ...........
225
200
175
150
125
100
75
50
25
0
. ····· ..... · - ·-· · · - · - -·· ·· ··· -- ..... ·· ··· ... ........ .. .. ·-· · ·
• . ··-·- ···-· ... .. ,, ..... r ···· ........... .... .. ........ ··· ··· .... . .................. .. . \.. .... .............. .. .. ........ .......... .
I ..•. .. ----· --- - · -· -·· ----- ... .. ......... . ...... ....... ... . .... . •
... ........................ • ... ... ...... .. ....... . .. ...........
.. .. .. .. • ........ ..... ... -····· ........ .. -····· .. ... .. .. ... ... .
• • . -·· · .. ........ .... . ·· ··· ··· ·· .. ..... .. ... ..... .... ..... . .... .
1000 1500 2000 2500 3000 3500
Cigarette Consumption (per adult per year)
4000
Bar Graph Here is an example of a bar graph with unusual pictorial bars.
72%
Nail polish
Cosmetics Used by Teenage Girls
67% 60%
55%
Lipstick Mascara Eye shadow
Source: data from USA TODAY, July 7, 1994
8Z LESSON 14
Blush
Notice a few things about this graph. There are no "raw" data given-only percents. Also, no details are given about how the information was gathered. You might also notice that the traditional bars are replaced by pictures of the objects described. It does show you that nail polish is the most common type of makeup used by teenage girls, with lipstick following a close second. Blush is the least common type of makeup used by teenage girls.
SUMMARY
This summary of types of variables, measures of center and spread, and types of graphs and plots can be helpful to you both before you begin to gather data and when you are ready. to display and analyze the data. Some things to remember are:
• Pie charts, picture graphs, and bar graphs are best used for describing categorical data. Remember this when you design your project. If you want more variety, you may want to consider some data that produce a measurement result. Line plots, stem-and-leaf plots, box plots, and histograms are most useful for measurement data.
• All graphs must have a title explaining the general topic of the graph.
• If graphs have axes, they must be labeled as to what each axis represents.
• There should be an explanation for each graph following the display.
• How a graph looks is very important. Remember to use a ruler. Color can also enhance both the appearance and the comprehensibility of your graph.
A REFERENCE GUIDE 83
LESSON 15
Doing a Project
How do you start a project?
What are some ideas you might use?
OBJECTIVE
Complete a project following correct
procedures.
84 LESSON 15
I n this module, you have studied censuses, surveys, and experiments. In this lesson, you will work in a group to
follow a given series of steps for a project.
INVESTIGATE
Steps for Doing a Project
An overview of the whole procedure is outlined below. It is important to understand each step in the process, so study the steps and make sure you have a clear understanding of what each step involves.
• Select a topic. Determine a question you want to answer.
• D.ecide whether your question should be answered by data from a census, a sample survey, or an experiment.
• Determine your target population if a census or sample survey is involved.
• Determine your treatments and experimental units if an experiment is involved.
• Determine the procedure for gathering your data.
• Field test your project.
• Collect your data.
• Organize the data into tables, graphs, and plots.
• Analyze the data.
• Report your results, conclusions, and predictions.
• Write recommendations for follow-up studies.
• Present an oral report.
Discussion and Practice
The Question
Selecting a topic is probably the most difficult part of the process. Your goal is to write a question for which you would like an answer.
If the question involves the estimation of a population characteristic, then you might conduct a census or survey. For example:
• How many students have jobs?
• What percentage of households have at least one pet?
• What is the average age of automobiles in my neighborhood?
• What would you change about your school if you could?
• How many of you have ever cheated on a test?
If the question involves the comparison of treatments, then you might conduct an experiment. For example:
• Do tennis balls of brand A bounce higher than those of brand B?
• Does adding salt to water cause boats to float better?
I. Decide on your question. Write down your question and make a sketch of your plan on a 4-by-6-inch card. Submit it to your teacher for suggestions and approval.
Target Population or Treatments
Your selection of a census, a sample survey, or an experiment will determine how you proceed. Each is explained below.
• If you are conducting a census or a sample survey, your goal is to determine what units are in the population and how many will be in your sample. Remember the importance of randomness when selecting your sample. Everyone should have a chance of being selected.
• If you are conducting an experiment, you need to determine your treatments and experimental units. Suppose the question is, "Which type of hot cup, plastic foam or paper,
DOING A PROJECT 8S
holds heat longer?" Cups of a certain brand and size are filled with hot water and temperature is measured after five minutes and ten minutes. The treatment is the type of cup. Be sure to carefully describe: what your procedure will be and the persons or things you will test; the number of experimental units (the number you will test); and how the process will be arranged and conducted. For instance, will you test only plastic foam cups in the morning and only paper cups in the afternoon?
2. If you are conducting a census or a sample survey, what population will you use and approximately how many will be in your sample? If you are performing an experiment, what treatments will you use and what will be the experimental units? Submit your plan to your teacher for suggestions and approval.
Procedure
The next step in completing your project is to decide how you will gather your data.
• If you are conducting a census or a sample survey, you need to write the questions you will ask. Remember to minimize · the bias in your questions.
• If you are performing an experiment, you need to determine the procedure your group will use and how you will standardize the procedure so that each person is doing exactly the same activity.
3. Determine how you will gather your data. If you are writing a census or sample survey, give a copy of your questions to your teacher for suggestions or approval. If you are writing an experiment, demonstrate your procedure to your teacher or write out the procedure you will use. Work with your teacher if changes are needed.
Field Test
You now need to test your questionnaire or experimental procedure to make sure it will answer the original question.
4. If you are doing a census or sample survey, try out your survey on about five people within your classroom. Determine if the information you are getting will answer your ques-
86 LESSON 15
tion. If you are successful, continue to the next part. If you are having difficulty, make revisions and talk to your teacher. If you are doing an experiment, determine if your procedure will provide an answer to your question. If you are successful, continue to the next part. If you are having difficulty, make revisions and talk to your teacher.
Collect Data
s. Now gather the information you need to answer your question. If you are working in a group, be sure all members are aware of their tasks. Make sure each person asks questions in the same way or does the experimental procedure in the same manner.
Organize
6. Organize the data you gathered and display it so the information is easily understood. Lesson 15 of this module contains a summary of some types of graphs you could make. Lesson 16 will help you decide how best to represent data for your project. Prepare and give your teacher a progress report.
Analyze
7. Carefully answer your original question based on the data you collected. Look for any unusual results and try to figure out what might have been the cause. Write a statistical summary of your findings.
Report
8. Write a report of your results. Before starting, read the Information Sheet, Informing Others found on pages 95-96. It will help you to write a good report. Follow these guidelines:
• Type or neatly write your report on 8.5-by-11-inch paper.
• Carefully mount all graphs, charts, and tables.
• Illustrate your cover sheet and include the project title, the names of the persons in your group, and the date.
DOING A PROJECT 87
Your report should include:
• the question that was investigated.
• a description of the target population or treatments and experimental units used.
• the procedure you used.
• the raw data, tables, and plots.
• analysis of the data, using the plots. Note any difficulties or unusual results.
• a statement of conclusions about your question and any predictions you can make.
• recommendations for follow-up studies that could be done.
Recommendations
9. Make recommendations or suggestions for changes in your design. Describe any problems you encountered and how you solved them.
Oral Report
10. After you have completed your project, drawn conclusions, and made predictions, make an oral presentation of your findings to the class. Include in your presentation all of the topics you used in your final report.
88 LESSON 15
LESSON 16
Representing the Same Data in Different Ways
What do different graphs tell you?
Is one kind of graph better than another?
O nce your data have been gathered, you should display the data so you and others can see relationships or trends.
You want to see what new information you can get from the data. You want to make the data-gathering process productive.
The trouble is that data can be so overwhelming, you can hardly see anything in the data at all. That is where statistics can help. By offering many different ways to organize and display data, statistical techniques can help find relationships or trends that are virtually invisible in data.
As you collect information for your project, you will want to start thinking about how you will display the results in a way that will be interesting, eye-catching, and informative.
One natural method of organizing data is in a table. Tables can be very effective in organizing frequency data. However, sometimes the relationships can be lost in a "sea of numbers."
INVESTIGATE
Frequency Tables
The table that follows shows the number of participants in the Olympic games since 1896. When you look at the number of competitors from the first Olympic games through the twelfth Olympic games, you can see that participation increased.
OBJECTIVES
Organize data in many different forms for
clearer understanding.
Construct a box plot.
Read and interpret a graphical display.
Compute and compare percents.
REPRESENTING THE SAME DATA IN DIFFERENT WAYS 89
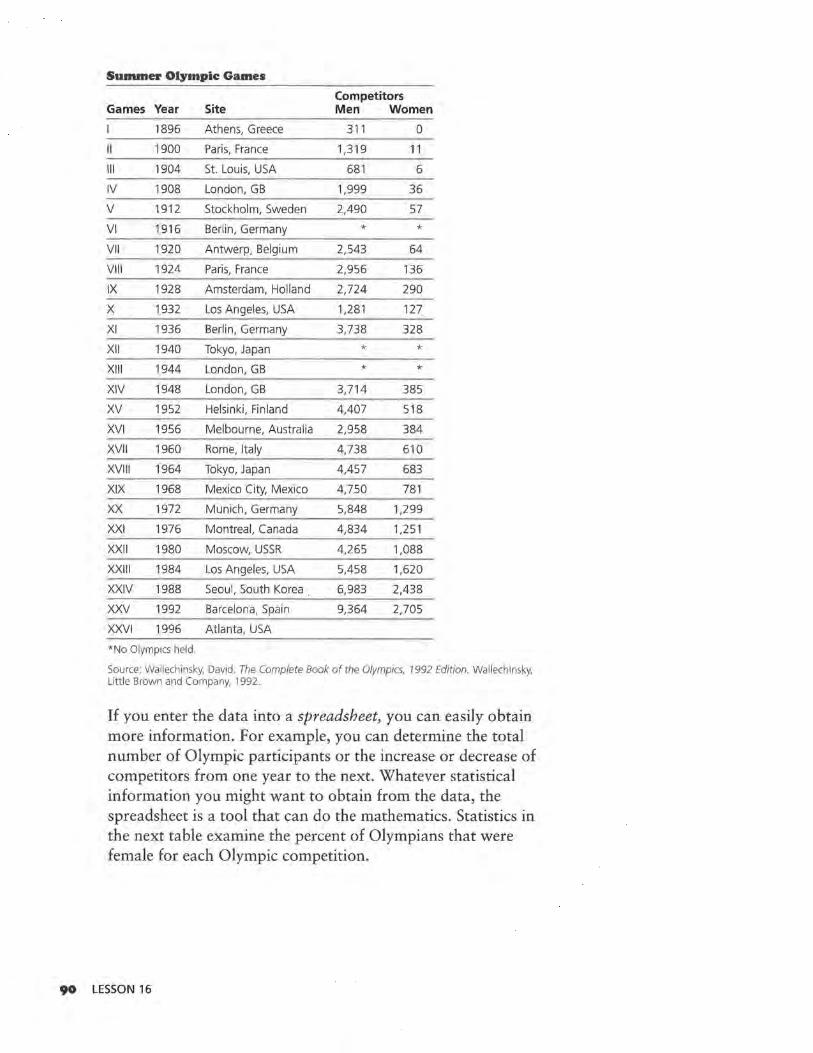
Summer Olympie Games
Competitors Games Year Site Men Women
I 1896 Athens, Greece 311 0
II 1900 Paris, France 1,319 11
Ill 1904 St. Louis, USA 681 6
IV 1908 London, GB 1,999 36
v 1912 Stockholm, Sweden 2,490 57
VI 1916 Berlin, Germany * * VII 1920 Antwerp, Belgium 2,543 64
VIII 1924 Paris, France 2,956 136
IX 1928 Amsterdam, Holland 2,724 290
x 1932 Los Angeles, USA 1,281 127
XI 1936 Berlin, Germany 3,738 328
XII 1940 Tokyo, Japan * * XIII 1944 London, GB * * XIV 1948 London, GB 3,714 385
xv 1952 Helsinki, Finland 4,407 518
XVI 1956 Melbourne, Australia 2,958 384
XVII 1960 Rome, Italy 4,738 610
XVIII 1964 Tokyo, Japan 4,457 683
XIX 1968 Mexico City, Mexico 4,750 781
xx 1972 Munich, Germany 5,848 1,299
XXI 1976 Montreal, Canada 4,834 1,251
XXll 1980 Moscow, USSR 4,265 1,088
XXlll 1984 Los Angeles, USA 5,458 1,620
XXIV 1988 Seoul, South Korea . 6,983 2,438
xxv 1992 Barcelona, Spain 9,364 2,705
XXVI 1996 Atlanta, USA
*No Olympics held.
Source: Wallechinsky, David. The Complete Book of the Olympics, 1992 Edition. Wallechinsky, Little Brown and Company, 1992.
If you enter the data into a spreadsheet, you can easily obtain more information. For example, you can determine the total number of Olympic participants or the increase or decrease of competitors from one year to the next. Whatever statistical information you might want to obtain from the data, the spreadsheet is a tool that can do the mathematics. Statistics in the next table examine the percent of Olympians that were female for each Olympic competition.
90 LESSON 16
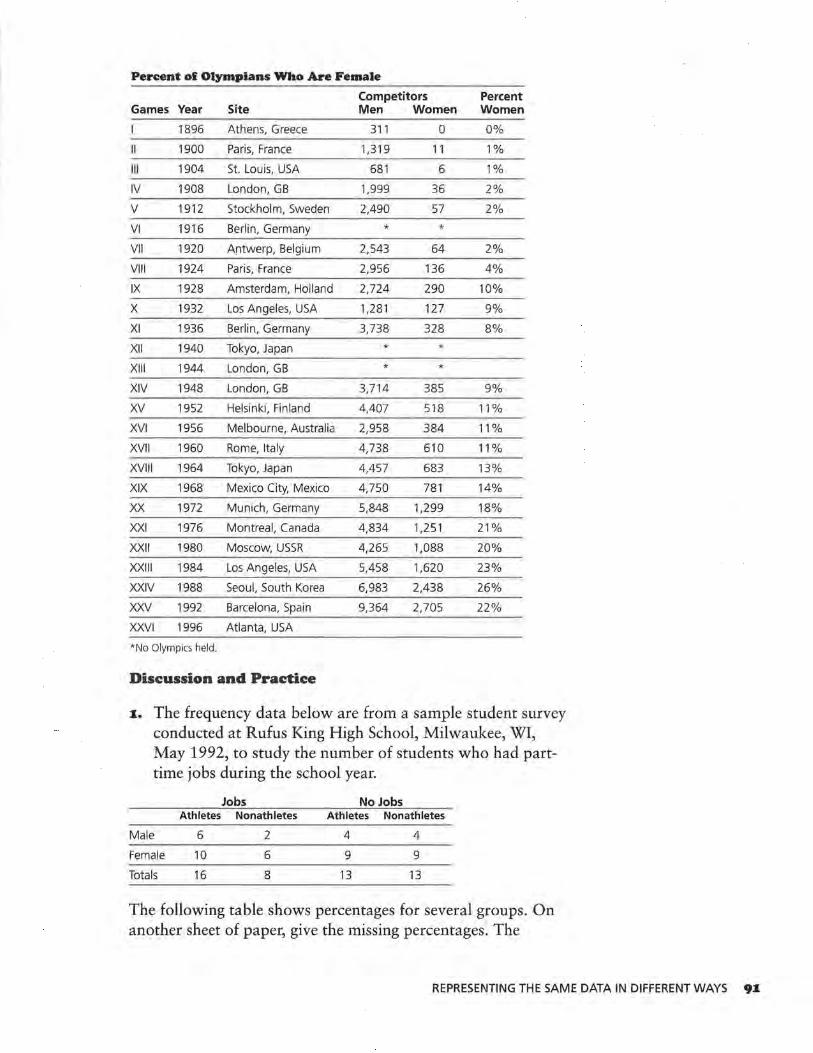
Percent of Olympians Who Are Female
Competitors Percent Games Year Site Men Women Women
1896 Athens, Greece 311 0 0%
II 1900 Paris, France 1,319 11 1%
Ill 1904 St. Louis, USA 681 6 1%
IV 1908 London, GB 1,999 36 2%
v 1912 Stockholm, Sweden 2,490 57 2%
VI 1916 Berlin, Germany * * VII 1920 Antwerp, Belgium 2,543 64 2%
VIII 1924 Paris, France 2,956 136 4%
IX 1928 Amsterdam, Holland 2,724 290 10%
x 1932 Los Angeles, USA 1,281 127 9%
XI 1936 Berlin, Germany 3,738 328 8%
XII 1940 Tokyo, Japan * * XIII 1944 London, GB * * XIV 1948 London, GB 3,714 385 9%
xv 1952 Helsinki, Finland 4,407 518 11 %
XVI 1956 Melbourne, Australia 2,958 384 11%
XVII 1960 Rome, Italy 4,738 610 11 %
XVIII 1964 Tokyo, Japan 4,457 683 13%
XIX 1968 Mexico City, Mexico 4,750 781 14%
xx 1972 Munich, Germany 5,848 1,299 18%
XXI 1976 Montreal, Canada 4,834 1,251 21%
XXll 1980 Moscow, USSR 4,265 1,088 20%
XXlll 1984 Los Angeles, USA 5,458 1,620 23%
XXIV 1988 Seoul, South Korea 6,983 2,438 26%
xxv 1992 Barcelona, Spain 9,364 2,705 22%
XXVI 1996 Atlanta, USA
*No Olympics held.
Discussion and Practice
I. The frequency data below are from a sample student survey conducted at Rufus King High School, Milwaukee, WI, May 1992, to study the number of students who had parttime jobs during the school year.
Jobs No Jobs Athletes Nonathletes Athletes Nonathletes
Male 6 2 4 4
Female 10 6 9 9
Totals 16 8 13 13
The following table shows percentages for several groups. On another sheet of paper, give the missing percentages. The
REPRESENTING THE SAME DATA IN DIFFERENT WAYS 9I
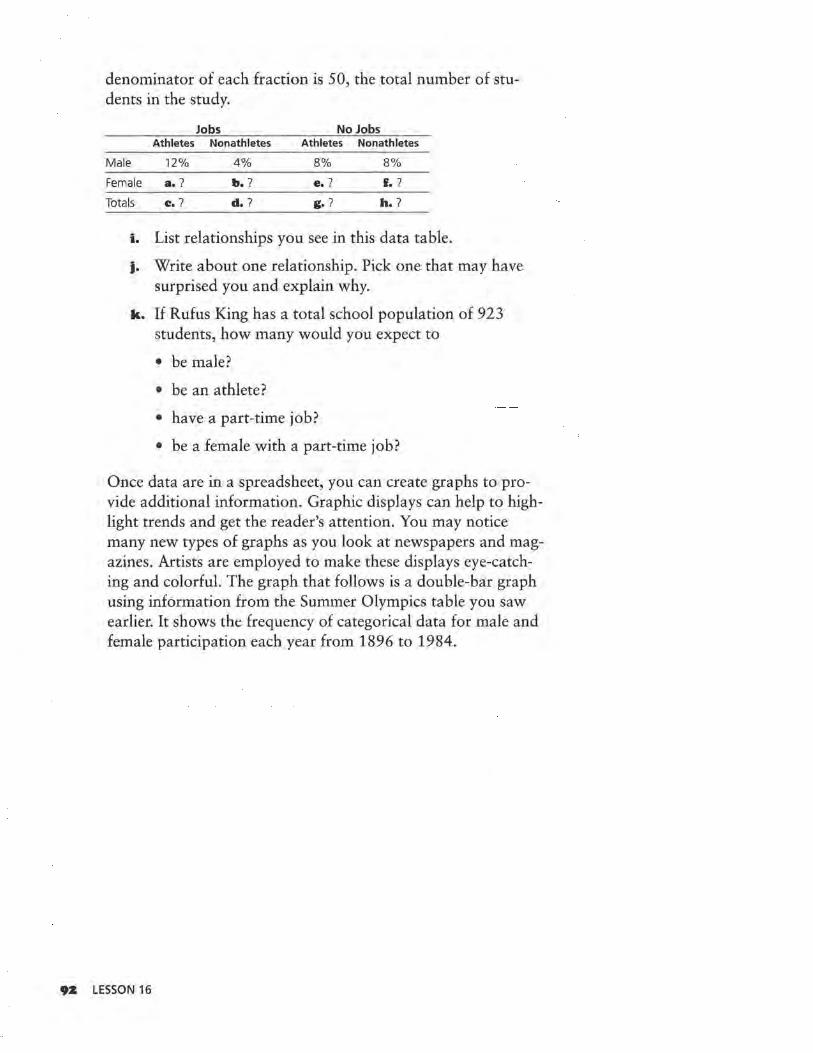
denominator of each fraction is 50, the total number of students in the study.
Jobs No Jobs Athletes Non athletes Athletes Non athletes
Male 12% 4% 8% 8%
Female a.? b. ? e.? f, ?
Totals e. 7 d.? g. ? h. ?
i. List relationships you see in this data table.
j. Write about one relationship. Pick one that may have surprised you and explain why.
k. If Rufus King has a total school population of 923 students, how many would you expect to
• be male?
• be an athlete?
• have a part-time job?
• be a female with a part-time job?
Once data are in a spreadsheet, you can create graphs to provide additional information. Graphic displays can help to highlight trends and get the reader's attention. You may notice many new types of graphs as you look at newspapers and magazines. Artists are employed to make these displays eye-catching and colorful. The graph that follows is a double-bar graph using information from the Summer Olympics table you saw earlier. It shows the frequency of categorical data for male and female participation each year from 1896 to 1984.
9Z LESSON 16
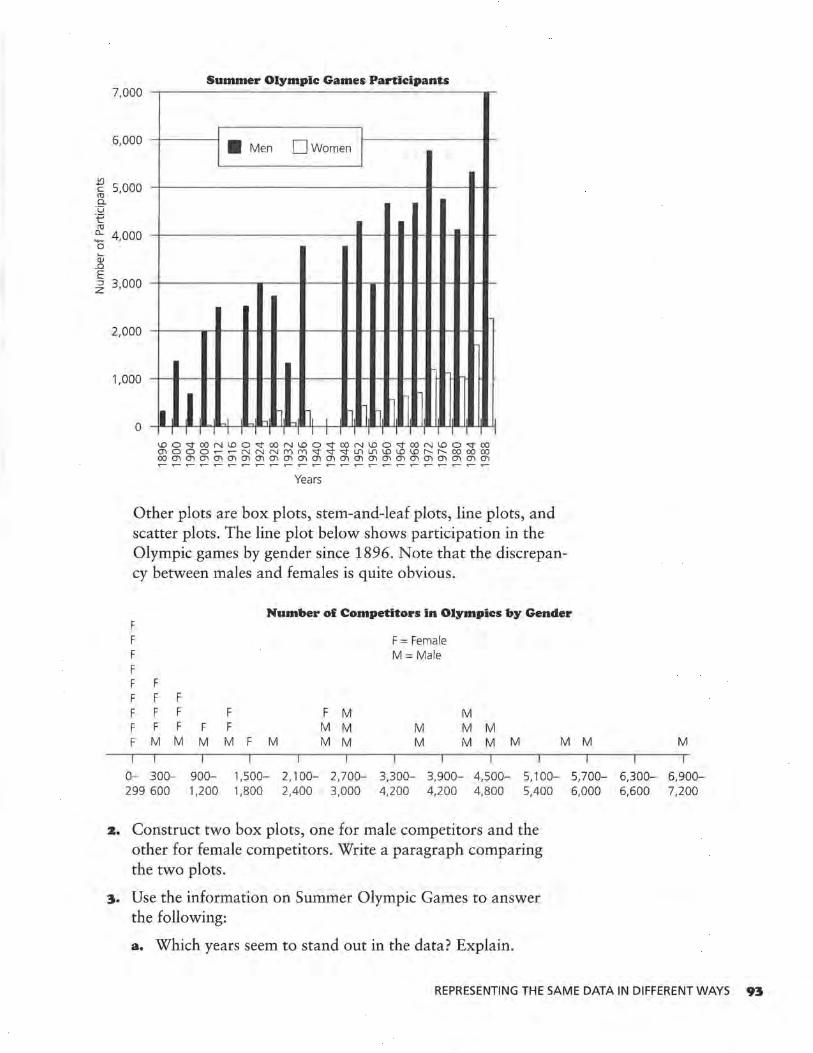
Summer Olympic Games Participants 7,000
6,000 •Men Owomen
ti fi5 5,000 0.. ·o ·-e ru !. 4,000 0 a;
_Q
E ~ 3,000
2,000
1,000
I I ~1 ~ n ~ n1 I n l n ~ ~ I I I I 0
Years
Other plots are box plots, stem-and-leaf plots, line plots, and scatter plots. The line plot below shows participation in the Olympic games by gender since 1896. Note that the discrepancy between males and females is quite obvious.
Number of Competitors in Olympics by Gender F F F =Female F M =Male F F F F F F
F F F F F M M F F F F F M M M M M F M M M M F M M M M M M M M M M
0- 300- 900- 1,500- 2,100- 2,700- 3,300- 3,900- 4,500- 5,100- 5,700- 6,300- 6,900-299 600 1,200 1,800 2,400 3,000 4,200 4,200 4,800 5,400 6,000 6,600 7 ,200
2. Construct two box plots, one for male competitors and the other for female competitors. Write a paragraph comparing the two plots.
3. Use the information on Summer Olympic Games to answer the following:
a. Which years seem to stand out in the data? Explain.
REPRESENTING THE SAME DATA IN DIFFERENT WAYS 93
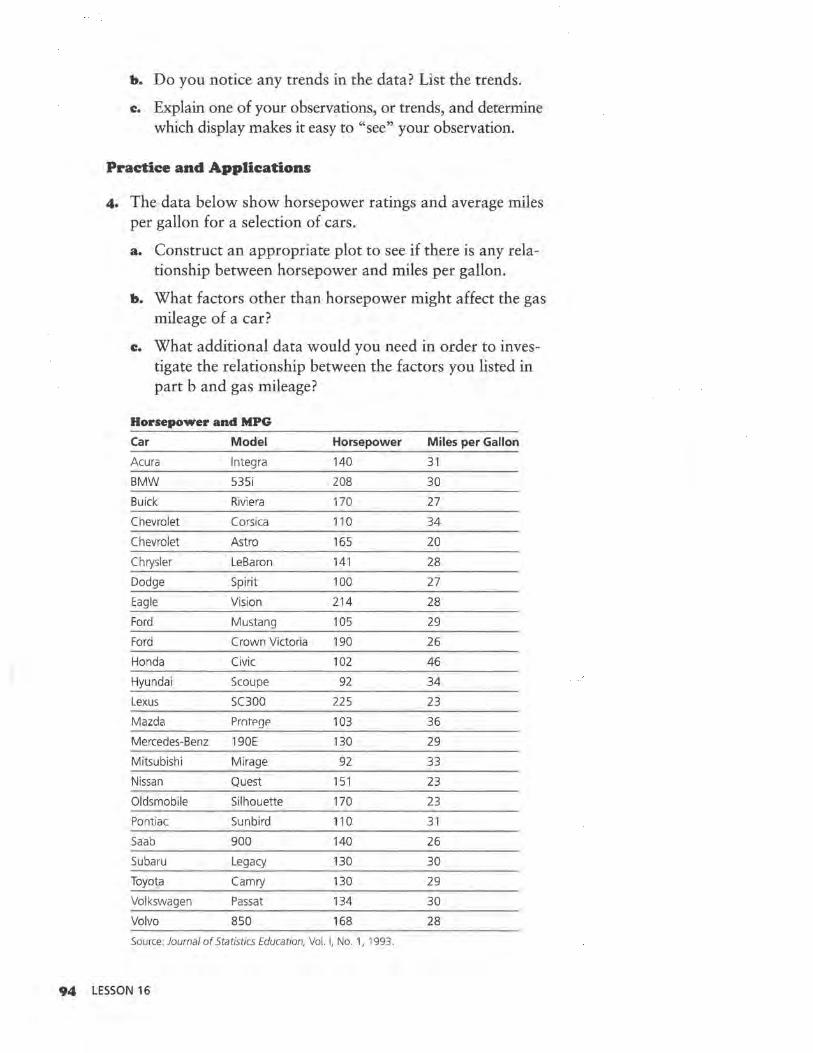
94
b. Do you notice any trends in the data? List the trends.
c. Explain one of your observations, or trends, and determine which display makes it easy to "see" your observation.
Practice and Applications
4. The data below show horsepower ratings and average miles per gallon for a selection of cars.
a. Construct an appropriate plot to see if there is any relationship between horsepower and miles per gallon.
b. What factors other than horsepower might affect the gas mileage of a car?
c. What additional data would you need in order to investigate the relationship between the factors you listed in part b and gas mileage?
Horsepower and MPG
Car Model Horsepower Miles per Gallon
Acura lntegra 140 31
BMW 535i 208 30
Buick Riviera 170 27
Chevrolet Corsica 110 34
Chevrolet Astra 165 20
Chrysler LeBaron 141 28
Dodge Spirit 100 27
Eagle Vision 214 28
Ford Mustang 105 29
Ford Crown Victoria 190 26
Honda Civic 102 46
Hyundai Scoupe 92 34
Lexus SC300 225 23
Mazda PrntP!JP 103 36
Mercedes-Benz 190E 130 29
Mitsubishi M irage 92 33
Nissan Quest 151 23
Oldsmobile Silhouette 170 23
Pontiac Sunbird 110 31
Saab 900 140 26
Subaru Legacy 130 30
Toyota Camry 130 29
Volkswagen Passat 134 30
Volvo 850 168 28
Source: Journal of Statistics Education, Vol. I, No. 1, 1993 .
LESSON 16
INFORMATION SHEET
Informing Others
How do you write a good report?
What should you say in your report?
How long should your report be?
W riting your project report does not begin after all the other work has been done. A good project report is
developed throughout the project. In her book Writing to Learn Mathematics, Joan Countryman uses a five-step process to analyze formal writing in mathematics.
Prewriting
In the early stages of writing, you are developing your own mind-set about the project. A journal, an activity log, and your team reports can be excellent ways to keep track of these early ideas about the project.
Drafting
As you move from developing these early ideas to a focus in your project, you can begin to produce early drafts of your report. These could include an outline of the report (just headings and brief phrases to explain the parts as necessary), rough sketches of graphs or layouts, or a concise statement of the problem and an outline of the procedures you plan to use in solving or investigating the problem. Again, a journal, a log, and team reports cari help you during this phase of the project.
Revising
This phase of the writing process is actually ongoing and overlapping with the next two steps. You need to develop an attitude that the written word is as easy to reflect on and revise as
INFORMING OTHERS 9S
the spoken word. Technology, that is, word processing, has helped develop that attitude in recent years. It is more difficult when you are doing your work by hand or by typewriter. In the case of your project, early revisions may have been major at first. You might have had three big ideas for your team's focus and then found that two of them really fizzled. Back to the drawing board! Find a new focus. Revising also includes checks on your progress-are you making progress toward your goals?
Later revisions may be more minor, restricted to changing words, changing labels on graphs, and so on.
Editing
This sounds like revising again, and it is. This time you are nearing completion of the project and are checking for big ideas that are important. As you read our draft copy, think about grammar, spelling, accuracy of displays, format of the pages, and the style points that will mean a high-quality report. The reader can be very easily distracted by errors in writing and might assume that such sloppiness carries over to the data collection itself.
Final Report
This is the final draft. You have read and reread. You have checked and double-checked everything to be sure totals match, graphs correspond, the conclusions are stated, and the sources of your data are well-documented. If you have a computer, save a final copy, lock the computer file, and make a backup disk. Print the report on your best paper with your best printer and turn in a professionally done, on-time report.
96 INFORMATION SHEET

9 781572 323971
ISBN 1-57232-397-3