Embed Size (px)
Citation preview
the increase in relative thickness of the plates when % is reduced the overall error of the system increases with frequency. In the centimeter range for IF1 = 0.05 the system error is 0.06-0.09, i.e., it exceeds the value of the measured quantity. In the meter band the val- ues of the errors are an order of magnitude less.
To reduce the error of the system one can try reducing the partial errors. However, the value of ~ corresponding to the error for the most accurate methods of measurement can hard- ly be reduced to any great extent. Consequently, the relatively large errors of a three- layer system are a serious limitation on their use as standards of small-reflection coeffi- cients.
LITERATURE CITED
i. A.M. Brekhovskikh, Waves in Layered Media [in Russian], AN'SSSR, Moscow (1957). 2. A.S. Zav'yalov, Design of Multilayer Optical Systems [in Russian], VUZ, Fizika, No. 4
(1972). 3. V.M. Belova et al., Tr. Sib. Nauch. Issled Inst. Metrol., No. 12 (1971). 4. B.E. Rabinovich, Vopr. Radioelektron. Radioizmer. Tekh., No. 4 (1961). 5. G.D. Burdun and B. N. Markov, Fundamentals of Metrology [in Russian], Standartov, Mos-
cow (1972).
ERROR OF MEASUREMENT FOR TELEVISION-CAMERA y
N. M. Zaitsev, Yu. N. Kozlov, and I. E. Ponomarenko UDC 621.397.331.2.088.001.24
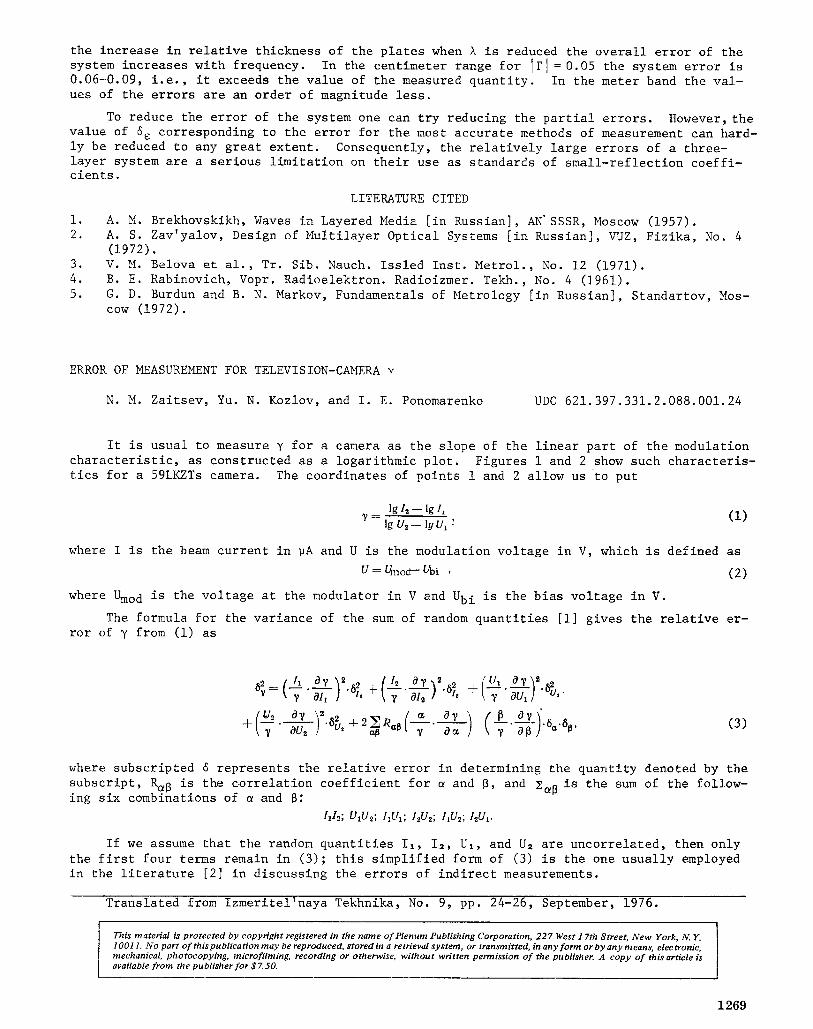
It is usual to measure y for a camera as the slope of the linear part of the modulation characteristic, as constructed as a logarithmic plot. Figures i and 2 show such characteris- tics for a 59LKZTs camera. The coordinates of points i and 2 allow us to put
lg 1~ - - lg 11 ,~ - ( 1 )
lg U~ - - ly Ua '
where I is the beam current in pA and U is the modulation voltage in V, which is defined as
U = Umod-- Ubi , (2)
where Umo d is the voltage at the modulator in V and Ubi is the bias voltage in V.
The formula for the variance of the sum of random quantities [I] gives the relative er- ror of y from (1) as
0 7 2 2 Z ~ 0 7 ~ 2 / U , 0~,~2 \ ~ aUl) ' "
d_(U2 O~ 2 2 ~ Oy \ v " a ~ ) " ~.o~, (3)
where subscripted 6 represents the relative error in determining the quantity denoted by the subscript, R~B is the correlation coefficient for a and B, and E~ is the sum of the follow- ing six combinations of a and B:
11~; U1U2; /1U1; I~U~; I1U~;I~U x.
If we assume that the random quantities 11, I=, UI, and U2 are uncorrelated, then only the first four terms remain in (3); this simplified form of (3) is the one usually employed in the literature [2] in discussing the errors of indirect measurements.
Translated from Izmeritel'naya Tekhnika, No. 9, pp. 24-26, September, 1976.
This material is protec ted by copyright registered in the name o f Plenum Publishing Corporation, 227 West 1 7th Street, N e w York, IV. Y. 10011. N o part o f t his publication may be reproduced, stored in a retrieval system, or transmitted, in any f o rm or by any means, electronic, mechanical, photocopying, microfilming, recording or otherwise, w i thou t writ ten permission o f the publisher. A copy o f this article is available f rom the publisher f o r $Z50 .
1 2 6 9
1000
:1 ' 4 yl / ' , l i:i
il dOl~ dO 50 100
4 V
Fig. I. Typical grid-modulation characteristics.
2 1070 I I I II
II I / ! l i l t
l ! 1/
2
I 00 #
I# # #
I I I I / I I / l l t1111
dO 50 U,V
i r ] / i i i l i l l I II I I I / I l l
I t
I
Ioo
Fig. 2. Typical cathode-modula- tion characteristics.
Provided that all R~B = 0, we have from (3) and (I) that
6~, : 0 . 4 3 s - - 3 : Us i " (4)
The beam current and modulator voltage should be measured with electrometer devices of class not less than 1.5 [3], and the readings should be made at 2/3 of full scale. This means that the coefficient of variation in measuring the beam current does not exceed • and we can put
61, = 612 = ! 4.5%. ( 5 )
I t i s r a t h e r more c o m p l i c a t e d t o d e t e r m i n e ~Uz and ~Us, s i n c e h e r e some c a r e i s needed a s r e g a r d s t h e r e l a t i v e e r r o r i n t h e d i f f e r e n c e o f two q u a n t i t i e s [ 4 ] .
We assume t h a t t h e e l e c t r o m e t e r d e v i c e t h a t m e a s u r e s t h e m o d u l a t o r v o l t a g e i s c h o s e n such t h a t Ubi i s m e a s u r e d w i t h an e r r o r o f n o t more t h a n 21.5%.
Then (2) g i v e s us t h a t f o r any Umo d t h e c o e f f i c i e n t o f v a r i a t i o n in m e a s u r i n g U d o e s n o t e x c e e d
8 U = ! 1.5.]/-~. IUbi ] %. (6) U
Calculations from (6) and Figs. I and 2 give
8U ~--+_ 16%, } 8U. .~ • (7)
For all the curves in Figs. 1 and 2, the ratios were 12/Iz = 25 and Us/Ux = 3, apart from the case Ubi= --50 V, in Fig. i, for which 12/Iz =15 and Us/Uz = 2.3 applies.
We therefore base our calculation on the values
Is 1 U~ Ig~=14: g~=04s (8)
We substitute (5), (7), and (8) into (4) to get
5 v = 4- 15.3%. (9)
1 2 7 0
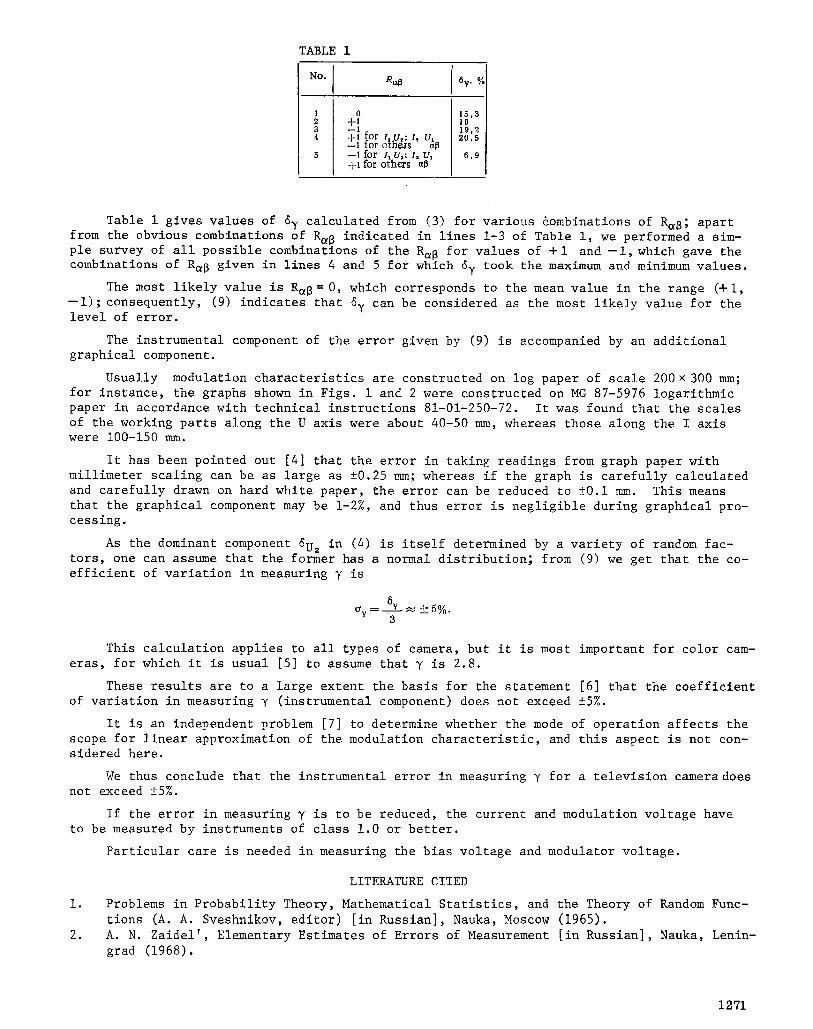
TABLE I
No. Ral3 5y, %
0 + i - I -}-~ foF I, u,; i , u, - - . for others ~1~ --1 f o r It U~; 12 U1 +1 for others a13
15 ,3 I0 19 ,2 2 0 , 5
6 , 9
Table 1 gives values of 6y calculated from (3) for various 6ombinations of R~8 ; apart from the obvious combinations of R~B indicated in lines 1-3 of Table i, we performed a sim- ple survey of all possible combinations of the R~B for values of + 1 and --i, which gave the combinations of R~6 given in lines 4 and 5 for which 6y took the maximum and minimum values.
The most likely value is RaB = 0, which corresponds to the mean value in the range (+ i, --i); consequently, (9) indicates that ~y can be considered as the most likely value for the level of error.
The instrumental component of the error given by (9) is accompanied by an additional graphical component.
Usually modulation characteristics are constructed on log paper of scale 200 x 300 mm; for instance, the graphs shown in Figs. 1 and 2 were constructed on MG 87-5976 logarithmic paper in accordance with technical instructions 81-01-250-72. It was found that the scales of the working parts along the U axis were about 40-50 mm, whereas those along the I axis were 100-150 mm.
It has been pointed out [4] that the error in taking readings from graph paper with millimeter scaling can be as large as • mm; whereas if the graph is carefully calculated and carefully drawn on hard white paper, the error can be reduced to • mm. This means that the graphical component may be 1-2%, and thus error is negligible during graphical pro- cessing.
As the dominant component ~U= in (4) is itself determined by a variety of random fac- tors, one can assume that the former has a normal distribution; from (9) we get that the co- efficient of variation in measuring y is
~v= .~+5%. 3
This calculation applies to all types of camera, but it is most important for color cam- eras, for which it is usual [5] to assume that y is 2.8.
These results are to a large extent the basis for the statement [6] that the coefficient of variation in measuring T (instrumental component) does not exceed •
It is an independent problem [7] to determine whether the mode of operation affects the scope for linear approximation of the modulation characteristic, and this aspect is not con- sidered here.
We thus conclude that the instrumental error in measuring T for a television camera does not exceed •
If the error in measuring y is to be reduced, the current and modulation voltage have to be measured by instruments of class 1.0 or better.
Particular care is needed in measuring the biasvoltage and modulator voltage.
1.
2.
LITERATURE CITED
Problems in Probability Theory, Mathematical Statistics, and the Theory of Random Func- tions (A. A. Sveshnikov, editor) [in Russian], Nauka, Moscow (1965). A. N. Zaidel', Elementary Estimates of Errors of Measurement [in Russian], Nauka, Lenin- grad (1968).
1271
3,
4.
5.
6. 7.
GOST 17103-- 71, "Electron-beam tubes. Methods ~f measuring electrical characteristics and light output" (1971). E. P. Yakovlev, Mathematical Processing of Measurement Data [in Russian], GITTL, Moscow (1953). GOST 19432-- 74, "Color television: basic parameters of a television-broadcasting sys- tem" (1974). GOST 21059.3-- 75, "Cameras for color television: methods of determining y" (1975). Cited in: The Electronics Industry [in Russian], No. 9, TsNII~lektronika, Moscow (1975).
APPLICATION OF COMPUTATIONAL TABLES AND COMPUTERS
TO MONITOR MEASURING MEANS
M. E. Balashov, V. P. Vasil'ev, A. M. Fedorov, and N. A. Fedorova
UDC 681.2.089.6:681.3
The number of studies on monitoring measurement means is sharply increasing at the pres- ent time. This problem has been traditionally solved by increasing the number of testing lab- oratories and the number of laboratory personnel, which is inefficient. Great efficiency can be obtained by increasing labor productivity in testing activity. For this purpose it is necessary to determine the optimal number of testing actions; establish the most efficient sequence in which they may be performed; apply the most efficient standard measurement means; automate the computer operations on which measurement results are processed and compiled; and efficiently organize the workplace for the tester. Most of these conditions must be deter- mined as early as the stage at which standard specifications for methods and tools used to monitor measuring means are developed.
Analysis of the standards and operating instructions for testing methods and tools in the field of electrical measurements at low to superhigh frequencies has demonstrated that the available ways in which the efficiency of the testing actions could be increased have as yet not been taken advantage of sufficiently. Small and large computers which could substan- tially increase the efficiency of testing actions are not being used. This is confirmed by the example presented below illustrating the use of a computer to monitor standard ASO-3M at- tenuators, which are widely used to monitor attenuation and voltage measuring means [1-4].
Voltage must be measured twice -- at the input Uo and output U i of the device -- for dif- ferent values of the applied attenuation in accordance with the technical specifications for methods and means of monitoring ASO-3M attenuators, in order to determine their dc error; the actual attenuation is then given by
1 Ui 4 = 20 g - ~ o (dB).
Voltage at the attenuator input should be maintained constant at 1.5 V for convenience in the calculations and also to ensure that the measurements will have the required preci- sion. Next, it is necessary to determine the error A i of the attenuator by the formula
A i = Arati-- A i ,
where Ara t i is the rated attenuation for a given attenuator level.
It is quite cumbersome and exhausting to calculate attenuator error from these equations, and this often results in computational errors. Therefore, the testing laboratory for radio engineering measurements of the D. I. Mendeleev All-Union Scientific-Research Metrological Institute compiled special auxiliary tables by means of a single computer computation of all possible values of Ui, making allowance for the acceptable attenuator errors, in order to
Translated from Izmeritel'naya Tekhnika, No. 9, p. 26, September, 1976.
This material is protected by copyright registered in the name o f Plenum Publishing Corporation, 227 West 17th ~treet, New York, N. Y. 10011. No part o f this publication may be reproduced, stored in a retrieval system, or transmitted, in any form or by any means, electronic, mechanical, photocopying, microfilming, recording or otherwise, wi thout written permission o f the publisher. A copy o f this article is availatlle from the publisher for $ Z 50.
1272