Embed Size (px)
Citation preview
ERM-6 Risk Integration, Aggregation, and Correlation
Robert F. Wolf, FCAS, MAAAPrincipal, William M. Mercer Inc./MMC Enterprise Risk Consulting
Copies of Presentation Available at www.casact.org
MMC Enterprise Risk 2
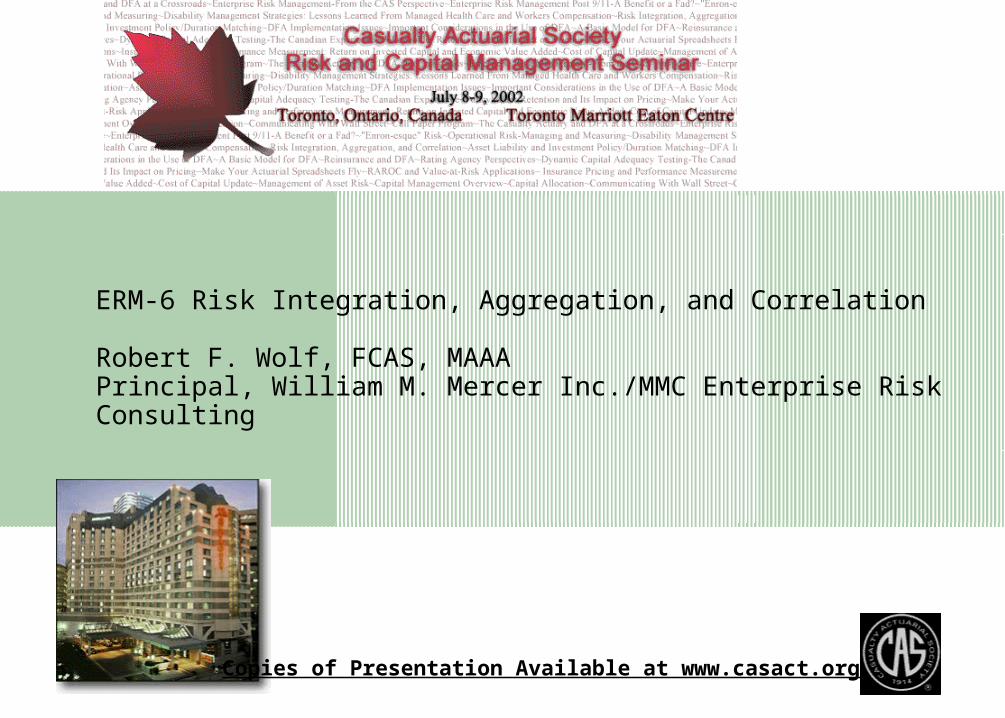
Correlation
What is Correlation?
– Two variables tending to move in the same direction e.g Commercial Building Fires and Employee Injuries
When Risk is Managed in Silos, a potential domino effect can be missed
1998 Mercer Management Consulting, Inc. Study
– Reasons for Major Stock Price Declines from Fortune 1000 Companies over a 5 year period
Often Multiples Reasons Seldom a Single Cause Unanticipated Correlated Impacts
MMC Enterprise Risk 3
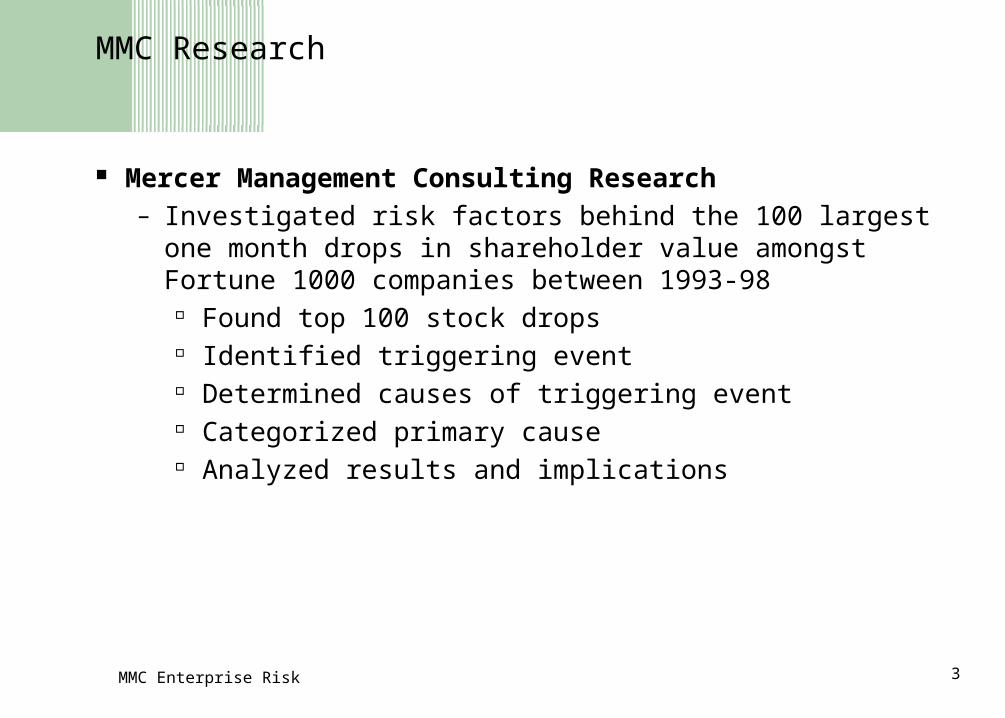
MMC Research
Mercer Management Consulting Research– Investigated risk factors behind the 100 largest one month drops in
shareholder value amongst Fortune 1000 companies between 1993-98
Found top 100 stock drops Identified triggering event Determined causes of triggering event Categorized primary cause Analyzed results and implications
MMC Enterprise Risk 4
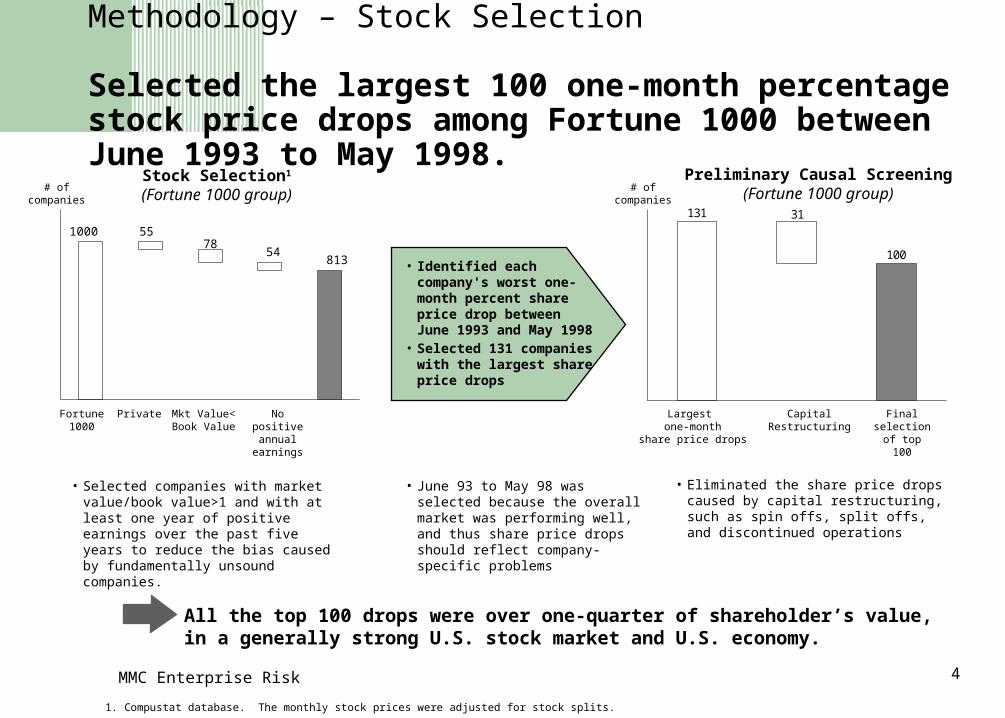
Methodology – Stock Selection
Selected the largest 100 one-month percentage stock price drops among Fortune 1000 between June 1993 to May 1998.
1. Compustat database. The monthly stock prices were adjusted for stock splits.
100
31131
Largest one-month
share price drops
Capital Restructuring
• Identified each company's worst one-month percent share price drop between June 1993 and May 1998
• Selected 131 companies with the largest share price drops
Stock Selection1
(Fortune 1000 group)Preliminary Causal Screening
(Fortune 1000 group)
• Selected companies with market value/book value>1 and with at least one year of positive earnings over the past five years to reduce the bias caused by fundamentally unsound companies.
• Eliminated the share price drops caused by capital restructuring, such as spin offs, split offs, and discontinued operations
Fortune1000
Mkt Value<Book Value
Private No positiveannual
earnings
1000 5578
54813
Final selection of
top 100
# of companies
# of companies
All the top 100 drops were over one-quarter of shareholder’s value, in a generally strong U.S. stock market and U.S. economy.
• June 93 to May 98 was selected because the overall market was performing well, and thus share price drops should reflect company-specific problems
MMC Enterprise Risk 5
2
5
13
24
53
100
202
392
674
0 100 200 300 400 500 600 700 800
-50%
-45%
-40%
-35%
-30%
-25%
-20%
-15%
-10%
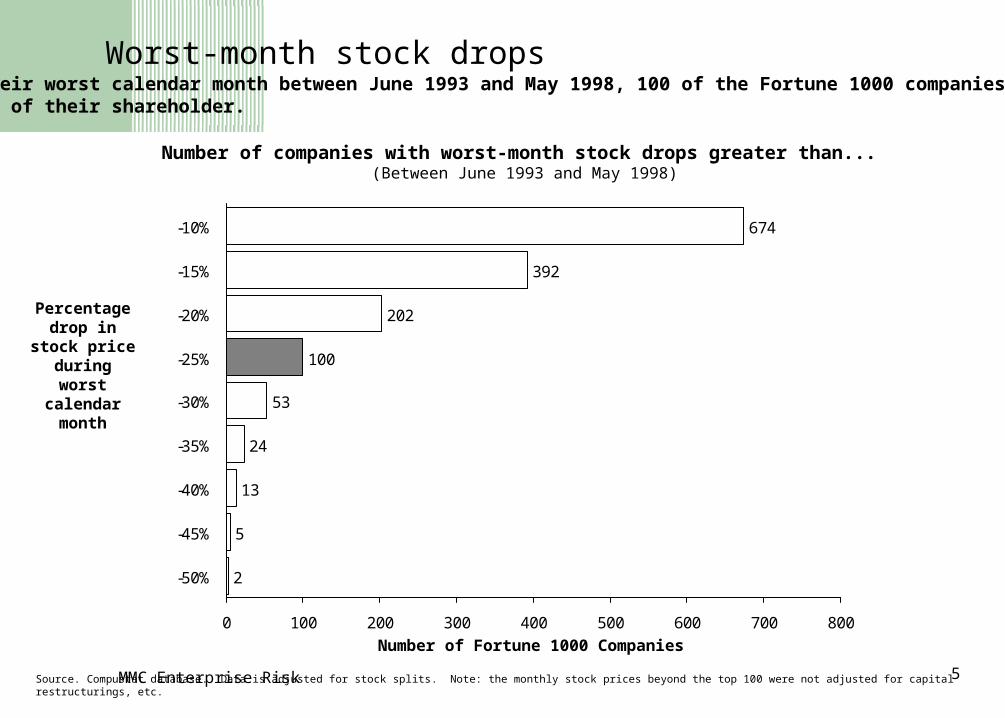
Worst-month stock drops
Percentage drop in stock price during
worst calendar month
Number of Fortune 1000 Companies
Number of companies with worst-month stock drops greater than... (Between June 1993 and May 1998)
Source. Compustat database. Data is adjusted for stock splits. Note: the monthly stock prices beyond the top 100 were not adjusted for capital restructurings, etc.
During their worst calendar month between June 1993 and May 1998, 100 of the Fortune 1000 companies lost over 25% of their shareholder.
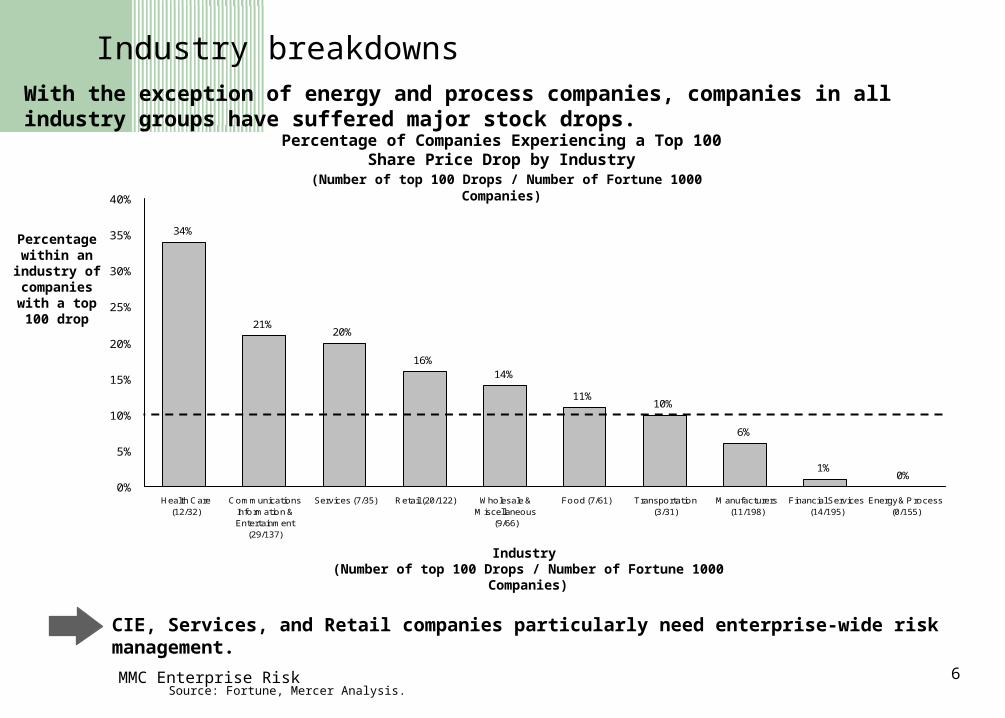
MMC Enterprise Risk 6Source: Fortune, Mercer Analysis.
Industry breakdowns
34%
21%20%
16%14%
11%10%
6%
1%0%
0%
5%
10%
15%
20%
25%
30%
35%
40%
Health Care(12/32)
CommunicationsInformation &Entertainment
(29/137)
Services (7/35) Retail (20/122) Wholesale &Miscellaneous
(9/66)
Food (7/61) Transportation(3/31)
Manufacturers(11/198)
Financial Services(14/195)
Energy & P rocess(0/155)
Percentage of Companies Experiencing a Top 100 Share Price Drop by Industry
(Number of top 100 Drops / Number of Fortune 1000 Companies)
Industry (Number of top 100 Drops / Number of Fortune 1000 Companies)
CIE, Services, and Retail companies particularly need enterprise-wide risk management.
Percentage within an
industry of companies
with a top 100 drop
With the exception of energy and process companies, companies in all industry groups have suffered major stock drops.
MMC Enterprise Risk 7
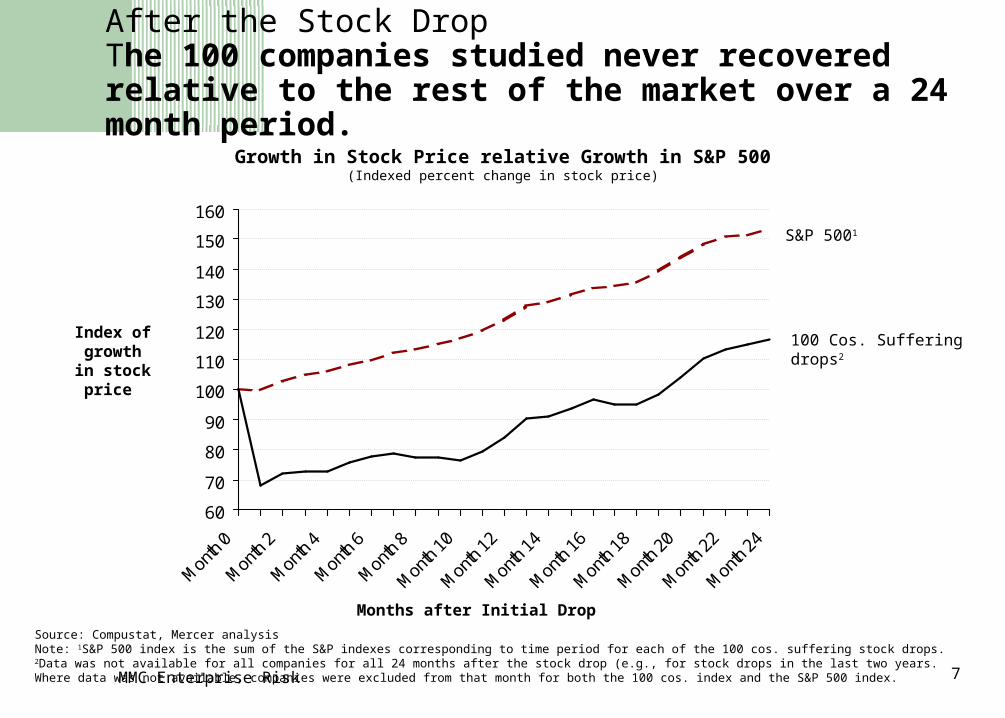
After the Stock DropThe 100 companies studied never recovered relative to the rest of the market over a 24 month period.
60
70
80
90
100
110
120
130
140
150
160
Source: Compustat, Mercer analysisNote: 1S&P 500 index is the sum of the S&P indexes corresponding to time period for each of the 100 cos. suffering stock drops.2Data was not available for all companies for all 24 months after the stock drop (e.g., for stock drops in the last two years. Where data was not available, companies were excluded from that month for both the 100 cos. index and the S&P 500 index.
Index of growth in
stock price
Months after Initial Drop
Growth in Stock Price relative Growth in S&P 500(Indexed percent change in stock price)
S&P 5001
100 Cos. Suffering drops2
MMC Enterprise Risk 8
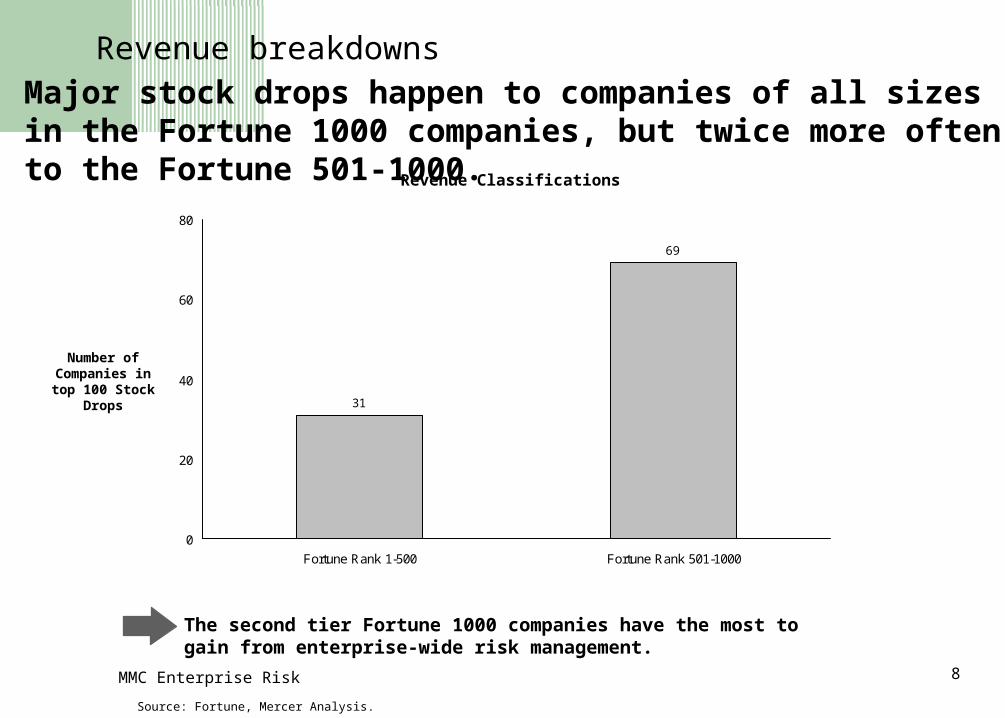
Revenue breakdowns
Revenue Classifications
Number of Companies in top 100 Stock
Drops 31
69
0
20
40
60
80
Fortune Rank 1-500 Fortune Rank 501-1000
Source: Fortune, Mercer Analysis.
The second tier Fortune 1000 companies have the most to gain from enterprise-wide risk management.
Major stock drops happen to companies of all sizes in the Fortune 1000 companies, but twice more often to the Fortune 501-1000.
MMC Enterprise Risk 9
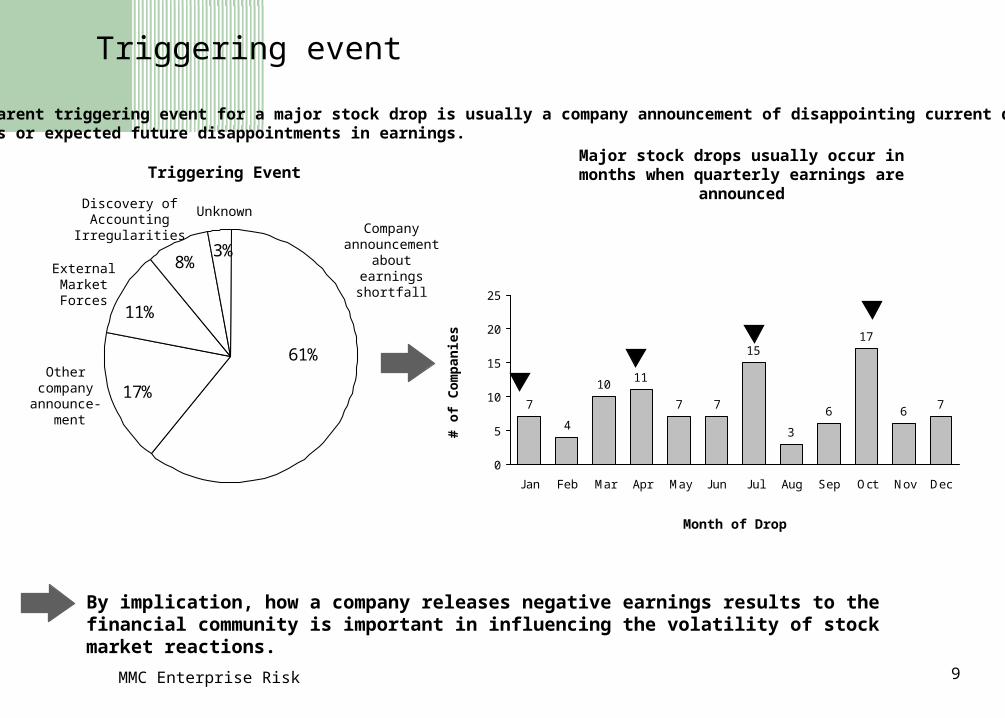
Triggering event
3%8%
11%
17%
61%
Triggering Event
Company announcement about earnings
shortfall
7
4
11
7 7
15
3
6
17
67
10
0
5
10
15
20
25
Jan Feb Mar Apr May Jun Jul Aug Sep Oct Nov Dec
Major stock drops usually occur in months when quarterly earnings are announced
Month of Drop
# o
f C
om
pan
ies
By implication, how a company releases negative earnings results to the financial community is important in influencing the volatility of stock market reactions.
Other company
announce- ment
Discovery of Accounting Irregularities
Unknown
External Market Forces
the apparent triggering event for a major stock drop is usually a company announcement of disappointing current quarter earnings or expected future disappointments in earnings.
MMC Enterprise Risk 10
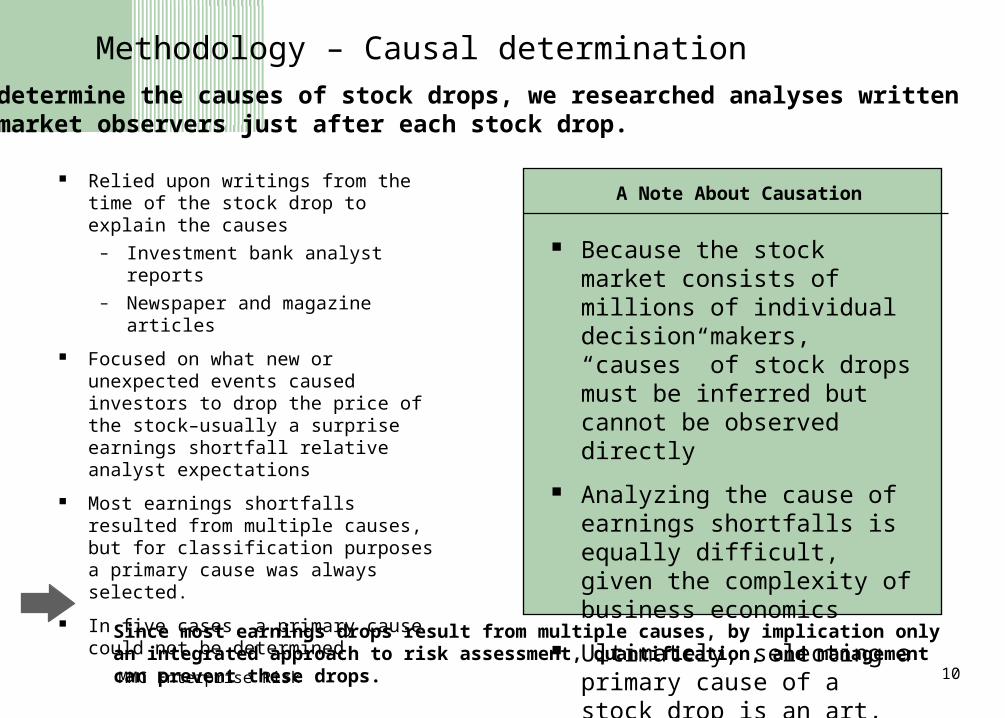
Methodology – Causal determination
Relied upon writings from the time of the stock drop to explain the causes
– Investment bank analyst reports
– Newspaper and magazine articles
Focused on what new or unexpected events caused investors to drop the price of the stock–usually a surprise earnings shortfall relative analyst expectations
Most earnings shortfalls resulted from multiple causes, but for classification purposes a primary cause was always selected.
In five cases, a primary cause could not be determined
Since most earnings drops result from multiple causes, by implication only an integrated approach to risk assessment, quantification, and management can prevent these drops.
Because the stock market consists of millions of individual decision makers, “causes” of stock drops must be inferred but cannot be observed directly
Analyzing the cause of earnings shortfalls is equally difficult, given the complexity of business economics
Ultimately, selecting a primary cause of a stock drop is an art, not a science
A Note About Causation
To determine the causes of stock drops, we researched analyses written by market observers just after each stock drop.
MMC Enterprise Risk 11
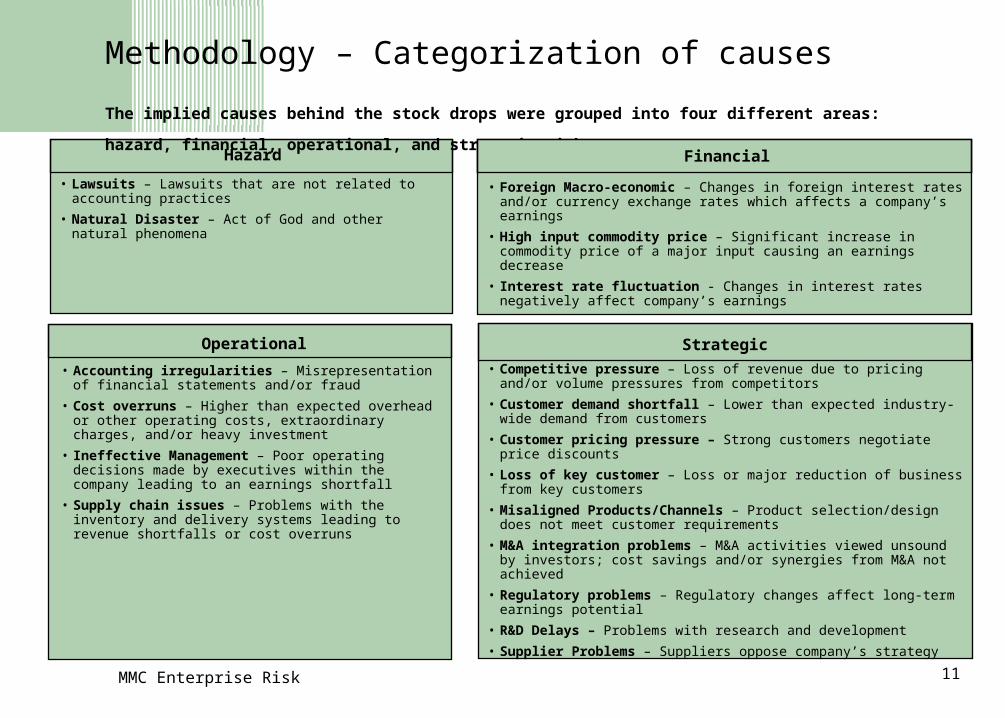
Methodology – Categorization of causes
The implied causes behind the stock drops were grouped into four different areas: hazard,
financial, operational, and strategic risks. • Lawsuits – Lawsuits that are not related to accounting
practices
• Natural Disaster – Act of God and other natural phenomena
Hazard
• Accounting irregularities – Misrepresentation of financial statements and/or fraud
• Cost overruns – Higher than expected overhead or other operating costs, extraordinary charges, and/or heavy investment
• Ineffective Management – Poor operating decisions made by executives within the company leading to an earnings shortfall
• Supply chain issues – Problems with the inventory and delivery systems leading to revenue shortfalls or cost overruns
• Foreign Macro-economic – Changes in foreign interest rates and/or currency exchange rates which affects a company’s earnings
• High input commodity price – Significant increase in commodity price of a major input causing an earnings decrease
• Interest rate fluctuation - Changes in interest rates negatively affect company’s earnings
• Competitive pressure – Loss of revenue due to pricing and/or volume pressures from competitors
• Customer demand shortfall – Lower than expected industry-wide demand from customers
• Customer pricing pressure – Strong customers negotiate price discounts
• Loss of key customer – Loss or major reduction of business from key customers
• Misaligned Products/Channels – Product selection/design does not meet customer requirements
• M&A integration problems – M&A activities viewed unsound by investors; cost savings and/or synergies from M&A not achieved
• Regulatory problems – Regulatory changes affect long-term earnings potential
• R&D Delays – Problems with research and development
• Supplier Problems – Suppliers oppose company’s strategy
Financial
Operational Strategic
MMC Enterprise Risk 12
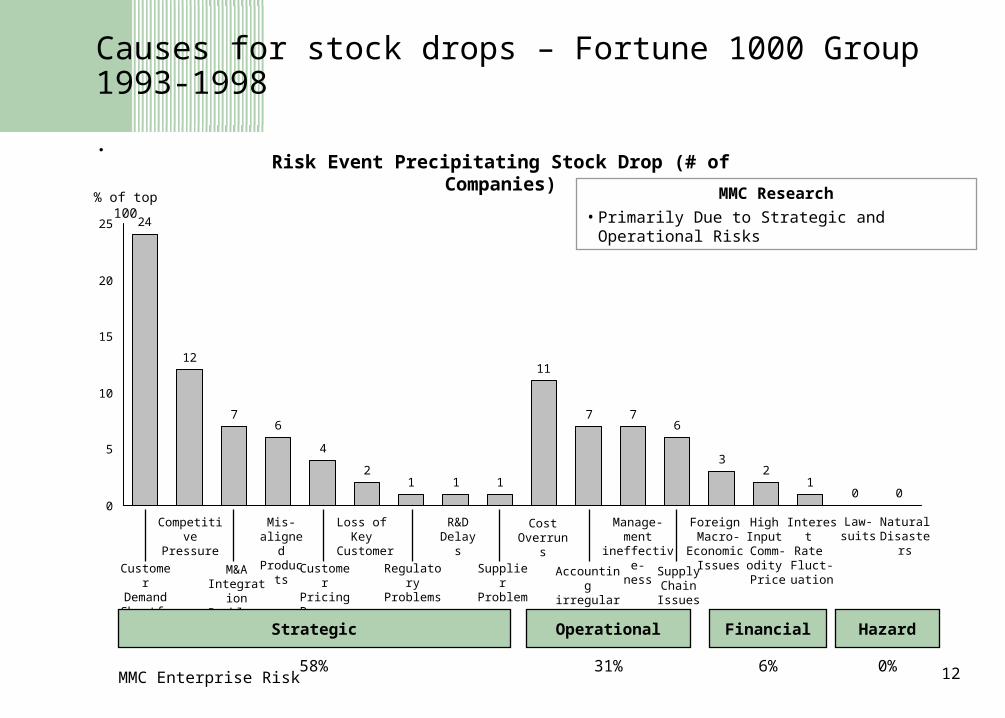
Causes for stock drops – Fortune 1000 Group1993-1998
.
24
12
76
4
21 1 1
11
7 76
32
10 0
0
5
10
15
20
25
Cost Overruns
Accounting irregularities
Manage-ment
ineffective-ness Supply
Chain Issues
Competitive Pressure
M&A Integration Problems
Mis-aligned
Products
Customer Pricing
Pressure
Loss of Key
Customer
Supplier Problems
R&D Delays
Customer Demand Shortfall
% of top 100
Regulatory Problems
MMC Research
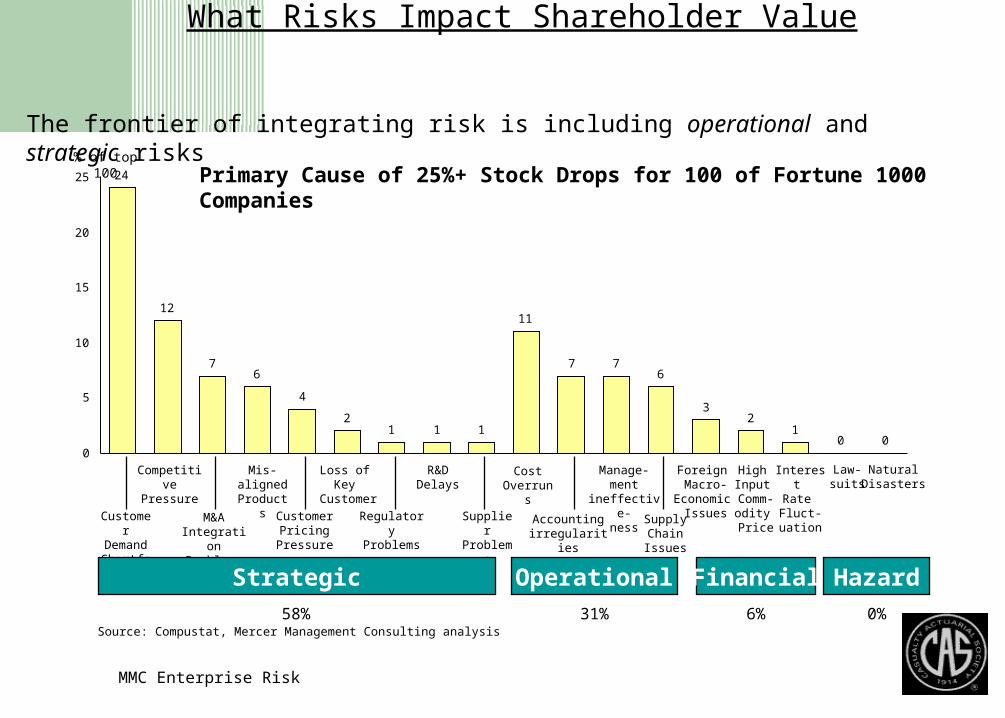
• Primarily Due to Strategic and Operational Risks
Strategic Operational Financial Hazard
Foreign Macro-
Economic Issues
Interest Rate Fluct-uation
High Input
Comm-odity Price
Law-suits
Natural Disasters
58% 31% 6% 0%
Risk Event Precipitating Stock Drop (# of Companies)
MMC Enterprise Risk 13
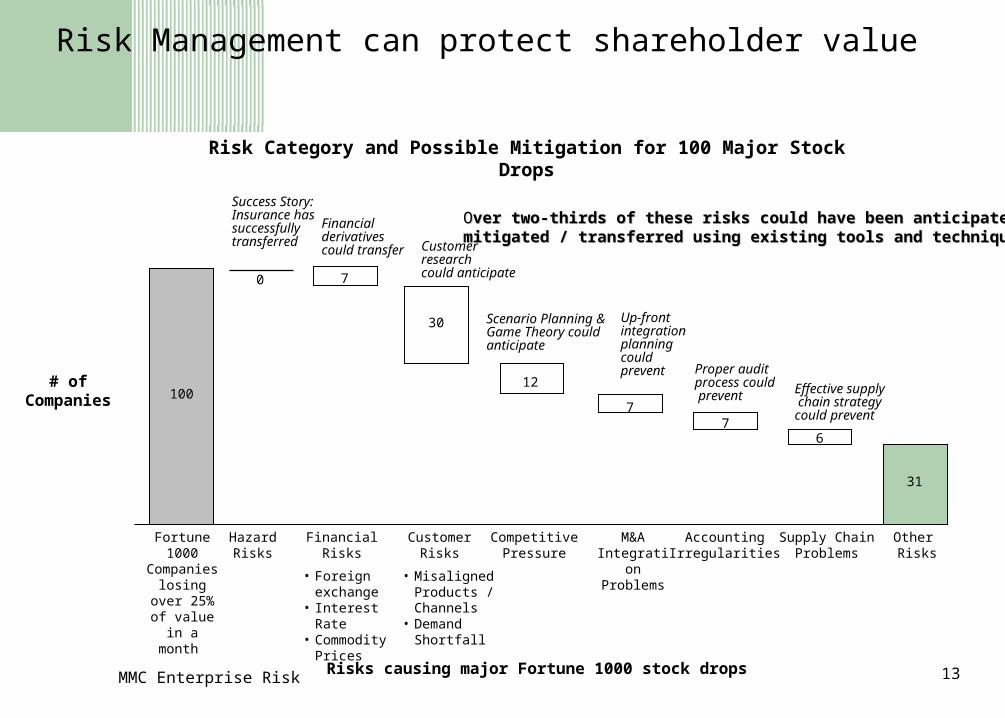
Risk Management can protect shareholder value
31
100
6
7
77
Fortune 1000
Companies losing over
25% of value in a
month
Financial Risks
M&A Integration Problems
AccountingIrregularities
Supply ChainProblems
Other Risks
# of Companies
Risk Category and Possible Mitigation for 100 Major Stock Drops
30
12
Customer Risks
CompetitivePressure
Financialderivativescould transfer Customer
research could anticipate
Scenario Planning & Game Theory could anticipate
Up-front integration planning could prevent Proper audit
process could prevent Effective supply
chain strategy could prevent
Hazard Risks
0
Success Story: Insurance has successfully transferred
Risks causing major Fortune 1000 stock drops
• Foreign exchange
• Interest Rate• Commodity
Prices
• MisalignedProducts / Channels
• Demand Shortfall
OOver two-thirds of these risks could have been anticipated and ver two-thirds of these risks could have been anticipated and mitigated / transferred using existing tools and techniques.mitigated / transferred using existing tools and techniques.
MMC Enterprise Risk 14
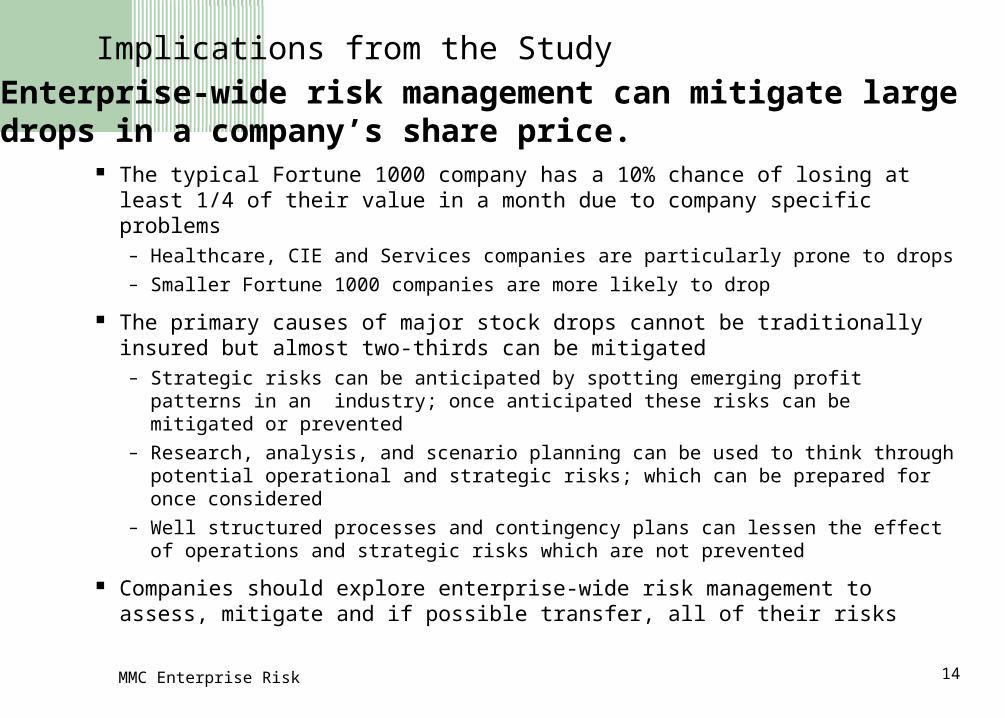
Implications from the Study
The typical Fortune 1000 company has a 10% chance of losing at least 1/4 of their value in a month due to company specific problems– Healthcare, CIE and Services companies are particularly prone to drops
– Smaller Fortune 1000 companies are more likely to drop
The primary causes of major stock drops cannot be traditionally insured but almost two-thirds can be mitigated– Strategic risks can be anticipated by spotting emerging profit patterns in an
industry; once anticipated these risks can be mitigated or prevented
– Research, analysis, and scenario planning can be used to think through potential operational and strategic risks; which can be prepared for once considered
– Well structured processes and contingency plans can lessen the effect of operations and strategic risks which are not prevented
Companies should explore enterprise-wide risk management to assess, mitigate and if possible transfer, all of their risks
Enterprise-wide risk management can mitigate large drops in a company’s share price.
MMC Enterprise Risk 15
XYZ Company
Exposed to many insurable risks
– Substantial Annual Costs Deductible or Retained Losses Insurance Premiums Collateral Costs
Goal- Optimal Insurance Structure
Actuary can be a valuable resource in bridging the communications gap between the risk manager and the CEO/CFO/Treasurer
MMC Enterprise Risk 16
Example: ABC Airlines
Rise in Jet Fuel Deemed to correlate and causative with certain events
– Increases Expense Raising Fares
– Bonuses Cut for Employees
– Stock Price Drops
– Fewer Passenger Miles
– Decreased Maintenance Expense
– Decreased Advertising
– Employees Layoffs
– Workers Compensation Costs Up
– Lower Levels of Space Needed
– Prices Fall on Rental Space
MMC Enterprise Risk 17
Consider Correlated Events not Causative to Jet Fuel
– Rise in Jet Fuel Correlated with cost of Oil and Natural Gas
Strategy
– Purchase a Call Option on Crude Oil
– Sell Calls on the Stock
– Negotiate for future aircraft when prices are at their highest
– variable contract with advertisers
– Workers Compensation Retention Inversely Related to Fuel Prices
– Tie Lease Negotiations to Fuel Prices
MMC Enterprise Risk 18
Challenges
Difficulty in Measuring Correlation
– Attempts to isolate relationships between variables such that historical relationships will continue into the future
Corporate Constraints to Integrating Risk
– Budgets Drive Corporate Behavior
– Trading Mentality
– Not particularly concerned with things that haven’t happened recently
– Static Inertia
– Risk Manager still seen as insurance buyer
MMC Enterprise Risk 19
Bridge in Organizational Communication-Speak same Language
How much capacity does XYZ Corp have to bear risk?
Within the above capacity, how desirable is it for XYZ Corp to retain/bear additional risk?
XYZ not in the business to just merely survive, but rather to thrive
MMC Enterprise Risk 20
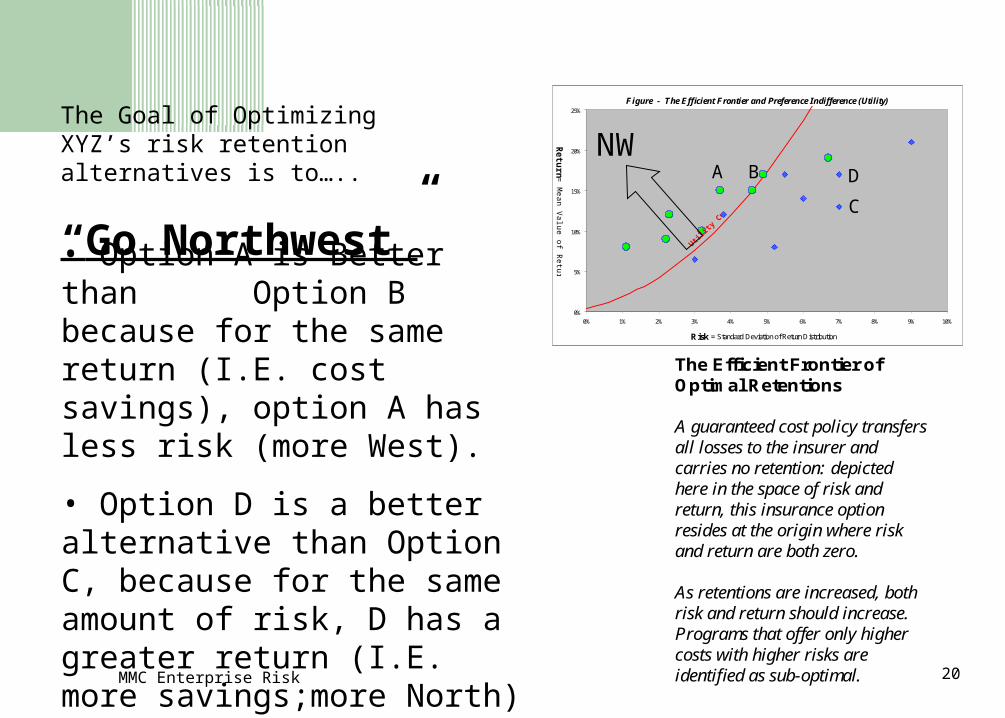
The Goal of Optimizing XYZ’s risk retention alternatives is to…..
“Go Northwest”
Figure - The Efficient Frontier and Preference Indifference (Utility)
0%
5%
10%
15%
20%
25%
0% 1% 2% 3% 4% 5% 6% 7% 8% 9% 10%
Risk = Standard Deviation of Return Distribution
Retu
rn = M
ean Value of R
eturn Distribution
The Efficient Frontier ofOptimal Retentions
A guaranteed cost policy transfersall losses to the insurer andcarries no retention: depictedhere in the space of risk andreturn, this insurance optionresides at the origin where riskand return are both zero.
As retentions are increased, bothrisk and return should increase.Programs that offer only highercosts with higher risks areidentified as sub-optimal.
NWA B
C
D
• Option A is Better than Option B because for the same return (I.E. cost savings), option A has less risk (more West).
• Option D is a better alternative than Option C, because for the same amount of risk, D has a greater return (I.E. more savings;more North)
MMC Enterprise Risk 21
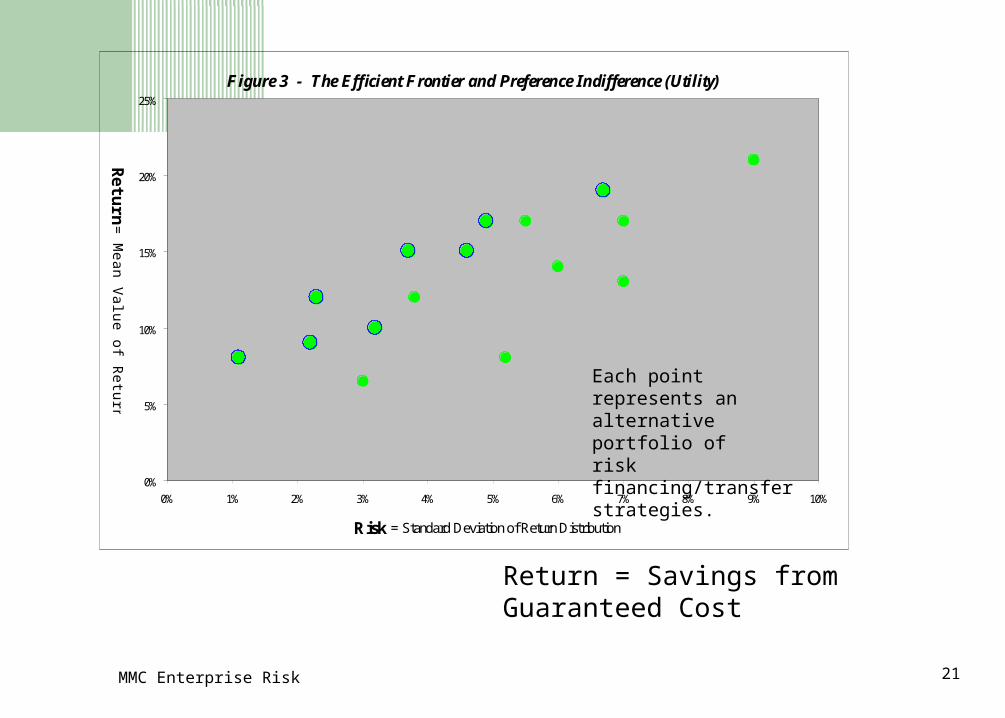
Figure 3 - The Efficient Frontier and Preference Indifference (Utility)
0%
5%
10%
15%
20%
25%
0% 1% 2% 3% 4% 5% 6% 7% 8% 9% 10%
Risk = Standard Deviation of Return Distribution
Retu
rn =
Mean V
alue of Return D
istribution
Each point represents an alternative portfolio of risk financing/transfer strategies.
Return = Savings from Guaranteed Cost
MMC Enterprise Risk 22
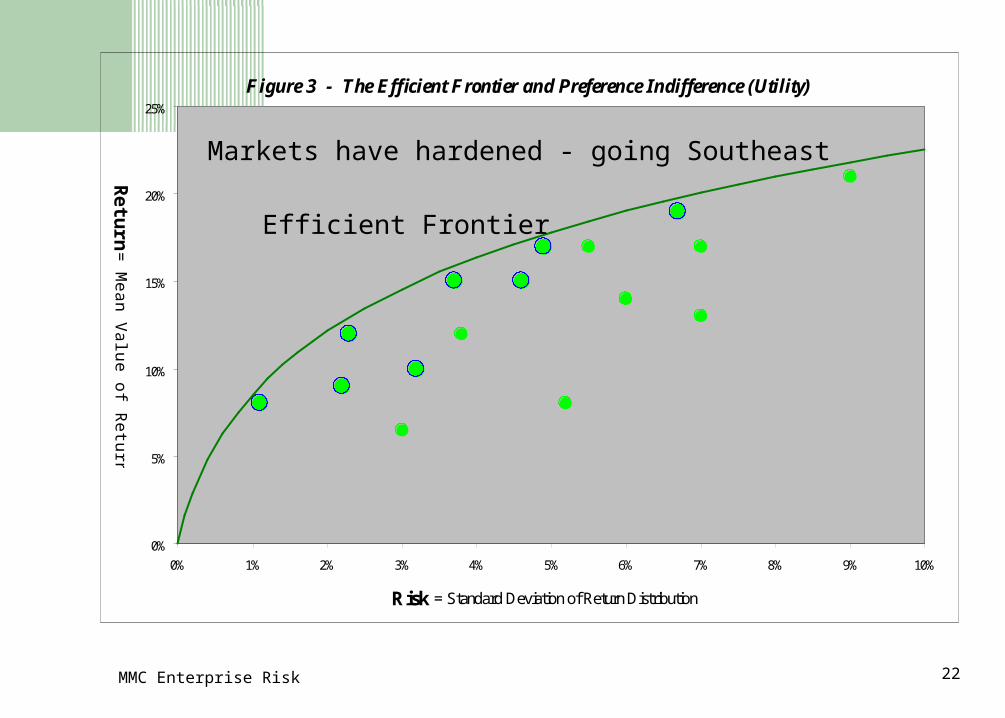
Figure 3 - The Efficient Frontier and Preference Indifference (Utility)
0%
5%
10%
15%
20%
25%
0% 1% 2% 3% 4% 5% 6% 7% 8% 9% 10%
Risk = Standard Deviation of Return Distribution
Retu
rn =
Mean V
alue of Return D
istribution
Efficient Frontier
Markets have hardened - going Southeast
MMC Enterprise Risk 23
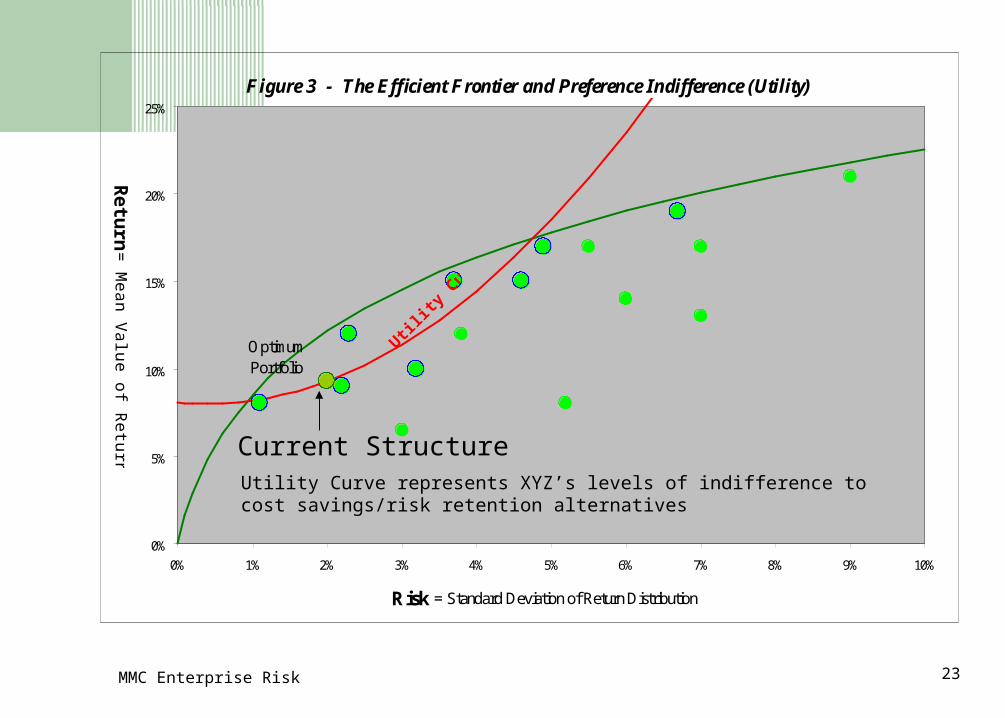
Figure 3 - The Efficient Frontier and Preference Indifference (Utility)
Optimum Portfolio
Utility
Curv
e
0%
5%
10%
15%
20%
25%
0% 1% 2% 3% 4% 5% 6% 7% 8% 9% 10%
Risk = Standard Deviation of Return Distribution
Retu
rn =
Mean V
alue of Return D
istribution
Utility Curve represents XYZ’s levels of indifference to cost savings/risk retention alternatives
Current Structure
MMC Enterprise Risk 24
Two Questions
Does the benefit of reduced costs given additional risk enhance or destroy XYZ’s shareholder value?
Does the benefit of reduced costs given the additional risk increase or destroy shareholder value?
In theory, shareholder value is enhanced if the Risk Adjusted Return on additional (marginal) capital at risk (by raising retention) exceeds XYZ’s marginal cost of capital.
MMC Enterprise Risk 25
When retaining risk, XYZ is notionally committing capital at risk. When viewed this way, the insurance and or risk-financing decision is essentially equated to an investment decision, and hence, the goal of the retention decision becomes maximizing return while minimizing risk.
MMC Enterprise Risk 26
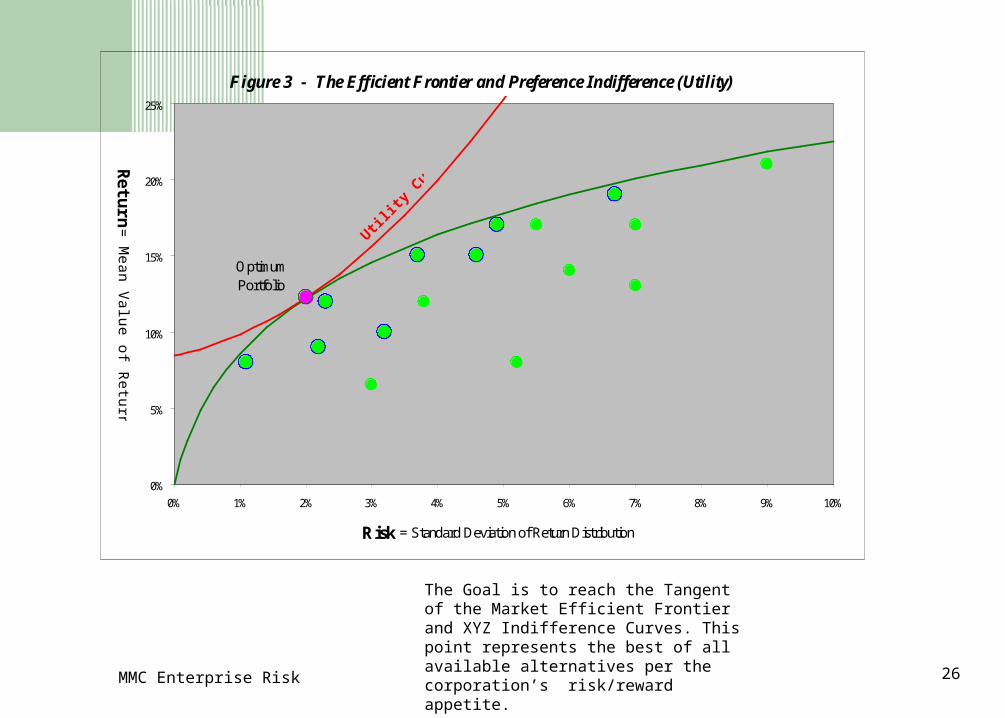
Figure 3 - The Efficient Frontier and Preference Indifference (Utility)
Optimum Portfolio
Utility
Curv
e
0%
5%
10%
15%
20%
25%
0% 1% 2% 3% 4% 5% 6% 7% 8% 9% 10%
Risk = Standard Deviation of Return Distribution
Retu
rn =
Mean V
alue of Return D
istribution
The Goal is to reach the Tangent of the Market Efficient Frontier and XYZ Indifference Curves. This point represents the best of all available alternatives per the corporation’s risk/reward appetite.
MMC Enterprise Risk 27
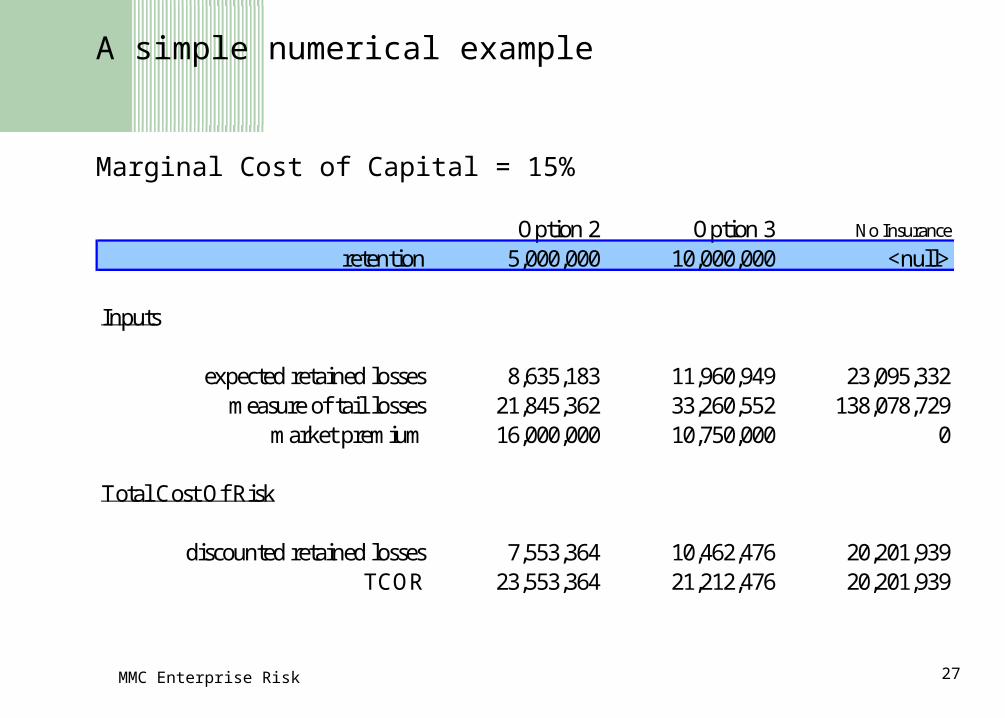
A simple numerical example
Marginal Cost of Capital = 15%
Option 2 Option 3 No Insurance
retention 5,000,000 10,000,000 <null>
Inputs
expected retained losses 8,635,183 11,960,949 23,095,332measure of tail losses 21,845,362 33,260,552 138,078,729
market premium 16,000,000 10,750,000 0
Total Cost Of Risk
discounted retained losses 7,553,364 10,462,476 20,201,939TCOR 23,553,364 21,212,476 20,201,939
MMC Enterprise Risk 28
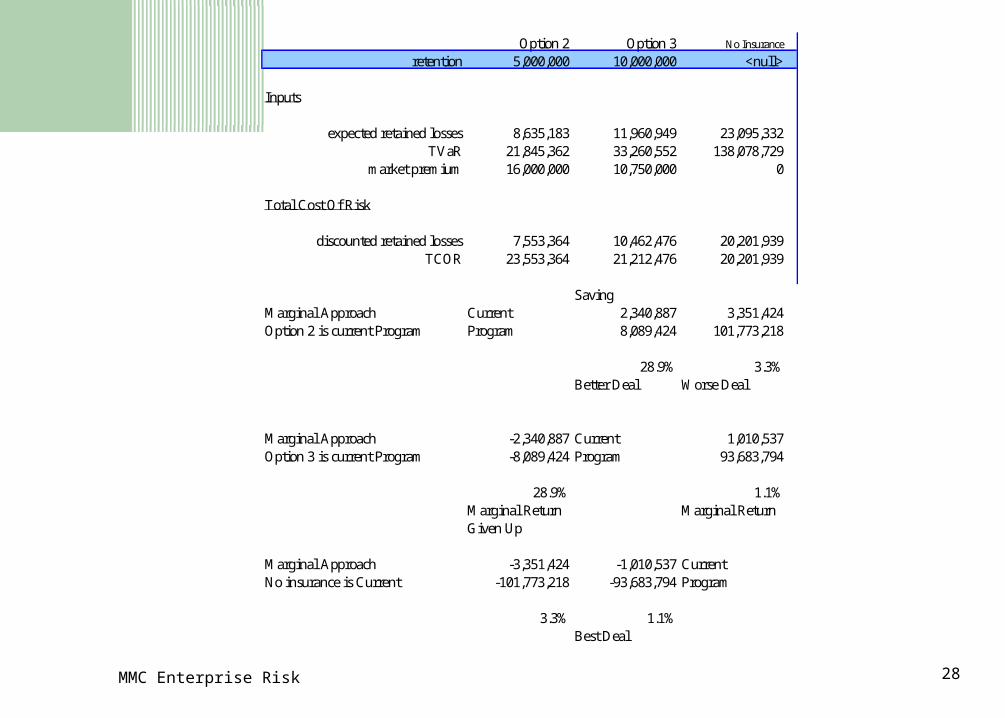
Option 2 Option 3 No Insurance
retention 5,000,000 10,000,000 <null>
Inputs
expected retained losses 8,635,183 11,960,949 23,095,332TVaR 21,845,362 33,260,552 138,078,729
market premium 16,000,000 10,750,000 0
Total Cost Of Risk
discounted retained losses 7,553,364 10,462,476 20,201,939TCOR 23,553,364 21,212,476 20,201,939
SavingMarginal Approach Current 2,340,887 3,351,424Option 2 is current Program Program 8,089,424 101,773,218
28.9% 3.3%Better Deal Worse Deal
Marginal Approach -2,340,887 Current 1,010,537Option 3 is current Program -8,089,424 Program 93,683,794
28.9% 1.1%Marginal Return Marginal ReturnGiven Up
Marginal Approach -3,351,424 -1,010,537 CurrentNo insurance is Current -101,773,218 -93,683,794 Program
3.3% 1.1%Best Deal
MMC Enterprise Risk 29
The frontier of integrating risk is including operational and strategic risks
24
12
76
4
21 1 1
11
7 76
32
10 0
0
5
10
15
20
25
Cost Overruns
Accounting irregularities
Manage-ment
ineffective-ness Supply
Chain Issues
Competitive Pressure
M&A Integration Problems
Mis-aligned
Products
Customer Pricing
Pressure
Loss of Key
Customer
Supplier Problems
R&D Delays
Customer Demand Shortfall
% of top 100
Regulatory Problems
Strategic Operational Financial Hazard
Foreign Macro-
Economic Issues
Interest Rate Fluct-uation
High Input
Comm-odity Price
Law-suits
Natural Disasters
58% 31% 6% 0%
Primary Cause of 25%+ Stock Drops for 100 of Fortune 1000 Companies
Source: Compustat, Mercer Management Consulting analysis
What Risks Impact Shareholder Value
MMC Enterprise Risk 30
“….We don’t do things because they are easy. We do them because they are hard.”
….John F. Kennedy
…….Significant Opportunities Casualty Actuaries in servingas the bridge between hazard and operational/strategic risks.