Embed Size (px)
Citation preview
Jeffrey J. Scott, FCAS, MAAAWilliam Hansen, FCAS, MAAAColumbus, Ohio
Oliver Wyman Actuarial Consulting, Inc.
May 28, 2008
Experience Rating Plan—OBWC Education Session
www.oliverwyman.com

1© 2008 Oliver Wyman www.oliverwyman.com
IntroductionExperience Rating Plan Fundamentals
Classification Prospective Credibility
Stability Marketability
Equity

2© 2008 Oliver Wyman www.oliverwyman.com
Contents
1. Objectives 3
2. Comparison of Experience Rating Plans 5
3. Performance Measures 8
4. Split Plan Summary Results 10
5. Impact of Past Credibility Changes 17
6. True Premium Cost 24
7. Impact Mitigation Strategies 27
8. Recap 35

Objectives of this Session

4© 2008 Oliver Wyman www.oliverwyman.com
Objectives
High level review of experience rating plan types and of experience rating plan performance measures
Understand the impact of both future experience rating plan changes being considered as well as past changes to the plan
Understand the options for mitigating premium volatility

Comparison of Experience Rating Plans
6© 2008 Oliver Wyman www.oliverwyman.com
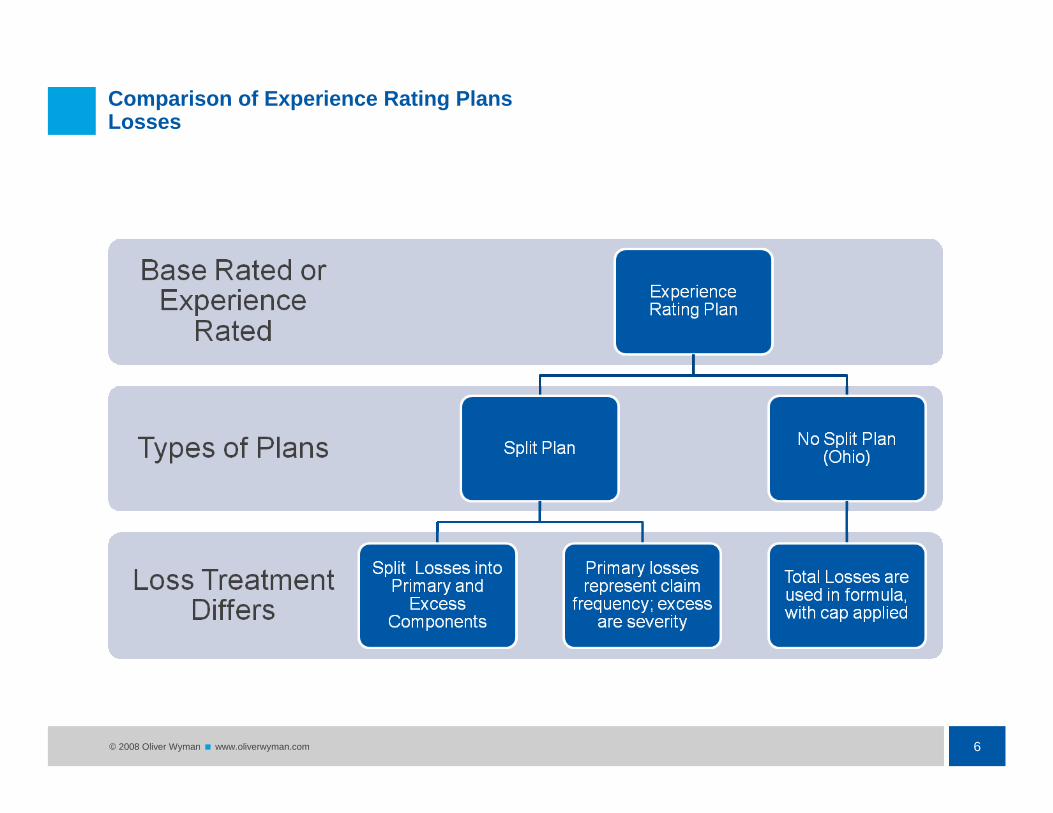
Comparison of Experience Rating PlansLosses

7© 2008 Oliver Wyman www.oliverwyman.com
Comparison of Experience Rating PlansCredibility

Performance Measures
9© 2008 Oliver Wyman www.oliverwyman.com
Performance MeasuresLoss Ratio Equity
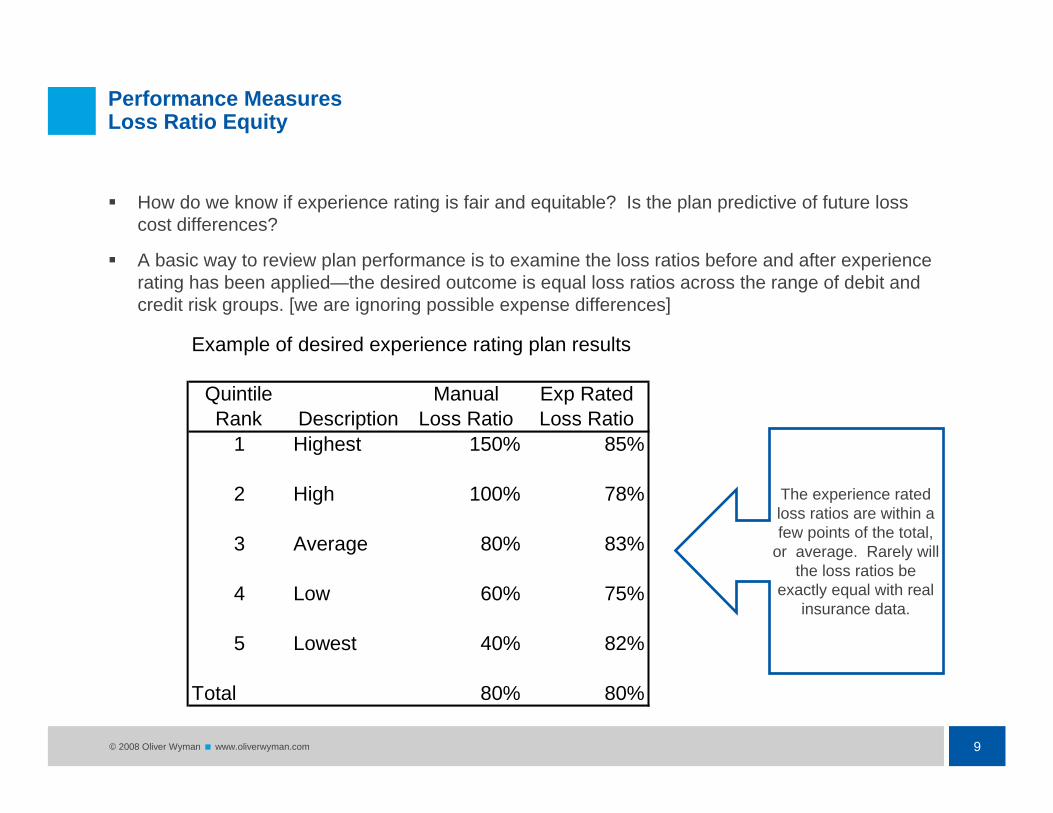
How do we know if experience rating is fair and equitable? Is the plan predictive of future loss cost differences?
A basic way to review plan performance is to examine the loss ratios before and after experience rating has been applied—the desired outcome is equal loss ratios across the range of debit and credit risk groups. [we are ignoring possible expense differences]
Example of desired experience rating plan results
Quintile Rank Description
Manual Loss Ratio
Exp Rated Loss Ratio
1 Highest 150% 85%
2 High 100% 78%
3 Average 80% 83%
4 Low 60% 75%
5 Lowest 40% 82%
Total 80% 80%
The experience rated loss ratios are within a few points of the total,
or average. Rarely will the loss ratios be
exactly equal with real insurance data.

Split Plan Summary Results

11© 2008 Oliver Wyman www.oliverwyman.com
Split Plan Summary ResultsPlan Defined

12© 2008 Oliver Wyman www.oliverwyman.com
Split Plan Summary Results$10,000 Split Point
Loss Ratios by Group Status
Policy Year 2003 Policy Year 2004 Policy Year 2005Policy Status Current Plan 10N Current Plan 10N Current Plan 10N
Group 145.1% 89.0% 131.7% 77.8% 117.7% 75.7%Non Group 63.8% 79.7% 53.4% 67.7% 56.1% 69.2%Base Rated 80.2% 106.8% 73.7% 90.0% 83.0% 96.1%Total 87.5% 87.5% 75.0% 75.0% 75.5% 75.5%
The loss ratios of Group and Non Group segments move towards the average
(total) with this split plan scenario
13© 2008 Oliver Wyman www.oliverwyman.com
Split Plan Summary Results$10,000 Split Point
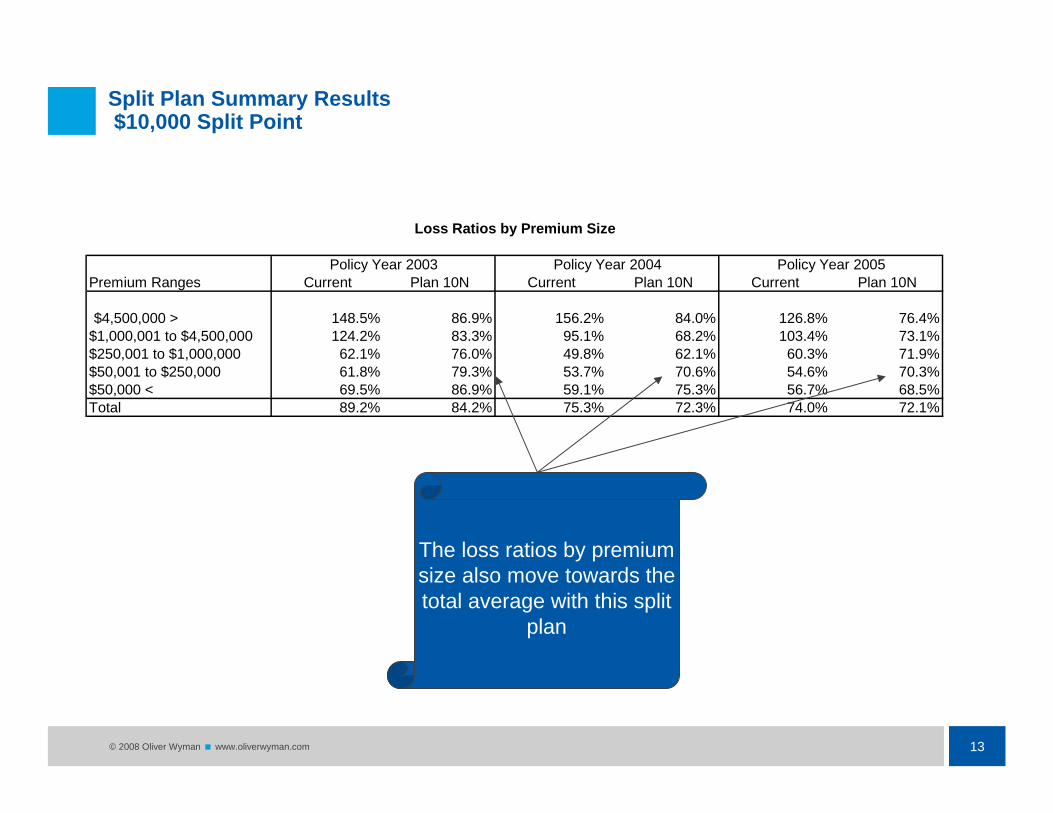
Loss Ratios by Premium Size
Policy Year 2003 Policy Year 2004 Policy Year 2005Premium Ranges Current Plan 10N Current Plan 10N Current Plan 10N
$4,500,000 > 148.5% 86.9% 156.2% 84.0% 126.8% 76.4%$1,000,001 to $4,500,000 124.2% 83.3% 95.1% 68.2% 103.4% 73.1%$250,001 to $1,000,000 62.1% 76.0% 49.8% 62.1% 60.3% 71.9%$50,001 to $250,000 61.8% 79.3% 53.7% 70.6% 54.6% 70.3%$50,000 < 69.5% 86.9% 59.1% 75.3% 56.7% 68.5%Total 89.2% 84.2% 75.3% 72.3% 74.0% 72.1%
The loss ratios by premium size also move towards the total average with this split
plan

14© 2008 Oliver Wyman www.oliverwyman.com
Split Plan Summary Results$10,000 Split Point
Quintile Current Plan 10N Current Plan 10N Current Plan 10N Current Plan 10N Current Plan 10N
1 420.2% 74.6% 378.1% 87.8% 91.2% 71.9% 57.3% 64.6% 47.6% 62.1%2 276.9% 97.9% 166.1% 75.3% 58.9% 65.6% 57.9% 78.2% 54.3% 74.0%3 230.3% 88.9% 115.6% 77.7% 57.0% 70.6% 58.4% 56.7% 49.4% 57.8%4 104.7% 77.0% 86.1% 70.8% 44.9% 64.1% 42.7% 73.8% 58.9% 63.1%5 59.3% 61.0% 58.5% 59.8% 60.7% 83.3% 57.4% 75.5% 64.6% 82.3%
Test Statistic 30.73 0.66 53.60 0.61 0.49 0.07 0.18 0.16 0.13 0.11
Less than $50,000
Experience Rated Loss Ratios by Size and Quintile--Policy Year 2005
Greater than $4,500,000 $1,000,001 to $4,500,000 $250,001 to $1,000,000 $50,001 to $250,000
•As demonstrated on slide 9, the equity in the rating plan is improved with the new split plan, as the loss ratios are much more similar across the quintile segments.
•The test statistic is a formal measure of performance:
•A measure above 1.00 means the experience rating plan is making results worse, or less equitable
•A measure below 1.00 means the experience rating plan is predictive of higher costs, improving equity
•In all cases a lower measure is better

15© 2008 Oliver Wyman www.oliverwyman.com
Split Plan Summary Results$10,000 Split Point
•The test statistic is a formal measure of performance:
•A measure above 1.00 means the experience rating plan is making results worse, or less equitable
•A measure below 1.00 means the experience rating plan is predictive of higher costs, improving equity
•In all cases a lower measure is better
Experience Rated Loss Ratios by Size and Quintile--Policy Year 2004
Greater than $4,500,000 $1,000,001 to $4,500,000 $250,001 to $1,000,000 $50,001 to $250,000 Less than $50,000 Quintile Current Plan 10N Current Plan 10N Current Plan 10N Current Plan 10N Current Plan 10N
1 513.6% 104.3% 392.8% 85.0% 72.5% 54.3% 54.7% 65.2% 45.0% 47.7%2 477.6% 90.2% 144.6% 72.9% 42.0% 54.3% 57.7% 72.8% 43.1% 86.3%3 180.8% 92.9% 93.3% 68.9% 53.7% 54.0% 49.0% 68.7% 55.3% 69.7%4 95.6% 68.7% 75.9% 60.3% 42.8% 74.5% 51.4% 67.9% 56.0% 75.1%5 74.3% 67.4% 57.5% 60.9% 47.5% 68.4% 55.6% 75.5% 76.8% 87.4%
Test Statistic 64.17 0.96 67.82 0.51 0.44 0.14 0.05 0.04 0.28 0.22

16© 2008 Oliver Wyman www.oliverwyman.com
Split Plan Summary Results$10,000 Split Point
•The test statistic is a formal measure of performance:
•A measure above 1.00 means the experience rating plan is making results worse, or less equitable
•A measure below 1.00 means the experience rating plan is predictive of higher costs, improving equity
•In all cases a lower measure is better
Experience Rated Loss Ratios by Size and Quintile--Policy Year 2003
Greater than $4,500,000 $1,000,001 to $4,500,000 $250,001 to $1,000,000 $50,001 to $250,000 Less than $50,000 Quintile Current Plan 10N Current Plan 10N Current Plan 10N Current Plan 10N Current Plan 10N
1 639.6% 113.0% 467.0% 92.3% 92.0% 74.2% 61.1% 63.7% 55.5% 60.5%2 421.4% 119.1% 197.4% 91.9% 56.5% 74.6% 62.1% 86.8% 41.6% 71.1%3 185.5% 101.9% 128.9% 81.7% 55.2% 68.1% 61.2% 70.4% 80.2% 100.9%4 105.3% 84.2% 100.9% 77.3% 70.4% 77.3% 58.0% 76.7% 67.1% 82.0%5 74.3% 69.6% 76.4% 78.6% 51.0% 82.7% 64.9% 90.7% 82.6% 97.5%
Test Statistic 135.61 2.34 32.13 0.13 0.79 0.04 0.02 0.13 0.40 0.19

Impact of Past Credibility Changes

18© 2008 Oliver Wyman www.oliverwyman.com
Impact of Past Credibility ChangesGroup rating and credibility
A confluence of credibility issues
The past and present credibility tables give too much weight to the loss history of large risks, with large defined as expected losses of roughly 250k and higher
The OBWC has not had regular updates to the credibility table to recognize inflation indexing
Effective July 2008 the credibility is 85% for expected losses of $1M; other states with comparable benefit levels have a credibility of roughly 50% at $1M
The maximum credibility level also defines the maximum experience rating credit: a large risk or large group with minimal losses can receive an experience mod of 0.15, or an 85% credit
Experience rating is revenue neutral, meaning no additional dollars should be gained or lost after all debits and credits are applied (in practice there is always a slight impact)
Qualifies for the same level of credibility as a large employer, even though a group does not statistically resemble a large employer
Qualifies for higher credibility and therefore higher credits or debits from experience rating
Loss experience stays with the risk, but not with the group, allowing for adverse selection
All loss experience stays with the employer over time for experience rating purposes
Heterogeneous—risks may come from the same industry group, but represent many different classes
Homogeneity-Represented by a few manual classes, typically having one large primary class
Risk profile changes can be significant as members are dropped and added
Constancy—has a risk profile that does not change much over time
GroupLarge Employer

19© 2008 Oliver Wyman www.oliverwyman.com
Impact of Past Credibility ChangesBase rate off balance adjustment
The combination of excessive credibility for large risks and rules allowing groups to be rated as large risks has resulted in a significant rate imbalance within the OBWC rating plan.
In the follow series of tables, we show the progression of how the premium imbalance evolves from the current group rating rules and the interaction with experience rating credibility
This first table shows the full indicated premium for class ‘123’, as determined by the ratemaking process:
ClassPayroll [in millions]
Base Rate [per $100]
Experience Modification
Premium[in millions]
123 $90.0 $2.0 1.00 $1.8
The next table is an example of introducing experience rating within the class, where the overall premiums are in balance:
ClassPayroll [in millions]
Base Rate [per $100]
Experience Modification
Premium[in millions]
123 $30.0 $2.0 1.25 $0.8123 $30.0 $2.0 1.00 $0.6123 $30.0 $2.0 0.75 $0.5
Total $1.8

20© 2008 Oliver Wyman www.oliverwyman.com
Impact of Past Credibility ChangesBase rate off balance adjustment
When we introduce a group program, there is financial incentive to move to a group with the promise of discounted premiums. In this example, $60 million of the $90 million of payroll moved to group with an EM of 0.35, or a credit of 65%.
By adding group membership the premium decreased to $1.07 million from $1.80 million for the class, however there is not a commensurate decrease in loss costs. From a rating perspective the credibility is much higher for those who joined group, but from a statistical perspective the credibility did not increase as much as the current plan allows. In addition, group membership changes each year as determined by the four year experience rating history, further biasing the experience rating data and diminishing the credibility of the groups.
ClassPayroll [in millions]
Base Rate [per $100]
Experience Modification
Premium[in millions]
123 $15.0 $2.0 1.25 $0.38123 $10.0 $2.0 1.00 $0.20123 $5.0 $2.0 0.75 $0.08123 $60.0 $2.0 0.35 $0.42
Total $1.07
21© 2008 Oliver Wyman www.oliverwyman.com
Impact of Past Credibility ChangesBase rate off balance adjustment
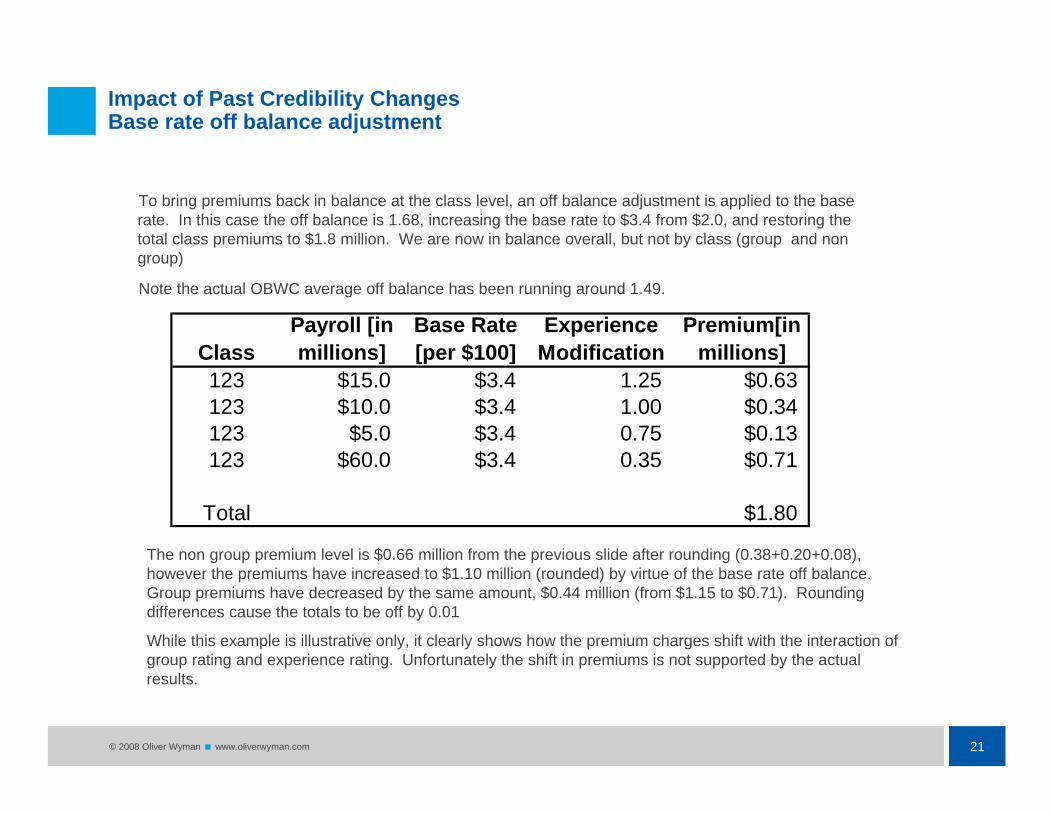
To bring premiums back in balance at the class level, an off balance adjustment is applied to the base rate. In this case the off balance is 1.68, increasing the base rate to $3.4 from $2.0, and restoring the total class premiums to $1.8 million. We are now in balance overall, but not by class (group and non group)
Note the actual OBWC average off balance has been running around 1.49.
The non group premium level is $0.66 million from the previous slide after rounding (0.38+0.20+0.08), however the premiums have increased to $1.10 million (rounded) by virtue of the base rate off balance. Group premiums have decreased by the same amount, $0.44 million (from $1.15 to $0.71). Rounding differences cause the totals to be off by 0.01
While this example is illustrative only, it clearly shows how the premium charges shift with the interaction of group rating and experience rating. Unfortunately the shift in premiums is not supported by the actual results.
ClassPayroll [in millions]
Base Rate [per $100]
Experience Modification
Premium[in millions]
123 $15.0 $3.4 1.25 $0.63123 $10.0 $3.4 1.00 $0.34123 $5.0 $3.4 0.75 $0.13123 $60.0 $3.4 0.35 $0.71
Total $1.80

22© 2008 Oliver Wyman www.oliverwyman.com
Impact of Past Credibility Changes $10,000 Split Point example
Loss Ratios by Group Status
Policy Year 2003 Policy Year 2004 Policy Year 2005Policy Status Current Plan 10N Current Plan 10N Current Plan 10N
Group 145.1% 89.0% 131.7% 77.8% 117.7% 75.7%Non Group 63.8% 79.7% 53.4% 67.7% 56.1% 69.2%Base Rated 80.2% 106.8% 73.7% 90.0% 83.0% 96.1%Total 87.5% 87.5% 75.0% 75.0% 75.5% 75.5%
$ 1,624,775,517 $ 1,624,775,517 $ 1,733,569,184 $ 1,733,569,184 $ 1,620,242,835 $ 1,620,242,835 Total230,507,163 267,036,124 268,198,830 327,356,187 236,229,343 314,620,176 Base Rated779,917,369 962,351,017 798,274,973 1,011,954,561 718,754,681 897,396,952 Non Group614,350,985 395,388,376 667,095,381 394,258,436 665,258,810 408,225,707 Group
Plan 10NCurrentPlan 10NCurrentPlan 10NCurrentPolicy StatusPolicy Year 2005Policy Year 2004Policy Year 2003
Premium Distribution by Group Status
Notes: The premiums shown are gross of all discount programs, and exclude ACF and DWRF charges;

23© 2008 Oliver Wyman www.oliverwyman.com
Impact of Past Credibility Changes$10,000 Split Point example
Policy Year 2003 Policy Year 2004 Policy Year 2005Policy Status
Group Non Group Group Non Group Group Non GroupCurrent 408,225,707 1,212,017,128 394,258,436 1,339,310,748 395,388,376 1,229,387,141 Plan 10N 665,258,810 954,984,025 667,095,381 1,066,473,803 614,350,985 1,010,424,532 Dollar Change 257,033,103 (257,033,103) 272,836,945 (272,836,945) 218,962,609 (218,962,609) Percent Change 63.0% -21.2% 69.2% -20.4% 55.4% -17.8%
Credibility Max of 100% Credibility Max of 100% Credibility Max of 95%
The table below shows the premium changes resulting from adopting a 10k split plan relative to the rating plan used in each respective policy year.
The resulting premium changes tell us:
•The rate level imbalance between group and non group improved from 2004 to 2005 with the change in credibility tables from 100% to 95%
•The rate level imbalance is near zero with these policy years modeled on a 10k split plan. This is an approximation only, which excludes the impact of all discount programs, and the annual reconstitution of group membership
CAVEATS:
The premiums shown are gross of all discount programs, and exclude ACF and DWRF charges, therefore these percentages and dollar amounts are illustrative in magnitude only, and are not consistent with the full premium calculation.
A rate imbalance would likely still result under a 10k split plan with the current group rules that allow for annual changes in group membership. The premiums calculated are estimates, with the assumption of static group membership.
*Non group includes base rated risks in this table

“True” Premium Cost

25© 2008 Oliver Wyman www.oliverwyman.com
True Premium CostBase Rates
Base rates will decrease if the average experience rating mod increases
For example, the average experience mod changed from 0.58 to 0.79 for policy year 2005 in the scenario modeling a 10k split plan. After accounting for base rated business, this results in a 23% decrease to the base rate. This measures the change from a 95% credibility table to a full split plan.
In modeling the premium impact of moving from the July 2008 85% credibility table to a full split plan, the base rate decrease is 10.6%.
National comparisons of Ohio WC premiums will benefit as the base rates move towards a more neutral, “base” level. The typical base rate offset for other states is 1% to 2%, whereas Ohio could still have an offset in excess of 25%.
CAVEAT: These examples assume a static group program—the actual results will be less of a base rate decrease with group reconstitution)

26© 2008 Oliver Wyman www.oliverwyman.com
True Premium CostHigh level impact
Likely to pay less premium
Base rated risks
Non group experience rated risks
Larger experience rated premium sizes
Retro and one claim program risks
Likely to pay more premium
Group rated risks
Risks removed from group

Impact Mitigation Strategies

28© 2008 Oliver Wyman www.oliverwyman.com
Impact mitigation strategy
Current policyholders in group, and those removed from group, could realize a significant increase in premiums with the adoption of a new experience rating plan and appropriate credibility levels.
If a group risk currently receives the maximum discount of 85%, with an Experience Mod (EM) of 0.15 as of July 2008, their discount could change to 50% under a split plan, or 50/15= 233%.
Likewise, a risk removed from group in 2008 could see their EM increase from 0.15 to 1.00 or higher, which is an even larger increase (1.00/0.15=567%)
These are clearly not stable or predictable premium movements, and could be disruptive to business in general

29© 2008 Oliver Wyman www.oliverwyman.com
Impact mitigation strategyGroup policy capping
The capping process considered for Group policies is a three stage premium computation:
1. Compute the new policy premium with
the original ’85%’credibility table using new payroll and new
loss experience
2. Compute the new policy premium using the same
information as [1], except use the new experience rating
plan/credibility
3. Cap the premium increase from the change in plan/credibility only to $500. If the $500 level is exceeded, then cap the
increase at 20%.
30© 2008 Oliver Wyman www.oliverwyman.com
Impact mitigation strategy Typical Policy Examples—draft stage
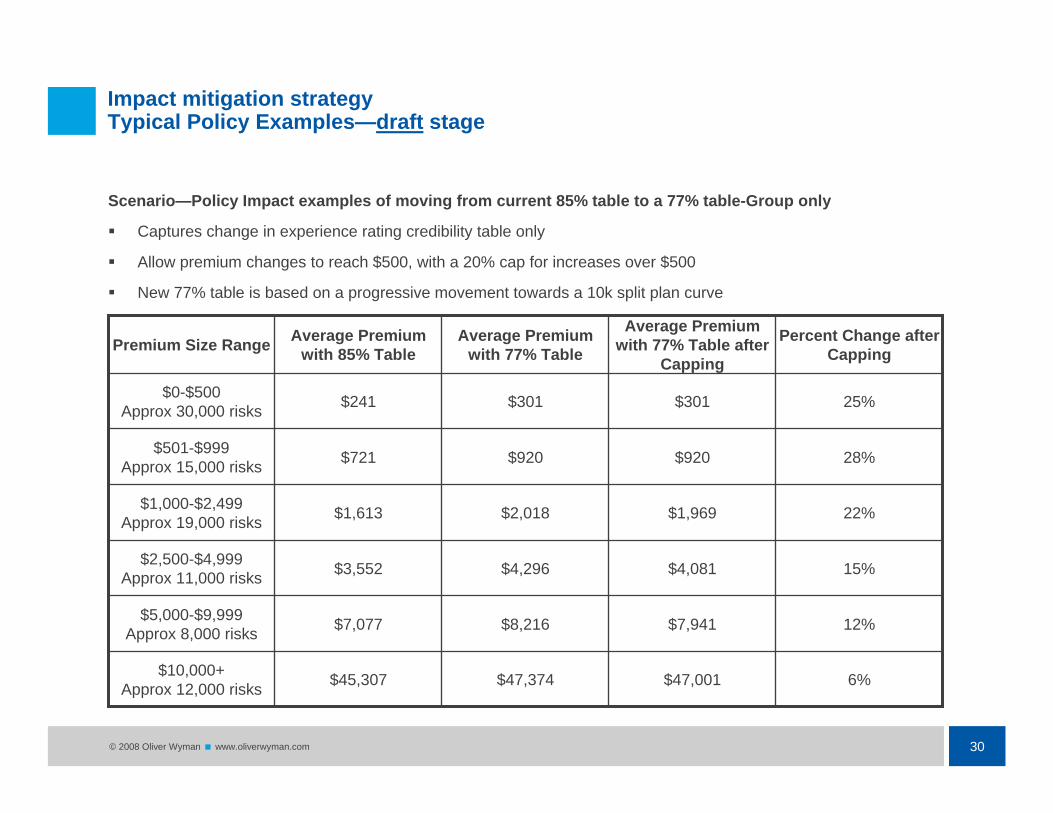
Scenario—Policy Impact examples of moving from current 85% table to a 77% table-Group only
Captures change in experience rating credibility table only
Allow premium changes to reach $500, with a 20% cap for increases over $500
New 77% table is based on a progressive movement towards a 10k split plan curve
12%$7,941$8,216$7,077$5,000-$9,999Approx 8,000 risks
15%$4,081$4,296$3,552$2,500-$4,999Approx 11,000 risks
22%$1,969$2,018$1,613$1,000-$2,499Approx 19,000 risks
6%$47,001$47,374$45,307$10,000+Approx 12,000 risks
28%$920$920$721$501-$999Approx 15,000 risks
25%$301$301$241$0-$500Approx 30,000 risks
Percent Change after Capping
Average Premium with 77% Table after
Capping
Average Premium with 77% Table
Average Premium with 85% TablePremium Size Range
31© 2008 Oliver Wyman www.oliverwyman.com
Impact mitigation strategyNon group policy capping--EM
The capping process considered for non group policies is more basic, and is aimed to reduce the volatility of employers removed from group
1. Compute the new premium for each non group risk using updated payroll, loss experience, and the new rating plan/credibility table.
2. Compare the new experience mod (EM) to the prior renewal experience mod, and cap the increase at 100%.
3. Compute the new premium using the capped EM, and repeat the EM capping in subsequent renewals until the full EM is realized.

32© 2008 Oliver Wyman www.oliverwyman.com
Impact mitigation strategy Typical Policy Examples—draft stage
Scenario—Policy Impact examples of moving from current 85% table to a 77% table--risks removed from group only
Captures changes in experience rating credibility, in group membership, in payroll and in experience rating history
Experience Mod change capped at 100%
65%$11,511$20,774$6,970$5,000-$9,999
Approx 500 risks
64%$5,963$12,303$3,630$2,500-$4,999
Approx 600 risks
67%$2,721$6,270$1,633$1,000-$2,499
Approx 700 risks
45%$79,883$91,436$55,041$10,000+
Approx 1,100 risks
64%$1,210$2,900$736$501-$999
Approx 500 risks
50%$300$719$199$0-$500
Approx 1,300 risks
Percent Change after Capping
Average Premium with 77% Table after
Capping
Average Premium with 77% Table
Average Premium with 85% TablePremium Size Range

33© 2008 Oliver Wyman www.oliverwyman.com
Impact mitigation strategy Typical Policy Examples—draft stage
Scenario—Policy Impact examples of moving from current 85% table to a 77% table-non group (excluding rejected group members)
Captures changes in experience rating credibility, in payroll and in experience rating history
No caps are applied to decreases in these examples
-5%$6,585$6,659$7,021$5,000-$9,999Approx 8,000 risks
-6%$3,302$3,304$3,519$2,500-$4,999Approx 13,000 risks
-6%$1,507$1,506$1,604$1,000-$2,499Approx 24,000 risks
-7%$69,047$72,015$77,155$10,000+Approx 13,000 risks
-6%$681$681$721$501-$999Approx 20,000 risks
-4%$203$202$212$0-$500Approx 57,000 risks
Percent Change after Capping
Average Premium with 77% Table after
Capping
Average Premium with 77% Table
Average Premium with 85% TablePremium Size Range

34© 2008 Oliver Wyman www.oliverwyman.com
Impact mitigation strategyAggregate capping Impacts—draft stage
While capping helps smooth the transition to a new rating plan for individual risks, there will also be a premium revenue impact
It is also possible to recapture some or all of the lost revenue through a base rate off-balance, however the capping process would need to be reiterated several times to reach the desired level.
These impacts capture the effects of capping on all policies, group and non group
Only the 2009 policy year includes the actual movement of risks from group to non group, therefore the revenue impacts on 2010 and 2011 are understated.
Less than $1 million2013
$5 million or 0.25%2012
$20 million or 1.0%2011
$35 million or 1.8%2010
$35 Million or 1.8%2009
Approximate Revenue ImpactYear Modeled

Recap
36© 2008 Oliver Wyman www.oliverwyman.com
RecapSummary
The OBWC is considering a split plan structure for experience rating, which is the current form used in almost all other states.
Initial testing of the 10k single split plan show improved performance across most classes. If group rules remain unchanged, the performance modeled here will be diminished by group membership reconstitution and possible growth in group membership.
The interaction of group rules with the current experience rating plan credibility has resulted in a large base rate off balance for Ohio. The credibility changes in 2005 helped to reduce the imbalance between group and non group
Groups do not emulate large employers statistically, even though they are rated as such
The premium increase mitigation options are effective in reducing premium volatility, however perceptions can vary as to what is reasonable. The potential revenue impact of capping must be considered, not to mention that the systems implementation of premium capping is above average in difficulty.