Embed Size (px)
Citation preview

Rückblick 2012 – Ausblick 2013 Der Pharmamarkt in ZahlenPMCA-Pharma Marketing Club Austria
Erika Sander
February 2013
1

Agenda
• Global and regional trends
• Europe versus the world
• The challenge
• Austrian trends
• Market Overview
• Hospital
• Retail
2
• OTC
• Go to market strategy
− Fundamentals
− Payer/ regulator
− Physicians
− Patients
− Winning
• Conclusions
The pharmaceutical market - Erika Sander, 18.02.2013© 2012, IMS HEALTH
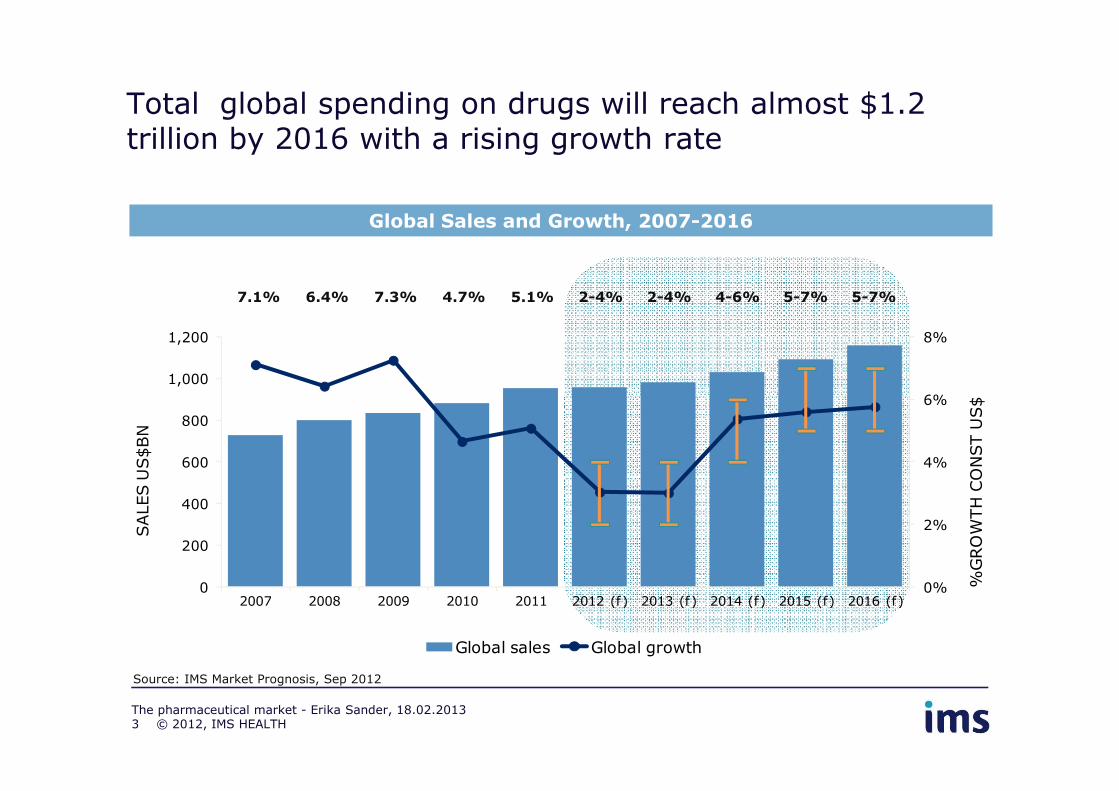
7.1% 6.4% 7.3% 4.7% 5.1% 2-4% 2-4% 4-6% 5-7% 5-7%
6%
8%
1,000
1,200
Total global spending on drugs will reach almost $1.2 trillion by 2016 with a rising growth rate
Global Sales and Growth, 2007-2016
$728 $799 $832 $881 $953 $960-970 $995-1,005$1,040-1,060
$1,105-$1,125
$1,175-$1,205
0%
2%
4%
6%
0
200
400
600
800
2007 2008 2009 2010 2011 2012 (f) 2013 (f) 2014 (f) 2015 (f) 2016 (f)
%G
RO
WTH
CO
NST U
S$
SALES U
S$BN
Global sales Global growth
Source: IMS Market Prognosis, Sep 2012
The pharmaceutical market - Erika Sander, 18.02.2013© 2012, IMS HEALTH3
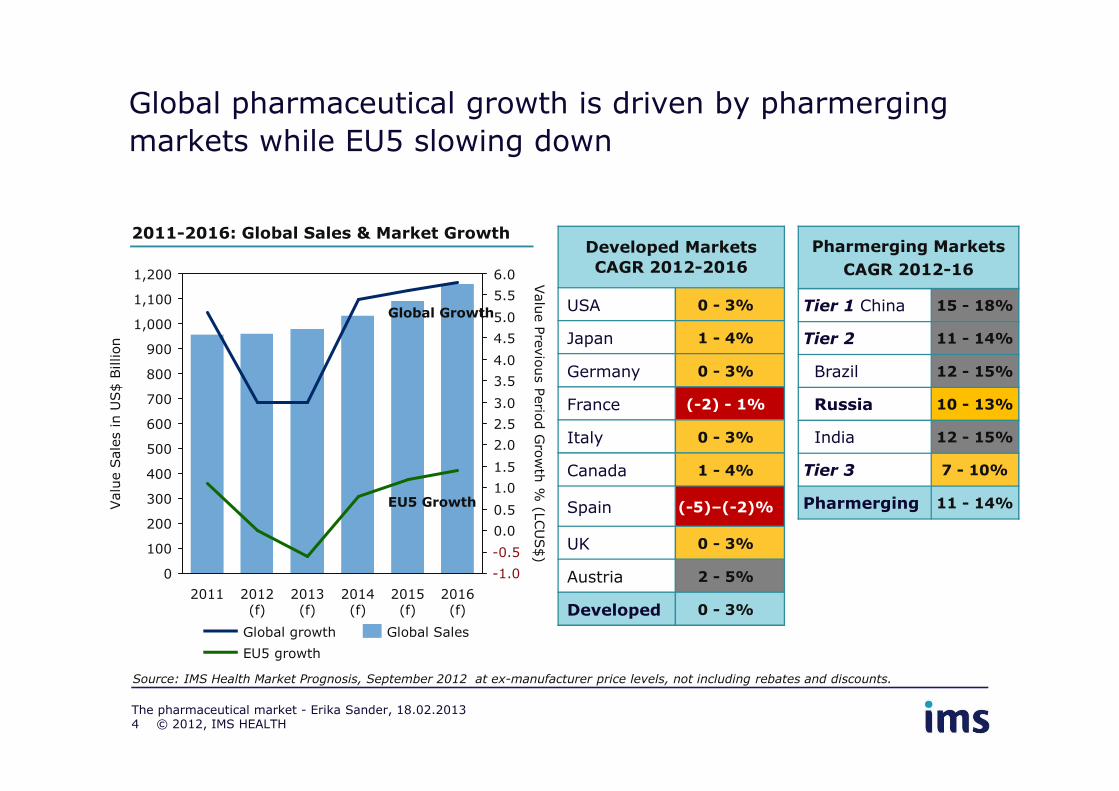
Global pharmaceutical growth is driven by pharmerging
markets while EU5 slowing down
2011-2016: Global Sales & Market GrowthDeveloped Markets
CAGR 2012-2016
USA 0 - 3%
Japan 1 - 4%
Germany 0 - 3%
France (-2) - 1%
Pharmerging Markets
CAGR 2012-16
Tier 1 China 15 - 18%
Tier 2 11 - 14%
Brazil 12 - 15%
Russia 10 - 13%
6.0
5.5
5.0
4.5
4.0
3.5
3.0
1,200
1,100
1,000
900
800
700
Valu
e S
ale
s in U
S$ B
illion
Valu
e P
revio
us P
erio
d G
row
th %
(LCU
S$)
Global Growth
France (-2) - 1%
Italy 0 - 3%
Canada 1 - 4%
Spain (-5)–(-2)%
UK 0 - 3%
Austria 2 - 5%
Developed 0 - 3%
Russia 10 - 13%
India 12 - 15%
Tier 3 7 - 10%
Pharmerging 11 - 14%
3.0
2.5
2.0
1.5
1.0
0.5
0.0
-0.5
-1.00
700
600
500
400
300
200
100
Valu
e S
ale
s in U
S$ B
illion
2016 (f)
2015 (f)
2014 (f)
2013 (f)
2012 (f)
2011Valu
e P
revio
us P
erio
d G
row
th %
(LCU
S$)
Source: IMS Health Market Prognosis, September 2012 at ex-manufacturer price levels, not including rebates and discounts.
Global Sales
EU5 growth
Global growth
EU5 Growth
© 2012, IMS HEALTHThe pharmaceutical market - Erika Sander, 18.02.2013
-0.5
-1.0
4
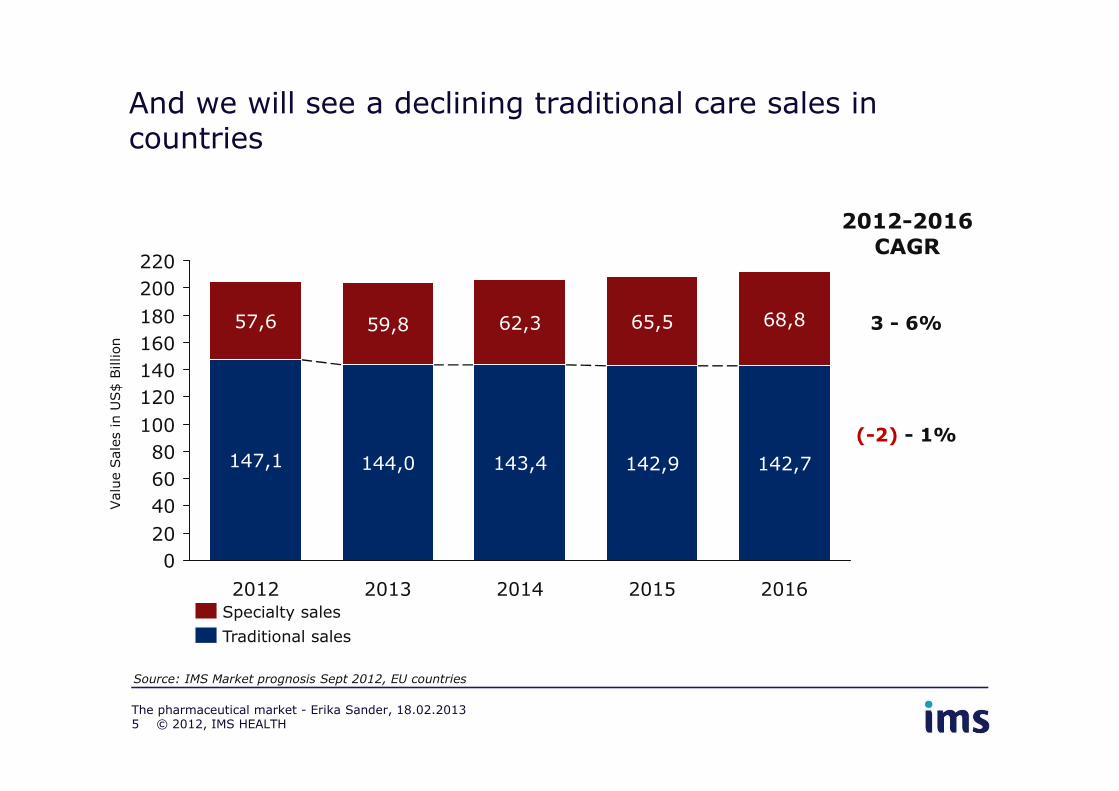
And we will see a declining traditional care sales in countries
220
120
160
140
57,6 59,8
200
68,865,562,3180 3 - 6%
2012-2016CAGR
Valu
e S
ale
s in U
S$ B
illion
© 2012, IMS HEALTH
40
20
60
80
120
2012
147,1
100
0
2016
142,7
2015
142,9
2014
143,4
2013
144,0
(-2) - 1%
Traditional sales
Specialty sales
Source: IMS Market prognosis Sept 2012, EU countries
The pharmaceutical market - Erika Sander, 18.02.20135
Valu
e S
ale
s in U
S$ B
illion

Antidiabetics
Asthma/COPD
Autoimmune
HIV Antivirals
Vaccines
Multiple Sclerosis
ADHD50Bn
5Bn
25Bn
15%
20%
SPEN
DIN
G C
AG
R 2
007-2
011
Spending and Growth in Leading Therapy Areas
But some key Therapy Areas will continue to see strong growth Specialty outpacing traditional
Immuno-suppressants
Specialty
Traditional
OncologicsAsthma/COPD
Lipid Regulators
Angiotensin IIAntipsychotics
Anti-Ulcerants Anti-Epileptics
Platelet Aggr Inhibitors
Contraceptives
Cephalosporins
Antivirals excl HIV
Anticoagulants
-5%
0%
5%
10%
-10% -5% 0% 5% 10% 15%
SPEN
DIN
G C
AG
R 2
007
SPENDING CAGR 2012-2016Source: IMS Institute for Healthcare Informatics, May 2012
Global market CAGR 2007-2011: 6%
Global market CAGR 2012-2016: 3-6%
Immuno-stimulants
Narcotic Analgesics
© 2012, IMS HEALTHThe pharmaceutical market - Erika Sander, 18.02.20136
60
70
80
90
100
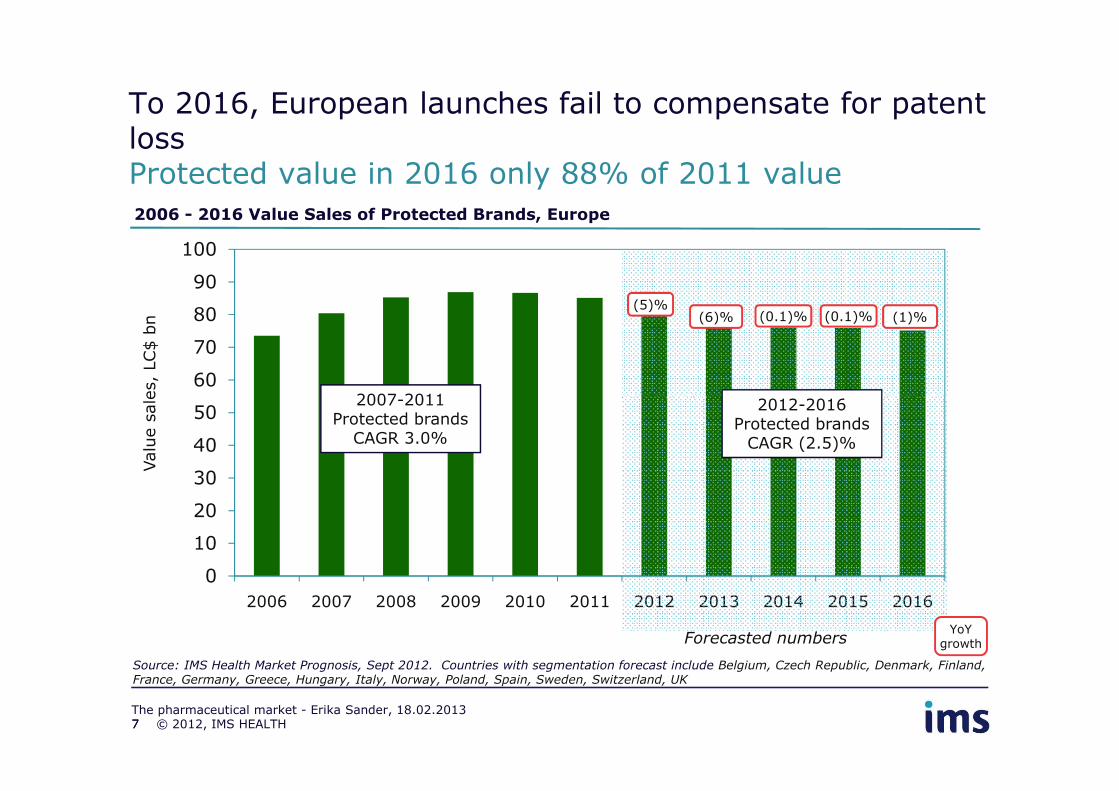
2006 - 2016 Value Sales of Protected Brands, Europe
2012-2016 2007-2011
Valu
e s
ale
s,
LC$ b
n
To 2016, European launches fail to compensate for patent lossProtected value in 2016 only 88% of 2011 value
(5)%(6)% (0.1)% (1)%(0.1)%
0
10
20
30
40
50
2006 2007 2008 2009 2010 2011 2012 2013 2014 2015 2016
Source: IMS Health Market Prognosis, Sept 2012. Countries with segmentation forecast include Belgium, Czech Republic, Denmark, Finland, France, Germany, Greece, Hungary, Italy, Norway, Poland, Spain, Sweden, Switzerland, UK
2012-2016 Protected brands
CAGR (2.5)%
2007-2011 Protected brands
CAGR 3.0%
Valu
e s
ale
s,
LC$ b
n
Forecasted numbers
7
YoY growth
© 2012, IMS HEALTHThe pharmaceutical market - Erika Sander, 18.02.20137
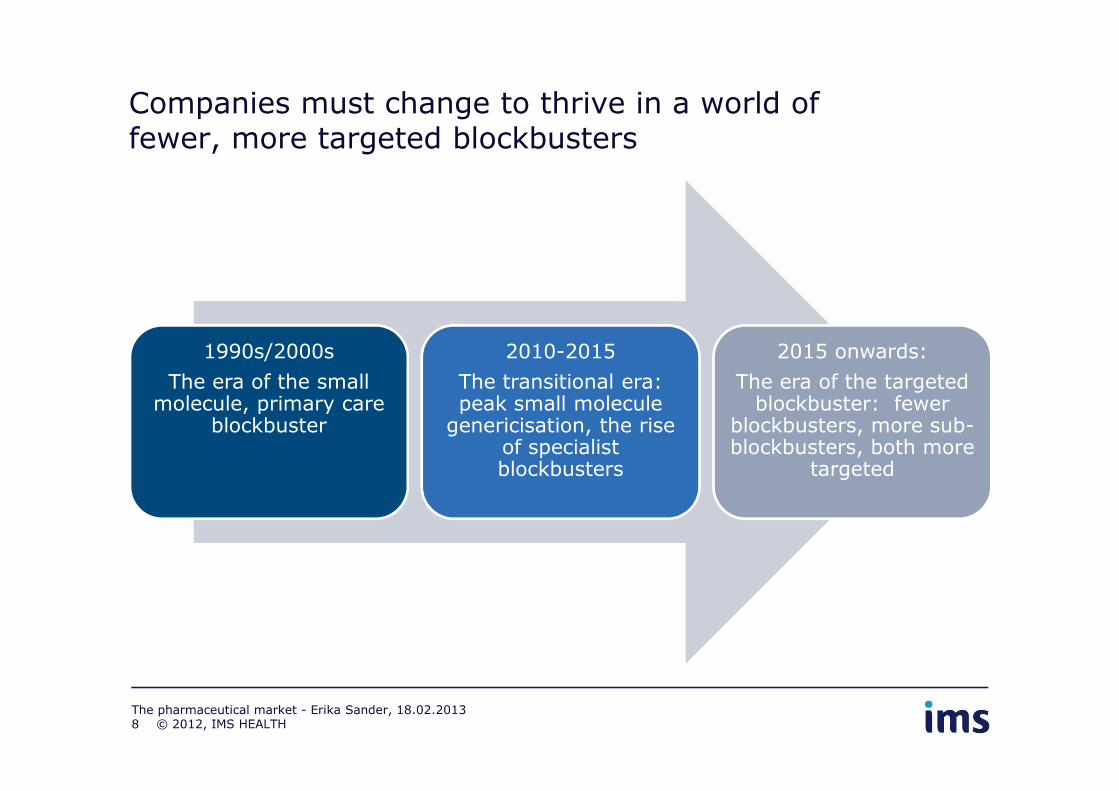
Companies must change to thrive in a world of fewer, more targeted blockbusters
1990s/2000s
The era of the small molecule, primary care
2010-2015
The transitional era: peak small molecule
2015 onwards:
The era of the targeted blockbuster: fewer molecule, primary care
blockbusterpeak small molecule
genericisation, the rise of specialist blockbusters
blockbuster: fewer blockbusters, more sub-blockbusters, both more
targeted
© 2012, IMS HEALTHThe pharmaceutical market - Erika Sander, 18.02.20138

Austrian Pharma market 2012-2016 will show higher growth than European average
Valu
e S
ale
s in M
io.
USD
4,2%3,9%
3,5%3,1%
Specialty sales
3,0
2,5
3,5
5,0
4,0
4,5
The total pharmaceutical market is forecasted to grow at a CAGR
of 2-5% over the period
The total pharmaceutical market is forecasted to grow at a CAGR
of 2-5% over the period
5 - 8%
Valu
e S
ale
s
0,0
1,5
0,5
1,0
20162015201420132012
Traditional sales
2,0
2,5of 2-5% over the period
2012-2016.of 2-5% over the period
2012-2016.
The pharmaceutical market - Erika Sander, 18.02.2013
Source: IMS Health Market Prognosis, Sept 2012 (*) at ex-manufacturer price levels, not including rebates and discounts
© 2012, IMS HEALTH9
1 - 4%
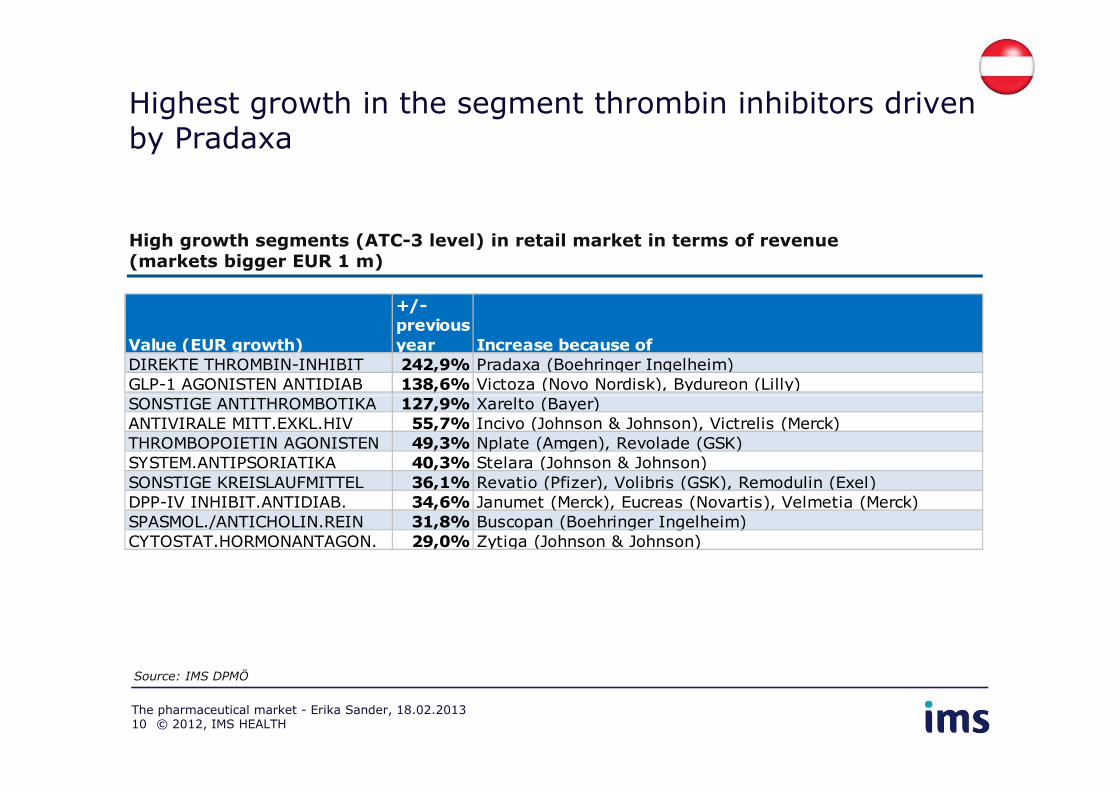
Highest growth in the segment thrombin inhibitors drivenby Pradaxa
High growth segments (ATC-3 level) in retail market in terms of revenue(markets bigger EUR 1 m)
Value (EUR growth)
+/-
previous
year Increase because of
DIREKTE THROMBIN-INHIBIT 242,9% Pradaxa (Boehringer Ingelheim)
GLP-1 AGONISTEN ANTIDIAB 138,6% Victoza (Novo Nordisk), Bydureon (Lilly)
SONSTIGE ANTITHROMBOTIKA 127,9% Xarelto (Bayer)
Source: IMS DPMÖ
© 2012, IMS HEALTHThe pharmaceutical market - Erika Sander, 18.02.201310
SONSTIGE ANTITHROMBOTIKA 127,9% Xarelto (Bayer)
ANTIVIRALE MITT.EXKL.HIV 55,7% Incivo (Johnson & Johnson), Victrelis (Merck)
THROMBOPOIETIN AGONISTEN 49,3% Nplate (Amgen), Revolade (GSK)
SYSTEM.ANTIPSORIATIKA 40,3% Stelara (Johnson & Johnson)
SONSTIGE KREISLAUFMITTEL 36,1% Revatio (Pfizer), Volibris (GSK), Remodulin (Exel)
DPP-IV INHIBIT.ANTIDIAB. 34,6% Janumet (Merck), Eucreas (Novartis), Velmetia (Merck)
SPASMOL./ANTICHOLIN.REIN 31,8% Buscopan (Boehringer Ingelheim)
CYTOSTAT.HORMONANTAGON. 29,0% Zytiga (Johnson & Johnson)

Highest revenue growth in the segment Ophthalm. Corticosteroids driven by Ozurdek
High growth segments (ATC-3 level) in hospital market in terms of revenue(markets bigger EUR 1 m)
Value (EUR growth)
+/-
previous
year Increase because of
OPHTHALM.CORTICOSTEROIDE 169,8% Ozurdek (Allergan)
HAEMATOPOETIKA MIT EISEN 76,2% Ferinject (Galenica), Monofer (Pharmacosmos)
OPIATENTWOEHNUNGSMITTEL 49,7% L-Polamidon (Sanofi)
Source: IMS DPMÖ
© 2012, IMS HEALTHThe pharmaceutical market - Erika Sander, 18.02.201311
OPIATENTWOEHNUNGSMITTEL 49,7% L-Polamidon (Sanofi)
LEBERSCH+LIPOTROPE PRAEP 33,3% Hepamerz (Merz), Legalon (Rotta)
THROMBOPOIETIN AGONISTEN 27,0% Nplate (Amgen), Revolade (GSK)
EINFACH - IMPFSTOFFE 25,8% FSME-Immun (Baxter), Gardasil (Merck, Sanofi)
ANTIRHEUMATIKA,SPEZIF. 22,8% Roactempra (Roche)
ALKYLIERENDE CYTOSTATIKA 21,3% Levact (Temmler), Busilvex (Pierre Fabre), Ovastat (Medac)
VIT.A+D INCL.EINF.KOMB. 19,8% Mimpara (Amgen), Zemplar (Abbott)
LAXANTIEN 17,0% Picoprep (Ferring), Moviprep (Norgine)

There are several key products which will lose exclusivity in Austria going forward to 2016
Austrian LoE going forwards
Product Therapy Area 2012 Sales, EUR
2013
Seretide Respiratory 27.6 m
Zometa Bisphosphonates 10.0 m
Singulair Receptor antagonist 9.7 m
Aclasta Osteoporosis 6.1 m
Xeloda Chemotherapy 5.9 m
Viagra Erectile Dysfunction 5.2 m
2014
Cipralex Anti-Depressants 19.5 m
Abilify Antipsychotics 15.7 m
Avelox Antibacterial agent 8.0 m
Ebixa Alzheimer 6.4 m
2015
Spiriva Respiratory 28.7 m
Copaxone Immunostimulants 21.1 m
Alimta Oncology 12.1 m
Cymbalta Anti-Depressants 12.6 m
Tarceva Oncology 8.4 m
2016Glivec Oncology 30.6 m
Zyvoxid Antibiotic 9.9 m
© 2012, IMS HEALTHThe pharmaceutical market - Erika Sander, 18.02.201312

Total Market growth 2012 slowing down against 2011
in %
6,8
7,5
3,84,3
Volume
Value
Source: IMS DPMÖ, DPMÖK, Q4 2012
1,5
2,4
0,9
2,6
-0,2
0,7
-0,3
2,3
3,8
20082007 2009 2010 2011 2012
© 2012, IMS HEALTHThe pharmaceutical market - Erika Sander, 18.02.201313
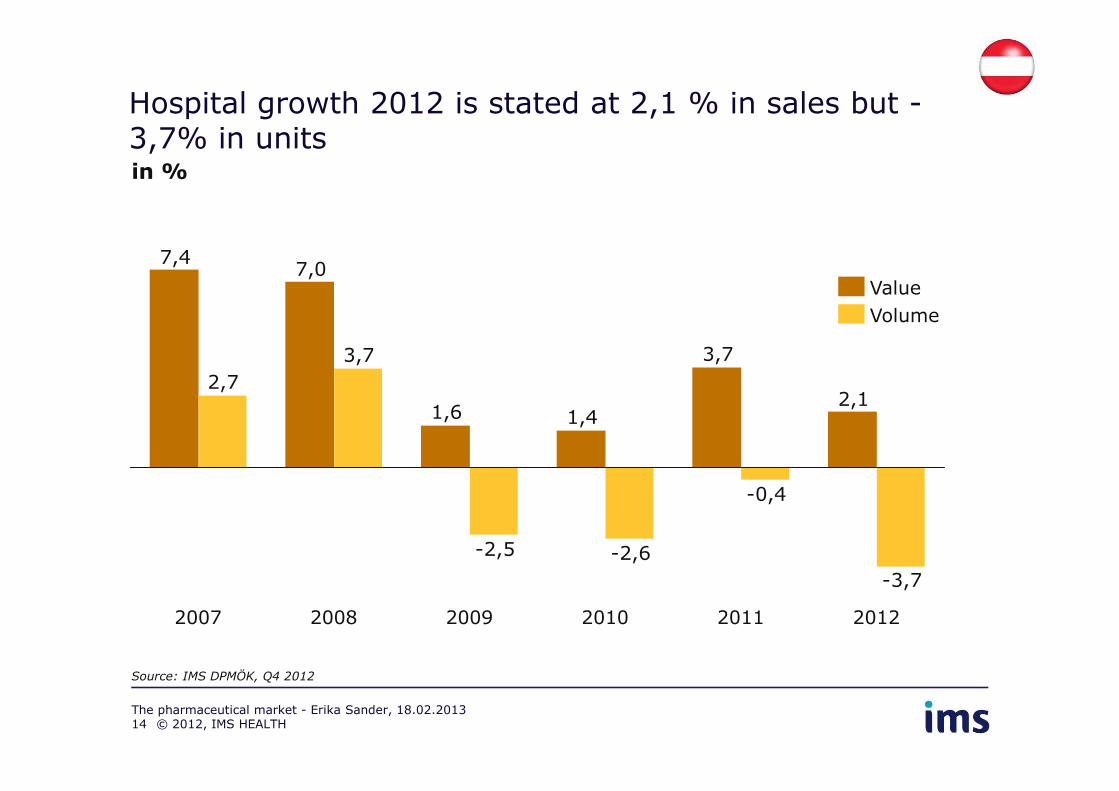
Hospital growth 2012 is stated at 2,1 % in sales but -3,7% in unitsin %
2,1
7,07,4
3,73,7
2,7
Volume
Value
Source: IMS DPMÖK, Q4 2012
2,11,41,6
-3,7
-0,4
-2,6-2,5
20082007 2009 2010 2011 2012
© 2012, IMS HEALTHThe pharmaceutical market - Erika Sander, 18.02.201314

Imported products account for 5.8% of the total hospitalmarket (value)
5.8%
Parallel Import
0.3%
Parallel Import
Value [%] Volume [%]
Parallel Import in hospital market
Remarks
• Value share higher thanvolume share
• Expensive products are
© 2012, IMS HEALTHThe pharmaceutical market - Erika Sander, 18.02.201315
94.2% 99.7%
• Expensive products aremore often affected byparallel trade (e.g. Avastin: EUR 1,338; Mabthera: EUR 1,516)
Source: IMS DPMÖK
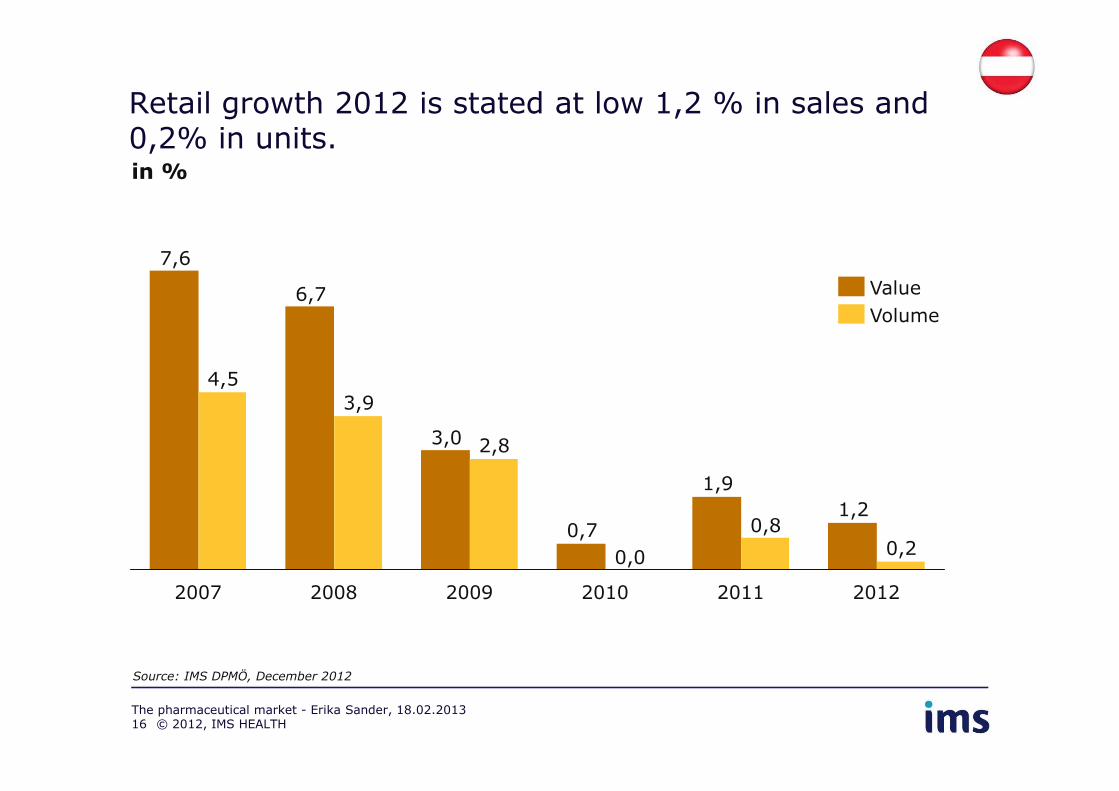
Retail growth 2012 is stated at low 1,2 % in sales and 0,2% in units.in %
6,7
7,6
3,9
4,5
Value
Volume
1,2
1,9
0,7
3,0
0,20,0
2,8
3,9
0,8
201220112010200920082007
Source: IMS DPMÖ, December 2012
© 2012, IMS HEALTHThe pharmaceutical market - Erika Sander, 18.02.201316
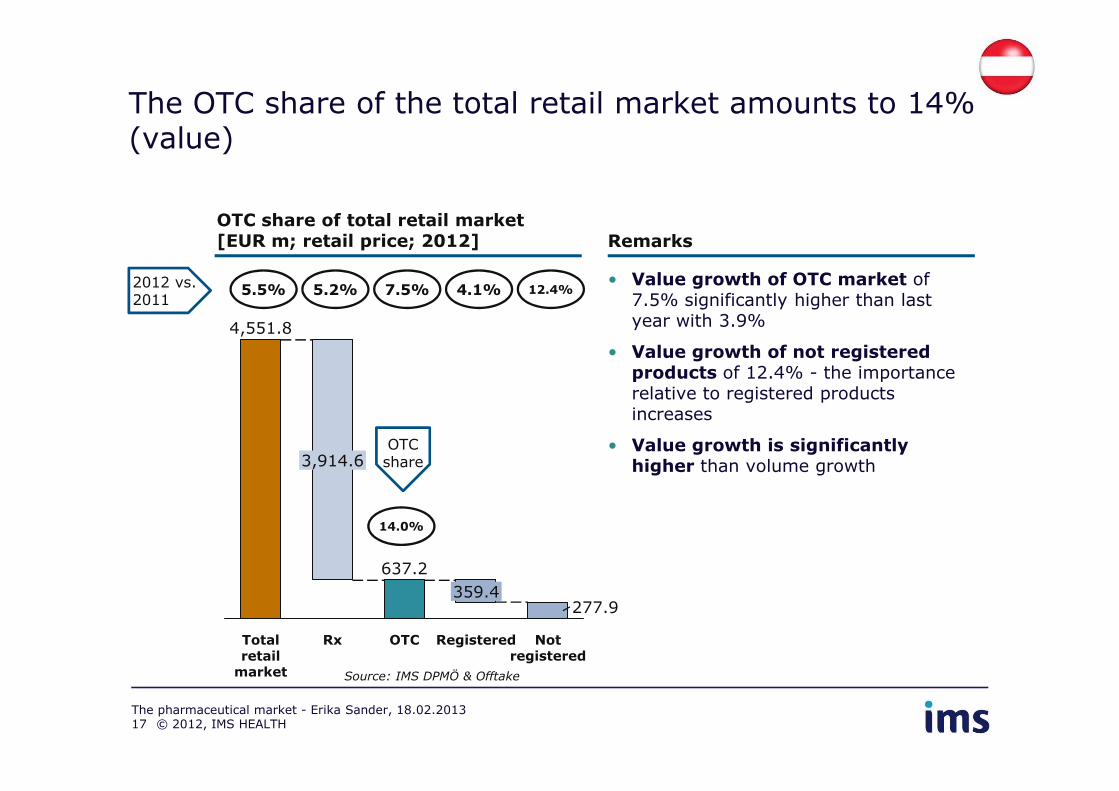
The OTC share of the total retail market amounts to 14% (value)
OTC share of total retail market[EUR m; retail price; 2012]
4,551.8
Remarks
5.5% 5.2% 7.5% 12.4%4.1%2012 vs. 2011
• Value growth of OTC market of7.5% significantly higher than last year with 3.9%
• Value growth of not registered products of 12.4% - the importancerelative to registered products
Not registered
277.9
Registered
359.4
OTC
637.2
Rx
3,914.6
Total retail market
relative to registered productsincreases
• Value growth is significantlyhigher than volume growth
14.0%
OTC share
Source: IMS DPMÖ & Offtake
© 2012, IMS HEALTHThe pharmaceutical market - Erika Sander, 18.02.201317

The OTC share of the total retail market amounts to 28% (volume)
OTC share of total retail market[´000 units; 2012]
237,891
3.4% 3.6% 3.0% 8.8%0.8%2012 vs. 2011
Remarks
• Volume growth of OTC market of3%
• Volume growth of not registered products of 8.8% significantly higherthan increase of registered products(0.8%)OTC
Not registered
19,971
Registered
47,537
OTC
67,508
Rx
170,383
Total retail market
(0.8%)
• Share of OTC market (28%) demonstrates the relative importanceof the OTC market
28,4%
OTC share
Source: IMS DPMÖ & Offtake
© 2012, IMS HEALTHThe pharmaceutical market - Erika Sander, 18.02.201318
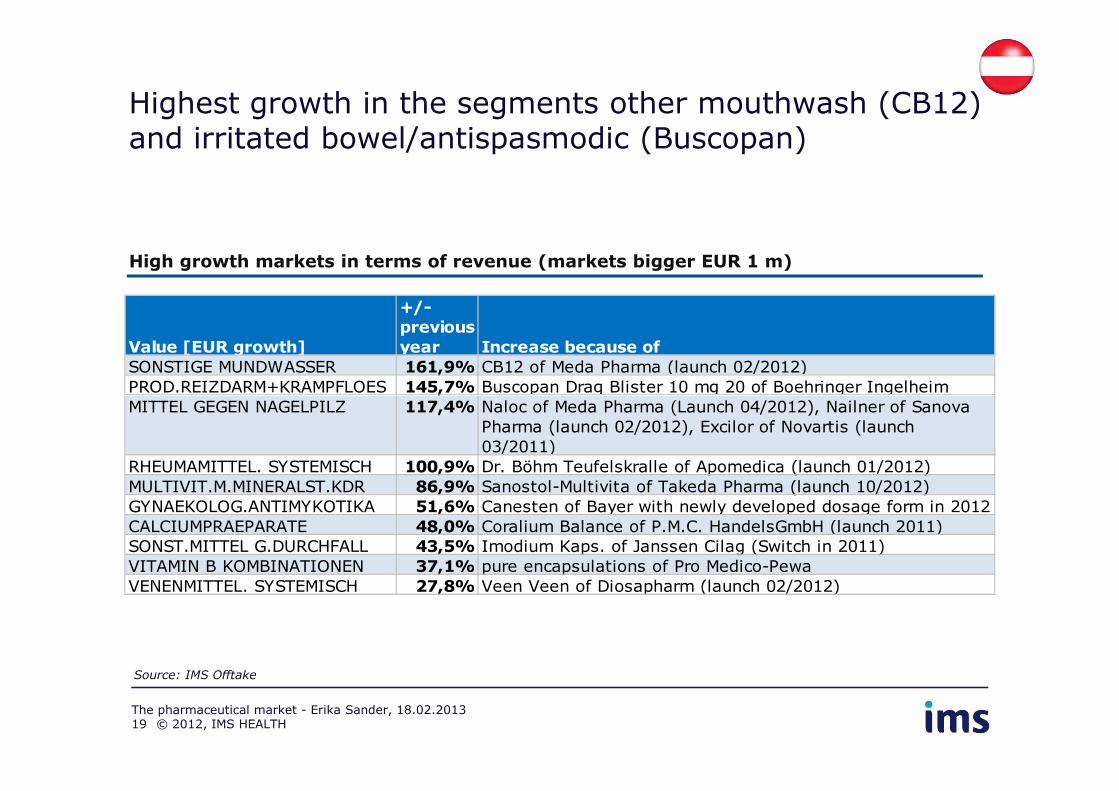
Highest growth in the segments other mouthwash (CB12) and irritated bowel/antispasmodic (Buscopan)
High growth markets in terms of revenue (markets bigger EUR 1 m)
Value [EUR growth]
+/-
previous
year Increase because of
SONSTIGE MUNDWASSER 161,9% CB12 of Meda Pharma (launch 02/2012)
PROD.REIZDARM+KRAMPFLOES 145,7% Buscopan Drag Blister 10 mg 20 of Boehringer Ingelheim
Source: IMS Offtake
© 2012, IMS HEALTHThe pharmaceutical market - Erika Sander, 18.02.201319
PROD.REIZDARM+KRAMPFLOES 145,7%
MITTEL GEGEN NAGELPILZ 117,4% Naloc of Meda Pharma (Launch 04/2012), Nailner of Sanova
Pharma (launch 02/2012), Excilor of Novartis (launch
03/2011)
RHEUMAMITTEL. SYSTEMISCH 100,9% Dr. Böhm Teufelskralle of Apomedica (launch 01/2012)
MULTIVIT.M.MINERALST.KDR 86,9% Sanostol-Multivita of Takeda Pharma (launch 10/2012)
GYNAEKOLOG.ANTIMYKOTIKA 51,6% Canesten of Bayer with newly developed dosage form in 2012
CALCIUMPRAEPARATE 48,0% Coralium Balance of P.M.C. HandelsGmbH (launch 2011)
SONST.MITTEL G.DURCHFALL 43,5% Imodium Kaps. of Janssen Cilag (Switch in 2011)
VITAMIN B KOMBINATIONEN 37,1% pure encapsulations of Pro Medico-Pewa
VENENMITTEL. SYSTEMISCH 27,8% Veen Veen of Diosapharm (launch 02/2012)

Highest growth for 2013 expected for not registered products in OTC segment
4,5
Estimated growth rate in 2013 [%]
10
Remarks
• Estimated growth in hospital higher than in retail
• Highest growth expectedin OTC segment
© 2012, IMS HEALTHThe pharmaceutical market - Erika Sander, 18.02.201320
1,5
2,0
OTCHospitalRetail
0
Not registered
Registered
in OTC segment
• Only not registered products are expected togrow in OTC sgement
Source: IMS Experts

The promotional environment is changing rapidly
Company
Yesterday
• 4-6 major brands
• 1-2 launches/year
• Mature markets focus
Today
• Larger number of smaller brands, many multi-indication
• 4-6 launches/year (new products and new indications)
• Focus split between Pharmerging and Mature markets
Tomorrow?
• Genetic profiling and biomarkers segment brands further
• RWE extends the launch across the lifecycle
• Mixture of highly segmented specialist and primary care marketsC
ompany
Market • Prescribers the key
stakeholder
• Distribution channels simple
• Competition simple: other branded on patent agents
• Primary care focus
• Payers increasingly dominant
• Distribution channels increasingly complex
• Competition against generics as well as other brands
• Specialist care focus
• Patients become significant stake-holders
• Health economic and outcome measures crucial
• RWE and lifetime pricing accelerates competition complexity
markets
© 2012, IMS HEALTHThe pharmaceutical market - Erika Sander, 18.02.201321
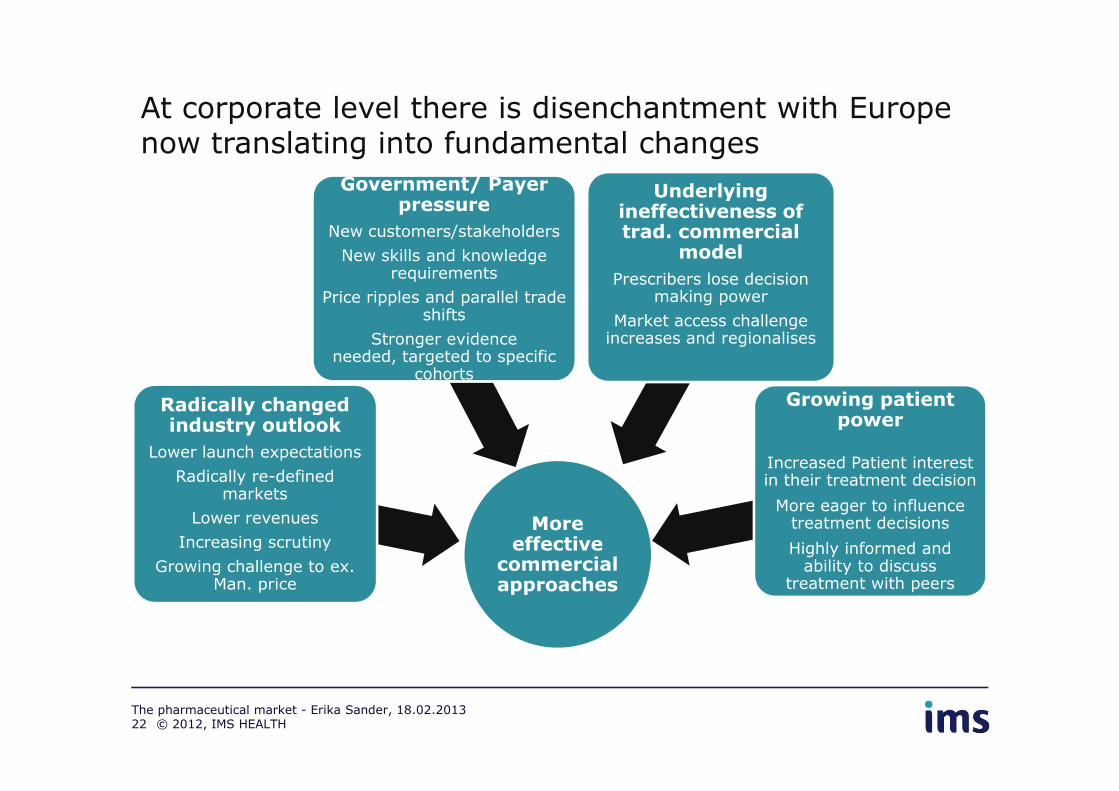
Radically changed
Government/ Payer pressure
New customers/stakeholders
New skills and knowledge requirements
Price ripples and parallel trade shifts
Stronger evidence needed, targeted to specific
cohorts
Underlying ineffectiveness of trad. commercial
model
Prescribers lose decision making power
Market access challenge increases and regionalises
Growing patient
At corporate level there is disenchantment with Europe now translating into fundamental changes
More effective
commercial approaches
Radically changed industry outlook
Lower launch expectations
Radically re-defined markets
Lower revenues
Increasing scrutiny
Growing challenge to ex. Man. price
Growing patient power
Increased Patient interest in their treatment decision
More eager to influence treatment decisions
Highly informed and ability to discuss
treatment with peers
22 © 2012, IMS HEALTHThe pharmaceutical market - Erika Sander, 18.02.2013
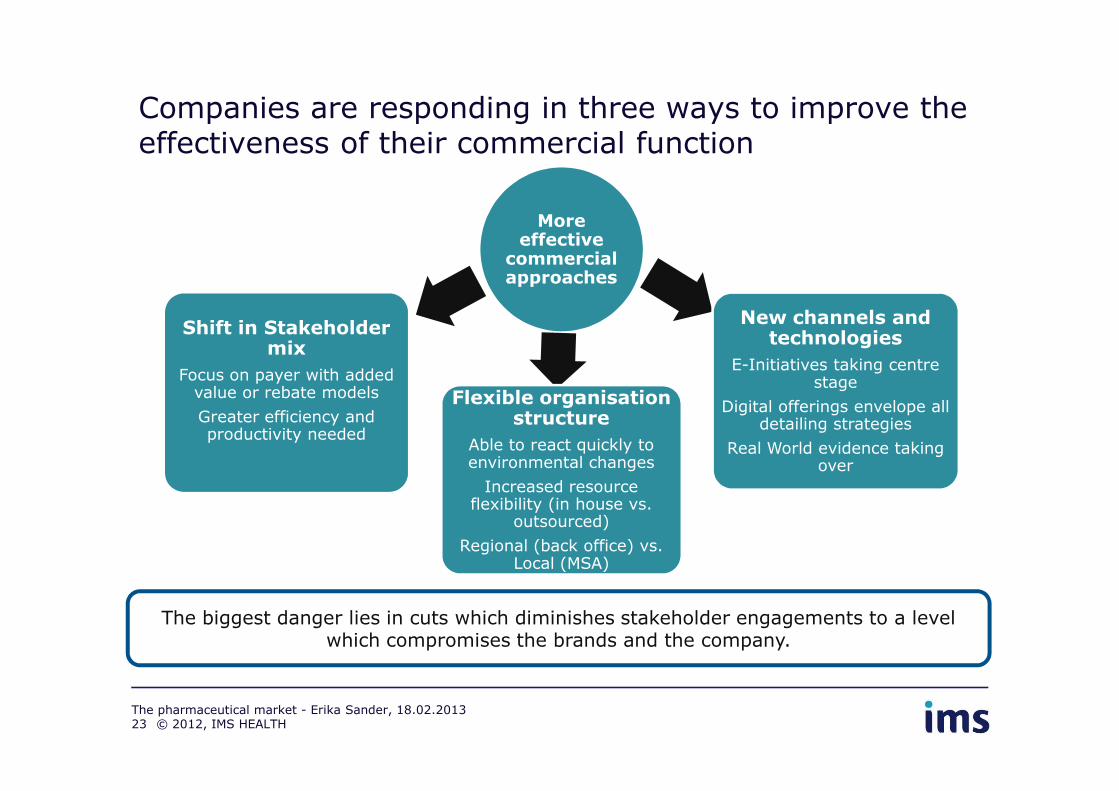
More effective
commercial approaches
Shift in Stakeholder mix
Focus on payer with added value or rebate models Flexible organisation
New channels and technologies
E-Initiatives taking centre stage
Companies are responding in three ways to improve the effectiveness of their commercial function
value or rebate models
Greater efficiency and productivity needed
Flexible organisation structure
Able to react quickly to environmental changes
Increased resource flexibility (in house vs.
outsourced)
Regional (back office) vs. Local (MSA)
Digital offerings envelope all detailing strategies
Real World evidence taking over
23
The biggest danger lies in cuts which diminishes stakeholder engagements to a level which compromises the brands and the company.
© 2012, IMS HEALTHThe pharmaceutical market - Erika Sander, 18.02.2013
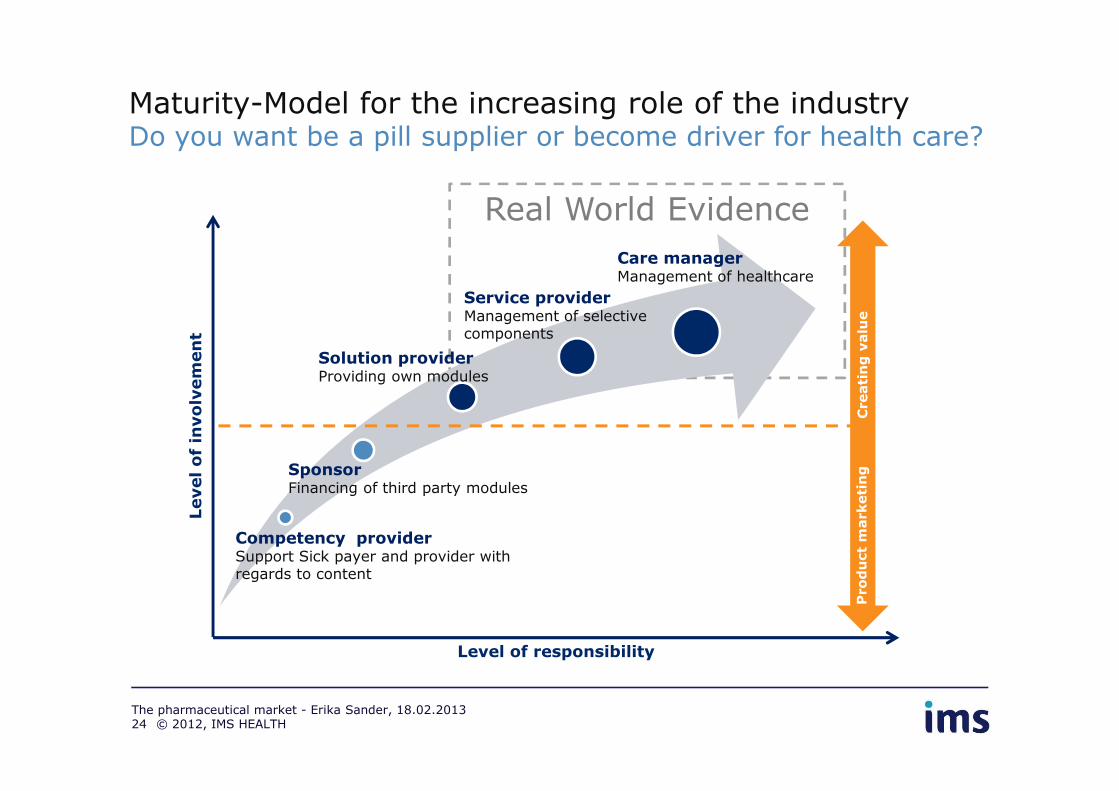
Real World Evidence
Maturity-Model for the increasing role of the industryDo you want be a pill supplier or become driver for health care?
Solution providerProviding own modules
Service providerManagement of selective components
Care managerManagement of healthcare
Level of involvement
Creating value
SponsorFinancing of third party modules
Competency providerSupport Sick payer and provider with regards to content
Level of responsibility
Level of involvement
Product marketing
Creating value
© 2012, IMS HEALTHThe pharmaceutical market - Erika Sander, 18.02.201324

Pharma moving away from Dr centric models mostly in response to market dynamics
Physician-centric model(rep-led)
B2B-model(cross-functional)
© 2012, IMS HEALTHThe pharmaceutical market - Erika Sander, 18.02.201325
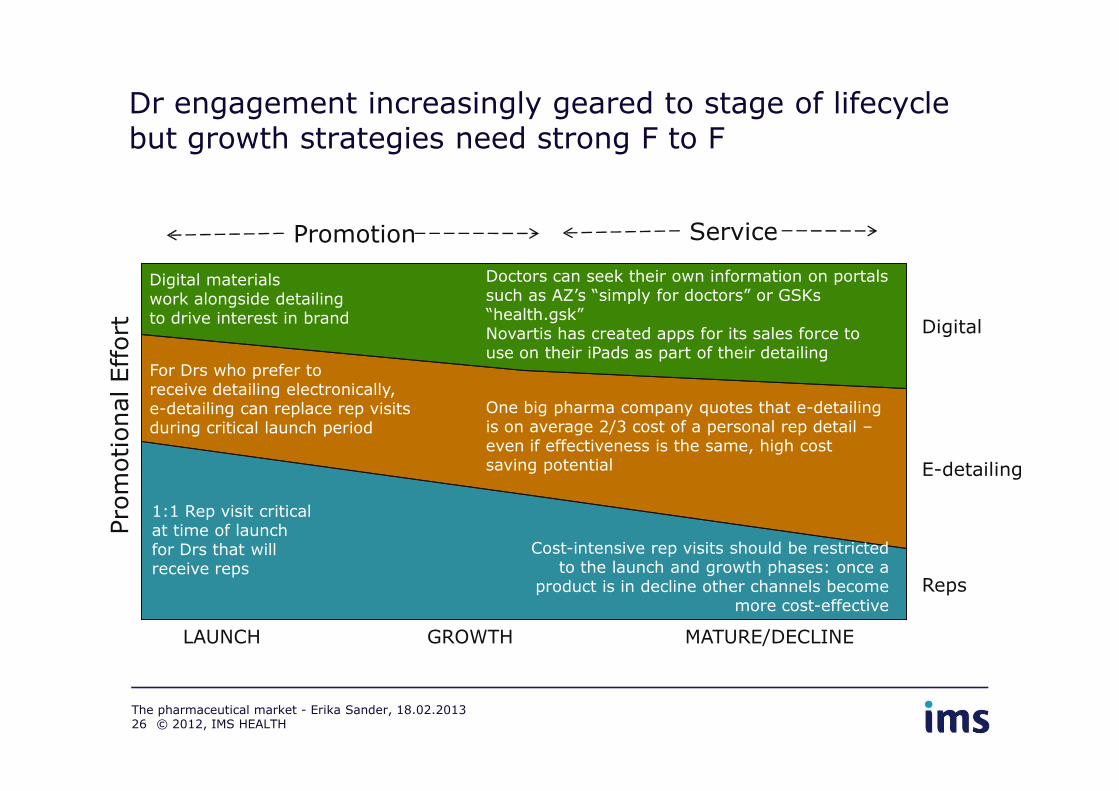
Dr engagement increasingly geared to stage of lifecycle but growth strategies need strong F to F
Digital
Pro
motional Eff
ort
Promotion Service
For Drs who prefer to receive detailing electronically,
Digital materials work alongside detailing to drive interest in brand
Doctors can seek their own information on portals such as AZ’s “simply for doctors” or GSKs “health.gsk” Novartis has created apps for its sales force to use on their iPads as part of their detailing
E-detailing
Reps
LAUNCH GROWTH MATURE/DECLINE
Pro
motional Eff
ort
1:1 Rep visit critical at time of launch for Drs that will receive reps
receive detailing electronically, e-detailing can replace rep visits during critical launch period
Cost-intensive rep visits should be restricted to the launch and growth phases: once a
product is in decline other channels become more cost-effective
One big pharma company quotes that e-detailing is on average 2/3 cost of a personal rep detail –even if effectiveness is the same, high cost saving potential
© 2012, IMS HEALTHThe pharmaceutical market - Erika Sander, 18.02.201326

Although you need a more integrated, combined cross functional approach
Marketing Medical Sales
Rep visitFace to face
seminareDetailing
© 2012, IMS HEALTH
Customer centre contact
Rep visit
eCME seminarPhysical detailing
Website
The pharmaceutical market - Erika Sander, 18.02.201327
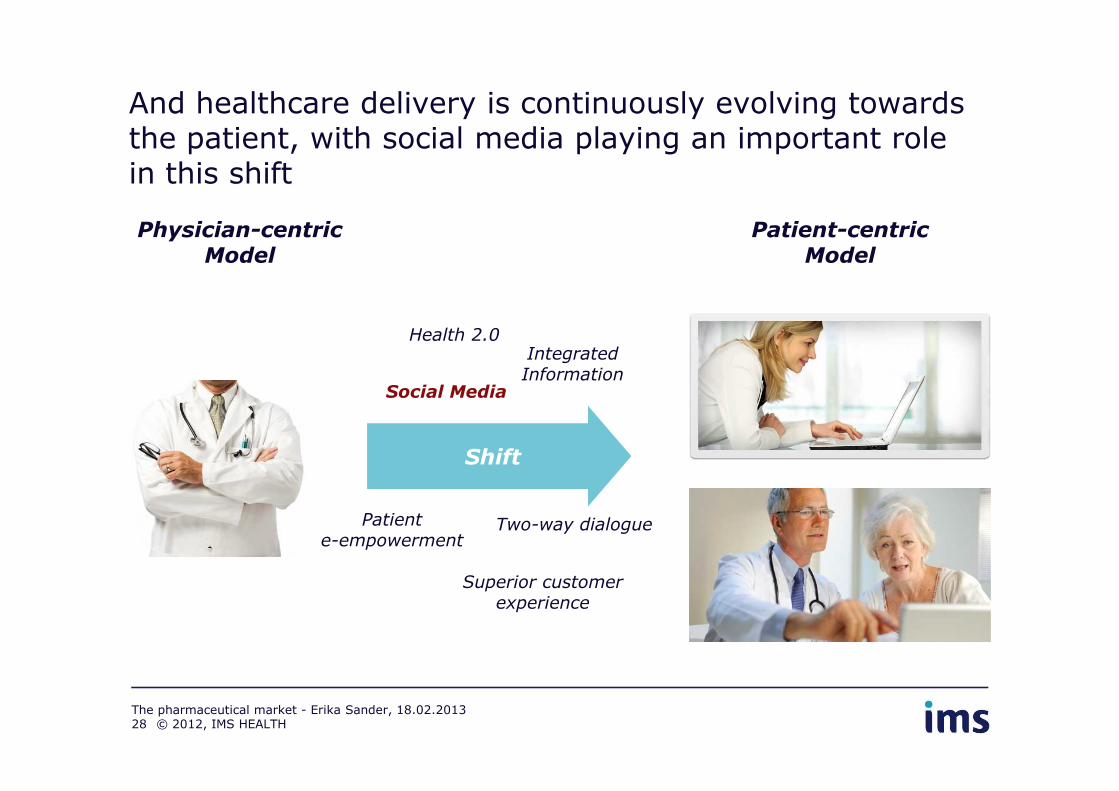
And healthcare delivery is continuously evolving towards the patient, with social media playing an important role in this shift
Physician-centric Model
Patient-centric Model
Health 2.0
Social Media
Integrated Information
Patiente-empowerment
Two-way dialogue
Social Media
Shift
Superior customer experience
© 2012, IMS HEALTHThe pharmaceutical market - Erika Sander, 18.02.201328
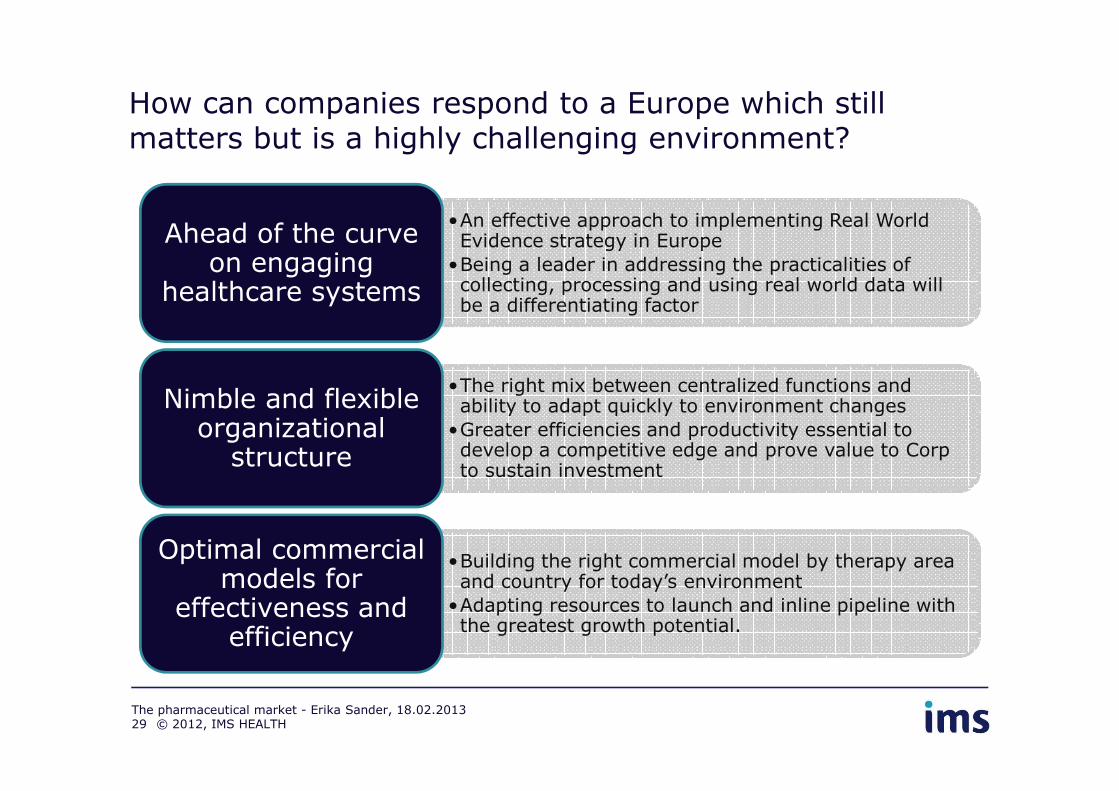
How can companies respond to a Europe which still matters but is a highly challenging environment?
•An effective approach to implementing Real World Evidence strategy in Europe
•Being a leader in addressing the practicalities of collecting, processing and using real world data will be a differentiating factor
Ahead of the curve on engaging
healthcare systems
•The right mix between centralized functions and ability to adapt quickly to environment changesNimble and flexible
•The right mix between centralized functions and ability to adapt quickly to environment changes
•Greater efficiencies and productivity essential to develop a competitive edge and prove value to Corp to sustain investment
Nimble and flexible organizational
structure
•Building the right commercial model by therapy area and country for today’s environment
•Adapting resources to launch and inline pipeline with the greatest growth potential.
Optimal commercial models for
effectiveness and efficiency
© 2012, IMS HEALTHThe pharmaceutical market - Erika Sander, 18.02.201329

Mag. Erika Sander
Senior Manager Commercial, Austria
Prokurist
Phone: +43 1 78 002 11Mobile: +43 664 80 002 110Email: [email protected]<http://www.imshealth.com/>
© 2012, IMS HEALTH GmbH & Co. OHG
Alle Rechte vorbehalten. Die Informationen dürfen weder ganz noch teilweise ohne vorherige ausdrückliche Erlaubnis vonIMS HEALTH GmbH & Co. OHG vervielfältigt, gespeichert, weiterverarbeitet und in keiner Weise zugänglich gemacht werden.
30
IMS HEALTH GmbH & Co. OHG vervielfältigt, gespeichert, weiterverarbeitet und in keiner Weise zugänglich gemacht werden.
IMS stellt durch den Einsatz modernster Technologien und Verfahren sicher, dass seine Dienstleistungen, unabhängig davonwie die Daten untereinander verknüpft werden, den Datenschutzbestimmungen entsprechen.