Embed Size (px)
Citation preview

Eric Ryland, RHIA, CHDA, CCS, CPC
Manager of Coding
Denver Health Medical Center
Denver, CO
Metrics: Measuring the Impact of CDI and Coder Contributions
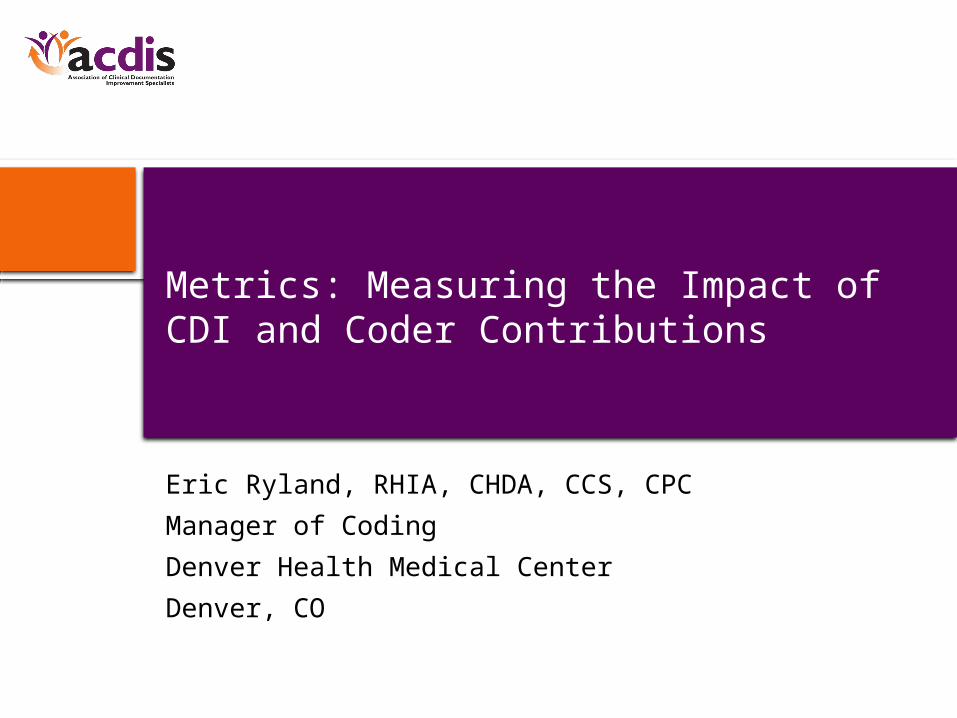
Our Facility
• Denver Health is a level one trauma center
• Located in downtown Denver
• 477 beds
• Multiple hospital-based specialty clinics
• Multiple community healthcare centers
• Medicaid & uninsured are our largest payer groups
• Medicare is our third largest payer
• Teaching facility utilizing residents
Coding Area
• One coding manager and two assistant managers
• 25 coders – inpatient & outpatient
• Two outsourcing companies providing additional coverage for staff vacations and training time
• We code for inpatient DRG accounts, observations, ambulatory surgeries, emergency department account, and for the specialty clinics
• 5-day turnaround time for coding
CDI Area
• One CDI nurse manger
• Three CDI nurses working part time for an equivalent of 2 FTEs
• Primary focus is our Medicare & Medicaid patients
• CDI staff report to the HIM director
• CDI staff attend the monthly coding meetings and maintain a high level of communication with the coding staff
Core Measures & PSI Staff
• Core measures & PSI staff are located in the quality department and report up to the CQO
• One nurse reviews core measures data
• One nurse reviews accounts for PSI, HAC, SOI, and ROM
• The quality department nurses frequently attend coding meetings
Goal
• We want to be able to demonstrate the success of the efforts made by the CDI and the coding staff. This helps:
– Justify the funding for the CDI program
– Support the argument for highly trained coders
– Identify areas of improvement within the CDI or coding teams
– Create a feedback loop between the CDI staff, the coding staff, and the downstream users of the coded data
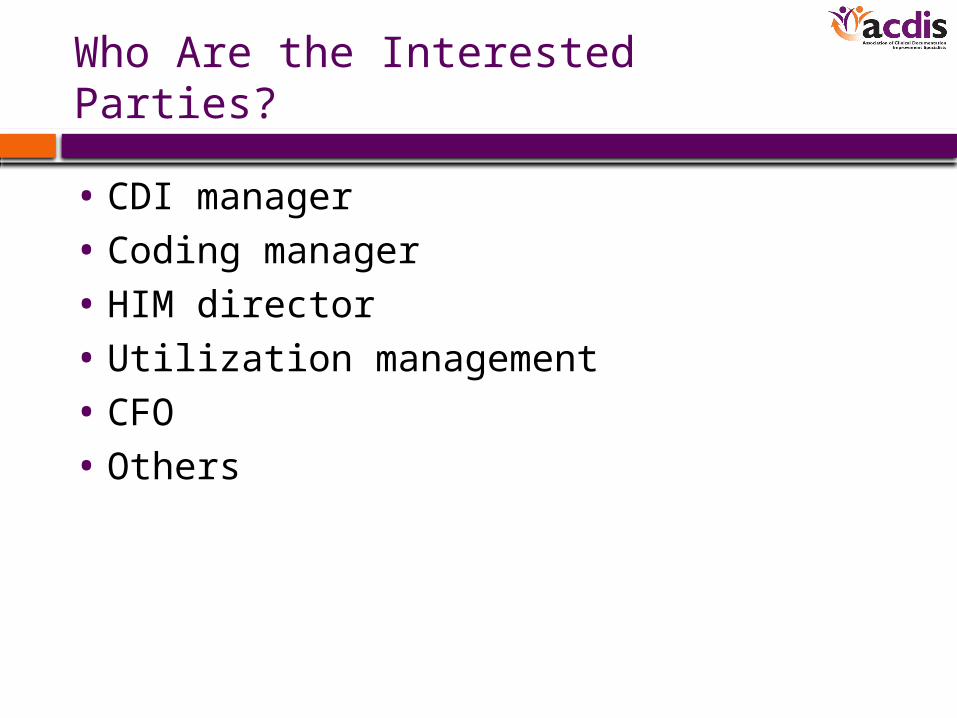
Who Are the Interested Parties?
• CDI manager
• Coding manager
• HIM director
• Utilization management
• CFO
• Others
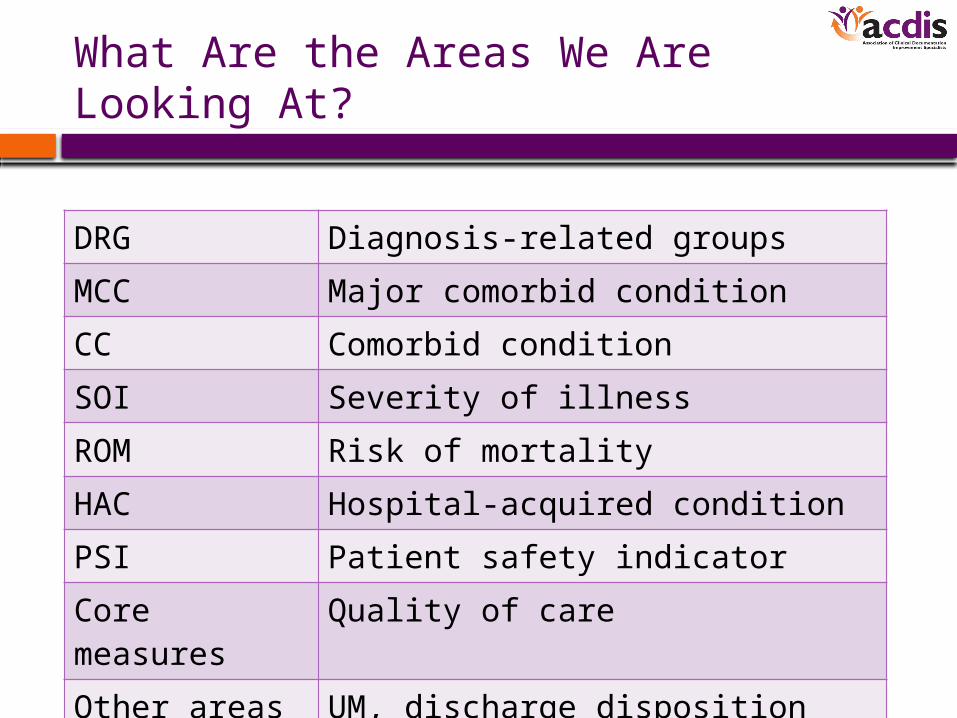
What Are the Areas We Are Looking At?
DRG Diagnosis-related groups
MCC Major comorbid condition
CC Comorbid condition
SOI Severity of illness
ROM Risk of mortality
HAC Hospital-acquired condition
PSI Patient safety indicator
Core measures
Quality of care
Other areas UM, discharge disposition
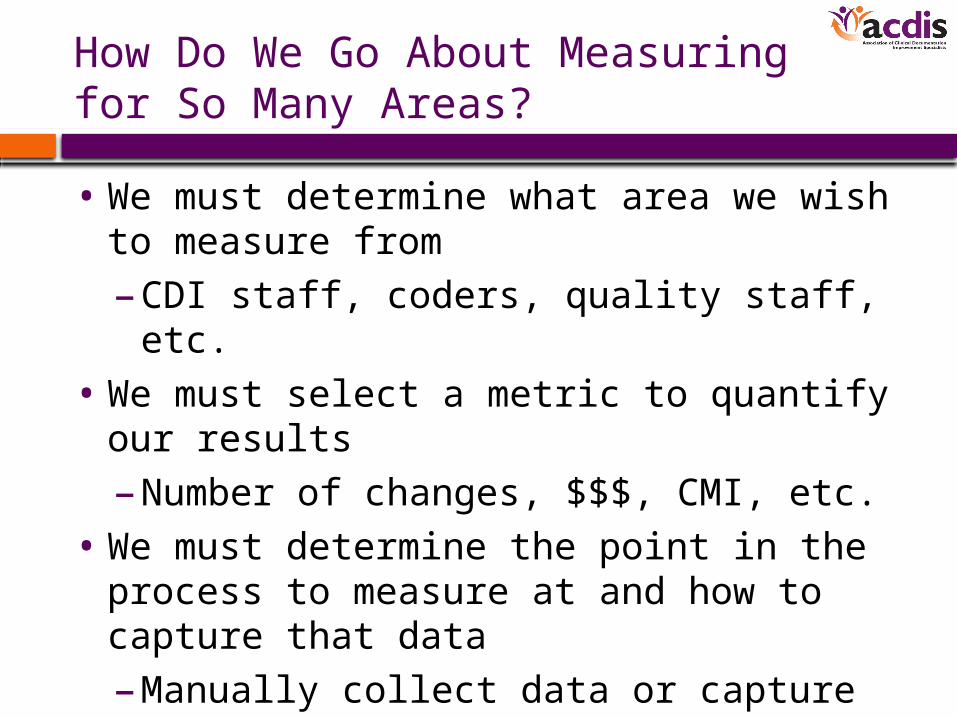
How Do We Go About Measuring for So Many Areas?
• We must determine what area we wish to measure from
– CDI staff, coders, quality staff, etc.
• We must select a metric to quantify our results
– Number of changes, $$$, CMI, etc.
• We must determine the point in the process to measure at and how to capture that data
– Manually collect data or capture data from systems reports
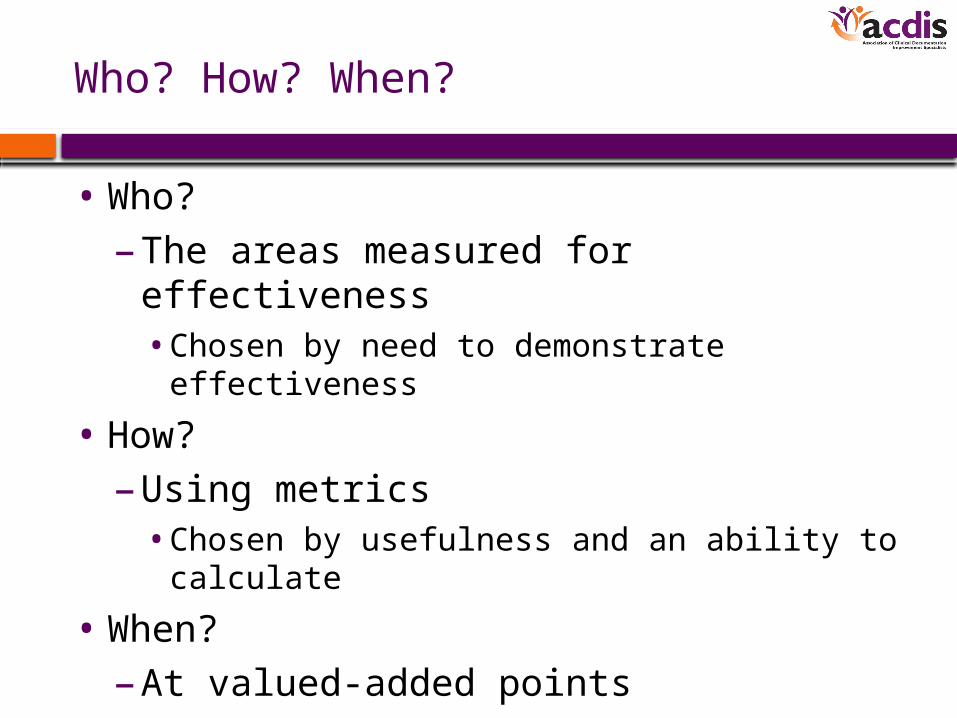
Who? How? When?
• Who?
– The areas measured for effectiveness• Chosen by need to demonstrate effectiveness
• How?
– Using metrics• Chosen by usefulness and an ability to calculate
• When?
– At valued-added points• Determined by reviewing process flow charts
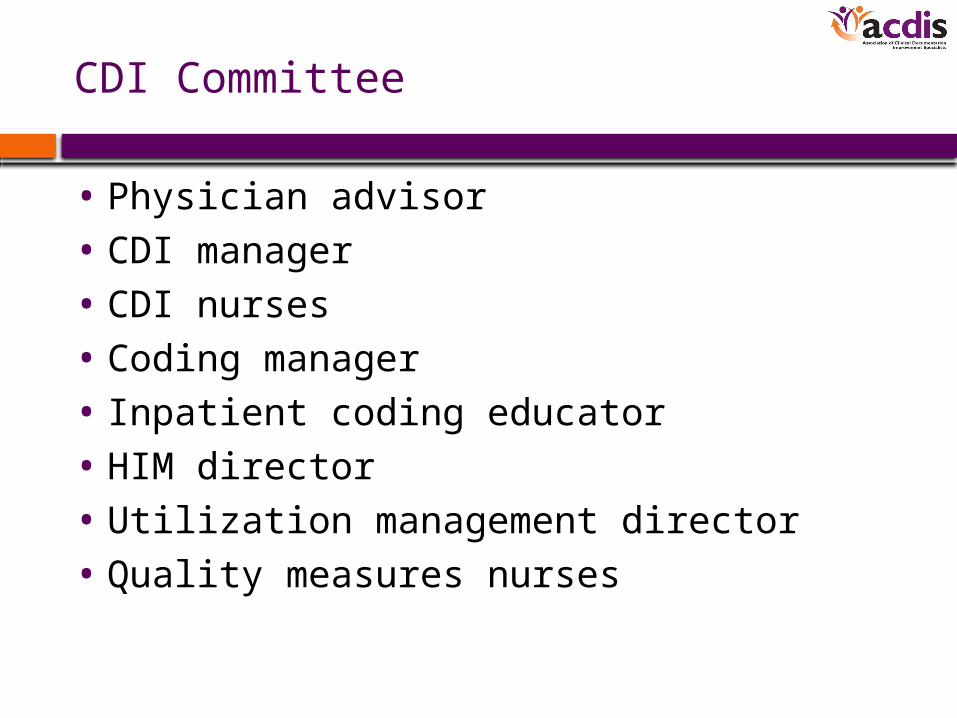
CDI Committee
• Physician advisor
• CDI manager
• CDI nurses
• Coding manager
• Inpatient coding educator
• HIM director
• Utilization management director
• Quality measures nurses
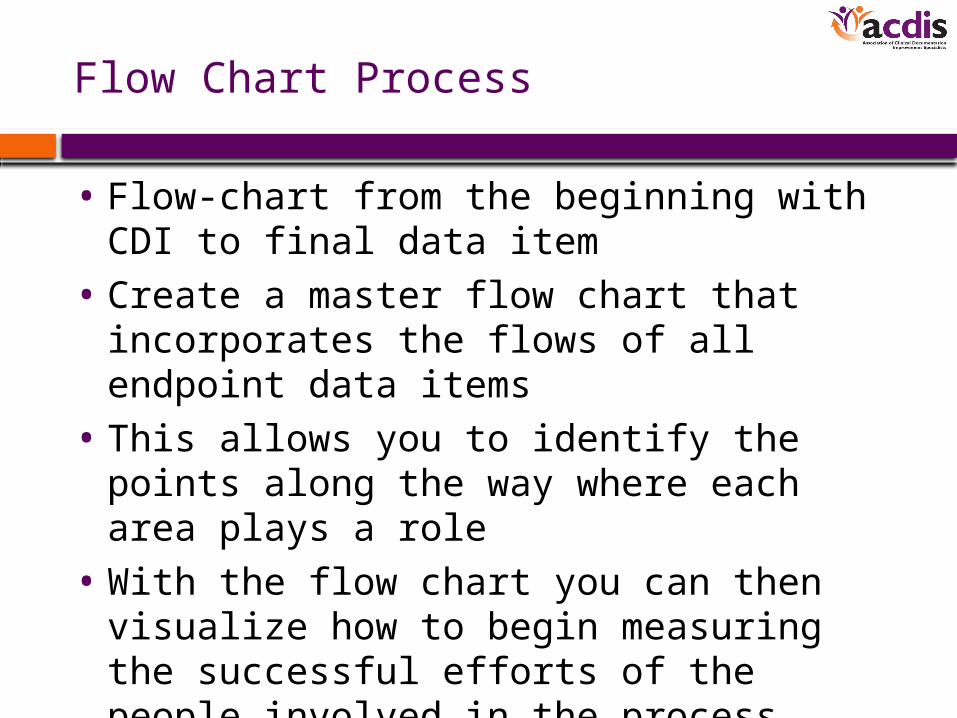
Flow Chart Process
• Flow-chart from the beginning with CDI to final data item
• Create a master flow chart that incorporates the flows of all endpoint data items
• This allows you to identify the points along the way where each area plays a role
• With the flow chart you can then visualize how to begin measuring the successful efforts of the people involved in the process
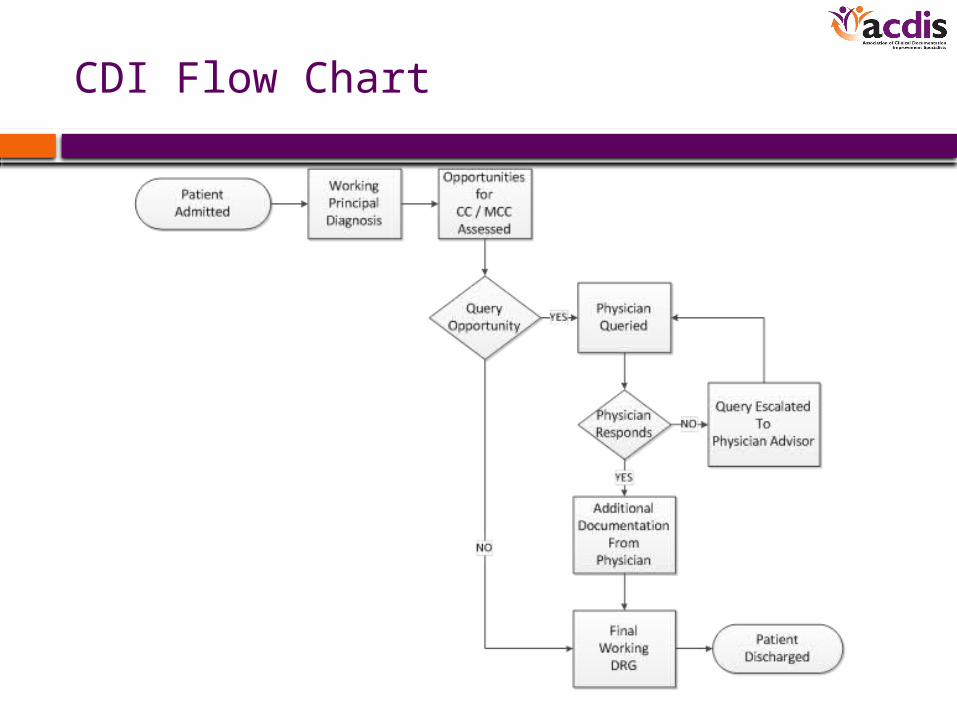
CDI Flow Chart
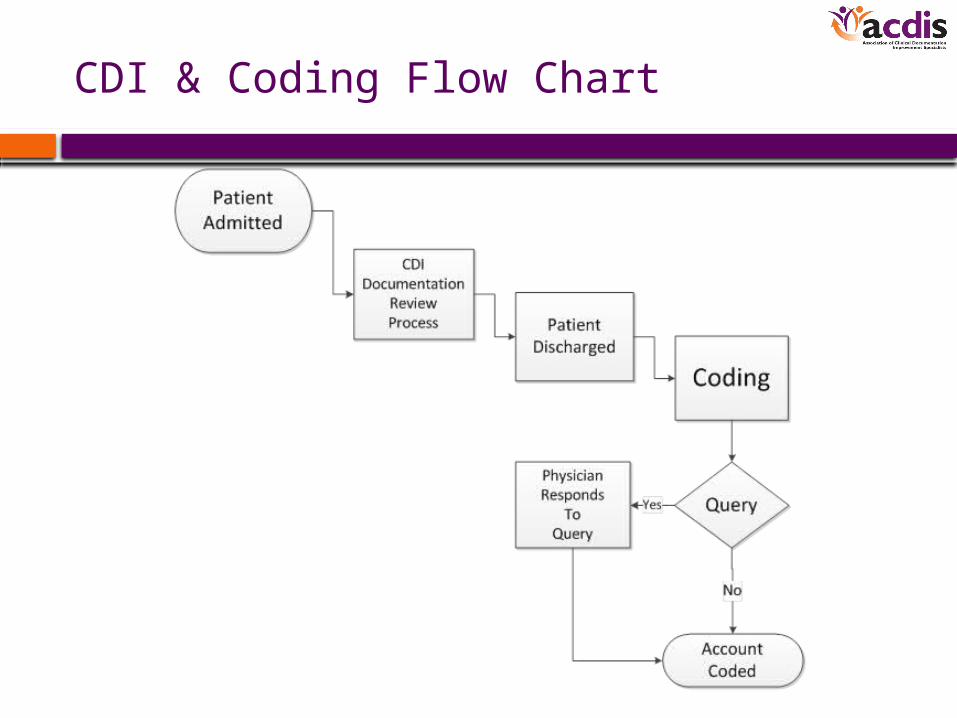
CDI & Coding Flow Chart
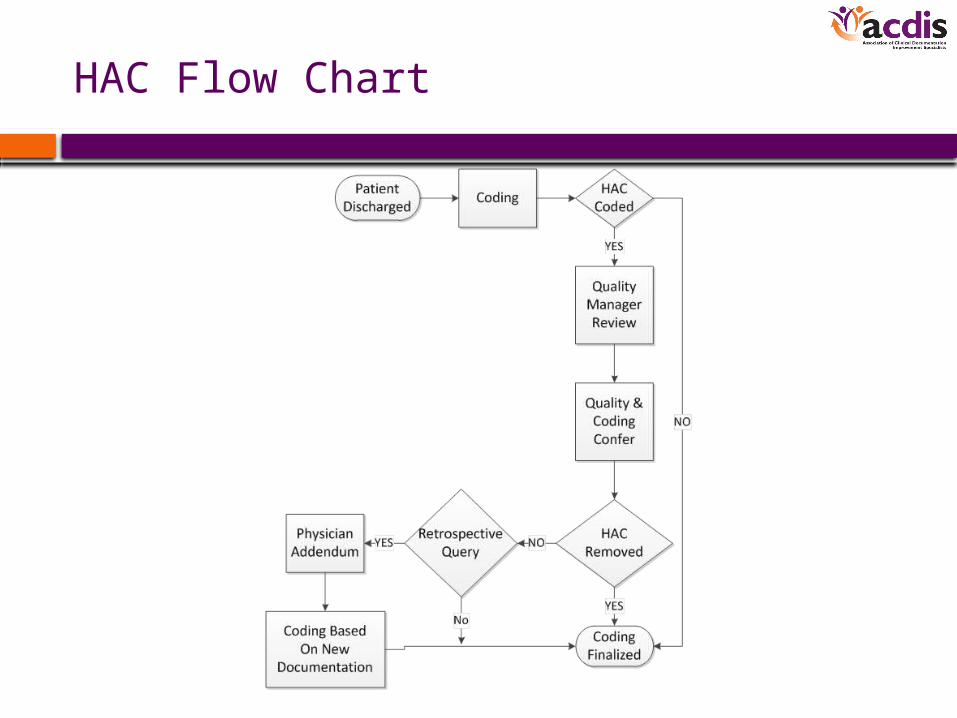
HAC Flow Chart
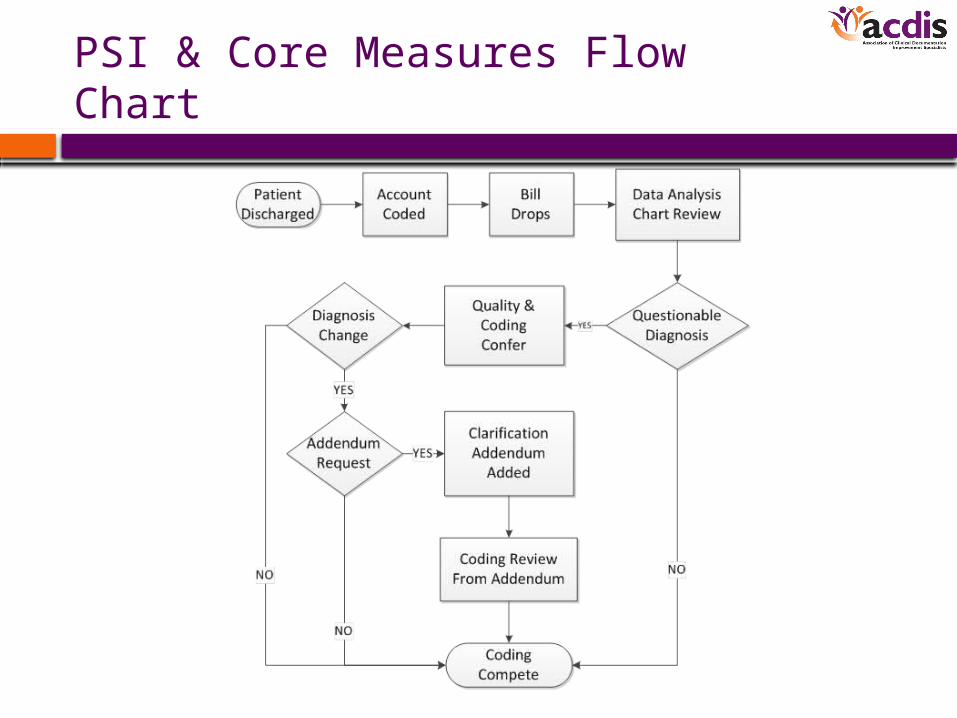
PSI & Core Measures Flow Chart
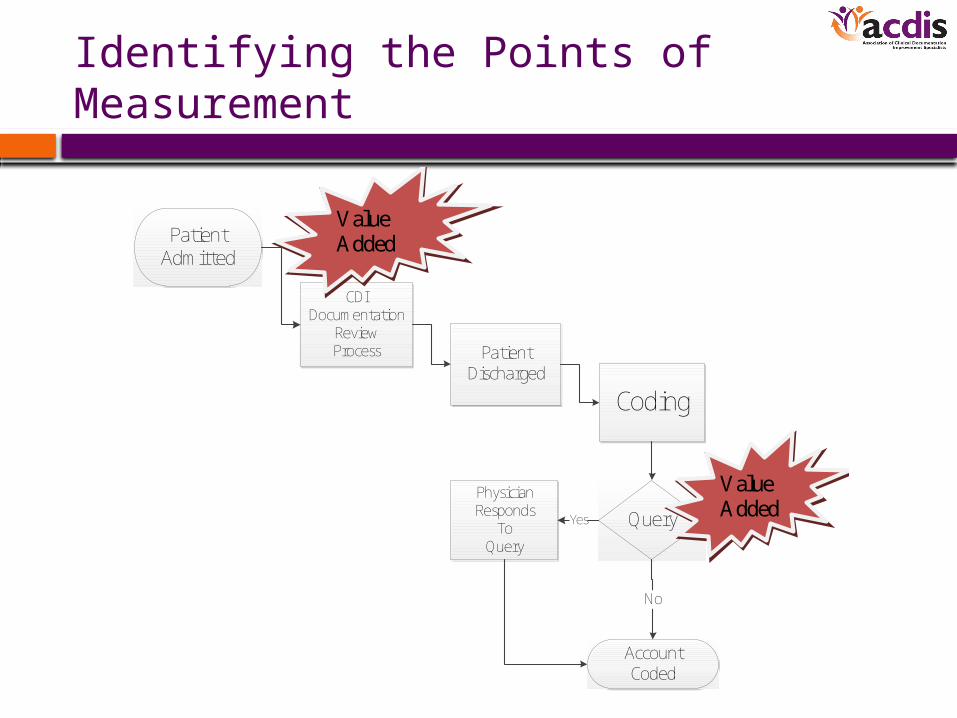
Identifying the Points of Measurement
Patient Admitted
CDIDocumentation
ReviewProcess Patient
Discharged
Coding
Query
AccountCoded
PhysicianResponds
To Query
Yes
No
Value Added
Value Added
How to Quantify the Measurements?
• Numerical count
– A simple count of the number of changes
– Can also be expressed as a percentage
• Dollar increase/decrease
– Revenue increase or decrease resulting from a DRG change
• Change in CMI, SOI, ROM, core measures
– Showing initial and final aggregate scores
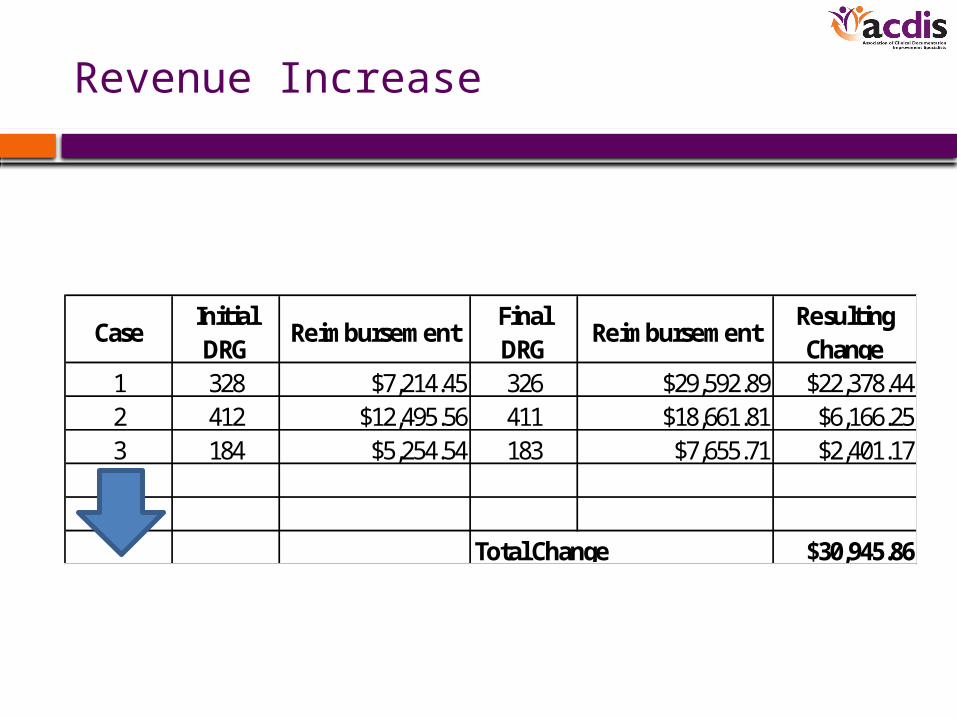
Revenue Increase
CaseInitial DRG
ReimbursementFinal DRG
ReimbursementResulting Change
1 328 $7,214.45 326 $29,592.89 $22,378.442 412 $12,495.56 411 $18,661.81 $6,166.253 184 $5,254.54 183 $7,655.71 $2,401.17
$30,945.86Total Change
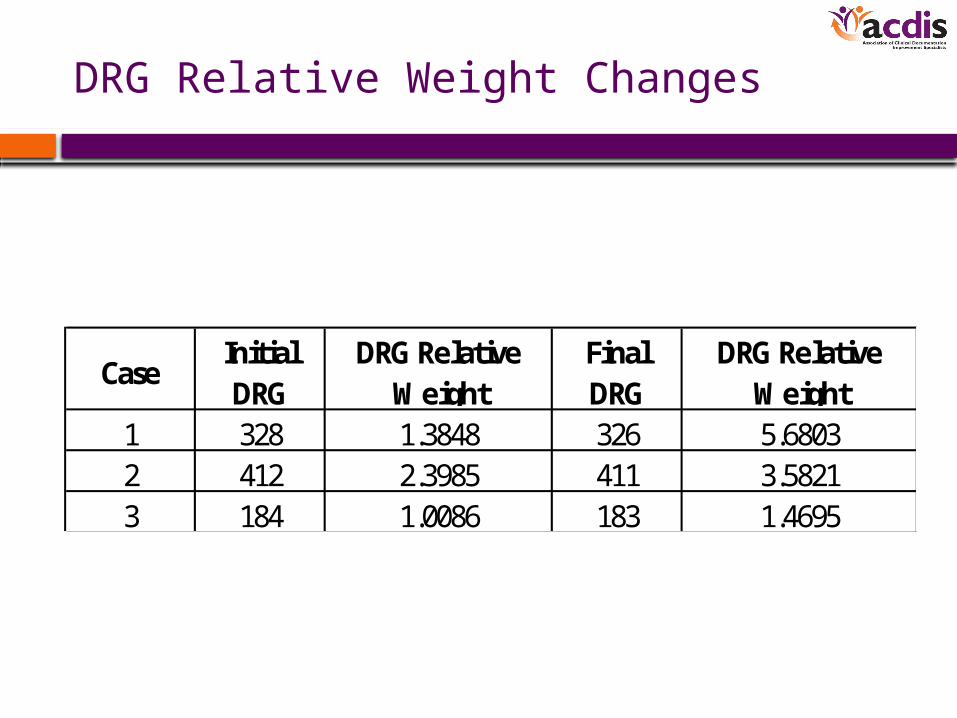
DRG Relative Weight Changes
CaseInitial DRG
DRG Relative Weight
Final DRG
DRG Relative Weight
1 328 1.3848 326 5.68032 412 2.3985 411 3.58213 184 1.0086 183 1.4695
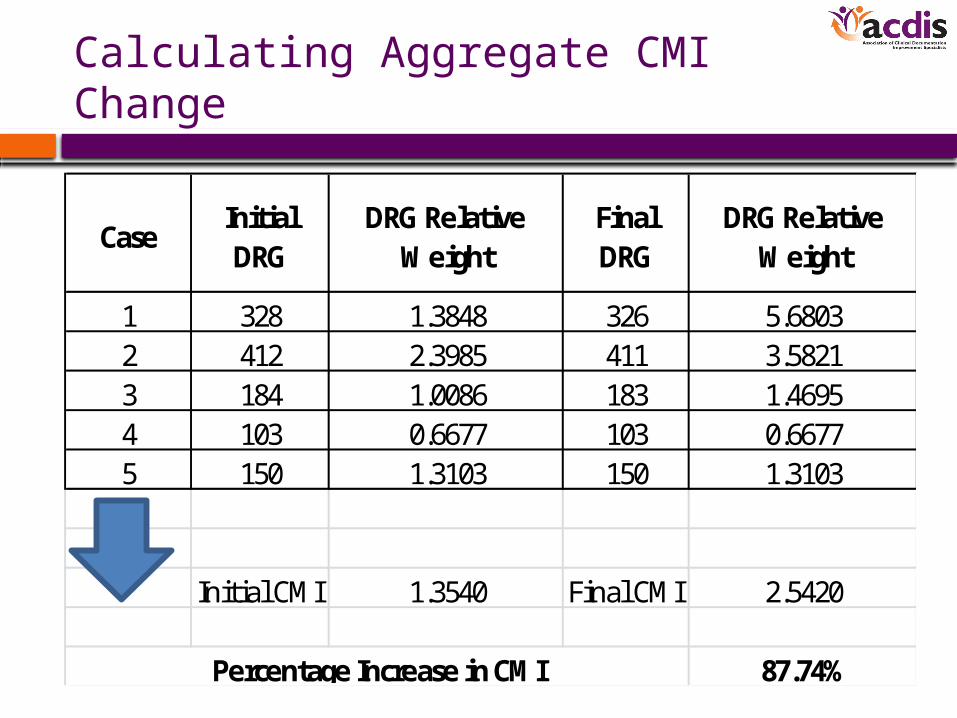
Calculating Aggregate CMI Change
CaseInitial DRG
DRG Relative Weight
Final DRG
DRG Relative Weight
1 328 1.3848 326 5.68032 412 2.3985 411 3.58213 184 1.0086 183 1.46954 103 0.6677 103 0.66775 150 1.3103 150 1.3103
Initial CMI 1.3540 Final CMI 2.5420
87.74%Percentage Increase in CMI
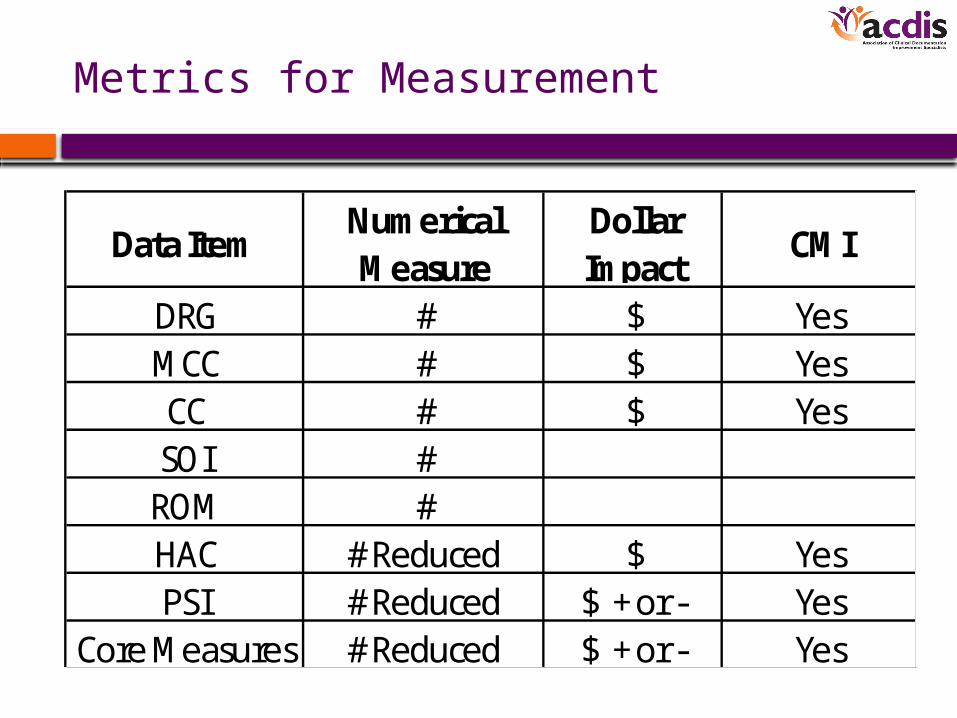
Metrics for Measurement
Data ItemNumerical Measure
Dollar Impact
CMI
DRG # $ YesMCC # $ YesCC # $ YesSOI #
ROM #HAC # Reduced $ YesPSI # Reduced $ + or - Yes
Core Measures # Reduced $ + or - Yes
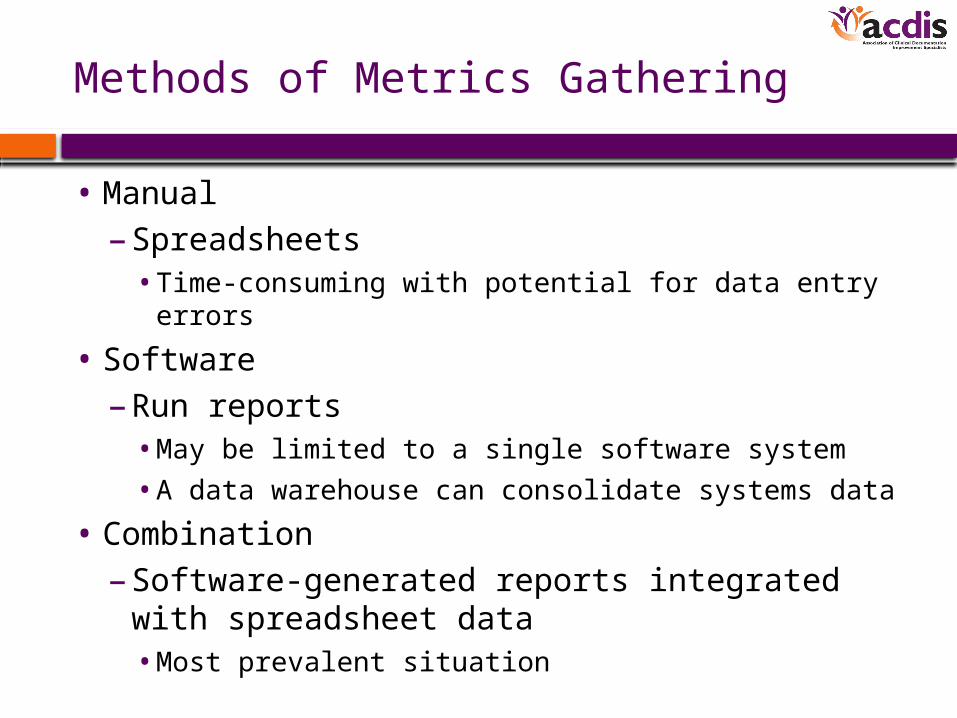
Methods of Metrics Gathering
• Manual
– Spreadsheets• Time-consuming with potential for data entry errors
• Software
– Run reports• May be limited to a single software system
• A data warehouse can consolidate systems data
• Combination
– Software-generated reports integrated with spreadsheet data• Most prevalent situation
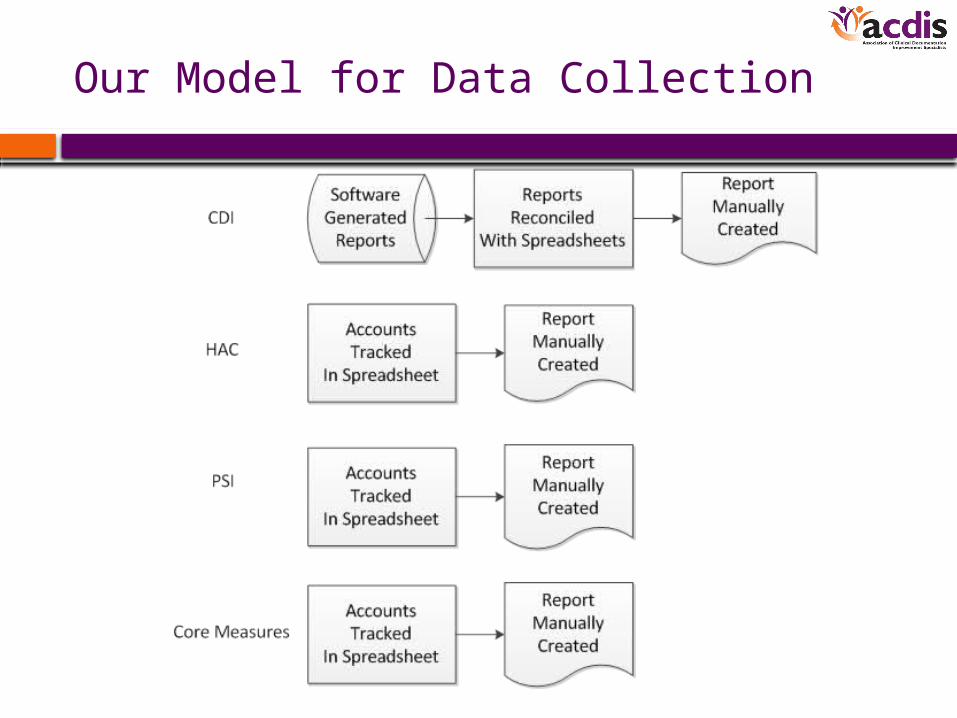
Our Model for Data Collection
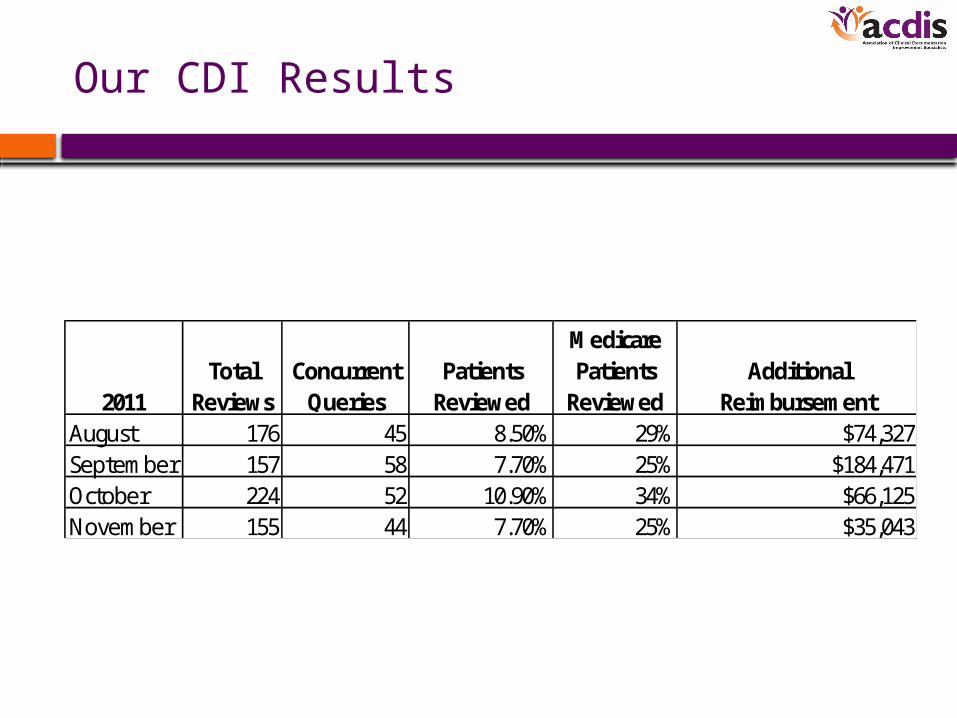
Our CDI Results
2011Total
ReviewsConcurrent
Queries Patients
Reviewed
Medicare Patients
ReviewedAdditional
ReimbursementAugust 176 45 8.50% 29% $74,327September 157 58 7.70% 25% $184,471October 224 52 10.90% 34% $66,125November 155 44 7.70% 25% $35,043
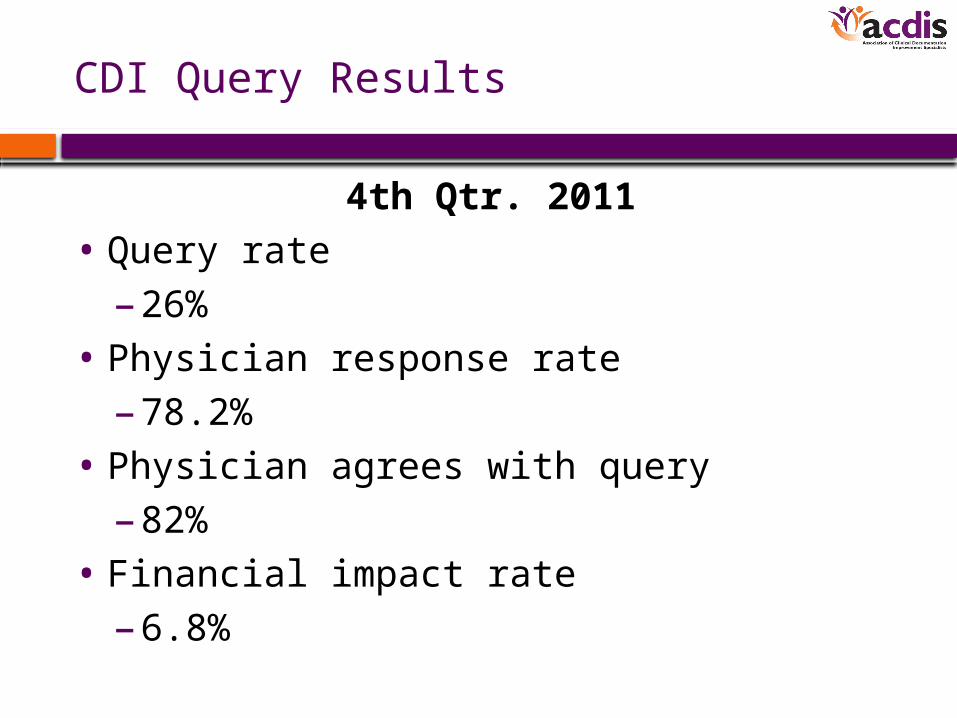
CDI Query Results
4th Qtr. 2011
• Query rate
– 26%
• Physician response rate
– 78.2%
• Physician agrees with query
– 82%
• Financial impact rate
– 6.8%
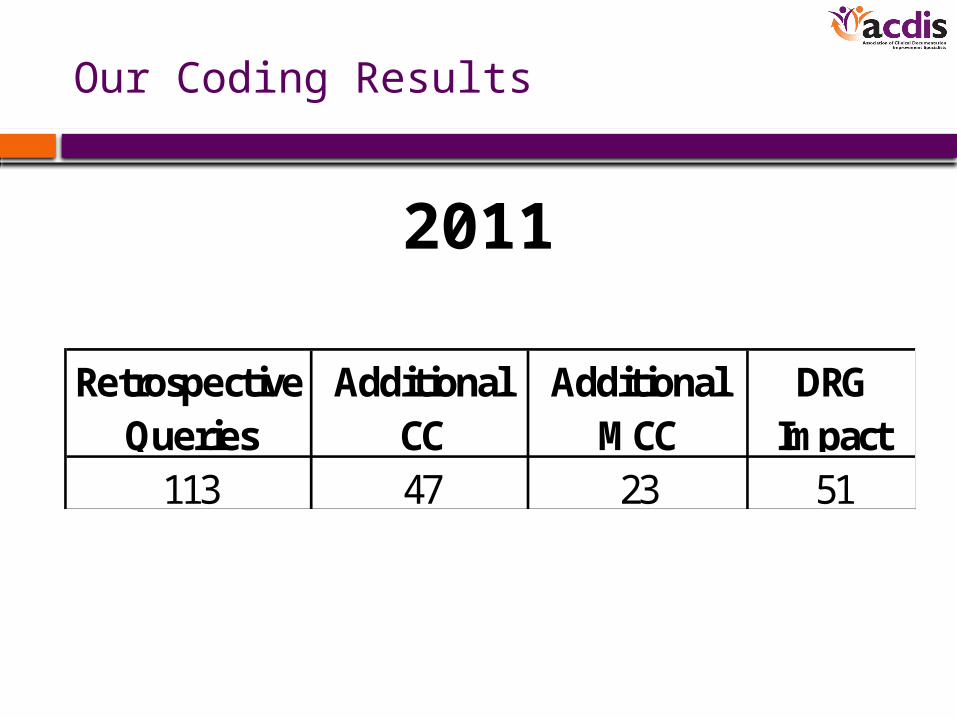
Our Coding Results
Retrospective Queries
Additional CC
Additional MCC
DRG Impact
113 47 23 51
2011
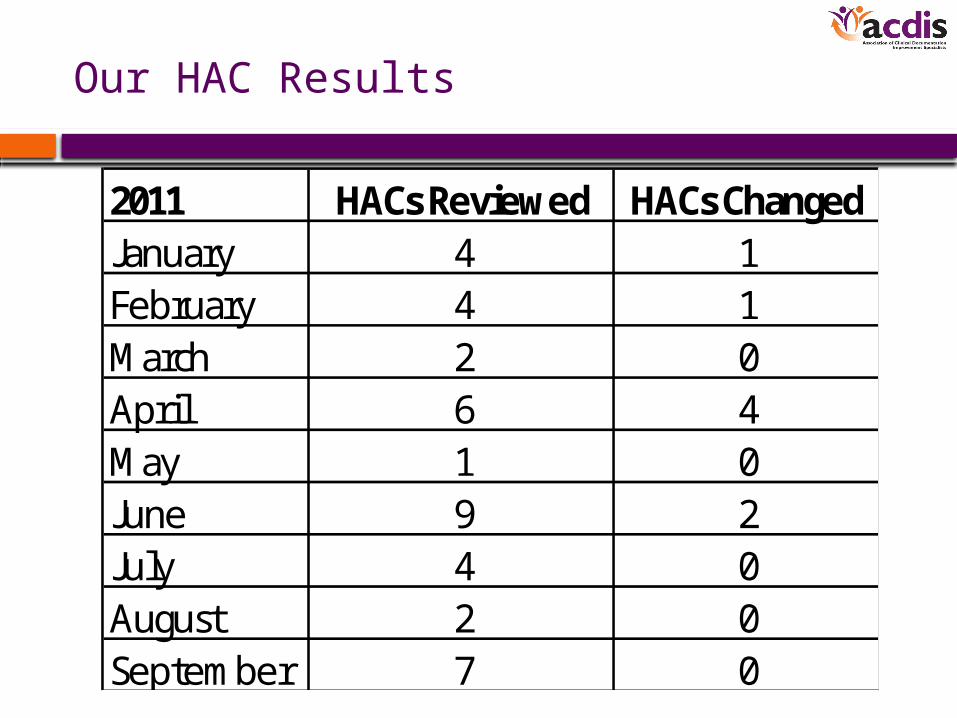
Our HAC Results
2011 HACs Reviewed HACs ChangedJanuary 4 1February 4 1March 2 0April 6 4May 1 0June 9 2July 4 0August 2 0September 7 0
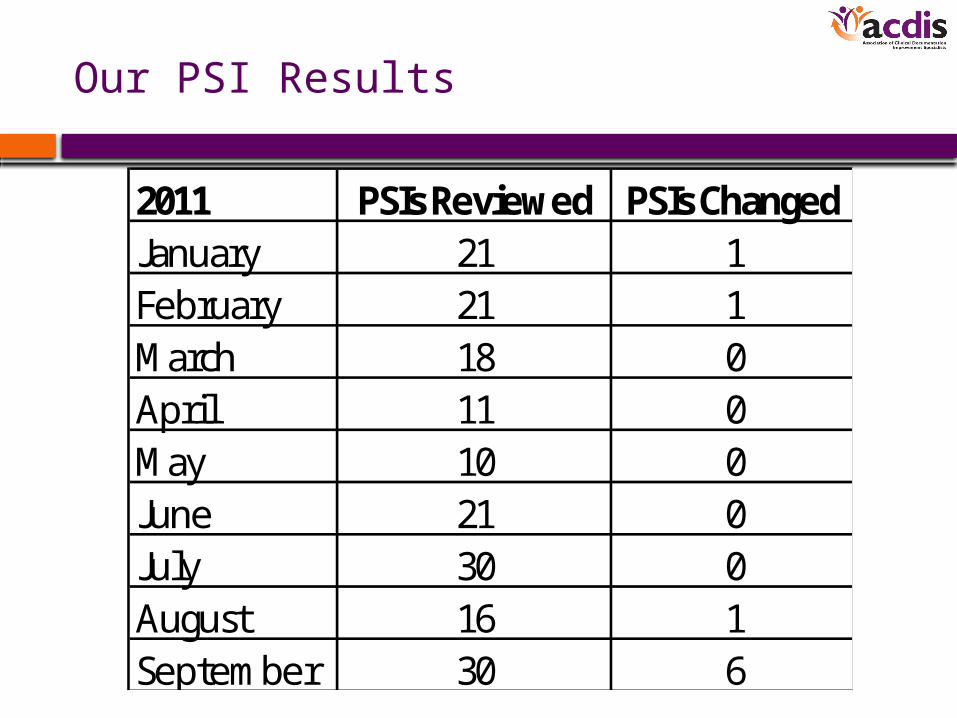
Our PSI Results
2011 PSIs Reviewed PSIs ChangedJanuary 21 1February 21 1March 18 0April 11 0May 10 0June 21 0July 30 0August 16 1September 30 6
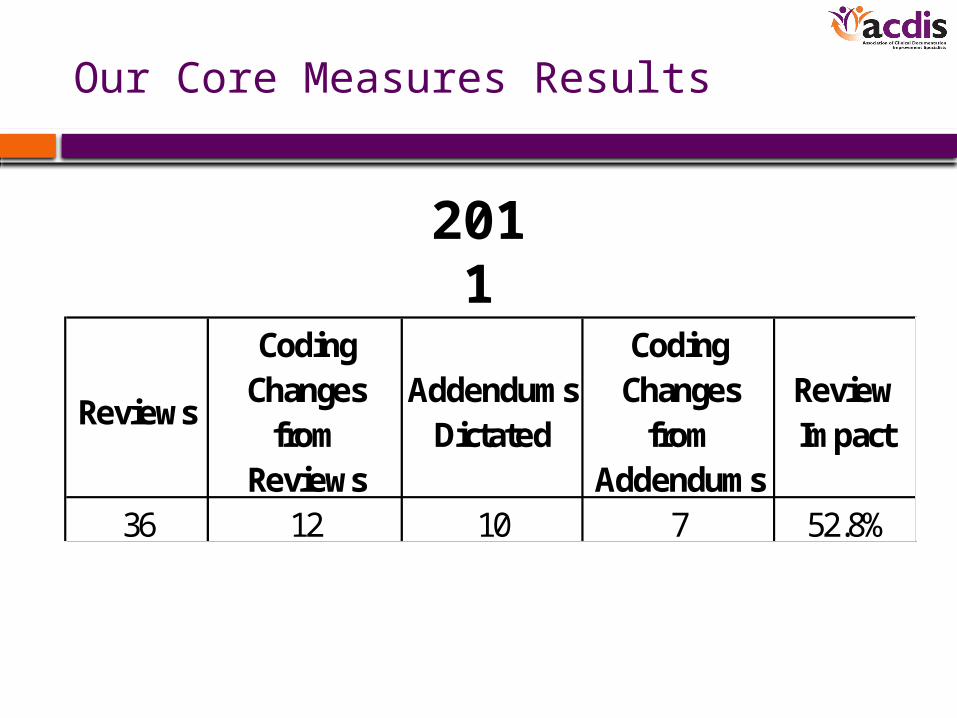
Our Core Measures Results
Reviews
Coding Changes
from Reviews
Addendums Dictated
Coding Changes
from Addendums
Review Impact
36 12 10 7 52.8%
2011
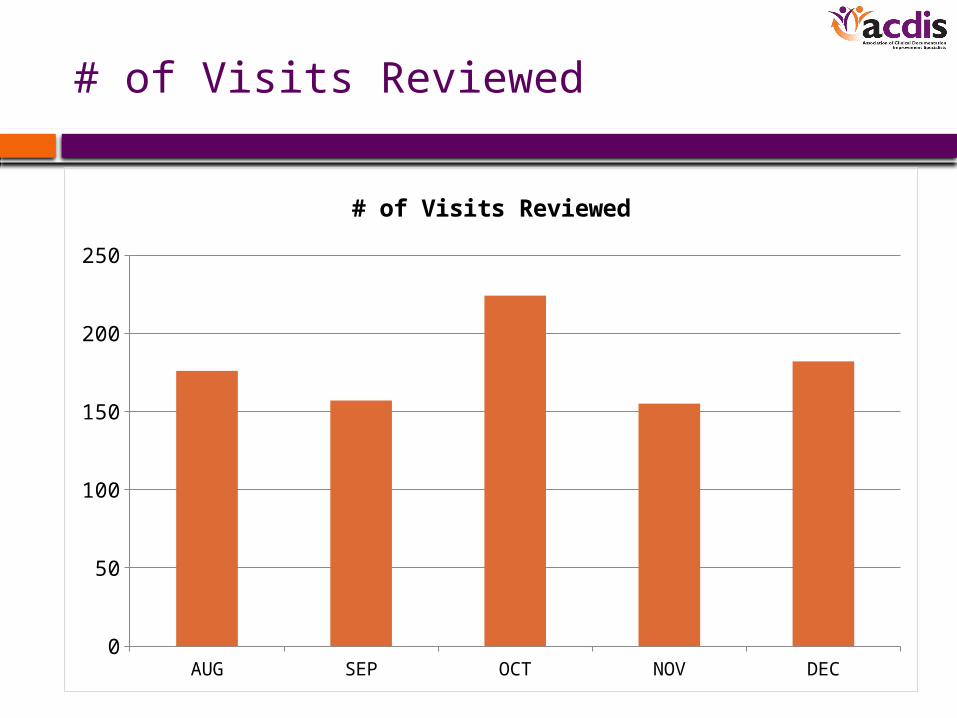
# of Visits Reviewed
AUG SEP OCT NOV DEC0
50
100
150
200
250
# of Visits Reviewed
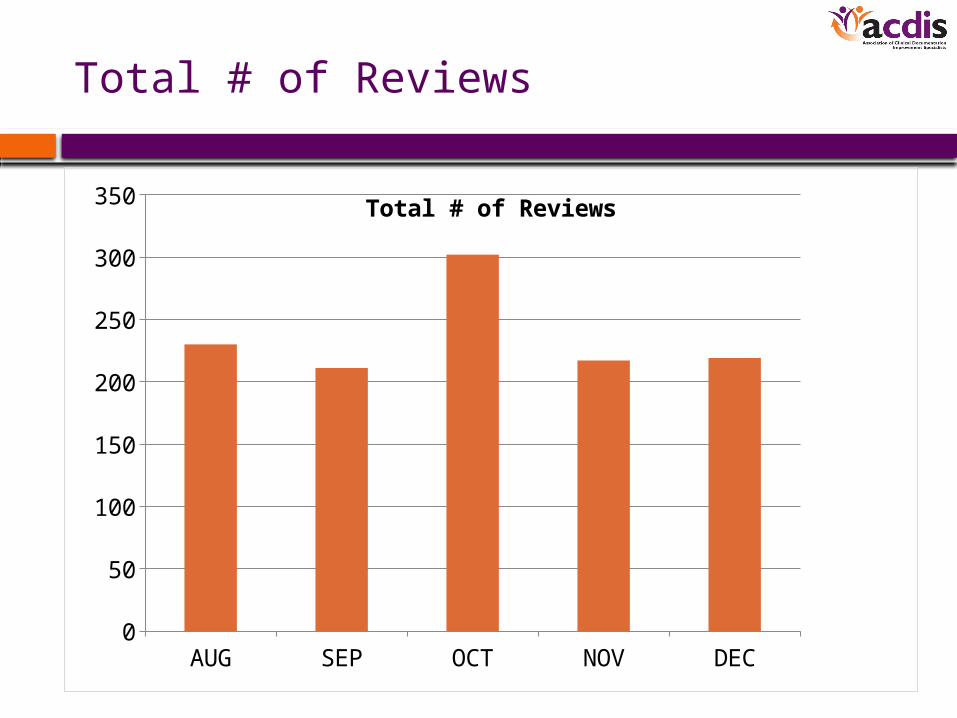
Total # of Reviews
AUG SEP OCT NOV DEC0
50
100
150
200
250
300
350 Total # of Reviews
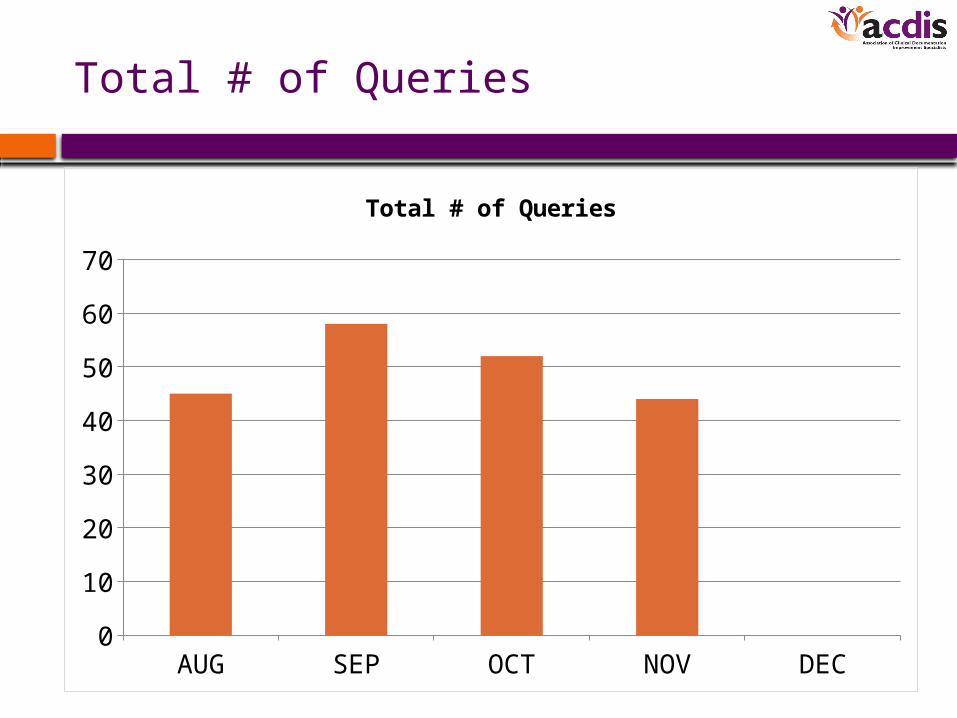
Total # of Queries
AUG SEP OCT NOV DEC0
10
20
30
40
50
60
70
Total # of Queries
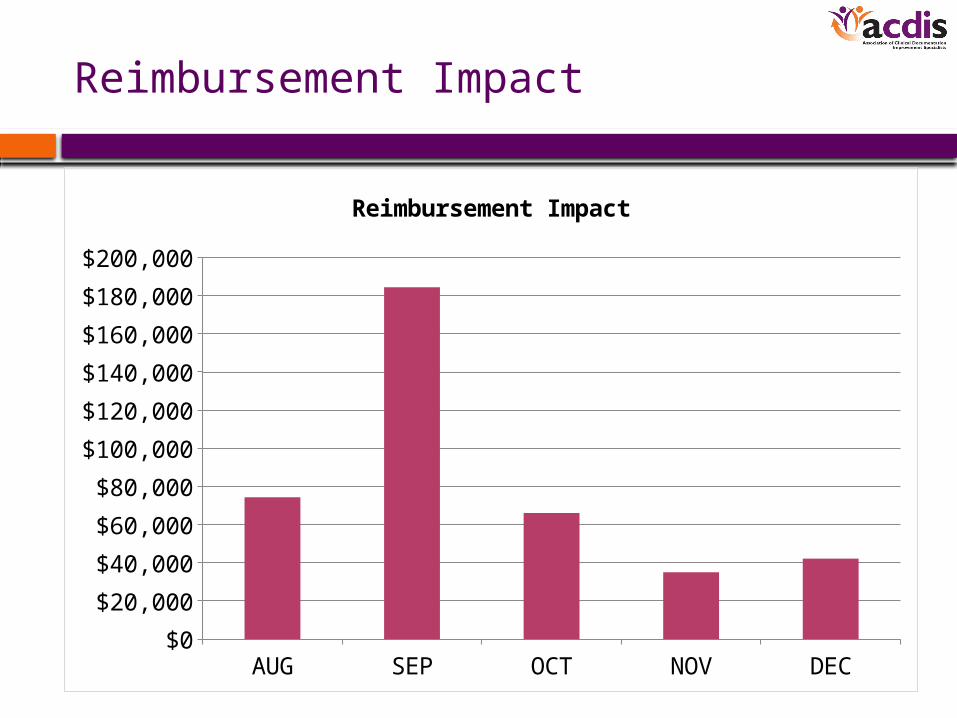
Reimbursement Impact
AUG SEP OCT NOV DEC$0
$20,000
$40,000
$60,000
$80,000
$100,000
$120,000
$140,000
$160,000
$180,000
$200,000
Reimbursement Impact
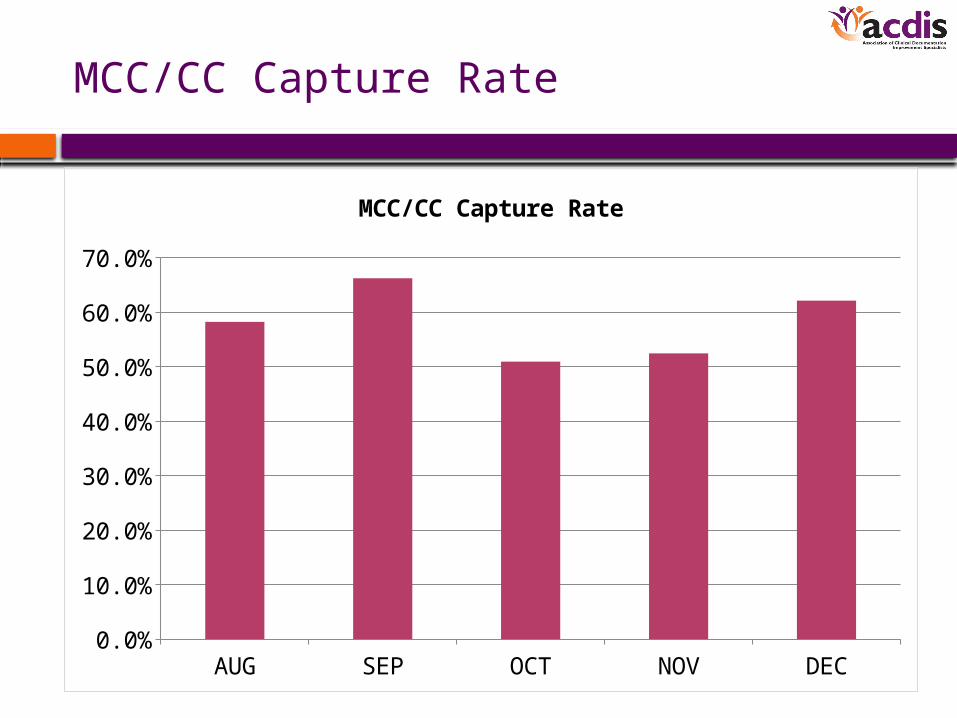
MCC/CC Capture Rate
AUG SEP OCT NOV DEC0.0%
10.0%
20.0%
30.0%
40.0%
50.0%
60.0%
70.0%
MCC/CC Capture Rate
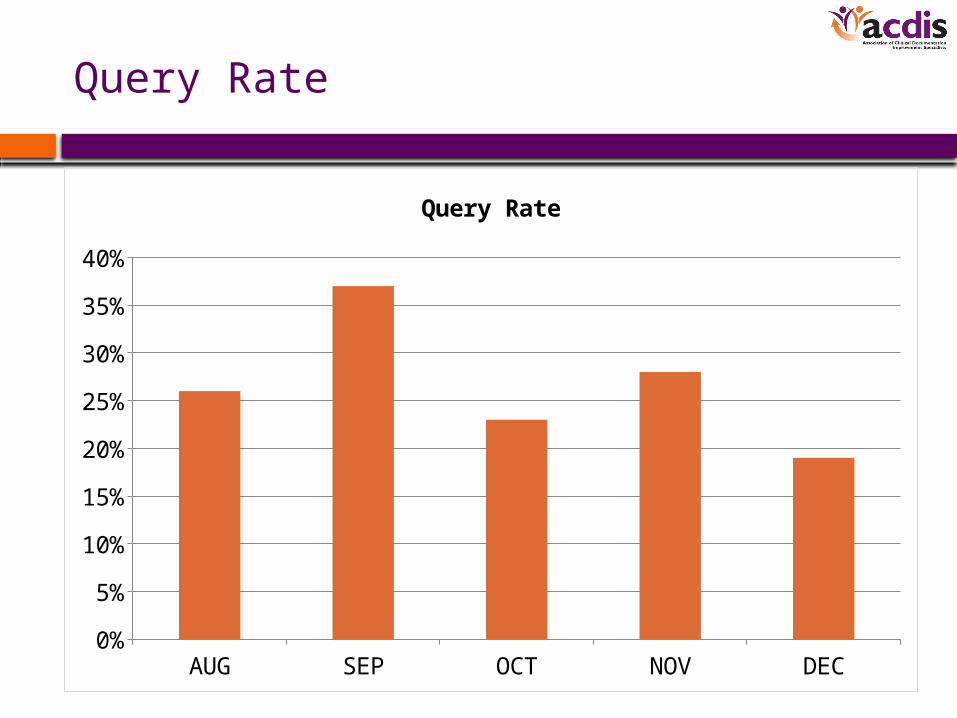
Query Rate
AUG SEP OCT NOV DEC0%
5%
10%
15%
20%
25%
30%
35%
40%
Query Rate
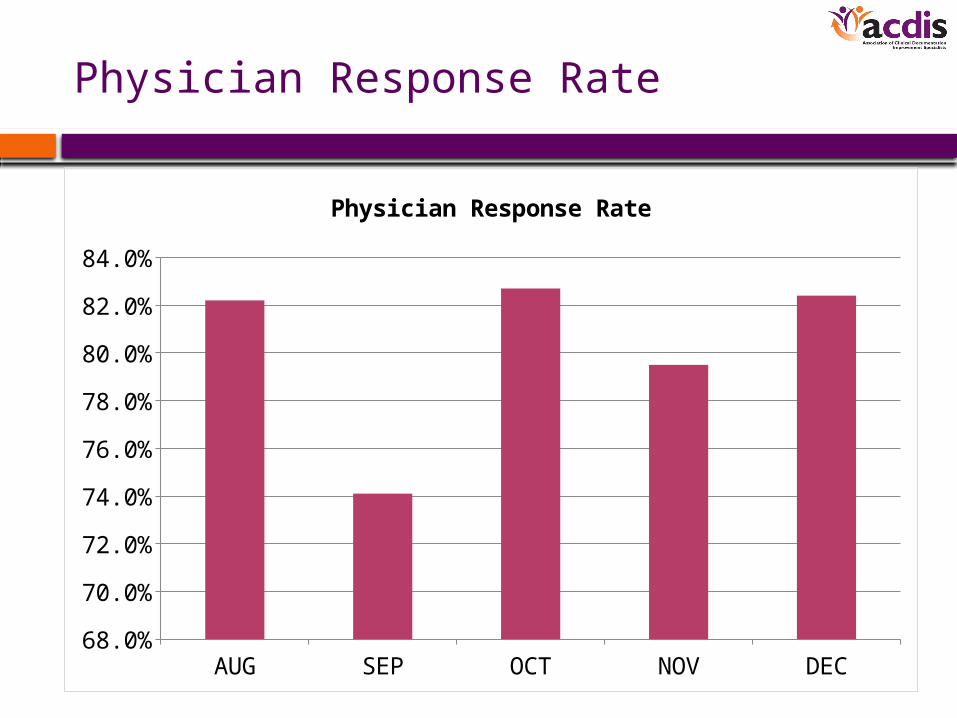
Physician Response Rate
AUG SEP OCT NOV DEC68.0%
70.0%
72.0%
74.0%
76.0%
78.0%
80.0%
82.0%
84.0%
Physician Response Rate
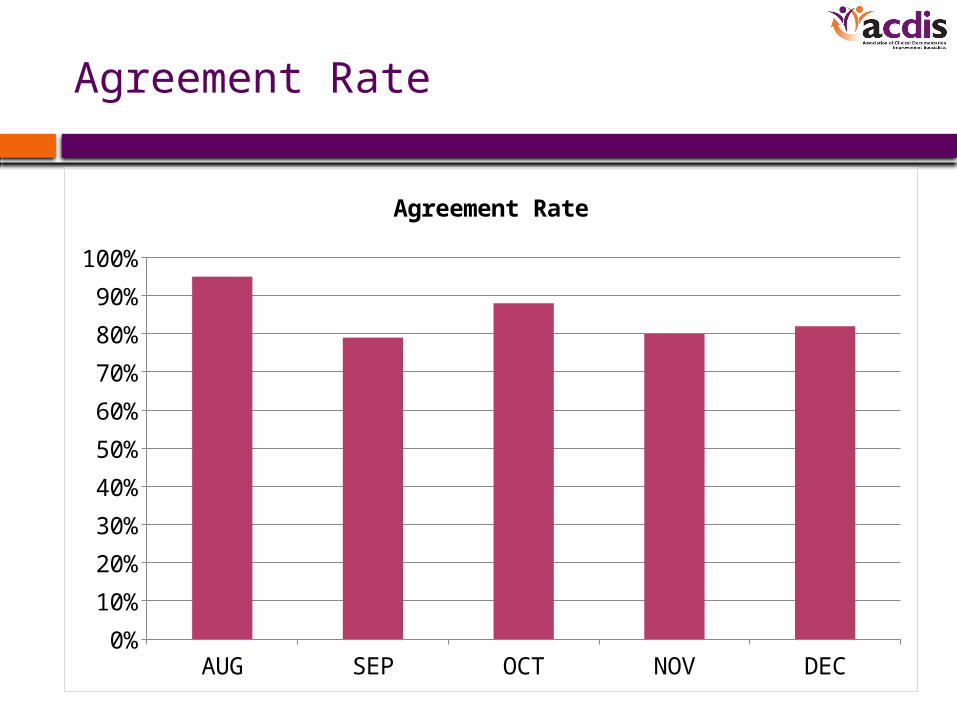
Agreement Rate
AUG SEP OCT NOV DEC0%
10%
20%
30%
40%
50%
60%
70%
80%
90%
100%
Agreement Rate
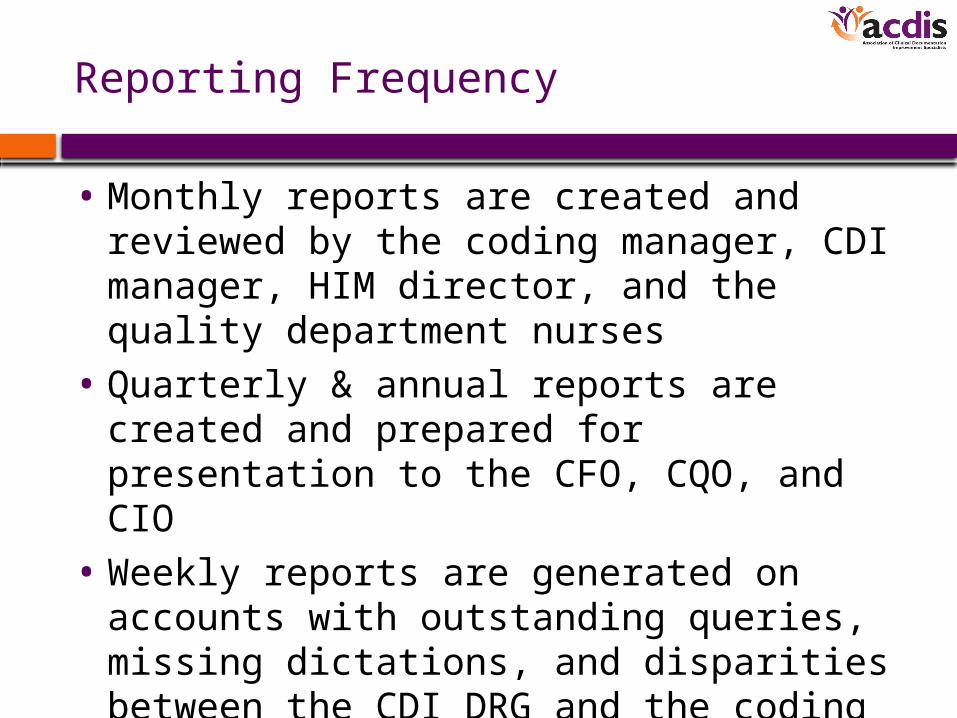
Reporting Frequency
• Monthly reports are created and reviewed by the coding manager, CDI manager, HIM director, and the quality department nurses
• Quarterly & annual reports are created and prepared for presentation to the CFO, CQO, and CIO
• Weekly reports are generated on accounts with outstanding queries, missing dictations, and disparities between the CDI DRG and the coding DRG
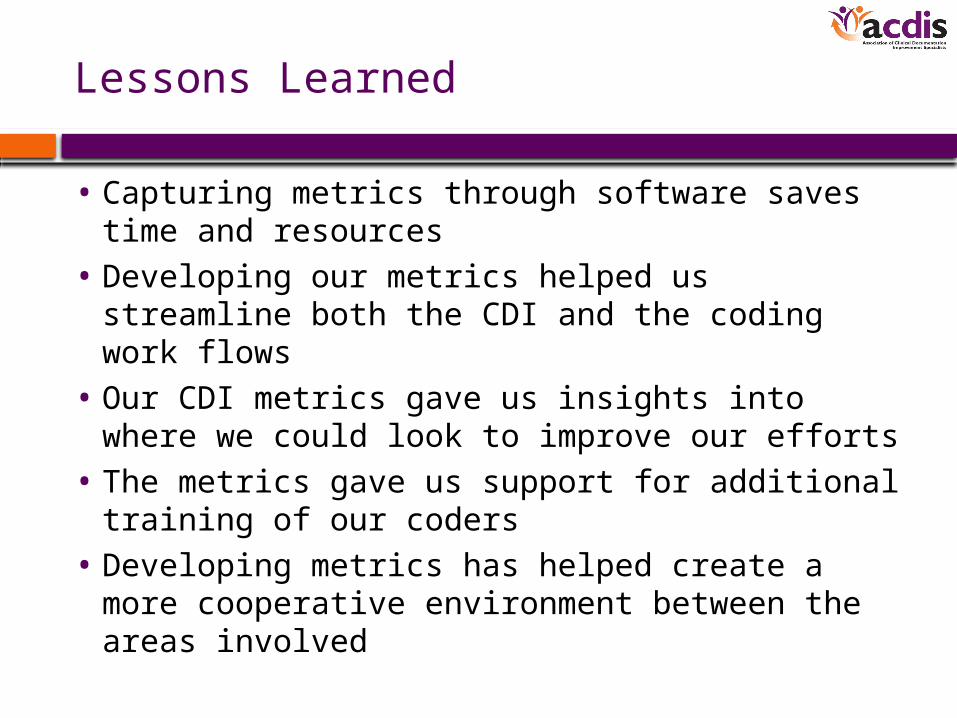
Lessons Learned
• Capturing metrics through software saves time and resources
• Developing our metrics helped us streamline both the CDI and the coding work flows
• Our CDI metrics gave us insights into where we could look to improve our efforts
• The metrics gave us support for additional training of our coders
• Developing metrics has helped create a more cooperative environment between the areas involved
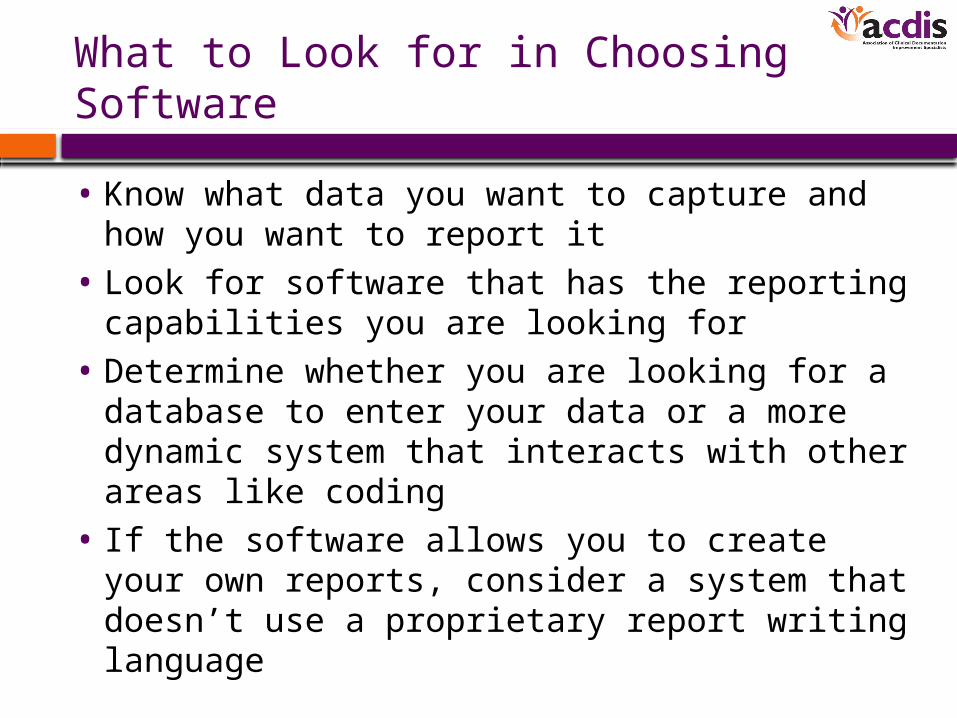
What to Look for in Choosing Software
• Know what data you want to capture and how you want to report it
• Look for software that has the reporting capabilities you are looking for
• Determine whether you are looking for a database to enter your data or a more dynamic system that interacts with other areas like coding
• If the software allows you to create your own reports, consider a system that doesn’t use a proprietary report writing language
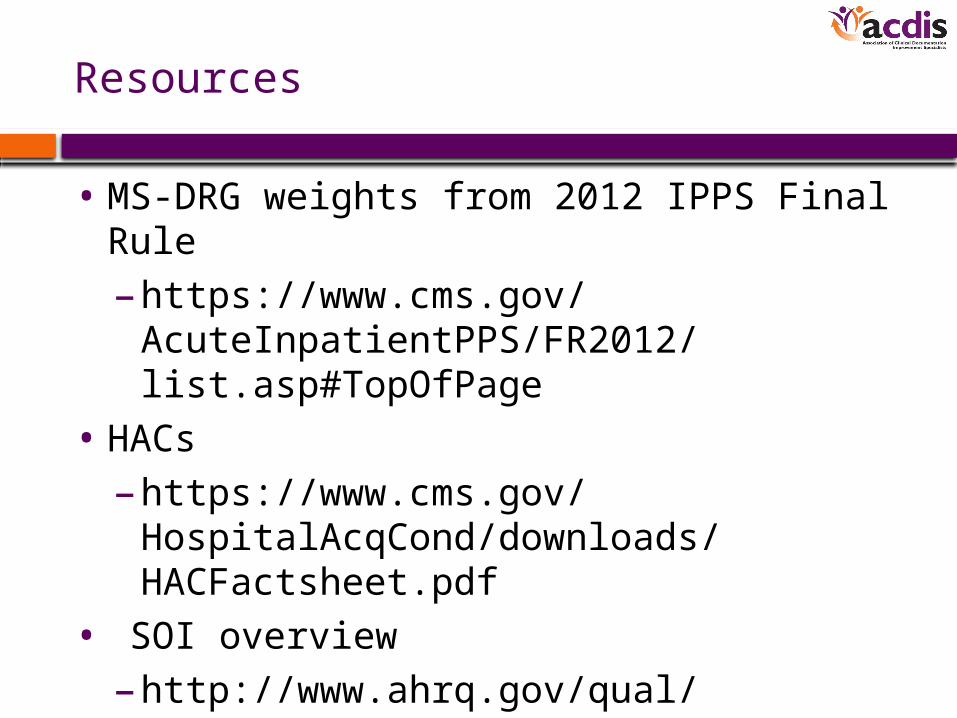
Resources
• MS-DRG weights from 2012 IPPS Final Rule
– https://www.cms.gov/AcuteInpatientPPS/FR2012/list.asp#TopOfPage
• HACs
– https://www.cms.gov/HospitalAcqCond/downloads/HACFactsheet.pdf
• SOI overview
– http://www.ahrq.gov/qual/mortality/Hughessumm.htm

In order to receive your continuing education certificate for this program, you must complete the online evaluation which can be found in the continuing education section at the front of the workbook.
Questions?