Embed Size (px)
Citation preview
Equity
Investment Philosophy & Process
September 2019

Content
2
Investment Philosophy
Team & Structure
Investment Process
Risk Management
Product Offerings
Equity – Investment Philosophy
3
Active Fund Management
▪ Our core investment premise is that equity markets are not fully efficient
▪ A well organized and thorough research effort combined with a disciplined portfolio
management approach will enable out-performance of the market index over time
Being True to Mandate
▪ The fund’s investment objective is paramount
▪ Stock selection, Industry and Asset allocation flow from the fund’s objective
▪ No Style ideology; use stock appropriate measures

Equity Team – Structure
4
Figures for Industry experience and Firm tenure may be rounded off. Please also refer slide ‘Fund Management Responsibility. 1Includes 3 dealers. Industry experience numbers as on
September 30, 2019
12 member team1 with 174 years of collective experience
Name RoleIndustry experience
(years)
Tenure with the
Firm
(years)
Taher Badshah Chief Investment Officer - Equities 24 2
Amit Nigam Fund Manager - PMS 18 1
Amit Ganatra Fund Manager 16 12
Pranav Gokhale Fund Manager 17 10
Neelesh Dhamnaskar
Fund Manager
Sectors – Auto & Auto Ancillaries, Real Estate,
Telecommunication Services
14 9
Nitin Gosar
Fund Manager
Sectors – Consumer Discretionary, Consumer Staples,
Healthcare
14 8
Dhimant KothariFund Manager
Sectors – Energy, Materials, Utilities, Financials14 8
Hiten Jain Sectors – Financials, Information Technology 10 3
Rita Tahilramani Sector – Industrials 5 1
Rajeev Bhardwaj Equity Dealer 14 10
Kuber Mannadi Equity Dealer 14 8
Pratik Sanghvi Equity Dealer- PMS 14 4
Equity Team – Coverage
5
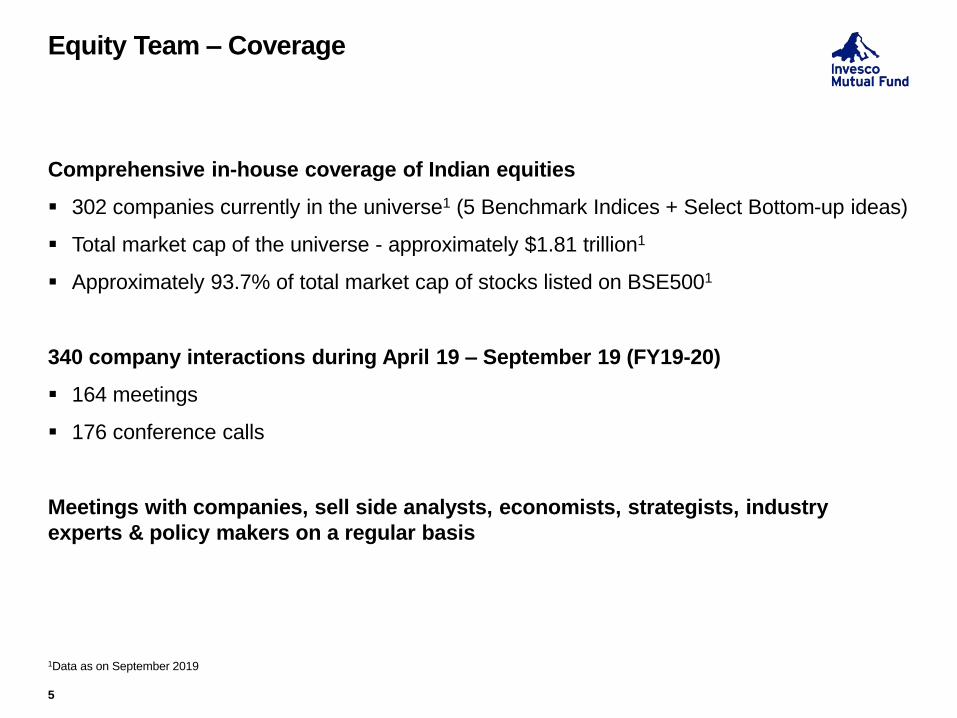
Comprehensive in-house coverage of Indian equities
▪ 302 companies currently in the universe1 (5 Benchmark Indices + Select Bottom-up ideas)
▪ Total market cap of the universe - approximately $1.81 trillion1
▪ Approximately 93.7% of total market cap of stocks listed on BSE5001
340 company interactions during April 19 – September 19 (FY19-20)
▪ 164 meetings
▪ 176 conference calls
Meetings with companies, sell side analysts, economists, strategists, industry
experts & policy makers on a regular basis
1Data as on September 2019
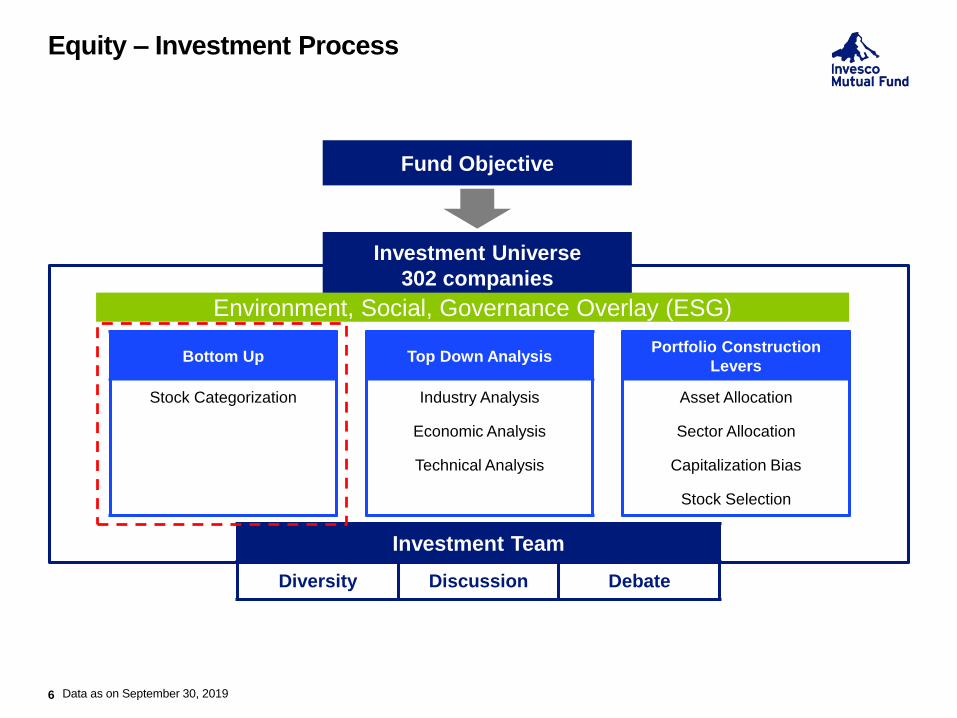
Equity – Investment Process
6
Fund Objective
Investment Universe
302 companies
Bottom Up Top Down AnalysisPortfolio Construction
Levers
Stock Categorization Industry Analysis Asset Allocation
Economic Analysis Sector Allocation
Technical Analysis Capitalization Bias
Stock Selection
Investment Team
Diversity Discussion Debate
Data as on September 30, 2019
Environment, Social, Governance Overlay (ESG)

Stock Categorization Framework
7
P2P: Path to Profit; ROE: Return on Equity
The Stock Categorization Framework is for Internal reference purposes only.
Stock Category
Descriptions
(e.g.)
Growth
Prospects
(e.g.)
Company Attribute
(e.g.)
Financial
Parameter
(e.g.)
Leader Established companies In line with or
better than
industry
Track record of leadership,
globally competitive
Industry leading
margin/ROE
Warrior Young/established
companies
Better than
industry
Unique proposition and/or right
place, right time
Margin & ROE
Expansion
Star Young companies High growth Entrepreneur vision, scalability Operating Leverage
Diamond Company with
valuable assets
Low growth Management intent to
unlock value
Value of
asset/business
Frog Prince Company in a
turnaround situation
Back to growth Intrinsic strengths in
core business
P2P, ROE
expansion
Shotgun Opportunistic
investment
Positive surprise Corporate event, restructuring,
earnings news
Event visibility
Commodities Call on the cycle
is paramount
Positive Integration, cost efficiency,
globally competitive
Profit leverage
The categorization framework enables us to filter the universe and identify the best investment
opportunities
Growth
Value
Event
Leader
Attributes: Track record of leadership, globally competitive
8
Source: Company, Bloomberg Estimates. Valuation data as on September 30, 2019.
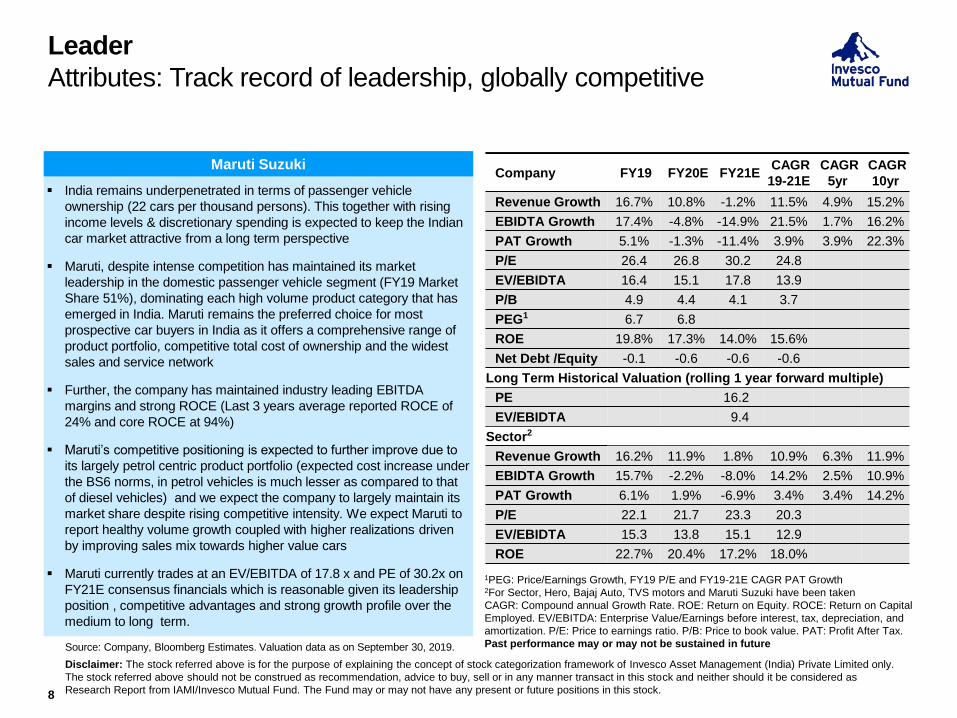
▪ India remains underpenetrated in terms of passenger vehicle
ownership (22 cars per thousand persons). This together with rising
income levels & discretionary spending is expected to keep the Indian
car market attractive from a long term perspective
▪ Maruti, despite intense competition has maintained its market
leadership in the domestic passenger vehicle segment (FY19 Market
Share 51%), dominating each high volume product category that has
emerged in India. Maruti remains the preferred choice for most
prospective car buyers in India as it offers a comprehensive range of
product portfolio, competitive total cost of ownership and the widest
sales and service network
▪ Further, the company has maintained industry leading EBITDA
margins and strong ROCE (Last 3 years average reported ROCE of
24% and core ROCE at 94%)
▪ Maruti’s competitive positioning is expected to further improve due to
its largely petrol centric product portfolio (expected cost increase under
the BS6 norms, in petrol vehicles is much lesser as compared to that
of diesel vehicles) and we expect the company to largely maintain its
market share despite rising competitive intensity. We expect Maruti to
report healthy volume growth coupled with higher realizations driven
by improving sales mix towards higher value cars
▪ Maruti currently trades at an EV/EBITDA of 17.8 x and PE of 30.2x on
FY21E consensus financials which is reasonable given its leadership
position , competitive advantages and strong growth profile over the
medium to long term.
Company FY19 FY20E FY21ECAGR
19-21E
CAGR
5yr
CAGR
10yr
Revenue Growth 16.7% 10.8% -1.2% 11.5% 4.9% 15.2%
EBIDTA Growth 17.4% -4.8% -14.9% 21.5% 1.7% 16.2%
PAT Growth 5.1% -1.3% -11.4% 3.9% 3.9% 22.3%
P/E 26.4 26.8 30.2 24.8
EV/EBIDTA 16.4 15.1 17.8 13.9
P/B 4.9 4.4 4.1 3.7
PEG1 6.7 6.8
ROE 19.8% 17.3% 14.0% 15.6%
Net Debt /Equity -0.1 -0.6 -0.6 -0.6
Long Term Historical Valuation (rolling 1 year forward multiple)
PE 16.2
EV/EBIDTA 9.4
Sector2
Revenue Growth 16.2% 11.9% 1.8% 10.9% 6.3% 11.9%
EBIDTA Growth 15.7% -2.2% -8.0% 14.2% 2.5% 10.9%
PAT Growth 6.1% 1.9% -6.9% 3.4% 3.4% 14.2%
P/E 22.1 21.7 23.3 20.3
EV/EBIDTA 15.3 13.8 15.1 12.9
ROE 22.7% 20.4% 17.2% 18.0%
1PEG: Price/Earnings Growth, FY19 P/E and FY19-21E CAGR PAT Growth2For Sector, Hero, Bajaj Auto, TVS motors and Maruti Suzuki have been taken
CAGR: Compound annual Growth Rate. ROE: Return on Equity. ROCE: Return on Capital
Employed. EV/EBITDA: Enterprise Value/Earnings before interest, tax, depreciation, and
amortization. P/E: Price to earnings ratio. P/B: Price to book value. PAT: Profit After Tax.
Past performance may or may not be sustained in future
Maruti Suzuki
Disclaimer: The stock referred above is for the purpose of explaining the concept of stock categorization framework of Invesco Asset Management (India) Private Limited only.
The stock referred above should not be construed as recommendation, advice to buy, sell or in any manner transact in this stock and neither should it be considered as
Research Report from IAMI/Invesco Mutual Fund. The Fund may or may not have any present or future positions in this stock.
Warrior
Attributes: Young/established companies, Better than industry/right
place, right time/margin & ROE expansion
9
Source: Company, Bloomberg Estimates. Valuation data as on September 30, 2019
Supreme Industries (SIL)
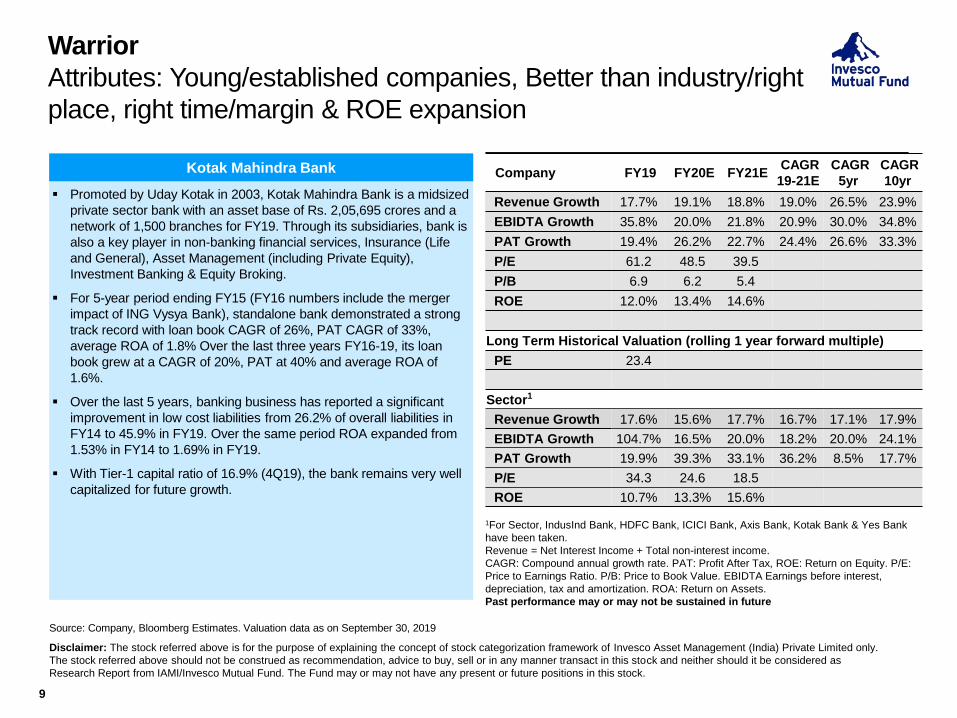
▪ Promoted by Uday Kotak in 2003, Kotak Mahindra Bank is a midsized
private sector bank with an asset base of Rs. 2,05,695 crores and a
network of 1,500 branches for FY19. Through its subsidiaries, bank is
also a key player in non-banking financial services, Insurance (Life
and General), Asset Management (including Private Equity),
Investment Banking & Equity Broking.
▪ For 5-year period ending FY15 (FY16 numbers include the merger
impact of ING Vysya Bank), standalone bank demonstrated a strong
track record with loan book CAGR of 26%, PAT CAGR of 33%,
average ROA of 1.8% Over the last three years FY16-19, its loan
book grew at a CAGR of 20%, PAT at 40% and average ROA of
1.6%.
▪ Over the last 5 years, banking business has reported a significant
improvement in low cost liabilities from 26.2% of overall liabilities in
FY14 to 45.9% in FY19. Over the same period ROA expanded from
1.53% in FY14 to 1.69% in FY19.
▪ With Tier-1 capital ratio of 16.9% (4Q19), the bank remains very well
capitalized for future growth.
1For Sector, IndusInd Bank, HDFC Bank, ICICI Bank, Axis Bank, Kotak Bank & Yes Bank
have been taken.
Revenue = Net Interest Income + Total non-interest income.
CAGR: Compound annual growth rate. PAT: Profit After Tax, ROE: Return on Equity. P/E:
Price to Earnings Ratio. P/B: Price to Book Value. EBIDTA Earnings before interest,
depreciation, tax and amortization. ROA: Return on Assets.
Past performance may or may not be sustained in future
Kotak Mahindra Bank
Disclaimer: The stock referred above is for the purpose of explaining the concept of stock categorization framework of Invesco Asset Management (India) Private Limited only.
The stock referred above should not be construed as recommendation, advice to buy, sell or in any manner transact in this stock and neither should it be considered as
Research Report from IAMI/Invesco Mutual Fund. The Fund may or may not have any present or future positions in this stock.
Company FY19 FY20E FY21ECAGR
19-21E
CAGR
5yr
CAGR
10yr
Revenue Growth 17.7% 19.1% 18.8% 19.0% 26.5% 23.9%
EBIDTA Growth 35.8% 20.0% 21.8% 20.9% 30.0% 34.8%
PAT Growth 19.4% 26.2% 22.7% 24.4% 26.6% 33.3%
P/E 61.2 48.5 39.5
P/B 6.9 6.2 5.4
ROE 12.0% 13.4% 14.6%
Long Term Historical Valuation (rolling 1 year forward multiple)
PE 23.4
Sector1
Revenue Growth 17.6% 15.6% 17.7% 16.7% 17.1% 17.9%
EBIDTA Growth 104.7% 16.5% 20.0% 18.2% 20.0% 24.1%
PAT Growth 19.9% 39.3% 33.1% 36.2% 8.5% 17.7%
P/E 34.3 24.6 18.5
ROE 10.7% 13.3% 15.6%

Star
Attributes: Young companies/high growth/Entrepreneur vision,
scalability/operating leverage
10
Source: Company, Bloomberg Estimates. Valuation data as on September 30, 2019
Gujarat State Petronet (GSPL)
▪ India is becoming a favorable destination for electronics
manufacturing driven by increasing cost of labor in China, favorable
policies of Indian government and levy of import duties, most of the
brands prefer domestic sourcing of their consumer products.
▪ In manufacturing, Dixon Technologies India ltd. (DTIL) has leading
market share in three core sub-segments (Television, Lighting &
Washing Machines), rising prominence of original design
manufacturer (ODM) model and a diversified business profile.
▪ An asset-light balance sheet with strong return ratios and low working
capital cycle coupled with availability of adequate capacity.
▪ Rising share of ODM model where product development and
designing is done in-house has scope to structurally improve the
company margins apart from operating leverage.
▪ DTIL’s new manufacturing facility at Tirupati will enable it to diversify
into TV, CCTV cameras and DVRs as part of further diversification.
Dixon Technologies
Disclaimer: The stock referred above is for the purpose of explaining the concept of stock categorization framework of Invesco Asset Management (India) Private Limited only.
The stock referred above should not be construed as recommendation, advice to buy, sell or in any manner transact in this stock and neither should it be considered as
Research Report from IAMI/Invesco Mutual Fund. The Fund may or may not have any present or future positions in this stock.
1PEG: Price/Earnings Growth, FY18 P/E and FY19-21 CAGR PAT Growth2For Sector, Voltas, Amber and Hitachi have been taken.
Revenue = Net Interest Income + Total Non-Interest Income
CAGR: Compound annual Growth Rate. PAT: Profit After Tax, ROE: Return on Equity.
P/E: Price to Earnings Ratio. P/B: Price to Book Value. EBIDTA: Earnings before interest,
tax, depreciation, and amortization.
Past performance may or may not be sustained in future
Company FY19 FY20E FY21ECAGR
19-21E
CAGR
5yr
CAGR
10yr
Revenue Growth 5.8% 43.2% 17.5% 29.8% 22.4% Na
EBIDTA Growth 7.5% 44.3% 17.9% 30.4% 39.1% Na
PAT Growth 12.2% 44.1% 31.6% 31.6% 38.3% Na
P/E 49.0 34.0 28.3
EV/EBIDTA 24.8 17.3 15.4
P/B 8.8 7.2 5.8
PEG1 1.6
ROE 19.7% 23.2% 22.6%
Long Term Historical Valuation (rolling 1 year forward multiple)
PE 32
EV/EBITA 16
Sector2
Revenue Growth 12.8% 22.4% 14.1% 18.2% 14.7% 11.8%
EBIDTA Growth 18.8% 27.4% 16.6% 21.9% 26.1% 14.5%
PAT Growth 3.0% 26.2% 22.9% 22.9% 23.1% 12.8%
P/E 51.7 41.0 34.2
EV/EBIDTA 33.3 26.2 21.3
ROE 14.8% 16.7% 17.5%
Diamond
Attributes: Company with valuable assets/low growth/ Management
intent to unlock value/value of asset & business
11
Source: Company, Bloomberg Estimates. Valuation data as on September 30, 2019
Gujarat State Petronet (GSPL)
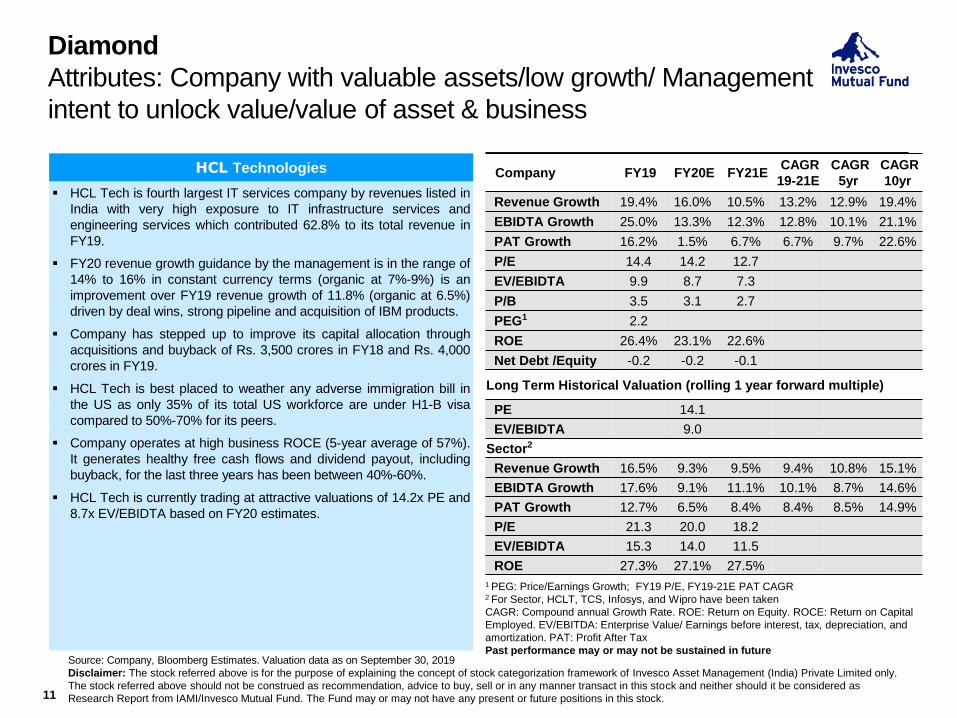
▪ HCL Tech is fourth largest IT services company by revenues listed in
India with very high exposure to IT infrastructure services and
engineering services which contributed 62.8% to its total revenue in
FY19.
▪ FY20 revenue growth guidance by the management is in the range of
14% to 16% in constant currency terms (organic at 7%-9%) is an
improvement over FY19 revenue growth of 11.8% (organic at 6.5%)
driven by deal wins, strong pipeline and acquisition of IBM products.
▪ Company has stepped up to improve its capital allocation through
acquisitions and buyback of Rs. 3,500 crores in FY18 and Rs. 4,000
crores in FY19.
▪ HCL Tech is best placed to weather any adverse immigration bill in
the US as only 35% of its total US workforce are under H1-B visa
compared to 50%-70% for its peers.
▪ Company operates at high business ROCE (5-year average of 57%).
It generates healthy free cash flows and dividend payout, including
buyback, for the last three years has been between 40%-60%.
▪ HCL Tech is currently trading at attractive valuations of 14.2x PE and
8.7x EV/EBIDTA based on FY20 estimates.
HCL Technologies
Disclaimer: The stock referred above is for the purpose of explaining the concept of stock categorization framework of Invesco Asset Management (India) Private Limited only.
The stock referred above should not be construed as recommendation, advice to buy, sell or in any manner transact in this stock and neither should it be considered as
Research Report from IAMI/Invesco Mutual Fund. The Fund may or may not have any present or future positions in this stock.
1 PEG: Price/Earnings Growth; FY19 P/E, FY19-21E PAT CAGR2 For Sector, HCLT, TCS, Infosys, and Wipro have been taken
CAGR: Compound annual Growth Rate. ROE: Return on Equity. ROCE: Return on Capital
Employed. EV/EBITDA: Enterprise Value/ Earnings before interest, tax, depreciation, and
amortization. PAT: Profit After Tax
Past performance may or may not be sustained in future
Company FY19 FY20E FY21ECAGR
19-21E
CAGR
5yr
CAGR
10yr
Revenue Growth 19.4% 16.0% 10.5% 13.2% 12.9% 19.4%
EBIDTA Growth 25.0% 13.3% 12.3% 12.8% 10.1% 21.1%
PAT Growth 16.2% 1.5% 6.7% 6.7% 9.7% 22.6%
P/E 14.4 14.2 12.7
EV/EBIDTA 9.9 8.7 7.3
P/B 3.5 3.1 2.7
PEG1 2.2
ROE 26.4% 23.1% 22.6%
Net Debt /Equity -0.2 -0.2 -0.1
Long Term Historical Valuation (rolling 1 year forward multiple)
PE 14.1
EV/EBIDTA 9.0
Sector2
Revenue Growth 16.5% 9.3% 9.5% 9.4% 10.8% 15.1%
EBIDTA Growth 17.6% 9.1% 11.1% 10.1% 8.7% 14.6%
PAT Growth 12.7% 6.5% 8.4% 8.4% 8.5% 14.9%
P/E 21.3 20.0 18.2
EV/EBIDTA 15.3 14.0 11.5
ROE 27.3% 27.1% 27.5%
Frog prince
Attributes: Company in a turnaround situation / Back to growth /
Intrinsic strengths in core business / P2P, ROE expansion
12
Source: Company, Bloomberg Estimates. Valuation data as on September 30, 2019
Cipl
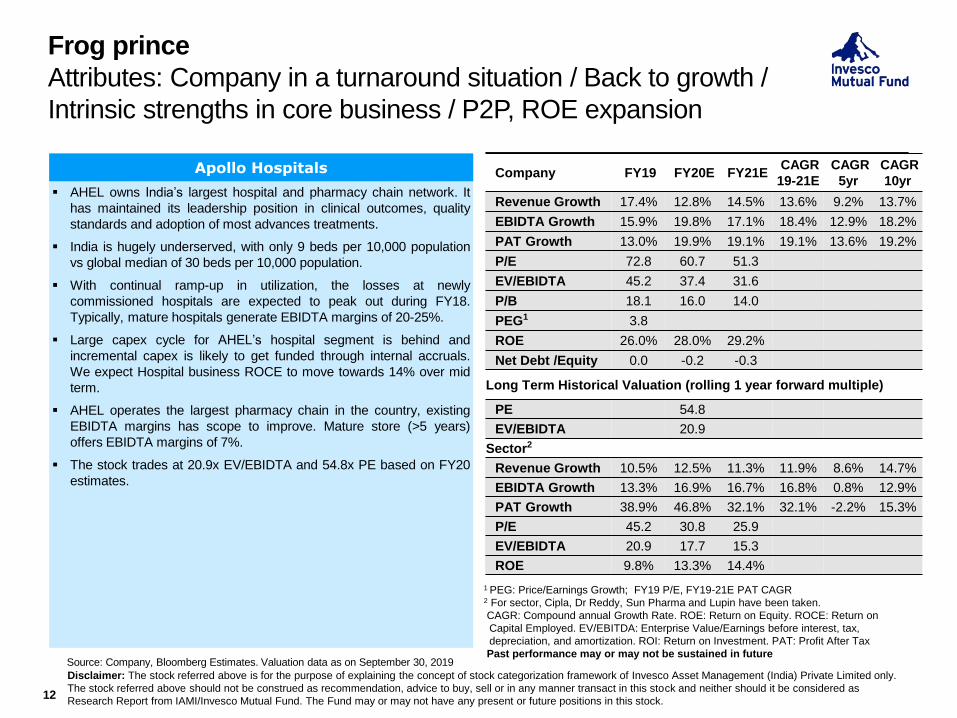
▪ AHEL owns India’s largest hospital and pharmacy chain network. It
has maintained its leadership position in clinical outcomes, quality
standards and adoption of most advances treatments.
▪ India is hugely underserved, with only 9 beds per 10,000 population
vs global median of 30 beds per 10,000 population.
▪ With continual ramp-up in utilization, the losses at newly
commissioned hospitals are expected to peak out during FY18.
Typically, mature hospitals generate EBIDTA margins of 20-25%.
▪ Large capex cycle for AHEL’s hospital segment is behind and
incremental capex is likely to get funded through internal accruals.
We expect Hospital business ROCE to move towards 14% over mid
term.
▪ AHEL operates the largest pharmacy chain in the country, existing
EBIDTA margins has scope to improve. Mature store (>5 years)
offers EBIDTA margins of 7%.
▪ The stock trades at 20.9x EV/EBIDTA and 54.8x PE based on FY20
estimates.
1 PEG: Price/Earnings Growth; FY19 P/E, FY19-21E PAT CAGR2 For sector, Cipla, Dr Reddy, Sun Pharma and Lupin have been taken.
CAGR: Compound annual Growth Rate. ROE: Return on Equity. ROCE: Return on
Capital Employed. EV/EBITDA: Enterprise Value/Earnings before interest, tax,
depreciation, and amortization. ROI: Return on Investment. PAT: Profit After Tax
Past performance may or may not be sustained in future
Company FY19 FY20E FY21ECAGR
19-21E
CAGR
5yr
CAGR
10yr
Revenue Growth 17.4% 12.8% 14.5% 13.6% 9.2% 13.7%
EBIDTA Growth 15.9% 19.8% 17.1% 18.4% 12.9% 18.2%
PAT Growth 13.0% 19.9% 19.1% 19.1% 13.6% 19.2%
P/E 72.8 60.7 51.3
EV/EBIDTA 45.2 37.4 31.6
P/B 18.1 16.0 14.0
PEG1 3.8
ROE 26.0% 28.0% 29.2%
Net Debt /Equity 0.0 -0.2 -0.3
Long Term Historical Valuation (rolling 1 year forward multiple)
PE 54.8
EV/EBIDTA 20.9
Sector2
Revenue Growth 10.5% 12.5% 11.3% 11.9% 8.6% 14.7%
EBIDTA Growth 13.3% 16.9% 16.7% 16.8% 0.8% 12.9%
PAT Growth 38.9% 46.8% 32.1% 32.1% -2.2% 15.3%
P/E 45.2 30.8 25.9
EV/EBIDTA 20.9 17.7 15.3
ROE 9.8% 13.3% 14.4%
Apollo Hospitals
Disclaimer: The stock referred above is for the purpose of explaining the concept of stock categorization framework of Invesco Asset Management (India) Private Limited only.
The stock referred above should not be construed as recommendation, advice to buy, sell or in any manner transact in this stock and neither should it be considered as
Research Report from IAMI/Invesco Mutual Fund. The Fund may or may not have any present or future positions in this stock.

CommoditiesAttributes: Call on the cycle is paramount/positive growth
prospects/integration, cost efficiency, globally competitive/profit leverage
13
Source: Company, Bloomberg Estimates. Valuation data as on September 30, 2019. Mtpa: Million tons per annum.
Gujarat State Petronet (GSPL)
▪ Ramco Cements is one of largest cement manufacturers in South
India. It has integrated cement capacity of 12.5 mtpa, with additional 6
mtpa of split grinding units.
▪ Company operates at utilization of ~70% on integrated capacity, with
huge scope for operating leverage.
▪ The South Indian region has witnessed subdued demand in last 4–5
years due to varied reasons including division of the states of Andhra
Pradesh and Telangana, political uncertainty, natural calamities, etc.
besides general economic weakness in India.
▪ Despite low utilization levels, company’s cement EBITDA per tonne
has been above industry average in last five years, which is function
of better realization (reward for strong brand) and its cost efficiencies.
▪ Even at 70% utilization and weak realization scenario in FY19,
company’s RoE stood at 12%, as against low single digit RoE
reported by many regional focused players.
▪ The company has meaningfully deleveraged itself (without dilution),
with net debt to equity at 0.3x as on March 2019 as against 1.2x as on
march 2014.
1 PEG: Price/Earnings Growth; FY19 P/E, FY19-21E PAT CAGR2 For Sector, Ramco, Ultratech, JK Cement, JK Lakshmi & Shree Cement have been taken.
CAGR: Compound annual Growth Rate. ROE: Return on Equity.
ROCE: Return on Capital Employed. EV/EBITDA: Enterprise Value/Earnings before
interest, tax, depreciation and amortization. PAT: Profit After Tax
Past performance may or may not be sustained in future
Company FY19 FY20E FY21ECAGR
19-21E
CAGR
5yr
CAGR
10yr
Revenue Growth 16.8% 11.8% 15.1% 13.4% 6.9% 8.1%
EBIDTA Growth -5.7% 30.5% 13.9% 21.9% 12.3% 2.9%
PAT Growth -9.0% 37.4% 15.4% 25.9% 29.7% 3.4%
P/E 32.8 23.9 20.7
EV/EBIDTA 17.2 13.7 12.1
P/B 3.7 3.3 2.9
PEG1 1.3
ROE 11.9% 14.6% 15.0%
Net Debt /Equity 0.3 0.4 0.4
Long Term Historical Valuation (rolling 1 year forward multiple)
PE 21.6
EV/EBIDTA 14.2
Sector1
Revenue Growth 18.5% 17.3% 12.7% 15.0% 12.0% 15.7%
EBIDTA Growth 7.8% 37.8% 12.3% 24.4% 12.1% 10.5%
PAT Growth -6.1% 58.8% 20.1% 38.1% 5.8% 6.8%
P/E 46.1 29.0 24.2
EV/EBIDTA 19.5 14.0 12.2
ROE 9.7% 13.7% 14.3%
Ramco Cements
Disclaimer: The stock referred above is for the purpose of explaining the concept of stock categorization framework of Invesco Asset Management (India) Private Limited only.
The stock referred above should not be construed as recommendation, advice to buy, sell or in any manner transact in this stock and neither should it be considered as
Research Report from IAMI/Invesco Mutual Fund. The Fund may or may not have any present or future positions in this stock.

Stock Categorization Financial Ratios
14
Data as on September 30, 2019 and relate to FY20/CY19 Estimates.
Source: Internal/Consensus/Bloomberg. Ratios based on Bloomberg consensus mean estimates for FY20/CY19.
Negative values have been removed from valuation measures where required to prevent distortion.
P/B: Price to Book Ratio, P/E: Price to Earnings Ratio. PEG: Price/Earnings To Growth Ratio, EBITDA: Earnings Before Interest, Taxes, Depreciation and Amortization,
EV/ Sales: Enterprise-Value-To-Sales Ratio, EV/EBITDA: Enterprise Value/Earnings Before Interest, Taxes, Depreciation and Amortization or Enterprise Multiple, Div Yield: Dividend
Yield. Revenue growth, EV/EBITDA and EV/Sales are for non-financial companies.
For PEG, FY19E/CY18E P/E and FY20E/CY19E growth is considered.
Disclaimer: The categorisation is as per the stock categorisation framework given on slide “Categorization Framework”. The categorisation does not in any manner reflect the quality of
the portfolio or its future performance/ returns. Invesco Asset Management (India) Private Limited/Invesco Mutual Fund is not guaranteeing or promising or forecasting any returns.
Investment universe: 302 companies, 131 categorized.
101 Unique companies across 11 active portfolios
Stock Category
No. of
Stocks % of Stock
Revenue
Growth
EBITDA
Growth
Profit
Growth RoE P/BV P/E PEG
EV/
EBITDA
EV/
Sales
Div
Yield
Growth
Leader 44 33.6% 10.0% 10.2% 6.7% 21.1% 5.3 26.3 3.9 16.7 3.5 1.09%
Star 2 1.5% 36.8% 37.7% 15.7% 19.5% 7.1 39.8 2.5 17.7 1.1 0.09%
Warrior 30 22.9% 9.9% 9.4% 20.8% 16.7% 3.9 25.7 1.2 15.0 2.5 0.80%
ValueDiamond 23 17.6% 3.8% 7.6% 59.1% 12.0% 1.4 12.3 0.2 6.8 1.1 2.00%
Frog Prince 14 10.7% 7.6% 16.7% 52.3% 7.1% 2.3 34.6 0.7 10.6 2.3 0.44%
Event Commodities 16 12.2% 1.8% 1.4% 1.3% 14.1% 1.5 11.8 8.8 7.4 0.9 4.05%
NA Shotgun 2 1.5% 14.0% 34.2% 24.2% 12.4% 17.1 139.6 5.8 0.0 0.0 2.09%
Total 131 100.0% 4.4% 6.4% 14.2% 15.0% 2.8 19.5 1.4 10.6 1.6 1.50%
Past performance may or may not be sustained in future.

Benefits of Stock Categorization
15
Focuses on the source of risk & return
▪ By identifying the key fundamental attributes of the company & drivers of stock price
performance
Stock appropriate valuation methodology
▪ Valuation attractiveness judged in the context of the category
▪ Provides a framework in which we can judge both under & overvaluation
Consistency across sectors and team members
Portfolio level clustering can be monitored

20
88
63
56
46
29
0
10
20
30
40
50
60
70
80
90
100
0 1-10 11-20 21-30 31-40 40+N
o.
of C
om
panie
s
No. of Analysts (Coverage by Sell-Side Analysts)
Invesco Asset Management (India) - Universe
Wide Research Coverage An Advantage
16
Source: Bloomberg. Data as on September 30, 2019
▪ Invesco Asset Management (India) has an
in-depth research coverage universe of
302 stocks
▪ Our unique research coverage is
underscored by the fact that ~36% of the
companies in the Invesco Asset
Management (India)’s investment universe
are under the research coverage of not
more than 10 sell-side analysts

Equity – Investment Process
17
Fund Objective
Investment Universe
Bottom Up Top Down AnalysisPortfolio Construction
Levers
Stock Categorization Industry Analysis Asset Allocation
Economic Analysis Sector Allocation
Technical Analysis Capitalization Bias
Stock Selection
Investment Team
Diversity Discussion Debate
Environment, Social, Governance Overlay (ESG)

Top Down Analysis
18
Industry/Economic Analysis
▪ View on the economy
▪ Implications for industries & companies
▪ Meetings with external sources – sell side analysts, economists, strategists, industry
experts & policy makers
Technical Analysis
▪ Industry & asset allocation decisions-where relevant
▪ Fine tuning of execution strategy-where relevant
▪ Idea generation
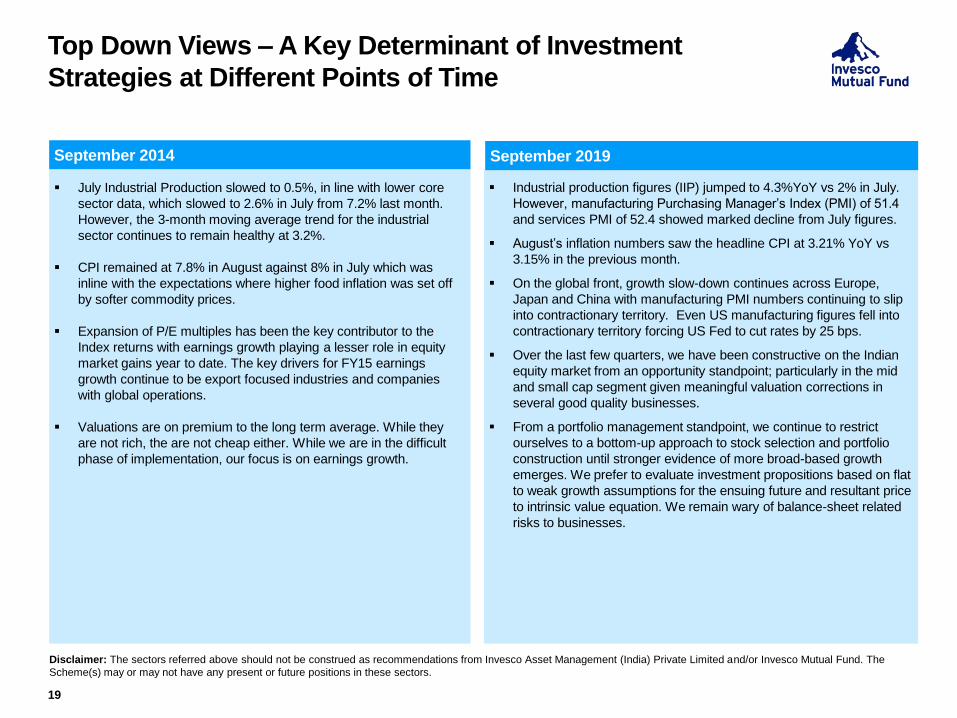
▪ July Industrial Production slowed to 0.5%, in line with lower core
sector data, which slowed to 2.6% in July from 7.2% last month.
However, the 3-month moving average trend for the industrial
sector continues to remain healthy at 3.2%.
▪ CPI remained at 7.8% in August against 8% in July which was
inline with the expectations where higher food inflation was set off
by softer commodity prices.
▪ Expansion of P/E multiples has been the key contributor to the
Index returns with earnings growth playing a lesser role in equity
market gains year to date. The key drivers for FY15 earnings
growth continue to be export focused industries and companies
with global operations.
▪ Valuations are on premium to the long term average. While they
are not rich, the are not cheap either. While we are in the difficult
phase of implementation, our focus is on earnings growth.
▪ Industrial production figures (IIP) jumped to 4.3%YoY vs 2% in July.
However, manufacturing Purchasing Manager’s Index (PMI) of 51.4
and services PMI of 52.4 showed marked decline from July figures.
▪ August’s inflation numbers saw the headline CPI at 3.21% YoY vs
3.15% in the previous month.
▪ On the global front, growth slow-down continues across Europe,
Japan and China with manufacturing PMI numbers continuing to slip
into contractionary territory. Even US manufacturing figures fell into
contractionary territory forcing US Fed to cut rates by 25 bps.
▪ Over the last few quarters, we have been constructive on the Indian
equity market from an opportunity standpoint; particularly in the mid
and small cap segment given meaningful valuation corrections in
several good quality businesses.
▪ From a portfolio management standpoint, we continue to restrict
ourselves to a bottom-up approach to stock selection and portfolio
construction until stronger evidence of more broad-based growth
emerges. We prefer to evaluate investment propositions based on flat
to weak growth assumptions for the ensuing future and resultant price
to intrinsic value equation. We remain wary of balance-sheet related
risks to businesses.
Top Down Views –A Key Determinant of Investment
Strategies at Different Points of Time
19
September 2014 September 2019
Disclaimer: The sectors referred above should not be construed as recommendations from Invesco Asset Management (India) Private Limited and/or Invesco Mutual Fund. The
Scheme(s) may or may not have any present or future positions in these sectors.

Equity – Investment Process
20
Fund Objective
Investment Universe
Bottom Up Top Down AnalysisPortfolio Construction
Levers
Stock Categorization Industry Analysis Asset Allocation
Economic Analysis Sector Allocation
Technical Analysis Capitalization Bias
Stock Selection
Investment Team
Diversity Discussion Debate
Environment, Social, Governance Overlay (ESG)
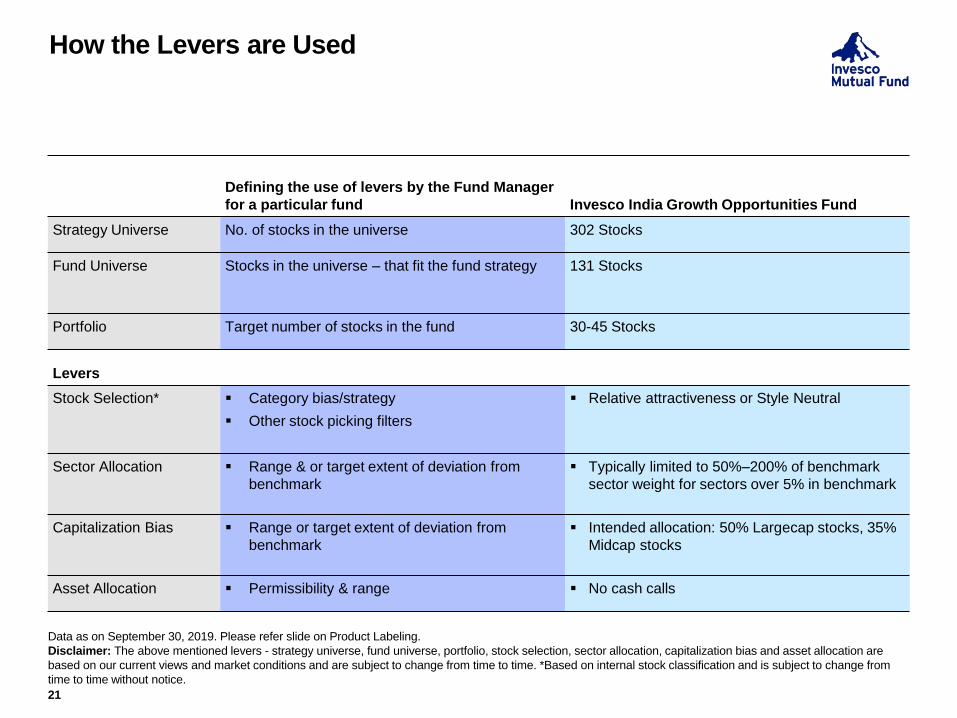
How the Levers are Used
21
Data as on September 30, 2019. Please refer slide on Product Labeling.
Disclaimer: The above mentioned levers - strategy universe, fund universe, portfolio, stock selection, sector allocation, capitalization bias and asset allocation are
based on our current views and market conditions and are subject to change from time to time. *Based on internal stock classification and is subject to change from
time to time without notice.
Defining the use of levers by the Fund Manager
for a particular fund Invesco India Growth Opportunities Fund
Strategy Universe No. of stocks in the universe 302 Stocks
Fund Universe Stocks in the universe – that fit the fund strategy 131 Stocks
Portfolio Target number of stocks in the fund 30-45 Stocks
Levers
Stock Selection* ▪ Category bias/strategy
▪ Other stock picking filters
▪ Relative attractiveness or Style Neutral
Sector Allocation ▪ Range & or target extent of deviation from
benchmark
▪ Typically limited to 50%–200% of benchmark
sector weight for sectors over 5% in benchmark
Capitalization Bias ▪ Range or target extent of deviation from
benchmark
▪ Intended allocation: 50% Largecap stocks, 35%
Midcap stocks
Asset Allocation ▪ Permissibility & range ▪ No cash calls

How the Levers are Used (CONTINUED)
22
Data as on September 30, 2019. Please refer slide on Product Labeling.
Disclaimer: The above mentioned levers - strategy universe, fund universe, portfolio, stock selection, sector allocation, capitalization bias and asset allocation are
based on our current views and market conditions and are subject to change from time to time. *Based on internal stock classification and is subject to change from
time to time without notice.
Invesco India
Multicap Fund
Invesco India
Tax Plan
Invesco India
Contra Fund
Strategy Universe (No.
of Companies)
302 Stocks 302 Stocks 302 Stocks
Fund Universe
(No. of Companies)
131 Stocks 131 Stocks 131 Stocks
Portfolio
(No. of Holdings)
30–50 Stocks 30-40 Stocks 35-50 Stocks
Levers
Stock Selection* ▪ All categories, growth biased ▪ All categories, growth biased ▪ Value bias
▪ At least 60% invested in Frog
Prince, Diamond,
Commodities, and in de-
rated companies from other
categories
Sector Allocation ▪ Significant deviations from
benchmark due to bottom up
approach
▪ Significant deviations from
benchmark
▪ No limits
Capitalization Bias ▪ Intended allocation: 50% -
70% allocation towards
midcap and smallcap stocks
▪ Significant deviations from the
benchmark
▪ Significant deviations from
benchmark
Asset Allocation ▪ No cash calls ▪ No cash calls ▪ No cash calls

How the Levers are Used (CONTINUED)
23
Data as on September 30, 2019. Please refer slide on Product Labeling.
Disclaimer: The above mentioned levers - strategy universe, fund universe, portfolio, stock selection, sector allocation, capitalization bias and asset allocation are
based on our current views and market conditions and are subject to change from time to time. *Based on internal stock classification and is subject to change from
time to time without notice.
Invesco India
Dynamic Equity Fund
Invesco India
Midcap Fund
Invesco India
Largecap Fund
Strategy Universe (No. of
Companies)
302 Stocks 302 Stocks 302 Stocks
Fund Universe
(No. of Companies)
131 Stocks 131 Stocks 131 Stocks
Portfolio
(No. of Holdings)
15–30 Stocks 30-50 Stocks 20-30 Stocks
Levers
Stock Selection* ▪ Relative attractiveness
▪ Earnings & Price momentum
▪ Growth bias ▪ 75–100% in leaders, warriors
including commodities
▪ Growth bias
Sector Allocation ▪ Significant deviation from
benchmark
▪ Significant deviations from
benchmark due to bottom up
approach
▪ Deviations from benchmark
Capitalization Bias ▪ Intended allocation:
Predominantly largecap
stocks
▪ Significant deviation from
benchmark
▪ Minimum 65% investment in
midcap stocks due to strategy
▪ Minimum 80% investment in
largecap stocks due to
strategy
Asset Allocation ▪ Active cash calls/hedges ▪ No cash calls ▪ No cash calls

How the Levers are Used (CONTINUED)
24
Data as on September 30, 2019. Please refer slide on Product Labeling.
Disclaimer: The above mentioned levers - strategy universe, fund universe, portfolio, stock selection, sector allocation, capitalization bias and asset allocation are
based on our current views and market conditions and are subject to change from time to time. *Based on internal stock classification and is subject to change from
time to time without notice.
Invesco India
Smallcap Fund
Invesco India
Financial Services
Fund
Invesco India
Infrastructure Fund
Invesco India
PSU Equity Fund
Strategy Universe (No.
of Companies)
302 Stocks 65 Stocks 180 Stocks 64 Stocks
Fund Universe
(No. of Companies)
131 Stocks 21 Stocks 84 Stocks 20 Stocks
Portfolio
(No. of Holdings)
30-50 Stocks 15–30 Stocks 20-40 Stocks 15–30 Stocks
Levers
Stock Selection* ▪ Growth bias ▪ Relative
attractiveness in
financial sector
▪ Relative attractiveness
in infrastructure
oriented companies
▪ Relative
attractiveness in
PSU’s
Sector Allocation ▪ Significant deviations
from benchmark due
to bottom up
approach
▪ NA ▪ Significant deviations
from the benchmark
▪ No limits
Capitalization Bias ▪ Minimum 65%
investment in
smallcap stocks due
to strategy
▪ Flexible ▪ Flexible ▪ Flexible
Asset Allocation ▪ No Cash calls ▪ No cash calls ▪ No cash calls ▪ No cash calls

Benefits of Portfolio Levers
25
▪ The levers follow on from the fund’s objective
▪ The levers provide the framework, the flexibility and the limits, which the fund manager
must adhere to in order to create alpha
▪ Enables monitoring of fund manager drift
▪ The levers are key to monitoring and delivering on our promise of running our funds “True
to Mandate”
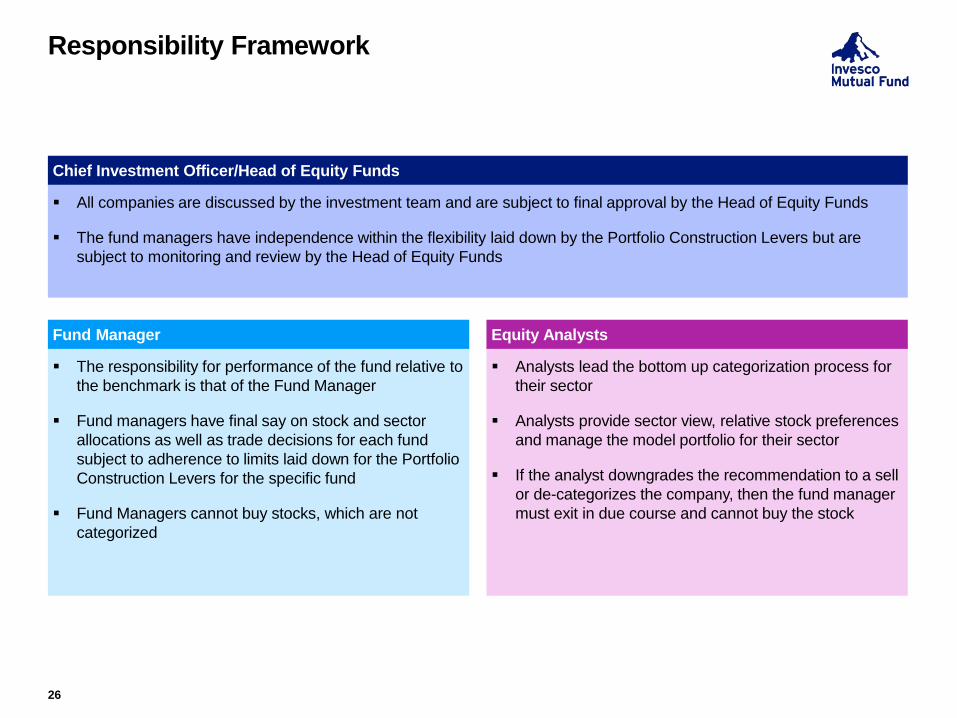
▪ All companies are discussed by the investment team and are subject to final approval by the Head of Equity Funds
▪ The fund managers have independence within the flexibility laid down by the Portfolio Construction Levers but are
subject to monitoring and review by the Head of Equity Funds
Responsibility Framework
26
Chief Investment Officer/Head of Equity Funds
▪ The responsibility for performance of the fund relative to
the benchmark is that of the Fund Manager
▪ Fund managers have final say on stock and sector
allocations as well as trade decisions for each fund
subject to adherence to limits laid down for the Portfolio
Construction Levers for the specific fund
▪ Fund Managers cannot buy stocks, which are not
categorized
Fund Manager
▪ Analysts lead the bottom up categorization process for
their sector
▪ Analysts provide sector view, relative stock preferences
and manage the model portfolio for their sector
▪ If the analyst downgrades the recommendation to a sell
or de-categorizes the company, then the fund manager
must exit in due course and cannot buy the stock
Equity Analysts

Risk Management
27
Dealing
▪ Separate team for Debt &
Equity
▪ Best Execution
▪ Compliance & Regulatory
checks
Review & Compliance
▪ Investment committee
▪ Consistency review
▪ Independent auditors
Investment Guidelines
▪ Absolute exposure limits
▪ Pre & post-trade checking
▪ Risk allocation
Portfolio Risk
▪ Bloomberg
Management of
Risk
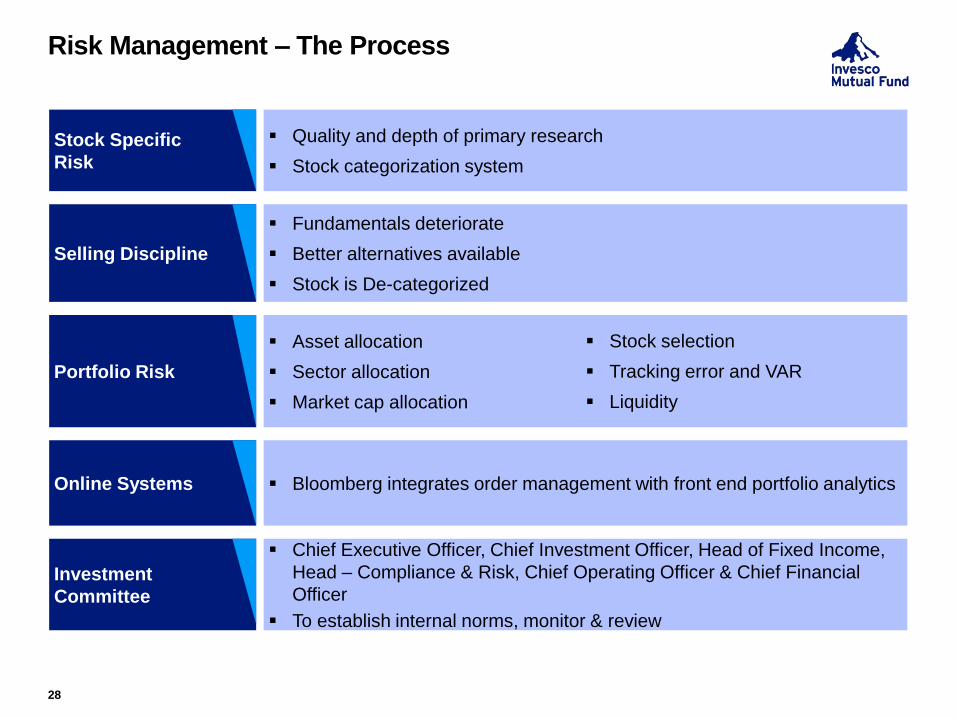
Risk Management – The Process
28
Stock Specific
Risk
▪ Quality and depth of primary research
▪ Stock categorization system
Selling Discipline
▪ Fundamentals deteriorate
▪ Better alternatives available
▪ Stock is De-categorized
Portfolio Risk
▪ Asset allocation
▪ Sector allocation
▪ Market cap allocation
▪ Stock selection
▪ Tracking error and VAR
▪ Liquidity
Online Systems ▪ Bloomberg integrates order management with front end portfolio analytics
Investment
Committee
▪ Chief Executive Officer, Chief Investment Officer, Head of Fixed Income,
Head – Compliance & Risk, Chief Operating Officer & Chief Financial
Officer
▪ To establish internal norms, monitor & review

Risk Management Details
29
▪ Committees to review AMC activities
– Investment Committee of Executives of Invesco Asset Management (India) Private
Limited
– Audit Committee of Board of Directors of Invesco Asset Management (India) Private
Limited
▪ Policy for Prohibition of Insider Trading
Audit Committee
30
▪ Review of financial statements, portfolio statements, financial reporting to unit holders
▪ Review compliance procedures, processes and reports, discuss with Compliance Officer
about the compliance framework and to monitor compliance and governance issues
▪ Review Risk Management framework
▪ Review the internal audit systems and internal and statutory audit reports
▪ Recommend appointment of auditors

Broad Product Portfolio
31
Note: Please refer slide on Product Labeling1 An open ended equity linked saving scheme with a statutory lock-in of 3 years and tax benefit.2 The investor will bear the recurring expenses of the scheme, in addition to the expenses of underlying scheme
Equity (10)
▪ Invesco India Tax Plan1
▪ Invesco India Growth
Opportunities Fund
▪ Invesco India Midcap Fund
▪ Invesco India Multicap Fund
▪ Invesco India
Infrastructure Fund
▪ Invesco India Contra Fund
▪ Invesco India Largecap
Fund
▪ Invesco India Financial
Services Fund
▪ Invesco India PSU Equity
Fund
▪ Invesco India Smallcap
Fund
Hybrid/ETFs/
Alternatives (7)
▪ Invesco India Arbitrage
Fund
▪ Invesco India Dynamic
Equity Fund
▪ Invesco India Equity & Bond
Fund
▪ Invesco India Equity
Savings Fund
▪ Invesco India Nifty ETF
▪ Invesco India Gold ETF
▪ Invesco India Gold FoF2
Fund of Funds (2)
(Investing Overseas)
▪ Invesco India Feeder –
Invesco Pan European
Equity Fund2
▪ Invesco India Feeder –
Invesco Global Equity
Income Fund2
Fixed Income (10)
▪ Invesco India Liquid Fund
▪ Invesco India Ultra Short
Term Fund
▪ Invesco India Short Term
Fund
▪ Invesco India Treasury
Advantage Fund
▪ Invesco India Corporate
Bond Fund
▪ Invesco India Money Market
Fund
▪ Invesco India Gilt Fund
▪ Invesco India Banking &
PSU Debt Fund
▪ Invesco India Credit Risk
Fund
▪ Fixed Maturity Plans of
various maturities

Fund Management Responsibility
32
Funds Managed Inception date Fund Manager/ Managing since Jointly Managed By/ Managing since
Invesco India Tax Plan December 29, 2006Amit Ganatra
Managing since (March 29, 2018)
Dhimant Kothari
Managing since (March 29, 2018)
Invesco India Contra Fund April 11, 2007Taher Badshah
Managing since (January 13, 2017)
Amit Ganatra
Managing since (August 14, 2012)
Invesco India Midcap Fund April 19, 2007Pranav Gokhale
Managing since (March 29, 2018)
Neelesh Dhamnaskar
Managing since (July 18, 2018)
Invesco India Arbitrage Fund April 30, 2007Pranav Gokhale
Managing since (April 1, 2011)-
Invesco India Growth Opportunities Fund August 9, 2007Taher Badshah
Managing since (January 13, 2017)
Amit Ganatra
Managing since (June 23, 2014)
Invesco India Dynamic Equity Fund October 4, 2007Taher Badshah
Managing since (January 13, 2017)
Pranav Gokhale
Managing since (June 1, 2018)
Invesco India Infrastructure Fund November 21, 2007Pranav Gokhale
Managing since (August 14, 2012)
Neelesh Dhamnaskar
Managing since (June 1, 2018)
Invesco India Multicap Fund March 17, 2008Taher Badshah
Managing since (March 29, 2018)
Pranav Gokhale
Managing since (March 29, 2018)
Invesco India Financial Services Fund July 14, 2008Amit Ganatra
(Managing since November 9, 2010)
Dhimant Kothari
Managing since (June 1, 2018)
Invesco India Largecap Fund August 21, 2009Amit Ganatra
Managing since (March 29, 2018)
Nitin Gosar
Managing since (March 29, 2018)
Invesco India PSU Equity Fund November 18, 2009Pranav Gokhale
Managing since (September 28, 2015)
Nitin Gosar
Managing since (June 1, 2018)
Invesco India Nifty ETF June 13, 2011Pranav Gokhale
Managing since (June 13, 2011)-
Invesco India Equity & Bond Fund1 June 30, 2018Taher Badshah(Equity Portion)
Managing since (June 30, 2018)
Amit Ganatra(Equity Portion)
Managing since (June 30, 2018)
Invesco India Small Cap Fund October 30, 2018Taher Badshah
Managing since (October 30, 2018)
Pranav Gokhale
Managing since (March 1, 2019)
Invesco India Equity Savings Fund2 March 7, 2019Taher Badshah (Equity Portion)
Managing since (March 7, 2019)
Amit Ganatra (Equity Portion)
Managing since (March 7, 2019)
1. Debt portion of the scheme is managed by Krishna Cheemalapati since June 30, 2018. 2. Debt potion of the scheme is managed by Krishna Cheemalapati since March 7, 2019.

Product LabellingSuitable for investors who are seeking* (CONTINUED)
33
Invesco India Tax Plan(an open-ended Equity Linked Saving Scheme with a statutory lock-in of 3 years and tax benefit)▪ capital appreciation over long-term▪ investment in equity and equity-related
instruments
Invesco India Growth Opportunities Fund(Large & Mid cap Fund - An open ended equity scheme investing in both large cap and mid cap stocks)▪ capital appreciation over long-term▪ investments predominantly in equity and
equity-related instruments of large and midcap companies
Invesco India Dynamic Equity Fund(an open ended dynamic asset allocation fund)▪ capital appreciation over long-term▪ investments in equity and debt securities
which are managed dynamically
Invesco India Contra Fund(an open ended equity scheme following contrarian investment strategy)▪ capital appreciation over long-term▪ investments predominantly in equity and equity
related instruments through contrarian investing
Invesco India Midcap Fund(Mid Cap Fund - An open ended equity scheme predominantly investing in mid cap stocks)▪ capital appreciation over long-term▪ investments predominantly in equity and
equity-related instruments of Midcap companies
Invesco India Multicap Fund
(Multi Cap Fund - An open ended equity scheme investing
across large cap, mid cap, small cap stocks)▪ capital appreciation over long-term▪ investments in equity and equity related instruments
across market capitalization
Invesco India Largecap Fund(Large Cap Fund - An open ended equity scheme predominantly investing in large cap stocks)▪ capital appreciation over long-term▪ investments predominantly in equity and equity-related
instruments of largecap companies
Invesco India Nifty Exchange Traded Fund(an open ended scheme replicating Nifty 50 Index)▪ capital appreciation over long term▪ generate returns that closely correspond to the returns
generated by the securities represented by the Nifty 50, subject to tracking error, if any
Invesco India Gold Fund1
(an open ended fund of fund scheme investing in Invesco India Gold Exchange Traded Fund)▪ regular income and capital appreciation over medium to
long term▪ investment in units of Invesco India Gold Exchange
Traded Fund, which in turn invests in physical gold
Invesco India Gold Exchange Traded Fund (an open ended scheme tracking returns provided by investment in physical gold)▪ capital appreciation over long-term▪ generate returns that closely correspond to the returns
provided by investment in physical gold in the domestic market, subject to tracking error
Invesco India Equity Savings Fund
(An open ended scheme investing in equity, arbitrage and debt)
▪ capital appreciation and current income
▪ Investments in equity and equity related instruments, arbitrage
opportunities and fixed income instruments (including debt,
government securities and money market instruments)
Invesco India Infrastructure Fund
(an open ended equity scheme following
Infrastructure theme)
▪ capital appreciation over long-term
▪ investments predominantly in equity and equity-
related instruments of infrastructure companies
Invesco India Feeder - Invesco Global Equity
Income Fund1
(an open ended fund of fund scheme investing in
Invesco Global Equity Income Fund)
▪ capital appreciation and/or income over long-
term
▪ investment in units of Invesco Global Equity
Income Fund, an overseas equity fund
Invesco India Financial Services Fund
(an open ended equity scheme investing in financial
services sector)
▪ capital appreciation over long-term
▪ investment predominantly in equity and equity-related
instruments of companies engaged in the business of
banking and financial services
Invesco India PSU Equity Fund
(an open ended equity scheme following PSU theme)
▪ capital appreciation over long-term
▪ investment in predominantly equity and equity-related
instruments of Government companies (PSU’s)
Invesco India Feeder - Invesco Pan
European Equity Fund1
(an open ended fund of fund scheme
investing in Invesco Pan European Equity
Fund)
▪ capital appreciation over long-term
▪ investment in units of Invesco Pan
European Equity Fund, an overseas equity
fund
* Investors should consult their financial advisers if in doubt about whether the product is suitable for them1 The investor will bear the recurring expenses of the scheme, in addition to expenses of the underlying scheme
LOW HIGH
Investors understand that their principal will be at
moderately high risk
RISKOMETER
LOW HIGH
Investors understand that their principal will be at
high risk
RISKOMETER
Invesco India Equity & Bond Fund
(an open ended hybrid scheme investing predominantly
in equity and equity related instruments)
▪ capital appreciation and current income over medium to long term
▪ investments in equity and equity related instruments and fixed
income securities
Invesco India Smallcap Fund
(Small Cap Fund – An open-ended equity
scheme predominantly investing in small cap
stocks)
• capital Appreciation over long term
• investments predominantly in equity and
equity-related instruments of Smallcap
companies
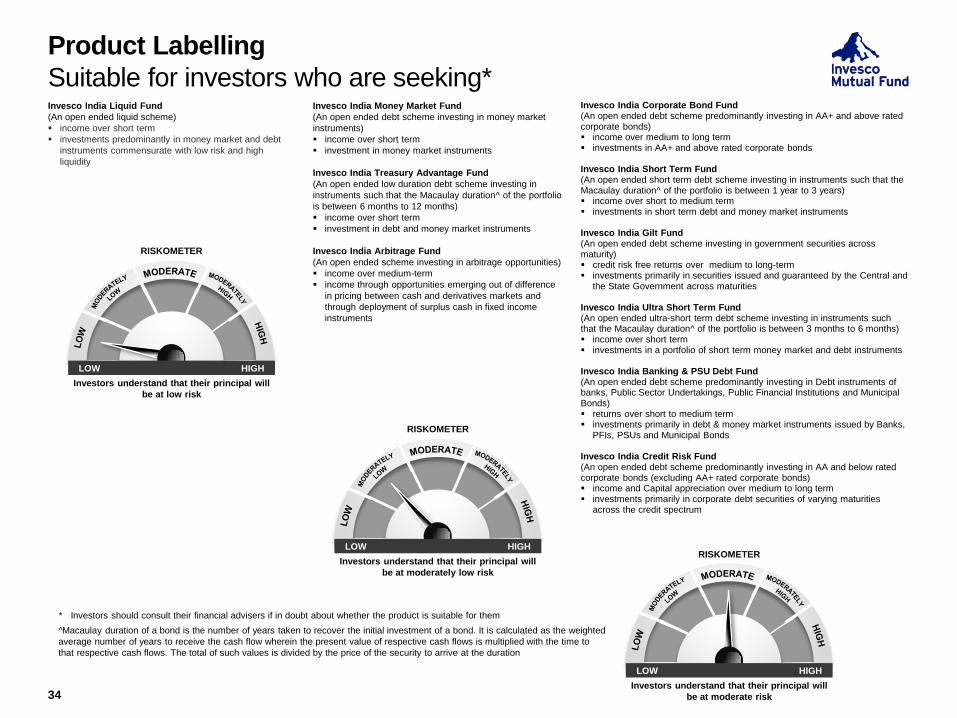
Product Labelling
Suitable for investors who are seeking*
34
Invesco India Liquid Fund
(An open ended liquid scheme)
▪ income over short term
▪ investments predominantly in money market and debt
instruments commensurate with low risk and high
liquidity
Invesco India Money Market Fund
(An open ended debt scheme investing in money market
instruments)
▪ income over short term
▪ investment in money market instruments
Invesco India Treasury Advantage Fund
(An open ended low duration debt scheme investing in
instruments such that the Macaulay duration ̂of the portfolio
is between 6 months to 12 months)
▪ income over short term
▪ investment in debt and money market instruments
Invesco India Arbitrage Fund
(An open ended scheme investing in arbitrage opportunities)
▪ income over medium-term
▪ income through opportunities emerging out of difference
in pricing between cash and derivatives markets and
through deployment of surplus cash in fixed income
instruments
Invesco India Corporate Bond Fund(An open ended debt scheme predominantly investing in AA+ and above rated corporate bonds)▪ income over medium to long term▪ investments in AA+ and above rated corporate bonds
Invesco India Short Term Fund(An open ended short term debt scheme investing in instruments such that the Macaulay duration ̂of the portfolio is between 1 year to 3 years)▪ income over short to medium term▪ investments in short term debt and money market instruments
Invesco India Gilt Fund (An open ended debt scheme investing in government securities across maturity)▪ credit risk free returns over medium to long-term▪ investments primarily in securities issued and guaranteed by the Central and
the State Government across maturities
Invesco India Ultra Short Term Fund(An open ended ultra-short term debt scheme investing in instruments such that the Macaulay duration ̂of the portfolio is between 3 months to 6 months)▪ income over short term▪ investments in a portfolio of short term money market and debt instruments
Invesco India Banking & PSU Debt Fund(An open ended debt scheme predominantly investing in Debt instruments of banks, Public Sector Undertakings, Public Financial Institutions and Municipal Bonds)▪ returns over short to medium term▪ investments primarily in debt & money market instruments issued by Banks,
PFIs, PSUs and Municipal Bonds
Invesco India Credit Risk Fund(An open ended debt scheme predominantly investing in AA and below rated corporate bonds (excluding AA+ rated corporate bonds)▪ income and Capital appreciation over medium to long term▪ investments primarily in corporate debt securities of varying maturities
across the credit spectrum
LOW HIGH
Investors understand that their principal will
be at low risk
RISKOMETER
LOW HIGH
Investors understand that their principal will
be at moderately low risk
RISKOMETER
LOW HIGH
Investors understand that their principal will
be at moderate risk
RISKOMETER
* Investors should consult their financial advisers if in doubt about whether the product is suitable for them
^Macaulay duration of a bond is the number of years taken to recover the initial investment of a bond. It is calculated as the weighted
average number of years to receive the cash flow wherein the present value of respective cash flows is multiplied with the time to
that respective cash flows. The total of such values is divided by the price of the security to arrive at the duration

Disclaimer
35
Disclaimer: This presentation is for information purposes only and is not an offer to sell or a solicitation to buy any mutual fund units/securities. The
content of this document is confidential and intended solely for the use of the addressee. If you are not the addressee, or the person responsible for
delivering it to the addressee, any disclosure, copying, distribution or any action taken or omitted to be taken in reliance on it is prohibited and may be
unlawful. The views/ information alone are not sufficient and shouldn’t be used for the development or implementation of an investment strategy. It
should not be construed as investment advice to any party. All opinions, figures, charts/graphs, estimates and data included in this document are as
on date and are subject to change without notice. The statements contained herein may include statements of future expectations and other forward
looking statements that are based on our current views and assumptions and involve known and unknown risks and uncertainties that could cause
actual results, performance or events to differ materially from those expressed or implied in such statements. The data used in this material is
obtained by Invesco Asset Management (India) Private Limited from the sources which it considers reliable. While utmost care has been exercised
while preparing the presentation, Invesco Asset Management (India) Private Limited does not warrant the completeness or accuracy of the information
and disclaims all liabilities, losses and damages arising out of the use of this information. Neither Invesco Asset Management (India) Private Limited
nor any person connected with it accepts any liability arising from the use of this information. The recipient(s) before acting on any information herein
should make his/their own investigation and seek appropriate professional advice.
Mutual Fund investments are subject to market risks, read all scheme related documents carefully.

Get in Touch
Corporate Office:
Invesco Asset Management (India) Pvt Ltd.
Unit No: 2101 A, 21st floor, A – Wing,
Marathon Futurex, N. M. Joshi Marg,
Lower Parel, Mumbai – 400 013
T +91 22 67310000 F +91 22 23019422
To invest:
Call 1800-209-0007 ∆ sms ‘Invest’ to 56677
Invest Online www.invescomutualfund.com
Follow us on