Embed Size (px)
Citation preview

8/7/2019 equity and derivative
http://slidepdf.com/reader/full/equity-and-derivative 1/123

8/7/2019 equity and derivative
http://slidepdf.com/reader/full/equity-and-derivative 2/123
EXECUTIVE SUMMARY
The project is about the study of equity and derivative market. It gives the knowledge of market
position of the company. I studied as to how this company proves to an option for the investors,by studying the performance of investing in equity & derivative for few months considering their
analysis. I selected area of COMPARITIVE ANALYSIS OF EQUITY & DERIVATIVE, which
attract different kinds of investors to invest in equity derivative and to face high risk and get high
returns. The major findings of the project are to overview of the comparison of equity cash
segment and equity derivative segment, overview of the equity and F & O segment from April
2010 to June 2010. The methodology of the project here is to analyze the Equity & Derivative
performance based on NAV, EPS and other things. In this project I also included my practical
situation during the project internship, that how the market goes up and down and why it
happens.
The methodology of the project here is to analyze the investment opportunities available for
those investors & study the returns & risk involved in various investment opportunities and also
study of investment management & risk management. So for that we have to study & analyze the
performance of Equity & Derivative in the market. We know that there is a high risk, high return
in equity but in a long time only. While in derivative there is a high risk, high return in the short
term, because derivative contract is for short time for 1/2/3 months only. So this project included
different types of returns, margin & risk involved in equity, and types, need, use & margin
involved in the derivatives market and also participants & terms use in derivative market.

8/7/2019 equity and derivative
http://slidepdf.com/reader/full/equity-and-derivative 3/123
CHAPTERIZATION
CHAPTER-I: INTRODUCTION
Need and importance
Objectives
Scope of the study
Methodology
Limitations
CHAPTER-II: COMPANY PROFILE
CHAPTER-III: EQUITY & DERIVATIVE PERSPECTIVES
EQUTIY PERSPECTIVES
Reasons for issuing equity
Equity Investment strategies
Characteristics of Equity
Benefits of Equity
Return on Equity
Selection of share
Risk associated with Equity Investment
Equity analysis
DERIVATIVE PERSPECTIVES
Introduction/Meaning
Factors driving growth of derivatives

8/7/2019 equity and derivative
http://slidepdf.com/reader/full/equity-and-derivative 4/123
Benefits of derivatives
Characteristics of derivatives
Types of derivative markets
Traders in derivative markets
Types of futures & options
Derivative analysis
CHAPTER-IV: COMPARATIVE ANALYSIS AND INTERPRETATIONS
CHAPTER-V: CONCLUSIONS AND SUGGESTIONS

8/7/2019 equity and derivative
http://slidepdf.com/reader/full/equity-and-derivative 5/123
INTRODUCTION
BACKGROUND OF THE STUDY:
The oldest stock exchange in Asia (established in 1875) and the first in the country to be granted
permanent recognition under the Securities Contract Regulation Act, 1956, Bombay Stock
Exchange Limited (BSE) has had an interesting rise to prominence over the past 133 years. A lot
has changed since 1875 when 318 persons became members of what today is called ³Bombay
Stock Exchange Limited´ paying a princely amount of Re 1. In 2002, the name "The Stock
Exchange, Mumbai" was changed to Bombay Stock Exchange. Subsequently on August 19,
2005, the exchange turned into a corporate entity from an Association of Persons (AoP) and
renamed as Bombay Stock Exchange Limited.
BSE, which had introduced securities trading in India, replaced its open outcry system of trading
in 1995, with the totally automated trading through the BSE Online trading (BOLT) system. The
BOLT network was expanded nationwide in 1997.
Since then, the stock market in the country has passed through both good and bad periods. The
journey in the 20th century has not been an easy one. Till the decade of eighties, there was no
measure or scale that could precisely measure the various ups and downs in the Indian stock
market. Bombay stock Exchange Limited (BSE) in 1986 came out with a stock Index that
subsequently became the barometer of the Indian Stock Market.
SENSEX first compiled in 1986 was calculated on a ³Market Capitalization Weighted´
methodology of 30 component stocks representing a sample of large, well established and
financially sound companies. The base year of SENSEX is 1978-79. The index is widelyreported in both domestic and international markets through prints as well as electronic media.
SENSEX is not only scientifically designed but also based on globally accepted construction and
review methodology. From September 2003, the SENSEX is calculated on a free-float market
capitalization methodology. The ³free-float Market Capitalization-Weighted´ methodology is a

8/7/2019 equity and derivative
http://slidepdf.com/reader/full/equity-and-derivative 6/123
widely followed index construction methodology on which majority of global equity benchmarks
are based.
The growth of equity markets in India has been phenomenal in the decade gone by Right from
early nineties the stock market witnessed heightened activity in terms of various bull and bear
runs. The SENSEX captured all these happenings in the most judicial manner. One can identify
the booms and bust of the Indian equity market through SENSEX.
The Exchange also disseminates the Price-Earnings Ratio, the Price to Book Value Ratio and the
Dividend Yield Percentage on day-to-day basis of all its major indices. The value of all BSE
indices are every 15 seconds during the market hours and displayed through the BOLT system.
BSE website and news wire agencies.
All BSE-Indices are reviewed periodically by the ³Index Committee´ of the Exchange. The
Committee frames the broad policy guidelines for the development and maintenance of all BSE
indices. Department of BSE Indices of the exchange carries out the day to day maintenance of all
indices and conducts research on development of new indices.
Institutional investors, money managers and small investors all refer to the Sensex for their
specific purposes The Sensex is in effect the substitute for the Indian stock markets. The
country's first derivative product i.e. Index-Futures was launched on SENSEX.
PERFORMANCE OF SENSEX FROM 1991
GRAPH SHOWING SENSEX PERFORMANCE

8/7/2019 equity and derivative
http://slidepdf.com/reader/full/equity-and-derivative 7/123
Financial market:-
Financial market is a mechanism that allows people to easily buy and sell (trade) financial
securities (such as stocks and bonds), commodities (such as precious metals or agricultural
goods), Financial markets have evolved significantly over several hundred years and are
undergoing constant innovation to improve liquidity.
A system that facilitates the exchange of money for financial assets. A security market such as
the National Stock Exchange is an example of a financial market.
Financial market
Equity market Derivative market

8/7/2019 equity and derivative
http://slidepdf.com/reader/full/equity-and-derivative 8/123
Equity market:-
A equity market is a public market for the trading of company stock at an
agreed price; these are securities listed on a stock exchange as well as those only traded
privately.
When you buy a share of a company you become a shareholder in that company. Shares
are also known as Equities. Equities have the potential to increase in value over time. It also
provides your portfolio with the growth necessary to reach your long term investment goals.
Research studies have proved that the equities have outperformed most other forms of
investments in the long term.
Equity is a share in the ownership of a company. It represents a claim on the company's
assets and earnings. As one acquire more stock, his ownership stake in the company increases.
The terms share, equity and stock means the same thing and can be used interchangeably.
Holding a company¶s stock means that you are one of the many owners (shareholders) of
a company, and, as such, you have a claim (to the extent of your holding) to everything the
company owns. As an owner, you are entitled to your share of the company's earnings as well as
any voting rights attached to the stock. Some may hold only a single share worth a few rupees,
cast only a single vote, and receive a tiny proportion of profit and dividends. Shareholders mayalso include giant pension funds and insurance companies whose investment may run to millions
of shares and hundreds of millions of rupees, and who are entitled to a correspondingly large
number of votes and proportion of profits and dividends.
Although the stockholders own the corporation, they do not manage it. Instead, they vote
to elect a board of directors. The board of directors represents the shareholders. It appoints top
management and is supposed to ensure that managers act in the shareholders¶ best interest.
This separation of ownership and management gives corporations permanence. Even if
managers quit or are dismissed and replaced, the corporation can survive, and today¶s
stockholders can sell all their shares to new investors without disrupting the operations of the
business.

8/7/2019 equity and derivative
http://slidepdf.com/reader/full/equity-and-derivative 9/123
In case of holding equity shares, the maximum value you can lose is the value of your
investment, which means that stockholders cannot be held personally responsible for the firm¶s
debt. Even if a company of which you are a shareholder goes bankrupt, you can never lose your
personal assets.
For example, in a company the total equity capital of Rs 2,00,00,000 is divided into
20,00,000 units of Rs 10 each. Each such unit of Rs 10 is called a Share. Thus, the company then
is said to have 20, 00,000 equity shares of Rs 10 each.
Derivative market: -
The derivatives markets are the financial markets for derivatives. The market can be
divided into two, that for exchange traded derivatives (ETD) and that for over-the-counter
derivatives(OTC).
The word ³DERIVATIVES´ is derived from the word itself derived of an underlying
asset. It is a future image or copy of an underlying asset which may be shares, stocks,
commodities, stock index, etc.
For example, wheat farmers may wish to sell their harvest at a future date to eliminate the risk of
a change in prices by that date. Such a transaction is an example of a derivative. The price of this
derivative is driven by the spot price of wheat which is the "underlying".
Derivatives have become very important in the field finance. They are very important
financial instruments for risk management as they allow risks to be separated and traded.
Derivatives are used to shift risk and act as a form of insurance. This shift of risk means that each
party involved in the contract should be able to identify all the risks involved before the contract
is agreed.
It is also important to remember that derivatives are derived from an underlying asset.
This means that risks in trading derivatives may change depending on what happens to the
underlying asset. The underlying asset can be equity, forex, commodity or any other asset.

8/7/2019 equity and derivative
http://slidepdf.com/reader/full/equity-and-derivative 10/123
For example, if the settlement price of a derivative is based on the stock price of a stock for e.g.
Infosys, which frequently changes on a daily basis, then the derivative risks are also changing on
a daily basis. This means that derivative risks and positions must be monitored constantly.
NEED OF THE STUDY
y Different kinds of investors to invest in equity & derivative and to face high risk and get
high returns.
y Company proves to an option for the investors.
y Studying the performance of investing equity & derivative for few months considering
their analysis.
OBJECTIVE OF THE STUDY
Any investor¶s vision is a long term investment and short term investment and gets high returns
by bearing high risk. For that objective need to be climbed successfully an so objectives of this
project are,
1) To find the RIGHT SCRIPT to buy and sell at the RIGHT TIME.
2) To understand the basic of equity investment like cost of equity, risk associated and different
strategies involved in that.
3) To understand the concept of the Financial Derivatives such as Futures and Options.
4) To know how derivatives can be use for hedging.
5) To know the outcome of Equity and Derivative.

8/7/2019 equity and derivative
http://slidepdf.com/reader/full/equity-and-derivative 11/123
SCOPE OF THE STUDY
The study is limited to ³Equity and Derivative Market´ With reference to the Indian context and
the India Infoline has been taken as representative sample for the study.
The study cannot be said as totally perfect, any alteration may come. The study has only made
humble attempt at evaluating the comparison of Equity & Derivatives Markets only in Indian
Context. The study is not based on the International perspective of the stock markets.
METHODOLOGY OF THE STUDY
The data collection methods include both primary and secondary collection methods.
Primary method: This method includes the data collected (of the various companies) from the
personal interaction with authorized members of India Infoline limited. Also the method of
analyzing has been explained by them.
Secondary method: The secondary data collection method includes:
y The lecturers delivered by the superintendents of respective departments.
y The brochures and material provided by India Infoline limited.
y The data and the various companies balance sheet collected from the internet
y Various books related to equities, capital market, corporate finance and other related
topics.
LIMITATIONS OF THE STUDY1) This project was restricted for two months hence exhaustive data is not available upon
which conclusions can be relied.
2) Investment in Securities carry risk so investment in Equity & Derivative is also carrying
risk on the basis of the market.

8/7/2019 equity and derivative
http://slidepdf.com/reader/full/equity-and-derivative 12/123
3) Factors affecting the Market Price of Investment may be due to Market forces,
Performance of the companies is not possible, and so all the data is not available.
8/7/2019 equity and derivative
http://slidepdf.com/reader/full/equity-and-derivative 13/123
COMPANY PROFILE

8/7/2019 equity and derivative
http://slidepdf.com/reader/full/equity-and-derivative 14/123
THE INDIA INFOLINE LIMITED
Origin:
India infoline Ltd., was founded in 1995 by a group of professional with impeccable
educational qualifications and professional credentials. Its institutional investors include Intel
Capital (world's) leading technology company, CDC (promoted by UK government), ICICI,
TDA and Reeshanar.
India Infoline group offers the entire gamut of investment products including stock
broking, Commodities broking, Mutual Funds, Fixed Deposits, GOI Relief bonds, Post office
savings and life Insurance. India Infoline is the leading corporate agent of ICICI Prudential Life
Insurance Co. Ltd., which is India' No. 1 Private sector life insurance company.
www.indiainfoline.com has been the only India Website to have been listed by none
other than Forbes in it's 'Best of the Web' survey of global website, not just once but three times
in a row and counting... ³A must read for investors in south Asia´ is how they choose to describe
India Infoline. It has been rated as No.l the category of Business News in Asia by Alexia rat ing.
Stock and Commodities broking is offered under the trade name 5paisa. India Infoline
Commodities pvt Ltd., a wholly owned subsidiary of India Infoline Ltd., holds membership of
MCX and NCDEX
Main Objects of the Company
Main objects as contained in its Memorandum or Association are:
1. To engage or undertake software and internet based services, data processing IT enabled
services, software development services, selling advertisement space on the site, web
consulting and related services including web designing and web maintenance, softwareproduct development and marketing, software supply services, computer consultancy
services, E-Commerce of all types including electronic financial intermediation business
and E-broking, market research, business and management consultancy.

8/7/2019 equity and derivative
http://slidepdf.com/reader/full/equity-and-derivative 15/123
2. To undertake, conduct, study, carry on, help, promote any kind of research, probe,
investigation, survey, developmental work on economy, industries, corporate business
houses, agricultural and mineral, financial institutions, foreign financial institutions,
capital market on matters related to investment decisions primary equity market,
secondary equity market, debentures, bond, ventures, capital funding proposals,
competitive analysis, preparations of corporate / industry profile etc. and trade / invest in
researched securities
VISION STATEMENT OF THE COMPANY:
³Our vision is to be the most respected company in the financial services space In India´.
Products: the India Infoline pvt ltd offers the following products
A. E-broking.
B. Distribution
C. Insurance
D. PMS
E. Mortgages
A. E-Broking:
It refers to Electronic Broking of Equities, Derivatives and Commodities under the brand name
of 5paisa
1. Equities
2. Derivatives
3. CommoditiesB.Distribution:
1. Mutual funds
2. Govt of India bonds.
3. Fixed deposits

8/7/2019 equity and derivative
http://slidepdf.com/reader/full/equity-and-derivative 16/123
C.Insurance:
1. Life insurance policies
2. General Insurance
3. Health Insurance Policies.
THE CORPORATE STRUCTURE
The India Infoline group comprises the holding company, India Infoline Ltd, which has 5
wholly-owned subsidiaries, engaged in distinct yet complementary businesses which together
offer a whole bouquet of products and services to make your money grow.
The corporate structure has evolved to comply with oddities of the regulatory framework
but still beautifully help attain synergy and allow flexibility to adapt to dynamics of different
businesses.
The parent company, India Infoline Ltd owns and managers the web properties
www.Indiainfoline.com and www.5paisa.com. It also undertakes research Customized and off-
the-shelf.
Indian Infoline Securities Pvt. Ltd. is a member of BSE, NSE and DP with NSDL. Its
business encompasses securities broking Portfolio Management services.
India Infoline.com Distribution Co. Ltd., Mobilizes Mutual Funds and other personal
investment products such as bonds, fixed deposits, etc.
India Infoline Insurance Services Ltd. Is the corporate agent of ICICI Prudential Life Insurance,
engaged in selling Life Insurance, General Insurance and Health Insurance products.
India Infoline Commodities Pvt. Ltd. is a registered commodities broker MCX and offers
futures trading in commodities.

8/7/2019 equity and derivative
http://slidepdf.com/reader/full/equity-and-derivative 17/123
India Infoline Investment Services Pvt Ltd., is proving margin funding and NBFC services to the
customers of India Infoline Ltd.,
Pictorial Representation of India Infoline Ltd

8/7/2019 equity and derivative
http://slidepdf.com/reader/full/equity-and-derivative 18/123
Management of India Infoline Ltd.,
India Infoline is a professionally managed Company. The promoters who run the
company/s day-to-day affairs as executive directors have impeccable academic professional track
records.
Nirmal Jain, chairman and Managing Director, is a Chartered Accountant, (All India
Rank 2); Cost Account, (All India Rank l) and has a post-graduate management degree from IIM
Ahmedabad. He had a successful career with Hindustan Lever, where he inter alia handled
Commodities trading and export business. Later he was CEO of an equity research organization.
R. Venkataraman, Director, is armed with a post- graduate management degree from IIM
Bangalore, and an Electronics Engineering degree from IIT, Kharagpur. He spent eight fruitful
years in equity research sales and private equity with the cream of financial houses such as ICICI
group, Barclays de Zoette and G.E. Capital
The non-executive directors on the board bring a wealth of experience and expertise.
Satpal khattar -Reeshanar investments, SingaporeThe key management team comprises seasoned
and qualified professionals.
Mukesh Sing- Director, India Infoline Securities Pvt Ltd.
Seshadri Bharathan- Director, India Infoline. Com Distribution Co Ltd
S Sriram- Vice President, Technology
Sandeepa Vig Arora- Vice President, Portfolio Management Services
Dharmesh Pandya- Vice President, Alternate Channel
Toral Munshi- Vice President, Research
Anil Mascarenhas- Chief Editor
Pinkesh Soni Financial controller
Harshad Apte Chief Marketing Officer

8/7/2019 equity and derivative
http://slidepdf.com/reader/full/equity-and-derivative 19/123
Fiancials of India Infoline Ltd.,
As per the latest results India Infoline limited's Net Sales for the 3 months period ending 31-
Dec-2009 is Rs.2317.53 Mn and its PAT is Rs 647.17 Mn.
Financials
All
figures in
Mn QoQ YoY

8/7/2019 equity and derivative
http://slidepdf.com/reader/full/equity-and-derivative 20/123
Component
Current
Quarter Previous Quarter Last Year's Quarter
Quarter ending
(months)
31-Dec-
2009 (3)
30-Sep-
2009 (3) Difference(%)
31-Dec-
06 Difference(%)
Net sales 2317.53 1191.12 94.57 2317.53 0
Other income 81.13 118.83 -31.73 81.13 0
Total income 2398.66 1309.95 83.11 2398.66 0
Total expenses 0 543.41 -100 0 N.A
Gross profit(OPBDIT) 2398.66 766.53 212.92 2398.66 0
Depreciation 23.96 51.16 -53.16 23.96 0
Operating profit(OPBIT) 2374.7 715.38 231.95 2374.7 0
Interest 0 32.71 -100 0 N.A
OPBT 2374.7 682.66 247.86 2374.7 0
Extraordinaryincome / exp 0 0 N.A 0 N.A
Prior period
adjustments 0 0 N.A 0 N.A
PBT 2374.7 682.66 247.86 2374.7 0
Tax provision 329.13 227.28 44.81 329.13 0
Net profit (PAT) 2045.57 455.38 349.2 2045.57 0
Adjusted PAT 2045.57 455.38 349.2 2045.57 0
Average tax rate 0.14 0.33 -58.37 0.14 0
GPM (%) 103.5 64.35 60.83 103.5 0
OPM (%) 102.47 60.06 70.61 102.47 0
NPM (%) 102.47 57.31 78.78 102.47 0
Equity Capital 533.88 533.55 0.06 533.88 0

8/7/2019 equity and derivative
http://slidepdf.com/reader/full/equity-and-derivative 21/123
Its growth figures for last 5 quarters
Growth Margins -
Quarterly (Difference between successive quarters) In %
Quarter
ending
(months
) 31-Dec-2009 (3)
30-Sep-2009
(3)
30-Jun-2009
(3)
31-Mar-2009
(3)
31-Dec-2006
(3)
Compo
nent Value
Differe
nce
(%)
Valu
e
Differ
ence
(%) Value
Differ
ence
(%) Value
Differ
ence
(%)
Valu
e
Differe
nce (%)
GPM 103.5 60.83
64.3
5 71.04 37.63 71.04 0 71.04 0 71.04
OPM 102.47 70.61
60.0
6 90.59 31.51 90.59 0 90.59 0 90.59
NPM 102.47 78.7857.31
-303.05 -28.23
-303.05 0
-303.05 0 -303.05
View the line graphs below for the Sales & Pat growth pattern over last 5 quarters:

8/7/2019 equity and derivative
http://slidepdf.com/reader/full/equity-and-derivative 22/123
Sales & PAT
Peer Group Comparison
Figured in Mn
Company name Sales Rank PAT Rank Market Cap Rank
India Infoline Limited 2697.80 1 521.22 2 68283.17 3
Indiabulls Financial Services Limited 2611.70 2 1531.03 1 179464.07 1
Edelweiss Capital Limited 576.38 3 261.97 3 75670.97 2
Motilal Oswal Financial Services Limited 107.48 4 14.88 5 41271.01 4
Religare Enterprises Limited 25.91 5 119.72 4 40454.70 5

8/7/2019 equity and derivative
http://slidepdf.com/reader/full/equity-and-derivative 23/123
CHAPTER III
EQUITY AND DERIVATIVE
PERSPECTIVES

8/7/2019 equity and derivative
http://slidepdf.com/reader/full/equity-and-derivative 24/123
Equity
Total equity capital of a company is divided into equal units of small denominations, each called
a share.
y It is a stock or any other security representing an ownership interest.
y It proves the ownership interest of stock holders in a company.
For example:-
In a company the total equity capital of Rs 2, 00, 00,000 is divided into 20, 00,000 units of Rs 10
each. Each such unit of Rs 10 is called a Share. Thus, the company then is said to have 20,
00,000 equity shares of Rs 10 each. The holders of such shares are members of the company and
have voting rights.
Reasons for issuing equity
To expand the business, a company, at some point, needs to raise money. To do this, it caneither borrow by taking a loan or raise funds by offering prospective investors a stake in the
company. which is known as issuing stock. However it can also buy back those shares, if
required. A company usually borrows from banks and/or financial institutions. This is called
µdebt financing¶.
On the other hand, issuing stock is called µequity financing¶. Loans raised are used for
temporary cash requirements (such as borrowing to fund a project), issuing stock is used to raise
funds of a permanent nature.
After taking the financing decision now the company has to decide the investment
decision. Investment and financing decisions are typically separated. When an investment
opportunity or ³project´ is identified, the project manager first asks whether the project is worth

8/7/2019 equity and derivative
http://slidepdf.com/reader/full/equity-and-derivative 25/123
more than the capital required to undertake it. If the answer is yes, he or she then considers how
the project should be financed.
EQUITY INVESTMENT STRATEGIES
Equity investment strategies include:
Buy-and-hold strategy Vs a market-timing strategy and
Value-oriented strategy Vs a growth-oriented strategy
Buy-and-hold Vs a market- timing strategy
A buy-and-hold strategy is like selecting and holding those stocks which has strong earning
potential and appreciation over the long term. Generally, the stocks are maintained as long as it
has the power to generate profit (or at least according to expectations), even though there may be
price swings. When they are no longer able to generate the adequate return/ profit then they are
sold away.
A market-timing strategy is more short term than a buy-and-hold strategy. Market timing
is used to capture short-term swings. This strategy seeks to optimize stock returns over simplybuying and holding stocks.
Value-oriented Vs growth oriented strategy
Value investing means identifying and investing in companies that are believed to be
currently undervalued but whose worth will be recognized by the market eventually. These
companies¶ intrinsic or fundamental values are higher than their current market values. This
strategy implies investing in such companies before the markets recognize their true values and
push up their share prices accordingly.

8/7/2019 equity and derivative
http://slidepdf.com/reader/full/equity-and-derivative 26/123
Growth investing means investing in those companies that show steady growth over a
certain time period, whose turnover and profits are expected to grow significantly, which will
result in appreciation in their share prices. Companies, whose potential for growth in sales and
earnings are excellent, are growing faster than other companies in the market are or other stocks
in the same industry are called the Growth Stocks. These companies usually pay little or no
dividends and instead prefer to reinvest their profits in their business for further expansions.
CHARACTERISTICS OF EQUITY
Profit Sharing: Investors can enjoy unlimited participation in the earnings of the firm.
Generally, there is no limit for a particular firm to earn profit and if it wants, it candistribute a part of that among the shareholders as dividends, because the dividend payment
is not compulsory. Dividend is a percentage of the face value of a share that a company
returns to its shareholders from its annual profits. Of course there is always a risk of non-
functioning or less profitability of the firm, which mainly the equity shareholders have to
bear.
Voting Rights: Equity stocks come with certain rights including the voting rights to which
the investors are entitled.
Limited Liability: Another important feature of equity is its limited liability, which means
that stockholders cannot be held personally responsible for the firm¶s debt, unlike
partnerships and sole proprietorships. In case of bankruptcies no one can demand the
shareholders to put up more money to cover the companies¶ debts. Stockholders can lose
their entire investment, but no more.
Highly liquid: Equity stocks are generally highly liquid instruments, which can be bought
and sold easily in the equity markets. Ownership stake in the company changes with every
buy and sell. An investor can acquire ownership and sell off his ownership quite easily
whenever he wishes to do so.

8/7/2019 equity and derivative
http://slidepdf.com/reader/full/equity-and-derivative 27/123
Benefits from Equity
The benefits distributed by the company to its shareholders can be:
1) Monetary Benefits
2) Non Monetary Benefits.
1. Monetary Benefits:
A. Dividend: An equity shareholder has a right on the profits generated by the Company. Profits
are distributed in part or in full in the form of dividends. Dividend is an earning on the
investment made in shares, just like interest in case Of bonds or debentures. A company can
issue dividend in two forms:a) Interim Dividend
b) Final Dividend.
While final dividend is distributed only after closing of financial year; companies at times
declare an interim dividend during a financial year. Hence if X Ltd. earns a profit of Rs 40 crore
and decides to distribute Rs 2 to each shareholder, a holding of 200 shares of X Ltd. Would
entitle you to Rs 400 as dividend. This is a return that you shall earn as a result of the investment
made by you by subscribing to the shares of X Ltd.
B. Capital Appreciation: A shareholder also benefits from capital appreciation. Simply put, this
means an increase in the value of the company usually reflected in its share price. Companies
generally do not distribute all their profits as dividend. As the companies grow, profits are re-
invested in the business. This means an increase in net worth, which results in appreciation in the
value of shares. Hence, if you purchase 200 shares of X Ltd at Rs 20 per share and hold the
same for two years, after which the value of each share is Rs 35. This means that your capital has
appreciated by Rs 3000.
2. Non-Monetary Benefits:

8/7/2019 equity and derivative
http://slidepdf.com/reader/full/equity-and-derivative 28/123
Apart from dividends and capital appreciation, investments in shares also fetch some type of
non-monetary benefits to a shareholder. Bonuses and rights issues are two such noticeable
benefits.
A. Bonus: An issue of bonus shares is the distribution free of cost to the shareholders usually
made when a company capitalizes on profits made over a period of time. Rather than paying
dividends, companies give additional shares in a pre-defined ratio. Prima facie, it does not affect
the wealth of shareholders. However, in practice, bonuses carry certain latent advantages such as
tax benefits, better future growth potential, and an increase in the floating stock of the company,
etc. Hence if X Ltd decides to issue bonus shares in a ration of 1:1, every existing Shareholder of
X Ltd would receive one additional share free for each share held by him. Of course, taking the
bonus into account, the share price would also ideally fall by 50 percent post bonus. However,
depending upon market expectations, the share price may rise or fall on the bonus
announcement.
B. Rights Issue: A rights issue involves selling of ordinary shares to the existing shareholders of
the company. A company wishing to increase its subscribed capital by allotment of further shares
should first offer them to its existing shareholders. The benefit of a rights issue is that existing
shareholders maintain control of the company. Also, this results in an expanded capital base,
after which the company is able to perform better. This gets reflected in the appreciation of share
value.
Risks In equity investment:
Although an equity investment is the most rewarding in terms of returns generated, certain risks
are essential to understand before venturing into the world of equity.
y Market/ Economy Risk.
y Industry Risk.
y Management Risk.
y Business Risk.

8/7/2019 equity and derivative
http://slidepdf.com/reader/full/equity-and-derivative 29/123
y Financial Risk
y Exchange Rate Risk.
y Inflation Risk.
y Interest Rate Risk.
How to overcome risks:
Most risks associated with investments in shares can be reduced by using the tool of
diversification. Purchasing shares of different companies and creating a diversified portfolio has
proven to be one of the most reliable tools of risk reduction.
The process of Diversification:
When you hold shares in a single company, you run the risk of a large magnitude. As your
portfolio expands to include shares of more companies, the company specific risk reduces. The
benefits of creating a well diversified portfolio can be gauged from the fact that as you add more
shares to your portfolio, the weightage of each company¶s share gets reduced. Hence any adverse
event related to any one company would not expose you to immense risk. The same logic can be
extended to a sector or an industry. In fact, diversifying across sectors and industries reaps the
real benefits of diversification. Sector specific risks get minimised when shares of other sectors
are added to the portfolio. This is because a recession or a downtrend is not seen in all sectors
together at the same time.
However all risks cannot be reduced:
Though it is possible to reduce risk, the process of equity investing itself comes with certain
inherent risks, which cannot be reduced by strategies such as diversification. These risks arecalled systematic risk as they arise from the system, such as interest rate risk and inflation risk.
As these risks cannot be diversified, theoretically, investors are rewarded for taking systematic
risks for equity investment.

8/7/2019 equity and derivative
http://slidepdf.com/reader/full/equity-and-derivative 30/123
Selection of Shares:
Proper selections of shares are of two types:-
1. Fundamental analysis:
It involves in ±depth study and analysis of the prospective company whose shares we want to
buy, the industry it operates in and the overall market scenario. It can be done by reading and
assessing the company¶s annual reports, research reports published by equity research houses,
research analysis published by the media and discussions with the company¶s management or the
other experienced investors.
2. Technical analysis :
It involves studying the prices movement of the stock over an extended period of
time in the past to judge the trend of the future price movement. It can be done by
software programs, which generate stock prices charts indicating upward. Downward and
sideways movements of the stock price over the stipulated time period.
When to buy & sell shares:
With high volatility prevailing in the market, major price fluctuations in equities
are not uncommon. Therefore, apart from ascertaining µwhich¶ stock to buy or sell, it becomes
equally important to consider µwhen¶ to buy or sell. Any investor should be aware of the fact
where all the investor is following i.e., Buy Low. Sell High.
That means we should buy stocks at a low price and sell them at a high price.
When to buy
Three ways by which we can figure that out what it is about this stock that makes it
hot.
1. Earnings per Share (EPS): How well the company is doing:
EPS is the total earning or profits made by company (during a given period of time) calculated
on per share basis. It aims to give an exact evaluation of the returns that the company can deliver.

8/7/2019 equity and derivative
http://slidepdf.com/reader/full/equity-and-derivative 31/123
Example:
Company XYZ Ltd. Capital: Rs 100 crore (Rs 1 billion).
Capital is the amount the owner has in the business. As the business grows and makes profits, it
adds to its capital. This capital is subdivided into shares (or stocks). The capital is divided into
100 million shares of Rs 10 each.
Net Profit in 2003-04: Rs 20 crore (Rs 200 million).
EPS is the net profit divided by the total number of shares.
EPS = net profit/ number of shares
EPS = Rs 20 crore (Rs 200 million)/ 10 crore (100 million) shares = Rs 2 per share
Lesson to be learnt
y If a company's EPS has grown over the years, it means the company is doing well, and
the price of the share will go up. If the EPS declines, that's a bad sign, and the stock price
falls.
y Companies are required to publish their quarterly results. Keep an eye out for these
results; check for the trend in their EPS.
2 Price earnings ratio (PE ratio): How other investors view this share

8/7/2019 equity and derivative
http://slidepdf.com/reader/full/equity-and-derivative 32/123
An indicator of how highly a share is valued in the market. It arrived at by dividing the closing
price of a share on a particular day by EPS. The ratio tends to be high in the case of highly rated
shares. The average PE ratio for companies in an industry group is often given in investment
journal. Two stocks may have the same EPS. But they may have different market prices. That's
because, for some reason, the market places a greater value on that stock. PE ratio is the market
price of the stock divided by its EPS.
PE = market price/ EPS
let¶s take an example of two companies.
Company XYZ Ltd
Market price = Rs 100
EPS = Rs 2
PE ratio = 100/ 2 = 50
Company ABC Ltd
Market price = Rs 200
EPS = Rs 2
PE ratio = 200/ 2 = 100
In the above cases, both companies have the same EPS. But because their market price is
different, the PE ratio is different.
Lesson to be learnt
y In the case of EPS, it is not so much a high or low EPS that matters as the growth in
the EPS. The company's PE reflects investors' expectations of future growth in the
EPS. A high PE company is one where investors have hopes that earnings will rise,
which is why they buy the share.

8/7/2019 equity and derivative
http://slidepdf.com/reader/full/equity-and-derivative 33/123
3. Forward PE: Looking ahead
The stock market is not nostalgic. It is forward looking. For instance, it sometimes happens that a
sick company, that has made losses for several years, gets a rehabilitation package from its bank
and a new CEO. As a consequence, the company's stock shoots up. Because investors think the
company will do better in the future because of the package and new leadership, and its earnings
will go up. And we think it is a good time to buy the shares of the company now. Suddenly, the
demand for the shares has gone up. Because stock prices are based on expectations of future
earnings, analysts usually estimate the future earnings per share of a company. This is known as
the forward PE. Forward PE is the current market price divided by the estimated EPS, usually for
the next financial year.
Forward PE = Current market price/ estimate EPS for the next financial year.
To illustrate what we have been talking about, let's take the example of Infosys Technologies.
Trailing 12-month EPS = Rs 56.82 (EPS of the last four quarters)
Closing price on January 6 = Rs 2043.15
PE = Price/EPS = 2043.15/ 56.82 = 35.95
Estimated EPS for 2004-05 = Rs 67
Estimated EPS for 2005-06 = Rs 90
these figures are according to brokers' consensus estimates.
Forward PE = current market price/ estimated EPS for next financial year
Forward PE for 2004-05 = 2043.15/ 67 = 30.49
Forward PE for 2005-06 = 2043.15/ 90 = 22.70
With an EPS growth of over 30%, a forward PE of 22.7 is not high, indicating that there is scope
to be optimistic about the stock's price.
Lesson to be learnt

8/7/2019 equity and derivative
http://slidepdf.com/reader/full/equity-and-derivative 34/123
y Sometimes, investors look out for a low PE stock, expecting that its price will rise in
the future. But sometimes, low PE stocks may remain low PE stocks for ages,
because the market doesn't fancy them.
y Keep tab on the business news to check out the company's prospects in the future
When to sell
Stock Reaches Fair Value or Target Price:
This is the easiest part of selling. We should sell when a stock reaches its fair value. It is the
main reason why we chose to buy it on the first place.
The target price can be computed by assessing the company¶s estimated financial performance
over the next 3 to 5 years, computing its EPS and using an acceptable P/E ratio to compute the
future market price. Based on this future estimated price and our required return on our
investment, compute our target price.
When the prices reaches Stop loss:It is advisable to always consider the possibility of a loss before making our investment. We
should decide how much loss we are willing to book in the stock. The lower price i.e., the price
at which we are willing curtail our loss, is called µStop Loss¶.
Need the money:
T he generally happens due to improper planning. However, things happen. Even the most
carefully planned strategy may not work. Catastrophic events may force investors to sell an
investment if his household is affected by it.
The book is unclean:
When management left their post abruptly or when the SEBI conduct a criminal investigation on
a company, it may be time to sell. Our assumption may be inaccurate as a lot of fair value

8/7/2019 equity and derivative
http://slidepdf.com/reader/full/equity-and-derivative 35/123
calculation is based on the company's balance sheet, cash flow or other financial statement
published by management.
Takeover news:
When one of your stock holding is getting bought by other companies, it may be time to sell.
Sure, you might like the acquiring company but you still need to figure out the fair value of the
common stock of the acquiring company. If the acquiring company is overvalued, then it is best
to sell.
Other Investment Opportunity:
Let us consider we bought stock A and it has risen to 10% below its fair value. Meanwhile, we
noticed that stock B fallen to below 50% of our calculated fair value. This is an easy decision.
We will sell our stock A and buy stock B. Our goal as an investor is to maximize our investment
return. Sacrificing a 10% of return in order to earn a 50% return is a sensible way to do that.
Inaccurate Fair Value Calculation:
There are factors that we might not take into accounts when researching a
particular company. For example, satyam scandal. As investors, we sometimes
made errors in our fair value calculation.
New Competitors with Better Products:
When new competitors sprung up, the company that you hold might have to spend more money
in order to fend off competition. Recent example includes the emergence of pay-per click
advertising by Google. Any advertising business such as newspapers or cable network, this new
product by Google might hurt profit margins and eventually the fair value of the stock.
Not having a valid reason to Buy:
When we don't know why we bought a particular stock, we won't know how much our potential
return is or when we should sell it. This is the easiest way of losing money. When we have no
valid reason to buy, we should sell immediately.

8/7/2019 equity and derivative
http://slidepdf.com/reader/full/equity-and-derivative 36/123
Types of Cash market margin
1. Value at Risk (VaR) margin.
2. Extreme loss margin
3. Mark to market Margin
1. Value at Risk ( VaR ) margin :
VaR Margin is at the heart of margining system for the cash market segment.
VaR is a technique used to estimate the probability of loss of value of an asset or group of assets
(for example a share or a portfolio of a few shares), based on the statistical analysis of historical
price trends and volatilities.
A VaR statistic has three components: a time period, a confidence level and a loss amount (or loss percentage). Keep these three parts in mind as we give some examples of variations of the
question that VaR answers:
y With 99% confidence, what is the maximum value that an asset or portfolio may lose
over the next day?
Example:-
Suppose shares of a company bought by an investor. Its market value today is Rs.50 lakhs but its
market value tomorrow is obviously not known. An investor holding these shares may, based on
VaR methodology, say that 1-day VaR is Rs.4 lakhs at 99% confidence level. This implies that
under normal trading conditions the investor can, with 99% confidence, say that the value of the
shares would not go down by more than Rs.4 lakhs within next 1-day.
In the stock exchange scenario, a VaR Margin is a margin intended to cover the largest
loss (in%) that may be faced by an investor for his / her shares (both purchases and sales) on a
single day with a 99% confidence level. The VaR margin is collected on an upfront basis (at the
time of trade).
How is VaR margin calculated?

8/7/2019 equity and derivative
http://slidepdf.com/reader/full/equity-and-derivative 37/123
VaR is computed using exponentially weighted moving average (EWMA) methodology. Based
on statistical analysis, 94% weight is given to volatility on µT-1¶ day and 6% weight is given to
µT¶ day returns.
To compute, volatility for January 1, 2008, first we need to compute day¶s return for Jan 1, 2009
by using LN (close price on Jan 1, 2009 / close price on Dec 31, 2008).
Take volatility computed as on December 31, 2008.
Use the following formula to calculate volatility for January 1, 2009:
Square root of [0.94*(Dec 31, 2008 volatility)*(Dec 31, 2008 volatility)+ 0.06*(January 1, 2009
LN return)*(January 1, 2009 LN return)]
Example:
Share of ABC Ltd
Volatility on December 31, 2008 = 0.0314
Closing price on December 31, 2008 = Rs. 360 Closing price on January 1, 2009 = Rs. 330
January 1, 2009 volatility =
Square root of [(0.94*(0.0314)*(0.0314) + 0.06 (0.08701)* (0.08701)] = 0.037 or 3.7%
How is the Extreme Loss Margin computed?
The extreme loss margin aims at covering the losses that could occur outside the coverage of
VaR margins.
The Extreme loss margin for any stock is higher of 1.5 times the standard deviation of
daily LN returns of the stock price in the last six months or 5% of the value of the position. This
margin rate is fixed at the beginning of every month, by taking the price data on a rolling basis
for the past six months.
Example:
In the Example given at question 10, the VaR margin rate for shares of ABC Ltd. was 13%.
Suppose the 1.5 times standard deviation of daily LN returns is 3.1%. Then 5% (which is higher
than 3.1%) will be taken as the Extreme Loss margin rate.
Therefore, the total margin on the security would be 18% (13% VaR Margin + 5% Extreme Loss

8/7/2019 equity and derivative
http://slidepdf.com/reader/full/equity-and-derivative 38/123
Margin). As such, total margin payable (VaR margin + extreme loss margin) on a trade of Rs.10
lakhs would be 1, 80,000/-
How is Mark-to-Market (MTM) margin computed?
MTM is calculated at the end of the day on all open positions by comparing transaction price
with the closing price of the share for the day.
Example:
A buyer purchased 1000 shares @ Rs.100/- at 11 am on January 1, 2008. If close price of the
shares on that day happens to be Rs.75/-, then the buyer faces a notional loss of Rs.25, 000/ - on
his buy position. In technical terms this loss is called as MTM loss and is payable by January 2,
2008 (that is next day of the trade) before the trading begins.
In case price of the share falls further by the end of January 2, 2008 to Rs. 70/-, then buy
position would show a further loss of Rs.5,000/-. This MTM loss is payable.
In case, on a given day, buy and sell quantity in a share are equal, that is net quantity
position is zero, but there could still be a notional loss / gain (due to difference between the buy
and sell values), such notional loss also is considered for calculating the MTM payable.
MTM Profit/Loss = [(Total Buy Qty X Close price)] - Total Buy Value] - [Total Sale Value -
(Total Sale Qty X Close price)]
STOCK SELECTION GUIDELINES
Choose a company:
Select companies in businesses that you already have an idea of and find interesting. One of the
businesses that could be of interest to you would be the one, which you are affiliated to because
of your employment or so on. For instance, if you are working in a manufacturing company, you
may understand this business well.

8/7/2019 equity and derivative
http://slidepdf.com/reader/full/equity-and-derivative 39/123
Analyze company¶s growth:
Just try to understand and analyze companies past performance and based on that determine the
future growth of the company. Ratio analysis is widely used to assess a company¶s past
performance.
Evaluate company¶s management:
The promoters and the management team of a company are the key people who drive
its business. Their integrity dictates whether the business benefits or they benefit
personally. Also, their experience and business competence is crucial for business
growth. Evaluate the company¶s promoters and management on the basis of four Cs:
Competence, Credibility, Corporate governance and Concern for shareholders.
Forecast the future prospects of the company
Although a company may have performed really well in the past, it is not necessary that it will
continue performing well in the future. All companies go through business cycles of ups and
downs. It is important that you form a view on the future trends of the business of the company
you have chosen. This can be done by reading views of experts in that business/industry and
forming your own view by reading and understanding economic trends and the impact of these
trends on the company¶s business.
Determine 5 year potential:
As mentioned earlier, the share price of all companies continuously fluctuate on the stock
markets with investors buying and selling the shares. The price at which an investor is willing to
buy or sell a share of a company is the perceived value of the share of the company taking into
consideration the company¶s present business and future business growth. In addition to this,
investor sentiment plays a large role in pricing of stocks. It is important that before you buy a
company¶s share, you assess whether the price of the share at which it is available for purchase,
is adequately valued i.e. it is not over-priced. Similarly, when you sell, you need to make sure

8/7/2019 equity and derivative
http://slidepdf.com/reader/full/equity-and-derivative 40/123
that you are not selling too cheap. To help you assess this, you could use a popular stock market
ratio called the Price/Earning ratio (P/E ratio).
The P/E ratio is based on the following formula:
P/E ratio = Market price of the share
Earning per share (EPS)*
*EPS = Profit After Tax (PAT)
Total number of shares issued by the company
Let¶s understand how the P/E ratio is used with an example:
Company ABC Ltd. has issued a total of 10 lakh equity shares and has earned a net profit of Rs
10 lakh. The EPS of the company is Re 1. The current market price of the company is Rs 15 per
share. The P/E ratio of Company ABC Ltd will be 15 (Rs 15 / Re 1).
The P/E ratio helps judge by how many times the company¶s share is traded based on its
earnings. In this case, the company¶s stock is available at a multiple of 15 times its earnings. The
higher the P/E ratio, the higher is the stock¶s valuation. Usually market prices of well-established
companies with a good past track record and reputed promoters command a high P/E ratio.
To use the P/E ratio correctly, keep the following aspects in perspective:
Compare the P/E ratio of a company with that of other companies in the same business.
Compare it with P/E ratios of the benchmark indices such as the P/E ratio of the BSE
Sensex, the NSE Nifty, etc.
Compare the P/E ratio with the growth potential of the company and the industry it is a
part of. There could be a situation that even if the P/E ratio of a company is high, it would be
worthwhile to buy the stock if the growth potential is significant.

8/7/2019 equity and derivative
http://slidepdf.com/reader/full/equity-and-derivative 41/123
It is said that the higher the P/E the more the market is willing to pay for the company¶s earnings.
But it doesn¶t holds true always as a high P/E ratio can be an indicator of lesser return and a low
P/E ratio can also indicate a higher return which we can understand with the help of an example:
Stock A Stock B *
Price Rs10.00 Rs20.00
Earnings per share Rs2.00 Rs2.00
P/E Ratio 5 10
* Stock B is more expensive than Stock A in terms of earnings. For Stock B, you must pay
Rs20.00 to earn Rs2.00, but for Stock A, you pay only Rs10.00 to earn Rs 2.00.
To conclude, just because a company¶s P/E ratio is high, it does not mean that it is over-priced.
Consider this ratio along with other factors such as past performance, business potential,
promoters, the company¶s order book position, etc.
Apart from analyzing the P/E ratio of certain companies, there are other fundamental methods
that will help to determine the actual worth of the company. Some of them are:
INTRINSIC VALUE
Intrinsic value means the real worth/ value of the investment, apart from its market price or book
value. The intrinsic value includes other variables such as brand name, trademarks, and
copyrights that are often difficult to calculate and sometimes not accurately reflected in the
market price.
MARGIN OF SAFETY
It is the difference between the companies¶ intrinsic value and the stock price. It mainly helps an
investor to take decision regarding his investment. It is basically a principle of investing in

8/7/2019 equity and derivative
http://slidepdf.com/reader/full/equity-and-derivative 42/123
which an investor only purchases shares when the market price is significantly below its intrinsic
value. This difference allows an investor to avoid making inaccurate decision and also minimize
the downside risk of his investment.
For example, you find that the intrinsic value for stock BIOCON is $70 and are currently
traded at $48. After applying 20 per cent discount, the fair value is $56 (20 per cent discount
from $70). So, current price at $48 is still lower than the discounted intrinsic value. In this
case, it is safe to buy the stock today.
EQUITY ANALYSIS
The fundamental analyst believes that securities are priced in a rational manner based on
macroeconomic information, industry news, and the firm's financial statements.
Technical analysis is the technique to forecast the future price of the stock by studying
the past trend such as past price, volume and market data. It only deals with the price movements
in the market with the help of various charts. It generally study the supply and demand of the
market and on the basis of that determine the trend that will continue in the future.
There are two classic market types used to characterize the general direction of the market.
Bull Market
Bear Market
Bull markets are movements in the stock market in which prices are rising and the
consensus is that prices will continue moving upward. During this time, economic production is
high, jobs are plentiful and inflation is low.
Bear markets are the opposite--stock prices are falling, and the view is that they willcontinue falling. The economy will slow down, coupled with a rise in unemployment and
inflation.
The field of technical analysis is based on three assumptions:
The market discounts everything

8/7/2019 equity and derivative
http://slidepdf.com/reader/full/equity-and-derivative 43/123
A major drawback of technical analysis is that it only considers price movement, ignoring the
fundamental factors of the company. However, technical analysis assumes that, at any given
time, a stock's price reflects everything that has or could affect the company- including
fundamental factors. Technical analysts believe that the company's fundamentals, along with
broader economic factors and market psychology, are all priced into the stock, removing the
need to actually consider these factors separately.
Price moves in trends:
In technical analysis, price movements are believed to follow trends. This means
that after a trend has been established, the future price movement is more likely to be in the
same direction as the trend than to be against it. Most technical trading strategies are based
on this assumption. Moving Averages and Elliott wave principle are said to be the most
common trend indicators.
History tends to repeat itself:
Another important idea in technical analysis is that history tends to repeat itself,
mainly in terms of price movement. The repetitive nature of price movements is attributed to
market psychology; in other words, market participants tend to provide a consistent reaction
to similar market stimuli over time. Technical analysis uses chart patterns to analyze market
movements and understand trends. Although many of these charts have been used for more
than 100 years, they are still believed to be relevant because they illustrate patterns in price
movements that often repeat themselves.
The equity analysis has been done on the following companies.
1) BATA INDIA
2) HDFC
3) ASIAN PAINTS
4) DABUR INDIA LTD

8/7/2019 equity and derivative
http://slidepdf.com/reader/full/equity-and-derivative 44/123
5) MRF TYRES
BATA INDIA:
Bata India manufactures different types of footwear including rubber/canvas footwear,
leather footwear and plastic footwear. The company offers various selection of footwear, Bata
also markets apparel under the brand names of ³North Star´, ³Power´ and ³Ambassador´. The
company sells its products through its retail outlets, as well as through wholesalers.
Present situation:
Net profit of Bata India declined 6.35% to Rs 10.33 crore in the quarter ended March
2009 as against Rs 11.03 crore during the previous quarter ended March 2008. Sales rose 6.80%
to Rs 233.03 crore in the quarter ended March 2009 as against Rs 218.20 crore during the
previous quarter ended March 2008.
The board of Bata India has recommended dividend at the rate of 25%.This was
recommended at the board meeting held on 27 February 2009.
Net profit of Bata India rose 0.05% to Rs 21.11 crore in the quarter ended December
2008 as against Rs 21.10 crore during the previous quarter ended December 2007. Sales rose
9.44% to Rs 255.23 crore in the quarter ended December 2008 as against Rs 233.22 crore during
the previous quarter ended December 2007.
For the full year, net profit rose 28.04% to Rs 60.74 crore in the year ended December 2008 as
against Rs 47.44 crore during the previous year ended December 2007. Sales rose 13.65% to Rs
983.60 crore in the year ended December 2008 as against Rs 865.45 crore during the previous
year ended December 2007.

8/7/2019 equity and derivative
http://slidepdf.com/reader/full/equity-and-derivative 45/123
Half yearly market report from Sep 2008- 28 Feb, 2009
In this case the BLUE bar indicates that stock has closed above than its open price and
RED bar indicates that the stock has closed lower its open price and other than that we should
also analyze the trend that this company follows:
Analyzing with the help of candlestick method:
With the help of candlesticks representation we can analyze that the market of BATA India has
shown a major decline from 150 (and above) to 79.5 in this six months. On the day before the
last day the company has shown a double decline to Rs 76.5. The stock previously moved up
from similar levels in Nov 2008. As per the last day, the company has shown a slight
improvement of Rs.3.5 on the day with an opening at Rs.81- Rs 82 and closing at Rs 84.5. Stop
loss is at Rs.79.5 while upside targets was at Rs.85.5.
The company has shown similar level in the mid of November and then the stock price
moved up to certain level. Once again it came to that level. So Rs 76.5 is said to be the Support
level i.e. from this level the company shows an upward movement and Rs 114- Rs 120 is
considered to be the Level of Resistance. As per the trend goes, it is suggested to buy the stock

8/7/2019 equity and derivative
http://slidepdf.com/reader/full/equity-and-derivative 46/123
with a 1-2 days perspective, as the stock price is expected to move higher. Let¶s see whether this
assumption really hold true or not by analyzing the price of next two months i.e. of March- April.
LINE CHART
The Line chart is the simplest type of chart. As shown in the chart the single line represents the
stock¶s closing price on each day of the entire year. Dates are displayed along the bottom of the
chart and prices are displayed on the side. Line charts are typically displayed using stocks
closing prices.
BATA INDIA:
Analyzing the stock movement from March 2009- April 2009:
By seeing the further movement of the stock price from Feb 2009, it is clear that the assumption
holds true. As it is a well saying that price movements are believed to follow trends and in case
of this company it holds true also.
As seen in the previous chart that the stock price of the company has shown a decline in
the 28 Feb 2009. But its condition has become somewhat better from March 2009 onwards. On
28 Feb it closes with the price of Rs79.5 and on April it has reached almost Rs 120. And by the
end of the month it has reached to Rs 130.90, thus succeeded to break the resistance level. A

8/7/2019 equity and derivative
http://slidepdf.com/reader/full/equity-and-derivative 47/123
break above the resistance level indicate that buyers have increased their expectations and are
willing to buy at even higher prices.
COMPARITIVE ANALYSIS WITH BSE
One-year comparative graph with BSE
BATA BSE
With the help of this graph we can say that Rs. 100 invested in the BATA in May 2008 has a
worth of Rs.70 in April 2009, it has almost shown a fall of Rs.30 (approx). During this period,
the benchmark BSE Sensex too recorded a fall with Rs 100 invested in May 2008 declining to
Rs.70 in April 2009. During the time of bearish market both BATA and BSE has shown almost
equal decline in the previous year. But now the share price has started moving in the upward
direction. And as per the technical analysis it is suggested to buy the share of the company.

8/7/2019 equity and derivative
http://slidepdf.com/reader/full/equity-and-derivative 48/123
Now with the help of the fundamental analysis let us analyze whether investing in
this company will be riskier or beneficial.
CALCULATION OF THE INTRINSIC VALUE
Current price = 130 Rs
EPS = 9.1
P/E ratio = 14.4%
Market capitalization= Rs.8408
Dividend payout ratio=32.6%
Expected ROI= 10%
EPSGR (earning per share growth rate) = 33.60%
STEP 1- Forecast share price for the next 5 years.
Forecast share price in 2013=EPS after 5th
year * P/E ratio
= 9.1*(1.34)* 14.4
= 566
STEP 2- Forecast Total Future Value.

8/7/2019 equity and derivative
http://slidepdf.com/reader/full/equity-and-derivative 49/123
Year Projected EPS
2008 9.1*1=9.1
2009 9.1*1.34=12.19
2010 9.1*(1.34)²=16.33
2011 9.1*(1.34)³=21.90
2012 9.1*(1.34)=29.34
2013 9.1*(1.34)=39.3
Total EPS =128.16
Total Dividend = Total EPS*Dividend Payout Ratio
= 128.16*32.6% =41.78
Total Future Value=Forecasted stock price in 2013+Total Dividend
= 566+41.78 =607.78
STEP 3: Calculate Intrinsic Value which is equal to
NET PRESENT VALUE=FUTURE VALUE
(EXPECTED ROI)NO OF YEARS

8/7/2019 equity and derivative
http://slidepdf.com/reader/full/equity-and-derivative 50/123
NPV=608 = 377.64
(1.10)
STEP 4: Compare with current stock price
Since the intrinsic value (377.64) is more than the current stock price (130), the
value of the stock is undervalued
MARGIN OF SAFETY
This is simply discounting the calculated intrinsic value. You can use
any discount rate. In this case, the intrinsic value of BATA is 377.64. Using a
discount rate of 20%, the fair value is 302.11. The current price is Rs130. It is
still lesser than its intrinsic value.
CONCLUSION:
Investing in the company is proving to be beneficial on the basis of both
technical and fundamental analyses. And it is also suggested to invest in those
companies which holds profitable on the basis of both technical and

8/7/2019 equity and derivative
http://slidepdf.com/reader/full/equity-and-derivative 51/123
fundamental analysis, which means in those companies where both the technical
and fundamental analyses go hand in hand. In case of this company it can also
be concluded that the company has the potential to grow further. So, it is
advisable to buy the stock.
HDFC Bank
HDFC Bank is the second largest private sector bank in the country (afterICICI Bank) in terms of asset size. At the end of March 2007, it had a franchise of
over 1,600 ATMs and 680 branches. The bank is focusing on loan origination in
the retail, SME (small and medium enterprises) and agriculture segments and on
non-fund based products and services. Its group companies, HDFC Standard Life
(insurance), HDFC AMC (mutual funds) and HDFC Securities (equities) adds
scalability to the bank's offerings.
HDFC Bank Ltd has informed BSE that the Investor Grievance (Share)
Committee of the Bank at its meeting held on May 08, 2009, have approved
allotment of 70,421 equity shares to the employees of the Bank under the
Employees Stock Option Scheme (ESOS).

8/7/2019 equity and derivative
http://slidepdf.com/reader/full/equity-and-derivative 52/123
Price representation by OHLC/ Bar chart
Analyzing the stock movement from May 2008- April 2009:

8/7/2019 equity and derivative
http://slidepdf.com/reader/full/equity-and-derivative 53/123
The stock price of HDFC seems to be highly unstable. The prices are rising
and falling very soon, not giving the time to the investors to decide whether to
stick with their stocks or simply sell them. In May 2008 it has entered with the
price of Rs 1475. And by the end of the same month the price has fallen to Rs.
1050, a fall of approx 28.8%. Again in the month of Sep it has managed to reach
near to Rs 1350. Again within 2 months i.e. in the first week of November itself
the stock price has drastically fall to Rs 825 approx. In April 2009 somehow the
stock price has managed to reach Rs 1075- Rs 1100 and now its current price is
Rs.1379. By analyzing the trend it is suggested not to buy the shares of the
company as previous year the stock price has fallen from this particular level so
there is a chance for the price to follow the same trend again.
COMPARITIVE ANALYSIS WITH BSE
One-year comparative graph with BSE

8/7/2019 equity and derivative
http://slidepdf.com/reader/full/equity-and-derivative 54/123
HDFC Bank BSE
With the help of this graph we can say that Rs. 100 invested in the HDFC Bank
in May 2008 has a worth of Rs.94 in April 2009, it has just shown a fall of Rs.6
(approx). During this period, the benchmark BSE Sensex has recorded a fall with
Rs 100 invested in May 2008 declining to Rs.70 in April 2009. During the time of
bearish market HDFC Bank has somehow managed the fall of its stock price
compared to the benchmark BSE. As it is said that equity market is a high risk-
high return market and it holds true as we can see in the case of HDFC Bank. The
investors of the bank havent faced much loss as compared to the investors of the
some other companies, as by the end of the year it has managed to reach the
price level of its starting point. The investors of the company are still standing in
the same point where they were standing in the previous year. And as there were
high fluctuations in the price level, so it is suggested not to hurry in investing in
the company.
Now, let us analyze whether the fundamental analysis supports our
assumption or not.

8/7/2019 equity and derivative
http://slidepdf.com/reader/full/equity-and-derivative 55/123
CALCULATION OF THE INTRINSIC VALUE
Current price = Rs1379
EPS = 53.0
P/E ratio = 26.0%
Market capitalization= Rs.599885
Dividend payout ratio=18.9%
Expected ROI= 10%
EPSGR (earning per share growth rate) = 5.60%
STEP 1- Forecast share price for the next 5 years.
Forecast share price in 2013=EPS after 5th
year * P/E ratio
= 53*(1.06)* 26.0
= 1846.52
STEP 2- Forecast Total Future Value.
Year Projected EPS

8/7/2019 equity and derivative
http://slidepdf.com/reader/full/equity-and-derivative 56/123
2008 53*1=53
2009 53*1.06= 56.18
2010 53*(1.06)²=59.55
2011 53*(1.06)³=63.12
2012 53*(1.06)=66.90
2013 53*(1.06)=71.02
Total EPS =369.77
Total Dividend = Total EPS*Dividend Payout Ratio
= 369.77*18.9% =69.88
Total Future Value=Forecasted stock price in 2013+Total Dividend
= 1846.52+69.88 =1916.4
STEP 3: Calculate Intrinsic Value which is equal to
NET PRESENT VALUE=FUTURE VALUE
(EXPECTED ROI)NO OF YEARS
NPV=1916.4 = 1190.3
(1.10)

8/7/2019 equity and derivative
http://slidepdf.com/reader/full/equity-and-derivative 57/123
STEP 4: Compare with current stock price
Since the intrinsic value (1190.3) is less than the current stock price (1379),
the value of the stock is overvalued
MARGIN OF SAFETY
This is simply discounting the calculated intrinsic value. You can use
any discount rate. In this case, the intrinsic value of HDFC Bank is Rs 1190.3,
which is already less than the stock price. Discounting the intrinsic value will
make the value of the company lesser than its stock price. Using a discount rate
of 20%, the fair value is 952.24. The current price is Rs1379. In this case the
stock price is more than the actual worth of the company. So it is advisable, not
to buy the stock.
CONCLUSION
Investing in the company is not that beneficial on the basis of both technical and
fundamental analyses. In case of technical analysis it has been found that the
share price of the company is highly unstable and fundamental analysis showed
that the price is more than the actual worth of the company. From which it can be

8/7/2019 equity and derivative
http://slidepdf.com/reader/full/equity-and-derivative 58/123
concluded that investing in the company includes high risk. So, it is not advisable
to buy the stock.
ASIAN PAINTS
Asian Paints has a market share of around 49% in the decorative paint segment.
The company, through a 50:50 joint venture with PPG Industries US, also has
presence in the automotive paints segment. The company is well focus on its core
business of paints and has posted a Company Annual Growth Rate (CAGR) of 28%
over the last five years in top line. The other competitors are Berger paint,
Nerolac etc.

8/7/2019 equity and derivative
http://slidepdf.com/reader/full/equity-and-derivative 59/123
The company manufactures and markets paints. The group also
manufactures phthalic anhydride and pentaerythritol. The group operates in
Australia, Fiji, Solomon Islands, Tonga, Vanuatu, Myanmar, China, Thailand,
Malaysia, Singapore, Bangladesh, Nepal, Sri Lanka, Bahrain, the UAE, Oman,
Barbados, Jamaica, Trinidad, Tobago, Egypt, Mauritius and Malta.
Asian Paints Limited has informed the Exchange regarding the
announcement made by Berger International Limited (BIL), Singapore which is
listed on the Singapore Stock Exchange Limited. BIL is a subsidiary of Asian Paints
Limited. Berger International Limited, Singapore has no operations in India
Price representation by OHLC/ Bar chart

8/7/2019 equity and derivative
http://slidepdf.com/reader/full/equity-and-derivative 60/123
Analyzing the stock movement from May 2008- April 2009:
By analyzing the chart one can easily say that the company has shown a
steady decline over a certain period of time. On May 2008 the stock price of the
company was nearly around Rs1220-Rs 1230. It has even touched the price level
of Rs 1300 once in the mid of the month and then declined to Rs 1175 by the end
of the same month, which means a decline of 9.6% approx within a month itself.
Then again the stock price slightly increased to a level of Rs 1275, in the month of
August but after that it is showing a continuous fall in the price. The major fall in
the price level can be seen in the last week of September, when the share price
has declined from Rs 1180 to Rs 980, a straight Rs 200/ 16.9% fall within a week.
When the price touched the level of Rs 1000/- in the month of October, the

8/7/2019 equity and derivative
http://slidepdf.com/reader/full/equity-and-derivative 61/123
investors believed that there will be an increase in the price level after that and Rs
1000 will act as a support level but all these assumptions proved wrong and there
was further decrease in the price level. Another decline of Rs 145/ 15.7% can be
notice in the end of Dec. Within a year i.e. in April 2009 it has came down to Rs
925 approx, i.e. a decline of 25% approx. and the current market price is Rs 955.
COMPARITIVE ANALYSIS WITH BSE
One-year comparative graph with BSE
ASIAN Paints BSE
With the help of this graph we can say that Rs. 100 invested in the ASIAN
Paints in May 2008 has a worth of Rs.80 in April 2009, it has almost shown a fall of
Rs.20 (approx). During this period, the benchmark BSE Sensex too recorded a fall

8/7/2019 equity and derivative
http://slidepdf.com/reader/full/equity-and-derivative 62/123
with Rs 100 invested in May 2008 declining to Rs.70 in April 2009. During the time
of bearish market both ASIAN Paints and BSE has shown decline in the previous
year. Although the company has shown a decline but by analyzing the graph one
can say that while the overall market has been bearish, Asian Paints has managed
to stand better than BSE.
By the technical analysis it has been observed that investing in the company
wont be a good idea, but then let us analyze with the help of the intrinsic value
calculation whether investing in this company will be really beneficial or not.
CALCULATION OF THE INTRINSIC VALUE
Current price = Rs955
EPS = 44.8
P/E ratio = 21.3%
Market capitalization= Rs.91613
Dividend payout ratio=39.8%
Expected ROI= 10%
EPSGR (earning per share growth rate) = 37.17%

8/7/2019 equity and derivative
http://slidepdf.com/reader/full/equity-and-derivative 63/123
STEP 1- Forecast share price for the next 5 years.
Forecast share price in 2013=EPS after 5th
year * P/E ratio
= 44.8*(1.37)* 21.3
= 4608.90
STEP 2- Forecast Total Future Value.
Year Projected EPS
2008 44.8*1=44.8
2009 44.8*1.37= 61.38
2010 44.8*(1.37)²=84.09
2011 44.8*(1.37)³=115.20
2012 44.8*(1.37)=157.8
2013 44.8*(1.37)=216.23
Total EPS =679.5
Total Dividend = Total EPS*Dividend Payout Ratio
= 679.5*39.8% =270.44

8/7/2019 equity and derivative
http://slidepdf.com/reader/full/equity-and-derivative 64/123
Total Future Value=Forecasted stock price in 2013+Total Dividend
= 4608.90+270.44 =4879.34
STEP 3: Calculate Intrinsic Value which is equal to
NET PRESENT VALUE=FUTURE VALUE
(EXPECTED ROI)NO OF YEARS
NPV=4879.34 = 3030.6
(1.10)
STEP 4: Compare with current stock price
Since the intrinsic value (3030.6) is more than the current stock price (955),
the value of the stock is under valued
MARGIN OF SAFETY
This is simply discounting the calculated intrinsic value. You can use
any discount rate. In this case, the intrinsic value of ASIAN Paints is Rs 3030.6,

8/7/2019 equity and derivative
http://slidepdf.com/reader/full/equity-and-derivative 65/123
which is more than the current stock price. Using a discount rate of 20%, the fair
value is 2424.48. The current price is Rs 955. In this case the stock price is less
than the actual worth of the company. So it is advisable to buy the stock.
CONCLUSION
By analyzing this company through both the technical and fundamental ways it
is seen that as the company is worth more than its price but at the same time the
price level do not show a good growth in the short run. Investing in the company
is beneficial for the long term investors. An investment in the company for at
least 5-6 years will prove to be beneficial.
DABUR
Dabur is India's fourth largest FMCG Company. It has a wide variety of
health care, personal care and food products. The company's name is generic to
'ayurvedic' products in India and it has big brands like Vatika (hair oils),
Chyawanprash, Hajmola, Amla oil and Lal Dant Manjan in its stable. The ayurvedic
products and certain brands like Laltail and Lal Dant Manjan are particularly
strong in the rural markets where Dabur has a strong distribution network. Dabur
has hived off its other food products (Real fruit juice & Homemade culinary
pastes), into a 100 per cent subsidiary Dabur Foods Ltd.
Present situation:
Dabur India's net profit rose 16.40% to Rs 91.71 crore on 16.20% rise in
net sales to Rs 620.23 crore in Q4 March 2009 over Q8 March 2008. Early this
month, the company had announced that Ratna Commercial Enterprises, a

8/7/2019 equity and derivative
http://slidepdf.com/reader/full/equity-and-derivative 66/123
promoter group company, revoked 4.50 lakh shares representing 0.05% of the
equity capital of the company out of 1.45 crore shares representing 1.68% of the
equity capital of the company Ratna Commercial Enterprises held 9.44% stake in
the company as on 31 March 2009.
The company had in February 2009 announced that promoters pledged
more than 7.95 crore shares representing 9.20% of the equity capital of the
company. The total promoter shareholding in the company stood at 70.73% as on
31 March 2009.
The committee of Dabur India has granted 2,04,144 fresh stock options
under Dabur Employees Stock Option Scheme 2000 to the eligible employees of
the company. The above options have vesting period of 1 year. These options
were granted at the committee meeting held on 29 April 2009.
Price representation by OHLC/ Bar chart

8/7/2019 equity and derivative
http://slidepdf.com/reader/full/equity-and-derivative 67/123
Analyzing the stock movement from May 2008- April 2009:
By simply analyzing the graph one can say that stock price has not shown a
good movement in case of this company. It entered with a price of Rs 98 in May
2008 and after a certain highs and lows, it was back to Rs 98 in April 2009. After
reaching this level the investors thought that the price level will further show a
decline, as it has shown in the previous year but the share price has not followed
the previous trend and it has shown some further growth after that. We can
analyze that investing in this company wont be harmful as there can be seen a
stability in the price level of the company. The current stock price of the company
is Rs.115.9. Now we are going to further compare the company with BSE in order
to identify the actual scenario.

8/7/2019 equity and derivative
http://slidepdf.com/reader/full/equity-and-derivative 68/123
COMPARITIVE ANALYSIS WITH BSE
One-year comparative graph with BSE
DABUR BSE
Now analyzing this graph gives an entire different picture. With the help
of this graph we can say that Rs. 100 invested in the DABUR in May 2008 has a
worth of Rs.100- Rs 110 in April 2009. During this period, the benchmark BSE
Sensex has recorded a fall with Rs 100 invested in May 2008 declining to Rs.70 in
April 2009. During the time of bearish market both where BSE has shown decline
in the previous year, DABUR has managed to hold its position. One can say that
during this period of not- so- good market condition also the company has
managed to outperformed the market.

8/7/2019 equity and derivative
http://slidepdf.com/reader/full/equity-and-derivative 69/123
With the help of the intrinsic value calculation let us analyze whether
investing in this company will be really beneficial or not.
CALCULATION OF THE INTRINSIC VALUE
Current price = Rs115.9
EPS = 3.9
P/E ratio = 30.0%
Dividend payout ratio=38.8%
Expected ROI= 10%
EPSGR (earning per share growth rate) = 24.2%
STEP 1- Forecast share price for the next 5 years.
Forecast share price in 2013=EPS after 5th
year * P/E ratio
= 3.9*(1.24)* 30.0
= 343

8/7/2019 equity and derivative
http://slidepdf.com/reader/full/equity-and-derivative 70/123
STEP 2- Forecast Total Future Value.
Year Projected EPS
2008 3.9*1=3.9
2009 3.9*1.24= 4.84
2010 3.9*(1.24)²=5.99
2011 3.9*(1.24)³=7.43
2012 3.9*(1.24)=9.21
2013 3.9*(1.24)=11.4
Total EPS =42.77
Total Dividend = Total EPS*Dividend Payout Ratio
= 42.77*38.8% =16.60
Total Future Value=Forecasted stock price in 2013+Total Dividend
= 343+16.60 =359.6

8/7/2019 equity and derivative
http://slidepdf.com/reader/full/equity-and-derivative 71/123
STEP 3: Calculate Intrinsic Value which is equal to
NET PRESENT VALUE=FUTURE VALUE
(EXPECTED ROI)NO OF YEARS
NPV=359.6 = 223.35
(1.10)
STEP 4: Compare with current stock price
Since the intrinsic value (223.35) is more than the current stock price (115.9),
the value of the stock is under valued
MARGIN OF SAFETY
This is simply discounting the calculated intrinsic value. You can use
any discount rate. In this case, the intrinsic value of DABUR is Rs 223.35,
which is more than the current stock price. Now let¶s observe after using the
discount rate. Using a discount rate of 20%, the fair value is 178.68. The current

8/7/2019 equity and derivative
http://slidepdf.com/reader/full/equity-and-derivative 72/123
price is Rs 115.9. In this case the stock price is less than the actual worth of the
company. So it is advisable to buy the stock.
CONCLUSION
The company has proved to maintain stability and even its worth more
than its price. The company has the potential of further growth. So investing in
the company seems to be a good investment decision. In the case of this company
also our technical assumption holds equal to the fundamental calculation. So,
investing in the company is advisable.
MRF TYRES

8/7/2019 equity and derivative
http://slidepdf.com/reader/full/equity-and-derivative 73/123
MRF is India`s largest tyre manufacturer, having a 22% market share.
The company derives over 95% of its revenues from its core business i.e. tyres,
the rest comes from its presence in toys and paints. This focus on tyres has
enabled it to constantly increase capacities, and maintain market leadership and
profitability in most segments. MRF exports its products to over 75 countries
worldwide.
MRF reported a net loss of Rs 38.30 crore in Q1 December 2008 as
compared to net profit of Rs 51.75 crore in Q1 December 2007. Net sales rose
17% to Rs 1351.97 crore in Q1 December 2008 over Q1 December 2007.

8/7/2019 equity and derivative
http://slidepdf.com/reader/full/equity-and-derivative 74/123
Price representation by OHLC/ Bar chart
Analyzing the stock movement from May 2008- April 2009:
Being remaining at the top position also couldn¶t escape the company
from the current market scenario. While entering, the share price of the company
was somewhere around Rs 4400. With small ups and downs the company has
shown a steady decline after the month of Sep, last year. It has faced a major
decline in the month of March, this year, when the share price has almost fallen
to Rs 1550. After that the price has bounced back. Showing a steady increase .In
the month of April 2009 the share price of the company was somewhere around
Rs 2250- Rs 2300. The current share price is Rs 2500.
COMPARITIVE ANALYSIS WITH BSE

8/7/2019 equity and derivative
http://slidepdf.com/reader/full/equity-and-derivative 75/123
One-year comparative graph with BSE
MRF Tyres BSE
The graph says that Rs. 100 invested in MRF in May 2008 has a worth of
Rs.53- Rs54 in April 2009, it has shown almost a fall of Rs.47 (approx). And till the
month of May 2009, it has come up to a price level of Rs 56- Rs 57. During this
period, the benchmark BSE Sensex too recorded a fall with Rs 100 invested in May
2008 declining to Rs.70 in April 2009. During the time of bearish market both MRF
and BSE has shown decline in the previous year. It is also noticeable that the in
the starting of the period the company managed to run along with BSE. And from
the mid of October 2008 the price of the company has fallen below BSE and after
that its share price is moving in proportion with the price of BSE, which means a
small fall of BSE makes the company also fall to some extent and with the rise in
BSE, the company also rises. One can say that while the overall market has been
bearish, MRF has underperformed the market, as it has fallen much below the

8/7/2019 equity and derivative
http://slidepdf.com/reader/full/equity-and-derivative 76/123
benchmark. So it is suggested not to invest in the stock in the present scenario, till
it gains somewhat better position.
As its market price fall in the previous year, from that time onwards it has
not shown any kind of improvement. Once it has fallen, it further continues to fall.
So, it is advisable not to purchase the stock of the company. Further let us analyze
with the help of intrinsic value calculation and see that whether our assumptions
hold true or not.
CALCULATION OF THE INTRINSIC VALUE
Current price = Rs 2500
EPS = 332.1
P/E ratio = 7.5%
Market capitalization= Rs.10600
Dividend payout ratio=5.9%
Expected ROI= 10%
EPSGR (earning per share growth rate) = 15.7%
STEP 1- Forecast share price for the next 5 years.
Forecast share price in 2013=EPS after 5th year * P/E ratio

8/7/2019 equity and derivative
http://slidepdf.com/reader/full/equity-and-derivative 77/123
= 332.1*(1.16)* 7.5
= 5230
STEP 2- Forecast Total Future Value.
Year Projected EPS
2008 332.1*1=332.1
2009 332.1*1.16= 385.2
2010 332.1*(1.16)²=446.8
2011 332.1*(1.16)³=518.4
2012 332.1*(1.16)=601.3
2013 332.1*(1.16)=697.5
Total EPS =2981.3
Total Dividend = Total EPS*Dividend Payout Ratio
= 2981.3*5.9% =175.90
Total Future Value=Forecasted stock price in 2013+Total Dividend
= 5230+175.90=5405.9

8/7/2019 equity and derivative
http://slidepdf.com/reader/full/equity-and-derivative 78/123
STEP 3: Calculate Intrinsic Value which is equal to
NET PRESENT VALUE=FUTURE VALUE
(EXPECTED ROI)NO OF YEARS
NPV=5405.9 = 3358
(1.10)
STEP 4: Compare with current stock price
Since the intrinsic value (3358) is more than the current stock price (2500),
the value of the stock is under valued
MARGIN OF SAFETY

8/7/2019 equity and derivative
http://slidepdf.com/reader/full/equity-and-derivative 79/123
This is simply discounting the calculated intrinsic value. You can use
any discount rate. In this case, the intrinsic value of MRF is Rs 3358, which is
more than the current stock price. Using a discount rate of 20%, the fair value is
2686. The current price is Rs 2500. In this case the stock price is less than the
actual worth of the company but not much. So it is advisable to buy the stock.
CONCLUSION
By analyzing the company it can be concluded that the price of the shares of the
company has shown a continuous decline in the previous year and also the worth
of the company doesn¶t differ much than its current price. So it is advisable to
think twice before buying the stock.

8/7/2019 equity and derivative
http://slidepdf.com/reader/full/equity-and-derivative 80/123
Derivatives
The emergence of the market for derivative products, most notably forwards, futures and options,
can be traced back to the willingness of risk-averse economic agents to guard themselves against
uncertainties arising out of fluctuations in asset prices. By their very nature, the financial markets
are marked by a very high degree of volatility. Through of derivatives of products, it is possible
to partially or fully transfer price risks by locking ±in asset prices. As instruments of risk
management, these generally do not influence the fluctuations underlying prices. However, by
locking ±in asset prices, derivatives products minimize the impact of fluctuations in asset prices
on the profitability and cash flow situation of risk±averse investors.
DEFINITION:
Understanding the word itself, Derivatives is a key to mastery of the topic. The word originates
in mathematics and refers to a variable, which has been derived from another variable. For
example, a measure of weight in pound could be derived from a measure of weight in kilograms
by multiplying by two.
In financial sense, these are contracts that derive their value from some
underlying asset. Without the underlying product and market it would have no independent
existence. Underlying asset can a Stock, Bond, Currency, Index or a Commodity. Some one maytake an interest in the derivative products. Without having an interest in the underlying product
market, but the two are always related and may therefore interact with each other.
The term Derivative has been defined in Securities Contracts (Regulation) Act 1956, as:
A. A security derived from a debt instrument, share, loan whether secure or
unsecured, risk instrument or contract for differences or any other form of
security.
B. A contract, which derives its value from the prices, or index of prices, of
underlying securities.

8/7/2019 equity and derivative
http://slidepdf.com/reader/full/equity-and-derivative 81/123
IMPORTANCE OF DERIVATIVES
Derivatives are becoming increasingly important in world markets as a tool for risk management.
Derivatives instruments can be used to minimize risk. Derivatives are used to separate risks and
transfer them to parties willing to bear these risks. The kind of hedging that can be obtained by
using derivatives is cheaper and more convenient than what could be obtained by using cash
instruments. It is so because, when we use derivatives for hedging, actual delivery of the
underlying asset is not at all essential for settlement purposes.
More over, derivatives would not create any risk. They simply manipulate the risks and transfer
to those who are willing to bear these risks. For example, Mr. A owns a bike. If does not take
insurance, he runs a big risk. Suppose he buys insurance [a derivative instrument on the bike] he
reduces his risk. Thus, having an insurance policy reduces the risk of owing a bike. Similarly,
hedging through derivatives reduces the risk of owing a specified asset, which may be a share,
currency, etc.
Derivative is a product whose value is derived from the value of one or more basic variables,called bases (underlying asset, index, or reference rate), in a contractual manner. The underlying
asset can be equity, forex, commodity or any other asset. For example, wheat farmers may wish
to sell their harvest at a future date to eliminate the risk of a change in prices by that date. Such a
transaction is an example of a derivative. The price of this derivative is driven by the spot price
of wheat which is the "underlying".
In the Indian context the Securities Contracts (Regulation) Act, 1956 (SCRA) defines
"derivative" to include-
1. A security derived from a debt instrument, share, loan whether secured or unsecured, risk
instrument or contract for differences or any other form of security.

8/7/2019 equity and derivative
http://slidepdf.com/reader/full/equity-and-derivative 82/123
2. A contract which derives its value from the prices, or index of prices, of underlying securities.
Derivatives are securities under the SC(R)A and hence the trading of derivatives is governed by
the regulatory framework under the SC(R)A.
Factors driving the growth of derivatives
Over the last three decades, the derivatives market has seen a phenomenal growth. A large
variety of derivative contracts have been launched at exchanges across the world. Some of the
factors driving the growth of financial derivatives are:
1. Increased volatility in asset prices in financial markets,
2. Increased integration of national financial markets with the international markets,
3. Marked improvement in communication facilities and sharp decline in their costs,
4. Development of more sophisticated risk management tools, providing economic agents a
wider choice of risk management strategies, and
5. Innovations in the derivatives markets, which optimally combine the risks and returns over a
large number of financial assets leading to higher returns, reduced risk as well as transactions
costs as compared to individual financial assets.
Purpose and benefits of derivative market;-
1. Today's sophisticated international markets have helped foster the rapid growth in
derivative instruments. In the hands of knowledgeable investors, derivatives can derive
profit from:
y Changes in interest rates and equity markets around the world.
y Changes in price of assets.
2. Help of hedge against inflation and deflation, and generate returns that are not correlated
with more traditional investments. The two most widely recognized benefits attributed to
derivative instruments are price discovery and risk management and others.

8/7/2019 equity and derivative
http://slidepdf.com/reader/full/equity-and-derivative 83/123
3. Price discovery: -
The kind of information and the way people absorb it constantly changes
the price of a commodity. This process is known as price discovery. the price of all future
contracts serve as prices that can be accepted by those who trade the contracts in lieu of
facing the risk of uncertain future prices.
4. Risk management: -
This could be the most important purpose of the derivatives market.
Risk management is the process of identifying the desired level of risk, identifying the
actual level of risk and altering the latter to equal the former. This process can fall into
the categories of hedging and speculation.
5. Derivatives help in transferring risks from risk-averse people to risk-oriented people.
6. By allowing transfer of unwanted risks, derivatives can promote more efficient allocation
of capital across the economy and thus, increasing productivity in the economy.
7. Derivatives increase the volume traded in markets because of participation of risk-averse
people in greater numbers.
RATIONALE BEHIND THE DEVELOPMENT OF DERIVATIVES
Holding portfolio of securities is associated with the risk of the possibility that the investor may
realize his returns, which would be much lesser than what he expected to get. There are various
influences, which affect the returns.
1. Price or dividend (interest).
2. Sum are internal to the firm bike:
Industry policy
Management capabilities
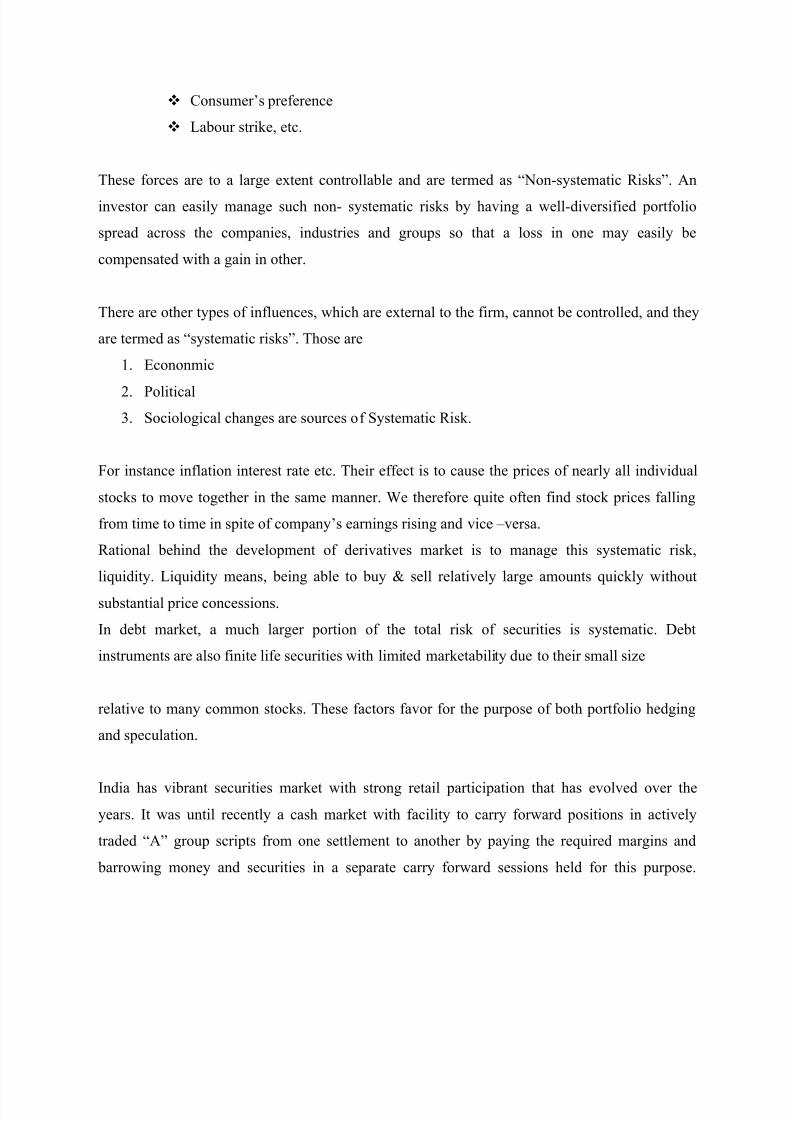
8/7/2019 equity and derivative
http://slidepdf.com/reader/full/equity-and-derivative 84/123
Consumer¶s preference
Labour strike, etc.
These forces are to a large extent controllable and are termed as ³Non-systematic Risks´. An
investor can easily manage such non- systematic risks by having a well-diversified portfolio
spread across the companies, industries and groups so that a loss in one may easily be
compensated with a gain in other.
There are other types of influences, which are external to the firm, cannot be controlled, and they
are termed as ³systematic risks´. Those are
1. Econonmic
2. Political
3. Sociological changes are sources of Systematic Risk.
For instance inflation interest rate etc. Their effect is to cause the prices of nearly all individual
stocks to move together in the same manner. We therefore quite often find stock prices falling
from time to time in spite of company¶s earnings rising and vice ±versa.
Rational behind the development of derivatives market is to manage this systematic risk,
liquidity. Liquidity means, being able to buy & sell relatively large amounts quickly without
substantial price concessions.
In debt market, a much larger portion of the total risk of securities is systematic. Debt
instruments are also finite life securities with limited marketability due to their small size
relative to many common stocks. These factors favor for the purpose of both portfolio hedging
and speculation.
India has vibrant securities market with strong retail participation that has evolved over the
years. It was until recently a cash market with facility to carry forward positions in actively
traded ³A´ group scripts from one settlement to another by paying the required margins and
barrowing money and securities in a separate carry forward sessions held for this purpose.

8/7/2019 equity and derivative
http://slidepdf.com/reader/full/equity-and-derivative 85/123
However, a need was felt to introduce financial products like other financial markets in the
world.
CHARACTERISTICS OF DERIVATIVES
1. Their value is derived from an underlying instrument such as stock index, currency, etc.
2. They are vehicles for transferring risk.
3. They are leveraged instruments.
Types of derivatives:
1. Forward Contract:
A forward contract is an agreement to buy or sell an asset on a specified date for a specified
price. One of the parties to the contract assumes a long position and agrees to buy the underlying
asset on a certain specified future date for a certain specified price. The other party assumes
short position and agrees to sell the asset on the same date for the same price. Other contract
details like delivery date, price and quantity are negotiated bilaterally by the parties to the
contract. The forward contracts are normally traded outside the exchanges
The salient features of forward contracts are:
� They are bilateral contracts and hence exposed to counter-party risk.
� Each contract is custom designed, and hence is unique in terms of contract size, expiration
date and the asset type and quality.
� The contract price is generally not available in public domain.
� On the expiration date, the contract has to be settled by delivery of the asset.
� If the party wishes to reverse the contract, it has to compulsorily go to the same counter-party,
which often results in high prices being charged.

8/7/2019 equity and derivative
http://slidepdf.com/reader/full/equity-and-derivative 86/123
Limitations of Forward Contract
Forward markets world-wide are afflicted by several problems:
y Lack of centralization of trading,
y Illiquidity, and
y Counterparty risk
In the first two of these, the basic problem is that of too much flexibility and generality. The
forward market is like a real estate market in that any two consenting adults can form contracts
against each other. This often makes them design terms of the deal which are very convenient in
that specific situation, but makes the contracts non-tradable.
Counterparty risk arises from the possibility of default by any one party to the transaction.
Whenone of the two sides to the transaction declares bankruptcy, the other suffers. Even when
forward markets trade standardized contracts, and hence avoid the problem of illiquidity, still the
counterparty risk remains a very serious issue.
2 . Future Contracts:
Futures markets were designed to solve the problems that exist in forward markets. A futures
contract is an agreement between two parties to buy or sell an asset at a certain time in the future
at a certain price. But unlike forward contracts, the futures contracts are standardized and
exchange traded. To facilitate liquidity in the futures contracts, the exchange specifies certain
standard features of the contract. It is a standardized contract with standard underlying
instrument, a standard quantity and quality of the underlying instrument that can be delivered, (or
which can be used for reference purposes in settlement) and a standard timing of such settlement.
A futures contract may be offset prior to maturity by entering into an equal and opposite
transaction. More than 99% of futures transactions are offset this way.
The standardized items in a futures contract are:

8/7/2019 equity and derivative
http://slidepdf.com/reader/full/equity-and-derivative 87/123
y Quantity of the underlying
y Quality of the underlying
y The date and the month of delivery
y The units of price quotation and minimum price change
y Location of settlement
The payoff from a long position in a forward contract is
P = S - X,
where S is a spot price of the security at time of contract maturity, X is the delivery price.
Similarly, the payoff from a short position is
P = X - S.
For example, let's say the current price of the stock is $80.00 and we entered in forward contract
to buy this stock in 3 months time for $81.00 (that means we hope that price will not fall lower
than $81.00). If after three months price is more than $81.00, let's say $83.00, than we can buy

8/7/2019 equity and derivative
http://slidepdf.com/reader/full/equity-and-derivative 88/123
the same stock for $81.00 (as stated by forward contract) and after reselling it on the market our
payoff will be
P = $83.00 - $81.00 = $2.00
If at forward maturity the stock price falls to $78.00, than our loss will be
P = $81.00 - $78.00 = $3.00
The graphs above illustrate the forward contract payoff patterns for long and short positions.
Distinction between futures and forwards
Futures Forwards
Trade on an organized exchange OTC in nature
Standardized contract terms Customised contract terms
hence more liquid Hence less liquid
Follows daily settlement Settlement happens at end of period
Future terminology
Spot price: The price at which an asset trades in the spot market.
Futures price: The price at which the futures contract trades in the futures market.
Contract cycle: The period over which a contract trades. The index futures contracts on the NSE
have one- month, two-month and three months expiry cycles which expire on the last Thursday
of the month. Thus a January expiration contract expires on the last Thursday of January and a
February expiration contract ceases trading on the last Thursday of February. On the Friday
following the last Thursday, a new contract having a three- month expiry is introduced for
trading.

8/7/2019 equity and derivative
http://slidepdf.com/reader/full/equity-and-derivative 89/123
Ex piry date: It is the date specified in the futures contract. This is the last day on which the
contract will be traded, at the end of which it will cease to exist.
Contract size: The amount of asset that has to be delivered less than one contract. Also called as
lot size.
Basis: In the context of financial futures, basis can be defined as the futures price minus the spot
price. There will be a different basis for each delivery month for each contract. In a normal
market, basis will be positive. This reflects that futures prices normally exceed spot prices.
Cost of carry: The relationship between futures prices and spot prices can be summarized in
terms of what is known as the cost of carry. This measures the storage cost plus the interest that
is paid to finance the asset less the income earned on the asset.
Initial margin: The amount that must be deposited in the margin account at the time a futures
contract is first entered into is known as initial margin.
Marking-to-market: In the futures market, at the end of each trading day, the margin account is
adjusted to reflect the investor's gain or loss depending upon the futures closing price. This is
called marking-to-market.
Maintenance margin: This is somewhat lower than the initial margin. This is set to ensure that
the balance in the margin account never becomes negative. If the balance in the margin account
falls below the maintenance margin, the investor receives a margin call and is expected to top up
the margin account to the initial margin level before trading commences on the next day.
3. Option Contracts
Options are fundamentally different from forward and futures contracts. An option gives the
holder of the option the right to do something. The holder does not have to exercise this right. In

8/7/2019 equity and derivative
http://slidepdf.com/reader/full/equity-and-derivative 90/123
contrast, in a forward or futures contract, the two parties have committed themselves to doing
something. Whereas it costs nothing (except margin requirements) to enter into a futures
contract, the purchase of an option requires an up-front payment.
Option Terminology
Index options: These options have the index as the underlying. Some options are European
while others are American. Like index futures contracts, index options contracts are also
cashsettled.
Stock options: Stock options are options on individual stocks. Options currently trade on over
500 stocks in the United States. A contract gives the holder the right to buy or sell shares at the
specified price.
Buyer of an option: The buyer of an option is the one who buy paying the option premium buys
the right but not the obligation to exercise his option on the seller/writer.
Writer of an option: The writer of a call/put option is the one who receives the option premium
and is thereby obliged to sell/buy the asset if the buyer exercises on him.
Option price/premium: Option price is the price which the option buyer pays to the option seller.
It is also referred to as the option premium.
Ex piration date: The date specified in the options contract is known as the expiration date, the
exercise date, the strike date or the maturity.
Strike price: The price specified in the options contract is known as the strike price or the
exercise price.

8/7/2019 equity and derivative
http://slidepdf.com/reader/full/equity-and-derivative 91/123
American options: American options are options that can be exercised at any time upto the
expiration date. Most exchange-traded options are American.
E uropean options: European options are options that can be exercised only on the expiration
date itself. European options are easier to analyze than American options, and properties of an
American option are frequently deduced from those of its European counterpart.
In-the-money option: An in-the-money (ITM) option is an option that would lead to a positive
cash flow to the holder if it were exercised immediately. A call option on the index is said to be
in-the-money when the current index stands at a level higher than the strike price (i.e. spot price
>strike price). If the index is much higher than the strike price, the call is said to be deep ITM. In
the case of a put, the put is ITM if the index is below the strike price.
At-the-money option: An at-the-money (ATM) option is an option that would lead to zero cash
flow if it were exercised immediately. An option on the index is at-the-money when the current
index equals the strike price (i.e. spot price = strike price).
Out-of-the-money option: An out-of-the-money (OTM) option is an option that would lead to a
negative cash flow if it were exercised immediately. A call option on the index is out-of-the
money when the current index stands at a level which is less than the strike price (i.e. spot price
< strike price). If the index is much lower than the strike price, the call is said to be deep OTM.
In the case of a put, the put is OTM if the index is above the strike price.
Intrinsic value of an option: The option premium can be broken down into two components -
intrinsic value and time value. The intrinsic value of a call is the amount the option is ITM, if it
is ITM. If the call is OTM, its intrinsic value is zero. Putting it another way, the intrinsic value of
a call is Max[0, (St ² K)] which means the intrinsic value of a call is the greater of 0 or (St ²
K). Similarly, the intrinsic value of a put is Max[0, K ² St ],i.e. the greater of 0 or (K ² St). K is
the strike price and St is the spot price.

8/7/2019 equity and derivative
http://slidepdf.com/reader/full/equity-and-derivative 92/123
T ime value of an option: The time value of an option is the difference between its premium and
its intrinsic value. Both calls and puts have time value. An option that is OTM or ATM has only
time value. Usually, the maximum time value exists when the option is ATM. The longer the
time to expiration, the greater is an option's time value, all else equal. At expiration, an option
should have no time value.
There are two basic types of options, call options and put options:
Call option: A call option gives the holder the right but not the obligation to buy an asset by a
certain date for a certain price.
i) Long a call :- person buys the right (a contract) to buy an asset at a certain price. We feel that
the price in the future will exceed the strike price. This is a bullish position.
ii) Short a call :- person sells the right ( a contract) to someone that allows them to buy to buy an
asset at a certain price. The writer feels that asset will devaluate over the time period of the
contract. This person is bearish on that asset.
Put option: A put option gives the holder the right but not the obligation to sell an asset by a
certain date for a certain price.
i) Long a put :- Buy the right to sell an asset at a pre-determined price. We feel that the asset will
devalue over the time of the contract. Therefore we can sell the asset at a higher price than is the
current market value. This is a bearish position.
ii) Short a put :- sell the right to someone else. This will allow them to sell the asset at a specific
price. We feel the price will go down and we do not. This is a bullish
position.

8/7/2019 equity and derivative
http://slidepdf.com/reader/full/equity-and-derivative 93/123
Profit / payoff in Option
The payoff to a derivative portfolio is the market value of the portfolio at expiration. (Also
gross payoff).
The profit on a derivative portfolio is the payoff less the cost of acquisition or
assembling the portfolio. (Net profit).
We will be looking at a number of option strategies and combinations.
The (gross) payoff is the value (positive or negative) of the option or portfolio at
maturity.
The payoff does not include the initial cost (or the initial cash inflow) at the time the
portfolio was set up.
N et profit= (gross) Payoff- cost of buying options or other securities+ premium
received for selling options or other securities
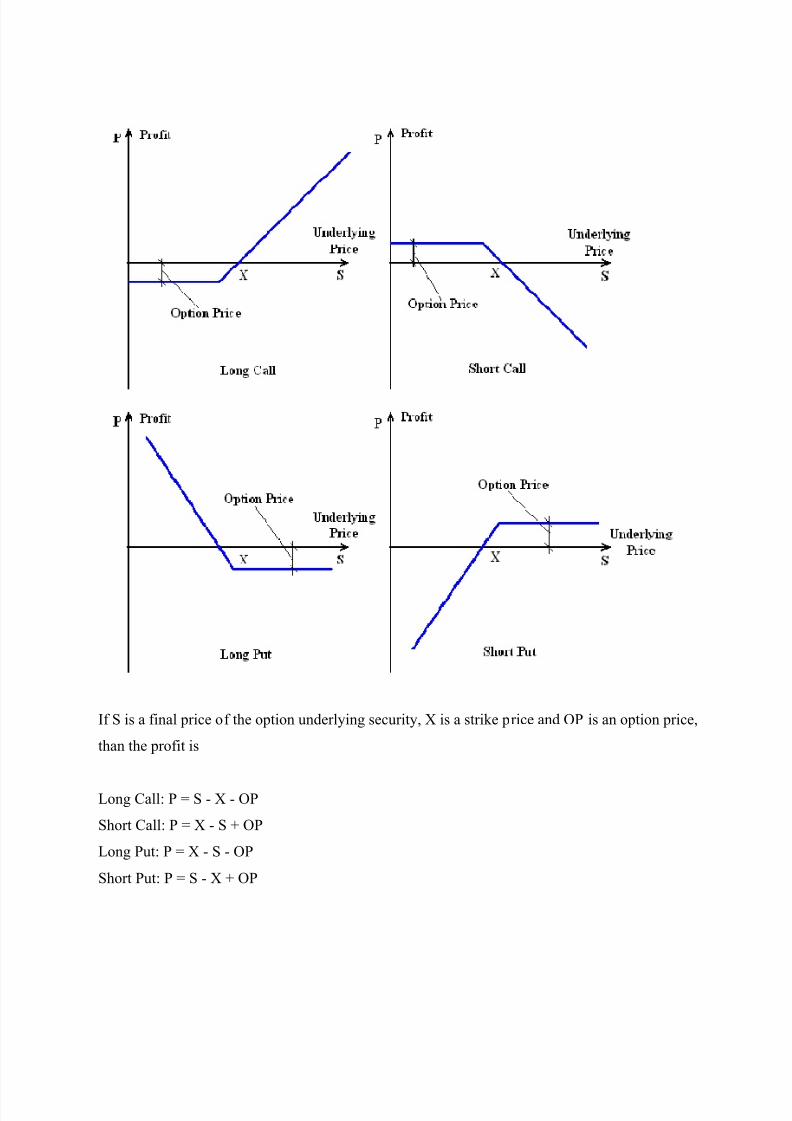
8/7/2019 equity and derivative
http://slidepdf.com/reader/full/equity-and-derivative 94/123
If S is a final price of the option underlying security, X is a strike price and OP is an option price,
than the profit is
Long Call: P = S - X - OP
Short Call: P = X - S + OP
Long Put: P = X - S - OP
Short Put: P = S - X + OP

8/7/2019 equity and derivative
http://slidepdf.com/reader/full/equity-and-derivative 95/123
For example, let's say the stock price is $50.00, we bought European call option with strike
$53.00 and paid $2.00 for this option. If option price is less than $53.00, we will not exercise the
option to buy the stock, because it doesn't make sense to buy security for higher price than it
costs on the market. In this case we lose all initial investment equal to the option price $2.00. If
stock price is more than $53.00, we will exercise the option. For example if the stock price is
$56.00, after exercising the option and immediately reselling the acquired stock our profit will
be:
P = $56.00 - $53.00 - $2.00 = $1.00
if the stock price is $54.00, than the profit is:
P = $54.00 - $53.00 - $2.00 = - $1.00
As we see in latter case we lose money. The reason is that increase of stock price just by $1.00
above the strike ($53.00) doesn't cover our initial investment of $2.00, although we still exercise
the option to recover at least $1.00 of initial investment. If the stock price at exercise time is
$55.00 than we exercise the option to cover our initial expenses(equal to option price):
P = $55.00 - $53.00 - $2.00 = $0.00
This latter case corresponds to option graph intersection point with horizontal axis on the
drawing above.
Distinction between futures and options
Futures Options
Exchange traded, with novation Same as futures.
Exchange defines the product Same as futures.
Price is zero, strike price moves Strike price is fixed, price moves.

8/7/2019 equity and derivative
http://slidepdf.com/reader/full/equity-and-derivative 96/123
Price is zero Price is always positive.
Linear payoff Nonlinear payoff.
Both long and short at risk Only short at risk
Types of traders in derivative market
1.Hedgers :-
Hedgers are those who protect themselves from the risk associated with the price of an asset by
using derivatives. A person keeps a close watch upon the prices discovered in trading and when
the comfortable price is reflected according to his wants, he sells futures contracts. In this way he
gets an assured fixed price of his produce.
In general, hedgers use futures for protection against adverse future price movements in the
underlying cash commodity. Hedgers are often businesses, or individuals, who at one point or
another deal in the underlying cash commodity.
Take an example: A Hedger pay more to the farmer or dealer of a produce if its prices go up.
For protection against higher prices of the produce, he hedges the risk exposure by buying
enough future contracts of the produce to cover the amount of produce he expects to buy. Since
cash and futures prices do tend to move in tandem, the futures position will profit if the price of
the produce raise enough to offset cash loss on the produce.
2. Speculators:
Speculators are somewhat like a middle man. They are never interested in actual owing the
commodity. They will just buy from one end and sell it to the other in anticipation of future price
movements. They actually bet on the future movement in the price of an asset.
They are the second major group of futures players. These participants include
independent floor traders and investors. They handle trades for their personal clients or
brokerage firms
.

8/7/2019 equity and derivative
http://slidepdf.com/reader/full/equity-and-derivative 97/123
Buying a futures contract in anticipation of price increases is known as µgoing long¶. Selling a
futures contract in anticipation of a price decrease is known as µgoing short¶. Speculative
participation in futures trading has increased with the availability of alternative methods of
participation.
Speculators have certain advantages over other investments they are as follows:
If the trader¶s judgment is good, he can make more money in the futures market
faster because prices tend, on average, to change more quickly than real estate or
stock prices.
Futures are highly leveraged investments. The trader puts up a small fraction of the value of
the underlying contract as margin, yet he can ride on the full value of the contract as it moves up
and down. The money he puts up is not a down payment on the underlying contract, but a
performance bond. The actual value of the contract is only exchanged on those rare occasions
when delivery takes place.
3. Arbitrators:
According to dictionary definition, a person who has been officially chosen to make a decision
between two people or groups who do not agree is known as Arbitrator. In commodity market
Arbitrators are the person who takes the advantage of a discrepancy between prices in two
different markets. If he finds future prices of a commodity edging out with the cash price, he will
take offsetting positions in both the markets to lock in a profit. Moreover the commodity future
investor is not charged interest on the difference between margin and the full contract value.
Types of Futures and Options Margins
Margins on Futures and Options segment comprise of the following:
1) Initial Margin
2) Exposure margin
In addition to these margins, in respect of options contracts the following additional margins are
collected

8/7/2019 equity and derivative
http://slidepdf.com/reader/full/equity-and-derivative 98/123
1) Premium Margin
2) Assignment Margin
How is Initial Margin Computed?
Initial margin for F&O segment is calculated on the basis of a portfolio (a collection of futures
and option positions) based approach. The margin calculation is carried out using software called
- SPAN® (Standard Portfolio Analysis of Risk). It is a product developed by Chicago Mercantile
Exchange (CME) and is extensively used by leading stock exchanges of the world.
SPAN® uses scenario based approach to arrive at margins. It generates a range of scenarios and
highest loss scenario is used to calculate the initial margin. The margin is monitored and
collected at the time of placing the buy / sell order.
The SPAN® margins are revised 6 times in a day - once at the beginning of the day, 4 times
during market hours and finally at the end of the day. Obviously, higher the volatility, higher the
margins.
How is exposure margin computed?
In addition to initial / SPAN® margin, exposure margin is also collected.
Exposure margins in respect of index futures and index option sell positions have been currently
specified as 3% of the notional value.
For futures on individual securities and sell positions in options on individual securities, the
exposure margin is higher of 5% or 1.5 standard deviation of the LN returns of the security (in
the underlying cash market) over the last 6 months period and is applied on the notional value of
position.
How is Premium and Assignment margins computed?
In addition to Initial Margin, a Premium Margin is charged to trading members trading in Option
contracts. The premium margin is paid by the buyers of the Options contracts and is equal to the
value of the options premium multiplied by the quantity of Options purchased.

8/7/2019 equity and derivative
http://slidepdf.com/reader/full/equity-and-derivative 99/123
For example, if 1000 call options on ABC Ltd are purchased at Rs. 20/-, and the investor has no
other positions, then the premium margin is Rs. 20,000. The margin is to be paid at the time
trade.
Assignment Margin is collected on assignment from the sellers of the contracts.
How Marked to Market Margins are computed?
1. Future contracts :- The open positions (gross against clients and net of proprietary/ self
trading) in the futures contracts for each member are marked to market to the daily settlement
price at the end of each day is the weighted average price of the last half an hour of the futures
contract. The profits/losses arising from the different between the trading price and the
settlement price are collected/ given to all clearing members.
2. Option contracts :- the marked o market for option contracts is computed and collected as
part of the Initial Margin in the form of Net Option Values. The Initial Margin is collected on an
online real time basis based on the data feeds given to the system at discrete time intervals.
How Client Margins are computed?
Client Members and Trading Member are required to collect initial margins from all their clients.
The collection of margins at client level in the derivatives markets is essential as derivatives are
leveraged products and non-collection of margins at the client level would provide zero cost
leverage. In the derivative markets all money paid by the client towards margins is kept in trust
with the Clearing House/ Clearing Corporation and in the event of default of the Trading or
Clearing Member the amounts paid by the client towards margins are segregated and not utilized
towards the dues of the defaulting member.
Therefore, Clearing members are required to report on a daily basis details in respect of such
margin amounts due and collected from their Trading members/ clients clearing and settling
through them. Trading members are also required to report on a daily basis details of the amount
due and collected from their clients. The reporting of the collection of the margins by the clients

8/7/2019 equity and derivative
http://slidepdf.com/reader/full/equity-and-derivative 100/123
is done electronically through the system at the end of each trading day. The reporting of
collection of client level margins plays a crucial role not only in ensuring that members collect
margin from clients but it also provides the clearing corporation with a record of the quantum of
funds it has to keep in trust for the clients.

8/7/2019 equity and derivative
http://slidepdf.com/reader/full/equity-and-derivative 101/123
DERIVATIVE ANALYSIS
FUTURES
Profit/Loss for a Future contract holder
Example:
On 7th Jan 2008 REL is trading at 2100 and REL January 2009 Contract is trading @ 2120. We
expect the share price to rise significantly and want to make a profit from the increase.
Lot size of REL is 550
Span Margin for REL Future is 42.93% on the contract value
If an Investor bought 1 REL Future @ 2120 on 7th January 2008 and the closing price of REL
Future on 16th Jan 2008 is 2600. To make profit from this transaction the buyer of the contract
can sell the Future and book profit.
Span Margin Payable for buying REL Contract = 2120x550x42.93%=500563
Capital Invested on this contract is Rs.500563/-
On 16th Jan 2008 REL January Contract is trading @2600, If the investor sold the contract then
he would have gained profit of Rs.264000/-
Profit = (2600-2120) x 550 = Rs.264000/-
On 23rd Jan 2008 REL Jan Future closed @ 1600; if the investor holds the future till date. His
Mark to Market loss is as fallows
Mark to Market Loss = (1600-2120) x 550 = Rs.286000/-

8/7/2019 equity and derivative
http://slidepdf.com/reader/full/equity-and-derivative 102/123
Investor has to pay/receive the margin with respect to the yesterday¶s closing price and to the
today¶s closing price.
Mark to Market margin payable/receivable = (Today¶s Closing price ± Yesterdays Closing Price)
x Lot Size
BASIC OPTION STRATEGIES
Buyer of the Call Option
Market View Bullish
Action Buy a calloption
Profit Potential Unlimited
Loss Potential Limited
To make a profit from an expected increase in the price of an underlying share during option¶s
life:
Case 1: On 30th Nov 2009, IOC is quoting at Rs.538. and the December Rs.560 (strike price)
Call costs Rs.32 (premium). We expect the share price to rise significantly and want to make a
profit from the increase.
Lot Size of IOC is 600
(i) IOC Dec 2009 CA 560 is trading @ 32 (Buying Out of Money Call Option):
Buy 1 IOC call at Rs.32, Market lot for IOC is 600. So, Net outlay is Rs.19200 (32x600). If IOC
shares go up, we can close the position either by selling the option back to the market or
exercising the right to buy the underlying shares at the exercise price.
On Expiry (27th Dec 2009) Market Price of IOC is Rs. 713/-

8/7/2019 equity and derivative
http://slidepdf.com/reader/full/equity-and-derivative 103/123
DATE Share price
(Cash
market)
Strike
Price
Call
Premium
CALL OPTION VALUE
30t Nov Rs.538 560 32 Buy 1 Dec 560 Call @ Rs.32
Cost = 19200
27th Dec Rs. 713 560 153 1. Sell 1 Dec contract (expiry)
Net gain Rs.153 (713--
560)*600 = Rs.91800
Analysis Rises by
Rs.175.
Return
32.5%
560 Gain: Option sale = Rs.91800
Premium Paid = Rs.19200.
Net Profit = Rs.72600.
Possible Outcome of IOC If the Spot price is not @ 713 on Expiry:
Share price Rs.713 Option worth Rs.91800. Closing the
position now will produce a net profit of
Rs.72600
Spot price < 560 Option expires worthless. The loss is
Rs.19200 (premium paid)
Share price >= 592 Net profit = Intrinsic value of (Break
even = 560+32) option i.e. by whatever
amount the share price exceeds Rs.592.

8/7/2019 equity and derivative
http://slidepdf.com/reader/full/equity-and-derivative 104/123
To establish a maximum cost at which to purchase shares at a lesser date if funds are not
available immediately:
(ii) IOC Dec 2009 CA 520 is trading @ 47 (Buying In the Money Call Option):
Buy 1 Dec 2009 IOC 520 call option at Rs.47 for total outlay of Rs.28200 on 30th Nov.
On Expiry 27th Dec 2009 Price of IOC is 713
DATE Share price
(Cash
market)
Strike
Price
Call
Premium
CALL OPTION VALUE
30th
Nov
Rs.538 520 47 Buy 1 Dec 520 Call @ Rs.47
Cost = 28200
27th
Dec
Rs. 713 520 193 1. Sell 1 Dec contract (expiry)
Net gain Rs.193 (713-520)*600
= Rs.115800
Analysi
s
Rises by
Rs.175.
Return 32.5%
520 Gain: Option sale = Rs.115800
Premium Paid = Rs.28200.
Net Profit = Rs.87600.
Possible outcome at Expiry

8/7/2019 equity and derivative
http://slidepdf.com/reader/full/equity-and-derivative 105/123
Share price Rs.713 Option worth Rs.115800. Closing the
position now will produce a net profit of
Rs.87600
Spot price < 520 Option expires worthless. The loss is
Rs.28200 (premium paid)
Share price >= 567 Net profit = Intrinsic value of (Break
even = 520+47) option i.e. by whatever
amount the share price exceeds Rs.567.
Writing a Call Option :
To earn additional income from a static shareholding, over and above any dividend earnings, in
terms of premium received on writing the option (Covered short call).
Market View Bearish/Neutral
Action: Sell call against an existing shareholding
Profit Potential Limited
Loss Potential Limited
Situation: On 30th Nov GMRINFRA share is trading at Rs.245. An investor holds 5000 shares
of GMRINFRA. He does not expect its price to move very much in the next few months. So, he
decides to write a call option against this shareholding.

8/7/2019 equity and derivative
http://slidepdf.com/reader/full/equity-and-derivative 106/123
Action: The Dec 260 call is trading at Rs.15 and investor sells 5 contracts (one contract = 1000
shares). He received an option premium of Rs.75000 and takes on the obligation to deliver 5000
shares at Rs.260 each if the holder exercises the option
Date Share price
(Cash market) Option market
30t Nov Rs.245 Sell 5 Dec 260 calls @
Rs.15
Income = Rs.75000
(15x5000).
27t Dec Rs.248 Option expires worthless
Analysis No change in shareholding Profit = Rs.75000
(Option Premium
received)

8/7/2019 equity and derivative
http://slidepdf.com/reader/full/equity-and-derivative 107/123
Possible Outcome at Expiry
Share > Rs.260 The holder will exercise his option.
The investor as a writer will sell shares
originally purchased for Rs.245 at Rs.275
(260+15).
Share price < 260 The option expires worthless.
Share Price = 260 Option won¶t be exercised as there is no
price difference.
Buyer of a Put Option
Market View Bearish
Action Buy a Put option
Profit Potential Unlimited
Loss Potential Limited
To make profit, from a fall in value of share price:
Situation: Current price of NTPC is @ Rs.280 on 14
th
Nov 2009. An investor thinks that NTPCis overvalued and may fall substantially. He therefore decides to buy Put option to gain exposure
to its anticipated fall.
Action: Buy 1 NTPC NOV Rs.270 Put at Rs.10 for a total consideration of Rs.16250.

8/7/2019 equity and derivative
http://slidepdf.com/reader/full/equity-and-derivative 108/123
Share price
(Cash market) Option market
14t Nov Rs.280 Buy 1 NTPC NOV put at
Rs.10.
Total outlay = Rs.16250.
29th Nov Rs.235 Sell 1 July contract.
Net gain = Rs.56875
[Rs.35(270-235)x1625]
Analysis Fall of share price Rs.45. Option purchase =
Rs.16250
Option sale = Rs.56875.
Net profit = Rs.40625.
Possible Outcome at Expiry If NPTC at diff. prices:
Share price = Rs.235 The put will be trading at Rs.35, which
gives a profit of Rs.25 (35-10)*1625, if
the position is closed out.
Share price is 260 Recover intrinsic value premium.
Share Price is between 260 to 270 Loss of Premium Varies from 1625 to
16250/-
Share Price is > 270 Loss of Premium Paid

8/7/2019 equity and derivative
http://slidepdf.com/reader/full/equity-and-derivative 109/123
Writing a PUT Option:
Market View Bullish/neutral
Action Sell put option
Profit Potential Limited
Loss Potential Unlimited
To generate earnings on portfolio of shares:
Situation: An investor owns 5500 shares of REL and also has cash holding of around
Rs.10000000. In early April he feels that the share price of REL will either remain constant or
slightly rise.
Action: The investor decides to generate some additional income on his portfolio writes 10 REL
Rs.1800 puts at Rs. Thus he received a premium of Rs.220000 (40x5500 shares).
Possible Outcome at Expiry
Share price > (or) = Rs.1800 The investor¶s expectation is correct and
the put will expire unexercised.
Profit = Rs.220000 (premium received).
Share price < Rs.1800 The put option will be exercised and the
stock will have to be purchased for
Rs.7700000 (9900000-220000).

8/7/2019 equity and derivative
http://slidepdf.com/reader/full/equity-and-derivative 110/123
CHAPTER IV
ANALYSIS &INTERPRETATIONS

8/7/2019 equity and derivative
http://slidepdf.com/reader/full/equity-and-derivative 111/123
Comparative Analysis
Basis Equity Derivative
Return Capital appreciation
Dividend Income
Capital gain
PriceFluctuation
Risk Company Specified
Sector specified
Global risk
General Market Risk
market risk
Credit risk
Liquidity risk
Settlement risk
Types of margin VaR
Extreme Loss
Mark to market
Initial margin
Premium margin
Exposure margin
Duration Generally Long term
(more than 1 yr)
Short term
(Max. 3 months)
Participants Long term Investors
Hedgers
Safe Investors
Speculations
Arbitragers
Hedgers
Expiry Date of
contract
No such things Last Thursday of any month
Comparative analysis is easy to understand when we are analysis with the example of the real
market situation.
Now I would like to quote a real life example during my internship where I understood the actualcomparison of equity and derivative market
Example:-

8/7/2019 equity and derivative
http://slidepdf.com/reader/full/equity-and-derivative 112/123
There was an investor Mr. Jaichand. He has Rs. 1, 00,000/- and he wants to invest it in
sharemarket. Now he has two options either to invest in equity cash market or equity derivative
market (F&O).
Now suppose if he invest in equity cash market and buy shares of Rs. 1, 00, 000/- and diversified
risk so he buys different scrips. So he purchases 10 RIL shares of Rs. 2350/- each. 10 L&T
shares of Rs 800/- each, 15 Religare Enterprises Shares of Rs. 370/- each, 20 ICICI bank shares
of Rs. 800/- each, 10 Tata power shares of Rs. 1250 each and 10 BHEL shares of Rs. 1595/-
each. So for investing Rs.1,00,000/- in equity cash market he has to pay Rs. 1,00,000/-
and gets the delivery of the shares
Now suppose if he invest in equity derivative market then he will able to purchase the shares
worth Rs. 5,00,000/- though he has capital of Rs. 1,00,00/- only, because of the margin payment.
But he has to purchase the share in a lot size. So he is able to purchase the 1 lot (100 shares) of
RIL at Rs. 2350/-, 1 lot (50 shares) of L&T at 2650/-, 2 lots (100 shares each) of Religare
Enterprises at Rs. 370/- and 1 lot (70 shares) of ICICI bank at Rs. 800/-. Here Mr. Jaichand has
to pay Rs. 1,00,000/- as a margin money and he is able to purchase a shares worth Rs. 5,00,000/-
But he has to pay the full amount of money at T+3 basis. So he has to pay the remaining amount
on the 3rd day of the trading if he wants the delivery.
I. Returns
Mr. Jaichand gets return on equity by two ways. One is when the share price of the
holding shares will increases in futures, called as capital appreciation. Second is by
getting a dividend income from the holding shares.
Mr. Jaichand gets return on equity derivative when the future prices of the shares are
increase in short term called as capital gain through price fluctuation or through options
premium.
II. Risk:
There are four types of risk involved in equity cash market.

8/7/2019 equity and derivative
http://slidepdf.com/reader/full/equity-and-derivative 113/123
1. Company Specified risk :- If company is not performing well than process of the shares will
declining and vice versa.
2. Sector specified risks : - If the sector is not performing well i.e. power sector,
metal sector, oil & gas sector, banking sector then prices of the shares will go
down and vice versa.
3. Global risk :- If global cues are positive then prices will increases but if global
cues are not good than prices of shares will go down.
4. General market risk :- General market risk is also affect the equity cash market
like inflation, banks interest rates etc.
So Mr. Jaichand has to consider all these risk factors while dealing in the equity
cash market.
There are four types of risk involved in equity derivative market
1. Market risk:- In derivative market we have to calculate the market risk or mark to market risk
involved in the stocks or securities, that is the exposure to potential loss from fluctuations in
market prices (as opposed to changes in credit status). It is calculated on the tradable assets i.e.,
stocks, currencies etc.
2. Credit risk: It may possible in derivative contract that the counterparty may be fail to perform
the contract or say defaulted then it is a risk for us. It is calculated on nontradable assets i.e.,
loans. So generally it is for long term purpose.
3. Liquidity Risk : - If Mr. Jaichand will not able to find a price( or a price within a reasonable
tolerance in terms of the deviation from prevailing or expected prices) for one or more of its
financial contracts in the secondary market. Consider the case of a counterparty who buys a
complex option on European interest rates. He is exposed to liquidity risk because of the
possibility that he cannot find anyone to make him a price in the secondary market and because
of the possibility that the price he obtains is very much against him and the theoretical price for
the product.

8/7/2019 equity and derivative
http://slidepdf.com/reader/full/equity-and-derivative 114/123
4. Settlement Risk : - The risk of non-payment of an obligation by a counterparty to a
transaction, exacerbated by mismatches in payment timings.
So, Mr. Jaichand has to consider all these factors while dealing in the equity derivative market.
Margins:
Now Mr. Jaichand has also seen the margin paid in the equity cash segment.
1. Var Margin: - Now Mr. jaichand bought shares of a company. Its market value today is Rs. 1,
00,000/- Obviously, we do not know what would be the market value of these shares next day.
Now Mr. Jaichand holding these shares may, based on VaR methodology, say that 1-day Var is
Rs. 1, 00,000/- at the 99% confidence level. This implies that under normal trading conditions
the investors can with 99% confidence, say that the value of shares would not go down by more
than Rs. 1,00,000/- within next 1-day.
2. Extreme loss margin: - In the above situation, the VaR margin rate for shares of RIL was
13%. Suppose that SD would be 1.5 x 3.1= 4.65. Then 5% (which is higher than 4.65%) will be
taken as the Extreme Loss margin rate. Therefore, the total margin on the security would be 18%
(13% VaR Margin + 5% Extreme Loss margin). As such, total margin payable( VaR margin +
extreme loss margin) on a trade of Rs. 23, 500/- woud be 4, 230/-
3. Mark to Market Margin :- Now Mr. Jaichand purchased 10 shares of RIL @ Rs. 2350/-, at
11 am on May 12, 2009. If close price of the shares on that happened to be Rs. 2350, then the
buyer faces a notional loss of Rs. 500/- on his buy position. In technical term this loss is called as
MTM loss and is payable by May 13, 2009 (that is next day of the trade) before the trading
begins. In case, price of the shares falls further by the end of May 13 2009 to Rs. 2200/-, then
buy postion would show a further loss of Rs. 1, 000/-. This MTM loss is payable by next day.

8/7/2019 equity and derivative
http://slidepdf.com/reader/full/equity-and-derivative 115/123
Now we will consider the margin payable under the equity derivatives segment.
i) Initial Margin: The initial margin required to be paid by the investor would be equal to
the highest loss the portfolio would suffer in any of the scenarios considered. The margin
is monitored and collected at the time of placing the buy/ sell order. As higher the
volatility, higher the initial margin.
ii) Exposure Margin : - Exposure margins in respect of index futures and index option sell
position are 3% of the notional value.
iii) Premium margin : - If 1000 call option on RIL are purchased at Rs. 20/- and Mr. Jaichand
has no other positions, then the premium margin Rs. 20,000.
iv) Assignment Margin : - Assignment Margin is collected on assignment from the sellers of
the contract.
I. Duration:
Generally equity market is a long term market and people invested in it for more than one year
and then only they get good return on equity. Generally any safe investors can invest in it
because here risk is comparatively low then derivative market. While in derivative market
investors are investing for less than one yea, generally for 2 months or 3 months. Here they get
high returns on it because they are bringing high risk.
II. Participants:
Generally any long term investors can invest in equity or hedgers are investing in the equity, who
wants to reduce their risk. Any person who wants to be safe investors and wanted to earn a good
amount of returns after a period of more than one year is also invested in equity.

8/7/2019 equity and derivative
http://slidepdf.com/reader/full/equity-and-derivative 116/123
In derivative market mostly speculators and arbitragers are invested because they wanted
quick money in short time period and hedgers are also invested in derivative market to reduce
their risk.
III. Expiry date:
It¶s a last Thursday of any month in case of a derivative market but no such things in case of an
equity market.
These are comparisions between the equity and derivative market.

8/7/2019 equity and derivative
http://slidepdf.com/reader/full/equity-and-derivative 117/123
CHAPTER V
CONCLUSIONS AND
RECOMMENDATIONS

8/7/2019 equity and derivative
http://slidepdf.com/reader/full/equity-and-derivative 118/123
FINDINGS
Practical situation
During my training internship I had experience of real practical situation in the stock Market andin an Organization.
End of June 2010 turned out to be favorable for Indian stock markets. The first few sessions saw
optimism in the market on the hope that the government will make policy announcements in the
budget. However, the market corrected soon after the announcement of budget due to absence of
major policy announcements. The sentiments remained negative during following few sessions.
However, the market picked momentum from mid of the month. This was helped by better-than
expected corporate earnings, huge overseas inflows and encouraging global cues. The buoyancy
in the market continued in the second half helping the BSE Sensex to touch highest in more than
a year towards the month end. On the whole, the market closed on a strong note. Global stocks
rallied over the month on encouraging economic data and earnings reports. The MSCI AC World
Index gained 8.70%, where as the MSCI Emerging Markets Index climbed 10.86% during the
month. The performance of Indian markets was in line with the global
counterparts. The Sensex settled the month with a gain of 8.12%, while the Nifty registered a rise
of 8.05%. The BSE Mid and Small caps performance was in line with their larger counterparts,
gaining 9.74% and 8.11% respectively over the month.
Sector Performance
All the BSE Sectoral indices wrapped the month with gains except Capital Goods. Intense
buying spree was seen in Auto, Realty, FMCG and IT indices, which posted gains of over 20%.
Metal, Teck, Health Care and Consumer Durable indices were among other top gainers whereas
Oil & Gas index posted a marginal rise over the month

8/7/2019 equity and derivative
http://slidepdf.com/reader/full/equity-and-derivative 119/123
Institutional Activities
The FIIs flow remained positive in equities with net inflows of Rs 11,625 crores (USD 2.40 bn)
during the month. The domestic MFs were also net buyers with inflows of Rs 1,825.50 crores
(USD 381 mn) during the month.
Major Corporate Events
Infosys Technologies announced a 17.28% y-o-y rise in � consolidated net profit for the quarter
ended June 2009 to Rs 1,527 crores (USD 318.59 mn). Income from operations for the quarter
climbed 12.73% y-o-y to Rs 5,472 crores (USD 1.14 bn).
Reliance Industries reported a drop of 11.53% y-o-y in � net profit for the quarter ended June
2009 to Rs 3,636 crores (USD 758.60 mn). Total income for the quarter slipped 21.64% y-o-y to
Rs 32,757 crores (USD 6.83 bn).
Steel Authority of India earmarked Rs 59,800 crores (USD � 12.48 bn) capex plan. It includes
ongoing modernization and expansion, value addition, technology up-gradation and sustenance.
Of the total capex plan, Rs 10,000 crores (USD 2.10 bn) will be spent during 2009-10.
Punj Lloyd along with its group companies bagged orders � worth Rs 10,250 crores (USD 2.14
bn) during the month. It reported a 27% y-o-y rise in consolidated profit after tax for the quarter
ended June 2009 to Rs 125 crores (USD 26.1 mn). Consolidated revenues for the quarter climbed
12% y-o-y to Rs 2,658 crores (USD 554.56 mn).
Key Macro Developments:
Industrial production continued to remain positive in May 2009, with a growth of 2.7%. Core
sectors registered a growth of 6.5% for June 2009. Exports growth continued to drop for a ninth
consecutive month. In dollar terms, exports plunged 27.70% to USD 12.81 billion, however, in
rupee terms, it dropped 17.40% to Rs 61,217 crores during June 2009. Meanwhile, oil prices
slipped marginally 0.63% over the month to USD 69.45 a barrel.

8/7/2019 equity and derivative
http://slidepdf.com/reader/full/equity-and-derivative 120/123
Outlook:
On the international front, the markets will track developments and key economic data from US,
China and Japan. The exit strategy of the central banks will also have bearing on the global
markets. On the other hand, the Indian markets will be driven by the progress of monsoon, policy
announcements from the government and key economic data. Overall quarterly corporate
earnings performance was better than the market expectations. The market is now hoping for
better earnings growth prospects for FY2010. The manufacturing growth has also started
showing signs of improvement.
Now, with signs of economic recovery in developed countries and improvement in risk appetite
globally, the funds will flow in the emerging markets like India in search of higher growth. This
coupled with encouraging earnings outlook for FY2010, provides good opportunity for investors
to take active participation in the market and increase the equity allocation from long term
perspective.
Comparative analysis of the traded value in the F & O Segment with the cash segment
From this table we can see that in practical life though equity cash segment is better than the
derivatives because it involves lesser risk more numbers of investors are trading in derivatives
(F& O) segment. It is a major finding of the projects shows that by 60% to 70% investors are

8/7/2019 equity and derivative
http://slidepdf.com/reader/full/equity-and-derivative 121/123
bear more risk and traded in derivatives market because they want to earn more profits by trading
in derivatives.
CONCLUSIONS
This project has covered several areas. Its main conclusions are:
y Derivatives market growth continues almost irrespective of equity cash market turnover
growth. Since 2000. Cash equity turnover has fallen in the developed markets, but
derivatives turnover continued to rise steeply and steadily.
y Equity derivatives businesses like interest derivatives are highly concentrated. Using
notional value as the measure, the 2 main US markets and the 2 cross-border European
markets accounted for about 75% of the total. This was most apparent in index
derivatives, which make 99% of the notional value of equity derivatives. In single stock
derivatives, other markets have established niches and the dominance of the gig four is
less evident.
y Equity market volume and derivative market notional value are strongly correlated- witha ratio significant differences between individual markets.
y A number of cash equity markets- particularly in developing Asia- do not have equity
derivatives markets. Comparison of their cash market volumes with those that do have
derivative exchanges shows that the markets without derivatives are of similar size. I Am
not convinced that market or infrastructure differences explain this, but suspects that
regularity barriers have effectively prevented the development, markets in several
developing Asian countries.

8/7/2019 equity and derivative
http://slidepdf.com/reader/full/equity-and-derivative 122/123
RECOMMENDATIONS
y RBI should play a greater role in supporting Derivatives. Because nowadays
Derivatives market are increasing rapidly and it plays a major role in the whole
Securities market.
y Derivatives market should be developed in order to keep it at par with other
derivative market in the world. Nowadays more number of investors are shows
their interest in derivatives market because it includes high return by bearing high
risk.
y Speculation should be discouraged because it affects the market conditions badly andnew investors are reducing their interest in the market.
y There must be more derivatives instruments aimed at individual investors.
y SEBI should conduct seminars regarding the use of derivatives to educate
individual investors
y There is a need to have a smaller contract size in F & O Market. We can review
the size of the contract from Rs. Two lacs to One lacs. In the FICCI survey, 73%
of the respondents also held the same view.
BIBLIORAPHY
Books:-
Securities Laws and Regulations of Financial Markets
National Securities Depository Limited
Fundamentals of Futures & Options Markets- John C. Hull

8/7/2019 equity and derivative
http://slidepdf.com/reader/full/equity-and-derivative 123/123
Financial Derivatives- S. L. Gupta
Websites:-
www.world-exchange.org
www.nseindia.com
www.bseindia.com
www.religaresecurities.com
www.moneycontrol.com
www.indiamart.com
www.finpipe.com