Embed Size (px)
Citation preview

Epigenetic and Genetic Control of Imprinting at the Mez1 Locus in Maize
A THESIS SUBMITTED TO THE FACULTY OF THE GRADUATE SCHOOL
OF THE UNIVERSITY OF MINNESOTA BY
William John Haun
IN PARTIAL FULFILLMENT OF THE REQUIREMENTS FOR THE DEGREE OF
DOCTOR OF PHILOSOPHY
Dr. Nathan M. Springer
May 2008

© William John Haun 2008

i
Acknowledgements
This thesis would not exist were it not for the help of countless people who have
guided me during this early part of my scientific career. First, I would like to thank Dr.
Nathan Springer for his guidance, intellectual insight, support and friendship. His
approach to advising me as his ‘inaugural’ graduate student (or more importantly when
not to advise!) helped me tremendously at becoming a better scientist. Two other people
in the Springer lab, Dr. Robert Stupar and Peter Hermanson were very important
contributors to the ideas and work of this thesis. I would also like to thank my committee
members for their guidance and suggestions during my graduate career and in the
production of this final document; Dr. Peter Tiffin, Dr. Tony Sanderfoot, Dr. Neil
Olszewski and Dr. Judy Berman.
My decision to pursue a degree in the plant sciences began with my high school
biology teacher, Mr. Barnes, and the way he piqued my interest for both plant biology
and genetics. That interest in plant genetics was cultivated, challenged and enhanced in
the lab of Drs. Shawn and Heidi Kaeppler at the University of Wisconsin – Madison. It
was there I met Alvar Carlson and Alan Smith, both of whom were excellent sources of
knowledge and know-how, but almost as important, good guys to get a beer with. Much
of the foundation for my success in graduate school was built in Madison, both from my
time as an undergraduate and graduate student.
I would also like to thank my parents and sister for all their support throughout
the years. They may not have fully understood why I chose to continue my education for
additional seven following college, but were supportive nonetheless. Finally and most

ii
importantly, I would like to thank my wife Naomi. When I was stressed-out and
frustrated, she was always there to encourage me.

iii
ABSTRACT
Genomic imprinting is the mono-allelic expression of gene based on its parent-of-
origin and is important for normal progeny development in plants. The goal of this
research was to better classify the epigenetic modifications at the Zea mays (maize)
imprinted gene Mez1, while also investigating the phenotypic consequence of a loss-of-
imprinting. The Mez1 gene in maize is imprinted in endosperm tissue, displaying
expression solely from the maternal allele. A differentially methylated region (DMR)
was identified in the 5’cis-proximal region of Mez1 in endosperm tissue. In this DMR,
the paternal allele displays significantly higher levels of both CpG and CpNpG DNA
methylation relative to the corresponding region of the maternal allele. The chromatin
modifications of the maternal and paternal alleles of Mez1 and a second imprinted gene,
ZmFie1, were studied using allele-specific chromatin immunoprecipitation (ChIP).
HistoneH3 and HistoneH4 acetylation are maternally-enriched in endosperm tissue, while
HistoneH3 Lysine27 tri-methylation (and to a lesser extent HistoneH3 Lysine27 di-
methylation) show paternal allele enrichment. HistoneH3 Lysine9 di-methylation and
HistoneH3 Lysine9 tri-methylation do not show parent-specific enrichment. These
results suggest DNA methylation and histone modifications are involved in the epigenetic
regulation of imprinting in plants.
Numerous studies have focused on understanding the mechanism of imprinting,
however relatively little is known about the phenotypic consequence of expressing the
normally silent allele of an imprinted gene. Several different alleles containing Mu
transposon insertions into the 5’cis-proximal region of Mez1 were characterized. Both

iv
maternal and paternal inheritance of mez1-mu alleles can result in a loss-of-imprinting.
This suggests that Mu transposon insertions at the Mez1 locus can act by disrupting the
production of a trans-acting factor or interfering with the cis-acting elements involved in
imprinting. Interestingly, the mez1-mu insertions do not effect plant vegetative growth or
seed development. These results suggest allelic communication is important between the
two parental alleles of imprinted loci.

v
TABLE OF CONTENTS Acknowledgements........................................i Abstract..............................................iii List of Tables.........................................vi List of Figures.......................................vii Chapter 1 – Literature review of imprinting Origin, Biological Significance and Evolution of
Imprinting.........................................1 Imprinting in Mammals..............................5 Imprinting in Plants...............................7 Imprinting Mechanism in Plants....................12 Conclusions.......................................15 References........................................17 Chapter 2 – Genomic imprinting and DNA methylation of maize
Enhancer of zeste (Mez) homologs Introduction...........................................23 Results................................................24 Imprinted expression of Mez1 in the endosperm.....24
Confirmation of imprinting using Sequenom allele-specific expression assays...................26
Mez1 imprinting is maintained throughout endosperm development..................................27
Allele-specific expression of Mez1 is not caused by allele-specific DNA degradation..............27
Sequence analysis of the Mez1 promoter............28 DNA methylation analysis of the Mez1 5’ upstream
region.......................................29 Phylogenetic relationships of imprinted and non-
imprinted E(z)-like genes....................30 Discussion.............................................32 Experimental Procedures................................35 References.............................................40 Chapter 3 - Analysis of allele-specific chromatin
modifications at imprinted maize loci Introduction...........................................52 Results................................................55
Confirmation of Chromatin Immunoprecipitation Protocol for Maize Endosperm.................55

vi
Paternal-allele enrichment of ZmFie1 with a 5-methylcytosine antibody......................56
Parental allele-specific enrichment of histone modifications at Mez1 and ZmFie1.............57
Dynamics of allele-specific histone modifications at imprinted loci...............................60
Discussion.............................................61 Experimental Procedures................................66 References.............................................72 Chapter 4 - Loss-of-imprinting is associated with mu
transposon insertions in the 5’cis-proximal region of Mez1
Introduction...........................................95 Results................................................98
Characterization of the mu-transposon insertion alleles at the Mez1 locus....................98
mez1-mu insertion lines do not effect Mez1 expression levels in seedlings...............99
Mu insertion alleles affect imprinting of Mez1...100 mez1-m1 causes a loss-of-imprinting when inherited
from the maternal parent....................101 mez1-m2 causes loss-of-imprinting when inherited from
the paternal parent....................102 mez1-m4 causes loss-of-imprinting when inherited from
either parent..........................103 Discussion............................................104 Experimental Procedures...............................110 References............................................116 Bibliography..........................................128

vii
LIST OF TABLES Chapter 1 – Literature review of imprinting Table 1. Plant Imprinted Genes........................21 Chapter 2 – Genomic imprinting and DNA methylation of maize
Enhancer of zeste (Mez) homologs Table 1. Imprinting of Mez1, Mez2 & Mez3..............43 Table 2. Summary of CAPS Markers......................44 Table 3. Primers......................................45 Chapter 3 - Analysis of allele-specific chromatin
modifications at imprinted maize loci Table 1. Parent-specific Histone Modifications........75 Table 2. Antibodies for ChIP..........................76 Table 3. Primers......................................77 Chapter 4 - Loss-of-imprinting is associated with mu
transposon insertions in the 5’cis-proximal region of Mez1
Table 1. Loss-of-imprinting of mez1-mu alleles.......119 Table 2. Primers.....................................120

viii
LIST OF FIGURES Chapter 1 – Literature review of imprinting Figure 1. Model of MEA imprinting mechanism...........22 Chapter 2 – Genomic imprinting and DNA methylation of maize
Enhancer of zeste (Mez) homologs Figure 1. Mez1 genomic structure and imprinting.......46 Figure 2. Sequenom allele-specific expression.........47 Figure 3. Mez1 imprinting throughout endosperm
development.......................................48 Figure 4. Mez1 DNA Methylation Analysis...............49 Figure 5. DMR verification............................50 Figure 6. Phylogenetic analysis of Mez1 homologs......51 Chapter 3 - Analysis of allele-specific chromatin
modifications at imprinted maize loci Figure 1. Verification of ChIP........................80 Figure 2. Paternal enrichment of 5-methylcytosine at
ZmFie1............................................81 Figure 3. Analysis of histone occupancy...............82 Figure 4. Paternal enrichment of H3K27me3 at ZmFie1 and
Mez1..............................................83 Figure 5. Maternal enrichment of H3 acetylation at ZmFie1
and Mez1...................................84 Figure 6. Maternal enrichment of H4 acetylation at ZmFie1
and Mez1...................................85 Figure 7. Histone modifications that do not show
enrichment at Mez1................................86 Figure 8. Histone modifications that do not show
enrichment at ZmFie1..............................88 Figure 9. Analysis of allele-specific enrichment for
histone modifications at Nrp1.....................90 Figure 10. Detailed analysis of H3 acetylation, H4
acetylation and H3K27me3 at Mez1 and ZmFie1.......91 Figure 11. Real-time PCR analyss of histone modification
enrichments in three regions of Mez1..............92 Figure 12. Model for the epigenetic regulation of imprinted
loci in plants..........................94

ix
Chapter 4 - Loss-of-imprinting is associated with mu
transposon insertions in the 5’cis-proximal region of Mez1
Figure 1. Mu transposon insertions at Mez1...........121 Figure 2. mez1-m1 insertion effects in non-imprinted
tissue...........................................122 Figure 3. mez1-m2 insertion effects in non-imprinted
tissue...........................................123 Figure 4. mez1-m2 insertion effects in non-imprinted
tissue...........................................124 Figure 5. Maternal transmission of mez1-m1 results in
loss-of-imprinting...............................125 Figure 6. Paternal transmission of mez1-m2 results in
loss-of-imprinting...............................126 Figure 6. Maternal and paternal transmission of mez1-m2
results in loss-of-imprinting....................127

1
Chapter 1 Literature Review
ORIGIN, BIOLOGICAL SIGNIFICANCE AND EVOLUTION OF IMPRINTING
Sexual reproduction in animals and plants involves the fusion of the haploid
maternal and paternal gametes, resulting in the diploid offspring. At the DNA level, the
primary sequence of the paternal and maternal genomes is nearly identical. However,
their respective contributions to the transcriptome can be markedly different. For some
loci, there are distinct differences in gene expression patterns based on the parent-of-
origin. For instance, one parental allele is expressed while the other is explicitly and
completely repressed. This regulation of expression based on the parent-of-origin is
referred to as genomic imprinting and is observed in both mammals and plants (Morison
et al, 2005; Feil and Berger, 2007). Genomic imprinting represents an example of germ-
line specific epigenetic regulation. A striking characteristic of genomic imprinting is the
differential regulation of identical alleles of the same gene, in the same nucleus.
Imprinting is crucial for normal mouse development, yet evidence for imprinted gene
expression in other model organisms such as D. melanogaster (fruit fly), C. elegans
(nematode) and D. rerio (zebrafish) is questionable.
The term ‘imprinting’ was first used was to describe chromosomal inheritance
patterns in the insect Sciaridea diptera (Crouse, 1971). Imprinting at a single locus was
first demonstrated for the R gene in maize through a study looking at differences in
phenotype associated with the mode of sexual transmission (Kermicle, 1970). The first
gene to display a mono-allelic (expression from one parental allele and not the other)
imprinted expression pattern, Insulin Growth Factor2 (Igf2), was discovered in mice (De

2
Chiara et al, 1991). The imprinted expression of Igf2 is crucial for normal mouse
development. Years prior to the discovery of Igf2 imprinting, it was known that
genomic contributions from both parents are necessary for proper embryo development in
mouse (reviewed in Reik and Walter, 2001). Artificially created mouse embryos
generated from two female pronculei were unable to develop to term, while parthogenetic
eggs that received a male pronucleus were viable (Surani et al, 1984). Additional
experiments involving uniparental disomic mice (embryos that inherit specific
chromosomes from one parent only) revealed that only certain regions of the genome
require contribution of both parental genomes in order for normal development to occur
(Cattanach and Kirk, 1985). These regions contain clusters of imprinted loci and the
improper expression of these loci is responsible for the developmental abnormalities
(Ohlsson et al, 1993 and references therein). Extensions of these studies revealed human
diseases such as Prader-Willi, Angelman and Beckwith-Wiedemann syndromes are the
consequence of improper regulation of certain imprinted loci (da Rocha and Ferguson-
Smith, 2004).
The discovery of imprinting in Arabidopsis, like that of mammals, also resulted
from studies of embryonic developmental abnormalities. A class of mutants (FIS –
Fertilization Independent Seed) that displayed seed and/or endosperm development in
the absence of fertilization was identified in Arabidopsis thaliana (Ohad et al, 1996;
Chaudhury et al, 1997). When the MEDEA (MEA) mutant (also known as FIS1) was
cloned, it was shown that the MEA gene is expressed solely from the maternal allele
(Kinoshita et al, 1999; Vielle-Calzada et al, 1999). The inheritance of a mutant maternal
mea (or other fis allele) results in improper endosperm/seed development and subsequent

3
seed atrophy and abortion (Ohad et al, 1996; Chaudhury et al, 1997; Grossniklaus et
al¸1998). However, inheritance of a mutant mea allele from the paternal parent does not
have any effect upon endosperm or seed development (Grossniklaus et al, 1998).
Many theories have been proposed to explain the biological importance of
imprinting and the evolutionary forces that gave rise to this phenomenon. One of the
most accepted theories concerning the evolution of imprinting was proposed to explain
the evolution of the triploid endosperm tissue in maize (Haig and Westoby, 1989).
Moore and Haig (1991) expanded on that initial work, discussing the negative
consequences for a developing maize seed when the normal 2:1 ratio of maternal to
paternal genomes is altered. The 2:1 ratio results from the double-fertilization event that
occurs between a haploid sperm cell and the dikaryotic central cell, giving rise to the
triploid endosperm. The theory proposed by Haig and Westoby is known as the genetic
conflict hypothesis and is summarized below. [This theory is also referred to as the
‘parental tug-of-war’ theory and more recently as the ‘kinship theory of genomic
imprinting’ (Haig, 2004).]
In polyandrous species (such as maize), the developing progeny within a brood
will be equally related to the mother, but less related to each other. Due to the equal
genetic interest in all her offspring, the mother desires to distribute her resources equally
among them. On the other hand, the fathers’ genetic interest is best served by enabling
his offspring to acquire as many resources as possible, even at the expense of the mother
and the other developing offspring. An offspring that can obtain more resources has a
better chance of surviving, reproducing and carrying on the father’s genetic lineage.
From a gene expression standpoint, the mother would seek to down-regulate nutrient

4
acquisition genes and up-regulate fetal growth inhibitors. The father seeks to do the
opposite, up-regulate nutrient acquisition genes in his offspring and down-regulate fetal
growth inhibitors. As a result, imprinting has evolved as a complex ‘tug-of-war’ between
male and female parents over controlling the expression of certain developmental genes
(Haig and Westoby, 1989; Moore and Haig, 1991). Additional theories exist that suggest
alternative explanations for the evolution of genomic imprinting (reviewed in Weisstein
et al, 2002). A detailed explanation of those additional theories is beyond the scope of
this review.
Analysis of Igf2R gene expression and imprinting status in evolutionary diverse
mammals revealed imprinting evolved ~150 million years ago (MYA) (Killian et al,
2001). In plants, imprinting is observed in both monocot and dicot species. If imprinting
evolved in the common ancestor of all monocots and dicots and was maintained
independently after the monocot/dicot split, imprinting in plants evolved at least 140
MYA [the monocot-dicot divergence estimated from molecular sequence data and the
fossil record is ~140 MYA (Sanderson et al, 2004)].
Disruption of imprinted expression patterns or mutation in certain imprinted genes
results in developmental abnormalities in both mammals and plants (Kono et al, 2002 and
references therein, Grossniklaus et al, 1998). Research towards understanding the
mechanism of imprinting, how the cell differentiates between two nearly identical alleles
and regulates their expression differently, has provided a wealth of knowledge in both
mammals and plants. The objective of this research is to explore what genetic and
epigenetic mechanisms are involved in regulating imprinting at the Mez1 locus in Zea
mays (maize).

5
IMPRINTING IN MAMMALS
Imprinting has been documented for at least 83 loci in mammals, 29 of which are
imprinted in both mice and humans (Morison et al, 2005). As mentioned previously, the
discovery of imprinting in mammals was made through studies of improper development
of embryos with unequal contributions from each parent (reviewed in Reik and Walter,
2001). In addition to improper development in mice, several human diseases (Prader-
Willi, Angelman and Beckwith-Wiedemann syndromes) are a consequence of imprinting
gene defects (reviewed in Walter and Paulsen, 2003). The importance of imprinting in
mammals is evident and understanding the mechanism of how these genes are imprinted
may provide cures for the aforementioned diseases as well as providing insight to the
complex process of mammalian development.
The general imprinting mechanism in mammals has four stages. Imprints need to
be [1] established during development of germ cells, [2] maintained after fertilization and
during development of the offspring, [3] read by the cellular machinery (which results in
differential gene expression) and [4] erased in the germ cells of the new organism so the
cycle can start again (Reik and Walter, 2001). In most cases, the molecular basis of the
‘imprint’ is differential DNA methylation of the two parental alleles (Edwards and
Ferguson-Smith, 2007). The methylation of DNA is enzymatic process, carried out by
three functional DNA methyltransferases in mammals, DNMT1, DNMT3a and DNMT3b
(Bestor, 2000). These differentially methylated regions (DMRs) are a critical component
of the mammalian imprinting mechanism (see below). A fundamental characteristic of
this mechanism is that DNA methylation is regulated differently at imprinted loci than at

6
other genomic regions. Following fertilization, there is genome-wide demethylation and
a wave of de novo methylation after implantation. Differentially methylated regions
resist this demethylation and de novo methylation and imprinting marks remain true to
their parental origin (reviewed in Reik and Walter, 2001).
Recent experiments have provided additional insight into the imprinting
mechanism in mammals. Many of the imprinted genes in mammals are organized into
clusters, each containing multiple imprinted genes (Edwards and Ferguson-Smith, 2007).
Each cluster typically has three characteristic components: several protein-coding genes,
a major cis-acting imprinting control region (ICR) and at least one non-coding RNA
(Edwards and Ferguson-Smith, 2007). Other regulatory regions may play a role in the
regulation of a particular cluster, however the expression of all the imprinted genes
within a cluster is controlled by the single ICR. A critical component to the regulation of
imprinting clusters is the differential methylation of the maternal and paternal ICRs. The
ICR typically contains a DMR and the regulation of these clusters is dependent on which
parental allele contains the methylated ICR.
The regulation of clusters occurs in one of two ways; ICRs can be methylated in
the maternal germline (the most common) or ICRs can be methylated in the paternal
germline. Although each cluster has unique components to its regulation, a few
characteristics are conserved between clusters. The mechanism regulating clusters that
inherit a methylated paternal ICR is not well defined. Clusters that inherit a methylated
maternal ICR, such as the Igf2/H19 cluster are better understood. The unmethylated
paternal ICR in the Igf2/H19 cluster acts as a promoter for a paternally-expressed non-
coding RNA (ncRNA). This ncRNA is usually antisense to at least one gene in the

7
cluster. It is still unclear if the expression of the antisense ncRNA itself is responsible for
the repression of all the silenced genes in the cluster. The mechanism for Igf2/H19 is
well understood, but appears to lack similarity with other imprinting clusters with a
maternally methylated ICR (reviewed in Edwards and Ferguson-Smith, 2007).
In summary, studies in mammals have revealed three key characteristics of the
imprinting mechanism. First, DNA methylation is an important epigenetic mark within
imprinting control regions. As described above, the parental allele that contributes the
methylated ICR dictates the manner in which the imprinted gene (cluster) is regulated.
Second, DNA methylation within imprinting clusters is resistant to the genome-wide
epigenetic resetting that occurs after fertilization. Third, antisense transcription of
ncRNAs also appears to playing a role in regulating the expression of imprinted genes
within a cluster. The discovery of imprinting in mammals originated with studies on
embryo development and revealed a requirement for a genetic contribution from both
parents.
IMPRINTING IN PLANTS
Similar to the discovery of imprinted genes in mammals, imprinting in plants was
identified through studies of improper endosperm/embryo development. Early studies
revealed certain mutations resulting in seed abortion require a functional maternal
contribution and that the phenotype caused by these mutations could not be rescued by a
wild-type paternal allele (Grossniklaus et al, 1998). Further experimentation identified a
handful of genes in plants that displayed mono-allelic expression patterns. Current

8
research (and the goal of this project) is working toward understanding the underlying
mechanisms that control imprinted gene expression in plants.
While imprinting in plants and mammals shares many characteristics, the
remainder of this review will focus on components specific to imprinting in plants.
Imprinting in plants has only been identified in angiosperms, where it is confined to the
triploid endosperm tissue. The endosperm tissue is a nutritive food source for the
developing embryo and is the result of a double fertilization event between a haploid
sperm cell and the dikaryotic central cell. While imprinting may exist in embryo or
somatic tissues, examples of this in plants have remained elusive. The location of
imprinting in the endosperm is an important component of the imprinting mechanism in
plants. The endosperm is a terminal tissue and makes no genetic contribution to the next
generation. Therefore, imprinting marks in plants are not inherited by the progeny and do
not need erasure in the progeny’s primordial germ cells in order to re-initiate the
imprinting sequence in the next generation. In this review, I will discuss the different
classifications of plant imprinted genes, list some of the examples of imprinting and give
a detailed overview of a model for how genes are imprinted in plants.
Currently, there are a handful of examples of imprinted genes in plants (Table 1).
Imprinted genes in plants are categorized into two main groups, gene-specific or allele-
specific imprinting. Examples in the gene-specific category display the characteristic
parent-of-origin expression pattern in all alleles tested from multiple genotypic lines.
This is in contrast to the allele-specific examples of plant-imprinted genes, in which only
a few alleles display a parent-of-origin expression pattern. For example, an analysis of
the maize Dzr1 gene in three inbred lines (Mo17, BSSS53 and W64A) revealed imprinted

9
expression only when the Mo17 allele was inherited maternally. Crosses between
BSSS53 and W64Aa or crosses with Mo17 as the paternal parent did not result in the
imprinted expression of Dzr1 (Chaudhuri and Messing, 1994). Four loci in maize
demonstrate allele-specific imprinting: R, Zein, α-Tubulin and Dzr1 (Table 1). Due to
their allele-specific imprinting, these genes are different from gene-specific examples of
imprinting and will be excluded from further discussion of plant imprinted genes.
Plant imprinted genes can be further divided into two subcategories, binary
imprinting and differential imprinting (Dilkes and Comai, 2004). Binary imprinting is
the strict mono-allelic expression of one of the parental alleles while the other is silent.
This class of imprinted genes in plants is thought to represent only a small percentage of
the imprinted loci (Dilkes and Comai, 2004). Differential imprinting is the bi-allelic
expression of both parental alleles but the expression levels deviate from those expected
based on genomic dosage. In addition, imprinted genes can also be classified according
to how long the imprinted expression pattern persists during endosperm development.
Some genes maintain their imprinted expression throughout endosperm development,
while others show imprinted expression early during development and bi-allelic
expression as endosperm development proceeds (Danilevskaya et al, 2003; Gutiérrez-
Marcos et al, 2006).
The basis of knowledge regarding imprinting mechanisms in plants is mainly the
result of research in Arabidopsis thaliana. MEDEA (MEA) was the first imprinted gene
discovered in Arabidopsis, showing only expression from the maternal allele in the
developing endosperm (Kinoshita et al, 1999; Vielle-Calzada et al, 1999). MEA encodes
a SET domain Polycomb group (PcG) protein similar to the Drosophila gene Enhancer of

10
Zeste [E(z)] (Grossnikauls et al, 1998). MEA is one of three Arabidopsis class I SET-
domain proteins (CLF and SWN/EZA1 are the others), believed to methylate Histone3
lysine27 (Springer et al, 2003). Plant PcG proteins are involved in maintaining
transcriptionally repressed states of their target genes during development by altering
chromatin structure (Köhler and Grossniklaus, 2002). During plant reproduction, PcG
proteins (MEA and others) play a role in controlling cell proliferation during
embryogenesis (Grossniklaus et al, 1998). Initial studies thoroughly characterized the
phenotype for mutations in MEA, while subsequent studies sought to identify the
underlying mechanism of MEA imprinting.
Two additional genes, FWA and FERTILIZATION INDEPENDENT SEED2
(FIS2), are imprinted in Arabidopsis. As is the case for MEA, maternal-specific
expression of FWA and FIS2 is observed in the endosperm (Kinoshita et al, 2004; Jullien
et al, 2006). One key difference between the imprinting of MEA and FWA/FIS2 is the
expression pattern throughout the plant life cycle. In contrast to the expression profile of
MEA, FWA and FIS2 transcripts are not found in any vegetative tissues. FWA expression
is only detectable in the open flower, four day after pollination (DAP) seeds and six DAP
endosperm + seed coat (Kinoshita et al, 2004). FIS2 expression is only found in late
silique tissue and in developing endosperm (Luo et al, 1999; Jullien et al, 2006).
Pheres1 (PHE1) is the fourth known imprinted gene in Arabidopsis. The
imprinted expression pattern of PHE1 is different from that of MEA, FWA and FIS2.
PHE1 is expressed solely from the paternal allele in 2-4 DAP gynoecia and silique tissue
(Köhler et al, 2005). PHE1 was identified as a downstream target of the MEA/FIE
complex through analysis of microarray data from mea and fie mutants (Köhler et al,

11
2003). MEA and FIE are required to down-regulate PHE1 expression during seed
development and the MEA/FIE complex was shown to physically interact with the PHE1
promoter (Köhler et al, 2003). PHE1 encodes a MADS-domain type-1 class transcription
factor which, when over-expressed (or when not down-regulated), results in the
endosperm over-proliferation and seed abortion phenotype associated with mea and fie
mutants (Köhler et al, 2003). Additionally, the repression of the maternal PHE1 allele
was shown to require MEA (Köhler et al, 2005). DNA methylation also appears to play a
role in the expression of PHE1, albeit in a different context than that of other Arabidopsis
imprinted genes. In the mea mutant background, PHE1 expression is high, the
endosperm over-proliferates and the seed aborts. However, in a mea/ddm1 double mutant
background where global methylation is reduced, PHE1 expression is reduced and the
seed abortion phenotype is rescued (Köhler et al, 2003).
Five genes in maize have been identified that display mono-allelic gene
expression characteristic of genomic imprinting. Three of the genes, Nrp1, ZmFie1 and
Meg1, show maternal-specific expression in the endosperm and no expression in any
other tissue (Guo et al, 2003; Danilevskaya et al, 2003; Springer et al, 2002; Gutiérrez-
Marcos et al, 2004). Based on the expression patterns, the mechanism controlling the
imprinted expression of Nrp1, ZmFie1 and Meg1 appear to be similar to that of
Arabidopsis FWA and FIS2. The fourth imprinted gene in maize, ZmFie2, displays a
different pattern of imprinted expression. The expression of ZmFie2 is not limited to
endosperm tissue and is found in embryo tissue as well as several vegetative tissues
(Springer et al, 2002; Danilevskaya et al, 2003). However, ZmFie2 is only imprinted
during early endosperm development and expression is bi-allelic in 10 DAP endosperm

12
tissue (Danilevskaya et al, 2003; Gutiérrez-Marcos et al, 2006). The final imprinted gene
in maize, Mez1, shows a distinct pattern of expression relative to other maize imprinted
genes. Mez1 is expressed in the embryo and several vegetative tissues like ZmFie2,
however it is constitutively imprinted throughout endosperm development (Haun et al,
2007). Mez1 is an [E(z)] homolog related to the Arabidopsis gene Curly Leaf (CLF) and
is phylogenetically similar to MEA (Springer et al, 2002). Sequence homology to MEA
as well as Drosophila melanogaster E(Z) suggests MEZ1 is class I histone3 lysine27
methyltransferase (Springer et al, 2003).
IMPRINTING MECHANISM IN PLANTS
All examples to date suggest a single common mechanism for imprinting in
plants. The model for the imprinting of MEA (and other imprinted genes in Arabidopsis)
involves multiple epigenetic marks and several proteins (Figure 1). Substantial evidence
suggests DNA methylation is a crucial component of the mechanism controlling the
imprinted expression of MEA (Vielle-Calzada et al, 1999; Xiao et al, 2003). The first
three stages for the general mechanism of imprinting in plants are the same as in
mammals. The erasure stage is not necessary in plants because imprinting only occurs in
endosperm, a tissue that makes no genetic contribution to the next generation. The
following model is based on evidence from the imprinted gene MEA in Arabidopsis,
however, many of the stages and components appear to be conserved for other imprinted
genes.

13
Establishment: Prior to gametogenesis and during vegetative growth, DNA
methylation is established in the promoter region of the imprinted gene (Figure 1 [A]).
During gametogenesis, the male and female germ lines develop separately and genes
such as MEA are regulated differently depending on the sex of the developing
gametophyte. Studies show that the gene DEMETER (DME) is necessary for maternal
activation of MEA in the central cell, the female progenitor of the endosperm (Xiao et al,
2003). DME encodes a protein containing a DNA glycosylase domain and is exclusively
expressed in the central cell during female gametogenesis (Choi et al, 2002). DME
transcription is abundant in immature flower buds and dramatically decreases in
developing seeds after fertilization (Choi et al, 2002). Bisulfite DNA sequencing results
showed the maternal MEA allele is hypomethylated in wild-type endosperm tissue but is
hypermethylated in dme mutant endosperm (Gehring et al, 2006). This is the result of
maternal-specific excision of 5-methylcytosines in wild-type tissues (Figure 1 [B]) (Choi
et al, 2002; Choi et al, 2004; Gehring et al, 2006). In flowers inheriting a mutant dme
allele, MEA expression is not detected. However, in a double mutant met1 dme
background, MEA expression is restored (Xiao et al, 2003). This removal of
methylcytosines is a necessary step in the activation of the maternal MEA allele. In the
male gamete, DME expression is absent and the paternal allele maintains its methylated
status and repressed transcription (Figure 1 [C]) (Choi et al, 2002). Inheritance of a
hypomethylated paternal genome in a met1 (and in other mutants that affect DNA
methylation such as ddm1, drm1 drm2 cmt3, ago4, rdr2 and dcl3) mutant background did
not result in activation of the paternal MEA allele (Gehring et al, 2006). This suggests
additional epigenetic marks and/or other yet-to-be identified proteins are necessary for

14
the silencing of the paternal MEA allele. Histone methylation was also shown to be
enriched at the paternal allele of MEA in endosperm tissue (Figure 1 [E]) (Gehring et al,
2006). Little is known about when the histone methylation is established at MEA,
however some evidence suggest the MEA protein itself is involved (see below).
Interestingly MEA is methylated in vegetative and embryo tissue (Gehring et al, 2006),
yet it is expressed from both parental alleles.
Maintenance: Prior to fertilization, the epigenetic states are maintained according
to the parent-of-origin. Following fertilization and during early development, DNA
methylation patterns are maintained in the paternal allele of the endosperm and both
parental alleles of the embryo. The maternal allele remains hypomethylated and the
expression of DME is repressed following fertilization and throughout seed development
(Figure 1 [D]) (Choi et al, 2002).
Interpretation: After fertilization, the maintained epigenetic states of the two
parental alleles are interpreted. The lack of DNA methylation at the maternal MEA allele
results in expression, while methylation represses expression of the paternal MEA allele
(Figure 1 [E]). Recent evidence suggests that MEA plays a role in its own imprinting.
The MEA protein interacts with its own promoter (Baroux et al, 2006) as well as with
other PcG proteins, suggesting that silencing of the paternal MEA allele is maintained in
part by maternally-expressed MEA protein (Figure 1 [E]) (Jullien et al, 2006; Gehring et
al, 2006). More specifically, MEA has been shown to interact with FIE, MSI1 and FIS2
to from a multi-protein complex (Spillane et al, 2000; Köhler et al, 2003; Wang et al,
2006). This complex localizes at the paternal MEA allele and maintains the suppressed
expression state by maintaining histone methylation and a condensed chromatin structure.

15
Mutations in any of these four genes results in improper endosperm
initiation/development and subsequent seed abortion (Luo et al, 2000; Köhler et al,
2003).
A consistent component of the imprinting mechanisms for MEA (as well as the
other Arabidopsis imprinted genes FWA and FIS2), is the role DNA methylation plays in
regulating the mono-allelic expression pattern. For both FWA and FIS2, a mutation in the
methyltransferase gene MET1 transmitted through the male parent results in reactivation
of the silenced paternal allele (Kinoshita et al, 2004; Jullien et al, 2006). Further analysis
revealed a requirement for DME in the female gametophyte is also required for the
activation of FWA and FIS2 (Kinoshita et al, 2004; Jullien et al, 2006). These results
suggest the mechanism controlling the imprinted expression of FWA and FIS2 is similar
to that of MEA and reinforces the role of DNA methylation in the imprinting mechanism.
CONCLUSIONS
Imprinting is a form of epigenetic regulation in which two alleles with identical,
or near-identical, sequence are differentially regulated within the same nucleus. Studies
in Arabidopsis have revealed a mechanism involving DNA methylation and activation of
the maternal allele. Though MEA, FWA and FIS2 have different expression patterns, the
mechanism controlling their imprinted expression in the endosperm appears to be similar.
Work in Arabidopsis has been informative to this point; however, certain limitations
make it difficult to answer some newly emerging questions. We propose using maize
(specifically the Mez1 gene) to study imprinting as a new model for plant imprinting for
several reasons. Maize has a large endosperm, which allows for assays such as chromatin

16
immunoprecipitation (ChIP) that are difficult to perform in Arabidopsis. The availability
of transposon insertion lines at the Mez1 locus also make it possible to study the affect on
imprinting when cis-proximal promoter regions are displaced by several thousand base
pairs. Lastly, preliminary analysis of Mez1 imprinting suggests it may be regulated by a
mechanism distinct from that of imprinted genes in Arabidopsis. Studies of Mez1 could
potentially fill in the gaps of the MEA mechanism, or may shed light on an alternative
mechanism for the regulation of imprinting in plants. To that end, this project has three
specific questions: 1) What is the role of DNA methylation in regulating Mez1
imprinting? 2) What histone modifications are enriched in a parent-specific manner at
Mez1? 3) What is the effect of Mutator transposon insertions into the 5’cis-proximal
sequences on Mez1 imprinted expression? Using the maize Mez1 locus, our studies will
focus on defining the cis-acting sequences and epigenetic modifications that regulate the
imprinted expression of the Mez1 gene.

17
REFERENCES
Baroux C, Gagliardini V, Page DR, Grossniklaus U (2006) Dynamic regulatory interactions of Polycomb group genes: MEDEA autoregulation is required for imprinted gene expression in Arabidopsis. Genes Dev 20: 1081-1086
Bestor TH (2000) The DNA methyltransferases of mammals. Hum Mol Genet 9: 2395-2402
Cattanach BM, Kirk M (1985) Differential activity of maternally and paternally derived chromosome regions in mice. Nature 315: 496-498
Chaudhuri S, Messing J (1994) Allele-specific parental imprinting of dzr1, a posttranscriptional regulator of zein accumulation. Proc Natl Acad Sci U S A 91: 4867-4871
Chaudhury AM, Ming L, Miller C, Craig S, Dennis ES, Peacock WJ (1997) Fertilization-independent seed development in Arabidopsis thaliana. Proc Natl Acad Sci U S A 94: 4223-4228
Choi Y, Gehring M, Johnson L, Hannon M, Harada JJ, Goldberg RB, Jacobsen SE, Fischer RL (2002) DEMETER, a DNA glycosylase domain protein, is required for endosperm gene imprinting and seed viability in arabidopsis. Cell 110: 33-42
Choi Y, Harada JJ, Goldberg RB, Fischer RL (2004) An invariant aspartic acid in the DNA glycosylase domain of DEMETER is necessary for transcriptional activation of the imprinted MEDEA gene. Proc Natl Acad Sci U S A 101: 7481-7486
Crouse HV, Brown A, Mumford BC (1971) --chromosome inheritance and the porblem of chromosome "imprinting" in Sciara (Sciaridae, Diptera). Chromosoma 34: 324-39 8
da Rocha ST, Ferguson-Smith AC (2004) Genomic imprinting. Curr Biol 14: R646-9
Danilevskaya ON, Hermon P, Hantke S, Muszynski MG, Kollipara K, Ananiev EV (2003) Duplicated fie genes in maize: expression pattern and imprinting suggest distinct functions. Plant Cell 15: 425-438
DeChiara TM, Robertson EJ, Efstratiadis A (1991) Parental imprinting of the mouse insulin-like growth factor II gene. Cell 64: 849-859
Dilkes BP, Comai L (2004) A differential dosage hypothesis for parental effects in seed development. Plant Cell 16: 3174-3180
Edwards CA, Ferguson-Smith AC (2007) Mechanisms regulating imprinted genes in clusters. Curr Opin Cell Biol 19: 281-289

18
Feil R, Berger F (2007) Convergent evolution of genomic imprinting in plants and mammals. Trends Genet 23: 192-199
Gehring M, Huh JH, Hsieh TF, Penterman J, Choi Y, Harada JJ, Goldberg RB, Fischer RL (2006) DEMETER DNA glycosylase establishes MEDEA polycomb gene self-imprinting by allele-specific demethylation. Cell 124: 495-506
Grossniklaus U, Vielle-Calzada JP, Hoeppner MA, Gagliano WB (1998) Maternal control of embryogenesis by MEDEA, a polycomb group gene in Arabidopsis. Science 280: 446-450
Guo M, Rupe MA, Danilevskaya ON, Yang X, Hu Z (2003) Genome-wide mRNA profiling reveals heterochronic allelic variation and a new imprinted gene in hybrid maize endosperm. Plant J 36: 30-44
Gutierrez-Marcos JF, Costa LM, Biderre-Petit C, Khbaya B, O'Sullivan DM, Wormald M, Perez P, Dickinson HG (2004) maternally expressed gene1 Is a novel maize endosperm transfer cell-specific gene with a maternal parent-of-origin pattern of expression. Plant Cell 16: 1288-1301
Gutierrez-Marcos JF, Costa LM, Dal Pra M, Scholten S, Kranz E, Perez P, Dickinson HG (2006) Epigenetic asymmetry of imprinted genes in plant gametes. Nat Genet 38: 876-878
Haig D, Westoby M (1989) Parent specific gene expression and the triploid endosperm. Am Nat 134: 147-155
Haig D (2004) Genomic imprinting and kinship: how good is the evidence? Annu Rev Genet 38: 553-585
Haun WJ, Laoueille-Duprat S, O'connell MJ, Spillane C, Grossniklaus U, Phillips AR, Kaeppler SM, Springer NM (2007) Genomic imprinting, methylation and molecular evolution of maize Enhancer of zeste (Mez) homologs. Plant J 49: 325-337
Jullien PE, Katz A, Oliva M, Ohad N, Berger F (2006) Polycomb group complexes self-regulate imprinting of the Polycomb group gene MEDEA in Arabidopsis. Curr Biol 16: 486-492
Kermicle JL (1970) Dependence of the R-Mottled Aleurone Phenotype in Maize on Mode of Sexual Transmission. Genetics 66: 69-85
Killian JK, Nolan CM, Wylie AA, Li T, Vu TH, Hoffman AR, Jirtle RL (2001) Divergent evolution in M6P/IGF2R imprinting from the Jurassic to the Quaternary. Hum Mol Genet 10: 1721-1728
Kinoshita T, Yadegari R, Harada JJ, Goldberg RB, Fischer RL (1999) Imprinting of the MEDEA polycomb gene in the Arabidopsis endosperm. Plant Cell 11: 1945-1952
Kinoshita T, Miura A, Choi Y, Kinoshita Y, Cao X, Jacobsen SE, Fischer RL, Kakutani T (2004) One-way control of FWA imprinting in Arabidopsis endosperm by DNA methylation. Science 303: 521-523

19
Köhler C, Grossniklaus U (2002) Epigenetic inheritance of expression states in plant development: the role of Polycomb group proteins. Curr Opin Cell Biol 14: 773-779
Köhler C, Hennig L, Spillane C, Pien S, Gruissem W, Grossniklaus U (2003) The Polycomb-group protein MEDEA regulates seed development by controlling expression of the MADS-box gene PHERES1. Genes Dev 17: 1540-1553
Köhler C, Page DR, Gagliardini V, Grossniklaus U (2005) The Arabidopsis thaliana MEDEA Polycomb group protein controls expression of PHERES1 by parental imprinting. Nat Genet 37: 28-30
Kono T, Sotomaru Y, Katsuzawa Y, Dandolo L (2002) Mouse parthenogenetic embryos with monoallelic H19 expression can develop to day 17.5 of gestation. Dev Biol 243: 294-300
Lund G, Ciceri P, Viotti A (1995a) Maternal-specific demethylation and expression of specific alleles of zein genes in the endosperm of Zea mays L. Plant J 8: 571-581
Lund G, Messing J, Viotti A (1995b) Endosperm-specific demethylation and activation of specific alleles of alpha-tubulin genes of Zea mays L. Mol Gen Genet 246: 716-722
Luo M, Bilodeau P, Koltunow A, Dennis ES, Peacock WJ, Chaudhury AM (1999) Genes controlling fertilization-independent seed development in Arabidopsis thaliana. Proc Natl Acad Sci U S A 96: 296-301
Moore T, Haig D (1991) Genomic imprinting in mammalian development: a parental tug-of-war. Trends Genet 7: 45-49
Morison IM, Ramsay JP, Spencer HG (2005) A census of mammalian imprinting. Trends Genet 21: 457-465
Ohad N, Margossian L, Hsu YC, Williams C, Repetti P, Fischer RL (1996) A mutation that allows endosperm development without fertilization. Proc Natl Acad Sci U S A 93: 5319-5324
Ohlsson R, Nystrom A, Pfeifer-Ohlsson S, Tohonen V, Hedborg F, Schofield P, Flam F, Ekstrom TJ (1993) IGF2 is parentally imprinted during human embryogenesis and in the Beckwith-Wiedemann syndrome. Nat Genet 4: 94-97
Reik W, Walter J (2001) Genomic imprinting: parental influence on the genome. Nat Rev Genet 2: 21-32
Sanderson MJ, Thorne JL, Wikström N, Bremer K (2004) Molecular evidence on plant divergence times. Am J Bot 91: 1656–1665
Spillane C, MacDougall C, Stock C, Kohler C, Vielle-Calzada JP, Nunes SM, Grossniklaus U, Goodrich J (2000) Interaction of the Arabidopsis polycomb group proteins FIE and MEA mediates their common phenotypes. Curr Biol 10: 1535-1538

20
Springer NM, Danilevskaya ON, Hermon P, Helentjaris TG, Phillips RL, Kaeppler HF, Kaeppler SM (2002) Sequence relationships, conserved domains, and expression patterns for maize homologs of the polycomb group genes E(z), esc, and E(Pc). Plant Physiol 128: 1332-1345
Springer NM, Napoli CA, Selinger DA, Pandey R, Cone KC, Chandler VL, Kaeppler HF, Kaeppler SM (2003) Comparative analysis of SET domain proteins in maize and Arabidopsis reveals multiple duplications preceding the divergence of monocots and dicots. Plant Physiol 132: 907-925
Surani MA, Barton SC, Norris ML (1984) Development of reconstituted mouse eggs suggests imprinting of the genome during gametogenesis. Nature 308: 548-550
Vielle-Calzada JP, Thomas J, Spillane C, Coluccio A, Hoeppner MA, Grossniklaus U (1999) Maintenance of genomic imprinting at the Arabidopsis medea locus requires zygotic DDM1 activity. Genes Dev 13: 2971-2982
Walter J, Paulsen M (2003) Imprinting and disease. Semin Cell Dev Biol 14: 101-110
Wang D, Tyson MD, Jackson SS, Yadegari R (2006) Partially redundant functions of two SET-domain polycomb-group proteins in controlling initiation of seed development in Arabidopsis. Proc Natl Acad Sci U S A 103: 13244-13249
Weisstein AE, Feldman MW, Spencer HG (2002) Evolutionary genetic models of the ovarian time bomb hypothesis for the evolution of genomic imprinting. Genetics 162: 425-439
Xiao W, Gehring M, Choi Y, Margossian L, Pu H, Harada JJ, Goldberg RB, Pennell RI, Fischer RL
(2003) Imprinting of the MEA Polycomb gene is controlled by antagonism between MET1
methyltransferase and DME glycosylase. Dev Cell 5: 891-901

21
Gene SpeciesParental
Expression Epigenetic Control Function? Reference(s)
MEA Arabidopsis Maternal 5' & 3' parental DMR, PcG H3K27 methyltransferase Kinoshita et al , 1999; Vielle-Calzada et al , 1999, Gehring et al , 2006
FWA Arabidopsis Maternal Maternal Demethylation Kinoshita et al , 2004PHE1 Arabidopsis Paternal Kohler et al , 2005FIS2 Arabidopsis Maternal Transcription Factor Jullien et al , 2006Mez1 Maize Maternal 5' DMR H3K27 methyltransferase Haun et al , 2007Fie1 Maize Maternal 5' DMR PcG Protein Gutierrez-Marcos et al , 2006Fie2 Maize Maternal 5' DMR PcG Protein Gutierrez-Marcos et al , 2006Meg1 Maize Maternal Defensin-like gene Gutierrez-Marcos et al , 2004Nrp1 Maize Maternal Transcription Factor Guo et al , 2003Zein* Maize Maternal Maternal Demethylation Zein storage protein Lund et al , 1995a
α-Tubulin* Maize Maternal Maternal Demethylation alpha tubulin Lund et al, 1995bdzr1* Maize Maternal zein transcription factor Chaudhuri and Messing, 1994
R* Maize Maternal MYB transcription factor Kermicle et al , 1970
Table 1. Plant imprinted genes. DMR – Differentially Methylated Region, ‘*’ - allele specific imprinting

Figure 1
MEA(m)MEA (p)
Gametogenesis MEA (p)
MEA(m)
Male
Female
MET1
MET1
DME
MEA(m)
A
B
C
Establishment
Fertilization
2n
3n
MEA (p)MEA(m)
MEA(m)
MEA
MEAFIS2
FIEMSI1
FIS2FIE
MSI1
D
E
- DNA Methylation - H3K27 Methylation
MEA (p) MEA(m)
Embryo
Endosperm
Maintenance
Interpretation
Figure 1. Model of MEA imprinting mechanism in Arabidopsis. See text for details.
22

23
Chapter 2 Genomic imprinting and DNA methylation of maize Enhancer of
zeste (Mez) homologs INTRODUCTION
The contribution of the maternal and paternal genomes to the transcriptome can
be different even though their primary DNA sequence is often nearly identical. Genes
that show mono-allelic transcription are referred to as imprinted, if differential expression
depends upon the parent-of-origin. Genomic imprinting represents a unique example of
differential gene regulation of identical alleles in the same nucleus. Numerous studies
have documented the existence of genes that display an imprinted pattern of gene
expression in both mammals and plants (Morison et al, 2005; Gehring et al, 2004;
Grossniklaus, 2005). In mammals, mechanisms exist that control genomic imprinting
such that both paternal-specific and maternal-specific loci are expressed (Wrzeska and
Rejduch, 2004) and normal embryonic development strictly requires contributions from
both genomes.
At the transcriptional level there is currently evidence for gene-specific imprinting
of four maize genes, ZmFie1 (Danilevskaya et al, 2003), ZmFie2 (Gutiérrez-Marcos et al,
2006), Meg1 (Gutiérrez-Marcos et al, 2004) and Nrp1 (Guo et al, 2003). There are two
maize orthologs of the Arabidopsis FIE gene, ZmFie1 and ZmFie2 (Springer et al, 2002;
Gutierrez-Marcos et al, 2006). ZmFie1 is imprinted in the endosperm in a manner similar
to that of the Arabidopsis MEA in that paternal transcripts cannot be detected throughout
seed development (Danilevskaya et al, 2003). The other maize ortholog, ZmFie2,
displays a delayed activation of the paternal allele in the endosperm such that expression
24
is imprinted in early endosperm tissue but displays bi-allelic expression at later time
points (Danilevskaya et al, 2003). Similar to ZmFie2, there is also evidence for delayed
paternal activation of the gene Meg1 (Gutierrez-Marcos et al, 2004). The expression of
the maize transcription factor Nrp1, from the No-apical-meristem gene family, is
restricted to the endosperm tissue and only transcripts derived from the maternal allele
are detected (Guo et al, 2003). Differentially methylated regions (DMRs) have been
identified for ZmFie1 and ZmFie2, which correlate with maternal expression of these two
genes in maize endosperm (Gutierrez-Marcos et al, 2006).
MEA is homologous to the Drosophila Polycomb group (PcG) gene Enhancer of
Zeste [E(z)] (Grossniklaus et al, 1998). Plant PcG proteins are thought to function as part
of a multiprotein complexes involved in maintaining transcriptional repression of certain
genes during development (Goodrich et al, 1997). MEA is one of three Arabidopsis
genes that are related to the Drosophila E(z) gene, along with CURLY LEAF (CLF) and
SWN (EZA1) (Grossniklaus et al, 1998, Goodrich et al, 1997; Preuss 1999). The maize
genome also encodes three homologs of the Drosophila E(z) gene; Mez1, Mez2 and Mez3
(Springer et al, 2003). The goal of this study was to determine if the maize E(z)-like
genes; Mez1, Mez2 and Mez3 display an imprinted pattern of gene expression in the
endosperm.
RESULTS Imprinted expression of Mez1 in the endosperm. The possibility of imprinted
expression patterns for the maize E(z) homologs was tested using an allele-specific RT-
PCR assay (Figure 1). CAPS markers were identified that allowed the allele-specific

25
analysis of Mez1, Mez2 and Mez3 expression in different maize genotypes (Table 2). The
allele-specific expression pattern of Mez1 and Mez2 could be investigated in tissues
generated from the B73 and Mo17 genotypes. Embryo and endosperm tissues were
isolated from ears derived from B73 self pollinations, Mo17 self pollinations, B73 (♀) x
Mo17 (♂) pollinations and Mo17 (♀) x B73 (♂) pollinations. Total RNA was extracted
from endosperm and embryo tissue isolated 13 days after pollination (DAP). The primers
used for the allele-specific RT-PCR expression analysis flank introns to clearly
distinguish the presence of amplifiable genomic DNA from cDNA. Each amplified PCR
product was digested with the restriction enzyme AluI to identify the parental nature of
the transcripts.
The presence and intensity of both maternal and paternal Mez1 transcripts in the
embryo of heterozygous F1 plants resulting from reciprocal crosses indicated that Mez1
expression was bi-allelic in the embryo (Figure 1b). Similarly, the presence of both
maternal and paternal Mez2 transcripts was seen in heterozygous embryo tissue (Figure
1c). The expression pattern of Mez2 in the endosperm was very similar to the pattern
observed in the embryo. These findings indicated that Mez2 does not display allele-
specific expression patterns in these two genotypes and was not imprinted in these
tissues. In contrast, only the maternal allele of Mez1 was detected in the endosperm
tissue of heterozygous plants from reciprocal crosses (Figure 1b). This result indicates
that Mez1 is regulated by genomic imprinting in maize endosperm. Analysis of tissue
derived from other inbreds suggests that Mez3 does not display an imprinted pattern of
expression (Table 1).

26
Unlike many of the other imprinted genes detected to date in maize (e.g. R and B),
the presence of a reciprocal pattern of expression in both of the F1 heterozygotes
suggested that Mez1 imprinting is common to both inbred alleles, not to a specific allele
of only one inbred line. We proceeded to test for imprinting of Mez1, Mez2 and Mez3 in
a set of five different reciprocal crosses (Table 1). In some cases, specific genes were
non-polymorphic and the imprinting status could not be assessed. Mez1 was consistently
imprinted in the endosperm tissue of all crosses analyzed while neither Mez2 nor Mez3
were found to display imprinted expression. These data suggest that the imprinting of
Mez1 is not an allele-specific imprinting phenomenon but is an example of gene-specific
imprinting common to all alleles tested.
Confirmation of imprinting using Sequenom allele-specific expression assays. A
secondary technique was used to monitor allele-specific expression in endosperm tissues
derived from B73 x Mo17 crosses. Sequenom technology uses mass-spectrometry to
distinguish the primer extension products of two alleles and calculate the relative
proportion of the two alleles in a sample (Jurinke et al, 2005). Allele-specific assays
based on SNPs were developed for ZmFie1, Mez1, Zmet3 and Mez2. Previous studies
have documented imprinting for ZmFie1 (Danilevskaya et al, 2003), while there is no
previous evidence (or expectation) for Zmet3 to display an imprinted pattern of
expression (Cao et al, 2000). For Mez1, three separate assays that test the relative
frequency of distinct SNPs were developed. The fraction of transcripts derived from the
B73 allele were determined for B73 x Mo17 and Mo17 x B73 cDNA as well as mixes of
cDNA derived from B73 and Mo17 inbred lines (Figure 2a and 2b). The results from the
Sequenom analysis were fully consistent with maternal specific expression of Mez1 and

27
ZmFie1 in both 13 DAP (days after pollination) and 19 DAP endosperm tissue of maize.
As expected, Mez2 and Zmet3, display bi-allelic, non-imprinted patterns of gene
expression. Both of these genes display expression patterns consistent with the
maternal:paternal dosage ratios.
Mez1 imprinting is maintained throughout endosperm development. Results from
Vielle-Calzada et al (2000) suggest that the entire paternal genome of Arabidopsis
thaliana is transcriptionally inactive during early endosperm and embryo development.
Different genes showed different times of reactivation during endosperm and embryo
development. A similar observation has recently been made in maize (Grimanelli et al,
2005). Moreover, both ZmFie2 and Meg1 exhibit delayed reactivation of the paternal
allele (Danilevskaya et al, 2003; Gutierrez-Marcos et al, 2004). Expression from the
paternal allele of ZmFie2 is delayed 5-10 DAP relative to the maternal allele
(Danilevskaya et al, 2003). It is possible that the parent-of-origin effects on Mez1
expression we have observed in 13 DAP endosperm are due to delayed activation of the
paternal genome, not gene-specific imprinting regulation of the Mez1 locus. In order to
further explore the possibility that Mez1 expression may be due to a delayed activation of
the paternal genome, we determined the allele-specific expression of Mez1 at multiple
time points during endosperm development (Figure 3a and 3b). Only transcripts
corresponding to the maternal allele of Mez1 were detected in all endosperm tissue tested,
from 8 DAP until 27 DAP, suggesting that Mez1 shows imprinted expression throughout
seed development.
Allele-specific expression of Mez1 is not caused by allele-specific DNA degradation.
There is a formal possibility that allele-specific degradation (Yerk et al, 1993), or

28
sequence elimination of the paternal allele, not allele specific transcription, could cause
the presence of only maternal Mez1 transcripts. To test this possibility DNA was isolated
from endosperm tissue and intron primers were used to amplify the genomic sequence
surrounding the CAPS marker. Using PCR followed by restriction digestion we were
able to detect similar levels of DNA from both parental alleles throughout endosperm
development (Figure 3c). These results confirm the presence of both parental genomes
throughout maize endosperm development, indicating the silencing of the Mez1 paternal
allele is not the result of paternal allele degradation.
Sequence analysis of the Mez1 promoter. For the imprinted FWA gene, a SINE
transposable element located in FWA has been identified as an important cis-acting
determinant of imprinting regulation (Lippman et al, 2004). In contrast, transposons and
repeats found at the MEA locus, which show differential methyaltion patterns (Gehring et
al, 2006), are not required for imprinting (Spillane et al, 2004). To search for cis-acting
regulatory sequences mediating imprinting at the Mez1 locus, we obtained sequence
upstream of Mez1 through analysis of a BAC clone (b0165E14) containing the Mez1
gene. The Mez1 genomic sequence (AY422167) includes ~2.8kb of upstream sequence.
No known retrotransposons or other known repetitive sequences were identified in this
region. A simple sequence repeat SSR (containing 23 TA repeats) was found at bp -1662
to -1617.
Danilevskaya et al (2003) suggested that the presence of two CpG islands could
potentially be involved in “marking” a gene for imprinting in plants based on the
observation of two CpG islands in the ZmFie1 coding sequence. However, using the
same methods as Danilevskaya et al (2003), only a single CpG island, near the start of

29
transcription, was detected in the imprinted Mez1 sequence (Figure 1a). No other CpG
islands were detected in this sequence.
DNA methylation analysis of the Mez1 5’ upstream region. Bisulfite sequencing was
used to determine the methylation status of the Mez1 5’ proximal sequence. DNA was
isolated from B73 x Mo17 F1 hybrid endosperms and treated with sodium bisulfite which
results in the conversion of unmethylated cytosines to uracil but does not affect
methylated cytosines. A set of primers were used to amplify regions from the (TA)23
SSR through to the first exon of Mez1 (Figure 4a). In addition, primers that target the
region 5’ of the (TA)23 SSR and exon 9 near the middle of the Mez1 gene were also used.
In most cases the same primers could be used to amplify the B73 and Mo17 allele,
however for some regions we needed to design B73 and Mo17 specific primers due to
sequence polymorphisms. The resulting PCR products for each of these regions were
cloned and sequenced. For most of the regions, we were able to determine whether each
of the individual clones was maternally or paternally derived based upon B73/Mo17
polymorphisms. The relative level of maternal and paternal methylation is shown in
Figure 4b and 4c. There was very little methylation present in the sequences near the
transcription start site of Mez1. However, a 556bp differentially methylated region
(DMR) wass located from -677 to -1232bp relative to the transcription start site. This
region displayed very high levels of methylation in the CpG and CpNpG context, on the
paternal allele of Mez1, but low levels of methylation on the maternally inherited Mez1
alleles (Figure 4). In contrast, asymmetric cytosine residues showed very little
methylation for either maternal or paternal Mez1 alleles. There was no evidence for

30
differential methylation in the region 5’ of the (TA)23 SSR or in exon 9 of the Mez1 gene
(data not shown). These regions both displayed virtually no methylation.
A methylation-sensitive PCR assay, that determines the methylation status of a
methyl-sensitive BstUI site, was developed to confirm this differentially methylated
domain. Mock and BstUI digests were performed using genomic DNA from inbred and
reciprocal F1 hybrid endosperm tissue. PCR amplification was performed using the mock
and BstUI digested DNA to assess whether this site was methylated (amplification
following BstUI digest indicates that this site was methylated and protected from
digestion). In order to determine whether methylation was present on one or both of the
two alleles, the amplified DNA (representing the methylated fraction) was digested with
HaeIII which differentiates the B73 and Mo17 alleles (Figure 5a). The analysis of the
reciprocal F1 hybrid samples indicates that the paternal Mez1 allele is protected from
cleavage by BstUI and is therefore methylated (Figure 5a and 5b). The ability to amplify
both alleles following BstUI digestion from DNA isolated from F1 hybrid immature ear
tissue indicates bi-allelic methylation of this site in vegetative tissues (Figure 5). We also
tested for methylation at a second BstUI site that lacked methylation according to our
bisulfite analysis. The failure to amplify a product following BstUI digests of genomic
DNA confirms that lack of methylation at this site (data not shown).
Phylogenetic relationships of imprinted and non-imprinted E(z)-like genes. Maize
and Arabidopsis both contain three E(z)-like homologs (Springer et al, 2003). While
alignments and phylogenetic analyses based on the protein sequences of these genes
suggest that MEA is highly divergent, there is evidence that MEA is a relatively recent
duplicate of SWN (EZA1). This evidence is based upon the location of these two genes in

31
collinear regions of the Arabidopsis genome and phylogenetic analyses based upon
synonymous sequence changes (C. Spillane, S. Laouielle, K. Wolfe and U. Grossniklaus,
unpublished data). An alignment was performed beginning with the protein sequence
and then selecting a conserved region for performing DNA alignments for the maize,
Arabidopsis, rice, Sorghum and poplar E(z)-like genes. The DNA alignment was then
analyzed using MEGA to obtain a bootstrapped neighbor-joining tree based on
synonymous or non-synonymous changes (Figure 6). Interestingly, the two genes with
evidence for imprinting, MEA and Mez1, do not show close relationships with one
another. Instead, both genes are more closely related to genes that do not show an
imprinted pattern of gene expression.

32
DISCUSSION
Genomic imprinting is the differential expression of an allele dependent on which
parent it was inherited from. In plants, the verified instances of imprinting have
predominantly been documented in the triploid endosperm tissue. In Arabidopsis, the
best studied example of genomic imprinting is the MEA gene. MEA encodes an E(z)-like
SET domain protein. SET domain proteins are putative histone methyltransferases and
on the basis of sequence similarity and chromatin immunoprecipitation (ChIP) assays,
MEA most likely encodes a HistoneH3 lysine27 methyltransferase (Springer et al, 2003;
Gehring et al, 2006, Makarevich et al, 2006). The Arabidopsis genome contains two
closely related E(z)-like genes, CLF and SWN (EZA1) (Goodrich et al, 1997; Preuss et al,
1999). No genetic evidence for genomic imprinting has been observed for CLF and SWN
(C. Spillane and U. Grossniklaus, unpublished). We have previously characterized three
maize E(z)-like genes, Mez1, Mez2 and Mez3 (Springer et al, 2002). Here, we
demonstrate that the Mez1 gene is imprinted in maize endosperm whereas the Mez2 and
Mez3 genes exhibit bi-allelic expression. We further demonstrate that Mez1 is imprinted
in multiple genetic backgrounds, and therefore likely represents gene-specific, rather than
allele-specific imprinting.
cis-acting sequences that control imprinting
The identification of additional examples of imprinting in plants allows further
testing of the emerging models of imprinting regulation. Recent studies have
documented a role for DNA methylation in the control of imprinted gene expression
patterns (Xiao et al, 2003; Kinoshita et al, 2004; Gutierrez-Marcos et al, 2006; Jullien et
al, 2006; Vielle-Calzada et al, 1999; Luo et al, 2000). It has been proposed that allele-

33
specific loss of DNA methylation, induced by DME, plays a critical role in imprinting
(Gehring et al, 2006). We have documented the presence of bi-allelic methylation of a
region of the Mez1 5’ proximal sequence in vegetative tissues but mono-allelic
methylation patterns in the endosperm tissue. These findings are similar to those
described for MEA in Arabidopsis at late stages of seed development (Gehring et al,
2006).
An important unresolved question regarding imprinted gene expression revolves
around understanding the cis-acting sequences that determine imprinted expression. We
were able to compare the sequence of the Mez1 promoter, and specifically the DMR, with
the sequence of promoters of other imprinted genes in plants. In our analysis, we did not
detect any primary sequence motifs common to the promoters of the known imprinted
genes in Arabidopsis and maize. In addition, we did not detect the double CG-island
noticed by Danilevskaya et al, (2003) at the ZmFie1 locus. However, it is possible that
our search window of 2766 bp was too limited and needs to include more distal
sequences. In animals, some of the imprinting regulatory elements can occur at loci
>100kb distal from the transcribed region (Ferguson-Smith and Surani, 2001) and the
regulation of paramutation in maize can involve sequence over 100kb away from the
gene itself (Stam et al, 2002). Further experimentation is necessary to map the cis-acting
sequences responsible for the imprinted expression of Mez1.
The majority of examples of imprinting in plants share the common features of
maternal-specific expression in endosperm tissue. These imprinted genes can be divided
into two classes based on whether they are also expressed in other plant tissues. FWA,
ZmFie1 and Nrp1 are all imprinted in the endosperm and not expressed at detectable

34
levels in other plant tissues (Kinoshita et al, 1999; Guo et al, 2003; Danilevskaya et al,
2003). However, the MEA and Mez1 genes are expressed in vegetative tissues including
the embryo as well as in endosperm tissue. Assuming a plant imprinting model of DNA
methylation as the default state and allele-specific demethylation in the endosperm would
suggest that these genes might be methylated and expressed in vegetative tissues. Indeed,
there is evidence for bi-allelic methylation and expression of Mez1 in immature ear
tissue. It will be interesting to monitor the developmental time-course of DNA
methylation patterns for these genes and how this methylation affects their expression.
Future experiments will elucidate the role of DNA methylation and histone modifications
in controlling imprinting.

35
EXPERIMENTAL PROCEDURES
Plant materials. Maize inbred lines were grown using standard conditions. Leaf tissue
was harvested for DNA collections. Reciprocal crosses and self pollinations were
performed. The ears were harvested 7, 10, 13, 17, 20, 23 and 27 DAP. Endosperm and
embryo tissue was collected by dissection. Tissue derived from multiple kernels from the
same ear was pooled prior to performing RNA or DNA extractions.
Identification of SNPs for CAPS analysis. In order to monitor imprinting it was
necessary to identify polymorphisms within the coding regions of the Mez1, Mez2 and
Mez3 genes. A region corresponding to the 3’ coding region and UTR from Mez1 and
Mez3 was amplified and sequenced from a set of 24 maize inbred lines. DNA was
extracted from leaf tissue using the Qiagen Plant DNeasy plant mini kit (Valencia, CA)
according to the manufacturer’s instructions. PCR reactions were performed in a 30 µl
total volume containing approximately 50 ng of DNA, 5 pmol of each primer, 0.65 units
of HotStarTaq polymerase (Qiagen, Valencia, CA), 3 µl of 10X reaction buffer, and 0.2
µl of 25mM dNTPs. Primers used were mez1F33 and mez1R33 for Mez1; mez2_SF and
mez2_SR for Mez2; and mez3_SF and mez3_SR for Mez3. All primer sequences are
provided in Table 3. Conditions of the polymerase-chain-reaction were as follows: 94o
for 15’, 35 cycles of 94 o for 30”, 58o for 30”, 72o for 1’, followed by 72o for 10’.
For each of the three genes, we identified sequence polymorphisms that allowed
for the development of a Cleaved Amplified Polymorphism (CAPs) assay. Sequence
information from B73 and Mo17 identified a CAPS marker in Mez2. This CAPS marker
was used to classify the remaining inbred lines (Table 2). These CAPS assays can be

36
employed to detect the presence of both alleles in genomic DNA or cDNA samples. The
Mez1 and Mez2 CAPS assays rely upon a polymorphism in an AluI restriction site while
the Mez3 CAPS assays utilizes a polymorphisms in a HaeIII site.
CAPS analysis of allele-specific expression patterns. RNA was isolated from endosperm
and embryo tissue using the Qiagen RNeasy plant mini kit according to the
manufacturer’s instructions. Contaminating DNA was removed by digestions with RQ1
DNase (Promega, Madison, WI). 5 µg of total RNA was mixed with 0.5 µg oligo dT
(Promega) and heated to 70 o for 10 minutes followed by 1 minute on ice. First strand
cDNA synthesis was performed by adding 6 µl 5X reaction buffer, 0.5 µl RNasin, 3 µl
5mM dNTPs, and 1 µl M-MLV reverse transcriptase (Promega). This reaction was
incubated at 42 o for 50 minutes followed by 70 o for 15 minutes. The resulting cDNA
was purified by phenol: chloroform extraction and ethanol precipitation. The cDNA was
resuspended in 20 µl ddH2O. PCR reactions were performed as above and the amplified
DNA was ethanol precipitated and resuspended in 20 µl H2O. Restriction digestions
were performed by mixing 10 µl DNA, 2 µl 10X reaction buffer, 0.2 µl BSA, 2 µl AluI or
HaeIII and 5.8 µl H2O and incubating at 37 o overnight. The digested products were
separated by electrophoresis in a 2.5% Metaphor (FMC Bioproducts, Rockland, ME)
TBE gel and observed by ethidium bromide staining.
Analysis of genomic DNA CAPS markers. Genomic DNA was extraction from
endosperm tissue using the Qiagen Plant DNeasy plant mini kit (Valencia, CA) according
to the manufacturer’s instructions. PCR amplification was performed as above using the

37
primers mez1F20 and mez1R9 (Table 3). The amplified DNA was processed in the same
manner as the amplified cDNA products.
Mass spectrometry based analysis of allele-specific expression: RNAs from 13 and 19
DAP endosperm tissues were treated with DNAse prior to allele-specific expression
analyses. cDNAs were synthesized from all three biological replicates of Mo17xB73 and
B73xMo17 hybrid RNAs. Mixed cDNAs were also synthesized from 2:1, 1:1 and 1:2
mixes of the biological replicates of Mo17 and B73 inbred RNAs. The cDNAs were
reverse transcribed using Superscript III reverse transcriptase, according to the
manufacturer’s instructions (Invitrogen, Carlsbad, CA).
PCR-based assays for allele-specific expression analyses based on SNPs were
designed in collaboration with Sequenom (San Diego, CA). See table 3 for PCR and
extension primers for these assays. PCR and extension PCR reactions on cDNA and
DNA templates were performed using the manufacturer’s specifications (Sequenom, San
Diego, CA). Mass spectrometry quantification of allele ratios was performed at the
University of Minnesota Genotyping Facility. Multiple measurements of the ratio of the
two alleles were performed for each of the three biological replicates of mixed RNA and
F1 RNAs.
Bisulfite Sequencing. Endosperm tissue was dissected from B73×Mo17 and Mo17×B73
18 DAP kernels. DNA was isolated using the Qiagen DNeasy kit according to
manufacturer’s protocol. 2 µg of DNA was digested with 10 units BamHI and HindIII in
a volume of 100 µl at 37°C overnight. Digested DNA was extracted with

38
phenol:chloroform, precipitated with 100% ethanol supplemented with 2 µl tRNA and
resuspended in 20 µl H2O. DNA was denatured at 97°C for 1 minute, snap-cooled on ice
for 2 minutes and incubated with 1 µl 6.3M NaOH (freshly prepared) for 30 minutes at
39°C. 208 µl of bisulfite solution (40.5 g sodium bisulfite in 80 mls H2O with slow
stirring, pH to 5.1 with freshly prepared 10M NaOH , add 3.3 ml 20mM hydroquinone,
volume to 100 ml, protect from light) was added to DNA at 39°C. Samples were
incubated for 5 cycles of 55°C for 3 hours, 95°C for 5 minutes. Samples were cleaned-up
using Qiagen PCR Purification kit according to manufacturer’s protocol (eluted in 100 µl
EB). Added 5 µl 6.3M NaOH and incubated at 37°C for 15 minutes. DNA was
precipitated with 0.1 vol 10M NH4OAc, 3 volumes 100% ethanol and 2 µl tRNA
(resuspended in 100 µl Qiagen EB). 2 µl of bisulfite-treated DNA was used per PCR
reaction. PCR components were 4 µl dNTPs, 5 µl 10X ExTaq buffer, 1 µl reverse
primer, 38 µl H2O. Primers used were mez1BSr7-F5 and mez1BSr7-R9M, mez1BSr7-F5
and mez1BSr7-R9B, mez1BSr6-F3M and mez1BSr6-R8, mez1BSr6-F3B and
mez1BSr6-R8, mez1BSr5-F2M and mez1BSr5-R3, mez1BSr5-F2B and mez1BSr5-R3,
mez1BSr4-F7 and mez1BSr4-R10, mez1BSr3-F6 and mez1BSr3-R9M, mez1BSr3-F6
and mez1BSr3-R9B, mez1BSr2-F4M and mez1BSr2-R8, mez1BSr2-F4B and
mez1BSr2-R8 (Table 3). PCR conditions were as follows: 95°C for 5 minutes, added 1
µl ExTaq (Takara), ran 5 cycles of 95°C for 20”, 60°C for 3’, 72°C for 3’. Added 1 µl
forward primer, ran 10 cycles of 95°C for 20”, 60°C for 1.5’, 72°C for 2’. Ran 30 cycles
of 95°C for 20”, 50°C for 1.5’, 72°C for 2’, followed by 72°C for 10’. PCR products
were gel excised from a low-melting point agarose gel and extracted using the Qiagen
Gel Extraction kit according to manufacturer’s protocol (resuspended in 30 µl EB). 2 µl

39
of PCR product was cloned using TA TOPO Cloning kit (Invitrogen, Carlsbad, CA).
Plasmid DNA was isolated, insert size verified by PCR using M13F and M13R primers
and sequenced.
Bisulfite Verification: Genomic DNA was extracted as described above from B73, Mo17,
B73×Mo17, Mo17×B73 endosperm tissue and B73×Mo17 and Mo17×B73 immature ear
tissue. 500 ng of DNA of each tissue was digested with 10U BstUI or 1 µl glycerol
(mock digest) in a total volume of 40 µl at 60°C for four hours. The reaction was cleaned
up using a Qiagen PCR Purification kit according to manufacturer’s protocol (eluted with
50 µl EB). 4 µl of DNA was then PCR amplified as described above using mez1F55 and
mez1R52 primers (Table 3). PCR products were ethanol precipitated and resuspended in
30 µl H2O. DNA was then digested with 20 units HaeIII at 37°C for four hours. The
digested products were separated by electrophoresis in a 2.5% Metaphor TBE gel and
observed by ethidium bromide staining.
Sequence analysis. The amino acid and nucleic sequences for Mez1, Mez2, Mez2,
Sdg711, Sdg718, Medea, Clf, Eza1 and E(z) were aligned using ClustalX version1.83
(Thompson et al., 1997). These alignments were edited and the phylogenetic
relationships were analyzed using MEGA (Kumar et al., 2001). The neighbor joining
method was used and a bootstrap analysis with 500 replicates was performed. The Mez1,
MEDEA, ZmFie1 and Sdg711 promoter sequences were tested for the presence of CNSs
using the methods described by Kaplinsky et al (2002).

40
REFERENCES
Cao, X., Springer, N.M., Muszynski, M.G., Phillips, R.L., Kaeppler, S., Jacobsen, S.E. (2000)
Conserved plant genes with similarity to mammalian de novo DNA methyltransferases. Proc Natl
Acad Sci U S A, 97, 4979-84
Danilevskaya, O.N., Hermon, P., Hantke, S., Muszynski, M.G., Kollipara, K. and Ananiev, E.V.
(2003) Duplicated fie genes in maize: expression pattern and imprinting suggest distinct functions.
Plant Cell, 15, 425-438
Ferguson-Smith, A.C. and Surani, M.A. (2001) Imprinting and the epigenetic asymmetry between
parental genomes. Science, 293, 1086-1089
Gehring, M., Choi, Y. and Fischer, R.L. (2004) Imprinting and seed development. Plant Cell, 16 Suppl,
S203-13
Gehring, M., Huh, J.H., Hsieh, T.F., Penterman, J., Choi, Y., Harada, J.J., Goldberg, R.B. and
Fischer, R.L. (2006) DEMETER DNA glycosylase establishes MEDEA polycomb gene self-
imprinting by allele-specific demethylation. Cell, 124, 495-506
Goodrich, J., Puangsomlee, P., Martin, M., Long, D., Meyerowitz, E.M. and Coupland, G. (1997) A
Polycomb-group gene regulates homeotic gene expression in Arabidopsis. Nature, 386, 44-51
Grimanelli D., Perotti E., Ramirez J., Leblanc O. (2005) Timing of the maternal-to-zygotic transition
during early seed development in maize. Plant Cell, 17, 1061-1072
Grossniklaus, U., Vielle-Calzada, J.P., Hoeppner, M.A. and Gagliano, W.B. (1998) Maternal control of
embryogenesis by Medea, a polycomb group gene in Arabidopsis. Science, 280, 446-450
Grossniklaus, U. (2005) Genomic imprinting in plants: a predominantly maternal affair. In Plant
Epigenetics (Meyer, P, ed). Blackwell Publishing, pp 174-200
Guo, H. and Moose, S.P. (2003) Conserved noncoding sequences among cultivated cereal genomes
identify candidate regulatory sequence elements and patterns of promoter evolution. Plant Cell,
15, 1143-1158
Gutierrez-Marcos JF, Costa LM, Biderre-Petit C, Khbaya B, O'Sullivan DM, Wormald M, Perez P,
Dickinson HG (2004) maternally expressed gene1 Is a novel maize endosperm transfer cell-
specific gene with a maternal parent-of-origin pattern of expression. Plant Cell 16: 1288-1301
Gutierrez-Marcos JF, Costa LM, Dal Pra M, Scholten S, Kranz E, Perez P, Dickinson HG (2006)
Epigenetic asymmetry of imprinted genes in plant gametes. Nat Genet 38: 876-878
Jullien, P.E., Kinoshita, T., Ohad, N. and Berger, F. (2006) Maintenance of DNA methylation during
the Arabidopsis life cycle is essential for parental imprinting. Plant Cell, 18, 1360-72
Jurinke, C., Denissenko, M.F., Oeth, P., Ehrich, M., van den Boom, D. and Cantor, C.R. (2005) A
single nucleotide polymorphism based approach for the identification and characterization of gene
expression modulation using MassARRAY. Mutat Res, 573, 83-95

41
Kaplinsky, N.J., Braun, D.M., Penterman, J., Goff, S.A. and Freeling, M. (2002) Utility and
distribution of conserved noncoding sequences in the grasses. Proc Natl Acad Sci U S A, 99,
6147-6151
Kinoshita T., Yadegari R., Harada J.J., Goldberg R.B. and Fischer R.L. (1999) Imprinting of the
MEDEA polycomb gene in the Arabidopsis endosperm. Plant Cell, 10, 1945-1952
Kinoshita, T., Miura, A., Choi, Y., Kinoshita, Y., Cao, X., Jacobsen, S.E., Fischer, R.L. and
Kakutani, T. (2004) One-way control of FWA imprinting in Arabidopsis endosperm by DNA
methylation. Science, 303, 521-523
Kumar, S., Tamura, K., Jakobsen, I.B. and Nei, M. (2001) MEGA2: molecular evolutionary genetics
analysis software. Bioinformatics, 17, 1244-1245
Lippman, Z., Gendrel, A.V., Black, M., Vaughn, M.W., Dedhia, N., McCombie, W.R., Lavine, K.,
Mittal, V., May, B., Kasschau, K.D., Carrington, J.C., Doerge, R.W., Colot, V. and
Martienssen, R. (2004) Role of transposable elements in heterochromatin and epigenetic control.
Nature, 430, 471-6
Luo, M., Bilodeau, P., Dennis, E.S., Peacock, W.J. and Chaudhury, A. (2000) Expression and parent-
of-origin effects for FIS2, MEA, and FIE in the endosperm and embryo of developing Arabidopsis
seeds. Proc Natl Acad Sci U S A, 97, 10637-10642
Makarevich G., Leroy O., Akinci U., Schubert D., Clarenz O., Goodrich J., Grossniklaus U. and
Kohler C. (2006) Different Polycomb group complexes regulate common target genes in
Arabidopsis. EMBO rep, Jul 28; [Epub ahead of print]
Morison, I.M., Ramsay, J.P. and Spencer, H.G. (2005) A census of mammalian imprinting. Trends
Genet, 8, 457-65
Preuss, D. (1999) Chromatin silencing and Arabidopsis development: A role for polycomb proteins. Plant
Cell, 11, 765-768
Spillane C., Baroux C., Escobar-Restrepo J.M., Page D.R., Laoueille S. and Grossniklaus U. (2004)
Transposons and tandem repeats are not involved in the control of genomic imprinting at the
MEDEA locus in Arabidopsis. Cold Spring Harb Symp Quant Biol, 69, 465-475
Springer, N.M., Danilevskaya, O.N., Hermon, P., Helentjaris, T.G., Phillips, R.L., Kaeppler, H.F. and
Kaeppler, S.M. (2002) Sequence relationships, conserved domains, and expression patterns for
maize homologs of the polycomb group genes E(z), esc, and E(Pc). Plant Physiol, 128, 1332-
13345
Springer, N.M., Napoli, C.A., Selinger, D.A., Pandey, R., Cone, K.C., Chandler, V.L., Kaeppler, H.F.
and Kaeppler, S.M. (2003) Comparative analysis of SET domain proteins in maize and
Arabidopsis reveals multiple duplications preceding the divergence of monocots and dicots. Plant
Physiol, 132, 907-925

42
Stam, M., Belele, C., Ramakrishna, W., Dorweiler, J.E., Bennetzen, J.L. and Chandler, V.L. (2002)
The regulatory regions required for B' paramutation and expression are located far upstream of the
maize b1 transcribed sequences. Genetics, 162, 917-30
Thompson, J.D., Gibson, T.J., Plewniak, F., Jeanmougin, F. and Higgins, D.G. (1997) The ClustalX
windows interface: flexible strategies for multiple sequence alignment aided by quality analysis
tools. Nucleic Acids Research, 25, 4876-4882
Vielle-Calzada, J.P., Thomas, J., Spillane, C., Coluccio, A., Hoeppner, M.A. and Grossniklaus, U.
(1999) Maintenance of genomic imprinting at the Arabidopsis medea locus requires zygotic
DDM1 activity. Genes Dev, 13, 2971-2982
Wrzeska, M. and Rejduch, B. (2004) Genomic imprinting in mammals. J. Appl. Genet, 45, 427-433
Xiao W, Gehring M, Choi Y, Margossian L, Pu H, Harada JJ, Goldberg RB, Pennell RI, Fischer RL
(2003) Imprinting of the MEA Polycomb gene is controlled by antagonism between MET1
methyltransferase and DME glycosylase. Dev Cell 5: 891-901
Yerk, G.L., Phillips, R.L. and Kowles, R.V. (1993) Allele-specific degradation in endosperm
development. Maize Genetics Coop Newsletter, 67, 103-14

43
Table 1. Imprinting of Mez1, Mez2 and Mez3 in maize hybrids.
B73 X Mo17 A619 X W64a B84 X B57 Oh43 X IL14H B57 X B79Mez1 endosperm Imprinted Imprinted Imprinted Imprinted Not polymorphicMez2 endosperm Biallelic Biallelic Not polymorphicMez3 endosperm Not polymorphic Not polymorphic Biallelic Biallelic Biallelic
CROSSTISSUE

44
Inbred Line Mez1 (AluI )a Mez2 (AluI )b Mez3 (HaeIII )c
A619 N NA NAB57 N N YB73 Y Y YB75 N N YB77 Y N YB79 N Y NB84 Y Y N
H100 Y N YH95 N Y Y
HP301 Y Y YII14H Y Y YKi3 Y Y Y
Ky21 Y N YM37W Y Y YMo17 N N YMS71 N N YN7A N Y Y
NC358 Y Y YOh43 N Y NOh7B Y Y YP39 Y N Y
Pa91 Y Y YW64a Y NA NAVa26 N Y N
Table 2. Summary of CAPS markers for Mez1, Mez2 and Mez3 in 24 maize inbred lines. For each gene, the presence of the restriction enzyme recognition site is noted. Crossing an inbred line that contains the restriction site by an inbred line that does not contain the site will allow the two alleles to be distinguished in genomic DNA and cDNA.

45
→
Table 3. Primers used for PCR, bisulfite sequencing and Sequenom allele-specific expression assays.

Embryo
Endosperm
B73 BxM MxB Mo17
B73 BxM MxB Mo17
B73 BxM MxB Mo17
B73 BxM MxB Mo17
(b) Mez1Embryo
Endosperm
(c) Mez2
MW
MM
WM
MW
M
MW
M
CpGisland(a)
Figure 1
Figure 1. (a) Mez1 genomic structure. The black boxes indicate the position of exons. Above the sequence the position of a CpG island is indicated. The ‘*' indicates the Alu I CAPS marker in the last exon. (b,c) Allele-specific analysis of Mez1 and Mez2 expression patterns. (b) The allele specific expression of Mez1was monitored in the embryo and endosperm tissue derived from four genotypes; B73, B73 (female) × Mo17 (male), Mo17 (female) × B73 (male) and Mo17. The expression in the embryo is bi-allelic while the endosperm shows mono-allelic expression of the maternal allele. The first lane in each image is the molecular weight marker (MWM). (c) Mez2 allele-specific expression was monitored in the same samples. Mez2 is expression was bi-allelic in both embryo and endosperm tissues.
*
46

13DAP Endosperm
0
0.2
0.4
0.6
0.8
1
Dmt103 Mez2 Fie101 Mez1a Mez1b Mez1cFrac
tion
of tr
ansc
ript f
rom
B73
al
lele
BxM
MxB
M+2B
M+B
2M+B
19DAP Endosperm
0
0.2
0.4
0.6
0.8
1
Dmt103 Mez2 Fie101 Mez1a Mez1b Mez1cFrac
tion
of tr
ansc
ript f
rom
B73
al
lele
BxM
MxB
M+2B
M+B
2M+B
(b)
(a)
Figure 2. Analysis of allele-specific gene expression using primer extension. Sequenom assays (MALDI-TOF detection of SNP primer extension products) were designed for a B73/Mo17 SNPs in Zmet3, Mez2, ZmFie1 and three different SNPs in Mez1. (a) Allele-specific expression was performed using cDNAextracted from 13DAP endosperm tissue from B73×Mo17 and Mo17×B73crosses. In addition, we mixed cDNA extracted from B73 and Mo17 in a 1:1 (B+M), 1:2 (B+2M) and 2:1 (2B+M) ratio as controls to demonstrate linear detection of both alleles in endosperm tissue. (b) The same set of cDNA samples were also analyzed in 19DAP endosperm tissue.
Figure 2
47

Mo17 x B73 cDNA
B73 x Mo17 cDNA
B73 x Mo17 genomic DNA
(a)
(b)
(c)
Figure 3. Allele-specific expression of Mez1 during endosperm development. Endosperm tissue was harvested at different times during development and used for allele-specific analysis of Mez1. The first lane is derived from B73 homozygous endosperms at 13 DAP while the second lane is derived from Mo17 homozygous endosperms at 13 DAP. These lanes simply illustrate the expected patterns produced by mono-allelic expression of the B73 or Mo17 allele. (a) Analysis of Mez1 allele-specific expression in tissue harvested from a cross of Mo17 (female) × B73 (male) at 8, 10, 13, 17, 20, 23 and 27 days after pollination (DAP). (b) Tissue was harvested at the same time-points from a cross of B73 as the female by Mo17 as the male. (c) A different set of primers were used to amplify genomic DNA isolated at 8, 10, 13, 17, 20, 23 and 27 DAP to detect whether both alleles are present in the genomic DNA at all time points.
B73
Mo1
7
8 10 13 17 20 23 27
B73
Mo1
7
8 10 13 17 20 23 27
B73
Mo1
7
8 10 13 17 20 23 27DAP
Figure 3
48

100%
50%
0%
(b)
Maternal
2000-200-400-600-800-1000-1200
100%
50%
0%
(c)
Paternal
2000-200-400-600-800-1000-1200
(a)
Figure 4. Methylation status of the Mez1 promoter. DNA was isolated from B73 (female) × Mo17 (male) endosperm tissue, treated with sodium metabisulfite and PCR-amplified. The PCR products were cloned and sequenced to determine the methylation patterns of the forward strand of DNA.. In most cases, B73/Mo17 sequence polymorphisms allowed for the unambiguous determination of parent-of-origin for each bisulfite clone. (a) Diagram of the Mez1 promoter. The regions amplified by PCR and cloned are shown in orange, with the number of maternal and paternal clones analyzed shown above and below the line, respectively. The differentially methylated region (DMR) is outlined in red. The primers used for verification are shown as green arrows as well as the location of the BstUI site. (b, c) The percent methylation at each CpG (red), CpNpG (blue) and CpNpN (gray) is plotted for the maternal and paternal alleles. Cytosines for which no data was obtained are shown below the line.
ATG
2
BstUITA SSR
17
8
18 10
10
8
5 0
7
3
3
-500-1000-1500
Figure 4
49

B73 BxM MxB Mo17
EndospermMock
BxM MxB
Imm. Ear
(b) BstUI
B73 BxM MxB Mo17
EndospermBxM MxB
Imm. Ear
(c)
Figure 5. Confirmation of differential methylation in maternal and paternal alleles by methyl-sensitive PCR. In order to confirm the presence of differentialmethylation of the maternal and paternal alleles in the endosperm we employed a combination of methyl-sensitive PCR and CAPS analysis. (a) Primers that flank a BstUI site that is predicted to be methylated on the paternal allele and demethylated on the maternal alleles were used to perform PCR on mock digested and BstUI digested genomic DNA that was derived from homozygous and reciprocal heterozygous endosperm DNA samples. Following PCR amplification, the DNA was digested with HaeIII which has an additional site in the Mo17 allele that is absent in the B73 allele. (b) The mock digest shows that both alleles can be amplified and detected using this system. (c) Following digestion with BstUI we were able to determine that in the reciprocal hybrids only the paternal allele was protected from digestion and amplified. This result confirms the paternal specific methylation of this site. In addition, the same assays were performed using DNA isolated from immature ear tissue and provides evidence for bi-allelic methylation in vegetative tissues.
BstUI
Mo17
B73 HaeIII
HaeIII HaeIII
(a)
Figure 5
50

Organism
Arabidopsis
Maize
Sorghum
Maize
Rice
Arabidopsis
Poplar
Poplar
Poplar
Poplar
Arabidopsis
Rice
Maize
Sorghum
Imprinting status
No
No
N.D.
No
N.D.
Yes
N.D.
N.D.
N.D.
N.D.
No
N.D.
Yes
N.D.
Mez2
Sez2
Mez3
SDG718
SDG909
SDG913
SWN
MEA
CLF
SDG910
SDG916
SDG711
Mez1
Sez1100
100
100
100
100
99
95
81
0.05
Figure 6. Relationships among plant enhancer of zeste-like genes. A ~684bp nucleic acid sequence corresponding to bp 2085 to 2768 of the Mez1 (AF443596) coding sequence was aligned with the following sequences using ClustalX: Drosophila Enhancer of zeste (U00180), MEDEA (AF060485 ), CLF (Y10580), EZA1 (AF100163), Mez2 (AF443597), Mez3 (AF443598), Sdg711 (AP003044), Sdg718 (AF407010). The alignment was analyzed using neighbor-joining methods to analyze synonymous changes using MEGA version2.1. Bootstrap analysis was performed using 500 replicates and values for all nodes supported at greater than 80% are shown.
Figure 6
51
52
Chapter 3 Analysis of allele-specific chromatin modifications at imprinted
maize loci INTRODUCTION
Genomic imprinting is the differential regulation of gene expression based on the
parental inheritance. At imprinted loci, the primary DNA sequence of each parental
allele is nearly identical, yet only one parental allele is expressed. Imprinting is a unique
and rare form of gene regulation that is essential to the normal development of progeny in
both mammals and plants (Kono et al, 2002; Grossniklaus et al, 1998). Numerous genes
in both plant and animals have been identified as showing a mono-allelic (imprinted)
pattern of gene expression (Grossniklaus, 2005; Feil and Berger, 2007; Morison et al,
2005). Studies on mammalian imprinted genes have revealed a variety of molecular
mechanisms for both maternally and paternally imprinted genes (Edwards and Ferguson-
Smith, 2007). Several diseases in humans, such as Prader-Willi and Angelman
syndromes, have been linked to a disruption of imprinted gene regulation (da Rocha and
Ferguson-Smith, 2004).
Relative to the number of imprinted genes in animals, exploration for imprinted
genes in plants has revealed only a few examples of imprinted loci (Feil and Berger,
2007). Studies on the maternal-effect phenotypes of FIS-class (Fertilization Independent
Seed) mutant alleles helped identify the imprinted gene MEDEA (MEA) and others in the
model plant Arabidopsis thaliana (Grossniklaus et al, 1998; Kinoshita et al¸1999).
Through sequence homology, several genes in Zea mays have also been identified as
imprinted (Danilevskaya et al, 2003; Gutiérrez-Marcos et al, 2003; Haun et al, 2007). To

53
date, all examples of imprinting in plants have been identified in the triploid endosperm
tissue. Endosperm is a unique tissue found in seed-producing flowering plants and is
necessary for supplying nourishment to the developing embryo (Berger F, 2003).
Maternal inheritance of a mutant mea in Arabidopsis results in endosperm over-
proliferation and seed abortion (Köhler et al, 2003). Recent studies on several imprinted
genes in Arabidopsis have provided several clues into the mechanism of imprinting in
plants.
The imprinting mechanism in plants can be divided into three phases:
establishment, maintenance and interpretation. Based on work in Arabidopsis, a general
model has been formulated. Prior to gametogenesis, a DNA methyltransferase enzyme
(such as MET1 in Arabidopsis) establishes a DNA methylation ‘imprint’ at important
regulatory regions of imprinted loci (Jullien et al, 2006, Vielle-Calzada et al, 1999). In
the developing male gametophyte DNA methylation is maintained (Choi et al, 2002),
while in the female gametophyte DNA methylation is removed by the DNA glycosylase
DEMETER (Choi et al, 2002; Xiao et al, 2003; Choi et al, 2004; Gehring et al, 2006).
Following fertilization, interpretation of the hypomethylated state of the maternal alleles
results in expression, while the hypermethylated paternal allele remains silent (Xiao et al,
2003). Recent studies show the MEA protein is involved in controlling its own imprinted
expression (Baroux et al, 2006; Gehring et al, 2006). Using chromatin
immunoprecipitation (ChIP) on Arabidopsis floral tissue, the MEA protein was found to
localize to its own promoter (Baroux et al, 2006). Additionally, chromatin
immunoprecipitation studies in silique tissue suggested histone H3 lysine27
dimethylation was enriched at the paternal allele of MEA (Gehring et al, 2006). These

54
results are consistent with the predicted function of MEA, which encodes a SET domain
Polycomb group (PcG) protein similar to the Drosophila gene Enhancer of Zeste [E(z)]
(Grossnikauls et al, 1998). MEA, a class-I SET domain protein, is believed to methylate
histone H3 lysine27 residues (Springer et al, 2003). These results from Arabidopsis and
other evidence suggest DNA methylation is not acting alone to regulate imprinted gene
expression.
Numerous studies in both plants and mammals have identified the importance of
histone modifications in the regulation of development and imprinting (Li, 2002; Baroux
et al, 2007). Histone tails protruding from the core histones of eukaryotic chromatin can
be post-translationally modified with chemical moieties including acetylation,
methylation, phosphorylation, ubiquitylation and others (Peterson and Laniel, 2004).
Site-specific modifications of histones along with DNA methylation have been shown to
correlate with specific chromatin states and DNA-mediated processes (reviewed in
Grewal and Moazed, 2003; Peterson and Laniel, 2004). In the regulation of imprinting,
studies in mouse showed allele-specific histone modifications at the imprinting control
region of the mammalian imprinted gene IGF2R (Yang et al, 2003; Thanh et al, 2004)
The role of histone modifications in regulating imprinted genes in plants is poorly
understood. The small size and non-persistent nature of the Arabidopsis endosperm
tissue makes procedures, such as ChIP, for studying such marks extremely difficult.
Furthermore, chromatin immunoprecipitation protocols are designed primarily for
mammalian systems, adding to the logistical difficulties of performing ChIP in plants.
To date, there is no data on the histone modification patterns present at imprinted genes
in plant endosperm tissue. This study utilized a plant-specific nuclei preparation

55
technique to study the histone modifications of the imprinted genes Mez1 and ZmFie1 in
the endosperm tissue of Zea mays.
RESULTS
Confirmation of Chromatin Immunoprecipitation Protocol for Maize Endosperm.
Chromatin immunoprecipitation (ChIP) is a popular technique for studying
histone modification localization in numerous species. However, the use of ChIP to
monitor histone modifications has only recently been applied to the large, complex
genome of maize (Haring et al, 2007; Casati et al, 2008). In addition, there are no
published protocols for performing ChIP on starchy maize endosperm tissue. We
developed a novel ChIP protocol for maize endosperm based upon protocols from several
other groups (Nagaki et al, 2003; Upstate Biotech/Millipore, Billerica, MA) and refined
this protocol via experimentation. This ChIP protocol was applied to endosperm and
seedling tissue of maize. Approximately 4 g of endosperm tissue was dissected from 14
day after pollination (DAP) kernels derived from the cross of Mo17 × B73 (M×B).
Cross-linked chromatin was extracted from the pool of M×B endosperm tissue and
incubated with the antibodies described below. Chromatin was sonicated prior to
antibody incubation, resulting in an average fragment size of approximately 500bp (see
experimental procedure, data not shown). This resulted in a resolution of approximately
1000bp for localizing a particular histone modification to specific genomic location.
Several approaches were used to verify that the ChIPs were actually enriching for
the proper chromatin. Initially, regions of the GAPC and Actin genes as well as the
retrotransposon Copia were used to test for enrichment of activating and silencing

56
modifications, respectively. Actin and GAPC are ‘housekeeping’ genes that show
constitutive expression in most tissues. The chromatin structure near the 5’cis-proximal
region of these genes is expected to be enriched for HistoneH3 acetylation, a
modification representative of gene expression. On the other hand, the Copia
retrotransposon element is expected to be enriched for the silencing histone modification
H3K9 dimethylation (H3K9me2) (Haring et al, 2007). An antibody to the invariant core
HistoneH4 domain (provided by Judith Berman) was also used as a positive control and
to compare nucleasome occupancy. Quantitative Real-Time PCR was used to determine
the amount of immunoprecipitated chromatin relative to the amount of chromatin input
(Haring et al, 2007). Chromatin immunoprecipitations with an antibody to HistoneH4
showed enrichment relative to chromatin immunoprecipitations performed with a pre-
immuno IgG control for GAPC, Actin and Copia. (Figure 1). Both the GAPC and Actin
genes exhibited significant enrichment for H3 acetylation compared to the IgG control in
their 5’cis-proximal regions (Figure 1a & 1b). The silent Copia elements showed
evidence for enrichment of H3K9me2 as well as some, albeit lower, enrichment for H3
acetylation (Figure 1c). These results suggest that our chromatin immunoprecipitation
were enriching for the appropriate chromatin types.
Paternal-allele enrichment of ZmFie1 with a 5-methylcytosine antibody.
In this experiment, the levels of histone modifications present at the maternal and
paternal alleles of imprinted loci were compared. This requires the development of
assays that will allow quantification of the amount of maternal and paternal alleles in
immunoprecipitated chromatin. A series of quantitative single nucleotide polymorphism
(SNP) assays were developed using the MassArray technology (Jurinke et al, 2005). This

57
platform utilizes mass spectrometry to compare the relative abundance of single base
extension products. Prior to screening for histone modifications at imprinted loci in
maize, we attempted to verify that we could successfully monitor allele-specific
enrichment for a known chromatin modification. A previously identified region within
the ZmFie1 that is paternally enriched for DNA methylation was monitored (Hermon et
al, 2007). ZmFie1 was chosen in lieu of Mez1 due to lack of quantitative SNP assays
available within the differentially methylation region (DMR) of Mez1. Sonicated and
denatured chromatin from M×B endosperm tissue was incubated with a 5-methylcytosine
antibody and the immunoprecipitated DNA was subjected to quantitative SNP analyses.
The percentage of chromatin derived from the paternal allele was calculated for the 5-
methylcytosine and input samples for four SNPs in ZmFie1. One of these SNPs is 5’ of
the DMR; two are within the DMR and the fourth is within the coding region. In the
input DNA sample (no antibody), we detected 33% paternal alleles as expected due to the
1:2 ratio of paternal:maternal DNA in endosperm (Figure 2). The two SNPs within the
DMR of ZmFie1 showed evidence for enrichment of the paternal allele in three different
chromatin immunoprecipitations (Figure 2). However, the SNPs that are 5’ and 3’ of the
DMR did not show any paternal enrichment in chromatin that was precipitated with a 5-
methylcytosine antibody. These results indicate that a combination of our ChIP and
quantitative SNP assays can be used to investigate allele-specific histone modifications at
imprinted loci.
Parental allele-specific enrichment of histone modifications at Mez1 and ZmFie1.
The combination of ChIP and quantitative SNP assays were used to investigate
the allele-specific histone modifications present at the maize imprinted genes Mez1 and

58
ZmFie1. Chromatin immunoprecipitation reactions were performed using a series of
eight different antibodies as well as an IgG control. The antibodies that were used are
specific to H4, H3 acetylation, H4 acetylation, H3K4me2, H3K9me2, H3K9me3,
H3K27me2, and H3K27me3. Each antibody was used to perform at least two
immunoprecipitations (technical replications) on three different samples of chromatin
(biological replications). The technical replications were performed by doing multiple
chromatin immunoprecipitations from a pool of chromatin using the same antibody. The
biological replications were performed on different dates using different sources of
biological material. The immunoprecipitated chromatin was then used to perform
quantitative SNP assays in order to identify regions of imprinted genes with maternally
and/or paternally enriched histone modifications (Table 1).
Initially, the proportion of the maternal and paternal allele detected in input
chromatin and chromatin precipitated with an antibody that recognizes histone H4 was
compared (Figure 3). As expected, ~1/3 of the input chromatin was derived from the
paternal allele. In general, there was not consistent evidence for maternal or paternal H4
differences (Figure 3). One region of the Mez1 promoter (immediately 5’ of the
transcription start site) exhibited a minor enrichment for the paternal allele. The general
lack of maternal or paternal enrichment in H4-precipitated chromatin suggests that both
alleles have similar levels of histone occupancy.
The allele-specific enrichment for the seven histone modifications was scanned
throughout the Mez1 and ZmFie1 loci. There were three histone modifications with
strong evidence for parent-of-origin specific enrichment for Mez1 and ZmFie1. Histone
H3K27 trimethylation (H3K27me3) was paternally enriched in the 5’cis-proximal

59
regions of both imprinted genes (Figure 4). The paternal enrichment can be observed by
comparing the proportion of the paternal allele obtained from different
immunoprecipications with the H3K27me3 antibody with the proportion of the paternal
allele detected in input chromatin. The paternal alleles accounted for roughly 33% of the
input chromatin. However, in the 5’ proximal regions of Mez1 and ZmFie1, 40-70% of
the chromatin precipitated using H3K27me3 was derived from the paternal allele. In
addition, we noted a low level of paternal enrichment for H3K27me3 throughout the
coding region. This observation is due to the fact that nearly all quantitative SNP
measurements of H3K27me3 enriched chromatin exhibited values greater than 0.33. In
contrast, histone H3 and histone H4 acetylation were enriched in the 5’ coding region of
the maternal allele for both Mez1 and ZmFie1 (Figures 5 & 6). There was less evidence
for allele-specific differences in the level of the other four histone modifications (Figures
7 and 8). Histone H3K4 dimethylation (H3K4me2) showed a low level of maternal bias
throughout the coding region of Mez1 and ZmFie1 (Figures 7d and 8d). Histone H3K27
dimethylation (H3K27me2) exhibited a low level of paternal bias throughout the coding
regions of Mez1 and ZmFie1 (Figures 7a and 8a). There was no evidence for enrichment
of histone H3K9 dimethylation (H3K9me2) or histone H3K9 trimethylation (H3K9me3)
(Figure 7 and 8).
The immunoprecipitated chromatin was also used to determine whether allele-
specific chromatin modifications were detected at a third imprinted gene, Nrp1. A SNP
that is located 938bp 3’ of the transcription start site was used to detect maternal or
paternal enrichment (Figure 9). Nrp1 exhibited patterns of maternal and paternal histone
modifications that were similar to Mez1 and ZmFie1. Chromatin precipitated with H3

60
acetylation or H4 acetylation antibodies was consistently enriched for the maternal allele.
In contrast, chromatin precipitated with H3K27me2 or H3K27me3 was enriched for the
paternal allele. In general, the three imprinted loci all exhibited similar patterns of allele-
specific histone modifications (Table 1).
Dynamics of allele-specific histone modifications at imprinted loci.
We focused on the regions and modifications that were identified in our scan of
Mez1 and ZmFie1 to determine whether these modifications were consistent in both B73
x Mo17 and Mo17xB73 reciprocal hybrids. In addition, the level of allele-specific
enrichment was tested in seedling tissue where these genes are not imprinted. The two
reciprocal hybrids show very similar patterns of maternal enrichment for histone
acetylation and paternal enrichment for H3K27me3 in the 5’ proximal regions of Mez1
and ZmFie1 (Figure 10). This suggests that these modifications are associated with the
parental origin of the allele and are not specific to the B73 or Mo17 allele. There was no
evidence for maternal or paternal enrichment of these histone modifications in seedling
tissue (data not shown). The seedling data exhibited a higher level of variation in the
allele-specific data. This may be due to the fact that very little chromatin was
precipitated and the quantitative SNP assays are known to exhibit higher levels of
variation when used with low levels of starting material.
Quantitative PCR analyses were used to monitor enrichment at three different
regions of the Mez1 locus (Figure 11). The quantitative real-time PCR analysis can
indicate the presence of absence of a modification but does not allow partitioning of the
modification as maternal or paternal. As expected, the three regions showed evidence for
the presence of H4. This confirmed that the immunoprecipitation successfully enriched

61
for chromatin. In the region that is 5’ of the DMR we observed significant enrichment
for H3K27me3 but no evidence for H3 or H4 acetylation (Figure 11a). The second
region, very near the transcription start site, exhibited evidence for H3K27me3 and
histone acetylation (Figure 11b). The quantitative SNP analyses within this same region
suggested that the H3K27me3 is present on the paternal allele while the H3 and H4
hyperacetylation occurs on the maternal allele. The region within the Mez1 coding
sequence does not show enrichment for H3K27me3 or histone acetylation (Figure 11c).
There was no evidence for maternal or paternal enrichment for this region in the
quantitative SNP analyses.
DISCUSSION
Imprinted gene expression is a unique epigenetic phenomenon wherein a cell is
able to differentiate between two nearly identical parental alleles in the same nucleus and
regulate their expression differently. DNA methylation and histone modifications
represent two known mechanisms by which epigenetic regulation can occur. A series of
studies have documented differential DNA methylation of the maternal and paternal
alleles of imprinted plant genes (reviewed in Huh et al, 2007). However, there is very
little data on histone modifications at imprinted genes. There is one published report that
indicates that H3K27me3 is enriched at the paternal allele of Mea in Arabidopsis floral
tissue (Gehring et al, 2006). In this study we were able to classify certain histone
modifications as either paternally enriched or maternally enriched in the regulatory and
coding regions of three maize imprinted genes, Mez1, ZmFie1 and Nrp1. The three genes
exhibited very similar patterns of histone modification enrichment, suggesting a role for

62
histone modifications in imprinted gene regulation in plants. We will discuss our results
in the context of describing the chromatin state for the paternal and maternal alleles of
imprinting genes. The generic view of chromatin at an imprinted maize gene is
illustrated in Figure 12.
Histone modifications present at the silenced paternal allele of imprinted loci.
Many studies have identified higher levels of DNA methylation at the silent
paternal allele of imprinted genes (reviewed in Huh et al, 2007). Indeed, our lab has
found a region of the Mez1 locus that exhibits paternal specific DNA methylation (Haun
et al, 2007). Similarly, two studies have identified paternal specific DNA methylation at
ZmFie1 (Gutierrez-Marcos et al, 2006; Hermon et al, 2007). In this study we were able
to identify a second epigenetic mark present on the paternal allele of imprinted loci.
H3K27me3 is significantly paternally enriched in the 5’cis-proximal regions of Mez1 and
ZmFie1. In both cases, the region of paternal enrichment is primarily observed in the cis-
regulatory regions that are immediately 5’ of the transcription start site. For ZmFie1, this
region of H3K27me3 enrichment appears to terminate near the transcription start site and
extend at least 2 kb upstream. Our ability to better define the region of enrichment at
Mez1 is obscured by the lack of suitable SNP assays from -500bp to -3000bp. This
region includes the previously identified differentially methylated region (DMR) and
would be good candidate for the localization of additional silencing marks (such as
H3K27me3). Indeed, real-time PCR results indicated enrichment of H3K27me3 in a
region 5’ to the DMR. Taken together, these results suggest the region for paternal
enrichment of H3K27me3 at Mez1 terminates approximately 1kb into the coding region
and extends 5’ at least 2.5kb. A SNP assay at position -3243bp shows no paternal

63
enrichment for H3K27me3 (data not shown), indicating the boundary for paternal
enrichment of H3K27me3 is between -1500bp and -3243 bp. We observed minor levels
of paternal enrichment for H3K27me2 and H3K27me3 in the coding regions of Mez1 and
ZmFie1. However, real-time PCR analyses do not provide evidence for significant levels
of this modification in these regions.
The presence of a region of H3K27me3 was predicted in Arabidopsis. Genetic
studies suggested that a functional maternal allele of MEA was important for silencing of
the paternal MEA allele (Jullien et al, 2006). The MEA protein was shown to be present
at the chromatin of the paternal MEA allele (Baroux et al, 2006). Based upon homology
with Drosophila and mammalian proteins with known biochemical activity (Müller et al,
2002; Nakayama et al, 2001), MEA and Mez1 are both expected to encode H3K27
histone methyltransferase. In this study, we were able to find evidence for enriched
H3K27me3 near the promoter of several imprinted maize genes. This suggests that the
maternally produced MEZ1 protein may be involved in methylating histones at the
paternal alleles of Mez1, ZmFie1 and Nrp1.
Interestingly, there is no evidence for paternal enrichment of H3K9me2 or
H3K9me3. Those modifications are typically associated with gene repression (Peterson
and Laniel, 2004), most notably repression of repetitive elements (Jackson et al, 2004).
We did identify enrichment for H3K9me2 in the Copia retrotransposon sequence (Figure
1). This data suggests that the histone modifications associated with the dynamic process
of imprinting are specific to H3K27me3. In contrast, H3K9 methylation is used to form
constitutive heterochromatin for the silencing of repetitive elements, such as Copia.
Histone modifications present at the active maternal allele of imprinted loci.

64
The scan of histone modifications also included several modifications, such as H3
acetylation, H4 acetylation and H3K4me2 that are generally found at actively transcribed
regions (Peterson and Laniel, 2004). The three imprinted maize genes all exhibited
maternal enrichments for H3 and H4 acetylation in the coding regions. For Mez1, the
region of maternal enrichment for histone acetylation begins around the transcription start
site and extends for several thousand base pairs into the coding region. For ZmFie1, a
lack of suitable SNP assays in the coding region does not allow for a thorough analysis of
the region for maternal-specific histone acetylation enrichment. However, there is strong
evidence the enriched histone acetylation region begins near the transcription start site.
The coding region of Nrp1 also shows maternal enrichment of histone acetylation. It is
interesting that the maternal enrichment is much stronger near the 5’ end of the transcript
than at the 3’ end of the transcripts. This could reflect a greater requirement of histone
acetylation for the efficient initiation of transcription and a lower requirement for
elongation / termination. The other activating modification, H3K4me2, exhibited a slight
bias towards the maternal allele in the coding regions of Mez1 and ZmFie1 but not in
Nrp1. The level of maternal enrichment for H3K4me2 is less pronounced than that
observed for H3 and H4 acetylation.
This study provides a survey of the chromatin modifications that are present at
imprinted loci in plants. The maternal and paternal alleles differ in their levels of histone
H3K27 methylation, histone H3 and H4 acetylation and DNA methylation. It is likely
that these modifications are important in establishing and maintaining the imprinted state
of these loci. Indeed, a reverse-genetic screen of chromatin modifying enzymes has
identified several histone deacetyltransferases and histone methyltransferases that are

65
required for proper imprinting of Mez1 (data not shown). This suggests that the histone
methylation and acetylation are actually required components of the imprinting
mechanisms in maize. The combination of the biochemical tools developed in this study
and genetics lines with impaired imprinting is likely to shed light and the interplay of
chromatin modifications and imprinting.

66
Experimental Procedures
Plant Material. Maize inbred lines were grown at the Minnesota Agricultural experiment
station (Saint Paul, MN) during the summer of 2007. Reciprocal crosses between the
inbred lines B73 and Mo17 were performed to generate hybrid endosperm tissue. Ears
were harvested at 14 and 24 days after pollination (DAP). Endosperm tissue (1-2 g,
approximately 30-40 endosperms) from individual Mo17×B73 and B73×Mo17 ears was
collected by dissection. Tissue derived from multiple kernels from the same ear was
pooled prior to crosslinking (see ChIP procedure below). Etiolated seedling tissue was
generated from Mo17×B73 and B73×Mo17 seeds grown in the dark at 30°C for 10 days.
Above-ground tissue was harvested and washed with water prior to performing ChIPs.
Chromatin Immunoprecipitation (ChIP). Crosslinking: Fresh endosperm and etiolated
seedling tissue was completely submerged in 40 ml of fresh prepared 1% (v/v)
formaldehyde. A vacuum was applied for 2 minutes, released and reapplied for an
additional 8 minutes. 1 volume (40 ml) of 0.25M glycine was added to quench any
unreacted formaldehyde. A vacuum was applied for 1 minute, released and reapplied for
an additional 4 minutes. The formaldehyde/glycine solution was discarded and tissue
was washed five times with water. Tissue was frozen in liquid nitrogen and ground to a
fine powder. Nuclei Extraction: All buffers were made fresh and kept on ice unless
otherwise indicated. PMSF or plant protease inhibitors were added to appropriate
solutions immediately prior to use. Powderized tissue was suspended in 10 ml nuclei
extraction buffer [10mM Tris-HCl pH 7.5, 3mM CaCl2, 2mM MgCl2, 0.1mM PMSF
(Sigma, P7626), 1 tablet complete mini per 50 ml buffer (Roche, #11836153001), 1%

67
(v/v) plant protease inhibitors (Sigma, P9599), 0.5% (v/v) Tween 40 (Sigma, P1504)]
and gently inverted to completely resuspend frozen tissue. The solution was filtered
through Miracloth (Calbiochem, # 475855) into a 50 ml tube on ice. Samples were spun
at 600xg in a swing-bucket type centrifuge for 10 minutes at 4°C. The supernatant was
discarded and pellet was resuspended in 5 ml nuclei extraction buffer containing 25%
(w/v) sucrose. With a cut tip, resuspended nuclei were pipeted on top of 5 ml nuclei
extraction buffer containing 50% (w/v) sucrose in a fresh 50 ml tube. The solution was
pipeted carefully down the wall of the tube to layer the 25% sucrose solution on top of
the 50% sucrose solution. Samples were spun at 1500xg in a swing-bucket type
centrifuge for 10 minutes at 4°C. The supernatant was removed with a pipet and nuclei
in pellet was mixed with 1.5 ml SDS lysis buffer [50mM Tris-HCl pH 8.0, 10mM EDTA,
1% (w/v) SDS, 0.1mM PMSF, 1% (v/v) plant protease inhibitors] and gently
resuspended. Lysate was stored on ice for 20 minutes to facilitate complete nuclei lysis.
750 µl was aliquoted into two fresh 1.5 ml tubes and kept on ice prior to sonication.
Sonication. Samples were sonicated with nine 10 second pulses (the exact number of 10s
pulses is species and tissue-specific) on a Heat Systems-Ultrasonics sonicator set at 30%
duty cycle, power setting 2. Samples were kept on ice during sonication and for 1 minute
between each 10 second pulse. Samples were spun at 12,000xg at 4°C for 10 minutes
and the supernatant containing sonicated chromatin was transferred to a fresh 1.5 ml tube.
Assessing Sonication Efficiency: A 48 µl aliquot of sonicated chromatin was removed
and mixed with 48 µl water and 4 µl 5M NaCl. Samples were incubated at 65°C
overnight. Samples were then incubated with 1 µl RNAse A at 37°C for 30 minutes.
DNA was extracted with 1 volume phenol:chloroform followed by ethanol precipitation

68
supplemented with 2 µl glycogen (Roche, 10901393001) and 10 µl 3M sodium acetate.
DNA in samples were quantified using a NanoDrop ND-1000 Spectrophotometer
(NanoDrop; Wilmington, DE) and analyzed on a 2% agarose gel. Immunoprecipitation:
For each immunoprecipitation, 100 µl of sheared, crosslinked chromatin was added to a
fresh 1.5 ml tube (this resulted in ~7 µg of DNA per immunoprecipitation for endosperm
tissue and ~4 µg of DNA per immunoprecipitation for etiolated seedling tissue). To each
sample 900 µl of ChIP dilution buffer [16.7mM Tris-HCl pH 8.0, 167mM NaCl, 1.2mM
EDTA, 0.01% (w/v) SDS, 1.1% (v/v) Triton X-100 (Sigma, #234729)] with 10 µl plant
protease inhibitors. Chromatin was precleared by adding 60 µl protein A agarose
(Upstate, #16-157) and incubated at 4°C for 1 hour on a rotating platform. Protein A
agarose was pelleted by centrifugation at 4000xg for l minute. 10% of the supernatant
was removed as the ‘input’ sample and stored at 4°C. The remaining supernatant was
transferred to fresh 1.5 ml tube and the appropriate antibody was added (Table 2).
Chromatin/antibodies were incubated overnight at 4°C on a rotating platform. To
immunoprecipitate bound chromatin, 60 µl protein A agarose was added to each sample
and incubated for 1 hour at 4°C on a rotating platform. Protein A agarose was pelleted
by centrifugation at 4000xg for l minute and the supernatant was removed without
disturbing pellet. Protein A agarose/antibody/chromatin immunocomplexes were washed
in the following buffers for 5 minutes at 4°C on a rotating platform followed by
centrifugation at 4000xg for l minute and careful removal of supernatant. One wash in
low salt immune complex wash buffer [20mM Tris-HCl pH 8.0, 150mM NaCl, 2mM
EDTA, 0.1% (w/v) SDS, 1% (v/v) Triton X-100]. One wash in high salt immune
complex wash buffer [20mM Tris-HCl pH 8.0, 500mM NaCl, 2mM EDTA, 0.1% (w/v)

69
SDS, 1% (v/v) Triton X-100]. One wash in LiCl immune complex wash buffer [20mM
Tris-HCl pH 8.0, 500mM NaCl, 2mM EDTA, 0.1% (w/v) SDS, 1% (v/v) Triton X-100].
Two washes in TE wash buffer [10mM Tris-HCl, 1mM EDTA, pH 8.0]. Following the
final wash, DNA was eluted from the protein A agarose beads with ChIP elution buffer
[100mM NaHCO3, 1% (w/v) SDS]. 100 µl ChIP elution buffer was added to pelleted
protein A agarose and incubate at room temperature for 15 minutes on a rotating
platform. Samples were centrifuged at 4000xg for l minute and careful removal of
supernatant to fresh 1.5 ml tube. The elution step was repeated a second time and the
eluted samples were combined for a final volume of ~200 µl. Precipitating ChIP DNA:
Eluted DNA was cleaned-up with 1 volume (200 µl) phenol:chloroform, followed by
ethanol precipitation supplemented with 2 µl glycogen and 20 µl 3M sodium acetate.
Pellet was resuspended in 100µl 10mM Tris.
Real-Time PCR Analysis. Prior to performing ChIP allele-specific SNP assays, real-time
PCR was performed to verify enrichment of DNA in antibody samples compared to no-
antibody (IgG) controls (Figure 1). Real-time PCR was performed using Applied
Biosystems’ SYBR Green PCR Master Mix (Foster City, CA, USA) in a 20 µl reaction
according to manufacturer’s protocol. 2 µl of immunoprecipitated DNA was amplified
using an Applied Biosystems 7900HT Real-Time PCR System. A 2-fold dilution series
(undiluted, 1:2, 1:4, 1:8 and 1:16 dilutions) calibration line was made from crosslinked,
sonicated chromatin. DNA for the calibration line was purified using phenol:chloroform
followed by ethanol precipitation supplemented with 1 µl glycogen (see above). Primers
were designed to amplify the second exon of the maize actin1 gene (Genbank #J01238),

70
the reverse-transcriptase coding region of the TY1 class retrotransposon copia (Genbank
#J01238), and the 5’ cis-proximal promoter region of maize the GAPDH gene (Genbank
# X15596). All primer sequences are provided in Table 3. For each experiment, no-
template controls, no-antibody controls and input samples were analyzed for every primer
set. Cycle threshold (Ct) values were obtained for each sample and a linear regression
line was fit to the calibration samples (log10 template (ng) vs Ct). Using the equation
from the calibration line, the amount of starting template DNA for each input and
antibody sample was calculated. A percentage of input (%IP) was then calculated for
each antibody sample to determine relative enrichment. Melting curve analysis was also
performed to verify only single amplicons were formed during the assay for all primers
sets tested (data not shown). Real-time PCR experiments were also performed using the
technique described above on immunoprecipitated DNA to measure overall enrichment at
certain genetic loci (Figure 11). A percent of input (%IP) was calculated as described
above. Relative enrichment for each antibody was calculated by dividing the %IP for
IgG from every sample. Primers for the regions of Mez1 analyzed are provided in table
3.
Quantitative SNP Assays. Immunoprecipitated DNA from the ChIP procedure above was
the template for a PCR-based allele-specific enrichment analysis based on SNPs. PCR
and extension primers (see Table 3) for these assays were designed in collaboration with
Sequenom (San Diego, CA) based on known SNP polymorphisms within the imprinted
genes. PCR reactions on ChIP and ‘input’ DNA samples were performed using the
manufacturer’s specifications (Sequenom, San Diego, CA). Mass spectrometry
quantification of parental allele ratios was performed at the University of Minnesota

71
Genotyping Facility. Five control DNA samples were processed along with ChIP
samples. 4:1 (and 1:4) control samples were mixed from individual B73 and Mo17 leaf
DNA samples. BxM and MxB hybrid endosperm DNA was used as the 2:1 (and 1:2)
control samples and BxM hybrid leaf DNA was used as the 1:1 control. Control samples
were replicated three times for each SNP assay.

72
REFERENCES
Baroux C, Gagliardini V, Page DR, Grossniklaus U (2006) Dynamic regulatory interactions of
Polycomb group genes: MEDEA autoregulation is required for imprinted gene expression in
Arabidopsis. Genes Dev 20: 1081-1086
Baroux C, Pien S, Grossniklaus U (2007) Chromatin modification and remodeling during early seed
development. Curr Opin Genet Dev
Berger F (2003) Endosperm: the crossroad of seed development. Curr Opin Plant Biol 6: 42-50
Casati P, Campi M, Chu F, Suzuki N, Maltby D, Guan S, Burlingame AL, Walbot V (2008) Histone
Acetylation and Chromatin Remodeling Are Required for UV-B-Dependent Transcriptional
Activation of Regulated Genes in Maize. Plant Cell
Choi Y, Gehring M, Johnson L, Hannon M, Harada JJ, Goldberg RB, Jacobsen SE, Fischer RL
(2002) DEMETER, a DNA glycosylase domain protein, is required for endosperm gene
imprinting and seed viability in arabidopsis. Cell 110: 33-42
Choi Y, Harada JJ, Goldberg RB, Fischer RL (2004) An invariant aspartic acid in the DNA glycosylase
domain of DEMETER is necessary for transcriptional activation of the imprinted MEDEA gene.
Proc Natl Acad Sci U S A 101: 7481-7486
da Rocha ST, Ferguson-Smith AC (2004) Genomic imprinting. Curr Biol 14: R646-9
Danilevskaya ON, Hermon P, Hantke S, Muszynski MG, Kollipara K, Ananiev EV (2003) Duplicated
fie genes in maize: expression pattern and imprinting suggest distinct functions. Plant Cell 15:
425-438
Edwards CA, Ferguson-Smith AC (2007) Mechanisms regulating imprinted genes in clusters. Curr Opin
Cell Biol 19: 281-289
Feil R, Berger F (2007) Convergent evolution of genomic imprinting in plants and mammals. Trends
Genet 23: 192-199
Gehring M, Huh JH, Hsieh TF, Penterman J, Choi Y, Harada JJ, Goldberg RB, Fischer RL (2006)
DEMETER DNA glycosylase establishes MEDEA polycomb gene self-imprinting by allele-
specific demethylation. Cell 124: 495-506
Grewal SI, Moazed D (2003) Heterochromatin and epigenetic control of gene expression. Science 301:
798-802
Grossniklaus U, Vielle-Calzada JP, Hoeppner MA, Gagliano WB (1998) Maternal control of
embryogenesis by MEDEA, a polycomb group gene in Arabidopsis. Science 280: 446-450
Grossniklaus, U. (2005) Genomic imprinting in plants: a predominantly maternal affair. In Plant
Epigenetics (Meyer, P, ed). Blackwell Publishing, pp 174-200

73
Gutierrez-Marcos JF, Pennington PD, Costa LM, Dickinson HG (2003) Imprinting in the endosperm: a
possible role in preventing wide hybridization. Philos Trans R Soc Lond B Biol Sci 358: 1105-
1111
Haring M, Offermann S, Danker T, Horst I, Peterhansel C, Stam M (2007) Chromatin
immunoprecipitation: optimization, quantitative analysis and data normalization. Plant Methods 3:
11
Haun WJ, Laoueille-Duprat S, O'connell MJ, Spillane C, Grossniklaus U, Phillips AR, Kaeppler SM,
Springer NM (2007) Genomic imprinting, methylation and molecular evolution of maize
Enhancer of zeste (Mez) homologs. Plant J 49: 325-337
Hermon P, Srilunchang KO, Zou J, Dresselhaus T, Danilevskaya ON (2007) Activation of the
imprinted Polycomb Group Fie1 gene in maize endosperm requires demethylation of the maternal
allele. Plant Mol Biol 64: 387-395
Huh JH, Bauer MJ, Hsieh TF, Fischer R (2007) Endosperm gene imprinting and seed development. Curr
Opin Genet Dev 17: 480-485
Jullien PE, Katz A, Oliva M, Ohad N, Berger F (2006) Polycomb group complexes self-regulate
imprinting of the Polycomb group gene MEDEA in Arabidopsis. Curr Biol 16: 486-492
Jurinke C, Denissenko MF, Oeth P, Ehrich M, van den Boom D, Cantor CR (2005) A single
nucleotide polymorphism based approach for the identification and characterization of gene
expression modulation using MassARRAY. Mutat Res 573: 83-95
Kinoshita T, Yadegari R, Harada JJ, Goldberg RB, Fischer RL (1999) Imprinting of the MEDEA
polycomb gene in the Arabidopsis endosperm. Plant Cell 11: 1945-1952
Kohler C, Hennig L, Spillane C, Pien S, Gruissem W, Grossniklaus U (2003) The Polycomb-group
protein MEDEA regulates seed development by controlling expression of the MADS-box gene
PHERES1. Genes Dev 17: 1540-1553
Kono T, Sotomaru Y, Katsuzawa Y, Dandolo L (2002) Mouse parthenogenetic embryos with
monoallelic H19 expression can develop to day 17.5 of gestation. Dev Biol 243: 294-300
Li E (2002) Chromatin modification and epigenetic reprogramming in mammalian development. Nat Rev
Genet 3: 662-673
Morison IM, Ramsay JP, Spencer HG (2005) A census of mammalian imprinting. Trends Genet 21: 457-
465
Muller J, Hart CM, Francis NJ, Vargas ML, Sengupta A, Wild B, Miller EL, O'Connor MB,
Kingston RE, Simon JA (2002) Histone methyltransferase activity of a Drosophila Polycomb
group repressor complex. Cell 111: 197-208
Nagaki K, Talbert PB, Zhong CX, Dawe RK, Henikoff S, Jiang J (2003) Chromatin
immunoprecipitation reveals that the 180-bp satellite repeat is the key functional DNA element of
Arabidopsis thaliana centromeres. Genetics 163: 1221-1225
74
Nakayama J, Rice JC, Strahl BD, Allis CD, Grewal SI (2001) Role of histone H3 lysine 9 methylation
in epigenetic control of heterochromatin assembly. Science 292: 110-113
Peterson CL, Laniel MA (2004) Histones and histone modifications. Curr Biol 14: R546-51
Springer NM, Napoli CA, Selinger DA, Pandey R, Cone KC, Chandler VL, Kaeppler HF, Kaeppler
SM (2003) Comparative analysis of SET domain proteins in maize and Arabidopsis reveals
multiple duplications preceding the divergence of monocots and dicots. Plant Physiol 132: 907-
925
Tamaru H, Selker EU (2001) A histone H3 methyltransferase controls DNA methylation in Neurospora
crassa. Nature 414: 277-283
Vielle-Calzada JP, Thomas J, Spillane C, Coluccio A, Hoeppner MA, Grossniklaus U (1999)
Maintenance of genomic imprinting at the Arabidopsis medea locus requires zygotic DDM1
activity. Genes Dev 13: 2971-2982
Xiao W, Gehring M, Choi Y, Margossian L, Pu H, Harada JJ, Goldberg RB, Pennell RI, Fischer RL
(2003) Imprinting of the MEA Polycomb gene is controlled by antagonism between MET1
methyltransferase and DME glycosylase. Dev Cell 5: 891-901
Yang Y, Li T, Vu TH, Ulaner GA, Hu JF, Hoffman AR (2003) The histone code regulating expression
of the imprinted mouse Igf2r gene. Endocrinology 144: 5658-5670
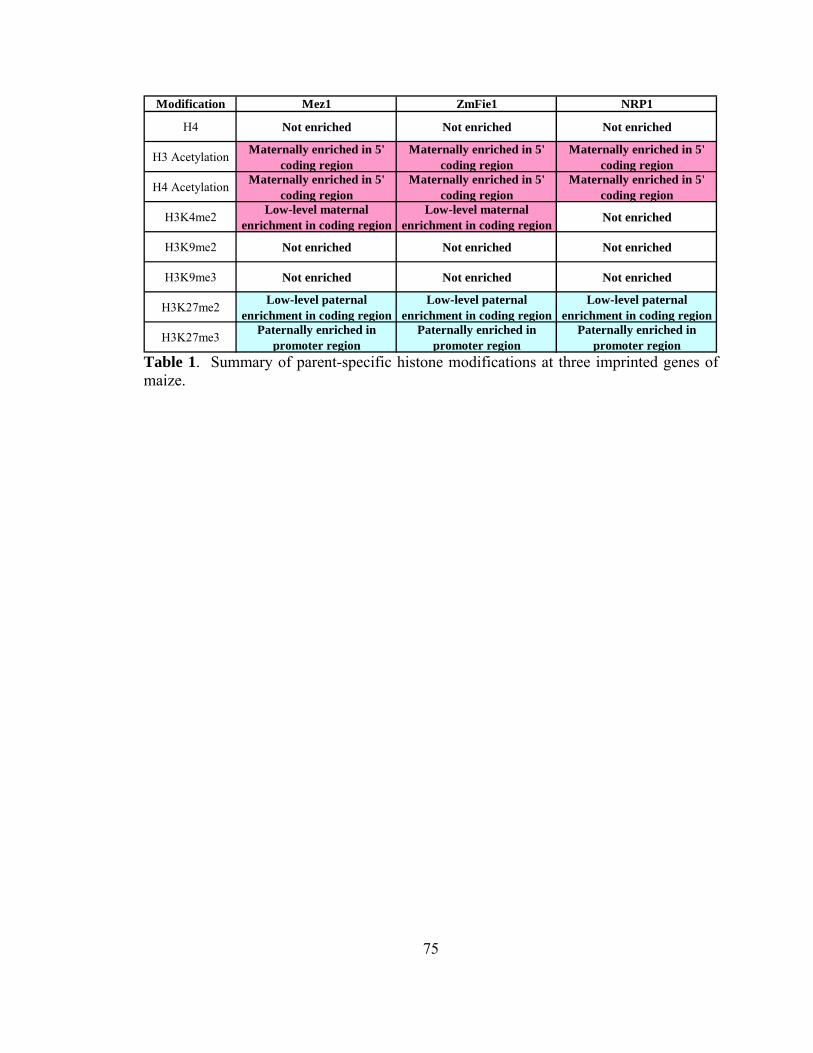
75
Modification Mez1 ZmFie1 NRP1
H4 Not enriched Not enriched Not enriched
H3 Acetylation Maternally enriched in 5' coding region
Maternally enriched in 5' coding region
Maternally enriched in 5' coding region
H4 Acetylation Maternally enriched in 5' coding region
Maternally enriched in 5' coding region
Maternally enriched in 5' coding region
H3K4me2 Low-level maternal enrichment in coding region
Low-level maternal enrichment in coding region Not enriched
H3K9me2 Not enriched Not enriched Not enriched
H3K9me3 Not enriched Not enriched Not enriched
H3K27me2 Low-level paternal enrichment in coding region
Low-level paternal enrichment in coding region
Low-level paternal enrichment in coding region
H3K27me3 Paternally enriched in promoter region
Paternally enriched in promoter region
Paternally enriched in promoter region
Table 1. Summary of parent-specific histone modifications at three imprinted genes of maize.

76
Antibody Source VolumeIgG Upstate 5-10 µlH4 Judith Berman 10 µl
H3 Acetyl Upstate #06-599 10 µlH4 Acetyl Upstate #06-866 10 µlK3K4me2 Upstate #07-030 10 µlH3K9me2 Upstate #07-212 10 µlH3K9me3 Abcam #ab8898 10 µlH3K27me2 Upstate #07-452 6-10 µlH3K27me3 Upstate #07-449 10 µl
5-methylcytosine Calbiochem #NA81 7.5-15 µl5-methylcytosine Fitzgerald #20-CS90 7.5-15 µl
Table 2. Antibodies used for ChIP protocol, showing source and volume used per immunoprecipitation.

77
Primer Sequence (5' 3')
Mez1 F80 TAGGCCCCTTCGTAATGCAAGATMez1 R75 AGACAGCTTTTCTCGCTTGATCTCATMez1 F69 TGTATTCGATATTTTATGCTGACGGAGGAAMez1 R30 TCGGTACGTGTGAGCGTTATTATGGMez1 RTF2 GTGAAGATGAAGCCATTGAAGATGAGGAGMez1 R43 ACCATCCACAACAATGCAAAAGAAAAAGGAPC F3 GTGTAACAGTCAGTCGGCTTTAAAAGGAGAPC R1 CTAGGAGGACGACGGGTGGAActin F2 GATGATGCGCCAAGAGCTGActin R2 GCCTCATCACCTACGTAGGCATCopia F1 CGATGTGAAGACAGCATTCCTCopia R1 CTCAAGTGACATCCCATGTGTMez_1ChIP11_F* ACGTTGGATGAAGCATGTGATCAGCACCAG9008D_ChIP43_F* ACGTTGGATGTAGTTTGGCGCGCGGCAAAG9002A_ChIP53_F* ACGTTGGATGGTCAGCTTGTGGCGAAAGAGMez_1ChIP20_F* ACGTTGGATGTACGATTACCGCTATGAGCCMez_2ChIP46_F* ACGTTGGATGTCTTTGATCCTTCGGGTCTCFie1_ChIP31_F* ACGTTGGATGAAGCTAATCAACCAGCACGGMez_1ChIP4_F* ACGTTGGATGTGGCTTATCTATGGTCACTGMez_1ChIP12_F* ACGTTGGATGCTCAGCGATTCGTCTATTGGMez_1ChIP19_F* ACGTTGGATGTCGTGAGAACTCATCGTTCCFie2_ChIP37_F* ACGTTGGATGGCAGAAATGATGAGCGAAGG9002C_ChIP50_F* ACGTTGGATGGTTAGTTTTGTGGCTGCAGG9008A_ChIP44_F* ACGTTGGATGGCCATCGTCTCTTCTAATACFie1_ChIP26_F* ACGTTGGATGACACAAAATGTGCATCGCCGMez_1ChIP21_F* ACGTTGGATGGCTGCCAAATTTGTCCTAACMez_1ChIP23_F* ACGTTGGATGTGTCGCATGATGGGACATCG9008A_ChIP45_F* ACGTTGGATGATTCCACAGAGTCTACCTCCMez_1ChIP3_F* ACGTTGGATGCTCCGTCAGCATAAAATATCGFie1_ChIP28_F* ACGTTGGATGGGCATGTAAGTGAAACCCAAFie2_ChIP34_F* ACGTTGGATGTTGTCTTCGGTTCCCAAAGCMez_1ChIP14_F* ACGTTGGATGGTCTTACAAATGGGACACGCMez_1ChIP18_F* ACGTTGGATGGACGGCAAAGAAAGATTGACMez_1ChIP17_F* ACGTTGGATGGTAAAGCTGTAGTTGTAGACMez_1ChIP13_F* ACGTTGGATGATAAGGGTCACAGTGCATCCMez_1ChIP1_F* ACGTTGGATGTTAGTTGACTATGCATTCGMez_1ChIP2_F* ACGTTGGATGTGACATAGTGTATGTCATTMez_1ChIP24_F* ACGTTGGATGTTTTTTTCTACTTCTAGCCMez_1ChIP7_F* ACGTTGGATGGTTCTGCATTCTGATATGAGNrp1_ChIP39_F* ACGTTGGATGTCCTCGATGGTGTCACAGAAFie2_ChIP35_F* ACGTTGGATGTGGATCCGACAACAAAAGGCFie1_ChIP30_F* ACGTTGGATGTACCATGTAAGAGTGAACGCMez_1ChIP25_F* ACGTTGGATGAGAGAGTAGGTTCACGAGAG9002C_ChIP49_F* ACGTTGGATGTCCTTGAAGAGGCGCGAGTAFie2_ChIP33_F* ACGTTGGATGTACTACGACGTCTTCGCCAC9009O_ChIP55_F* ACGTTGGATGTCAGGAGCCGCCTGGCCGMez_1ChIP5_F* ACGTTGGATGAAGCGACTTCGCGTGTGAG9009O_ChIP56_F* ACGTTGGATGCCTGTCTGGTTCCAATAGAG9008E_ChIP41_F* ACGTTGGATGGCCACAACCATAGTCAATCGMez_1ChIP8_F* ACGTTGGATGATGCACCCTGCATAGTCTTG9008E_ChIP40_F* ACGTTGGATGGGATAGAGGCGATGGTGTCFie2_ChIP36_F* ACGTTGGATGTGATGAGCGAAGGCTTCAAC
→

78
Primer Sequence (5' 3')
Fie1_ChIP27_F* ACGTTGGATGAATGGTGGGATGTCCGGTTCFie1_ChIP29_F* ACGTTGGATGGTCCATAGTAGATGTGTCGGMez_1ChIP16_F* ACGTTGGATGCAGGGCAAGCCAAAGAAATGMez_1ChIP6_F* ACGTTGGATGTTCTTGTCTTAGGTCGAGGGMez_1ChIP10_F* ACGTTGGATGTATACCCCGTTTGGATGTAGNrp1_ChIP38_F* ACGTTGGATGACCACCGGGATCAAGAAGACMez_1ChIP9_F* ACGTTGGATGCCATCAAATATCATAGCACACMez_1ChIP15_F* ACGTTGGATGGAGATCACTGTTGCAAGACGMez_1ChIP11_R* ACGTTGGATGTTGCTTGGGTACATGTTTTG9008D_ChIP43_R* ACGTTGGATGAGATCCCTGCTGCGTGGCAT9002A_ChIP53_R* ACGTTGGATGCCGACTGATCACTGATGATGMez_1ChIP20_R* ACGTTGGATGTTGCCCATCATCCTTTGCTCMez_2ChIP46_R* ACGTTGGATGTATTGAGGCTAGCGAGGAACFie1_ChIP31_R* ACGTTGGATGCGACGCCTGAGCGAGAGGAMez_1ChIP4_R* ACGTTGGATGCGAAGAACCTACTTGAACCCMez_1ChIP12_R* ACGTTGGATGAAATCTCCACAACACTCCCCMez_1ChIP19_R* ACGTTGGATGAGGTGGTCAGCCAAGTATAGFie2_ChIP37_R* ACGTTGGATGAGCTAAGAGAGCTTTGTTGG9002C_ChIP50_R* ACGTTGGATGACCTGTTCGCCACGTGAAAG9008A_ChIP44_R* ACGTTGGATGGGCCTCCTCAGGTTTCATTTFie1_ChIP26_R* ACGTTGGATGTAGTTGAGGCAGTGGATGTGMez_1ChIP21_R* ACGTTGGATGTCAATGGGCGTGCAAAGAAGMez_1ChIP23_R* ACGTTGGATGCATGAACCAAACAGGCCTTC9008A_ChIP45_R* ACGTTGGATGGGTAGAAACAGTAGGTGGTGMez_1ChIP3_R* ACGTTGGATGCGTTTGACAGCTTCAAGGACFie1_ChIP28_R* ACGTTGGATGAGATTGGAGAAGGCTGAAAGFie2_ChIP34_R* ACGTTGGATGTTCTCAGTGCTTAATGAGGGMez_1ChIP14_R* ACGTTGGATGGCTAATATGCTGATGCAAAGGMez_1ChIP18_R* ACGTTGGATGGAGGAACCTTTTGACCAAAACMez_1ChIP17_R* ACGTTGGATGCATATACCGTACTTCAAGGCMez_1ChIP13_R* ACGTTGGATGGAAAACAACAGTGCCTCTGGMez_1ChIP1_R* ACGTTGGATGGGGGCTAAAACTTGATAATMez_1ChIP2_R* ACGTTGGATGAACAAGGATCAACTAGAACMez_1ChIP24_R* ACGTTGGATGACGTTGAGTTTGTGCAATACMez_1ChIP7_R* ACGTTGGATGCAGCACAATAAGGAACACTGNrp1_ChIP39_R* ACGTTGGATGTCACAGACATCATCGACGAGFie2_ChIP35_R* ACGTTGGATGTGCCTTATGTGCCTCTTGTGFie1_ChIP30_R* ACGTTGGATGTGTATACGTGGTTTGCCTACMez_1ChIP25_R* ACGTTGGATGTTAAGGGTGTTATGTCAAC9002C_ChIP49_R* ACGTTGGATGTTCGGGCTCGACGCCTTCTFie2_ChIP33_R* ACGTTGGATGACTCCCCAAACCTCAGTAAG9009O_ChIP55_R* ACGTTGGATGACCACCTCTTCGGCGGCTCMez_1ChIP5_R* ACGTTGGATGATGCGGACGACGCCACTAC9009O_ChIP56_R* ACGTTGGATGCTTTACGGAAAGCTGCTCTG9008E_ChIP41_R* ACGTTGGATGGCACGAATTGAAATGGTTTGMez_1ChIP8_R* ACGTTGGATGGAGAAAGGACTTTCGTCTTG9008E_ChIP40_R* ACGTTGGATGGAGTAGTCCGTCCACACCTTFie2_ChIP36_R* ACGTTGGATGGATTCTGCAGAGCTTTGTTGFie1_ChIP27_R* ACGTTGGATGAAACCTGGCTCATCATCGACFie1_ChIP29_R* ACGTTGGATGAACCTCAACTCAGCAAGTCCMez_1ChIP16_R* ACGTTGGATGCTCTATTCTCTCTTGCCCACMez_1ChIP6_R* ACGTTGGATGCAAATTACTCCGAACCGACC
→

79
Primer Sequence (5' 3')
Mez_1ChIP10_R* ACGTTGGATGTCCATGTGCCCAAACAACAGNrp1_ChIP38_R* ACGTTGGATGGGATGGCCGGAATGTTGTTCMez_1ChIP9_R* ACGTTGGATGGTTGTGTTTGTATTGCTGCCMez_1ChIP15_R* ACGTTGGATGTGCTTCATGATCAATGGTAGMez_1ChIP11_UEP* CAGCACCAGCAGCAG9008D_ChIP43_UEP* GGAGTGGACTGGAGC9002A_ChIP53_UEP* CGAAAGAGCCACTTGCMez_1ChIP20_UEP* ATGAGCCTGACAGAGCMez_2ChIP46_UEP* cGTCTCCTAGCCCAAGCFie1_ChIP31_UEP* agGTGAACCGGCGGGCGMez_1ChIP4_UEP* GTCACTGATCTGTTGGACMez_1ChIP12_UEP* TCTTTCTGATTCCACCTTTMez_1ChIP19_UEP* TCCTTTTCAACCTGAACAAFie2_ChIP37_UEP* CAACGGTTGAGTTCTTATC9002C_ChIP50_UEP* ggggTGCAGGACGACCCAT9008A_ChIP44_UEP* tcTACTCTCAAGGTTTCTCACFie1_ChIP26_UEP* ACCATATAGAACCACTTATCAMez_1ChIP21_UEP* gggCAAATCAGATTCAGCCTCMez_1ChIP23_UEP* gtagGGGACATCGAAGCCGCA9008A_ChIP45_UEP* tcattAGCCTTCCTCCAATTTCTMez_1ChIP3_UEP* TTATAACCTCGAGATAAAACAATFie1_ChIP28_UEP* tcAAGTGAAACCCAAACAAGAAGFie2_ChIP34_UEP* ccTTCCCAAAGCACAATTTCATTGMez_1ChIP14_UEP* gggtAAATACTGTGGACGAGTTCCMez_1ChIP18_UEP* AAAGATTGACCAACTTTATCATTATMez_1ChIP17_UEP* gAGTTGTAGACTTGTATTGCAATTTMez_1ChIP13_UEP* tTGCATCCAACCTTAATATATCCTTTMez_1ChIP1_UEP* ttttGTTGACTATGCATTCGAGACCTMez_1ChIP2_UEP* TTGAATCTGAATTTTTGTTAATACCAMez_1ChIP24_UEP* ttttgTCTACTTCTAGCCTATCACATAMez_1ChIP7_UEP* tagcGAAAATAACGTTTAAGAACATGANrp1_ChIP39_UEP* agccgCGATGGTGTCACAGAAGGACGAFie2_ChIP35_UEP* acCTTGTTGACTATTATACAGAACTCTAFie1_ChIP30_UEP* ttttaGATTCAATCCAAAAGCTTAAACTMez_1ChIP25_UEP* GATATGAGAGAATTTTATAGGATAAAAC9002C_ChIP49_UEP* GCGCGAGTACACGGTFie2_ChIP33_UEP* CATCGACTGCTCTCTC9009O_ChIP55_UEP* GGGACTTGCGCGGCGAMez_1ChIP5_UEP* taGGGGCTAGGGTTTCC9009O_ChIP56_UEP* ccAAAGCTCGTCTACGGT9008E_ChIP41_UEP* TTGATTGTCCTTTGAACGMez_1ChIP8_UEP* GGTTGACAAAGATGGTGG9008E_ChIP40_UEP* cccaGTGGGGCGGGCAGGGFie2_ChIP36_UEP* TCAACGGTTGAGTTCTTATCFie1_ChIP27_UEP* TGGACCCTCCTTTTTCTTGTCFie1_ChIP29_UEP* gGTGTCGGTTTTGGTACTCTAMez_1ChIP16_UEP* ccccAAGAAATGGCACATGATTMez_1ChIP6_UEP* ccctcAGGTCGAGGGGGCAATGMez_1ChIP10_UEP* ATAGAATTGAGAATTGGAGTTGNrp1_ChIP38_UEP* cataaCAGGTGGCCATGGCCGGTMez_1ChIP9_UEP* CATAGCACACTATTTCATAAATATMez_1ChIP15_UEP* gtGGCACAATATAATAGAATGGTG
Table 3. Primers used for CAPS imprinting assays, genotyping mez1-mu insertion alleles, DMR analyses, Mez1 real-time PCR Taqman (*) assays and Sequenom (**) assays.
→

Figure 1
Figure 1. Verification of ChIP. ChIP was performed on 14 DAP endosperm tissue with IgG and antibodies specific to H4, H3 acetylation or H3K9me2. Quantitative real-time PCR was performed with primers specific to Actin, GAPC or Copia to quantify the concentration of DNA recovered in each immunoprecipitation and in the input chromatin. The amount of DNA from each immunoprecipitation was calculated from a standard curve and compared to the calculated concentration of input control. Enrichment for a particular histone modification will result in a % of input significantly higher than IgG of a non-enriched histone modification. (a,b) GAPC and Actin show a significant amount of enrichment for H4 and H3 acetylation. (c) Copia shows a significant amount of H4 and H3K9me2 enrichment.
GAPC
Actin
Copia
IgG
H4
H3 Acetylation
H3K9me2 Methylation
0.00%
5.00%
10.00%
15.00%
20.00%
25.00%
0.00%
10.00%
20.00%
30.00%
40.00%
0.00%
0.50%
1.00%
1.50%
2.00%
% o
f Inp
ut%
of I
nput
% o
f Inp
ut
(a)
(b)
(c)
80

Figure 2
Figure 2. Paternal enrichment of 5-methylcytosine in the promoter of ZmFie1. Chromatin from 14 DAP endosperm tissue was immunoprecipitated with an antibody against 5-methylcytosine. Four different quantitative SNP assays were performed on the immunoprecipitated chromatin to determine the percent of the paternal allele (y-axis) in input chromatin and in chromatin precipitated with the 5-methylcytosine antibody. The position of the four SNPs in the ZmFie1 gene is indicated along the x-axis. A schematic of the ZmFie1 gene is shown with the position of the transcription start site (green arrow), coding region (grey box) and DMR (orange lines indicate regions determined by Hermon et al.,2007) shown. The horizontal black line indicates the expected value of 0.33 if there is no enrichment for maternal or paternal alleles. The open circles represent averaged, normalized input values for each SNP assay and are all near the expected value. The blue triangles represent the percent of the paternal allele detected in the chromatin precipitated with the 5-methylcytosine antibody. Multiple biological replicates are shown for each SNP assay.
% P
ater
nal A
llele
Position
ZmFie1 coding region
Paternal enrichment
DMRs
Input chromatin5-methylcytosine
81

Figure 3
Figure 3. Analysis of nucleosome occupancy on the maternal and paternal alleles of Mez1 and ZmFie1. A series of quantitative SNP assays were used to determine the percent of the paternal allele (y-axis) detected in input chromatin (open circles) and chromatin precipitated with a histone H4 antibody (blue triangles). The position of each SNP within the Mez1 (A) or ZmFie1 (B) transcript is indicated along the x-axis. The location of the transcription start site is indicated by the green arrow. The horizontal black line indicates the expected percent of the paternal allele if there is no enrichment. Values from the three different biological replicates are shown for each SNP.
Position
Mez1
ZmFie1
% P
ater
nal A
llele
% P
ater
nal A
llele
Position
Mez1 coding region
0 2500 5000 7500 10000
0-1000 0 1000 2000 3000-2000
(a)
(b)
Input chromatinH4
Input chromatinH4
ZmFie1 coding region
82

Figure 4
Position
Mez1
ZmFie1
% P
ater
nal A
llele
% P
ater
nal A
llele
Position
0 2500 5000 7500 10000
0-1000 0 1000 2000 3000-2000
Figure 4. Paternal enrichment for H3K27me3 in the promoter of Mez1 and ZmFie1. Chromatin immunoprecipitation was performed on chromatin isolated from 14 DAP endosperm tissue using an antibody that recognizes H3K27me3. The quantitative SNP assays were used to determine the percent of the paternal allele (y-axis) detected in input chromatin (open circles) and chromatin precipitated with a H3K27me3 antibody (blue triangles). The position of each SNP within the Mez1 (A) or ZmFie1(B) transcript is indicated along the x-axis. The location of the transcription start site is indicated by the green arrow. The horizontal black line indicates the expected percent of the paternal allele if there is no enrichment. Values from the three different biological replicates are shown for each SNP.
Paternal enrichment
Paternal enrichment
(a)
(b)
Input chromatinH3K27me3
Input chromatinH3K27me3
Mez1 coding region
ZmFie1 coding region
83

Figure 5
Position
Mez1
ZmFie1
% P
ater
nal A
llele
% P
ater
nal A
llele
Position
0 2500 5000 7500 10000
0-1000 0 1000 2000 3000-2000
Maternal enrichment
Maternal enrichment
Figure 5. Maternal enrichment for H3 acetylation in the promoter of Mez1 and ZmFie1. Chromatin immunoprecipitation was performed on chromatin isolated from 14 DAP endosperm tissue using an antibody that recognizes H3K27me3. The quantitative SNP assays were used to determine the percent of the paternal allele (y-axis) detected in input chromatin (open circles) and chromatin precipitated with a H3 acetylation antibody (blue triangles). The position of each SNP within the Mez1 (A) or ZmFie1 (B) transcript is indicated along the x-axis. The location of the transcription start site is indicated by the green arrow. The horizontal black line indicates the expected percent of the paternal allele if there is no enrichment. Values from the three different biological replicates are shown for each SNP.
(a)
(b)
Input chromatinH3 acetylation
Input chromatinH3 acetylation
Mez1 coding region
ZmFie1 coding region
84

Figure 6
Position
Mez1
ZmFie1
% P
ater
nal A
llele
% P
ater
nal A
llele
Position
0 2500 5000 7500 10000
0-1000 0 1000 2000 3000-2000
Maternal enrichment
Maternal enrichment
Figure 6. Maternal enrichment for H4 acetylation in the promoter of Mez1 and ZmFie1. Chromatin immunoprecipitation was performed on chromatin isolated from 14 DAP endosperm tissue using an antibody that recognizes H3K27me3. The quantitative SNP assays were used to determine the percent of the paternal allele (y-axis) detected in input chromatin (open circles) and chromatin precipitated with a H4 acetylation antibody (blue triangles). The position of each SNP within the Mez1 (A) or ZmFie1 (B) transcript is indicated along the x-axis. The location of the transcription start site is indicated by the green arrow. The horizontal black line indicates the expected percent of the paternal allele if there is no enrichment. Values from the three different biological replicates are shown for each SNP.
(a)
(b)
Input chromatinH4 acetylation
Input chromatinH4 acetylation
Mez1 coding region
ZmFie1 coding region
85

Figure 7
Position0 2500 5000 7500 10000
Mez1 coding region
(a)
(b)
(c)
(d)
H3K9me2
H3K27me2
H3K9me3
H3K4me2
Input chromatinH3K9me2
Input chromatinH3K9me3
Input chromatinH3K27me2
Input chromatinH3K4me2
% P
ater
nal A
llele
% P
ater
nal A
llele
% P
ater
nal A
llele
% P
ater
nal A
llele
86

Figure 7. Several histone modifications do not show evidence for allele-specific enrichment at Mez1. Chromatin immunoprecipitation was performed on chromatin isolated from 14 DAP endosperm tissue using antibodies that recognize H3K9me2 (a), H3K27me2 (b), H3K9me3 (c) or H3K4me2 (d). The quantitative SNP assays were used to determine the percent of the paternal allele (y-axis) detected in input chromatin (open circles) and chromatin precipitated with specific antibodies (blue triangles). The position of each SNP within the Mez1 transcript is indicated along the x-axis. The horizontal black line indicates the expected percent of the paternal allele if there is no enrichment. Values from the three different biological replicates are shown for each SNP.
87

Figure 8
H3K9me2
H3K27me2
H3K9me3
H3K4me2
Position-2000 -1000 0 1000 2000
ZmFie1 coding region
Input chromatinH3K9me2
Input chromatinH3K9me3
Input chromatinH3K27me2
Input chromatinH3K4me2
3000
(a)
(b)
(c)
(d)
% P
ater
nal A
llele
% P
ater
nal A
llele
% P
ater
nal A
llele
% P
ater
nal A
llele
88

Figure 8. Several histone modifications do not show evidence for allele-specific enrichment at ZmFie1. Chromatin immunoprecipitation was performed on chromatin isolated from 14 DAP endosperm tissue using antibodies that recognize H3K9me2 (a), H3K27me2 (b), H3K9me3 (c) or H3K4me2 (d). The quantitative SNP assays were used to determine the percent of the paternal allele (y-axis) detected in input chromatin (open circles) and chromatin precipitated with specific antibodies (blue triangles). The position of each SNP within the ZmFie1 transcript is indicated along the x-axis. The horizontal black line indicates the expected percent of the paternal allele if there is no enrichment. Values from the three different biological replicates are shown for each SNP.
89

Figure 9
-0.3
-0.2
-0.1
0
0.1
0.2
0.3
0.4
0.55-methylH3 AcetylH3K27me2H3K27me3H3K4me2H3K9me2H3K9me3H4H4 AcetylIgGInput
Figure 9. Analysis of allele-specific enrichment for histone modifications in the imprinted Nrp1 gene. Chromatin immunoprecipitation was performed on chromatin isolated from 14 DAP endosperm tissue using a series of antibodies that recognize histone H4 or specific histone modifications. The allelic enrichment (percent paternal allele detected in immunoprecipitated chromatin minus percent paternal allele detected in input chromatin) was determined for each antibody. The standard deviation (based on three biological replicates) is shown for each antibody. We see evidence for maternal enrichment for H3 and H4 acetylation and paternal enrichment for H3K27me2 and H3K27me3.
Pate
rnal
enr
ichm
ent
Mat
erna
l enr
ichm
ent
90

Figure 10
Figure 10. Detailed analysis of H3 acetylation, H4 acetylation and H3K27me3. Data as shown in figures 4, 5 and 6 was analyzed in more detail in the promoter and 5’ coding regions of Mez1 and ZmFie1. The percent of the paternal allele (y-axis) for H3 acetylation (red triangles), H4 acetylation (red triangles) and H3K27me3 (blue triangles) is shown. The position of each SNP within the Mez1 (a) or ZmFie1 (b) transcript is indicated along the x-axis. The horizontal black line indicates the expected percent of the paternal allele if there is no enrichment.
Mez1BxM EndoMxB Endo
H3 Acetylation
H3K27me3
H4 Acetylation
% P
ater
nal A
llele
% P
ater
nal A
llele
-500 1000 2500 -500 1000 2500
(a)
(b)
ZmFie1BxM EndoMxB Endo
-1000 0-1000 0
91

0.00
0.50
1.00
1.50
2.00
2.50
3.00
3.50
0.00
1.00
2.00
3.00
4.00
5.00 IgG
H4
H3 Acetylation
H3K27me3 Methylation
H4 Acetylation
Figure 11
(a)
(b)
(c)
Mez1 transcript
1 2 3
0.00
1.00
2.00
3.00
4.00
5.00
6.00
Rel
ativ
e En
richm
ent
Rel
ativ
e En
richm
ent
Rel
ativ
e En
richm
ent
1
2
3
(d)
DMR
92

Figure 11. Real-time PCR analyss of histone modification enrichments in three regions of Mez1. The relative enrichment of IgG, H4, H3 acetylation, H4 acetylation and H3K27me3 in immunoprecipitated DNA was determined by real-time PCR. The amount of DNA from each immunoprecipitation was calculated from a standard curve and compared to the calculated concentration of input control. Enrichment for each antibody relative to IgG was then calculated. Enrichment for a particular histone modification will result in a relative enrichment greater than 1.00. (a) Relative enrichment of H4 and H3K27me2 in region 5’ to the DMR. (b) Relative enrichment of H4, H3 acetylation, H4 acetylation and H3K27me in the region 5’ to transcription start. (c) Relative enrichment of only H4 in the fourth exon of the coding region. (d) Genomic map of Mez1. 5’ and 3’ genomic regions are shown as a thick blank like, transcription start site is shown as a green arrow, the three regions analyzed are shown as thin black lines above the figure and the DMR is shown as an orange line below the figure.
93

Figure 12. Model for the epigenetic regulation of imprinted loci in plants. A genomic structure for a generic plant imprinted gene is shown, with the coding region represented by the colored rectangle (pink for the maternal allele and blue for the paternal allele). Transcription start is indicated by the green arrow. The location of the regions enriched for either DNA methylation and/or histone modifications are shown as colored lines.
Figure 12
Generic Imprinted GeneDMR
Generic Imprinted Gene
Maternal Allele
Paternal AlleleH3K27me3
H3 acetylation
H4 acetylationH3K4me2
94

95
Chapter 4 Loss-of-imprinting is associated with mu transposon insertions in
the 5’cis-proximal region of Mez1
INTRODUCTION
Genomic imprinting is an epigenetic phenomenon that results in the mono-allelic
expression of a gene based on its parent-of-origin. Studies in plants (reviewed in Köhler
and Makarevich, 2006) and mammals (reviewed in Edwards and Ferguson-Smith, 2007)
have identified some of the key factors that are involved in the regulation of imprinted
expression. In both plants and mammals, epigenetic marks such as DNA methylation and
histone modifications are central components of the imprinting mechanism. For
example, the DNA methyltransferase MET1 and the DNA glycosylase DEMETER play
crucial roles in regulating the imprinted expression of MEA (Choi et al, 2002; Choi et al,
2004; Gehring et al, 2006). The putative histone methyltransferase encoded by the
maternal MEA locus is actually important for the silencing of the paternal allele of MEA,
likely through methylation of H3K27 (Jullien et al, 2006). This and other information
has been formulated into a model of imprinting mechanisms in plants (reviewed in Huh et
al, 2007). However, there are still significant gaps in our understanding of imprinting. In
plants, the primary DNA sequences that are responsible for recruiting the epigenetic
modifier proteins remain elusive. In addition, there is very little information on the
phenotypic consequences of bi-allelic expression for the normally imprinted loci.
Several sequence motifs in both Arabidopsis and Zea mays (maize) have been
proposed as important cis-regulatory domains for imprinting. Transposons and direct
repeats at the MEA locus display differential DNA methylation (Gehring et al, 2006);

96
however, those regions are not required for imprinting (Spillane et al, 2004). The DNA
regions that are sufficient for imprinting of the FIS2 and MEA loci have been determined
using transgenic fusion constructs (Lou et al, 2000). Regions in the maize imprinted
genes Mez1, ZmFie1 and ZmFie2 also display differential DNA methylation between the
parental alleles in the imprinted tissue. For the ZmFie1 and ZmFie2 genes, transposon
and repeat sequences, respectively, are present in the 5’-proximal region but are not
targeted for differential DNA methylation (Hermon et al, 2007; Gutierrez-Marcos et al,
2006). Additionally, Gutierrez-Marcos et al (2006) demonstrated imprinted expression
and differential DNA methylation of Fie1-GUS and Fie2-GFP transcriptional fusions
containing ~4kb of promoter and downstream sequence elements. Danilevskaya et al
(2003) proposed a two CpG island rule as a ‘mark’ for genomic imprinting, however no
other plant imprinted genes contain more than one CpG island (Haun et al, 2007). A
comparison of the primary sequences required for imprinting as defined by transgenic
fusions or differential methylation does not identify any conserved sequence motifs
(Haun et al, 2007).
While there has been significant progress towards understanding the mechanisms
that control imprinted gene expression, our understanding of the biological role of
imprinting during seed development remains somewhat obscure. There are examples of
paternal activation of imprinted genes in mea, dme, fie and met1 mutant backgrounds
(Gehring et al, 2006; Choi et al, 2002; Jullien et al, 2006). However, in these studies the
disruption of imprinting is the result of mutation or ectopic expression of one or more
crucial regulatory genes. In many of these studies there is evidence for strong
morphological consequences. However, it is unclear whether these phenotypic

97
differences are associated with bi-allelic expression of normally imprinted loci or altered
regulation at other genomic loci. A recent study in Arabidopsis demonstrated that seed
production could occur without contribution of a paternal genome in the endosperm by
bypassing genomic imprinting (Nowack et al, 2007). The resulting seeds were
significantly smaller than wild-type seeds, which the authors suggested was an indication
of early angiosperm seed development prior to the evolution of imprinting (Nowack et al,
2007). A paternal contribution increases overall seed size, but also introduces genetic
information that may seek to selfishly misallocate maternal resources. Imprinting may
have evolved as way to capture the advantages of having a paternal genome while still
leaving resource allocation under the control of the maternal parent (Haig, 2004). The
generation of seeds without genomic imprinting is an interesting result, however; it does
not address the phenotypic consequence of activating the silent paternal allele of an
imprinted gene.
The maize gene Mez1 encodes a putative histone methyltransferase gene related
to the Drosophila PcG gene Enhancer of zeste (Springer et al, 2002). Mez1 is imprinted
in endosperm tissue but exhibits bi-allelic expression in other plant tissues (Haun et al,
2007). A differentially methylated region (DMR) was identified in the 5’ proximal
sequences of Mez1 and may play a role in the imprinted expression of Mez1 (Haun et al,
2007). We identified several alleles that contain Mu transposons insertions in the 5’
proximal sequences of the Mez1 gene. These transposon insertion alleles were used to
probe the causes and effects of imprinted expression at the Mez1 locus.

98
RESULTS
Characterization of the mu-transposon insertion alleles at the Mez1 locus. Three
Mutator transposons insertion alleles for the Mez1 locus were identified during a screen
of Pioneer Hi-Bred's Trait Utility System for Corn (TUSC) mutant collection (provided
by Bob Meeley). These three insertion alleles were back-crossed into the B73 and Mo17
genetic backgrounds for at least four generations. Further classification of these lines
revealed the location and nature of the inserts (Figure 1). The mu insertions (designated
mez1-m1, mez1-m2 and mez1-m4) are all located in the 5’-cis proximal region of Mez1.
All three mu insertions are located in between the Mez1 transcription start site and the
previously identified differentially methylated region (DMR) (Haun et al, 2007).The -m1,
-m2 and -m4 insertions are 38, 151 and 159 base pairs, respectively, upstream of the
Mez1 transcription start site. Based upon the family pedigrees and sequencing of several
regions of the Mez1 locus we were able to infer the likely progenitor allele. The Mutator
terminal inverted repeat sequences were used to predict the type of mu element that was
inserted into each allele and this was confirmed by PCR assays.
The mez1-m1 allele is an insertion of a 4.9kb MuDR element into a B73-like
Mez1 allele. The Mez1 coding sequence linked to the mez1-m1 insertion contains B73-
like SNP polymorphisms and imprinting can be assayed when this allele is crossed to
Mo17. The mez1-m1 allele has been backcrossed to B73 for several generations, so a
plant heterozygous for mez1-m1 insertion will be homozygous for B73-like SNPs in the
DMR and coding regions of the Mez1 locus. The mez1-m2 and mez1-m4 alleles are
insertions of a 2.2kb Mu7 and a 2.2 kb Mu4 element, respectively, into an A632-like
Mez1 allele. The A632 Mez1 allele has coding sequence single nucleotide

99
polymorphisms similar to the Mo17 Mez1 allele. Therefore, the mez1-m2 and mez1-m4
alleles can be crossed to B73 to assay imprinting. The mez1-m2 and mez1-m4 alleles
have been backcrossed to Mo17 for several generations, resulting in individuals that are
heterozygous for the mez1-m2 or mez1-m4 insertions and homozygous for Mo17-like
SNPs in the coding region and DMR.
mez1-mu insertion lines do not effect Mez1 expression levels in seedlings. Plants that
were heterozygous for each mez1-mu allele were self pollinated to generate seeds
segregating 1:2:1 for the mez1-mu insertion. The resultant ears were morphologically
normal (Figure 4d and data not shown). Plants heterozygous and homozygous for the
mez1-mu insertion alleles showed no abnormal growth phenotype or reduced germination
relative to their wild-type siblings (Figure 2a, 3a & 4a). In order to determine if the
mez1-mu insertions had an affect on overall seed weight, 100 seeds from the ears
described above were individually weighed. If the mez1-mu insertions resulted in
improper seed development, a non-normal distribution of seed weights would have been
observed. However, the distribution of individual seed weights for all three mez1-mu
alleles appeared normal (Figure 2b, 3b & 4b). The 12 heaviest and lightest seeds were
germinated and genotyped to verify that certain genotypic classes were not enriched. For
each mez1-mu allele, the resultant seedlings segregated approximately 1:2:1 for mez1-mu
in both the heavy and light seeds (data not shown). Mez1 is imprinted in endosperm
tissue, but expression is bi-allelic in all other tissues tested (Springer et al, 2002; Haun et
al, 2007). To better understand the effect of the mez1-mu insertions, the expression level
of Mez1 was analyzed in tissue from seedlings segregating for the mez1-mu insertion for

100
all three alleles. Real-Time PCR results did not provide evidence for altered expressed
levels of Mez1 in seedlings homozygous for mez1-mu relative to wild-type or
heterozygous siblings (Figure 2c, 3c & 4c). The three Mu transposons insertion alleles do
not appear to have an effect on the expression level of Mez1 in vegetative tissues.
Mu insertion alleles affect imprinting of Mez1. Although the mu insertions at the Mez1
allele did not affect seedling expression levels, we were interested in determining
whether the normal imprinted expression pattern was maintained in these alleles.
Insertional mutagenesis has been used to generate a loss-of-imprinting phenotype in
mouse at the Dlk1-Gtl2 locus (Steshina et al, 2006). The location of the mu insertions in
the 5’cis-proximal region of Mez1 suggested that imprinted regulation could potentially
be disrupted since the location of the DMR is 1.5-4kb further from the transcription start
that in the wild-type Mez1 alleles. We initiated a screen to survey for a loss-of-
imprinting at the Mez1 locus when a mez1-mu insertion allele is inherited from the
maternal parent or the paternal parent. A total of 67 crosses involving the three mu
insertion lines and wild-type B73 or Mo17 plants were made. RNA was isolated from a
pool of 12-16 sibling endosperms that were isolated 14-16 days after pollination (DAP).
The pooled endosperms were segregating 1:1 for kernels that are heterozygous for the
mez1-mu insertion allele and homozygous for non-insertion alleles. By screening pooled
tissue we were able to assess whether imprinting was disrupted in a large number of
crosses. Quantitative SNP assays were performed using the MassArray system on Mez1
transcripts produced by RT-PCR from the pooled endosperm tissue. In several assays of
wild-type B73×Mo17 or Mo17×B73 endosperms, expression was detected exclusively

101
from the maternal allele as expected (data not shown). However, many of the crosses
involving mez1-mu alleles showed activation of the paternal allele consistent with a
segregating loss-of-imprinting (Table 1).
The different mez1-mu insertion alleles showed different loss-of-imprinting
patterns. We observed a loss-of-imprinting when mez1-m1 was inherited from the
maternal parent but rarely observed imprinting defects when mez1-m1 was inherited from
the paternal parent. The mez1-m2 allele showed the opposite pattern. We frequently
observed a loss-of-imprinting when mez1-m2 was inherited from the paternal parent but
rarely observed effects on imprinting when this allele was inherited from the maternal
parent. The mez1-m4 allele often caused a loss-of-imprinting when inherited from either
the maternal or the paternal parent. The results from the imprinting analyses of pooled
endosperm tissue suggests the mu allele insertions in the 5’cis-proximal region of Mez1
are disrupting the normal mono-allelic expression typically observed in endosperm tissue.
mez1-m1 causes a loss-of-imprinting when inherited from the maternal parent. We
proceeded to analyze individual endosperms that were segregating for the mez1-m1
insertion. Two plants that were heterozygous for the mez1-m1 allele in the B73 genetic
background were reciprocally crossed as males and females to wild-type Mo17 plants
resulting in four ears. These crosses result in endosperms that are polymorphic for a SNP
within the coding region of Mez1 and are segregating 1:1 for wild-type:heterozygous
mez1-m1 insertions. Both CAPS (Figure 5a) and quantitative SNP (Figure 5b) analyses
were used to test for activation of the normally silent paternal allele. The CAPS analysis
revealed expression from both the maternal and paternal alleles in endosperms that inherit

102
the mez1-m1 allele from the maternal parent (Figure 5a). However, when mez1-m1 was
inherited from the paternal parent only the maternal allele was detected. We confirmed
these results using quantitative SNP analyses on at least four heterozygous endosperms
and two wild-type endosperms from each of the four ears that were produced. The
percent of the Mez1 transcripts from the paternal allele was determined for each
endosperm. We observed significant levels (~20-30%) of transcripts from the paternal
allele of Mez1 when the mez1-m1 allele was inherited from the maternal parent. The
other genotypes showed little or no expression of the paternal allele in these samples.
Quantitative Real-Time PCR was used to compare the overall expression of Mez1 in
several individuals of both genotypes (heterozygous mez1-m1 and wild-type) from all
four ears (Figure 5c). We did not notice consistent significant differences in the
expression level associated with any of the genotypes. The CAPS and quantitative SNP
assays on both individual and bulk endosperm samples suggest that the inheritance of the
mez1-m1 allele from the maternal parent can result in activation of the wild-type paternal
allele. These results agree with our survey of imprinting in a number of crosses involving
mez1-m1 (Table 1).
mez1-m2 causes loss-of-imprinting when inherited from the paternal parent. The
same series of experiments were performed to determine how the mez1-m2 allele affects
imprinting of Mez1 (Figure 6). The CAPS assays suggested that inheritance of the mez1-
m2 allele through the maternal parent did not have any effect upon imprinted expression.
However, when mez1-m2 was inherited from the paternal parent we observed activation
of the paternal allele in both wild-type endosperms (Figure 6a). Interestingly, we also

103
observed lower levels of paternal Mez1 transcripts in the wild-type endosperms of the
paternal transmission crosses. These results were confirmed by the quantitative SNP data
(Figure 6b). The maternal transmission of mez1-m2 did not affect Mez1 imprinting;
however, when a mez1-m2 allele was paternally transmitted we observed a significant
proportion (20-25%) of paternal Mez1 transcripts. We saw significantly lower levels of
paternal Mez1 transcripts in the wild-type siblings of the paternal transmission of mez1-
m2 crosses. Quantitative real-time PCR experiments showed slightly lower levels of
Mez1 expression in heterozygous and wild-type endosperms derived from a cross of
B73WT/B73WT X Mo17WT/Mo17mez1-m2 than in the reciprocal cross (Figure 6c). However,
the Mez1 expression levels were not different in the endosperms that were heterozygous
for the mez1-m2 allele relative to wild-type siblings.
mez1-m4 causes loss-of-imprinting when inherited from either parent. A similar set
of experiments were performed on individual endosperms resulting from reciprocal
crosses of plants that were heterozygous for the mez1-m4 allele. In both the CAPS
(Figure 7a) and quantitative SNP (Figure 7b) analyses, we observed expression of the
paternal Mez1 allele in heterozygous endosperm samples but not in wild-type siblings.
This loss-of-imprinting was observed when the mez1-m4 allele was inherited from either
the maternal parent or from the paternal parent. Interestingly, the level of Mez1
expression differed in heterozygous endosperms relative to wild-type siblings and the
level of expression also varies depending upon which parent transmited the mez1-m4
allele (Figure 7c). If the maternal parent was heterozygous for the mez1-m4 allele, then
the resulting heterozygous off-spring exhibit lower levels of Mez1 expression than wild-

104
type sibling endosperms. However, if the paternal parent was heterozygous for mez1-m4
then the resulting heterozygous offspring exhibited higher levels of Mez1 expression than
wild-type siblings.
DISCUSSION
Imprinting is a unique form of gene regulation that results in the expression of a
gene from only one of the parental alleles. Many recent studies of imprinted genes in
plants have begun to unravel the complex mechanism that allows a cell to distinguish
between the two nearly identical parental alleles. In this study we have utilized several
alleles of the imprinted Mez1 gene to further probe the mechanisms of imprinting.
Interestingly, these alleles can result in a loss-of-imprinting phenotype. These findings
allow us to discuss the biological role of imprinting and to add to the plant imprinting
mechanism.
Bi-allelic expression of Mez1 in endosperm tissue has no phenotypic consequence.
Many theories, including the ‘kinship theory of genomic imprinting’ (Haig, 2004), have
been proposed to explain why imprinting has evolved in plants. However, very little is
known about why a handful of plant genes are subjected to imprinting. One of the most
important questions regarding the biological importance of imprinting, what is the
consequence of a loss-of-imprinting, has yet to be addressed. In mice, a study of the
imprinted locus Dlk1-Gtl2 used insertional mutagenesis to generate an allele with a loss-
of-imprinting (Steshina et al, 2006). Paternal inheritance of the 15-kb integration allele
produced a loss-of-imprinting of Dlk1-Gtl2. This altered the expression levels of Dlk1
and Gtl2, resulting in decreased survival and dwarfism of the offspring (Steshina et al,

105
2006). We were able to study the phenotypes associated with transposons insertion
alleles that display bi-allelic expression to determine if the presence or absence of
imprinting at Mez1 affects seed size.
All three mez1-mu alleles in this study resulted in a loss-of-imprinted expression
of Mez1 in endosperm tissue. The mez1-mu alleles had no affect on germination or
seedling growth (Figures 2a, 3a & 4a), nor was the weight of heterozygous or
homozygous mez1-mu seeds different from that of wild-type seeds (Figures 2b, 3b & 4b).
The insertions also did not alter the bi-allelic expression levels of Mez1 in non-imprinted
tissues (Figures 2c, 3c & 4c). Mature mez1-mu plants appeared phenotypically normal
and developed normal flowers with no decrease in fertility (data not shown). The only
observed effect of these mez1-mu insertions was the disrupted expression of Mez1
imprinting in endosperm tissue. Developing seeds on an ear segregating 1:2:1 for the
mez1-m4 allele showed no obvious segregating abnormalities (Figure 4d).
These results may suggest the silencing of paternal Mez1 is not necessary for
normal endosperm and seed development. The kinship theory of genomic imprinting
(Haig and Westoby, 1989; Haig, 2004) suggests imprinting evolved as a parental ‘tug-of-
war’ to control the expression of certain developmental genes. Nutrient-acquiring genes
would be down-regulated by the mother to ensure equal distribution of nutrients to all her
offspring. Under this theory, one of the consequences a loss-of-imprinting should result
in the over-acquisition of nutrients and a growth advantage. Our results demonstrate that
activation of the silent allele of one imprinted gene has no detectable phenotypic
consequence. Several possibilities exist to explain our results and the lack of a phenotype
associated with paternal Mez1 expression. The Mez1 gene was originally identified as a

106
maize homolog to the Drosophila PcG gene Enhancer-of-Zeste [E(z)] (Springer et al,
2002). Based on genetic and biochemical evidence in Arabidopsis and Drosophila the
E(z)-like genes often function in a protein complex containing an esc-like, Su(z)12-like
and p55-like gene. Evidence from Arabidopsis has shown the imprinted genes MEA and
FIS2 are members of a plant PcG protein complex (Spillane et al, 2000; Köhler et al,
2003; Wang et al, 2006). A similar complex in maize may contain the imprinted genes
Mez1 and Fie1/Fie2. For the plant PcG protein complexes, redundant imprinting of
multiple members of the complex could explain the lack of a phenotype when one of the
members is bi-allelically expressed. Paternal activation of Mez1 may not be sufficient to
increase the level of the functional PcG complex and therefore does not alter endosperm
phenotype.
mez1-mu alleles provide new insight into the imprinting mechanism of plants.
Studies in both maize and Arabidopsis have provided insight into the mechanism that
regulates imprinting in plants (reviewed in Huh et al, 2007). Recent work has identified
key components of that mechanism, including DNA methylation (Haun et al, 2007;
Vielle-Calzada et al, 1999; Xiao et al, 2003), histone methylation (Gehring et al, 2006;
Jullien et al, 2006) and self-imprinting autoregulation (Baroux et al, 2006). The expected
and unexpected results presented here open the door for a variety of theories to expand
upon the existing model for the regulation of imprinted expression in plants.
Paternal inheritance of mez1-mu results in activation of paternal Mez1. The activation
of paternal Mez1 allele when mez1-mu was inherited paternally was not unexpected and
107
seems to fit with the current model for the imprinting mechanism in plants. The
ubiquitous bi-allelic expression of Mez1 in vegetative tissue (Springer et al, 2002) and the
presence of a paternal hypermethylated region (Haun et al, 2007) suggests that the Mez1
imprinting mechanism may involve targeted paternal-allele silencing. Paternal activation
is an obvious consequence of an insertion that displaces the silencing epigenetic
modifications from the coding region. Displacement of the DMR may have prevented a
hypothetical methyl-binding silencing factor from localizing to the paternal Mez1
promoter. Without this silencing factor, the expression of paternal Mez1 could have been
driven from the normal promoter or from a cryptic promoter within the mu transposon.
Maternal inheritance of mez1-mu results in activation of the paternal allele. It was
unexpected to observe a loss-of-imprinting when mez1-mu was inherited maternally, as
was the case for mez1-m1 and mez1-m4 (Figures 5 & 7). This scenario suggests some
sort of communication is occurring between the maternal and paternal alleles of Mez1.
This communication between the maternal and paternal alleles could occur through the
production of protein, small RNA or a DNA pairing mechanism. Recent studies have
suggested the MEA protein produced by the maternal allele is involved in establishing
and maintaining the silencing of the paternal allele (Gehring et al, 2006; Jullien et al,
2006; Baroux et al, 2006). If a similar mechanism is involved in regulating Mez1
imprinting, it is possible that disrupting the expression of the maternal Mez1 allele could
result in a loss of targeted paternal allele silencing. The mez1-mu insertions might be
reducing the amount of maternal Mez1 or altering temporal/spatial expression patterns. If
a certain level of maternal Mez1 transcript at a precise developmental time point (ie high

108
expression immediately after fertilization) were required to sufficiently silence paternal
Mez1, it is possible to suspect the mez1-mu alleles could disrupt that chain of events.
mez1-m1, mez1-m2 and mez1-m4 result in a different pattern of paternal Mez1 activation.
We were surprised by the fact that each of the three mez1-mu alleles analyzed in this
study affected Mez1 imprinting in slightly different ways. The mez1-m1 allele only
affected imprinting when maternally transmitted, the mez1-m2 allele only affected
imprinting when paternally transmitted and the mez1-m4 allele affected imprinting when
maternally or paternally transmitted. There are several potential explanations for the
differences between the three Mu insertion alleles. The different sizes of the three Mu
elements may contribute to the variation. The different effects could have been a
consequence of insertion site, however, mez1-m2 and mez-m4 were inserted in a nearly
identical location and displayed different effects. Since each mez1-mu allele was the
result of a different class of Mu transposon, the sequences of the individual Mu
transposons could give rise to the inconsistent phenotypes. Similarly, the individual Mu
transposon insertions could have resulted in a different type of chromatin environment at
each allele. The extent to which the epigenetic environment was altered could partially
explain the variation observed.
The exact mechanism by which the Mu transposons insertions affect Mez1
imprinting is not clear. The simple displacement of cis-acting elements may affect
normal imprinted expression. The Mu transposons insertions could disrupt the normal
expression pattern of the MEZ1 protein. Alternatively, the Mu transposons may generate
a novel type of chromatin within the Mez1 promoter that blocks or enhances the

109
formation of different chromatin structures during the process of imprinting. It is clear
that these alleles offer a unique system for probing the mechanisms and consequences of
imprinting in plants.

110
EXPERIMENTAL PROCEDURES
Plant Materials and tissue collection. Maize inbred and mez1-mu lines were grown using
standard field conditions in the summer of 2006 and 2007 in St. Paul, MN. All three
mez1-mu insertion alleles were independently backcrossed to B73 and Mo17 for at least
four generations prior to use in loss-of-imprinting assays. Reciprocal crosses between
B73 or Mo17 and the heterozygous mez1-mu lines were performed to generate
endosperm tissue in which all kernels are polymorphic for coding region SNPs (see
below). A total of 67 crosses were made for mez1-m1 to/by Mo17, mez1-m2 to/by B73
and mez1-m4 to/by B73. Ears were harvested at 14-16 days after pollination (DAP) and
endosperm tissue from individual kernels was collected by dissection. For each ear, we
collected a pooled sample of 12-16 endosperms and an additional 12 individual
endosperms. All isolated endosperm tissue was flash frozen in liquid nitrogen and stored
at -80°C until processed.
Nucleic Acid Extractions. DNA and/or RNA were extracted for genotyping, expression
and DNA methylation analyses. For genotyping and characterization of the mez1-mu
alleles, DNA was extracted from leaf tissue of segregating mez1-mu families using a
CTAB extraction protocol (Springer, 2007). For the mez1-mu seedling real-time PCR
assays, DNA and RNA was extracted from greenhouse grown 14 day-old seedlings.
Seedlings were genotyped for mez1-mu insertion alleles. All above-ground tissue was
harvested, flash frozen in liquid nitrogen and stored at -80°C. Tissue was ground to a
fine powder and RNA extracted with Trizol (Invitrogen) according to manufacturer’s
protocol. For the imprinting assays from pooled or individual endosperms, the tissue was

111
ground in liquid nitrogen and the tissue divided between the DNA and RNA extractions.
DNA was extracted using the Qiagen DNeasy Plant Mini Kit (Valencia, CA, USA)
according to the manufacturer’s protocol. RNA was isolated using a SDS/Trizol
combination protocol as described previously (Stupar et al, 2007). RNA was
resuspended in RNAse-free water and quantified on a NanoDrop Spectrophotometer
(Wilmington, DE, USA).
First-strand cDNA synthesis was performed to generate template for the real-time
PCR assays and imprinting assays. Contaminating DNA was removed by digestion with
RQ1 DNase (Promega, Madison, WI, USA). Total RNA (1.5 µg for endosperm cDNA
synthesis, 2.5 µg for seedling cDNA synthesis) was mixed with 0.5 µg oligo dT
(Invitrogen, Carlsbad, CA, USA) and heated to 70°C for 5 minutes followed by 1 minute
on ice. First-strand cDNA synthesis was performed in a total volume of 30 µl by adding
6 µl 5X reaction buffer, 1.5 µl RNaseOut (Invitrogen), 0.8 µl 25mM dNTPs, and 1 µl M-
MLV reverse transcriptase (Invitrogen). This reaction was incubated at 42°C for 50
minutes followed by 70°C for 15 minutes. The resulting cDNA was purified by
phenol:chloroform extraction followed by ethanol precipitation and resuspended in 30 µl
ddH2O.
Characterization and genotyping of mez1-mu insertion alleles. In order to facilitate
backcrossing and downstream analyses, a PCR-based genotyping assay was developed to
screen for the presence of the mu insertions at the Mez1 locus. To genotype field
samples, DNA was extracted from leaf tissue of segregating mez1-mu families as
described above. A primer specific to the mu TIR 9242 (see table 2 for all primer

112
sequences) and a Mez1-specific primer Mez1R31 downstream of the mu insertions were
used to assay the presence of mu. In order to distinguish between heterozygous mez1-mu
and homozygous mez1-mu, a separate PCR reaction was performed on each sample using
a Mez1-specific primer Mez1F32 upstream of the mu insertion sites with the Mez1R31
primer. A band in both the 9242/Mez1R31 and the Mez1F32/Mez1R31 reactions
indicates a heterozygous mez1-mu insertion. A band only in 9242/Mez1R31 or only in
Mez1F32/Mez1R31 indicates homozygous mez1-mu or homozygous wild-type,
respectively. PCR reactions were performed in a 15 µl total volume, containing
approximately 25 ng of DNA, 2.5 pmol of each primer, 0.33 units of HotStarTaq
Polymerase (Qiagen), 1.5 µl 10X reaction buffer and 0.1 µl of 25mM dNTPS. PCR
conditions were as follows: 94°C for 15 min, 35 cycles of 94°C for 1 min, 65°C for 30
sec and 72°C for 1 min, followed by 72°C for 10 min. The PCR products were separated
by electrophoresis in a 1% agarose TBE gel and observed by ethidium bromide staining.
To identify the location of each of the mez1-mu insertions, DNA was extracted
from leaf tissue of plants homozygous for each of the mez1-mu insertion alleles. 1µl
DNA was used in PCR reactions as described above with 9242/Mez1R31 and
9242/Mez1F32 primers. The appropriate sized band was verified by gel electrophoresis
and the remaining PCR product was purified with a PCR Purification Kit (Qiagen). PCR
products were sequenced using both Mez1R31 and Mez1F32 primers. Based on the
sequence, the location of the Mu insertions were identified by examining where Mez1
sequence terminated and Mu TIR sequence began. These same sequence reads were used
to obtain approximately 45 base pairs of the Mu TIR sequence and used for identification
of the Mu element responsible for each insertion allele.

113
In order to monitor imprinting or allele-specific DNA methylation patterns,
sequence polymorphisms within the coding region and DMR of Mez1 were identified in
the B73, Mo17, mez1-m1, mez1-m2 and mez1-m4 alleles. A region corresponding to the
3’ coding region and UTR was PCR-amplified from leaf tissue as described above using
the Mez1F33 and Mez1R33 primers. PCR products were purified using a Qiagen PCR
Purification kit and sequenced. The genotype for a previously identified cleaved
amplified polymorphism sequence (CAPS) marker was determined for each sample
(Haun et al, 2007). The Mez1 CAPS assay relies upon a polymorphism in an AluI
restriction site. A second region in the DMR was also amplified and sequenced using the
Mez1F55 and Mez1R52 PCR primers. The DMR CAPS assay relies upon a
polymorphism in an AciI restriction site.
Quantitative Real-Time PCR Assays. Real-time PCR assays were performed on first
strand cDNA (described above) from seedling or endosperm tissue using the Applied
Biosystems custom Taqman Gene Expression Assay (Foster City, CA, USA). 2 µl of
cDNA was amplified using an Applied Biosystems 7900HT Real-Time PCR System in a
20 µl reaction volume. A 2-fold dilution series (undiluted, 1:2, 1:4, 1:8 and 1:16
dilutions) calibration line was made from B73 seedling cDNA, prepared in an identical
manner to the seedling cDNA segregating for mez1-mu insertion alleles. Each sample
was amplified with primers specific to Mez1 and to the maize GAPC gene (Genbank
#X07156). Three technical replicates were performed for each sample. The average
cycle threshold (Ct) values were determined for the three technical replicates. Variations
in the amount of starting template were corrected for by calculating a ∆Ct value based on

114
the differences between Mez1 and GAPC Ct values. For each experiment (a comparison
of wild-type and mutants for each allele), the highest ∆Ct was subtracted from each
remaining Ct value to generate a relative ∆∆Ct. Fold change of Mez1 expression within
each experiment was calculated by the formula 2-∆∆Ct.
Allele-Specific Expression analyses. PCR-based assays for monitoring allele-specific
expression based on SNPs were designed using the MassArray platform from Sequenom
(San Diego, CA, USA) (see table 2 for PCR and extension primers for these assays).
First-strand cDNA was prepared from both pooled and individual endosperm RNA as
described above. Two technical replicates were performed for pooled endosperm cDNA,
three technical replicates were performed for individual endosperm cDNA. PCR and
extension PCR reactions on cDNA templates were performed as described Haun et al
(2007). Mass spectrometry quantification of allele ratios was performed at the University
of Minnesota Genotyping Facility. Multiple measurements of the ratio of the maternal
and paternal alleles were performed for each the technical replicates.
CAPS Analysis of Allele-Specific Expression. A 30 µl PCR reaction was performed on 2
µl of cDNA from sibling endosperm tissue that was heterozygous for the mez1-mu allele
or lacked the mez1-mu allele with primers corresponding to the Mez1 3’ coding region
and UTR (Mez1F33 and Mez1R33). Amplified DNA was ethanol-precipitated,
resuspended in 20 µl of water and digested with 20 units of AluI at 37°C overnight. The
enzyme was heat-inactivated at 65°C for 20 minutes and separated by electrophoresis in a

115
TBE gel containing 2.5% Metaphor (FMC Bioproducts, Rockland, ME, USA) and
observed by ethidium bromide staining.
CAPS Analysis of Allele-Specific DNA methylation. DNA from individual heterozygous
mez1-mu and wild-type sibling endopserms was digested with 10 units of the methyl-
sensitive restriction enzyme BstUI overnight at 60°C. The digested DNA was ethanol
precipitated and resuspended in 20 µl of water. A 30 µl PCR reaction was performed on
2 µl of DNA with primers corresponding to the Mez1 5’ DMR region (Mez1F55 and
Mez1R52). The PCR reaction was ethanol precipitated, resuspended in 20 µl of water
and digested with 10 units of AciI at 37°C overnight. The entire digestion reaction was
separated by electrophoresis in a TBE gel containing 2.5% Metaphor (FMC Bioproducts)
and observed by ethidium bromide staining.

116
REFERENCES
Baroux C, Gagliardini V, Page DR, Grossniklaus U (2006) Dynamic regulatory interactions of
Polycomb group genes: MEDEA autoregulation is required for imprinted gene expression in
Arabidopsis. Genes Dev 20: 1081-1086
Choi Y, Gehring M, Johnson L, Hannon M, Harada JJ, Goldberg RB, Jacobsen SE, Fischer RL
(2002) DEMETER, a DNA glycosylase domain protein, is required for endosperm gene
imprinting and seed viability in arabidopsis. Cell 110: 33-42
Choi Y, Harada JJ, Goldberg RB, Fischer RL (2004) An invariant aspartic acid in the DNA glycosylase
domain of DEMETER is necessary for transcriptional activation of the imprinted MEDEA gene.
Proc Natl Acad Sci U S A 101: 7481-7486
da Rocha ST, Ferguson-Smith AC (2004) Genomic imprinting. Curr Biol 14: R646-9
Danilevskaya ON, Hermon P, Hantke S, Muszynski MG, Kollipara K, Ananiev EV (2003) Duplicated
fie genes in maize: expression pattern and imprinting suggest distinct functions. Plant Cell 15:
425-438
Edwards CA, Ferguson-Smith AC (2007) Mechanisms regulating imprinted genes in clusters. Curr Opin
Cell Biol 19: 281-289
Feil R, Berger F (2007) Convergent evolution of genomic imprinting in plants and mammals. Trends
Genet 23: 192-199
Gehring M, Huh JH, Hsieh TF, Penterman J, Choi Y, Harada JJ, Goldberg RB, Fischer RL (2006)
DEMETER DNA glycosylase establishes MEDEA polycomb gene self-imprinting by allele-
specific demethylation. Cell 124: 495-506
Gutierrez-Marcos JF, Costa LM, Dal Pra M, Scholten S, Kranz E, Perez P, Dickinson HG (2006)
Epigenetic asymmetry of imprinted genes in plant gametes. Nat Genet 38: 876-878
Haig D, Westoby M (1989) Parent specific gene expression and the triploid endosperm. Am Nat 134: 147-
155
Haig D (2004) Genomic imprinting and kinship: how good is the evidence? Annu Rev Genet 38: 553-585
Haun WJ, Laoueille-Duprat S, O'connell MJ, Spillane C, Grossniklaus U, Phillips AR, Kaeppler SM,
Springer NM (2007) Genomic imprinting, methylation and molecular evolution of maize
Enhancer of zeste (Mez) homologs. Plant J 49: 325-337
Hermon P, Srilunchang KO, Zou J, Dresselhaus T, Danilevskaya ON (2007) Activation of the
imprinted Polycomb Group Fie1 gene in maize endosperm requires demethylation of the maternal
allele. Plant Mol Biol 64: 387-395
Huh JH, Bauer MJ, Hsieh TF, Fischer R (2007) Endosperm gene imprinting and seed development. Curr
Opin Genet Dev 17: 480-485

117
Jullien PE, Katz A, Oliva M, Ohad N, Berger F (2006) Polycomb group complexes self-regulate
imprinting of the Polycomb group gene MEDEA in Arabidopsis. Curr Biol 16: 486-492
Kinoshita T, Yadegari R, Harada JJ, Goldberg RB, Fischer RL (1999) Imprinting of the MEDEA
polycomb gene in the Arabidopsis endosperm. Plant Cell 11: 1945-1952
Kohler C, Hennig L, Bouveret R, Gheyselinck J, Grossniklaus U, Gruissem W (2003) Arabidopsis
MSI1 is a component of the MEA/FIE Polycomb group complex and required for seed
development. EMBO J 22: 4804-4814
Kohler C, Makarevich G (2006) Epigenetic mechanisms governing seed development in plants. EMBO
Rep 7: 1223-1227
Luo M, Bilodeau P, Dennis ES, Peacock WJ, Chaudhury A (2000) Expression and parent-of-origin
effects for FIS2, MEA, and FIE in the endosperm and embryo of developing Arabidopsis seeds.
Proc Natl Acad Sci U S A 97: 10637-10642
Morison IM, Ramsay JP, Spencer HG (2005) A census of mammalian imprinting. Trends Genet 21: 457-
465
Nowack MK, Shirzadi R, Dissmeyer N, Dolf A, Endl E, Grini PE, Schnittger A (2007) Bypassing
genomic imprinting allows seed development. Nature 447: 312-315
Spillane C, Baroux C, Escobar-Restrepo JM, Page DR, Laoueille S, Grossniklaus U (2004)
Transposons and tandem repeats are not involved in the control of genomic imprinting at the
MEDEA locus in Arabidopsis. Cold Spring Harb Symp Quant Biol 69: 465-475
Spillane C, MacDougall C, Stock C, Kohler C, Vielle-Calzada JP, Nunes SM, Grossniklaus U,
Goodrich J (2000) Interaction of the Arabidopsis polycomb group proteins FIE and MEA
mediates their common phenotypes. Curr Biol 10: 1535-1538
Springer NM, Danilevskaya ON, Hermon P, Helentjaris TG, Phillips RL, Kaeppler HF, Kaeppler
SM (2002) Sequence relationships, conserved domains, and expression patterns for maize
homologs of the polycomb group genes E(z), esc, and E(Pc). Plant Physiol 128: 1332-1345
Springer NM, Gutierrez-Marcos JF. (2008). Imprinting in maize. In The Maize handbook. (Eds. Hake
S, Bennetzen J) Springer-Verlag. New York.
Steshina EY, Carr MS, Glick EA, Yevtodiyenko A, Appelbe OK, Schmidt JV (2006) Loss of
imprinting at the Dlk1-Gtl2 locus caused by insertional mutagenesis in the Gtl2 5' region. BMC
Genet 7: 44
Stupar RM, Hermanson PJ, Springer NM (2007) Nonadditive expression and parent-of-origin effects
identified by microarray and allele-specific expression profiling of maize endosperm. Plant
Physiol 145: 411-425
Vielle-Calzada JP, Thomas J, Spillane C, Coluccio A, Hoeppner MA, Grossniklaus U (1999)
Maintenance of genomic imprinting at the Arabidopsis medea locus requires zygotic DDM1
activity. Genes Dev 13: 2971-2982

118
Wang D, Tyson MD, Jackson SS, Yadegari R (2006) Partially redundant functions of two SET-domain
polycomb-group proteins in controlling initiation of seed development in Arabidopsis. Proc Natl
Acad Sci U S A 103: 13244-13249
Xiao W, Gehring M, Choi Y, Margossian L, Pu H, Harada JJ, Goldberg RB, Pennell RI, Fischer RL
(2003) Imprinting of the MEA Polycomb gene is controlled by antagonism between MET1
methyltransferase and DME glycosylase. Dev Cell 5: 891-901

119
Table 1. Loss-of-imprinting is associated with mez1-mu insertion alleles.
Table 1. Loss of imprinting is associated with Mez1-mu insertion alleles
Allele Mu element Locationa Maternal loss-of-imprintingb
Paternal loss-of-imprintingb
mez1-m1 MuDR -38 5 (9) 2 (9)mez1-m2 Mu7 -151 2 (11) 8 (9)mez1-m4 Mu4 -158 12 (13) 12 (16)
aThe location of the Mu insertion relative to the transcription start site is indicated.bIn each cell the number of ears with a loss-of-imprinting is shown and the total number of ears tested is shown in parentheses.

120
Table 2. Primers used for CAPS imprinting assays, genotyping mez1-mu insertion alleles, DMR analyses, Mez1 real-time PCR Taqman(*) assays and Sequenom(**) assays.
Primer Sequence (5' 3')mez1F33 CACAAAGAAGCAGATAAGCGTGGAAAGmez1R33 TTGGGGCCTATGAATGACAGGTTCmuTIR9242 AGAGAAGCCAACGCCAWCGCCTCYATTTCGTCmez1F55 GGGGGCTAAAACTTGATAATAAACAMez1R52 CGGTCTCTGTGCATTTGTCCTTMez1F32 GACGAGCACACTGGTTTTTCCTACCMez1R31 CATCACCCGTGGAAACCCTAGCMEZ1-MZ11F* CCGGTCTCGCCCATCTAGMEZ1-MZ11R* AGCTCGCACAGCCGAATTAMEZ1-MZ11M1* CCGCCCAGGTCACCAGGAPC-GAP4F* CCTCACCGTCAGAATCGAGAAGGAPC-GAP4R* CACATAACCCATGATACCCTTGAGTGAPC-GAP4M2* CTCGGAAGCAGCCTTAATMez_1a_F** ACGTTGGATGATGCACCCTGCATAGTCTTGMez_1a_R** ACGTTGGATGGAGAAAGGACTTTCGTCTTGMez_1a_UEP** CCGGTTGACAAAGATGGTGGMez_1b_F** ACGTTGGATGTCGTGAGAACTCATCGTTCCMez_1b_R** ACGTTGGATGTCAGCTTGTCACCCATTCTGMez_1b_UEP** TCCTTTTCAACCTGAACAAMez_1c_F** ACGTTGGATGTCTACGATTCCCGCTATGAGMez_1c_R** ACGTTGGATGTTGCCCATCATCCTTTGCTCMez_1c_UEP** GCTATGAGCCTGACAGAGC

ATGTA SSR DMR
m1 (MuDR)~
4.9 kb~
m2 (Mu7)~2.2 kb
~
m4 (Mu4)~
2.2 kb
~
= 250bp
BstUI
Figure 1. Mu transposon insertions at Mez1. Approximately 2,000 bp of the Mez1 5’-cis proximal region is indicated by the bold line. The first exon, differentially methylated region (DMR) and TA single sequence repeat (SSR) is shown as shaded rectangles. The location of each mu transposon is shown by triangles, indicating the size of each insertion. The location of the methyl-sensitive BstUI restriction site used for the methylation assay is also indicated.
Figure 1
121

Figure 2. mez1-m1 insertions do not negatively impact plant health, seed weight or alter Mez1 expression in non-imprinted tissue. (a) Seedlings from a segregating 1:2:1 ear shown at 12 days after germination. mez1-m1 heterozygotes and homozygotes are phenotypically indistinguishable from wild-type siblings. (b) The weights of 100 seeds from a segregating 1:2:1 ear show a normal distribution, indicating loss-of-imprinting does not affect seed development. “#” indicates classes of seeds that were grown and genotyped (see text). (c) Real-time PCR results showing no effect on Mez1 expression in seedling of mez-m1 heterozygotes or homozygotes relative to wild-type siblings.
0
0.5
1
1.5
2
2.5
3
3.5
4
4.5
5
Wild-type Heterozygous mez1-m1
Homozygous mez1-m1
Rel
ativ
e Fo
ld-C
hang
e
Wild-type Heterozygous mez1-m1
Homozygous mez1-m1
Seed weight distribution
Figure 2
(a)
(b)
(c)
0
5
10
15
20
25
30
35
0.193 0.2054 0.2178 0.2302 0.2426 0.255 0.2674 0.2798 0.2922 0.3046 More
# ## # # #
122

Figure 3
(a)
(b)
Wild-type Heterozygous mez1-m2
Homozygous mez1-m2
0
0.5
1
1.5
2
2.5
Wild-type Heterozygous mez1-m2
Homozygous mez1-m2
Rel
ativ
e Fo
ld-C
hang
e(c)
0
5
10
15
20
25
30
35
0.245 0.2575 0.27 0.2825 0.295 0.3075 0.32 0.3325 0.345 0.3575 More
#
Figure 3. mez1-m2 insertions do not negatively impact plant health, seed weight or alter Mez1 expression in non-imprinted tissue. (a) Seedlings from a segregating 1:2:1 ear shown at 12 days after germination. mez1-m2 heterozygotes and homozygotes are phenotypically indistinguishable from wild-type siblings. (b) The weights of 100 seeds from a segregating 1:2:1 ear show a normal distribution, indicating loss-of-imprinting does not affect seed development. “#” indicates classes of seeds that were grown and genotyped (see text). (c) Real-time PCR results showing no effect on Mez1 expression in seedling of mez-m2 heterozygotes or homozygotes relative to wild-type siblings.
#
#
# # # #
123

(a)
Figure 4. mez1-m4 insertions do not negatively impact plant health, seed weight or alter Mez1 expression in non-imprinted tissue. (a) Seedlings from a segregating 1:2:1 ear shown at 12 days after germination. mez1-m4 heterozygotesand homozygotes are phenotypically indistinguishable from wild-type siblings. (b) The weights of 100 seeds from a segregating 1:2:1 ear show a normal distribution, indicating loss-of-imprinting does not affect seed development. “*” indicates classes of seeds that were grown and genotyped (see text). (c) Real-time PCR results showing no effect on Mez1 expression in seedling of mez-m4 heterozygotes or homozygotes relative to wild-type siblings. (d) Ear resulting from a selfed mez1-m1 heterozygous plant. No segregating kernel abnormalities were observed.
Figure 4
Wild-type Heterozygous mez1-m4
Homozygous mez1-m4
Rel
ativ
e Fo
ld-C
hang
e
Wild-type Heterozygous mez1-m4
Homozygous mez1-m4
0
0.5
1
1.5
2
2.5
0
5
10
15
20
25
30
35
40
0.21 0.2268 0.2436 0.2604 0.2772 0.294 0.3108 0.3276 0.3444 0.3612 More
(b)
(c) (d)
124

0
0.05
0.1
0.15
0.2
0.25
0.3
0.35
0.4
H H H WT WT H H WT WT Genotype
Mo17 band
B73 bands
Maternal transmissionB73WT/B73mu X Mo17WT/Mo17WT
Paternal transmissionMo17WT/Mo17WT X B73WT/B73mu
Maternal transmission of mu allelePaternal transmission of mu allele
Prop
ortio
n tra
nscr
ipts
from
pa
tern
al a
llele
0
2
4
6
8
10
12
Maternal transmission of mu allelePaternal transmission of mu allele
Het. mez1-m1 Het. mez1-m1 Wild-typeWild-type
Expr
essi
on le
vel
Figure 5. Maternal transmission of mez1-m1results in loss-of-imprinting. (a) Allele-specific expression was monitored in mez1-m1heterozygote and wild-type endosperm tissue. The expression in the wild-type endosperms is exclusively from the maternal parent. In heterozygous endosperms transmitted maternally, a faint paternal band is observed, indicating a loss-of-imprinting. (b) Quantification of paternal allele activation using Sequenom. RNA from the same endosperms as shown in (a) was analyzed with Sequenom. The proportion of transcripts from the paternal allele in wild-type tissue is virtually zero. The proportion of transcripts from the paternal allele in maternally-inherited mez1-m1 heterozygous endosperms is 17-38%. (c) Quantification of total Mez1 expression in heterozygous mez1-m1 and wild-type endosperm tissue. Real-time PCR results show no difference in overall Mez1 expression in loss-of-imprinting endosperms compared to wild-type. Expression level is relative to Mez1 expression in wild-type seedling tissue.
(a)
(b)
(c)
Figure 5
Het. mez1-m1 Wild-type
125

H H WT WT H H WT WT Genotype
Mo17 band
B73 bands
Maternal transmissionMo17WT/Mo17mu X B73WT/B73WT
Paternal transmissionB73WT/B73WT X Mo17WT/Mo17mu
Prop
ortio
n tra
nscr
ipts
from
pa
tern
al a
llele
0
2
4
6
8
10
Maternal transmission of mu allelePaternal transmission of mu allele
Het. mez1-m2 Het. mez1-m2 Wild-typeWild-type
Expr
essi
on le
vel
Figure 6. Paternal transmission of mez1-m2results in loss-of-imprinting in heterozygous and wild-type endosperms. (a) Allele-specific expression was monitored in mez1-m2heterozygote and wild-type endosperm tissue. In heterozygous endosperms transmitted paternally, a faint paternal band is observed, indicating a loss-of-imprinting. Wild-type sibling endosperms from the same cross also show a faint paternal band. (b) Quantification of paternal allele activation using Sequenom. RNA from the same endosperms as shown in (a) was analyzed with Sequenom. The proportion of transcripts from the paternal allele in maternally-inherited mez1-m1heterozygous endosperms is 21-33%. The proportion of transcripts from the paternal allele in wild-type tissue is 0-10%. (c) Quantification of total Mez1 expression in heterozygous mez1-m1and wild-type endosperm tissue. Real-time PCR results show no difference in overall Mez1expression in loss-of-imprinting endosperms compared to wild-type. Expression level is relative to Mez1 expression in wild-type seedling tissue.
0
0.05
0.1
0.15
0.2
0.25
0.3
0.35
Maternal transmission of mu allelePaternal transmission of mu allele
(a)
(b)
(c)
Figure 6
Het. mez1-m1 Wild-type
126

0
0.05
0.1
0.15
0.2
0.25
0.3
0.35
H H WT WT Genotype
Mo17 band
B73 bands
Maternal transmissionMo17WT/Mo17mu X B73WT/B73WT
Paternal transmissionB73WT/B73WT X Mo17WT/Mo17mu
Prop
ortio
n tra
nscr
ipts
from
pa
tern
al a
llele
Figure 7. Maternal and paternal transmission of mez1-m4 results in loss-of-imprinting. (a) Allele-specific expression was monitored in mez1-m4heterozygote and wild-type endosperm tissue. The expression in the wild-type endosperms is exclusively from the maternal parent (no paternal transcript was detected). In heterozygous endosperms transmitted maternally, a faint paternal band is observed, indicating a loss-of-imprinting. (b) Quantification of paternal allele activation using Sequenom. RNA from the same endosperms as shown in (a) was analyzed with Sequenom. The proportion of transcripts from the paternal allele in wild-type tissue is zero. The proportion of transcripts from the paternal allele in maternally-inherited mez1-m4 heterozygous endosperms is 14-16% and 16-24% when inherited paternally. (c) Quantification of total Mez1 expression in heterozygous mez1-m4 and wild-type endosperm tissue. Real-time PCR results show maternally inherited mez1-m4 endosperms
Maternal transmission of mu allelePaternal transmission of mu allele
H H H WT WTH
0
10
20
30
40
50
60
Maternal transmission of mu allelePaternal transmission of mu allele
Het. mez1-m4 Het. mez1-m4 Wild-typeWild-type
Expr
essi
on le
vel
Het. mez1-m1 Wild-type
(a)
(b)
(c)
Figure 7
127

128
Bibliography
Baroux C, Gagliardini V, Page DR, Grossniklaus U (2006) Dynamic regulatory interactions of
Polycomb group genes: MEDEA autoregulation is required for imprinted gene expression in
Arabidopsis. Genes Dev 20: 1081-1086
Baroux C, Pien S, Grossniklaus U (2007) Chromatin modification and remodeling during early seed
development. Curr Opin Genet Dev
Berger F (2003) Endosperm: the crossroad of seed development. Curr Opin Plant Biol 6: 42-50
Bestor TH (2000) The DNA methyltransferases of mammals. Hum Mol Genet 9: 2395-2402
Cao, X., Springer, N.M., Muszynski, M.G., Phillips, R.L., Kaeppler, S., Jacobsen, S.E. (2000)
Conserved plant genes with similarity to mammalian de novo DNA methyltransferases. Proc Natl
Acad Sci U S A, 97, 4979-84
Casati P, Campi M, Chu F, Suzuki N, Maltby D, Guan S, Burlingame AL, Walbot V (2008) Histone
Acetylation and Chromatin Remodeling Are Required for UV-B-Dependent Transcriptional
Activation of Regulated Genes in Maize. Plant Cell
Cattanach BM, Kirk M (1985) Differential activity of maternally and paternally derived chromosome
regions in mice. Nature 315: 496-498
Chaudhuri S, Messing J (1994) Allele-specific parental imprinting of dzr1, a posttranscriptional regulator
of zein accumulation. Proc Natl Acad Sci U S A 91: 4867-4871
Chaudhury AM, Ming L, Miller C, Craig S, Dennis ES, Peacock WJ (1997) Fertilization-independent
seed development in Arabidopsis thaliana. Proc Natl Acad Sci U S A 94: 4223-4228
Choi Y, Gehring M, Johnson L, Hannon M, Harada JJ, Goldberg RB, Jacobsen SE, Fischer RL
(2002) DEMETER, a DNA glycosylase domain protein, is required for endosperm gene
imprinting and seed viability in arabidopsis. Cell 110: 33-42
Choi Y, Harada JJ, Goldberg RB, Fischer RL (2004) An invariant aspartic acid in the DNA glycosylase
domain of DEMETER is necessary for transcriptional activation of the imprinted MEDEA gene.
Proc Natl Acad Sci U S A 101: 7481-7486

129
Crouse HV, Brown A, Mumford BC (1971) Chromosome inheritance and the problem of chromosome
"imprinting" in Sciara (Sciaridae, Diptera). Chromosoma 34: 324-39 8
da Rocha ST, Ferguson-Smith AC (2004) Genomic imprinting. Curr Biol 14: R646-9
Danilevskaya ON, Hermon P, Hantke S, Muszynski MG, Kollipara K, Ananiev EV (2003) Duplicated
fie genes in maize: expression pattern and imprinting suggest distinct functions. Plant Cell 15:
425-438
DeChiara TM, Robertson EJ, Efstratiadis A (1991) Parental imprinting of the mouse insulin-like growth
factor II gene. Cell 64: 849-859
Dilkes BP, Comai L (2004) A differential dosage hypothesis for parental effects in seed development.
Plant Cell 16: 3174-3180
Edwards CA, Ferguson-Smith AC (2007) Mechanisms regulating imprinted genes in clusters. Curr Opin
Cell Biol 19: 281-289
Feil R, Berger F (2007) Convergent evolution of genomic imprinting in plants and mammals. Trends
Genet 23: 192-199
Ferguson-Smith, A.C. and Surani, M.A. (2001) Imprinting and the epigenetic asymmetry between
parental genomes. Science, 293, 1086-1089
Gehring, M., Choi, Y. and Fischer, R.L. (2004) Imprinting and seed development. Plant Cell, 16 Suppl,
S203-13
Gehring M, Huh JH, Hsieh TF, Penterman J, Choi Y, Harada JJ, Goldberg RB, Fischer RL (2006)
DEMETER DNA glycosylase establishes MEDEA polycomb gene self-imprinting by allele-
specific demethylation. Cell 124: 495-506
Goodrich, J., Puangsomlee, P., Martin, M., Long, D., Meyerowitz, E.M. and Coupland, G. (1997) A
Polycomb-group gene regulates homeotic gene expression in Arabidopsis. Nature, 386, 44-51
Grewal SI, Moazed D (2003) Heterochromatin and epigenetic control of gene expression. Science 301:
798-802
Grimanelli D., Perotti E., Ramirez J., Leblanc O. (2005) Timing of the maternal-to-zygotic transition
during early seed development in maize. Plant Cell, 17, 1061-1072

130
Grossniklaus U, Vielle-Calzada JP, Hoeppner MA, Gagliano WB (1998) Maternal control of
embryogenesis by MEDEA, a polycomb group gene in Arabidopsis. Science 280: 446-450
Grossniklaus, U. (2005) Genomic imprinting in plants: a predominantly maternal affair. In Plant
Epigenetics (Meyer, P, ed). Blackwell Publishing, pp 174-200
Guo M, Rupe MA, Danilevskaya ON, Yang X, Hu Z (2003) Genome-wide mRNA profiling reveals
heterochronic allelic variation and a new imprinted gene in hybrid maize endosperm. Plant J 36:
30-44
Gutierrez-Marcos JF, Pennington PD, Costa LM, Dickinson HG (2003) Imprinting in the endosperm: a
possible role in preventing wide hybridization. Philos Trans R Soc Lond B Biol Sci 358: 1105-
1111
Gutierrez-Marcos JF, Costa LM, Biderre-Petit C, Khbaya B, O'Sullivan DM, Wormald M, Perez P,
Dickinson HG (2004) maternally expressed gene1 Is a novel maize endosperm transfer cell-
specific gene with a maternal parent-of-origin pattern of expression. Plant Cell 16: 1288-1301
Gutierrez-Marcos JF, Costa LM, Dal Pra M, Scholten S, Kranz E, Perez P, Dickinson HG (2006)
Epigenetic asymmetry of imprinted genes in plant gametes. Nat Genet 38: 876-878
Haig D, Westoby M (1989) Parent specific gene expression and the triploid endosperm. Am Nat 134: 147-
155
Haig D (2004) Genomic imprinting and kinship: how good is the evidence? Annu Rev Genet 38: 553-585
Haring M, Offermann S, Danker T, Horst I, Peterhansel C, Stam M (2007) Chromatin
immunoprecipitation: optimization, quantitative analysis and data normalization. Plant Methods 3:
11
Haun WJ, Laoueille-Duprat S, O'connell MJ, Spillane C, Grossniklaus U, Phillips AR, Kaeppler SM,
Springer NM (2007) Genomic imprinting, methylation and molecular evolution of maize
Enhancer of zeste (Mez) homologs. Plant J 49: 325-337
Hermon P, Srilunchang KO, Zou J, Dresselhaus T, Danilevskaya ON (2007) Activation of the
imprinted Polycomb Group Fie1 gene in maize endosperm requires demethylation of the maternal
allele. Plant Mol Biol 64: 387-395
131
Huh JH, Bauer MJ, Hsieh TF, Fischer R (2007) Endosperm gene imprinting and seed development. Curr
Opin Genet Dev 17: 480-485
Jullien PE, Katz A, Oliva M, Ohad N, Berger F (2006) Polycomb group complexes self-regulate
imprinting of the Polycomb group gene MEDEA in Arabidopsis. Curr Biol 16: 486-492
Jurinke C, Denissenko MF, Oeth P, Ehrich M, van den Boom D, Cantor CR (2005) A single
nucleotide polymorphism based approach for the identification and characterization of gene
expression modulation using MassARRAY. Mutat Res 573: 83-95
Kaplinsky, N.J., Braun, D.M., Penterman, J., Goff, S.A. and Freeling, M. (2002) Utility and
distribution of conserved noncoding sequences in the grasses. Proc Natl Acad Sci U S A, 99,
6147-6151
Kermicle JL (1970) Dependence of the R-Mottled Aleurone Phenotype in Maize on Mode of Sexual
Transmission. Genetics 66: 69-85
Killian JK, Nolan CM, Wylie AA, Li T, Vu TH, Hoffman AR, Jirtle RL (2001) Divergent evolution in
M6P/IGF2R imprinting from the Jurassic to the Quaternary. Hum Mol Genet 10: 1721-1728
Kinoshita T, Yadegari R, Harada JJ, Goldberg RB, Fischer RL (1999) Imprinting of the MEDEA
polycomb gene in the Arabidopsis endosperm. Plant Cell 11: 1945-1952
Kinoshita T, Miura A, Choi Y, Kinoshita Y, Cao X, Jacobsen SE, Fischer RL, Kakutani T (2004)
One-way control of FWA imprinting in Arabidopsis endosperm by DNA methylation. Science
303: 521-523
Köhler C, Grossniklaus U (2002) Epigenetic inheritance of expression states in plant development: the
role of Polycomb group proteins. Curr Opin Cell Biol 14: 773-779
Köhler C, Hennig L, Bouveret R, Gheyselinck J, Grossniklaus U, Gruissem W (2003) Arabidopsis
MSI1 is a component of the MEA/FIE Polycomb group complex and required for seed
development. EMBO J 22: 4804-4814
Köhler C, Hennig L, Spillane C, Pien S, Gruissem W, Grossniklaus U (2003) The Polycomb-group
protein MEDEA regulates seed development by controlling expression of the MADS-box gene
PHERES1. Genes Dev 17: 1540-1553

132
Köhler C, Page DR, Gagliardini V, Grossniklaus U (2005) The Arabidopsis thaliana MEDEA Polycomb
group protein controls expression of PHERES1 by parental imprinting. Nat Genet 37: 28-30
Köhler C, Makarevich G (2006) Epigenetic mechanisms governing seed development in plants. EMBO
Rep 7: 1223-1227
Kono T, Sotomaru Y, Katsuzawa Y, Dandolo L (2002) Mouse parthenogenetic embryos with
monoallelic H19 expression can develop to day 17.5 of gestation. Dev Biol 243: 294-300
Kumar, S., Tamura, K., Jakobsen, I.B. and Nei, M. (2001) MEGA2: molecular evolutionary genetics
analysis software. Bioinformatics, 17, 1244-1245
Li E (2002) Chromatin modification and epigenetic reprogramming in mammalian development. Nat Rev
Genet 3: 662-673
Lippman, Z., Gendrel, A.V., Black, M., Vaughn, M.W., Dedhia, N., McCombie, W.R., Lavine, K.,
Mittal, V., May, B., Kasschau, K.D., Carrington, J.C., Doerge, R.W., Colot, V. and
Martienssen, R. (2004) Role of transposable elements in heterochromatin and epigenetic control.
Nature, 430, 471-6
Lund G, Ciceri P, Viotti A (1995a) Maternal-specific demethylation and expression of specific alleles of
zein genes in the endosperm of Zea mays L. Plant J 8: 571-581
Lund G, Messing J, Viotti A (1995b) Endosperm-specific demethylation and activation of specific alleles
of alpha-tubulin genes of Zea mays L. Mol Gen Genet 246: 716-722
Luo M, Bilodeau P, Koltunow A, Dennis ES, Peacock WJ, Chaudhury AM (1999) Genes controlling
fertilization-independent seed development in Arabidopsis thaliana. Proc Natl Acad Sci U S A 96:
296-301
Luo M, Bilodeau P, Dennis ES, Peacock WJ, Chaudhury A (2000) Expression and parent-of-origin
effects for FIS2, MEA, and FIE in the endosperm and embryo of developing Arabidopsis seeds.
Proc Natl Acad Sci U S A 97: 10637-10642
Makarevich G., Leroy O., Akinci U., Schubert D., Clarenz O., Goodrich J., Grossniklaus U. and
Kohler C. (2006) Different Polycomb group complexes regulate common target genes in
Arabidopsis. EMBO rep, Jul 28; [Epub ahead of print]

133
Moore T, Haig D (1991) Genomic imprinting in mammalian development: a parental tug-of-war. Trends
Genet 7: 45-49
Morison IM, Ramsay JP, Spencer HG (2005) A census of mammalian imprinting. Trends Genet 21: 457-
465
Muller J, Hart CM, Francis NJ, Vargas ML, Sengupta A, Wild B, Miller EL, O'Connor MB,
Kingston RE, Simon JA (2002) Histone methyltransferase activity of a Drosophila Polycomb
group repressor complex. Cell 111: 197-208
Nagaki K, Talbert PB, Zhong CX, Dawe RK, Henikoff S, Jiang J (2003) Chromatin
immunoprecipitation reveals that the 180-bp satellite repeat is the key functional DNA element of
Arabidopsis thaliana centromeres. Genetics 163: 1221-1225
Nakayama J, Rice JC, Strahl BD, Allis CD, Grewal SI (2001) Role of histone H3 lysine 9 methylation
in epigenetic control of heterochromatin assembly. Science 292: 110-113
Nowack MK, Shirzadi R, Dissmeyer N, Dolf A, Endl E, Grini PE, Schnittger A (2007) Bypassing
genomic imprinting allows seed development. Nature 447: 312-315
Ohad N, Margossian L, Hsu YC, Williams C, Repetti P, Fischer RL (1996) A mutation that allows
endosperm development without fertilization. Proc Natl Acad Sci U S A 93: 5319-5324
Ohlsson R, Nystrom A, Pfeifer-Ohlsson S, Tohonen V, Hedborg F, Schofield P, Flam F, Ekstrom TJ
(1993) IGF2 is parentally imprinted during human embryogenesis and in the Beckwith-
Wiedemann syndrome. Nat Genet 4: 94-97
Peterson CL, Laniel MA (2004) Histones and histone modifications. Curr Biol 14: R546-51
Preuss, D. (1999) Chromatin silencing and Arabidopsis development: A role for polycomb proteins. Plant
Cell, 11, 765-768
Reik W, Walter J (2001) Genomic imprinting: parental influence on the genome. Nat Rev Genet 2: 21-32
Sanderson MJ, Thorne JL, Wikström N, Bremer K (2004) Molecular evidence on plant divergence times. Am J Bot 91: 1656–1665

134
Spillane C, MacDougall C, Stock C, Kohler C, Vielle-Calzada JP, Nunes SM, Grossniklaus U,
Goodrich J (2000) Interaction of the Arabidopsis polycomb group proteins FIE and MEA
mediates their common phenotypes. Curr Biol 10: 1535-1538
Spillane C, Baroux C, Escobar-Restrepo JM, Page DR, Laoueille S, Grossniklaus U (2004)
Transposons and tandem repeats are not involved in the control of genomic imprinting at the
MEDEA locus in Arabidopsis. Cold Spring Harb Symp Quant Biol 69: 465-475
Springer NM, Danilevskaya ON, Hermon P, Helentjaris TG, Phillips RL, Kaeppler HF, Kaeppler
SM (2002) Sequence relationships, conserved domains, and expression patterns for maize
homologs of the polycomb group genes E(z), esc, and E(Pc). Plant Physiol 128: 1332-1345
Springer NM, Napoli CA, Selinger DA, Pandey R, Cone KC, Chandler VL, Kaeppler HF, Kaeppler
SM (2003) Comparative analysis of SET domain proteins in maize and Arabidopsis reveals
multiple duplications preceding the divergence of monocots and dicots. Plant Physiol 132: 907-
925
Springer NM, Gutierrez-Marcos JF. (2008). Imprinting in maize. In The Maize handbook. (Eds. Hake
S, Bennetzen J) Springer-Verlag. New York.
Stam, M., Belele, C., Ramakrishna, W., Dorweiler, J.E., Bennetzen, J.L. and Chandler, V.L. (2002)
The regulatory regions required for B' paramutation and expression are located far upstream of the
maize b1 transcribed sequences. Genetics, 162, 917-30
Steshina EY, Carr MS, Glick EA, Yevtodiyenko A, Appelbe OK, Schmidt JV (2006) Loss of
imprinting at the Dlk1-Gtl2 locus caused by insertional mutagenesis in the Gtl2 5' region. BMC
Genet 7: 44
Stupar RM, Hermanson PJ, Springer NM (2007) Nonadditive expression and parent-of-origin effects
identified by microarray and allele-specific expression profiling of maize endosperm. Plant
Physiol 145: 411-425
Surani MA, Barton SC, Norris ML (1984) Development of reconstituted mouse eggs suggests imprinting
of the genome during gametogenesis. Nature 308: 548-550
Tamaru H, Selker EU (2001) A histone H3 methyltransferase controls DNA methylation in Neurospora
crassa. Nature 414: 277-283

135
Thompson, J.D., Gibson, T.J., Plewniak, F., Jeanmougin, F. and Higgins, D.G. (1997) The ClustalX
windows interface: flexible strategies for multiple sequence alignment aided by quality analysis
tools. Nucleic Acids Research, 25, 4876-4882
Vielle-Calzada JP, Thomas J, Spillane C, Coluccio A, Hoeppner MA, Grossniklaus U (1999)
Maintenance of genomic imprinting at the Arabidopsis medea locus requires zygotic DDM1
activity. Genes Dev 13: 2971-2982
Walter J, Paulsen M (2003) Imprinting and disease. Semin Cell Dev Biol 14: 101-110
Wang D, Tyson MD, Jackson SS, Yadegari R (2006) Partially redundant functions of two SET-domain
polycomb-group proteins in controlling initiation of seed development in Arabidopsis. Proc Natl
Acad Sci U S A 103: 13244-13249
Weisstein AE, Feldman MW, Spencer HG (2002) Evolutionary genetic models of the ovarian time bomb
hypothesis for the evolution of genomic imprinting. Genetics 162: 425-439
Wrzeska, M. and Rejduch, B. (2004) Genomic imprinting in mammals. J. Appl. Genet, 45, 427-433
Wolfe KH, Gouy M, Yang YW, Sharp PM, Li WH (1989) Date of the monocot-dicot divergence
estimated from chloroplast DNA sequence data. Proc Natl Acad Sci U S A 86: 6201-6205
Xiao W, Gehring M, Choi Y, Margossian L, Pu H, Harada JJ, Goldberg RB, Pennell RI, Fischer RL
(2003) Imprinting of the MEA Polycomb gene is controlled by antagonism between MET1
methyltransferase and DME glycosylase. Dev Cell 5: 891-901
Yang Y, Li T, Vu TH, Ulaner GA, Hu JF, Hoffman AR (2003) The histone code regulating expression
of the imprinted mouse Igf2r gene. Endocrinology 144: 5658-5670
Yerk, G.L., Phillips, R.L. and Kowles, R.V. (1993) Allele-specific degradation in endosperm
development. Maize Genetics Coop Newsletter, 67, 103-14