Embed Size (px)
Citation preview

EPIDEMIOLOGY OF HUMAN INTESTINAL
PARASITES IN QWA-QWA, SOUTH AFRICA
by
THABANG INNOCENTIA MOSALA
Submitted in fulfilment of the academic
requirements for the degree of
Master of Science
in the
Department of Zoology and Entomology,
University of Natal
Pietermaritzburg
1995

FRONTISPIECE
View over Qwa-Qwa from Makhabane primary school at 2200m altitude - the highest rural community in South Africa .
I

ABSTRACT
This study investigated the prevalences and intensity of
intestinal parasites and aspects of their epidemiology among
children in the Qwa-Qwa region of the eastern Free St~te. Faecal
samples of 1180 children differing socio-economic status from
nine schools at altitudes varying from 1660m to 2200m were
examined quantitatively by means of the formol-ether
sedimentation technique. Socio-economic, and demographic
characteristics for the communities served by the schools were
obtained from the literature and from a questionnaire.
The study showed that, the area supports a markedly low diversity
of parasite infections, and at lower intensities, than low
altitude areas such as the coastal plain of KwaZulu-Natal and
Eastern Cape, the Northern Province, Mpumalanga and the Western
Cape. The intestinal parasite fauna affecting children in Qwa-Qwa
is dominated by protozoans with only few helminths and no
hookworm or bilharzia.
The results indicated that factors which influence the
transmission of intestinal parasites in Qwa-Qwa appear to be
related primarily to social, economic and cultural aspects of the
peoples' lifestyles. Climatic factors were not found important.
There was a significant seasonal effect on the intensities of all
parasite infection, except two protozoans, Entamoeba coli and
Endolimax nana.
ii

Water source, electricity, house-type and quality of meat were
found to be the important socio-economic factors that influenced
parasite transmission. These relationships were investigated by
fitting logistic regression and generalized linear mixed models.
By documenting human parasitism (above 1700m) tl:lis study provided
an endpoint to the altitudinal transect conducted in 1993 in
KwaZulu-Natal by Appleton and Gouws (in press). Public health
authorities and Primary Health Care personnel should find this
study useful when designing and implementing nutrition and
parasite control. Severe ascariasis has been reported from the
study area. It will help focus PHC activities in Qwa-Qwa and in
the wider context of Free State Province by demonstrating the
value of proper personal and environmental hygiene in the home,
thereby forming ' the basi's for intestinal parasite control at the
community level.
iii

PREFACE
The research work described i n this dissertation was carried out
in the Department of Zoology and Entomology, University of Natal,
from January 1994 to December 1995, under the supervision of
Professor Chris C. Appleton.
These studies represent original work by author and have not
otherwise been submitted in any form for any degree or diploma
to any University. Where use has been made of the work of others
it is duly acknowledged in the text .
. IV
TABLE OF CONTENTS
Abstract
Preface
Table of contents
Acknowledgements
List of appendices
List of tables
List of figures
List of plates
Chapter 1 GENERAL INTRODUCTION
Chapter 2 LITERATURE REVIEW
Chapter 3 THE STUDY AREA
3.1 Introduction
3.2 Topography and climatic factors
3.2.1 Topography
3.2.2 Rainfall
3.2.3
3.2.4
3.2.5
3.2.6
3.2.7
3.2.8
3.2.9
3.2.10
Chapter 4
Environmental temperature
Sunshine
Relative hummidity
Wind
Frost
Soil types
Flood plains
Characteristics of schools sampled
METHODOLOGY
4.1 Introduction
4 . 2 Stool collection and analysis
4.3 Chemotharapy
v
Page no
ii
iv
v
vii
ix
x
xi
xi;i
1
11
17
17
17
18
18
19
19
19
20
20
20
20
22
24
24
25
27

4.4 Questionnaire 4 . 5 Statistical analysis
Chapter 5
5.1
5.2
5.3.1 5.3.2
5.3.2.1
5.3.2.2
RESULTS
Introduction
Prevalence of intestinal parasites
Intensities of intestinal parasites Polyparasitism
Frequencies of overall polyparasitism in the
nine schools in summer
Frequencies of overall polyparasitism in the
eight schools in winter
5.4 Morphology and diagnostic features of cysts and
28
30
32
32
33 34
35
35
37
eggs of intestinal parasites found in the study area 39
5.4.1
5.4.1.1 5.4.1.2
5.4.2 5.4.3
5.5
5.5.1 5.5.2 5.5.3
5.6
5.6.1
5.6.1.1 5.6.1.2 5.6.1.3
5.6.1.4
The protozoans
The flagellates
The amoebae
The cestodes The nematodes
STATISTICAL ANALYSIS
Introduction Relationships between prevalence and ~ltitude Relationship between prevalence and soil type Relationship between prevalence and socio-economic factors
Gender prevalence profiles by school
Prevalences in males and females Prevalences in different age classes
Effect of household size on transmission
Effect of level of education on transmission
vi
39
39
40
41 42
43
43 44 44
44
45
45 46
46
47

5.6.1.5
5.6.1.6 5.6.1.7
5.6.1.8 5.6.1.9 5.6.1.10
5.6.1.11
Effect of level of employment of
parents/guardian on transmission
Effect of household income on transmission Effect of housing quality on transmission
Effect of kind of meat eaten on transmission Effect of source of meat on transmission Effect of quality of meat on transmission
Effect of distance from water source on transmission
4 9
50
50 51 52 52
52
5.6.1.12 Effect of sanitation on parasite transmission 53
5.6.1.13 Effect of electricity on transmission 54
5.7 STATISTICAL MODELS 54
Chapter 6 GENERAL DISCUSSION 59
Chapter 7 CONCLUSIONS AND RECOMMENDATIONS 75
REFERENCES 83
vii

APPENDIX A
APPENDIX B
APPENDIX C
APPENDIX D
APPENDIX E
LIST OF APPENDICES
Modified merthiolate-iodine-formaldehyde concentration technique
Parent consent form
Questionnaire
Prevalences of intestinal parasites by school with respect to age and gender.
Morphology and diagnostic features of intestinal protozoans
viii

Table
Table 1
Table 2
Table 3
Table 4.1
Table 4.2
Table 5
Table 5.1a
Table 5.1b
Table 6.1 to
Table 7
Table 15a
& 15b
Table 16
LIST OF TABLES
Page no
Description of soil types 21
Description of s ampling sites 26
Qualitative and quantitative methods of 27 measuring parasite infection.
Seasonal effect on the prevalences of 33 protozoans in the nine schools in summer
Seasonal effect on the prevalences of 33 protozoans in the nine schools in winter
Overall prevalences of intestinal parasites 34 in Qwa-Qwa during summer and winter
Mean intensities of protozoans and cestodes 45 at the nine schools in summer
Mean intensities of protozoans and cestodes 45 at the nine scools in winter
14 (except Table 7) are in Appendix E.
Geometric mean egg counts fro the nematodes 34 in summer and winter
Comparison of intestinal parasites in 59 KwaZulu-Natal, Lesotho and Qwa-Qwa.
Comparison of intestinal parasites along an 6 0 altitudinal transect fron KwaZulu-Natal to Qwa-Qwa.
i x

LIST OF FIGURES
Figure
Figure 1 Qwa-Qwa in the national context
Figure 2 Map of Qwa-Qwa indicating gradients of slope
Page no
17
18
Figure 3 Map of Qwa-Qwa showing distribution of 18 rainfall patterns
Figure 4 Map of Qwa-Qwa showing distribution of 20 different soil types
Figure 5 The study area showing settlements 24
Figure 6 Graph of percentages of children not 44 infected with intestinal parasites in the nine schools sampled
Figure 7 Relative frequencies of parasite infection 45 among infected males and females
Figure 8 Prevalences of intestinal parasites 46 in summer and winter in the three age classes at selected schools
Figure 9 Graphs of prevalences of intestinal parasites 60 in Qwa-Qwa, Lesotho and Kwa-Zulu-Natal
x

Plate
FRONTISPIECE
PLATE I
PLATE II
PLATE III
PLATE IV
PLATE V
PLATE VI
PLATE VII
PLATE VIII
LIST OF PLATES
Views of settlements in Qwa-Qwa
Cysts of protozoan flagellates
Cysts of protozoan amoebae
Cestode eggs
Nematode eggs
Ascaris lumbricoides eggs
Qualitative estimate of intensities of infection
Intestinal bolus due to A. lumbricoides
xi
Page no
23
39
40
41
42
43
67
65

ACKNOWLEDGEMENTS
This work could not have been completed if the mastermind in
parasitology Prof. Chris Appleton was not behind it all and whom
I want to express my greatest appreciation, respect and
gratitude, for the tremendous patience and dedication, critical
and constructive criticism shown in compiling this dissertation.
I shall not stop giving my special thanks to the University
Development Programme (FRO) for their financial support
throughout this study.
I also want to thank the University of the North for giving me
the opportunity to improve my qualifications by granting study
leave.
My specially thanks are extended to Mrs Colleen Archer, for her
patience and dedication in teaching me the skills of intestinal
parasite diagnosis.
Mr Jonathan Levin, the amount of time and dedication you
sacrificed in helping with the statistical analysis and models,
is tremendously appreciated. I thank you ever so much.
This study was made possible by the support and participation I
got from all the parents, children, principals, clinic nurses,
teachers, social workers, health inspectors, Ntate Manyane, Ntate
Weeto, Mr Buys, Mrs Morailane, Mrs Ramongalo, Mrs Matla, Mrs
Bolofo and Mrs Motsekuwa from the Primary Health Care my special
xii

thanks to all of them for their support indeed.
My acknowledgement goes to Dr. Jerry Moloi and Mr Fladdy Modise
and his laboratory staff at Manapo Hospital for allowing me to
use the laboratory and their tolerance and patience during
sampling.
I thank the Electron Microscopy Unit staff, Bellinda White, CilIa
Donnelly and Vijay Bandu for all the assistance. I also want to
thank all the staff of Department of Zoology & Entomology, Billy
Boodhoo your advice in preparation of the photographic work is
greatly appreciated.
Finally I want to thank my family for their constant support,
courage, love and understanding, Ntate Ramotseare, Mme maThabang,
Photile, Koli, Beoana, Ramokoni, Lebohang, Shwanky and Mathuloe.
xiii

Chapter 1
INTRODUCTION
1.1 Introduction
The epidemiology of human intestinal parasites at high altitudes
in South Africa has not been researched. This study aims to
determine the effect of environmental, socio-economic and socio
cultural factors on the epidemiology of intestinal parasites in
South Africa with special reference to Qwa-Qwa. The study area
lies between 1600 and 2200m altitude and is the highest densely
inhabited part of South Africa. It also forms an endpoint to the
altitudinal transect conducted in 1993 in KwaZulu-Natal by
Appleton & Gouws (in press) .
Intestinal protozoans and nematodes have become adapted to
practically all types of environment. Their cysts and eggs They
are able to adjust to a wide range of temperatures, pH, salinity
and nutriment. Moreover, species that secrete a thick, relatively
impermeable cyst wall, are able to survive long periods of
desiccation (Beaver et al . , 1984) .
Parasitic infection of human bowel is a world-wide phenomenon.
Ascaris lumbricoides and Trichuris trichiura are the commonest.
Stoll (1947) estimated that one person for every four, allover
the world, was infected with the common roundworm and whipworm
infected about 350 million people, both estimates still hold at
the present time.
1

In 1964 the World Health Organization (WHO) suggested that in
assessing the relative importance of helminths 'and the
desirability of introducing control programmes and feeding
schemes, and understanding the population dynamics and
epidemiology of infectious disease agents was necessary (Anderson
and May, (1992) and Ukoli, (1984). The factors of primary
importance are those which affect transmission. The combined
effects of these factors determine the distribution and
prevalence of the parasites at any given time and place (Ukoli,
1984). Appleton and Kvalsvig (1994) support this concern noting
that little is known of the geographical distribution of human
intestinal parasites in South Africa. They point out that
KwaZulu-Natal is the best documented province with regard to
information on the prevalences and intensities of
gastrointestinal parasitism. Remarkably little is known however
about the actual routes of parasite transmission in these areas.
Surveys done during the last few decades were almost always on an
ad hoc basis and thus cannot usefully be compared with one
another. The study therefore represents the first detailed
assessment of the prevalences, intensities, distribution and
transmission routes of intestinal parasites in a defined area in
South Africa. The only other study which investigated
transmission routes was the one conducted by Mqoqi (1993) on
urinary schistomiasis in the former Transkei.
A moment's thought on any disease reveals the truth that
transmission rates combine many biological, social, and
environmental factors and the best way to measure transmission
2

is to examine these factors indirectly (Brown, 1969).
Many species of intes·tinal parasites have complex life cycles
involving developmental stages that live in soil (cysts, ova and
helminth larvae) or wat.er (protozoan cysts and helminth eggs), or
use various kinds of intermediate hosts, including invertebrates
like insects, snails and vertebrates like pigs, rats and cattle
(Beaver et al., 1984).
Crompton et ale (1989) explained two ways (direct and indirect)
by which intestinal parasites can be transmitted.
1. Direct transmission involves the infective stages (egg or
cyst) of parasites passing directly from one host to the
next. Examples are all the intestinal protozoan, and
nematodes. The latter include Enterobius vermicularis,
Trichuris trichiura and Ascaris lumbricoides . The life-cycle
of E. vermicularis follows the direct-faecal-oral route
while those of T. trichiura and A. lumbricoides follows the
faecal-soil-oral route. None of these parasites need an
intermediate host . Hookworm and Strongyloides produce free
living larvae which also have to develop outside the host.
2. Indirect transmission involves the infective stage passing
through one or more intermediate hosts in order to complete
its life cycle. Plasmodium falciparum, which causes malaria,
needs the mosquito to complete its life cycle and
Schistosoma needs a snail in which to produce its infective
stages (cercariae).
3

Winbald and Kilama (1992) stress that while viruses, bacteria,
protozoans and worms can be spread through direct contact ~s well
as indirectly via food, water and soil or via mechanical vectors
like flies and fleas. Protozoan diseases like amoebic dysentery
and giardiasis and wo~ infections like ascariasis, trichuriasis
and pinworm are transmitted through faecally contaminated food or
drink.
The principles of ecology apply as much to parasitic organisms as
to others, because epidemiology is the study of factors affecting
the distribution and transmi ssion of human parasitic diseases.
Thus water, flies, soil and raw vegetables may be vectors for a
variety of parasitic diseases especially. those found in the
present study area. A high degree of environmental contamination
with eggs of Ascaris can result in their being found on the
following sites in addition to soil and sewage: door handles,
wash basins, furniture, dust in houses and transport), fruit,
vegetables, pickles, insects, chopping boards, public baths,
paper money, nail dirt, fingernails, nasal discharge,
underclothes, coins and school rooms (Crompton et aI, 1989).
Viable pinworm eggs have been found in the following locations:
bed linen, towels, furniture, windowsills, doorjambs and dust
about the house (Beck & Davies, 1976; Beaver et al., 1984 and
Ukoli, 1984).
Parasite prevalences are determined not only by the combined
effects of ecological and climatic factors and their vectors, but
human behaviour, cultural practices, customs and traditions, and
4

their socio economic situations can also playa part (Most, 1951;
Horton-Smith, 1957; Jeon, 1973; Crompton et al., 1989; Holland et
al., 1988; Edungbola et al., 1988; Kirkby, 1988; Watts, 1986;
Pammenter, 1988; Kirky, 1988; Chandiwana, 1986; Piekarski, 1989;
Iputo et al., 1992; Greenberg, 1993 and Sarti et al., 1994).
However the ecological and climatic factors are by far the most
important. It is therefore not surprising that many control
programmes in the past have sought to eliminate vectors such as
mosquitoes in the case of malaria or snails in the case of
schistosomiasis and so prevent them ~rom transmitting disease. It
is because of the apparent failure of these approaches to · achieve
control that (Dunn, 1979; Holland et al., 1988 and Watts, 1993)
have suggested that attention should be focused on the effect of
socio-economic and socio-cultural factors as well. The chances of
infection by parasites increase when the climate favours the
survival and development of infective stages like eggs and cysts
outside the primary host. In the case of South Africa this is
most likely in KwaZulu-Natal, Mpumalanga and the Northern
Province.
There is an important temperature difference between air and
ground (Geiger, 1950). Wind effects generally ensure that
temperatures will be more extreme close to the air/ground
interface than above it. The transmission potentials of
intestinal parasites with complex life cycles (e.g bilharzia,
hookworm) are influenced by the temperature of the water and/or
soil in which they are transmitted. Water, air and soil
temperature can for example induce substantial changes in life .
5

expectancies of free living infective stages, such as L3 (third
larval stage) of hookworms or the miracidia or cercaria of
schistosomes (Anderson and May, 1992).
The eggs of hookworm, . pinworm, and Schistosoma have transparent
shells. For these eggs to hatch they need a warm climate to be
able to develop quickley. Pitchford (1981) found that
distribution of Schistosoma could be correlated with certain air
temperature regimes.
Beaver et al. (1984) and Anderson & May (1992) concluded that
high temperatures usually induce rapid parasite development and
vice versa. According to Learmonth (1988) larval transmission of
hookworm, which occurs via the skin of bare feet on damp ground
polluted with infected faeces, is especially favoured in warm,
humid cl,imates and where there is decaying vegetation. One of the
features responsible for the success of nematodes is the
structure and chemical composition of their egg shells. This
allows development of the embryo to occur even at low
temperatures, Ukoli (1984). Ascaris is the more common in humans
than any other helminth (Stoll, 1947). It is a cosmopolitan
intestinal parasite, and the largest roundworm found in humans
and also the most widespread. One feature which has a profound
influence on the epidemiology of this parasite is its eggshell
which is tough, light and adhesive. It also allows development of
the embryo under adverse environmental conditions and can survive
in the presence of chemicals like ether and formalin, both which
are lethal to other parasite eggs like Schistosoma, hookworms and
6

Strongyloides (Crompton et al., 1989). If conditions are
unfavourable for development of the larva the egg can lie dormant
for a period of up to six years (Muller, 1953 in Crompton et al.,
1989) . The Trichuris egg becomes fully embryonated after 3~ weeks
at 26°C and remains infective for 4 to 4~ weeks at this
temperature, high rainfall and humidity, dense shade and in
moisture retaining soil (Schimdt & Roberts, 1985; Cheesbrough,
1991; Garaguso, 1981; Beaver et al., 1984; Fullerborn, 1923 in
Anderson, 1992).
Another factor that contributes to the success of nematodes is
their high productivity of transmission stages which offsets the
low probability that anyone infective stage gains entry to a new
host. Ascaris is didelphic and each female is capable of laying
up to 200 000 eggs per day, Trichuris is monodelphic and lays 10
000 to 30 000 eggs per day. It has been estimated that each
female contains 4572 - 16 888 eggs. After laying the eggs she
perishes (Beaver et al., 1984 and Anderson, 1992)
The major diseases transmitted through water are schistomiasis,
amoebiasis and giardiasis (Winbald & Kilama, 1992 and Meyer,
1992. Transmission of these parasites can occurs directly via the
faecal-oral-route, ingestion of contaminated food, person to
person contact and also by consumption of contaminated drinking
water. Sophisticated water supply systems may also be
contaminated and result in urban epidemics of amoebiasis; such as
an outbreak at the Chigago World Fair during the 1930s, resulting
in approximately 100 deaths. Most of these epidemics were brought
7

about by faecal contamination of faulty water-supply systems,
since routine chlorination as employed in modern city waterworks
does not destroy the cysts of Entamoeba histolytica (Beck &
Davies, 1976). These cysts succumb readily to desiccation and
high temperatures however (Beaver et al., 1984). The cyst of
Giardia intestinalis may according to Meyer (1990), survive in
water for up to three months but they are also highly vulnerable
to desiccation and temperature of ~50oC. They may survive in a
watery or faecal sample.~ Studies in Nigeria by Edungbola et al.,
(19&8) and Watts (1986) showed that a village, protected
boreholes helped in controlling guineaworm diseases while
unprotected ones facilitated transmission.
Interaction between parasite and host in general depends to a
considerable extent on the nutritional state of the host
(Anderson & May, 1992). The high i ncidence of amoebiasis in the
tropics is attributable chiefly to poor sanitation (Beck &
Davies, 1976). According to Ukoli (1984) and Winbald and Kilama
(1992), trahsmission is associated with a low level of sanitation
in which food and water are very easily contaminated with human
faeces. Poverty and ignorance combine to inhibit adequate
treatment and purification of food and drink . Amoebiasis is also
highly endemic in areas with good sanitation in temperate zones.
People here may be asymptomatic while prevalences are high . This
can be explained by the degree of resistance by the infected host
and the good nutritional state and general good health of these
people who live under generally high socio-economic conditions
Kirkby (1988) . A poorly nourished child or individual will
8

usually be more susceptible to infection, slower to mount an
effective immune response and · more likely to die of severe
infection, than a well fed host. Studies on human
gastrointestinal parasites in malnourished human communities have
shown repeatedly that . even light infections contribute to the
host's nutritional deficiencies and this has been confirmed by
Crompton et al. (1986). Parasitism contributes directly to
malnutrition, which in turn reduces resistance to infection.
Polyparasitism may be caused by undernutrition, malnutrition and
even starvation (Ukoli, 1984).
Most helminthic infections are the results of human activities.
Stratification by age is of significant importance since age
reflects time i changes in prevalences with the hosts' age
therefore represent the rate at which individuals acquire
infection (i. e . the force of transmission) Anderson & May,
(1992). Children playing in yards close to the house, frequently
show a high incidence of soil transmitted parasites in endemic
areas, because of contact between their invariably dirty hands
and their mouths. In areas where night soil is used as
fertilizer, infections are transmitted by eating raw vegetables.
The severity of disease is determined by the extent to which man
pollutes his environment with his own excreta (Meyer, 1990).
Education generates the capacity in the people to seek solutions
to their own problems. Schimdt & Roberts (1985) have suggested
that there is very little hope of eliminating the vast amount of
helminthic diseases from the world without drastic changes in
9

human behaviour. Holland et al. (1988) reported that Ascaris
lumbricoides occurred more frequently in children who resided in
relatively crowded areas and whose mothers had minimal formal
education. Holland (1989) also discovered in Nigeria that the
prevalences of single and multiple helminthic infections were
higher in children living in houses made of wood or bamboo than
in those living in houses built in concrete blocks .
Ukoli (1994) pointed out that diseases thrive where there was
poverty and ignorance. He suggested that there was a need to
adjust the imbalance in the socio-economic order and provide
reasonable environmental quality especially in rural areas .
Watson (1978) went as far to say that parasitic diseases probably
contribute most to the retardation of socio-economic development.
10

Chapter 2
LITERATURE REVIEW
There is a great lack of information on the prevalences,
distribution and economic consequences of intestinal parasite
diseases in South Africa. This fact, which was recognized more
than a decade ago by F.M.A. Ukoli, a Nigerian parasitologist, in
his book on parasitology in tropical Africa (1984), does not seem
to have been accepted by the Mational Department of Health in
Pretoria. Such information is vital before any steps can be taken
to introduce control measures at either the national or regional
level. At present, KwaZulu-Natal is by far the best researched
province in the country from the parasitological point of view
but even here the numerous surveys carried out during the 1970s
and 1980s were not done in a planned way so that they are of
limited value. This has recently been corrected by the
development of a method of combining altitudinal transect surveys
and Geographical Information Systems to produce maps of parasite
distribution (Appleton & Gouws, in press; Appleton & Kvalsvig,
1994) .
For the purpose of this review, the South African landmass is
divided into several altitudinal regions. These are dominated by
the highveld plateau which is separated from the lowlands to the
north, east and south by the Drakensburg mountains. This latter
includes much of the present study area, Qwa-Qwa, and the Kingdom
of Lesotho. Few parasite studies have been done on the highveld
plateau; most were done, as noted above, on the coastal plain of
11

<
KwaZulu-Natal. A smaller number has been done in the Western Cape
(Cape Town), with one-off studies in other provinces such as the
Eastern Cape (Transkei/Ciskei and Port Elizabeth), the northern
Cape and the lowveld of Mpumalanga and the Northern Province.
This review will collate relevant reports first for the lowlying
areas and then for the higher altitudes. ,/'"'
/
KwaZulu-Natal is, according to the available data, the province
most seriously affected by intestinal parasites, probably
followed by Mpumalanga though this cannot be stated for certain.
~Within KwaZulu-Natal,
/ area since infection f.....
the coastal plain is the worst affected
rates of the common nematodes (Trichuris
trichiura, Ascaris lumbricoides, Necator americanus, and
Strongyloides stercoralis) decrease with increasing altitude and
in the case of N. americanus and S. stecoralis with increasing
south latitude as well (Appleton & Gouws, in press; Appleton &
Kvalsvig, 1994). The present study in Qwa-Qwa allows the altitude
transect on which these trends are based to be extended beyond
the limit of ±1700m in the Drakensberg foothills (Appleton &
Gouws, in press) to 2200m. Thus we can now see a pattern of
decreasing prevalence of, for example A. lumbricoides, from ±70%
on the KwaZulu-Natal coast to ±4% at an altitude of 2200m in the
Drakensberg mountains and T. trichiura from ±80% on the coast to
ero above 1990m. Hookworm (N. americanus) and S. stecoralis are
prevalent (>±30% and >2% respectively) only along the coastal
plain of KwaZulu-Natal to about 200m altitude. Prevalences of
these two helminths also decline with increasing south latitude
from ±90% and ±10% close to the Mozambique border in the north to
12

±4S% and <1% respectively near the Umzimkhulu river in the south
(Maurihungirire, 1993).
These patterns are supported by surveys done along the coastal
plain by Schutte et al., 1977; 1981). A study at Umkomaas on this
same plain (Kirkby, ~1988) confirmed what is already assumed, that
black children constitute the great reservoir for these
parasites. Kirkby (1988) attributes these high parasites loads to
inadequate housing, lack of piped water supplies, poor general
hygiene and ineffective/non-existent sewerage and suggests that
a deworming programme would have little effect.
Protozoan parasites are also common but generally do not show
altitude-related distribution patterns. An exception is the
amoebae Endolimax nana which seems to be most common at higher
altitudes in man (Appleton & Gouws, in press) .
Little is known about the effects of the high infection rates of
these geohelminths recorded in KwaZulu-Natal. Complications of
ascariasis undoubtedly occur and frequently present as intestinal
obstructions (i.e bolus formation) which may have to be removed
surgically. Bradely & Buch (1994) reported seven such cases
within a 14 month period at a hospital in KwaZulu-Natal midlands
and the present study recorded one in Qwa-Qwa (Dr J.S. Moloi,
Manapo Hospital, Phuthaditjhaba, personal communication).
Cysticercosis, due to infection by larval Taenia solium, occurs
in KwaZulu-Natal but is rare, particularly in the north-eastern
part (0.2%) (Pammenter et al., 1987).
13

Further south in the Eastern Cape Province, the few data that are
available show that in the former Transkei, several helminth
species are present (T. tri chi ura, A. lumbricoides and
Hymenolepis nana). Va~ Niekerk et al., (1979) found an overall
parasite infection rate of 97.0%. Trichuris was the commonest
with prevalence of 89.9% followed by 71.0% Ascaris in Guguletho
children and 32.0% Trichuris in Tsolo children and 23.0% Ascaris.
The former Transkei and Ciskei are "hotspots" for cysticercosis
and Pammenter et al., (1987) estimated a prevalence of 2.5% for
these areas. In the Port Elizabeth area, high prevalences were
again encountered more in coloured than black school children
living in the area served by Livingstone Hospital (Freeman &
Grunewald, (1978). They recorded 57 . 0% T. trichiura in coloured
chidren than 36% in black children . Prevalences for
A. lumbricoides in coloured and black children were 55.0% and
41.0% respectively.
Several surveys have been done on the Cape Flats near Cape Town, -
Western Cape i a sandy area with a high water table and much
poverty . Millar et ale (1989) reported an overall parasite
infection rate of 45.6% amongst children from Mitchell's Plain.
Trichuris trichiura was present at 30.7%, A. lumbricoides at
27.7% and Giardia intestinalis at 7.9%. Enterobius vermicularis I-
was also present, but was not quantified. Gunders et al., (1993)
reported an infection rate in pre-school children of 54.0% due
largely to T. trichiura and A. lumbricoides at 36.6% and 33.9%
respectively. Hymenolepis nana was present' but uncommon «6.0%)
14

as was Enterobius vermicularis though, again, its infection rate
was not quantified. Another study (Bester et al. ~ 1993) showed
considerably lower prevalences, Giardia intestinalis 14.3%,
T. trichiura 4.2%, A. lumbricoides 4.1% and H. nana 0.2%.
A surprising result was the unusually low rate of Entamoeba coli,
viz 2.7%. In the only estimate of E. vermicularis infection done
in South Africa, Leary et al., (1974) used the "Scotch tape"
method and reported prevalences between 26.0% and 38.0%.
The only study done to date in the semi-arid Northern Cape (Scaaf
et al., 1989.) showed prevalences of parasitism in school children
to be low, 3.0% and 2.0% for T. trichiura and A. lumbricoides
respectively. Low infection rates are perhaps to be expected in
arid climates where eggs and cysts will be subject to severe
desiccation, but the finding of a prevalence of 21.0% for Giardia
intestinalis is interesting. This and the 23.0% reported from
Lesotho (Esrey e~ al., 1989 - see below) are the highest yet
reported for G.intestinalis from South Africa.
Few data are available for the Northern Province either. The only
published report is that by Roodt et al., (1995) who examined
adults only. The fact that only adults (>19 years) were sampled
probably explains the low prevalences of most parasites normally
regarded as common in children, viz: A. 1 umbri coides , 0.8%,
hookworm (reported as Ancylostoma duodenale), 0.2%, Taenia sp.,
4.4%, and Giardia intestinalis, 0.6%. Two species, both
classified as commensals by most textbooks, Entamoeba coli and
Blastocystis hominis, infected 50.4% and 30. 8% respectively. This
is the only published report of B. hominis from South Africa but
15

it is undoubtedly much more common and widespread. Its absence
from other studies is probably due to a lack of familiarity with
the morphology of its cysts by microscopists.
In Mpumalanga Provinc~, parasitism by helminths was investigated
in three different environments between 1200m and 1400m,
resettlement, farming and urban, by (Evans et al., 1987).
Generally, the spectrum of parasites recorded and their
prevalences were similar to those in KwaZulu-Natal at comparable
altitudes. The prevalence of Ascaris lumbricoides was highest in
the urban environment (22.7%), T. trichiura was uncommon in all
three, with maximum of 3.7%, also in the urban setting as was
hookworm (not identified) and Strongyloides stercoralis at 22.7%
and 5.3% respectively. Tapeworm infections were most frequent in
the resettlement and urban areas; an unidentified taeniid reached
a high prevalence of 9.0% in the former while H. nana was equally
common, 3.8% and 3.7% in both.
The mountainous highlands of Lesotho represent a distinctive
region and the survey by Kravitz et al., (1993) showed that
helminthic infections were very rare, <1.0%, while prevalences of
protozoan are not dissimilar to those recorded in other parts of
the subcontinent. An earlier study by Esrey et al., (1989)
reported an alarmingly high prevalence of Giardia intestinalis,
23.6% in the rural areas of that country. Esrey et al., (1989)
concluded that it was not the quality of water that played a
primary role in giardiasis transmission, but the amount of water
used for personal and domestic hygiene.
16

Chapter 3.
THE STUDY AREA
3.1 Introduction
Figure 1 (Vrey and Smith, 1980) shows Qwa-Qwa in its provincial
context. Qwa-Qwa is situated between latitudes 28 0 and 30 0 south
and longitudes 28 0 and 30 0 east . It is bounded to the south by
Lesotho and by KwaZulu-Natal on the east . Qwa-Qwa is in the
north-eastern Free State, called region C by Erasmus (1991).
The estimated population of Qwa-Qwa was 342 400 (Central
Statistical Services, 1991), and is the third largest district,
following Bloemfontein and Welkom in the province . The district
covers an area of 655 km2 and had population density of 282
persons per km2 and a growth rate of 5.8% from 1985 to 1990
(Erasmus, 1991). Of this total, 29 000 lived in urban areas and
the remainder in semi-urban and rural areas (Central Statistical
Services, 1991). There were 293 300 Africans (151 550 males and
190 850 females) the rest were Asians, Whites and Coloureds.
3.2 Topographic and climatic factors
Data are available on several physical factors, e.g topography,
rainfall, environmental temperature, sunshine, relative humidity,
wind, frost and soil types. It is necessary to describe these
because many parasites recorded from Qwa-Qwa have stages, either
cysts or eggs, which have to survive periods of time outside
their hosts, i.e in the external environment, and are thus
17

YWAllWA LOCATION WITH REGARD TO ADJOINING AREAS AND TRAFFIC ROUTES
GOLDEN GATE HlGIfl..A.NO PARK
,- .-..J'" ' .
c .. .., ... -' . .r ... ~ .. ->..r.i"...-'.- - .. r · .. "-·· J
PS111 /-./0 ./. .~ D
~ fl .. .. /' ... , r ·· . .,. .... L .. · ',-- r71 .' _" __ ./ \,. .. r " ...... ;. ~ ....... ...
LESOTHO
.,77
r7I ~
~ o o
TARRED Rc:M.OS
PROCLAIWED ROADS UHO£R CONSTRUCTION
FOR PERMANENT ROAD SURFACE STAJrC)AAD
GRAVEl ROAOS
RAILAOAD
PRIWAAY ROAD
CONNECTING ROAD
SECONDARY ROAD
( '.
" QWAQWA
.. . _"' ''''' '- .. ." (
---'-~'
,
Figure 1. Qwa-Qwa in its National context.
,
Extracted from Vrey and Smith (1980)
" .,-/
1' .
/
" /
NATAL
N
fI..
/
" > /
12
/ .. -/
/
1,5 10 15 20 ktn
K de 1.1 Hey

subj ect to climatic stresses. It is not possible to discuss
transmission of these parasites without a knowledge of the
environmental variables their free living stages have to
withstand.
3.2.1 Topography
Qwa-Qwa is predominantly mountainous and forms part of the
Drakensberg mountain range (see Frontispiece). Mountains rising
to altitudes of 1500m and 3000m above sea level and the southern
and south-western boundaries of Qwa-Qwa are formed by the
Drakensberg mountains and Caledon River respectively. Figure 2
(adapted from Vrey and Smith, 1980) indicates the gradients of
the slopes in Qwa-Qwa. It is clear from this that the bulk of the
area is rocky which means that urban development is restricted to
areas with gradients below 1:7.
3.2.2 Rainfall
Qwa-Qwa receives its main rainfall during summer. In the low
lying central area the average annual rainfall of 700-800 mm
falls during the months of October to March (data from Weather
Bureau, Pretoria, 1995) and higher up in the mountains it
increases to more than 1200mm per annum. Figure 3 (adapted from
Kritzinger, 1987) shows the distribution of rainfall isolines in
Qwa-Qwa. Hail storms are common and occur four to five times per
year. Snowfalls occur in the high lying southern region, with the
heaviest falls towards the end of June.
18

" .. ~
QWAQWA SLOPE ANALYSIS
ORANGE FREE STATE
, J
Figure 2. Map o f Qwa-Qwa indicating gradients of slopes. Adapted from Vrey and Smith (1980). ( . ) r epresent sampling sites .
N
1\
., , '
NATAL
SIUP'fR1H.I,HI7
u

OWAOWA RAINFALL
SUMMER RAI NFALL
LESOTHO
/ I
I I I I
/ \ , ,
, \ \ I I I I I I I
I I I
I
/ I
I I
HARRISMITH (PORTION)
LESOTHO
• _kIoof (71l0III661
• c.vem G_ Firm "32Wf'691
I BOUNDARIES
National
Dlatrict
TOWNS
C! Procllimed town.
o Settlomenta
ROADS
RAINFALL
Primary paved
Primary unpaved
Secondary paved
Secondary unpaved
Tertiary unpaved
• Rainfall stations in operation
o Rainfall stations closed
(7601655J Moan annual rainfall in mm/mesn
annual rainfall Sept. to March in mm
(average over a number of years)
- 600 - Isohyets - average millimetres per annum
Figure 3. Map of Datterns
Qwa-Qwa showing distribution of rainfall in thp ;IIT"oO;:l I A \ _~ ___ ___ A.. ---- ...

3.2.3 Environmental temperature
The environmental temperature of the study area may be described
as being cool to moderately warm. Daily maximum temperatures
during mid-winter (July) range from -1.5°C to 15.3°C with an
average of 6.9°C. Mid-summer (January) temperatures range from '
12.9°C to 25.S0C with an average of 19.2°C. Cold spells, that is
drops in temperature >5°C, can occur 30 times a year. Hot spells,
that is increases in temperatures of >35°C, occur for four to
five days per year.
3.2.4 Sunshine
Qwa-Qwa receives between 60% to 70% of possible sunshine per
year: 53% in spring, 55% in summer, 65% in autumn and 75% in
winter. On average, there are 10 completely overcast day~ per
year, 35 days with :s;10% sunshine and 240 days that can be
regarded as sunny, i.e with ~50% possible sunshine.
Average annual evaporation according to the class A method
measured 1750 mm in the lower lying areas, 31% in spring, 32% in
summer, 21% in autumn and 16% in winter.
3.2.5 Relative humidity
The relative humidity varies between 38% to 45% during May to
October and 47% to 51% from November to April. This is the result
of the plentiful sunshine and relatively strong winds.
19

3.2.6 Wind
wind is characteristic of very high altitudes. It aggravates the
cold dry conditions by lowering surface temperatures and
increasing evaporation (Irwin and Irwin, 1992).
3.2.7 Frost
The average first and last days of frost in Qwa-Qwa are 1st May
and 20th September respectively, resulting in a frost period of
150 days per annum.
3.2.8 Soil types
The distributions of different soil types are shown in Figure 5.
These pertain however to an area of only approximately 9 200
hectares or 18% of the total area of Qwa-Qwa. There is no
information available on the rest of the region. The scale of
this map (Figure 4) (adapted from Kritzinger et al., 1987) is too
large to relate meaningfully to the schools in question. Further,
the catchment area of these schools are not well known and
consequently cannot be mapped. Properties of these soil types are
explained in Table 1.
3.2.9 Flood plains
The high rainfall in Qwa-Qwa coupled with factors such as the
topography causes large flood plains to develop along rivers.
20

OWAOWA ,
SOIL TYPES
LESOTHO
Figure 4. Map of Qw~a showing distributi on n F ~ i##o-_~ ~ --~,
/\ / , / ,
/ \ / , I ....
I " I , I , I ' , \ I , I , I ' I \ I
BOUNDARIES
TOWNS
National
District
r7 Proclaimod towns
o Sottlomonts
ROADS
Primary pavod
Primary unpaved
Secondary paved
Sftcondery unpaved
Tuniary unpaved
SOIL ASSOCIATION TYPES
Typo
Clovelly·Av.lon
Hunon·Shottl."ds
St.rbpruit (Dundee)
~ ICroonSl1ld I(luIPflJit
W K.llptulllOundfiel
longlandl e.tcourt ICltlprwl
0 ... ··w•
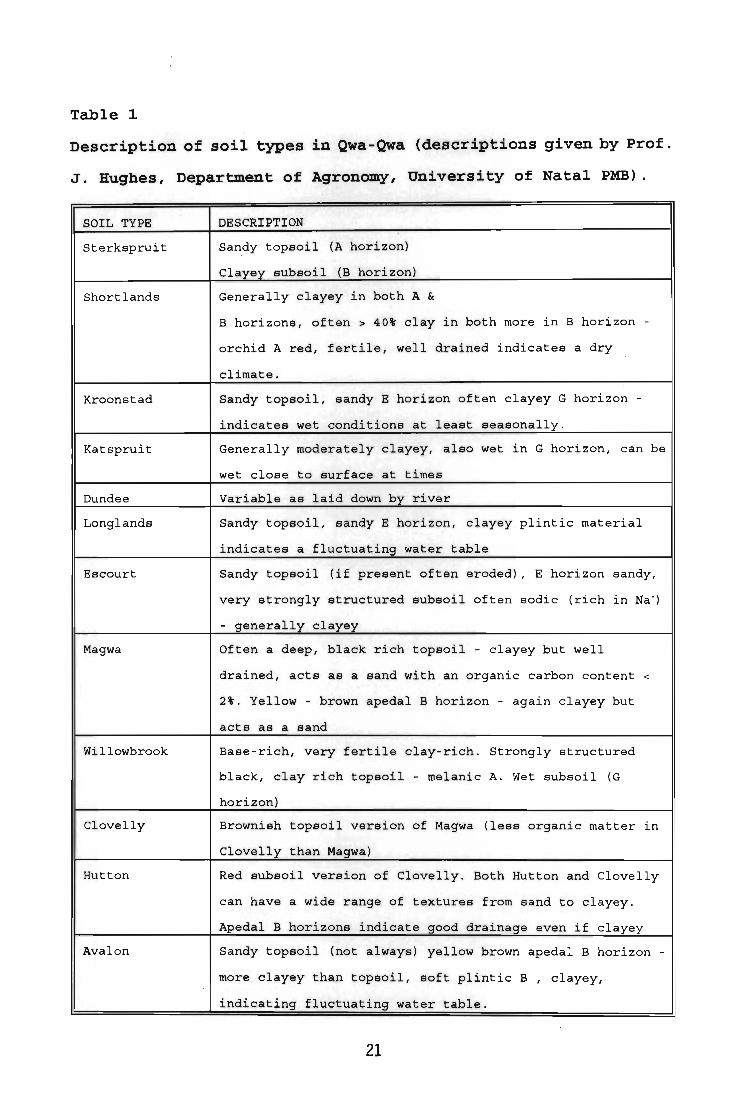
Table 1
Description of soil types in Qwa-Qwa (descriptions given by Prof.
J. Hughes, Department of Agronomy, University of Natal PMB).
SOIL TYPE DESCRIPTION
Sterkspruit Sandy topsoil (A hori zon)
Clayey subsoil (B hori zon)
Short lands Generally clayey in both A &
B horizons, often > 40% clay in both more in B horizon -
orchid A red, fertile , well drained indicates a dry
climate.
Kroonstad Sandy topsoil, sandy E horizon often clayey G horizon -
indicates wet conditions at least seasonally.
Katspruit Generally moderately clayey, also wet in G horizon, can be
wet close to surface at times
Dundee Variable as laid down by river
Longlands Sandy topsoil, sandy E horizon, clayey plintic material
indicates a fluctuating water table
Escourt Sandy topsoil (if present often eroded), E horizon sandy,
very strongly structured subsoil often sodic (rich in Na+)
- generally clayey
Magwa Often a deep, black rich topsoil - clayey but well
drained, acts as a san d with an organic carbon content <
2%. Yellow - brown apedal B horizon - again clayey but
acts as a sand
Willowbrook Base-rich, very fert i le clay-rich. Strongly structured
black, clay rich topsoil - melanic A. Wet subsoil (G
horizon)
Clovelly Brownish topsoil version of Magwa (less organic matter in
Clovelly than Magwa)
Hutton Red subsoil version of Clovelly. Both Hutton and Clovelly
can have a wide range of textures from sand to clayey .
Apedal B horizons indicate good drainage even if clayey
Avalon Sandy topsoil (not always) yellow brown apedal B horizon -
more clayey than topsoil, soft plintic B , clayey,
indicating fluctuating water table.
21

3.2.10 CHARACTERISTICS OF THE SCHOOLS SAMPLED
The nine schools sampled were grouped into those serving the low
socio-economic and higher socio-economic sectors of the
community. The former schools, Letlotlo, Mafika-ditshiu, Teboho, /
~.( Makhetheng, Mohlakaneng, Makeneng, Sehlajaneng and Makhabane,
served children living mostly in houses and shacks. Their homes
have no electricity, proper sanitation or readily available water
source. The parents or guardians of these children have household
incomes of less than R600 per month and little formal education.
They do not have access to medical aid schemes and do not get
adequate health education when visiting local General
Practitioners, clinics or hospitals. Many of them still prefer
traditional healers' to western medical doctors.
Schools serving the low socio-economic section of the community
were further divided according to the number of houses per km2 in
the areas they serve. Makhabane, Sehlajaneng, Makhetheng and
Mohlakaneng are located in low density areas (0 - 10 houses
per km2) (see Plate IA). These schools will be referred to as
Group 1. Teboho, Makeneng, Mafika-Ditshiu serve semi-rural areas
(20 -40 houses per km2) \vith predominantly mud houses and shacks .
There are a few brick houses. These were grouped with Letlotlo
which serves the urban area with >50 houses per km2. Residents in
this area live in small two-roomed houses or in shacks. These
schools will be referred to as Group 2 (see PLATE IB and Ie) .
22

Sentinel school is the only primary school serving children whose
parents are educated, have an income of >Rl 000 p.m.
and can afford medical aid schemes. Their houses are of brick,
have electricity, piped water, flush toilets and eat graded meat.
They have educated parents and live in brick houses. No children
attending this school lived in either a shack or mud house. These
parents however parents still visit traditional healers and still
slaughter animals for their traditional customs . They also do not
get any education on intestinal parasite transmission from their
local general practitioners . This school was therefore used as a
control.
23

PLATE I VIE'VS OF SETTLEMENTS IN QWA-QWA
A = Low housing density (0-9 people/ha) without either sanitation or electricity.
B = High density housing (20-30 people/ha) without either sanitation or electricity.
C = Highest density housing (> 50 people/ha) with latrines but no electricity.

Chapter 4
METHODOLOGY
4.1 Introduction
Cluster sampling was used to choose nine primary schools for this
study (Figure 5, adapted from Vrey and Smith, 1980)), eight
serving the lower socio-economic portion of the community and the
one and only .school serving the higher socio-economic section.
The schools chosen were between 4.1km and 17.0km apart (mean
9.4km ±3.9 SO) and are listed in Table 2 with altitudes,
population densities and the number of children sampled in each.
Primary schools were chosen as sampling sites rather than whole
settlements for three reasons. Firstly, because it was easier for
the researcher to come back for further samples from the same
children. Secondly, because the school infrastructure enabled the
collection the ancillary data needed, e. g. age and socio-economic
)<Sdata. Lastly, school children constituted the section of the
population at greatest risk of parasite infection and children I
~ ...---. between the~ges two to 10 years are the most co-operative. The
schools selected were located at altitudes between 1660 to 2200m
above sea level and are situated in the urban, semi-rural and
rural areas of Qwa-Qwa (see Plate I). Permission to conduct
research at schools, clinics and the hospital was obtained from
the Secretary for Health and Director of Education.
24

./ ..
QWAQWA POPULATION DENSITY
-,.~ -, (
" , '\ I
\ I '- I ",t-~~~
I -,/
I
/ /
r/
/'
'" ORANGE FREE STATE /
/
I
/ I
r I
/
I I
I
I
/
/'
/
I r I
NATAL
o O- .... I"fItSOHS'lIl ...
o lCI-le.ftI'EMOttSfIf" ...
o 10 - It." PEMOMS 1"(11 ...
o lO - " .MI"EftSON5I"fIt ...
LESOTHO o ..a - n." I"f~HS"1II 1\.
D :::::. liO,OO ""RSONS I"flt "" I
)
\
\ /
\/'
Figure 5. The study area showing settlements with corresponding schools (1 - 9 ) , and indicating population densities in each settlement served by the schools ( tt ) .
, , -'

4.2 Stool collection and analysis.
A total of 2583 stool samples was col l ected from the nine schools
(see Table 2). During the mid-winter month of July duplicate
samples were collected from each of the 969 X 3 children in the
eight schools serving lower socio-economic communities. Single
samples were collected in summer . Duplicate samples were also
taken from 211 X 2 children in summer at the Sentinel School
(No 9) serving the higher socio-economic sector of the community .
This was used as a control school in the subsequent analysis of
the parasitological data .
Once collected, samples were taken to Manapo Hospital laboratory
in Phuthaditjhaba for sub-sampling, weighing and preservation .
The mean weight ±SD of the samples to be analysed was 0.86
±O .13g. The stool consistency classification and coding procedure
developed at Tulane University Tropi cal Medicine Clinic (1948)
was used to grade individual specimens from hard to watery.
The weighed specimens were then preserved with 10 ml of 5%
formalin, and taken to the Department of Zoology and Entomology,
University of Natal, Pietermaritzburg for processing, staining
and analysis.
A modified version of Merthiolate-iodine-formaldehyde
concentration technique (MIF) of Sapero and Lawless (1953), was
used for processing stool samples (see Appendix A) .
25

Table 2.
Altitude [metres above see level], population density and number of samples taken
in summer and winter at the nine schools {positive responses}.
Name of school Polpn. No of chi l dren Total
(abbr) densty. sampled number of
[Alt] no/km 2 Summer Winter samples
l. Letlotlo (Le) >50 146 146
[1660m] {129} {129 X 2} 387
2 . Mafika-ditshiu 30 - 39 123 123 245
[174~fI(J:) {97} {74 X 2}
3. Teboho (Te) 40 - 49 105 105 243
[1800m] { 91} {76 X 2}
4 . Mak~EMa1eng 0-9 104 104 247
[1800m] { 97} {75 X 2}
5. Mohlakaneng 20 - 29 120 120 317
(Mhl) [1860m] {117} {100 X 2}
6. Makeneng (Mk) 20 - 29 116 116 195
[1990m] {71} {62 X 2}
7. Sehlajaneng 10 - 19 140 140 356
(Se) {128} {114 X 2}
[2000m]
8. Makhabane 0-9 115 115 295
(Mkh) {83} {106 X 2}
[2200m]
9. Sentinel >50 211 X 2 None 298
control (Snt) {149 }
[166 Om]
This procedure was used instead of the modified formal-ether
concentration technique of Allen and Ridley (1970) which was
widely used in previous parasitological surveys in KwaZulu-Natal,
for the following reasons :
26
1. its simplicity and low cost of preparation.
2. its rapid (almost immediate) wet fixing and staining of both
cysts and trophozoites of intestinal protozoan and of
helminth eggs, and
3. its preservation qualities which allow field, home or
hospital ward collections of stools to be kept in the
freshest possible state.
This procedure results in the sedimentation of helminth eggs and
protozoan cysts at the bottom of a centrifuge tube. This
concentrate is sub-sampled using a Pasteur pipette onto a slide
and examined under 400X using a compound microscope. The
intensity of infection of both protozoans and helminths was
determined as indicated in Table 3 . The identification of these
parasites was made after the author had been trained in
morphological diagnosis using light microscopy by a qualified and
highly experienced instructor.
4.3 Chemotherapy
School principals, the nearest clinic and the primary heal th care
doctor were provided with a list of all children diagnosed as
having pathogenic parasites and treatment was requested. Before
treatment, a consent form was s i gned by an each child's parents
(see Appendix B). Worm infections were treated with of
Mebendazole (Vermox) at 100mg per dose every 12 hours for five
days regardless of child's age and weight. Those who had
amoebiasis were treated with Metroni dazole (Flagyl) given at
27

Table 3
Intensities of infections was assed for helminths by calculating the number of eggs per gram stool and for protozoans by scoring the number of cysts per field of vision at 40X objective (dilution method).
Protozoans
Intensity Number of cysts Mean in 40 per field of fields vision at 40X objective
Occasional 1 cyst every 0.6 .. second field
Scanty 2 cysts every 1.1 second field
+ 3 cysts per 2.4 field
++ 4-5 cysts per 4.1 field
+++ 6-8 cysts per 7.1 field
++++ Field full of 20.9 cysts with little spaces between.
Helminths
(Egg-count classification for both Ascaris and Trichuris)
Scheme used for Ascaris
Light infection
Moderate infection
Heavy infection
For Trichuris
Light infection
Moderate infection
Heavy infection
<10 000 eggs per gram (.epg)
10 000 - 40 000 epg
>40 000 epg
<2 000 epg
2 000 - <7 000 epg
>7 000 epg
Standard deviation
0.52
0.99
0.84
0.88
0.88
0.88
Adapted from Ashford et a1. I (1981) and Singh et a1. I (1994) .

20mg/kg/day in two or three doses for five successive days. After
five days a post-treatment stool was collected, preserved,
processed and analysed as described in Appendix A. No further
post-treatment analyses were carried out.
4.4 Questionnaire
A questionnaire designed by author (see Appendix C) was
personally administered in one-on-one interviews with the parents
or guardians of the children sampled. The purpose was to
undertake a household economic survey to investigate possible
social causes of parasite infection. Questions covered the
following socio-economic and demographic parameters:
Socio-economic factors Demographic factors
*
*
*
*
*
*
*
*
*
*
*
*
*
sanitation * age and sex profiles
education * migrant labour
nutritional deficiencies * overcrowding
distance from
water source
literacy
unemployment
income/poverty
nearest * household
* number of
availability of electricity
personal and environmental hygiene
source of meat
quality of meat eaten
distance from health facility
quality of housing
28
size
houses per km2

Several socio-cultural factors were also investigated:
*
*
religious taboos
traditional leaders
*
*
traditional healers
eating habits
The principals organized meetings for this purpose with the
parents at each school. It was necessary for this study to give
consideration to the following additional questions which relate
to in planning the human side' of the project:
(a) what was the state of readiness of the community with
respect to the proposed intestinal parasite survey?
(b) are infections by intestinal parasites really of concern
to the people?
(c) do the people feel the diseases caused by these intestinal
parasites could or should be controlled?
(d) do western-style control procedures arouse culturally
determined fears 1n "traditional healers"'? FDr example, they
might feel threatened because they enjoyed authority among
rural people in the past and might now feel they are no
longer in control. They will also lose money.
29

3.3.3 Statistical Analysis.
Associations between selected sociodemographic factors and
overall intestinal parasites (classified as present or absent)
were investigated using chi-square tests. A number of significant
associations were found, but this approach has two drawbacks viz:
(a) there was the possibility that some false positive
associations might be found due to the fact that many tests
were carried out. Furthermore many of the socio-demographic
variables were highly correlated with each other (e.g there
was a very strong association between mother's education and
mother's income). A multivariate approach was then used to
see which socio-demographic factors were the most important
determinants of parasite transmission.
(b) the second approach ignored the fact that cluster sampling
was used, with the schools forming clusters of children. It
became apparent however that this led to an overestimate of
the evidence for relationships in the data. Thus, a method
was needed that took into account the structure of the
sample (that are children being clustered into schools) .
The following procedures were used to overcome this problems:
(a) multiple logistic regression models were fitted
(separately for summer and winter) to assess the effects of
socio-economic (in these models schools were fitted as ..
fixed effects" i.e. an approach used by Holt and Scott
(1982).
30

(b) To take account of the cluster sampling, Generalized Linear
Mixed Models were fitted, using the Genstat Library
Procedure GLMM (Schall, 1991 and Breslow and Clayton, 1993.
These models were fitted using the explanatory variables
identified as potentially important in (a) as fixed effects, and
using the schools as random effects .
These fitted models in both (a) and (b) provide us with parameter
estimates that can be interpreted as log of the odds ratio (for
two levels of the explanatory factor) e.g. they allow us to say
how much more likely a child is to be infected if his/her mother
has low income than if she has a high income .
31

Chapter 5
RESULTS
5.1 Introduction
A total of 13 parasite species was recorded. This diversity
included protozoans and helminths. Among the protozoans there
were two flagellates viz:
(a) Giardia intestinal is Felice, 1952 a pathogenic parasite,
and Chilomastix mesnili (Wenyon, 1910) which is
non-pathogenic (see Plate II).
(b) the only pathogenic amoeba recorded was Entamoeba
histolytica Schaudinn, 1903. E. histolytica is recorded
here as the only pathogenic amoeba. It is however
recognised that invasive amoebiasis is now widely
considered to be due to another species, E. dispar Brumpt,
1928, while E. histolytica is regarded as a non-invasive
commensal. Separation of these two species was beyond the
scope of this study. Four other commensal species were also
present, viz: Entamoeba coli (Grassi, 1879) Entamoeba
hartmanni von Prowazek, 1912, Endolimax nan a (Wenyon and
0' Connor, 1917) and Iodamoeba biietschlii (von Prowazek,
1911) (see Plate III). What was interesting was that at the
highest altitudes unidentifiable immature precysts were
found which lacked the usual diagnostic structures. These
precysts were
(designated SPA
separable into two groups: small ones
small precyst i c amoebae) similar in size
to E. hartmanni, and the larger ones (designated MSPA -
medium sized precystic amoebae) similar in size to
E. histolytica and E. coli.
32

The diversity of helminths found in the survey comprised
(a) three cestode species, viz : an unidentified taeniid tapeworm
presumably either Taenia solium Linnaeus, 1758 or
Taeniarhynchus saginatus (Goeze , 1782) Hymenolepis diminuta
(Rudolphi, 1819) and Hymenolepi s nana (Stiles, 1906) (see
Plate IV). Because most textbooks on medical parasitology
refer to H. nana, I have used this name but it should be
noted that Schimdt (1986) has placed it into synonomy with
Vampirolepis nana (Siebold, 1852) i
(b) three nematode species, Trichuris trichiura (Linnaeus,
1771), Enterobius vermicularis (Linnaeus, 1758) and Ascaris
lumbricoides (Linnaeus, 1758). Hookworm and Strongyloides
were not present (see Plate V) . Trematodes were also absent .
The overall helminth infection rate was highest at group II two
schools (Table 4.1 and 4 . 2) . In most cases prevalences were lower
in winter than in summer.
5.2 PREVALENCES OF INTESTINAL PARASITES.
Tables 4.1 and 4 . 2 show the prevalences of the 13 parasites
species (including SPA and MSPA) during summer and winter and
also of the uninfected children (NPS - no parasite seen) .
These data show that prevalences of intestinal helminths are
generally low and that the most common parasites in all groups
were E. coli and E. nana, both protozoans.
The overall prevalences of helminths and protozoans in the whole
33

Table •. 1 Beasonal effect on the prevalence of protozoan parasites in eight schools (school 9 was only sampled in summer) .
- ----
Sch Le Mf Te Mkh Mhl Mk Se Mkh Snt (C)
Num 1 2 3 4 5 6 7 8 9
Alt 166 1740 1800 1BOO 1860 1990 2000 2200 1660 (m) 0
N 146 123 105 104 120 116 140 115 211
Giardia intestinal is
Prev % % % % % % % % %
Sum 3.4 2.4 2.8 1.9 0.8 5.0 2.8 0.0 12 . 5
win 12. 1.2 7.4 1.3 2.0 11. 0 6.1 1.9 -8
Ave 8.1 1.8 5 . 1 1.6 1.4 8.0 4.4 1.0 -Chilomastix mesnili I
Sum 13.0 17.0 9 . 5 29.0 13.0 13.0 12.8 15.0 9.2 ,
win 12.0 7 . 1 13.5 7.9 10.0 15.3 4.4 1.0 -Ave 12.5 12.1 11.5 18 .4 11.5 14.2 8.6 8.0 -
Entamoeba histol ytica
Sum 0.0 0.8 0 . 95 0.0 0.0 0 .0 3.6 0 .0 0.6
win 0.85 2 . 4 2.4 0.0 5.0 3.0 2.6 0.0 -
Ave 0.42 1.5 1.7 0.0 2.5 1.5 3.1 0.0 -Entamoeba coli
Sum 50.7 47.0 51. 0 59.0 58.0 37.0 53 . 0 36.5 29.0
win 71.0 56.0 67.0 59.0 45.0 61.5 51.0 61.0 -Ave 60.8 51.5 59.0 59 . 0 51. 5 49.2 52.0 48.4 -
Entamoeba hartmanni
Sum 9 . 6 6.5 10.5 2.8 2.5 7.0 13 .6 3.5 3.9
Win 7.7 5.0 8.6 3.9 5.0 4 .6 2 .6 4.7 -Ave 8.6 5.8 9.6 3.4 3.8 5.8 8 . 1 4.1 -
Sum
Win
Ave
Sum
Win
Ave
Sum
Win
Ave
Sum
Win
AV~
Le Mf Te Ma Mhl Mk Se Mkh Snt C SPA MSPA
Endolimax nana
22.6 14.6 15.0 12 . 5 26.0 11.0 17.8 20.0
24. D" l). O' 28 . 0 9.2 22.0 17.0 16.7 26.0
23.3 l).8 21.7 10.8 24.0 14.0 17.3 23.0
Iodomoeba buetschlii
7.5 2.4 7 .6 3.8 2.5 0.7 3.6 2 . 6
0.85 2.4 1.2 1.3 1.0 0.0 0.0 0.0
4.2 2.4 4.4 2.6 1.8 0.35 1.8 1.3
Small unidentified pre-cystic amoeba
0.7 1.6 0.0 0.0 0.0 0.7 2.1 0.0
0 .0 0.0 2.4 0.0 0.0 0.0 0.0 0.0
0.35 0.8 1.2 0.0 0.0 1.8 1.5 0.0
Medium sized unidentified pre-cystic amoeba
6.8 4.0 3.8
5.1 7 .4 8.6
5.9 5.4 6.2
Letlotlo Mafika-ditshiu Teboho Makhetheng Mohlakaneng Makeneng Sehlajaneng Makhabane sentinel
4.8
0.0
2.4
Control school Small unidentified Medium unidentified
8.3 4.3 5.6
0.0 3.0 0.0
4.2 1.8 2.8
precystic amoebae precystic amoebae
5.2
0.0
2.6
11. 0
--
1.9
--
0.0
--
0.0
-
-

Table 4.2
Seasonal effect on the prevalences of helminth parasites in eight schools (school 9 was only sampled in summer).
Sch Le Mf Te Mak Mohl Man Se Mkh Snt ( C)
Num 1 2 3 4 5 6 7 8 9
Pre ~ ~ % ~ ~ ~ % ~ ~ 0 0 0 0 0 0 0
v
Alt 1660 1740 1800 1800 1860 1990 2000 2200 1600 (m)
N 146 123 105 104 120 104 140 115 211
taeniid tapeworm
Sum 0.0 0.0 0.0 1.0 0.0 0.0 0.0 0.0 0.0
Win 0.0 0.0 0.0 1.0 0.0 0.0 0.0 0.0 -Ave 0.0 0.0 0.0 1.0 0.0 0.0 0.0 0.0 -
Hymenolepis diminuta
Sum 0.0 0.0 0.0 0.0 0 . 8 0.0 0.0 0.0 0.0
Win 0.0 0.0 0.0 0.0 0.0 0.0 1.0 0.0 -
Ave 0.0 0.0 0.0 0.0 0. 4 0.0 0.5 0.0 -Hymenolepis nana
Sum 0.7 0.0 1.0 1.0 0.0 0.0 0.0 0.0 0.0 . 0j_
Win 0.0 0.0 0.0 0.0 0.0 0.0 0.0 0.0 -Ave 0.35 0.0 0.5 0.5 0.0 0.0 0.0 0.0 -
Trichuris trichiura
Sum 1.4 0.8 0.0 0.0 1.7 0.8 0.0 0.0 1.0
Win 0.85 0.0 0.0 0.0 1.0 0.0 0.0 0.0 -Ave 1.1 0.4 0.0 0.0 0.85 0.4 0.0 0.0 -
Ascaris lumbricoides
Sum 8.9 1.6 13.0 0.0 2.5 5.0 2.1 1.7 1.3
Win 6.1 0.0 6.1 0.0 2.0 J:.5 1.0 0.0 -
Ave 7.5 0.8 9.55 0.0 2.25 3.25 1. 55 0.85 -No parasites seen in stool sample (NPS)
Sum 23.3 27.0 26.0 31.0 35.0 15.0 28.6 20.0 66.0
Win 14.5 40.5 21.0 39.0 41. 0 29.0 42.0 33.0 -

TABLE 5
OVERALL PREVALENCES OF INTESTINAL PARASITES IN QWA-QWA DURING
SUMMER AND WINTER.
I I Summer I winter I Average I Parasite species % Prevo 9.,-
0 Prevo % Prevo
G. intestinalis 3.5 5.5 4.5
c. mesnili 14.6 8.9 11.8
E. histolytica 0.7 2.0 1.4
E. coli 46.7 58.9 52.8
E. hartmanni 6.6 5.2 5.9
E. nana 16.7 19.5 18.1
I. buetschlii 3.6 0.8 2.2
SPA 0.6 0.3 0.4
MSPA 5.2 3.0 4.1
taeniid tapeworm 0.1 0.1 0.1
H. diminuta 0.3 0.1 0.2
H. nana 0.3 0.0 0.2
T. trichiura 0.8 0.2 0.5
E. vermicularis 0.4 0.4 0.4
A. lumbricoides 3.8 2.1 2.9

Table S.la Mean intensities of protozoan and cestode infections at the nine schools in summer (school 9 was only sampled in summer). Intensities were scored as: none, light, moderate or heavy according to Ashford et al (1981) and Singh et al (1994).
Sch Le Mf Te Ma Mhl Mk Se Mkh Snt (c)
Num 1 2 3 4 5 6 7 8 9
Alt 1660 1740 1800 1800 (m)
1860 1990 2000 2200 1660
N 146 123 105 104 120 116 140 115 211
Giardia intestinal is
none 96.5 97.3 97.1 98.1 99.2 93.9 97.2 99.2 91.7
low 3.5 2.7 2.9 1.9 0.8 6.1 2.8 0.8 4.4
mod 0.0 0.0 0.0 0.0 0.0 0.0 0.0 0.0 3.9
heav 0.0 0.0 0.0 0.0 0.0 0.0 0.0 0.0 0.0
Chilomastix mesnili
none 97.2 81.1 91.3 70.9 86.9 88.7 86.5 85.0 93.3
low 2.4 16.2 3.9 17.5 9.0 5.2 6.4 10.5 2.9
mod 0.0 2.7 3.9 9.7 1.6 3.5 6.4 2.6 2.9 heav 0.0 0.0 0.9 1.9 2.5 2.6 0.7 1.7 0.9
Entamoeba histolytica
none 100 100 99.1 100 100 99.1 97.2 100 100 low 0.0 0.0 0.9 0.0 0.0 0.9 2.8 0.0 0.0
mod 0.0 0.0 0.0 0.0 0.0 0.0 0.0 0.0 0.0
heav 0.0 0.0 0.0 0.0 0.0 0.0 o. a 0.0 0.0
Entamoeba coli
none 50.0 50.4 45.6 42.7 40.5 63.5 45.7 61.4 83.4 low 33.0 36.9 35.0 24.3 34.7 23.5 37.8 26.3 10.7
mod 15.5 10.8 13.6 28.1 18.2 11.3 15.0 10.5 3.9
heav 1.5 1.9 5.8 4.9 7.6 1.7 1.5 3.9 1.9
Entamoeba hartmanni
none 90.8 95.5 89.3 97.1 98.4 93.1 87.2 95.6 97.2
low 9.2 4.5 8.9 2.9 1.6 6.9 12.1 4.4 1.9
mod 0.0 0.0 0.9 0.0 0.0 0.0 0.7 0.0 0.9
heav 0.0 0.0 0.9 0.0 0.0 0.0 o. a 0.0 0.0
Endolimax nana -- -
none 79.7 86.4 87.4 89.3 77.0 91. 4 85.1 80.7 91.8
low 16.1 11.7 7.8 5.8 16.5 6.9 12.8 11. 4 5.4
mod 1.4 1.8 4.8 4.9 4 .9 0.0 2.1 6.1 1.9
heav 2.8 0.0 0.0 0.0 1.6 1.7 0.0 1.8 0.9
Iodamoeba buetschlii
none 92.3 97.3 91.4 96.1 97.6 99.2 97.2 98.4 98.5
low 6.3 1.8 7.7 3.9 1.6 0.8 2.8 0.8 1.5
mod 1.4 0.9 0.9 0.0 0.0 0.0 0.0 0.8 0.0
heav 0.0 0.0 0.0 0.0 0.8 0.0 0.0 0.0 0.0
Small unidentified pre-cystic amoeba
none 100 100 100 lOa... 99.2 98.2 97.9 100 100
low 0.0 0.0 0.0 0.0 0.8 1.8 2.1 0.0 0.0
mod 0.0 0 .0 0.0 0.0 0.0 0.0 0.0 0.0 0.0
heav 0.0 0.0 0.0 0.0 0.0 0.0 0.0 0.0 0.0
Medium sized unidentified pre-cystic amoeba
none 94.4 96.4 96.1 95.2 91. 8 95.7 94 . 3 94.8 100
low 5.6 2.7 3.9 4.8 7.4 4.3 4.3 0.0 0.0
mod 0.0 0.9 0 . 0 0.0 0.8 0 . 0 1.4 0.0 0.0
heav 0.0 0.0 0'.0 0.0 0.0 0.0 0.0 0 .0 0.0
taeniid tapeworm
none 100 100 100 99.1 100 100 100 100 100
low 0.0 0.0 0.0 0.1 0.0 0.0 0.0 0.0 0.0
mod 0.0 0.0 0.0 0.0 0.0 0 . 0 0.0 0.0 0.0
heav 0.0 0.0 0.0 0.0 0.0 0.0 0.0 0.0 0.0
Hymenolepis diminuta
none 100 100 100 99.1 99.2 100 100 100 100
low 0.0 0.0 0 .0 0.9 0.8 0.0 0.0 0.0 0.0
mod 0 . 0 0.0 0.0 0 . 0 0.0 0 . 0 0 . 0 0 . 0 0.0
heav 0.0 0.0 0.0 0 . 0 0.0 0 . 0 0 . 0 0.0 0.0
Hymenolepis nana
none 99.3 100 99 .1 100 100 100 100 100 100
low 0.7 0.0 0.9 0.0 0.0 0.0 0.0 0.0 0.0
mod 0.0 0.0 0 . 0 0.0 0.0 0.0 0.0 0.0 0.0
heav 0.0 0.0 0.0 0 . 0 0.0 0.0 0.0 0.0 0.0

Table 5.1b Mean intensities of protozoan and cestode infections at the nine schools in winter (school 9 was only sampled in summer). Intensities were scored as: none, low, moderate or heavy accordinq to Ashford et al (1981) and sinqh et al (1994)
Sch Le Mf Te Ma Mhl Mk Se Mkh
Num 1 2 3 4 5 6 7 8
Alt 1660 1740 1800 1800 1860 1990 2000 2200 (m)
N 146 123 105 104 120 116 140 115
Giardia intestinalis
none 91. 6 93.9 94.2 99.1 98.4 99.1 94.3 98.1
low 7.7 6.1 5.8 0.9 1.6 0.9 5.7 1.7
mod 0.7 0.0 0.0 0.0 0.0 0.0 0.0 0.0
heav 0.0 0.0 0.0 0.0 0.0 0.0 0.0 0.0
Chilomastix mesnili
none 90.2 91. 5 89.4 93.4 92.6 97.3 96.4 93.6
low 7.0 6.0 5.8 4.8 5.8 0.9 3.6 3.5
mod 2.1 1.7 3.9 0.9 1.6 1.8 0.0 2.9
heav 0.7 0.8 0.9 0.9 0.0 0.0 0.0 0.0
Entamoeba histolytica
none 99.3 98.2 97.3 100 98.2 98.2 97.2 99.1
low 0.7 0.9 1.8 0.0 0.9 1.8 2.8 0.9
mod 0.0 0.9 0.9 0.0 0.9 0.0 0.0 0.0
heav 0.0 0.0 0.0 0.0 0.0 0.0 0.0 0.0
Entamoeba coli
none 42.4 66.9 77.6 56.5 61. 9 61. 3 58.6 43.9
low 45.0 21. 7 27.2 30.0 29.7 32.4 35.7 50.0
mod 10.5 8.8 18.4 12.6 7.4 4.5 4.3 6.1
heav 2.1 2.6 4.8 0.9 0.8 1.8 1.4 0.0
Entamoeba hartmanni
none 95.1 97.4 93.3 97.1 97.5 95.5 97.2 96.5
low 3.5 2.6 5.8 2.9 2.5 4.5 2.8 3.5
, mod 1.4 0.0 0.9 0.0 0.0 0.0 0.0 0.0
heav 0.0 0.0 0.0 0.0 0.0 0.0 0.0 0.0
Endolimax nana
none 81.7 91.4 79.6 94.5 81.0 90.1 87.9 78.9
low 14.8 6.9 14.6 4.8 15.7 9.9 11.4 20.2
mod 2.8 1.7 5.8 0.7 2.5 0.0 0.7 0.0 I
heav 0.7 0.0 0.0 0.0 0.8 0.0 0.0 0.9
Iodamoeba buetschlii
none 99.3 100 99.1 99.1 99.2 98.2 100 100
low 0.0 0.0 0.0 0.0 0.8 1.8 0.0 0.0
mod 0.7 0.0 0.9 0.9 0.0 0.0 0.0 0.0
heav 0.0 0.0 0.0 0.0 0.0 0.0 0.0 0.0
SPA
none 100 100 99.1 100 100 100 100 100
low 0.0 0.0 0.9 0.0 0.0 0 '.0 0.0 0.0
mod 0.0 0.0 0.0 0.0 0.0 0 . 0 0.0 0.0
heav 0.0 0.0 0.0 ·re· o 0.0 0.0 0.0 0.0
MSPA
none 97.2 99.1 96.3 99.1 99.1 100 100 100
low 2.8 0.9 3.7 0.9 0.9 0.0 0.0 0.0
mod 0.0 0.0 0.0 0.0 0.0 0.0 0.0 0.0
heav 0.0 0.0 0.0 0.0 0.0 0.0 0.0 0.0
taeniid tapeworm
none 100 100 100 99.1 100 100 100 100
low 0.0 0.0 0.0 0.9 0.0 0.0 0.0 0.0
mod 0.0 0.0 0.0 0.0 0.0 0.0 0.0 0.0
heav 0.0 0.0 0.0 0.0 0.0 0.0 0.0 0.0
. Hymenolepis diminuta
none 100 100 100 100 100 100 99.3 100
low 0.0 0.0 0.0 0.0 0.0 0.0 0.7 0.0
mod 0.0 0.0 0.0 0.0 0.0 0.0 0.0 0.0
heav 0.0 0.0 0.0 0.0 0.0 0.0 0.0 0.0
Hymenolepis nana
none 100 100 100 100 100 100 100 100
low 0.0 0.0 0.0 0.0 0.0 0.0 0.0 0.0
mod 0.0 0.0 0.0 0.0 0.0 0.0 0.0 0.0
heav 0.0 0.0 0.0 0.0 0.0 0.0 0.0 0.0

study area were 0.7% and 11. 2% respectively (see Table 5).
Prevalences of A. lwnbricoides were considerably less during
winter at six schools: Letlotlo, Teboho, Mafika-ditshiu,
Makeneng, Mohlakaneng and Sehlajaneng. Prevalences of
T. trichiura by contrast, varied little between season and the
parasite was absent from the two highest schools (2000 to 2200)m.
Enterobius vermicularis was excluded from analysis of the data.
The reason for this was that faecal examination does not give a
true reflection of its prevalence. The most reliable diagnostic
technique for this helminth is the cellophane tape swab (see
discussion, chapter six) . SPA occurred with a prevalence of 0.4%.
They were similar in shape and size to E. hartmanni and
E. histolytica but la'cked diagnostic features characteristic of
either species. MSPA were also present with an overall prevalence
of 4.1%.
5.3 INTENSITIES OF INTESTINAL PARASITES
The mean intensities of protozoans and cestodes in winter and
summer are given in Tables 6 .1a and 6 .1b. Those for nematodes are
gi ven in Table 7. Amongst the protozoans I prevalences were
generally light. Exceptions were E. coli, E. nana and C. mesnili
where each have considerable numbers of moderate infections and
even a few heavy ones. This is particularly so in summer.
Cestodes were rare in summer and virtually absent in winter.
Generally there was a trend amongst all the parasites towards
lower prevalences and intensities in winter, compared to the
summer values. Exceptions were E. coli and E. nana which were
34

Table 6.1a Mean intensities of protozoan and cestode infections at the nine schools in summer (school 9 was only sampled in summer). Intensities were scored as : none. light, moderate or heavy
Sch Le Mf Te Ma Mhl Mk Se Mkh Snt (c)
Num 1 2 3 4 5 6 7 8 9
Alt 1660 1740 1800 1800 1860 1990 2000 2200 1660 (m)
N 146 123 105 104 120 116 140 115 211
Giardia intestinal is
none 96.5 97.3 97.1 98.1 99.2 93.9 97.2 99.2 91. 7
low 3.5 2.7 2.9 1.9 0.8 6.1 2.8 0.8 4.4
mod 0.0 0.0 0.0 0.0 0.0 0.0 0.0 0.0 3.9
heav 0.0 0.0 0.0 0.0 0.0 0.0 0.0 0.0 0.0
Chilomastix mesnili
none 97.2 81.1 91.3 70.9 86.9 88.7 86.5 85.0 93.3
low 2.4 16.2 3.9 17.5 9.0 5.2 6.4 10.5 2.9
mod 0.0 2.7 3.9 9.7 1.6 3.5 6 . 4 2.6 2.9
heav 0.0 0.0 0.9 1.9 2.5 2.6 0 . 7 1.7 0.9
Entamoeba histolytica
none 100 100 99.1 100 100 99.1 97.2 100 100
low 0.0 0.0 0.9 0.0 0.0 0.9 2.8 0.0 0.0
mod 0.0 0.0 0.0 0.0 0.0 0.0 0.0 0.0 0.0
heav 0.0 0.0 0.0 0.0 0.0 0.0 0.0 0.0 0.0
Entamoeba coli
none 50.0 50.4 45.6 42.7 40.5 63.5 45.7 61. 4 83.4
low 33.0 36.9 35.0 24.3 34.7 23.5 37.8 26.3 10.7
mod 15.5 10.8 13.6 28.1 18.2 11. 3 15.0 10.5 3.9
heav 1.5 1.9 5.8 4.9 7.6 1.7 1.5 3.9 1.9
Entamoeba hartmanni
none 90.8 95.5 89.3 97.1 98.4 93.1 87.2 95.6 97.2
low 9.2 4.5 8.9 2.9 1.6 6.9 12.1 4.4 1.9
mod 0.0 0.0 0.9 0.0 0.0 0.0 0.7 0.0 0.9
heav 0.0 0.0 0.9 0.0 0.0 0.0 0.0 0.0 0.0
none
low
i mod
heav
none
low
mod
heav
none
low
mod
heav
none
low
mod
heav
none
low
mod
heav
none
low
mod
heav
Endolimax nana
79.7 86.4 87.4 89.3 77.0 91. 4 85.1 80.7 91.8
16.1 11. 7 7.8 5.8 16.5 6.9 12.8 11. 4 5.4
1.4 1.8 4.8 4.9 4.9 0.0 2.1 6.1 1.9
2.8 0.0 0.0 0.0 1.6 1.7 0.0 1.8 0.9
Iodamoeba buetschlii
92.3 97.3 91.4 96.1 97.6 99.2 97.2 98.4 98.5
6.3 1.B 7.7 3.9 1.6 O.B 2.B O.B 1.5 I
1.4 0.9 0.9 0.0 0.0 0.0 0.0 0.8 0.0
0.0 0.0 0.0 0.0 0.8 0.0 0.0 0.0 0 . 0
Small unidentified pre-cystic amoeba
100 100 100 100 99.2 98.2 97.9 100 100
0.0 0.0 0.0 0.0 0.8 1.8 2.1 0.0 0.0
0.0 0.0 0 . 0 0.0 0.0 0.0 0.0 0.0 0.0
0.0 0 . 0 0.0 0 .0 0.0 0.0 0.0 0.0 0.0
Medium sized unidentified pre-cystic amoeba II 94 . 4 96.4 96.1 95.2 91.B 95.7 94 . 3 94.8 100
5.6 2.7 3.9 4.8 7.4 4.3 4.3 0.0 0.0
0.0 0. 9 0. 0 0. 0 O.B 0.0 1.4 0 .0 0.0
0.0 0.0 0. 0 0.0 0.0 0.0 0.0 0.0 0.0
taeniid tapeworm
100 100 100 99.1 100 100 100 100 100
0.0 0.0 0.0 0.1 0.0 0.0 0.0 0.0 0.0
0.0 0.0 0.0 0.0 0.0 0.0 0.0 0.0 0.0
0.0 0.0 0.0 0.0 0.0 0.0 0.0 0.0 0.0
Hymenolepis diminuta
100 100 100 99.1 99.2 100 100 100 100
0.0 0.0 0.0 0.9 0.8 0.0 0.0 0.0 0.0
0.0 0.0 0. 0 D.O' ''''' 0.0 0.0 0.0 0.0 0.0
0.0 0.0 0 . 0 0.0 0.0 0.0 0.0 0.0 0.0

TaDle 6.1D Hean intensities ot protozoan and cestode intections at the nine schools in winter (school 9 was only sampled in summer). Intensities were scored as : none. low. moderate or heavy
Sch Le Mf Te Ma Mhl Mk Se Mkh
Num 1 2 3 4 5 6 7 8
Alt 1660 1740 1800 1800 1860 1990 2000 2200 (m)
N 146 123 105 104 120 116 140 115
Giardia intestinalis
none 91.6 93.9 94.2 99.1 98.4 99.1 94.3 98 . 1
low 7.7 6.1 5.8 0.9 1.6 0 . 9 5.7 1.7
mod 0.7 0.0 0.0 0.0 0.0 0.0 0.0 0.0
heav 0.0 0 ": 0 0.0 0.0 0.0 0.0 0.0 0.0
Chilomastix mesnili I
none 90.2 91.5 89.4 93.4 92 . 6 97.3 96. 4 93.6
low 7.0 6.0 5.8 4 .8 5.8 0.9 3 .6 3.5
mod 2.1 1.7 3.9 0.9 1.6 1.8 0.0 2 . 9
heav 0.7 0.8 0.9 0 . 9 0 . 0 0.0 0 . 0 0.0
Entamoeba histolytica
none 99 . 3 98.2 97.3 100 98.2 98.2 97.2 99 . 1
low 0.7 0.9 1.8 0.0 0.9 1.8 2.8 0 . 9
mod 0.0 0.9 0.9 0.0 0.9 0.0 0.0 0.0
heav 0.0 0.0 0.0 0.0 0.0 0.0 0.0 0.0
Entamoeba coli
none 42.4 66.9 77.6 56.5 61. 9 61. 3 58.6 43.9
low 45.0 21.7 27.2 30.0 29.7 32.4 35.7 50.0
mod 10.5 8.8 18.4 12.6 7.4 4.5 4.3 6.1
heav 2.1 2.6 4.8 0.9 0.8 1.8 1.4 0.0
Entamoeba hartmanni
none 95.1 97.4 93.3 97.1 97.5 95.5 97.2 96.5
low 3.5 2.6 5.8 2.9 2.5 4 . 5 2 . 8 3 . 5
mod 1.4 0.0 0.9 0.0 0.0 0.0 0.0 0.0
heav 0.0 0.0 0.0 0.0 0.0 0.0 0 . 0 0.0
Endol i max nana
none 81.7 91.4 79.6 94.5 81. 0 90.1 87.9 78 . 9
low 14.8 6.9 14.6 4.8 15.7 9.9 11.4 20.2
mod 2.8 1.7 5.8 0.7 2.5 0.0 0.7 0.0
heav 0.7 0.0 0.0 0.0 0.8 0.0 0.0 0.9
Iodamoeba buetschlii
none 99.3 100 99.1 99.1 99.2 98.2 100 100
low 0.0 0.0 0.0 0.0 0.8 1.8 0.0 0.0
mod 0.7 0.0 0.9 0.9 0.0 0.0 0.0 0.0
heav 0.0 0.0 0.0 0.0 0.0 0.0 0.0 0.0
SPA
none 100 100 99.1 100 100 100 100 100
low 0.0 0.0 0.9 0.0 0.0 0.0 0.0 0.0
mod 0.0 0.0 0.0 0.0 0.0 0.0 0 . 0 0.0
heav 0.0 0.0 0.0 0.0 0.0 0.0 0.0 0.0
MSPA r
none 97.2 99.1 9 6.3 99.1 99 . 1 100 1 00 100
low 2.8 0.9 3 . 7 0 .9 0 . 9 0 . 0 0.0 0.0
mod 0 . 0 0.0 0.0 0.0 0 . 0 0.0 0.0 0.0
heav 0 . 0 0.0 0.0 0 . 0 0.0 0.0 0.0 0 . 0
taeni'id tapeworm
none ,100 100 100 99 . 1 100 100 100 100
low 0.0 0.0 0.0 0.9 0.0 0.0 0.0 0.0
mod 0.0 0.0 0.0 0.0 0.0 0".0 0.0 0.0
heav 0.0 0.0 0.0 0 . 0 0 . 0 0 . 0 0.0 0.0 ,
Hymenolepis diminuta
none 100 100 100 100 100 100 99.3 100
low 0.0 0.0 0.0 0.0 0.0 0.0 0.7 0.0
mod 0.0 0.0 0.0 0.0 0.0 0.0 0.0 0.0
heav 0.0 0.0 0.0 0.0 0 . 0 0.0 0.0 0.0
Hymenolepis nana
none 100 100 100 100 100 100 100 100
low 0.0 0.0 0.0 0.0 0.0 0 . 0 0.0 0.0
mod 0.0 0 . 0 0.0 0.0 0.0 0.0 0.0 0.0

Table 7
Geometric mean egg counts (epg) for the nematode parasites at the nine schools in summer and winter (school 9 was only sampled in summer) .
Sch Le Mf Te Ma Mhl Mk Se Mkh Snt
Num 1 2 3 4 5 6 7 8 9
Alt 1660 1740 1800 1800 1860 1990 2000 2200 1660 (m)
N 146 123 105 104 120 116 140 115 211
Trichuris trichiura
none 98.6 99.1 100 100 98.4 99.1 100 100 98.6
Sum 409 19 0 0 391 4 0 0 34
Win 478 0 0 0 253 0 0 0
Ascaris lumbricoides
none 91. 5 98.2 86.4 100 97.5 94.1 97.1 98.2 98.5
Sum 791 265 1314 0 4419 430 124 857 413
Win 2255 0.0 1524 0 671 307 98 0 0.0

more common and more intense in winter.
5.4 POLYPARASITISM
5.4.1 Frequencies of overall polyparasitism per child in the
nine schools in summer .
Table 8.a
Overall frequencies of numbers of parasites per child.
Number of Frequecy Percentage Cumulative
Parasites percentage
0 353 35.4 35.4
1 326 32.7 68.1
2 190 19.1 87.2
3 98 9.8 97.0
>4 30 3.0 100.0
In general, the majority Of children (87.2%) have two or fewer
parasites. Tables 8.a & 8.b indicate that polyparasitism is not
a problem in summer and winter respectively in the study area.
35

Table S.b Frequencies of polyparasitism per child by school.
I I Number of parasite per child I I Sch Al t (rn) 0(%) 1(%) 2 (%) 3(%) >4 (%) Total
Le 1660 36 45 17 20 7 125
(28.8) (36.0) (13.6) (16.0) (5.6)
Te 1800 26 28 26 10 2 92
(28.3) (30.4) (28.2) (10.9) (2.2)
Mf 1740 19 30 14 6 4 73
(26.0) (41.1) (19.2) (8.2) (5.5)
Mk 1990 36 37 17 7 5 102
(35.6) (36.3) (16.7) (6.9) (4.8)
Mhl 1860 40 41 22 12 4 119
(33.6) (34.4) (30.2) (10.1) (8.4 )
Ma 1800 31 31 25 9 3 98
(31.6) (31. 6) (25.5) (9.2) (2.1)
Se 2000 39 45 29 14 3 130
(30.0) (34.6) (22.3) (10.8) (2.0)
Mkh 2200 25 29 17 11 1 83
(30.1) (34.9) (20 . 5) (13.2) (1. 3)
Snt 1660 90 33 19 7 1 150
( C) (60.0) (22.0) (12.7) (4 . 7) (0 . 6)
36

5.4.2 Frequencies of overall polyparasi tism per child in
eight ' schools in winter
Table 9a
Frequencies of overall polyparasitism per child in eight schools
in winter.
Number of Frequency Percentage Cumulative
parasites percentage
0 247 32.9 32.9
1 303 40.3 73.2
2 133 17.7 90.9
3 57 7.6 98.5
>4 11 1.5 100
In winter 90.9% of children had two or fewer parasi tes, therefore
polyparasitism is not important in winter as shown in Tables
9a & ' 9b. There is no statistical difference between the
frequ,encies of polyparasitism between summer and winter.
37

Table 9b
Frequencies of polyparasitism in the eight schools sampled in
winter, per child by school.
Number of parasites per child
Sch Alt (m) o (%) 1 (%) 2 (%) 3 (%) >4(%) Total
Le 1660 18 55 24 16 1 114
(15.7) (48.2) (21.0) (14.0) ( 1.1)
Te 1800 16 30 21 8 4 79
(20.2) (28.1) (26.6) (10.1) (5.0)
Mf 1740 19 27 8 7 2 63
(30.1) (42.8) (12.7) (11.1 ) (3.3)
Mk 1990 33 31 10 3 2 79
(41. 8) (39.2) (12.7) (3.7) (2.6)
Mhl 1860 43 35 17 5 2 102
(42.1) (34.3) (16.7) (4.9) (2.0)
Ma 1800 30 32 10 4 0 76
(39.5) (42.1) (13.2) (5.2) (0.0)
Se 2000 49 43 17 7 0 116
(42.2) (37.0) (14.6) (6.2) (0.0)
Mkh 2200 36 44 20 6 0 106
(33.9) (41.5) (18.9) (5.7) (0.0)
38

5.5. Morphology and diagnostic features of cysts and eggs of
intestinal parasites found in the study area.
5.5.1 THE PROTOZOANS
5.5.1.1 The Flagellates
Giardia intestinalis (Plate II A)
The cyst is oval in shape and measures 8 to 12~m in length and 7
to 10~m in width. The cytoplasm is clear, with a distinct central
axostyle, flagellum curled up and has 2 to 4 nuclei and usually
2 retracted vacuoles ·or "eyes"; When stained with iodine the cyst
is normally yellow or light brown.
Chilomastix mesnili (Plate lIB)
The cyst is characteristically lemon shaped, they measure 7 to
10~m in length by 4 to 10~m in width. It has a very thick wall,
an axostyle down the middle and sometimes with a curled-up
flagellum. A dense granular cytoplasm appears separated from the
wall at the narrow end and forms a distinct nipple. Stains yellow
with iodine.
39

PLATE II
Cysts of intestinal protozoan parasites (flagellates)
A. Giardia intestinalis, , oval shaped cyst with curled up axonemes of flagella (ax) and two or four nuclei, (seen with lOOOX objective).
B. Chilomastix mesnili, pear shaped cyst with one nucleus and a characteristic nipple (n) (seen with lOOOX objective).

5.5.1.2 The Amoebae
Entamoeba histolytica (Plate IlIA)
usually spherical in shape with a prominent dark "pencil lead"
outer wall. It is 10 to 20p.m in diameter. It has granular
cytoplasm with 1 to 4 nuclei and round-ended chromatoidal bars
and does not retract from the cyst wall. The karyosome is central
within the nucleus . Stains light yellow with iodine.
Entamoeba coli (Plate lIIB)
The cysts vary in shape, and measure between 10 and 33 p.m in
maximum diameter. It has 1 to 8 nuclei sometimes more, clear
cytoplasm, when immature some are almost full of glycogen . They
are very large, and in some cases the cytoplasm has retracted
from the cyst wall. Nucleolus is eccentric and has spindle-ended
chromatoidal bars. Stains yellow to orange with iodine.
Entamoeba hartmanni (Plate IIIe)
This is a very small, round cyst measuring 5 to 10p.m in diameter .
The cytoplasm is granular with 1 to 4 nuclei, a central nucleolus
and rounded-ended chromatoidal bars. It stains orange to brown
with iodine .
40

PLATE III
Cysts of intestinal protozoan parasites (amoebae).
A. Entamoeba histolytica, cyst with central nucleolus (1-4 nuclei), showing rod-shaped chrornatoidal bars (r), (seen with 1000X objective).
B. Entamoeba coli, cyst with eccentric nucleolus (1-8 nuclei) showing splinter like chrornatoidal bars (r) and eight nuclei, (seen with 1000X objective).

,. 1" '. -: ..
D. Endolimax nana, oval shaped cyst with and four nuclei, (seen with 1000X objective).
c. Entamoeba hartmanni, spherical, cyst with granular cytoplasm and one nucleus, (seen with 1000X objectiver~-'· : '-· ·· ·
E. Iodamoeba buetschlii, compact glycogen vacuole (v) and one nucleus, (seen with lOOOX objective) .

Endolimax nana (Plate IIID)
The shape of the cyst is spherical or ovoid, with a clear
cytoplasm containing refractile vacuoles . It measures 5 to 14~m
in diameter and has 1 to 4 indistinct nuclei. Stains pale green
with iodine.
Iodamoeba buetschlii (Plate IIIE)
The cyst varies in shape, viz: round, oval, elliptical,
rhomboidal etc . It measures between 5 to 20~m. It has a granular
cytoplasm, one nucleus with a well defined glycogen vacuole. The
nucleolus is surrounded by granules. Typically stains dark brown
with iodine.
5.5.2 The Cestodes
Taeniid tapeworm (Plate IV A)
The fully embryonated egg, which is almost mature when it leaves
the uterus. The eggs are spherical , measure 31 to 431lm in
diameter, the shell is thick-walled, consisting of many truncated
prisms cemented together. Within a shell is a fully developed
onchosphere which, in Taenia solium that has three pairs of
hooklets. These cannot usually be seen so that T. saginatus and
T. solium eggs are very difficult to separate.
41

\
I
\
I I \
\
\
\
Cestode eggs
A. Fully embryonated, spherical, egg (Pork tapeworm) Taenia solium hatching to release hexacanth embryo with three pairs of hooklets (h) ,and thick radially striated shell, (seen with 400X ob ective).
B. Rat tapeworm (Hymenolepis diminuta) fully embryonated, spherical egg with three pairs of hooklets (h) similar to H .nana but no polar filaments, seen with 400X objective).
C. Dwarf tapeworm (Hymenolepis nana) fully embryonated, oval shaped egg, contain onchosphere enclosed with polar thickenings from which polar filaments arise (p). Onchosphere has three pairs of hooklets, (seen with 400X objective).
,f"" ...... ,-.+- ..... ..l- -

Hymenolepis diminuta (Plate IV B)
The eggs are spherical or subspherical, measure 60 to 79~m by 72
to 86~m, and have the onchosphere with three pairs of hooks and
no polar filaments between embryo and outer shell.
Hymenolepis nana (Plate IV C)
The egg is spherical to oval in shape, measures 30 to 47~m in
diameter and contains an onchosphere that is enclosed in an inner
envelope with two polar thickenings, from each of these arise 4
to 8 polar filaments.
5.5.3 The Nematodes
Trichuris trichiura (Plate V A)
In Trichuris trichiura the outer eggshell is fully formed and
deeply tanned while in the uterus. The egg is barrel-shaped, and
in addition to a vitelline membrane, ' has a triple layered shell,
the outer layer is dark brown. They have bipolar, unstained
mucoid plugs. The eggs measure 50 to 54~m by 22 to 23~m.
Enterobius vermicularis (Plate V C)
The egg contains an infective Ll stage larva when laid. The eggs
are elongate-ovoidal, flattened on one side, and measure 50 to
60~m by 20 to 30~m. The shell is relatively thick and colourless .
They are sticky.
42
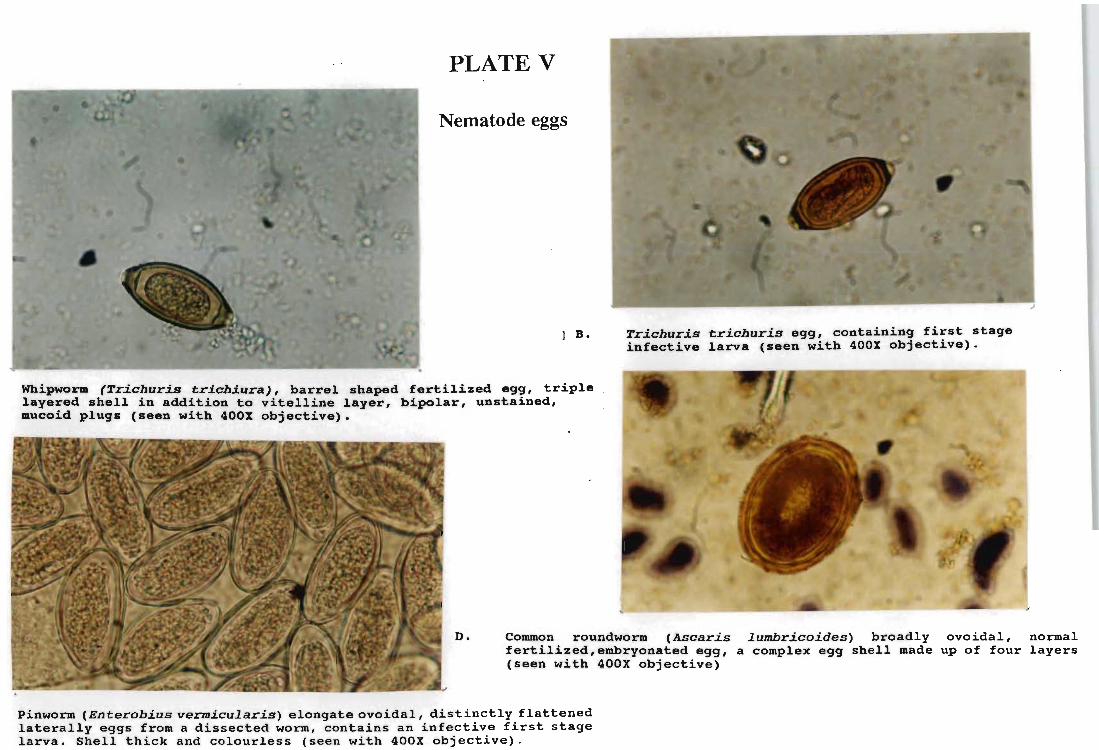
PLATE V
Nematode eggs
I B.
Whipworm (Trichuris ~richiura), barrel shaped fertilized egg, triple layered shell in addition to vitelline layer, bipolar, unstained, mucoid plugs (seen with 400X objective).
Trichuris erichuris egg, containing first stage infective larva (seen with 400X objective).
D. Common roundworm (Ascaris lumbricoides) broadly ovoidal, normal fertilized, embryonated egg, a complex egg shell made up of four layers (seen with 400X objective)
Pinworm (Enterobius vermicularis) elongate ovoidal, distinctly flattened laterally eggs from a dissected worm, contains an infective first stage larva. Shell thick and colourless (seen with 400X objective).

Ascaris lumbricoides (Plates VD, VIA-D)
The egg is extremely tough and very adhesive. Three structurally
different types of eggs are commonly found, especially in heavy
infections. Fertilized eggs (Plate VD and VIC) measure over the
range 50-70 by 40-50JLm in length. These eggs are broadly ovoid in
shape. Unfertilized eggs measure uP . to 60-100 by 40-60JLm.
Infertile eggs (Plate VIA) confused with plant cells.
Decorticated eggs (Plate VIB) sometimes be confused with hookworm
eggs. Plate VID shows the L2 (second stage) hatching from the
egg.
5.6 STATISTICAL AN~YSIS
As noted in Chapter 4 to overcome the confounding effects of
schools models were fitted to determine the most important
socio-economic variables.
5.5.1 Introduction
Socio-economic factors were considered one at a time, i.e. chi
squared tests were used to determine whether transmission of
parasites appears to be related to each socio-economic factor.
In addition to the unadjusted chi-square test, a Mantel-Haenszel
stratified approach was used for those socio-economic factors
with two levels, e.g. g~nder, with the schools as strata to
remove the confounding effect of the schools themselves as socio
economic variables.
43

PLATE VI Ascaris lumbricoides eggs
Normal unfertilized egg, with mammillated B. albuminoid layer (seen with 400X objective)
Embryonated egg containing an infective second stage larva (seen with 400X objective)
Decorticated (lost the mammillated layer), fertilized egg, (seen with 400X objective)
\
embryonated
D. Hatching of infective second stage larva from the egg, (seen with 400X objective)

5.5.2 Relationships between prevalences and altitude
Figure 6 shows the percentages of uninfected children
(NPS) at each school in summer. Winter data are not included
because no winter data were available for school no. 9. There
were no significant differences in total parasitism between
schools at different altitudes from 16~0 to 2200m . However there
was a marked difference between the two schools at the same
altitude 1660m, viz: Letlotlo (No 1) and Sentinel (No 9),
(X 2 = 11.80, P s 0.001). Indeed reference to Figure 6 shows that
whereas 23.0% of children at Letlotlo had no parasite infections,
66.0% at Sentinel school were uninfected.
5.5.3 Relationship between prevalence and soil type
The scale of the soil type maps available (Fig. 4) (p.20) is too
large to relate meaningfully to the schools in question. Further,
the catchment areas of these schools are not well known and
consequently cannot be mapped. The settlements in which the soil
transmitted nematodes A. lumbricoides and T. trichiura occur, lie
on soils basically very fertile clay rich area, viz: Clovelly
Avalon, Willowbrook and Kroonstad. Katspruit types. (Prof. J.
Hughes, Department of Agronomy, University of Natal pers. comm.) .
The characteristics of the different soil types are described in
Table 1 on (p.21).
Prevalences of helminths in group 1 schools ranged from 1.7% in
summer to 0% at Makhabane in winter. At Sehlajaneng, the
44

70
65
60
-en a.. z -... c: Q) u ~
Q) 45 a..
40
35
30 Le Mf Te Ma Mhl Mk Se Mkh Snt
Schools
Figure 6 shows percentages of uninfected children during summer
(NPS = No parasites seen in faecal sample).
prevalence decreased from 2 . 1% in sununer to 1 . 0 in winter.
Tapeworm infection was only 'found at Makhetheng where one child
was infected. There was no seasonal effect on tapeworm infection
in winter, ascariasis was also not recorded at the Makhetheng. At
Mohlakaneng ascariasis decreased from 2.5% to 2 . 0% in winter .
In group 2 schools, ascariasis decreased from 5 . 0% at Makeneng
to 1 . 5%, from 13.0% to 6.1% at Teboho and from 8.9% to 6.1% at
Letlotlo .
E. coli and E. nana in group 1 and group 2 prevalences increased
in winter, with prevalences increasing from 36 . 5% to 61%
Makhabane (see Tabl,e 5.1 and 5 . 2 for seasonal effect on
prevalences of intestinal parasites in all schools) . Sentinel was
sampled in sununer only.
5.6 RELATIONSHIP BETWEEN PREVALENCES AND
SOCIO-ECONOMIC FACTORS
5.6.1 GENDER PREVALENCE PROFILES BY SCHOOL
5.6.1.1 PREVALENCES IN MALES AND FEMALES
Gender-related parasite prevalence data are given for each school
' in Appendix D. Analysis of these data showed that there was no
evidence of a difference in the infection rate for males and
females in either winter or sununer . This is shown in Figure 7.
Pooling the data from all nine schools:
45

nles (51 .G%)
winter Summer
Felllal!~s ( /IIIA ~~) Males (4U .n%)
Figure 7
Relative frequencies of intestinal parasite infections among males and females - data pooled from all nine school s in summer and e i ght schools in winter.
Females ( ;-)() . 2 ~~ )

X2 = 0.14 on 1 d.f. (p = 0.71) (summer)
X 2 = 0.11 on 1 d.f. (p = 0.74) (winter)
Use of the Mantel-Haenszel approach to adjust for the possible
confounding effect of IIschoolll gave:
X 2 MH = O. 04 (p = O. 85 )
X 2 MH = O. 40 (p = O. 52 )
5.6.1.2 PREVALENCES IN DIFFERENT AGE CLASSES
Analysis of the age-related data in Appendix D showed
considerable variation in parasite prevalences between schools.
X2 = 3.14 on 2 d.f.
X2 = 4.89 on 2 d.f.
(p = 0.21) (summer)
,(p = 0.087) (winter).
For example it can be seen that in Figure 8, at Mohlakaneng and
Mafika-ditshiu schools, prevalences in the < 5year age group in
summer were 23.9% and 45.0% respectively. Similarly, in the 6-10
year age groups, prevalences of 50.5% and 86.7% were recorded at
Teboho and Sehlajaneng schools respectively in summer. Variation
was less in the <10 year age group, from 0.8% at Mohlakaneng to
31.3% at Makhabane in winter.
Two groups of children are most commonly infected by these
parasites i.e the <5 year and the 6-10 year old groups
(Figure 8). The >10 year group have generally low prevalences of
parasite infections with the 6-10 year group being the most
frequently infected age group followed by the <5 year old group.
' 46
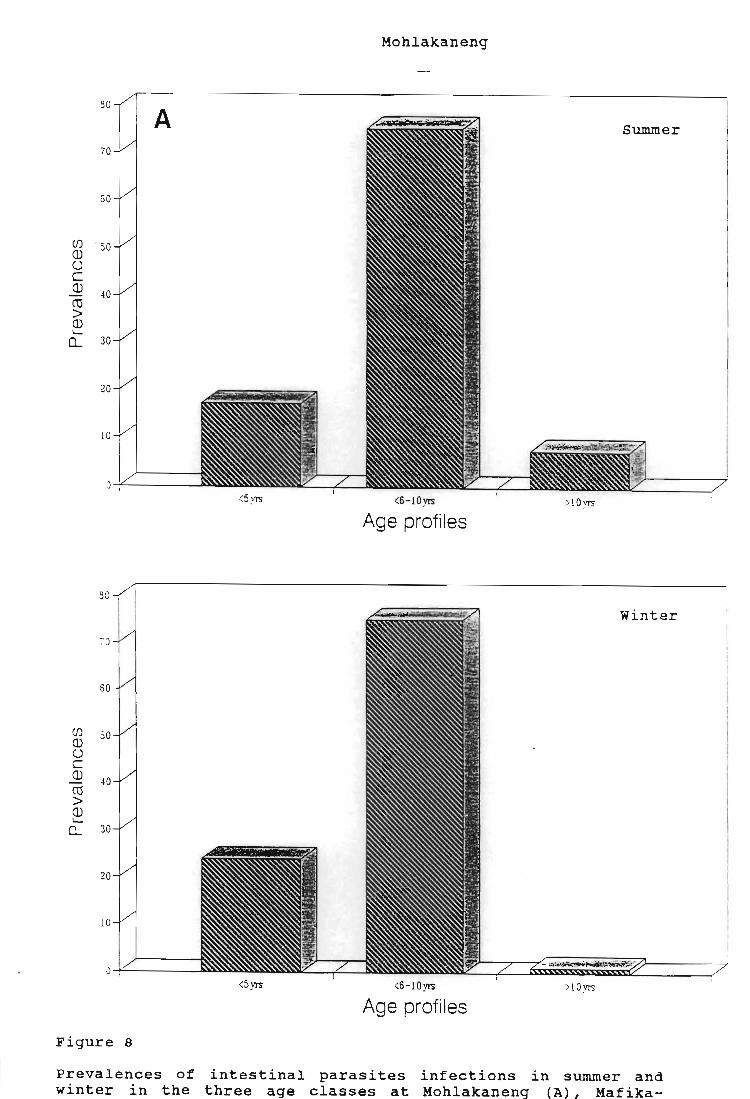
Mohlakaneng
30
A Summer
70
60
(j) . 50 ill U C ill 40 CO > ill ~
Cl... 30
20
10
O -i"-----~
<5yrs <6-10yrs >l Oyrs
Age profiles
30
Winter
70
60
(j) 50 ill U c ill 40 CO > ill ~
Cl... 30
20
10
0 <5yrs <S-1 0yrs >lOyrs
Age profiles
Figure 8
Prevalences of intestinal parasites infections in summer and winter in the three age classes at Mohlakaneng (A), Mafika-

Mafika-ditshiu
60 8 summer
50
-10 (J) Q) u c Q)
CO 30
> Q) ~
0... 20
10
0-=-----"'" <5 VI'S <6-10yrs >lO yrs
Age profiles
50 win"ter
-i5
-i0
35
(J) Q) 30 U C ill 25 CO > Q)
20 ~
0...
15
10
5
0 <5yrs <6-10yrs >l Oyrs
Age profiles

Teboho
50 summer c
<5yrs >6-10yrs >10yrs
.ts winter
~O
35
30 (J) (1) U
25 C (1)
C'Cl > 20 (1)
--Q... 15
10
5
0 <5yrs >6-10yrs >l Oyrs
Age profiles

Makhetheng
70 Summer D
60
50
(fJ
CD U 40 C CD eel > 30 CD ....
0....
20
:0
>5y1'S <6- l 0yrs >lO yrs
Age profiles
30 / Winter
- Q~ !
30
(fJ 50 CD U C Q)
~o (ij
> Q) '-
0.... 30
20
<5 yr.; <6-l0yrs >l Oyr.;
Age profiles

The age of parents or guardians (usually grandparents)
categorized as (i.e. <30, 31-40 and >40 years) did not have any
significant effect on whether or not a child was infected. This
was true regardless of the sex of the parent or guardian.
5.6.1.3 EFFECT OF HOUSEHOLD SIZE ON TRANSMISSION
The average household size in Qwa-Qwa is six to seven people.
This increases according to the following trend: rural (see
Plate IA) >urban (see Plate Ie) >semi-rural (see Plate IB)
(p. 23). The largest average household size recorded was in
Makwane with 8 to 12 people. The smallest household size «5
people) was recorded, In the higher socio-economic sector of the
Qwa-Qwa community. Interestingly, the highest ascariasis
prevalence was recorded at Teboho school which serves the Makwane
community. Trichuriasis was not recorded at Teboho school.
However statistical results show that 41.0% of the children from
small households, 38.0% from intermediate households and 39.0%
for households with more than . ten people were not infected.
Household size did therefore not have a significant effect on
parasite transmission:
X 2 = l.11 on 1 d.f. (p = 0.29) (summer)
X 2 = 2.73 on 1 d. f. (p = 0.098) (winter)
Use of the Mantel-Haenszel approach to adjust for the possible
confounding effect of "school" gave:
X 2 MH = O. 01 (p = O. 85 )
X 2 MH = 1. 5 7 (p = O. 21 )
47

5.6.1.4 EFFECT OF LEVEL OF EDUCATION ON TRANSMISSION
The lowest levels of education were recorded at Makhabane,
Lejwaneng and Rietpan even though educational institutions are
evenly distributed within the study area. The heads of the
households in these areas (Group 1) have only primary school
education or no education at all. The results of the survey
indicated that 66.0% of the children whose fathers possess a
primary education qualification only, were infected. For children
whose fathers had a higher primary, secondary or tertiary level
of infection rates were 64.0%, 64.0% and 33.0% respectively. The
highest level of infection (68.0%) was recorded among those
children whose fathers had no formal education at all. There is
strong evidence that the fathers level of education has a
significant influence on the probability of his children being
infected in summer, however in winter there is no evidence of the
relationship:
X2 = 30.39 on 4 d.f. (p:s; 0.0001) (summer)
X2 = 3.45 on 4 d.f. (p = 0.49) (winter)
The present study shows that for children whose mothers had only
attained a lower or higher primary qualification, infection
levels were 65.0% and 71.0% respectively. Among children whose
parents possessed secondary education the prevalence rate was
62.0% compared with 35.0% observed in those children whose
mothers had tertiary education. This was only significant in
summer.
48

x2 = 38.78 on 4 d.f (p :s; 0.0001) (summer)
X 2 = 1.54 on 4 d.f (p = 0.82) (winter)
One possible reason for the different results in summer and
winter is the exclusion of the control school in winter (since
many parents in the control area had higher levels of education) .
5.6.1.5 EFFECT OF LEVEL OF EKPLOYHENT OF PARENTS/GUARDIANS
ON TRANSMISSION
Employment of the father has been shown to be significant in
determining the probability of a child becoming infected in
summer but not in winter. In summer, 60.0% of children whose
fathers were unskilled were infected. whereas 50.0% of those
whose fathers were skilled were infected. Children who were
looked after by their grandfathers, wer~ 67.5% infected.
X 2 = 9.35 on 3 d.f. (p = 0.025) (summer)
X 2 = 3.10 on 3 d.f . (p = 0 . 38) (winter)
Sixty eight percent of children whose mothers were unskilled were
infected, while those whose mothers were skilled showed a 45 . 0%
infection rate. Those children who were looked after by
pensioners showed a 62.0% level of infection. Association of
mother's employment and infection was found to be significant
x2 = 22.58 on 3 d.f.
X2 = 2.63 on 3 d.f.
(p :s; 0.0001) (summer)
(p = 0.45) (winter)
49

•
5.6.1.6 EFFECT OF HOUSEHOLD INCOME ON TRANSMISSION
The income of father played a significant role in parasite
transmission in summer. Sixty six percent of children whose
fathers earned less than R300 p.m. had intestinal parasites. Of
those who earned between R301 - R600 p.m. 64.0% of their children
were infected, and 40.0% of children whose fathers earned more
than R1 000 p. m were infected. In winter there was no such
relationship.
X2 = 24.39 on 4 d.f. (p s 0.0001) (summer)
X2 = 4.62 on 4 d.f. (p = 0.33) (winter)
The mother's income . played an even more significant role in
determining whether a child is likely to be infected or not in
summer. Sixty five percent and 68.0% percent children whose
mothers earned less than R300 p.m. and R301 R600 p.m.
respectively were infected. Only 35.0% of children whose had
mothers earned more than R1 000 p.m. had infection:
X2 = 39.97 on 4 d.f . . (p s 0.0001) (summer)
X2 = 3.16 on 4 d.f. (p = 0.53) (winter)
5.6.1.7 EFFECT OF HOUSING QUALITY ON TRANSMISSION
Levels of infections varied according to house quality.
Children living in brick houses were the least likely to be
infected ; 55.0% were infected followed by children liviing in mud
houses where the prevalence was 65.0%. Children who lived in
shacks had a 71.0% infection rate. The correlation between house
50
quality and parasite transmission was significant:
X2 = 9 . 86 on 2 d.f. (p s; 0.01) (sumner)
X 2 = 5.96 on 2 d. f . (p = 0.051) (winter)
5.6.1.8 EFFECT OF KIND OF MEAT EATEN ON TRANSMISSION
There was no evidence for any significant association between
parasite transmission and the kind of meat eaten. My survey
showed that 55.0% ate beef, 36 . 8% ate both beef and pork, 5.5%
ate goat meat, 2.4% ate pork only and 0.3% could not afford to
buy meat at all. Note that the statistical results for this
variable are unreliable due to a very large number of missing
values and only 16 pork eaters.
5.7.1.9 EFFECT OF SOURCE OF MEAT ON TRANSMISSION
The association between source of meat and intestinal parasite
transmission was found to be not significant. The results showed
that 53.6% of children who ate meat bought from a butchery were
infected. However 63.6% of children whose parents bought meat
from the butchery and also slaughtered their own were infected.
This provides some evidence that the inclusion of self
slaughtered meat in children's diets promoted parasite infection.
5.6.1.10 EFFECT OF QUALITY OF MEAT ON TRANSMISSION
There was statistical evidence that children coming from
families that bought both graded and ungraded meat were infected
51

significantly more often than those children whose families did
not buy meat at all, 55 . 0% were infected. Of those who came from
families who bought meat from vendors or slaughtered their own
and thus ate uninspected meat, 67.0% were infected.
X 2 = 13.58 on 2 d.f. (p = 0.001) (summer)
X 2 = 7.57 on 2 d.f. (p = 0.023) (winter)
5.6.1.11 EFFECT OF DIS~ANCE FROM WATER SOURCE ON TRANSMISSION
Water source had a highly significant effect on parasite
transmission in summer. Thirty five percent of children from
households with taps available indoors, were infected. Those who
had water sources further from the house were 65.0% infected
while and those which had to fetch water more than a kilometre
away had 72.0% of their children infected.
X 2 = 57.67 on 3 d.f (p s 0.0001) (summer)
X2 = 6.14 on 3 d.f (p = 0.11) (winter)
5.6.1.12 EFFECT OF SANITATION ON TRANSMISSION
Only 32 . 7% of children who had flush toilets in their houses were
infected; 86.0% of these children were from Sentinel school which
serves t he higher socio-economic sector of the community. Those
who only had access to pit-latrines or buckets were 67.0%
infected. This was a highly significant association. Pooling the
data from all nine schools:
X 2 = 57.51 on 1 d.f. (p s 0.0001) (summer)
X2 = 1.33 on 1 d.f. (p = 0.72) (winter)
52

Use of the Mantel-Haenszel approach we got :
X2 MH = 23.14 on 1 d.f (p:s; 0.0001) (summer)
X2 MH = 0.16 (p = 0.48) (winter)
The effect of sanitation is however likely to be confounded with
other socio-economic variables such as water source, electricity
and housetype.
5.6.1.13 EFFECT OF ELECTRICITY ON TRANSMISSION
The results show that 31.0% of children coming from homes with
electricity were infected while 67.0% of those coming from homes
without electricity were infected. There was strong evidence that
the presence or absence of electricity in the home influenced
parasite transmission:
X2 = 62.08 on 1 d. f (p :s; 0.0001) (summer)
X2 = 1.17 on 1 d.f (p = 0.64) (winter)
Use of the Mantel-Haenszel approach to adjust for the possible
confounding effect of "school" gave:
X2MH = 57.41 (p:s; 0.0001) (summer)
53
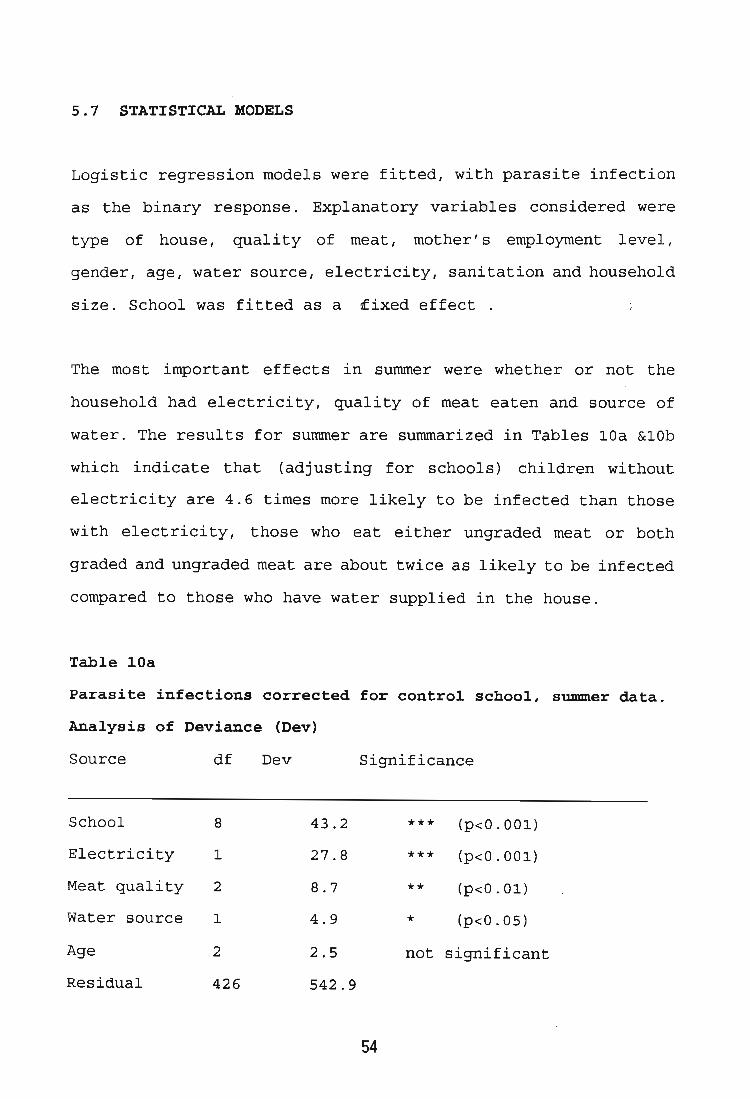
5.7 STATISTICAL MODELS
Logistic regression models were fitted, with parasite infection
as the binary response. Explanatory variables considered were
type of house, quality of meat , mother's employment level,
gender, age, water source, electricity, sanitation and household
size. School was fitted as a ~ixed effect .
The most important effects in summer were whether or not the
household had electricity, quality of meat eaten and source of
water. The results for summer are summarized in Tables lOa &lOb
which indicate that (adjusting for schools) children without
electricity are 4.6 times more likely to be infected than those
with electricity, those who eat either ungraded meat or both
graded and ungraded meat are about twice as likely to be infected
compared to those who have water supplied in the house.
Table lOa
Parasite infections corrected for control school, summer data.
Analysis of Deviance (Dev)
Source df Dev Significance
School 8 43.2 *** (p<O.OOl)
Electrici ty 1 27 . 8 *** (p<O . OOl)
Meat qual ity 2 8.7 ** (p<O.Ol)
Water source 1 4.9 * (p<O.05)
Age 2 2.5 not significant
Residual 426 542.9
54

Interpreted Parameters
Parameter est.
No electricity 1.519
Ungraded meat 0.688
Both graded & 0.669
graded meat
Water source 0.932
Key:
est. =
s.e . =
O.R. =
estimate
standard error
Odds Ratio
n.8 . = not significant
Table lOb
s . e . Odds Ratio
0 . 516 4 . 57
0 . 290 1.99
0.240 1. 95
0 . 422 2 . 54
Parasite infections. Winter data - correct Denominator including
mother's employment level.
Analysis of Deviance
Source df Dev Significance
School 7 24.6 *** (p<O . 001)
House type 2 10.7 *** (p<O . OOl)
Meat grade 2 2.5 n.s.
Water source 1 1 . 3 n.s.
Residual 321 409
55
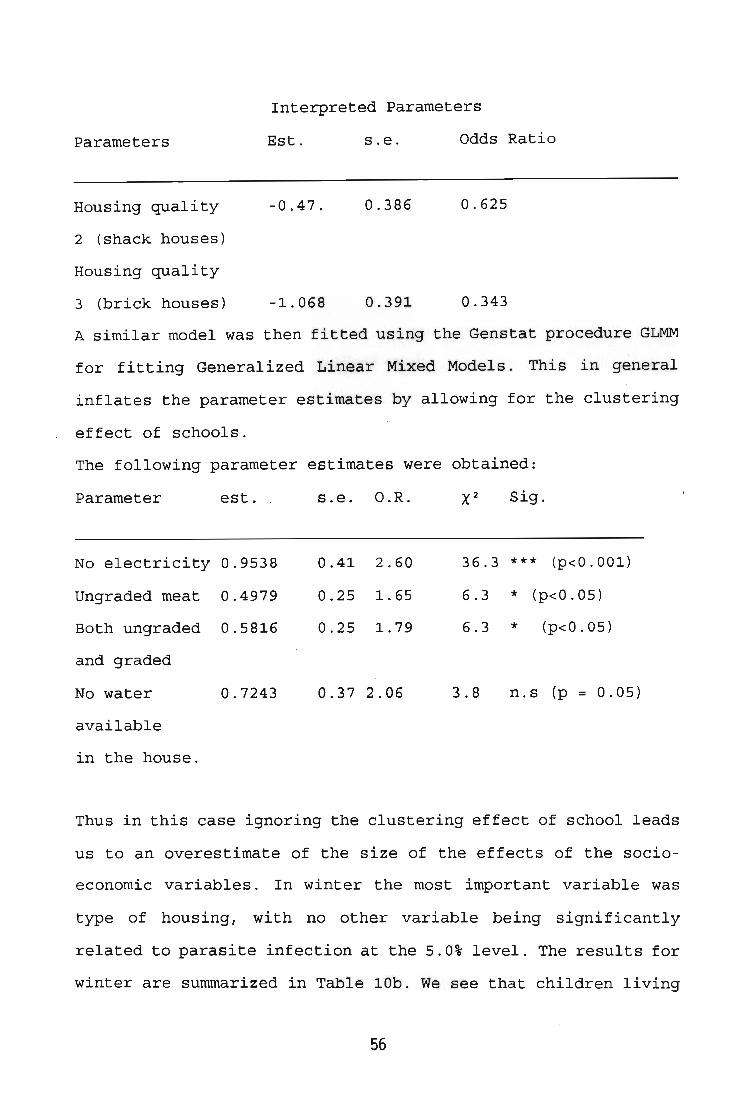
Interpreted Parameters
Parameters
Housing quality
2 (shack houses)
Housing quality
3 (brick houses)
Est.
-0.47.
-1.068
s.e. Odds Ratio
0.386 0.625
0.391 0.343
A similar model was then fitted using the Genstat procedure GLMM
for fitting Generalized Linear Mixed Models. This in general
inflates the parameter estimates by allowing for the clustering
effect of schools.
The following parameter estimates were obtained:
Parameter est . . s.e. O.R. Sig.
No electricity 0.9538 0.41 2.60 36.3 *** (p<O.OOl)
Ungraded meat 0.4979 0.25 1. 65 6.3 * (p<0.05)
Both ungraded 0.5816 0.25 1. 79 6.3 * (p<0.05)
and graded
No water 0.7243 0.37 2.06 3.8 n.s (p = 0.05)
available
in the house.
Thus in this case ignoring the clustering effect of school leads
us to an overestimate of the size of the effects of the socio
economic variables. In winter the most important variable was
type of housing, with no other variable being significantly
related to parasite infection at the 5.0% level. The results for
winter are summarized in Table lOb. We see that children living
56

in mud houses are 0.63 times as likely to be infected as children
living in shacks, while children living in brick houses are only
0.36 times as likely to be infected as children from shacks (i.e
children living in shacks are about 3 times more likely to be
infected than children from brick houses) .
The results from GLMM are summarized below :
Parameter
Mud house
Brick house
est.
-0.4454
-0 . 8167
s . e .
0 . 327
0.3282
O.R. X2 significance
0 . 64 7.0 (p<0 . 05)
0.44 7 . 0 (p<0 . 05)
So again, ignoring the clustering effects of schools leads us to
overestimate the size of the effects of socio-economic variables .
Variables such as economic status and level of education were not
considered in these models due to the large number of missing
values in these variables . When f i tt ing GLMM the effect of
altitude could be examined, but there was no evidence of change
in infection rate with increasing altitude (in both summer and
winter) .
In conclusion the results for summer and winter were very
different, with much stronger associations found in summer. This
was partly due to the fact that there was no control school data
in winter I but an analysis of .the summer data excluding the
57

control school still showed different results from winter .
58

Chapter 6
GENERAL DISCUSSION
This study has involved a detailed investigation into the
diversity and transmission of human intestinal parasites
infecting children at high altitudes, from 1600 to 2200m, their
prevalences and intensities in relation to climatic, demographic
and socio-economic factors . The results were compared to Kravitz
et al., (1993) from neighbouring Lesotho (see Tables l~a and
15b). The two studies are almost similar.
People in Qwa-Qwa are not severely parasitised by worms and there
is no hookworm or bilharzia as it has been established by Evans
et al., (1987) and Pitchford (1981) that the Schistosoma endemic
areas are below 1400m. The study has developed a model of
intestinal parasite transmission at community level and lays a
groundwork on which the Primary Health Care (PHC) and Public
Health authorities can base the design and control programme for
the area or any area in South Africa after taking into
consideration the relevant climatic and socio-economic factors.
Data on intestinal parasites at high altitudes (Kravitz et al.,
(1993a&b) and this study) show that there is a very low
prevalence and intensity of worm infection but a wide range of
prevalences and intensities of protozoan infections. Kravitz et
al., (1993b) attributed the absence of helminths, especially
Ascaris, hookworm and Trichuris from Lesotho to cold , dry
climate, which was unfavourable for the survival of eggs and, in
59

Table lSa comparison of the prevalences of intestinal protozoans in KwaZulu-Natal, Lesotho and Qwa-Qwa .
I study area I 1 I 2 I 3 I 4
Altitude 50 - 100 - 1650 1660 /- 2200 (m.a.s.l) 1720 300
Number of N = N = N = N = children 693 7569 1611 1180 sampled
Parasite %Prev % Prev 51, 0 Prev Sum 51,
0 Win % species
Protozoans
Giardia 16.8 3.4 4.1 3.5 5.5 intestinal is
Chilomastix 1.3 4.2 6.1 14.6 8.9 mesnili
Balantidium 0.7 0.7 0.0 0.0 0.0 coli
Entamoeba 0.9 4.3 14.5 0.7 2.0 histolytica
Entamoeba 40.2 60.5 53.2 46.7 58.9 coli
Entamoeba 0.0 4.3 6.7 6.6 5.2 hartmanni
Endolimax nana 2.1 7.0 3.7 16.7 19.5
Iodomoeba 17.8 4.3 1.7 3.6 0.8 buetschlii
SPA 0.0 0.0 0.0 0.6 0.3
MSPA 0.0 0.7 0.0 5.2 3.0
Key: 1 = KwaZulu-Natal altitudinal transect study by
Appleton and Gouws (in press)
2 =
3 =
4 =
m.a.s.l
KwaZulu-Natal coastal community study by Schutte et al. (1981)
Lesotho study by Kravitz et al. (1993)
This study (1995)
= metres above sea level
SPA = Small pre-cystic unidentified amoebae
MSPA = Medium sized precystic unidentified amoebae
Ave %
4.5
11. 8
0.0
1.4
52.8
5.9
18.1
2.2
0.45
4.1
I

Table 15b.
comparison of the prevalences of intestinal helminths in KwaZulu-Natal, Lesotho and Qwa-Qwa.
study area 1 2 3 4
Altitude 50 - 100 - 1650 1660 - 2200 (m. a . s. 1) 1720 300
Number of N = N = ~6~1 N = children sampled 693 7569 1180
\
Parasite species %Prev %Prev %Prev Sum % I win % I Ave %
Helminths
taeniid tapeworm 0.9 1.5 0.5 0.1
Hymenolepis 0.0 0.03 0.0 0.3 diminuta
H. nana 2.8 0.6 0.1 0.3
Fasciola hepatica 0.25 0.3 0.0 0.0
Schistosoma 0 . 9 57. 0 0.0 0.0 haematobium
strongyloides 10.3 0.5 0.3 0.0 stercoralis
Trichuris 93.5 54 .1 0 . 1 0.8 trichiura
Enterobius 2.8 0.9 0.0 0.3 vermicularis
Ascaris 84.1 50.4 0.9 3.8 lumbricoides
Necator 30.8 37.2 0.0 0.0 americanus
Key:
1 = KwaZulu-Natal altitudinal transect study by Appleton and Gouws (in press)
0.1 0.1
0.1 0.2
0.0 0.15
0.0 0.0
0.0 0.0
0.0 0.0
0.2 0.5
0.4 0.35
2.1 2.95
0.0 0.0
2 = KwaZulu-Natal coastal community study by Schutte et al. (1981)
3 = Lesotho study by Kravitz et al. (1993)
4 = This study (1995)
m.a.s.l = metres above sea level
I

the case of hookworm the free-living larval stages. This is in
contrast with studies conducted in KwaZulu-Natal by Appleton &
Gouws (in press) and Schutte et al., (1981) which recorded a high
diversity and prevalences of helminths infections (see Fig. 9).
In studies across KwaZulu-Natal, Appleton and Gouws (in press)
showed that there was a decrease in prevalence of human
gastrointestinal parasites with increasing altitude from sea
level to 1750m. These data from sea level to 1750m are tabulated
together with data (1800, 2000 and 2200)m from this study in
Table 16. The two studies show a clear decline in worm infections
e.g from 84.1% Ascaris at sea level 1 . 7% at 2200m; Trichuris
dropped from 93.5% at sea level to 0.0% above 2000m. In fact
Trichuris seem to be -just "hanging in there" in the study area,
which might indicate that this is its upper limit. The absence of
Trichuris at altitudes above 2000m can be explained by the fact
that the egg is not mamillated and lacks the albuminous external
layer that is found in the Ascaris egg (see Plate V for
comparison of eggshell textures for the nematodes recorded in the
study area) (p. 42). It has been noted that the Trichuris egg
survives better in areas of high rainfall, high humidity, dense
shade and moisture retaining soils but the problem might be its
sensitivity to desiccation (Garaguso, 1981; Beaver et al., 1984;
Schimdt & Roberts, 1985 and Anderson, 1992). Although Qwa-Qwa has
high rainfall, high humidity, with midwinter mean ambient
temperature of 7°C and mean summer ambient temperature of 19°C,
the whipworm egg might not be able to tolerate the dry climate
long periods of sunshine. In addition, the bulk of the area is
rocky and most of the soils do not hold moisture. Schistosoma is
60

Figure 9
Prevalences of intestinal parasites in Qwa-Qwa, Lesotho and K waZuluNatal. (A) this study (B) Lesotho study by Kravitz et ai, 1993; (C) KwaZulu-Natal study by Appleton & Gouws, (in press) and (D) KwaZulu-Natal study by Schutte et ai, (1981).

I ,,~ 'f!-
ii ii > o
I ' -;
",
"1
~
I . e c . ~, t . . E. II_ E . ..
Prevalences of intestinal parasites in Qwa-Qwa (1995) this study . N = 1680.
Parasite species
Prevalences of intestinal parasites in KwaZulu-Natal by Appleton , Gouws 1993 (in press) . N = 693 .
Parasite species
IJl (1) U C (1)
ro > (1)
ct 'eft
(1) U C (1)
ro > (1)
ct 'eft
,
,
,
,
,
,
,
,
,
Prevalences of
Prevalences of intestinal parasites in Lesotho by Kravtiz et aI, (1993). N = 1611.
Parasite species
intestinal parasites in KwaZuIu-Natal by Schutte et aI, (1981) . , N= 7569.
~ ~ ~ ~
~
= ~ ~ l~
Parasite species

Table 16.
comparisons of prevalences of parasites along an altitudinal transect between KwaZulu-Natal and this study.
I Sch I si I Bh IEm I Um I Do I Th I Te I Se I Mkh I Alt 50 480 860 800 1100 1720 1800 2000 2200
Spec 9,-0 % 9,-
0 9,-0
9,-0
9,-0
9,-0
9,-0 %
E.c 40.2 44.4 29.3 37.9 17.1 40.2 67.0 53.0 61. 0
E.hi 0.9 0.7 2.7 1.7 1.3 2.2 2.4 3.6 0.0
I.b 17.8 3.5 3.4 4.3 4.0 5.8 7.6 3.6 2.6
E.n 0.0 0.0 2.0 2.6 1.3 6.6 28.0 16.7 26.0
G.d 16.8 7.8 7.5 4.3 4.0 8.0 7.4 6.1 1.9
C.m 0.0 0.0 1.3 0.0 0.0 0.0 13.5 12.8 15.0
B.c 0.0 0.7 0.0 0.0 0.0 0.0 0.0 0.0 0.0
T.t 93.5 55.6 15.7 37.9 5.3 5.8 0.0 0.0 0.0
Ho 30.8 4.9 2.7 0.0 2.6 0.0 0.0 0.0 0.0
Str 10.3 0.0 1.3 0.0 0.0 0.7 0.0 0.0 0.0
E.v 2 . 8 0.7 0.0 0.9 0.0 0.7 1.0 0.2 0.0
A.I 84.1 59.9 29.9 67.2 44.7 12.4 13.0 2.1 1.7
F.h 0.0 0.0 0.0 0.0 0.0 1.5 0.0 0.0 0.0
S.h 0.9 0.0 0.0 0.0 0.0 0.0 0.0 0.0 0.0

absent because there are no snails to host its intermediate
stages.
An interesting parasite which shows an increase with altitude is
Endolimax nana. It started to appear at 860m with prevalence of
2.0% and increased to 26.0% at the top school in Qwa-Qwa (2200m) .
The survey was done in a small area, nine communities were
investigated and the difference in altitude between them was
600m, i. e between the highest and lowest settlement.
Interestingly there was a marked difference in parasite
distribution but this was due more to socio-economic factors than
to topographical factors .
A similar landscape epidemiological study was conducted in Kenya,
by Ashford et al., (1993) over a smaller altitudinal range (15 to
225m) . Prevalences varied between 24.0% and 75.0%. These clusters
(20 individuals were randomly selected, each to indicate the
centre of a cluster). These results showed that people living in
drier areas, furthest from the coast were relatively free from
intestinal nematodes and that human behaviour was at least as
important as the major environmental factor in determination of
parasite abundance. This was supported by other authors e . g
(Nelson, 1966 Pampiglione & Ricciardi, 1974; Chunge et al.,
1985) In Ashford et al., (1993) study, the prevalence of
Ascaris at 15m was 69.0% and 15.0% at 225m ascariasis prevalence
was 15.0%, trichuriasis prevalence at 15m was 27% and at 225m
trichuriasis prevalence was 11.0%. The only other South African
61

study that reveal a decrease in prevalence of Trichuris from the
coastal belt to higher altitudes ±300m was Schutte et al.,
(1979) .
Generally there was a decreasing trend amongst all prevalences
and intensities of infections in winter especially in worm
infections. Cestodes were rare in summer and virtually absent in
winter. Exceptions were E. coli and E. nana which were more
common and more intense in winter. A possible explanation is the
cold temperatures on the ground due to frost. The average ambient
temperature during mid-winter in Qwa-Qwa is 7°C, the soil
temperature can be even lower according to Geiger (1950) . He
found that soil condition changes -with weather depending on the
moisture content of the soil. He discovered that at depths beyond
1m the temperature becomes constant and above that soil
temperatures fluctuate, and that if dry air moves up and down the
atmosphere adiabatically, its temperature changed. In moving
upwards it came into a region of lower air pressure, its volume
increases and it became cooler. Descending air, on the other hand
became warmer. Thermodynamics tells us that altitudinal
temperature changes amount to 1°C per 100m difference in
al titude. Perhaps that is why worm infections are low at
Makhabane and Sehlajaneng with altitudes of 2000 and 2200m
respectively although they have mean annual rainfall of 1000 to
1100m per annum and the protozoans were taking an advantage of
the empty niche since they are not dependent on environmental
temperature for their survival. There are no data available on
ground temperatures and relative humidity in Qwa-Qwa.
62

Protozoans are more likely to be transmitted in winter than
geohelminths because in winter many children (especially boys
irrespective of age) wore the same clothes for many days, they
don't wash and they sleep together to keep themselves warm. Girls
wash regularly whereas boys of the 6-10 years age group wash
their faces only. They play differently from girls of their age,
they make wire cars and drive them around, some make animals with
clay and sell them. When making this animals they use their
saliva to smooth the clay surfaces of the animals and this habit
may cause infection with soil transmitted parasites.
Another reason for possible transmission of faecal matter is that
most rural people do not clean their hands before eating and
after defecating. Most people do not use toilet paper, they
either use stones, or old newspapers, children <6 years both boys
and girls do not wipe themselves at all . Children are forced to
sleep together especially because in rural areas children sleep
on the floor while adults and visitors sleep on the bed. Blankets
used by these children are washed once or twice a year depending
on the general cleaniless of the family or whether there is
enough soap to wash them . Sheets and use of toilet paper to clean
the anus after . defecating are luxuries. Water is used to wash
children, in clean families only .
Schools are provided with toilet paper but it never reaches the
pupil's toilets. Pupils in these school bring their own paper,
some use newspaper, this leads to most of toilets at school
becoming blocked and are not immediately unblocked by
63

municipality. The only school which teaches children to use
toilet paper is Sentinel. Here general assistants stand at the
toilet's door during the interval. They give each child a piece
of toilet paper and explain and demonstrate to each child what
they are expected to do. This practice continues until the
children get used to it.
Person to person infection can be another factor that causes
transmission of protozoans in the area. The small amount of water
used for personal hygiene, storage of water in open vessels and
not cleaning the vessels frequently may lead to the vessels being
the main source of contamination. In addition these vessels are
used to brew "Mqomboti" during traditional feasts, which may
result in an increase in bacterial and fungal growth and lead to
increasing protozoan populations because most of the commensal,
especially E. coli feed on bacteria (Fripp, 1979; Beaver et al.,
1984 and Mims, 1992). The quantity of water used for personal
hygiene was found to be the chief factor accounting for the high
prevalences of giardiasis in Lesotho (Esrey et al., 1989). This
was supported by (Jeon, 1973; Campell, 1982; Watts, 1986; Henry,
1990; Morgan 1990; Pinfold, 1990; Kravitz et al., 1993a&b and
Lengerish et al., 1994).
Protozoan cysts can survive storage in refrigerator (4°C) for
periods varying between 7 to 36 weeks (Neal et aI, 1974). Giardia
on the other hand is known to withstand chlorine (Gray et al.,
\/1 994) .
64

Part of the life-cycles of Trichuris and Ascaris involve
embryonation of their eggs which must take place outside the host
environment. Under suitable conditions of temperature, moisture .
O2 content and soil texture (determined by grain size of the
soil), embryonation proceeds to the infective first stage larva
of Trichuris and to the infective second stage larva in Ascaris.
Anderson (1992) gave the following rates of the development of
Trichuris trichiura eggs at various temperatures: 120 days at
20°Cj 57 days at 25°Cj 17.5 days at 30 0 Cj and 11 days at 35°C and
its daily egg output is 3 000-20 000 (Faust et al., in Anderson,
1992j Maung (1978) in Anderson, 1992 and Needham & Lillywhite,
1994) reported considerable variability in the timing of the
moults of Ascaris lurnbricoides larvae, at 28°C Ll stage occurred
in 15 to 24 days and the infective L2 stage after 17 days. Fully
embryonated L2 larval stage of Ascaris can remain viable for up
to six years under favourable conditions (Crompton et al., 1989).
Although prevalences and intensities of parasites found in the
study area were low, a case of Ascaris forming a bolus has been
reported in Qwa-Qwa from an 19 year old female (see Plate VIII) .
According to the report there was no evidence of worm
infestations clinically. Findings at a laparotomy indicated a
very tense and distended terminal (±10cm) part of the jejunum,
packed with thick glittering Ascaris lurnbricoides. About 10cm of
the bowel segment was showing signs of devitalisation, i.e early
necrosis. Milking of the worms was impossible without tearing off
the necrotic luminal wall. The obstruction was complete at that
point and the surgeon could see the worm moving in other part of
65

PLATE VIII
Intestinal bolus
Contrast X-ray of the abdomen of a 19 years old female, showing
Ascaris lumbricoides forming a bolus (arrow).
(Courtesy of Dr J. Moloi, Manapo Hospital, Qwa-Qwa) . ...

the abdominal cavity. A 15cm piece of small bowel/necrotic bowel,
was resected and an end-to-end anastomosis was performed. As the
bowel recovered from surgery and a sausage of worms removed, the
patient was put on Mebendazole orally and discharged from
hospital after two weeks. Similar cases have been reported by
Millar et al., (1989) at the Red Cross Hospital in Cape Town,
Freeman & Grunewald (1980) at Livingstone Hospital in Port
Elizabeth. Bradley & Bush (1994) reported seven children with
intestinal obstructions to A. lumbricoides admitted to a Red
Cross Memorial Children's Hospital in KwaZulu-Natal over a period
of 14 months. It is known among Africans that pregnant women like
eating soil (pica) (personal communication with nursing sisters
at 27 clinics visited in Qwa-Qwa and people in general) .
The most common protozoans found in the area are primarily
considered as commensals and cause no disease . Their presence in
the stool is however an important indicator that a child has
ingested some faecal matter and therefore identification is of
diagnostic value (Katz et al., 1988). Amoebic dysentery was
diagnosed in 100 to 150 children per year in Cape Town (Watson
et al, 1970 and Segal et al ., 1981), found 7 cases out of 55
patients examined at Baragwanath Hospital in Soweto. Giardiasis
has been confirmed as the main cause of travellers diarrhoea
(Beaver et al., 1984; Ukoli, 1984 and Meyer, 1990).
E. histolytica normally feeds on the intestinal contents but may
ingest blood sometimes feed blood, even the worms, particularly
if they are present in large numbers (Sepulveda & Diamond, 1976
and Scrimshaw, 1984).
66

Protozoans, both pathogens and non-pathogens can reduce the
absorptive area available for nutrient uptake if they are
abundant (>+++) (see Plate VII) . , Important minerals and vitamins
can also pass out with the stool possibly leading to
malnutrition and diarrhoea (Garaguso, (1991). Heavy infections of
ascariasis are known to be associated with granulomatous
hepatitis and multiple li'ver abscesses (Anstey, 1966 & Louw, 1966
in Hendriks (1994). It has been noted that common parasite
infections cause energy depletion and growth stunting in endemic
areas and there is a suggestion that mental processes and school
achievement can be affected as well (Kvalsvig et al., 1991).
Polyparasitism (the number of parasite species found per child)
especially in case of worm infections, does not pose a public
health problem in Qwa-Qwa. No child was found infected with more
than one species of worm in the survey though there were multiple
infections of protozoans. An example of a child with multiple
protozoan infection is shown in Plate VII. Polyparasitism becomes
important when multiple infections of diseases like
schistomiasis, hookworm and malaria occur together with Ascaris
and Trichuris as discussed by Gunders et al., (1993) in Cape
Town. In any consideration of how much intestinal parasites
contribute to undernourishment and malnutrition . Their
contribution on nutritional deficiencies is not clearcut. There
are many studies that show that Ascaris and Giardia for example,
may exist in small numbers in a severely malnourished children
wi thout evidence of nutrient malabsorption. However, heavier
infections unquestionably do cause nutrient losses (Gunzburg et
67

PLATE VII Qualitative measure of intensities of infection
(C.m = Chilomastix mesnili, E.c = E.coli, E.n = Endoli1nax nana)
+ infection (Entamoeba coli) + + + infection (El1tamo eba coli)
+ + infection (Entamoeba coli) Multiple infection

al., 1992; Gracey, 1985; Solomons, 1982; Wright, 1979).
The most important socio-economic factors affecting parasite
transmission in summer were whether or not the household had
electricity; the quality of meat eaten and the proximity of the
nearest water source. The reason might be that the analysis of
the summer results included data from the control school and that
caused the much stronger associations between variables and
transmission in winter. In winter the only important socio
economic variable significantly associated with transmission was
housing quality. But it should be remembered that only eight
schools were sampled in winter, and these served the lower socio
economic sector of the Qwa-Qwa population
The models show that there is a 4 . 57/5 chance of a child without
electricity being infected, and a 1.99/5 chance with respect to
those children who eat both graded and ungraded meat. The
presence or absence of electricity in the home influenced
parasite transmission because the prevalent intestinal parasites
found are transmitted through contaminated food or drink. In
addition it is not possible to have electricity in a shack or mud
house i.e. (quality of house), therefore resources to keep food
cool in summer will be more expensive than in a house with an
electric refrigerator. This results in less contamination of food
or drink in a household with electricity.
Water source is important because the probability of a person
having water available indoors means that he/she might have a
68

flush toilet and therefore a greater possibility of having
electricity within the household. This might be connected to
income which is usually determined by a person's level of
education and employment. Water source is also important in
winter because people without taps available indoors use little
water when bathing . Women are the only people who fetch water and
most group 1 school which served extreme rural areas (see Plate
IA) (p.23) they fetch it >lkm away while those in Group 2 school
areas (semi-rural and urban) fetch water from <lkm. Hence
overcrowding plays a more important part in parasite transmission
in group 2 settlements (semi-rural and urban) (see Plate IB) than
group 1 settlements (extreme rural) (see Plate IA) .
Tapeworm is rare, because most people do not eat pork. The
explanation for this is that most people do not eat pork because
of their religious taboos, and they were not prepared to discuss
the issue further during questionnaire interviews. Not eating
pork could save them from being infected with Taenia solium but
the possibility of getting T. saginatus still 'exists. Most
children in the rural areas are not given meat, they eat pap and
green vegetables (summer) or tea and bread or pap and beans in
winter. Meat is only bought on Sundays or when there is a special
visitor. The children may only get a chance of eating meat during
a feast. Most boys eat rats and birds. This may explain the
occurrence of the rat tapeworm Hymenolepis diminuta in boys than
girls (see Appendix E) .
The majority of people in Qwa-Qwa still perform their cultural
69

customs and rituals. Part of this tradition is to slaughter the
animal in the yard, the blood must spill there and this shows the
respect you have towards your ancestors. The score for
traditional customs in the model is low because, communities from
all socio-economic sectors of the community eat both graded and
ungraded meat. This shows that meat does not contribute much to
the transmission of intestinal parasites, but here is an
indication of the people's lifestyles . It shows a lack awareness
of the dangers of slaughtering without a meat inspector checking
the meat before it is consumed. Most Africans, urban or rural, do
not or will not part with their traditions and customs and a lot
them still use traditional medicines and visit traditional
healers (Manganyi, 1974; Matseke, 1974; Tema & Sebego, 1990;
Abdol Karim et al., (1994) Crawford, 1995). This compounds the
problem of personal hygiene which is found to be a very important
factor in protozoan parasite transmission in the study area.
People thought that it was normal that their children should have
intestinal parasites, mothers showed concern, but the
grandfathers and male guardians seemed not to be perturbed. They
were more concerned about poverty and employment.
Their large positive response to allowing their children to
comply, was because we promised to treat their children free of
charge. Interviewing in their own language made it very easy for
them to relax and answer most questions, communication between
the interviewee and parents/patient in his/her own language is
very crucial, this creates a better atmosphere between the two
70

parties involved,this is supported by Nash, (1995). I tried not
to write anything while I was interviewing because they usually
think researchers like experimenting with them (i.e. treating
them as guinea pigs) . When designing the questionnaire I followed
suggest i ons from (Katzenellenbogen, 1991; Lengeler et al., 1991;
1992) by asking less sensitive questions first and follow with
more sensitive ones and end with something like "income and
education". To get good results a self-administered questionnaire
is preferable because the researcher is able to phrase questions
such that they will elicit the desired answer in relation to the
topic of the investigation. A teacher, for an example, may not be
able to decide (or might not be sure) what level of employment
applies to someone who is a domestic worker, thus resulting in
her filling the incorrect category in the questionnaire. For
instance those educated parents who filled-in questionnaires at
home had to come to school for clarification, and I had to be
there to answer questions relating to the context of the
questionnaire. The accessibility of water may also be interpreted
differently by subjects of rural origin which may expose the
interpretation of data to the effects of subjective
interpretation; the presence of the reseacher will aid in
eliminating such effects.
Girls washed more frequently than boys, especially age <10 years,
but their playing styles were different. Girls and boys <5 years
(most of the rural areas children do not attend school until they
are six years old and have no pre-schools). The age group <5
years liked playing with soil and some cooked soil as gravy; one
71

coming from a richer family would and steal some mealie meal to
make pap, they may start a fire or imagine it, and then start
eating. The 6-10 years age group are more clever and careful, and
do not eat soil or play with fire, because they know that fire is
dangerous. In sununer the girls play dolls, "Diketo" a game where
they sit on the ground. In winter they play skipping, by making
skipping ropes with grass, but they don't play on the ground
because it is cold . The boys play soccer or make wire cars and
drive around in sununer but in winter they make clay cattle, sheep
etc and use their tongues to smooth and make final touches of the
surface the toys they make , most boys sell them to passing
tourists. Because they use clayey soil they stand a good chance
of gett i ng Ascaris .infections . In the higher socio-economic
sector of the conununity, children play with real toys or teddy
bears, but very seldom with soil. The study recorded high
prevalences of parasitism in the <5 year and 6-10 year age
groups .
In this study the overall prevalence of E. histolytica was 1.4%
in contrast to the 14.0% in Lesotho (Kravitz et al . , 1993b) .
However if the MPSA (3.0%) had been cultured, they could have
been identified, possibly as E. histolytica and so increased the
prevalence . Also the children sampled were <12 years old, whereas
Jackson (1995) states that E. histolytica is most conunon in the
20 to 50 years age group.
It should be noted that Enterobius vermicularis was excluded from
the analysis because it gave false results about the real
72

prevalence of this parasite. Faecal examination gave a 0.4%
prevalence of the 2583 samples examined of this parasite, whereas
after treating 56 children for helminthic infections, 12 (22.0%)
of the post treatment stools had live pinworms in them. The most
reliable diagnostic technique to get a true reflection of this
parasite is to conduct a cellophane swab technique. This involves
the attachment of a piece of cellophane-tape to the peri-anal
region overnight or in the morning before the child defecates or
takes a bath. Clinically and medically it was not possible to do
this in schools or clinics because there are not enough beds at
clinics and nor is it to do it at schools.
Statistical analysis shows no difference in parasite transmission
with respect to sex, and this has been found by many other
authors (Chandiwana, 1989; Evans et al . , 1987; Kvalsvig et al.,
1991) .
In Plate I (p.23) three kinds of settlement are shown, the rural,
semirural and urban settlements. The statistical models show that
children living in shacks and mud are about three times more
likely to be infected than children from brick houses. Plate IA
indicates rural areas which have <9 houses per km2, and though
they do not have proper sanitation, they have big yards and many
bushes behind the houses where people can defecate, decreasing
the chances of cysts and eggs contaminating the surrounding
environment.
73

In rural or semi-rural areas (Plate IB,C) when a latrine is full
it is filled up with soil, and after three years the occupants
start planting in the area and they actually know that if you
plant there the soil is very fertile and they claim to get very
big carrots, potatoes, beetroot etc. They even call the area
"Manyolong". When these vegetables are prepared they wash them
with a little water and don't cook them well, in fact most rural
people like the feel of soil when eating green vegetables
"Moroho". Ascaris eggs can survive for more than two years if the
second stage larva has already developed. The problem here is
that most people including all traditional healers interviewed.
associate intestinal parasites with either fruit, especially
peaches, vegetables animals or even witchcraft. They do not
associate parasitism with contamination.
When people are washing themselves, they use a small amount of
water in a basin. In winter warm this same quantity and share it
because they have no resources or electricity to warm more. Most
children do not wash at all in winter or share the little water
that was warmed depending on whether the family had enough
resources to warm more for them . After washing, the dirty water
is thrown at the back or front of the house because there are no
drainage systems in the lower socio-economic sectors of the
communi ty . There is both an advantage and a disadvantage in
throwing dirty water in front of the house. The advantage is that
on windy days the water is thrown in front of the houses so that
it can help settle the dust and prevent from coming into the
house. The disadvantage is that a child playing in the same
74

ground can drop a sweet, and picking it up, become infected
with parasites like protozoans and geohelmiths, because cysts and
eggs of these parasites can withstand any detergent. Personal
experience while analysing the stool samples revealed many live
infective L2 larvae of A. lumbricoides inside eggs in both ether
and 5% formalin and even hatched (see Plate VID) , to extent of
seeing the L2 infective stage larva of Ascaris hatching from the
egg (see Plate VID) (p.43) and also surviving well in ether and
5% formalin .
The increase in parasite prevalence and intensities in the semi
rural areas and urban areas is a result of high housing densities
i.e overcrowding (see Plate IB & C) . The consequences of used
dish-washing water being thrown either in front of or behind
houses may differ depending on the housing density. It may result
in an increase in flies, especially in summer . The area with the
highest ascariasis prevalence is next to a chicken farm and
piggery , which results in more flies than any other place in
Qwa-Qwa ; the health inspectors consider the area an environmental
nuisance . Flies may be important mechanical vectors, carrying
eggs and cysts, which can contaminate food or drink with the
parasites infective stages .
Most household do not cover food and have no refrigerators to
keep the food cold because of the absence of electricity . Their
level of income do not allow them to maintain paraffin or gas
refrigerators.
75

Here is an example from personal interviews conducted by myself,
of how people think about how worms are transmitted. Intestinal
parasites are transmitted if you give your child powdered milk,
eat peas, eat raw vegetables or fruit especially peaches . If you
happen to eat raw maize, a small worm is hiding there, presumably
the developing embryo mistaken for Enterobius vermicularis
("Tjobitjobi" or "Lenyonyo" in Sesotho) because most people know
it and have seen it on a child at night. If you eat this maize by
mistake , the small worm, after being swallowed, grows to be very
big and pinkish (presumably A. lumbricoides ("Lenyoha"). If a
child start passing worms, the local doctors or clinic may
prescribe Albendazole or Mebendazole for the patient. Albendazole
usually has the disadvantage that it completely destroys the worm
while still in the bowel and it is partly absorbed. Mebendazole
however is a purgative and paralyses the worm and it is not
absorbed (Garaguso, 1981). What the parents see is a dead
Ascaris . The string-like reproductive organs of these worms, and
which fill most of the pseudocoelom, are perceived by both
traditional healers and parents to be little Ascaris!
76

Chapter 7
CONCLUSIONS AND RECOMMENDATIONS
The present study not only gives a detailed account of intestinal
parasitism at high altitudes but also completes the altitudinal
transect of Appleton & Gouws (in press). As such it will make a
contribution to public health planning at community level
planning in South Africa.
Parasites found in Qwa-Qwa do not constitute a public health
problem, therefore chemotherapy (deworming programme) cannot
control be justified as a control measure. Rather control should
rely on an improvement of personal hygiene, change in certain
lifestyles and some traditions like slaughtering own meat,
improving sanitation facilities and domestic environment by
government through, refuse and sewage disposal. This has been
supported by other authors e.g van Rensburg & Fourie, 1990; 1992;
1994; Oskowitz & McKenzie, 1993 and Kent, 1994). Human factors
such as implementation of health education programmes are also
necessary so that knowledge of the life cycles of parasites and
their transmission routes can be taught to women.
It is not the researcher, or a microscope or nurses or teachers
that will prevent people in this area from being infected with
parasites. Affected communities must be involved in trying to
implement control programmes themselves and must take the
initiative in trying to improve their lifestyles and abandon some
77

of their customs which might be difficult to do, and lastly
improve their environment by collecting refuse.
The Government must try to uplift the socio-economic level of
these people. Reconstruction and development programmes must
create jobs by training people to be health workers, buy
computers for each clinic and train people who can enter correct
data in each clinic so that an accurate data base can be built
up. Teachers and nurses must improve their medical and teaching
ethic by taking time to educate the rural people and children to
do basic things like washing hands before eating and after
defecating and must keep their environment clean. The study has
shown that transmission rates combine many biological, social,
cultural and environmental factors and that these factors
interact.
RECOMMENDATIONS
These are some recommendations that may improve the quality of
life of the people of Qwa-Qwa:
* Introduction of health education in all school syllabi uses.
* Better recording of statistical data at clinics. At the 27
clinics visited, any stomach ailment except diarrhoea was
recorded as gastroenteritis. Staff confirm that most
children have intestinal parasites and realize that they are
more prevalent in summer than winter but still they do not
record them. Diarrhoea is only recorded only when there is
an outbreak.
78

* Improve the quantity and quality of manpower in the clinics.
There must be at least four doctors who can visit clinics
twice a week; the situation now is that only one doctor is
in charge of 24 functional clinics.
* There is shortage of doctors, This has led to the
government bringing Cuban doctors to try and help in
implementation of the new primary health care system. There
is a concern that these foreign doctors will not be able to
communicate with their patients . To expect such a doctor to
explain the epidemiology of any disease to a patient is
naive. If they do not know the language of their patients.
Doctors have the capability and intellectual ability to
learn any language, the hospital can organize tapes and
oblige them to learn the local language, this is practised
in provinces like Western Cape and KwaZulu-Natal. That can
improve their knowledge of the peoples' culture and get a
correct history of the patient background if their real aim
is to get a maximum cure for a patient. Health education can
never be implemented if it is conducted in a language that
people do not understand.
*
*
The health department must train health workers. to do
simple test (like the Kato-Katz) to perform simple stool,
blood or urine tests diagnoses. Diagnoses can be done
immediately at the clinics and nursing sisters can get the
results immediately or after only a few hours, sooner than
relying on results that take a week come from the pathology
laboratory.
One nurse in every clinic must have a driver's licence.
79

* Selected clinics must have computers. One clerk can be
taught in a week to enter data and collate data from the
four to five nearest clinics. Data on infectious and
preventable diseases given to the author by health
authorities and clinics was very unreliable . This made it
difficult to perform an epidemiological survey and
impossible to compare data with prevalences of intestinal
parasites during previous years .
* Hospital authorities should organize training tapes of
simple conversations needed to get the background of a
patient. People always think that you show respect by trying
his/her language .
* Retired nurses and teachers can be used or may be asked to
volunteer to conduct health education . If the government
were to train them. These are the only people in our society
who are willing to improve the quality of lives of their
communities and are still respected by rural and semi rural
communities.
* Government lacks the drive to implement proper research
centres for infectious diseases in many provinces including
the Free State. There must be proper infectious disease
research centres in each province.
* Improvement of communication between communities and
Department of Water Affairs and health and welfare. My
personal experience in the area is that the water sometimes
have chironomids and small nematodes in domestic water
supplies. The water is sometimes brown and unpalatable and
we can be without water for two weeks without the community
80

being given an explanation from the Department of Water
Affairs department.
* There must be a formal link between Departments of Education
and Health to design the health education curriculum for
schools. Controlling diseases involves many parties,
therefore if they plan together and evaluate progress
regularly, then it will be real progress.
* Government must introduce pre-schools in rural and semi
rural areas. The parents of most of these children go to
work at 04hOO and come back at 22hOO. This will make sure
that the child does not go hungry because no one is there to
look after them or cook for them. I have interviewed
children who had not have a meal for three days. This may
lead to malnutrition resulting in children getting all forms
of infectious diseases because they eat from rubbish dumps
as was the case in the first sampled school (Letlotlo). The
government must also make sure that an abattoir is built, to
serve the ±400 000 people in the area.
*
*
Mass media (e . g radio) can be used to educate people about
transmission routes of intestinal parasites, because people
in rural areas cannot read or write. Radio is the best
media to use because it can be operated by battery .
Education on intestinal parasites and their complications,
e. g liver abscess or Ascaris bolus can be reinforced
extremely graphic posters in the streets, clinics, schools
churches, traditional healers and by billboards with a huge
unmistakeable public message.
81

In conclusion, the realities of the epidemiology of human
intestinal parasites in the area will continue affecting them .
People must however try to abandon, or at least modify, their
lifestyles and improve their personal and environmental hygiene,
if they wish to avoid being infected. The feasibility of
providing sui table and acceptable al ternati ves seems remote,
since it is a function of the socio-economic and cultural status
of the community which can only be uplifted by the government.
82
REFERENCES
Abdool-Karim, S.S., Ziqubu-Page, T.T. & Arendse, R. (1994)
Bridging the gap. Potential for health care partnership between
African traditional healers and biomedical personnel in South
Africa. Medical Association of South Africa. 1-16.
Allen, A.V.H. & Ridley, D.S. (1970) Further observations on the
formol-etherconcentration technique for faecal parasites. Journal
of Clinical Pathology. 23: 545-547.
Anderson, R.C. (1992) Nematode parasites of vertebrates. Their
development and transmission. University Press, Cambridge. 578pp.
Anderson, R.C. & May, R.M. (1991) Infectious Diseases of Humans:
dynamics and control. Oxford University Press. New York and
Tokyo.
Appleton, C.C. (1978) Review of literature on abiotic factors
influencing the distribution and life cycles of bilharziasis
intermediate hosts snails. Malacological Review 11: 1-25.
Appleton, C.C. & Kvalsvig, J.D. (1994) Compiling an atlas of
parasitism for Natal province, South Africa. Abstracts of the
VIII International Conference of Parasitology, Izmir, Turkey:
355.
83

Appleton, C.C. & Gouws, E. (in press) The distribution of gastro
intestinal parasites along an altitudinal transect in KwaZulu
Natal, South Africa. Annals of Tropical Medicine and
Parasitology.
Ashford, R.W., Craig, P.S. & Oppenheimer, S.J. (1993)
Polyparasitism on the Kenya coast. 2. spatial heterogeneity in
parasite distributions. Annals of Tropical Medicine and
Parasitology 87: 283-293.
Ashford, R.W., Hall, A.J. & Babona, J.D. (1981). Distribution and
abundance of intestinal helminths in man western Papua New Guinea
with special reference to Strongyloides. Annals of Tropical
Medicine and Parasitology. 75(3): 269-279.
Ayers, R.M., Lee, D.L., Mara, D.D. & Silva, S .A. (1993) The
accumulation, distribution and viability of human parasitic
nematode eggs in the sludge of a primary facultative waste
stabilization pond. Transactions of Royal Society Tropical
Medicine and Hygiene 87: 256-258.
Beaver, P.C., Jung, R.C. & Cupp, E.W. (1984)
Parasitology. 9th Edn. Lea & Febiger, Philadelphia.
Clinical
Beck, J.W. & Davies, J.E. (1976) Medical Parasitology. C.V Mosby.
St Louis.
84

Benenson, A.S. (Ed) (1975) Control of communicable diseases in
man. 12th Edn. Library of Congress in Publication Data.
Washington.
Bester, C. C., Burger, P.J. & Mouton, T',M. (1993) The prevalence
of intestinal parasites in pre-school children in the Cape
Peninsula. South African Journal of Epidemiology and , Infection.
8: 22-24.
Bradley, J.P. & Buch, E. (1994) The prevalence of Ascaris and
other helminth infestations in children attending a rural Natal
hospital and its clinics. South African Journal of Epidemiology
and Infection 9: 42-44.
Bray, R.S. & Harris, W.G. (1977) Epidemiology of infection with
Entamoeba histolytica in Gambia, West Africa. Transactions of the
Royal Society Tropical Medicine and Hygiene 71: 401-406.
Breslow, N.D. & Clayton, D.G. (1993) "Approximate Inference in
Generalized Linear Models". Journal of the American Statistical
Association 88: 9-25.
Brown, H.W. (1969) Parasitology. 3rd Edn. Meredith Publishing
Company. New York .
Brumpt, E. (1928) Differentiation of human infectious amoebae
with four-nucleated cysts. Royal Society of Tropical Medicine and
Hygiene 22: 101-114.
85

Buck, A.A., Anderson, R.I. & MacRae A.A. (1978a) Epidemiology of
polyparasitism. I . Occurrence , frequency and distribution of
multiple infections in rural communities in Chad, Peru,
Afghanistan and Zaire. Tropnmedizin und Parasitologie 29 : 61-70 .
Buck, A.A . , Anderson, R. I. & MacRae , A.A. (1978b) Epidemiology of
polyparasitism. II. Types of combinations, relative frequency and
associations of multiple i nfections. Tropnmedizin und
Parasitologie 29: 137-144 .
Buck, A.A., Andreson, R. I. & MacRae, A.A. (1978c) Epidemiology of
polyparasitism . IV. Combined effects on the state health.
Tropnmedizin und Parasitologie 29: 253-268.
Campbell, G.D.C., Seedat , Y. K. & Daynes, G.D. (Eds). (1982)
Clinical medicine and heal th in developing Africa. 1st Edt. David
Philip, Publishers (Pty) Ltd . London .
Central Statistical Services (Republic of South Africa) . (1991)
Qwa-Qwa population. District and place by population group.
(Urban, semi-rural and non-urban) .
Chandiwana, S.K. (1989) The problem and control of
gastrointestinal helminthiasis in Zimbabwe. Environmental Journal
of Epidemiology 5: 507-515 .
Cheesbrough, M. (1991) Medical laboratory manual for tropical
countries. Vol.1 . 2nd Edn . Butterworth-Heinemann. Cambridge.
86

Chunge, R.N., Kamunvi, F. & Kinoti, S.N. (1985) Intestinal
parasitoses in Kenya, 1900-1983. East African Medical Journal 62:
1-28.
Chunge, R.N., Kamunvi, F & Kinoti, S.N. (1988) Intestinal
parasites in a village community in Kiambu district, Kenya, with
emphasis on the epidemiology of protozoan infections. Proceedings
of the 8th Annual Medical Scientific Conference KEMTRI/KETRI:
215-220 .
Crawford, T. (1995) Traditional healers and psychiatric health
care. South African Medical Journal 85: 291-292.
Crompton, D.W.T. & Joyner, S.M. ' (1980) Parasitic worms. 1st Edn.
Wykeham Publications, London.
Crompton, D.W.T. & Pawlowski, Z.S. (1985). Life history and
development of Ascaris lumbricoides and the persistance of human
ascariasis. In: Crompton, D.W.T., Neisheim, M.C. & Pawlowski,
Z.S. (Eds). (1989) Ascariasis and its Public Health significance.
Taylor & Francis, London
Crompton, D.W.T., Neisheim, M.C. & Pawlowski, Z.S. (Eds). (1989)
Ascariasis and its Public Health significance. Taylor & Francis,
London.
Daynes, G. & Leary, P.M. (1974). Children's diseases. In:
Campbell, G.D.C., Seedat, Y.K. & Daynes, G.D. (Eds). (1982)
87

Clinical medicine and heal th in developing Africa. 1st Edt. David
Philip, Publishers (Pty) Ltd. London
Epi-Info version 5. (1990) The division of surveillance and
epidemiologic studies. Epidemiology Programme Office. Centres for
Disease Control. Atlanta, USA.
Edungbola, L.D., Watts, S.T., Alabi, T.O & Bello, A.B. (1988) The
impact of a Unicef -assisted rural water proj ect on the prevalence
of Guinea worm disease in Asa, Kwara state, Nigeria. Journal of
Tropical Medicine and Hygiene 39: 79-85.
Erasmus, J. (Ed) (1991) Economic and social memorandum. Region C.
Halfway House, Development Bank of Southern Africa, Pretoria. 1-
101.
Esrey, S., Collett, J., Miliotis, M., Koornhoff, H. & Makhale, P.,
(1989) The risk of infection from Giardia lamblia due to drinking
water supply, use of water, and latrine among pre- school children
in rural Lesotho. International Journal of Epidemiology
18: 248-253.
Evans, A.C., du Preez, L., Maziya, S.P., van der Merwe, C.A. &
Schutte, C.H.J. (1987) Observations on helminthic infections in
black pupils of the Eastern Transvaal lowveld of South Africa.
South African Journal of Epidemiology and Infection 2: 7-14.
88

Freeman, A. & Grunewald, J. w. (1980) Incidence of parasitic
infestation in Black children at Livingstone Hospital. South
African Medical Journal 57: 358-360.
Fripp, P.J. (1983) An introduction of human parasitology with
reference to Southern Africa. 2nd Edn. Macmillan, Johannesburg.
Garaguso, P. (1981) Intestinal parasitic diseases. Nestle
Nutrition. 46: 2-47.
Geiger, R. (1950) The, ciimate near the ground. Harvard University
Press, Cambridge, Massachusetts.
Gracey, M. (1985) Diarrhoeal disease and malnutrition: a clinical
update. Longmans, Newyork.
Gray, S . F., Gunnell, D.J & Peters, T.J. (1994) Risk factors for
giardiasis. A case-control study in Avon and Somerset.
Epidemiology and Infection 113: 95-102.
Greenberg, R.S. (1993) Medical Epidemiology. 1st Edn. Appleton &
Lange, Newyork.
Gunders, A.E., Cotton, M., Nel, E., Hendricks, M. , Ebrecht, K.,
Hahne, H., Redecker, R., Shaw, M.L., van der Walt, J. & Williams,
A. (1993) Prevalence and intensity of intestinal worm infections
in creche attenders in urban and peri-urban settings in greater
Cape Town. South African Journal of Epidemiology and Infection 8:
89

48-51.
Gunzburg, S., Gracey, M., Burke, V & Chang, B. (1992)
Epidemiology and microbiology of diarrhoea in young Aboriginal
children in the Kimberly region of Western Australia .
Epidemiology and Infection 108: 67-76.
Hendricks, M.K. (1994) Liver abscesses in children: a review of
10 years' clinical experience. South African Journal of
Epidemiology and Infection 9: 10-12.
Henry, F.J., Huttly, S.R.A., Patwary, Y. & Aziz, K.M.A. (1990)
Environmental sanitation, food and water contamination and
diarrhoea in rural Bangladesh. Epidemiology and Infection
104: 253-259.
Holland, C. V. (1989) Man and his parasites. Integration of
biomedical and social approaches to transmission and control .
Social Science and Medicine 29: 403-411.
Holland, C.V., Taren, D.L., Crompton,
Sanjur, D.,
Intestinal
Barbeau, I . ,
helminthiasis
Tiffany, J.
in relation
D. W. T . , Nesheim, M. C. ,
and Rivera, G. (1988)
to thesocio-economic
environment of Panamanian children. Social Science and Medicine
26: 209-213.
Holt, D. & Scott, A.J . (1982) ~egression analysis using survey
data. The Statistician 30: 169-177.
90

Holt, D., Scott, A.J and Ewings, P.D. (1980) Chi-squared tests
with survey data. Journal of the Royal Statistical Society 143:
303-320.
Horton-Smith, C. (1957) Biological aspects of transmission of
disease . 1st Edn, Oliver and Boyd, London.
Iputo, J .E., Oku, C. & Nkalubo, J. (1992) Intestinal parasitosis
in undernourished children in a rural area of Transkei. South
African Journal of Epidemiology and Infection 7: 81-83.
Irwin, D. & Irwin, P. (1992) A field guide to the Natal
Drakensberg. 2nd Edn, The Natal Witness. Pietermaritzburg.
Jackson , T.F.H.G. (1~95) Amoebiasis - resolution of a century-old
mystery and its impact on our understanding of the disease. South
African Journal Medical Educational 13: 903-913 .
Jeon, K. W. (1973) The biology of Amoeba. Academic press. London.
Katz, M. , Despommier, D.D. & Gwadz, R. (1988) Parasitic diseases.
2nd Edn, Springer-Verlag, New York.
Katzenellenbogen, J., Joubert, G. & Yach, D. (Eds) (1991)
Introductory manual for epidemiology in Southern Africa. South
African Medical Research Council, Cape Town.
91

Kent, A. (1994) Medical education - the time has come. South
African Medical Journal 84: 822. (Corresp.)
Kirkby, R. E. (1988) Intestinal worm infestation in white primary
school children in Umkomaas. South African Family Practice. 9:
78-81 .
Kravitz, J., Mandel, R., Petersen, E., Nyaphisi & Maema, M.
(1993a) Quantitative microbiologic examination of village 'water
supplies in Lesotho: issues of water quality, sanitation, and
village health. Unpublished Report to Lesotho Highlands Health
Survey. Maseru, Lesotho. 1-14.
Kravitz, J., Mandel, R . , Petersen, E. & Collins, R. (1993b)
Prevalence and intensity of human communicable infectious
diseases. ' The University of Arizona and the Consortium for
International Development. Unpublished Report to Lesotho
Highlands Health Survey. Maseru, Lesotho. Report. 61-74.
Kritzinger, A.S. & Pieterse, J.M. (Eds). (1987) QwaQwa.
Introductory Economic and social memorandum. Development Bank of
Southern Africa. Halfway House, Pretoria. 1-83.
Kurtz, R ~ C. ' (1981) Nutrition in gastrointestinal disease
contemporary issues in clinical nutri tion. Vol 1. Churchill
Livingstone, New York.
92

Kvalsvig, J.D., Preston-Whyte, E.M. and Mtshali, T. (1991a)
Perceptions of common helminthic infections in a rural community.
Development Southern Africa. 8: 359-369.
Kvalsvig , J.D., Cooppan, R.M. and Connolly, K.J. (1991b) The
effects of parasite infection on cognitive processes in children.
Annals of Tropical Medicine and Parasitology. 5: 551-568.
Learmonth, A. (1988) Disease ecology. An Introduction. 1st Edt.
Basil Blackwell, Oxford.
Leary, P.M., Jones, C. & Douglas, F. (1974). In: Van Niekerk,
C.H., Wienberg, E.G., Lorn Shore, S.C & de V Hees, H. (1979)
Intestinal par.asitic infection in urban and rural Xhosa children.
South African Medical Journal. 76: 197-198.
Lengeler, C., Kilima, P., Morona, D., Hatz, C. and Tanner, M.
(1991) Rapid, low-cost, two-step method to screen for urinary
schistomiasis at district level: the Kilosa experience. Bulletin
of the World Health Organization. 69: 197-189.
Lengeler, C., Sala-diakanda, D.M. & Tanner, M. (1992) Using
questionnaires through an existing administrative system: a new
approach to health interviews. Health Policy and Planning.
7: 10-21.
Lengerich, E.J., Addiss, D.G. & Juranek, D.D. (1994) Severe
giardiasis in the United States. Clinical and Infectious Diseases
93

18: 760-763.
Manganyi, N.C. (1974) Health and Disease - some topical problems
of sociocultural tranition. South African Medical Journal
48: 922-924.
Matseke, S.K . (1974) Interesting the community in nutrition.
South African Medical Journal 48: 2515.
Maurihungirire, M. (1993) Studies on hookworm and threadworm
infection in man on the coastal plain of Natal, South Africa.
M.Sc dissertation. University of Natal.
Meyer, E.A. (1990) Giardiasis. Human parasitic diseases. Vol.3.
Elsevier Science Publishers, Amsterdam.
Millar, A.J.W., Bass, D.H. & van der Merwe, P. (1989) Parasitic
infestation in Cape Town children. South African Medical Journal
76: 197-198.
Mims, C.A. (1992) The major human infections and the crucial role
of person-to-person spread. Epidemiology and Infection.
106: 423-433.
Morgan, P. (1990) Rural water supplies and sanitation. Macmillan.
Harare, Zimbabwe.
94

Most, H. (Ed.) (1951) Parasitic infections in man. Colombia
University Press. New York.
Mqoqi, N. P. (1991) Epidemiology of urinary schistosomiasis,
Schistosoma haematobium, in the Port St. Johns district of
Transkei. M Sc. dissertation, University of Natal.
Naidoo, K. (1982) Epidemiology of Ascaris in Durban. A commentary
submitted in partial fulfilment of the requirement for part" II of
the FFCH(CM) (SA). University of Natal, Durban.
Nash, E.S. (1995) Listening to your patient - the hidden language
of communication. South African Journal of Continuing of Medical
Education 13: 357-362.
Neal, R.A. (1974) Survival of Entamoeba and related amoebae at
low temperature. I. viability of Entamoeba cysts at 4°C.
International Journal of Parasitology 4: 227-229.
Neal, R.A., Latter, V.S. & Richards, W.H.G. (1974) Survival of
Entamoeba and related amoebae at low temperatures. II. Viability ...
of amoebae and cysts stored in liquid nitrogen. International
Journal of Parasitology 4: 353-360.
Needham, C.S. & Lillywhite, J.E. (1994) Immunoepidemiologyof
intestinal helminthic infections. 2 immunological correlates with
patterns of Trichuris infection. Transactions of Royal Society
Tropical Medicine and Hygiene 88: 262-264.
95
Nelson, G.S. (1966) Human behaviour in the transmission of
parasitic diseases. Transactions of Royal Society of Tropical
Medicine and Hygiene 60: 471-480.
Nwosu, A.B.C., Ifezulije,
dracontiasis in Anambra
E . 0 . & Anya, A. 0 . ( 1982 ) Endemi c
State of Nigeria: geographical
distribution, clinical features, . epidemiology and socio-economic
impact of the disease. Annals of Tropical Medicine and
Parasitology 76: 187-200.
Oskowwitz, R.N. & Mckenzie, A. (1993) Health Education - The
Tintswalo experience, Part 2 - Teaching health educators. Journal
of Comprehensive Health 4: 13-16.
Pacey, A. (1978) Sanitation in developing countries. John Wiley
& Sons, New York.
Pammenter, M.D., Rossouw, E.J. & Dingle, C.E. (1987) Serological
detection of cysticercosis in two rural areas of South Africa .
Transactions of Royal Society of Tropical Medicine and Hygiene
81: 242-244.
Pampigl i one, S. & Ricciardi, M.L. (1974) Parasitological survey
on pygmies in central Africa. I Babinga group (Central African
Republic). Rivista di Parassitologia 25: 161-188.
Piekarski, G. (1989) Medical parasitology. 3rd Edn.
Springer-Verlag, Berlin.
96

Pinfold, J.V. (1990) Faecal contamination of water and
fingertip-rinses as a method for evaluating the effect of
low-cost water supply and sanitation activities on faeco-oral
disease transmission. II A hygiene intervention study in rural
north-east Thailand. Epidemiology and Infection 105: 377-389.
pitchford, R.J. (1981) Temperature and schistosome distribution
in South Africa. South African Journal of Science 77: 252-261 .
Roodt, L., Felix, M & Wadee, A.A. (1995) Total IgE levels in a
rural Pedi population in the North Eastern Transvaal. South
African Journal of Epidemiology and Infection. 10: 79-82.
Sapero, J. J. & Lawless, D. K. (1953) The "MIF" stain- preservation ,
technic for the identification of intestinal Protozoa . American
Journal of Tropical Medicine and Hygiene 2: 613-619.
Sarti, E., Schantz, P.M., Plancarte, A., Wilson, M., Gutierrez,
1.0. , Agvilera, J . , Roberts, J. & Flisser, A. (1994)
Epidemiological investigation of Taenia solium taeniasis and
cysticercosis in rural village of Michican State, Mexico.
Transactions of Royal Society of Tropical Medicine and hygiene
88: 49-52.
Schaaf, H. S., Donald, P. R. & Burger, P. J. (1989) Intestinal
parasites in Richtersveld children. South African Journal of
Epidemiology and infection 4: 7-8.
97

Schall, R. (1991) Estimation in generalized linear models with
random effects. Biometrika 78: 719-727.
Schimdt, G.D. & Roberts, L.S. (1985) Foundations of parasitology.
Mosby college publishing. New York.
Schutte, C.H.J., van Deventer, J.N.G & Eriksson, I.M. (1977)
Parasitic infections in Black children in an endemic
schistosomiasis area in Natal. South African Medical Journal
51: 268-272.
Schutte. C.H.J., van Deventer, J.M.G. & Lamprecht, T. (1981) A
cross-sectional study on the prevalence and intensity of
infection with Schistosoma haematobium in students of northern
KwaZulu. American Journal of Tropical Medicine and Hygiene 30:
364-372.
Schutte, C.H.J., Eriksson, I.M., Anderson, C.B. & Lamprecht, T.
(1981) Intestinal parasitic infections in Black scholars in
northern KwaZulu. South African Medical Journal 55: 756-757.
Scrimshaw, N.S., Taylor, C.E. & Gordon, J.E. (1968) Interactions
of nutrition and infection. WHO Monograph Series No. 57. 1-329.
Searle, C., Brink, 1.L & Grobbelaar, W.C. (Eds) (1992) Aspects of
community health. 6th Edn. King Edward VII Trust, Cape Town.
98

Segal, I., Hodkinson, J.H., Asuat, M.S., Hurwitz, S. & Conlan, A.
(1981) Amoebiasis in an urban Black population. South African
Medical Journal 60 : 230-231.
Sepulveda, B. & Diamond, L.S. (1976) Amoebiasis. International
conference on amoebiasis. Instituto Mexicano del Seguro Social.
Mexico.
Shasha, w. & Pamrnenter, M.D. (1992) The challenge of I .
cysticercosis. South African Journal of Epidemiology and
Infection 4: 38.
Shasha, W., van Dellen, J. & Cakata, E. (1986) Cysticercosis: An
analysis of 141 cases in South Africa. South African journal of
Epidemiology and Infection 1: 94-97.
Singh, B., Abdullah, M.S. & Zakaria, R. (1994) Proceedings of the
Eighth International Congress of Parasitology, Abstracts (Vol. 1) .
141.
Smith, C. (1991) Individual larval motility: a possible viability
test for embryonated Ascaris lumbricoides ova. Transactions of
Royal Society of Tropical Medicine and Hygiene 85 : 760.
Sole, T.D. & Croll, N.A. (1980) Intestinal parasites in man in
Labrador, Canada. American Journal of Tropical Medicine and
Hygiene 29: 364-368.
99

Solomons, N.W. (1982) Giardiasis: Nutritional implications.
Reviews of infectious diseases 4 : 859-869.
Stoll, N. (1947) This wormy world . Journal of Parasitology
33: 1-18.
Tema, B. and Sebego, M. (1990) Some biological
Batswana traditional healers . South African
Epidemiology and Infection 5: 44 - 48.
concepts of
Journal of
Ukoli, F.M.A. (1984) Introduction to parasitology in tropical
Africa . 1st Edn. John Wiley & Sons, New York.
Van Niekerk, C.H., Wienberg, E.G ., Lorn Shore, S.C & de V Hees,
H. (1979) Intestinal parasitic infection in urban and rural Xhosa
children . South African Medical Journal. 76: 197-198.
Van Rensburg, H. C. J & Fourie, A. (1994a) Inequalities in South
Africa Health Care. Part 1. The problem - manifestations and
origins. South African Medical Journal 84: 95-99.
Van Rensburg, H.C.J & Fourie, A. (1994b) Inequalities in South
African Health Care. Part II. Setting the record straight. South
African Medical Journal 84: 99 - 103 .
Van Rensburg, H. C.J., Fourie, A. & Pretorius, E. (1992) Health
Care in South Africa: Structure and Dynamics. Pretoria Academia.
100
/

Van Rensburg, H.C.J & Mans, A. (1990) Profile of disease and
health care in South Africa. 2nd Edn. Van Schalk. Cape Town.
Von Schirnding, Y.E.R. (1992) Environmental health issues in the
1990s. South African Medical Journal 81: 536-537 (Editorial).
Vrey, W . J . H . & Smith, D.J.G. (1980) Die Ontwinkkeling van
QwaQwa. Vol.2. Universiteit van die Oranje-Vrystaat.
Bloemfontein.
Wagner, J. (1990) Learning difficulties in township children.
Journal of Comprehensive Health 1: 93-133.
Watson, C.E., Leary, P.M & Hartley, P.S. (1970) Amoebiasis in
Cape Town children. South African Medical Journal 44: 419-421.
Watts, S.J. (1986) Human behaviour and the transmission of
drancunculiasis: a case study from the Ilorin area of Nigeria.
International Journal of Epidemiology 15: 252-256.
Weather Bureau. (1995) Climate of South Africa WB42 climatic
statistics 1961-1990. Number 0332150A6 Golden Gate. Period 1983
-1990.
Welham, S.J. (1993) Procedure GLMM in Gestat procedure library
manual release 3[1]. (The Genstat 5 Editorial Committee).
101

Winblad, V & Kilama, W. (1992) Sanitation without water. 3rd Edn
Macmillan, London and Basingstoke .
World Health Organization. (1964) Soil-transmitted helminths.
Technical Report Series No 277. WHO, Geneva.
World Health Organization. (1967) Control of Ascariasis.
Technical Report Series No 379, WHO, Geneva.
Wright, S.G. (1979) Giardiasis. Transactions of the Royal Society
of Tropical Medicine and Hygiene 73: 509-511.
102

APPENDIX A
.MODIFIED MERTHIOLATE-IODINE-FORMALDEHYDE CONCENTRATION TECHNIQUE
METHOD:
1. Pour the totally emulsified preserved stool sample through
a double wetted gauze into 70ml paper cup.
2. Wash down any remaining stool sample with few drops of 5%
formalin.
3. Tranfer the filtrate (strained fluid) into a labelled
plastic centrifuge tube.
4. Centrifuge at 4 000 rpm for 1 minute. Remove excess
supernatant. (leave 7-8ml)
5. Add 4ml ether and close tightly with a cork stopper.
6. Shake vigorously for 2 minutes.
7. Remove the cork stopper and centrifuge immediately at
5 000 rpm for 2 minutes.
8 . After centrifuging four
(formol-ether, plug of
sediment) .
layers ~hould have been formed
faecal debris, formalin and
9. Using an "orange stick" carefully loosen aroutld the debris
layer between ether and formalin.
10. Return tube to upright position and tap the bottom of the
tube to resuspend the sediment.
11. When about to examine add the 2 drops of Lugol's iodine to
the sample, and transfer with pasture pipette onto the
slide. Put coverslip on top and examine.

APPENDIXB
II PARENT CONSENT FORM II
PARENTS
The majority of children in your area have common parasite infections like intestinal worms and pathogenic protozoans. We would like per~isiion to test and to treat your child if she/he has any of these infections. Medical staff will be present during treatment. Generally there are no problems but if you suspect that treatment has affected your child please contact the nearest clinic or hospital as soon as possible. There will be no charge, but without your permission we are unable to treat your child. The results of your child's tests will be made available to you if you contact your school or principal of the school that your child attends.
1, __________________________________________________________________ _
a parent or guardian, give permission for my child
to be treated by school nurses and doctor from the Department of Health if she/he is infected with intestinal parasites.
BATSWADI
Boholo ba bana ba moo le ahileng ten~ ba na le tshwaetso ya manyoha. Re kopa ke hona tumello ya ho hlahloba ngwana wa hao le mo alafa ebang a ena le tswaetso ya mofuta ona. Baoki le Ngaka ba tla ba teng ha ngwana a fuwa phekolo. Ha se phekolo e bakang mathatai empa ha 0 ka belaelwa hore ngwana hao 0 amehile ka tsela e itseng ke pheko eo 0 ka ikopanya le tliliniki e haufi. Diteko le phekolo ha di lefellwei empa re sitwa ho alafa ngwana wa hao ntle le tumello ya hao. Diphetho (results) tsa diteko tsa ho bona hore tshwaetso e teng kapa tjhe ngwaneng wa hao 0 ka di fumana ho mooki wa sekolo kapa mosuwehloho wa sekolo.
Nna, -------------------------------------------------------
motswadi, ke fana ka tumello ya hore ngwanaka,
a alafuwe ke mooki wa Lefapha la Bophelo ha eba a ena Ie tswaetso ya manyoha.

APPENDIXC
NUMBER (NUM)
NAME OF SHOOL
ALTITUDE (Y2)
SEX (X2) d 9
AGE (X3) < 5YRS 6 - 10 YRS >10 YRS
STANDARD OF HYGIENE
BEEF PORK BOTH OTHER
II
SOURCE OF BUTCHERY OWN SLAUGHTER BOTH MEAT (X5)
QUALITY OF GRADED UNGRADED BOTH MEAT (X6)
WATER IN THE < 1 KM > 1KM . TANKS OTHER SOURCE HOUSE (RIVER) (X7) or BUSH)
SANITATION (X8) PIT-LATRINE FLUSH TOILET
ELECTRICITY CONSTANT OCCASIONAL NONE (X9) SUPPLY
PUPIL'S BACKGROUND
PARENTjGAURDIAN'S AGE
FATHER (X10A) MOTHER (X10B)
< 30YRS < 30 YRS
31 - 40 YRS 31 - 40 YRS
> 40 YRS > 40 YRS

APPENDIXD Table 6.2
Table 6.1
Prevalences of intestinal parasites with respect to age and sex profiles in summer at Letlotlo primary school. Percentage children without any parasites = 23.3 %. Total number of children sampled = 146.
Prevalences of intestinal parasites with respect to age and sex profiles in winter at Letlotlo primary school. Percentage of children without any parasites = 14.5 %. Total number of children sampled = 146.
Letlotlo Females Males <5yrs
Number 77 52 23 who complj,ed (129]
Parasite % (num) % (num) % (num) species
G.i 2.6 (3 ) 5.8 (3 ) 0.0 (0)
C.m 12.9(10) 17.3 (9 ) 8.6 (2 )
E.hi 0.0 (0) 0.0 ( 0) 0.0 (0)
E.c 62.3(48) 48.1(25) 30.4 (7 )
E.ha 12.9(10) 5.8 (3 ) 8.7 (2 )
E.n 28.6(22) 17.3 (9) 0.0 (0)
I.b 5.2 (4 ) 13.5 (7 ) 4.3 ( 1)
SPA 0.0 (0) 0.0 (0) 0.0 (0)
MSPA 7 . 8 ( 6) 3.8 (4 ) 0.0 (0)
tae 0.0 (0) 0.0 (0) ' 0.0 (0)
H.d 0.0 (0) 0.0 (0) 0.0 (0)
H.n 0.0 (0) 1.9 (10 0.0 (0)
T.t 1.3 ( 1) 3.8 (2 ) 0.0 (0)
A.I 9.9 (7) 11.5 (6) 17.4 (4 )
6-10yrs
85
% (num)
4.7 (4 )
18.8(16)
0.0 (0)
61.2(52)
10.6 (9)
25.9(22)
9.4 (8 )
0.0 (0)
4.7 (4 )
0.0 (0)
0.0 (0)
1.2(10)
1.2
10.6
G.i C.m E.hi E.c E.ha E.n I.b SPA MSPA tae H.d H.n T.t a 1
( 1)
(9)
>10yrs Letlotlo
21 Number who complied (129]
% (num) Parasite species
4.8 ( 1) G. i
4.8 ( 1) C. m
0.0 (0) E. hi
66.7(14)
9.5 (2 )
42.8 (9 )
9.5 (2 )
0.0 (0)
19.0 (4 )
0.0 (0)
0.0 (0)
0.0 (0)
9.5 (2 )
0 (0)
Giardia intestinal is Chilomastix mesnili Entamoeba histolytica Entamoeba coli Entamoeba hartmanni Endolimax nana
E.c
E.ha
E.n
I.b
SPA
MSPA
tae
H.d
H.n
T.t
A.I
Iodomoeba buetschlii Small pre-cystic amoeba Medium pre-cystic amoeba taeniid tapeworm Hymenolepis diminuta Hymenolepis nana Trichuris trichillra AR~Aris lumbricoides
"
. .
Females Males <5yrs 6-10yrs >lOyrs
77 52 23 85 21
% (num) % (num) % (num) % (num) % (num)
10.4 ( 8) 1l.5 (6) 8.7 (2 ) 8.2 (7) 23.8 (5)
9.1 (7) 13.5 (7) 8.7 (2 ) 10.6 (9) 14.3 (3)
0.0 (0) 1.9 (1) 4.3 ( 1) 0.0 (0) 0.0 (0)
59.7(46) 51.9(27) 43.5(10) 62.4(53) 47.6(10)
3.9 (3) 3.8 (2 ) 0.0 (0) 4.7 (4 ) 4.8 (1)
18.2 (14) 15.4(8) 0.0 ( 0) 22.4(19) 14.3(3)
0.0 (0) 0.0 (0) 0.0 (0) 0.0 (0) 0.0 (0)
0.0 (0) 0.0 (0) ' 0.0 (0) 0.0 (0) 0.0 (0)
5.2 (4 ) 0 . 0 (0) 8.7 (2 ) 2.4 ( 2) 0.0 (0)
0.0 (0) 0.0 (0) 0.0 (0) 0.0 (0) 0 . 0 (0)
0.0 (0) 0.0 (0) 0.0 (0) 0.0 (0) 0.0 (0)
0.0 (0) 0.0 (0) 0.0 (0) 0.0 (0) 0.0 (0)
0.0 (0) 1.9 ( 1) 0.0 (0) 1.2 ( 1) 0.0 (0)
6.5 (5) 5.8 (3 ) 8.7 (2 ) 5.9 ( 5) 4.8 ( 1)
I

Table 7.1
Prevalences of intestinal parasites with respect to age and sex profiles in summer at Mafika-ditshiu primary school. Percentage of children without any parasites = 27.0 %. Total number of children sampled = 126.
Mafika- Females Males <5yrs 6-10yrs >10yrs ditshiu
Number 43 54 44 44 9 [97]
Parasite % (num) % (num) % (num) % (num) % (num) !
species
G.i 2.3 (1) 1.8 (1) 0.0 (0) 4.5 (2 ) 0.0 (0)
C.m 20.9 (9) 18.5(10) 18.1 (8) 20 . 4 (9 ) 22.2 (2 )
E.hi 0.0 (0) 1.8 (1) 2.3 ( 1) 0.0 (0) 0.0 (0)
E.c 58.1(25) 50 . 0(27) 52.3(23) 50.0(22) 77.8 (7)
E.ha 9.3 (4 ) 1.8 (1) 6.8 (3 ) 4.5 (2) 0.0 (0)
E.n 13.9 (6) 16.7 (9) 22 . 7(10) 6.8 (3 ) 11.1 (1)
I.b 2.3 (1) 3.7 (2) 2.3 (1) 2.3 (1) 11.1 (1)
SPA 2.3 (1) 1.8 (1) 0.0 (0) 4.5 (2) 0.0 (0)
MSAP 6.9 (3 ) 1.8 (1) 4.5 (2) 2.3 (1) 11.1 (1)
tae 0.0 (0) 0.0 (0) 0.0 (0) 0.0 (0) 0.0 (0)
H.d 0.0 (0) 0.0 (0) 0.0 (0) 0.0 (0) 0.0 (0)
H.n 0.0 (0) 0.0 (0) 0.0 (0) 0.0 (0) 0.0 (0)
T.t 0.0 (0) 1.8 ( 1) 2.3 (1) 0.0 (0) 0.0 (0)
A.l 0.0 (0) 3.7 (2) 2.3 (1) 0.0 (0) 11.1 (1)
Table 7.2
Prevalences of intestinal parasites with respect to age and sex profiles in winter at Mafika-ditshiu primary school. percentage of children without any parasites = 40.5 %. Total number of children sampled = 126.
I
Mafika- Females Males <5yrs 6-10yrs >10yrs
ditshiu
Number 36 38 31 36 7
who complied [74]
parasite % (num) % (num) %(num) %(num) % (num)
species
G.i 2.8 (1) 0.0 (0) 3.2 (1) 0.0 (0) 0.0 (0)
C.m 2.8 (1) 5.2 (2 ) 6.4 (2 ) 2.7 (1) 0.0 (0)
E.hi 2.8 ( 1) 0.0 (0) 0.0 (0) 0.0 (0) 14.2 (1)
E.c 41.6(15) 63.1(24) 41.9(13) 55.5(20) 85.7(6)
E.ha 16.7 (6) 7.9 (3 ) 9.6 (3 ) 5.6 (2 ) 0.0 (0)
E.n 13.9 (5) 13.2 (5) 9.6 (3 ) 11.1 (4 ) 42.8 (3 )
I.b 0.0 (0) 2.6 (1) 0.0 (0) 0.0 (0) 14.2 (1)
SPA 0.0 (0) 0.0 (0) 0.0 (0) 0.0 (0) 0.0 (0)
MSPA 0.0 (0) 2.6 (1) 0.0 (0) 2".7 (1) 0.0 (0)
tae 0.0 (0) 0.0 (0) 0.0 (0) 0.0 (0) 0.0 (0)
H.d 0.0 (0) 0.0 (0) 0.0 (0) 0.0 (0) 0.0 (0)
H.n 0.0 (0) 0.0 (0) 0.0 (0) 0.0 (0) 0.0 (0)
'r.t 0.0 (0) 0.0 (0) 0.0 (0) 0.0 (0) 0.0 (0)
A.l 0.0 (0) 0.0 (0) 0.0 (0) 0.0 (0) 0.0 (0)

Table 8.1
Prevalences of intestinal parasites with respect to age and sex profiles in summer at Teboho primary school . Percentage of children without any parasites = 26.0%. Total number of children sampled = 105.
Letlotlo Females Males <5yrs 6-10yrs >10yrs
Number 46 45 35 46 10 who complied [91)
Parasite % (num) % (num) % (num) % (num) % (num) species
G.i 8.7 (4) 2.2 (1) 0.0 (0) 2.2 (1) 0.0 (0)
C.m 8.7 (4) 11.1 (5) 17.1 (6) 4.3 (2) 10.0 (1)
E. hi 0.0 (0) 2.2 (1) 2.8 (1) 4.3 (2) 0.0 (0)
E.c 54.3(25) 62.2(28) 51.4(18) 58.7(27( 80.0(8)
E.ha 13.0 (6) 11.1 (5) 20.0 (7) 8.7 (4) 0.0 (0)
E.n 4.3 (6) 15.6 (7) 8.6 (3) 19.6 (9) 10.0 (1)
lob 13.0 (6) 6.7 (3) 5.7 (2) 13.0 (6) 10.0 (1)
SAP 0.0 (0) 0.0 (0) 0.0 (0) 0.0 (0) 0.0 (0)
MSPA · 2.2 (1) 6.7 (3 ) 5.7 (2) 2.2 (1) 10.0 (1)
tae 0.0 (0) 0.0 (0) 0.0 (0) 0.0 (0) 0.0 (0)
H.d 0.0 (0) 0.0 (0) 0.0 (0) 0.0 (0) 0.0 (0)
H.n 2.2 (1) 0.0 (0) 0.0 (0) 2.2 (1) 0.0 (0)
T.t 0.0 (0) 0.0 (0) 0.0 (0) 0.0 (0) 0.0 (0)
A.I 15.2 (7) 15.5 (7) 8.6 (3) 19.6 (9) 20.0 (2)
Table 8 . 2
Prevalences of intestinal parasites with res~ect to age and sex profiles in winter at Teboho primary school. Percentage of children without any parasites = 21.0 %. Total number of children sampled = 105.
Teboho Females Males <5yrs 6-10yrs >10yrs
Number 45 31 31 33 12 who complied [76)
Parasite %(num) %(num) % (num) %(num) %num) species
G.i 4.4 (2) 12.9 (4) 6.4 (2) 9.1 (3) 8.3 (1)
C.m 4.4 (2) 29.0 (9) 22.6 (7) 3.0 (1) 25.0 (3)
E.hi 2.2 (1) 6.5 (2) 3.2 (1) 6.1 (2) 0.0 (0)
E.c 44.4(20) 93.5(29) 67.7(21) 57.6(19) 75.0(9)
E.ha 2.2 (1) 19.4 (6) 9.7 (3) 6.1 (2) 16.6 (2)
E.n 24.4 (1) 29.0 (9) 29.0 (9) 21. 2 (7) 33.3 (4)
I.b 2.1 (1) 0.0 (0) 3.2 (1) 0.0 (0) 0.0 (0)
SPA 2.2 (1) 3.2 (1) 0.0 (0) 6.1 (2) 0.0 (0)
MSPA 2.2 (1) 6.5 (2) 3.2 (1) 3.0 (1) 8.3 (1)
tae 0.0 (0) 0.0 (0) 0.0 (0) 0.0 (0) 0.0 (0)
H.d 0.0 (0) 0.0 (0) 0.0 (0) 0.0 (0) 0.0 (0)
H.n 0.0 (0) 0.0 (0) 0.0 (0) 0.0 (0) 0.0 (0)
T.t 0.0 (0) 0.0 (0) 0.0 (0) 0.0 (0) 0.0 (0)
A.l 4.4 (2) 9.7 (3) 12.9 (13) 0.0 (0) 8.3 (1)

Table 9.1
Prevalences of intestinal parasites with respect to age and sex profiles in summer at Makhetheng primary school. Percentage of children without any parasites = 31.0 %. Total number of children sampled 104.
Makhethe Females Males <5yrs 6-1.oyrs >1.0yrs -ng
Number 47 50 28 64 5 who complied [97]
Parasite % (num) % (num) % (num) % (num) % (num) I I
species
G.i 4.2 (2) 0.0 (0) 3.6 (1.) 1..6 (1.) 0.0 (0)
C.m 23.4(1.1.) 36.0(1.8) 25.0(17) 34.3(22) 0.0 (0)
E.hi 0.0 (0) 0.0 (0) 0.0 (0) 0.0 (0) 0.0 (0)
E.c 48.9(23) 70.0(35) 53.6(1.5) 65.6(66) 20.0(1)
E.ha 0.0 (0) 0.0 (0) 0.0 (0) 0.0 (0) 0.0 (0)
E.n 8.5 (4) 1.4.0 (7) 10.7 (3) 9.3 (6) 40.0 (2)
lob 6.4 (3) 2.0 (1) 3.6 (1.) 4.7 (3) 6.2 (4)
SPA 0.0 (0) 0.0 (0) 0.0 (0) 0.0 (0) 0.0 (0)
MSPA 4.2 (2) 6.0 (3 ) 3.6 (1.) 6.2 (4) 0.0 (0)
tae 2.1. (1.) 0.0 (0) 0.0 (0) 0.0 (0) 20.0 (1.)
H.d 0.0 (0) 2.0 (1.) 0.0 (0) 1..6 (1.) 0.0 (0)
H.n 0.0 (0) 0.0 (0) 0.0 (0) 0.0 (0) 0.0 (0)
T.t 0.0 (0) 0.0 (0) 0.0 (0) 0.0 (0) 0.0 (0)
A.I 0.0 (0) 0.0 (0) 0.0 (0) 0.0 (0) 0.0 (0)
Table 9.2
Prevalences of intestinal parasites with respect to age and sex profiles in winter at Makhetheng primary school. percentage of children without any parasites = 39.0 %. Tot~l number of children sampled = 104. '
Makhethe Females Males <5yrs 6-1.0yrs >1.0yrs -ng
Number 37 38 1.7 53 5 who complied [75 ]
Parasite % (num) % (num) % (num) % (num) % (num) species
G.i 0.0 (0) 2.6 (1.) 0.0 (0) 1..9 (1.) 0.0 (0)
C.m 1.3.5 (5) 5.3 (2) 1.1.. 8 (2) 9.4 (5) 0 : 0 (0)
E.hi 0.0 (0) 2.6 (1. ) 0.0 (0) 1..9 (1) 0.0 (0)
E.c 51..4(1.9) 68.4(1.6) 70.6(1.2) 60.4(32) 20.0 (1.)
E.ha 0.0 (0) 7.9 (3) 5.9 (1.) 7.5 (4) 0.0 (0)
E.n 2.7 (1.) 1.0.5 (4) 5.9 (1.) 7.5 (4) 0.0 (0)
lob 0.0 (0) 2.6 (1) 0.0 (0) 1..9 (1.) 0.0 (0)
SPA 0.0 (0) 0.0 (0) 0.0 (0) 0.0 (0) 0.0 (0)
MSPA 0.0 (0) 2.6 (1) 0.0 (0) 1..9 (1) 0.0 (0)
tae 2.7 (1.) 0.0 (0) 0.0 (0) 0.0 (0) 20.0 (1)
H.d 0.0 (0) 0.0 (0) 0.0 (0) 0.0 (0) 0.0 (0)
H.n 0.0 (0) 0.0 (0) 0.0 (0) 0.0 (0) 0.0 (0)
T.t 0.0 (0) 0.0 (0) 0.0 (0) 0.0 (0) 0.0 (0)
A.I 0.0 (0) 0.0 (0) 0.0 (0) 0.0 (0) 0.0 (0)

Table 10.1
Prevalences of intestinal parasites with respect to age and sex profiles in summer at Mohlakaneng primary school. Percentage of children without any parasites = 35.0 %. Total number of children sampled = 120.
Mohlakan Females Males <5yrs 6-10yrs >10yrs -eng
Number 53 64 28 88 01 who complied [117]
Parasite % (num) % (num) % (num) % (num) % (num) species
G. i 0.0 (0) 1.6 (1) 0.0 (0) 1.1 (1) 0.0 (0)
C.m 9.4 (5) 15.6(10) 17 .8 (5) 11.4(10) 0.0 (0)
E.hi 3.8 (2) 0.0 (0) 0.0 (0) 2.3 (2) 0.0 (0)
E.c 52.8(28) 65.6(42) 57.1(16) 60.2(53) 100.0(1)
E.ha 3.8 (2) 0.0 (0) 0.0 (0) 2.3 (2) 0.0 (0) ,
E.n 22.6(12) 23.4(15) 17.8(5) 23.8(21) 100.0 (1)
lob 1.9 (1) 3.1 (2) 0.0 (0) 3.4 (3) 0.0 (0)
SPA 0.0 (0) 0.0 (0) 0.0 (0) 0.0 (0) 0.0 (0)
MSPA 13.2(7) 4.7 (3) 7.1 (2) 9.1 (8) 0.0 (0)
tae 0.0 (0) 0.0 (0) 0.0 (0) 0.0 (0) 0.0 (0)
H.d 0.0 (0) 1.6 (1) 0.0 (0) 1.1 (1) 0.0 (0)
H.n 0.0 (0) 0.0 (0) 0.0 (0) 0.0 (0) 0.0 (0)
T.t 1.9 (1) 1.6 (1) 0.0 (0) 2.3 (2) 0.0 (0)
A.l 3.8 (2) 1.6 (1) 3.6 (1) 2.3 (2) 0.0 (0)
Table 10.2
Prevalences of intestinal parasites with respect to age and sex profiles in winter at Mohlakaneng primary school. Percentage of children without any parasites = 41.0 %. Total jnumber of children sampled 120.
Mohlakan Females Males <5yrs 6-10yrs >10yrs -eng
l'fumber 43 57 24 75 1 who complied [100]
Parasite % (num) % (num) % (num) % (num) % (num) species
G.i 2.3 (1) 1.8 (1) 0.0 (0) 2.7 (2) 0.0 (0)
C.m 6.9 (3) 10.5 (6) 8.3 (2) 9.3 (7) 0.0 (0)
E.hi 2.3 (1) 7.0 (4) 4.2 (1) 5.3 (4) 0.0 (0)
E.c 44.2(19) 47.4(27) 33.3(8) 49.3(37) 100.0(1)
E.ha 0.0 (0) 5.3 (3) 0.0 (0) 4.0 (3) 0.0 (0)
E.n 16.3 (7) 26.3(15) 20.8 (5) 22.7(17) 0.0 (0)
lob 0.0 (0) 1.8 (1) 0.0 (0) 1.3 (1) 0.0 (0) • SPA 0.0 (0) 0.0 (0) 0.0 (0) 0.0 (0) 0.0 (0)
MSPA · 0.0 (0) 0.0 (0) 0.0 (0) 0.0 (0) 0.0 (0)
tae 0.0 (0) 0.0 (0) 0.0 (0) 0.0 (0) 0.0 (0)
H.d 0.0 (0) 0.0 (0) 0.0 (0) 0.0 (0) 0.0 (0)
H.n 0.0 (0) 0.0 (0) 0.0 (0) 0.0 (0) 0.0 (0)
T.t 0.0 (0) 1.8 (1) 0.0 (0) 1.3 (1) 0.0 (0)
A.l 4.6 (2) 0.0 (0) 0.0 (0) 2.7 (2) 0.0 (0)

Table 11.1
Prevalence of intestinal parasites with respect to age and sex profiles in summer at Makeneng primary school. percentage of children without any parasites = 29.0 %. Total number of chidren sampled = 116.
Makeneng Females Males <5yrs 6-l0yrs >5yrs
Number 34 37 24 40 7 [1.1.6]
Parasite % (num) % (num) % (num) % (num) % (num) species
G.i 8.8 (3) lO.8 (4) 8.3 (2) l2.5 (5) 0.0 (0)
C.m l7.6 (6) l8.9 (7) l6.6 (4) 22.5 (9) 0.0 (0)
E. hi 0.0 (0) 0.0 (0) 0.0 (0) 0.0 (0) 0.0 (0)
E.c 67.6(23) 51..4(l9) 58.3(1.4) 62.5(25) 42.8(3)
E.ha 23.5 (8) 0.0 (0) 4.2 (l) l7.5 (7) 0.0 (0)
E.n l7.6 (6) lO.8 (1.1.) 8.3 (2) l2. 5 (5) 0.0 (0)
lob 0.0 (0) 2.7 (l) 0.0 (0) 0.0 (0) 1.4.3 (l)
SPA . 0.0 (0) 0.0 (0) 0.0 (0) 0.0 (0) 0.0 (0)
MSPA l1.. 7 (4) 2.7 (l) 4.2 (l) lO.O (4) 0.0 (0)
tae 0.0 (0) 0.0 (0) 0.0 (0) 0.0 (0) 0.0 (0)
H.d 0.0 (0) 0.0 (0) 0.0 (0) 0.0 (0) 0.0 (0)
H.n 0.0 (0) 0.0 (0) 0.0 (0) 0.0 (0) 0.0 (0)
T.t 0.0 (0) 2.7 (l) 0.0 (0) 2.5 (l) 0.0 (0)
A.I 8.8 (3) 8.l (3) 20.8 (5) 2.5 (l) 0.0 (0)
Table 11. 2
Prevalences of intestinal parasites with respebt to age and sex profiles in winter at Makeneng primary school. Percentage of children without any parasites = 29.0 %. Total number of children sampled = 116.
Makeneng Females Males <5yrs 6-l0yrs >lOyrs
Number 32 30 28 29 5 who complied [62]
Parasite % (num) % (num) % (num) % (num) % (num) species
G.i 6.2 (2) l6.7 (5) 1.4.2 (4) lO.3 (3) 0.0 (0)
C.m 9.4 (3) 23.3 (7) l7.8 (5) 1.3.8 (4) 20.0 (l)
E.h 3.l (l) 3.3 (l) 3.5 (l) 0.0 (0) 20.0 (l)
E.c 68.8(22) 53.3(l6) 67.8(l9 ) 58.6(l7) 40.0 (2)
E.ha 3.l (l) 6.7 (2) 3.5 (l) 3.4 ( l) 20.0 (l)
E.n l5.6(50) l6.7 (5) l4.2 (4) lO.3 (3) 0.0 (0)
I.b 0.0 (0) 0.0 (0) 0.0 (0) 0.0 (0) 0.0 (0)
SPA 0.0 (0) 0.0 (0) 0.0 (0) 0.0 (0) 0.0 (0)
MSPA 3.l (1) 0.0 (0) 3.5 (1) 0.0 (0) 0.0 (0)
tae 0.0 (0) 0.0 (0) 0.0 (0) 0.0 (0) 0.0 (0)
H.d 0.0 (0) 0.0 (0) 0.0 (0) 0.0 (0) 0.0 (0)
H.n 0.0 (0) 0.0 (0) 0.0 (0) 0.0 (0) 0.0 (0)
T.t 0.0 (0) 0.0 (0) 0.0 (0) 0.0 (0) 0.0 (0)
A.I 3.l (l) 0.0 (0) 3.5 (l) 0.0 (0) 0.0 (0)

Table 12.1
Prevalences of intestinal parasites with respect to age and sex profiles in summer at Sehlajaneng primary school. percentage of children without any parasites = 28.6 %. Total number of children sampled = 140.
Sehlajan Females Males <5yrs 6-10yrs >loyrs -eng
Number 62 66 4 111 13 who complied (128)
Parasite % (num) % (num) % (num) % (num) % (num) species
G.i 1..6 (1) 4 .5 (3 ) 0 .0 (0) 2.7 (3 ) 7.7 (1)
C. m 9. 7 ( 6 ) 15 . 2 (10) 25 . 0 (1) 9.9 (11) 30 . 7 (4)
E.hi 6.4 ( 4 ) 0 . 0 (0 ) 25 .0 (1) 2 . 7 (3 ) 7.7 (1)
E. c 56. 4 ( 35 ) 59.1( 39 ) 100.0( 4 ) 55.8(62) 61..5(5)
E.ha 20.9(13) 7. 6 (5) 25.0 (1) 13.5(15) 15.4(2) ! I
E.n 17.7(11) 15. 2 (10) 0.0 (0) 18.0(20) 7.7 (1) I
lob 3.2 (2) 3.0 (2) 0.0 (0) 2.7 (3) 7.7 (1)
SPA 1..6 (1) 1..5 (1) 0.0 (0) 1..8 (2) 0.0 (0)
MSPA 9.7 (6) 3.0 (2 ) 0.0 (0) 7 . 2 (8) 0.0 (0)
tae 0.0 (0) 0.0 (0) 0.0 (0) 0.0 (0) 0.0 (0)
H. d 0.0 (0) 0 .0 (0) 0.0 (0) 0 . 0 (0) 0.0 (0)
H.n 0.0 (0) 0.0 (0) 0.0 (0) 0.0 (0) 0.0 (0)
T.t 0.0 (0) 0.0 (0) 0.0 (0) 0.0 (0) 0.0 (0)
A.I 4.8 (3 ) 0.0 (0) 0.0 (0) 2~_8) 7.7 (1) --- -- -
Table 12.2
Prevalences of intestinal parasites with respect to age and sex profiles in winter at sehlajaneng primary school. Percentage of children without any parasites = 42.0 %. Total Jlumber of children sampled = 140. ;
, I
Sehlajan Females Males <5yrs 6-10yrs >loyrs
-eng
Number 54 60 3 100 11
who complied (114)
Parasite % (num) % (num) % (num) % (num) % (num)
species
G.i 3.7 (2) 8.3 (5) 0 . 0 (0) 6.0 (6) 9.1 (1)
C.m 1..8 (1) 6 .7 ( 4 ) 0.0 (0) 5. 0 (5) 0.0 (0)
E . hi 5.6 (3) 1..7 (1) 0.0 (0) 4 .0 (4) 0.0 (0)
E.c 51..8(28) 46.7(2 8 ) 0.0 (0) 48 .0( 48 ) 72.7( 8 )
E.ha 7.4 (4) 0.0 (0) 0.0 (0) 4 .0 (4) 0.0 (0)
E.n 16.7 (9) 13.3 (8 ) 0.0 (0) 16.0(16) 9.1 (1)
I.b 0.0 (0) 0.0 (0) 0 .0 (0) 0.0 (0) 0.0 (0)
SPA 0.0 (0) 0.0 (0) 0.0 (0) 0.0 (0) 0.0 (0)
MSPA 0.0 (0) 0.0 (0) 0.0 (0) 0.0 (0) 0.0 (0)
tae 0.0 (0) 0.0 (0) 0 . 0 (0) 0.0 (0) 0.0 (0)
H.d 1..8 (1) 0.0 (0) 0.0 (0) 1..0 (1) 0 . 0 (0)
H.n 0.0 (0) 0.0 (0) 0.0 (0) 0.0 (0) 0.0 (0)
T.t 0.0 (0) 0.0 (0) 0.0 (0) 0.0 (0) 0.0 (0)
A.I 0.0 (0) 1..7 (1) 0.0 (0) 1..0 (1) 0.0 (0)

Table 13.1
Prevalences of intestinal parasites with respect to age and sex profiles in summer at Makhabane primary school. Percentage of children without any parasites = 20.0 %. Total number of children sampled = 115.
I
Makhaban Females Males <5yrs 6-l0yrs >lOyrs e
Number 38 45 who
09 48 26
complied [83]
Parasite % (num) % (num) % (num) % (num) % (num) species
G.i 2.6 (1) 0.0 (0) 0.0 (0) 0.0 (0) 3.8 (1) C. m 21. 0 (8) 20.0 (9) 0.0 (0) 22.9(11) 23.1(6) E.hi 0.0 (0) 0.0 (0) 0.0 (0) 0.0 (0) 0.0 (0) E.c 44.7(17) 60.0 (27) 55.6(5) 58.3(28) 42.3(11) E.ha 7.9 (3) 4.4 (2) 11.1(1) 4.2 (2) 7.7 (2) E.n 31.6(12) 22.2(10) 22.2(2) 25.0(12) 30.7(8) lob 5.3 (2) 0.0 (0) 0.0 (0) 2.1 (1) 3.8 (1) SPA 0.0 (0) 0.0 (0) 0.0 (0) 0.0 (0) 0.0 (0) MSPA 10.5 (4) 4.4 (2) 22.2(2) 4.2 (2) 7.7 (2) tae 0.0 (0) 0.0 (0) 0.0 (0) 0.0 (0) 0.0 (0) H.d 0.0 (0) 0.0 (0) 0.0 (0) 0.0 (0) 0.0 (0) H.n 0.0 (0) 0.0 (0) 0.0 (0) 0.0 (0) 0.0 (0) T.t 0.0 (0) 0.0 (0) 0.0 (0) 0.0 (0) 0.0 (0) A.l 2.6 (1) 4.4 (2) 11. 0 (1) 4.2 (2) 0.0 (0)
Table 13.2
Prevalences of intestinal parasites with respect to age and sex profiles in winter at Makhabane primary sc~oOl. percentage of children without any parasites = 33.0 %. Total number of children sampled = 115.
Makhaba- Females Males <5yrs 6-10yrs >10yrs ne
Number 50 56 9 62 35 who complied [106J
Parasite % (num) % (num) % (num) % (num) % (num) species
I
G.i 4.0 (2) 0.0 (0) 11.1(1) 9.7 ( 6 ) 0.0 (0)
C.m 6.0 (3) 7.1 (4) 11.1(1) 9.7 (6) 0.0 (0)
E.hi 0.0 (0) 1.8 (1) 0.0 (0) 0.0 (0) 2.8 (1)
E.c 60.0(30) 60.7(34) 55.6(5) 56.4(35) 68.6(24)
E.ha 4.0 (2) 3.6 (2) 0.0 (0) 3.2 (2) 5.7 (6)
E.n 28.0(14) 17.8(10) 11.1(1) 24.2(15) 22.8(8)
lob 0.0 (0) 0.0 (0) 0.0 (0) 0.0 (0) 0.0 (0)
SPA 0.0 (0) 0.0 (0) 0.0 (0) 0.0 (0) 0.0 (0)
MSPA 0.0 (0) 0.0 (0) 0.0 (0) 0.0 (0) 0.0 (0)
tae 0.0 (0) 0.0 (0) 0 . 0 (0) 0.0 (0) 0.0 (0)
H.d 0.0 (0) 0.0 (0) 0.0 (0) 0.0 (0) 0.0 (0)
H.n 0.0 (0) 0.0 (0) 0.0 (0) 0.0 (0) 0.0 (0)
T.t 0.0 (0) 0.0 (0) 0.0 (0) 0.0 (0) 0.0 (0)
A.I 0.0 (0) 0.0 (0) 0 . 0 (0) 0.0 (0) 0.0 (0)

Table 14.
Prevalences of intestinal parasites with respect to age and sex profiles in summer at sentinel primary school. Percentage of children without any parasites = 60.0 %. Total number of children sampled = 211.
sentinel Females Males <5yrs 6-10yrs (control)
Number who 68 81 53 96 complied
[149]
Parasite ~ (num) % (num) % (num) ~ (num) 0 0
species
G.i 7.3 (5) 2.5 (2) 1.9 (1) 3.1 ( 3 )
C.m 7.3 ( 5 ) 11.1 (9 ) 9.4 (5) 9.4 (9 )
E.hi 0.0 ( 0) 1.2 ( 1) 1.9 ( 1) 0.0 ( 0)
E.c 22.0(15) 24.5(20) 24.5(13) 22.9(22)
E.ha 0.0 ( 0) 7.3 (7) 0.0 ( 0) 7.3 (7 )
E.n 14.7 (1'0) 8;'.6 (7 ) 11. 3 (6) 11.4(11)
I.b 2.9 ( 2 ) 2.5 ( 2 ) 1.9 ( 1) 3.1 ( 3 )
SPA 0.0 ( 0) 0.0 (0 ) 0.0 ( 0) 0.0 ( 0)
MSPA 0.0 ( 0) 0.0 ( 0) 0.0 ' ( 0) 0.0 (0 )
tae 0.0 (0) 0.0 (0) 0.0 (0) 0.0 ( 0)
H.d 0.0 (0) 0.0 (0) 0.0 (0) 0.0 ( 0)
H.n 0.0 (0) 0.0 (0) 0.0 ( 0) 0.0 ( 0)
T.t 0.0 (0) 2.5 (2) 1.9 (1) 1.0 ( 1)
,A.l 2.9 ( 2 ) 1.2 (1) 0.0 (0) 3.1 ( 3 )

1.
SMALL CYSTS
Amoebae
Endolimax nana
Smooth cytoplasm 4 nucleii (dots) oval or round shape
Round in shape Granular cytoplasm 1 - 4 nucleii with central nucleolus Round-ended chromatoidal bars
2. Entamoeba hartmanni
* ~ .
• @-
3. Iodamoeba buetshlii
All shapes -very distinct glycogen vacuole unstained it is clean ; stained with iodine it is brown
Flagellates
4. Chilomastix mesnilli
APPENDIXE
MEDIUM CYSTS
Amoebae
1. Entamoeba histolytica
"pencil" outer wall round in shape 1 - 4 nucleii with central nucleolus round-ended chromatoidal bars
2. Iodomoeba buetschlii
All shapes distinct glycogen vacuole
Flagellates
3. Giardia intestinal is
~ I Axostyle
Flagellum
small cytoplasm oval shape
Pear- shaped Axostyle don middle, sometimes with curled up flagellum characteristic " nipple " 1 or 3 nucleii
central axostyle Flagellum curled up 2 - 4 nucleii usually 2" eyes "
LARGE CYSTS
Amoebae
1. Entamoeba coli
• ~ glycogen
Vary in shape Very large usually some smaller some retracted from cyst wall some almost filled with glycogen - immature
As before but as large as E.coli
2. Iodomoeba buetschlii