Embed Size (px)
Citation preview

Maldives 2016
Immunization system highlights
� There is a draft comprehensive multi-year plan (cMYP) for immunization covering 2016-2020.
� A standing national technical advisory group on immunization (NTAGI) fully functional.
� A national system to monitor adverse events following immunization (AEFI) exists.
� A national policy for health care waste management including waste from immunization activities exists.
� 100% of all vaccine costs as well as routine immunization costs financed by the government.
� All 20 Atolls have updated micro-plans that include activities to improve immunization coverage.
� All 20 Atolls have ³80% coverage for DTP-Hib-HepB3 and ³90% coverage for MCV1.
� No atoll reported more than 10% drop-out rate DTP1 to DTP3.
Source: WHO/UNICEF joint reporting form (JRF) 2015
Disclaimer: The boundaries and names shown and the designations used on all the maps do not imply the expression of any opinion whatsoever on the part of the World Health Organization concerning the legal status of any country, territory, city or area or of its authorities, or concerning the delimitation of its frontiers or boundaries.
Table 1: Basic information1 2015
1 SEAR annual EPI reporting form, 2015 and WHO, World Health Statistics 2015
EPI history � EPI launched in 1976. � Hepatitis B vaccine introduced in 1993. � MMR vaccine introduced in 2007. � Hib Pentavalent (DTP-Hib-HepB) vaccine started
at national level in 2013. � TT vaccine replaced by Td vaccine in 2015. � IPV introduced in 2015. � Type 2 component of OPV withdrawn on 18
April 2016 by switching from tOPV to bOPV.
Table 2: Immunization schedule, 2015
Source: cMYP 2009-2013 and EPI/MOH
Source: WHO/UNICEF joint reporting form (JRF) 2015
World Health Organization• SEARO/FGL/IVD • 31 August 2012World Health Organization• SEARO/FGL/IVD • 31 August 2012 Immunization andVaccine Development
South-East Asia Region
Immunization andVaccine Development
South-East Asia Region
E P I F a c t S h E E t
Figure 9: Immunity against measles: Immunity profile by age in 2015*
Figure 10: Immunity against measles: Immunity profile by age in 2016*
Figure 12: % Unimmunized confirmed (Lab and Epi linked) measles outbreak associated cases, by age, 2010–2015
* Modeled using MSP tool ver 2 based on coverage data up to 2015.
Source: SEAR annual EPI reporting form
* Modeled using MSP tool ver 2 assuming the schedule and measles containing vaccine (MCV) coverage remain unchanged and no SIAs in 2015 & 2016.
Source: SEAR annual EPI reporting form
Figure 11: Confirmed (Lab and Epi linked) measles outbreak associated cases, by age, 2010–2015
Table 8: Suspected sporadic and Outbreak associated measles and rubella cases, 2010-2015
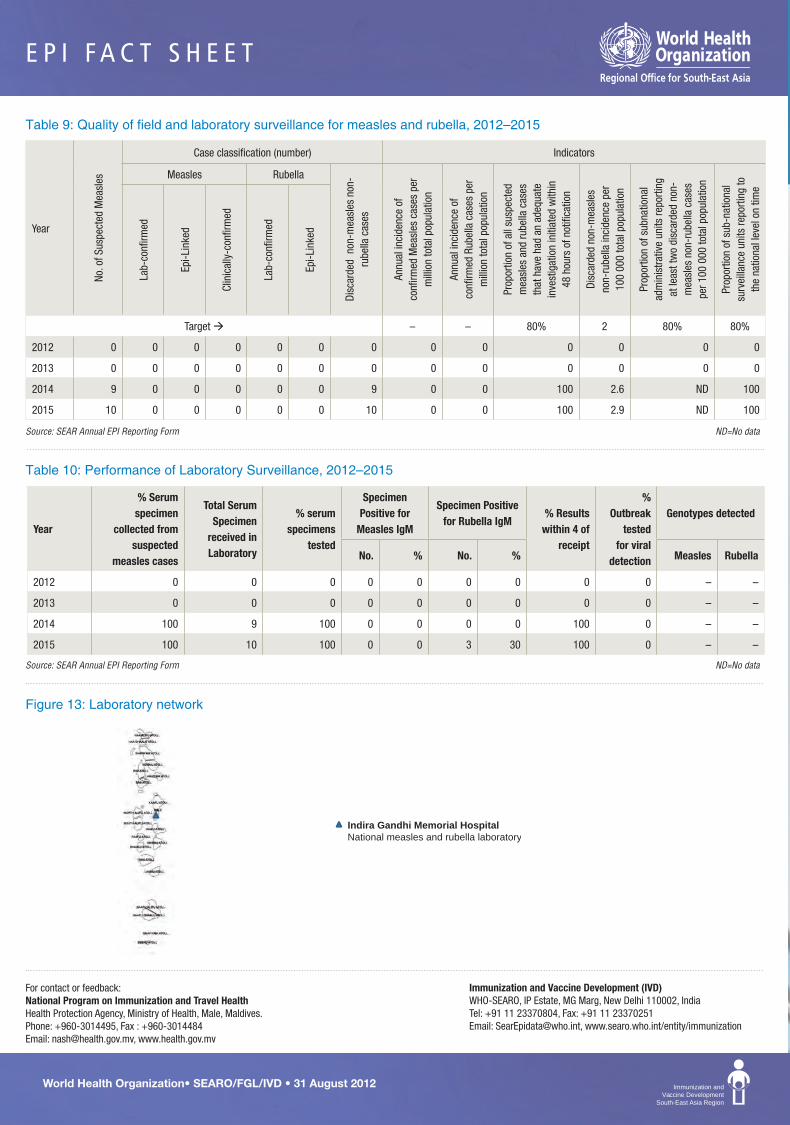
Table 9: Quality of field and laboratory surveillance for measles and rubella, 2012–2015
Table 10: Performance of Laboratory Surveillance, 2012–2015
Source: Monthly VPD Reporting to WHO/SEARO * Laboratory confirmed & epidemiologically- linked
Source: SEAR Annual EPI Reporting Form ND=No data
Source: SEAR Annual EPI Reporting Form ND=No data
For contact or feedback:National Program on Immunization and Travel HealthHealth Protection Agency, Ministry of Health, Male, Maldives. Phone: +960-3014495, Fax : +960-3014484Email: [email protected], www.health.gov.mv
Figure 13: Laboratory network
Immunization and Vaccine Development (IVD)WHO-SEARO, IP Estate, MG Marg, New Delhi 110002, IndiaTel: +91 11 23370804, Fax: +91 11 23370251Email: [email protected], www.searo.who.int/entity/immunization
Total population 347 552
Live births (LB) 7 233
Children <1 year 7 277
Children <5 years 34 447
Children <15 years 96 797
Pregnant women 7 445
Women of child bearing age (15-49 years) 102 759
Neonatal mortality rate 6.0 (per 1,000 LB)
Infant mortality rate 8.4 (per 1,000 LB)
Under-five mortality rate 9.9 (per 1,000 LB)
Maternal mortality ratio 31 (per 100,000 LB)
Division/Province/State/Region –
Atoll/District 20
City 2
Island (inhabited) 196
Total Islands 1192
Population living in urban areas 42%
Population using improved drinking-water sources
99%
Population using improved sanitation 99%
Total expenditure on health as % of GDP 11.4%
Births attended by skilled health personnel 99%
Neonates protected at birth against NT 95%
Vaccine Age of administration
BCG At birth
HepB At birth
DTP-Hib-HepB 2 months, 4 months, 6 months
OPV2 months, 4 months, 6 months and 15+years pilgrims
IPV 6 months
Measles 9 months
MMR 18 months
TdFemales 15 to 45 years, +1 month, +6 months, +1 year, +1 year
Vitamin A 9 - 59 monthsYear Routine/sporadic cases Outbreak associated cases
No. of suspected
case
No. of death
No. of lab-confirmed measles
cases
No. of lab-confirmed
rubella cases
No. of suspected outbreak
No. of Outbreak
Investigated
No. of case
No. of death
No. of measles
outbreak*
No. of confirmed measles
case*
No. of confirmed
rubella outbreak*
No. of confirmed
rubella cases*
2010 0 0 0 0 0 0 0 0 0 0 0 0
2011 0 0 0 0 0 0 0 0 0 0 0 0
2012 0 0 0 0 0 0 0 0 0 0 0 0
2013 0 0 0 0 0 0 0 0 0 0 0 0
2014 0 0 0 0 0 0 0 0 0 0 0 0
2015 11 0 0 3 0 0 0 0 0 0 0 0
Year
No. o
f Sus
pect
ed M
easl
es
Case classification (number) Indicators
Measles Rubella
Disc
arde
d n
on-m
easl
es n
on-
rube
lla c
ases
Annu
al in
cide
nce
of
confi
rmed
Mea
sles
cas
es p
er
mill
ion
tota
l pop
ulat
ion
Annu
al in
cide
nce
of
confi
rmed
Rub
ella
cas
es p
er
mill
ion
tota
l pop
ulat
ion
Prop
ortio
n of
all
susp
ecte
d m
easl
es a
nd ru
bella
cas
es
that
hav
e ha
d an
ade
quat
e in
vest
igat
ion
initi
ated
with
in
48 h
ours
of n
otifi
catio
n
Disc
arde
d no
n-m
easl
es
non-
rube
lla in
cide
nce
per
100
000
tota
l pop
ulat
ion
Prop
ortio
n of
sub
natio
nal
adm
inis
trativ
e un
its re
porti
ng
at le
ast t
wo
disc
arde
d no
n-m
easl
es n
on-r
ubel
la c
ases
pe
r 100
000
tota
l pop
ulat
ion
Prop
ortio
n of
sub
-nat
iona
l su
rvei
llanc
e un
its re
porti
ng to
th
e na
tiona
l lev
el o
n tim
e
Lab-
confi
rmed
Epi-L
inke
d
Clin
ical
ly-c
onfir
med
Lab-
confi
rmed
Epi-L
inke
d
Target – – 80% 2 80% 80%
2012 0 0 0 0 0 0 0 0 0 0 0 0 0
2013 0 0 0 0 0 0 0 0 0 0 0 0 0
2014 9 0 0 0 0 0 9 0 0 100 2.6 ND 100
2015 10 0 0 0 0 0 10 0 0 100 2.9 ND 100
Year
% Serum specimen
collected from suspected
measles cases
Total Serum Specimen
received in Laboratory
% serum specimens
tested
Specimen Positive for
Measles IgM
Specimen Positive for Rubella IgM
% Results within 4 of
receipt
% Outbreak
tested for viral
detection
Genotypes detected
No. % No. % Measles Rubella
2012 0 0 0 0 0 0 0 0 0 – –
2013 0 0 0 0 0 0 0 0 0 – –
2014 100 9 100 0 0 0 0 100 0 – –
2015 100 10 100 0 0 3 30 100 0 – –
0%10%20%30%40%50%60%70%80%90%
100%
0 1 2 3 4 5 6 7 8 9 10 11 12 13 14 15 16 17 18 19
Perce
nt of
popu
lation
Age (in years)
Susceptible Immune due to past infectionProtected by SIAs Protected by routine vaccination with 2nd doseProtected by routine vaccination with 1st dose Protected by maternal antibodies
0%10%20%30%40%50%60%70%80%90%
100%
0 1 2 3 4 5 6 7 8 9 10 11 12 13 14 15 16 17 18 19
Perce
nt of
popu
lation
Age (in years)Protected by maternal antibodies Protected by routine vaccination with 1st doseProtected by routine vaccination with 2nd dose Protected by SIAsImmune due to past infection Susceptible
1
2
3
4
5
2010 2011 2012 2013 2014 2015<1 year 1–4 years 5–9 years 10–14 years 15+ years
n=0 n=0 n=0 n=0 n=0 n=0
No Measles case / outbreak
1
2
3
4
5
2010 2011 2012 2013 2014 2015<1 year 1–4 years 5–9 years 10–14 years 15+ years
n=0 n=0 n=0 n=0 n=0 n=0(0%) (0%) (0%) (0%) (0%) (0%)
No Measles case / outbreak
Indira Gandhi Memorial Hospital National measles and rubella laboratory

E P I F a c t S h E E t
World Health Organization• SEARO/FGL/IVD • 31 August 2016 Immunization andVaccine Development
South-East Asia Region
Figure 1: National immunization coverage, 1980–2015* Figure 6: MCV1 & MCV2 coverage1 and measles cases2, 1980–2015
Figure 2: DTP3 coverage1, diphtheria and pertussis cases2, 1980–2015
Figure 7: MCV1 coverage by province, 2015
Figure 4: TT2+ coverage1 and NT cases2, 1980–2015Table 7: Districts with more than 95% MCV1 coverage
Source: WHO and UNICEF estimates of national immunization coverage, July 2016 revision 1 WHO and UNICEF estimates of national immunization coverage, July 2016 revision2 WHO vaccine-preventable diseases: monitoring system 2016
Source: SEAR annual EPI reporting form, 2015 (administrative data)
Source: WHO/UNICEF JRF
1 WHO and UNICEF estimates of national immunization coverage, July 2016 revision2 WHO vaccine-preventable diseases: monitoring system 2016
Source: SEAR annual EPI reporting form, 2015 (administrative data)
1 Country offi cial estimates, 1980–2015.2 WHO vaccine-preventable diseases: monitoring system 2016
Source: WHO/UNICEF JRF
Figure 3: DTP-Hib-HepB3 coverage, 2015Table 6: MCV supplementary immunization activities
Figure 5:Acute Flaccid Paralysis (AFP) cases 2010-2015
Table 3: OPV supplementary immunization activities (SIA)
Figure 8: Sporadic and outbreak associated measles cases* by month 2010–2015
Source: NCCPE report and WHO/UNICEF JRF
*Includes laboratory confirmed and epidemiologically linked casesSource: SEAR Monthly VPD reports
1 Number of discarded AFP cases per 100,000 children under 15 years of age. 2 Percent with 2 specimens, 24 hours apart and within 14 days of paralysis onset.3 2005 to 2007 result reported within 28 days and 2008 onwards result reported within 14 days of sample received at laboratory.
Table 5: Reported cases of vaccine preventable disease, 2006–2015
Table 4: AFP surveillance performance indicators, 2006–2015
Last laboratory-confirmed polio case due to wild polio virus (WPV) was reported in 1994.
Maldives achieved maternal neonatal tetanus (MNT) elimination status before 2000.
Indicator 2006 2007 2008 2009 2010 2011 2012 2013 2014 2015
AFP cases 1 0 0 4 4 3 4 1 1 5
Wild poliovirus confirmed cases 0 0 0 0 0 0 0 0 0 0
Compatible cases 0 0 0 0 0 0 0 0 0 0
AFP rate 1.04 0 0 4.40 4.53 3.40 4.55 1.08 1.12 5.60
Non-polio AFP rate1 1.04 0 0 4.40 4.53 3.40 4.55 1.08 1.12 5.60
Adequate stool specimen collection percentage2 100% 0% 0% 50% 50% 33% 75% 100% 100% 60%
Total stool samples collected 2 0 0 6 4 2 6 2 2 6
% NPEV isolation 0 0 0 0 0 0 0 0 0 0
% Timeliness of primary result reported3 0 0 0 100 100 0 100 100 100 0
Source: WHO/UNICEF JRF ND=No data
Year ActivityTarget population
(<5 years)Date of 1st round Date of 2nd round
1st round coverage (%)
2nd round coverage (%)
1997–98 NID 40 000 (<5 yrs) 18-Dec-97 18-Jan-98 43 40
1998–99 NID 39 000 (<5 yrs) 18-Dec-98 18-Jan-99 41 44
1999–00 NID 38 000 (<5 yrs) 18-Dec-99 18-Jan-00 47 50
2000–01 NID 37 500 (<5 yrs) 18-Dec-00 18-Jan-01 53 53
2001–02 SNID 35 000 (<5 yrs) 18-Dec-01 18-Jan-02 29 14
Year Polio Diphtheria Pertussis Neonatal Tetanus (% of all Tetanus)
Measles Rubella Mumps Japanese Encephalitis
Congenital Rubella Syndrome
2006 0 0 0 0 47 0 5 349 ND ND
2007 0 0 0 0 20 ND 341 ND ND
2008 0 0 0 0 2 ND 114 ND ND
2009 0 0 0 0 6 0 71 0 0
2010 0 0 0 0 0 0 50 0 0
2011 0 0 0 0 0 0 69 0 0
2012 0 0 0 0 0 0 14 0 0
2013 0 0 0 0 0 0 17 0 0
2014 0 0 0 0 0 0 0 0 0
2015 0 0 0 0 0 3 0 0 0
Year Vaccine, geographic coverage, target group Target Coverage Achieved
2005MR, nationwide, 6 to 25 years-males and 6 to
35 years-females144 997 82%
2006MR, nationwide, 6 to 25 years-males and 6 to
35 years-females144 997 85%
2007 MMR, nationwide, 4 to 6 years 29 529 56%
Year Number of districts %
2010 20 100
2011 20 100
2012 20 100
2013 20 100
2014 20 100
2015 20 100
0
20
40
60
80
100
0
1
2
3
4
5
6
7
8
1980 1985 1990 1995 2000 2005 2010 2011 2012 2013 2014 2015
% C
over
age
No. o
f cas
es
YearDiphtheria Cases Pertussis Cases DTP3 Coverage
0
20
40
60
80
100
0
1
2
3
4
5
1980 1985 1990 1995 2000 2005 2010 2011 2012 2013 2014 2015
% C
over
age
No. o
f cas
es
Year NT cases TT2+ Coverage
2010 = 4 cases
2011 = 3 cases
2012 = 4 cases
2013 = 1 case
2014 = 1 case
2015 = 5 cases
0
20
40
60
80
100
0
500
1000
1500
2000
2500
3000
3500
1980 1985 1990 1995 2000 2005 2010 2011 2012 2013 2014 2015
% C
over
age
No. o
f cas
es
Year
Measles Cases MCV1 Coverage MCV2 Coverage
0
2
4
6
8
10
Jan-
10Ma
r-10
May-1
0Ju
l-10
Sep-
10No
v-10
Jan-
11Ma
r-11
May-1
1Ju
l-11
Sep-
11No
v-11
Jan-
12Ma
r-12
May-1
2Ju
l-12
Sep-
12No
v-12
Jan-
13Ma
r-13
May-1
3Ju
l-13
Sep-
13No
v-13
Jan-
14Ma
r-14
May-1
4Ju
l-14
Sep-
14No
v-14
Jan-
15Ma
r-15
May-1
5Ju
l-15
Sep-
15No
v-15
No. o
f cas
es
Sporadic measles Outbreak associated measles
No Measles case / outbreak
1980 1985 1990 1995 2000 2005 2010 2011 2012 2013 2014 2015BCG 7 45 99 99 99 97 97 98 99 99 99 99DTP3 4 28 94 94 98 98 96 96 99 99 99 99OPV3 4 28 94 97 98 98 97 96 99 99 99 99MCV1 47 96 96 99 97 97 96 98 99 99 99
0
20
40
60
80
100
% C
over
age
<70% 70%–79% 80%–89% > 90%
<70% 70%–79% 80%–89% > 90

Maldives 2016
Immunization system highlights
� There is a draft comprehensive multi-year plan (cMYP) for immunization covering 2016-2020.
� A standing national technical advisory group on immunization (NTAGI) fully functional.
� A national system to monitor adverse events following immunization (AEFI) exists.
� A national policy for health care waste management including waste from immunization activities exists.
� 100% of all vaccine costs as well as routine immunization costs financed by the government.
� All 20 Atolls have updated micro-plans that include activities to improve immunization coverage.
� All 20 Atolls have ³80% coverage for DTP-Hib-HepB3 and ³90% coverage for MCV1.
� No atoll reported more than 10% drop-out rate DTP1 to DTP3.
Source: WHO/UNICEF joint reporting form (JRF) 2015
Disclaimer: The boundaries and names shown and the designations used on all the maps do not imply the expression of any opinion whatsoever on the part of the World Health Organization concerning the legal status of any country, territory, city or area or of its authorities, or concerning the delimitation of its frontiers or boundaries.
Table 1: Basic information1 2015
1 SEAR annual EPI reporting form, 2015 and WHO, World Health Statistics 2015
EPI history � EPI launched in 1976. � Hepatitis B vaccine introduced in 1993. � MMR vaccine introduced in 2007. � Hib Pentavalent (DTP-Hib-HepB) vaccine started
at national level in 2013. � TT vaccine replaced by Td vaccine in 2015. � IPV introduced in 2015. � Type 2 component of OPV withdrawn on 18
April 2016 by switching from tOPV to bOPV.
Table 2: Immunization schedule, 2015
Source: cMYP 2009-2013 and EPI/MOH
Source: WHO/UNICEF joint reporting form (JRF) 2015
World Health Organization• SEARO/FGL/IVD • 31 August 2012World Health Organization• SEARO/FGL/IVD • 31 August 2012 Immunization andVaccine Development
South-East Asia Region
Immunization andVaccine Development
South-East Asia Region
E P I F a c t S h E E t
Figure 9: Immunity against measles: Immunity profile by age in 2015*
Figure 10: Immunity against measles: Immunity profile by age in 2016*
Figure 12: % Unimmunized confirmed (Lab and Epi linked) measles outbreak associated cases, by age, 2010–2015
* Modeled using MSP tool ver 2 based on coverage data up to 2015.
Source: SEAR annual EPI reporting form
* Modeled using MSP tool ver 2 assuming the schedule and measles containing vaccine (MCV) coverage remain unchanged and no SIAs in 2015 & 2016.
Source: SEAR annual EPI reporting form
Figure 11: Confirmed (Lab and Epi linked) measles outbreak associated cases, by age, 2010–2015
Table 8: Suspected sporadic and Outbreak associated measles and rubella cases, 2010-2015
Table 9: Quality of field and laboratory surveillance for measles and rubella, 2012–2015
Table 10: Performance of Laboratory Surveillance, 2012–2015
Source: Monthly VPD Reporting to WHO/SEARO * Laboratory confirmed & epidemiologically- linked
Source: SEAR Annual EPI Reporting Form ND=No data
Source: SEAR Annual EPI Reporting Form ND=No data
For contact or feedback:National Program on Immunization and Travel HealthHealth Protection Agency, Ministry of Health, Male, Maldives. Phone: +960-3014495, Fax : +960-3014484Email: [email protected], www.health.gov.mv
Figure 13: Laboratory network
Immunization and Vaccine Development (IVD)WHO-SEARO, IP Estate, MG Marg, New Delhi 110002, IndiaTel: +91 11 23370804, Fax: +91 11 23370251Email: [email protected], www.searo.who.int/entity/immunization
Total population 347 552
Live births (LB) 7 233
Children <1 year 7 277
Children <5 years 34 447
Children <15 years 96 797
Pregnant women 7 445
Women of child bearing age (15-49 years) 102 759
Neonatal mortality rate 6.0 (per 1,000 LB)
Infant mortality rate 8.4 (per 1,000 LB)
Under-five mortality rate 9.9 (per 1,000 LB)
Maternal mortality ratio 31 (per 100,000 LB)
Division/Province/State/Region –
Atoll/District 20
City 2
Island (inhabited) 196
Total Islands 1192
Population living in urban areas 42%
Population using improved drinking-water sources
99%
Population using improved sanitation 99%
Total expenditure on health as % of GDP 11.4%
Births attended by skilled health personnel 99%
Neonates protected at birth against NT 95%
Vaccine Age of administration
BCG At birth
HepB At birth
DTP-Hib-HepB 2 months, 4 months, 6 months
OPV2 months, 4 months, 6 months and 15+years pilgrims
IPV 6 months
Measles 9 months
MMR 18 months
TdFemales 15 to 45 years, +1 month, +6 months, +1 year, +1 year
Vitamin A 9 - 59 monthsYear Routine/sporadic cases Outbreak associated cases
No. of suspected
case
No. of death
No. of lab-confirmed measles
cases
No. of lab-confirmed
rubella cases
No. of suspected outbreak
No. of Outbreak
Investigated
No. of case
No. of death
No. of measles
outbreak*
No. of confirmed measles
case*
No. of confirmed
rubella outbreak*
No. of confirmed
rubella cases*
2010 0 0 0 0 0 0 0 0 0 0 0 0
2011 0 0 0 0 0 0 0 0 0 0 0 0
2012 0 0 0 0 0 0 0 0 0 0 0 0
2013 0 0 0 0 0 0 0 0 0 0 0 0
2014 0 0 0 0 0 0 0 0 0 0 0 0
2015 11 0 0 3 0 0 0 0 0 0 0 0
Year
No. o
f Sus
pect
ed M
easl
es
Case classification (number) Indicators
Measles Rubella
Disc
arde
d n
on-m
easl
es n
on-
rube
lla c
ases
Annu
al in
cide
nce
of
confi
rmed
Mea
sles
cas
es p
er
mill
ion
tota
l pop
ulat
ion
Annu
al in
cide
nce
of
confi
rmed
Rub
ella
cas
es p
er
mill
ion
tota
l pop
ulat
ion
Prop
ortio
n of
all
susp
ecte
d m
easl
es a
nd ru
bella
cas
es
that
hav
e ha
d an
ade
quat
e in
vest
igat
ion
initi
ated
with
in
48 h
ours
of n
otifi
catio
n
Disc
arde
d no
n-m
easl
es
non-
rube
lla in
cide
nce
per
100
000
tota
l pop
ulat
ion
Prop
ortio
n of
sub
natio
nal
adm
inis
trativ
e un
its re
porti
ng
at le
ast t
wo
disc
arde
d no
n-m
easl
es n
on-r
ubel
la c
ases
pe
r 100
000
tota
l pop
ulat
ion
Prop
ortio
n of
sub
-nat
iona
l su
rvei
llanc
e un
its re
porti
ng to
th
e na
tiona
l lev
el o
n tim
e
Lab-
confi
rmed
Epi-L
inke
d
Clin
ical
ly-c
onfir
med
Lab-
confi
rmed
Epi-L
inke
d
Target – – 80% 2 80% 80%
2012 0 0 0 0 0 0 0 0 0 0 0 0 0
2013 0 0 0 0 0 0 0 0 0 0 0 0 0
2014 9 0 0 0 0 0 9 0 0 100 2.6 ND 100
2015 10 0 0 0 0 0 10 0 0 100 2.9 ND 100
Year
% Serum specimen
collected from suspected
measles cases
Total Serum Specimen
received in Laboratory
% serum specimens
tested
Specimen Positive for
Measles IgM
Specimen Positive for Rubella IgM
% Results within 4 of
receipt
% Outbreak
tested for viral
detection
Genotypes detected
No. % No. % Measles Rubella
2012 0 0 0 0 0 0 0 0 0 – –
2013 0 0 0 0 0 0 0 0 0 – –
2014 100 9 100 0 0 0 0 100 0 – –
2015 100 10 100 0 0 3 30 100 0 – –
0%10%20%30%40%50%60%70%80%90%
100%
0 1 2 3 4 5 6 7 8 9 10 11 12 13 14 15 16 17 18 19
Perce
nt of
popu
lation
Age (in years)
Susceptible Immune due to past infectionProtected by SIAs Protected by routine vaccination with 2nd doseProtected by routine vaccination with 1st dose Protected by maternal antibodies
0%10%20%30%40%50%60%70%80%90%
100%
0 1 2 3 4 5 6 7 8 9 10 11 12 13 14 15 16 17 18 19
Perce
nt of
popu
lation
Age (in years)Protected by maternal antibodies Protected by routine vaccination with 1st doseProtected by routine vaccination with 2nd dose Protected by SIAsImmune due to past infection Susceptible
1
2
3
4
5
2010 2011 2012 2013 2014 2015<1 year 1–4 years 5–9 years 10–14 years 15+ years
n=0 n=0 n=0 n=0 n=0 n=0
No Measles case / outbreak
1
2
3
4
5
2010 2011 2012 2013 2014 2015<1 year 1–4 years 5–9 years 10–14 years 15+ years
n=0 n=0 n=0 n=0 n=0 n=0(0%) (0%) (0%) (0%) (0%) (0%)
No Measles case / outbreak
Indira Gandhi Memorial Hospital National measles and rubella laboratory