Embed Size (px)
Citation preview
EPFL – BIOPAdvanced Image Processing, MATLAB
20-22.04.2015O. Burri, R. Guiet, A. Seitz
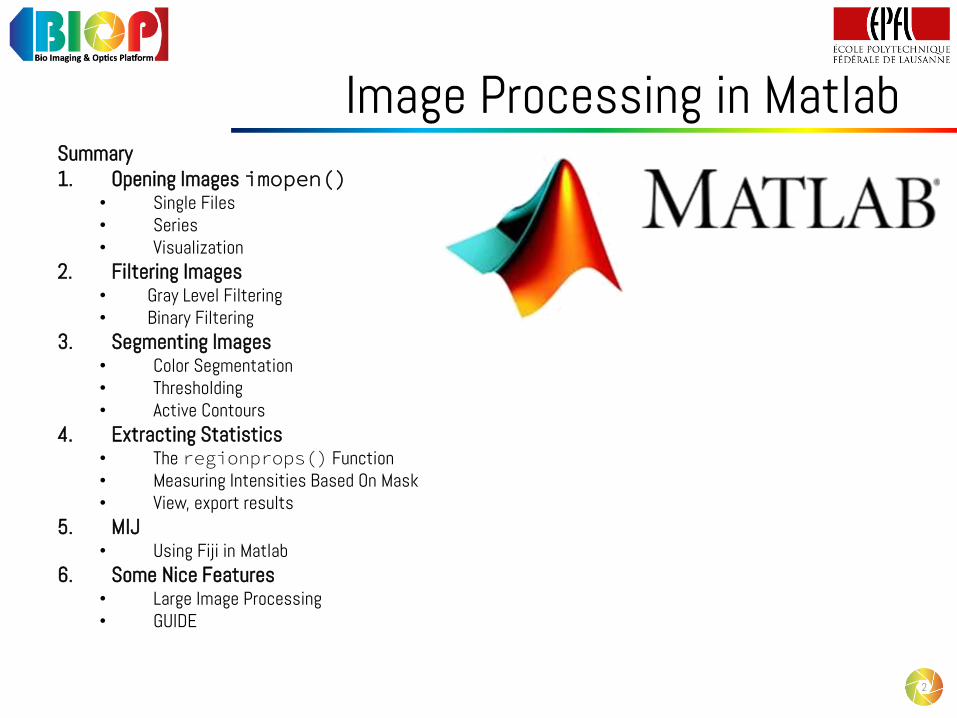
Image Processing in MatlabSummary1. Opening Images imopen()
• Single Files• Series• Visualization
2. Filtering Images• Gray Level Filtering• Binary Filtering
3. Segmenting Images• Color Segmentation• Thresholding• Active Contours
4. Extracting Statistics• The regionprops() Function• Measuring Intensities Based On Mask• View, export results
5. MIJ• Using Fiji in Matlab
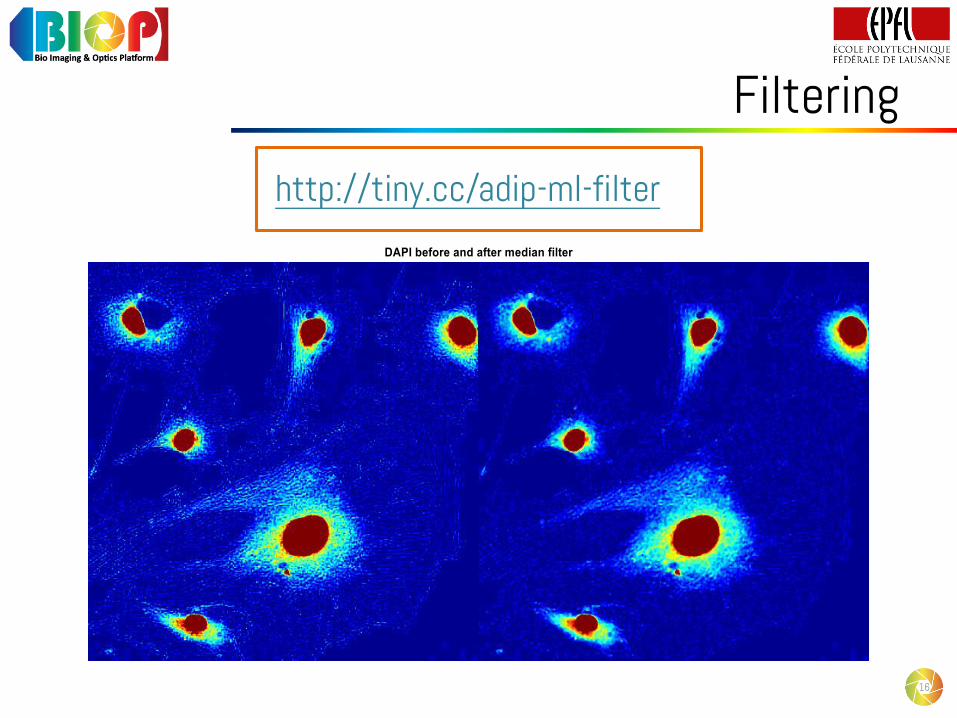
6. Some Nice Features• Large Image Processing• GUIDE
2
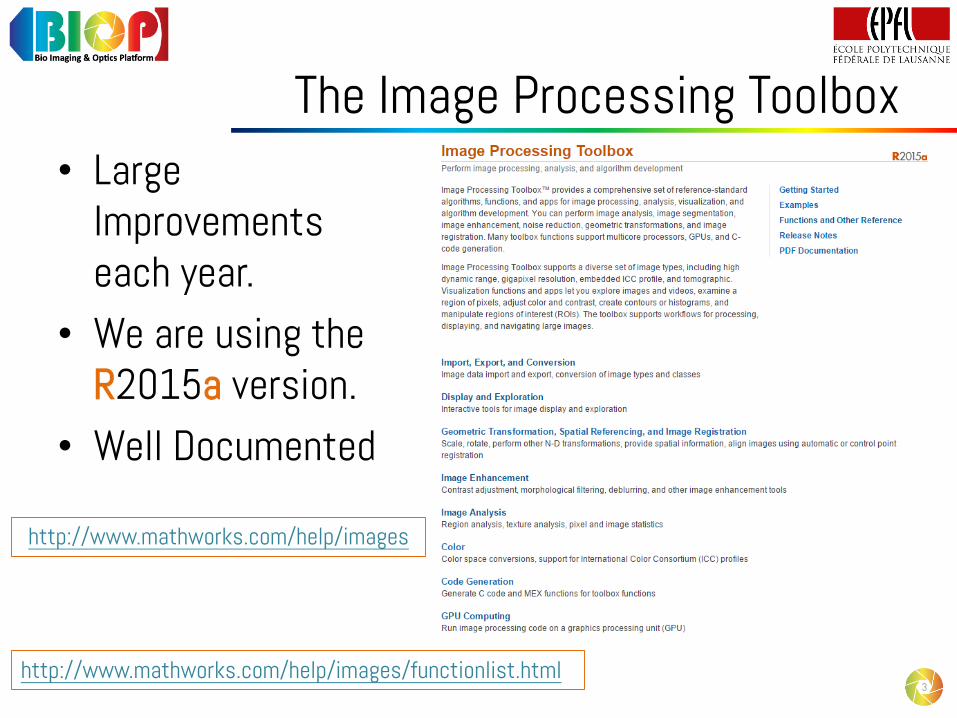
The Image Processing Toolbox• Large
Improvements each year.
• We are using the R2015a version.
• Well Documented
3
http://www.mathworks.com/help/images
http://www.mathworks.com/help/images/functionlist.html
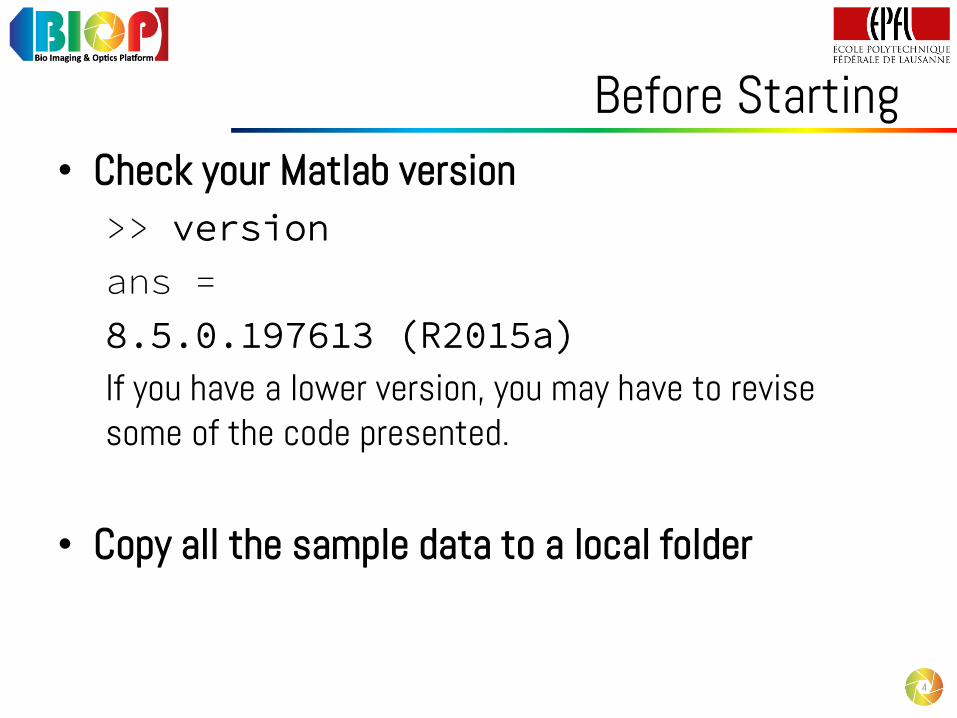
Before Starting• Check your Matlab version
>> version
ans =
8.5.0.197613 (R2015a)
If you have a lower version, you may have to revise some of the code presented.
• Copy all the sample data to a local folder
4
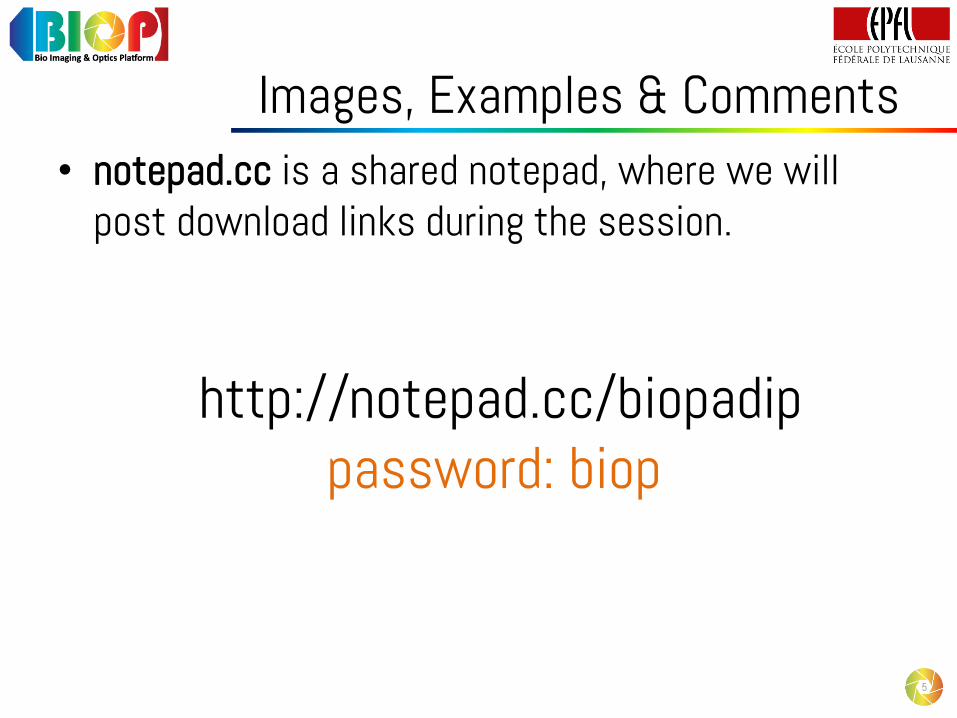
Images, Examples & Comments• notepad.cc is a shared notepad, where we will
post download links during the session.
5
http://notepad.cc/biopadippassword: biop
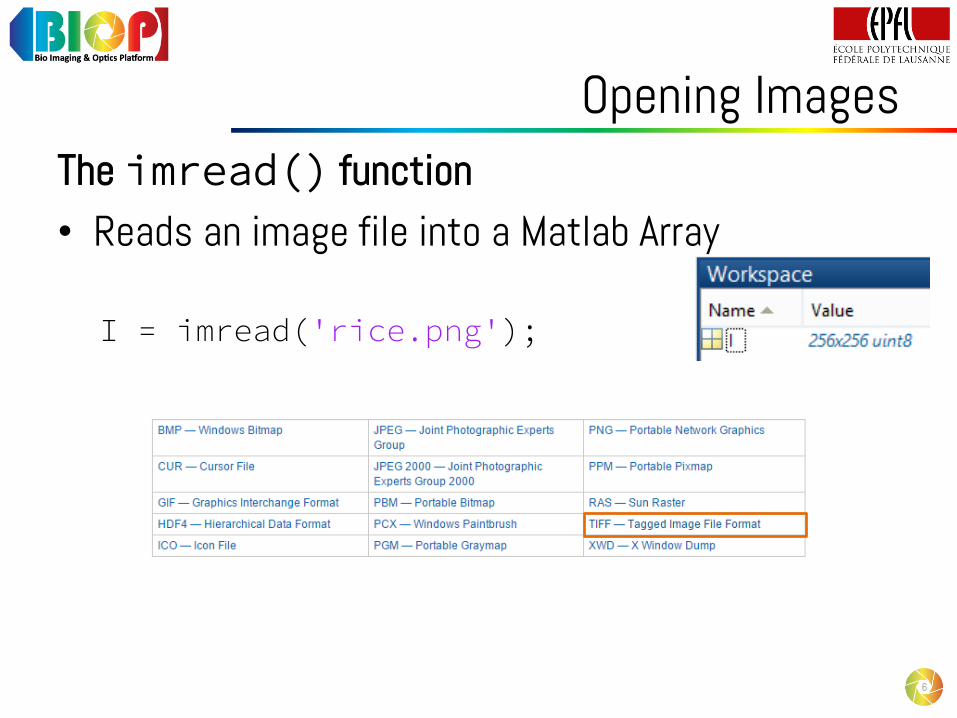
Opening ImagesThe imread() function • Reads an image file into a Matlab Array
I = imread('rice.png');
6
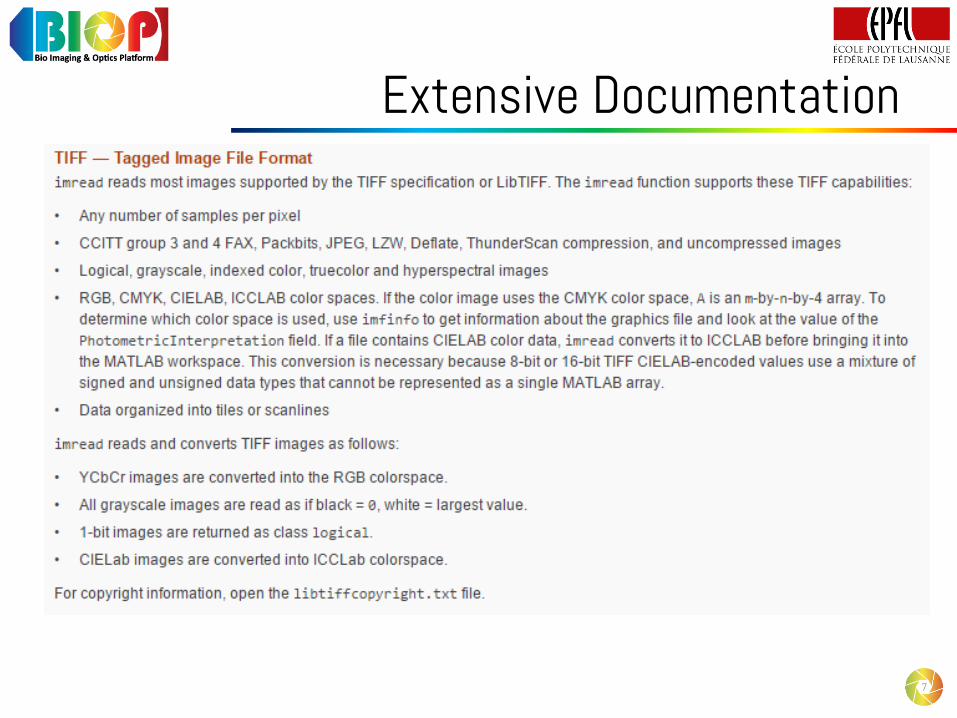
Extensive Documentation
7
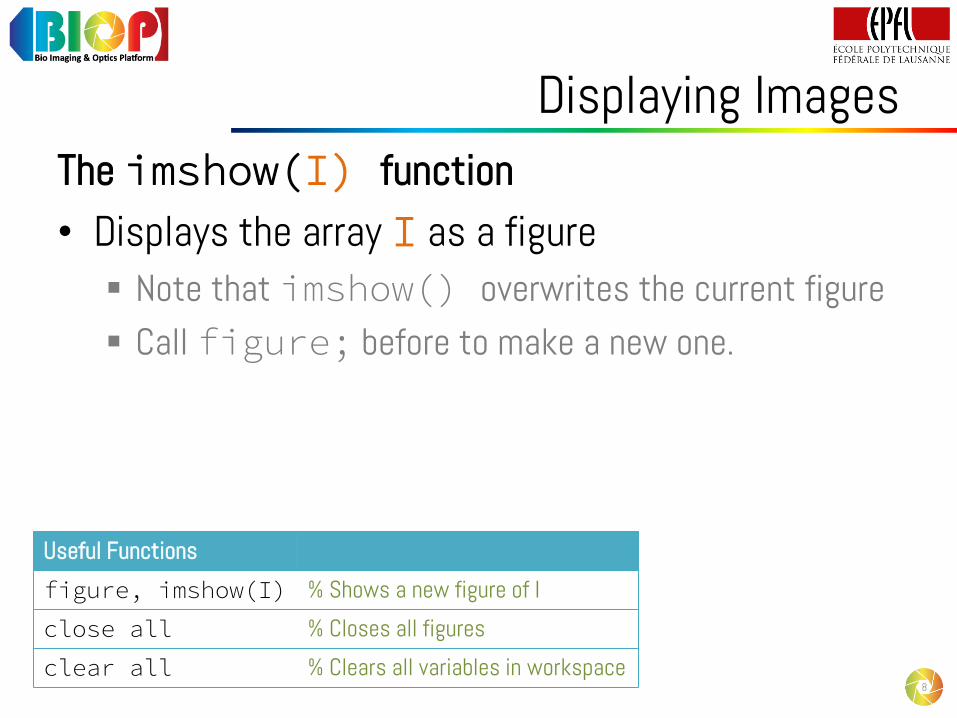
Displaying ImagesThe imshow(I) function • Displays the array I as a figure
Note that imshow() overwrites the current figure Call figure; before to make a new one.
8
Useful Functions
figure, imshow(I) % Shows a new figure of I
close all % Closes all figures
clear all % Clears all variables in workspace
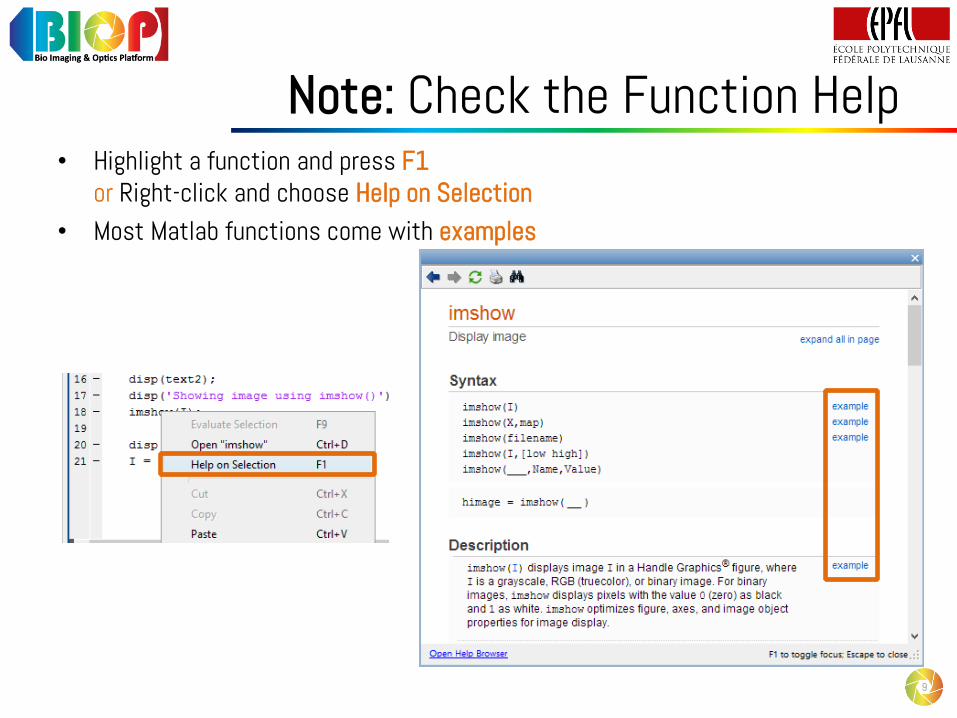
Note: Check the Function Help• Highlight a function and press F1
or Right-click and choose Help on Selection• Most Matlab functions come with examples
9
Displaying ImagesThe imshow(I) function
10
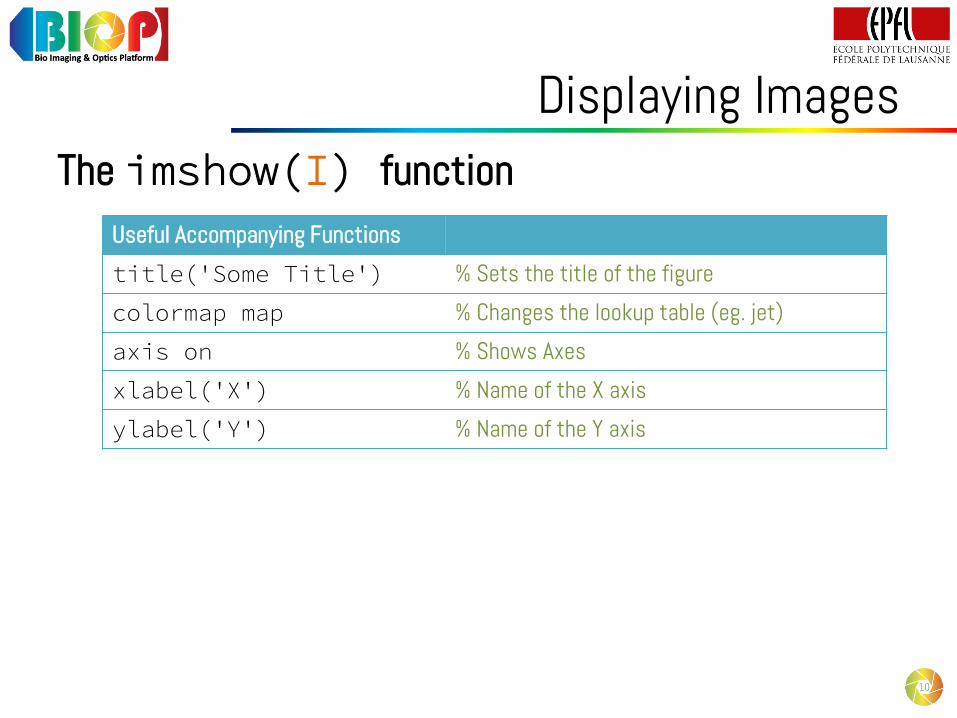
Useful Accompanying Functions
title('Some Title') % Sets the title of the figure
colormap map % Changes the lookup table (eg. jet)
axis on % Shows Axes
xlabel('X') % Name of the X axis
ylabel('Y') % Name of the Y axis
Displaying ImagesThe imshow(I) function
11
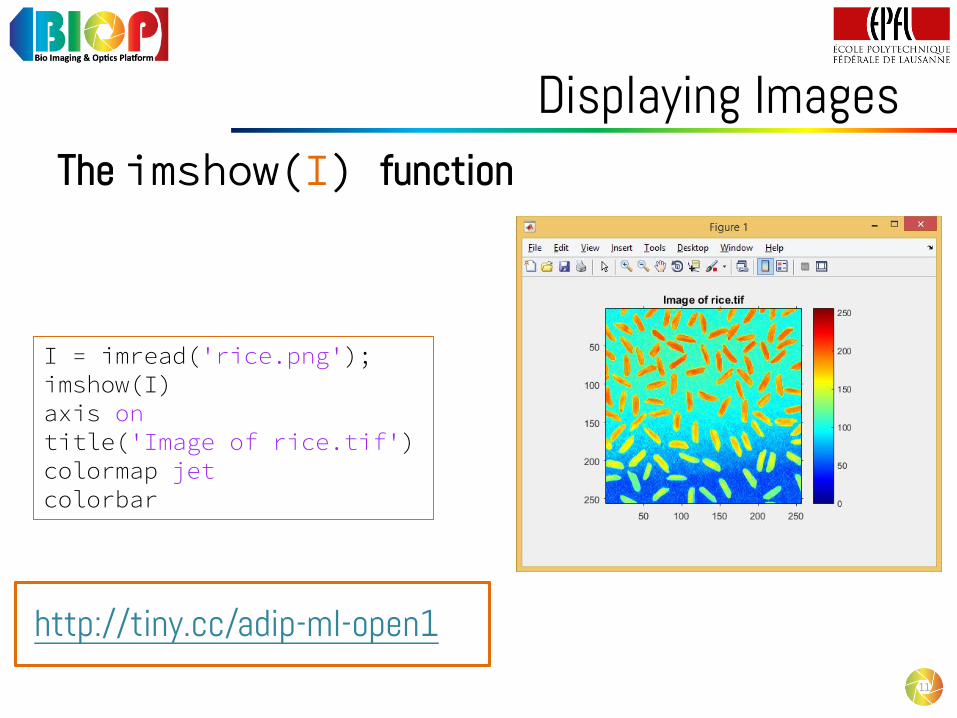
I = imread('rice.png');imshow(I)axis ontitle('Image of rice.tif')colormap jetcolorbar
http://tiny.cc/adip-ml-open1
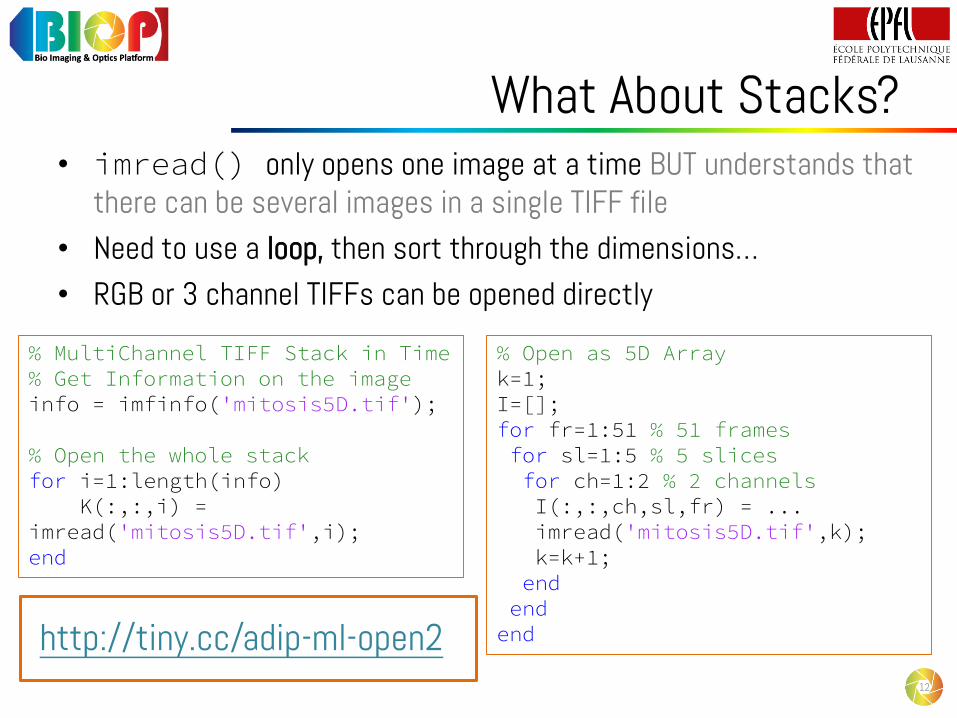
What About Stacks?• imread() only opens one image at a time BUT understands that
there can be several images in a single TIFF file• Need to use a loop, then sort through the dimensions…• RGB or 3 channel TIFFs can be opened directly
12
% MultiChannel TIFF Stack in Time% Get Information on the imageinfo = imfinfo('mitosis5D.tif');
% Open the whole stackfor i=1:length(info)
K(:,:,i) = imread('mitosis5D.tif',i);end
% Open as 5D Array k=1;I=[];for fr=1:51 % 51 framesfor sl=1:5 % 5 slicesfor ch=1:2 % 2 channelsI(:,:,ch,sl,fr) = ...imread('mitosis5D.tif',k);k=k+1;
endend
endhttp://tiny.cc/adip-ml-open2
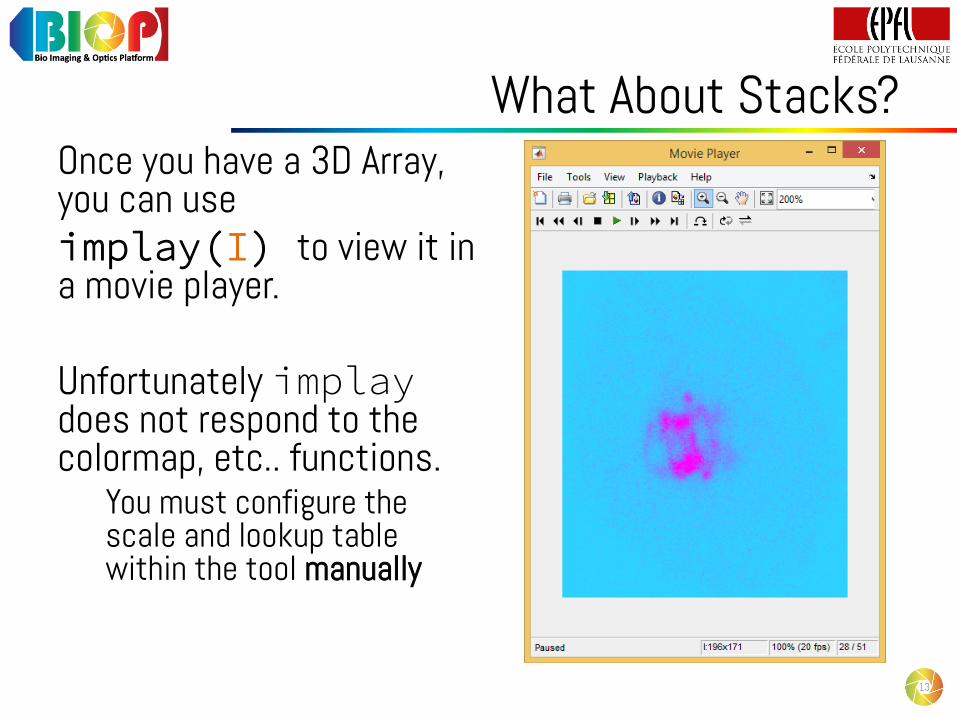
What About Stacks?Once you have a 3D Array, you can useimplay(I) to view it in a movie player.
Unfortunately implaydoes not respond to the colormap, etc.. functions.
You must configure the scale and lookup table within the tool manually
13
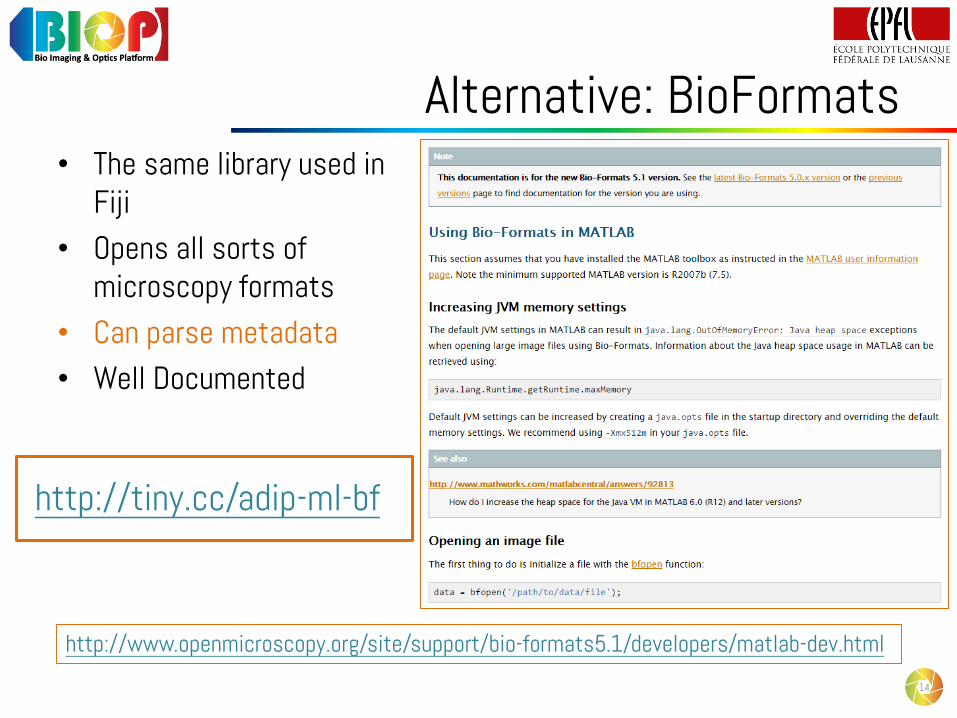
Alternative: BioFormats• The same library used in
Fiji• Opens all sorts of
microscopy formats• Can parse metadata• Well Documented
14
http://www.openmicroscopy.org/site/support/bio-formats5.1/developers/matlab-dev.html
http://tiny.cc/adip-ml-bf
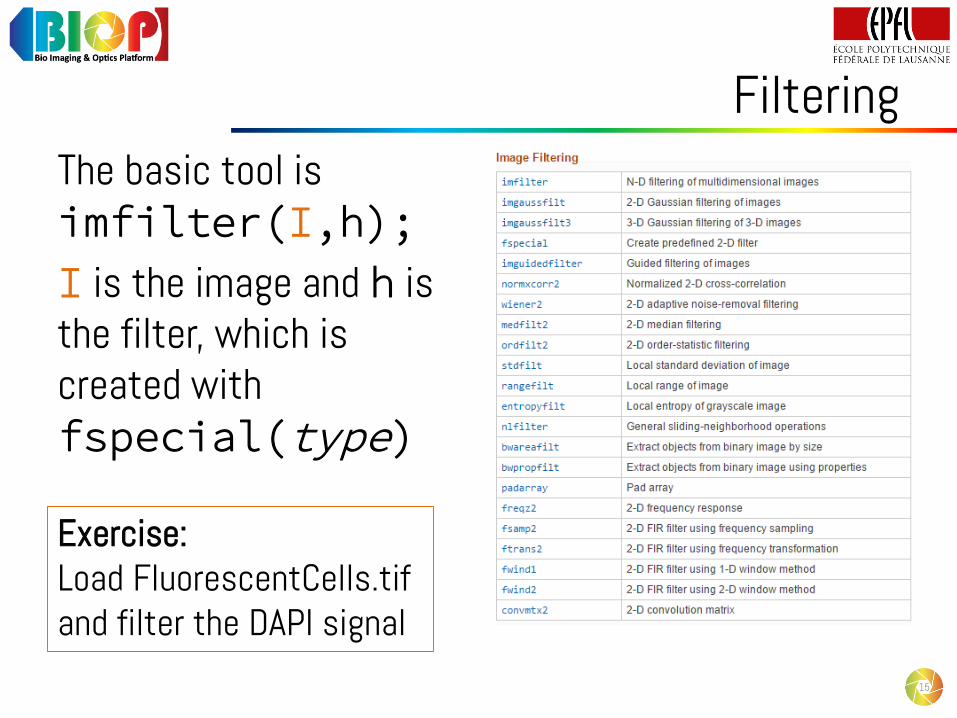
FilteringThe basic tool is imfilter(I,h);
I is the image and h is the filter, which is created with fspecial(type)
15
Exercise:Load FluorescentCells.tifand filter the DAPI signal
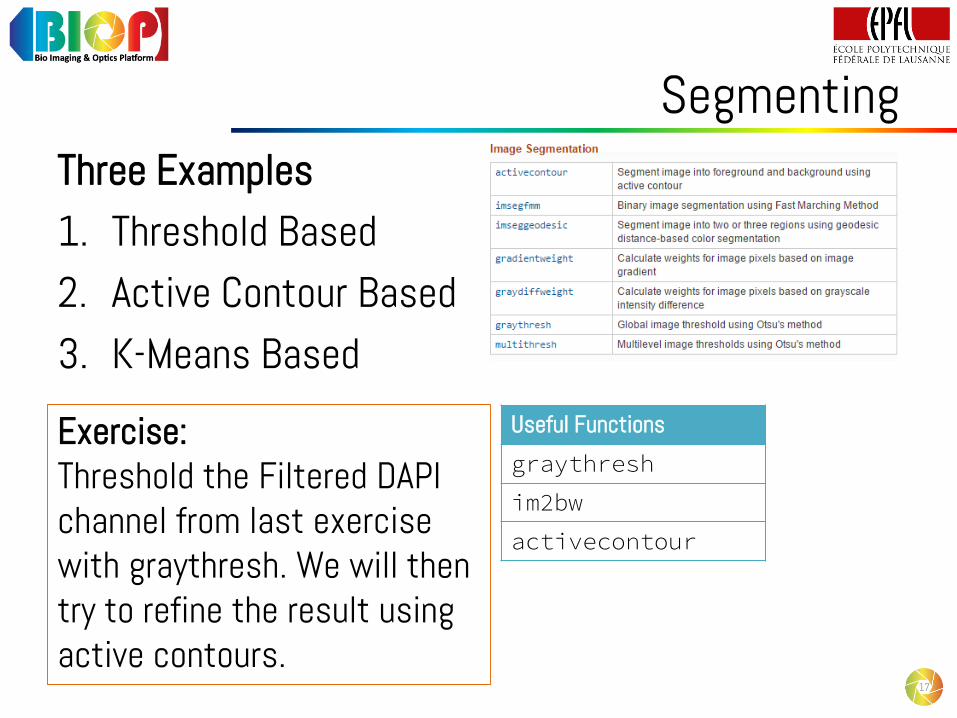
SegmentingThree Examples1. Threshold Based2. Active Contour Based3. K-Means Based
17
Exercise:Threshold the Filtered DAPI channel from last exercise with graythresh. We will then try to refine the result using active contours.
Useful Functions
graythresh
im2bw
activecontour
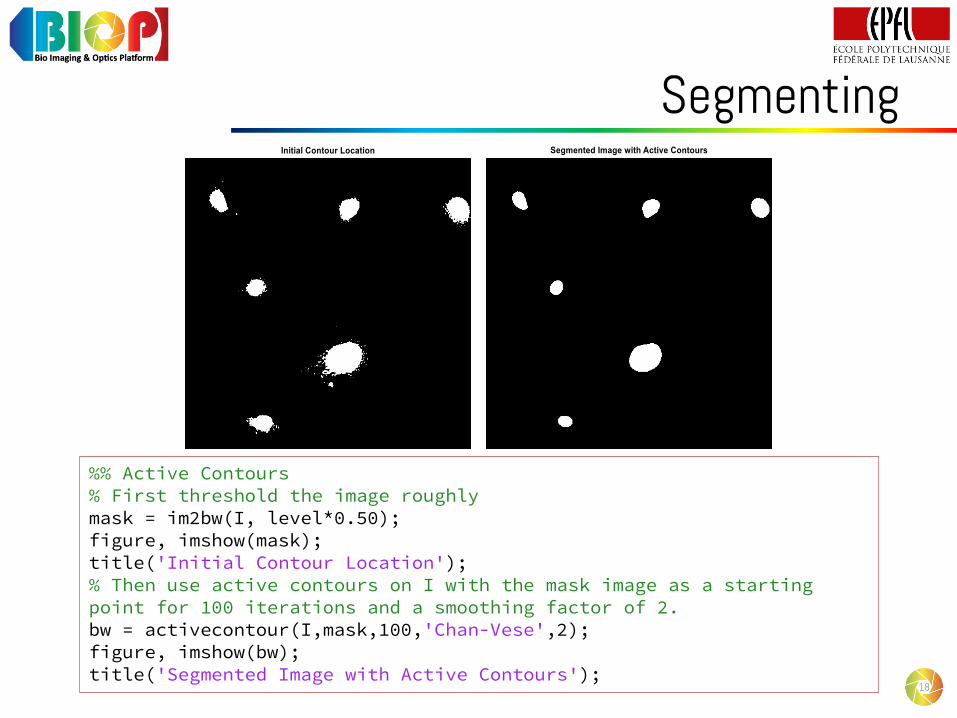
Segmenting
18
%% Active Contours% First threshold the image roughlymask = im2bw(I, level*0.50);figure, imshow(mask);title('Initial Contour Location');% Then use active contours on I with the mask image as a starting point for 100 iterations and a smoothing factor of 2.bw = activecontour(I,mask,100,'Chan-Vese',2);figure, imshow(bw);title('Segmented Image with Active Contours');
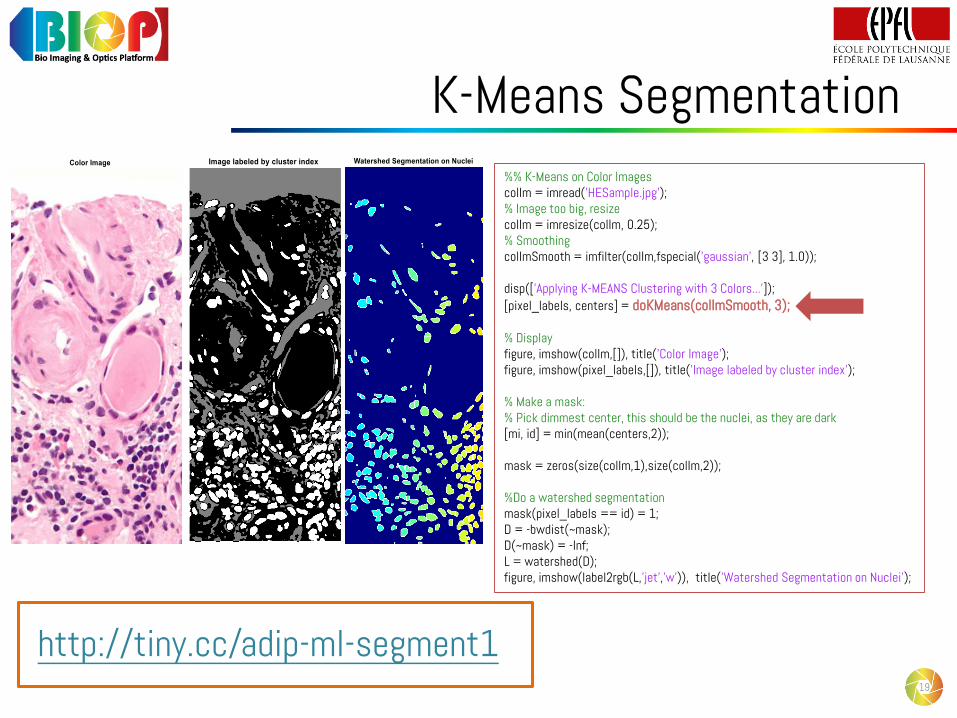
K-Means Segmentation
19
%% K-Means on Color ImagescolIm = imread('HESample.jpg');% Image too big, resizecolIm = imresize(colIm, 0.25);% SmoothingcolImSmooth = imfilter(colIm,fspecial('gaussian', [3 3], 1.0));
disp(['Applying K-MEANS Clustering with 3 Colors...']);[pixel_labels, centers] = doKMeans(colImSmooth, 3);
% Displayfigure, imshow(colIm,[]), title('Color Image');figure, imshow(pixel_labels,[]), title('Image labeled by cluster index');
% Make a mask:% Pick dimmest center, this should be the nuclei, as they are dark[mi, id] = min(mean(centers,2));
mask = zeros(size(colIm,1),size(colIm,2));
%Do a watershed segmentationmask(pixel_labels == id) = 1;D = -bwdist(~mask);D(~mask) = -Inf;L = watershed(D);figure, imshow(label2rgb(L,'jet','w')), title('Watershed Segmentation on Nuclei');
http://tiny.cc/adip-ml-segment1
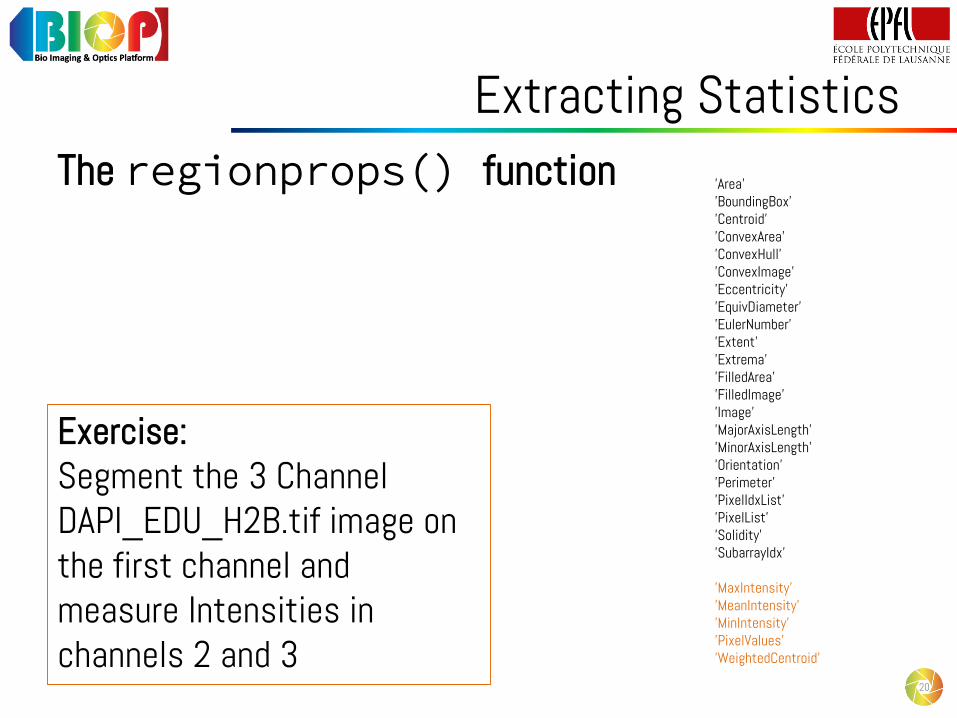
Extracting StatisticsThe regionprops() function
20
'Area''BoundingBox''Centroid''ConvexArea''ConvexHull''ConvexImage''Eccentricity''EquivDiameter''EulerNumber''Extent''Extrema''FilledArea''FilledImage''Image''MajorAxisLength''MinorAxisLength''Orientation''Perimeter''PixelIdxList''PixelList''Solidity''SubarrayIdx'
'MaxIntensity''MeanIntensity''MinIntensity''PixelValues''WeightedCentroid'
Exercise:Segment the 3 Channel DAPI_EDU_H2B.tif image on the first channel and measure Intensities in channels 2 and 3
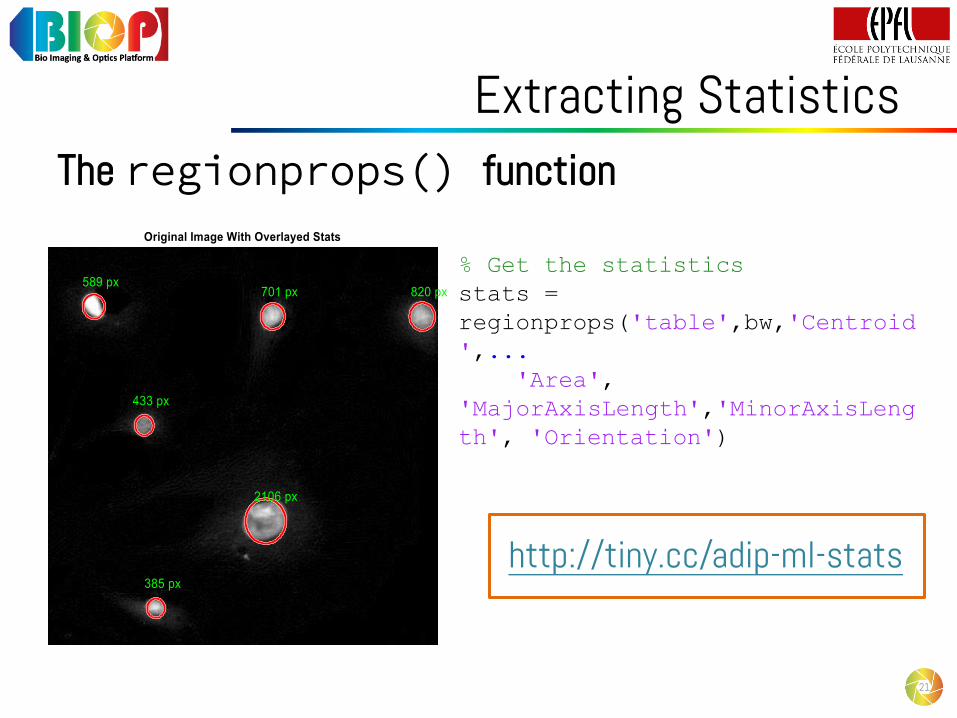
Extracting StatisticsThe regionprops() function
21
% Get the statistics
stats =
regionprops('table',bw,'Centroid
',...
'Area',
'MajorAxisLength','MinorAxisLeng
th', 'Orientation')
http://tiny.cc/adip-ml-stats
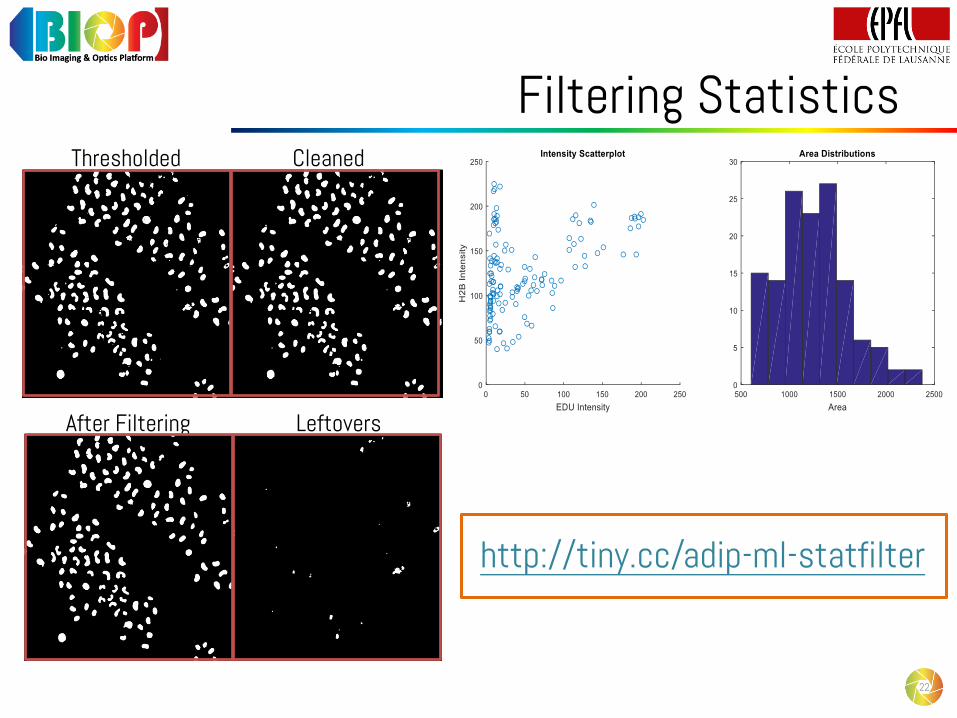
Filtering Statistics
22
Thresholded
After Filtering
Cleaned
Leftovers
http://tiny.cc/adip-ml-statfilter
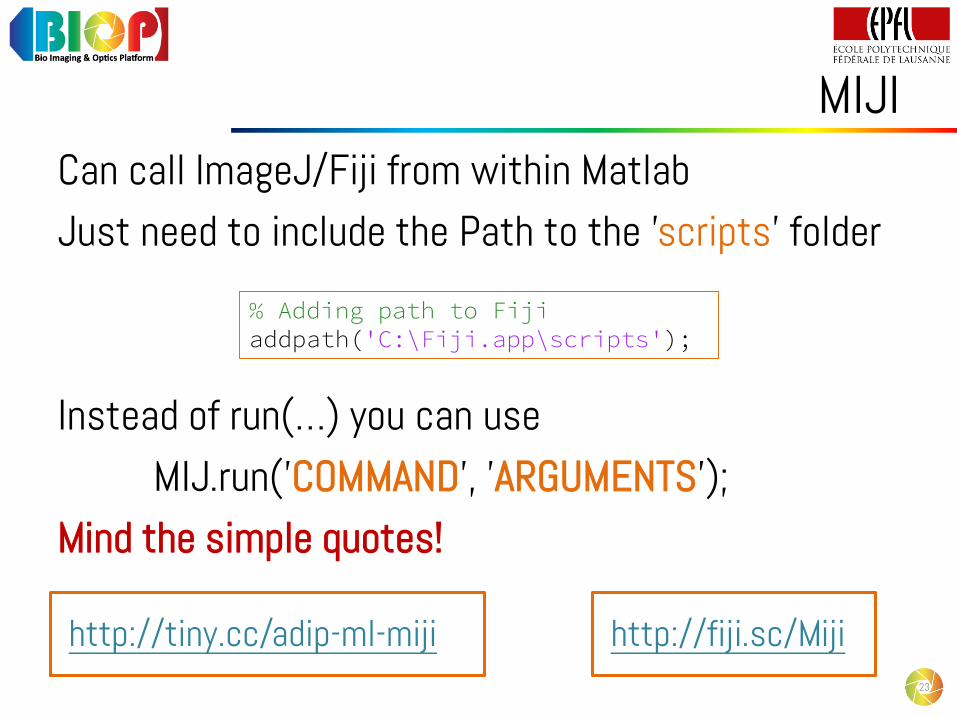
MIJICan call ImageJ/Fiji from within MatlabJust need to include the Path to the 'scripts' folder
Instead of run(…) you can useMIJ.run('COMMAND', 'ARGUMENTS');
Mind the simple quotes!
23
http://fiji.sc/Miji
% Adding path to Fijiaddpath('C:\Fiji.app\scripts');
http://tiny.cc/adip-ml-miji
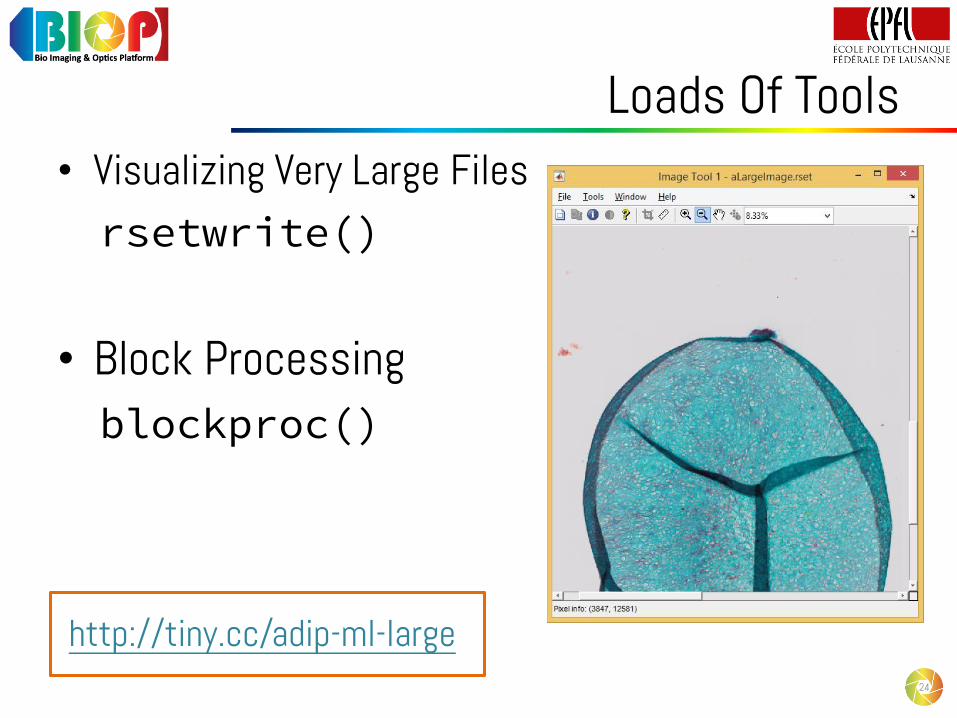
Loads Of Tools• Visualizing Very Large Filesrsetwrite()
• Block Processingblockproc()
24
http://tiny.cc/adip-ml-large
Finished• Thank you for your time.
26