Embed Size (px)
Citation preview

1 | P a g e
EPC-15-085: May to July 2020 Measurement and Verification Report
City of San Diego Public Library ZNE Demonstration Project Quarter 1: May – July 2020 Prepared for California Energy Commission Prepared by Center for Sustainable Energy
Office Locations San Diego, CA Los Angeles, CA Oakland, CA Boston, MA September 2020

2 | P a g e
© 2020 Center for Sustainable Energy
Disclaimer: The Center for Sustainable Energy® (CSE) has made every attempt to ensure the accuracy and reliability of information provided in this report. However, the content is presented “as is” without warranty of any kind. CSE does not accept any responsibility or liability for accuracy, completeness, legality or reliability to the information contained herein. No promises and/or representations of any kind, expressed or implied, are given as to the nature or standard of the information provided nor to the suitability of the information to your circumstances. Center for Sustainable Energy, CSE and CSE logo are registered trademarks of the Center for Sustainable Energy.
CSE Headquarters Center for Sustainable Energy 3980 Sherman Street, Suite 170 San Diego, CA 92110 858-244-1177 EnergyCenter.org
CSE Offices Los Angeles, CA • Oakland, CA • Sacramento, CA • Boston, MA • Brooklyn, NY • Stony Brook, NY
3 | P a g e
Contents I. Introduction ......................................................................................................................................... 6
Project Background ........................................................................................................................ 6
Purpose of Measurement and Verification .................................................................................... 6
II. Facility Descriptions and Operations ................................................................................................... 7
Point Loma/Hervey Library Description ......................................................................................... 7
Serra Mesa-Kearny Mesa Library Description ................................................................................ 7
Valencia Park/Malcolm X Library Description ................................................................................ 8
Typical Operations Prior to COVID-19 ............................................................................................ 8
Operations During COVID-19 ......................................................................................................... 9
III. Q1 Energy Performance Assessment ................................................................................................ 10
Baseline M&V Data ........................................................................................................................... 10
Q1 Energy Performance Data ............................................................................................................ 10
Point Loma/Hervey Library Energy Baseline (2017) ..................................................................... 11
Point Loma/Hervey Q1 Electric Profile (2020) ............................................................................. 12
Serra Mesa-Kearny Mesa Library Energy Baseline (2017) ........................................................... 14
Serra Mesa-Kearny Mesa Q1 Electric Profile (2020) .................................................................... 15
Valencia Park/Malcolm X Library Baseline Energy (2017) ........................................................... 16
Valencia Park/Malcolm X Q1 Electric Profile (2020) .................................................................... 17
Library Natural Gas Profiles .......................................................................................................... 19
Solar PV Production Baseline (2017) ............................................................................................ 20
Solar PV Production Q1 Energy Profile ......................................................................................... 21
ZNE Valuation .................................................................................................................................... 22
Baseline Energy Comparison ............................................................................................................. 24
Conclusion ......................................................................................................................................... 28
Appendices ................................................................................................................................................ 29
Appendix A: Point Loma/Hervey (Daily and Weekly End-Use Consumption) ................................... 29
Appendix B: Serra Mesa-Kearny Mesa (Daily and Weekly End-Use Consumption) .......................... 36
Appendix C: Valencia Park/Malcolm X (Daily and Weekly End-Use Consumption) .......................... 43

4 | P a g e
Tables Table 1: Point Loma/Hervey Estimated ECM Savings ................................................................................. 7
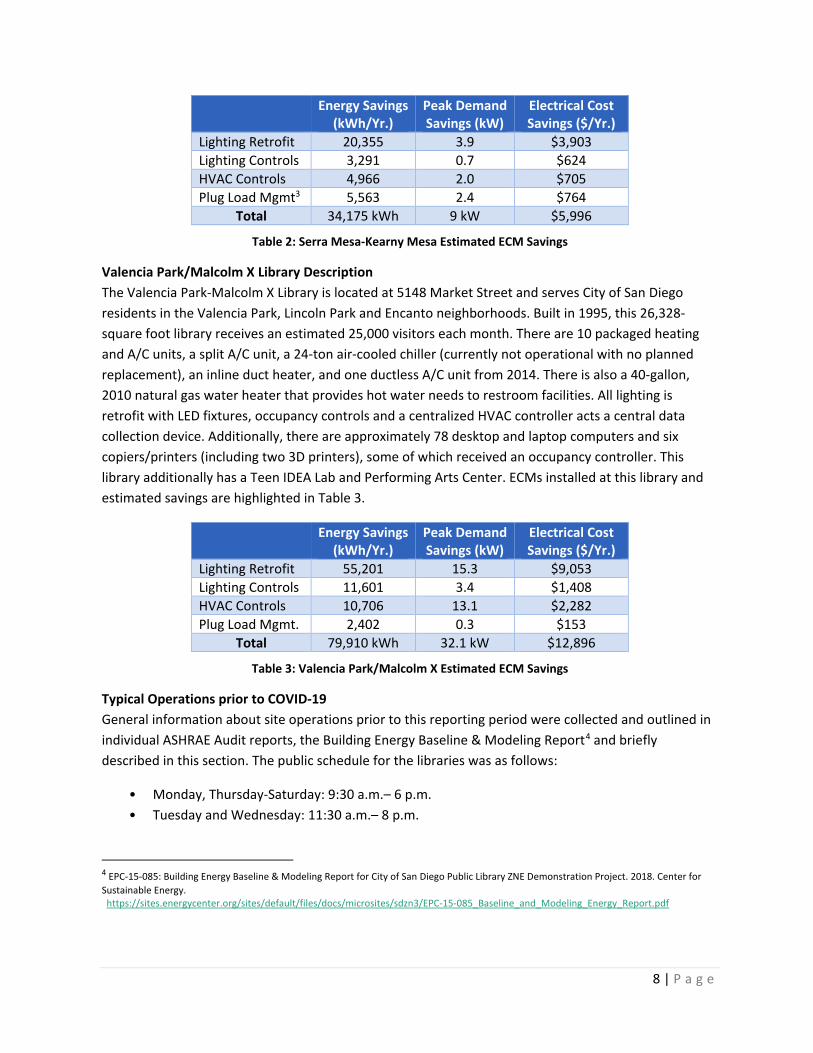
Table 2: Serra Mesa-Kearny Mesa Estimated ECM Savings ........................................................................ 8
Table 3: Valencia Park/Malcolm X Estimate ECM Savings .......................................................................... 8
Table 4: Q1 Electric End-Use Breakout at Point Loma/Hervey including % .............................................. 14
Table 5: Q1 Electric End-Use Breakout at Serra Mesa-Kearny Mesa including % ..................................... 16
Table 6: Q1 Electric End-Use Breakout at Valencia Park/Malcolm X including % ..................................... 19
Table 7: PV System Technical and Performance Details ........................................................................... 20
Table 8: Q1 Monthly % Gross Site Consumption Offset by PV.................................................................. 22
Table 9: Q1 Monthly Btu and TDV Values ................................................................................................. 23
Table 10: Q1 TDV Energy Use Intensity (EUI) Valuation............................................................................ 24
Figures Figure 1: Q1 Monthly Gross Site Electric Consumption and PV Production (May-July 2020) .................. 11
Figure 2: Baseline Energy Consumption at Point Loma/Hervey (2017) .................................................... 12
Figure 3: Baseline Electric End-Use Breakout at Point Loma/Hervey ....................................................... 12
Figure 4: Q1 Monthly Electric End-Use Breakout at Point Loma/Hervey (May-July 2020) ....................... 13
Figure 5: Q1 Electric End-Use Breakout at Point Loma/Hervey ................................................................ 13
Figure 6: Baseline Energy Consumption at Serra Mesa-Kearny Mesa (2017) ........................................... 14
Figure 7: Baseline Electric End-Use Breakout at Serra Mesa-Kearny Mesa .............................................. 15
Figure 8: Q1 Monthly Electric End-Use Breakout at Serra Mesa-Kearny Mesa (May-July 2020) ............. 15
Figure 9: Q1 Electric End-Use Breakout at Serra Mesa-Kearny Mesa ....................................................... 16
Figure 10: Baseline Energy Consumption at Valenica Park/Malcolm X (2017) ......................................... 17
Figure 11: Baseline Electric End-Use Breakout at Valenica Park/Malcolm X ............................................ 17
Figure 12: Q1 Monthly Electric End-Use Breakout at Valenica Park/Malcolm X (May-July 2020) ........... 18
Figure 13: Q1 Electric End-Use Breakout at Valenica Park/Malcolm X ..................................................... 18
Figure 14: Q1 Monthly Natural Gas Consumption .................................................................................... 19
Figure 15: PV Production (Nov 2017-Dec 2018) ........................................................................................ 21
5 | P a g e
Figure 16: Q1 Monthly PV Production ...................................................................................................... 22
Figure 17: Electric Use Comparison for Q1 at Point Loma/Hervey ........................................................... 24
Figure 18: Electic Use Comparsion for Q1 at Serra Mesa-Kearny Mesa ................................................... 25
Figure 19: Electric Use Comparison for Q1 at Valencia Park/Malcolm X .................................................. 25
Figure 20: Actual vs, Modeled Electric Energy for Q1 at Point Loma/Hervey ........................................... 26
Figure 21: Actual vs. Modeled Electric Energy for Q1 at Serra Mesa-Kearny Mesa ................................. 26
Figure 22: Actual vs.Modeled Electric Energy for Q1 at Valencia Park/Malcolm X .................................. 27
6 | P a g e
I. Introduction Project Background The Center for Sustainable Energy (CSE) developed this May-July 2020 Measurement & Verification (M&V) Report to analyze a post-retrofit energy profile and compare to a 2017 energy baseline at three City of San Diego public libraries (Point Loma/Hervey, Serra Mesa-Kearny Mesa and Valencia Park/Malcolm X) as part of the California Energy Commission (CEC) EPIC 1 demonstration project, EPC-15-085. This project is a demonstration of cost-effective zero net energy (ZNE) and integrated demand-side management strategies that includes installing, testing and measuring energy efficiency improvements in three existing municipal buildings with the goal of achieving ZNE or near-ZNE. These libraries are owned and operated by the City of San Diego, located in California Climate Zone 7 and in the San Diego Gas & Electric® (SDG&E) service territory.
M&V began on May 1, 2020 after energy efficiency retrofit activities concluded at all three libraries in April 2020. Interval energy data was collected from several sources in order to determine a first quarter (Q1) energy profile and for evaluating if the libraries achieved ZNE or near-ZNE performance. ZNE performance is measured according to the CEC’s Time Dependent Valuation (TDV) definition2. It is important to note, library operations were altered due to the COVID-19 shutdown and as highlighted in this report, typical savings from efficiency measures were not clearly defined by the data. Additional information and future considerations are discussed in the baseline energy comparison section.
Purpose of Measurement and Verification The purpose of the ZNE M&V process is for comprehensive collection of end-use data to evaluate project successes and/or deficiencies by Energy Conservation Measure (ECM) and by whole-building performance as well as to verify a building was able to produce as much energy as it consumes over the course of a year or reached ZNE status. Reporting requirements for this project set by the CEC and adjusted for COVID-19 impacts are to provide 12 months on M&V (nine months using actual utility data and 3 months using energy consumption projections). Findings will be reported in four quarterly M&V reports as well as an annual report after the first nine months of energy performance are evaluated using actual metered data.
Each quarterly report will include a monthly breakout of consumption by end-use which is represented in a stacked bar graph and accompanying tables in the Appendices. Each also will include the energy profile for each location at the building level, status of ZNE achievement analysis and will discuss any
1 Energy Innovation Showcase.2020. California Energy Commission. http://innovation.energy.ca.gov/SearchResultProject.aspx?p=30919&tks=636842721307653350 2 Time Dependent Valuation of Energy for Developing Building Efficiency Standards. 2017. Energy and Environmental Economics, Inc. https://efiling.energy.ca.gov/GetDocument.aspx?tn=216062

7 | P a g e
realized successes or deficiencies relating to ECMs installed. The annual report will summarize M&V findings for a full year.
II. Facility Descriptions and Operations Point Loma/Hervey Library Description The Point Loma/Hervey Branch Library is located at 3701 Voltaire Street and serves City of San Diego residents in the Point Loma neighborhood. Built in 2003, this 22,480-square foot library receives an estimated 19,000-22,000 visitors each month. The facility HVAC equipment is 2002 vintage and includes one split A/C unit, a central 100-ton Evapco chiller (planned for replacement in 2020/2021), a boiler and 10 air handler units (AHU) on the roof, known as four-pipe fan coil units, that are served by the chiller and boiler. There is also an 81-gallon natural gas water heater (2002 vintage) that provides hot water needs to the library’s restrooms and kitchen area. Additionally, there are approximately 24 desktop computers and seven copiers/printers, some of which received an occupancy controller. ECMs installed at this library and estimated savings are highlighted in the Table 1.
Energy Savings (kWh/Yr.)
Peak Demand Savings (kW)
Electrical Cost Savings ($/Yr.)
Lighting Retrofit 85,106 19.9 $8,908 Lighting Controls 9,636 2.4 $876 HVAC Controls 23,141 18.2 $4,137 Plug Load Mgmt.3 6,037 1.6 $568
Total 123,920 kWh 42 kW $14,489
Table 1: Point Loma/Hervey Estimated ECM Savings
Serra Mesa-Kearny Mesa Library Description The Serra Mesa-Kearny Mesa Library is located at 9005 Aero Drive and serves City of San Diego residents in the Serra Mesa and Kearny Mesa neighborhoods. Built in 2006, this 15,626-square foot library receives an estimated 5,000-10,000 visitors each month. The HVAC equipment includes 10 packaged air conditioning (A/C) units located on the roof of the library. Overall, these units are from 2005. A 40-gallon natural gas water heater, also 2005 vintage, provides hot water to the building’s public restroom facilities and community room kitchen. Additionally, there are 58 desktop computers and five copiers/printers, some of which received an occupancy controller. ECMs installed at this library and estimated savings are highlighted in Table 2.
3 Not all original scoped BertBrain Plug Load Management devices were installed due to limited Wi-Fi connectivity.
8 | P a g e
Energy Savings (kWh/Yr.)
Peak Demand Savings (kW)
Electrical Cost Savings ($/Yr.)
Lighting Retrofit 20,355 3.9 $3,903 Lighting Controls 3,291 0.7 $624 HVAC Controls 4,966 2.0 $705 Plug Load Mgmt3 5,563 2.4 $764
Total 34,175 kWh 9 kW $5,996
Table 2: Serra Mesa-Kearny Mesa Estimated ECM Savings
Valencia Park/Malcolm X Library Description The Valencia Park-Malcolm X Library is located at 5148 Market Street and serves City of San Diego residents in the Valencia Park, Lincoln Park and Encanto neighborhoods. Built in 1995, this 26,328-square foot library receives an estimated 25,000 visitors each month. There are 10 packaged heating and A/C units, a split A/C unit, a 24-ton air-cooled chiller (currently not operational with no planned replacement), an inline duct heater, and one ductless A/C unit from 2014. There is also a 40-gallon, 2010 natural gas water heater that provides hot water needs to restroom facilities. All lighting is retrofit with LED fixtures, occupancy controls and a centralized HVAC controller acts a central data collection device. Additionally, there are approximately 78 desktop and laptop computers and six copiers/printers (including two 3D printers), some of which received an occupancy controller. This library additionally has a Teen IDEA Lab and Performing Arts Center. ECMs installed at this library and estimated savings are highlighted in Table 3.
Energy Savings (kWh/Yr.)
Peak Demand Savings (kW)
Electrical Cost Savings ($/Yr.)
Lighting Retrofit 55,201 15.3 $9,053 Lighting Controls 11,601 3.4 $1,408 HVAC Controls 10,706 13.1 $2,282 Plug Load Mgmt. 2,402 0.3 $153
Total 79,910 kWh 32.1 kW $12,896
Table 3: Valencia Park/Malcolm X Estimated ECM Savings
Typical Operations prior to COVID-19 General information about site operations prior to this reporting period were collected and outlined in individual ASHRAE Audit reports, the Building Energy Baseline & Modeling Report4 and briefly described in this section. The public schedule for the libraries was as follows:
• Monday, Thursday-Saturday: 9:30 a.m.– 6 p.m. • Tuesday and Wednesday: 11:30 a.m.– 8 p.m.
4 EPC-15-085: Building Energy Baseline & Modeling Report for City of San Diego Public Library ZNE Demonstration Project. 2018. Center for Sustainable Energy. https://sites.energycenter.org/sites/default/files/docs/microsites/sdzn3/EPC-15-085_Baseline_and_Modeling_Energy_Report.pdf

9 | P a g e
• Sunday: 12:30 p.m. – 5 p.m.
Anywhere from seven to 13 staff members would occupy each library on any given day, arrive typically 30-minutes prior to opening and leave within an hour of closing. Both indoor lighting and HVAC operations would follow this same occupied schedule with exterior lights on their own timer controls. HVAC units all had locked local thermostats, and the Public Works Facilities Division must be called to request a temperature change of 1-2°F up or down from 72°. Each library contains study and seminar rooms, staff workrooms, computer rooms/areas and large community rooms. They were all open to the public during the hours mentioned. These libraries also served as a community ‘Cool Zone’ which allows for residents to seek relief from heat on days with above average temperatures during public hours. It is unclear at the time of this report as to when the libraries will resume these typical operations or some altered form of how they used to operate.
Operations during COVID-19 Library operations have drastically changed since the beginning of COVID-19 related closures. From March 17 through April 13, all city libraries were closed with no staff or public allowed in the buildings. This timeframe was before M&V started and only noted for context. Library staff returned to work on April 14 and have been occupying the buildings on a limited schedule with no public allowed through July.
The libraries are currently on a reduced operating schedule, Monday to Friday from 9 a.m. through 6 p.m. (varying a half hour for some libraries) and a reduced average staff count of about 8-15 employees reporting to work. Energy consumption during Q1 is mainly attributed to lighting of staff offices and main spaces, minimal HVAC for employee comfort and plug load for staff computers. During minimal operations, energy reduction can be attributed to the lighting in ancillary rooms such as study rooms and public computer stations not being utilized and less cooling requirements from HVAC due to less heat from patrons, lighting fixtures and computers. There are no community events held during Q1 M&V and the libraries were not open as a neighborhood ‘Cool Zone’ as mentioned in the section above.
The chiller at Point Loma/Hervey has been non-operational prior to and during Q1 M&V where four portable MovinCool 1.5 Ton air conditioners are being used to cool the common working space for employees. The community room chiller at Valencia Park/Malcolm X is also non-operational through July as well.
III. Q1 Energy Performance Assessment
Baseline M&V Data The utility data baseline for this project utilized January to December 2017 electric and natural gas interval data from SDG&E. This baseline was used to help complete energy model calibration during the

10 | P a g e
initial stages of the project for determining potential energy conservation measures (ECM). It will also be used to compare to post-retrofit energy profiles to analyze the effectiveness of installed ECMs. End-use monitoring was implemented in July 2018 and only three months of consumption data was collected and analyzed for a prior report. That data will briefly be discussed in the energy baseline comparison section. Considering the minimized operations of the libraries due to COVID-19, verifying ECM savings will require a unique approach for Q1 M&V and is addressed in the energy baseline comparison and conclusions sections.
Q1 Energy Performance Data Energy consumption data was collected from various sources to analyze Q1 M&V energy performance. The BuildingOS Energy Dashboard implemented at each library acts as the central portal for data collection, interpretation and visualization. The following data points were pulled for May 1 through July 31, 2020 from the BuildingOS portal:
• Autani Panel Meter kWh – 26 Total (15-min Intervals) o 10 at Point Loma/Hervey o 7 at Serra Mesa-Kearny Mesa o 9 at Valencia Park/Malcolm X
• PV Production kWh (15-min Intervals) • Natural Gas Consumption therms (Monthly Intervals)
Electrical consumption and demand information was provided by City of San Diego (City) staff for Q1 due to a connection issue between BuildingOS and SDG&E. Channel 1 (grid import) and Channel 2 (grid export) 15-min interval data was analyzed to calculate Net Grid Consumption and Gross Site Consumption (Net Grid + PV Production) in kWh. It is expected this issue will be fixed by Q2. Utility consumption data can be pulled from the BuildingOS portal. Figure 1 represents Q1 monthly gross site consumption and PV production which will be further analyzed in each library sub-sections.

11 | P a g e
Figure 1: Q1 Monthly Gross Site Electric Consumption and PV Production (May-July 2020)
The breakout of end-use energy consumption highlighted in the following sections was obtained through various metering equipment, data sources and calculations. Autani metering devices measure panel consumption for lighting, plug load, miscellaneous and a portion of HVAC equipment, which is then paired with Gross Site Consumption data to obtain the non-metered HVAC loads. This level of detail was required to verify performance and savings of specific loads and ECMs such as upgraded lighting and plug load controls.
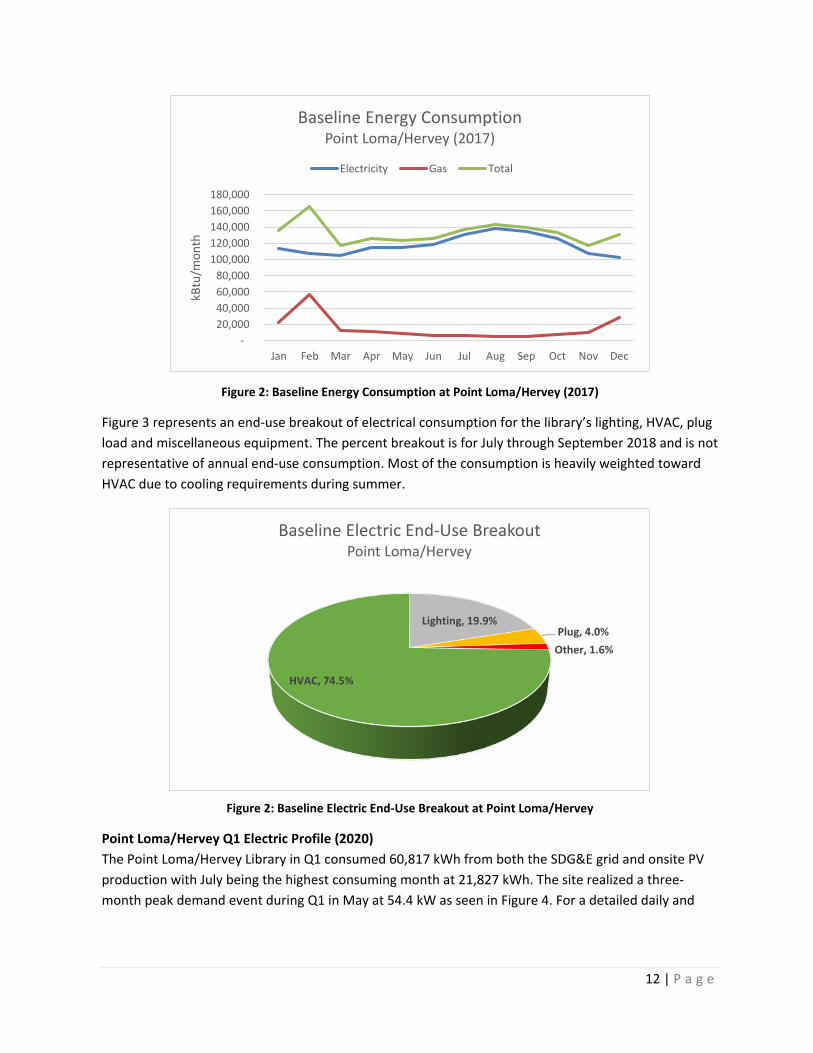
Point Loma/Hervey Library Energy Baseline (2017) In 2017, the Point Loma/Hervey Library consumed 1,595,736 kBtu of energy, which translates to more than 414,472 kWh in electricity (89% of energy use) and approximately 182 MMBtu in natural gas (11% of energy use). Point Loma/Hervey’s total energy cost was $96,807 during the baseline year, of which $95,366 was spent on electricity alone, $1,140 on natural gas. The library’s time-of-use (TOU) utility tariff also accounts for peak demand, which was 146 kW in May 2017. Figure 2 represents the monthly baseline energy consumption in kBtu.
0
5,000
10,000
15,000
20,000
25,000
30,000
0
5,000
10,000
15,000
20,000
25,000
30,000
May-20 Jun-20 Jul-20
PV P
rodu
ctio
n (k
Wh)
Site
Con
sum
ptio
n (k
Wh)
PL Gross Site SM Gross Site MX Gross Site
PL Total PV SM Total PV MX Total PV
12 | P a g e
Figure 2: Baseline Energy Consumption at Point Loma/Hervey (2017)
Figure 3 represents an end-use breakout of electrical consumption for the library’s lighting, HVAC, plug load and miscellaneous equipment. The percent breakout is for July through September 2018 and is not representative of annual end-use consumption. Most of the consumption is heavily weighted toward HVAC due to cooling requirements during summer.
Figure 2: Baseline Electric End-Use Breakout at Point Loma/Hervey
Point Loma/Hervey Q1 Electric Profile (2020) The Point Loma/Hervey Library in Q1 consumed 60,817 kWh from both the SDG&E grid and onsite PV production with July being the highest consuming month at 21,827 kWh. The site realized a three-month peak demand event during Q1 in May at 54.4 kW as seen in Figure 4. For a detailed daily and
- 20,000 40,000 60,000 80,000
100,000 120,000 140,000 160,000 180,000
Jan Feb Mar Apr May Jun Jul Aug Sep Oct Nov Dec
kBtu
/mon
th
Baseline Energy ConsumptionPoint Loma/Hervey (2017)
Electricity Gas Total
Lighting, 19.9%Plug, 4.0%
Other, 1.6%
HVAC, 74.5%
Baseline Electric End-Use BreakoutPoint Loma/Hervey
13 | P a g e
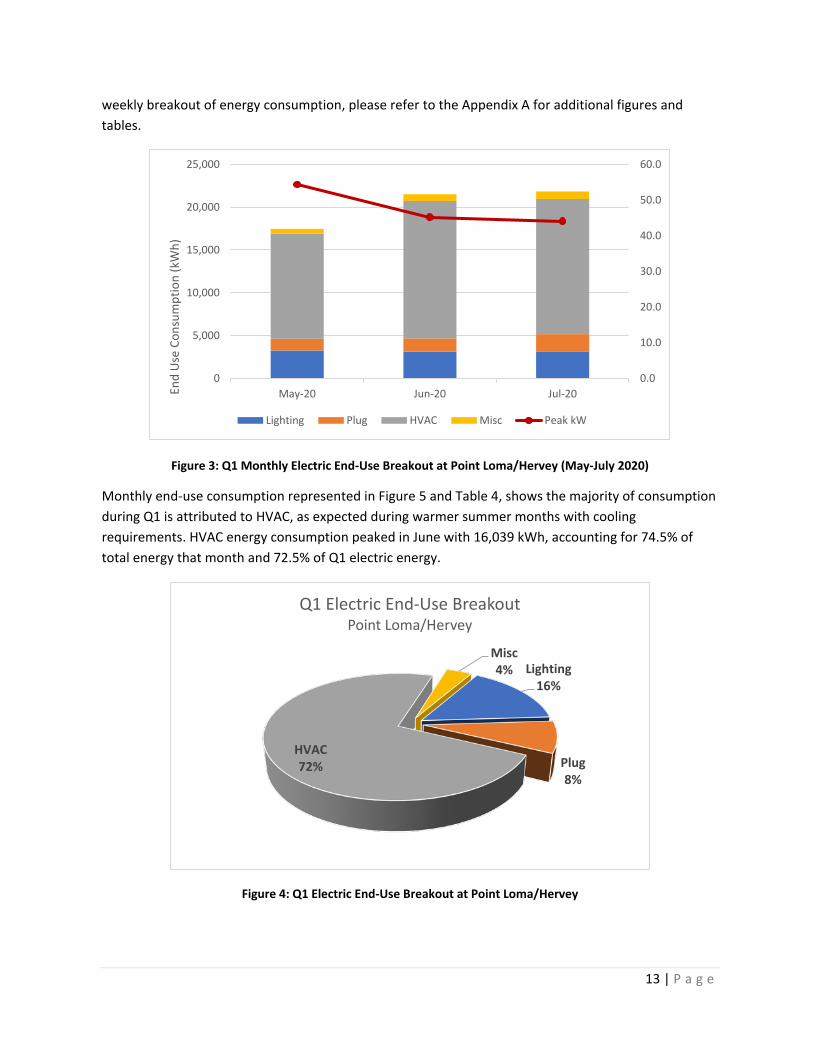
weekly breakout of energy consumption, please refer to the Appendix A for additional figures and tables.
Figure 3: Q1 Monthly Electric End-Use Breakout at Point Loma/Hervey (May-July 2020)
Monthly end-use consumption represented in Figure 5 and Table 4, shows the majority of consumption during Q1 is attributed to HVAC, as expected during warmer summer months with cooling requirements. HVAC energy consumption peaked in June with 16,039 kWh, accounting for 74.5% of total energy that month and 72.5% of Q1 electric energy.
Figure 4: Q1 Electric End-Use Breakout at Point Loma/Hervey
0.0
10.0
20.0
30.0
40.0
50.0
60.0
0
5,000
10,000
15,000
20,000
25,000
May-20 Jun-20 Jul-20End
Use
Con
sum
ptio
n (k
Wh)
Lighting Plug HVAC Misc Peak kW
Lighting16%
Plug8%
HVAC72%
Misc4%
Q1 Electric End-Use BreakoutPoint Loma/Hervey

14 | P a g e
Month Lighting Plug HVAC Misc. Total Lighting %
Plug %
HVAC %
Misc. %
May-20 3,250.5 1,382.0 12,273.2 568.4 17,474.1 18.6% 7.9% 70.2% 3.3% Jun-20 3,119.6 1,555.9 16,039.3 801.3 21,516.1 14.5% 7.2% 74.5% 3.7% Jul-20 3,162.6 2,000.9 15,790.7 873.4 21,827.6 14.5% 9.2% 72.3% 4.0% Q1 Total 9,532.7 4,938.7 44,103.2 2,243.2 60,817.8 15.7% 8.1% 72.5% 3.7%
Table 4: Q1 Electric End-Use Breakout at Point Loma/Hervey including %
Serra Mesa-Kearny Mesa Library Energy Baseline (2017) In 2017, the Serra Mesa-Kearny Mesa Library consumed 1,007,449 kBtu of energy, which translates to 260,856 kWh (88% electricity use) and 117 MMBtu (12% natural gas use). Serra Mesa-Kearney Mesa’s total energy cost was $66,214 during the baseline year, of which $65,283 was spent on electricity alone, $931 on natural gas. The library’s TOU utility tariff also accounts for peak demand, which was 100 kW in September 2017. Figure 6 represents the monthly baseline energy consumption in kBtu.
Figure 5: Baseline Energy Consumption at Serra Mesa-Kearny Mesa (2017)
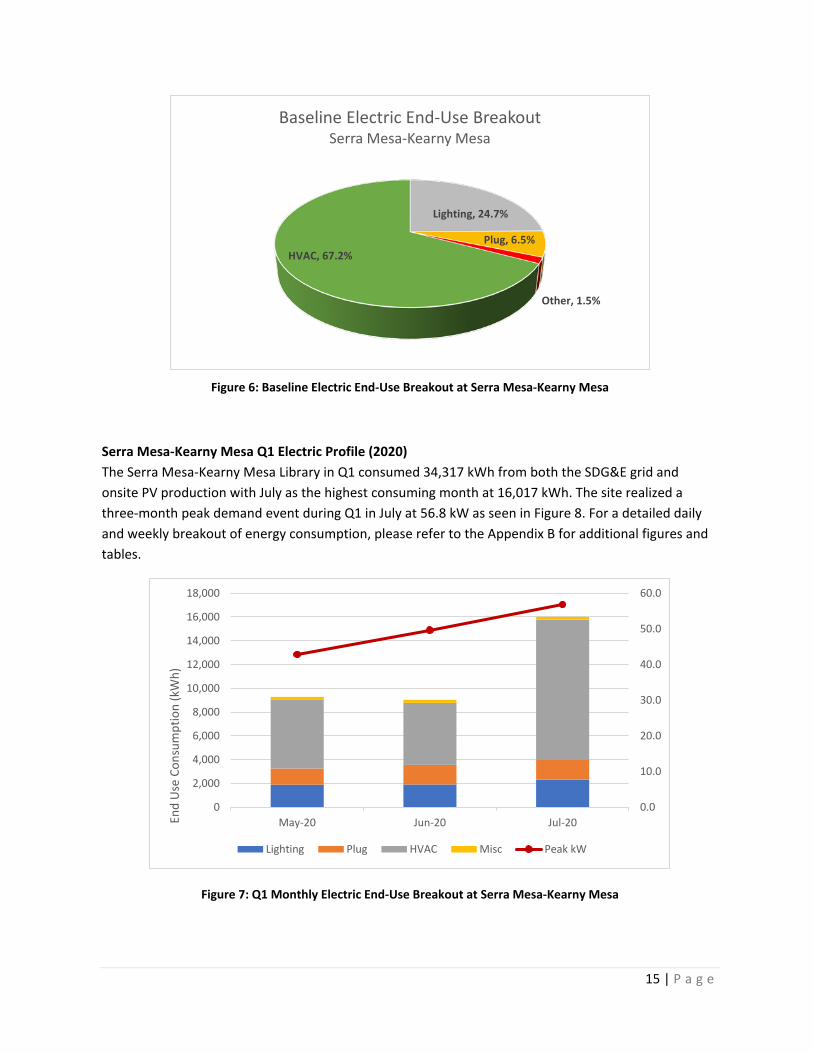
Figure 7 represents an end-use breakout of electrical consumption for the library’s lighting, HVAC, plug load and miscellaneous equipment. The percent breakout is for July through September 2018 and is not representative of annual end-use consumption. Most of the consumption is heavily weighted toward HVAC due to cooling requirements during summer.
-
20,000
40,000
60,000
80,000
100,000
120,000
Jan Feb Mar Apr May Jun Jul Aug Sep Oct Nov Dec
kBtu
/mon
th
Baseline Energy ConsumptionSerra Mesa-Kearny Mesa (2017)
Electricity Gas Total
15 | P a g e
Figure 6: Baseline Electric End-Use Breakout at Serra Mesa-Kearny Mesa
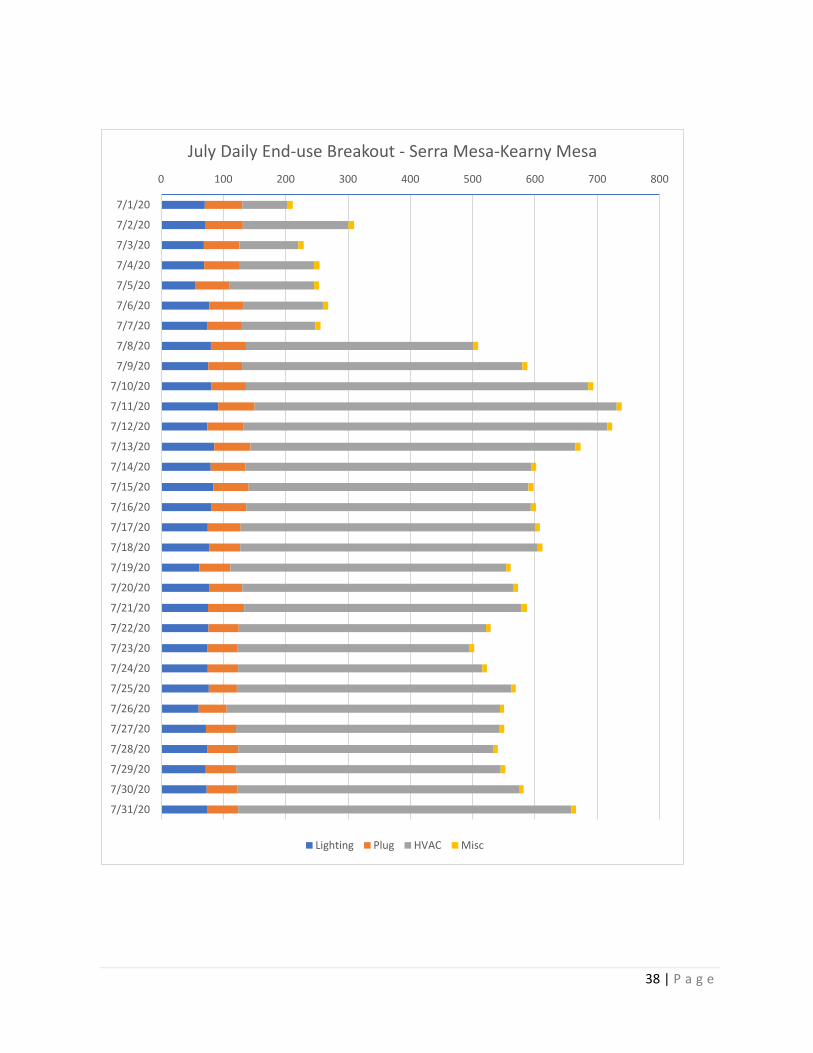
Serra Mesa-Kearny Mesa Q1 Electric Profile (2020) The Serra Mesa-Kearny Mesa Library in Q1 consumed 34,317 kWh from both the SDG&E grid and onsite PV production with July as the highest consuming month at 16,017 kWh. The site realized a three-month peak demand event during Q1 in July at 56.8 kW as seen in Figure 8. For a detailed daily and weekly breakout of energy consumption, please refer to the Appendix B for additional figures and tables.
Figure 7: Q1 Monthly Electric End-Use Breakout at Serra Mesa-Kearny Mesa
Lighting, 24.7%
Plug, 6.5%
Other, 1.5%
HVAC, 67.2%
Baseline Electric End-Use BreakoutSerra Mesa-Kearny Mesa
0.0
10.0
20.0
30.0
40.0
50.0
60.0
0
2,000
4,000
6,000
8,000
10,000
12,000
14,000
16,000
18,000
May-20 Jun-20 Jul-20End
Use
Con
sum
ptio
n (k
Wh)
Lighting Plug HVAC Misc Peak kW

16 | P a g e
Monthly end-use consumption represented in Figure 9 and Table 5, shows most of the consumption during Q1 is attributed to HVAC, as expected during warmer summer months with cooling requirements. HVAC energy consumption peaked in June with 11,804 kWh, accounting for 73.7% of total energy that month and 66.5% of Q1 electric energy.
Figure 8: Q1 Electric End-Use Breakout at Serra Mesa-Kearny Mesa
Month Lighting Plug HVAC Misc. Total Lighting %
Plug %
HVAC %
Misc. %
May-20 1,884.2 1,370.6 5,811.9 210.0 9,276.7 20.3% 14.8% 62.7% 2.3% Jun-20 1,901.6 1,663.4 5,204.6 253.7 9,023.4 21.1% 18.4% 57.7% 2.8% Jul-20 2,312.1 1,654.8 11,804.0 246.3 16,017.3 14.4% 10.3% 73.7% 1.5% Q1 Total 6,098.0 4,688.8 22,820.5 710.0 34,317.4 17.8% 13.7% 66.5% 2.1%
Table 5: Q1 Electric End-Use Breakout at Serra Mesa-Kearny Mesa including %
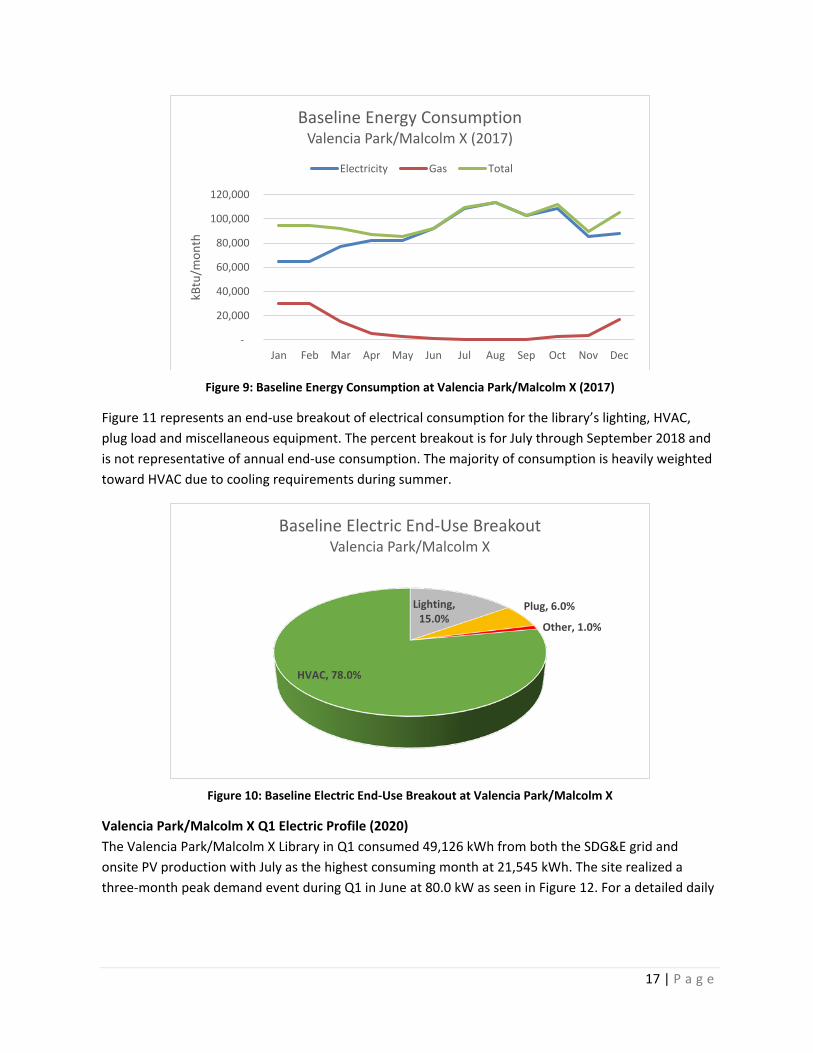
Valencia Park/Malcolm X Library Baseline Energy (2017) In 2017, the Valencia Park/Malcolm X Library consumed 1,099,325 kBtu of energy, which translates to 290,976 kWh in electricity (90% of energy use) and 107 MMBtu in natural gas (10% of energy use). Valencia Park/Malcolm X’s total energy cost was $80,595 during the baseline year, of which $79,737 was spent on electricity alone, $858 on natural gas. The library’s TOU utility tariff also accounts for peak demand, which was 147 kW in October 2017. Figure 10 represents the monthly baseline energy consumption in kBtu.
Lighting18%
Plug14%
HVAC66%
Misc2%
Q1 Electric End-Use BreakoutSerra Mesa-Kearny Mesa
17 | P a g e
Figure 9: Baseline Energy Consumption at Valencia Park/Malcolm X (2017)
Figure 11 represents an end-use breakout of electrical consumption for the library’s lighting, HVAC, plug load and miscellaneous equipment. The percent breakout is for July through September 2018 and is not representative of annual end-use consumption. The majority of consumption is heavily weighted toward HVAC due to cooling requirements during summer.
Figure 10: Baseline Electric End-Use Breakout at Valencia Park/Malcolm X
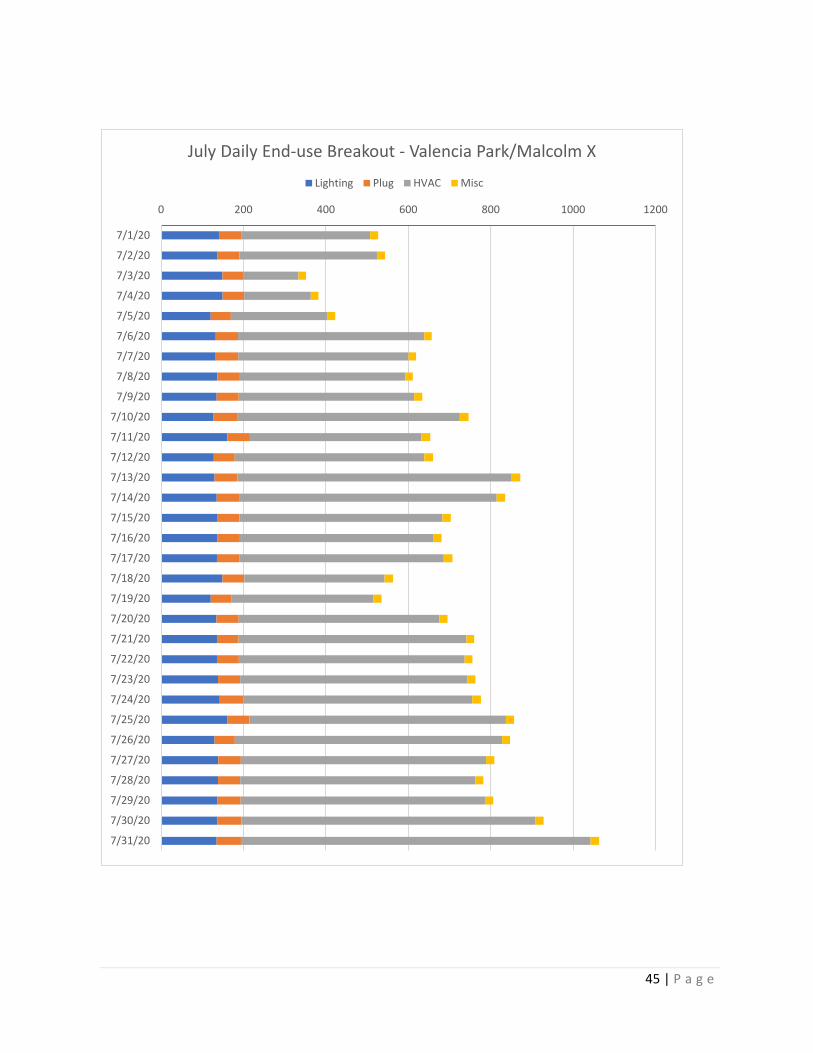
Valencia Park/Malcolm X Q1 Electric Profile (2020) The Valencia Park/Malcolm X Library in Q1 consumed 49,126 kWh from both the SDG&E grid and onsite PV production with July as the highest consuming month at 21,545 kWh. The site realized a three-month peak demand event during Q1 in June at 80.0 kW as seen in Figure 12. For a detailed daily
-
20,000
40,000
60,000
80,000
100,000
120,000
Jan Feb Mar Apr May Jun Jul Aug Sep Oct Nov Dec
kBtu
/mon
th
Baseline Energy ConsumptionValencia Park/Malcolm X (2017)
Electricity Gas Total
Lighting, 15.0%
Plug, 6.0%
Other, 1.0%
HVAC, 78.0%
Baseline Electric End-Use BreakoutValencia Park/Malcolm X
18 | P a g e
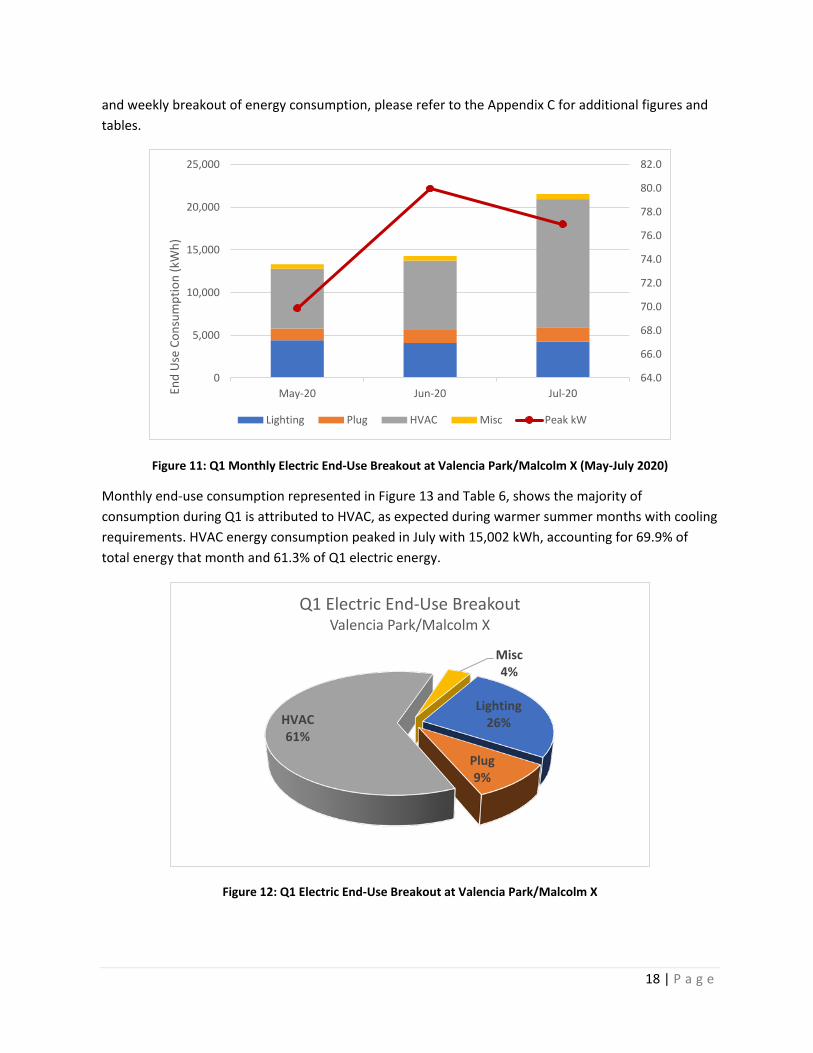
and weekly breakout of energy consumption, please refer to the Appendix C for additional figures and tables.
Figure 11: Q1 Monthly Electric End-Use Breakout at Valencia Park/Malcolm X (May-July 2020)
Monthly end-use consumption represented in Figure 13 and Table 6, shows the majority of consumption during Q1 is attributed to HVAC, as expected during warmer summer months with cooling requirements. HVAC energy consumption peaked in July with 15,002 kWh, accounting for 69.9% of total energy that month and 61.3% of Q1 electric energy.
Figure 12: Q1 Electric End-Use Breakout at Valencia Park/Malcolm X
64.0
66.0
68.0
70.0
72.0
74.0
76.0
78.0
80.0
82.0
0
5,000
10,000
15,000
20,000
25,000
May-20 Jun-20 Jul-20End
Use
Con
sum
ptio
n (k
Wh)
Lighting Plug HVAC Misc Peak kW
Lighting26%
Plug9%
HVAC61%
Misc4%
Q1 Electric End-Use BreakoutValencia Park/Malcolm X
19 | P a g e
Month Lighting Plug HVAC Misc. Total Lighting %
Plug %
HVAC %
Misc. %
May-20 4,404.9 1,383.5 6,987.5 535.8 13,311.7 33.1% 10.4% 52.5% 4.0% Jun-20 4,089.1 1,520.8 8,128.9 530.4 14,269.2 28.7% 10.7% 57.0% 3.7% Jul-20 4,256.0 1,673.4 15,002.3 613.6 21,545.2 19.8% 7.8% 69.6% 2.8% Q1 Total 12,750.0 4,577.6 30,118.7 1,679.7 49,126.0 26.0% 9.3% 61.3% 3.4%
Table 6: Q1 Electric End-Use Breakout at Valencia Park/Malcolm X including %
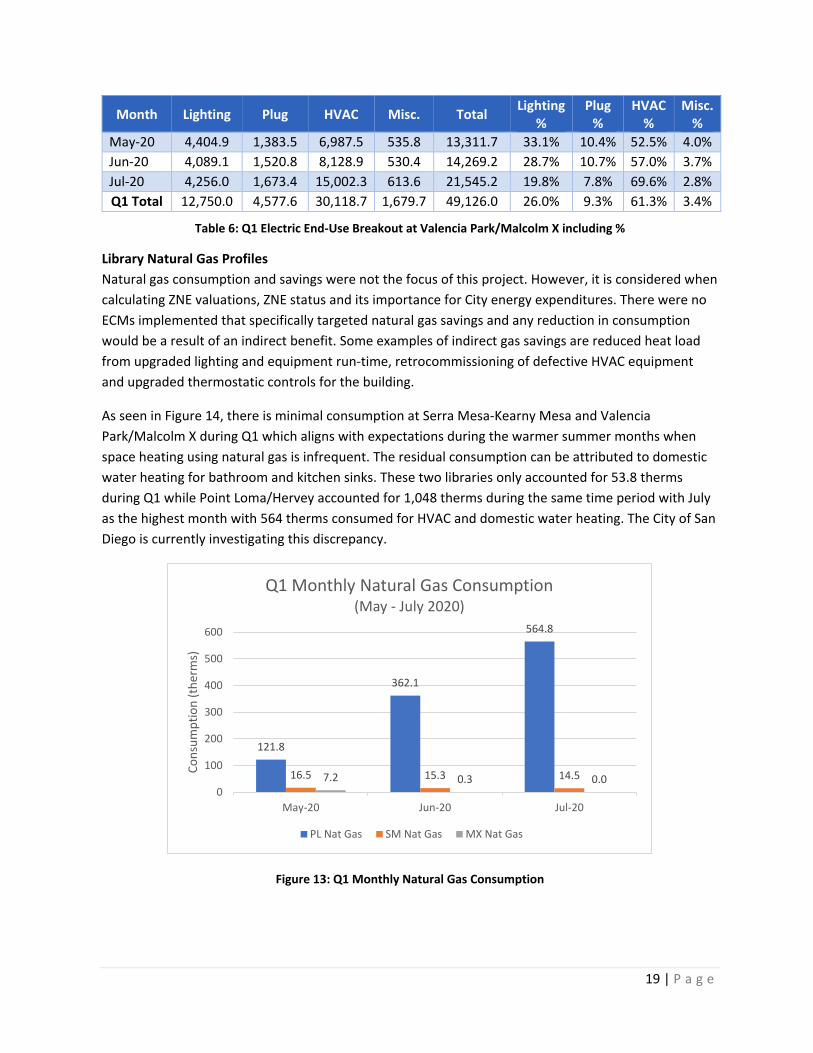
Library Natural Gas Profiles Natural gas consumption and savings were not the focus of this project. However, it is considered when calculating ZNE valuations, ZNE status and its importance for City energy expenditures. There were no ECMs implemented that specifically targeted natural gas savings and any reduction in consumption would be a result of an indirect benefit. Some examples of indirect gas savings are reduced heat load from upgraded lighting and equipment run-time, retrocommissioning of defective HVAC equipment and upgraded thermostatic controls for the building.
As seen in Figure 14, there is minimal consumption at Serra Mesa-Kearny Mesa and Valencia Park/Malcolm X during Q1 which aligns with expectations during the warmer summer months when space heating using natural gas is infrequent. The residual consumption can be attributed to domestic water heating for bathroom and kitchen sinks. These two libraries only accounted for 53.8 therms during Q1 while Point Loma/Hervey accounted for 1,048 therms during the same time period with July as the highest month with 564 therms consumed for HVAC and domestic water heating. The City of San Diego is currently investigating this discrepancy.
Figure 13: Q1 Monthly Natural Gas Consumption
121.8
362.1
564.8
16.5 15.3 14.57.2 0.3 0.00
100
200
300
400
500
600
May-20 Jun-20 Jul-20
Cons
umpt
ion
(the
rms)
Q1 Monthly Natural Gas Consumption(May - July 2020)
PL Nat Gas SM Nat Gas MX Nat Gas
20 | P a g e
The natural gas data provided by SDG&E can only be broken down into billable months which could have a ‘meter read date’ in the middle of a particular month. Since TDV valuations have a monthly TDV factor aligning with a calendar month, the data was averaged out to a therm/day consumption rate and applied to the appropriate number of days in a calendar month. SDG&E is working on the ability to report natural gas data on a more granular interval such as hourly consumption data.
Solar PV Production Baseline (2017) Solar PV systems are currently installed at each library and the technical specifications of each system are presented in Table 7. These systems are important to this project as they produce onsite renewable energy that will offset energy consumption and enable the buildings to achieve ZNE or near-ZNE. The PV systems at Serra Mesa-Kearny Mesa and Valencia Park/Malcolm X were commissioned in November 2017, offset about 78-79% of annual grid consumption and large enough to export energy during sunny mid-day hours. The PV system installed at Point Loma/Hervey in July 2018 is significantly smaller than the other two libraries due to available space at the site, providing about 31% of annual electric energy and will only export energy during specific circumstances.
Library PV System Capacity (kW-DC)
Mounting Type Estimated Annual
PV Production5 (kWh-AC)
Estimated Annual Offset
(% of 2017 kWh) Point Loma/Hervey 84.42 kW Roof 129,698.5 kWh 31.3% Serra Mesa-Kearny Mesa 138.69 kW Ground (Carport) 204,014.2 kWh 78.2% Valencia Park/Malcolm X 138.69 kW Ground (Carport) 230,283.0 kWh 79.1%
Table 7: PV System Technical and Performance Details
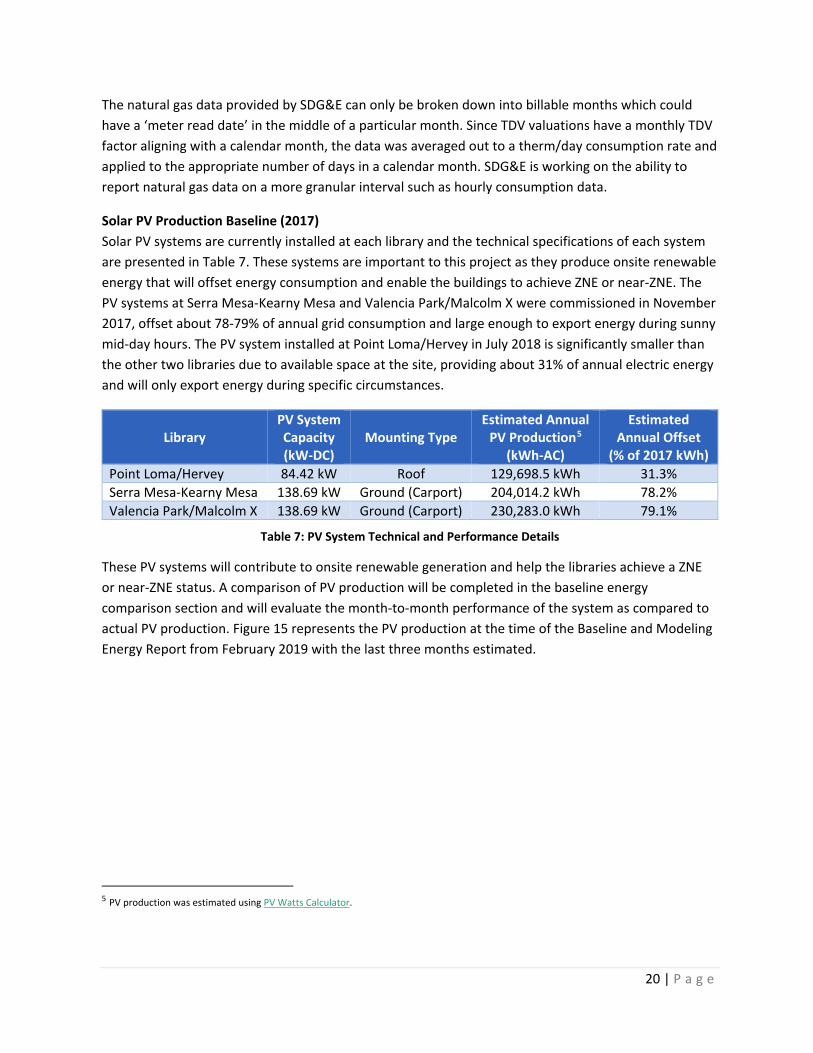
These PV systems will contribute to onsite renewable generation and help the libraries achieve a ZNE or near-ZNE status. A comparison of PV production will be completed in the baseline energy comparison section and will evaluate the month-to-month performance of the system as compared to actual PV production. Figure 15 represents the PV production at the time of the Baseline and Modeling Energy Report from February 2019 with the last three months estimated.
5 PV production was estimated using PV Watts Calculator.
21 | P a g e
Figure 14: PV Production (Nov 2017-Dec 2018)
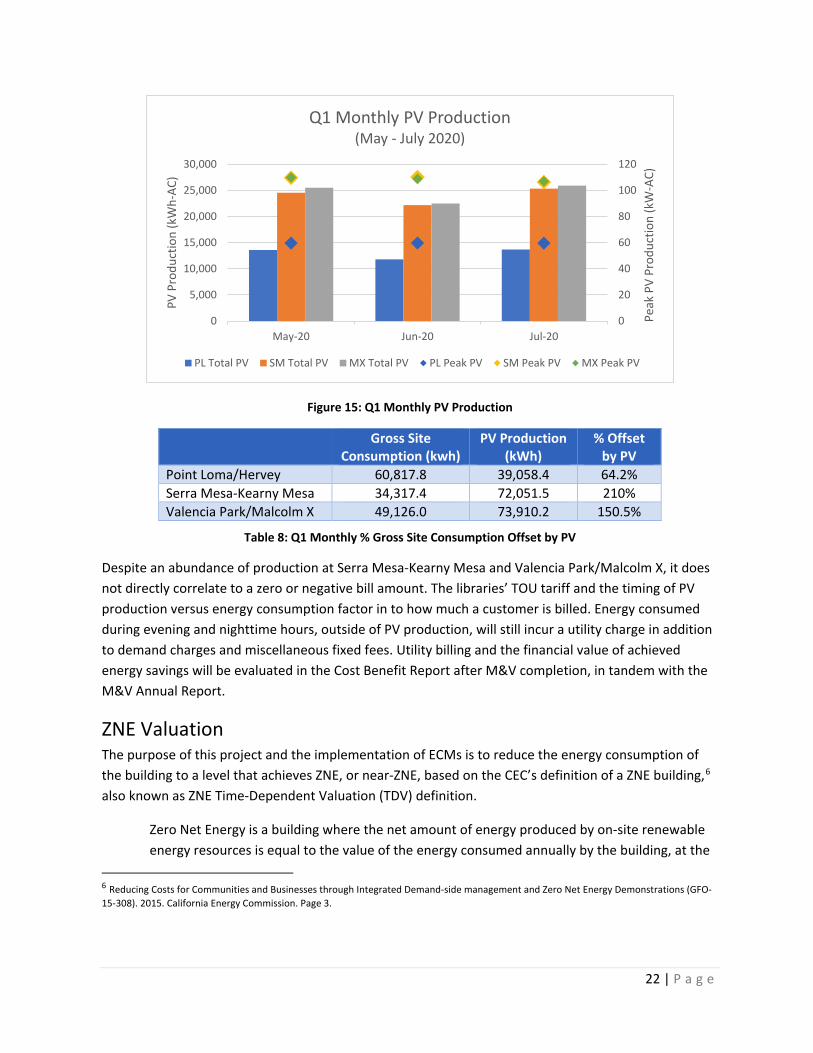
Solar PV Production Q1 Energy Profile Onsite PV systems provide a renewable source of generation that helps offset grid consumed electric and is critical to achieving ZNE or near-ZNE status. The system installed at Point Loma/Hervey in July 2018 (84.42 kW-DC) was subject to sizing constraints and was estimated to offset only 31% of annual kWh. During the libraries’ COVID-19 shutdown, PV has accounted for a larger portion of the site’s electrical consumption. As represented in Figure 16 and Table 8, Point Loma/Hervey produced 39,058 kWh during Q1 which offset 64.2% of Gross Site Consumption.
The two systems installed in November 2017 at Serra Mesa-Kearny Mesa and Valencia Park/Malcolm X (138.69 kW-DC each) were estimated to offset a significant amount of utility energy at each library, 78.2% and 79.1% respectively. However due to the libraries’ COVID-19 closure, both systems overproduced the facilities monthly energy requirements where the system at Serra Mesa-Kearny Mesa provided 210% of the libraries Gross Site Consumption and Valencia Park/Malcolm X provided 150.5%.
0.0
5,000.0
10,000.0
15,000.0
20,000.0
25,000.0
Serra Mesa (Actual PV kWh) Malcolm X (Actual PV kWh) Point Loma (Actual PV kWh)
Serra Mesa (Estimated PV kWh) Malcolm X (Estimated PV kWh) Point Loma (Estimated PV kWh)
22 | P a g e
Figure 15: Q1 Monthly PV Production
Gross Site Consumption (kwh)
PV Production (kWh)
% Offset by PV
Point Loma/Hervey 60,817.8 39,058.4 64.2% Serra Mesa-Kearny Mesa 34,317.4 72,051.5 210% Valencia Park/Malcolm X 49,126.0 73,910.2 150.5%
Table 8: Q1 Monthly % Gross Site Consumption Offset by PV
Despite an abundance of production at Serra Mesa-Kearny Mesa and Valencia Park/Malcolm X, it does not directly correlate to a zero or negative bill amount. The libraries’ TOU tariff and the timing of PV production versus energy consumption factor in to how much a customer is billed. Energy consumed during evening and nighttime hours, outside of PV production, will still incur a utility charge in addition to demand charges and miscellaneous fixed fees. Utility billing and the financial value of achieved energy savings will be evaluated in the Cost Benefit Report after M&V completion, in tandem with the M&V Annual Report.
ZNE Valuation The purpose of this project and the implementation of ECMs is to reduce the energy consumption of the building to a level that achieves ZNE, or near-ZNE, based on the CEC’s definition of a ZNE building,6 also known as ZNE Time-Dependent Valuation (TDV) definition.
Zero Net Energy is a building where the net amount of energy produced by on-site renewable energy resources is equal to the value of the energy consumed annually by the building, at the
6 Reducing Costs for Communities and Businesses through Integrated Demand-side management and Zero Net Energy Demonstrations (GFO-15-308). 2015. California Energy Commission. Page 3.
0
20
40
60
80
100
120
0
5,000
10,000
15,000
20,000
25,000
30,000
May-20 Jun-20 Jul-20
Peak
PV
Prod
uctio
n (k
W-A
C)
PV P
rodu
ctio
n (k
Wh-
AC)
Q1 Monthly PV Production(May - July 2020)
PL Total PV SM Total PV MX Total PV PL Peak PV SM Peak PV MX Peak PV

23 | P a g e
level of a single “project” seeking development entitlements and building code permits, as measured using the California Energy Commission’s Time Dependent Valuation (TDV) metric.
Considering the seasonal variations in energy consumption and onsite PV production, ZNE status must be evaluated on an annual basis and a full determination will be outlined in the Annual M&V Report. However, see Table 9 for initial Q1 TDV values using 2019 CEC-issued TDV factors.
Additionally, the TDV valuation is on a site energy generation and consumption basis and does not account for grid source emissions and losses in energy delivery. Offsetting the source of generation and delivery of the energy is not required, however all site fuels, gas and electric, must be offset through renewables. To account for source energy use and emissions, a ZNE Source along with ZNE Site valuation will be evaluated in the Annual M&V Report to compare ZNE definition valuation differences.7
Month PL Net Btu PL TDV SM Net Btu SM TDV MX Net Btu MX TDV May-20 14,504,957 44,674,277 -51,926,724 -321,543,922 -41,498,191 -256,484,167 Jun-20 36,787,595 154,274,981 -44,726,516 -309,230,797 -28,065,143 -202,453,203 Jul-20 33,430,227 93,498,575 -31,676,091 -500,851,764 -14,978,953 -296,788,305 Q1 Total 84,722,779 292,447,832 -128,329,332 -1,131,626,484 -84,542,288 -755,725,675
Table 9: Q1 Monthly Btu and TDV Values
For TDV valuation, utility provided electric and natural gas data is first converted from kWh and therms into Btu. Hourly interval electric TDV factors are then applied to Net Grid Consumption data which accounts for onsite grid consumption as well as exported PV production, positive for consumption and negative for PV export. Natural gas data is provided as monthly total from SDG&E and is applied the monthly interval TDV factor. There was minimal gas consumption for the Q1 summer months, so the majority of TDV energy (Btu’s) came from grid-related electric consumption.
Table 10 is an evaluation of the TDV Energy Use Intensity (EUI) which is another important indicator and used frequently for comparison to other energy-efficient buildings. An EUI looks at energy consumption based on a square foot basis for a normalized comparison and it can be seen in the following table that under the reduced operation of the libraries, two are considered at or below ZNE. This is expected due to the large PV arrays at Serra Mesa-Kearny Mesa and Valencia Park/Malcolm X whereas the array at Point Loma/Hervey wasn’t large enough to offset Q1 grid consumption with PV.
7 The Vocabulary of ZNE: A Guide to Zero Net Energy Terminology. 2015. New Buildings Institute. https://gettingtozeroforum.org/wp-content/uploads/sites/2/2017/08/ZNE_NBI_CommsToolkit_Terminology_.pdf

24 | P a g e
Point Loma/Hervey
Serra Mesa-Kearny Mesa
Valencia Park/Malcolm X
TDV Value (Elec + Gas) 292,447,832 -1,131,626,484 -755,725,675 Building Sq. Ft 22,480 15,626 26,328 TDV Energy (Btu/Sq. Ft) 13,009 -72,419 -28,704 TDV Energy (kBtu/Sq. Ft) 13.0 -72.4 -28.7
Table 10: Q1 TDV Energy Use Intensity (EUI) Valuation
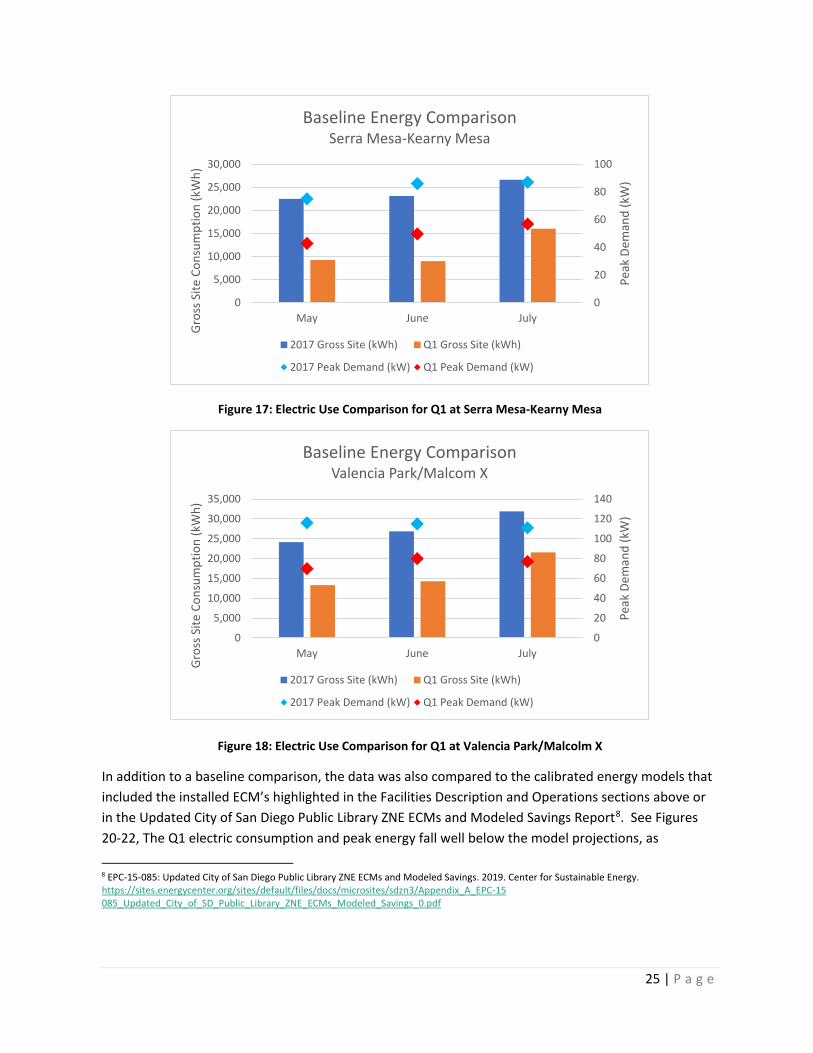
Baseline Energy Comparison In a typical M&V report, the post-retrofit energy performance of the building would be compared to the baseline performance and any savings or discrepancies on an end-use basis would be identified. However, as mentioned in the COVID-19 operations section of this report, the energy consumption of the site during Q1 has changed drastically from pre-retrofit conditions and a standard evaluation approach would not clearly define savings or discrepancies. Figures 17-19 are an initial look at the electric consumption comparison on a monthly basis during Q1 for all three libraries where it’s obvious there was a significant drop-off in energy consumption (kWh) and peak demand (kW). Corresponding months of May through July 2017 were compared to Q1 months in 2020 in Figure 17.
Figure 16: Electric Use Comparison for Q1 at Point Loma/Hervey
020406080100120140160
0
10,000
20,000
30,000
40,000
50,000
May June July
Peak
Dem
and
(kW
)
Gros
s Site
Con
sum
ptio
n (k
Wh)
Baseline Energy ComparisonPoint Loma/Hervey
2017 Gross Site (kWh) Q1 Gross Site (kWh)
2017 Peak Demand (kW) Q1 Peak Demand (kW)
25 | P a g e
Figure 17: Electric Use Comparison for Q1 at Serra Mesa-Kearny Mesa
Figure 18: Electric Use Comparison for Q1 at Valencia Park/Malcolm X
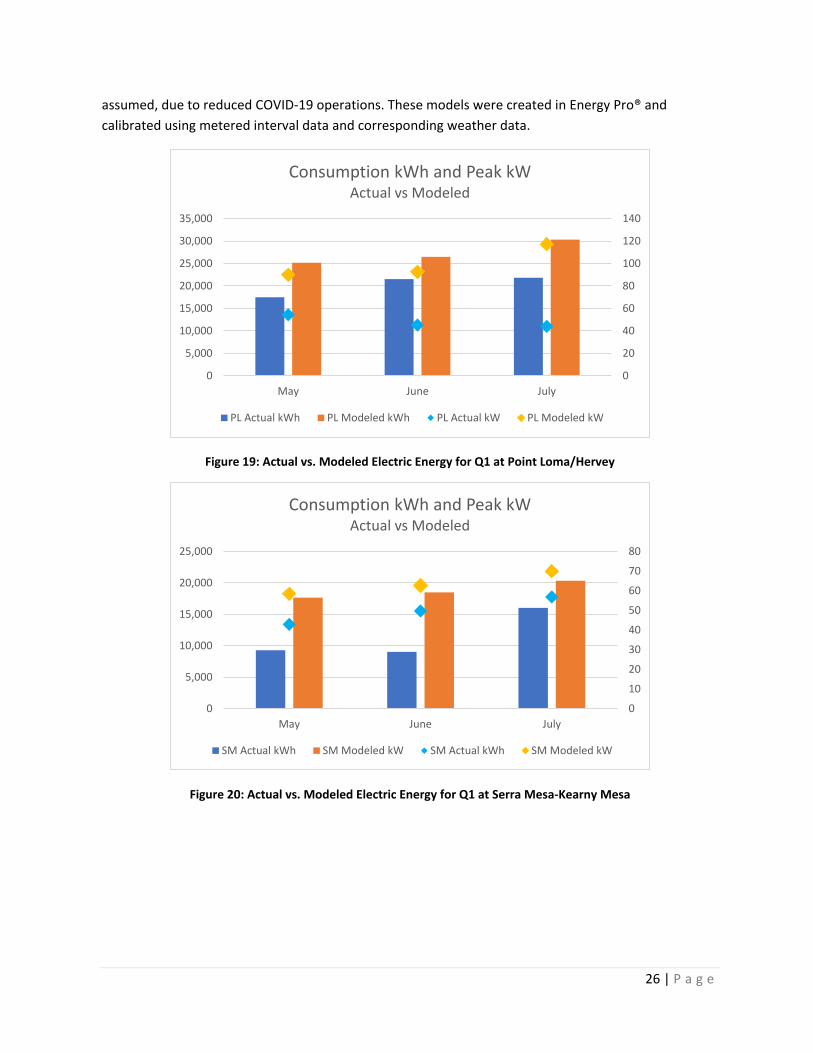
In addition to a baseline comparison, the data was also compared to the calibrated energy models that included the installed ECM’s highlighted in the Facilities Description and Operations sections above or in the Updated City of San Diego Public Library ZNE ECMs and Modeled Savings Report8. See Figures 20-22, The Q1 electric consumption and peak energy fall well below the model projections, as
8 EPC-15-085: Updated City of San Diego Public Library ZNE ECMs and Modeled Savings. 2019. Center for Sustainable Energy. https://sites.energycenter.org/sites/default/files/docs/microsites/sdzn3/Appendix_A_EPC-15 085_Updated_City_of_SD_Public_Library_ZNE_ECMs_Modeled_Savings_0.pdf
0
20
40
60
80
100
0
5,000
10,000
15,000
20,000
25,000
30,000
May June July
Peak
Dem
and
(kW
)
Gros
s Site
Con
sum
ptio
n (k
Wh)
Baseline Energy ComparisonSerra Mesa-Kearny Mesa
2017 Gross Site (kWh) Q1 Gross Site (kWh)
2017 Peak Demand (kW) Q1 Peak Demand (kW)
0
20
40
60
80
100
120
140
0
5,000
10,000
15,000
20,000
25,000
30,000
35,000
May June July
Peak
Dem
and
(kW
)
Gros
s Site
Con
sum
ptio
n (k
Wh)
Baseline Energy ComparisonValencia Park/Malcom X
2017 Gross Site (kWh) Q1 Gross Site (kWh)
2017 Peak Demand (kW) Q1 Peak Demand (kW)
26 | P a g e
assumed, due to reduced COVID-19 operations. These models were created in Energy Pro® and calibrated using metered interval data and corresponding weather data.
Figure 19: Actual vs. Modeled Electric Energy for Q1 at Point Loma/Hervey
Figure 20: Actual vs. Modeled Electric Energy for Q1 at Serra Mesa-Kearny Mesa
0
20
40
60
80
100
120
140
0
5,000
10,000
15,000
20,000
25,000
30,000
35,000
May June July
Consumption kWh and Peak kWActual vs Modeled
PL Actual kWh PL Modeled kWh PL Actual kW PL Modeled kW
0
10
20
30
40
50
60
70
80
0
5,000
10,000
15,000
20,000
25,000
May June July
Consumption kWh and Peak kWActual vs Modeled
SM Actual kWh SM Modeled kW SM Actual kWh SM Modeled kW
27 | P a g e
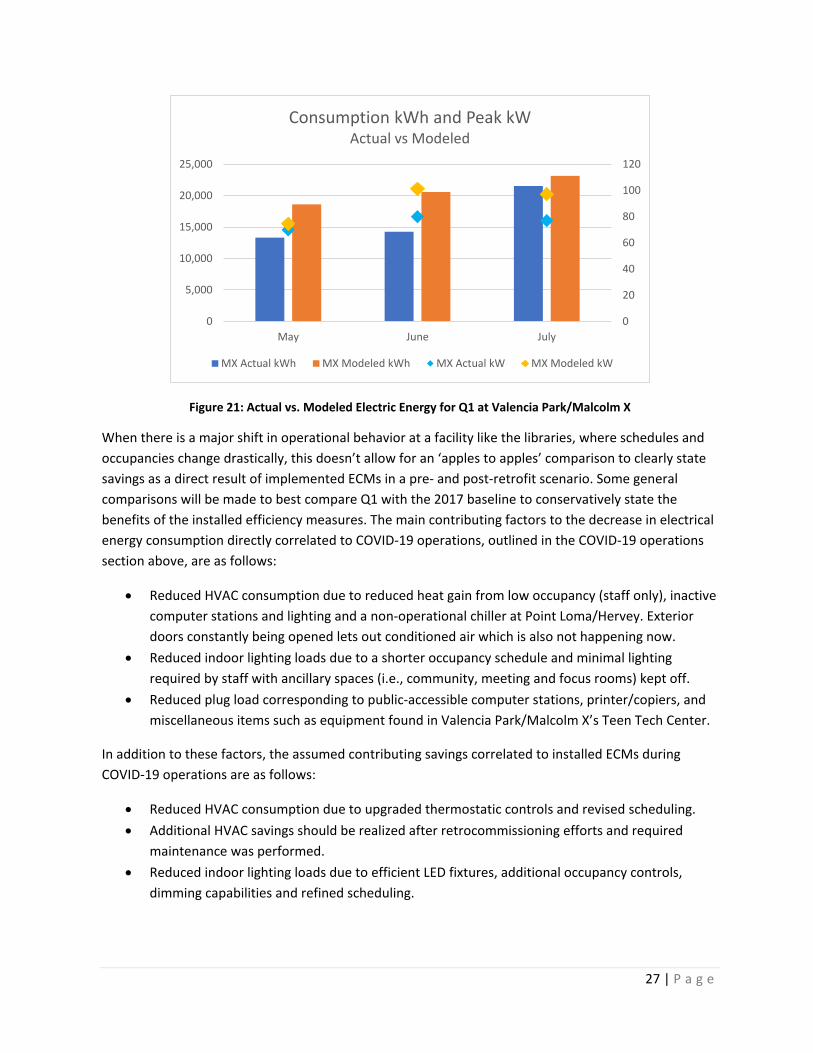
Figure 21: Actual vs. Modeled Electric Energy for Q1 at Valencia Park/Malcolm X
When there is a major shift in operational behavior at a facility like the libraries, where schedules and occupancies change drastically, this doesn’t allow for an ‘apples to apples’ comparison to clearly state savings as a direct result of implemented ECMs in a pre- and post-retrofit scenario. Some general comparisons will be made to best compare Q1 with the 2017 baseline to conservatively state the benefits of the installed efficiency measures. The main contributing factors to the decrease in electrical energy consumption directly correlated to COVID-19 operations, outlined in the COVID-19 operations section above, are as follows:
• Reduced HVAC consumption due to reduced heat gain from low occupancy (staff only), inactive computer stations and lighting and a non-operational chiller at Point Loma/Hervey. Exterior doors constantly being opened lets out conditioned air which is also not happening now.
• Reduced indoor lighting loads due to a shorter occupancy schedule and minimal lighting required by staff with ancillary spaces (i.e., community, meeting and focus rooms) kept off.
• Reduced plug load corresponding to public-accessible computer stations, printer/copiers, and miscellaneous items such as equipment found in Valencia Park/Malcolm X’s Teen Tech Center.
In addition to these factors, the assumed contributing savings correlated to installed ECMs during COVID-19 operations are as follows:
• Reduced HVAC consumption due to upgraded thermostatic controls and revised scheduling. • Additional HVAC savings should be realized after retrocommissioning efforts and required
maintenance was performed. • Reduced indoor lighting loads due to efficient LED fixtures, additional occupancy controls,
dimming capabilities and refined scheduling.
0
20
40
60
80
100
120
0
5,000
10,000
15,000
20,000
25,000
May June July
Consumption kWh and Peak kWActual vs Modeled
MX Actual kWh MX Modeled kWh MX Actual kW MX Modeled kW
28 | P a g e
• Reduced ‘active’ or ‘on’ time for large printer/copiers due to local occupancy controls switching units to ‘standby’ when not in use.
• Any future equipment failure or maintenance issue that will become visually apparent through end-use monitoring and data collection and interpretation by facility staff.
At the time this report was written, there is insufficient evidence to soundly state estimated savings as a result of installed ECMs and further energy monitoring might enlighten the analysis. In anticipation of a prolonged library shutdown, additional data acquired in Q2 and Q3 will capture seasonal changes and allow for possible energy correlations where assumptions can be made with more supporting information.
Conclusion Due to the circumstance mentioned throughout the report, there was no clear way to definitively identify energy savings associated with individual ECMs or by whole building. The data collection and interpretation for Q1 M&V purposes did not have any major issues and looks to be accurate for how the buildings are being currently operated. The energy profile created from this data shows how different COVID-19 operations are from the baseline period of 2017.
The end-use breakout of energy consumption is still in line with the baseline as expected with a majority of energy consumption attributed to HVAC. PV production was noticed to be slightly above the 2018 data and is overproducing on a monthly basis at Serra Mesa-Kearny Mesa and Valencia Park/Malcolm X Libraries. An attempt was made to compare Q1 and baseline energy by looking at the two national holidays, Memorial Day (May 25) and Independence Day (July 4), where the libraries are closed with minimal energy consumption. Although, it was found this was not effective as it was too small of a data sample and the three libraries were either just below, equal to or just above the baseline consumption for that same day in 2017. Additional data acquired in Q2 and Q3 will hopefully provide insight to possible energy correlations to support sound M&V savings estimates.

29 | P a g e
Appendix A: Point Loma/Hervey Daily End-Use Consumption
0 100 200 300 400 500 600 700 800
5/1/20
5/2/20
5/3/20
5/4/20
5/5/20
5/6/20
5/7/20
5/8/20
5/9/20
5/10/20
5/11/20
5/12/20
5/13/20
5/14/20
5/15/20
5/16/20
5/17/20
5/18/20
5/19/20
5/20/20
5/21/20
5/22/20
5/23/20
5/24/20
5/25/20
5/26/20
5/27/20
5/28/20
5/29/20
5/30/20
5/31/20
May Daily End-use Breakout - Point Loma/Hervey
Lighting Plug HVAC Misc
30 | P a g e
0 100 200 300 400 500 600 700 800 900
6/1/20
6/2/20
6/3/20
6/4/20
6/5/20
6/6/20
6/7/20
6/8/20
6/9/20
6/10/20
6/11/20
6/12/20
6/13/20
6/14/20
6/15/20
6/16/20
6/17/20
6/18/20
6/19/20
6/20/20
6/21/20
6/22/20
6/23/20
6/24/20
6/25/20
6/26/20
6/27/20
6/28/20
6/29/20
6/30/20
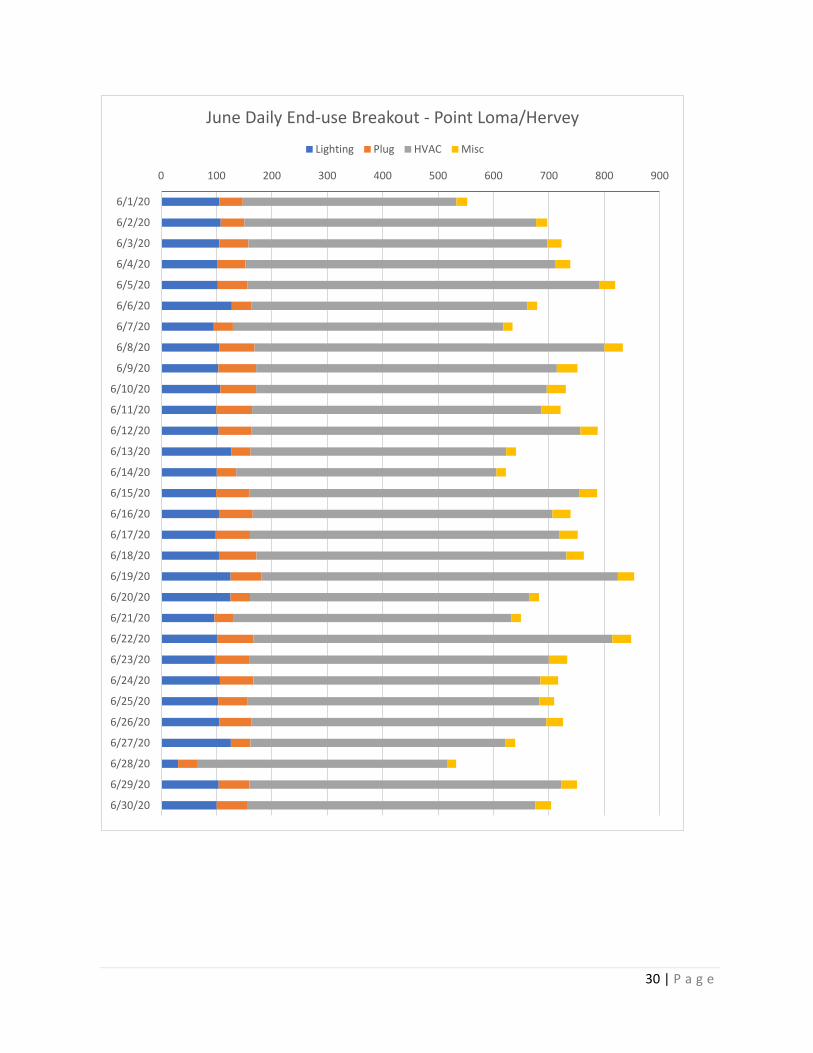
June Daily End-use Breakout - Point Loma/Hervey
Lighting Plug HVAC Misc

31 | P a g e
0 100 200 300 400 500 600 700 800 900
7/1/20
7/2/20
7/3/20
7/4/20
7/5/20
7/6/20
7/7/20
7/8/20
7/9/20
7/10/20
7/11/20
7/12/20
7/13/20
7/14/20
7/15/20
7/16/20
7/17/20
7/18/20
7/19/20
7/20/20
7/21/20
7/22/20
7/23/20
7/24/20
7/25/20
7/26/20
7/27/20
7/28/20
7/29/20
7/30/20
7/31/20
July Daily End-use Breakout - Point Loma/Hervey
Lighting Plug HVAC Misc
32 | P a g e
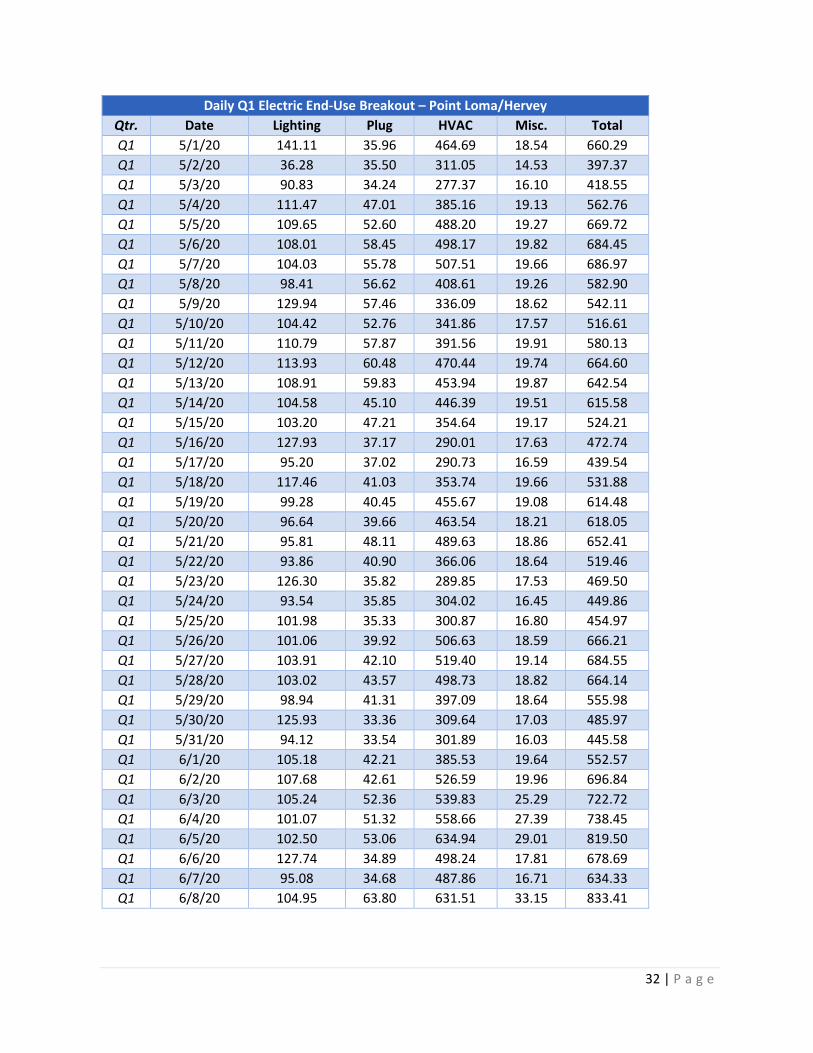
Daily Q1 Electric End-Use Breakout – Point Loma/Hervey Qtr. Date Lighting Plug HVAC Misc. Total Q1 5/1/20 141.11 35.96 464.69 18.54 660.29 Q1 5/2/20 36.28 35.50 311.05 14.53 397.37 Q1 5/3/20 90.83 34.24 277.37 16.10 418.55 Q1 5/4/20 111.47 47.01 385.16 19.13 562.76 Q1 5/5/20 109.65 52.60 488.20 19.27 669.72 Q1 5/6/20 108.01 58.45 498.17 19.82 684.45 Q1 5/7/20 104.03 55.78 507.51 19.66 686.97 Q1 5/8/20 98.41 56.62 408.61 19.26 582.90 Q1 5/9/20 129.94 57.46 336.09 18.62 542.11 Q1 5/10/20 104.42 52.76 341.86 17.57 516.61 Q1 5/11/20 110.79 57.87 391.56 19.91 580.13 Q1 5/12/20 113.93 60.48 470.44 19.74 664.60 Q1 5/13/20 108.91 59.83 453.94 19.87 642.54 Q1 5/14/20 104.58 45.10 446.39 19.51 615.58 Q1 5/15/20 103.20 47.21 354.64 19.17 524.21 Q1 5/16/20 127.93 37.17 290.01 17.63 472.74 Q1 5/17/20 95.20 37.02 290.73 16.59 439.54 Q1 5/18/20 117.46 41.03 353.74 19.66 531.88 Q1 5/19/20 99.28 40.45 455.67 19.08 614.48 Q1 5/20/20 96.64 39.66 463.54 18.21 618.05 Q1 5/21/20 95.81 48.11 489.63 18.86 652.41 Q1 5/22/20 93.86 40.90 366.06 18.64 519.46 Q1 5/23/20 126.30 35.82 289.85 17.53 469.50 Q1 5/24/20 93.54 35.85 304.02 16.45 449.86 Q1 5/25/20 101.98 35.33 300.87 16.80 454.97 Q1 5/26/20 101.06 39.92 506.63 18.59 666.21 Q1 5/27/20 103.91 42.10 519.40 19.14 684.55 Q1 5/28/20 103.02 43.57 498.73 18.82 664.14 Q1 5/29/20 98.94 41.31 397.09 18.64 555.98 Q1 5/30/20 125.93 33.36 309.64 17.03 485.97 Q1 5/31/20 94.12 33.54 301.89 16.03 445.58 Q1 6/1/20 105.18 42.21 385.53 19.64 552.57 Q1 6/2/20 107.68 42.61 526.59 19.96 696.84 Q1 6/3/20 105.24 52.36 539.83 25.29 722.72 Q1 6/4/20 101.07 51.32 558.66 27.39 738.45 Q1 6/5/20 102.50 53.06 634.94 29.01 819.50 Q1 6/6/20 127.74 34.89 498.24 17.81 678.69 Q1 6/7/20 95.08 34.68 487.86 16.71 634.33 Q1 6/8/20 104.95 63.80 631.51 33.15 833.41

33 | P a g e
Q1 6/9/20 103.30 68.20 542.71 37.24 751.45 Q1 6/10/20 107.14 64.30 524.68 34.48 730.60 Q1 6/11/20 99.42 64.82 521.75 34.99 720.98 Q1 6/12/20 103.87 58.85 593.98 31.31 788.01 Q1 6/13/20 126.53 35.13 461.09 17.94 640.70 Q1 6/14/20 100.43 35.14 469.66 17.03 622.26 Q1 6/15/20 99.33 59.82 596.35 31.46 786.96 Q1 6/16/20 104.58 60.82 540.79 32.88 739.06 Q1 6/17/20 98.73 61.70 558.93 32.65 752.01 Q1 6/18/20 104.57 67.60 559.36 31.60 763.13 Q1 6/19/20 125.55 55.82 643.12 29.39 853.88 Q1 6/20/20 125.34 35.19 503.62 18.00 682.16 Q1 6/21/20 96.35 35.01 500.99 17.08 649.44 Q1 6/22/20 102.05 64.34 647.93 34.22 848.55 Q1 6/23/20 97.10 61.73 540.98 33.14 732.94 Q1 6/24/20 106.24 60.37 518.03 31.89 716.53 Q1 6/25/20 103.23 52.13 527.35 26.60 709.31 Q1 6/26/20 104.98 57.72 532.63 30.21 725.54 Q1 6/27/20 126.04 35.35 459.56 18.08 639.02 Q1 6/28/20 30.79 35.50 450.99 15.17 532.46 Q1 6/29/20 104.07 55.33 562.94 28.36 750.70 Q1 6/30/20 100.53 56.05 518.70 28.63 703.91 Q1 7/1/20 105.11 68.37 563.13 35.66 772.27 Q1 7/2/20 100.63 61.05 556.14 31.80 749.62 Q1 7/3/20 124.77 36.37 642.92 18.81 822.86 Q1 7/4/20 122.63 35.03 494.50 18.45 670.61 Q1 7/5/20 90.95 35.52 497.98 17.38 641.82 Q1 7/6/20 101.35 64.61 649.59 34.30 849.85 Q1 7/7/20 100.70 69.89 546.92 37.29 754.81 Q1 7/8/20 104.11 69.33 521.62 37.32 732.38 Q1 7/9/20 102.31 57.51 454.65 30.76 645.24 Q1 7/10/20 98.69 71.18 504.27 31.43 705.57 Q1 7/11/20 125.49 51.38 400.97 18.03 595.87 Q1 7/12/20 93.73 50.84 402.00 17.08 563.66 Q1 7/13/20 104.07 75.77 521.56 32.84 734.24 Q1 7/14/20 105.19 76.16 535.95 36.59 753.89 Q1 7/15/20 105.20 76.37 542.14 34.99 758.70 Q1 7/16/20 107.65 77.91 551.11 31.00 767.67 Q1 7/17/20 105.67 68.14 537.41 29.08 740.31 Q1 7/18/20 20.95 52.06 431.80 15.92 520.72 Q1 7/19/20 96.28 48.65 428.77 18.00 591.70
34 | P a g e
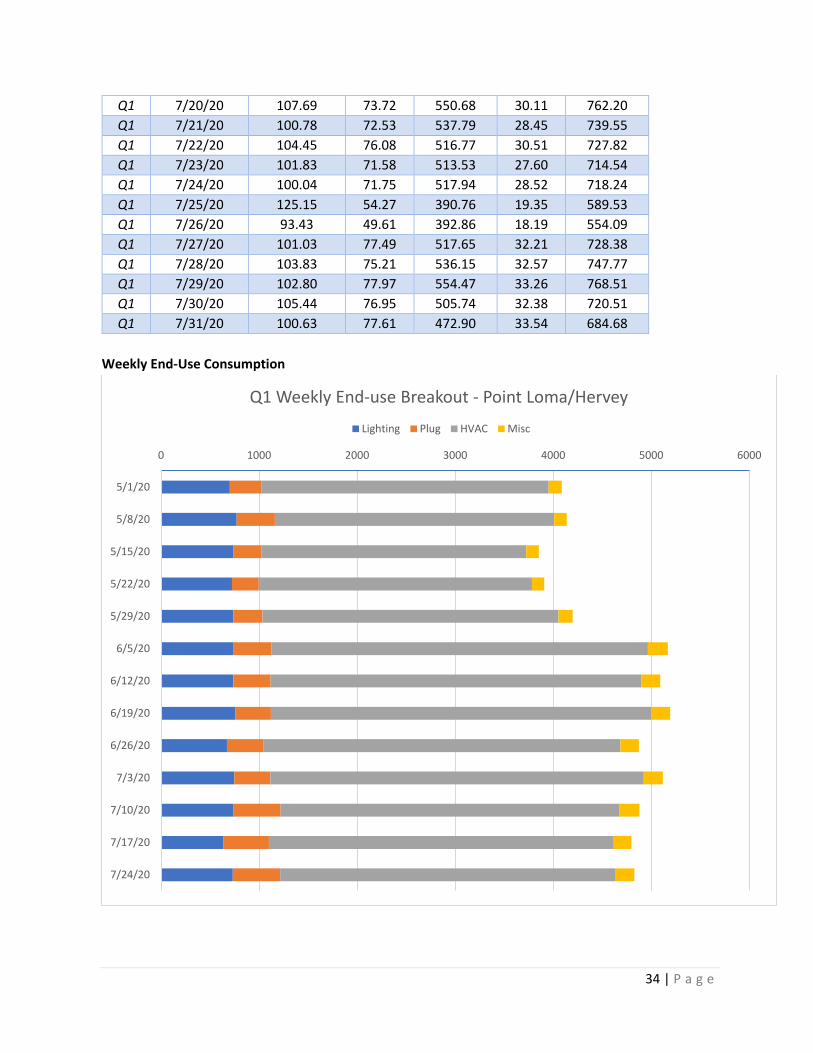
Q1 7/20/20 107.69 73.72 550.68 30.11 762.20 Q1 7/21/20 100.78 72.53 537.79 28.45 739.55 Q1 7/22/20 104.45 76.08 516.77 30.51 727.82 Q1 7/23/20 101.83 71.58 513.53 27.60 714.54 Q1 7/24/20 100.04 71.75 517.94 28.52 718.24 Q1 7/25/20 125.15 54.27 390.76 19.35 589.53 Q1 7/26/20 93.43 49.61 392.86 18.19 554.09 Q1 7/27/20 101.03 77.49 517.65 32.21 728.38 Q1 7/28/20 103.83 75.21 536.15 32.57 747.77 Q1 7/29/20 102.80 77.97 554.47 33.26 768.51 Q1 7/30/20 105.44 76.95 505.74 32.38 720.51 Q1 7/31/20 100.63 77.61 472.90 33.54 684.68
Weekly End-Use Consumption
0 1000 2000 3000 4000 5000 6000
5/1/20
5/8/20
5/15/20
5/22/20
5/29/20
6/5/20
6/12/20
6/19/20
6/26/20
7/3/20
7/10/20
7/17/20
7/24/20
Q1 Weekly End-use Breakout - Point Loma/Hervey
Lighting Plug HVAC Misc

35 | P a g e
Weekly Q1 Electric End-Use Breakout – Point Loma/Hervey Date Lighting Plug HVAC Misc. Total
5/1/20 701.37 319.54 2932.15 134.49 4087.54 5/8/20 770.97 390.12 2848.89 127.77 4137.76
5/15/20 735.51 290.64 2697.96 129.20 3853.31 5/22/20 723.68 273.47 2785.56 125.97 3908.68 5/29/20 738.17 296.71 3019.23 143.98 4198.10 6/5/20 740.13 383.75 3841.70 203.37 5168.95
6/12/20 738.03 379.06 3780.16 194.87 5092.12 6/19/20 755.86 364.60 3882.02 190.32 5192.80 6/26/20 672.15 369.36 3644.09 187.91 4873.51 7/3/20 746.82 368.26 3808.19 194.31 5117.58
7/10/20 740.01 479.61 3458.01 201.98 4879.60 7/17/20 637.66 462.76 3516.75 179.68 4796.83 7/24/20 731.71 483.24 3415.58 196.49 4827.01

36 | P a g e
Appendix B: Serra Mesa-Kearney Mesa Daily End-Use Consumption
0 50 100 150 200 250 300 350 400 450 500
5/1/20
5/2/20
5/3/20
5/4/20
5/5/20
5/6/20
5/7/20
5/8/20
5/9/20
5/10/20
5/11/20
5/12/20
5/13/20
5/14/20
5/15/20
5/16/20
5/17/20
5/18/20
5/19/20
5/20/20
5/21/20
5/22/20
5/23/20
5/24/20
5/25/20
5/26/20
5/27/20
5/28/20
5/29/20
5/30/20
5/31/20
May Daily End-use Breakout - Serra Mesa-Kearny Mesa
Lighting Plug HVAC Misc

37 | P a g e
0 100 200 300 400 500 600
6/1/20
6/2/20
6/3/20
6/4/20
6/5/20
6/6/20
6/7/20
6/8/20
6/9/20
6/10/20
6/11/20
6/12/20
6/13/20
6/14/20
6/15/20
6/16/20
6/17/20
6/18/20
6/19/20
6/20/20
6/21/20
6/22/20
6/23/20
6/24/20
6/25/20
6/26/20
6/27/20
6/28/20
6/29/20
6/30/20
June Daily End-use Breakout - Serra Mesa-Kearny Mesa
Lighting Plug HVAC Misc
38 | P a g e
0 100 200 300 400 500 600 700 800
7/1/20
7/2/20
7/3/20
7/4/20
7/5/20
7/6/20
7/7/20
7/8/20
7/9/20
7/10/20
7/11/20
7/12/20
7/13/20
7/14/20
7/15/20
7/16/20
7/17/20
7/18/20
7/19/20
7/20/20
7/21/20
7/22/20
7/23/20
7/24/20
7/25/20
7/26/20
7/27/20
7/28/20
7/29/20
7/30/20
7/31/20
July Daily End-use Breakout - Serra Mesa-Kearny Mesa
Lighting Plug HVAC Misc

39 | P a g e
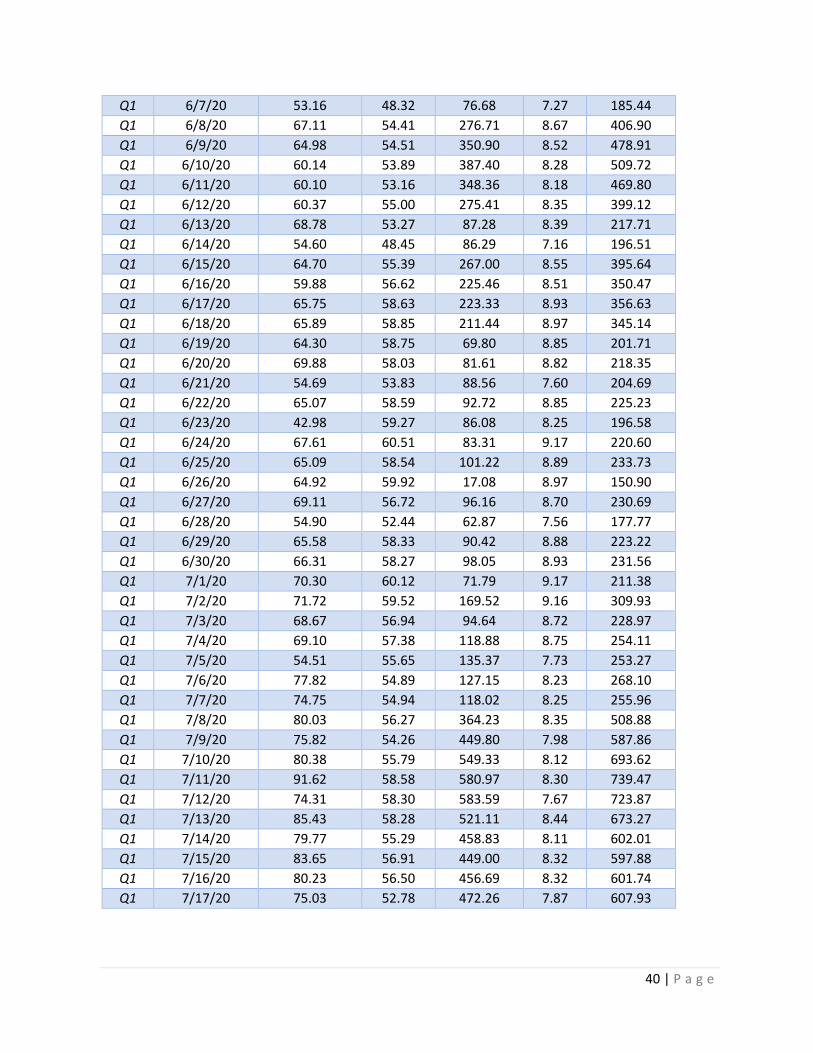
Daily Q1 Electric End-Use Breakout – Serra Mesa-Kearny Mesa Qtr. Date Lighting Plug HVAC Misc. Total Q1 5/1/20 81.42 42.82 241.00 7.06 372.30 Q1 5/2/20 68.08 36.08 80.66 6.16 190.97 Q1 5/3/20 53.61 36.63 81.07 5.76 177.07 Q1 5/4/20 81.06 39.73 262.94 7.00 390.72 Q1 5/5/20 55.27 37.95 307.72 6.07 407.01 Q1 5/6/20 64.88 38.01 191.28 6.39 300.56 Q1 5/7/20 69.18 50.31 319.06 8.23 446.78 Q1 5/8/20 55.25 42.42 257.15 6.43 361.24 Q1 5/9/20 68.67 41.33 82.30 6.68 198.99 Q1 5/10/20 54.05 41.34 82.65 6.20 184.24 Q1 5/11/20 71.84 45.00 244.49 7.05 368.38 Q1 5/12/20 61.86 44.08 228.99 6.83 341.76 Q1 5/13/20 73.32 55.69 202.24 8.63 339.87 Q1 5/14/20 57.90 44.47 218.48 6.54 327.39 Q1 5/15/20 43.70 50.08 247.37 6.76 347.90 Q1 5/16/20 67.68 42.65 67.61 6.60 184.53 Q1 5/17/20 53.66 42.55 77.18 6.12 179.51 Q1 5/18/20 61.03 42.47 235.76 6.51 345.77 Q1 5/19/20 59.40 43.06 200.78 6.36 309.60 Q1 5/20/20 65.80 44.70 216.92 6.79 334.22 Q1 5/21/20 41.68 42.67 230.54 5.85 320.74 Q1 5/22/20 54.95 41.17 224.31 6.19 326.63 Q1 5/23/20 69.45 40.41 98.41 6.48 214.74 Q1 5/24/20 53.26 40.10 73.44 5.87 172.67 Q1 5/25/20 68.69 40.03 81.23 6.40 196.35 Q1 5/26/20 45.58 41.89 305.46 5.93 398.87 Q1 5/27/20 42.61 54.22 302.10 7.60 406.54 Q1 5/28/20 47.31 53.40 269.05 7.73 377.49 Q1 5/29/20 68.55 53.37 216.52 8.42 346.85 Q1 5/30/20 69.70 53.09 88.26 8.28 219.33 Q1 5/31/20 54.81 48.85 76.97 7.06 187.69 Q1 6/1/20 68.64 54.15 274.01 8.46 405.26 Q1 6/2/20 66.01 53.19 277.31 8.34 404.85 Q1 6/3/20 68.19 53.48 335.72 8.46 465.84 Q1 6/4/20 67.58 52.90 228.14 8.36 356.99 Q1 6/5/20 66.74 53.09 225.33 8.41 353.58 Q1 6/6/20 68.51 52.96 79.93 8.45 209.84
40 | P a g e
Q1 6/7/20 53.16 48.32 76.68 7.27 185.44 Q1 6/8/20 67.11 54.41 276.71 8.67 406.90 Q1 6/9/20 64.98 54.51 350.90 8.52 478.91 Q1 6/10/20 60.14 53.89 387.40 8.28 509.72 Q1 6/11/20 60.10 53.16 348.36 8.18 469.80 Q1 6/12/20 60.37 55.00 275.41 8.35 399.12 Q1 6/13/20 68.78 53.27 87.28 8.39 217.71 Q1 6/14/20 54.60 48.45 86.29 7.16 196.51 Q1 6/15/20 64.70 55.39 267.00 8.55 395.64 Q1 6/16/20 59.88 56.62 225.46 8.51 350.47 Q1 6/17/20 65.75 58.63 223.33 8.93 356.63 Q1 6/18/20 65.89 58.85 211.44 8.97 345.14 Q1 6/19/20 64.30 58.75 69.80 8.85 201.71 Q1 6/20/20 69.88 58.03 81.61 8.82 218.35 Q1 6/21/20 54.69 53.83 88.56 7.60 204.69 Q1 6/22/20 65.07 58.59 92.72 8.85 225.23 Q1 6/23/20 42.98 59.27 86.08 8.25 196.58 Q1 6/24/20 67.61 60.51 83.31 9.17 220.60 Q1 6/25/20 65.09 58.54 101.22 8.89 233.73 Q1 6/26/20 64.92 59.92 17.08 8.97 150.90 Q1 6/27/20 69.11 56.72 96.16 8.70 230.69 Q1 6/28/20 54.90 52.44 62.87 7.56 177.77 Q1 6/29/20 65.58 58.33 90.42 8.88 223.22 Q1 6/30/20 66.31 58.27 98.05 8.93 231.56 Q1 7/1/20 70.30 60.12 71.79 9.17 211.38 Q1 7/2/20 71.72 59.52 169.52 9.16 309.93 Q1 7/3/20 68.67 56.94 94.64 8.72 228.97 Q1 7/4/20 69.10 57.38 118.88 8.75 254.11 Q1 7/5/20 54.51 55.65 135.37 7.73 253.27 Q1 7/6/20 77.82 54.89 127.15 8.23 268.10 Q1 7/7/20 74.75 54.94 118.02 8.25 255.96 Q1 7/8/20 80.03 56.27 364.23 8.35 508.88 Q1 7/9/20 75.82 54.26 449.80 7.98 587.86 Q1 7/10/20 80.38 55.79 549.33 8.12 693.62 Q1 7/11/20 91.62 58.58 580.97 8.30 739.47 Q1 7/12/20 74.31 58.30 583.59 7.67 723.87 Q1 7/13/20 85.43 58.28 521.11 8.44 673.27 Q1 7/14/20 79.77 55.29 458.83 8.11 602.01 Q1 7/15/20 83.65 56.91 449.00 8.32 597.88 Q1 7/16/20 80.23 56.50 456.69 8.32 601.74 Q1 7/17/20 75.03 52.78 472.26 7.87 607.93

41 | P a g e
Q1 7/18/20 77.10 49.95 477.46 7.65 612.16 Q1 7/19/20 61.29 50.09 442.52 7.12 561.02 Q1 7/20/20 77.06 53.27 434.51 8.02 572.87 Q1 7/21/20 75.40 58.04 444.92 8.75 587.11 Q1 7/22/20 76.21 48.43 396.94 7.46 529.03 Q1 7/23/20 73.82 49.18 372.13 7.48 502.61 Q1 7/24/20 74.99 48.69 391.86 7.48 523.02 Q1 7/25/20 76.72 45.06 440.31 7.14 569.24 Q1 7/26/20 60.42 44.99 438.63 6.51 550.55 Q1 7/27/20 72.12 48.22 423.13 7.34 550.81 Q1 7/28/20 73.83 49.91 409.11 7.53 540.38 Q1 7/29/20 71.86 48.77 424.41 7.35 552.39 Q1 7/30/20 73.30 48.88 452.24 7.49 581.91 Q1 7/31/20 74.87 48.92 534.69 7.50 665.98
Weekly End-Use Consumption
0 500 1000 1500 2000 2500 3000 3500 4000 4500 5000
5/1/20
5/8/20
5/15/20
5/22/20
5/29/20
6/5/20
6/12/20
6/19/20
6/26/20
7/3/20
7/10/20
7/17/20
7/24/20
Q1 Weekly End-use Breakout - Serra Mesa-Kearny Mesa
Lighting Plug HVAC Misc

42 | P a g e
Weekly Q1 Electric End-Use Breakout – Serra Mesa-Kearny Mesa Date Lighting Plug HVAC Misc. Total
5/1/20 473.49 281.52 1483.73 48.35 2287.09 5/8/20 442.88 314.33 1316.30 46.04 2119.54
5/15/20 392.95 308.17 1276.16 44.99 2022.27 5/22/20 381.85 311.23 1353.99 46.22 2093.29 5/29/20 463.48 369.02 1496.93 57.37 2386.81 6/5/20 440.74 370.34 1745.31 57.78 2614.18
6/12/20 439.96 386.21 1376.21 58.85 2261.23 6/19/20 429.63 407.51 603.31 60.43 1500.87 6/26/20 462.86 405.32 605.89 61.38 1535.44 7/3/20 500.70 390.34 1408.09 58.02 2357.14
7/10/20 575.38 399.66 3599.52 57.28 4631.85 7/17/20 515.92 361.74 3040.73 54.34 3972.73 7/24/20 503.25 334.53 2979.69 50.83 3868.30
43 | P a g e
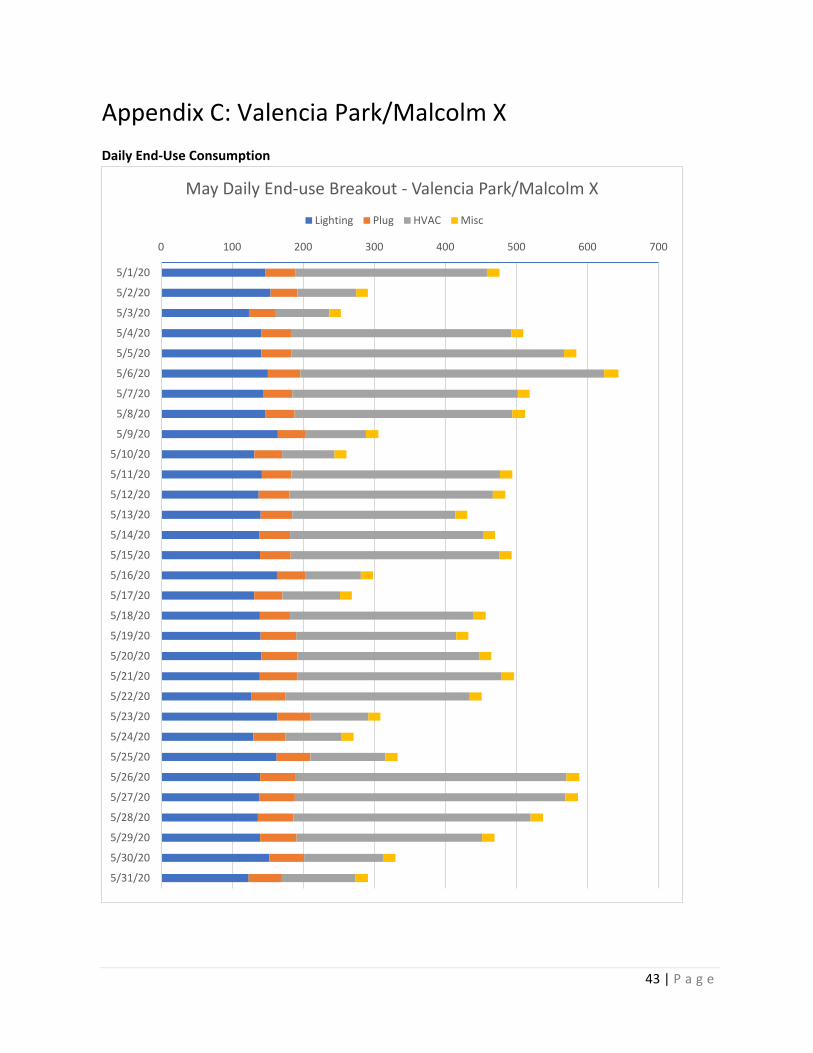
Appendix C: Valencia Park/Malcolm X Daily End-Use Consumption
0 100 200 300 400 500 600 700
5/1/20
5/2/20
5/3/20
5/4/20
5/5/20
5/6/20
5/7/20
5/8/20
5/9/20
5/10/20
5/11/20
5/12/20
5/13/20
5/14/20
5/15/20
5/16/20
5/17/20
5/18/20
5/19/20
5/20/20
5/21/20
5/22/20
5/23/20
5/24/20
5/25/20
5/26/20
5/27/20
5/28/20
5/29/20
5/30/20
5/31/20
May Daily End-use Breakout - Valencia Park/Malcolm X
Lighting Plug HVAC Misc

44 | P a g e
0 100 200 300 400 500 600 700 800
6/1/20
6/2/20
6/3/20
6/4/20
6/5/20
6/6/20
6/7/20
6/8/20
6/9/20
6/10/20
6/11/20
6/12/20
6/13/20
6/14/20
6/15/20
6/16/20
6/17/20
6/18/20
6/19/20
6/20/20
6/21/20
6/22/20
6/23/20
6/24/20
6/25/20
6/26/20
6/27/20
6/28/20
6/29/20
6/30/20
June Daily End-use Breakout - Valencia Park/Malcolm X
Lighting Plug HVAC Misc
45 | P a g e
0 200 400 600 800 1000 1200
7/1/20
7/2/20
7/3/20
7/4/20
7/5/20
7/6/20
7/7/20
7/8/20
7/9/20
7/10/20
7/11/20
7/12/20
7/13/20
7/14/20
7/15/20
7/16/20
7/17/20
7/18/20
7/19/20
7/20/20
7/21/20
7/22/20
7/23/20
7/24/20
7/25/20
7/26/20
7/27/20
7/28/20
7/29/20
7/30/20
7/31/20
July Daily End-use Breakout - Valencia Park/Malcolm X
Lighting Plug HVAC Misc

46 | P a g e
Daily Q1 Electric End-Use Breakout – Valencia Park/Malcolm X Qtr. Date Lighting Plug HVAC Misc. Total Q1 5/1/20 147.10 41.58 269.83 17.77 476.29 Q1 5/2/20 154.18 37.74 82.64 16.42 290.97 Q1 5/3/20 123.69 37.84 75.21 16.28 253.02 Q1 5/4/20 140.91 41.92 309.83 16.97 509.62 Q1 5/5/20 140.97 42.26 383.85 17.22 584.30 Q1 5/6/20 150.28 45.83 427.33 20.17 643.61 Q1 5/7/20 143.47 41.14 317.46 16.67 518.74 Q1 5/8/20 146.36 41.57 306.25 18.16 512.34 Q1 5/9/20 164.35 39.32 84.67 17.50 305.84 Q1 5/10/20 131.21 39.05 73.72 16.97 260.95 Q1 5/11/20 141.92 41.51 293.36 17.41 494.19 Q1 5/12/20 137.35 43.32 286.18 17.47 484.32 Q1 5/13/20 140.18 44.42 229.37 16.96 430.94 Q1 5/14/20 137.91 43.76 271.33 16.87 469.88 Q1 5/15/20 139.34 43.08 293.92 16.93 493.27 Q1 5/16/20 163.08 40.40 77.64 17.09 298.21 Q1 5/17/20 131.10 39.60 81.06 16.64 268.41 Q1 5/18/20 139.10 42.43 258.38 16.89 456.79 Q1 5/19/20 140.05 50.00 225.22 17.07 432.35 Q1 5/20/20 141.20 50.51 255.64 17.34 464.71 Q1 5/21/20 139.02 52.49 287.78 17.42 496.71 Q1 5/22/20 126.72 48.09 259.63 16.82 451.26 Q1 5/23/20 163.56 47.08 81.06 16.89 308.59 Q1 5/24/20 129.91 45.26 79.04 16.75 270.94 Q1 5/25/20 162.65 47.50 105.27 17.36 332.79 Q1 5/26/20 139.37 49.17 381.85 18.05 588.43 Q1 5/27/20 138.59 49.69 380.55 17.82 586.64 Q1 5/28/20 136.23 49.96 333.79 17.40 537.39 Q1 5/29/20 139.38 51.30 261.15 17.31 469.14 Q1 5/30/20 152.48 48.82 110.86 17.73 329.90 Q1 5/31/20 123.28 46.80 103.65 17.43 291.16 Q1 6/1/20 135.87 49.89 362.31 17.64 565.71 Q1 6/2/20 134.54 50.19 317.45 17.44 519.61 Q1 6/3/20 137.26 51.18 416.92 17.94 623.31 Q1 6/4/20 138.80 46.50 242.40 17.23 444.93 Q1 6/5/20 133.84 45.59 255.13 17.36 451.93 Q1 6/6/20 154.00 42.83 101.07 17.09 314.99

47 | P a g e
Q1 6/7/20 125.20 42.68 96.05 17.02 280.95 Q1 6/8/20 136.62 46.56 367.47 17.89 568.54 Q1 6/9/20 133.95 47.98 517.36 18.68 717.96 Q1 6/10/20 133.55 47.60 502.12 18.24 701.51 Q1 6/11/20 135.91 52.91 375.18 17.59 581.59 Q1 6/12/20 133.75 46.84 309.62 17.20 507.42 Q1 6/13/20 150.52 51.55 107.66 17.74 327.47 Q1 6/14/20 121.34 47.75 99.64 17.22 285.95 Q1 6/15/20 135.59 54.43 303.85 17.90 511.77 Q1 6/16/20 135.31 53.47 261.70 17.76 468.24 Q1 6/17/20 135.64 54.99 287.07 17.67 495.36 Q1 6/18/20 141.44 54.33 285.65 17.62 499.03 Q1 6/19/20 137.97 53.71 296.61 18.00 506.28 Q1 6/20/20 150.10 52.52 98.29 17.75 318.67 Q1 6/21/20 121.11 48.88 110.73 17.16 297.87 Q1 6/22/20 131.50 53.28 344.60 17.89 547.28 Q1 6/23/20 133.78 53.04 355.22 17.89 559.93 Q1 6/24/20 134.11 55.42 295.24 17.89 502.66 Q1 6/25/20 132.59 54.13 303.89 17.76 508.37 Q1 6/26/20 133.37 54.47 280.37 18.22 486.42 Q1 6/27/20 160.60 52.59 126.17 18.09 357.45 Q1 6/28/20 129.39 48.69 117.80 17.27 313.16 Q1 6/29/20 137.15 53.18 276.37 17.53 484.24 Q1 6/30/20 134.30 53.60 314.96 17.71 520.57 Q1 7/1/20 140.50 55.19 311.67 19.51 526.87 Q1 7/2/20 137.30 53.16 335.07 18.24 543.77 Q1 7/3/20 149.00 51.38 133.18 18.21 351.77 Q1 7/4/20 149.52 51.96 162.00 18.54 382.03 Q1 7/5/20 120.66 48.72 234.99 18.40 422.76 Q1 7/6/20 132.74 54.15 451.68 18.30 656.89 Q1 7/7/20 132.68 54.52 413.33 18.34 618.87 Q1 7/8/20 136.74 54.48 401.71 18.11 611.04 Q1 7/9/20 134.99 53.50 425.77 19.76 634.01 Q1 7/10/20 127.57 56.87 540.61 21.21 746.26 Q1 7/11/20 160.92 54.84 415.81 21.74 653.31 Q1 7/12/20 127.85 51.06 459.79 21.33 660.03 Q1 7/13/20 129.88 55.38 665.65 20.89 871.81 Q1 7/14/20 135.03 56.11 623.27 20.62 835.03 Q1 7/15/20 135.98 54.52 492.31 20.40 703.20 Q1 7/16/20 135.99 55.25 468.90 20.55 680.70 Q1 7/17/20 135.73 55.09 495.36 20.94 707.12

48 | P a g e
Q1 7/18/20 149.14 53.05 340.11 20.54 562.84 Q1 7/19/20 120.57 49.50 344.97 20.07 535.12 Q1 7/20/20 134.50 53.89 487.22 19.50 695.11 Q1 7/21/20 135.92 52.30 552.94 18.73 759.89 Q1 7/22/20 135.60 53.21 548.02 18.74 755.56 Q1 7/23/20 138.19 53.91 550.70 19.87 762.68 Q1 7/24/20 142.48 56.87 555.84 21.07 776.27 Q1 7/25/20 161.52 52.72 622.63 19.73 856.61 Q1 7/26/20 129.87 49.12 648.58 19.52 847.10 Q1 7/27/20 138.77 54.83 595.30 20.02 808.92 Q1 7/28/20 138.16 53.98 570.38 19.59 782.10 Q1 7/29/20 137.08 56.16 593.15 19.70 806.09 Q1 7/30/20 136.22 58.39 713.22 20.48 928.31 Q1 7/31/20 134.86 59.22 848.18 20.90 1063.15
Weekly End-Use Consumption
0 1000 2000 3000 4000 5000 6000 7000
5/1/20
5/8/20
5/15/20
5/22/20
5/29/20
6/5/20
6/12/20
6/19/20
6/26/20
7/3/20
7/10/20
7/17/20
7/24/20
Q1 Weekly End-use Breakout - Valencia Park/Malcolm X
Lighting Plug HVAC Misc

49 | P a g e
Weekly Q1 Electric End-Use Breakout – Valencia Park/Malcolm X Date Lighting Plug HVAC Misc. Total
5/1/20 1000.60 288.31 1866.14 121.34 3276.38 5/8/20 999.27 292.96 1544.88 121.89 2959.01
5/15/20 992.90 318.52 1479.64 119.38 2910.44 5/22/20 997.02 336.75 1621.19 121.08 3076.04 5/29/20 961.61 344.68 1814.75 122.72 3243.76 6/5/20 953.07 326.15 2214.38 123.87 3617.47
6/12/20 953.59 363.36 1655.19 123.11 3095.24 6/19/20 941.16 370.98 1804.58 124.34 3241.06 6/26/20 972.62 370.88 1762.40 126.58 3232.47 7/3/20 956.33 368.71 2222.66 129.66 3677.36
7/10/20 953.22 384.04 3666.34 146.73 5150.34 7/17/20 949.65 370.95 3319.32 138.40 4778.32 7/24/20 984.11 382.08 4299.09 140.11 5805.40