Embed Size (px)
Citation preview
Water Distribution System Analysis 2010 - WDSA2010 Tuscon, AZ, USA, Sept. 12-15, 2010
EPANET2 DESKTOP APPLICATION FOR PRESSURE DRIVENDEMAND MODELING
Assela Pathirana
Urban Water and Sanitation Department, UNESCO-IHE Institute for Water Education, Delft, The Netherlands,e-mail:[email protected]
Abstract
The fixed demand hydraulics engine of EPANET software in its original form is not suitable foranalysis of water distribution networks with low operating pressures. A modification of EPANETdesktop for pressure driven demand analysis, employing emitter modeling of demands, is presented.The introduced version is able to work in a fully transparent way with standard EPANET networkfiles and could be developed into other EPANET-toolkit based applications following the exact pro-cedure as with standard EPANET. A simple network example used to demonstrate the operation ofthe system. Finally an illustrative case study of the model application is presented.
Keywords: EPANET, Emitter, Pressure driven demand, Intermittent water supply
1. INTRODUCTION
Under ideal operating conditions, water distribution networks have adequate operating pressurethroughout the system, making the water withdrawal virtually independent of the system pressure– the demand is fully determined by the end-of-pipe, customer behavior. However, there aremany practical situations where the operating pressure of the networks are less than ideal – dueto excessive demand, among other reasons. Examples are contingencies like pipe breakage andday-to-day operation of many water networks of urban centers of the third world.
Ozger (2003) developed a semi-pressure-driven algorithm for network analysis that could circum-vent the problem of spurious negative pressures due to forced-demand conditions in the hydraulicanalysis. While being much more realistic compared to the standard demand-driven analysis, thisapproach had the weakness of withholding demands until the minimum service pressure is achieved.This is analogous to a situation where the customer volenteerly refrain from drawing water whenthe service-pressue is low. Cheung et al. (2005) implemented a pressure-sensitive demand versionof EPANET using the object oriented modification of EPANET known as OOTEN and utilizingemitter functionality of EPANET. This was a command line tool, not integrated to a graphicaluser interface. Giustolisi et al. (2008), among others, have presented new numerical algorithms tohandle pressure-dependent demand in networks.
Water Distribution System Analysis 2010 - WDSA2010 Tuscon, AZ, USA, Sept. 12-15, 2010
We modifed the EPANET 2.0 computational engine to implement pressure-sensitive demandin network calculations, in a way that is completely compatible with the existing user interface ofthe standard EPANET model. Further the EPANET-toolkit applications using the demand-drivenEPANET (standard) engine can benefit from this modified form without changing any applicationcode.
2. THEORY
As explained in section 1, standard demand driven analysis first imposes the demands on thenetwork and then analyses the resulting pressures. In a scenarios where the demand is fully depen-dent on pressure (e.g. Irrigation sprinkler system), the pressure-demand relationship is explainedby an emitter formula that states demand is proportional to a fractional power of the pressure(normally this power, α = 0.5 for nozzles). However, in reality, the behavior of network nodes thatrepresent a collection of household customers is much more complex. When there is adequate pres-sure in the system, the customers decide the demands (hence the demand driven analysis works).When there is not ‘adequate’ pressure (PECUP – will be further discussed in section 6), the demand(Q) depends on customer decided demand (Qo) as well as the current pressure of the system(P ).
Hence, all demand nodes of a network that has converged to a stable condition under realisticPDA should satisfy the following conditions:
1. For P > PECUP , Q = Q0
2. For P < 0, Q = 03. For 0 < P < PECUP , Q = SPα
where S is a proportionality constant known as emitter constant.
3. SOFTWARE ARCHITECTURE
Attempts were made to design the software as straght-forward as possible to use by the enduser as well as the toolkit-programmer. To ensure this, several principals were adopted during thedevelopment of the software:
1. Fully transparent EPANET toolkit calls. (e.g. The toolkit programmer need not worry aboutthe customization, but can use the new library with standard toolkit calls.)
2. Possibility to fully integrate with EPANET Desktop interface. (So that the full power andease of use of the Desktop interface can be used to setup, run and post-process models.)
3. Keep the changes within EPANET engine and Desktop interface to a minimum. (So that itis possible to upgrade the system with possible future EPANET versions.)
4. To make, as large portion of the project as possible, reusable for different future projectsrelated to customizing EPANET.
In order to achieve the above objectives, the development was divided to two distinct stages,namely
Water Distribution System Analysis 2010 - WDSA2010 Tuscon, AZ, USA, Sept. 12-15, 2010
Wrapper
Standard EPANET Source code
External Toolkit/GUI program
CustomCode(e.g.Emitter)
Customized epanet2.dll
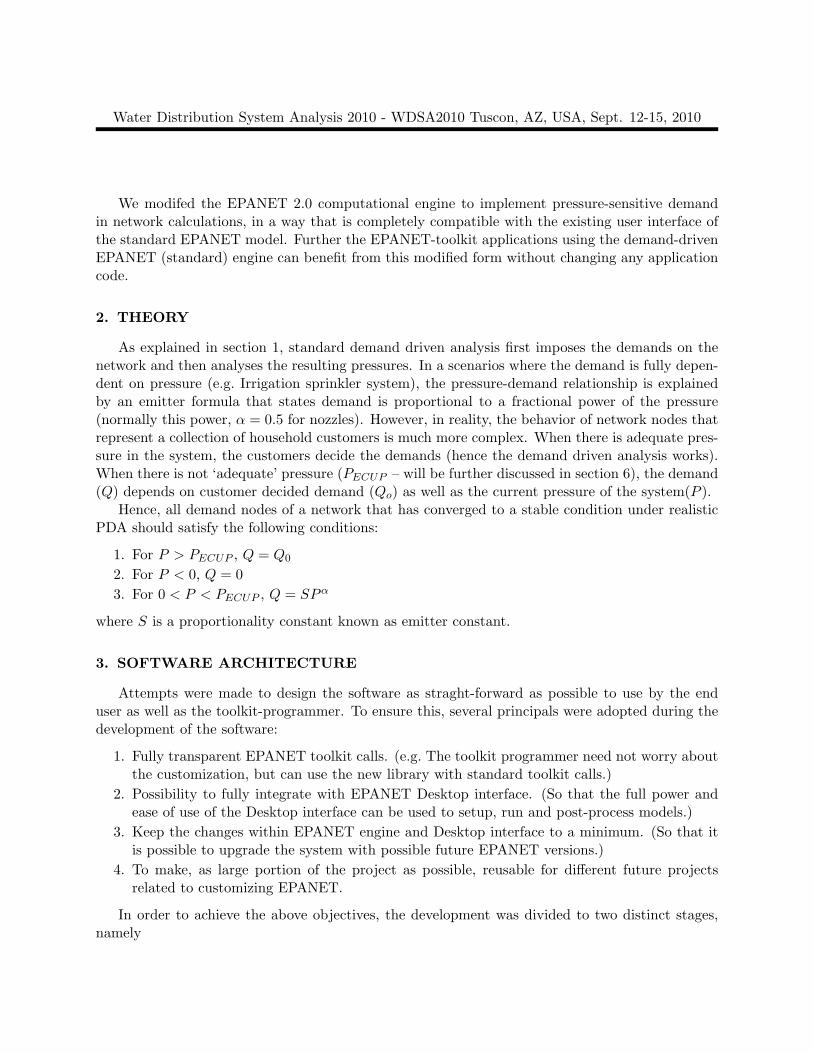
Figure 1: A block diagram of the customization scheme.
1. to build a wrapper for the standard EPANET engine, that allows to call a custom routinebefore execution of each toolkit call, and,
2. to develop the custom routines to implement emitter modification based on the above frame-work.
3.1. A wrapper for EPANET engine
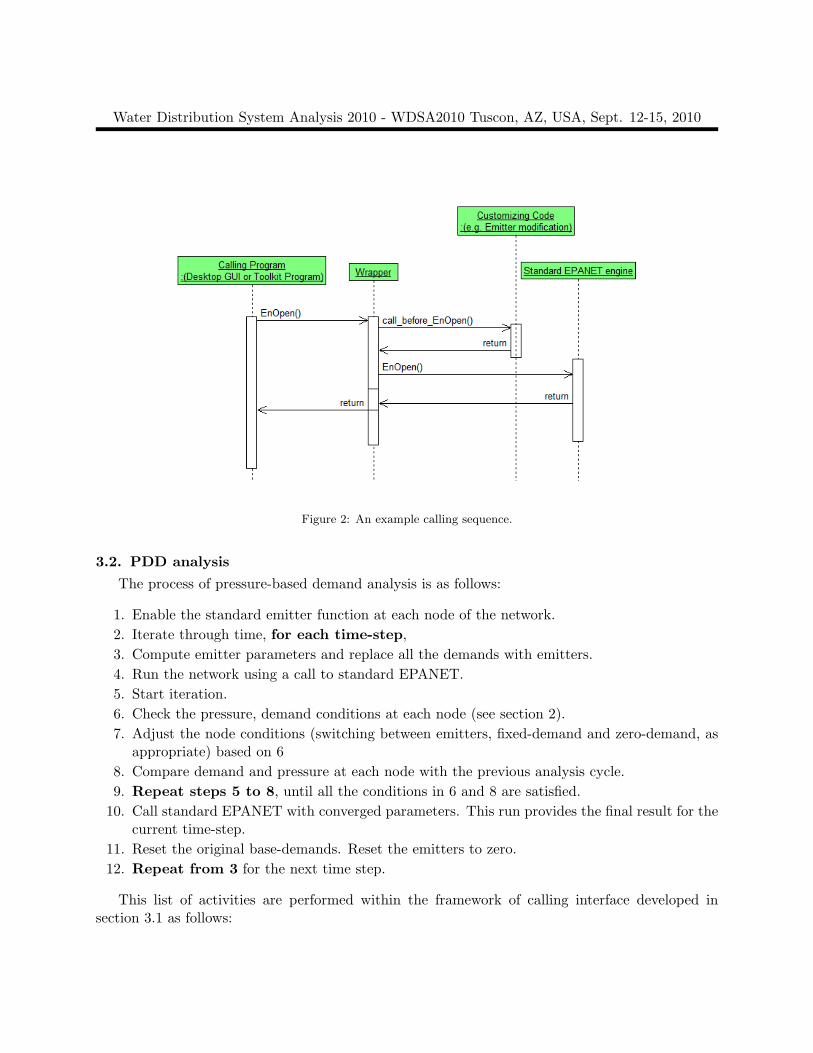
The EPANET program (Rossman, 2000) is designed in two distinct components: The analysisengine and the entity that operates the engine, where the latter can be the Desktop interface or acustomized toolkit code. This flexibility has allowed numerous adaptations of the engine code to beembedded in numerous other 3rd party tools in an elegant way. The two component communicatesvia a set of calls known as “toolkit-functions” (e.g. ENOpen, ENInitH, ENrunH, etc.). In thepresent modification, the task of the developed wrapper is to intercept these calls, first allow forrunning any custom code necessary to implement a modification and then pass the control to theEPANET engine. This architecture is explained in the block diagram in figure 1. An exampleof a call is shown in the sequence diagram in figure 2. The the user who develops the toolkitdriver does not have to worry about the fact that she is dealing with a customized EPANETengine. The wrapper will simply intercept the toolkit call (ENopen), calls the custom function(run before ENopen) and then calls the ENopen of the original EPANET engine.
The above calling interface is provided as a static library, that could be compiled into a dynamiclinking library after implementing the application logic. (See the example in section 3.2.)
Water Distribution System Analysis 2010 - WDSA2010 Tuscon, AZ, USA, Sept. 12-15, 2010
Figure 2: An example calling sequence.
3.2. PDD analysis
The process of pressure-based demand analysis is as follows:
1. Enable the standard emitter function at each node of the network.2. Iterate through time, for each time-step,3. Compute emitter parameters and replace all the demands with emitters.4. Run the network using a call to standard EPANET.5. Start iteration.6. Check the pressure, demand conditions at each node (see section 2).7. Adjust the node conditions (switching between emitters, fixed-demand and zero-demand, as
appropriate) based on 68. Compare demand and pressure at each node with the previous analysis cycle.9. Repeat steps 5 to 8, until all the conditions in 6 and 8 are satisfied.
10. Call standard EPANET with converged parameters. This run provides the final result for thecurrent time-step.
11. Reset the original base-demands. Reset the emitters to zero.12. Repeat from 3 for the next time step.
This list of activities are performed within the framework of calling interface developed insection 3.1 as follows:
Water Distribution System Analysis 2010 - WDSA2010 Tuscon, AZ, USA, Sept. 12-15, 2010
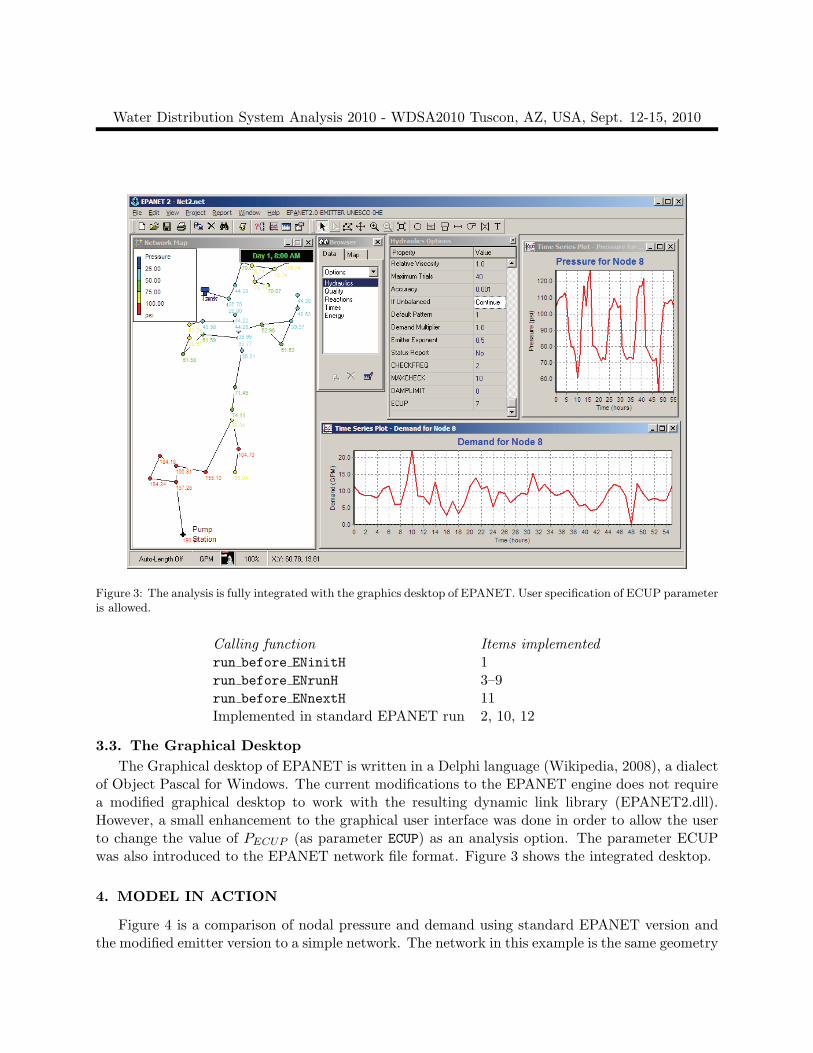
Figure 3: The analysis is fully integrated with the graphics desktop of EPANET. User specification of ECUP parameteris allowed.
Calling function Items implementedrun before ENinitH 1run before ENrunH 3–9run before ENnextH 11Implemented in standard EPANET run 2, 10, 12
3.3. The Graphical DesktopThe Graphical desktop of EPANET is written in a Delphi language (Wikipedia, 2008), a dialect
of Object Pascal for Windows. The current modifications to the EPANET engine does not requirea modified graphical desktop to work with the resulting dynamic link library (EPANET2.dll).However, a small enhancement to the graphical user interface was done in order to allow the userto change the value of PECUP (as parameter ECUP) as an analysis option. The parameter ECUPwas also introduced to the EPANET network file format. Figure 3 shows the integrated desktop.
4. MODEL IN ACTION
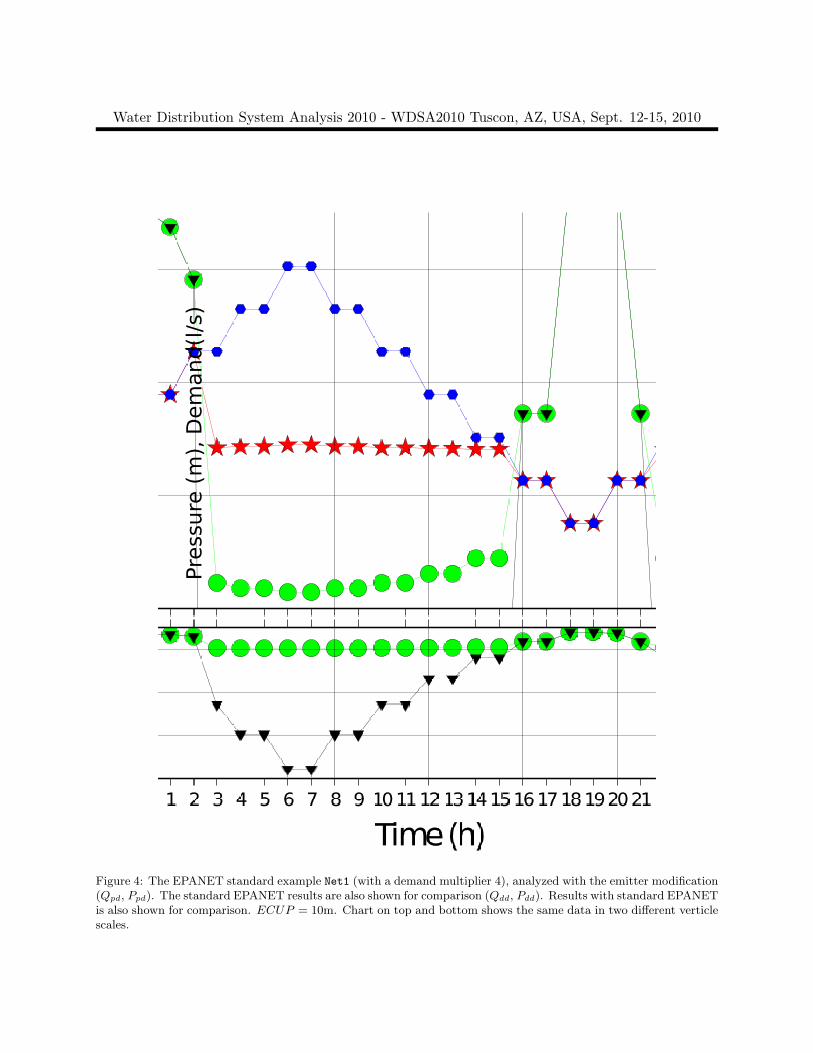
Figure 4 is a comparison of nodal pressure and demand using standard EPANET version andthe modified emitter version to a simple network. The network in this example is the same geometry
Water Distribution System Analysis 2010 - WDSA2010 Tuscon, AZ, USA, Sept. 12-15, 2010
as the standard example file Net1.net provided with EPANET 2.0 software. A demand multiplierof 4 was applied to create a pressure deficient situation in the network. The units were convertedfrom standard gallons per minute (GPM) to liters per second (LPS).
In the standard EPANET 2.0 software, the pressures drop to large negative values, attemptingto maintain the hydraulic balance in the system. This is physically unrealistic. On the otherhand, the emitter modified version has the emitters kick-in when the pressure is below ECUP ,modulating the flow. This results in a more physically realistic flow situation. The value of ECUPdepends very much on the network properties like the nature of the nodal demands and level ofsimplification from the reality. Experience shows that this values is around 10m for networks withnormal domestic demand.
In the next section we demonstrate the use of the software with an application.
5. APPLICATION: EXTENDING CUSTOMER MINUTES LOST CONCEPT
WaterNet (formerly Amsterdam Water Supply), the company managing the water supply ofAmsterdam City (Waternet, 2010), use the average number of minutes water supply disruption dueto repair activities per year per customer connection, termed as “Customer Minutes Lost (CML)”to benchmark its service levels. The repairs of major leakages and bursts are carried out by closingthe ‘value-section’ that includes the problematic pipe and the impact on this activity on CML iscalculated by the following non-hydraulic approach:
CMLi = Nc,itd,i (1)
where CMLi (units: min) is the contribution to the Cml by the closure of a value section i. Nc,i
and td,i are the number of customers connected within the value section i and the time period thesection was closed for repair, respectively. CML for the network is calculated as the sum of Cmlifor a year for the whole network divided by the number of customer connections in the network.
However, it is obvious that the closure of an interconnected value section of a network couldhave impact not only for the customers within that valve section, but for others outside that section,due to changes in the network hydraulics. The network situation after a burst but before closurefor repair can also contribute to the customer service levels. Three issues need to be resolved inorder to consider these for a more realistic estimation of CML,
1. Impact on the customers outside the valve section could be the partial supply of water dueto drops in the pressure. This requires the extending the definition of the CML concept.
2. Network hydraulics need to be taken in to account. There is the possibility of the networkbeing under pressurized.
3. A representation of pipe bursts in the hydraulic network so that the before-closure situationcan be simulated.
The CML concept was extended as follows: CMLm is the value of ‘Customer minutes lost’computed by assuming each customer connection that received only m percentage (or less) of itsrequired demand due to network disruptions. This necessitates the use of a network model that
Water Distribution System Analysis 2010 - WDSA2010 Tuscon, AZ, USA, Sept. 12-15, 2010
Pre
ssu
re (
m),
Dem
an
d(l
/s)
Figure 4: The EPANET standard example Net1 (with a demand multiplier 4), analyzed with the emitter modification(Qpd, Ppd). The standard EPANET results are also shown for comparison (Qdd, Pdd). Results with standard EPANETis also shown for comparison. ECUP = 10m. Chart on top and bottom shows the same data in two different verticlescales.
Water Distribution System Analysis 2010 - WDSA2010 Tuscon, AZ, USA, Sept. 12-15, 2010
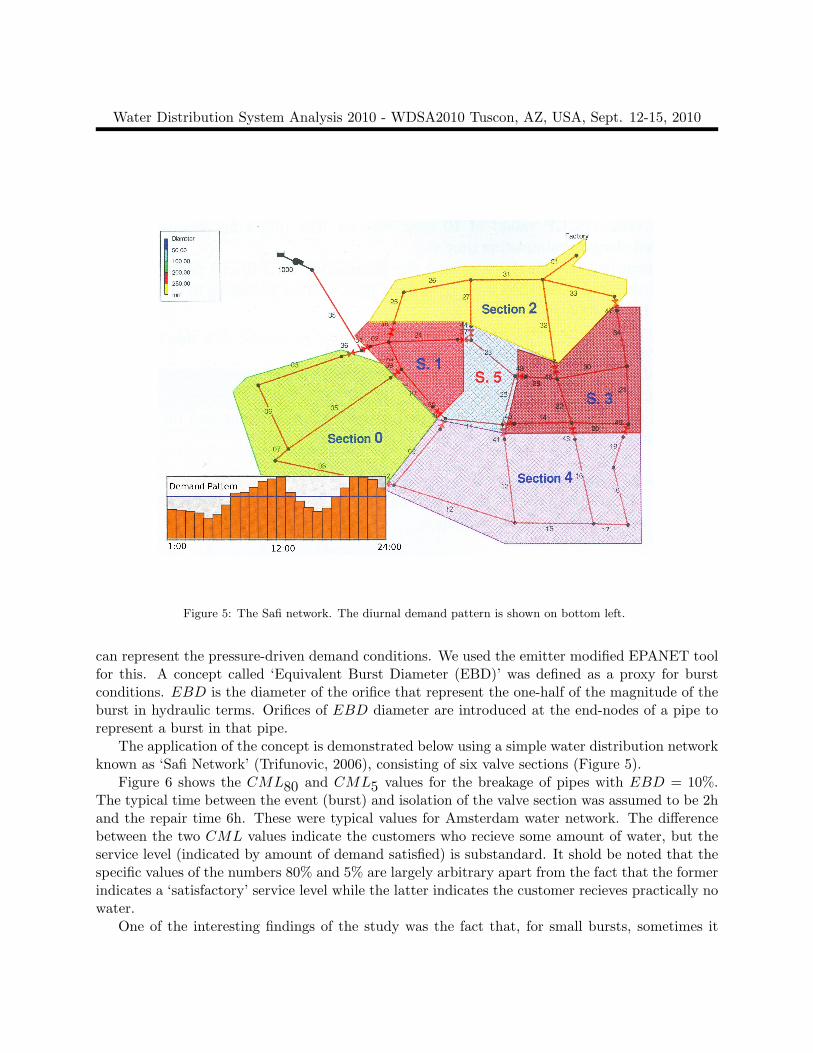
Figure 5: The Safi network. The diurnal demand pattern is shown on bottom left.
can represent the pressure-driven demand conditions. We used the emitter modified EPANET toolfor this. A concept called ‘Equivalent Burst Diameter (EBD)’ was defined as a proxy for burstconditions. EBD is the diameter of the orifice that represent the one-half of the magnitude of theburst in hydraulic terms. Orifices of EBD diameter are introduced at the end-nodes of a pipe torepresent a burst in that pipe.
The application of the concept is demonstrated below using a simple water distribution networkknown as ‘Safi Network’ (Trifunovic, 2006), consisting of six valve sections (Figure 5).
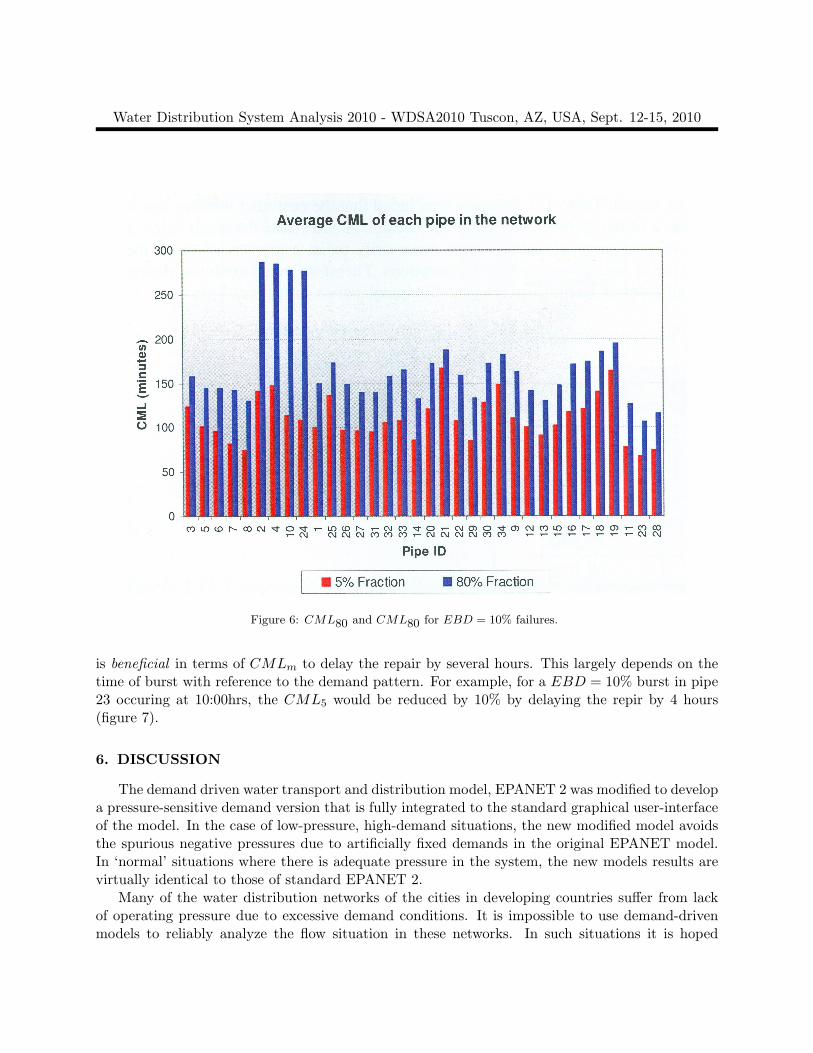
Figure 6 shows the CML80 and CML5 values for the breakage of pipes with EBD = 10%.The typical time between the event (burst) and isolation of the valve section was assumed to be 2hand the repair time 6h. These were typical values for Amsterdam water network. The differencebetween the two CML values indicate the customers who recieve some amount of water, but theservice level (indicated by amount of demand satisfied) is substandard. It shold be noted that thespecific values of the numbers 80% and 5% are largely arbitrary apart from the fact that the formerindicates a ‘satisfactory’ service level while the latter indicates the customer recieves practically nowater.
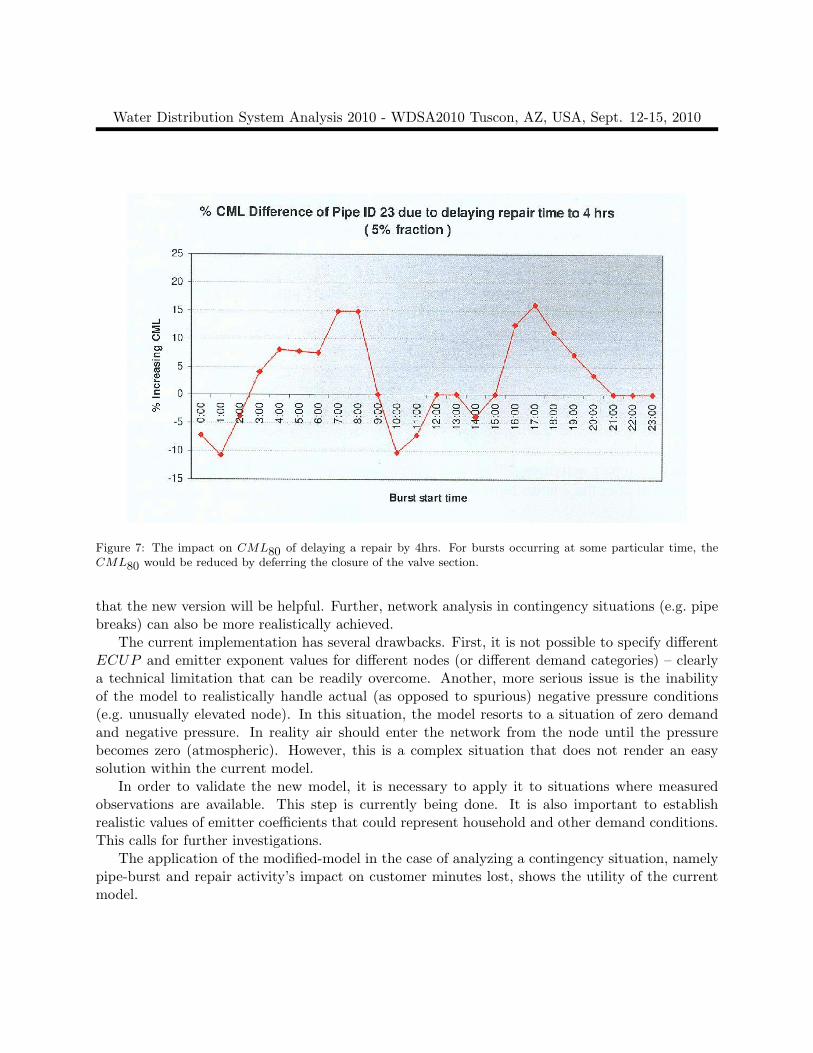
One of the interesting findings of the study was the fact that, for small bursts, sometimes it
Water Distribution System Analysis 2010 - WDSA2010 Tuscon, AZ, USA, Sept. 12-15, 2010
Figure 6: CML80 and CML80 for EBD = 10% failures.
is beneficial in terms of CMLm to delay the repair by several hours. This largely depends on thetime of burst with reference to the demand pattern. For example, for a EBD = 10% burst in pipe23 occuring at 10:00hrs, the CML5 would be reduced by 10% by delaying the repir by 4 hours(figure 7).
6. DISCUSSION
The demand driven water transport and distribution model, EPANET 2 was modified to developa pressure-sensitive demand version that is fully integrated to the standard graphical user-interfaceof the model. In the case of low-pressure, high-demand situations, the new modified model avoidsthe spurious negative pressures due to artificially fixed demands in the original EPANET model.In ‘normal’ situations where there is adequate pressure in the system, the new models results arevirtually identical to those of standard EPANET 2.
Many of the water distribution networks of the cities in developing countries suffer from lackof operating pressure due to excessive demand conditions. It is impossible to use demand-drivenmodels to reliably analyze the flow situation in these networks. In such situations it is hoped
Water Distribution System Analysis 2010 - WDSA2010 Tuscon, AZ, USA, Sept. 12-15, 2010
Figure 7: The impact on CML80 of delaying a repair by 4hrs. For bursts occurring at some particular time, theCML80 would be reduced by deferring the closure of the valve section.
that the new version will be helpful. Further, network analysis in contingency situations (e.g. pipebreaks) can also be more realistically achieved.
The current implementation has several drawbacks. First, it is not possible to specify differentECUP and emitter exponent values for different nodes (or different demand categories) – clearlya technical limitation that can be readily overcome. Another, more serious issue is the inabilityof the model to realistically handle actual (as opposed to spurious) negative pressure conditions(e.g. unusually elevated node). In this situation, the model resorts to a situation of zero demandand negative pressure. In reality air should enter the network from the node until the pressurebecomes zero (atmospheric). However, this is a complex situation that does not render an easysolution within the current model.
In order to validate the new model, it is necessary to apply it to situations where measuredobservations are available. This step is currently being done. It is also important to establishrealistic values of emitter coefficients that could represent household and other demand conditions.This calls for further investigations.
The application of the modified-model in the case of analyzing a contingency situation, namelypipe-burst and repair activity’s impact on customer minutes lost, shows the utility of the currentmodel.
Water Distribution System Analysis 2010 - WDSA2010 Tuscon, AZ, USA, Sept. 12-15, 2010
Note: The modified version is available for download at http://assela.pathirana.net/EPANET/.The program source code will be provided on request.Acknowledgment : The Application described in section 5 was adopted from the MSc study byMs. N.K. Rasminati at UNESCO-IHE, funded by WaterNet.
References
Cheung, P., Zyl, J. V., Reis, L., 2005. Extension of epanet for pressure driven demand modelingin water distribution system. In: Proceedings of CCWI2005 - Water Management for the 21stCentury. Exeter, UK, pp. 215–226.
Giustolisi, O., Savic, D., Kapelan, Z., 2008. Pressure-driven demand and leakage simulation forwater distribution networks. Atmospheric Chemistry and Physics 134 (5), 626–635, americanSociety of Civil Engineers.
Ozger, S., 2003. A semi-pressure-driven approach to reliability assessment of water distributionnetworks. Ph.d., Arizona State University, Tempe, Arizona.
Rossman, L. A., September 2000. EPANET 2 users manual. EPA/600/R-00/57 http://www.epa.gov/nrmrl/wswrd/EN2manual.PDF.
Trifunovic, N., 2006. Introduction to Water Transport and Distribution – UNESCO-IHE LectureNotes Series. Tailor and Francis.
Waternet, 2010. Waternet-English. http://www.waternet.nl/algemene_onderdelen/english re-trieved on: May 2010.
Wikipedia, 2008. Codegear delphi — wikipedia, the free encyclopedia. http://en.wikipedia.org/w/index.php?title=CodeGear\_Delphi\&oldid=255419236 [Online; accessed 3-December-2008].