Embed Size (px)
Citation preview

Financial Conduct Authority
Evaluation Paper 18/3: An
evaluation of reducing barriers
to entry into the UK banking
sector
December 2018

1
We welcome views on this Evaluation Paper.
You can send them to us by email at [email protected] or in writing to:
Economic and Financial Analysis Department, Strategy & Competition Division, Financial
Conduct Authority, 12 Endeavour Square, London, E20 1JN.
Authors
Robert Baker, Damian Finlayson, Daniel Mittendorf and Karthik Raghavan
The authors work in the Economic and Financial Analysis Department at the FCA.
Acknowledgements
We are grateful to Sumit Agarwal and John Ashton for their academic peer reviews,
advice, and guidance. We would also like to thank Stephen Dickinson at the PRA for
helpful comments and discussions.
All our publications are available to download from www.fca.org.uk. If you would like to
receive this paper in an alternative format, please call 020 7066 9644 or email
publications_graphics @fca.org.uk or write to Editorial and Digital team, Financial
Conduct Authority, 12 Endeavour Square, London, E20 1JN.
FCA evaluation papers

2
Executive summary 3
1 Overview and purpose of the evaluation 9
2 Approach to the evaluation 12
3 Changes to entry into the banking sector 20
4 Banking services and products offered by entrants 25
5 The growth of entrants 28
6 Benefits to consumers 33
7 Lessons learned 40
Contents

3
Post-Intervention evaluations inform our decision-
making process
Evaluation is part of our Mission’s decision-making framework. Testing the effectiveness
of our remedies helps us make better decisions and add public value.
In April 2018, we published Discussion Paper 18/3 on our proposed framework for post-
intervention impact evaluations. This is one of the ways we assess the impact of our
interventions. Post-intervention impact evaluations differ from other approaches as they
focus on quantifying the impact of our intervention.1
This evaluation examines the effects of the 2013 review by the FSA (the Financial
Services Authority – our predecessor organisation) and the Bank of England (the Bank)
‘A review of requirements for firms entering into or expanding in the banking sector’ (the
2013 review) on firms entering the UK banking sector.
The 2013 review of requirements for firms entering the
banking sector
After the Office of Fair Trading (2010) and the Independent Commission on Banking
(2011) published reports into competition and barriers to entry in the banking sector, the
Treasury asked the FSA and the Bank to review the prudential and conduct requirements
for new entrants to the banking sector to ensure they were proportionate and did not
pose excessive barriers to entry.
The 2013 review revealed that concerns about barriers to entry were focused on:
• the level of capital requirements for new banks and their ability to raise it
• the level of liquidity requirements of new banks
• the lack of certainty in the authorisation process and the way in which the
process was executed
The 2013 review focused on addressing these issues by:
• reducing capital and liquidity requirements for new banks at authorisation
• improving the authorisations process, in particular the level of up-front
support and engagement provided to firms during the pre-application stage 2
1 The proposed framework sets out how we intend to use ex post impact evaluation (EPIEs), or post-intervention impact evaluations, to assess the impact our interventions have had on consumers, firms and markets. Evaluations feed back into our decision-making and how best to use our diagnostic and remedy tools.
2 Banks are still required to meet the requirements under Financial Services and Markets Act 2000 (FSMA) including the requirement to satisfy the Threshold Conditions (TCs) at Schedule 6 to FSMA to obtain Part 4A Permission. The changes were not designed to lower these minimum standards for obtaining and retaining
Executive summary

4
• introducing an additional option for the authorisation process, referred to
as ‘mobilisation’ which offers a more flexible approach to account for the
variations in the applications received from firms3
• streamlining information requirements during the authorisations process so
that the overall burden on firms is reduced (regardless of whether the firm opts
for the mobilisation route)
These recommendations were made by the FSA and Bank but implemented by the FSA
successor bodies, the Prudential Regulation Authority (PRA) and by us, the Financial
Conduct Authority (FCA). Under the reformed system, banks are dual regulated and a
bank is authorised by the PRA with the consent of the FCA.4
We expected the intervention to make the authorisations process cheaper and quicker for
potential new banks, reducing barriers to entry and increasing the number of firms
entering the UK banking sector. We anticipated this would lead to an increased
competitive challenge to existing banks and benefits to consumers across a range of
products.
This evaluation focuses on the benefits of this initiative on competition in the UK banking
sector, and less so on the wider implications for prudential risks which relate to the
activities of these new banks, and financial stability in general.
We use a mix of qualitative and quantitative analysis to
evaluate the impact of the intervention
There is no clear single and robust counterfactual for this intervention. We have
developed a causal chain that explains how we would have expected the changes to the
authorisations process would lead to increased competitive benefits to consumers. We
have undertaken several discrete pieces of analysis to test key changes along the causal
chain. If the analyses demonstrate that our expectations are met at the various stages of
the causal chain, we can have some confidence, even in the absence of a single strong
counterfactual, that any final positive impact is due, at least in part, to the 2013
intervention.
We focus on quantifying the impact of the intervention by analysing a mix of transaction-
level data, regulatory submissions, other publicly available data and insights from firms
themselves. This is summarised in Figure 1.
permission, but aimed to make the authorisation process more straightforward for those firms that met the TCs. Firms who do not meet the TCs are not authorised.
3 The applications received from firms may vary, for example, due to different banking models. The three stages of the mobilisation route are: pre-application support, assessment and authorisation (based on a shorter application that focuses on key essential elements), and mobilisation (where successful firms mobilise the remaining requirements such as capital, personnel, IT and other infrastructure). The mobilisation route is for firms that require the certainty of an authorisation before a significant capital outlay. 4 Under s.55F FSMA the PRA will grant a bank Part 4A permission (to carry out the regulated activity of accepting deposits) with the consent of the FCA. Applicant banks need to make a single application to the PRA, the lead regulator, and application is then assessed by the PRA and the FCA against their respective threshold conditions. The PRA is responsible for prudential regulation and supervision of banks, while the FCA regulates their conduct.
5
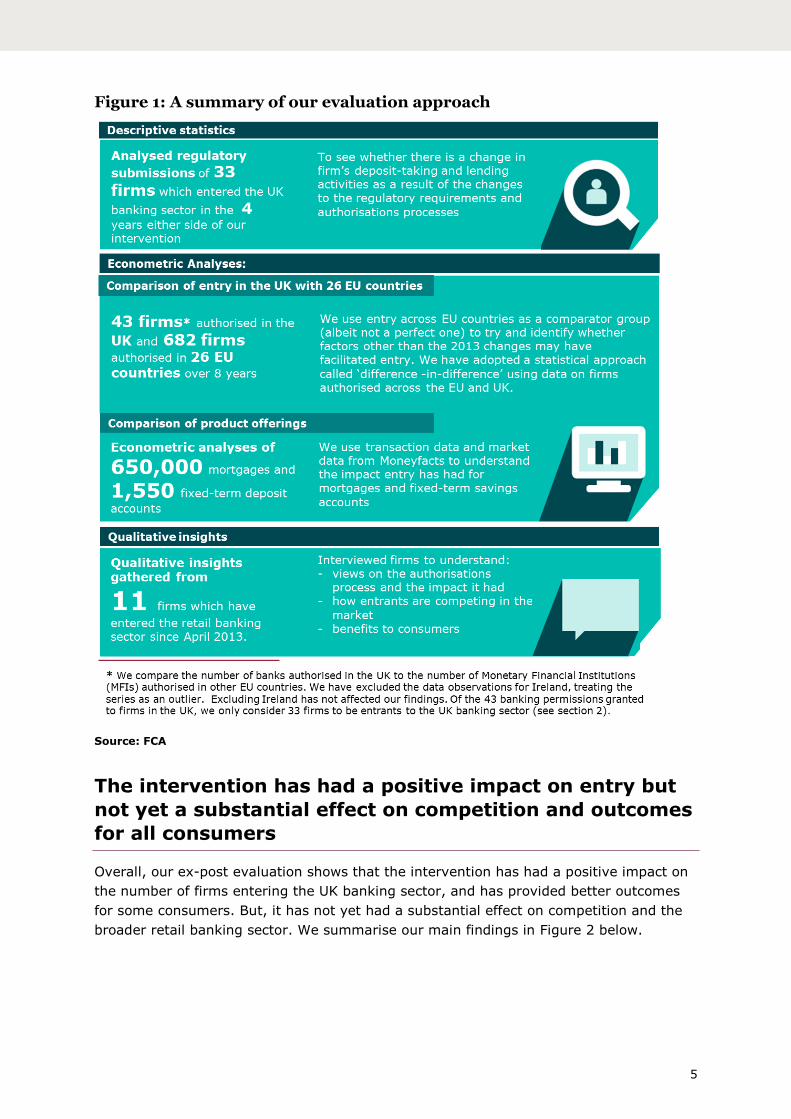
Figure 1: A summary of our evaluation approach
Source: FCA
The intervention has had a positive impact on entry but
not yet a substantial effect on competition and outcomes
for all consumers
Overall, our ex-post evaluation shows that the intervention has had a positive impact on
the number of firms entering the UK banking sector, and has provided better outcomes
for some consumers. But, it has not yet had a substantial effect on competition and the
broader retail banking sector. We summarise our main findings in Figure 2 below.
6
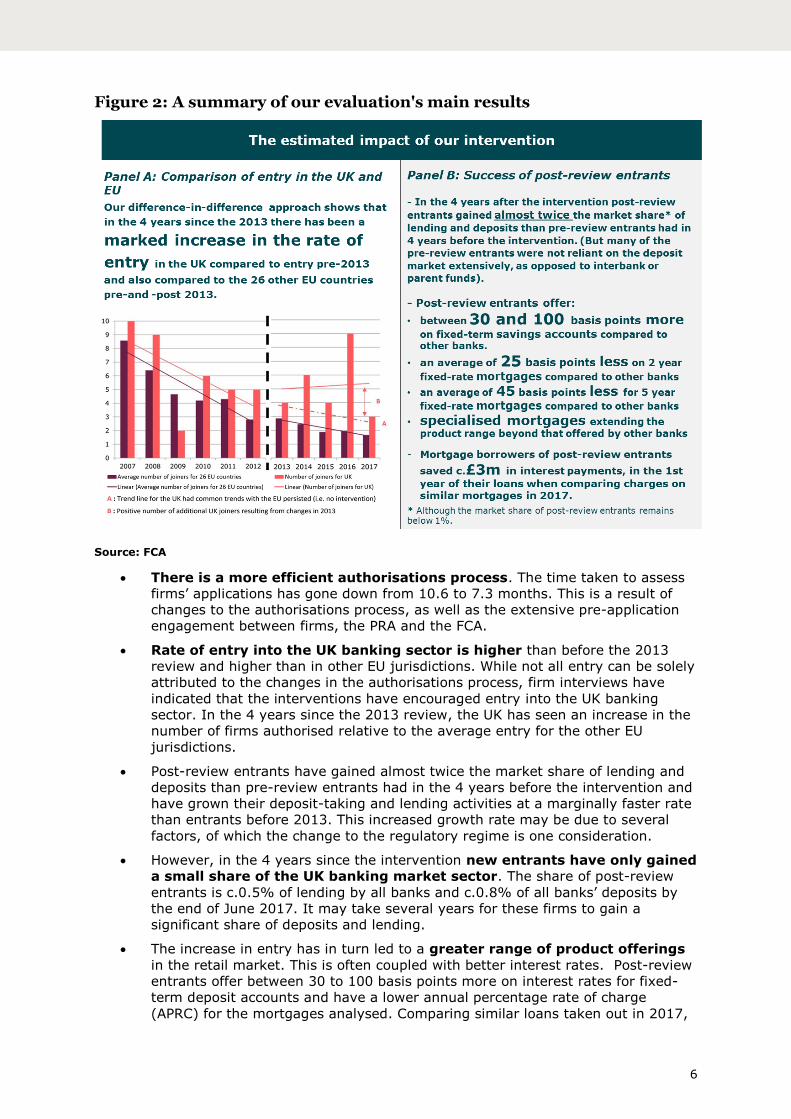
Figure 2: A summary of our evaluation's main results
Source: FCA
• There is a more efficient authorisations process. The time taken to assess
firms’ applications has gone down from 10.6 to 7.3 months. This is a result of
changes to the authorisations process, as well as the extensive pre-application
engagement between firms, the PRA and the FCA.
• Rate of entry into the UK banking sector is higher than before the 2013
review and higher than in other EU jurisdictions. While not all entry can be solely
attributed to the changes in the authorisations process, firm interviews have
indicated that the interventions have encouraged entry into the UK banking
sector. In the 4 years since the 2013 review, the UK has seen an increase in the
number of firms authorised relative to the average entry for the other EU
jurisdictions.
• Post-review entrants have gained almost twice the market share of lending and
deposits than pre-review entrants had in the 4 years before the intervention and
have grown their deposit-taking and lending activities at a marginally faster rate
than entrants before 2013. This increased growth rate may be due to several
factors, of which the change to the regulatory regime is one consideration.
• However, in the 4 years since the intervention new entrants have only gained
a small share of the UK banking market sector. The share of post-review
entrants is c.0.5% of lending by all banks and c.0.8% of all banks’ deposits by
the end of June 2017. It may take several years for these firms to gain a
significant share of deposits and lending.
• The increase in entry has in turn led to a greater range of product offerings
in the retail market. This is often coupled with better interest rates. Post-review
entrants offer between 30 to 100 basis points more on interest rates for fixed-
term deposit accounts and have a lower annual percentage rate of charge
(APRC) for the mortgages analysed. Comparing similar loans taken out in 2017,

7
mortgages by post-review entrants are an average of 25 basis points cheaper for
2-year fixed mortgages and an average of 45 basis points cheaper for 5-year
fixed mortgages. This has generated clear benefits for consumers. For
example, in the first year of their loans, data suggests that new entrants’
mortgage borrowers saved around £3m in interest payments compared to taking
a similar mortgage with an existing bank.
• However, there has not yet been a substantial change to concentration in
the retail banking sector, nor do we have evidence of significant competitive
responses (eg more attractive borrowing rates) by incumbent banks.
• Low barriers to entry are a necessary but not sufficient condition for
healthy competition. The impact on competition in banking has so far mainly
benefitted those consumers that have switched to the new entrants. The
increased number of competitors has not yet benefitted many customers of
incumbents because barriers to expansion remain which affect the ability
of entrants to compete, especially for more ‘sticky’ consumers (hence the small
combined market share of new entrants). Unless the larger incumbent banks feel
a competitive threat from the new entrant, their customers will not benefit.
Could this be about to change? Interventions such as the recently introduced Open
Banking initiative are designed to lower some of the long-standing barriers to
switching and help smaller and newer banks to grow and achieve scale. Our Strategic
Review of Retail Banking Business Models looks at the competitive advantages and
disadvantages of incumbent banks’ business models and the potential scenarios of
change.

8
Lessons learned
We view evaluations as an opportunity to learn from our previous interventions and
feed any insights into our current and future work. Our main lessons learned from this
evaluation are:
• Lowering barriers to entry is effective and has a positive impact on entry, and
delivered benefits to consumers. We have seen, for example, new entrants with
significantly better offerings on specific products.
• However, ease of entry is a necessary but not sufficient condition for healthy
competition. It takes time for lowering barriers to entry to affect market shares in a
significant way because there may be other barriers to firms expanding to a more
significant scale. Small scale or niche entry may not be enough to force incumbent
banks to compete harder to protect market share.
• The changes introduced by the PRA and the FCA have improved the speed and
transparency of the authorisations process and allowed for greater regulatory
engagement.5 While the requirements for new firms have not changed, the new
approach to authorisation has had a positive impact on entry. This suggests clearer,
transparent processes and engagement can have a significant positive impact on all
our interactions with firms, as they make it easier and quicker for firms to
understand and meet our expectations. This can affect levels of compliance, for
example, as well as the authorisation of new firms into other sectors we regulate.
5 The PRA and FCA have their respective Threshold Conditions (TCs) which must be met by a firm at authorisation and on an ongoing basis. As such their TCs will form the basis of each respective regulator’s assessment of your application. More detail on the PRA’s and FCA’s Threshold Conditions can be found here.

9
The changes to the regulatory requirements and
authorisation process
The reports published by the Office of Fair Trading (2010) and the Independent
Commission on Banking (2011) into competition and barriers to entry in the banking
sector recognised that regulation is only one of the barriers facing new banks. The FSA’s
position as the gateway to the UK banking sector meant it was important that the
regulatory requirements were not unnecessarily burdensome and maintained the
required standards for firms entering it. Subsequently, the Treasury asked the FSA and
the Bank of England to review the prudential and conduct requirements for new entrants
to the banking sector to ensure they are proportionate and do not pose excessive
barriers.
The 2013 review sets out the findings from a review of FSA processes and rules, and
describes changes that were designed to facilitate easier market entry. It covers changes
to prudential requirements for a bank to be authorised, and the process through which
these changes are applied. The 2013 review revealed that applicant concerns about
barriers to entry were focused on: the level of capital requirements for new banks and
their ability to raise it, the level of liquidity requirements of new banks, the lack of
certainty in the authorisation process and the way in which the process is executed.
The changes introduced by the FSA and Bank in applying regulatory requirements to new
entrants were along two dimensions: reforms to the authorisations process and a shift in
approach to the prudential regulation of banking start-ups. In particular, the 2013 review
focused on addressing these issues by:
• Reducing capital requirements for new banks at authorisation, and the
subsequent 3 to 5-year period.6
• Reducing liquidity requirements for new banks.7
• Improving the authorisations process so that the FCA and PRA provide an
assessment and complete decision-making process within 6 months of receiving a
complete application form with supporting materials. To support firms in their
application, firms get a significant level of up-front support during the pre-
application stage.8
6 Page 9 of the 2013 review offers capital concessions at authorisation and in the subsequent 3 to 5-
year period to those new entrant banks that the FSA/PRA judge can be resolved in an orderly fashion with no systemic impact. These changes permit new banks to set capital based on the projected balance sheet at a 12-month period. There are no Pillar 2 capital requirements, simply because the firm is new; and the Capital Planning Buffer (CPB) is set as the wind-down costs of the bank, typically the operating costs for the next 12 months. 7 All new banks benefitted from the reduction in liquidity requirements previously announced in the FSA's Policy Statement PS13/1; and the review set out no automatic new bank liquidity premium. 8 This approach is particularly suited to firms that have the development backing, capital and infrastructure to allow them to set up a bank at speed; (e.g. subsidiary of a bank or where the bank can use existing IT and other infrastructure).
1 Overview and purpose of the
evaluation

10
• Introducing an alternative route for authorisation referred to as
‘mobilisation’, which provides a 3-stage route to authorisation to account for the
variation in firms’ applications.9
• Streamlining information requirements of the authorisations process so that
the overall burden on firms is reduced (regardless of the route they pursue).
These changes aimed to reduce barriers to entry into the UK banking sector, enabling an
increased competitive challenge to existing banks. They were not designed to lower the
minimum standards for entry but aimed at facilitating entry for those firms that met the
required standards. Banks are still required to meet standards that prevent undue risks
to the financial system and consumers.
Previous findings and views on the impact of the
changes
In A review of requirements for firms entering into or expanding in the banking sector
one year on the PRA and the FCA noted the revised approach to setting capital for new
entrants had delivered in line with the expectations of the 2013 review. New banks held
lower levels of capital when entering the market than would have been required under
the old approach. In addition, the option of a mobilisation stage had been widely
welcomed by firms, trade bodies and other market commentators as addressing their
concerns. Furthermore, following the 2013 review, potential applicants had commented
positively about the regulators’ willingness to engage during the pre-application phase.10
In the speech Two years on from the March 2013 publication of ‘A review of requirements
for firms entering into or expanding in the banking sector’ the PRA noted that feedback
from new banks indicated that the new regime for authorising new firms was working
and was seen as a more proportionate regime. The proportionate approach to regulating
new entrants as well as the strength and transparency of UK regulation was expected to
attract both UK and international entrants. Entrants were making inroads into the
market, although it was recognised that it might take many years for them to gain
significant market share. It was also noted that there had been a wider pool of applicants
aiming to provide new services and products or using new technologies.
The Competition and Markets Authority (CMA), as part of its retail banking market
investigation in 2016, noted bank authorisation had undergone significant change in
recent years and enabled a more flexible approach, including the option for firms to
become authorised with restrictions. The revised regulatory requirements and
authorisations process had facilitated the entry by several new providers. The CMA found
that recent (and prospective) entrants had welcomed the changes to the authorisation
process. In addition, new and prospective entrants also benefited from the New Bank
9 The mobilisation phase is designed for firms that require longer lead times in terms of raising capital, or setting up infrastructure. These firms, while authorised, have restrictions placed on their permission which limits their market activity (particularly deposit taking) until the required capital and infrastructure has been put in place. That is, the PRA can grant authorisation but with a restriction that will enable the firm to mobilise the remaining requirements such as capital, personnel, IT and other infrastructure, all of which are easier for firms to develop if they have already been authorised.
10 The PRA will have regard to barriers to expansion in its supervisory approach, consistent with the principle to have regard to the need to minimise any adverse effect on competition.

11
Start-Up Unit, which provides support to entrants in the process of becoming a new bank
and in the early years following authorisation.
The PRA’s ‘Second Annual Competition Report’ (2017) commented that the composition
of banks entering the UK had changed with several new banks authorised being UK
banks. There had also been innovation in the business models of the banks authorised,
with some banks providing retail banking services to customers entirely digitally.
The evaluation and its aims
As stated in our Mission, evaluation is a critical part of getting our interventions right.
Finding out the impact of past interventions helps develop a strong evidence base to
guide our decisions. These decisions can include which issues to prioritise and how best
to intervene to tackle harm.
We published a proposed framework outlining the way we measure the causal impact of
our interventions in April 2018. The framework explains:
• why we do post-intervention impact evaluations11
• how we choose specific interventions to study
• how we ensure that our evaluations are robust, impartial, and, therefore, credible
This report follows the proposed approach to post-intervention impact evaluations, and is
one of three pilot evaluations. This evaluation aims to build upon the findings of previous
reviews, which mainly focused on the effect changes to the authorisation process has had
on the number of firms seeking entry to the UK banking sector. The aim of this work is to
understand:
1. the impact of the FSA and Bank of England’s (Bank) interventions to lower barriers to
entry in the banking sector in 2013 and
2. whether the intervention met its objective of increased competitive challenge to
existing banks and benefits to consumers across a range of products
We do this by focusing on the main changes that we expected to see after the
intervention; and less so on the wider implications for prudential risks which relate to the
activities of these new banks, and financial stability in general.
Report structure
• Section 2 sets out an economic framework for this evaluation
• Section 3 looks at changes to entry in the banking sector
• Section 4 comments on the banking services and product offerings of entrants
• Section 5 considers changes in the growth of entrants
• Section 6 explores the benefits from entry consumers experience
• Section 7 concludes with the main lessons that we have learned from this evaluation
and
• a Technical Annex provides further details on the analyses in sections 3, 5 and 6
11 We refer to post-intervention impact evaluations, or ex post impact evaluations, as ‘evaluations’ in this report.

12
In this section, we set out how we have approached evaluating the impact of lowering
barriers to entry to the UK banking sector, describe the methodology and the main
sources of information we have used.
The expected outcomes from the intervention
A causal chain, or pathway, or logic model, describes the causal mechanisms by which an
intervention addresses the identified market failure and reduces harm, leading to costs
and benefits. It does this by linking the intended intermediate and final outcomes with
the intervention inputs, activities, processes and theoretical assumptions.
Figure 3 sets out a causal chain of the expected impact arising from the 2013
intervention and how we have analysed whether this has led to an increased competitive
challenge to existing banks and benefits to consumers across a range of products.
Lower capital and liquidity requirements as well as a more efficient authorisations
process result in lower costs for firms entering the UK banking sector. Lower regulatory
costs and a more efficient authorisations process, in turn, help facilitate entry and
increase the number of banks entering. As more firms enter the market, additional
products are also offered to consumers.
Entrants offer improved or differentiated products to compete for custom. Consumers
subsequently benefit from these product offerings. Incumbents respond to entry and
change their offerings or prices. When competition works well, we expect it to drive down
costs and prices, improve service standards and quality and increases access to financial
services.12
12 For a further discussion on this, see Our Approach to Competition.
2 Approach to the evaluation

13
Figure 3: Causal chain
Source: FCA
The counterfactual
To evaluate the impact of the 2013 review, it is important to consider the most likely
outcome if it had not happened. However, we are only able to observe how the UK
banking sector has evolved since the FSA and Bank’s intervention. So, it is important to
define what would have happened if the 2013 review had not occurred. This is our
‘counterfactual’.
Overall, it is difficult to establish with any degree of certainty what the level of entry
would have been had the FSA and the Bank not intervened.
The causal chain at Figure 3 explains how we would have expected the changes to the
authorisations process to lead to increased competitive benefits to consumers. We have
undertaken several discrete pieces of analysis to test key changes along the causal chain.
If the analyses demonstrate that our expectations are met at the various stages of the
causal chain, we can have some confidence, even in the absence of a clear single and
robust counterfactual, that any final positive impact is due, at least in part, to the 2013
intervention.
For this evaluation, we assess entry into the banking sector before and after the 2013
review. There are several reasons why entry could have increased, even absent the
intervention, such as changes in macroeconomic conditions or technological costs. Such

14
considerations would also affect our baseline.13 We try to net out other factors that would
have affected bank entry irrespective of the intervention, by comparing entry in the UK
against a comparator. We use the number of Monetary Financial Institutions (MFIs) in 26
other EU countries.14 We are mindful that the macro-economic circumstances may have
differed between the UK and the EU countries, which would limit the usefulness of the
comparator. However, we consider that significant differences in the rate of entry
between the UK and other EU countries would be at least indicative of positive changes in
the UK market, including the 2013 review.
Similarly, we consider that without the 2013 review, the post-2013 entrants’
performance would have continued to evolve in the same way as pre-review entrants. To
identify the effects of the 2013 review on the performance of entrants, as far as it is
possible, we compare the growth of entrants in each cohort to the other to see whether
there is any change. In doing so, we compare the growth of the deposit taking and
lending activities of entrants. We also compare the performance of entrants to
incumbents to gauge the impact different market conditions may have had; for example,
the market relating to mortgage products has varied between 2009 to 2017.
Government and regulatory strategy since the crisis has sought to tackle multiple
contributing causes of weak competition and may have contributed to better performance
by post-review entrants. This includes interventions such as the 7-day switching
guarantee, the creation of the Payment Systems Regulator (PSR), CMA remedies from
the retail banking inquiry (such as open banking) and the Payment Systems Directive
(PSD2). Banks entering before 2013 may not have had the advantage of these regulatory
interventions or market changes such as developments in technology.
Having established that the changes to the regulatory requirements and authorisations
process have led to increased entry and better performance, we assess the extent to
which customers benefit from post-review entrants. We compare the product offerings of
post-review entrants to pre-review entrants and incumbents. In doing so, we focus on
offerings within the retail banking sector.
Establishing how well the intervention has worked
To provide a view on how well the intervention has worked, we begin by testing key
outcomes against the expected impact of these interventions. Our expectations are set
out in Figure 3, which shows how we expected the intervention to work to meet its
intended objectives. We compare observed outcomes with what we consider the most
likely outcome without the intervention.
Regarding the changes to the regulatory requirements for authorisation, no banks that
have entered since April 2013 have failed. But they have all been authorised under
benign conditions, and the resilience and sustainability of their business models over the
full length of a credit cycle is yet to be tested.
13 No CBA was undertaken as the review itself did not propose new rules, and therefore, there was no obligation under FSMA to conduct a CBA.
14 MFIs encompass the following undertakings: central banks, credit institutions (including banks), other deposit-taking corporations and money market funds. The ECB notes that there ‘are four events that could result in a financial institution joining the MFI sector: a) the establishment of an MFI because of a merger; b) the establishment of new legal entities as a result of the division of an existing MFI; c) the establishment of a new MFI; or d) a change in the status of a previous non-MFI, such that it becomes an MFI.’
15
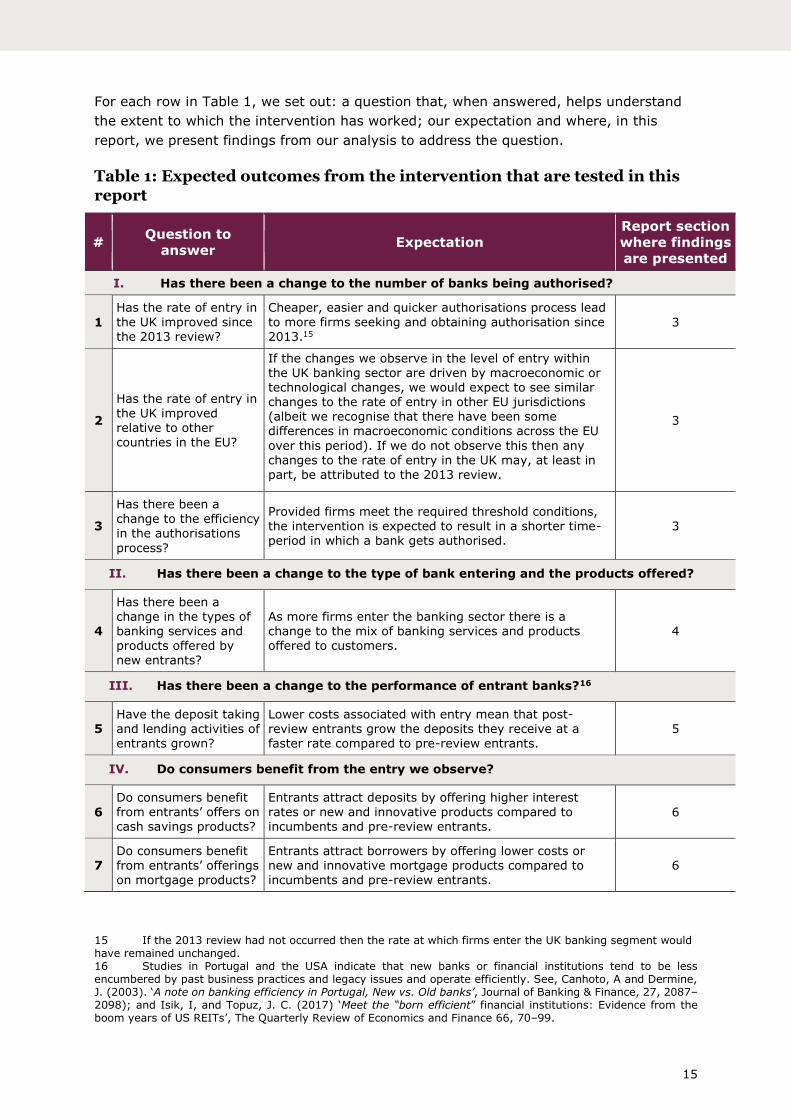
For each row in Table 1, we set out: a question that, when answered, helps understand
the extent to which the intervention has worked; our expectation and where, in this
report, we present findings from our analysis to address the question.
Table 1: Expected outcomes from the intervention that are tested in this report
# Question to
answer Expectation
Report section
where findings
are presented
I. Has there been a change to the number of banks being authorised?
1
Has the rate of entry in
the UK improved since the 2013 review?
Cheaper, easier and quicker authorisations process lead
to more firms seeking and obtaining authorisation since 2013.15
3
2
Has the rate of entry in the UK improved relative to other countries in the EU?
If the changes we observe in the level of entry within the UK banking sector are driven by macroeconomic or technological changes, we would expect to see similar changes to the rate of entry in other EU jurisdictions (albeit we recognise that there have been some differences in macroeconomic conditions across the EU
over this period). If we do not observe this then any changes to the rate of entry in the UK may, at least in part, be attributed to the 2013 review.
3
3
Has there been a change to the efficiency
in the authorisations
process?
Provided firms meet the required threshold conditions,
the intervention is expected to result in a shorter time-period in which a bank gets authorised.
3
II. Has there been a change to the type of bank entering and the products offered?
4
Has there been a change in the types of banking services and products offered by new entrants?
As more firms enter the banking sector there is a change to the mix of banking services and products offered to customers.
4
III. Has there been a change to the performance of entrant banks?16
5 Have the deposit taking and lending activities of
entrants grown?
Lower costs associated with entry mean that post-review entrants grow the deposits they receive at a
faster rate compared to pre-review entrants.
5
IV. Do consumers benefit from the entry we observe?
6
Do consumers benefit from entrants’ offers on cash savings products?
Entrants attract deposits by offering higher interest rates or new and innovative products compared to incumbents and pre-review entrants.
6
7 Do consumers benefit from entrants’ offerings on mortgage products?
Entrants attract borrowers by offering lower costs or new and innovative mortgage products compared to incumbents and pre-review entrants.
6
15 If the 2013 review had not occurred then the rate at which firms enter the UK banking segment would have remained unchanged. 16 Studies in Portugal and the USA indicate that new banks or financial institutions tend to be less encumbered by past business practices and legacy issues and operate efficiently. See, Canhoto, A and Dermine, J. (2003). ‘A note on banking efficiency in Portugal, New vs. Old banks’, Journal of Banking & Finance, 27, 2087–2098); and Isik, I, and Topuz, J. C. (2017) ‘Meet the “born efficient” financial institutions: Evidence from the boom years of US REITs’, The Quarterly Review of Economics and Finance 66, 70–99.
16
We first look at all the firms that were granted banking permissions (ie authorised as a
bank). We do this to understand how the changes have affected the overall level of
permissions granted. This forms the basis of our analysis relating to part I (or questions
1 to 3 above).
Distinguishing between authorised firms and entrants
In analysing the impact of intervention, we need to be clear how we define an entrant.
We identify as ‘entrants’ those firms that have established a new bank in the UK and
have no ties to a broader UK banking group.17 These firms are a subset of those firms
granted permissions. This allows us to identify those banks which could have benefitted
the most from the regulatory change. We do this because we are primarily interested in
the effect the intervention has had on the operations of these firms, competition and
outcomes for consumers, rather than the impact on firms that already had ties with the
UK, for example.
The criteria we used to identify ‘entrants’ are whether they:
• are newly authorised banks,18 and
• exited the mobilisation stage (if they opted for this route)19
Included in the above are existing firms that have previously been active in lending to
customers and have subsequently been granted banking permissions, we consider them
to be an entrant into the UK banking sector. Such firms’ lending activities were already
established at the point of becoming authorised banks, potentially accelerating their
expansion. This could affect both cohorts of entrants.
We then remove:
• Banks which were required to subsidiarise (as they had exceeded the PRA’s risk
tolerance for third country branches) but had a pre-existing branch, as they were
already operating within the UK banking sector and therefore have established
operations.20
• Banks that have a relationship with other banks as part of a broader group structure.
We consider the authorisation of these banks as further expansion into the banking
sector by the broader group. Particularly as newly established banks which are part of
a broader group may benefit from intra-group transactions.
17 The FCA handbook defines a bank: (a) as a firm with a Part 4A permission which includes accepting deposits, and:
(i) which is a credit institution; or (ii) whose Part IV permission includes a requirement that it comply with the rules in GENPRU
and BIPRU relating to banks; but which is not a building society, a friendly society or a credit union;
(b) an EEA bank which is a full credit institution. We have not included non-banks in our analysis for this evaluation. 18 Banks which are not based in the EEA but enter the UK banking market by opening a branch or subsidiary are considered entrants, provided these firms do not have any operations already established in the UK.
19 Three firms were authorised but did not exit mobilisation and therefore never entered the market. Although these firms were authorised, we have not considered these firms as entrants.
20 This is a different set of firms to those in footnote 18.

17
• Newly created banks that are a product of mergers and acquisitions. These banks will
be inheriting an established customer base and trading book. The performance of
these firms will also be affected by the operations of the existing bank.
• Banks that have been created as a result of ring-fencing or restructuring activities.
• Banks passporting into the UK banking sector. Although they could also be considered
entrants, this option is only available to banks which have already been authorised by
another country within the EEA and not available to non-EEA firms entering the UK
market. For those banks, passporting is an efficient process by which to enter the UK
market and would not be affected by the 2013 changes.
It should also be noted that firms entering the banking sector which do not meet the
criteria could have also benefitted from the 2013 intervention. We acknowledge that if
the changes enable a banking group to structure itself more efficiently then benefits
might accrue to consumers. Although the extent to which they may have benefitted is
unclear.
The analysis in parts II, III and IV focuses on the benefits to entrants before and after
the 2013 review.
Information and data sources
To inform the evaluation, we sought to gather a wide range of evidence from a variety of
sources. The evidence that we have relied upon can be classed into 5 main categories:
• data on pre-application meetings, the number of firms seeking and obtaining
authorisation and the time firms take to get authorised
• regulatory submissions to the FCA; namely: FSA001 and FSA002 (regulatory balance
sheet and income statements respectively) and PSD001 (product sales data on
regulated mortgages)
• desk-based research and industry reports, including reviews by other regulators
• interviews with banks
• Moneyfacts data
More information on the different sources of evidence we have used during the
investigation is provided throughout the report, where we have used this information and
data as part of the evaluation.
Methods used to evaluate the impact of the intervention
We have used different methodological approaches and data to test the pre-intervention
expectations in Figure 3. We explain these three analytical methods in further detail
below.
Descriptive statistics
Descriptive statistics provide context on what has happened in the market. The data we
use sets out the growth in deposit-taking and lending activities by banks.
We collected data from regulatory submissions from 33 entrants and 295 incumbents,
regarding their income statements and balance sheets, between January 2009 and June

18
2017 (i.e. just over four years either side of the intervention date). We did this to help
ascertain whether post-review entrants had experienced a faster growth rate than the
pre-review cohort. We also compare changes in the growth by entrants to incumbents.
We can, therefore, see whether changes in the growth of entrants are associated with
the intervention.21 We present this data in section 5.
We also use data on the cash savings and mortgage offerings by post-review entrants to
better understand the types of products they are offering to customers and the
associated interest rates.22 We present this data in section 6.
Econometric analysis
We use econometric analysis23 to diagnose the extent to which there is evidence that,
based on the available data, the intervention has led to changes in the market.
Difference in difference
To help us identify the impact the changes to the regulatory requirements and
authorisations process have had on the rate of entry we use a difference-in-difference
(DiD) model. A DiD model compares the rate of entry in the UK (which is affected by this
intervention) to the rate of entry in the EU (which is unaffected by the intervention)
before and after the intervention. By comparing the change in the rate of entry in the UK
to the change in the EU, the model identifies the impact of the intervention in 2013. A
divergence in the rate of entry between the EU and UK indicates that there has been a
meaningful change in the average number of entrants in the UK since the 2013 review.
We therefore use data on 43 banks which were authorised in the UK and 682 banks
authorised in 26 EU countries over 8 years to isolate the impact these changes to
regulatory requirements and the authorisations process have had on entry. A further
explanation can be found in the Technical Annex.
Pooled Ordinary Least Squares
To identify whether entrants offer products at more favourable prices, we use a
regression technique called pooled ordinary least squares (POLS). POLS measures the
impact various factors have on the interest rates offered by banks over a given time
period. In doing so, it identifies the extent to which these factors affect the average
interest rate which is offered. So we can assess, statistically, whether there is a
meaningful difference between the offerings of post-review entrants and other existing
banks within the relevant market.
We undertake econometric analysis of c.650,000 mortgages and c.1,500 fixed term
deposit accounts to understand the impact this entry has had for consumers in these
markets. Further explanations are in the Technical Annex.
Firm interviews
We also use insights from interviews with senior management from 11 new entrants to
validate the outcomes we observe from the analytical approaches set out above.
The interviews focused on firms’ experience of the authorisation process and the
regulatory requirements since these changes were introduced, the extent to which it
21 We note that that throughout this time-period the interest rate environment has remained constant.
22 We consider these products as they are typically the biggest items for banks and entrants.
23 We use ‘econometric analysis’ and ‘regression analysis’ interchangeably in this report.

19
affected their decision to enter the market, and how they have sought to compete for
custom within the retail banking segment.

20
Section summary
Our analysis shows that:
- Comparing a 4-year period before and after the intervention in 2013, the rate of
entry into the UK banking sector has increased from 4.5 to 5.6 banks per year.
In contrast, since the review, each year has seen an average per country of 2.3
MFI joiners for 26 other EU jurisdictions.
- Compared to a baseline that we establish, we estimate that in the 4 years since
the 2013 review there has been an increase in the number of firms authorised in
the UK relative to the average entry for the other EU jurisdictions. Not all the
entry observed can be attributed solely to the intervention.
- There is a more efficient authorisations process. We find that firms which meet
the Threshold Conditions are more likely to be authorised within 12 months. 85%
of firms were authorised within 12 months compared to just over half of
applicants being authorised within 12 months before the intervention.24
- There is a reduction in the time taken to assess firms’ applications from 10.6 to
7.3 months. This is a result of changes to the authorisations process as well as
the extensive pre-application engagement between firms, the PRA and the FCA.
Entry in the UK before and after the 2013 review
Previous assessments by the FCA and PRA indicated that the 2013 review led to an
increase in the number of firms being granted banking permissions. Between 2009 and
2017 Q2, a total of 43 new banking permissions were granted. Of these, 19 were granted
before April 2013, when the FSA and the Bank’s intervention was implemented and 24
banks have been authorised since the intervention; as shown in Figure 4 below.
There has been an increase in the rate at which firms are obtaining banking permissions
since the 2013 review. On average, there were 4.5 firms per year that were granted
banking permissions in the four years preceding the 2013 review, and this has increased
to 5.6 in the 4 years after 2013, with a significant increase in 2016.25
24 S.55V FSMA sets the statutory deadlines for determining applications for authorisation under Part 4A: 6 months for a complete application and 12 months for an incomplete application. Occasionally, applicants will withdraw an application and re-apply to restart the clock. In these instances, the time taken to assess the firm’s application may be longer than 12 months.
25 Only 2 banks have passported into the UK since 2009 with deposit taking permissions, and both have done so after the 2013 regulatory change. So, the vast majority of deposit taking banks entering the UK have been authorised by the PRA with the consent of the FCA. We have not included these 2 passporting firms in this analysis.
3 Changes to entry into the
banking sector

21
Figure 4: Overview of banks authorised
Source: FCA analysis of authorisations data. Note that the figures in the following three columns are not directly comparable with others: 2013 Q1 (one quarter), 2013 Q2+ (3 quarters) and 2017 Q1 & Q2 (2 quarters).
On the whole, it is difficult to establish with any degree of certainty what the level of
entry would have been had the FSA and the Bank not intervened. There are several
reasons why entry could have increased, even absent the intervention, such as: changes
in macroeconomic conditions or technological costs. However, during our interviews with
banks, they told us they considered the authorisations process under the FSA as a ‘black
box’. The changes proposed by the FSA and the Bank and introduced by the FCA and PRA
have improved the transparency of the authorisations process and allowed for greater
regulatory engagement.
Many of the banks we interviewed indicated that these changes to the regulatory
requirements and authorisations process were a catalyst in their decision to apply for
banking permissions; and were a determinant in deciding to apply for banking
permissions rather than enter the UK banking sector through an acquisition.26
Most firms also indicated that they did not consider the regulatory requirements and
authorisation process to be a significant barrier to entry.27 Rather, many said the biggest
challenge they faced was the ability to raise sufficient funding from potential investors.
For some banks, introducing the mobilisation phase made it easier for them to attract the
required level of investments as they were able to raise capital in tranches before they
were authorised as a bank and again in mobilisation.
This evidence suggests that at least part of the increase in entry since April 2013 shown
in Figure 4 is attributable to the review.
26 Some banks also indicated that they viewed the following as challenges to entering the banking sector: the ability to obtain agency banking services, sourcing the right IT solutions and recruiting the right personnel. Although, not all banks considered all these issues to be barriers to entry.
27 This is congruent with the CMA’s finding that bank authorisations have undergone significant changes in recent years which have facilitated the entry by several new providers.

22
A comparison of entry into the UK and the EU
Given the increase in the number of firms being authorised in the 4 years after April
2013, we compare the average rate of entry in the UK to other EU countries. If we do not
observe a similar increase in the number of banking permissions granted in other EU
countries during this time-period, then we consider that significant differences in the rate
of entry between the UK and other EU jurisdictions may be indicative of changes in the
UK market, including the 2013 review. Interviews with firms also suggest that there have
been positive changes in the UK banking sector because of the intervention.
Data on the number of MFIs joining each EU country is submitted to the European
Central Bank (ECB) by the respective central banks once a quarter. These data have
been combined with the number of banking permissions granted in the UK.28
Figure 5 shows that the average number of banks authorised in the UK each year and
the average number of MFIs entering across all other EU countries has declined between
2007 and 2013, in the aftermath of the financial crisis. As the level of entry in the UK and
across the EU has declined at a similar rate between 2007 and 2013, there is a common
trend between the average number of MFI joiners across other EU countries and the
number of banks authorised in the UK during this period. We therefore use the average
number of MFI joiners per country in 26 other EU jurisdictions as a comparator group for
the UK.
Figure 5: Banking licences issued in the UK and EU
Source: FCA analysis of ECB data and FSA/FCA data. Note the data on banks authorised includes all firms that have been authorised in the UK, including both UK domiciled and foreign banks.
28 We noted that the ECB series for the UK does not match our own analysis of the number of banking licenses issued. The major difference between the MFI series and the FCA data is the timing of when banking permissions were granted. In aggregate, the number of MFI joiners submitted to the ECB is very similar to the aggregate number of banking joiners drawn from the FCA data for the 2009 to 2017 period. We have therefore replaced the UK MFI joiners’ series with our own analysis of the number of banking licenses issued each quarter. We also noticed that there appear to be issues with the data for Ireland. So, we have removed the data observations for Ireland, treating the series as an outlier. Excluding Ireland has not affected our findings.

23
Since 2013, a divergent trend has emerged between the UK and other EU countries.
There has been an increase in the number of banks entering the UK while the average
number of MFIs entering other EU countries has continued to decline. This suggests that
the UK has seen a greater level of entry by banks.29
We recognise that these EU countries have experienced specific shocks which the UK was
not subject to, such as the Euro-crisis. We consider it unlikely that these shocks have
affected all 26 countries at the same time; i.e. the Euro-crisis would have impacted entry
into the banking sectors in these countries in different ways and at different times. To
control for the impact these shocks may have had on these countries, we have included
country-specific GDP and dummy variables within the regressions.
Using DiD, we compare the permissions granted before the 2013 review (January 2009
to March 2013) to those granted after the 2013 review (April 2013 to June 2017) for the
UK and EU, taking into account country-specific factors.30 Our analysis shows there is an
increase in the number of firms authorised to enter the UK banking sector beyond the
number of firms who would have entered had the UK continued to follow a similar trend
to the EU post-review. The trend observed in the full EU sample analysis broadly carries
across to a subsample of EU countries with a comparable number of entrants to the UK
(Italy, France, Spain, and Germany). Full details of our analysis are in the Technical
Annex.31
That is, accounting for EU-wide and country specific factors we show that since the 2013
review the UK has experienced a comparative increase in the average number of banking
permissions granted per quarter. It is evident that since the 2013 review, there has been
a positive impact on entry into the UK. However, not all entry into the UK can be
attributed to the 2013 intervention as some banks told us they were considering entering
the UK banking sector anyway.
Notwithstanding the limitations of using other EU countries as a comparator, we consider
that this piece of analysis, taken together with other findings, such as our interviews with
firms, give us assurance that the 2013 intervention has had a positive impact on entry in
the UK.
A more efficient authorisations process
The intervention has also had a positive impact on the time it takes for firms to be
granted permissions. Comparing a 4-year period either side of the intervention, it is
evident that:
• Firms which meet the Threshold Conditions (TCs) are more likely to be
authorised within 12 months.32 (Firms that do not meet the TCs are not
29 For further details see Section 1 of the Technical Annex. 30 We recognise that there are differences between countries and therefore we use a ‘fixed-effects’ approach at the country level. That is, we attempt to account for factors which may influence the number of joiners in each country; such as changes in tax rates or the country’s post-crisis rate of recovery. A more detailed discussion of the regression can be found in the Technical Annex. 31 As explained in the Technical Annex while the number of observations we have for the UK is not large, we are still able to conclude at a statistically significant level.
32 All applications need to be determined in 12 months. On occasion, applicants will withdraw an application and re-apply to restart the clock.

24
authorised). Since 2013, 85% of firms were authorised within 12 months compared to
just over 50% of applicants being authorised within 12 months before the
intervention.
• The time taken to assess firms’ applications has gone down. Before 2013 it
took an average of 10.6 months for a firm to be authorised from submitting their
application, compared to a current average of 7.3 months. This reduction is a result of
changes to the authorisations process as well as pre-application engagement between
firms, the FCA, and the PRA.33
The changes to the authorisations process have increased the certainty and clarity of the
applications process. Pre-application engagement, where potential applicants can discuss
and receive challenge on their applications as well as obtain formal feedback, is an
important part of this.34 By having a clearer view of what is expected of them, firms can
better plan for the process and development of their business. Since April 2013, the FCA
and PRA have had around 40 pre-application meetings each year.
The mobilisation route has been widely used as a means through the authorisation
process since it was introduced in 2013. 60 percent of firms authorised have opted to use
this route. Of those banks using the mobilisation process, almost all of them have been
UK domiciled (and not part of a broader banking group).
The first banks through the mobilisation route noted it was imperfect, although banks
who used this option later found it a positive experience. Many banks valued the level of
pre-application engagement, and found mobilisation allowed them the ability, for
example, to attract the required level investments, source the right IT solutions or recruit
the right personnel. However, there remained challenges to setting up a bank and
becoming fully operational, such as other regulatory and operational requirements which
needed to be fulfilled. Banks also told us that Internal Capital Adequacy Assessment
Process (ICAAP) and (Internal Liquidity Adequacy Assessment Process) ILAAP documents
required specific skills that were not easy to source. Almost all banks who entered since
the 2013 review did not consider the regulatory requirements and authorisations process
to be a substantial barrier to entry.
We conclude that these changes have made it easier for new banks to enter the market.
33 However, the time firms spend engaging with the FCA and PRA is not reflected in the current average of 7.3 months as this occurs before the application is submitted. In addition, those firms that opt for mobilisation, are not fully operational when they are authorised (whereas they would be under the old process).
34 It is expected that firms act on the feedback received during these pre-application meetings.

25
Section summary
Our analysis shows that:
- There has been an increase in UK domiciled banks since the intervention. Almost
two-thirds of all new banking permissions were granted to UK domiciled banks
compared to 22% in the 4 years before 2013. This indicates an increase in the
number of new banks establishing operations in the UK from scratch.
- There has been a shift towards entrants offering more retail banking products
and specialised SME banking services.
- A number of innovative business models have arisen since the review.
Having looked at the total number of firms authorised, we examine the changes in
‘entrants’ to the UK banking sector.
Between January 2009 and the end of March 2013 there were 14 entrants, and since
April 2013 there have been 18.35 As well as an increase in entrants, there has been a
change in the entrants’ country of origin. Before the intervention 22% of entrants were
UK domiciled, whereas almost two-thirds of post-review entrants have been UK
domiciled. Overseas banks36 are establishing operations in the UK through a branch or
subsidiary, often to serve a corporate client base and operate in the wholesale segment
of the market. UK domiciled entrants are in the main establishing a new bank aimed at
providing banking services to a particular segment of the UK market. We focus on these
services and products in this chapter.
Banking services offered by entrants
Table 2 shows the different types of banking services offered by entrants. After the
intervention, no banks offering investment banking services have entered. Rather, there
has been a departure from wholesale banking services, typically offered by overseas
banks, towards more varied retail banking offerings and specialised SME banking
services. This is also reflective of a broader trend, since the post-financial crisis, with
banks transitioning towards retail deposits as a more secure form of funding, as indicated
by the Strategic Review of Retail Banking Business Models.
35 Although 24 firms were authorised, we only consider 18 to be entrants into the banking sector. See section 2 above, on how we identify entrants.
36 Overseas banks are those firms entering the UK which are not already established within the EU.
4 Banking services and products
offered by entrants

26
Table 2: Banking services offered by pre-review and post-review entrants37
Banking services offered 2009 Q1 –
2013 Q1
2013 Q2 –
2017 Q2
Wholesale banking 4 1
Corporate banking 4 4
Retail banking 7 9
Specialised SME 2 4
Clearing bank 0 1
Investment banking 3 0
Private banking 1 1
Source: FCA analysis of company websites and regulatory business plans
The product offerings of overseas banks, which are establishing a branch or subsidiary,
and UK domiciled banks tend to differ. Overseas banks are more likely to have an
offering tailored to corporate clients, whereas UK-domiciled banks tend to focus on retail
offerings to individuals and SMEs.
Entrants’ product offerings
Given the focus of post-review entrants on the retail banking segment, there has been a
change in the types of products entrants are choosing to offer consumers. Figure 6
compares the number of different types of offerings by pre-review and post-review
entrants across different product groupings. Most notable is the increase in personal
saving and deposit accounts offered by post-review entrants, as well as lending products
for businesses. There has also been an increase in the number of entrants offering
mortgage products to the market.
Few entrants have opted to provide transactional accounts (e.g. current accounts and
pre-payment cards) as part of their product offering so little benefit has arisen in these
areas to date, but these are now starting to appear.38
37 Table 2 includes prospective entrants who are currently in mobilisation.
38 We note that some firms may offer these types of accounts, but without deposit taking permissions (such as e-money providers); but as discussed above we do not consider them to be banks.

27
Figure 6: Product offerings by pre-review and post-review entrants
Source: FCA analysis of company websites and regulatory business plans
Alongside the increase in product offerings, a number of innovative banking models have
arisen amongst the post-review entrants. Specialised banks have been entering the
market targeting specific business segments with bespoke or niche service offerings.
Some of these entrants were already providing different types of finance to SMEs before
becoming a bank. Other entrants are finding new ways to attract customers, such as
differentiating the service proposition offered to SMEs or focusing on particular types of
businesses, such as payment service providers.39
Many of these banking business models are still in their infancy and are likely to develop
with their product offerings. In addition, some post-review entrants have introduced a
digital-only offering providing internet or mobile based banking services (e.g. some
current account offerings) to their customers in the retail banking segment and do not
have any physical branches.
39 Previous findings by other bodies, such as the CMA, have identified a lack of competition within the SME banking segment. So, entry which focuses on the SME segment is a welcome development in the market.

28
Section summary
Our analysis shows that:
- Post-review entrants grew deposit-taking and lending activities at a quicker rate
than the pre-review cohort of entrants. As well as the authorisation process,
other market factors and regulatory interventions may have contributed to this
increased growth.
- Post-review entrants account for around 0.5% of lending by all banks and c.0.8%
of all banks’ deposits by the end of June 2017. These shares remain low and it
may take several years for these firms to gain a significant share of deposits and
lending.
- The overall impact of entry on competition and the broader retail banking sector
has not yet been substantial.
We consider whether post-review entrants are growing at a faster rate compared to the
pre-review cohort.40 We measure growth by increases to the amount of deposits taken
and outstanding loans and balances. First, we look at whether post-review entrants were
able to raise relatively more in deposits when compared to pre-review entrants. We then
compare lending undertaken by each cohort.41
Deposit-taking activities by entrants
At the end of 2013 and 2017, entrants in each cohort held a total of £4.8bn and £8.7bn
worth of deposits respectively. Figure 7 shows a breakdown of total customer deposits
for each cohort of entrants.42 It is evident that post-review entrants have raised
considerably more retail deposits in aggregate in the first 4 years of their operation
relative to their pre-review counterparts. Most deposits raised by post-review entrants
are retail deposits, whereas pre-review entrants have been reliant on both retail and
corporate deposits. Also, as shown in the Technical Annex, post-review entrants have
grown retail deposit-taking activities at a quicker rate than the pre-review cohort of
40 Looking at accounting metrics for entrants, such as operating revenue (cost) growth, total costs to total assets and operating leverage, it broadly appears that post-review entrants are more efficient than pre-review entrants. However, given the limited time that post-review entrants have been operating in the market, we were not able to make a definitive comparison. As noted above, studies in Portugal and the USA indicate that new banks or financial institutions tend to be less encumbered by past business practices and legacy issues and operate efficiently.
41 Figures are inflation adjusted to 2017 Q2 values.
42 Total customer deposits comprise of: retail deposits excluding e-money, corporate deposits (deposits from non-bank firms) and other deposits (and does not include e-money and intra-group items). Total customer deposits exclude wholesale deposits. We noted that pre-review entrants received a substantial level of intra-group deposits.
5 The growth of entrants

29
entrants over the first 2 years of their average lifecycle. We note of course that post-
review entrants have a stronger focus on retail deposits than pre-review entrants.
Figure 7: Customer deposits – pre- and post-review entrants
Source: FCA analysis of FSA001 submissions
As the number of entrants differs in the 2 periods, Figure 8 shows the average growth in
retail deposits for each entrant cohort. The index below43 shows the growth in deposits
for each cohort in the last 2 years for each of the respective periods.44
Post-review entrants have, on average, experienced much faster growth in retail deposits
compared to the pre-review cohort. In two years, the average post-review entrant had
more than doubled the retail deposits they held in 2015 Q3. In contrast, the average pre-
review entrant had not increased retail deposits held. As incumbents grew their retail
deposits at similar rates in each of the respective time periods, market conditions are not
a substantial factor which would have (favourably) impacted the growth of one cohort of
entrants more than the other.
Figure 8: Average growth in retail deposits received by entrants
Source: FCA analysis of FSA001 submissions
43 The index is a measure of the average growth by entrants over a specified time-period. The index starts at a base of 100 for a given year. The deposits (lending) is then shown by the percentage change from 100 for each subsequent quarter. 44 The last two years of each period are selected as this provides an indication as to how entrants are performing once they have established themselves in the market. It also factors in that entry is spread over each of the respective periods, so focusing on the last two years of each period allows us to capture the activity of entrants once they have established themselves in the market.

30
Figure 9 shows the deposits taken by each cohort of entrants as a percentage of deposits
taken by all banks. At the end of Q1 2013, pre-review entrants accounted for 0.4% of all
bank retail deposits, and 0.1% of other deposits. Comparatively, post-review entrants
account for 0.8% of bank retail deposits and 0.7% of other deposits by Q2 2017, but did
not experience similar growth in relation to corporate deposits. This is expected as many
of the post-review entrants are newly established banks and have not actively targeted
business (savings) accounts.
Figure 9: Entrants’ share of all banks’ deposits
Source: FCA analysis of FSA001 submissions
The market growth exhibited by post-review entrants in retail deposits is almost double
that of pre-review entrants and underpins the stronger retail offering of recent entrants.
New entrants almost exclusively focus on retail deposits. From Figure 9 it is evident that
newer entrants are gaining market share from incumbents at a quicker rate.
However, this increased growth can also be attributed to other factors. Government and
regulatory initiatives since the crisis have been a holistic effort aimed at improving
competition in the retail banking sector. These initiatives could be helping overcome
some barriers to expansion and increasing the rate of uptake of products offered by
entrants who entered after the 2013-review when compared with the pre-review cohort.
Our Strategic Review of Retail Banking Business Models shows that new entrants have
yet to pose a significant risk to incumbent banks. Major banks have scale advantages
that have helped them to sustain high market shares in deposit markets, and high
switching costs for customers have made it difficult for new entrants to acquire
significant numbers of customers. The recently introduced Open Banking initiative is
designed to lower some of the long-standing barriers to switching and help smaller and
newer banks to grow and achieve scale. The success of this initiative is yet to be seen,
but in combination with other measures – such as the interventions evaluated here – has
the capacity to increase competitive challenge in retail banking and drive benefits to
consumers.
While entrants’ market shares have grown at a slightly faster rate and to a slightly higher
level, the overall extent to which entrants have penetrated the market has been limited
indicating that it takes time for entrants to increase their market share. Looking at the
stock of deposits underplays the impact new entrants have on the market as new banks
don’t have a back-book in their stock and incumbents have a large stock of deposits.
However, the increased number of competitors have not yet obtained many customers
from incumbents because barriers to expansion remain which affect the ability of

31
entrants to compete for new customers, especially for more ‘sticky’ consumers (hence
the small combined market share of post-review entrants); nor have they attracted a
significant number of new customers to market.
Lending by entrants
Pre-review entrants were lending £7.4 billion as at Q1 2013, whereas post-review
entrants were lending just under £8.5 billion. As entrants have attracted more deposits
their lending has increased. We note that for both groups, a component of the growth in
lending will be driven by firms which were doing lending activities before becoming a
bank. The proportion of these banks differs across cohorts.
As shown in the Technical Annex, post-review entrants have grown their lending
activities at a quicker rate than the pre-review cohort of entrants over the first 2 years of
their average lifecycle.
Since the number of entrants differs in the 2 periods, Figure 10 shows the average
growth in loans and of advances outstanding (the stock of lending) for each cohort
entrants. Post-review entrants have, on average, experienced much faster growth in
loans compared to the average growth for pre-review entrants. In contrast, lending by
incumbents has decreased slightly in the period 2011 to 2013, by 6.7%. Market
conditions are likely to have differed in these periods and contributed to the slower
growth of pre-review entrants relative to the post-review cohort.
Figure 10: Average growth in lending by entrants
Source: FCA analysis of FSA001 submissions
The growth in lending balances is also reflected in the share of total bank lending. Figure
11 below shows that at the end of Q1 2013, pre-review entrants had just over 0.3% of
all outstanding loans and advances to customers by banks. In contrast, at the end of Q2
2017, post-review entrants had approximately 0.5% of all loans and advances to
customers by banks.

32
Figure 11: Loans and advances to customers (balances outstanding)
Source: FCA analysis of FSA001 submissions
We conclude that post-review entrants have experienced faster growth in lending, which
has translated into a bigger gain in market share from incumbents when compared to
pre-review entrants. However, market conditions may have affected the lending activities
of pre-review entrants.
Looking at the stock of lending underplays the impact new entrants have on the market
as new banks don’t have a back-book in their stock and incumbents have a large stock of
lending. New banks could have a large share of new lending but a tiny proportion of the
stock of lending. Our Strategic Review of Retail Banking Business Models also shows that
major banks have scale advantages that have helped them to sustain high market shares
in lending markets. Our analysis suggests that it takes time for entrants to increase their
market share with regards to lending activities. Firms told us there were barriers
preventing them from expanding or entering other markets (such as, for example, the
ability to attract customers or the cost of funding). This would indicate that the overall
impact of entry on competition and the broader retail banking sector has not yet been
substantial.

33
Section summary
Our analysis shows that:
- Lowering barriers to entry is a necessary but not sufficient condition for healthy
competition. Entry has mainly benefitted those consumers that have switched to,
or sought to use, new entrants.
- Customers using cash savings products offered by post-review entrants experience
offerings which offer between 30 and 100 basis points more on fixed-term savings
accounts when compared to other banks.
- Entrants are likely to offer specialised mortgages which are not offered by other
established banks.45
- Comparing similar types of mortgages, those borrowing from new entrants realise
cheaper offerings than those offered by existing banks. Evidence suggests that in
the first year of their loans, those borrowing from entrants saved around £3m in
total interest payments.
Many of the post-review entrants are active in retail banking and we focus on this sector
in this chapter. We consider whether post-review entrants have better offerings
compared to other banks. First, we look at the type of cash savings products offered by
post-review entrants and whether these offerings have a higher interest rate (gross
annual equivalent rate) to attract deposits compared to other banks. We then compare
the mortgage products offered by post-review entrants to those offered by other banks
to see whether consumers benefit from a lower annual percentage rate of charge (APRC)
on mortgages. We focus on these 2 product areas because entrants have not always
included transactional accounts (e.g. current accounts and pre-payment cards) as part of
their product offering so fewer benefits have arisen to date.
Cash savings
In determining the impact entrants are having in the cash savings market, we consider
the different deposit products and the interest rates offered on these products during
2017. We then use regression analysis to compare the interest rates offered by post-
review entrants to those offered by other banks to ascertain whether these banks have a
more competitive offering.
We use Moneyfacts data to compare the savings products offered by banks.46 Almost
90% of cash savings products offered by post-review entrants in 2017 were fixed-term
45 Although these specialised mortgages may have been available through non-banks.
46 The dataset contains 44 incumbents which offer 1,141 fixed term products, 7 post-review entrants offering 384 fixed term products and 3 pre-review entrants offering 36 fixed term products. It should be noted
6 Benefits to consumers

34
savings products, which offer a guaranteed interest rate for savings with a fixed-term
length. Looking at fixed-term savings products, Table 3 shows that post-review entrants
on average:
• offer products which have longer fixed-term lengths compared to other banks
• offer higher interest rates when comparing products across the same fixed-term
length
• keep fixed-term products on the market for shorter periods of time
Table 3: Fixed-term savings product offerings
Products offered Post-
review
entrants
Pre-review
entrants
Incumbents
Average fixed-term length (across
all products):
2.4 years 1.2 years 1.6 years
Average interest rate by term
length:
1-year fixed term 1.6% 1.2% 1.1%
2-year fixed term 1.8% 1.3% 1.3%
3-year fixed term 2.0% 1.5% 1.6%
Average duration product is
offered on the market (months):
1-year fixed term 3.8 4 4.2
2-year fixed term 3.5 4 4.0
3-year fixed term 3.8 5.3 4.3
Source: FCA analysis of Moneyfacts Data
To take account of the different features of fixed-term savings accounts, which may have
also influenced the interest rates offered, we use POLS regression analysis on around
1,500 fixed term deposit accounts. We assess whether there is a significant difference
between the interest rates offered by post-review entrants to other banks.47 Full details of
our analysis are in the Technical Annex.
that the product comparison does not include all banks. For the 2017 analysis which follows, the sample consists of 44 incumbents, 1 pre-review entrant and 6 post-review entrants. A more detailed discussion of the dataset can be found in the Technical Annex.
47 The econometric analysis takes account of factors which may be observable (eg whether the product is offered within a branch or online), but does not consider unobservable variables (eg geographical variation).

35
The analysis shows that post-review entrants offer significantly higher interest rates on
fixed term savings products;48 these products offer between 30 to 100 basis points more
than the interest rate offerings of incumbents. This finding is supported by firm
interviews, where entrants who offer cash savings products indicated that consumers are
sensitive to interest rates, and to attract customers they ensure their products feature
prominently in best buy tables.
As noted in the cash savings market study, the need for new entrants to offer higher
interest rates is a sign of the challenges they face in attracting and retaining customer
deposits from other incumbents. New entrants have to be able to make a viable business
model on the basis of offering these higher deposit rates.
Mortgage lending
In determining the impact entrants are having in the mortgage market, we consider the
features of different mortgages on offer and whether there is a difference in the APRC
consumers paid in the first year of their mortgage. We note that the mortgage offerings
differ across post-review entrants, with some firms providing specialised mortgages. These
types of mortgages are reflective of the different banking models of post-review entrants
(and their lending activities prior to becoming a bank). We compare APRC offers on the
mortgages sold by post-review entrants to those sold by pre-review entrants and
incumbent banks. In doing so, we control for the different mortgage features, by using
econometric techniques to ascertain whether post-review banks have a more competitive
offering for consumers. 49 Lastly, we consider the extent to which consumers have
benefitted from these offerings across the UK.50
Examining the mortgages originated by post-review entrants in 2017, we find that these
firms have offered a wide range of products. In particular, more than 40% of mortgages
originated by post-review entrants have features that are generally associated with
specialist lending; such as, reversion to LIBOR rate, second charge mortgages51 and
bridging loans.52 This has introduced a change to the types of mortgages which are
typically offered by banks, and is driven by those entrants that were already in the
mortgage-lending sphere before becoming banks.
Table 4 presents the share post-review entrants have of mortgages originated by banks
in 2017 for selected loan features. It shows that post-review entrants have had a
particularly strong presence in bridging loans, interest roll-up mortgages53 and second
charge mortgages. So, it is not surprising that these mortgages account for a meaningful
share of the loans originated by post-review entrants. In addition, these product-specific
48 These results are statistically significant. See the Technical Annex.
49 The sample contains mortgages sold by 52 incumbent banks, 5 post-review entrants, and 3 pre-review entrants. So, the findings presented in this section are driven by the activities of a small number of firms.
50 Our analysis focuses on the benefits of this initiative to consumers and on competition and less so on the wider implications for prudential risks, such as ‘pricing for risk’ and financial stability in general.
51 Second charge mortgage contracts are loans that are secured on a property that already serves as collateral for another mortgage.
52 Bridging loans typically have shorter terms and serve as a temporary financing solution for borrowers.
53 Under an interest roll-up mortgage, a type of interest-only loan, neither capital repayments, nor payment of any of the interest accruing under its terms, are required or anticipated until it comes to an end.

36
shares of lending are in stark contrast to the overall share of bank mortgages by post-
review entrants, which was around 1.5% across the UK in 2017.
Table 4: Share of mortgages originated by different groups of banks in 2017, by selected product features
Post-review
entrants
Pre-review
entrants
Incumbents
Bridging loan 74% 0% 26%
Interest roll-up mortgage 57% 0% 43%
Second charge mortgage 25% 7% 69%
Shared equity mortgage 5% 0% 95%
Extra money withdrawn for debt
consolidation 4% 1% 95%
Mortgage advanced under a
government supported initiative 4% 0% 96%
Source: FCA analysis of PSD001 submissions. Note that rows may not sum to 100% due to rounding. This table excludes mortgages which were originated by non-bank mortgage lenders.
One beneficial impact of this focus has been extended access to mortgages through a
willingness of post-review banks to take on lending risk beyond the current appetite of
more established banks; particularly as some post-review entrants were offering
specialised mortgages prior to becoming a bank.54 In this sense, they do not compete
directly with existing banks but rather against specialised mortgage lenders.55 Naturally,
this has come at a cost with the increased risk being reflected in the product price.
When looking at whether entrants offer cheaper mortgages, our pricing analysis focuses
on a subset of loans that have two-year and five-year fixed rates. In doing so, we
exclude loans with LIBOR tracker reversion rates and regulated second charge mortgages
as the number of comparable loans by incumbents is limited, when considering 2- and 5-
year fixed-rate loans only. The remaining mortgages allow for a robust comparison of
pricing across groups. This sample covers approximately 85% of loans by existing banks
and a third of post-review entrants’ loans. See the Technical Annex for a discussion of
the relevant considerations.
To assess the total cost of borrowing for consumers, we calculate the Annual Percentage
Rate of Charge (APRC) for each mortgage sold.56 This measure accounts for any fees
(including intermediary fees) that the consumer may pay in addition to the interest due.
While consumers may pay a lender’s fees either up-front or over the life of the loan (ie
54 During firm interviews it was noted that firms would focus on identifying new types of customers they could lend to.
55 We do not explore whether firms who were already lending mortgages before they became banks have changed their mortgage product offerings since becoming a bank.
56 This approach adapts the methodology set out in the FCA’s Occasional Paper 35 “Six of One …? Choice of Intermediary in the UK Mortgage Market”. See the Technical Annex for a further explanation of the methodology used.

37
‘roll-up’ the fee), we assume fees are rolled-up. We also assume that customers re-
mortgage after the initial deal period which is necessary, as reversion rates are not
available in the data.
Taking this into account, Table 5 compares the average APRC across 2- and 5-year fixed
mortgages in 2017. It is evident that post-review entrants have originated loans with
lower APRCs than the other groups for both 2- and 5-year fixed mortgages.
Table 5: Average APRC for 2- and 5-year mortgage offerings
Products offered Incumbents Pre-review
entrants
Post-review
entrants
2-year fixed: average APRC 2.24% 3.65% 1.95%
5-year fixed: average APRC 2.44% 2.17% 1.88%
Source: FCA analysis of PSD001 submissions
While the statistics above allow us to compare the average price of mortgages, it does
not account for differences in product and borrower characteristics across incumbents,
pre-review entrants, and post-review entrants. We use regression analysis to take such
factors into account when assessing whether there is a significant difference between the
interest rates offered by post-review entrants to other banks.
The regression analysis controls for observable factors in the data, such as borrower
income and the loan-to-value ratio, but may also be affected by unobserved factors. See
the Technical Annex for a further discussion on the econometric analysis and the different
specifications used for the regression analysis (models 1-3 in Table 6 below).
The results from our regression analysis are shown in Table 6 below. It can be seen, that
the APRC for 2-year fixed mortgages by post-review entrants is around 25 basis points
lower than incumbents, on average, although the statistical significance of these findings
varies depending on the different assumptions used in the econometric models. Post-
review entrants are significantly cheaper when compared to the offerings by pre-review
entrants.
Table 6 also shows that, all else being equal, post-review entrants offer 5-year fixed
mortgages that are around 45 basis points cheaper than incumbents. This difference in
APRC is statistically significant across the different econometric models used.

38
Table 6: Regression analysis
2-year fixed mortgages 5-year fixed mortgages
Model 1 Model 2 Model 3 Model 1 Model 2 Model 3
Post-review entrants -0.28†
(0.24)
-0.28†
(0.24)
-0.23†
(0.18)
-0.45***
(0.07)
-0.44***
(0.07)
-0.46***
(0.06)
Pre-review entrants 1.50†
(0.85)
1.50†
(0.85)
1.24†
(0.63)
-0.06
(0.09)
-0.05
(0.08)
-0.01
(0.05)
Borrower features Yes Yes Yes‡ Yes Yes Yes‡
Mortgage features Yes Yes Yes‡ Yes Yes Yes‡
Postcode controls No Yes No No Yes No
Interactions No No Yes‡ No No Yes‡
Adj. R-squared 0.67 0.68 0.67 0.70 0.71 0.72
Observations 415,175 415,175 415,175 231,856 231,856 231,856
Source: FCA analysis of PSD001 submissions
The ‘Yes’ and ‘No’ entries in the table indicate whether a particular set of features has been controlled for in a particular
regression specification. For example, borrower features include factors such as borrower income; mortgage features accounts
for loan features such as whether it is a joint mortgage, and postcode controls account for geographical differences on the
outward postcode level.
‡ The model uses the most informative principal components of these features. See the Technical Annex for a discussion of the
principal component analysis (PCA) used in Model 3.
*** indicates that the findings are statistically significant at a 1% level, ** is significant at 5%, * is significant at a 10%
† indicates that the estimates are significant at a 1% level, in some specifications. See the Technical Annex for a discussion of
statistical significance.
Using the findings from the econometric analysis, we approximate how much less
interest borrowers from post-review entrants paid during the first year of their mortgage,
compared to the counterfactual that they had taken out the same loan with an
incumbent. For the loans analysed, the evidence suggests that, in total, in 2017,
borrowers from post-review entrants paid around £3m less interest during the first year
of their loans, compared to those who borrowed from the incumbents.57 While we do not
estimate future savings, we would expect entrants to offer some savings to consumers at
the margin.
We also considered whether certain geographic areas within the UK were benefiting more
from the offerings of post-review entrants. The data and firm interviews indicated that
these entrants rely almost entirely on intermediaries to originate loans. Figure 12 shows
57 Across specifications, the estimated interest difference remains positive and in the region of £3m.

39
those areas in which new entrants are originating more than 3%, or double their national
share, of mortgages sold.58 Such areas are distributed widely across the UK, suggesting
that post-review entrants’ use of intermediaries has allowed them to reach customers
independently of their location.
Figure 12: Areas where post-review entrants accounted for more than 3% of regional sales in 2017
Source: FCA analysis of PSD001 submissions
58 Our analysis includes mortgages in Northern Ireland. However, it appears that entrants have not accounted for more than 3% of bank loans in any outward postcode area in Northern Ireland in 2017.

40
The lessons learned from this evaluation are a function of the intervention in this specific
market. Our lessons here may not read across directly to, for example, a similar
intervention in another market. Nevertheless, they provide useful insight in helping us
anticipate potential ways of reducing harm and the likely impact in doing so.
Table 7: Main lessons learned from our evaluation
# Lesson learned Comments
1
It takes time for
lowering barriers to
entry to affect
market shares in a
significant way
Lowering barriers to entry is effective and has a positive
impact on entry, and delivered benefits to consumers. We
have seen, for example, new entrants with significantly
better offerings on specific products. This intervention is a
necessary but not sufficient condition for healthy
competition. The impact on competition in banking has so
far mainly benefitted those consumers that have switched
to the new entrants.
2
There may be other
barriers to firms
expanding to a
more significant
scale
The increased number of competitors has not yet
benefitted many customers of incumbents because barriers
to expansion remain. These affect entrants’ ability to
compete, especially for more ‘sticky’ consumers (hence the
small combined market share of new entrants). The small
scale or niche entry may not be enough to force incumbent
banks to compete harder to protect market share.
3
Clearer,
transparent
processes and
engagement can
have a significant
positive impact on
all our interactions
with firms
Firms said the authorisations process under the FSA was a
‘black box’. The changes introduced by the Bank and
PRA/FCA have improved the transparency of the
authorisations process and allowed for greater regulatory
engagement. While the requirements for new firms have
not changed, the new approach to authorisation has had a
positive impact on entry. It has made it easier for firms to
understand and do what we expect from them. This can
affect levels of compliance, for example, as well as the
authorisation of new firms into other sectors we regulate.
7 Lessons learned

© Financial Conduct Authority 2018
12 Endeavour Square, Stratford, London E20 1JN Telephone: +44 (0)20 7066 1000 Website: www.fca.org.uk
All rights reserved