Embed Size (px)
Citation preview
EOR CCS Incentives: Win for environment, economy, security, treasury Kurt Waltzer Clean Air Task Force IOGCC Midyear Meeting 2012 Vancouver, BC
Overview
• In order to address climate change, CCS must be globally affordable
• Scale is the key to drop costs
• The Value proposition for EOR-CCS
• Recommendations from the National EOR Initiative
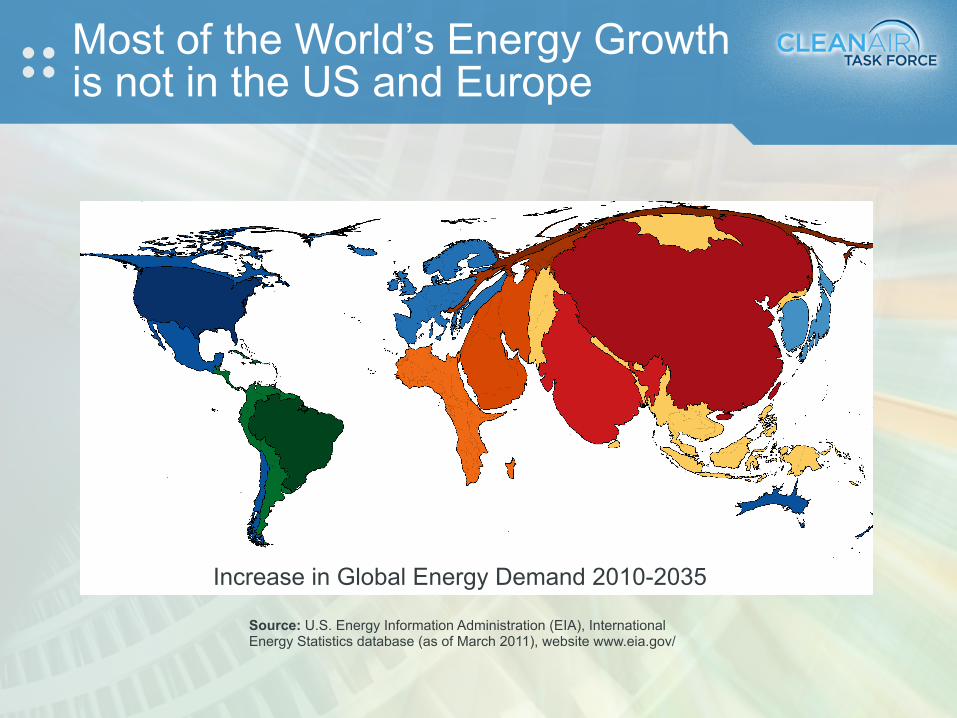
Most of the World’s Energy Growth is not in the US and Europe
Increase in Global Energy Demand 2010-2035
Source: U.S. Energy Information Administration (EIA), International Energy Statistics database (as of March 2011), website www.eia.gov/
© BP 2012
Non-OECD economies drive energy consumption growth…
0
3
6
9
12
15
18
1990 2000 2010 2020 2030
Renewables
Hydro
Nuclear
Coal
Gas
OilOECD
Non-OECD
Billion toe
*Includes biofuels
Billion toe
Energy Outlook 2030 10
*
0
3
6
9
12
15
18
1990 2000 2010 2020 2030
OECD
Non-OECD
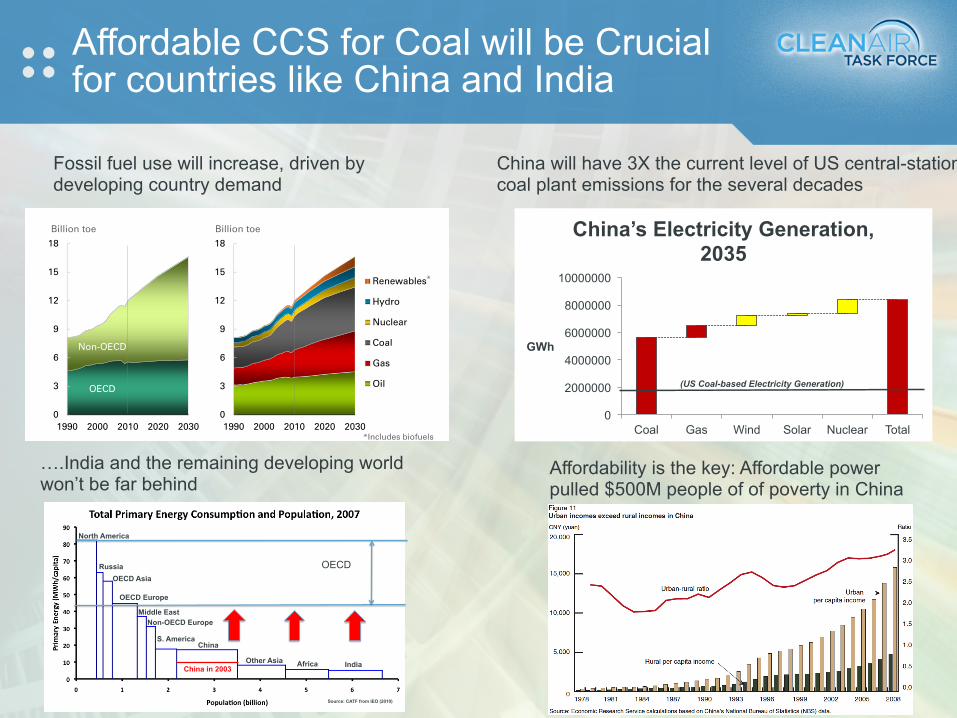
Affordable CCS for Coal will be Crucial for countries like China and India
4
Fossil fuel use will increase, driven by developing country demand
China will have 3X the current level of US central-station coal plant emissions for the several decades
Affordability is the key: Affordable power pulled $500M people of of poverty in China
North America
Non-OECD Europe
S. America
Other Asia
China
Africa India
Russia OECD Asia
OECD Europe
Middle East
China in 2003
Source: CATF from IEO (2010)
OECD
….India and the remaining developing world won’t be far behind
0
2000000
4000000
6000000
8000000
10000000
Coal Gas Wind Solar Nuclear Total
GWh
China’s Electricity Generation, 2035
(US Coal-based Electricity Generation)
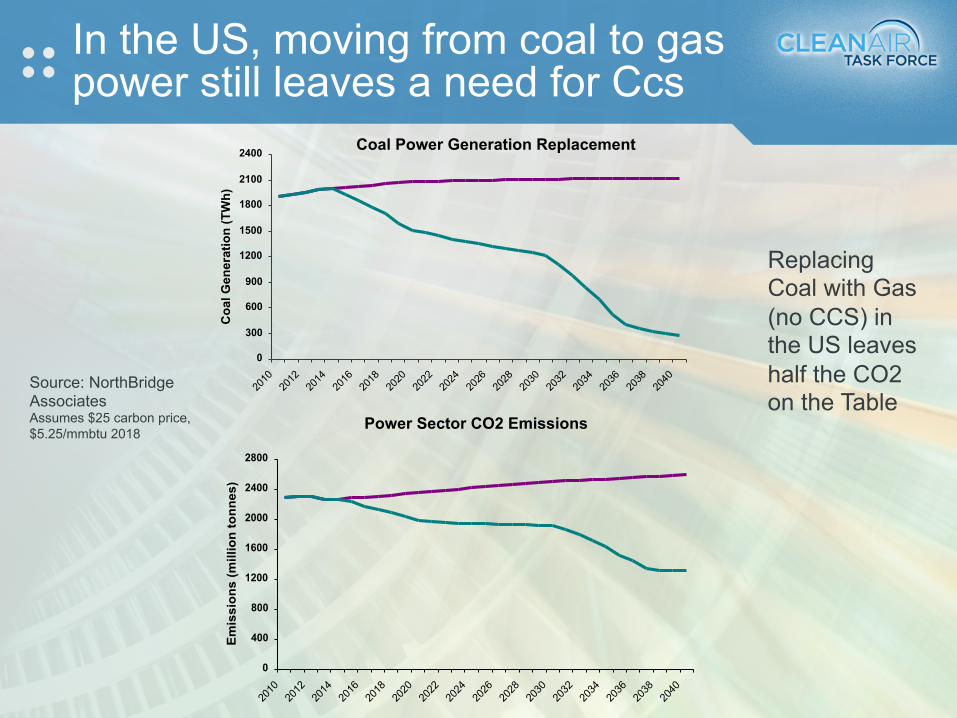
In the US, moving from coal to gas power still leaves a need for Ccs
0
300
600
900
1200
1500
1800
2100
2400
2010
2012
2014
2016
2018
2020
2022
2024
2026
2028
2030
2032
2034
2036
2038
2040
Coa
l Gen
erat
ion
(TW
h)
Coal Power Generation Replacement
0
400
800
1200
1600
2000
2400
2800
2010
2012
2014
2016
2018
2020
2022
2024
2026
2028
2030
2032
2034
2036
2038
2040
Em
issi
on
s (m
illio
n t
on
nes
)
Power Sector CO2 Emissions
Source: NorthBridge Associates Assumes $25 carbon price, $5.25/mmbtu 2018
Replacing Coal with Gas (no CCS) in the US leaves half the CO2 on the Table
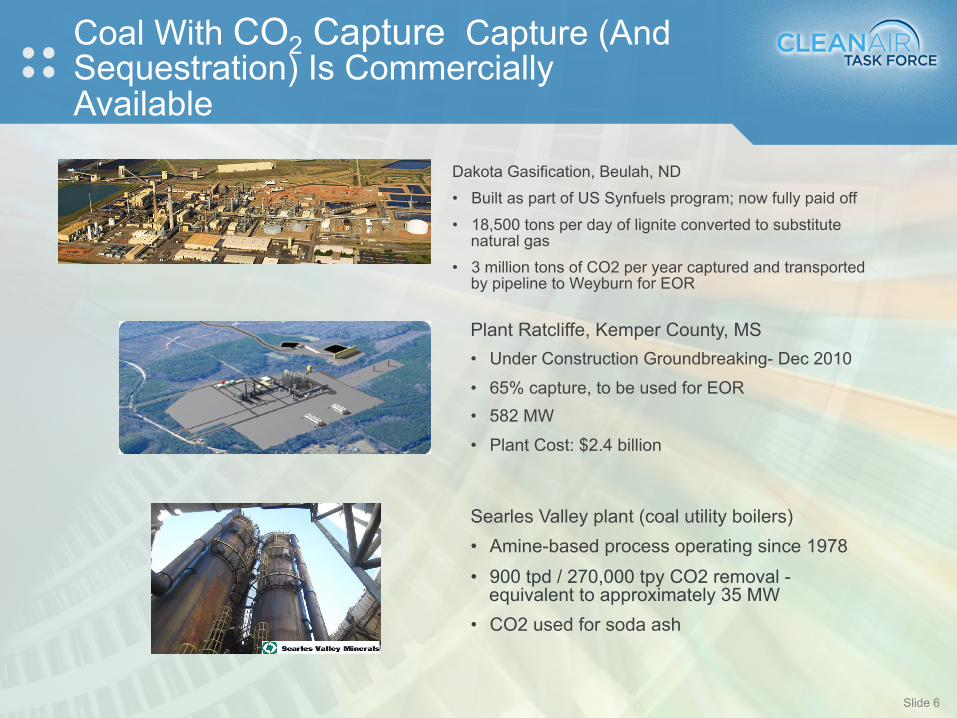
Dakota Gasification, Beulah, ND • Built as part of US Synfuels program; now fully paid off
• 18,500 tons per day of lignite converted to substitute natural gas
• 3 million tons of CO2 per year captured and transported by pipeline to Weyburn for EOR
Coal With CO2 Capture Capture (And Sequestration) Is Commercially Available
Slide 6
Plant Ratcliffe, Kemper County, MS • Under Construction Groundbreaking- Dec 2010
• 65% capture, to be used for EOR • 582 MW
• Plant Cost: $2.4 billion
Searles Valley plant (coal utility boilers) • Amine-based process operating since 1978 • 900 tpd / 270,000 tpy CO2 removal -
equivalent to approximately 35 MW • CO2 used for soda ash
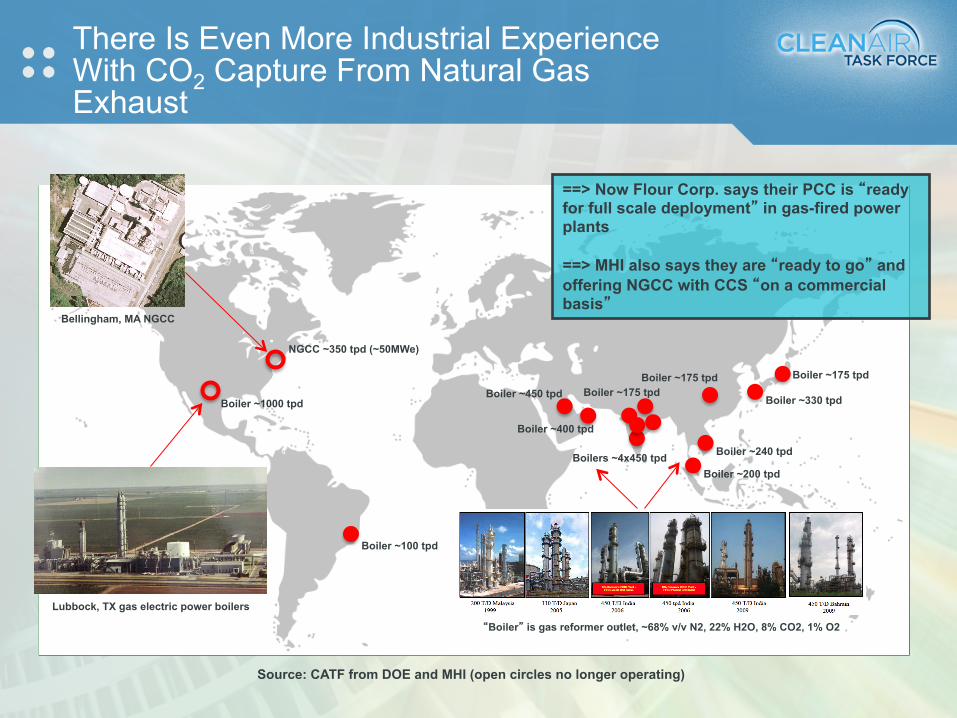
NGCC ~350 tpd (~50MWe)
Source: CATF from DOE and MHI (open circles no longer operating)
Boiler ~1000 tpd
Boiler ~175 tpd Boiler ~175 tpd
Boiler ~100 tpd
Boiler ~175 tpd
Boiler ~200 tpd
Boiler ~240 tpd
Boiler ~330 tpd Boiler ~450 tpd
Boiler ~400 tpd
Boilers ~4x450 tpd
“Boiler” is gas reformer outlet, ~68% v/v N2, 22% H2O, 8% CO2, 1% O2
There Is Even More Industrial Experience With CO2 Capture From Natural Gas Exhaust
==> Now Flour Corp. says their PCC is “ready for full scale deployment” in gas-fired power plants ==> MHI also says they are “ready to go” and offering NGCC with CCS “on a commercial basis”
Bellingham, MA NGCC
Lubbock, TX gas electric power boilers
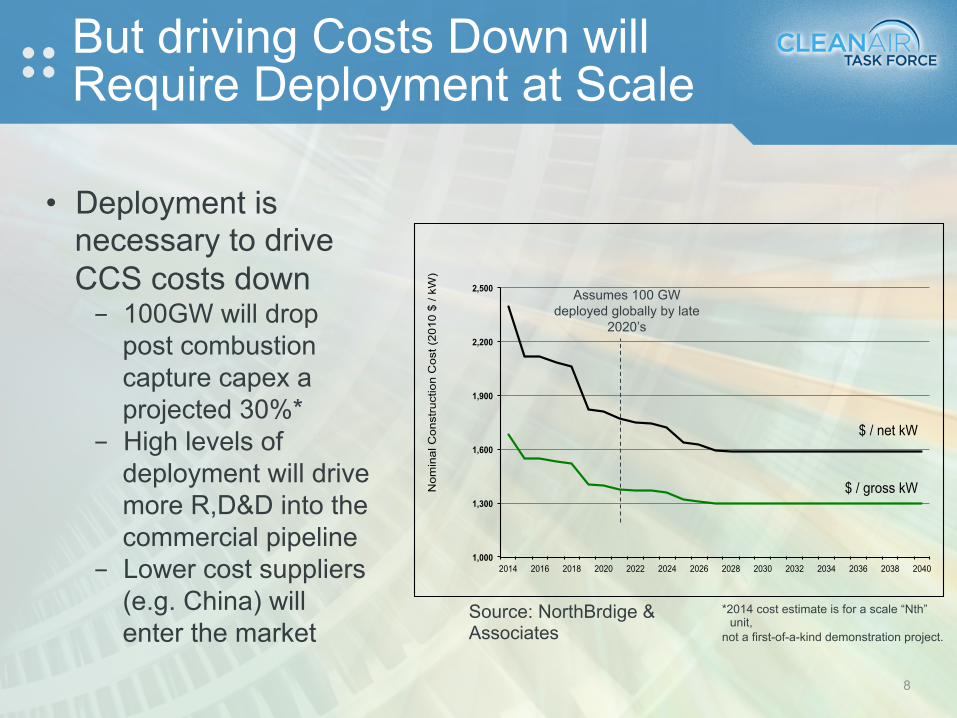
But driving Costs Down will Require Deployment at Scale
8
*2014 cost estimate is for a scale “Nth” unit,
not a first-of-a-kind demonstration project.
Source: NorthBrdige & Associates
1,000
1,300
1,600
1,900
2,200
2,500
2014 2016 2018 2020 2022 2024 2026 2028 2030 2032 2034 2036 2038 2040
Nom
inal
Con
stru
ctio
n C
ost (
2010
$ /
kW)
$ / net kW
$ / gross kW
Assumes 100 GW deployed globally by late
2020’s
• Deployment is necessary to drive CCS costs down - 100GW will drop
post combustion capture capex a projected 30%*
- High levels of deployment will drive more R,D&D into the commercial pipeline
- Lower cost suppliers (e.g. China) will enter the market
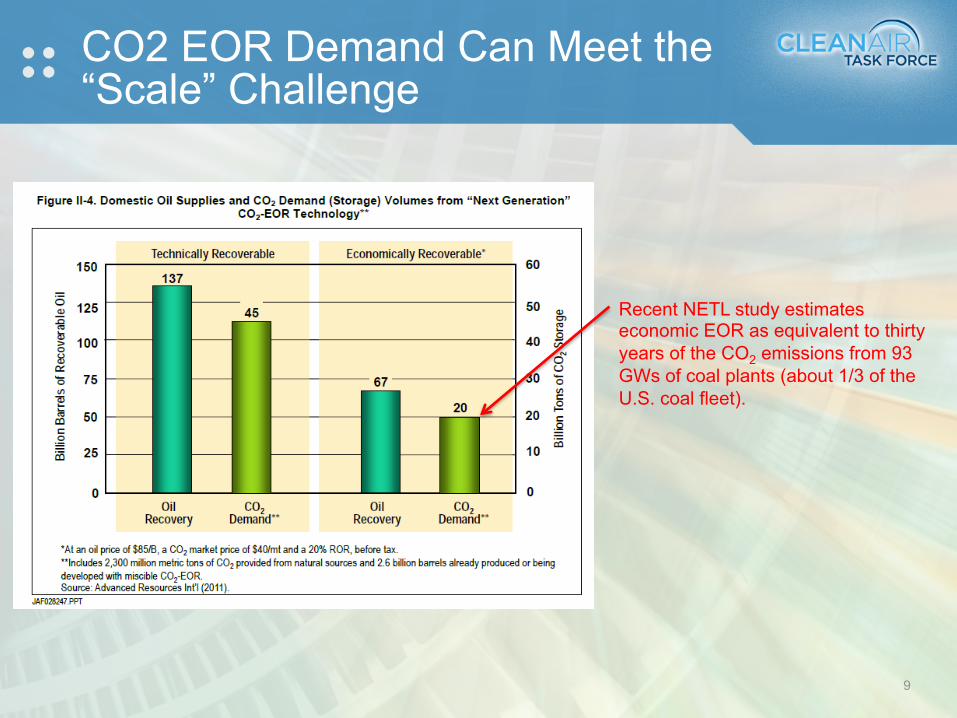
CO2 EOR Demand Can Meet the “Scale” Challenge
Recent NETL study estimates economic EOR as equivalent to thirty years of the CO2 emissions from 93 GWs of coal plants (about 1/3 of the U.S. coal fleet).
9
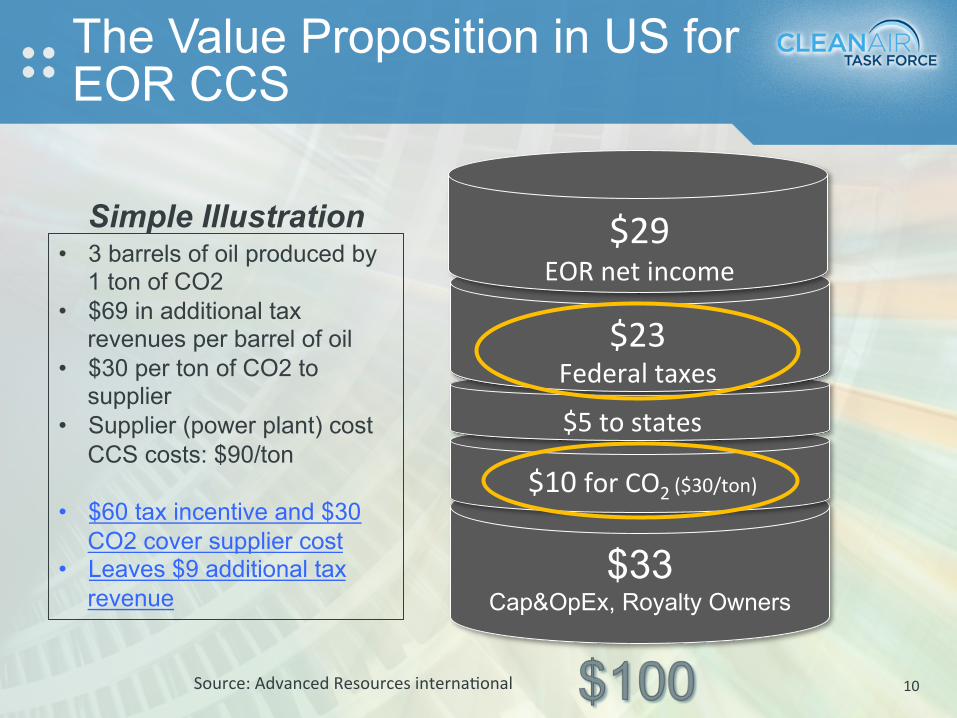
10 Source: Advanced Resources interna4onal
$33 Cap&OpEx, Royalty Owners
$10 for CO2 ($30/ton)
$5 to states
$23 Federal taxes
$29 EOR net income
The Value Proposition in US for EOR CCS
• 3 barrels of oil produced by 1 ton of CO2
• $69 in additional tax revenues per barrel of oil
• $30 per ton of CO2 to supplier
• Supplier (power plant) cost CCS costs: $90/ton
• $60 tax incentive and $30
CO2 cover supplier cost • Leaves $9 additional tax
revenue
Simple Illustration
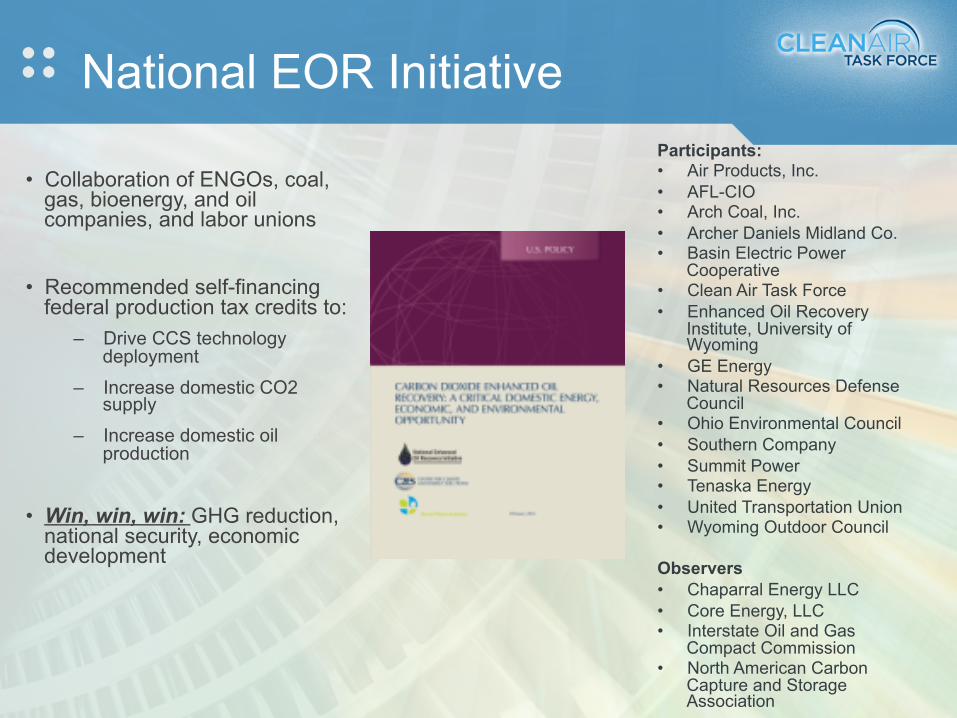
National EOR Initiative
• Collaboration of ENGOs, coal, gas, bioenergy, and oil companies, and labor unions
• Recommended self-financing federal production tax credits to:
– Drive CCS technology deployment
– Increase domestic CO2 supply
– Increase domestic oil production
• Win, win, win: GHG reduction, national security, economic development
Participants: • Air Products, Inc. • AFL-CIO • Arch Coal, Inc. • Archer Daniels Midland Co. • Basin Electric Power
Cooperative • Clean Air Task Force • Enhanced Oil Recovery
Institute, University of Wyoming
• GE Energy • Natural Resources Defense
Council • Ohio Environmental Council • Southern Company • Summit Power • Tenaska Energy • United Transportation Union • Wyoming Outdoor Council Observers • Chaparral Energy LLC • Core Energy, LLC • Interstate Oil and Gas
Compact Commission • North American Carbon
Capture and Storage Association
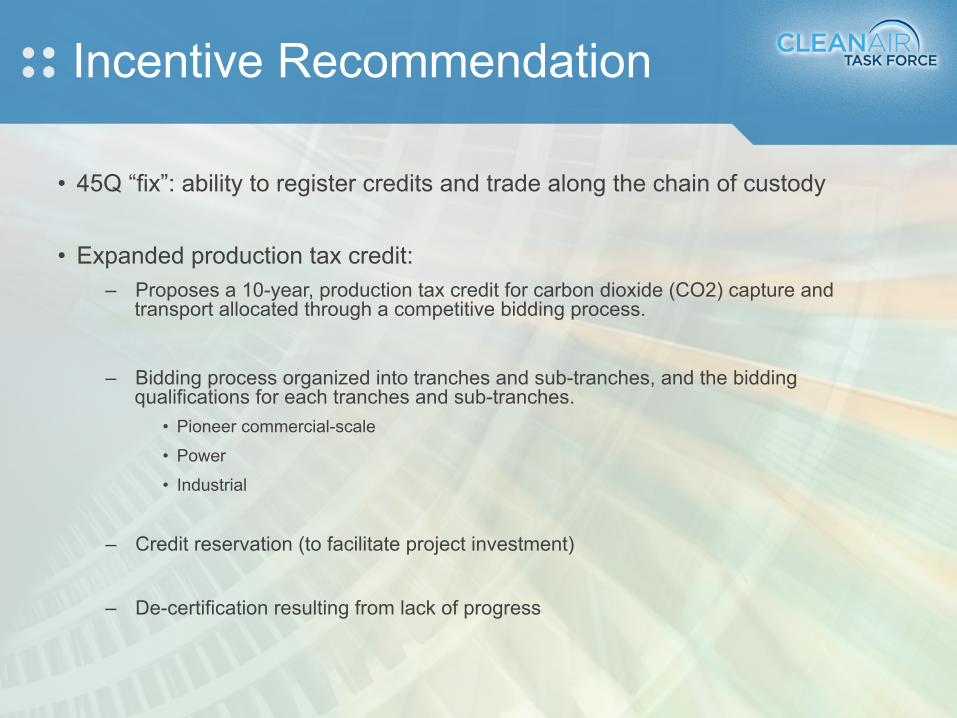
Incentive Recommendation
• 45Q “fix”: ability to register credits and trade along the chain of custody • Expanded production tax credit:
– Proposes a 10-year, production tax credit for carbon dioxide (CO2) capture and transport allocated through a competitive bidding process.
– Bidding process organized into tranches and sub-tranches, and the bidding
qualifications for each tranches and sub-tranches. • Pioneer commercial-scale
• Power
• Industrial
– Credit reservation (to facilitate project investment) – De-certification resulting from lack of progress
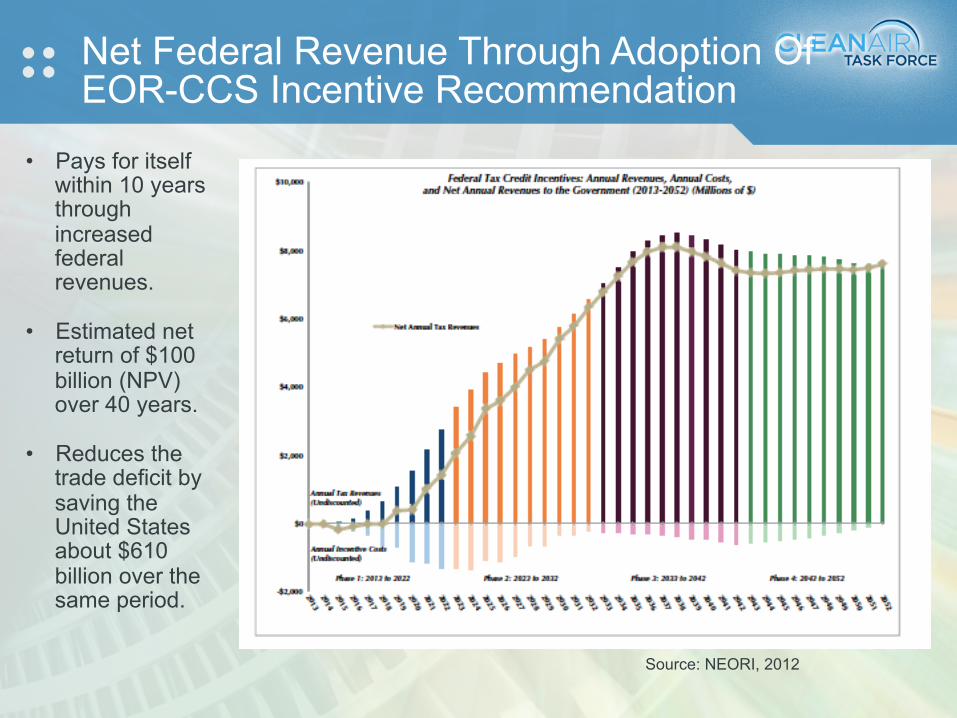
Net Federal Revenue Through Adoption Of EOR-CCS Incentive Recommendation
Source: NEORI, 2012
• Pays for itself within 10 years through increased federal revenues.
• Estimated net return of $100 billion (NPV) over 40 years.
• Reduces the
trade deficit by saving the United States about $610 billion over the same period.