Embed Size (px)
Citation preview

energy
opportunitygrowth
2001 Annua l Repor t to Shareho lders
2 EOG Resources, Inc.
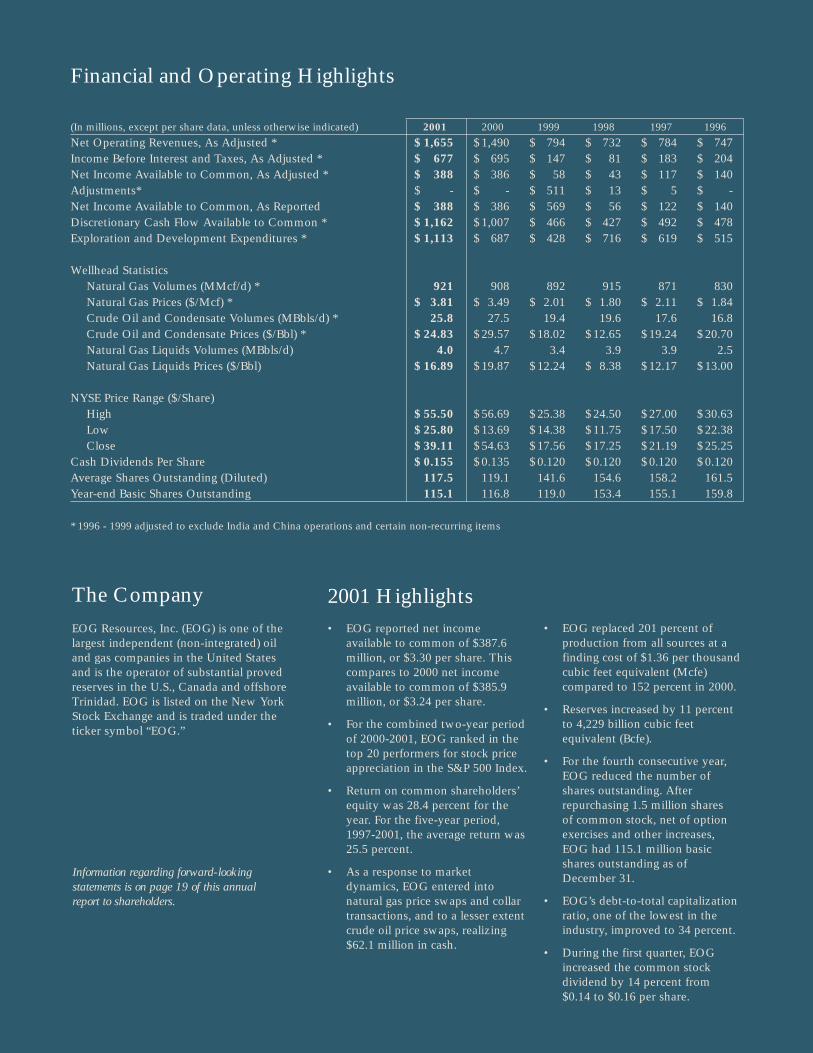
Financial and Operating Highlights
(In millions, except per share data, unless otherwise indicated) 2001 2000 1999 1998 1997 1996Net Operating Revenues, As Adjusted * $ 1,655 $ 1,490 $ 794 $ 732 $ 784 $ 747Income Before Interest and Taxes, As Adjusted * $ 677 $ 695 $ 147 $ 81 $ 183 $ 204Net Income Available to Common, As Adjusted * $ 388 $ 386 $ 58 $ 43 $ 117 $ 140Adjustments* $ - $ - $ 511 $ 13 $ 5 $ -Net Income Available to Common, As Reported $ 388 $ 386 $ 569 $ 56 $ 122 $ 140Discretionary Cash Flow Available to Common * $ 1,162 $ 1,007 $ 466 $ 427 $ 492 $ 478Exploration and Development Expenditures * $ 1,113 $ 687 $ 428 $ 716 $ 619 $ 515
Wellhead StatisticsNatural Gas Volumes (MMcf/d) * 921 908 892 915 871 830Natural Gas Prices ($/Mcf) * $ 3.81 $ 3.49 $ 2.01 $ 1.80 $ 2.11 $ 1.84Crude Oil and Condensate Volumes (MBbls/d) * 25.8 27.5 19.4 19.6 17.6 16.8Crude Oil and Condensate Prices ($/Bbl) * $ 24.83 $ 29.57 $ 18.02 $ 12.65 $ 19.24 $ 20.70Natural Gas Liquids Volumes (MBbls/d) 4.0 4.7 3.4 3.9 3.9 2.5Natural Gas Liquids Prices ($/Bbl) $ 16.89 $ 19.87 $ 12.24 $ 8.38 $ 12.17 $ 13.00
NYSE Price Range ($/Share)High $ 55.50 $ 56.69 $ 25.38 $ 24.50 $ 27.00 $ 30.63Low $ 25.80 $ 13.69 $ 14.38 $ 11.75 $ 17.50 $ 22.38Close $ 39.11 $ 54.63 $ 17.56 $ 17.25 $ 21.19 $ 25.25
Cash Dividends Per Share $ 0.155 $ 0.135 $ 0.120 $ 0.120 $ 0.120 $ 0.120Average Shares Outstanding (Diluted) 117.5 119.1 141.6 154.6 158.2 161.5Year-end Basic Shares Outstanding 115.1 116.8 119.0 153.4 155.1 159.8
* 1996 - 1999 adjusted to exclude India and China operations and certain non-recurring items
2001 Highlights• EOG reported net income
available to common of $387.6million, or $3.30 per share. Thiscompares to 2000 net incomeavailable to common of $385.9million, or $3.24 per share.
• For the combined two-year periodof 2000-2001, EOG ranked in thetop 20 performers for stock priceappreciation in the S&P 500 Index.
• Return on common shareholders’equity was 28.4 percent for theyear. For the five-year period,1997-2001, the average return was25.5 percent.
• As a response to marketdynamics, EOG entered intonatural gas price swaps and collartransactions, and to a lesser extentcrude oil price swaps, realizing$62.1 million in cash.
• EOG replaced 201 percent of production from all sources at afinding cost of $1.36 per thousandcubic feet equivalent (Mcfe)compared to 152 percent in 2000.
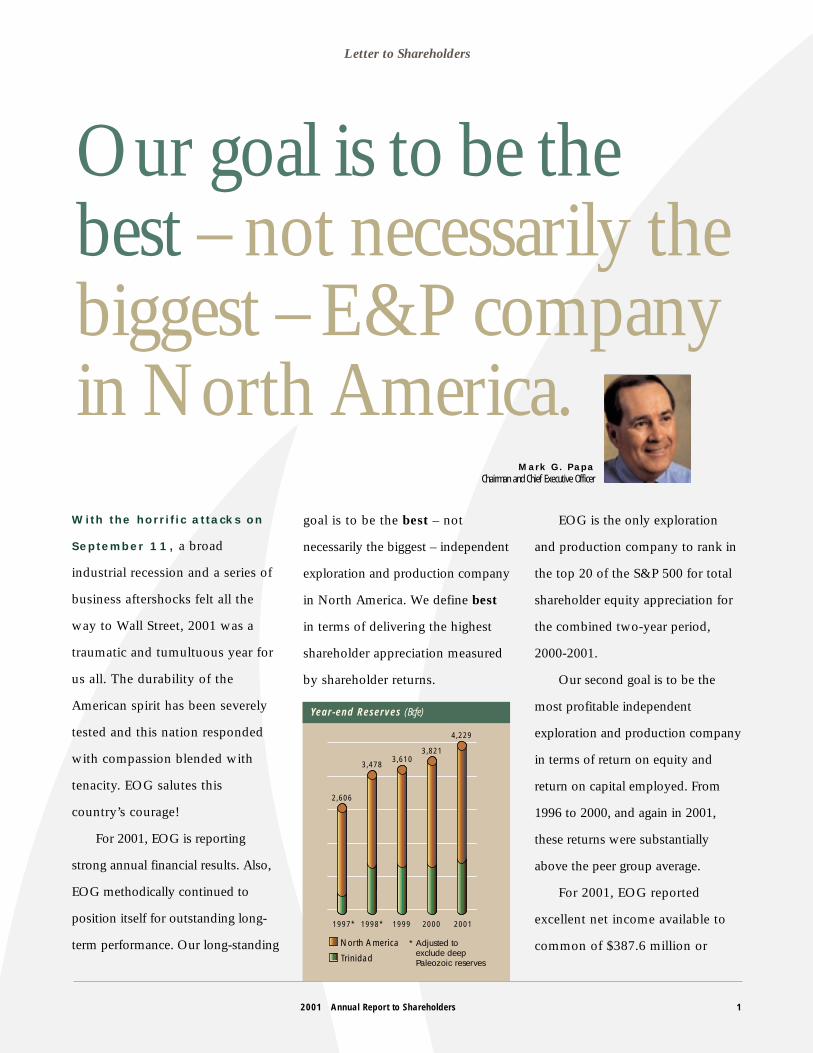
• Reserves increased by 11 percentto 4,229 billion cubic feetequivalent (Bcfe).
• For the fourth consecutive year,EOG reduced the number ofshares outstanding. Afterrepurchasing 1.5 million shares of common stock, net of optionexercises and other increases,EOG had 115.1 million basicshares outstanding as ofDecember 31.
• EOG’s debt-to-total capitalizationratio, one of the lowest in theindustry, improved to 34 percent.
• During the first quarter, EOGincreased the common stockdividend by 14 percent from $0.14 to $0.16 per share.
The CompanyEOG Resources, Inc. (EOG) is one of thelargest independent (non-integrated) oiland gas companies in the United Statesand is the operator of substantial provedreserves in the U.S., Canada and offshoreTrinidad. EOG is listed on the New YorkStock Exchange and is traded under theticker symbol “EOG.”
Information regarding forward-lookingstatements is on page 19 of this annualreport to shareholders.
Letter to Shareholders
With the horrific attacks on
September 11, a broad
industrial recession and a series of
business aftershocks felt all the
way to Wall Street, 2001 was a
traumatic and tumultuous year for
us all. The durability of the
American spirit has been severely
tested and this nation responded
with compassion blended with
tenacity. EOG salutes this
country’s courage!
For 2001, EOG is reporting
strong annual financial results. Also,
EOG methodically continued to
position itself for outstanding long-
term performance. Our long-standing
goal is to be the best – not
necessarily the biggest – independent
exploration and production company
in North America. We define best
in terms of delivering the highest
shareholder appreciation measured
by shareholder returns.
EOG is the only exploration
and production company to rank in
the top 20 of the S&P 500 for total
shareholder equity appreciation for
the combined two-year period,
2000-2001.
Our second goal is to be the
most profitable independent
exploration and production company
in terms of return on equity and
return on capital employed. From
1996 to 2000, and again in 2001,
these returns were substantially
above the peer group average.
For 2001, EOG reported
excellent net income available to
common of $387.6 million or
Our goal is to be the best – not necessarily thebiggest – E&P company in North America.
Mark G. PapaChairman and Chief Executive Officer
1998* 1999 2000 2001
3,4783,610
3,821
4,229
1997*
2,606
North America
Trinidad
* Adjusted to exclude deep Paleozoic reserves
Year-end Reserves (Bcfe)
2001 Annual Report to Shareholders 1
Letter to Shareholders
2 EOG Resources, Inc.
$3.30 per share, compared with
2000 net income available to
common of $385.9 million or $3.24
per share. At EOG, net income
matters. It is our belief that net
income and return on capital should
be important determinants of stock
price in the exploration and
production sector, rather than just
cash flow. We operate EOG based
on that conviction.
EOG’s 2001 operational
highlights are as diversified as
our nine divisions across North
America and Trinidad. In West
Texas, EOG advanced its horizontal
Devonian drilling program where
nine out of 12 wells were
successful. In South Texas, we
continued to focus on the Roleta
trend and we made a significant
wildcat discovery in the Wilcox
trend. The Oklahoma City Division
continued to build on its success in
the Oklahoma Panhandle. EOG
Resources Canada drilled more than
970 shallow natural gas wells,
made two small, attractive
acquisitions and is testing several
frontier plays. In Trinidad, an
ammonia plant that will be served
with natural gas from EOG’s U(a)
block is on schedule for a 2002 start-up
and several discoveries increased our
reserves in the SECC block.
Traditionally, EOG hasadded reserves through thedrillbit rather than throughacquisitions.
1998 1999 2000 2001
1,056 1,0291,101 1,100
1997
1,000
Liquids
Natural Gas
Total Daily Production (MMcfe/d)
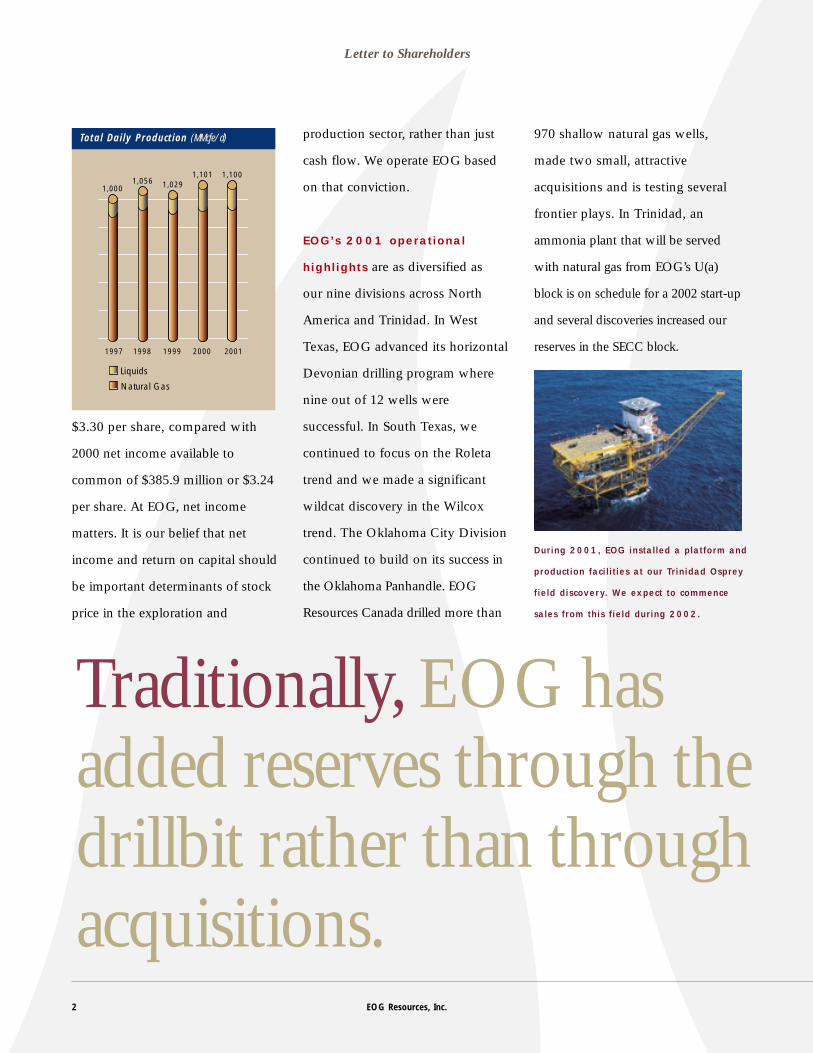
During 2001, EOG installed a platform and
production facilities at our Trinidad Osprey
field discovery. We expect to commence
sales from this field during 2002.
Letter to ShareholdersLetter to Shareholders
Because EOG has traditionally
added reserves through the drillbit
rather than through acquisitions,
we constantly monitor the North
American supply and demand
picture in maintaining an
opportunistic strategy. That
landscape is changing.
In response to the high natural
gas prices at the beginning of 2001,
the North American exploration and
production industry responded with
a massive capital infusion, drilling a
record number of gas wells.
However, the corresponding
increase in production generated in
the U.S. was miniscule. By our
estimates, natural gas production
grew less than one percent in 2001,
while the amount of industry capital
invested increased dramatically over
2000 levels. We project that total
U.S. natural gas production will fall
about three to four percent in 2002.
The U.S. faces an alarming
decline in natural gas production
from existing fields. In 2001, the
decline rate was approximately 26
percent, up from 22 percent just
two years earlier. For 2002, we
are forecasting a 29 percent
decline rate.
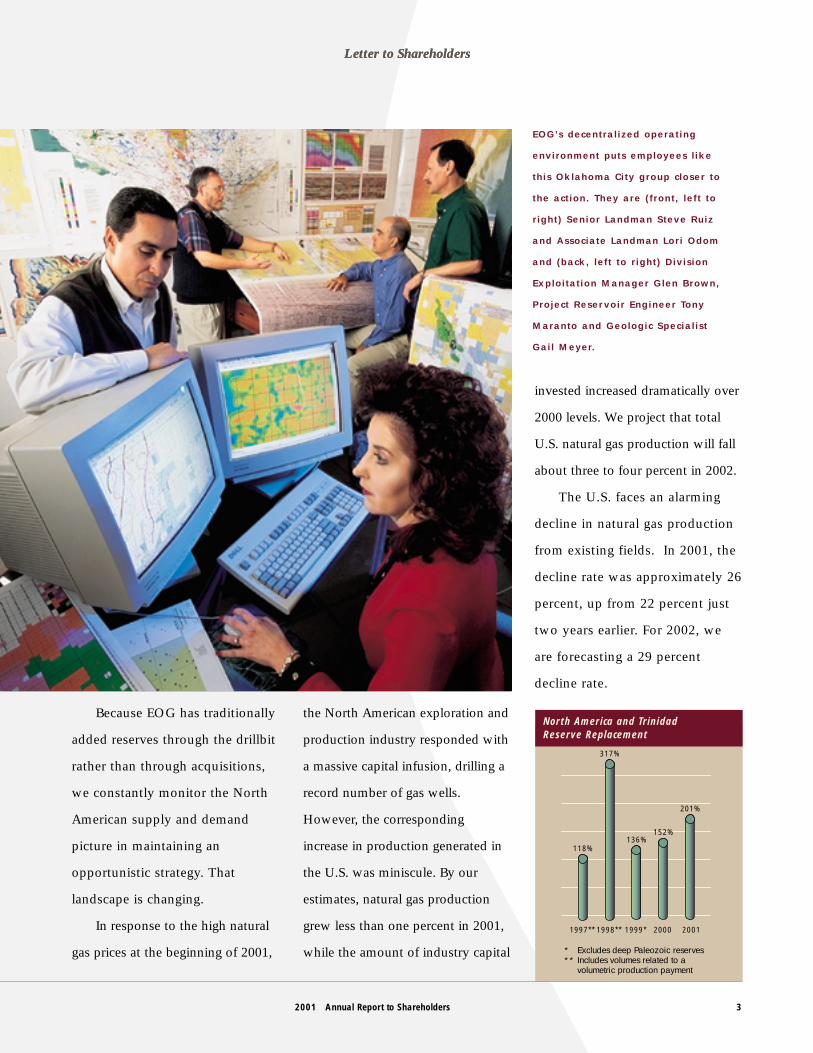
EOG’s decentralized operating
environment puts employees like
this Oklahoma City group closer to
the action. They are (front, left to
right) Senior Landman Steve Ruiz
and Associate Landman Lori Odom
and (back, left to right) Division
Exploitation Manager Glen Brown,
Project Reservoir Engineer Tony
Maranto and Geologic Specialist
Gail Meyer.
1998** 1999* 2000 2001
317%
1997**
118%136%
152%
201%
* Excludes deep Paleozoic reserves** Includes volumes related to a
volumetric production payment
North America and Trinidad Reserve Replacement
2001 Annual Report to Shareholders 3
EOG's operations are
centered in North
America ranging from
West Texas to Canada.
Midland Division
employees (inset
photo) Senior
Production Foreman
Dirk Ellyson and Lease
Operator 3 Mike
Huntington review
well test results.
Letter to Shareholders
We view current natural gas prices
in light of the worst U.S. industrial
recession in 20 years. The lackluster
economy and record levels of natural
gas in storage are severely depressing
natural gas prices, a scenario that we
expect to see through mid-year. By that
time, natural gas prices could gradually
strengthen with truly meaningful
tightening taking place in 2003 as the
U.S. pulls out of the current recession
and the impact of reduced drilling
activity and the production decline is felt.
Given this scenario, what is
EOG’s strategy? Since North
American natural gas continues to be
our growth engine, we are trimming
the ship for some choppy waters in
the first half of 2002 while at the
same time preparing for the
strengthening of natural gas prices
that we predict will follow. From
2003 through 2010, barring any major
industrial recession, EOG expects the
sustainable price of natural gas to be
higher than its historical average.
4 EOG Resources, Inc.
1998 1999 2000 2001
47% 47%
38%
34%
1997
37%
Debt-to-Total Capitalization Ratio
EOG has partially hedged
2002 natural gas prices and is
re-emphasizing operational cost
efficiencies while targeting flat
North American production growth.
EOG’s debt-to-total
capitalization ratio of 34 percent is
well below our peer group average
of approximately 50 percent.
During 2001, EOG was one of
the few companies in its peer
group to reduce its debt-to-total
capitalization ratio. We are well
positioned with our low debt level
and recognize there may be
opportunities to utilize
some of our balance sheet strength
for appropriate acquisitions.
EOG spent $1.1 billion on
capital expenditures in 2001,
including approximately $170 million
of acquisitions. For 2002, our capital
expenditure budget of $600 to $750
million excludes acquisitions and
factors in lower drilling costs, as well
as a sharply focused exploration
program. This should prove very
productive. We expect 2002 capital
expenditures to slightly exceed cash
flow and debt may be allowed to
increase modestly to allow for
smaller acquisitions.
EOG also continues to
emphasize the importance of
per-share metrics. We are the only
independent exploration and
production company among our
peer group to reduce its number of
shares outstanding for five
Letter to Shareholders
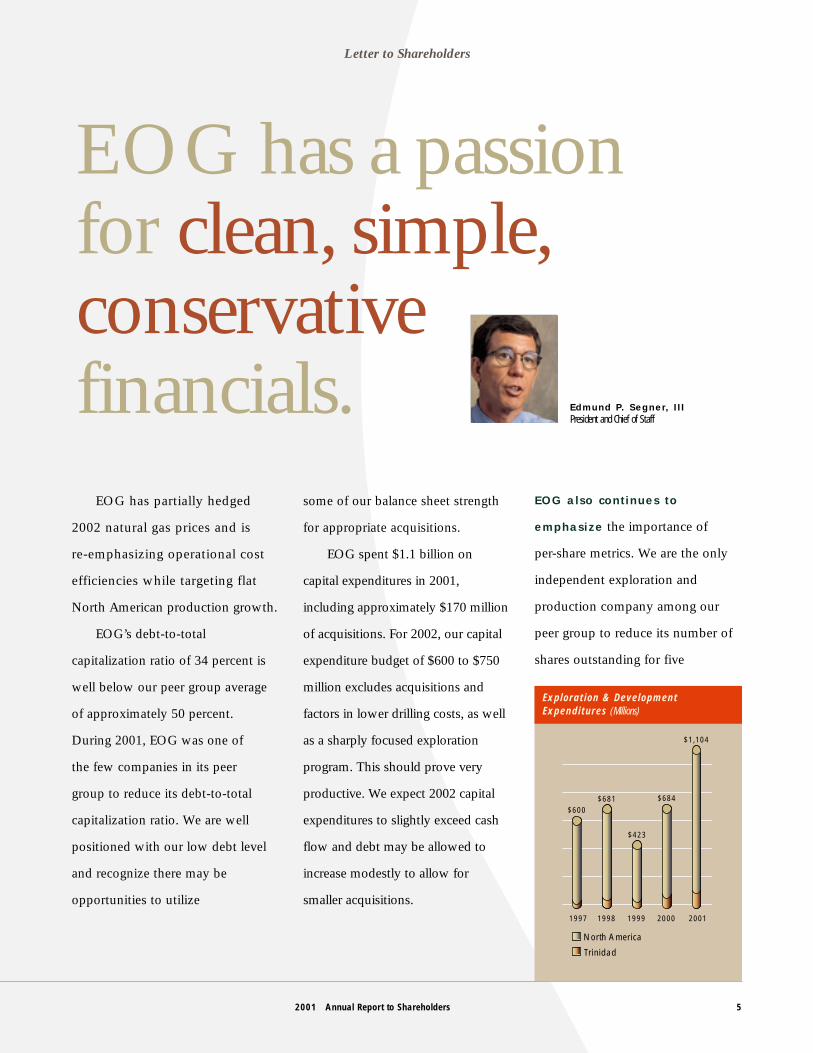
EOG has a passion for clean, simple,conservativefinancials. Edmund P. Segner, III
President and Chief of Staff
1998 1999 2000 2001
$681
$423
$684
$1,104
1997
$600
North America
Trinidad
Exploration & DevelopmentExpenditures (Millions)
2001 Annual Report to Shareholders 5
Letter to Shareholders
consecutive years. In 2001, EOG
repurchased 1.5 million shares,
reducing basic shares outstanding to
115.1 million at December 31, 2001.
We elected again not to participate
in large acquisitions and mergers at
the top of the market that would
have required us to issue additional
stock or greatly increase our debt.
As always, we consider our
workforce of 960 men and women
to be our greatest strength. Working
together, we think they distinguish
EOG from our peer group. EOG still
very much favors the decentralized
organizational structure in which we
operate. Regionally focused, it is
bottom line oriented and
operationally autonomous, keeping
EOG employees closer to the action.
This gives us a competitive edge.
So what really matters at EOG?
We value honesty and integrity. We
have a passion for clean, simple,
conservative financials. We shy
away from complex financial
structures whether they are debt or
merger related. We have no off-
balance sheet special purpose
vehicles and carry zero goodwill on
our balance sheet. We think it is
important to focus on cost
efficiencies and rate of return on
capital. Our game plan to grow
EOG through the drillbit is simple
and easy to understand. We think
that is why EOG has achieved
superior stock price performance
over the last two years.
Our commitment to our
shareholders in 2002 and beyond
stands: EOG is committed to
consistently delivering the highest
shareholder appreciation of any
independent exploration and
production company in the
United States.
In closing, we dedicate the
2001 EOG Resources, Inc. Annual
Report to Shareholders in memory
of Fred C. Ackman. Mr. Ackman,
who served on our board of
directors since the very beginning
of EOG, passed away in 2001. We
will miss Fred’s wisdom, judgment
and dedication.
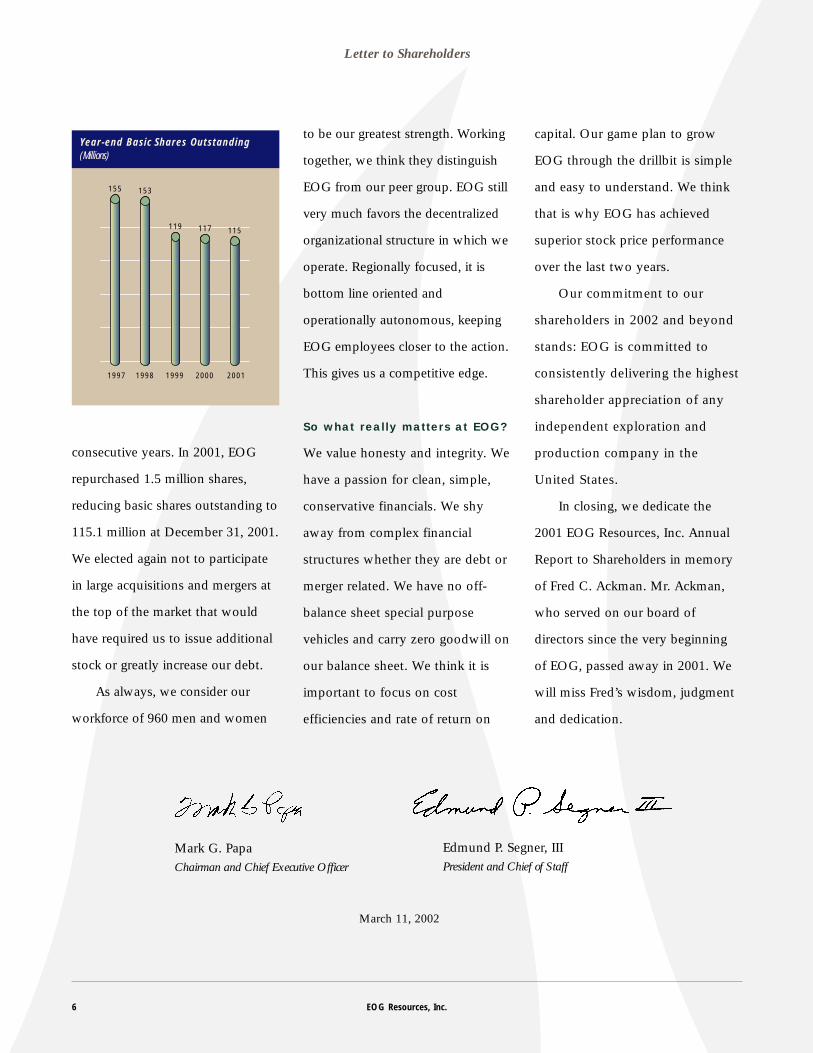
Mark G. PapaChairman and Chief Executive Officer
Edmund P. Segner, IIIPresident and Chief of Staff
6 EOG Resources, Inc.
1998 1999 2000 2001
153
119 117 115
1997
155
Year-end Basic Shares Outstanding(Millions)
March 11, 2002

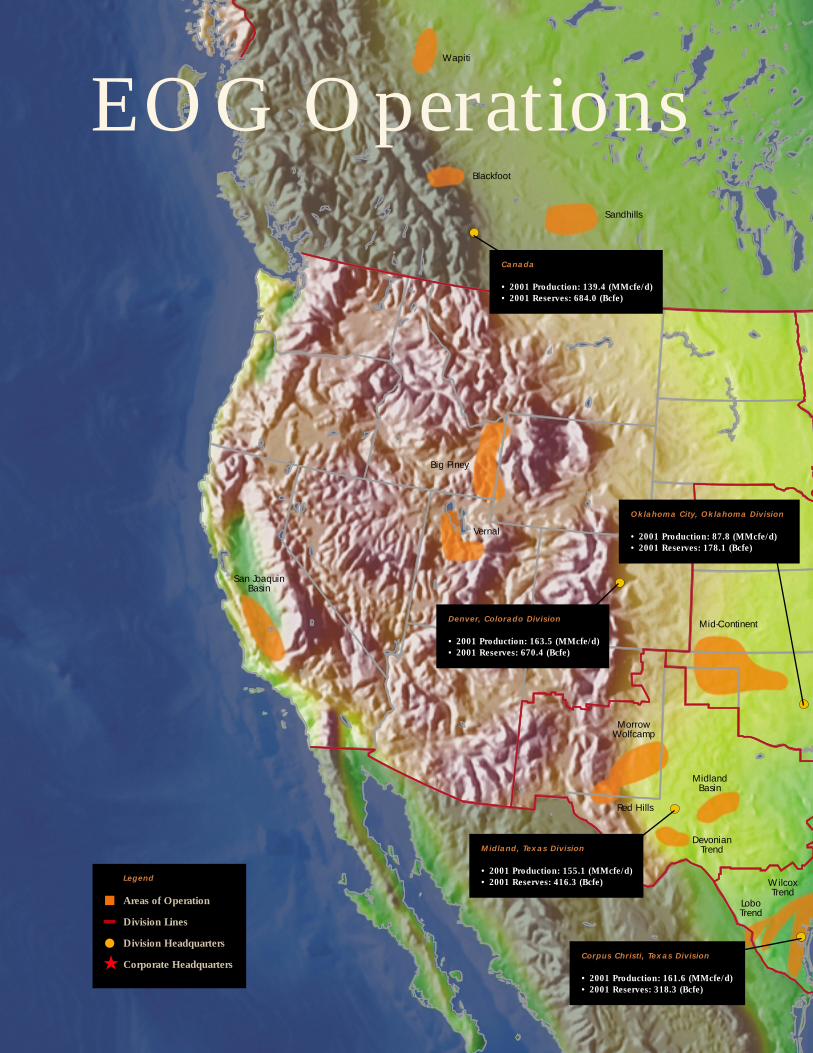
Wapiti
Blackfoot
Sandhills
Big Piney
Vernal
San JoaquinBasin
MorrowWolfcamp
Red Hills
MidlandBasin
LoboTrend
WilcoxTrend
DevonianTrend
Mid-Continent
Legend
Areas of Operation
Division Lines
Division Headquarters
Corporate Headquarters★
Canada
• 2001 Production: 139.4 (MMcfe/d) • 2001 Reserves: 684.0 (Bcfe)
Corpus Christi, Texas Division
• 2001 Production: 161.6 (MMcfe/d) • 2001 Reserves: 318.3 (Bcfe)
Denver, Colorado Division
• 2001 Production: 163.5 (MMcfe/d) • 2001 Reserves: 670.4 (Bcfe)
Midland, Texas Division
• 2001 Production: 155.1 (MMcfe/d) • 2001 Reserves: 416.3 (Bcfe)
EOG Operations
Oklahoma City, Oklahoma Division
• 2001 Production: 87.8 (MMcfe/d) • 2001 Reserves: 178.1 (Bcfe)
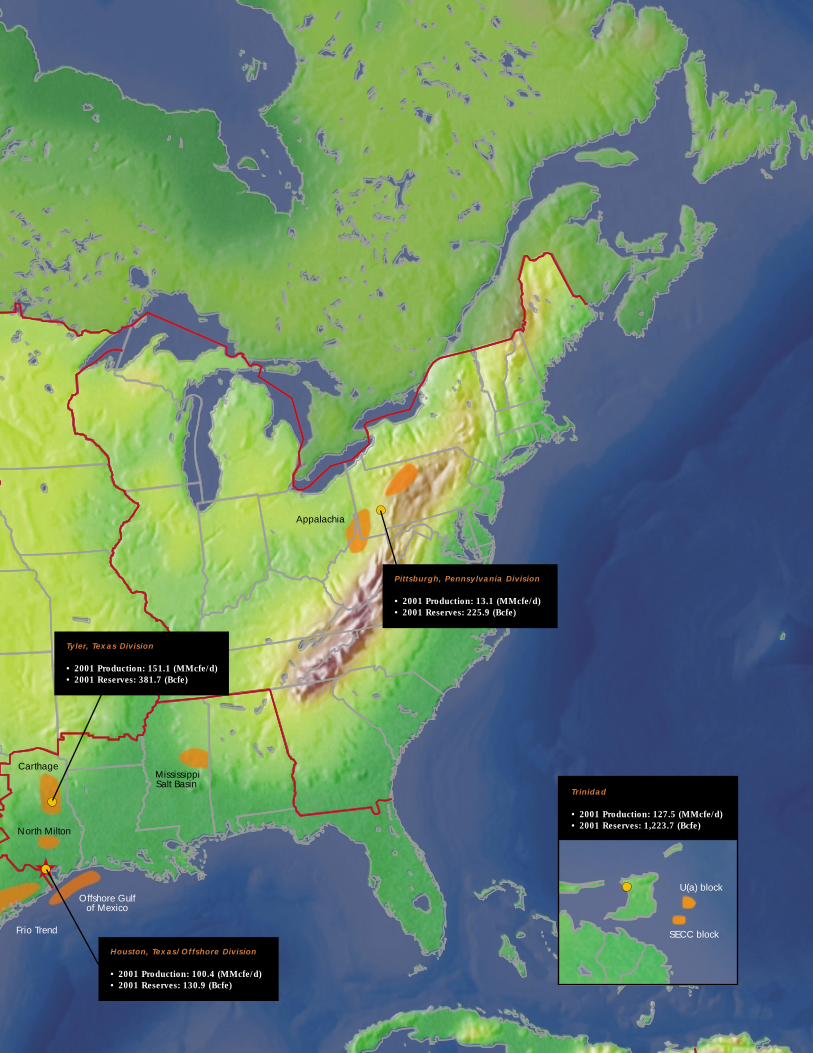
Carthage
North Milton
Offshore Gulfof Mexico
Frio Trend
MississippiSalt Basin
Appalachia
Houston, Texas/Offshore Division
• 2001 Production: 100.4 (MMcfe/d) • 2001 Reserves: 130.9 (Bcfe)
Tyler, Texas Division
• 2001 Production: 151.1 (MMcfe/d) • 2001 Reserves: 381.7 (Bcfe)
Trinidad
• 2001 Production: 127.5 (MMcfe/d) • 2001 Reserves: 1,223.7 (Bcfe)
U(a) block
SECC block
Pittsburgh, Pennsylvania Division
• 2001 Production: 13.1 (MMcfe/d) • 2001 Reserves: 225.9 (Bcfe)

10 EOG Resources, Inc.
2001 Annual Report to Shareholders 11
Management’s Discussion and Analysis of Financial Conditionand Results of Operations 12
Report of Independent Public Accountants 20
Management’s Responsibility for Financial Reporting 21
Consolidated Statements of Income and Comprehensive Incomefor the years ended December 31, 2001, 2000 and 1999 22
Consolidated Balance Sheets, December 31, 2001 and 2000 23
Consolidated Statements of Shareholders’ Equity for the years ended December 31, 2001, 2000 and 1999 24
Consolidated Statements of Cash Flows for the years ended December 31, 2001, 2000 and 1999 25
Notes to Consolidated Financial Statements 26
Supplemental Information to Consolidated Financial Statements 39
Financial Review
The following review of operations for each of the three yearsin the period ended December 31, 2001 should be read inconjunction with the consolidated financial statements ofEOG Resources, Inc. (“EOG”) and notes thereto beginningwith page 22.
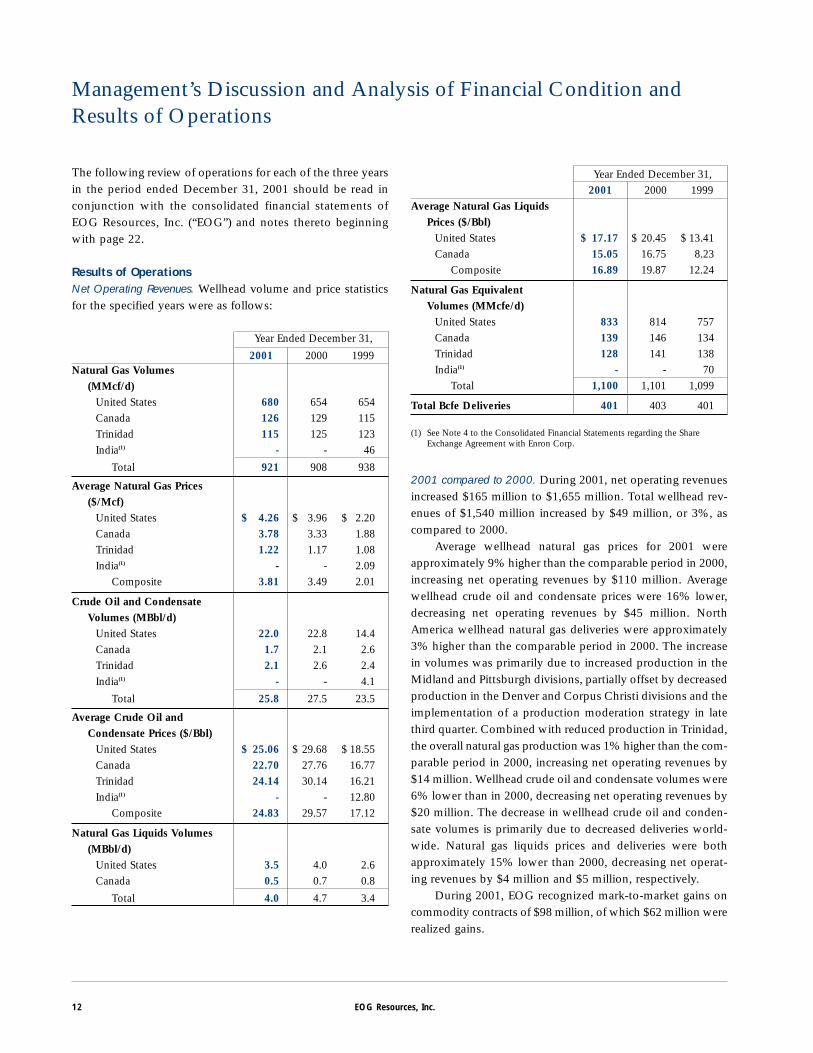
Results of OperationsNet Operating Revenues. Wellhead volume and price statisticsfor the specified years were as follows:
Year Ended December 31,
2001 2000 1999Natural Gas Volumes
(MMcf/d)United States 680 654 654Canada 126 129 115Trinidad 115 125 123India(1) - - 46
Total 921 908 938
Average Natural Gas Prices ($/Mcf)
United States $ 4.26 $ 3.96 $ 2.20Canada 3.78 3.33 1.88Trinidad 1.22 1.17 1.08India(1) - - 2.09
Composite 3.81 3.49 2.01
Crude Oil and Condensate Volumes (MBbl/d)
United States 22.0 22.8 14.4Canada 1.7 2.1 2.6Trinidad 2.1 2.6 2.4India(1) - - 4.1
Total 25.8 27.5 23.5
Average Crude Oil and Condensate Prices ($/Bbl)
United States $ 25.06 $ 29.68 $ 18.55Canada 22.70 27.76 16.77Trinidad 24.14 30.14 16.21India(1) - - 12.80
Composite 24.83 29.57 17.12
Natural Gas Liquids Volumes (MBbl/d)
United States 3.5 4.0 2.6Canada 0.5 0.7 0.8
Total 4.0 4.7 3.4
12 EOG Resources, Inc.
Management’s Discussion and Analysis of Financial Condition andResults of Operations
Year Ended December 31,2001 2000 1999
Average Natural Gas Liquids Prices ($/Bbl)
United States $ 17.17 $ 20.45 $ 13.41Canada 15.05 16.75 8.23
Composite 16.89 19.87 12.24
Natural Gas Equivalent Volumes (MMcfe/d)
United States 833 814 757Canada 139 146 134Trinidad 128 141 138India(1) - - 70
Total 1,100 1,101 1,099
Total Bcfe Deliveries 401 403 401
(1) See Note 4 to the Consolidated Financial Statements regarding the ShareExchange Agreement with Enron Corp.
2001 compared to 2000. During 2001, net operating revenuesincreased $165 million to $1,655 million. Total wellhead rev-enues of $1,540 million increased by $49 million, or 3%, ascompared to 2000.
Average wellhead natural gas prices for 2001 wereapproximately 9% higher than the comparable period in 2000,increasing net operating revenues by $110 million. Averagewellhead crude oil and condensate prices were 16% lower,decreasing net operating revenues by $45 million. NorthAmerica wellhead natural gas deliveries were approximately3% higher than the comparable period in 2000. The increasein volumes was primarily due to increased production in theMidland and Pittsburgh divisions, partially offset by decreasedproduction in the Denver and Corpus Christi divisions and theimplementation of a production moderation strategy in latethird quarter. Combined with reduced production in Trinidad,the overall natural gas production was 1% higher than the com-parable period in 2000, increasing net operating revenues by$14 million. Wellhead crude oil and condensate volumes were6% lower than in 2000, decreasing net operating revenues by$20 million. The decrease in wellhead crude oil and conden-sate volumes is primarily due to decreased deliveries world-wide. Natural gas liquids prices and deliveries were bothapproximately 15% lower than 2000, decreasing net operat-ing revenues by $4 million and $5 million, respectively.
During 2001, EOG recognized mark-to-market gains oncommodity contracts of $98 million, of which $62 million wererealized gains.
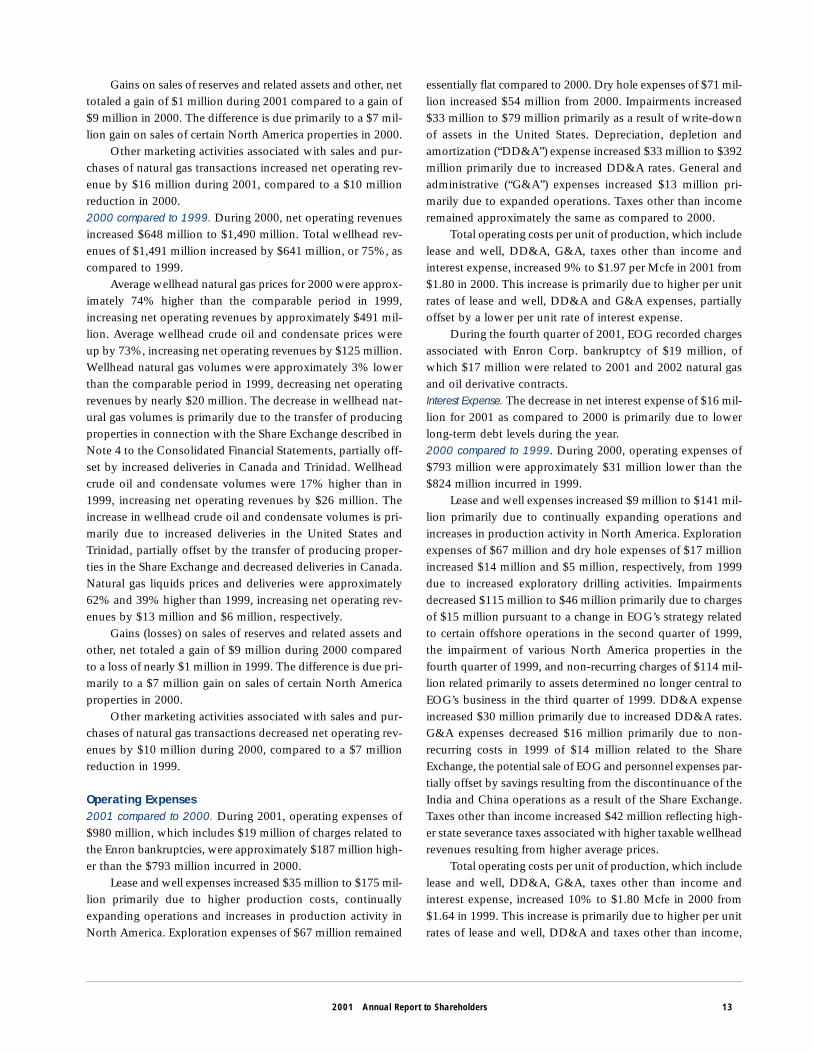
Gains on sales of reserves and related assets and other, nettotaled a gain of $1 million during 2001 compared to a gain of$9 million in 2000. The difference is due primarily to a $7 mil-lion gain on sales of certain North America properties in 2000.
Other marketing activities associated with sales and pur-chases of natural gas transactions increased net operating rev-enue by $16 million during 2001, compared to a $10 millionreduction in 2000.2000 compared to 1999. During 2000, net operating revenuesincreased $648 million to $1,490 million. Total wellhead rev-enues of $1,491 million increased by $641 million, or 75%, ascompared to 1999.
Average wellhead natural gas prices for 2000 were approx-imately 74% higher than the comparable period in 1999,increasing net operating revenues by approximately $491 mil-lion. Average wellhead crude oil and condensate prices wereup by 73%, increasing net operating revenues by $125 million.Wellhead natural gas volumes were approximately 3% lowerthan the comparable period in 1999, decreasing net operatingrevenues by nearly $20 million. The decrease in wellhead nat-ural gas volumes is primarily due to the transfer of producingproperties in connection with the Share Exchange described inNote 4 to the Consolidated Financial Statements, partially off-set by increased deliveries in Canada and Trinidad. Wellheadcrude oil and condensate volumes were 17% higher than in1999, increasing net operating revenues by $26 million. Theincrease in wellhead crude oil and condensate volumes is pri-marily due to increased deliveries in the United States andTrinidad, partially offset by the transfer of producing proper-ties in the Share Exchange and decreased deliveries in Canada.Natural gas liquids prices and deliveries were approximately62% and 39% higher than 1999, increasing net operating rev-enues by $13 million and $6 million, respectively.
Gains (losses) on sales of reserves and related assets andother, net totaled a gain of $9 million during 2000 comparedto a loss of nearly $1 million in 1999. The difference is due pri-marily to a $7 million gain on sales of certain North Americaproperties in 2000.
Other marketing activities associated with sales and pur-chases of natural gas transactions decreased net operating rev-enues by $10 million during 2000, compared to a $7 millionreduction in 1999.
Operating Expenses2001 compared to 2000. During 2001, operating expenses of$980 million, which includes $19 million of charges related tothe Enron bankruptcies, were approximately $187 million high-er than the $793 million incurred in 2000.
Lease and well expenses increased $35 million to $175 mil-lion primarily due to higher production costs, continuallyexpanding operations and increases in production activity inNorth America. Exploration expenses of $67 million remained
essentially flat compared to 2000. Dry hole expenses of $71 mil-lion increased $54 million from 2000. Impairments increased$33 million to $79 million primarily as a result of write-downof assets in the United States. Depreciation, depletion andamortization (“DD&A”) expense increased $33 million to $392million primarily due to increased DD&A rates. General andadministrative (“G&A”) expenses increased $13 million pri-marily due to expanded operations. Taxes other than incomeremained approximately the same as compared to 2000.
Total operating costs per unit of production, which includelease and well, DD&A, G&A, taxes other than income andinterest expense, increased 9% to $1.97 per Mcfe in 2001 from$1.80 in 2000. This increase is primarily due to higher per unitrates of lease and well, DD&A and G&A expenses, partiallyoffset by a lower per unit rate of interest expense.
During the fourth quarter of 2001, EOG recorded chargesassociated with Enron Corp. bankruptcy of $19 million, ofwhich $17 million were related to 2001 and 2002 natural gasand oil derivative contracts.Interest Expense. The decrease in net interest expense of $16 mil-lion for 2001 as compared to 2000 is primarily due to lowerlong-term debt levels during the year.2000 compared to 1999. During 2000, operating expenses of$793 million were approximately $31 million lower than the$824 million incurred in 1999.
Lease and well expenses increased $9 million to $141 mil-lion primarily due to continually expanding operations andincreases in production activity in North America. Explorationexpenses of $67 million and dry hole expenses of $17 millionincreased $14 million and $5 million, respectively, from 1999due to increased exploratory drilling activities. Impairmentsdecreased $115 million to $46 million primarily due to chargesof $15 million pursuant to a change in EOG’s strategy relatedto certain offshore operations in the second quarter of 1999,the impairment of various North America properties in thefourth quarter of 1999, and non-recurring charges of $114 mil-lion related primarily to assets determined no longer central toEOG’s business in the third quarter of 1999. DD&A expenseincreased $30 million primarily due to increased DD&A rates.G&A expenses decreased $16 million primarily due to non-recurring costs in 1999 of $14 million related to the ShareExchange, the potential sale of EOG and personnel expenses par-tially offset by savings resulting from the discontinuance of theIndia and China operations as a result of the Share Exchange.Taxes other than income increased $42 million reflecting high-er state severance taxes associated with higher taxable wellheadrevenues resulting from higher average prices.
Total operating costs per unit of production, which includelease and well, DD&A, G&A, taxes other than income andinterest expense, increased 10% to $1.80 Mcfe in 2000 from$1.64 in 1999. This increase is primarily due to higher per unitrates of lease and well, DD&A and taxes other than income,
2001 Annual Report to Shareholders 13
partially offset by a lower per unit rate of G&A expenses.Excluding the aforementioned 1999 charges of $14 million inG&A expenses, the per unit operating costs for EOG were $1.60per Mcfe in 1999. The per unit operating costs in 2000 of $1.80was $.20 higher than the adjusted per unit operating costs of1999, primarily due to higher per unit rates of lease and well,DD&A and taxes other than income.Other Income (Expense). Other income of $611 million for 1999included a $575 million net gain from the Share Exchange, a$59.6 million gain on the sale of 3.2 million options owned byEOG to purchase Enron Corp. common stock, and a $19.4 mil-lion charge for estimated exit costs related to EOG’s decisionto dispose of certain international assets.Income Taxes. Income tax provision increased approximately$238 million for 2000 as compared to 1999 as a result of a high-er pre-tax income year to year after removing the non-taxablegain on the Share Exchange in 1999.
Capital Resources and LiquidityCash Flow. The primary sources of cash for EOG during thethree-year period ended December 31, 2001 included cash gen-erated from operations, including realized gains from mark-to-market commodity derivative contracts, proceeds from the salesof other assets, selected oil and gas reserves and related assetsand funds from new borrowings and proceeds from equityofferings. Primary cash outflows included funds used in oper-ations, exploration and development expenditures, commonstock repurchases, dividends paid to EOG shareholders, repay-ments of debt and cash contributed to transferred subsidiariesin the Share Exchange.
Net operating cash flows of $1,197 million in 2001increased approximately $230 million as compared to 2000 pri-marily due to higher net operating revenues resulting fromhigher natural gas prices, net of increased cash operatingexpenses, and lower current income taxes, partially offset bya lower tax benefit from stock options exercised. Changes inworking capital and other liabilities increased operating cashflows by $75 million as compared to 2000 primarily due tochanges in accounts receivable, accrued royalties payable andaccrued production taxes caused by fluctuation of commodi-ty prices at each yearend. Net investing cash outflows of $1,088million in 2001 increased by $421 million as compared to 2000due primarily to increased exploration and developmentexpenditures of $426 million (including producing propertyacquisitions) and decreased proceeds from sales of reserves andrelated assets, partially offset by decreased equity investments.Changes in components of working capital associated withinvesting activities included changes in accounts payable asso-ciated with the accrual of exploration and developmentexpenditures and changes in inventories which represent mate-rials and equipment used in drilling and related activities. Cash
used in financing activities in 2001 was $127 million as com-pared to $305 million in 2000. Financing activities in 2001included repayments of debt of $4 million, common stockrepurchases of $127 million and dividend payments of $29 mil-lion, partially offset by proceeds from sales of treasury stockof $31 million.
Net operating cash flows of $967 million in 2000increased approximately $524 million as compared to 1999 dueto higher net operating revenues resulting from higher prices,net of cash operating expenses, and higher tax benefits fromstock options exercised partially offset by higher current incometaxes. Changes in working capital and other liabilities decreasedoperating cash flows by $16 million as compared to 1999 pri-marily due to changes in accounts receivable, accrued royal-ties payable and accrued production taxes caused by fluctua-tion of commodity prices at each yearend. Net investing cashoutflows of $667 million in 2000 increased by $304 million ascompared to 1999 due primarily to increased exploration anddevelopment expenditures of $226 million (including produc-ing property acquisitions), increased equity investments, andthe non-recurrence of proceeds from sales of Enron Corp.options in 1999, partially offset by increased proceeds fromsales of reserves and related assets. Changes in components ofworking capital associated with investing activities includedchanges in accounts payable associated with the accrual ofexploration and development expenditures and changes ininventories which represent materials and equipment used indrilling and related activities. Cash used in financing activitiesin 2000 was $305 million as compared to $62 million in 1999.Financing activities in 2000 included repayments of debt of$131 million, common stock repurchases of $273 million anddividend payments of $26 million, partially offset by proceedsfrom sales of treasury stock of $127 million.
Discretionary cash flow available to common, a fre-quently used measure of performance for exploration andproduction companies, is generally derived by adjusting netincome to include tax benefits on stock options exercised andto eliminate the effects of depreciation, depletion and amor-tization, impairments, deferred income taxes, gains on salesof oil and gas reserves and related assets, certain other non-cash amounts, except for amortization of deferred revenueand exploration and dry hole costs. EOG generated discre-tionary cash flow available to common of approximately$1,162 million in 2001, $1,007 million in 2000, $477 millionin 1999. Discretionary cash flow available to common shouldnot be considered as an alternative to income from operationsor to cash flows from operating activities (as determined inaccordance with accounting principles generally accepted inthe United States) and should not be construed as an indi-cation of a company’s operating performance or as a meas-ure of liquidity.
14 EOG Resources, Inc.
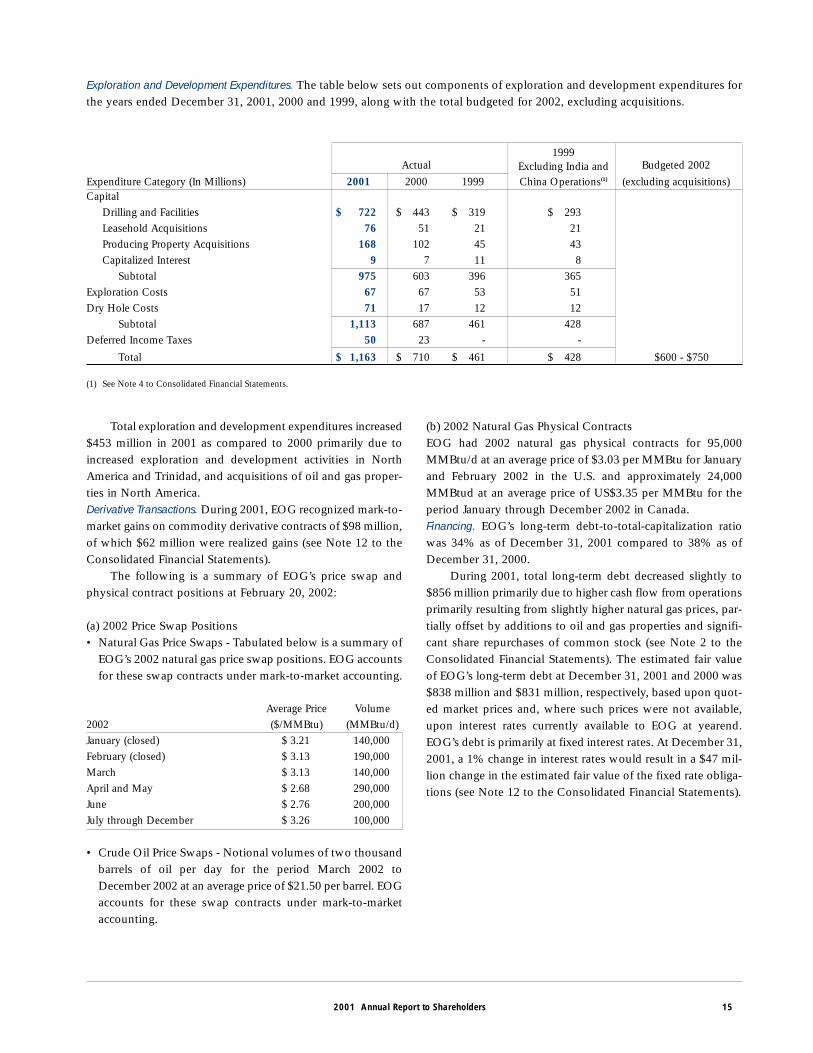
Total exploration and development expenditures increased$453 million in 2001 as compared to 2000 primarily due toincreased exploration and development activities in NorthAmerica and Trinidad, and acquisitions of oil and gas proper-ties in North America.Derivative Transactions. During 2001, EOG recognized mark-to-market gains on commodity derivative contracts of $98 million,of which $62 million were realized gains (see Note 12 to theConsolidated Financial Statements).
The following is a summary of EOG’s price swap andphysical contract positions at February 20, 2002:
(a) 2002 Price Swap Positions• Natural Gas Price Swaps - Tabulated below is a summary of
EOG’s 2002 natural gas price swap positions. EOG accountsfor these swap contracts under mark-to-market accounting.
Average Price Volume2002 ($/MMBtu) (MMBtu/d)January (closed) $ 3.21 140,000February (closed) $ 3.13 190,000March $ 3.13 140,000April and May $ 2.68 290,000June $ 2.76 200,000July through December $ 3.26 100,000
• Crude Oil Price Swaps - Notional volumes of two thousandbarrels of oil per day for the period March 2002 toDecember 2002 at an average price of $21.50 per barrel. EOGaccounts for these swap contracts under mark-to-marketaccounting.
(b) 2002 Natural Gas Physical ContractsEOG had 2002 natural gas physical contracts for 95,000MMBtu/d at an average price of $3.03 per MMBtu for Januaryand February 2002 in the U.S. and approximately 24,000MMBtud at an average price of US$3.35 per MMBtu for theperiod January through December 2002 in Canada.Financing. EOG’s long-term debt-to-total-capitalization ratiowas 34% as of December 31, 2001 compared to 38% as ofDecember 31, 2000.
During 2001, total long-term debt decreased slightly to$856 million primarily due to higher cash flow from operationsprimarily resulting from slightly higher natural gas prices, par-tially offset by additions to oil and gas properties and signifi-cant share repurchases of common stock (see Note 2 to theConsolidated Financial Statements). The estimated fair valueof EOG’s long-term debt at December 31, 2001 and 2000 was$838 million and $831 million, respectively, based upon quot-ed market prices and, where such prices were not available,upon interest rates currently available to EOG at yearend.EOG’s debt is primarily at fixed interest rates. At December 31,2001, a 1% change in interest rates would result in a $47 mil-lion change in the estimated fair value of the fixed rate obliga-tions (see Note 12 to the Consolidated Financial Statements).
2001 Annual Report to Shareholders 15
Exploration and Development Expenditures. The table below sets out components of exploration and development expenditures forthe years ended December 31, 2001, 2000 and 1999, along with the total budgeted for 2002, excluding acquisitions.
1999Actual Excluding India and Budgeted 2002
Expenditure Category (In Millions) 2001 2000 1999 China Operations(1) (excluding acquisitions)Capital
Drilling and Facilities $ 722 $ 443 $ 319 $ 293Leasehold Acquisitions 76 51 21 21Producing Property Acquisitions 168 102 45 43Capitalized Interest 9 7 11 8
Subtotal 975 603 396 365Exploration Costs 67 67 53 51Dry Hole Costs 71 17 12 12
Subtotal 1,113 687 461 428Deferred Income Taxes 50 23 - -
Total $ 1,163 $ 710 $ 461 $ 428 $600 - $750
(1) See Note 4 to Consolidated Financial Statements.
Shelf Registration. During the third quarter of 2000, EOG fileda shelf registration statement for the offer and sale from timeto time of up to $600 million of EOG debt securities, preferredstock and/or common stock. The registration statement wasdeclared effective by the Securities and Exchange Commissionon October 27, 2000. As of February 20, 2002, EOG had soldno securities pursuant to this shelf registration. When combinedwith the unused portion of a previously filed registration state-ment declared effective in January 1998, these registration state-ments provide for the offer and sale from time to time of EOGdebt securities, preferred stock and/or common stock by EOGin an aggregate amount up to $688 million.Outlook. Natural gas prices historically have been volatile, andthis volatility is expected to continue. Uncertainty continuesto exist as to the direction of future North America natural gasand crude oil price trends, and there remains a rather wide diver-gence in the opinions held by some in the industry. This diver-gence in opinion is caused by various factors including the cur-rent industrial recession and economic downturn, improve-ments in the technology used in drilling and completing crudeoil and natural gas wells, improvements being realized in theavailability and utilization of natural gas storage capacity andwarmer weather experienced in the latter part of 2001.However, the increasing recognition of natural gas as a moreenvironmentally friendly source of energy along with the avail-ability of significant domestically sourced supplies should resultin increases in demand. Being primarily a natural gas produc-er, EOG is more significantly impacted by changes in naturalgas prices than by changes in crude oil and condensate prices.At December 31, 2001, based on EOG’s tax position and theportion of EOG’s anticipated natural gas volumes for 2002 forwhich prices have not, in effect, been hedged using NYMEX-related commodity market transactions and long-term mar-keting contracts, EOG’s price sensitivity for each $0.10 per Mcfchange in average wellhead natural gas prices is $15 million (or$0.13 per share) for net income and $23 million for current oper-ating cash flow. EOG is not impacted as significantly by chang-
ing crude oil prices for those volumes not otherwise hedged.EOG’s price sensitivity for each $1.00 per barrel change in aver-age wellhead crude oil prices is $5 million (or $0.04 per share)for net income and $8 million for current operating cash flow.
EOG plans to continue to focus a substantial portion ofits exploration and development expenditures in its major pro-ducing areas in North America. However, in order to diversi-fy its overall asset portfolio and as a result of its overall suc-cess realized in Trinidad, EOG anticipates expending a portionof its available funds in the further development of opportu-nities outside North America. In addition, EOG expects to con-duct limited exploratory activity in other areas outside of NorthAmerica and will continue to evaluate the potential forinvolvement in other exploitation type opportunities. Budgeted2002 exploration and development expenditures, excludingacquisitions, are in the range of $600 - $750 million, address-ing the continuing uncertainty with regard to the future of theNorth America natural gas and crude oil and condensate priceenvironment. Budgeted expenditures for 2002 are structured tomaintain the flexibility necessary under EOG’s continuing strat-egy of funding North America exploration, exploitation, devel-opment and acquisition activities primarily from available inter-nally generated cash flow.
The level of exploration and development expendituresmay vary in 2002 and will vary in future periods depending onenergy market conditions and other related economic factors.Based upon existing economic and market conditions, EOGbelieves net operating cash flow and available financing alter-natives in 2002 will be sufficient to fund its net investing cashrequirements for the year. However, EOG has significant flex-ibility with respect to its financing alternatives and adjustmentof its exploration, exploitation, development and acquisitionexpenditure plans if circumstances warrant. While EOG has cer-tain continuing commitments associated with expenditure plansrelated to operations in Trinidad, such commitments are notanticipated to be material when considered in relation to thetotal financial capacity of EOG.
16 EOG Resources, Inc.
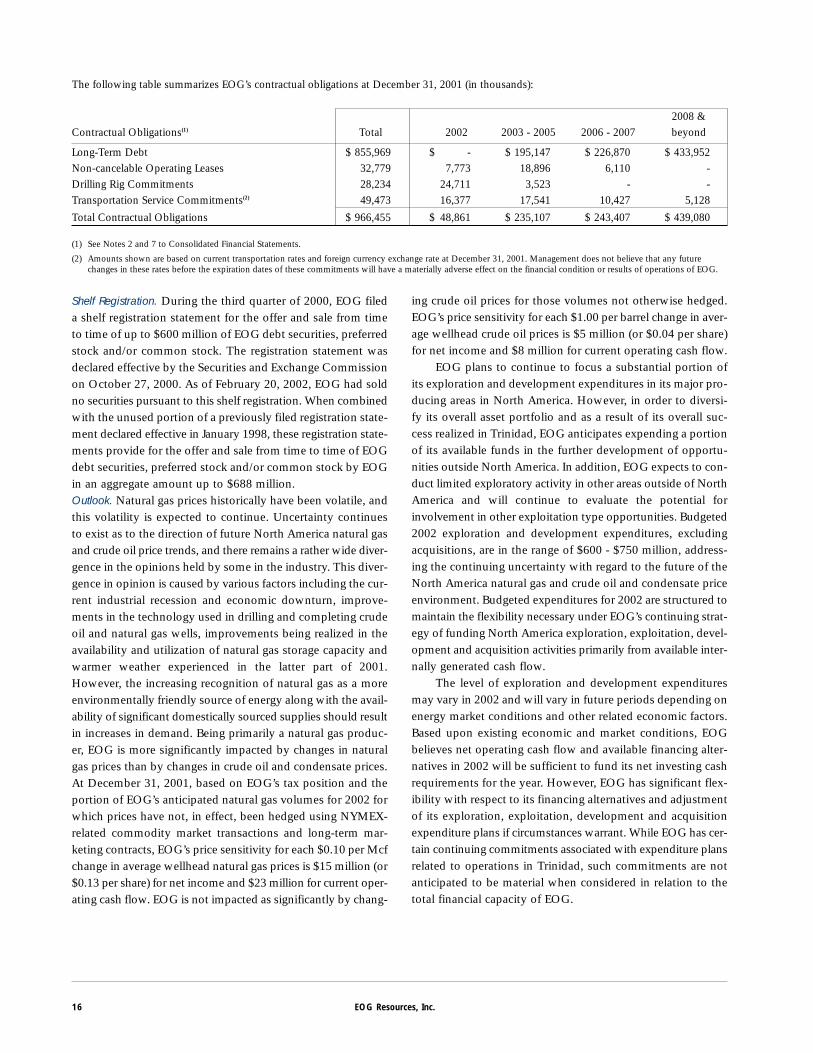
The following table summarizes EOG’s contractual obligations at December 31, 2001 (in thousands):
2008 &Contractual Obligations(1) Total 2002 2003 - 2005 2006 - 2007 beyond
Long-Term Debt $ 855,969 $ - $ 195,147 $ 226,870 $ 433,952Non-cancelable Operating Leases 32,779 7,773 18,896 6,110 -Drilling Rig Commitments 28,234 24,711 3,523 - -Transportation Service Commitments(2) 49,473 16,377 17,541 10,427 5,128
Total Contractual Obligations $ 966,455 $ 48,861 $ 235,107 $ 243,407 $ 439,080
(1) See Notes 2 and 7 to Consolidated Financial Statements.
(2) Amounts shown are based on current transportation rates and foreign currency exchange rate at December 31, 2001. Management does not believe that any futurechanges in these rates before the expiration dates of these commitments will have a materially adverse effect on the financial condition or results of operations of EOG.
Environmental Regulations. Various federal, state and local lawsand regulations covering the discharge of materials into theenvironment, or otherwise relating to protection of the envi-ronment, may affect EOG’s operations and costs as a result oftheir effect on natural gas and crude oil exploration, exploita-tion, development and production operations. In addition, EOGhas acquired certain oil and gas properties from third partieswhose actions with respect to the management and disposalor release of hydrocarbons or other wastes were not underEOG’s control. Under environmental laws and regulations,EOG could be required to remove or remediate wastes disposedof or released by prior owners or operators. EOG also hasacquired or merged with companies that own and operate oiland gas properties. Any obligations or liabilities of these com-panies under environmental laws would continue as liabilitiesof the acquired company, or of EOG in the event of a merger,even if the obligations or liabilities resulted from actions thattook place before the acquisition or merger. Compliance withsuch laws and regulations has not had a material adverse effecton EOG’s operations or financial condition. It is not anticipat-ed, based on current laws and regulations, that EOG will berequired in the near future to expend amounts that are mate-rial in relation to its total exploration and development expen-diture program by reason of environmental laws and regula-tions. However, inasmuch as such laws and regulations are fre-quently changed, EOG is unable to predict the ultimate costof compliance.
EOG also could incur costs related to the clean up of sitesto which it sent regulated substances for disposal and for dam-ages to natural resources or other claims related to releases ofregulated substances at such sites. In this regard, EOG has beennamed as a potentially responsible party in certain proceedingsinitiated pursuant to the Comprehensive EnvironmentalResponse, Compensation, and Liability Act and may be namedas a potentially responsible party in other similar proceedingsin the future. It is not anticipated that the costs incurred by EOGin connection with the presently pending proceedings will, indi-vidually or in the aggregate, have a materially adverse effect onthe financial condition or results of operations of EOG.
Summary of Significant Accounting PoliciesPrinciples of Consolidation. The consolidated financial state-ments of EOG, a Delaware corporation, include the accountsof all domestic and foreign subsidiaries. Investments in uncon-solidated affiliates, in which EOG is able to exercise signifi-cant influence, are accounted for using the equity method. Allmaterial intercompany accounts and transactions have beeneliminated.
The preparation of financial statements in conformity withaccounting principles generally accepted in the United States
requires management to make estimates and assumptions thataffect the reported amounts of assets and liabilities and dis-closure of contingent assets and liabilities at the date of thefinancial statements and the reported amounts of revenue andexpenses during the reporting period. Actual results could dif-fer from those estimates.
Certain reclassifications have been made to prior periodfinancial statements to conform with the current presentation.Beginning 2001, the “Impairment of Unproved Oil and GasProperties” caption on the Consolidated Statements of Incomewas renamed “Impairments” to include the impairment loss oflong-lived assets as described in Statement of FinancialAccounting Standards (“SFAS”) No. 121--“Accounting for theImpairment of Long-Lived Assets and for Long-Lived Assets tobe Disposed of” (“SFAS 121 Impairments”). As a result, EOGreclassified all prior periods to reflect such SFAS 121Impairments in Impairments, instead of Depreciation, Depletionand Amortization (“DD&A”) as previously reported. SFAS 121Impairments reclassified from DD&A to Impairments were $11million and $133 million for 2000 and 1999, respectively.Financial Instruments. EOG’s financial instruments consist of cashand cash equivalents, marketable securities, accounts receivable,accounts payable and long-term debt. The carrying values ofcash and cash equivalents, marketable securities, accountsreceivable and accounts payable approximate fair value (seeNote 2 “Long-Term Debt” for fair value of long-term debt).Cash and Cash Equivalents. EOG records as cash equivalents allhighly liquid short-term investments with original maturitiesof three months or less.Oil and Gas Operations. EOG accounts for its natural gas andcrude oil exploration and production activities under the suc-cessful efforts method of accounting.
Oil and gas lease acquisition costs are capitalized whenincurred. Unproved properties with significant acquisition costsare assessed quarterly on a property-by-property basis, and anyimpairment in value is recognized. Unproved properties withacquisition costs that are not individually significant are aggre-gated, and the portion of such costs estimated to be nonpro-ductive, based on historical experience, is amortized over theaverage holding period. If the unproved properties are deter-mined to be productive, the appropriate related costs are trans-ferred to proved oil and gas properties. Lease rentals areexpensed as incurred.
Oil and gas exploration costs, other than the costs ofdrilling exploratory wells, are charged to expense as incurred.The costs of drilling exploratory wells are capitalized pendingdetermination of whether they have discovered proved com-mercial reserves. If proved commercial reserves are not dis-covered, such drilling costs are expensed. Costs to developproved reserves, including the costs of all development wells
2001 Annual Report to Shareholders 17
and related equipment used in the production of natural gasand crude oil, are capitalized.
Depreciation, depletion and amortization of the cost ofproved oil and gas properties is calculated using the unit-of-production method. Estimated future dismantlement, restora-tion and abandonment costs (classified as long-term liabilities),net of salvage values, are taken into account. Certain otherassets are depreciated on a straight-line basis.
Periodically, or when circumstances indicate that an assetmay be impaired, EOG compares expected undiscounted futurecash flows at a producing field level to the unamortized capi-talized cost of the asset. If the future undiscounted cash flows,based on EOG’s estimate of future crude oil and natural gasprices and operating costs and anticipated production fromproved reserves are lower than the unamortized capitalized cost,the capitalized cost is reduced to fair value. Fair value is cal-culated by discounting the future cash flows at an appropriaterisk-adjusted discount rate.
Inventories, consisting primarily of tubular goods and wellequipment held for use in the exploration for, and developmentand production of natural gas and crude oil reserves, are car-ried at cost with adjustments made from time to time to rec-ognize any reductions in value.
Natural gas revenues are recorded when production isdelivered. EOG natural gas revenues are recorded on the enti-tlement method based on EOG’s percentage ownership of cur-rent production. Each working interest owner in a well gener-ally has the right to a specific percentage of production,although actual production sold may differ from an owner’sownership percentage. Under entitlement accounting, a receiv-able is recorded when underproduction occurs and a payablewhen overproduction occurs.
Gains and losses associated with the sale of in place nat-ural gas and crude oil reserves and related assets are classifiedas net operating revenues in the consolidated statements ofincome and comprehensive income based on EOG’s strategyof continuing such sales in order to maximize the economicvalue of its assets.New Accounting Pronouncements. In June 1998, the FinancialAccounting Standards Board (“FASB”) issued Statement ofFinancial Accounting Standards (“SFAS”) No. 133--“Accountingfor Derivative Instruments and Hedging Activities” effective forfiscal years beginning after June 15, 1999. SFAS No. 133, asamended by SFAS No. 137 and No. 138, cannot be appliedretroactively. EOG adopted SFAS No. 133, as amended, onJanuary 1, 2001 for the accounting periods which begin there-after. The adoption of SFAS No. 133 did not have a materialimpact on EOG’s financial statements.
In June 2001, the FASB issued SFAS No. 143--“Accountingfor Asset Retirement Obligations” effective for fiscal years
beginning after June 15, 2002. SFAS No.143 requires entitiesto record the fair value of a liability for legal obligations asso-ciated with the retirement of tangible long-lived assets and theassociated asset retirement costs. The fair value of the liabili-ty is added to the carrying amount of the associated asset andthis additional carrying amount is depreciated over the life ofthe asset. If the obligation is settled for other than the carry-ing amount of the liability, a gain or loss is recognized on set-tlement. This statement will impact how EOG accounts for itsabandonment liability related to its oil and gas wells. EOG iscurrently evaluating the effect of adopting SFAS No. 143 onits financial statements and has not yet determined the tim-ing of adoption.
In August 2001, the FASB issued SFAS No. 144--“Accounting for the Impairment or Disposal of Long-LivedAssets” effective for fiscal years beginning after December 15,2001. SFAS No. 144, which supersedes SFAS No. 121--“Accounting for the Impairment of Long-Lived Assets and forLong-Lived Assets to be Disposed of,” provides that long-livedassets to be disposed of by sale be measured at the lower ofcarrying amount or fair value less cost to sell. In addition, SFASNo. 144, which also supersedes the accounting and reportingprovisions of Accounting Principles Board (“APB”) Opinion No.30--“Reporting the Results of Operations -- Reporting theEffects of Disposal of a Segment of a Business, andExtraordinary, Unusual and Infrequently Occurring Events andTransactions,” broadens the reporting of discontinued opera-tions to include all components of an entity with operationsthat can be distinguished from the rest of the entity and thatwill be eliminated from the ongoing operations of the entityin a disposal transaction. EOG adopted the provisions of SFASNo. 144 on January 1, 2002. This statement will impact howEOG tests for long-lived asset impairments. EOG does notexpect the impact of SFAS No. 144 to have a material effect onits financial position or results of operations.Accounting for Price Risk Management Activities. EOG engages inprice risk management activities from time to time. These activ-ities are intended to manage EOG’s exposure to fluctuationsin commodity prices for natural gas and crude oil. EOG utilizesderivative financial instruments, primarily price swaps and cost-less collars, as the means to manage this price risk. EOG adopt-ed SFAS No. 133--“Accounting for Derivative Instruments andHedging Activities,” as amended by SFAS No. 137 and No. 138,on January 1, 2001 for the accounting periods which beginthereafter. The statement establishes accounting and reportingstandards requiring that every derivative instrument be record-ed in the balance sheet as either an asset or liability measuredat its fair value. The statement requires that changes in the deriv-ative’s fair value be recognized currently in earnings unless spe-cific hedge accounting criteria are met. Special accounting for
18 EOG Resources, Inc.
qualifying hedges allows a derivative’s gains and losses to off-set related results on the hedged item in the statements ofincome and requires a company to formally document, desig-nate and assess the effectiveness of transactions that receivehedge accounting treatment. The adoption of SFAS No. 133 didnot have a material impact on EOG’s financial statements.During 2001, EOG elected not to designate any of its price riskmanagement activities as accounting hedges under SFAS No.133, and accordingly, accounted for them using the mark-to-market accounting method. Under this accounting method, thechanges in the market value of outstanding financial instru-ments are recognized as gains or losses in the period of change.The gains or losses are recorded in Mark-to-market Gains(Losses) on Commodity Derivative Contracts in the NetOperating Revenues section of the Consolidated Statements ofIncome. The related cash flow impact is reflected as cash flowsfrom operating activities in the Consolidated Statements ofCash Flows (see Note 12 “Prices and Interest Rate RiskManagement Activities”).Capitalized Interest Costs. Certain interest costs have been cap-italized as a part of the historical cost of unproved oil and gasproperties and work in progress for development drilling andrelated facilities with significant cash outlays.Income Taxes. EOG accounts for income taxes under the pro-visions of SFAS No. 109--“Accounting for Income Taxes.” SFASNo. 109 requires the asset and liability approach for account-ing for income taxes. Under this approach, deferred tax assetsand liabilities are recognized based on anticipated future taxconsequences attributable to differences between financialstatement carrying amounts of assets and liabilities and theirrespective tax bases (see Note 5 “Income Taxes”).Foreign Currency Translation. For subsidiaries whose functionalcurrency is deemed to be other than the U.S. dollar, asset andliability accounts are translated at year-end exchange rates andrevenue and expenses are translated at average exchange ratesprevailing during the year. Translation adjustments are includ-ed as a separate component of shareholders’ equity. Any gainsor losses on transactions or monetary assets or liabilities in cur-rencies other than the functional currency are included in netincome in the current period.Net Income Per Share. In accordance with the provisions of SFASNo. 128--“Earnings per Share,” basic net income per share iscomputed on the basis of the weighted-average number of com-mon shares outstanding during the periods. Diluted net incomeper share is computed based upon the weighted-average num-ber of common shares plus the assumed issuance of commonshares for all potentially dilutive securities (see Note 8 “NetIncome Per Share Available to Common” for additional infor-mation to reconcile the difference between the Average
Number of Common Shares outstanding for basic and dilutednet income per share).Stock Option Plans. EOG accounts for stock options under theprovisions and related interpretations of APB Opinion No. 25--“Accounting for Stock Issued to Employees.” No compensa-tion expense is recognized for such options. As allowed bySFAS No. 123-- “Accounting for Stock-Based Compensation”issued in 1995, EOG has continued to apply APB Opinion No.25 for purposes of determining net income and to present thepro forma disclosures required by SFAS No. 123.
Information Regarding Forward-Looking StatementsThis Annual Report includes forward-looking statements with-in the meaning of Section 27A of the Securities Act of 1933 andSection 21E of the Securities Exchange Act of 1934. All state-ments other than statements of historical facts, including, amongothers, statements regarding EOG’s future financial position,business strategy, budgets, reserve information, projected lev-els of production, projected costs and plans and objectives ofmanagement for future operations, are forward-looking state-ments. EOG typically uses words such as “expect,” “anticipate,”“estimate,” “strategy,” “intend,” “plan,” “target” and “believe” orthe negative of those terms or other variations of them or bycomparable terminology to identify its forward-looking state-ments. In particular, statements, express or implied, concerningfuture operating results, the ability to increase reserves, or theability to generate income or cash flows are forward-lookingstatements. Forward-looking statements are not guarantees ofperformance. Although EOG believes its expectations reflectedin forward-looking statements are based on reasonable assump-tions, no assurance can be given that these expectations will beachieved. Important factors that could cause actual results to dif-fer materially from the expectations reflected in the forward-looking statements include, among others: the timing and extentof changes in commodity prices for crude oil, natural gas andrelated products and interest rates; the extent and effect of anyhedging activities engaged in by EOG; the extent of EOG’s suc-cess in discovering, developing, marketing and producingreserves and in acquiring oil and gas properties; the accuracy ofreserve estimates, which by their nature involve the exercise ofprofessional judgment and may therefore be imprecise; politi-cal developments around the world, including terrorist activi-ties and responses to such activities; and financial market con-ditions. In light of these risks, uncertainties and assumptions,the events anticipated by EOG’s forward-looking statementsmight not occur. EOG undertakes no obligations to update orrevise its forward-looking statements, whether as a result of newinformation, future events or otherwise.
2001 Annual Report to Shareholders 19
To EOG Resources, Inc.:
We have audited the accompanying consolidated balance sheetsof EOG Resources, Inc. (a Delaware corporation) and sub-sidiaries as of December 31, 2001 and 2000, and the relatedconsolidated statements of income and comprehensive income,shareholders’ equity and cash flows for each of the three yearsin the period ended December 31, 2001. These financial state-ments are the responsibility of the Company’s management.Our responsibility is to express an opinion on these financialstatements based on our audits.
We conducted our audits in accordance with auditing stan-dards generally accepted in the United States. Those standardsrequire that we plan and perform the audit to obtain reason-able assurance about whether the financial statements are freeof material misstatement. An audit includes examining, on atest basis, evidence supporting the amounts and disclosures inthe financial statements. An audit also includes assessing theaccounting principles used and significant estimates made by
management, as well as evaluating the overall financial state-ment presentation. We believe that our audits provide a rea-sonable basis for our opinion.
In our opinion, the financial statements referred to abovepresent fairly, in all material respects, the financial position ofEOG Resources, Inc. and subsidiaries as of December 31, 2001and 2000, and the results of their operations and their cashflows for each of the three years in the period endedDecember 31, 2001, in conformity with accounting principlesgenerally accepted in the United States.
ARTHUR ANDERSEN LLP
Houston, TexasFebruary 21, 2002
20 EOG Resources, Inc.
Report of Independent Public Accountants
The following consolidated financial statements of EOGResources, Inc. and its subsidiaries (“EOG”) were prepared bymanagement, which is responsible for their integrity, objectiv-ity and fair presentation. The statements have been preparedin conformity with accounting principles generally accepted inthe United States and, accordingly, include some amounts thatare based on the best estimates and judgments of management.
Arthur Andersen LLP, independent public accountants, wasengaged to audit the consolidated financial statements of EOGand issue a report thereon. In the conduct of the audit, ArthurAndersen LLP was given unrestricted access to all financialrecords and related data including minutes of all meetings ofshareholders, the Board of Directors and committees of theBoard. Their audit was made in accordance with auditing stan-dards generally accepted in the United States and included areview of the system of internal controls to the extent consid-ered necessary to determine the audit procedures required tosupport their opinion on the consolidated financial statements.Management believes that all representations made to ArthurAndersen LLP during the audit were valid and appropriate.
The system of internal controls of EOG is designed to pro-vide reasonable assurance as to the reliability of financial state-ments and the protection of assets from unauthorized acqui-sition, use or disposition. This system includes, but is not lim-ited to, written policies and guidelines including a publishedcode for the conduct of business affairs, conflicts of interest andcompliance with laws regarding antitrust, antiboycott and for-eign corrupt practices policies, the careful selection and train-ing of qualified personnel, and a documented organizationalstructure outlining the separation of responsibilities amongmanagement representatives and staff groups.
The adequacy of financial controls of EOG and theaccounting principles employed in financial reporting by EOGare under the general oversight of the Audit Committee of theBoard of Directors. No member of this committee is an officeror employee of EOG. The independent public accountants andinternal auditors have full, free, separate and direct access tothe Audit Committee and meet with the committee from timeto time to discuss accounting, auditing and financial reportingmatters. It should be recognized that there are inherent limita-tions to the effectiveness of any system of internal control,including the possibility of human error and circumvention oroverride. Accordingly, even an effective system can provide onlyreasonable assurance with respect to the preparation of reliablefinancial statements and safeguarding of assets. Furthermore,the effectiveness of an internal control system can change withcircumstances.
It is management’s opinion that, considering the criteriafor effective internal control over financial reporting and safe-guarding of assets which consists of interrelated componentsincluding the control environment, risk assessment process,control activities, information and communication systems, andmonitoring, EOG maintained an effective system of internalcontrol as to the reliability of financial statements and the pro-tection of assets against unauthorized acquisition, use or dis-position during the year ended December 31, 2001.
Mark G. PapaChairman and Chief Executive Officer
Edmund P. Segner, IIIPresident and Chief of Staff
Timothy K. DriggersVice President, Accountingand Land Administration
Houston, TexasFebruary 21, 2002
2001 Annual Report to Shareholders 21
Management’s Responsibility for Financial Reporting
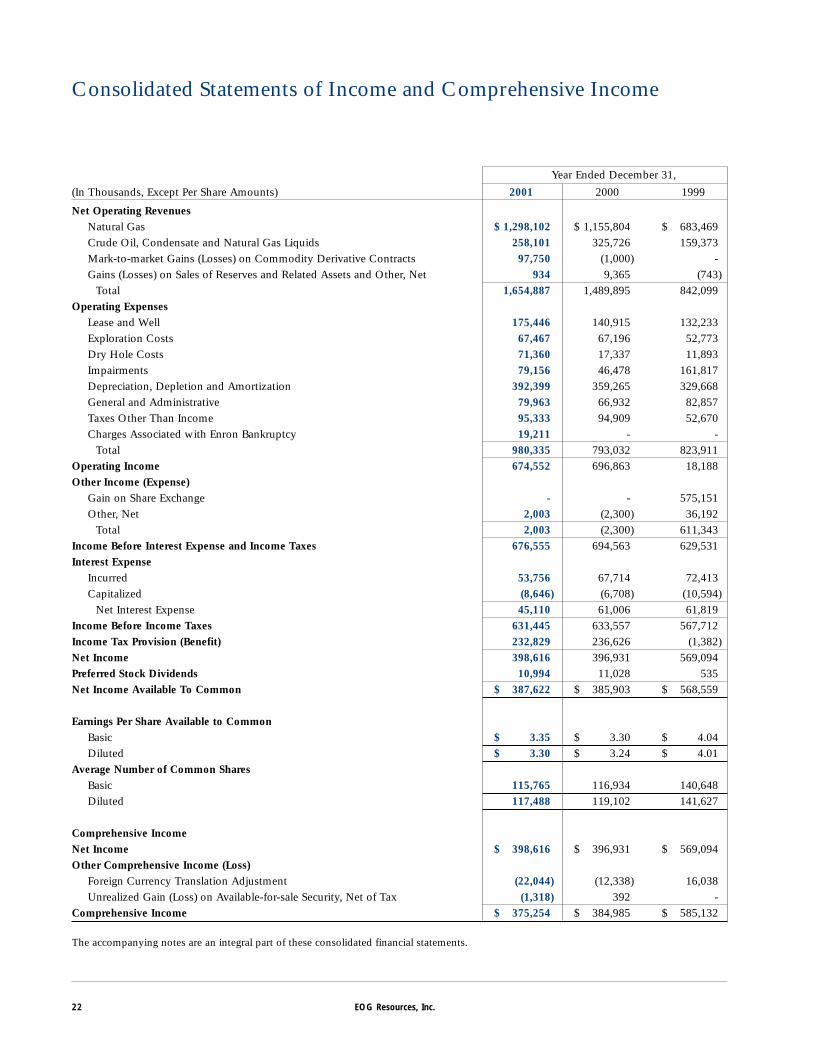
Consolidated Statements of Income and Comprehensive Income
Year Ended December 31,
(In Thousands, Except Per Share Amounts) 2001 2000 1999
Net Operating RevenuesNatural Gas $ 1,298,102 $ 1,155,804 $ 683,469Crude Oil, Condensate and Natural Gas Liquids 258,101 325,726 159,373Mark-to-market Gains (Losses) on Commodity Derivative Contracts 97,750 (1,000) -Gains (Losses) on Sales of Reserves and Related Assets and Other, Net 934 9,365 (743)
Total 1,654,887 1,489,895 842,099Operating Expenses
Lease and Well 175,446 140,915 132,233Exploration Costs 67,467 67,196 52,773Dry Hole Costs 71,360 17,337 11,893Impairments 79,156 46,478 161,817Depreciation, Depletion and Amortization 392,399 359,265 329,668General and Administrative 79,963 66,932 82,857Taxes Other Than Income 95,333 94,909 52,670Charges Associated with Enron Bankruptcy 19,211 - -
Total 980,335 793,032 823,911Operating Income 674,552 696,863 18,188Other Income (Expense)
Gain on Share Exchange - - 575,151Other, Net 2,003 (2,300) 36,192
Total 2,003 (2,300) 611,343Income Before Interest Expense and Income Taxes 676,555 694,563 629,531Interest Expense
Incurred 53,756 67,714 72,413Capitalized (8,646) (6,708) (10,594)
Net Interest Expense 45,110 61,006 61,819Income Before Income Taxes 631,445 633,557 567,712Income Tax Provision (Benefit) 232,829 236,626 (1,382)Net Income 398,616 396,931 569,094Preferred Stock Dividends 10,994 11,028 535Net Income Available To Common $ 387,622 $ 385,903 $ 568,559
Earnings Per Share Available to CommonBasic $ 3.35 $ 3.30 $ 4.04Diluted $ 3.30 $ 3.24 $ 4.01
Average Number of Common SharesBasic 115,765 116,934 140,648Diluted 117,488 119,102 141,627
Comprehensive IncomeNet Income $ 398,616 $ 396,931 $ 569,094Other Comprehensive Income (Loss)
Foreign Currency Translation Adjustment (22,044) (12,338) 16,038Unrealized Gain (Loss) on Available-for-sale Security, Net of Tax (1,318) 392 -
Comprehensive Income $ 375,254 $ 384,985 $ 585,132
The accompanying notes are an integral part of these consolidated financial statements.
22 EOG Resources, Inc.
Consolidated Balance Sheets
At December 31,
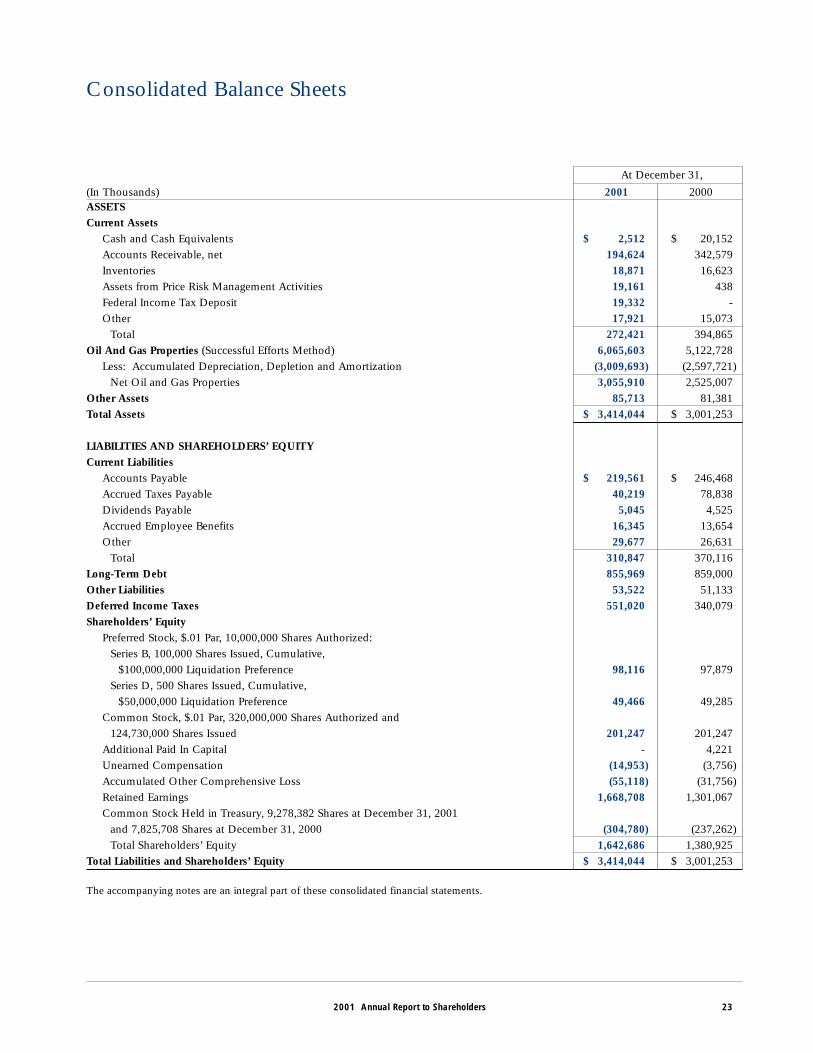
(In Thousands) 2001 2000ASSETSCurrent Assets
Cash and Cash Equivalents $ 2,512 $ 20,152Accounts Receivable, net 194,624 342,579Inventories 18,871 16,623Assets from Price Risk Management Activities 19,161 438Federal Income Tax Deposit 19,332 -Other 17,921 15,073
Total 272,421 394,865Oil And Gas Properties (Successful Efforts Method) 6,065,603 5,122,728
Less: Accumulated Depreciation, Depletion and Amortization (3,009,693) (2,597,721)Net Oil and Gas Properties 3,055,910 2,525,007
Other Assets 85,713 81,381Total Assets $ 3,414,044 $ 3,001,253
LIABILITIES AND SHAREHOLDERS’ EQUITYCurrent Liabilities
Accounts Payable $ 219,561 $ 246,468Accrued Taxes Payable 40,219 78,838Dividends Payable 5,045 4,525Accrued Employee Benefits 16,345 13,654Other 29,677 26,631
Total 310,847 370,116Long-Term Debt 855,969 859,000Other Liabilities 53,522 51,133Deferred Income Taxes 551,020 340,079Shareholders’ Equity
Preferred Stock, $.01 Par, 10,000,000 Shares Authorized:Series B, 100,000 Shares Issued, Cumulative,
$100,000,000 Liquidation Preference 98,116 97,879Series D, 500 Shares Issued, Cumulative,
$50,000,000 Liquidation Preference 49,466 49,285Common Stock, $.01 Par, 320,000,000 Shares Authorized and
124,730,000 Shares Issued 201,247 201,247Additional Paid In Capital - 4,221Unearned Compensation (14,953) (3,756)Accumulated Other Comprehensive Loss (55,118) (31,756)Retained Earnings 1,668,708 1,301,067Common Stock Held in Treasury, 9,278,382 Shares at December 31, 2001
and 7,825,708 Shares at December 31, 2000 (304,780) (237,262)Total Shareholders’ Equity 1,642,686 1,380,925
Total Liabilities and Shareholders’ Equity $ 3,414,044 $ 3,001,253
The accompanying notes are an integral part of these consolidated financial statements.
2001 Annual Report to Shareholders 23
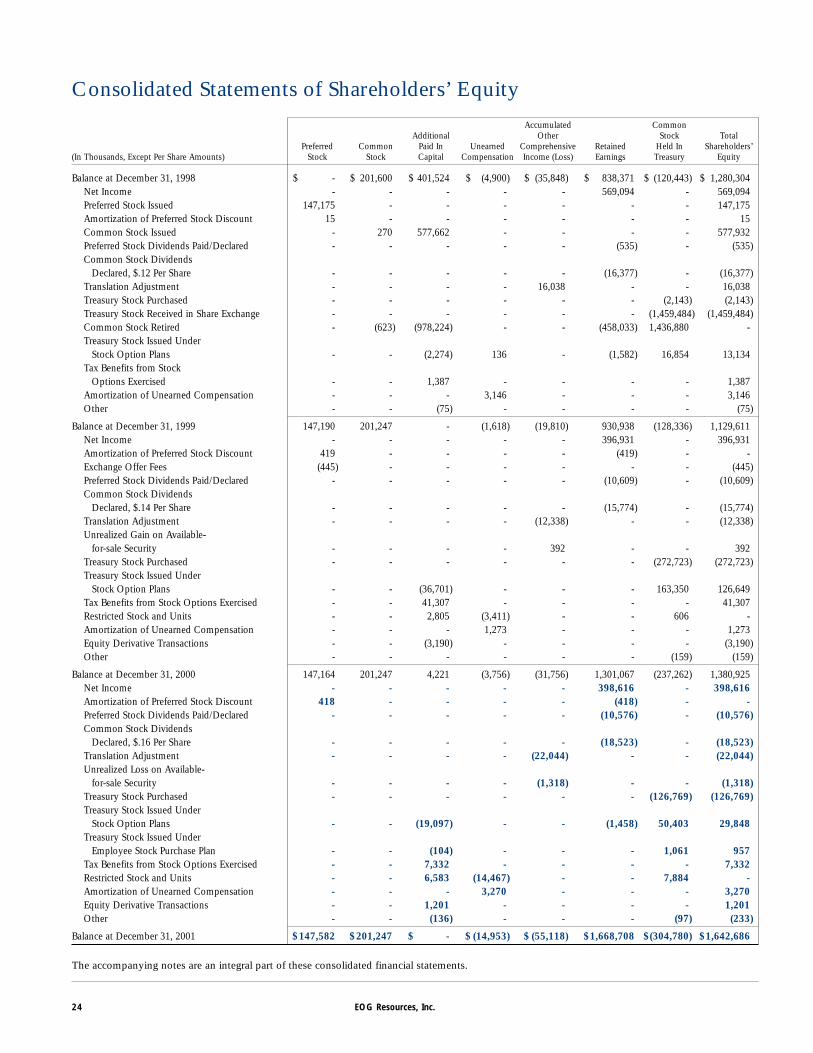
Consolidated Statements of Shareholders’ EquityAccumulated Common
Additional Other Stock TotalPreferred Common Paid In Unearned Comprehensive Retained Held In Shareholders’
(In Thousands, Except Per Share Amounts) Stock Stock Capital Compensation Income (Loss) Earnings Treasury Equity
Balance at December 31, 1998 $ - $ 201,600 $ 401,524 $ (4,900) $ (35,848) $ 838,371 $ (120,443) $ 1,280,304Net Income - - - - - 569,094 - 569,094Preferred Stock Issued 147,175 - - - - - - 147,175Amortization of Preferred Stock Discount 15 - - - - - - 15Common Stock Issued - 270 577,662 - - - - 577,932Preferred Stock Dividends Paid/Declared - - - - - (535) - (535)Common Stock Dividends
Declared, $.12 Per Share - - - - - (16,377) - (16,377)Translation Adjustment - - - - 16,038 - - 16,038Treasury Stock Purchased - - - - - - (2,143) (2,143)Treasury Stock Received in Share Exchange - - - - - - (1,459,484) (1,459,484)Common Stock Retired - (623) (978,224) - - (458,033) 1,436,880 -Treasury Stock Issued Under
Stock Option Plans - - (2,274) 136 - (1,582) 16,854 13,134Tax Benefits from Stock
Options Exercised - - 1,387 - - - - 1,387Amortization of Unearned Compensation - - - 3,146 - - - 3,146Other - - (75) - - - - (75)
Balance at December 31, 1999 147,190 201,247 - (1,618) (19,810) 930,938 (128,336) 1,129,611Net Income - - - - - 396,931 - 396,931Amortization of Preferred Stock Discount 419 - - - - (419) - -Exchange Offer Fees (445) - - - - - - (445)Preferred Stock Dividends Paid/Declared - - - - - (10,609) - (10,609)Common Stock Dividends
Declared, $.14 Per Share - - - - - (15,774) - (15,774)Translation Adjustment - - - - (12,338) - - (12,338)Unrealized Gain on Available-
for-sale Security - - - - 392 - - 392Treasury Stock Purchased - - - - - - (272,723) (272,723)Treasury Stock Issued Under
Stock Option Plans - - (36,701) - - - 163,350 126,649Tax Benefits from Stock Options Exercised - - 41,307 - - - - 41,307Restricted Stock and Units - - 2,805 (3,411) - - 606 -Amortization of Unearned Compensation - - - 1,273 - - - 1,273Equity Derivative Transactions - - (3,190) - - - - (3,190)Other - - - - - - (159) (159)
Balance at December 31, 2000 147,164 201,247 4,221 (3,756) (31,756) 1,301,067 (237,262) 1,380,925Net Income - - - - - 398,616 - 398,616Amortization of Preferred Stock Discount 418 - - - - (418) - -Preferred Stock Dividends Paid/Declared - - - - - (10,576) - (10,576)Common Stock Dividends
Declared, $.16 Per Share - - - - - (18,523) - (18,523)Translation Adjustment - - - - (22,044) - - (22,044)Unrealized Loss on Available-
for-sale Security - - - - (1,318) - - (1,318)Treasury Stock Purchased - - - - - - (126,769) (126,769)Treasury Stock Issued Under
Stock Option Plans - - (19,097) - - (1,458) 50,403 29,848Treasury Stock Issued Under
Employee Stock Purchase Plan - - (104) - - - 1,061 957Tax Benefits from Stock Options Exercised - - 7,332 - - - - 7,332Restricted Stock and Units - - 6,583 (14,467) - - 7,884 -Amortization of Unearned Compensation - - - 3,270 - - - 3,270Equity Derivative Transactions - - 1,201 - - - - 1,201Other - - (136) - - - (97) (233)
Balance at December 31, 2001 $147,582 $201,247 $ - $ (14,953) $ (55,118) $1,668,708 $(304,780) $1,642,686
The accompanying notes are an integral part of these consolidated financial statements.
24 EOG Resources, Inc.
Consolidated Statements of Cash Flows
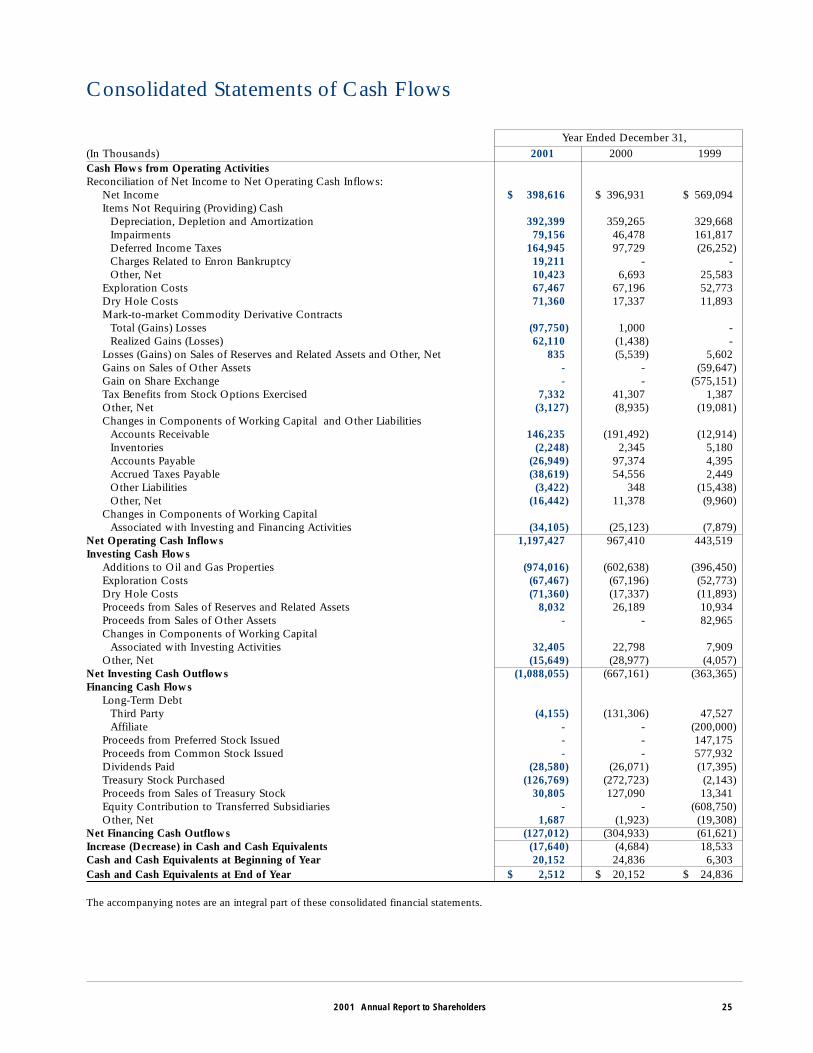
Year Ended December 31,(In Thousands) 2001 2000 1999Cash Flows from Operating ActivitiesReconciliation of Net Income to Net Operating Cash Inflows:
Net Income $ 398,616 $ 396,931 $ 569,094Items Not Requiring (Providing) Cash
Depreciation, Depletion and Amortization 392,399 359,265 329,668Impairments 79,156 46,478 161,817Deferred Income Taxes 164,945 97,729 (26,252)Charges Related to Enron Bankruptcy 19,211 - -Other, Net 10,423 6,693 25,583
Exploration Costs 67,467 67,196 52,773Dry Hole Costs 71,360 17,337 11,893Mark-to-market Commodity Derivative Contracts
Total (Gains) Losses (97,750) 1,000 -Realized Gains (Losses) 62,110 (1,438) -
Losses (Gains) on Sales of Reserves and Related Assets and Other, Net 835 (5,539) 5,602Gains on Sales of Other Assets - - (59,647)Gain on Share Exchange - - (575,151)Tax Benefits from Stock Options Exercised 7,332 41,307 1,387Other, Net (3,127) (8,935) (19,081)Changes in Components of Working Capital and Other Liabilities
Accounts Receivable 146,235 (191,492) (12,914)Inventories (2,248) 2,345 5,180Accounts Payable (26,949) 97,374 4,395Accrued Taxes Payable (38,619) 54,556 2,449Other Liabilities (3,422) 348 (15,438)Other, Net (16,442) 11,378 (9,960)
Changes in Components of Working CapitalAssociated with Investing and Financing Activities (34,105) (25,123) (7,879)
Net Operating Cash Inflows 1,197,427 967,410 443,519Investing Cash Flows
Additions to Oil and Gas Properties (974,016) (602,638) (396,450)Exploration Costs (67,467) (67,196) (52,773)Dry Hole Costs (71,360) (17,337) (11,893)Proceeds from Sales of Reserves and Related Assets 8,032 26,189 10,934Proceeds from Sales of Other Assets - - 82,965Changes in Components of Working Capital
Associated with Investing Activities 32,405 22,798 7,909Other, Net (15,649) (28,977) (4,057)
Net Investing Cash Outflows (1,088,055) (667,161) (363,365)Financing Cash Flows
Long-Term DebtThird Party (4,155) (131,306) 47,527Affiliate - - (200,000)
Proceeds from Preferred Stock Issued - - 147,175Proceeds from Common Stock Issued - - 577,932Dividends Paid (28,580) (26,071) (17,395)Treasury Stock Purchased (126,769) (272,723) (2,143)Proceeds from Sales of Treasury Stock 30,805 127,090 13,341Equity Contribution to Transferred Subsidiaries - - (608,750)Other, Net 1,687 (1,923) (19,308)
Net Financing Cash Outflows (127,012) (304,933) (61,621)Increase (Decrease) in Cash and Cash Equivalents (17,640) (4,684) 18,533Cash and Cash Equivalents at Beginning of Year 20,152 24,836 6,303Cash and Cash Equivalents at End of Year $ 2,512 $ 20,152 $ 24,836
The accompanying notes are an integral part of these consolidated financial statements.
2001 Annual Report to Shareholders 25
1. Summary of Significant Accounting PoliciesPrinciples of Consolidation. The consolidated financial statementsof EOG Resources, Inc. (“EOG”), a Delaware corporation,include the accounts of all domestic and foreign subsidiaries.Investments in unconsolidated affiliates, in which EOG is ableto exercise significant influence, are accounted for using theequity method. All material intercompany accounts and trans-actions have been eliminated.
The preparation of financial statements in conformity withaccounting principles generally accepted in the United Statesrequires management to make estimates and assumptions thataffect the reported amounts of assets and liabilities and dis-closure of contingent assets and liabilities at the date of thefinancial statements and the reported amounts of revenue andexpenses during the reporting period. Actual results could dif-fer from those estimates.
Certain reclassifications have been made to prior periodfinancial statements to conform with the current presentation.Beginning 2001, the “Impairment of Unproved Oil and GasProperties” caption on the Consolidated Statements of Incomewas renamed “Impairments” to include the impairment loss oflong-lived assets as described in Statement of FinancialAccounting Standards (“SFAS”) No. 121--“Accounting for theImpairment of Long-Lived Assets and for Long-Lived Assets tobe Disposed of” (“SFAS 121 Impairments”). As a result, EOGreclassified all prior periods to reflect such SFAS 121Impairments in Impairments, instead of Depreciation, Depletionand Amortization (“DD&A”) as previously reported. SFAS 121Impairments reclassified from DD&A to Impairments were $11million and $133 million for 2000 and 1999, respectively.Financial Instruments. EOG’s financial instruments consist of cashand cash equivalents, marketable securities, accounts receivable,accounts payable and long-term debt. The carrying values ofcash and cash equivalents, marketable securities, accountsreceivable and accounts payable approximate fair value (seeNote 2 “Long-Term Debt” for fair value of long-term debt).Cash and Cash Equivalents. EOG records as cash equivalents allhighly liquid short-term investments with original maturitiesof three months or less.Oil and Gas Operations. EOG accounts for its natural gas andcrude oil exploration and production activities under the suc-cessful efforts method of accounting.
Oil and gas lease acquisition costs are capitalized whenincurred. Unproved properties with significant acquisition costsare assessed quarterly on a property-by-property basis, and anyimpairment in value is recognized. Unproved properties with
acquisition costs that are not individually significant are aggre-gated, and the portion of such costs estimated to be nonpro-ductive, based on historical experience, is amortized over theaverage holding period. If the unproved properties are deter-mined to be productive, the appropriate related costs are trans-ferred to proved oil and gas properties. Lease rentals areexpensed as incurred.
Oil and gas exploration costs, other than the costs ofdrilling exploratory wells, are charged to expense as incurred.The costs of drilling exploratory wells are capitalized pendingdetermination of whether they have discovered proved com-mercial reserves. If proved commercial reserves are not dis-covered, such drilling costs are expensed. Costs to developproved reserves, including the costs of all development wellsand related equipment used in the production of natural gasand crude oil, are capitalized.
Depreciation, depletion and amortization of the cost ofproved oil and gas properties is calculated using the unit-of-production method. Estimated future dismantlement, restora-tion and abandonment costs (classified as long-term liabilities),net of salvage values, are taken into account. Certain otherassets are depreciated on a straight-line basis.
Periodically, or when circumstances indicate that an assetmay be impaired, EOG compares expected undiscounted futurecash flows at a producing field level to the unamortized capi-talized cost of the asset. If the future undiscounted cash flows,based on EOG’s estimate of future crude oil and natural gasprices and operating costs and anticipated production fromproved reserves, are lower than the unamortized capitalizedcost, the capitalized cost is reduced to fair value. Fair value iscalculated by discounting the future cash flows at an appro-priate risk-adjusted discount rate.
Inventories, consisting primarily of tubular goods and wellequipment held for use in the exploration for, and developmentand production of natural gas and crude oil reserves, are car-ried at cost with adjustments made from time to time to rec-ognize any reductions in value.
Natural gas and liquids revenues are recorded when pro-duction is delivered. Additionally, natural gas revenues arerecorded on the entitlement method based on EOG’s percent-age ownership of current production. Each working interestowner in a well generally has the right to a specific percentageof production, although actual production sold may differ froman owner’s ownership percentage. Under entitlement account-ing, a receivable is recorded when underproduction occurs anda payable when overproduction occurs.
26 EOG Resources, Inc.
Notes to Consolidated Financial Statements
Gains and losses associated with the sale of in place nat-ural gas and crude oil reserves and related assets are classifiedas net operating revenues in the consolidated statements ofincome and comprehensive income based on EOG’s strategyof continuing such sales in order to maximize the economicvalue of its assets.New Accounting Pronouncements. In June 1998, the FinancialAccounting Standards Board (“FASB”) issued Statement ofFinancial Accounting Standards (“SFAS”) No. 133--“Accountingfor Derivative Instruments and Hedging Activities” effective forfiscal years beginning after June 15, 1999. SFAS No. 133, asamended by SFAS No. 137 and No. 138, cannot be appliedretroactively. EOG adopted SFAS No. 133, as amended, onJanuary 1, 2001 for the accounting periods which begin there-after. The adoption of SFAS No. 133 did not have a materialimpact on EOG’s financial statements.
In June 2001, the FASB issued SFAS No. 143--“Accountingfor Asset Retirement Obligations” effective for fiscal yearsbeginning after June 15, 2002. SFAS No.143 requires entitiesto record the fair value of a liability for legal obligations asso-ciated with the retirement of tangible long-lived assets and theassociated asset retirement costs. The fair value of the liabili-ty is added to the carrying amount of the associated asset andthis additional carrying amount is depreciated over the life ofthe asset. If the obligation is settled for other than the carry-ing amount of the liability, a gain or loss is recognized on set-tlement. This statement will impact how EOG accounts for itsabandonment liability related to its oil and gas wells. EOG iscurrently evaluating the effect of adopting SFAS No. 143 onits financial statements and has not yet determined the tim-ing of adoption.
In August 2001, the FASB issued SFAS No. 144--“Accounting for the Impairment or Disposal of Long-LivedAssets” effective for fiscal years beginning after December 15,2001. SFAS No. 144, which supersedes SFAS No. 121--“Accounting for the Impairment of Long-Lived Assets and forLong-Lived Assets to be Disposed of,” provides that long-livedassets to be disposed of by sale be measured at the lower ofcarrying amount or fair value less cost to sell. In addition, SFASNo. 144, which also supersedes the accounting and reportingprovisions of Accounting Principles Board (“APB”) Opinion No.30--“Reporting the Results of Operations -- Reporting theEffects of Disposal of a Segment of a Business, andExtraordinary, Unusual and Infrequently Occurring Events andTransactions,” broadens the reporting of discontinued opera-tions to include all components of an entity with operationsthat can be distinguished from the rest of the entity and thatwill be eliminated from the ongoing operations of the entityin a disposal transaction. EOG adopted the provisions of SFASNo. 144 on January 1, 2002. This statement will impact howEOG tests for long-lived asset impairments. EOG does not
expect the impact of SFAS No. 144 to have a material effect onits financial position or results of operations.Accounting for Price Risk Management Activities. EOG engages inprice risk management activities from time to time. These activ-ities are intended to manage EOG’s exposure to fluctuationsin commodity prices for natural gas and crude oil. EOG utilizesderivative financial instruments, primarily price swaps and cost-less collars, as the means to manage this price risk. EOG adopt-ed SFAS No. 133--“Accounting for Derivative Instruments andHedging Activities,” as amended by SFAS No. 137 and No. 138,on January 1, 2001 for the accounting periods which beginthereafter. The statement establishes accounting and reportingstandards requiring that every derivative instrument be record-ed in the balance sheet as either an asset or liability measuredat its fair value. The statement requires that changes in the deriv-ative’s fair value be recognized currently in earnings unless spe-cific hedge accounting criteria are met. Special accounting forqualifying hedges allows a derivative’s gains and losses to off-set related results on the hedged item in the statements ofincome and requires a company to formally document, desig-nate and assess the effectiveness of transactions that receivehedge accounting treatment. The adoption of SFAS No. 133 didnot have a material impact on EOG’s financial statements.During 2001, EOG elected not to designate any of its price riskmanagement activities as accounting hedges under SFAS No.133, and accordingly, accounted for them using the mark-to-market accounting method. Under this accounting method, thechanges in the market value of outstanding financial instru-ments are recognized as gains or losses in the period of change.The gains or losses are recorded in Mark-to-market Gains(Losses) on Commodity Derivative Contracts in the NetOperating Revenues section of the Consolidated Statements ofIncome. The related cash flow impact is reflected as cash flowsfrom operating activities in the Consolidated Statements ofCash Flows (see Note 12 “Prices and Interest Rate RiskManagement Activities”).Capitalized Interest Costs. Certain interest costs have been cap-italized as a part of the historical cost of unproved oil and gasproperties and work in progress for development drilling andrelated facilities with significant cash outlays.Income Taxes. EOG accounts for income taxes under the pro-visions of SFAS No. 109--“Accounting for Income Taxes.” SFASNo. 109 requires the asset and liability approach for account-ing for income taxes. Under this approach, deferred tax assetsand liabilities are recognized based on anticipated future taxconsequences attributable to differences between financialstatement carrying amounts of assets and liabilities and theirrespective tax bases (see Note 5 “Income Taxes”).Foreign Currency Translation. For subsidiaries whose functionalcurrency is deemed to be other than the U.S. dollar, asset andliability accounts are translated at year-end exchange rates and
2001 Annual Report to Shareholders 27
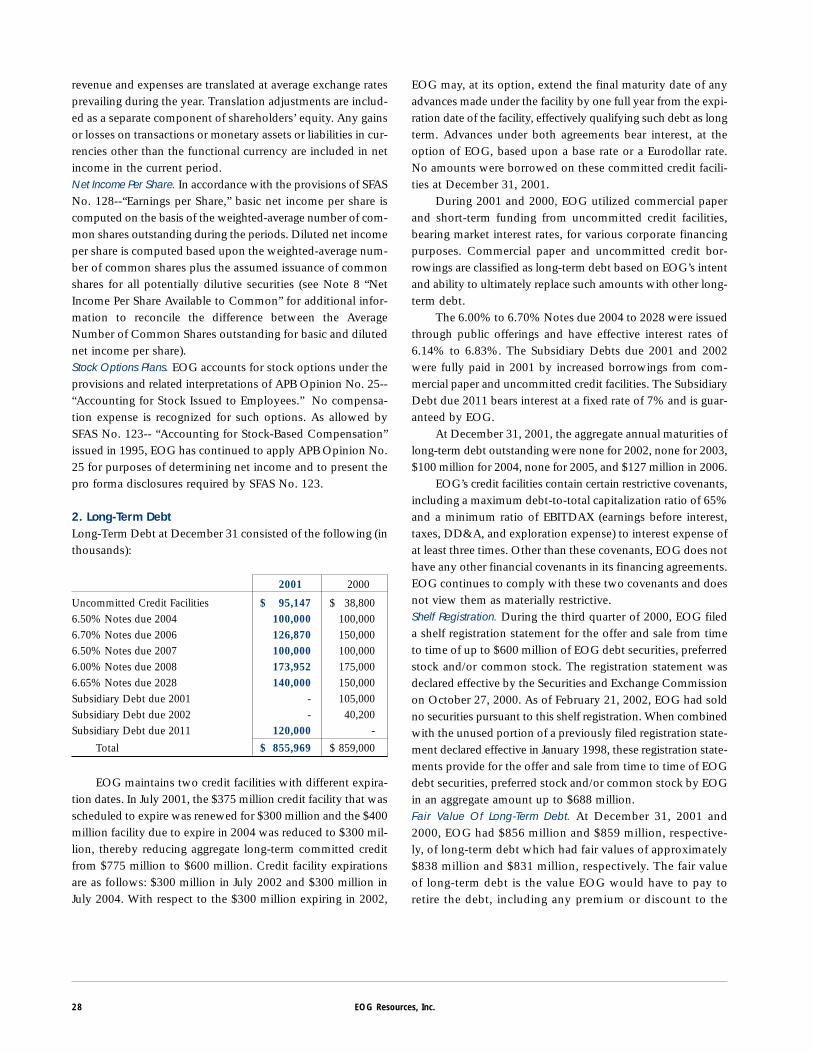
revenue and expenses are translated at average exchange ratesprevailing during the year. Translation adjustments are includ-ed as a separate component of shareholders’ equity. Any gainsor losses on transactions or monetary assets or liabilities in cur-rencies other than the functional currency are included in netincome in the current period.Net Income Per Share. In accordance with the provisions of SFASNo. 128--“Earnings per Share,” basic net income per share iscomputed on the basis of the weighted-average number of com-mon shares outstanding during the periods. Diluted net incomeper share is computed based upon the weighted-average num-ber of common shares plus the assumed issuance of commonshares for all potentially dilutive securities (see Note 8 “NetIncome Per Share Available to Common” for additional infor-mation to reconcile the difference between the AverageNumber of Common Shares outstanding for basic and dilutednet income per share).Stock Options Plans. EOG accounts for stock options under theprovisions and related interpretations of APB Opinion No. 25--“Accounting for Stock Issued to Employees.” No compensa-tion expense is recognized for such options. As allowed bySFAS No. 123-- “Accounting for Stock-Based Compensation”issued in 1995, EOG has continued to apply APB Opinion No.25 for purposes of determining net income and to present thepro forma disclosures required by SFAS No. 123.
2. Long-Term DebtLong-Term Debt at December 31 consisted of the following (inthousands):
2001 2000
Uncommitted Credit Facilities $ 95,147 $ 38,8006.50% Notes due 2004 100,000 100,0006.70% Notes due 2006 126,870 150,0006.50% Notes due 2007 100,000 100,0006.00% Notes due 2008 173,952 175,0006.65% Notes due 2028 140,000 150,000Subsidiary Debt due 2001 - 105,000Subsidiary Debt due 2002 - 40,200Subsidiary Debt due 2011 120,000 -
Total $ 855,969 $ 859,000
EOG maintains two credit facilities with different expira-tion dates. In July 2001, the $375 million credit facility that wasscheduled to expire was renewed for $300 million and the $400million facility due to expire in 2004 was reduced to $300 mil-lion, thereby reducing aggregate long-term committed creditfrom $775 million to $600 million. Credit facility expirationsare as follows: $300 million in July 2002 and $300 million inJuly 2004. With respect to the $300 million expiring in 2002,
EOG may, at its option, extend the final maturity date of anyadvances made under the facility by one full year from the expi-ration date of the facility, effectively qualifying such debt as longterm. Advances under both agreements bear interest, at theoption of EOG, based upon a base rate or a Eurodollar rate.No amounts were borrowed on these committed credit facili-ties at December 31, 2001.
During 2001 and 2000, EOG utilized commercial paperand short-term funding from uncommitted credit facilities,bearing market interest rates, for various corporate financingpurposes. Commercial paper and uncommitted credit bor-rowings are classified as long-term debt based on EOG’s intentand ability to ultimately replace such amounts with other long-term debt.
The 6.00% to 6.70% Notes due 2004 to 2028 were issuedthrough public offerings and have effective interest rates of6.14% to 6.83%. The Subsidiary Debts due 2001 and 2002were fully paid in 2001 by increased borrowings from com-mercial paper and uncommitted credit facilities. The SubsidiaryDebt due 2011 bears interest at a fixed rate of 7% and is guar-anteed by EOG.
At December 31, 2001, the aggregate annual maturities oflong-term debt outstanding were none for 2002, none for 2003,$100 million for 2004, none for 2005, and $127 million in 2006.
EOG’s credit facilities contain certain restrictive covenants,including a maximum debt-to-total capitalization ratio of 65%and a minimum ratio of EBITDAX (earnings before interest,taxes, DD&A, and exploration expense) to interest expense ofat least three times. Other than these covenants, EOG does nothave any other financial covenants in its financing agreements.EOG continues to comply with these two covenants and doesnot view them as materially restrictive.Shelf Registration. During the third quarter of 2000, EOG fileda shelf registration statement for the offer and sale from timeto time of up to $600 million of EOG debt securities, preferredstock and/or common stock. The registration statement wasdeclared effective by the Securities and Exchange Commissionon October 27, 2000. As of February 21, 2002, EOG had soldno securities pursuant to this shelf registration. When combinedwith the unused portion of a previously filed registration state-ment declared effective in January 1998, these registration state-ments provide for the offer and sale from time to time of EOGdebt securities, preferred stock and/or common stock by EOGin an aggregate amount up to $688 million.Fair Value Of Long-Term Debt. At December 31, 2001 and2000, EOG had $856 million and $859 million, respective-ly, of long-term debt which had fair values of approximately$838 million and $831 million, respectively. The fair valueof long-term debt is the value EOG would have to pay toretire the debt, including any premium or discount to the
28 EOG Resources, Inc.
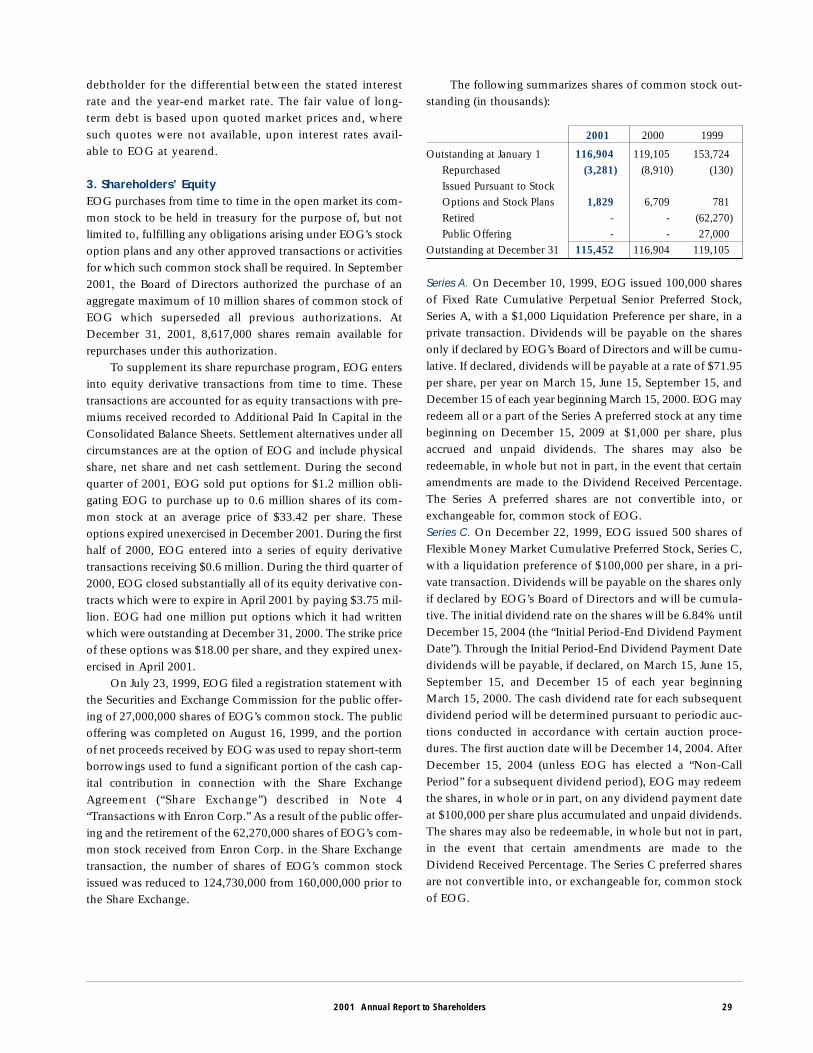
debtholder for the differential between the stated interestrate and the year-end market rate. The fair value of long-term debt is based upon quoted market prices and, wheresuch quotes were not available, upon interest rates avail-able to EOG at yearend.
3. Shareholders’ EquityEOG purchases from time to time in the open market its com-mon stock to be held in treasury for the purpose of, but notlimited to, fulfilling any obligations arising under EOG’s stockoption plans and any other approved transactions or activitiesfor which such common stock shall be required. In September2001, the Board of Directors authorized the purchase of anaggregate maximum of 10 million shares of common stock ofEOG which superseded all previous authorizations. AtDecember 31, 2001, 8,617,000 shares remain available forrepurchases under this authorization.
To supplement its share repurchase program, EOG entersinto equity derivative transactions from time to time. Thesetransactions are accounted for as equity transactions with pre-miums received recorded to Additional Paid In Capital in theConsolidated Balance Sheets. Settlement alternatives under allcircumstances are at the option of EOG and include physicalshare, net share and net cash settlement. During the secondquarter of 2001, EOG sold put options for $1.2 million obli-gating EOG to purchase up to 0.6 million shares of its com-mon stock at an average price of $33.42 per share. Theseoptions expired unexercised in December 2001. During the firsthalf of 2000, EOG entered into a series of equity derivativetransactions receiving $0.6 million. During the third quarter of2000, EOG closed substantially all of its equity derivative con-tracts which were to expire in April 2001 by paying $3.75 mil-lion. EOG had one million put options which it had writtenwhich were outstanding at December 31, 2000. The strike priceof these options was $18.00 per share, and they expired unex-ercised in April 2001.
On July 23, 1999, EOG filed a registration statement withthe Securities and Exchange Commission for the public offer-ing of 27,000,000 shares of EOG’s common stock. The publicoffering was completed on August 16, 1999, and the portionof net proceeds received by EOG was used to repay short-termborrowings used to fund a significant portion of the cash cap-ital contribution in connection with the Share ExchangeAgreement (“Share Exchange”) described in Note 4“Transactions with Enron Corp.” As a result of the public offer-ing and the retirement of the 62,270,000 shares of EOG’s com-mon stock received from Enron Corp. in the Share Exchangetransaction, the number of shares of EOG’s common stockissued was reduced to 124,730,000 from 160,000,000 prior tothe Share Exchange.
The following summarizes shares of common stock out-standing (in thousands):
2001 2000 1999
Outstanding at January 1 116,904 119,105 153,724Repurchased (3,281) (8,910) (130)Issued Pursuant to Stock Options and Stock Plans 1,829 6,709 781Retired - - (62,270)Public Offering - - 27,000
Outstanding at December 31 115,452 116,904 119,105
Series A. On December 10, 1999, EOG issued 100,000 sharesof Fixed Rate Cumulative Perpetual Senior Preferred Stock,Series A, with a $1,000 Liquidation Preference per share, in aprivate transaction. Dividends will be payable on the sharesonly if declared by EOG’s Board of Directors and will be cumu-lative. If declared, dividends will be payable at a rate of $71.95per share, per year on March 15, June 15, September 15, andDecember 15 of each year beginning March 15, 2000. EOG mayredeem all or a part of the Series A preferred stock at any timebeginning on December 15, 2009 at $1,000 per share, plusaccrued and unpaid dividends. The shares may also beredeemable, in whole but not in part, in the event that certainamendments are made to the Dividend Received Percentage.The Series A preferred shares are not convertible into, orexchangeable for, common stock of EOG.Series C. On December 22, 1999, EOG issued 500 shares ofFlexible Money Market Cumulative Preferred Stock, Series C,with a liquidation preference of $100,000 per share, in a pri-vate transaction. Dividends will be payable on the shares onlyif declared by EOG’s Board of Directors and will be cumula-tive. The initial dividend rate on the shares will be 6.84% untilDecember 15, 2004 (the “Initial Period-End Dividend PaymentDate”). Through the Initial Period-End Dividend Payment Datedividends will be payable, if declared, on March 15, June 15,September 15, and December 15 of each year beginningMarch 15, 2000. The cash dividend rate for each subsequentdividend period will be determined pursuant to periodic auc-tions conducted in accordance with certain auction proce-dures. The first auction date will be December 14, 2004. AfterDecember 15, 2004 (unless EOG has elected a “Non-CallPeriod” for a subsequent dividend period), EOG may redeemthe shares, in whole or in part, on any dividend payment dateat $100,000 per share plus accumulated and unpaid dividends.The shares may also be redeemable, in whole but not in part,in the event that certain amendments are made to theDividend Received Percentage. The Series C preferred sharesare not convertible into, or exchangeable for, common stockof EOG.
2001 Annual Report to Shareholders 29
During the third quarter of 2000, EOG completed twoexchange offers for its preferred stock whereby shares of EOG’sSeries A preferred stock were exchanged for shares of EOG’sSeries B preferred stock, and shares of EOG’s Series C preferredstock were exchanged for shares of EOG’s Series D preferredstock. All preferred shares were validly tendered and not with-drawn prior to expiration of the offers. EOG accepted all of thetendered shares and issued the respective series in exchange.Both exchange offers were registered under the Securities Actof 1933. The Series B preferred stock has substantially the sameterms as Series A and the Series D preferred stock has sub-stantially the same terms as Series C.
On February 14, 2000, EOG’s Board of Directors declareda dividend of one preferred share purchase right (a “Right,” andthe agreement governing the terms of such Rights, the “RightsAgreement”) for each outstanding share of common stock, parvalue $.01 per share. The Board of Directors has adopted thisRights Agreement to protect stockholders from coercive or oth-erwise unfair takeover tactics. The dividend was distributed tothe stockholders of record on February 24, 2000. Each Right,expiring February 24, 2010, represents a right to buy from EOGone hundredth (1/100) of a share of Series E Junior ParticipatingPreferred Stock (“Preferred Share”) for $90, once the Rightsbecome exercisable. This portion of a Preferred Share will givethe stockholder approximately the same dividend, voting, andliquidation rights as would one share of common stock. Priorto exercise, the Right does not give its holder any dividend, vot-ing, or liquidation rights. If issued, each one hundredth (1/100)of a Preferred Share (i) will not be redeemable; (ii) will entitleholders to quarterly dividend payments of $.01 per share, or anamount equal to the dividend paid on one share of commonstock, whichever is greater; (iii) will entitle holders upon liqui-dation either to receive $1 per share or an amount equal to thepayment made on one share of common stock, whichever isgreater; (iv) will have the same voting power as one share ofcommon stock; and (v) if shares of EOG’s common stock areexchanged via merger, consolidation, or a similar transaction,will entitle holders to a per share payment equal to the paymentmade on one share of common stock.
As amended on December 13, 2001, the Rights will notbe exercisable until ten days after the public announcement thata person or group has become an acquiring person (“AcquiringPerson”) by obtaining beneficial ownership of 10% or more ofEOG’s common stock, or if earlier, ten business days (or a laterdate determined by EOG’s Board of Directors before any per-son or group becomes an Acquiring Person) after a person orgroup begins a tender or exchange offer which, if consum-mated, would result in that person or group becoming anAcquiring Person.
If a person or group becomes an Acquiring Person, all hold-ers of Rights except the Acquiring Person may, for $90, pur-
chase shares of EOG’s common stock with a market value of$180, based on the market price of the common stock prior tosuch acquisition. If EOG is later acquired in a merger or simi-lar transaction after the Rights become exercisable, all holdersof Rights except the Acquiring Person may, for $90, purchaseshares of the acquiring corporation with a market value of $180based on the market price of the acquiring corporation’s stock,prior to such merger.
EOG’s Board of Directors may redeem the Rights for $.01per Right at any time before any person or group becomes anAcquiring Person. If the Board of Directors redeems any Rights,it must redeem all of the Rights. Once the Rights areredeemed, the only right of the holders of Rights will be toreceive the redemption price of $.01 per Right. The redemp-tion price will be adjusted if EOG has a stock split or stock div-idends of EOG’s common stock. After a person or groupbecomes an Acquiring Person, but before an Acquiring Personowns 50% or more of EOG’s outstanding common stock, theBoard of Directors may exchange the Rights for common stockor equivalent security at an exchange ratio of one share of com-mon stock or an equivalent security for each such Right, otherthan Rights held by the Acquiring Person.
4. Transactions with Enron Corp.Enron Corp. Bankruptcy. In December 2001, Enron Corp. and cer-tain of its affiliates, including Enron North America Corp., filedvoluntary petitions for reorganization under Chapter 11 of theUnited States Bankruptcy Code. EOG recorded $19.2 millionin charges associated with the Enron bankruptcies in the fourthquarter of 2001 related to certain contracts with Enron affili-ates, including 2001 and 2002 natural gas and crude oil deriv-ative contracts. EOG has other contractual relationships withEnron Corp. and certain of its affiliates. Based on EOG’s reviewof these other matters, EOG believes that Enron Corp.’s Chapter11 proceedings will not have a material adverse effect on EOG’sfinancial position.Share Exchange. On August 16, 1999, EOG and Enron Corp.completed the Share Exchange whereby EOG received62,270,000 shares of EOG’s common stock out of 82,270,000shares owned by Enron Corp. in exchange for all the stock ofEOG’s subsidiary, EOGI-India, Inc. Prior to the Share Exchange,EOG made an indirect capital contribution of approximately$600 million in cash, plus certain intercompany receivables, toEOGI-India, Inc. At the time of completion of this transaction,this subsidiary owned, through subsidiaries, all of EOG’s assetsand operations in India and China. EOG recognized a $575 mil-lion tax-free gain on the Share Exchange based on the fair valueof the shares received, net of transaction fees of $14 million.Immediately following the Share Exchange, EOG retired the62,270,000 shares of EOG’s common stock received in thetransaction. The weighted average basis in the treasury shares
30 EOG Resources, Inc.
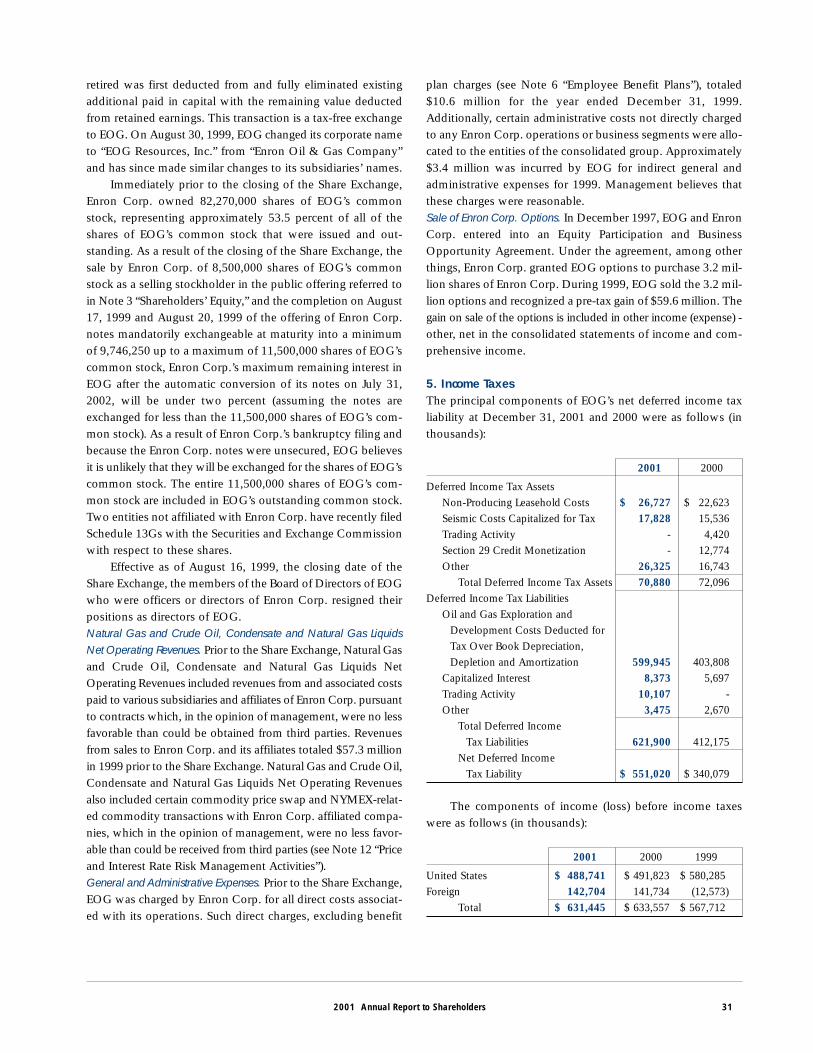
retired was first deducted from and fully eliminated existingadditional paid in capital with the remaining value deductedfrom retained earnings. This transaction is a tax-free exchangeto EOG. On August 30, 1999, EOG changed its corporate nameto “EOG Resources, Inc.” from “Enron Oil & Gas Company”and has since made similar changes to its subsidiaries’ names.
Immediately prior to the closing of the Share Exchange,Enron Corp. owned 82,270,000 shares of EOG’s commonstock, representing approximately 53.5 percent of all of theshares of EOG’s common stock that were issued and out-standing. As a result of the closing of the Share Exchange, thesale by Enron Corp. of 8,500,000 shares of EOG’s commonstock as a selling stockholder in the public offering referred toin Note 3 “Shareholders’ Equity,” and the completion on August17, 1999 and August 20, 1999 of the offering of Enron Corp.notes mandatorily exchangeable at maturity into a minimumof 9,746,250 up to a maximum of 11,500,000 shares of EOG’scommon stock, Enron Corp.’s maximum remaining interest inEOG after the automatic conversion of its notes on July 31,2002, will be under two percent (assuming the notes areexchanged for less than the 11,500,000 shares of EOG’s com-mon stock). As a result of Enron Corp.’s bankruptcy filing andbecause the Enron Corp. notes were unsecured, EOG believesit is unlikely that they will be exchanged for the shares of EOG’scommon stock. The entire 11,500,000 shares of EOG’s com-mon stock are included in EOG’s outstanding common stock.Two entities not affiliated with Enron Corp. have recently filedSchedule 13Gs with the Securities and Exchange Commissionwith respect to these shares.
Effective as of August 16, 1999, the closing date of theShare Exchange, the members of the Board of Directors of EOGwho were officers or directors of Enron Corp. resigned theirpositions as directors of EOG.Natural Gas and Crude Oil, Condensate and Natural Gas LiquidsNet Operating Revenues. Prior to the Share Exchange, Natural Gasand Crude Oil, Condensate and Natural Gas Liquids NetOperating Revenues included revenues from and associated costspaid to various subsidiaries and affiliates of Enron Corp. pursuantto contracts which, in the opinion of management, were no lessfavorable than could be obtained from third parties. Revenuesfrom sales to Enron Corp. and its affiliates totaled $57.3 millionin 1999 prior to the Share Exchange. Natural Gas and Crude Oil,Condensate and Natural Gas Liquids Net Operating Revenuesalso included certain commodity price swap and NYMEX-relat-ed commodity transactions with Enron Corp. affiliated compa-nies, which in the opinion of management, were no less favor-able than could be received from third parties (see Note 12 “Priceand Interest Rate Risk Management Activities”).General and Administrative Expenses. Prior to the Share Exchange,EOG was charged by Enron Corp. for all direct costs associat-ed with its operations. Such direct charges, excluding benefit
plan charges (see Note 6 “Employee Benefit Plans”), totaled$10.6 million for the year ended December 31, 1999.Additionally, certain administrative costs not directly chargedto any Enron Corp. operations or business segments were allo-cated to the entities of the consolidated group. Approximately$3.4 million was incurred by EOG for indirect general andadministrative expenses for 1999. Management believes thatthese charges were reasonable.Sale of Enron Corp. Options. In December 1997, EOG and EnronCorp. entered into an Equity Participation and BusinessOpportunity Agreement. Under the agreement, among otherthings, Enron Corp. granted EOG options to purchase 3.2 mil-lion shares of Enron Corp. During 1999, EOG sold the 3.2 mil-lion options and recognized a pre-tax gain of $59.6 million. Thegain on sale of the options is included in other income (expense) -other, net in the consolidated statements of income and com-prehensive income.
5. Income TaxesThe principal components of EOG’s net deferred income taxliability at December 31, 2001 and 2000 were as follows (inthousands):
2001 2000
Deferred Income Tax AssetsNon-Producing Leasehold Costs $ 26,727 $ 22,623Seismic Costs Capitalized for Tax 17,828 15,536Trading Activity - 4,420Section 29 Credit Monetization - 12,774Other 26,325 16,743
Total Deferred Income Tax Assets 70,880 72,096Deferred Income Tax Liabilities
Oil and Gas Exploration and Development Costs Deducted forTax Over Book Depreciation, Depletion and Amortization 599,945 403,808
Capitalized Interest 8,373 5,697Trading Activity 10,107 -Other 3,475 2,670
Total Deferred Income Tax Liabilities 621,900 412,175
Net Deferred Income Tax Liability $ 551,020 $ 340,079
The components of income (loss) before income taxeswere as follows (in thousands):
2001 2000 1999
United States $ 488,741 $ 491,823 $ 580,285Foreign 142,704 141,734 (12,573)
Total $ 631,445 $ 633,557 $ 567,712
2001 Annual Report to Shareholders 31
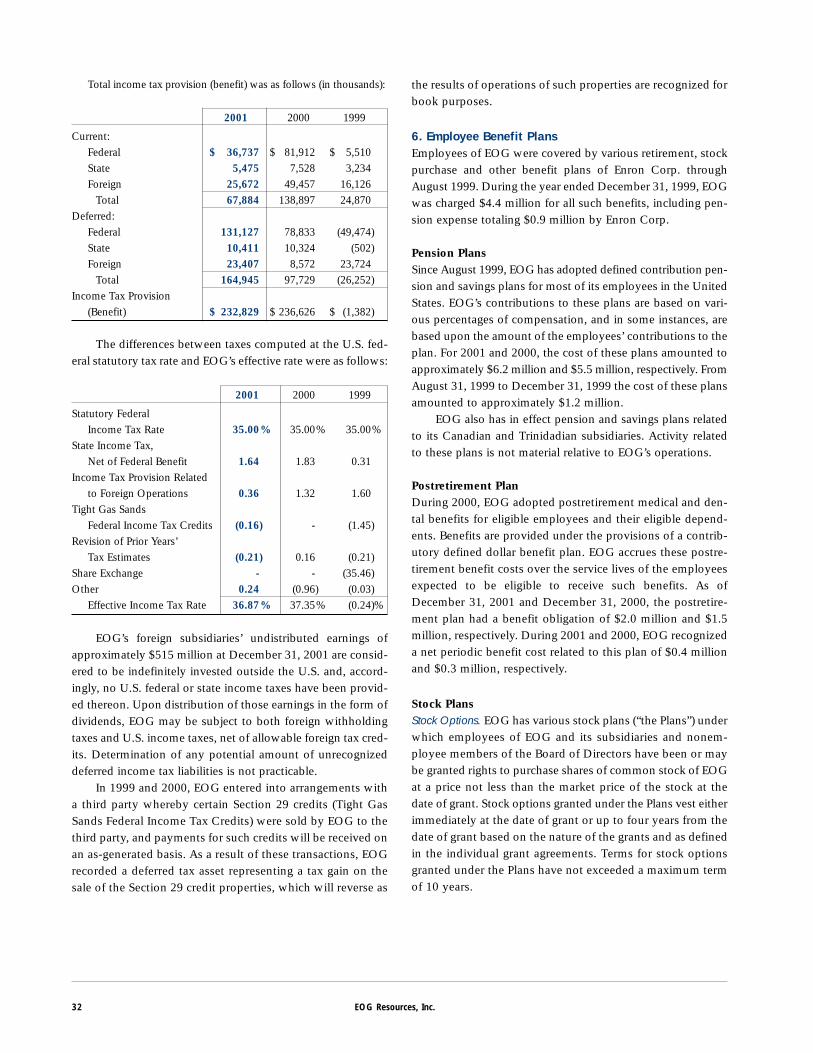
Total income tax provision (benefit) was as follows (in thousands):
2001 2000 1999
Current:Federal $ 36,737 $ 81,912 $ 5,510State 5,475 7,528 3,234Foreign 25,672 49,457 16,126
Total 67,884 138,897 24,870Deferred:
Federal 131,127 78,833 (49,474)State 10,411 10,324 (502)Foreign 23,407 8,572 23,724
Total 164,945 97,729 (26,252)Income Tax Provision
(Benefit) $ 232,829 $ 236,626 $ (1,382)
The differences between taxes computed at the U.S. fed-eral statutory tax rate and EOG’s effective rate were as follows:
2001 2000 1999
Statutory Federal Income Tax Rate 35.00)% 35.00)% 35.00)%
State Income Tax, Net of Federal Benefit 1.64 1.83 0.31
Income Tax Provision Related to Foreign Operations 0.36 1.32 1.60
Tight Gas Sands Federal Income Tax Credits (0.16) - (1.45)
Revision of Prior Years’ Tax Estimates (0.21) 0.16 (0.21)
Share Exchange - - (35.46)Other 0.24 (0.96) (0.03)
Effective Income Tax Rate 36.87)% 37.35)% (0.24)%
EOG’s foreign subsidiaries’ undistributed earnings ofapproximately $515 million at December 31, 2001 are consid-ered to be indefinitely invested outside the U.S. and, accord-ingly, no U.S. federal or state income taxes have been provid-ed thereon. Upon distribution of those earnings in the form ofdividends, EOG may be subject to both foreign withholdingtaxes and U.S. income taxes, net of allowable foreign tax cred-its. Determination of any potential amount of unrecognizeddeferred income tax liabilities is not practicable.
In 1999 and 2000, EOG entered into arrangements witha third party whereby certain Section 29 credits (Tight GasSands Federal Income Tax Credits) were sold by EOG to thethird party, and payments for such credits will be received onan as-generated basis. As a result of these transactions, EOGrecorded a deferred tax asset representing a tax gain on thesale of the Section 29 credit properties, which will reverse as
the results of operations of such properties are recognized forbook purposes.
6. Employee Benefit PlansEmployees of EOG were covered by various retirement, stockpurchase and other benefit plans of Enron Corp. throughAugust 1999. During the year ended December 31, 1999, EOGwas charged $4.4 million for all such benefits, including pen-sion expense totaling $0.9 million by Enron Corp.
Pension PlansSince August 1999, EOG has adopted defined contribution pen-sion and savings plans for most of its employees in the UnitedStates. EOG’s contributions to these plans are based on vari-ous percentages of compensation, and in some instances, arebased upon the amount of the employees’ contributions to theplan. For 2001 and 2000, the cost of these plans amounted toapproximately $6.2 million and $5.5 million, respectively. FromAugust 31, 1999 to December 31, 1999 the cost of these plansamounted to approximately $1.2 million.
EOG also has in effect pension and savings plans relatedto its Canadian and Trinidadian subsidiaries. Activity relatedto these plans is not material relative to EOG’s operations.
Postretirement PlanDuring 2000, EOG adopted postretirement medical and den-tal benefits for eligible employees and their eligible depend-ents. Benefits are provided under the provisions of a contrib-utory defined dollar benefit plan. EOG accrues these postre-tirement benefit costs over the service lives of the employeesexpected to be eligible to receive such benefits. As ofDecember 31, 2001 and December 31, 2000, the postretire-ment plan had a benefit obligation of $2.0 million and $1.5million, respectively. During 2001 and 2000, EOG recognizeda net periodic benefit cost related to this plan of $0.4 millionand $0.3 million, respectively.
Stock PlansStock Options. EOG has various stock plans (“the Plans”) underwhich employees of EOG and its subsidiaries and nonem-ployee members of the Board of Directors have been or maybe granted rights to purchase shares of common stock of EOGat a price not less than the market price of the stock at thedate of grant. Stock options granted under the Plans vest eitherimmediately at the date of grant or up to four years from thedate of grant based on the nature of the grants and as definedin the individual grant agreements. Terms for stock optionsgranted under the Plans have not exceeded a maximum termof 10 years.
32 EOG Resources, Inc.
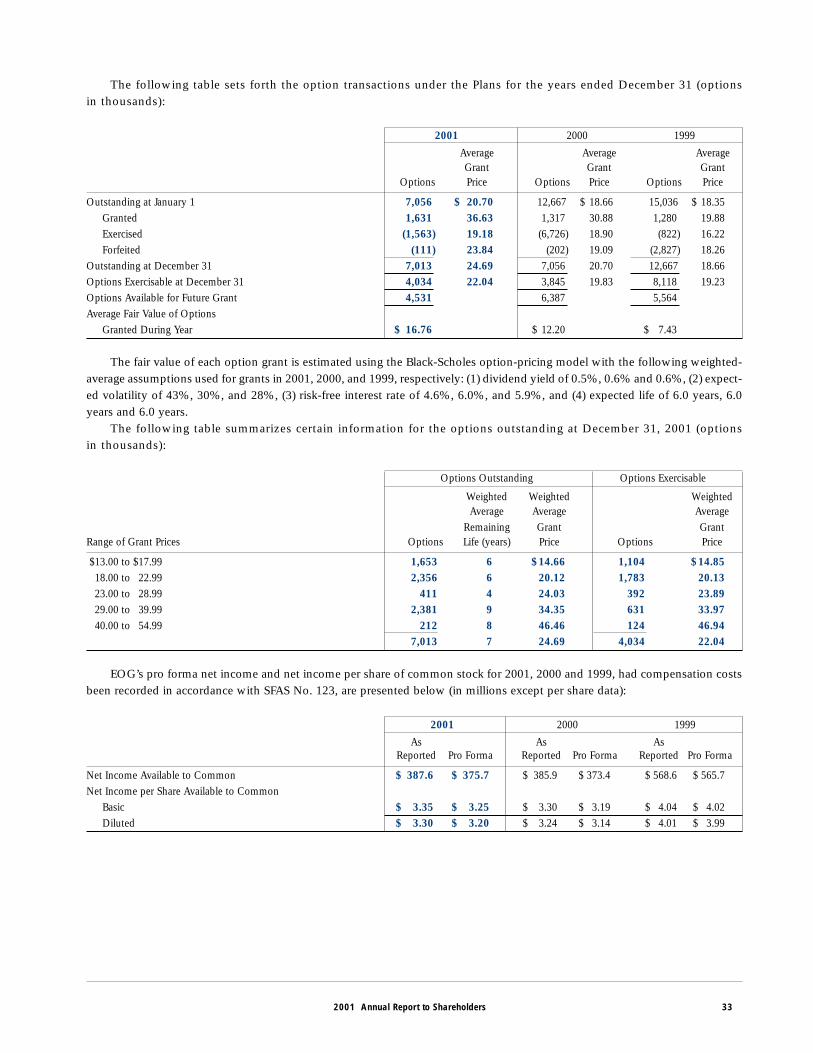
The following table sets forth the option transactions under the Plans for the years ended December 31 (optionsin thousands):
2001 2000 1999
Average Average AverageGrant Grant Grant
Options Price Options Price Options Price
Outstanding at January 1 7,056 $ 20.70 12,667 $ 18.66 15,036 $ 18.35Granted 1,631 36.63 1,317 30.88 1,280 19.88Exercised (1,563) 19.18 (6,726) 18.90 (822) 16.22Forfeited (111) 23.84 (202) 19.09 (2,827) 18.26
Outstanding at December 31 7,013 24.69 7,056 20.70 12,667 18.66Options Exercisable at December 31 4,034 22.04 3,845 19.83 8,118 19.23Options Available for Future Grant 4,531 6,387 5,564Average Fair Value of Options
Granted During Year $ 16.76 $ 12.20 $ 7.43
The fair value of each option grant is estimated using the Black-Scholes option-pricing model with the following weighted-average assumptions used for grants in 2001, 2000, and 1999, respectively: (1) dividend yield of 0.5%, 0.6% and 0.6%, (2) expect-ed volatility of 43%, 30%, and 28%, (3) risk-free interest rate of 4.6%, 6.0%, and 5.9%, and (4) expected life of 6.0 years, 6.0years and 6.0 years.
The following table summarizes certain information for the options outstanding at December 31, 2001 (optionsin thousands):
Options Outstanding Options Exercisable
Weighted Weighted WeightedAverage Average Average
Remaining Grant GrantRange of Grant Prices Options Life (years) Price Options Price
$13.00 to $17.99 1,653 6 $14.66 1,104 $14.8518.00 to 22.99 2,356 6 20.12 1,783 20.1323.00 to 28.99 411 4 24.03 392 23.8929.00 to 39.99 2,381 9 34.35 631 33.9740.00 to 54.99 212 8 46.46 124 46.94
7,013 7 24.69 4,034 22.04
EOG’s pro forma net income and net income per share of common stock for 2001, 2000 and 1999, had compensation costsbeen recorded in accordance with SFAS No. 123, are presented below (in millions except per share data):
2001 2000 1999
As As AsReported Pro Forma Reported Pro Forma Reported Pro Forma
Net Income Available to Common $ 387.6 $ 375.7 $ 385.9 $ 373.4 $ 568.6 $ 565.7Net Income per Share Available to Common
Basic $ 3.35 $ 3.25 $ 3.30 $ 3.19 $ 4.04 $ 4.02Diluted $ 3.30 $ 3.20 $ 3.24 $ 3.14 $ 4.01 $ 3.99
2001 Annual Report to Shareholders 33
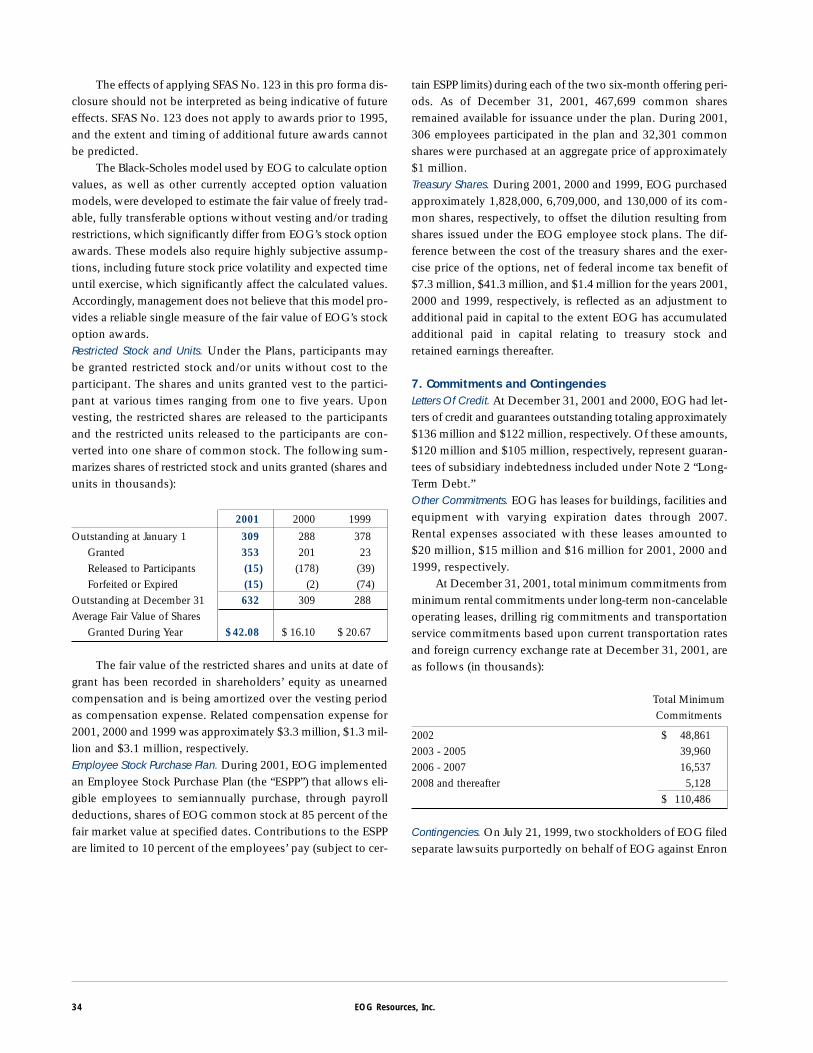
The effects of applying SFAS No. 123 in this pro forma dis-closure should not be interpreted as being indicative of futureeffects. SFAS No. 123 does not apply to awards prior to 1995,and the extent and timing of additional future awards cannotbe predicted.
The Black-Scholes model used by EOG to calculate optionvalues, as well as other currently accepted option valuationmodels, were developed to estimate the fair value of freely trad-able, fully transferable options without vesting and/or tradingrestrictions, which significantly differ from EOG’s stock optionawards. These models also require highly subjective assump-tions, including future stock price volatility and expected timeuntil exercise, which significantly affect the calculated values.Accordingly, management does not believe that this model pro-vides a reliable single measure of the fair value of EOG’s stockoption awards.Restricted Stock and Units. Under the Plans, participants maybe granted restricted stock and/or units without cost to theparticipant. The shares and units granted vest to the partici-pant at various times ranging from one to five years. Uponvesting, the restricted shares are released to the participantsand the restricted units released to the participants are con-verted into one share of common stock. The following sum-marizes shares of restricted stock and units granted (shares andunits in thousands):
2001 2000 1999
Outstanding at January 1 309 288 378Granted 353 201 23Released to Participants (15) (178) (39)Forfeited or Expired (15) (2) (74)
Outstanding at December 31 632 309 288Average Fair Value of Shares
Granted During Year $42.08 $ 16.10 $ 20.67
The fair value of the restricted shares and units at date ofgrant has been recorded in shareholders’ equity as unearnedcompensation and is being amortized over the vesting periodas compensation expense. Related compensation expense for2001, 2000 and 1999 was approximately $3.3 million, $1.3 mil-lion and $3.1 million, respectively.Employee Stock Purchase Plan. During 2001, EOG implementedan Employee Stock Purchase Plan (the “ESPP”) that allows eli-gible employees to semiannually purchase, through payrolldeductions, shares of EOG common stock at 85 percent of thefair market value at specified dates. Contributions to the ESPPare limited to 10 percent of the employees’ pay (subject to cer-
tain ESPP limits) during each of the two six-month offering peri-ods. As of December 31, 2001, 467,699 common sharesremained available for issuance under the plan. During 2001,306 employees participated in the plan and 32,301 commonshares were purchased at an aggregate price of approximately$1 million.Treasury Shares. During 2001, 2000 and 1999, EOG purchasedapproximately 1,828,000, 6,709,000, and 130,000 of its com-mon shares, respectively, to offset the dilution resulting fromshares issued under the EOG employee stock plans. The dif-ference between the cost of the treasury shares and the exer-cise price of the options, net of federal income tax benefit of$7.3 million, $41.3 million, and $1.4 million for the years 2001,2000 and 1999, respectively, is reflected as an adjustment toadditional paid in capital to the extent EOG has accumulatedadditional paid in capital relating to treasury stock andretained earnings thereafter.
7. Commitments and ContingenciesLetters Of Credit. At December 31, 2001 and 2000, EOG had let-ters of credit and guarantees outstanding totaling approximately$136 million and $122 million, respectively. Of these amounts,$120 million and $105 million, respectively, represent guaran-tees of subsidiary indebtedness included under Note 2 “Long-Term Debt.”Other Commitments. EOG has leases for buildings, facilities andequipment with varying expiration dates through 2007.Rental expenses associated with these leases amounted to$20 million, $15 million and $16 million for 2001, 2000 and1999, respectively.
At December 31, 2001, total minimum commitments fromminimum rental commitments under long-term non-cancelableoperating leases, drilling rig commitments and transportationservice commitments based upon current transportation ratesand foreign currency exchange rate at December 31, 2001, areas follows (in thousands):
Total MinimumCommitments
2002 $ 48,8612003 - 2005 39,9602006 - 2007 16,5372008 and thereafter 5,128
$ 110,486
Contingencies. On July 21, 1999, two stockholders of EOG filedseparate lawsuits purportedly on behalf of EOG against Enron
34 EOG Resources, Inc.
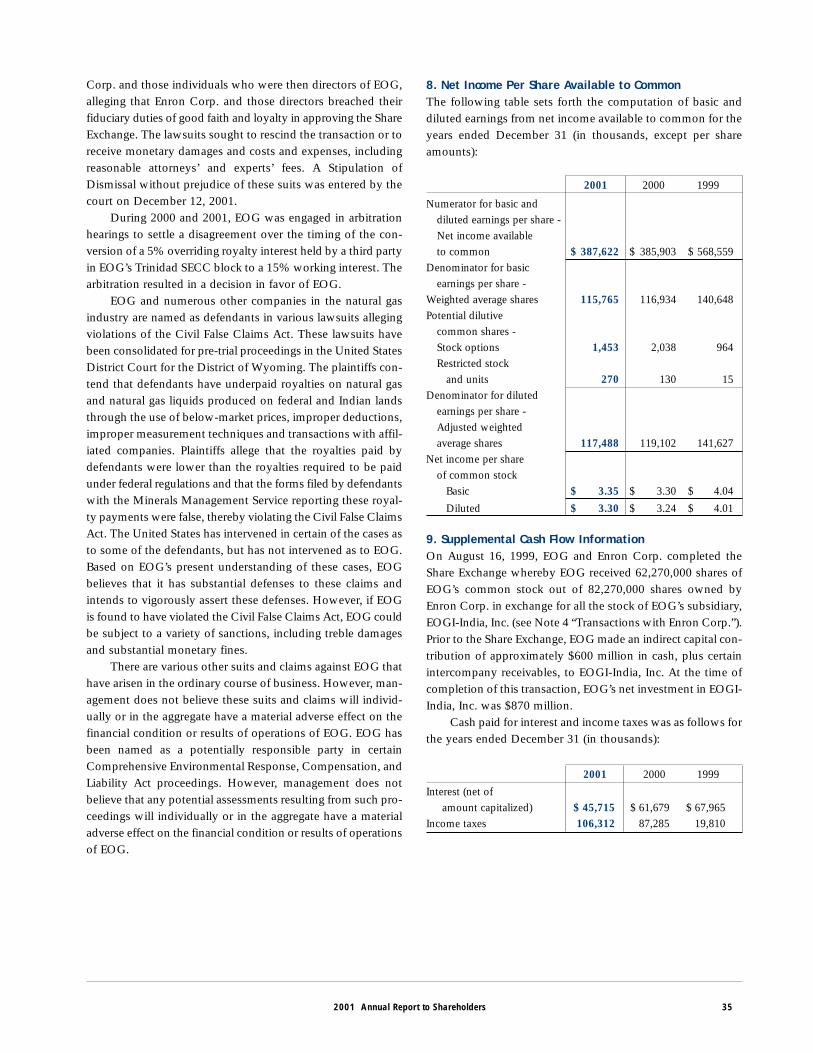
Corp. and those individuals who were then directors of EOG,alleging that Enron Corp. and those directors breached theirfiduciary duties of good faith and loyalty in approving the ShareExchange. The lawsuits sought to rescind the transaction or toreceive monetary damages and costs and expenses, includingreasonable attorneys’ and experts’ fees. A Stipulation ofDismissal without prejudice of these suits was entered by thecourt on December 12, 2001.
During 2000 and 2001, EOG was engaged in arbitrationhearings to settle a disagreement over the timing of the con-version of a 5% overriding royalty interest held by a third partyin EOG’s Trinidad SECC block to a 15% working interest. Thearbitration resulted in a decision in favor of EOG.
EOG and numerous other companies in the natural gasindustry are named as defendants in various lawsuits allegingviolations of the Civil False Claims Act. These lawsuits havebeen consolidated for pre-trial proceedings in the United StatesDistrict Court for the District of Wyoming. The plaintiffs con-tend that defendants have underpaid royalties on natural gasand natural gas liquids produced on federal and Indian landsthrough the use of below-market prices, improper deductions,improper measurement techniques and transactions with affil-iated companies. Plaintiffs allege that the royalties paid bydefendants were lower than the royalties required to be paidunder federal regulations and that the forms filed by defendantswith the Minerals Management Service reporting these royal-ty payments were false, thereby violating the Civil False ClaimsAct. The United States has intervened in certain of the cases asto some of the defendants, but has not intervened as to EOG.Based on EOG’s present understanding of these cases, EOGbelieves that it has substantial defenses to these claims andintends to vigorously assert these defenses. However, if EOGis found to have violated the Civil False Claims Act, EOG couldbe subject to a variety of sanctions, including treble damagesand substantial monetary fines.
There are various other suits and claims against EOG thathave arisen in the ordinary course of business. However, man-agement does not believe these suits and claims will individ-ually or in the aggregate have a material adverse effect on thefinancial condition or results of operations of EOG. EOG hasbeen named as a potentially responsible party in certainComprehensive Environmental Response, Compensation, andLiability Act proceedings. However, management does notbelieve that any potential assessments resulting from such pro-ceedings will individually or in the aggregate have a materialadverse effect on the financial condition or results of operationsof EOG.
8. Net Income Per Share Available to CommonThe following table sets forth the computation of basic anddiluted earnings from net income available to common for theyears ended December 31 (in thousands, except per shareamounts):
2001 2000 1999
Numerator for basic and diluted earnings per share -Net income available to common $ 387,622 $ 385,903 $ 568,559
Denominator for basic earnings per share -
Weighted average shares 115,765 116,934 140,648Potential dilutive
common shares -Stock options 1,453 2,038 964Restricted stock
and units 270 130 15Denominator for diluted
earnings per share -Adjusted weighted average shares 117,488 119,102 141,627
Net income per share of common stock
Basic $ 3.35 $ 3.30 $ 4.04
Diluted $ 3.30 $ 3.24 $ 4.01
9. Supplemental Cash Flow InformationOn August 16, 1999, EOG and Enron Corp. completed theShare Exchange whereby EOG received 62,270,000 shares ofEOG’s common stock out of 82,270,000 shares owned byEnron Corp. in exchange for all the stock of EOG’s subsidiary,EOGI-India, Inc. (see Note 4 “Transactions with Enron Corp.”).Prior to the Share Exchange, EOG made an indirect capital con-tribution of approximately $600 million in cash, plus certainintercompany receivables, to EOGI-India, Inc. At the time ofcompletion of this transaction, EOG’s net investment in EOGI-India, Inc. was $870 million.
Cash paid for interest and income taxes was as follows forthe years ended December 31 (in thousands):
2001 2000 1999
Interest (net of amount capitalized) $ 45,715 $ 61,679 $ 67,965
Income taxes 106,312 87,285 19,810
2001 Annual Report to Shareholders 35
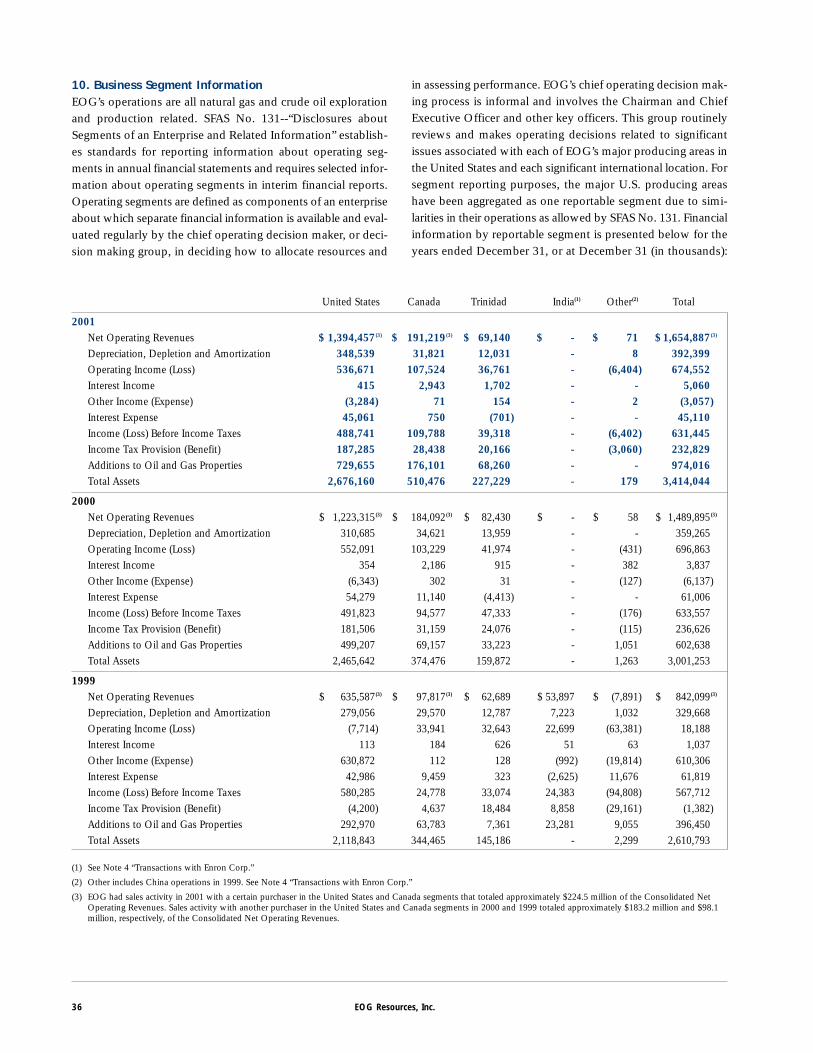
10. Business Segment InformationEOG’s operations are all natural gas and crude oil explorationand production related. SFAS No. 131--“Disclosures aboutSegments of an Enterprise and Related Information” establish-es standards for reporting information about operating seg-ments in annual financial statements and requires selected infor-mation about operating segments in interim financial reports.Operating segments are defined as components of an enterpriseabout which separate financial information is available and eval-uated regularly by the chief operating decision maker, or deci-sion making group, in deciding how to allocate resources and
in assessing performance. EOG’s chief operating decision mak-ing process is informal and involves the Chairman and ChiefExecutive Officer and other key officers. This group routinelyreviews and makes operating decisions related to significantissues associated with each of EOG’s major producing areas inthe United States and each significant international location. Forsegment reporting purposes, the major U.S. producing areashave been aggregated as one reportable segment due to simi-larities in their operations as allowed by SFAS No. 131. Financialinformation by reportable segment is presented below for theyears ended December 31, or at December 31 (in thousands):
36 EOG Resources, Inc.
United States Canada Trinidad India(1) Other(2) Total
2001Net Operating Revenues $ 1,394,457)
(3) $ 191,219)(3) $ 69,140 $ - $ 71 $ 1,654,887)
(3)
Depreciation, Depletion and Amortization 348,539 31,821 12,031 - 8 392,399Operating Income (Loss) 536,671 107,524 36,761 - (6,404) 674,552Interest Income 415 2,943 1,702 - - 5,060Other Income (Expense) (3,284) 71 154 - 2 (3,057)Interest Expense 45,061 750 (701) - - 45,110Income (Loss) Before Income Taxes 488,741 109,788 39,318 - (6,402) 631,445Income Tax Provision (Benefit) 187,285 28,438 20,166 - (3,060) 232,829Additions to Oil and Gas Properties 729,655 176,101 68,260 - - 974,016Total Assets 2,676,160 510,476 227,229 - 179 3,414,044
2000Net Operating Revenues $ 1,223,315)
(3) $ 184,092)(3) $ 82,430 $ - $ 58 $ 1,489,895)
(3)
Depreciation, Depletion and Amortization 310,685 34,621 13,959 - - 359,265Operating Income (Loss) 552,091 103,229 41,974 - (431) 696,863Interest Income 354 2,186 915 - 382 3,837Other Income (Expense) (6,343) 302 31 - (127) (6,137)Interest Expense 54,279 11,140 (4,413) - - 61,006Income (Loss) Before Income Taxes 491,823 94,577 47,333 - (176) 633,557Income Tax Provision (Benefit) 181,506 31,159 24,076 - (115) 236,626Additions to Oil and Gas Properties 499,207 69,157 33,223 - 1,051 602,638Total Assets 2,465,642 374,476 159,872 - 1,263 3,001,253
1999Net Operating Revenues $ 635,587)
(3) $ 97,817)(3) $ 62,689 $ 53,897 $ (7,891) $ 842,099)
(3)
Depreciation, Depletion and Amortization 279,056 29,570 12,787 7,223 1,032 329,668Operating Income (Loss) (7,714) 33,941 32,643 22,699 (63,381) 18,188Interest Income 113 184 626 51 63 1,037Other Income (Expense) 630,872 112 128 (992) (19,814) 610,306Interest Expense 42,986 9,459 323 (2,625) 11,676 61,819Income (Loss) Before Income Taxes 580,285 24,778 33,074 24,383 (94,808) 567,712Income Tax Provision (Benefit) (4,200) 4,637 18,484 8,858 (29,161) (1,382)Additions to Oil and Gas Properties 292,970 63,783 7,361 23,281 9,055 396,450Total Assets 2,118,843 344,465 145,186 - 2,299 2,610,793
(1) See Note 4 “Transactions with Enron Corp.”
(2) Other includes China operations in 1999. See Note 4 “Transactions with Enron Corp.”
(3) EOG had sales activity in 2001 with a certain purchaser in the United States and Canada segments that totaled approximately $224.5 million of the Consolidated NetOperating Revenues. Sales activity with another purchaser in the United States and Canada segments in 2000 and 1999 totaled approximately $183.2 million and $98.1million, respectively, of the Consolidated Net Operating Revenues.
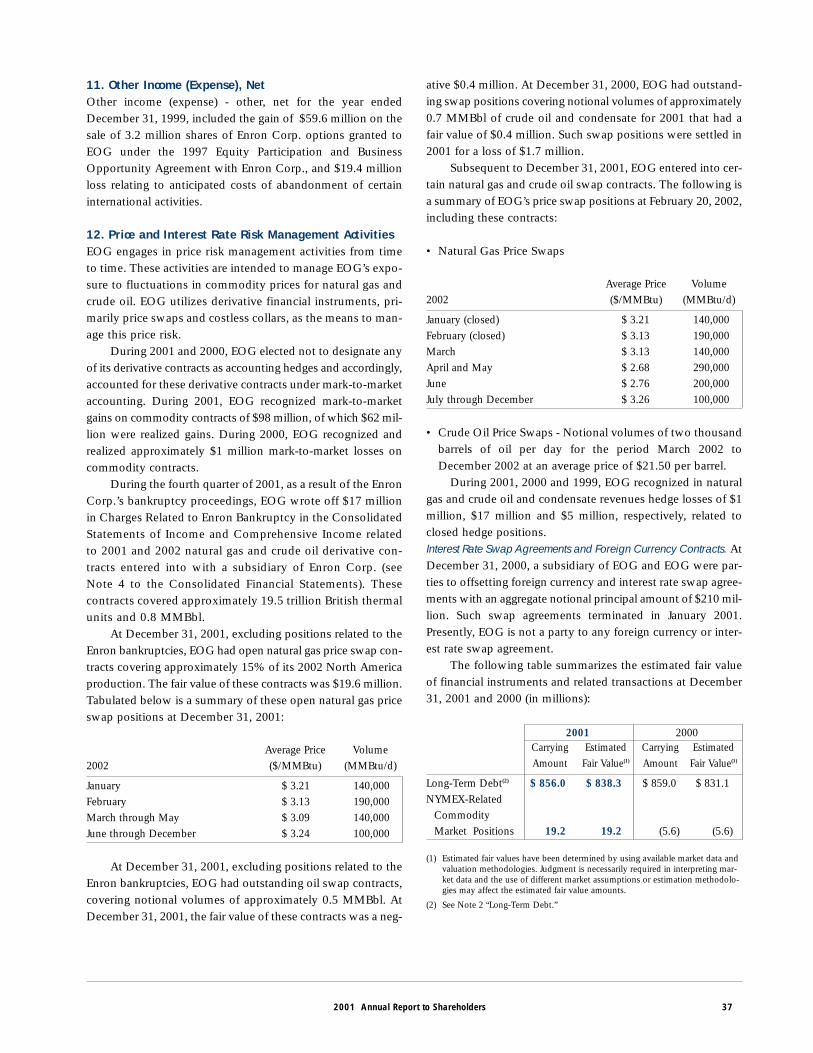
11. Other Income (Expense), NetOther income (expense) - other, net for the year endedDecember 31, 1999, included the gain of $59.6 million on thesale of 3.2 million shares of Enron Corp. options granted toEOG under the 1997 Equity Participation and BusinessOpportunity Agreement with Enron Corp., and $19.4 millionloss relating to anticipated costs of abandonment of certaininternational activities.
12. Price and Interest Rate Risk Management ActivitiesEOG engages in price risk management activities from timeto time. These activities are intended to manage EOG’s expo-sure to fluctuations in commodity prices for natural gas andcrude oil. EOG utilizes derivative financial instruments, pri-marily price swaps and costless collars, as the means to man-age this price risk.
During 2001 and 2000, EOG elected not to designate anyof its derivative contracts as accounting hedges and accordingly,accounted for these derivative contracts under mark-to-marketaccounting. During 2001, EOG recognized mark-to-marketgains on commodity contracts of $98 million, of which $62 mil-lion were realized gains. During 2000, EOG recognized andrealized approximately $1 million mark-to-market losses oncommodity contracts.
During the fourth quarter of 2001, as a result of the EnronCorp.’s bankruptcy proceedings, EOG wrote off $17 millionin Charges Related to Enron Bankruptcy in the ConsolidatedStatements of Income and Comprehensive Income relatedto 2001 and 2002 natural gas and crude oil derivative con-tracts entered into with a subsidiary of Enron Corp. (seeNote 4 to the Consolidated Financial Statements). Thesecontracts covered approximately 19.5 trillion British thermalunits and 0.8 MMBbl.
At December 31, 2001, excluding positions related to theEnron bankruptcies, EOG had open natural gas price swap con-tracts covering approximately 15% of its 2002 North Americaproduction. The fair value of these contracts was $19.6 million.Tabulated below is a summary of these open natural gas priceswap positions at December 31, 2001:
Average Price Volume2002 ($/MMBtu) (MMBtu/d)
January $ 3.21 140,000February $ 3.13 190,000March through May $ 3.09 140,000June through December $ 3.24 100,000
At December 31, 2001, excluding positions related to theEnron bankruptcies, EOG had outstanding oil swap contracts,covering notional volumes of approximately 0.5 MMBbl. AtDecember 31, 2001, the fair value of these contracts was a neg-
ative $0.4 million. At December 31, 2000, EOG had outstand-ing swap positions covering notional volumes of approximately0.7 MMBbl of crude oil and condensate for 2001 that had afair value of $0.4 million. Such swap positions were settled in2001 for a loss of $1.7 million.
Subsequent to December 31, 2001, EOG entered into cer-tain natural gas and crude oil swap contracts. The following isa summary of EOG’s price swap positions at February 20, 2002,including these contracts:
• Natural Gas Price Swaps
Average Price Volume2002 ($/MMBtu) (MMBtu/d)
January (closed) $ 3.21 140,000February (closed) $ 3.13 190,000March $ 3.13 140,000April and May $ 2.68 290,000June $ 2.76 200,000July through December $ 3.26 100,000
• Crude Oil Price Swaps - Notional volumes of two thousandbarrels of oil per day for the period March 2002 toDecember 2002 at an average price of $21.50 per barrel.
During 2001, 2000 and 1999, EOG recognized in naturalgas and crude oil and condensate revenues hedge losses of $1million, $17 million and $5 million, respectively, related toclosed hedge positions.Interest Rate Swap Agreements and Foreign Currency Contracts. AtDecember 31, 2000, a subsidiary of EOG and EOG were par-ties to offsetting foreign currency and interest rate swap agree-ments with an aggregate notional principal amount of $210 mil-lion. Such swap agreements terminated in January 2001.Presently, EOG is not a party to any foreign currency or inter-est rate swap agreement.
The following table summarizes the estimated fair valueof financial instruments and related transactions at December31, 2001 and 2000 (in millions):
2001 2000Carrying Estimated Carrying EstimatedAmount Fair Value(1) Amount Fair Value(1)
Long-Term Debt(2) $ 856.0 $ 838.3 $ 859.0 $ 831.1NYMEX-Related
Commodity Market Positions 19.2 19.2 (5.6) (5.6)
(1) Estimated fair values have been determined by using available market data andvaluation methodologies. Judgment is necessarily required in interpreting mar-ket data and the use of different market assumptions or estimation methodolo-gies may affect the estimated fair value amounts.
(2) See Note 2 “Long-Term Debt.”
2001 Annual Report to Shareholders 37
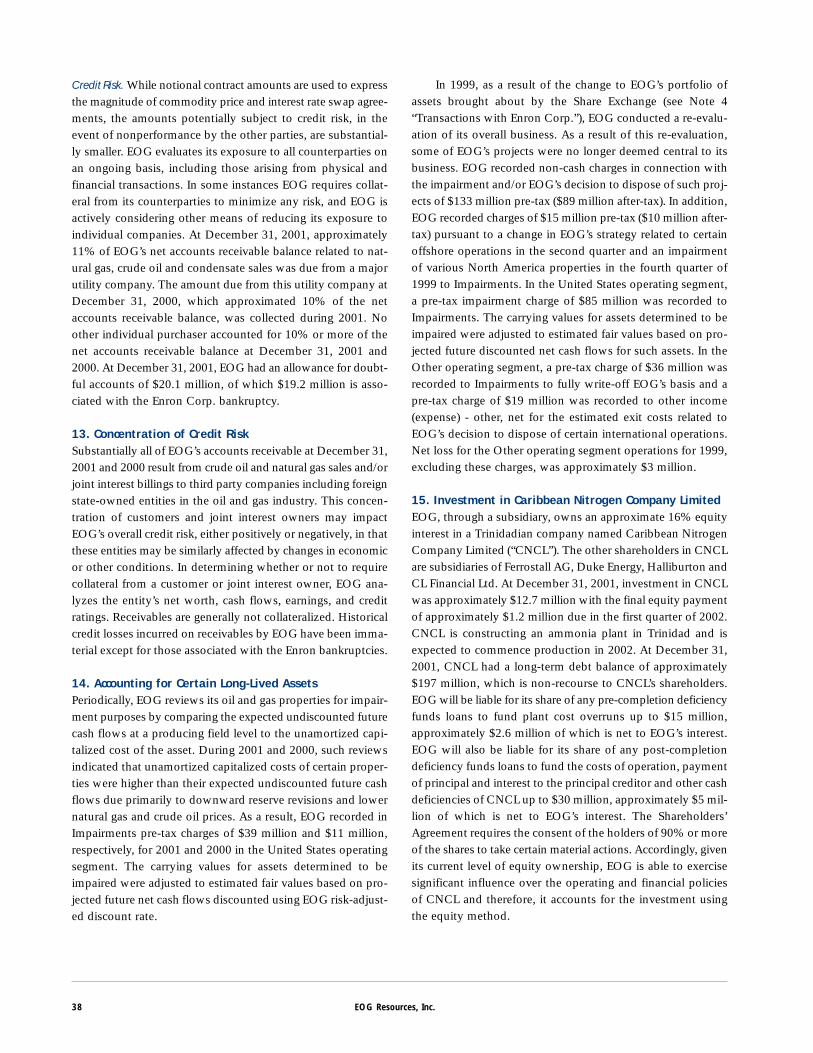
Credit Risk. While notional contract amounts are used to expressthe magnitude of commodity price and interest rate swap agree-ments, the amounts potentially subject to credit risk, in theevent of nonperformance by the other parties, are substantial-ly smaller. EOG evaluates its exposure to all counterparties onan ongoing basis, including those arising from physical andfinancial transactions. In some instances EOG requires collat-eral from its counterparties to minimize any risk, and EOG isactively considering other means of reducing its exposure toindividual companies. At December 31, 2001, approximately11% of EOG’s net accounts receivable balance related to nat-ural gas, crude oil and condensate sales was due from a majorutility company. The amount due from this utility company atDecember 31, 2000, which approximated 10% of the netaccounts receivable balance, was collected during 2001. Noother individual purchaser accounted for 10% or more of thenet accounts receivable balance at December 31, 2001 and2000. At December 31, 2001, EOG had an allowance for doubt-ful accounts of $20.1 million, of which $19.2 million is asso-ciated with the Enron Corp. bankruptcy.
13. Concentration of Credit RiskSubstantially all of EOG’s accounts receivable at December 31,2001 and 2000 result from crude oil and natural gas sales and/orjoint interest billings to third party companies including foreignstate-owned entities in the oil and gas industry. This concen-tration of customers and joint interest owners may impactEOG’s overall credit risk, either positively or negatively, in thatthese entities may be similarly affected by changes in economicor other conditions. In determining whether or not to requirecollateral from a customer or joint interest owner, EOG ana-lyzes the entity’s net worth, cash flows, earnings, and creditratings. Receivables are generally not collateralized. Historicalcredit losses incurred on receivables by EOG have been imma-terial except for those associated with the Enron bankruptcies.
14. Accounting for Certain Long-Lived AssetsPeriodically, EOG reviews its oil and gas properties for impair-ment purposes by comparing the expected undiscounted futurecash flows at a producing field level to the unamortized capi-talized cost of the asset. During 2001 and 2000, such reviewsindicated that unamortized capitalized costs of certain proper-ties were higher than their expected undiscounted future cashflows due primarily to downward reserve revisions and lowernatural gas and crude oil prices. As a result, EOG recorded inImpairments pre-tax charges of $39 million and $11 million,respectively, for 2001 and 2000 in the United States operatingsegment. The carrying values for assets determined to beimpaired were adjusted to estimated fair values based on pro-jected future net cash flows discounted using EOG risk-adjust-ed discount rate.
In 1999, as a result of the change to EOG’s portfolio ofassets brought about by the Share Exchange (see Note 4“Transactions with Enron Corp.”), EOG conducted a re-evalu-ation of its overall business. As a result of this re-evaluation,some of EOG’s projects were no longer deemed central to itsbusiness. EOG recorded non-cash charges in connection withthe impairment and/or EOG’s decision to dispose of such proj-ects of $133 million pre-tax ($89 million after-tax). In addition,EOG recorded charges of $15 million pre-tax ($10 million after-tax) pursuant to a change in EOG’s strategy related to certainoffshore operations in the second quarter and an impairmentof various North America properties in the fourth quarter of1999 to Impairments. In the United States operating segment,a pre-tax impairment charge of $85 million was recorded toImpairments. The carrying values for assets determined to beimpaired were adjusted to estimated fair values based on pro-jected future discounted net cash flows for such assets. In theOther operating segment, a pre-tax charge of $36 million wasrecorded to Impairments to fully write-off EOG’s basis and apre-tax charge of $19 million was recorded to other income(expense) - other, net for the estimated exit costs related toEOG’s decision to dispose of certain international operations.Net loss for the Other operating segment operations for 1999,excluding these charges, was approximately $3 million.
15. Investment in Caribbean Nitrogen Company LimitedEOG, through a subsidiary, owns an approximate 16% equityinterest in a Trinidadian company named Caribbean NitrogenCompany Limited (“CNCL”). The other shareholders in CNCLare subsidiaries of Ferrostall AG, Duke Energy, Halliburton andCL Financial Ltd. At December 31, 2001, investment in CNCLwas approximately $12.7 million with the final equity paymentof approximately $1.2 million due in the first quarter of 2002.CNCL is constructing an ammonia plant in Trinidad and isexpected to commence production in 2002. At December 31,2001, CNCL had a long-term debt balance of approximately$197 million, which is non-recourse to CNCL’s shareholders.EOG will be liable for its share of any pre-completion deficiencyfunds loans to fund plant cost overruns up to $15 million,approximately $2.6 million of which is net to EOG’s interest.EOG will also be liable for its share of any post-completiondeficiency funds loans to fund the costs of operation, paymentof principal and interest to the principal creditor and other cashdeficiencies of CNCL up to $30 million, approximately $5 mil-lion of which is net to EOG’s interest. The Shareholders’Agreement requires the consent of the holders of 90% or moreof the shares to take certain material actions. Accordingly, givenits current level of equity ownership, EOG is able to exercisesignificant influence over the operating and financial policiesof CNCL and therefore, it accounts for the investment usingthe equity method.
38 EOG Resources, Inc.
Oil and Gas Producing ActivitiesThe following disclosures are made in accordance with SFASNo. 69--“Disclosures about Oil and Gas Producing Activities”:Oil and Gas Reserves. Users of this information should be awarethat the process of estimating quantities of “proved,” “proveddeveloped” and “proved undeveloped” crude oil and natural gasreserves is very complex, requiring significant subjective deci-sions in the evaluation of all available geological, engineeringand economic data for each reservoir. The data for a given reser-voir may also change substantially over time as a result ofnumerous factors including, but not limited to, additional devel-opment activity, evolving production history, and continualreassessment of the viability of production under varying eco-nomic conditions. Consequently, material revisions to existingreserve estimates occur from time to time. Although every rea-sonable effort is made to ensure that reserve estimates report-ed represent the most accurate assessments possible, the sig-nificance of the subjective decisions required and variances inavailable data for various reservoirs make these estimates gen-erally less precise than other estimates presented in connectionwith financial statement disclosures.
Proved reserves represent estimated quantities of naturalgas, crude oil, condensate, and natural gas liquids that geo-logical and engineering data demonstrate, with reasonable cer-tainty, to be recoverable in future years from known reservoirsunder economic and operating conditions existing at the timethe estimates were made.
Proved developed reserves are proved reserves expectedto be recovered, through wells and equipment in place andunder operating methods being utilized at the time the esti-mates were made.
Proved undeveloped reserves are reserves that are expect-ed to be recovered from new wells on undrilled acreage, or fromexisting wells where a relatively major expenditure is requiredfor recompletion. Reserves on undrilled acreage are limited tothose drilling units offsetting productive units that are reason-ably certain of production when drilled. Proved reserves forother undrilled units can be claimed only where it can bedemonstrated with certainty that there is continuity of pro-duction from the existing productive formation. Estimates forproved undeveloped reserves are not attributed to any acreagefor which an application of fluid injection or other improvedrecovery technique is contemplated, unless such techniqueshave been proved effective by actual tests in the area and inthe same reservoir.
Canadian provincial royalties are determined based on agraduated percentage scale which varies with prices and pro-duction volumes. Canadian reserves, as presented on a netbasis, assume prices and royalty rates in existence at the timethe estimates were made, and EOG’s estimate of future pro-duction volumes. Future fluctuations in prices, production rates,or changes in political or regulatory environments could causeEOG’s share of future production from Canadian reserves tobe materially different from that presented.
As a result of the re-evaluation of EOG’s portfolio of assetsfollowing the Share Exchange (see Note 4 “Transactions withEnron Corp.”), on November 12, 1999 senior management pro-posed to the Board of Directors (“the Board”) of EOG to deferthe development of the Big Piney Madison deep Paleozoic for-mation methane reserves in Wyoming for the foreseeablefuture. The Board approved the recommendation. As a result,the 1.2 trillion cubic feet of methane reserves in the formation,which are located on acreage owned by EOG and held by pro-duction for the foreseeable future, and which were classifiedas proved undeveloped reserves at December 31, 1998, wereremoved as a revision during 1999. At December 31, 1998,these reserves represented approximately $100 million or 5%of EOG’s Standardized Measure of Discounted Future Net CashFlows as adjusted for the sale of the India and China reservesas a result of the Share Exchange. At December 31, 2001, EOGhad no plan to develop these reserves for the foreseeable future.
Estimates of proved and proved developed reserves atDecember 31, 2001, 2000 and 1999 were based on studies per-formed by the engineering staff of EOG for reserves in theUnited States, Canada, Trinidad, India and China (see Note 4to the Consolidated Financial Statements regarding operationstransferred under the Share Exchange). Opinions by DeGolyerand MacNaughton (“D&M”), independent petroleum consult-ants, for the years ended December 31, 2001, 2000, and 1999covered producing areas containing 71%, 49% and 52%,respectively, of proved reserves of EOG on a net-equivalent-cubic-feet-of-gas basis. D&M’s opinions indicate that the esti-mates of proved reserves prepared by EOG’s engineering stafffor the properties reviewed by D&M, when compared in totalon a net-equivalent-cubic-feet-of-gas basis, do not differ mate-rially from the estimates prepared by D&M. Such estimates byD&M in the aggregate varied by not more than 5% from thoseprepared by the engineering staff of EOG. All reports by D&Mwere developed utilizing geological and engineering data pro-vided by EOG.
2001 Annual Report to Shareholders 39
Supplemental Information to Consolidated Financial Statements(In Thousands Except Per Share Amounts Unless Otherwise Indicated)(Unaudited Except for Results of Operations for Oil and Gas Producing Activities)
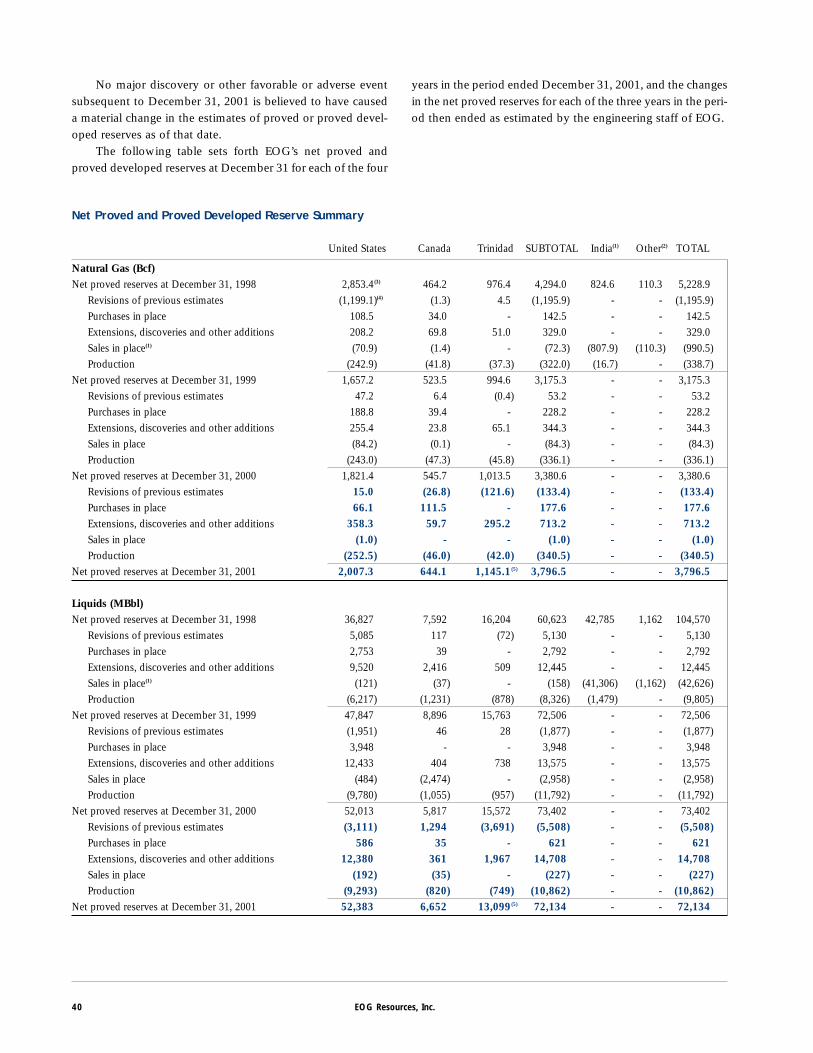
Net Proved and Proved Developed Reserve Summary
United States Canada Trinidad SUBTOTAL India(1) Other(2) TOTAL
Natural Gas (Bcf)Net proved reserves at December 31, 1998 2,853.4)
(3) 464.2 976.4 4,294.0 824.6 110.3 5,228.9Revisions of previous estimates (1,199.1)(4) (1.3) 4.5 (1,195.9) - - (1,195.9)Purchases in place 108.5 34.0 - 142.5 - - 142.5Extensions, discoveries and other additions 208.2 69.8 51.0 329.0 - - 329.0Sales in place(1) (70.9) (1.4) - (72.3) (807.9) (110.3) (990.5)Production (242.9) (41.8) (37.3) (322.0) (16.7) - (338.7)
Net proved reserves at December 31, 1999 1,657.2 523.5 994.6 3,175.3 - - 3,175.3Revisions of previous estimates 47.2 6.4 (0.4) 53.2 - - 53.2Purchases in place 188.8 39.4 - 228.2 - - 228.2Extensions, discoveries and other additions 255.4 23.8 65.1 344.3 - - 344.3Sales in place (84.2) (0.1) - (84.3) - - (84.3)Production (243.0) (47.3) (45.8) (336.1) - - (336.1)
Net proved reserves at December 31, 2000 1,821.4 545.7 1,013.5 3,380.6 - - 3,380.6Revisions of previous estimates 15.0 (26.8) (121.6) (133.4) - - (133.4)Purchases in place 66.1 111.5 - 177.6 - - 177.6Extensions, discoveries and other additions 358.3 59.7 295.2 713.2 - - 713.2Sales in place (1.0) - - (1.0) - - (1.0)Production (252.5) (46.0) (42.0) (340.5) - - (340.5)
Net proved reserves at December 31, 2001 2,007.3 644.1 1,145.1)(5) 3,796.5 - - 3,796.5
Liquids (MBbl)Net proved reserves at December 31, 1998 36,827 7,592 16,204 60,623 42,785 1,162 104,570
Revisions of previous estimates 5,085 117 (72) 5,130 - - 5,130Purchases in place 2,753 39 - 2,792 - - 2,792Extensions, discoveries and other additions 9,520 2,416 509 12,445 - - 12,445Sales in place(1) (121) (37) - (158) (41,306) (1,162) (42,626)Production (6,217) (1,231) (878) (8,326) (1,479) - (9,805)
Net proved reserves at December 31, 1999 47,847 8,896 15,763 72,506 - - 72,506Revisions of previous estimates (1,951) 46 28 (1,877) - - (1,877)Purchases in place 3,948 - - 3,948 - - 3,948Extensions, discoveries and other additions 12,433 404 738 13,575 - - 13,575Sales in place (484) (2,474) - (2,958) - - (2,958)Production (9,780) (1,055) (957) (11,792) - - (11,792)
Net proved reserves at December 31, 2000 52,013 5,817 15,572 73,402 - - 73,402Revisions of previous estimates (3,111) 1,294 (3,691) (5,508) - - (5,508)Purchases in place 586 35 - 621 - - 621Extensions, discoveries and other additions 12,380 361 1,967 14,708 - - 14,708Sales in place (192) (35) - (227) - - (227)Production (9,293) (820) (749) (10,862) - - (10,862)
Net proved reserves at December 31, 2001 52,383 6,652 13,099)(5) 72,134 - - 72,134
40 EOG Resources, Inc.
No major discovery or other favorable or adverse eventsubsequent to December 31, 2001 is believed to have causeda material change in the estimates of proved or proved devel-oped reserves as of that date.
The following table sets forth EOG’s net proved andproved developed reserves at December 31 for each of the four
years in the period ended December 31, 2001, and the changesin the net proved reserves for each of the three years in the peri-od then ended as estimated by the engineering staff of EOG.
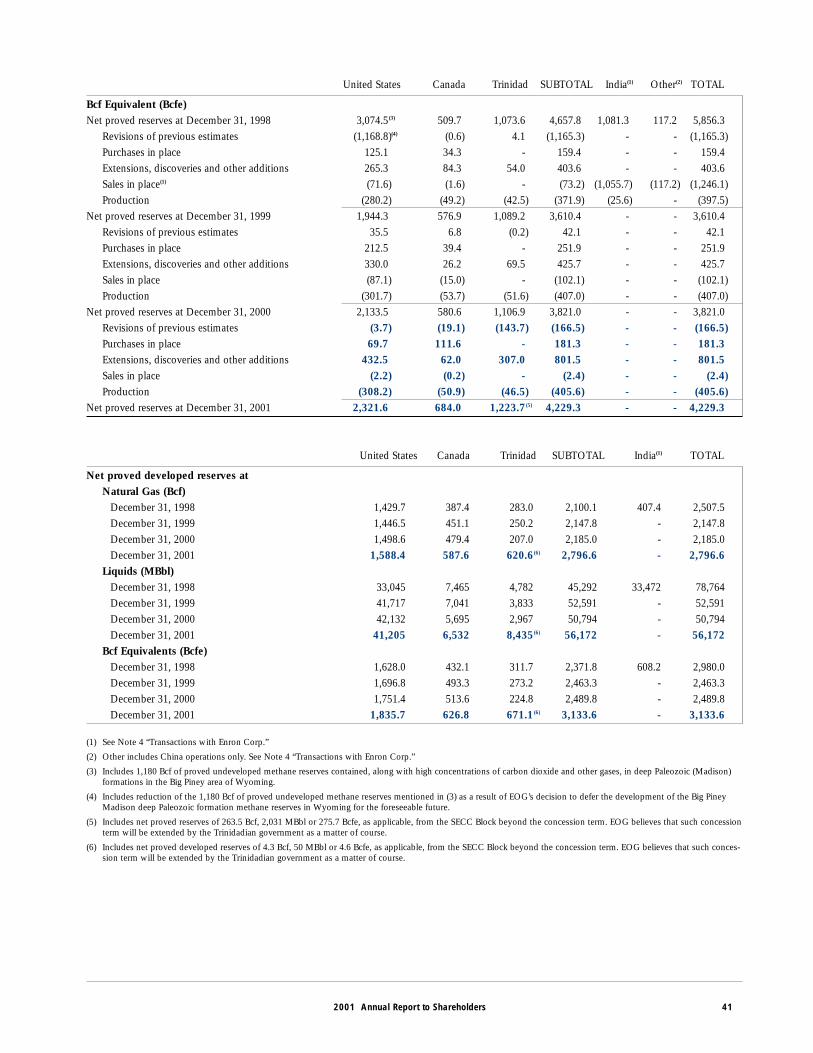
United States Canada Trinidad SUBTOTAL India(1) Other(2) TOTAL
Bcf Equivalent (Bcfe)Net proved reserves at December 31, 1998 3,074.5)
(3) 509.7 1,073.6 4,657.8 1,081.3 117.2 5,856.3Revisions of previous estimates (1,168.8)(4) (0.6) 4.1 (1,165.3) - - (1,165.3)Purchases in place 125.1 34.3 - 159.4 - - 159.4Extensions, discoveries and other additions 265.3 84.3 54.0 403.6 - - 403.6Sales in place(1) (71.6) (1.6) - (73.2) (1,055.7) (117.2) (1,246.1)Production (280.2) (49.2) (42.5) (371.9) (25.6) - (397.5)
Net proved reserves at December 31, 1999 1,944.3 576.9 1,089.2 3,610.4 - - 3,610.4Revisions of previous estimates 35.5 6.8 (0.2) 42.1 - - 42.1Purchases in place 212.5 39.4 - 251.9 - - 251.9Extensions, discoveries and other additions 330.0 26.2 69.5 425.7 - - 425.7Sales in place (87.1) (15.0) - (102.1) - - (102.1)Production (301.7) (53.7) (51.6) (407.0) - - (407.0)
Net proved reserves at December 31, 2000 2,133.5 580.6 1,106.9 3,821.0 - - 3,821.0Revisions of previous estimates (3.7) (19.1) (143.7) (166.5) - - (166.5)Purchases in place 69.7 111.6 - 181.3 - - 181.3Extensions, discoveries and other additions 432.5 62.0 307.0 801.5 - - 801.5Sales in place (2.2) (0.2) - (2.4) - - (2.4)Production (308.2) (50.9) (46.5) (405.6) - - (405.6)
Net proved reserves at December 31, 2001 2,321.6 684.0 1,223.7)(5) 4,229.3 - - 4,229.3
United States Canada Trinidad SUBTOTAL India(1) TOTAL
Net proved developed reserves atNatural Gas (Bcf)
December 31, 1998 1,429.7 387.4 283.0 2,100.1 407.4 2,507.5December 31, 1999 1,446.5 451.1 250.2 2,147.8 - 2,147.8December 31, 2000 1,498.6 479.4 207.0 2,185.0 - 2,185.0December 31, 2001 1,588.4 587.6 620.6)
(6) 2,796.6 - 2,796.6Liquids (MBbl)
December 31, 1998 33,045 7,465 4,782 45,292 33,472 78,764December 31, 1999 41,717 7,041 3,833 52,591 - 52,591December 31, 2000 42,132 5,695 2,967 50,794 - 50,794December 31, 2001 41,205 6,532 8,435)
(6) 56,172 - 56,172Bcf Equivalents (Bcfe)
December 31, 1998 1,628.0 432.1 311.7 2,371.8 608.2 2,980.0December 31, 1999 1,696.8 493.3 273.2 2,463.3 - 2,463.3December 31, 2000 1,751.4 513.6 224.8 2,489.8 - 2,489.8December 31, 2001 1,835.7 626.8 671.1)
(6) 3,133.6 - 3,133.6
(1) See Note 4 “Transactions with Enron Corp.”
(2) Other includes China operations only. See Note 4 “Transactions with Enron Corp.”
(3) Includes 1,180 Bcf of proved undeveloped methane reserves contained, along with high concentrations of carbon dioxide and other gases, in deep Paleozoic (Madison)formations in the Big Piney area of Wyoming.
(4) Includes reduction of the 1,180 Bcf of proved undeveloped methane reserves mentioned in (3) as a result of EOG’s decision to defer the development of the Big PineyMadison deep Paleozoic formation methane reserves in Wyoming for the foreseeable future.
(5) Includes net proved reserves of 263.5 Bcf, 2,031 MBbl or 275.7 Bcfe, as applicable, from the SECC Block beyond the concession term. EOG believes that such concessionterm will be extended by the Trinidadian government as a matter of course.
(6) Includes net proved developed reserves of 4.3 Bcf, 50 MBbl or 4.6 Bcfe, as applicable, from the SECC Block beyond the concession term. EOG believes that such conces-sion term will be extended by the Trinidadian government as a matter of course.
2001 Annual Report to Shareholders 41
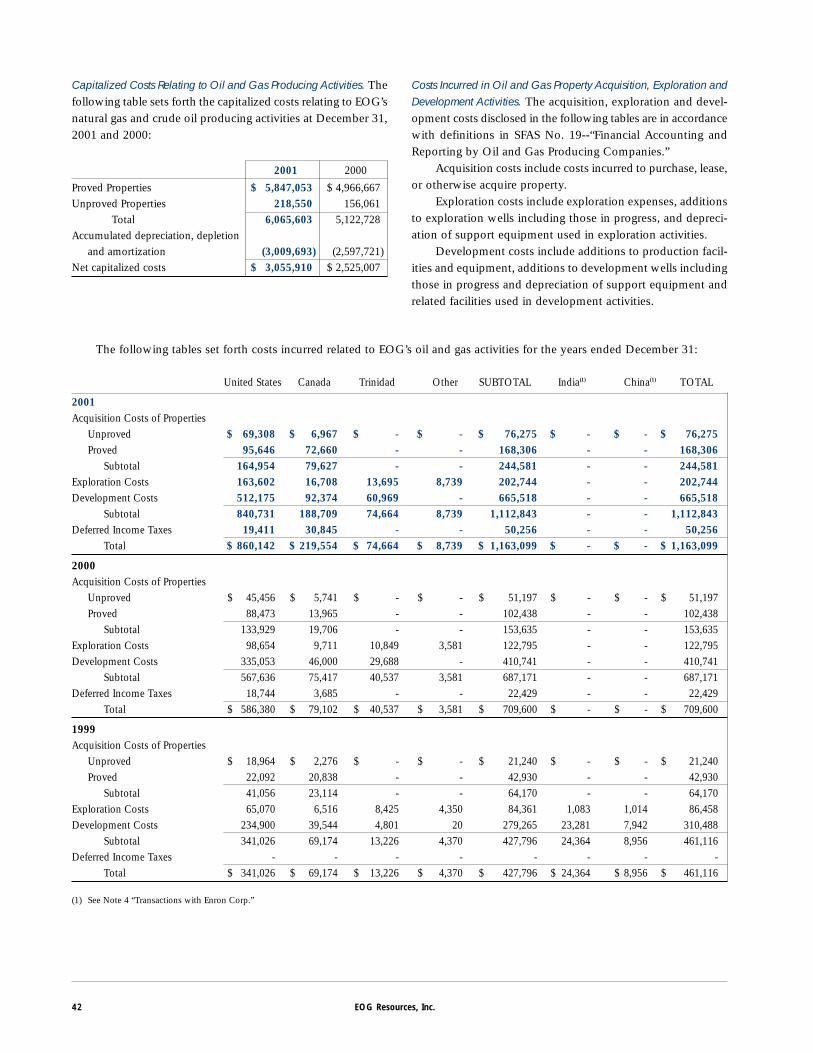
The following tables set forth costs incurred related to EOG’s oil and gas activities for the years ended December 31:
United States Canada Trinidad Other SUBTOTAL India(1) China(1) TOTAL
2001Acquisition Costs of Properties
Unproved $ 69,308 $ 6,967 $ - $ - $ 76,275 $ - $ - $ 76,275Proved 95,646 72,660 - - 168,306 - - 168,306
Subtotal 164,954 79,627 - - 244,581 - - 244,581Exploration Costs 163,602 16,708 13,695 8,739 202,744 - - 202,744Development Costs 512,175 92,374 60,969 - 665,518 - - 665,518
Subtotal 840,731 188,709 74,664 8,739 1,112,843 - - 1,112,843Deferred Income Taxes 19,411 30,845 - - 50,256 - - 50,256
Total $ 860,142 $ 219,554 $ 74,664 $ 8,739 $ 1,163,099 $ - $ - $ 1,163,099
2000Acquisition Costs of Properties
Unproved $ 45,456 $ 5,741 $ - $ - $ 51,197 $ - $ - $ 51,197Proved 88,473 13,965 - - 102,438 - - 102,438
Subtotal 133,929 19,706 - - 153,635 - - 153,635Exploration Costs 98,654 9,711 10,849 3,581 122,795 - - 122,795Development Costs 335,053 46,000 29,688 - 410,741 - - 410,741
Subtotal 567,636 75,417 40,537 3,581 687,171 - - 687,171Deferred Income Taxes 18,744 3,685 - - 22,429 - - 22,429
Total $ 586,380 $ 79,102 $ 40,537 $ 3,581 $ 709,600 $ - $ - $ 709,600
1999Acquisition Costs of Properties
Unproved $ 18,964 $ 2,276 $ - $ - $ 21,240 $ - $ - $ 21,240Proved 22,092 20,838 - - 42,930 - - 42,930
Subtotal 41,056 23,114 - - 64,170 - - 64,170Exploration Costs 65,070 6,516 8,425 4,350 84,361 1,083 1,014 86,458Development Costs 234,900 39,544 4,801 20 279,265 23,281 7,942 310,488
Subtotal 341,026 69,174 13,226 4,370 427,796 24,364 8,956 461,116Deferred Income Taxes - - - - - - - -
Total $ 341,026 $ 69,174 $ 13,226 $ 4,370 $ 427,796 $ 24,364 $ 8,956 $ 461,116
(1) See Note 4 “Transactions with Enron Corp.”
42 EOG Resources, Inc.
Capitalized Costs Relating to Oil and Gas Producing Activities. Thefollowing table sets forth the capitalized costs relating to EOG’snatural gas and crude oil producing activities at December 31,2001 and 2000:
2001 2000
Proved Properties $ 5,847,053 $ 4,966,667Unproved Properties 218,550 156,061
Total 6,065,603 5,122,728Accumulated depreciation, depletion
and amortization (3,009,693) (2,597,721)Net capitalized costs $ 3,055,910 $ 2,525,007
Costs Incurred in Oil and Gas Property Acquisition, Exploration andDevelopment Activities. The acquisition, exploration and devel-opment costs disclosed in the following tables are in accordancewith definitions in SFAS No. 19--“Financial Accounting andReporting by Oil and Gas Producing Companies.”
Acquisition costs include costs incurred to purchase, lease,or otherwise acquire property.
Exploration costs include exploration expenses, additionsto exploration wells including those in progress, and depreci-ation of support equipment used in exploration activities.
Development costs include additions to production facil-ities and equipment, additions to development wells includingthose in progress and depreciation of support equipment andrelated facilities used in development activities.
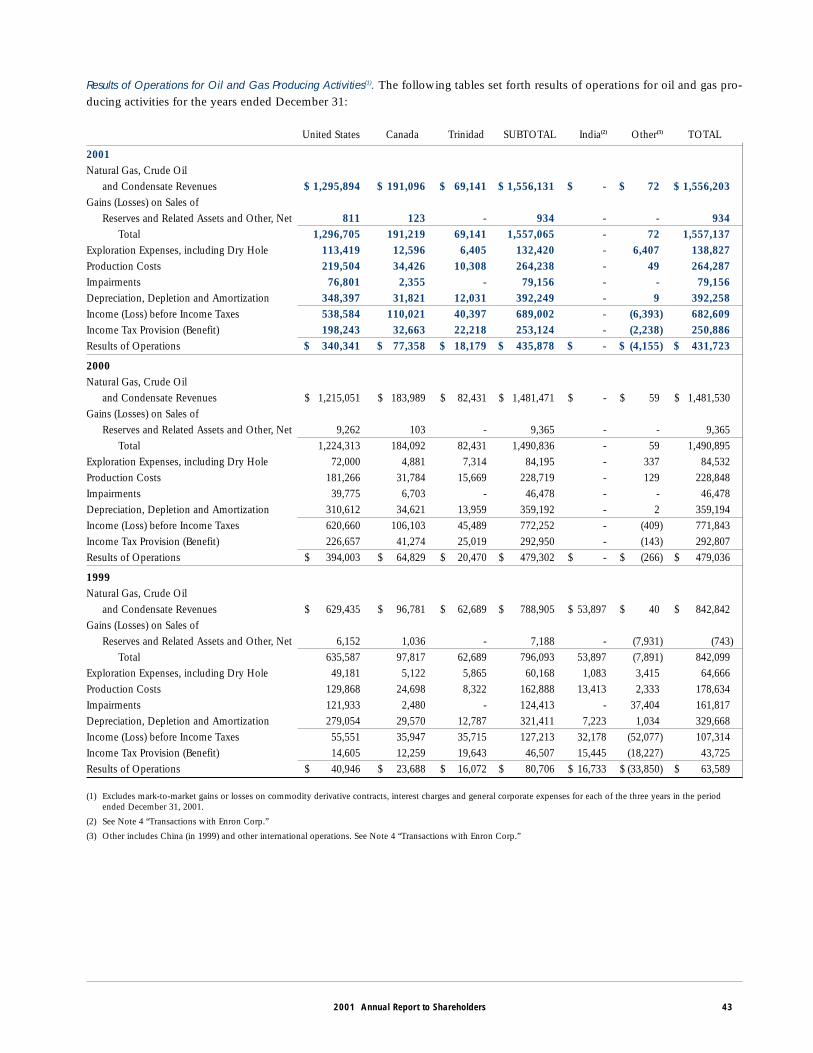
Results of Operations for Oil and Gas Producing Activities(1). The following tables set forth results of operations for oil and gas pro-ducing activities for the years ended December 31:
United States Canada Trinidad SUBTOTAL India(2) Other(3) TOTAL
2001Natural Gas, Crude Oil
and Condensate Revenues $ 1,295,894 $ 191,096 $ 69,141 $ 1,556,131 $ - $ 72 $ 1,556,203Gains (Losses) on Sales of
Reserves and Related Assets and Other, Net 811 123 - 934 - - 934Total 1,296,705 191,219 69,141 1,557,065 - 72 1,557,137
Exploration Expenses, including Dry Hole 113,419 12,596 6,405 132,420 - 6,407 138,827Production Costs 219,504 34,426 10,308 264,238 - 49 264,287Impairments 76,801 2,355 - 79,156 - - 79,156Depreciation, Depletion and Amortization 348,397 31,821 12,031 392,249 - 9 392,258Income (Loss) before Income Taxes 538,584 110,021 40,397 689,002 - (6,393) 682,609Income Tax Provision (Benefit) 198,243 32,663 22,218 253,124 - (2,238) 250,886Results of Operations $ 340,341 $ 77,358 $ 18,179 $ 435,878 $ - $ (4,155) $ 431,723
2000Natural Gas, Crude Oil
and Condensate Revenues $ 1,215,051 $ 183,989 $ 82,431 $ 1,481,471 $ - $ 59 $ 1,481,530Gains (Losses) on Sales of
Reserves and Related Assets and Other, Net 9,262 103 - 9,365 - - 9,365Total 1,224,313 184,092 82,431 1,490,836 - 59 1,490,895
Exploration Expenses, including Dry Hole 72,000 4,881 7,314 84,195 - 337 84,532Production Costs 181,266 31,784 15,669 228,719 - 129 228,848Impairments 39,775 6,703 - 46,478 - - 46,478Depreciation, Depletion and Amortization 310,612 34,621 13,959 359,192 - 2 359,194Income (Loss) before Income Taxes 620,660 106,103 45,489 772,252 - (409) 771,843Income Tax Provision (Benefit) 226,657 41,274 25,019 292,950 - (143) 292,807Results of Operations $ 394,003 $ 64,829 $ 20,470 $ 479,302 $ - $ (266) $ 479,036
1999Natural Gas, Crude Oil
and Condensate Revenues $ 629,435 $ 96,781 $ 62,689 $ 788,905 $ 53,897 $ 40 $ 842,842Gains (Losses) on Sales of
Reserves and Related Assets and Other, Net 6,152 1,036 - 7,188 - (7,931) (743)Total 635,587 97,817 62,689 796,093 53,897 (7,891) 842,099
Exploration Expenses, including Dry Hole 49,181 5,122 5,865 60,168 1,083 3,415 64,666Production Costs 129,868 24,698 8,322 162,888 13,413 2,333 178,634Impairments 121,933 2,480 - 124,413 - 37,404 161,817Depreciation, Depletion and Amortization 279,054 29,570 12,787 321,411 7,223 1,034 329,668Income (Loss) before Income Taxes 55,551 35,947 35,715 127,213 32,178 (52,077) 107,314Income Tax Provision (Benefit) 14,605 12,259 19,643 46,507 15,445 (18,227) 43,725Results of Operations $ 40,946 $ 23,688 $ 16,072 $ 80,706 $ 16,733 $ (33,850) $ 63,589
(1) Excludes mark-to-market gains or losses on commodity derivative contracts, interest charges and general corporate expenses for each of the three years in the periodended December 31, 2001.
(2) See Note 4 “Transactions with Enron Corp.”
(3) Other includes China (in 1999) and other international operations. See Note 4 “Transactions with Enron Corp.”
2001 Annual Report to Shareholders 43
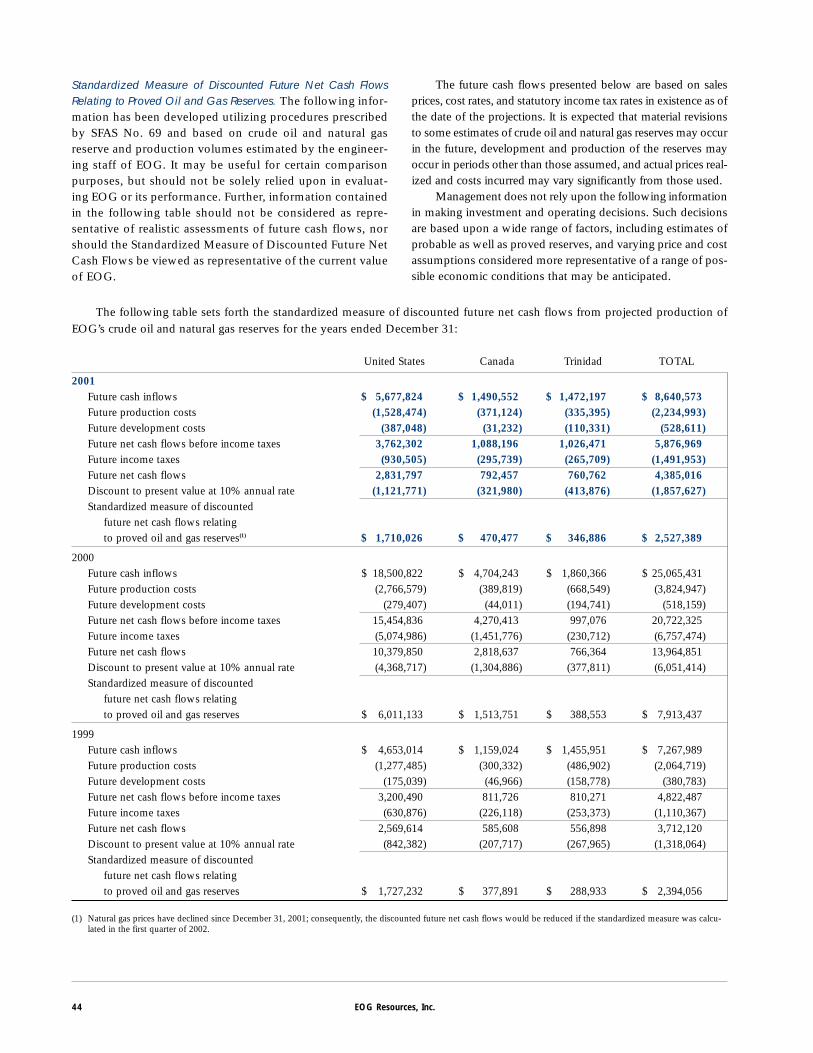
The following table sets forth the standardized measure of discounted future net cash flows from projected production ofEOG’s crude oil and natural gas reserves for the years ended December 31:
United States Canada Trinidad TOTAL
2001Future cash inflows $ 5,677,824 $ 1,490,552 $ 1,472,197 $ 8,640,573Future production costs (1,528,474) (371,124) (335,395) (2,234,993)Future development costs (387,048) (31,232) (110,331) (528,611)Future net cash flows before income taxes 3,762,302 1,088,196 1,026,471 5,876,969Future income taxes (930,505) (295,739) (265,709) (1,491,953)Future net cash flows 2,831,797 792,457 760,762 4,385,016Discount to present value at 10% annual rate (1,121,771) (321,980) (413,876) (1,857,627)Standardized measure of discounted
future net cash flows relatingto proved oil and gas reserves(1) $ 1,710,026 $ 470,477 $ 346,886 $ 2,527,389
2000Future cash inflows $ 18,500,822 $ 4,704,243 $ 1,860,366 $ 25,065,431Future production costs (2,766,579) (389,819) (668,549) (3,824,947)Future development costs (279,407) (44,011) (194,741) (518,159)Future net cash flows before income taxes 15,454,836 4,270,413 997,076 20,722,325Future income taxes (5,074,986) (1,451,776) (230,712) (6,757,474)Future net cash flows 10,379,850 2,818,637 766,364 13,964,851Discount to present value at 10% annual rate (4,368,717) (1,304,886) (377,811) (6,051,414)Standardized measure of discounted
future net cash flows relatingto proved oil and gas reserves $ 6,011,133 $ 1,513,751 $ 388,553 $ 7,913,437
1999Future cash inflows $ 4,653,014 $ 1,159,024 $ 1,455,951 $ 7,267,989Future production costs (1,277,485) (300,332) (486,902) (2,064,719)Future development costs (175,039) (46,966) (158,778) (380,783)Future net cash flows before income taxes 3,200,490 811,726 810,271 4,822,487Future income taxes (630,876) (226,118) (253,373) (1,110,367)Future net cash flows 2,569,614 585,608 556,898 3,712,120Discount to present value at 10% annual rate (842,382) (207,717) (267,965) (1,318,064)Standardized measure of discounted
future net cash flows relatingto proved oil and gas reserves $ 1,727,232 $ 377,891 $ 288,933 $ 2,394,056
(1) Natural gas prices have declined since December 31, 2001; consequently, the discounted future net cash flows would be reduced if the standardized measure was calcu-lated in the first quarter of 2002.
44 EOG Resources, Inc.
Standardized Measure of Discounted Future Net Cash FlowsRelating to Proved Oil and Gas Reserves. The following infor-mation has been developed utilizing procedures prescribedby SFAS No. 69 and based on crude oil and natural gasreserve and production volumes estimated by the engineer-ing staff of EOG. It may be useful for certain comparisonpurposes, but should not be solely relied upon in evaluat-ing EOG or its performance. Further, information containedin the following table should not be considered as repre-sentative of realistic assessments of future cash flows, norshould the Standardized Measure of Discounted Future NetCash Flows be viewed as representative of the current valueof EOG.
The future cash flows presented below are based on salesprices, cost rates, and statutory income tax rates in existence as ofthe date of the projections. It is expected that material revisionsto some estimates of crude oil and natural gas reserves may occurin the future, development and production of the reserves mayoccur in periods other than those assumed, and actual prices real-ized and costs incurred may vary significantly from those used.
Management does not rely upon the following informationin making investment and operating decisions. Such decisionsare based upon a wide range of factors, including estimates ofprobable as well as proved reserves, and varying price and costassumptions considered more representative of a range of pos-sible economic conditions that may be anticipated.
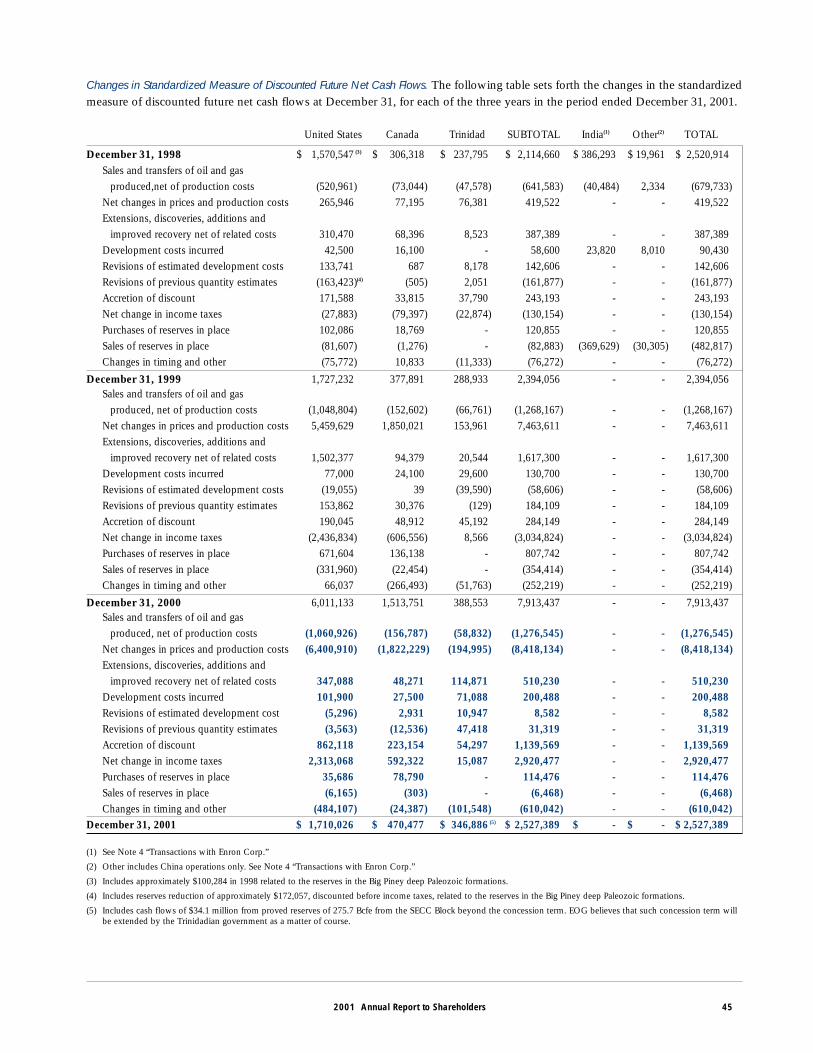
Changes in Standardized Measure of Discounted Future Net Cash Flows. The following table sets forth the changes in the standardizedmeasure of discounted future net cash flows at December 31, for each of the three years in the period ended December 31, 2001.
United States Canada Trinidad SUBTOTAL India(1) Other(2) TOTAL
December 31, 1998 $ 1,570,547)(3) $ 306,318 $ 237,795 $ 2,114,660 $ 386,293 $ 19,961 $ 2,520,914Sales and transfers of oil and gas
produced,net of production costs (520,961) (73,044) (47,578) (641,583) (40,484) 2,334 (679,733)Net changes in prices and production costs 265,946 77,195 76,381 419,522 - - 419,522Extensions, discoveries, additions and
improved recovery net of related costs 310,470 68,396 8,523 387,389 - - 387,389Development costs incurred 42,500 16,100 - 58,600 23,820 8,010 90,430Revisions of estimated development costs 133,741 687 8,178 142,606 - - 142,606Revisions of previous quantity estimates (163,423)(4) (505) 2,051 (161,877) - - (161,877)Accretion of discount 171,588 33,815 37,790 243,193 - - 243,193Net change in income taxes (27,883) (79,397) (22,874) (130,154) - - (130,154)Purchases of reserves in place 102,086 18,769 - 120,855 - - 120,855Sales of reserves in place (81,607) (1,276) - (82,883) (369,629) (30,305) (482,817)Changes in timing and other (75,772) 10,833 (11,333) (76,272) - - (76,272)
December 31, 1999 1,727,232 377,891 288,933 2,394,056 - - 2,394,056Sales and transfers of oil and gas
produced, net of production costs (1,048,804) (152,602) (66,761) (1,268,167) - - (1,268,167)Net changes in prices and production costs 5,459,629 1,850,021 153,961 7,463,611 - - 7,463,611Extensions, discoveries, additions and
improved recovery net of related costs 1,502,377 94,379 20,544 1,617,300 - - 1,617,300Development costs incurred 77,000 24,100 29,600 130,700 - - 130,700Revisions of estimated development costs (19,055) 39 (39,590) (58,606) - - (58,606)Revisions of previous quantity estimates 153,862 30,376 (129) 184,109 - - 184,109Accretion of discount 190,045 48,912 45,192 284,149 - - 284,149Net change in income taxes (2,436,834) (606,556) 8,566 (3,034,824) - - (3,034,824)Purchases of reserves in place 671,604 136,138 - 807,742 - - 807,742Sales of reserves in place (331,960) (22,454) - (354,414) - - (354,414)Changes in timing and other 66,037 (266,493) (51,763) (252,219) - - (252,219)
December 31, 2000 6,011,133 1,513,751 388,553 7,913,437 - - 7,913,437Sales and transfers of oil and gas
produced, net of production costs (1,060,926) (156,787) (58,832) (1,276,545) - - (1,276,545)Net changes in prices and production costs (6,400,910) (1,822,229) (194,995) (8,418,134) - - (8,418,134)Extensions, discoveries, additions and
improved recovery net of related costs 347,088 48,271 114,871 510,230 - - 510,230Development costs incurred 101,900 27,500 71,088 200,488 - - 200,488Revisions of estimated development cost (5,296) 2,931 10,947 8,582 - - 8,582Revisions of previous quantity estimates (3,563) (12,536) 47,418 31,319 - - 31,319Accretion of discount 862,118 223,154 54,297 1,139,569 - - 1,139,569Net change in income taxes 2,313,068 592,322 15,087 2,920,477 - - 2,920,477Purchases of reserves in place 35,686 78,790 - 114,476 - - 114,476Sales of reserves in place (6,165) (303) - (6,468) - - (6,468)Changes in timing and other (484,107) (24,387) (101,548) (610,042) - - (610,042)
December 31, 2001 $ 1,710,026 $ 470,477 $ 346,886)(5) $ 2,527,389 $ - $ - $ 2,527,389
(1) See Note 4 “Transactions with Enron Corp.”
(2) Other includes China operations only. See Note 4 “Transactions with Enron Corp.”
(3) Includes approximately $100,284 in 1998 related to the reserves in the Big Piney deep Paleozoic formations.
(4) Includes reserves reduction of approximately $172,057, discounted before income taxes, related to the reserves in the Big Piney deep Paleozoic formations.
(5) Includes cash flows of $34.1 million from proved reserves of 275.7 Bcfe from the SECC Block beyond the concession term. EOG believes that such concession term willbe extended by the Trinidadian government as a matter of course.
2001 Annual Report to Shareholders 45
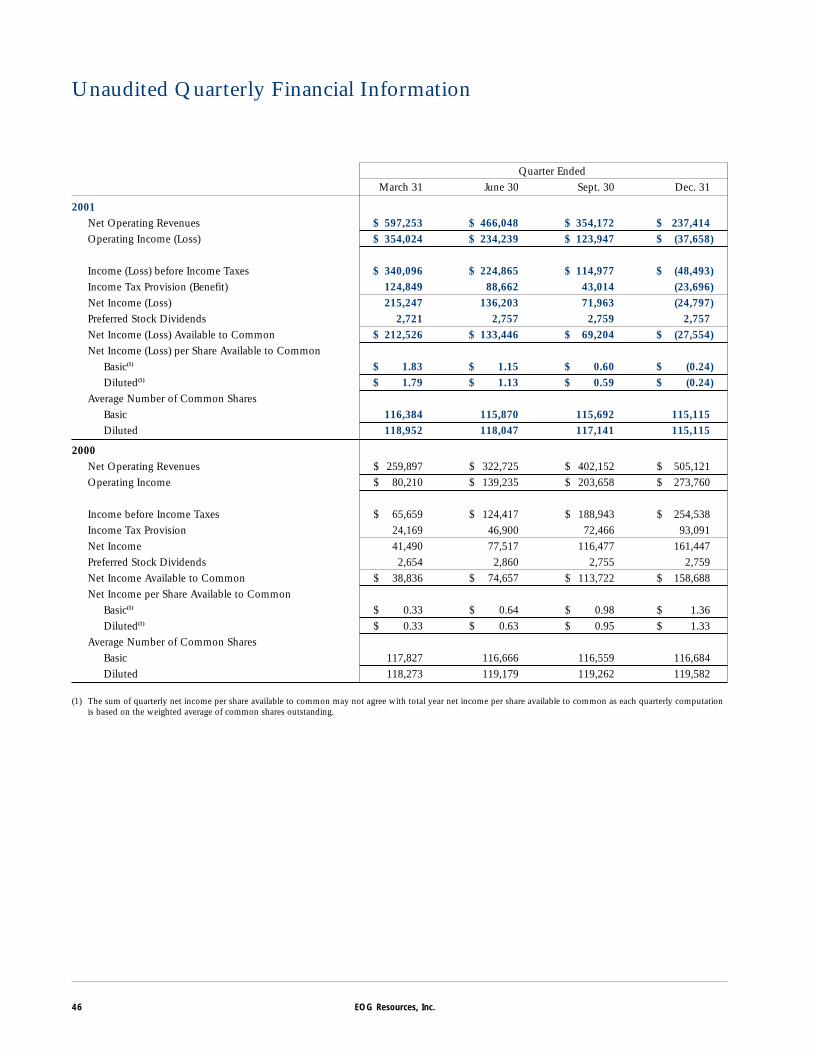
Unaudited Quarterly Financial Information
Quarter EndedMarch 31 June 30 Sept. 30 Dec. 31
2001Net Operating Revenues $ 597,253 $ 466,048 $ 354,172 $ 237,414Operating Income (Loss) $ 354,024 $ 234,239 $ 123,947 $ (37,658)
Income (Loss) before Income Taxes $ 340,096 $ 224,865 $ 114,977 $ (48,493)Income Tax Provision (Benefit) 124,849 88,662 43,014 (23,696)Net Income (Loss) 215,247 136,203 71,963 (24,797)Preferred Stock Dividends 2,721 2,757 2,759 2,757Net Income (Loss) Available to Common $ 212,526 $ 133,446 $ 69,204 $ (27,554)Net Income (Loss) per Share Available to Common
Basic(1) $ 1.83 $ 1.15 $ 0.60 $ (0.24)Diluted(1) $ 1.79 $ 1.13 $ 0.59 $ (0.24)
Average Number of Common SharesBasic 116,384 115,870 115,692 115,115Diluted 118,952 118,047 117,141 115,115
2000Net Operating Revenues $ 259,897 $ 322,725 $ 402,152 $ 505,121Operating Income $ 80,210 $ 139,235 $ 203,658 $ 273,760
Income before Income Taxes $ 65,659 $ 124,417 $ 188,943 $ 254,538Income Tax Provision 24,169 46,900 72,466 93,091Net Income 41,490 77,517 116,477 161,447Preferred Stock Dividends 2,654 2,860 2,755 2,759Net Income Available to Common $ 38,836 $ 74,657 $ 113,722 $ 158,688Net Income per Share Available to Common
Basic(1) $ 0.33 $ 0.64 $ 0.98 $ 1.36Diluted(1) $ 0.33 $ 0.63 $ 0.95 $ 1.33
Average Number of Common SharesBasic 117,827 116,666 116,559 116,684Diluted 118,273 119,179 119,262 119,582
(1) The sum of quarterly net income per share available to common may not agree with total year net income per share available to common as each quarterly computationis based on the weighted average of common shares outstanding.
46 EOG Resources, Inc.
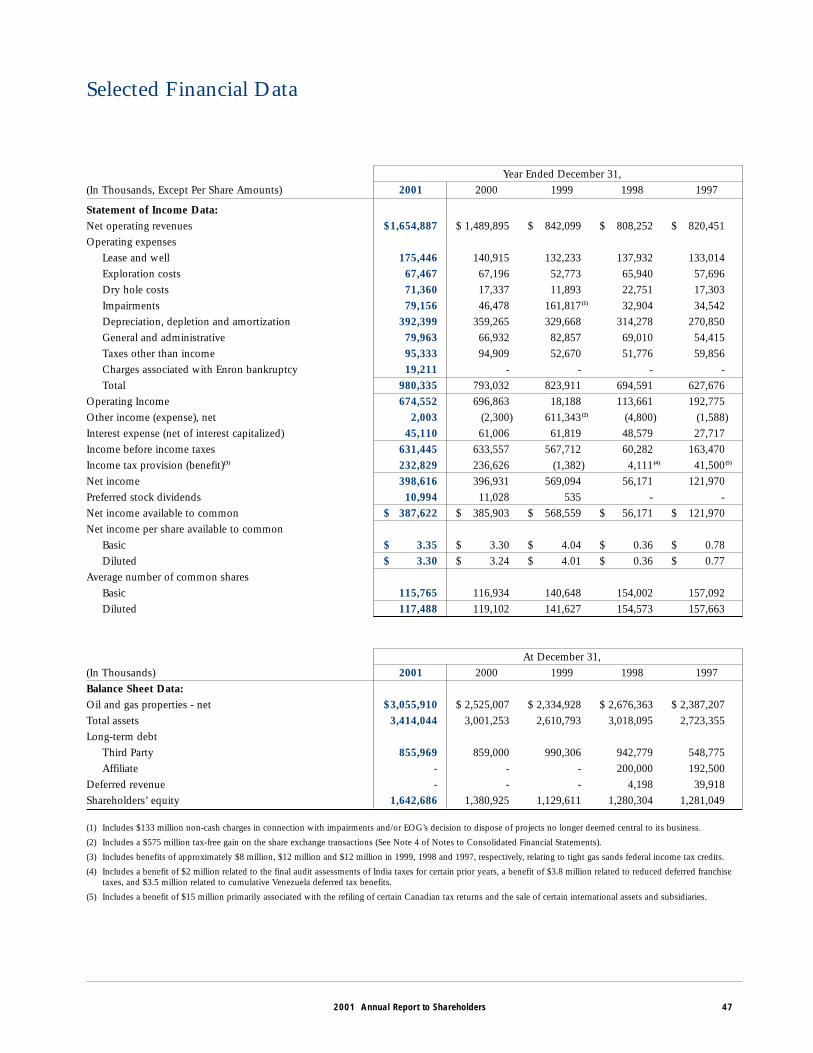
2001 Annual Report to Shareholders 47
Selected Financial Data
Year Ended December 31,(In Thousands, Except Per Share Amounts) 2001 2000 1999 1998 1997
Statement of Income Data:Net operating revenues $1,654,887 $ 1,489,895 $ 842,099 $ 808,252 $ 820,451Operating expenses
Lease and well 175,446 140,915 132,233 137,932 133,014Exploration costs 67,467 67,196 52,773 65,940 57,696Dry hole costs 71,360 17,337 11,893 22,751 17,303Impairments 79,156 46,478 161,817)
(1) 32,904 34,542Depreciation, depletion and amortization 392,399 359,265 329,668 314,278 270,850General and administrative 79,963 66,932 82,857 69,010 54,415Taxes other than income 95,333 94,909 52,670 51,776 59,856Charges associated with Enron bankruptcy 19,211 - - - -Total 980,335 793,032 823,911 694,591 627,676
Operating Income 674,552 696,863 18,188 113,661 192,775Other income (expense), net 2,003 (2,300) 611,343)
(2) (4,800) (1,588)Interest expense (net of interest capitalized) 45,110 61,006 61,819 48,579 27,717Income before income taxes 631,445 633,557 567,712 60,282 163,470Income tax provision (benefit)(3) 232,829 236,626 (1,382) 4,111)
(4) 41,500)(5)
Net income 398,616 396,931 569,094 56,171 121,970Preferred stock dividends 10,994 11,028 535 - -Net income available to common $ 387,622 $ 385,903 $ 568,559 $ 56,171 $ 121,970Net income per share available to common
Basic $ 3.35 $ 3.30 $ 4.04 $ 0.36 $ 0.78Diluted $ 3.30 $ 3.24 $ 4.01 $ 0.36 $ 0.77
Average number of common sharesBasic 115,765 116,934 140,648 154,002 157,092Diluted 117,488 119,102 141,627 154,573 157,663
At December 31,(In Thousands) 2001 2000 1999 1998 1997Balance Sheet Data:Oil and gas properties - net $3,055,910 $ 2,525,007 $ 2,334,928 $ 2,676,363 $ 2,387,207Total assets 3,414,044 3,001,253 2,610,793 3,018,095 2,723,355Long-term debt
Third Party 855,969 859,000 990,306 942,779 548,775Affiliate - - - 200,000 192,500
Deferred revenue - - - 4,198 39,918Shareholders’ equity 1,642,686 1,380,925 1,129,611 1,280,304 1,281,049
(1) Includes $133 million non-cash charges in connection with impairments and/or EOG’s decision to dispose of projects no longer deemed central to its business.
(2) Includes a $575 million tax-free gain on the share exchange transactions (See Note 4 of Notes to Consolidated Financial Statements).
(3) Includes benefits of approximately $8 million, $12 million and $12 million in 1999, 1998 and 1997, respectively, relating to tight gas sands federal income tax credits.
(4) Includes a benefit of $2 million related to the final audit assessments of India taxes for certain prior years, a benefit of $3.8 million related to reduced deferred franchisetaxes, and $3.5 million related to cumulative Venezuela deferred tax benefits.
(5) Includes a benefit of $15 million primarily associated with the refiling of certain Canadian tax returns and the sale of certain international assets and subsidiaries.
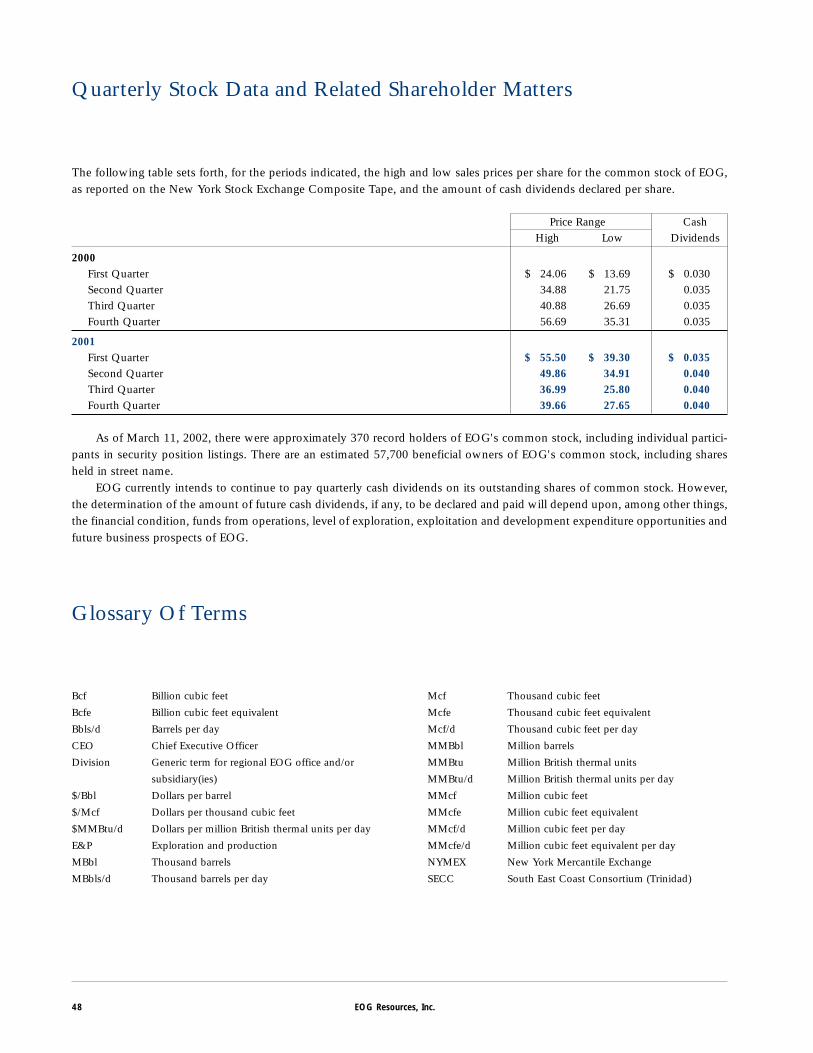
48 EOG Resources, Inc.
Quarterly Stock Data and Related Shareholder Matters
The following table sets forth, for the periods indicated, the high and low sales prices per share for the common stock of EOG,as reported on the New York Stock Exchange Composite Tape, and the amount of cash dividends declared per share.
Price Range CashHigh Low Dividends
2000First Quarter $ 24.06 $ 13.69 $ 0.030Second Quarter 34.88 21.75 0.035Third Quarter 40.88 26.69 0.035Fourth Quarter 56.69 35.31 0.035
2001First Quarter $ 55.50 $ 39.30 $ 0.035Second Quarter 49.86 34.91 0.040Third Quarter 36.99 25.80 0.040Fourth Quarter 39.66 27.65 0.040
As of March 11, 2002, there were approximately 370 record holders of EOG's common stock, including individual partici-pants in security position listings. There are an estimated 57,700 beneficial owners of EOG's common stock, including sharesheld in street name.
EOG currently intends to continue to pay quarterly cash dividends on its outstanding shares of common stock. However,the determination of the amount of future cash dividends, if any, to be declared and paid will depend upon, among other things,the financial condition, funds from operations, level of exploration, exploitation and development expenditure opportunities andfuture business prospects of EOG.
Glossary Of Terms
Bcf Billion cubic feet
Bcfe Billion cubic feet equivalent
Bbls/d Barrels per day
CEO Chief Executive Officer
Division Generic term for regional EOG office and/or
subsidiary(ies)
$/Bbl Dollars per barrel
$/Mcf Dollars per thousand cubic feet
$MMBtu/d Dollars per million British thermal units per day
E&P Exploration and production
MBbl Thousand barrels
MBbls/d Thousand barrels per day
Mcf Thousand cubic feet
Mcfe Thousand cubic feet equivalent
Mcf/d Thousand cubic feet per day
MMBbl Million barrels
MMBtu Million British thermal units
MMBtu/d Million British thermal units per day
MMcf Million cubic feet
MMcfe Million cubic feet equivalent
MMcf/d Million cubic feet per day
MMcfe/d Million cubic feet equivalent per day
NYMEX New York Mercantile Exchange
SECC South East Coast Consortium (Trinidad)
2001 Annual Report to Shareholders 49
Directors
George A. Alcorn(1)
Houston, TexasPresident, Alcorn Exploration, Inc.
Mark G. PapaChairman and CEOEOG Resources, Inc.
Edward Randall, III(2)
Houston, TexasInvestments
Edmund P. Segner, IIIPresident and Chief of StaffEOG Resources, Inc.
Donald F. Textor(3)
Locust Valley, New YorkFormer Partner/Managing DirectorGoldman Sachs
Frank G. Wisner(4)
New York, New YorkVice ChairmanAmerican International Group, Inc. andformer Ambassador to India, Philippines,Egypt and Zambia
Executive Committee
Mark G. PapaChairman and CEO
Edmund P. Segner, IIIPresident and Chief of Staff
Loren M. LeikerExecutive Vice President,Exploration and Development
Gary L. ThomasExecutive Vice President,North America Operations
Barry Hunsaker, Jr.Senior Vice President and GeneralCounsel
Sandeep BhakhriVice President and Chief InformationOfficer
Officers (including key subsidiaries)
Lewis Chandler, Jr.Senior Vice President, Law
Lawrence E. FenwickSenior Vice President and GeneralManager, EOG Resources Canada Inc.
William R. ThomasSenior Vice President and GeneralManager, Midland, Texas
William E. AlbrechtVice President, Acquisitions andEngineering
Maire A. BaldwinVice President, Investor Relations
Ben B. BoydVice President, Finance and Accounting,EOG Resources International, Inc.
James R. BreimayerVice President and General Manager,Tyler Division
Steven B. ColemanVice President and General Manager,Oklahoma City Division
Gerald R. ColleyVice President and General Manager,International DivisionPresident, EOG Resources International,Inc.
Phil C. DeLozierVice President, Business Development
Kurt DoerrVice President and General Manager,Denver Division
Timothy K. DriggersVice President, Accounting and LandAdministration
Patricia L. Edwards Vice President, Human Resources,Administration and Corporate Secretary
Robert K. GarrisonVice President and General Manager,Corpus Christi Division
Kevin S. HanzelVice President, Audit
Andrew N. HoyleVice President, Marketing and RegulatoryAffairs
Lindell L. LoogerVice President and General Manager,EOG Resources Trinidad Ltd.
David R. LooneyVice President, Finance
Richard A. OttVice President, Tax
Earl J. Ritchie, Jr.Vice President and General Manager,Offshore Division
Gary L. SmithVice President and General Manager,Pittsburgh Division
Ann D. JanssenTreasurer
(1) Chairman, Nominating Committee; Member,Audit, Compensation and InternationalStrategy Committees
(2) Chairman, Compensation Committee;Member, Audit, International Strategy andNominating Committees
(3) Chairman, Audit Committee; Member,Compensation, International Strategy andNominating Committees
(4) Chairman, International Strategy Committee;Member, Audit, Compensation andNominating Committees
Officers and Directors
50 EOG Resources, Inc.
Shareholder Information
Corporate Headquarters333 Clay Street, Suite 4200Houston, Texas 77002P.O. Box 4362Houston, Texas 77210-4362(713) 651-7000 Toll Free: (877) 363-EOGR www.eogresources.com
Common Stock Exchange Listing:New York Stock Exchange Ticker Symbol: EOG Common Stock Outstanding at
December 31, 2001: 115,451,618
Principal Transfer AgentEquiServe Trust Company, N.A.P.O. Box 2500 Jersey City, New Jersey 07303-2500 Toll Free: (800) 519-3111 Outside U.S.: (201) 324-1225 www.equiserve.com Hearing Impaired: TDD (201) 222-4955
Additional InformationThe Annual Meeting of Shareholders will be held at 2 p.m. CDT inthe La Salle “A” Room of the Doubletree Hotel, 400 Dallas Street,Houston, Texas 77002 on Tuesday, May 7, 2002. Information withrespect to this meeting is contained in the Proxy Statement sent withthis Annual Report to holders of record of EOG Resources, Inc.Common Stock. The Annual Report is not to be considered a part ofthe proxy soliciting material.
Additional copies of the Annual Report and the Form 10-K areavailable upon request by calling (877) 363-EOGR or through theEOG Resources website at www.eogresources.com. Quarterlyearnings press release information and SEC filings also can beaccessed through the website.
Financial analysts and investors who need additional informationshould visit the EOG website, www.eogresources.com, or contactInvestor Relations at (713) 651-7000.

333 Clay Street, Suite 4200
Houston, Texas 77002
P.O. Box 4362
Houston, Texas 77210–4362
(713) 651-7000
www.eogresources.com