Embed Size (px)
Citation preview
EO data to support the optimal
management of irrigation water in
western Morocco:
Potential of sentinel-2 type observation
Kamal LABBASSI
Chouaib Doukkali University
Morocco
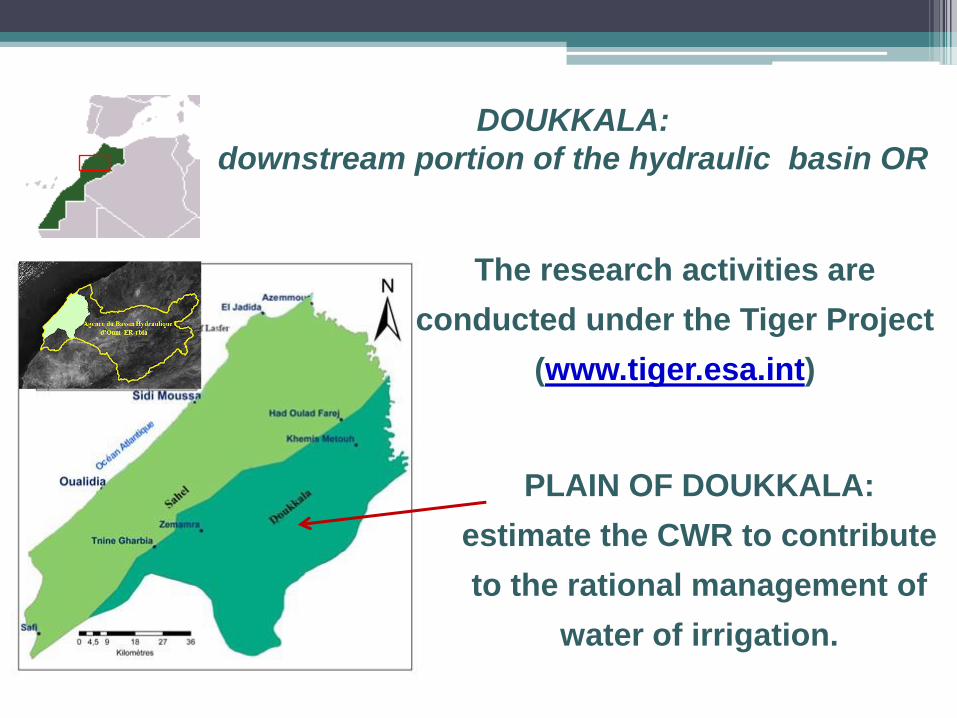
DOUKKALA:
downstream portion of the hydraulic basin OR
The research activities are
conducted under the Tiger Project
(www.tiger.esa.int)
PLAIN OF DOUKKALA:
estimate the CWR to contribute
to the rational management of
water of irrigation.
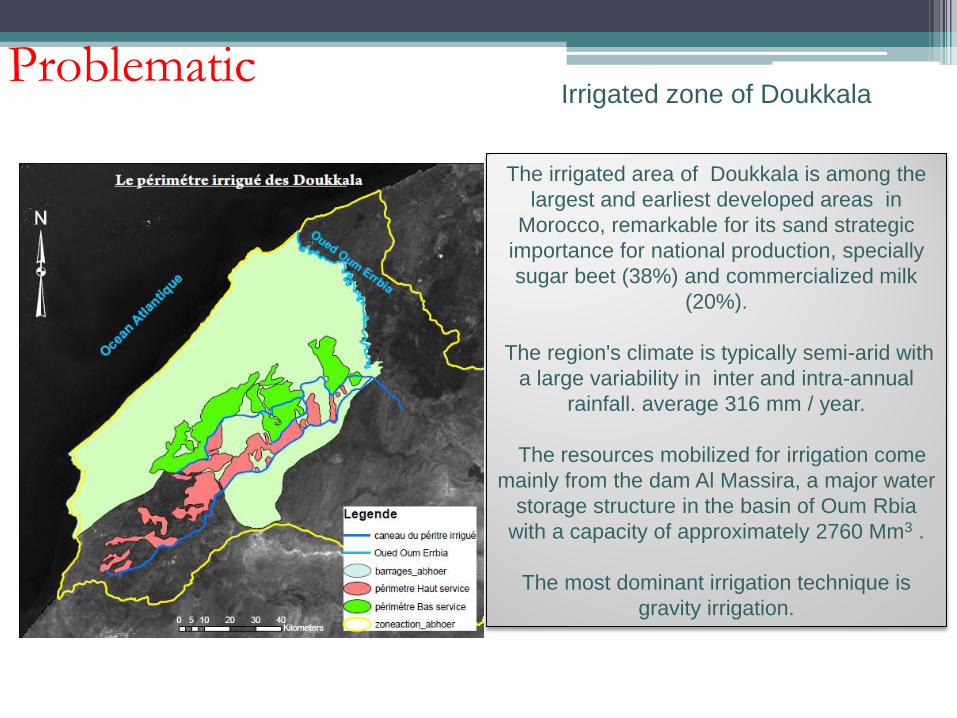
The irrigated area of Doukkala is among the
largest and earliest developed areas in
Morocco, remarkable for its sand strategic
importance for national production, specially
sugar beet (38%) and commercialized milk
(20%).
The region's climate is typically semi-arid with
a large variability in inter and intra-annual
rainfall. average 316 mm / year.
The resources mobilized for irrigation come
mainly from the dam Al Massira, a major water
storage structure in the basin of Oum Rbia
with a capacity of approximately 2760 Mm3 .
The most dominant irrigation technique is
gravity irrigation.
Problematic Irrigated zone of Doukkala
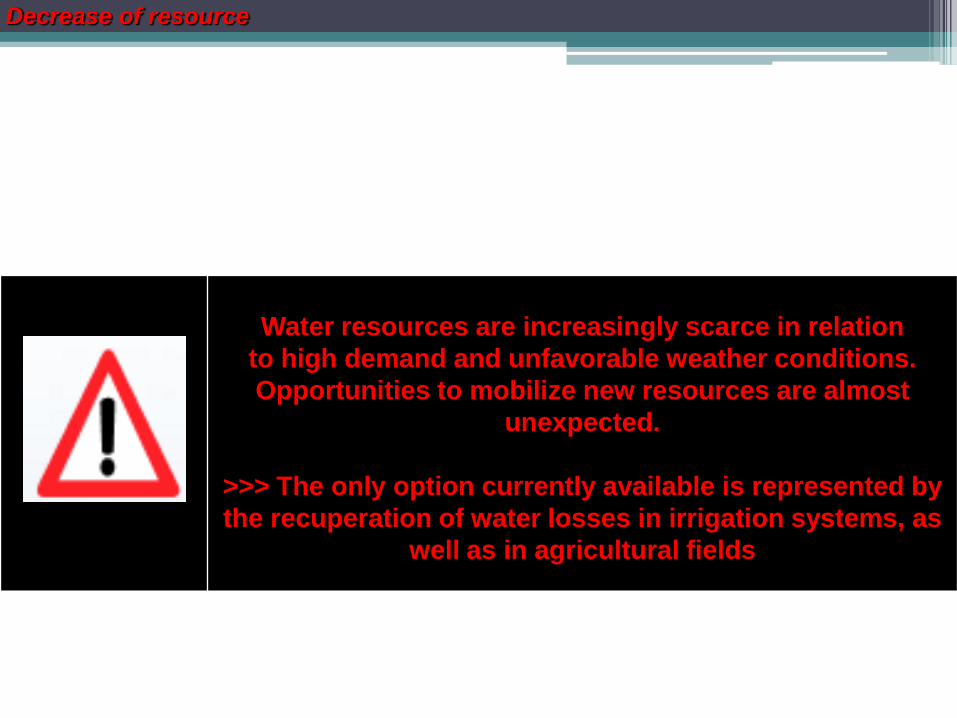
Decrease of resource
Decrease of groundwater resources by 50% during the last 25 years.
Water resources are increasingly scarce in relation
to high demand and unfavorable weather conditions.
Opportunities to mobilize new resources are almost
unexpected.
>>> The only option currently available is represented by
the recuperation of water losses in irrigation systems, as
well as in agricultural fields
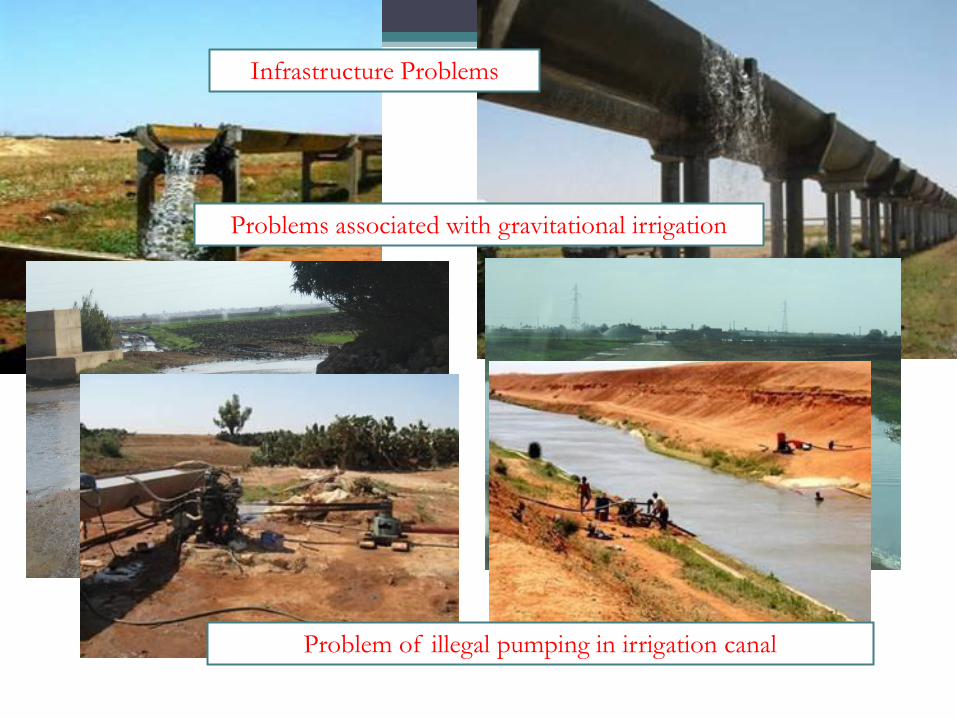
Infrastructure Problems
Problems associated with gravitational irrigation
Problem of illegal pumping in irrigation canal
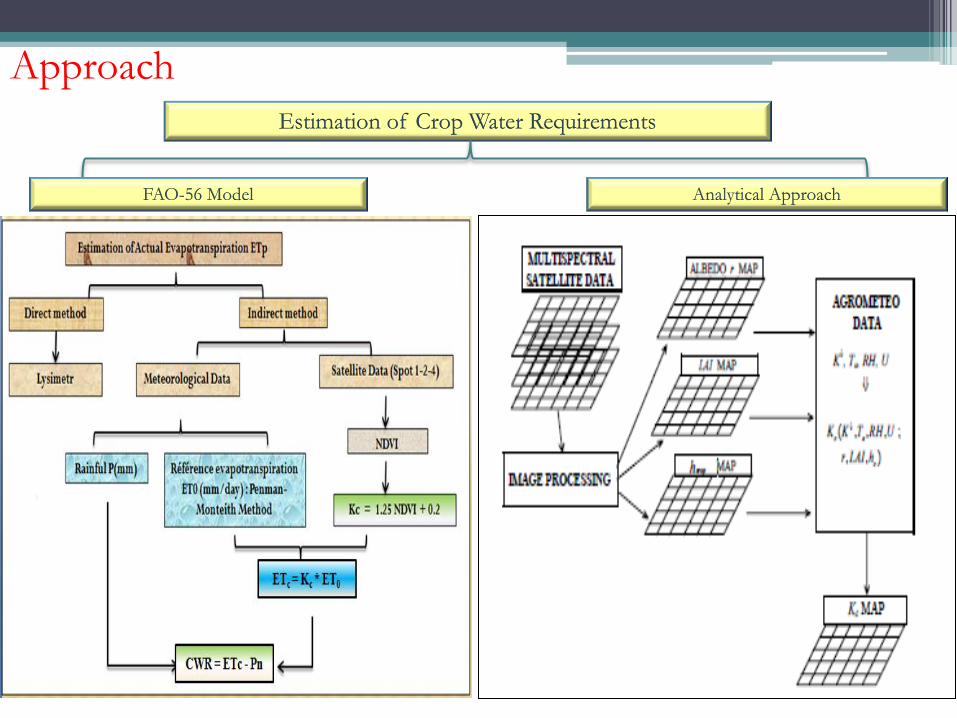
Approach
Estimation of Crop Water Requirements
FAO-56 Model Analytical Approach
Combination of:
- Satellite images
- Meteorological data
(Rainfall, Temperature, Humidity, Wind and Global Radiation)
- Agronomical data
(Calender of crops, irrigated areas, and water allocations).
Means Used
CDA _zone irrigué de Doukkala (Mosaic Spot _ Nov_2008)
Fr
SB Zr
TG
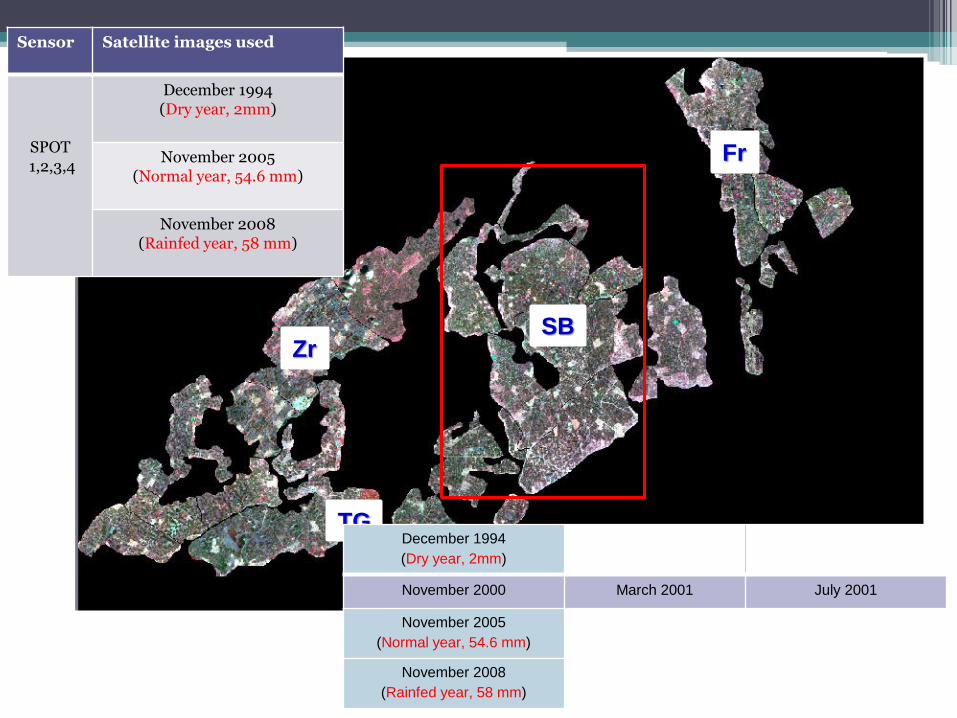
Sensor
Satellite images used
SPOT 1,2,3,4
December 1994 (Dry year, 2mm)
November 2005 (Normal year, 54.6 mm)
November 2008 (Rainfed year, 58 mm)
December 1994
(Dry year, 2mm)
November 2000 March 2001 July 2001
November 2005
(Normal year, 54.6 mm)
November 2008
(Rainfed year, 58 mm)
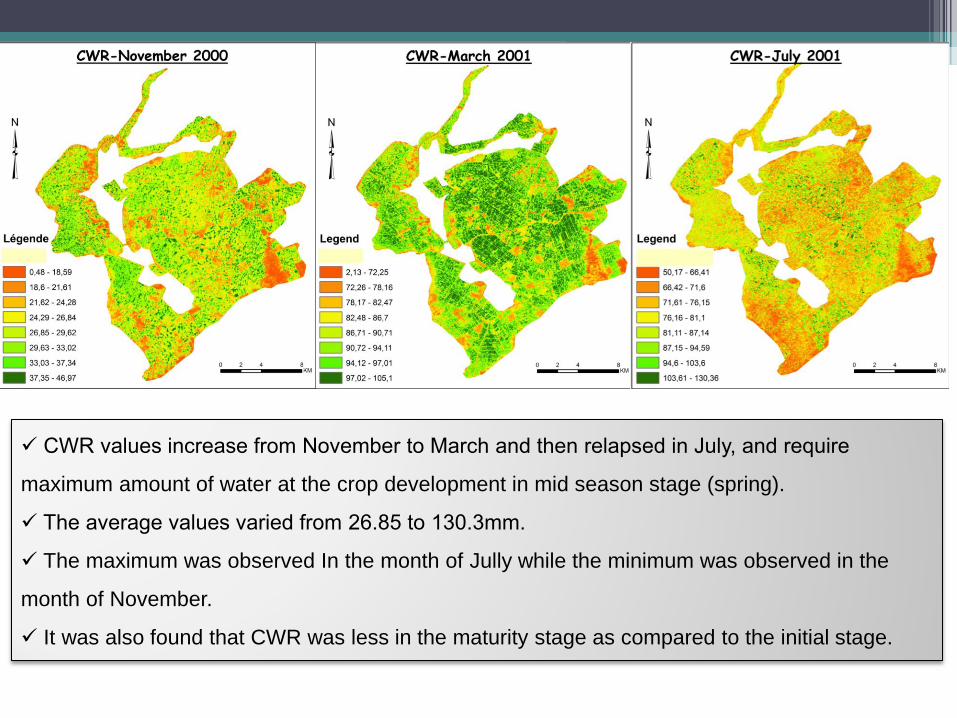
CWR values increase from November to March and then relapsed in July, and require
maximum amount of water at the crop development in mid season stage (spring).
The average values varied from 26.85 to 130.3mm.
The maximum was observed In the month of Jully while the minimum was observed in the
month of November.
It was also found that CWR was less in the maturity stage as compared to the initial stage.
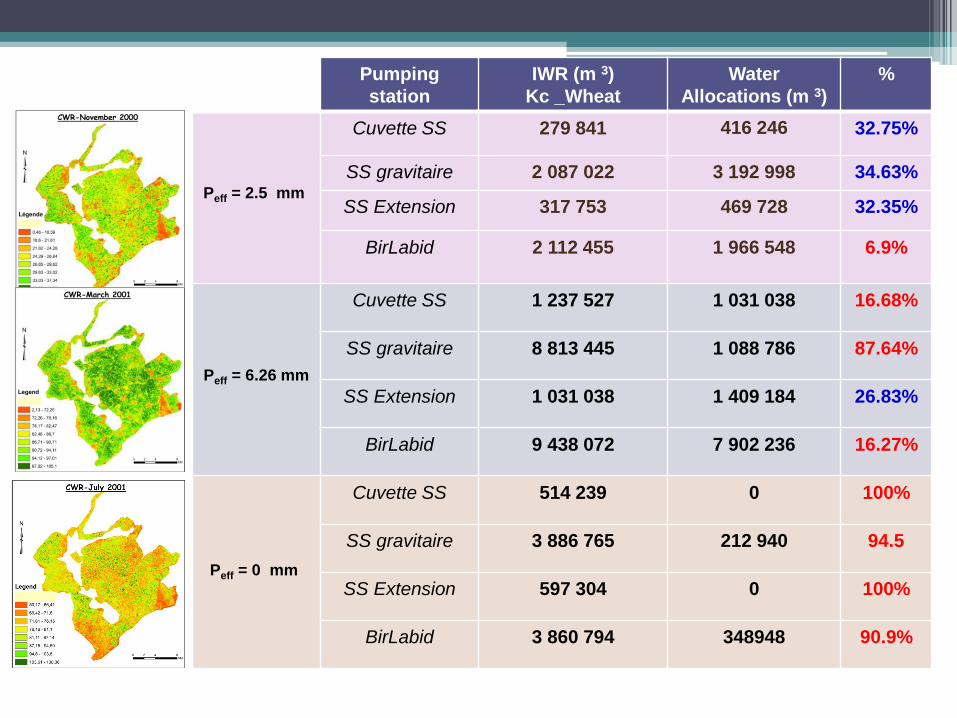
Pumping
station
IWR (m 3)
Kc _Wheat
Water
Allocations (m 3)
%
Cuvette SS 279 841 416 246 32.75%
SS gravitaire 2 087 022 3 192 998 34.63%
SS Extension 317 753 469 728 32.35%
BirLabid 2 112 455 1 966 548 6.9%
Peff = 6.26 mm
Cuvette SS 1 237 527 1 031 038 16.68%
SS gravitaire 8 813 445 1 088 786 87.64%
SS Extension 1 031 038 1 409 184 26.83%
BirLabid 9 438 072 7 902 236 16.27%
Cuvette SS 514 239 0 100%
SS gravitaire 3 886 765 212 940 94.5
SS Extension 597 304 0 100%
BirLabid 3 860 794 348948 90.9%
Peff = 2.5 mm
Peff = 0 mm
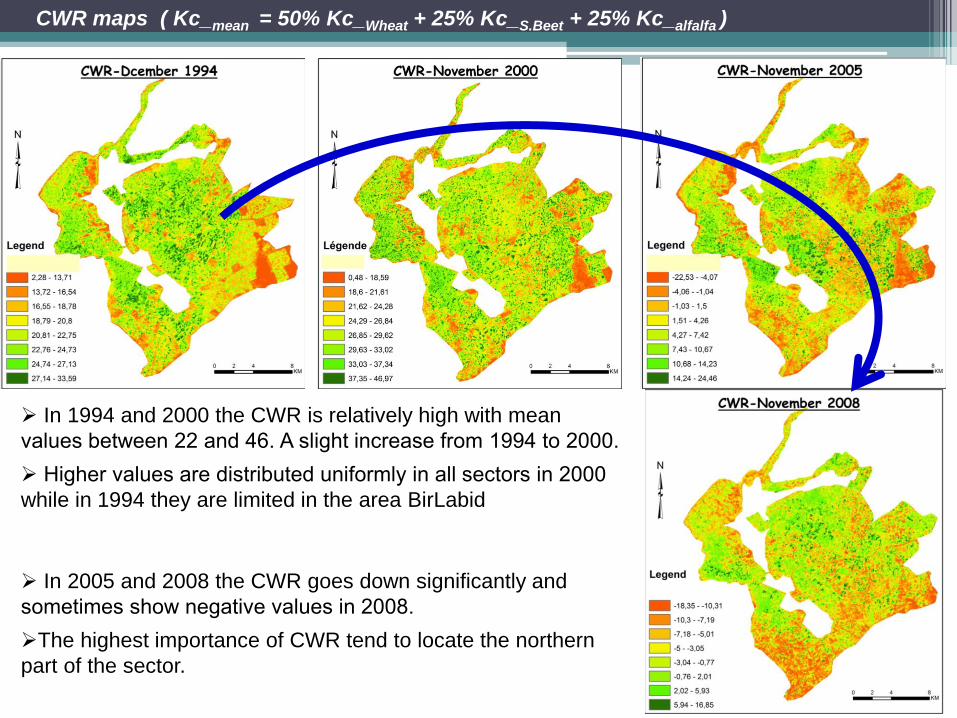
CWR maps ( Kc_mean = 50% Kc_Wheat + 25% Kc_S.Beet + 25% Kc_alfalfa )
In 1994 and 2000 the CWR is relatively high with mean
values between 22 and 46. A slight increase from 1994 to 2000.
Higher values are distributed uniformly in all sectors in 2000
while in 1994 they are limited in the area BirLabid
In 2005 and 2008 the CWR goes down significantly and
sometimes show negative values in 2008.
The highest importance of CWR tend to locate the northern
part of the sector.
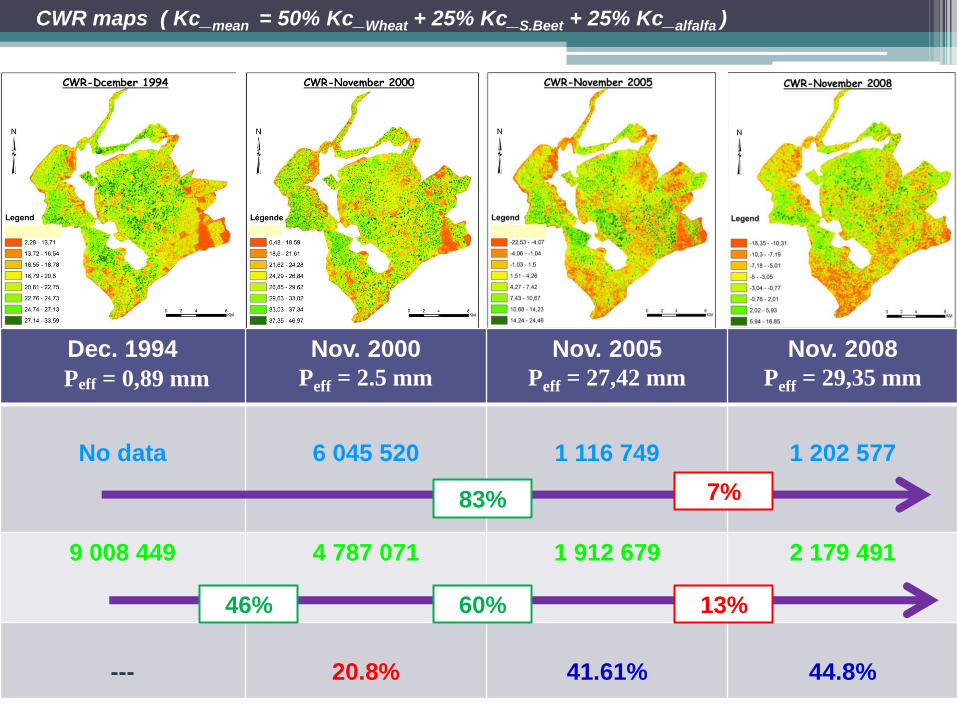
Dec. 1994 Nov. 2000
Peff = 2.5 mm
Nov. 2005
Peff = 27,42 mm
Nov. 2008
Peff = 29,35 mm
No data
6 045 520
1 116 749
1 202 577
9 008 449 4 787 071 1 912 679 2 179 491
---
20.8%
41.61%
44.8%
Peff = 0,89 mm
46% 60% 13%
83% 7%
CWR maps ( Kc_mean = 50% Kc_Wheat + 25% Kc_S.Beet + 25% Kc_alfalfa )
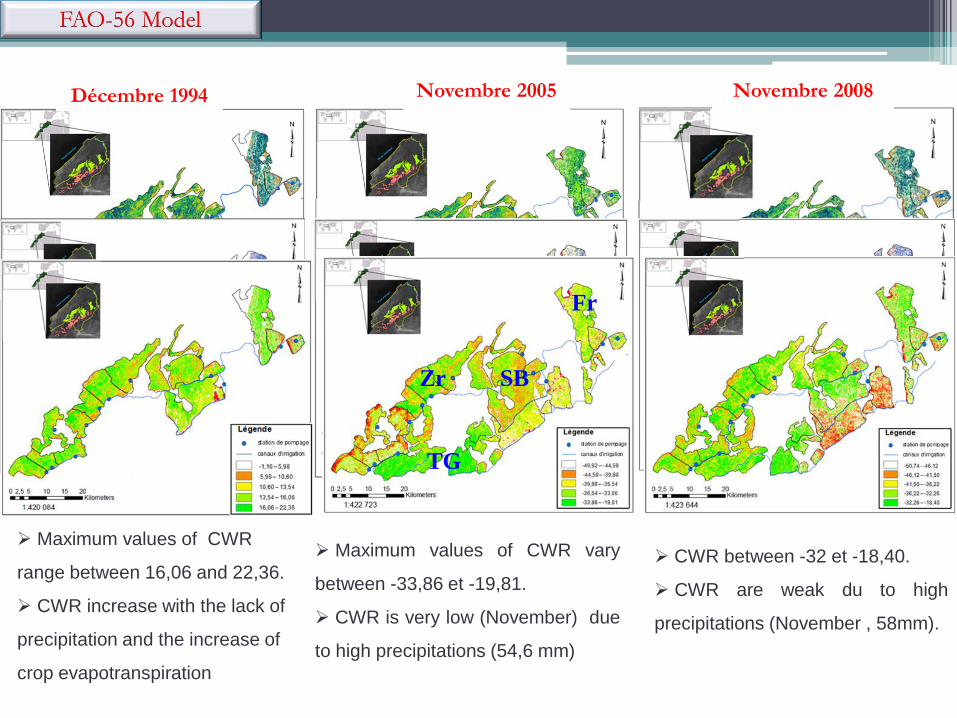
Décembre 1994
Novembre 2005
Novembre 2008
Maximum values of CWR
range between 16,06 and 22,36.
CWR increase with the lack of
precipitation and the increase of
crop evapotranspiration
Maximum values of CWR vary
between -33,86 et -19,81.
CWR is very low (November) due
to high precipitations (54,6 mm)
CWR between -32 et -18,40.
CWR are weak du to high
precipitations (November , 58mm).
SB
TG
Zr
Fr
FAO-56 Model
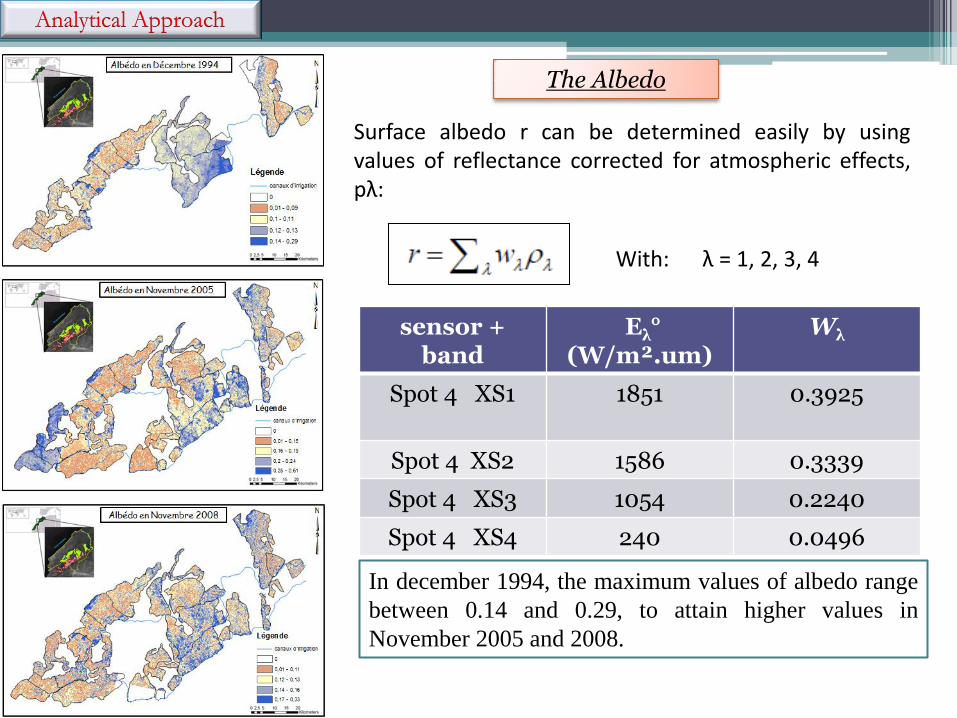
Surface albedo r can be determined easily by using values of reflectance corrected for atmospheric effects, pλ:
With: λ = 1, 2, 3, 4
sensor + band
Eλ° (W/m².um)
Wλ
Spot 4 XS1 1851
0.3925
Spot 4 XS2 1586 0.3339
Spot 4 XS3 1054 0.2240
Spot 4 XS4 240 0.0496
Analytical Approach
The Albedo
In december 1994, the maximum values of albedo range
between 0.14 and 0.29, to attain higher values in
November 2005 and 2008.
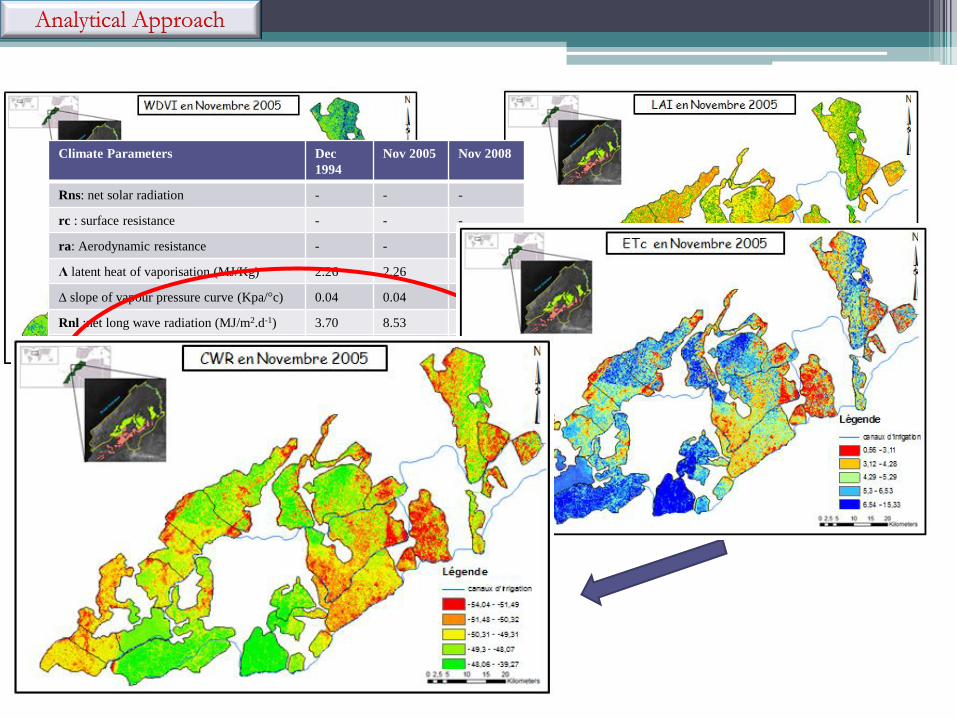
Analytical Approach
Climate Parameters Dec
1994
Nov 2005 Nov 2008
Rns: net solar radiation - - -
rc : surface resistance - - -
ra: Aerodynamic resistance - - -
Λ latent heat of vaporisation (MJ/Kg) 2.26 2.26 2.26
∆ slope of vapour pressure curve (Kpa/°c) 0.04 0.04 0.03
Rnl :net long wave radiation (MJ/m2.d-1) 3.70 8.53 8.92
G: soil heat flux -0.406 -0.819 -0.882
De: vapour pressure density 0.09 0.15
0.11
Atmospheric density 1.19
1.19
1.19
Psychometric constant 0.066 0.066
0.066
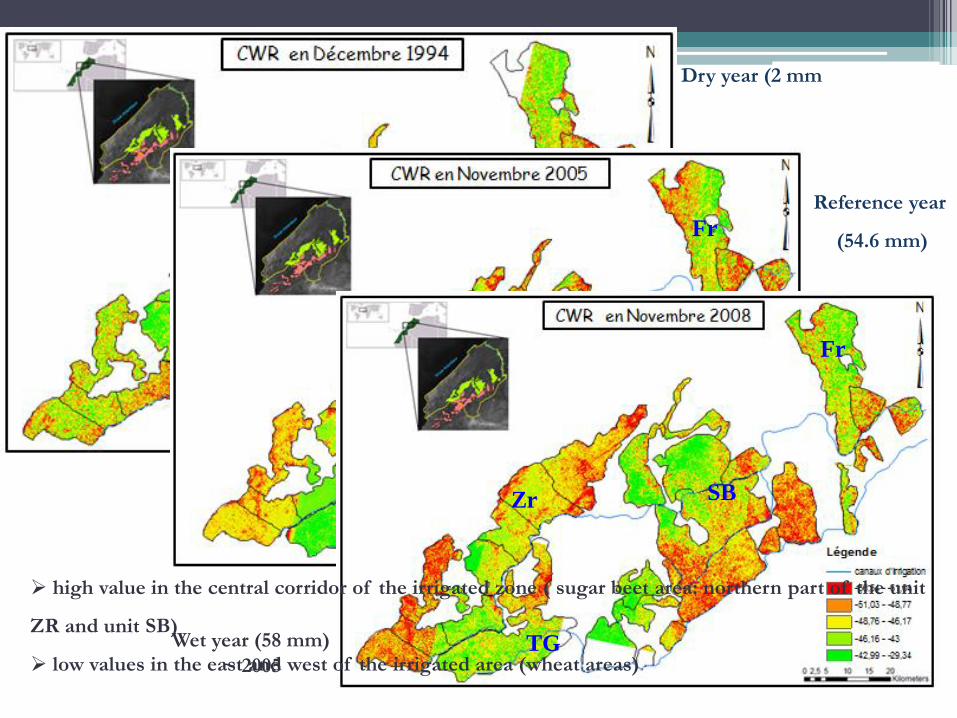
Dry year (2 mm
Reference year
(54.6 mm)
TG
Fr
SB
Zr
Wet year (58 mm)
~ 2005
SB
TG
Zr
Fr
high value in the central corridor of the irrigated zone ( sugar beet area: northern part of the unit
ZR and unit SB)
low values in the east and west of the irrigated area (wheat areas)
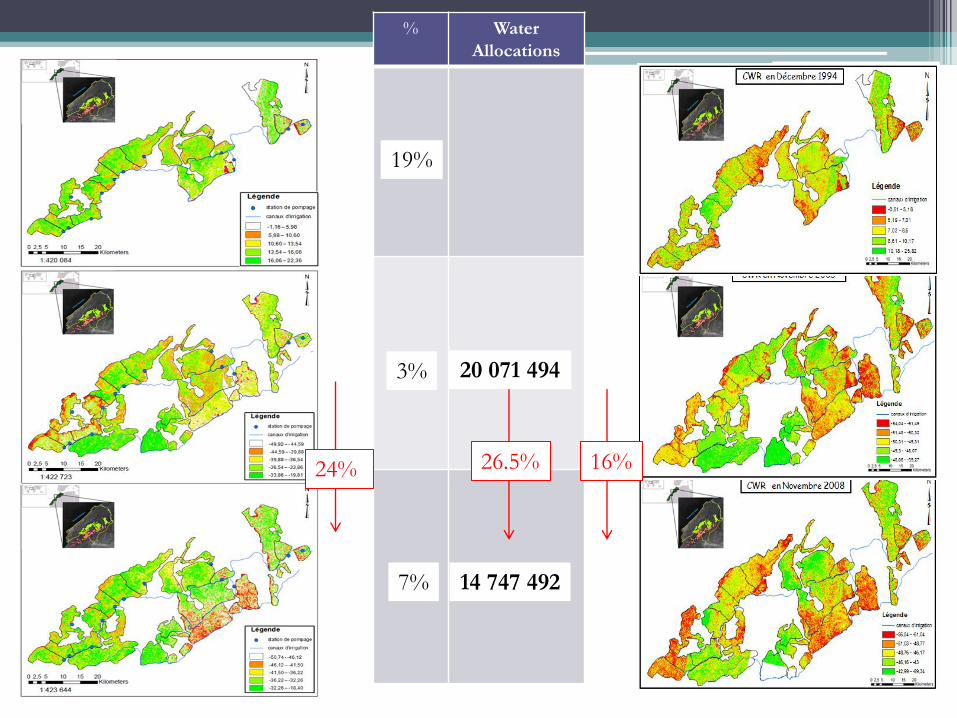
% Water
Allocations
26.5% 24% 16%
19%
3%
7%
20 071 494
14 747 492
Conclusion perspective
use satellite data has enabled to highlight new information on the irrigated zone and to
make a link between large trends in terms of cultures, evapotranspiration and water
requirements in relation with rainfall and allocations (is a new approach, never used in the
region)
The comparison of water allocations and values estimated by the CWR, confirms the
results of measurements on the satisfaction of needs of crops, with a new contribution to
the spatial vision of the phenomenon.
Remote Sensing and GIS integrated approach can be used for estimation of crop
water requirement and irrigation water requirement.
the Crop water requirement was higher in the vegetative and mid-season stage and
shows decreasing trend towards the maturity stage.
it was found that irrigation water requirement highly correlated with crop water
requirement
The approach will be used for other spatial and temporal scales of observation:
- The methodology will be applied on a farm taking into account the type of crop
(winter crop: wheat, summer crop, and throughout the year: Sugar Beet)
- Should be expanded and generalized to on other irrigated areas of the basin (OR)
-Statistical processing of measurement and analysis to establish a logical relationship
between CWR and water allocation
-introduction of new types of data! (With more in spectral and temporal)
In the futur….

Abstract Submission 30 April 2012
Acceptance Notification 30 June 2012
Final paper submission 01 September 2012
IMPORTANT DATES
www.aarse2012.org
9TH INTERNATIONAL CONFERENCE OF THE
AFRICAN ASSOCIATION OF REMOTE SENSING
OF THE ENVIRONMENT (AARSE)
October 29 to November 2,
EL JADIDA, MOROCCO

THANK YOU
See you in El Jadida in October 2012