Embed Size (px)
Citation preview
LETTERS
Enzyme-inhibitor-like tuning of Ca21 channelconnectivity with calmodulinXiaodong Liu1, Philemon S. Yang1, Wanjun Yang1 & David T. Yue1
Ca21 channels and calmodulin (CaM) are two prominent signallinghubs1 that synergistically affect functions as diverse as cardiacexcitability2, synaptic plasticity3 and gene transcription4. It istherefore fitting that these hubs are in some sense coordinated, asthe opening of CaV1–2 Ca21 channels are regulated by a single CaMconstitutively complexed with channels5. The Ca21-free form ofCaM (apoCaM) is already pre-associated with the isoleucine–glutamine (IQ) domain on the channel carboxy terminus, and sub-sequent Ca21 binding to this ‘resident’ CaM drives conformationalchanges that then trigger regulation of channel opening6. Anotherpotential avenue for channel–CaM coordination could arise fromthe absence of Ca21 regulation in channels lacking a pre-associatedCaM6,7. Natural fluctuations in CaM concentrations might theninfluence the fraction of regulable channels and, thereby, theoverall strength of Ca21 feedback. However, the prevailing viewhas been that the ultrastrong affinity of channels for apoCaMensures their saturation with CaM8, yielding a significant form ofconcentration independence between Ca21 channels and CaM.Here we show that significant exceptions to this autonomy exist,by combining electrophysiology (to characterize channel regu-lation) with optical fluorescence resonance energy transfer(FRET) sensor determination of free-apoCaM concentration inlive cells9. This approach translates quantitative CaM bio-chemistry from the traditional test-tube context into the realm offunctioning holochannels within intact cells. From this perspective,we find that long splice forms of CaV1.3 and CaV1.4 channelsinclude a distal carboxy tail10–12 that resembles an enzyme com-petitive inhibitor that retunes channel affinity for apoCaM suchthat natural CaM variations affect the strength of Ca21 feedbackmodulation. Given the ubiquity of these channels13,14, the connec-tion between ambient CaM levels and Ca21 entry through channelsis broadly significant for Ca21 homeostasis. Strategies such as ourspromise key advances for the in situ analysis of signalling moleculesresistant to in vitro reconstitution, such as Ca21 channels.
Our investigations build on a CaV1.4 channel mutation underlyingcongenital stationary night blindness15. This mutation yields a pre-mature stop that deletes the distal carboxy tail (DCT) of these retinalCa21 channels, and produces an unexpected emergence of their Ca21
regulation by CaM11,12, known as Ca21-dependent inactivation (CDI).Full-length CaV1.4 channels lack CDI11,12, thereby maintaining Ca21-driven transmitter release at tonically depolarized retinal synapses.Hence, the emergence of CDI probably impairs vision. Mechanisti-cally, the DCT contains a CDI-inhibiting module (ICDI) that isreported to somehow ‘switch off’ the latent CDI of CaV1.4 channels11,12.
Figure 1 summarizes our initial characterization of ICDI effects.Because CaV1.4 channels yield diminutive currents16, we appendedthe DCT of the main CaV1.4 subunit (a1F) onto the core of better-expressing CaV1.3 channels (main subunit, a1D). This approach
permits robust investigation of DCT effects11,12. As baseline, Fig. 1adisplays the CDI of core CaV1.3 channels (left, a1DD), similar tonatural short splice variants8. Core channels contain all elementsrequired for CDI6,17, including the IQ domain for apoCaM pre-association6 and the EF-hand-like region for CDI transduction18.Depolarization thereby produced a rapidly decaying Ca21 current(middle, red trace), indicative of strong CDI. Because Ba21 bindsCaM poorly17, the slow Ba21 current decay (middle, black trace)represents the background inactivation of a distinct voltage-dependentprocess6,7. Thus, the fraction of peak current remaining after depola-rization for 50 ms (right, r50) relates intimately to inactivation, with thedifference between the Ca21 and Ba21 r50 relations indexing CDI (f50).Appending the CaV1.4 DCT to the CaV1.3 core (Fig. 1b, left) signifi-cantly reduced CDI (middle and right) relative to control (dashes)(Supplementary Information, section 1.2). Notably, the DCT did notaltogether abolish CDI as reported before11,12, but left a clear residuum.This difference foreshadowed major mechanistic and biologicalconsequences.
1Calcium Signals Laboratory, Departments of Biomedical Engineering and Neuroscience, The Johns Hopkins University School of Medicine, Ross Building, Room 713, 720 RutlandAvenue, Baltimore, Maryland 21205, USA.
N
DCT α1F
A B ICDIC
α1DΔ–(ABI)Fb
Ca
Ba
–10 mV
100 ms
0.2 nA
–80 Ba
Ca
r50
V (mV)
f50
–50 0 500
1
–50 0 500
1
f50 = 0.67 ± 0.03 (5)
f50 = 0.15 ± 0.04 (7)
CN
EF
IQ
NSCaTE
α1DΔ
a
Figure 1 | Distal carboxy tail of CaV1.4 weakens Ca21 regulation ofchannels. a, Core CaV1.3 channel contains all known structural elementsrequired for CDI (schematic of main subunit a1DD, containing NSCaTE17,EF18 and IQ6) and thereby exhibits robust CDI (subpanels). Average f50 CDImetric shown at bottom (data shown, mean 6 s.e.m.), with number of cellsin parentheses. Throughout, current scale bars pertain to Ca21 currents.Ba21 currents are scaled for kinetic comparison. Tail currents are clipped toframe. b, Adding DCT of a1F (main pore-forming CaV1.4 subunit) to coreCaV1.3 channel weakens CDI. A, B and ICDI segments of the a1F DCT(together referred to as (ABI)F) are defined in Supplementary Information,section 1.1. The dashed curve reproduces the baseline from a.
Vol 463 | 18 February 2010 | doi:10.1038/nature08766
968Macmillan Publishers Limited. All rights reserved©2010
Hints of these consequences came from qualitative considerationof underlying mechanism. As background, we recapitulated coarsestructural underpinnings of DCT effects. To confirm that DCT func-tion requires complementary elements within core channels11,12, weshowed the lack of DCT effects on CaV2.2 channels (SupplementaryInformation, section 1.3), which presumably lack complementingmodules. Furthermore10,12, when such complementing modules arepresent, only ICDI and A subsegments of the DCT (Fig. 1b, left) arerequired for inhibition of CDI (Supplementary Information,section 1.4). Beyond these initial points, actual DCT mechanismsremain controversial. Glutathione S-transferase pull-downs ofchannel peptides have been used to support an allosteric mechanism(Supplementary Information, section 1.5), in which the ICDI asso-ciates with an EF-hand-like module to eliminate CDI transduction12
(Fig. 1a, left), but leaves apoCaM–channel binding unchanged. Bycontrast, in other work, channel peptide FRET has been used toadvance a competitive mechanism (Supplementary Information,section 1.5) in which ICDI competes with apoCaM for binding nearthe channel IQ domain (Fig. 1a, left), thus inhibiting CDI by displa-cing CaM from channels11.
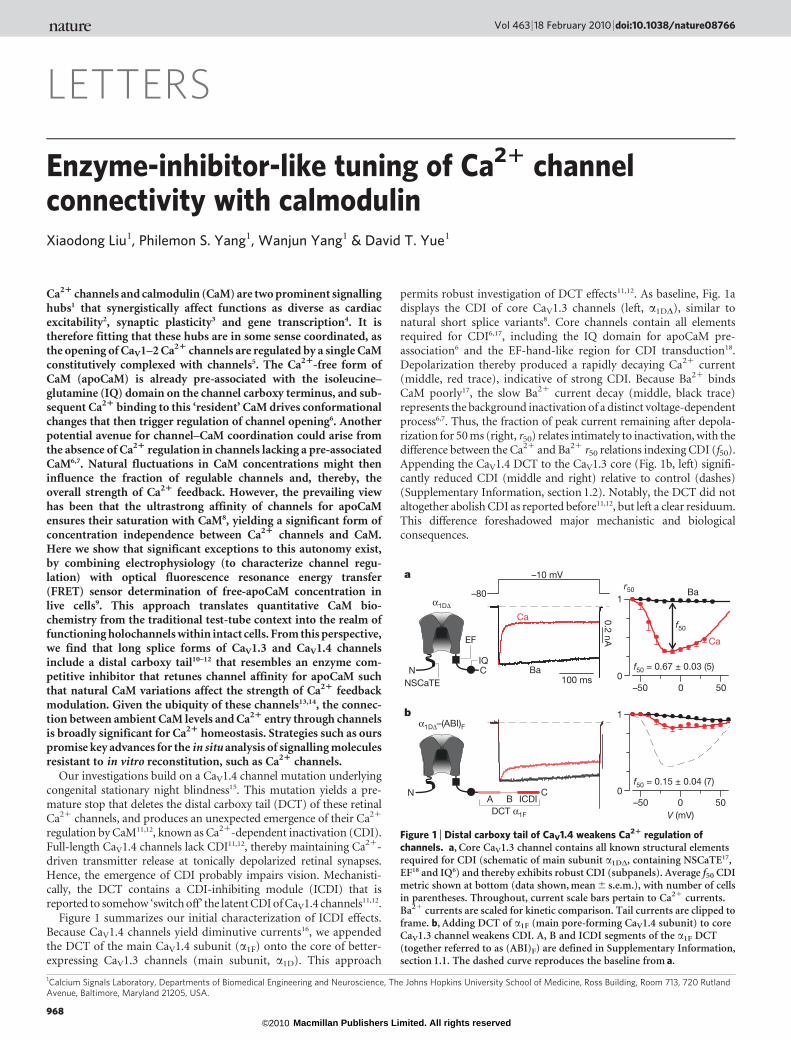
To help resolve this controversy, we pursued two preliminaryapproaches. First, using live-cell FRET two-hybrid assays6,17 we testedwhether the CaV1.4 ICDI (Fig. 2a, cyan fluorescent protein (CFP)fused to ICDI (ECFP–ICDIF)) could bind the presumed apoCaMpre-association module of CaV1.3 (yellow fluorescent protein (YFP)fused to the PreIQ3–IQ–A segment of the channel, as schematized inFigs 1b and 2a (EYFP–PreIQ3–IQD–AF); Supplementary Information,section 2.1). We thus resolved a high-affinity in situ binding curve(Fig. 2a) in which FRET strength (FR) is plotted cell-by-cell versusthe concentration of free ECFP–ICDIF (Dfree, free donor). By contrastto previous analyses using single-number FRET indices11, our bindingcurve excludes low-affinity interaction, and a similar binding curvewas obtained for partners solely derived from CaV1.4 (SupplementaryInformation, section 2.2). We also confirmed avid binding betweenapoCaM (ECFP–CaMWT in resting cells) and this EYFP–PreIQ3–IQD–AF module6 (Fig. 2b). More telling, the ICDI (without a fluorophore)attenuated the same apoCaM interaction (Fig. 2c, grey zone), suggest-ing that ICDI and apoCaM could vie for IQ occupancy (Sup-plementary Fig. 2.2b). Together, these data confirmed the potentialfor competition but pertained only to peptides, without guarantee ofanalogous events within intact channels.
Accordingly, a second provisional approach specifically targetedthe holochannel configuration. Scrutiny of mechanisms (Sup-plementary Information, section 1.5) showed that manipulatingapoCaM concentrations would affect CDI only in the competitive,but not strictly allosteric, framework. Indeed, increasing the CaMconcentration sharply reversed ICDI effects (Fig. 2d, middle), andapoCaM chelation eliminated residual CDI (Fig. 2d, right; Sup-plementary Information, section 2.3). Notably, increasing the CaMconcentration also increased the CDI of full-length CaV1.4 channels(Fig. 2e; but see ref. 19). Overall, both preliminary approaches sup-ported competition, and the residual CDI seen earlier (Fig. 1b)appeared to reflect incomplete competition. Still, these data neitherexcluded more nuanced allosteric mechanisms20 nor revealedwhether biologically relevant CaM fluctuations could modulate CDI.
These limitations might be overcome if only the free-apoCaMconcentration could be quantified within the same cells where CDIwas measured. Then the holochannel equivalent of classic enzymeinhibition plots20, which rigorously distinguish among mechanisms,could be determined. Accordingly, we incorporated a recentlydeveloped optical FRET-based sensor of apoCaM, BSCaMIQ. HereCFP and YFP flank the apoCaM-binding site of neuromodulin9
(Fig. 3a), such that the overall FRET is determined by the free-apoCaM concentration. We confirmed the limiting behaviours byco-expressing BSCaMIQ with excess CaM (Fig. 3b, blue line) or CaM-chelating peptides (Fig. 3b, green line (FRmax); SupplementaryInformation, section 3.1). As expected, FR was nearly independent
of isolated CFP fluorescence, which is an approximate measure ofsensor expression in each cell. By contrast, when BSCaMIQ wasexpressed alone, FR increased towards FRmax (Fig. 3b, black line),as anticipated for a sensor that chelates and decreases free apoCaM.With reassurance of BSCaMIQ performance in our system, we co-expressed BSCaMIQ and Ca21 channels, and measured the free-apoCaM concentration before determining CDI in the same cell(Fig. 3c). If free apoCaM were varied among cells by CaM overex-pression or chelation, the resulting plot of CDI versus apoCaM wouldrigorously distinguish among mechanisms. Specifically, using the
N C
α1F
e +10 mV
f300 = 0.01 ± 0.01 (5)
Endogenous CaM
NDCT α1F
C
α1DΔ–(ABI)F
d
N C CaMWT+
–10 mV
Ca
Ba
–80
f50 = 0.56 ± 0.04 (7)
0.2 nA
+10 mV
N C CaMWT+
0.36 ± 0.07 (9)
100 ms
+CaM sponge
0.06 ± 0.03 (7)
–10 mV
N C
+competitorICDI
0
1
2
100,0000
200,000
3c
YFPEYFP–PrelQ3–IQD–AF
EYFP–PrelQ3–IQD–AF
CFPFRET pair
C-tail α1D DCT α1F
C-tail α1D DCT α1F
IQ A B ICDIEFC
ECFP–ICDIF
FRET pairECFP–CaMWT
N
0
2
50,000
4
0
6
Dfree
FR
150,000
a
YFP
CFP
EYFP–PrelQ3–IQD–AF
FRET pairECFP–CaMWT
YFP
CFP
N C
IQ AEFCN
0
1
2
100,0000
200,000
3
b
Figure 2 | Provisional evidence for competition. a, FRET, CFP-tagged ICDIof a1F versus YFP-tagged PreIQ3–IQ–A from Fig. 1b (SupplementaryInformation, section 2.1). FR is proportional to the product of FRET efficiencyand fraction of YFP-tagged molecules bound6. Dfree, relative concentration ofunbound CFP-tagged molecules; scale bar (green), ,500 nM (ref. 6).b, FRET, apoCaM versus PreIQ3–IQ–A in a. c, ICDI (without fluorophore)attenuates binding in b. The grey reference curve is from b. d, Left, CDI isrescued upon overexpressing CaM with chimaera in Fig. 1b. Right, CaMsponge (CaV1.2 YFP–PreIQ3–IQ6) eliminates CDI. e, Overexpressing CaMwith full-length CaV1.4. f300, 300-ms version of f50.
NATURE | Vol 463 | 18 February 2010 LETTERS
969Macmillan Publishers Limited. All rights reserved©2010
relation between FRET and free-apoCaM concentration in our cells9
(Supplementary Information, section 3.2), the exact signature ofcompetition20 becomes as shown in the right-hand plot of Fig. 3d(grey curves) and
CDI~CDImaxSb
Sb(1{r)zrð1Þ
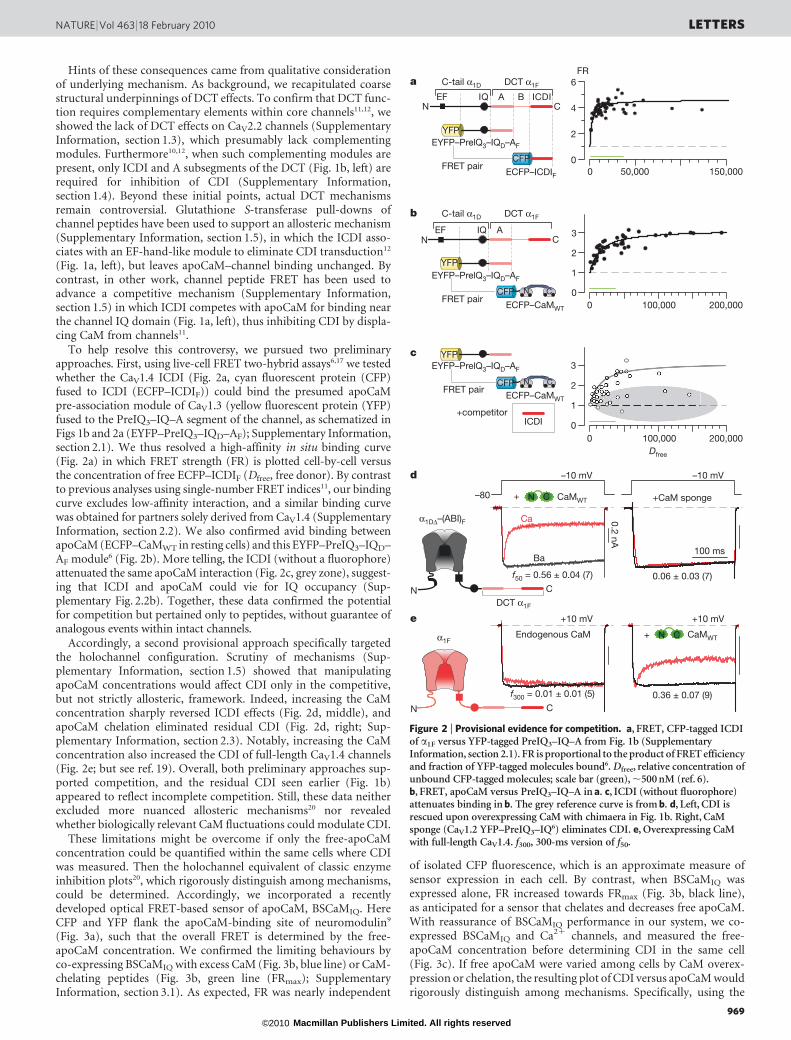
where r 5 Kd-channel-apparent/Kd-sensor, CDImax is the maximal CDIwithout ICDI, Kd-channel-apparent is the apparent dissociation constantof channels for apoCaM (with competitive inhibitor), Kd-sensor is thedissociation constant of BSCaMIQ for apoCaM9 (2.3 mM), and Sb isthe fraction of sensor bound to apoCaM (SupplementaryInformation, section 3.3). As Fig. 3b shows, Sb is directly determinedfrom FR and ranges from zero to one with increasing apoCaM. IfICDI competition is strong (r . 1), curves will be upwardly concave(right-hand plot of Fig. 3d, grey curves); if it is weak (r , 1), curveswill be downwardly concave.
Figure 3d also displays the experimental outcome for core CaV1.3channels affixed to the CaV1.4 DCT (a1DD–(ABI)F, from Fig. 1b). Inthe CDI–Sb plot, each symbol corresponds to a single cell, and togetherthese data fit the competitive scheme (red curve; equation (1))remarkably well. Current traces from exemplar cells (left-hand plotsof Fig. 3d; (i)–(iii)) explicitly demonstrate the appropriate increase ofCDI with increasing Sb and apoCaM concentration. Importantly,
parallel analysis of core CaV1.3 channels revealed far greaterapoCaM affinity (Fig. 3e), yielding maximal CDI throughout.Hence, the upward concavity in Fig. 3d is a genuine ICDI effect, notan unanticipated property of the CaV1.3 core. Critically, at highapoCaM concentration (Sb < 1), the CDIs of the two constructs con-verged, which is a hallmark of competition20.
Having established these results for the retinal CaV1.4 DCT, wewondered whether CDI–Sb analysis might uncover similar DCTmechanisms in other Ca21 channel subtypes, with yet broader distri-bution and impact. We considered a long splice variant of the humanCaV1.3 channel10 (a1D–long[hum]), which contains a DCT homologousto that in CaV1.4. This long variant has recently been reported to havedecreased CDI10 in comparison with a short variant akin to corechannels (see, for example, Fig. 3e). It thus seemed plausible that acompetitive ICDI mechanism could extend to these channels, whichwould be an important possibility given the wide distribution ofCaV1.3 channels13,14 and the predominance of the long variantthroughout brain10. Complicating this view, however, were our priorobservations that corresponding long and short variants of rat CaV1.3channels show no difference in CDI8. Indeed, all of the experimentsdescribed to this point of the present study involved constructs basedon rat CaV1.3 channels. Accordingly, we undertook CDI–Sb analysis oflong CaV1.3 variants from both human and rat. The human longCaV1.3 variant (Fig. 3f) adhered to a competitive ICDI mechanism,
CDI
0.0
0.6
0 1
CIQEF A B ICDI
CIQEF
DCT α1D[hum]
α1D–long[hum]
A B ICDIC
IQEF
f ge
CDI
0.0
0.6
0 1
CDI
0.0
0.6
0 1
0.0
0.6
(ii)(i)
(iii)
0 1Sb
0.004 = r
1
87
0.09
0.35
3.313
CDI(f50)
DCT α1F
A B ICDIC
IQEF
α1DΔ[rat]
α1DΔ[rat]–(ABI)F
(i) (ii) (iii)
100 ms0.2
nA
d
FR
SCFP
+CaM sponge
+CaM
0 6,0001
2
3
4
5
6
7
Endogenous CaM
1
0
Sb
b
CFP YFP
CFP Y
FPApoCAM
Lower FRET
Higher FRET CDI
FR
a c
α1DΔ[rat]
α1DΔ[rat] α1DΔ[hum]
α1D–long[rat]
DCT α1D[rat]α1DΔ[rat]
Sb Sb Sb
Figure 3 | Live-cell holochannel biochemistry proves competition.a, BSCaMIQ schematic. b, BSCaMIQ expressed alone (black curve and datapoints) and co-expressed with CaM or CaM sponges (neuromodulin IQ(filled green data points; Supplementary Information, section 3.1) or CaV1.2PreIQ3–IQ6 (open green data points)). SCFP, isolated CFP fluorescence6.c, Approach to obtaining CDI and FRET read-outs of apoCaM (FR) in single
cells. d, CDI–Sb analysis for a1DD[rat]–(ABI)F, for 210-mV steps. Right, greyCDI–Sb curves illustrate potential profiles for competitive inhibition,according to equation (1). The superimposed red data points and fitconform to the competitive profile. Left, corresponding exemplar traces,labelled (i)–(iii). e–g, CDI–Sb analysis for a1DD[rat], a1D–long[hum] anda1D–long[rat] (the rat orthologue of a1D–long[hum]); format as in d.
LETTERS NATURE | Vol 463 | 18 February 2010
970Macmillan Publishers Limited. All rights reserved©2010
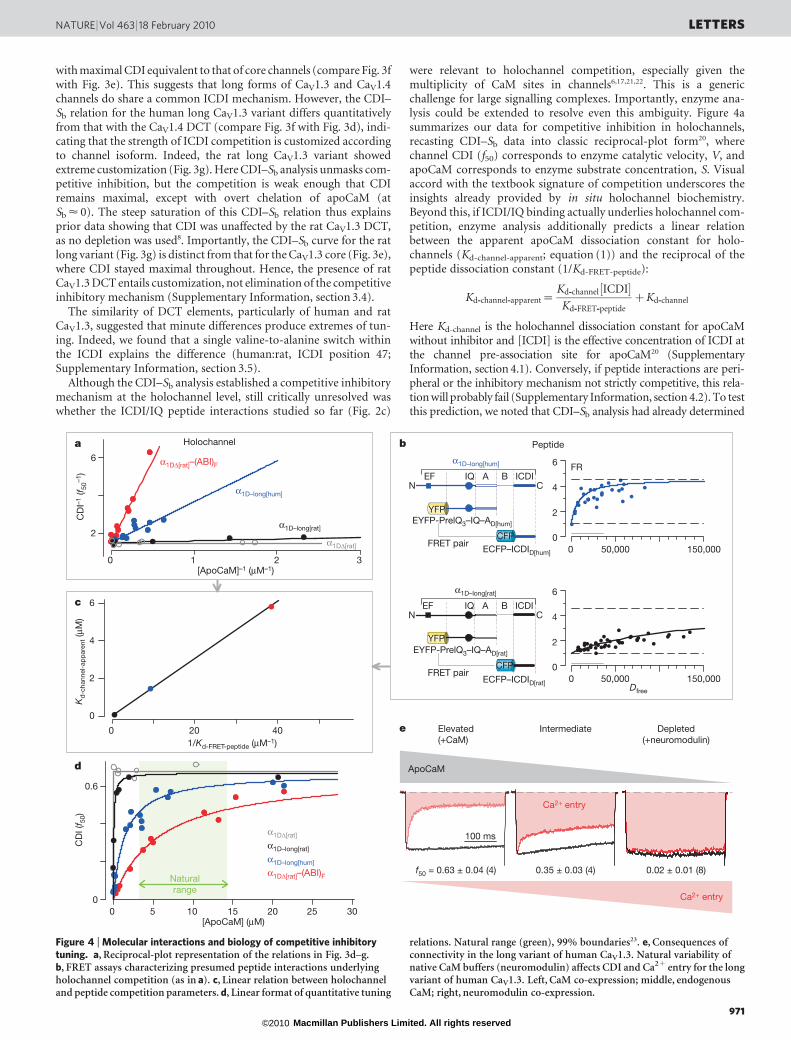
with maximal CDI equivalent to that of core channels (compare Fig. 3fwith Fig. 3e). This suggests that long forms of CaV1.3 and CaV1.4channels do share a common ICDI mechanism. However, the CDI–Sb relation for the human long CaV1.3 variant differs quantitativelyfrom that with the CaV1.4 DCT (compare Fig. 3f with Fig. 3d), indi-cating that the strength of ICDI competition is customized accordingto channel isoform. Indeed, the rat long CaV1.3 variant showedextreme customization (Fig. 3g). Here CDI–Sb analysis unmasks com-petitive inhibition, but the competition is weak enough that CDIremains maximal, except with overt chelation of apoCaM (atSb < 0). The steep saturation of this CDI–Sb relation thus explainsprior data showing that CDI was unaffected by the rat CaV1.3 DCT,as no depletion was used8. Importantly, the CDI–Sb curve for the ratlong variant (Fig. 3g) is distinct from that for the CaV1.3 core (Fig. 3e),where CDI stayed maximal throughout. Hence, the presence of ratCaV1.3 DCT entails customization, not elimination of the competitiveinhibitory mechanism (Supplementary Information, section 3.4).
The similarity of DCT elements, particularly of human and ratCaV1.3, suggested that minute differences produce extremes of tun-ing. Indeed, we found that a single valine-to-alanine switch withinthe ICDI explains the difference (human:rat, ICDI position 47;Supplementary Information, section 3.5).
Although the CDI–Sb analysis established a competitive inhibitorymechanism at the holochannel level, still critically unresolved waswhether the ICDI/IQ peptide interactions studied so far (Fig. 2c)
were relevant to holochannel competition, especially given themultiplicity of CaM sites in channels6,17,21,22. This is a genericchallenge for large signalling complexes. Importantly, enzyme ana-lysis could be extended to resolve even this ambiguity. Figure 4asummarizes our data for competitive inhibition in holochannels,recasting CDI–Sb data into classic reciprocal-plot form20, wherechannel CDI (f50) corresponds to enzyme catalytic velocity, V, andapoCaM corresponds to enzyme substrate concentration, S. Visualaccord with the textbook signature of competition underscores theinsights already provided by in situ holochannel biochemistry.Beyond this, if ICDI/IQ binding actually underlies holochannel com-petition, enzyme analysis additionally predicts a linear relationbetween the apparent apoCaM dissociation constant for holo-channels (Kd-channel-apparent; equation (1)) and the reciprocal of thepeptide dissociation constant (1/Kd-FRET-peptide):
Kd-channel-apparent~Kd-channel½ICDI�Kd-FRET-peptide
zKd-channel
Here Kd-channel is the holochannel dissociation constant for apoCaMwithout inhibitor and [ICDI] is the effective concentration of ICDI atthe channel pre-association site for apoCaM20 (SupplementaryInformation, section 4.1). Conversely, if peptide interactions are peri-pheral or the inhibitory mechanism not strictly competitive, this rela-tion will probably fail (Supplementary Information, section 4.2). To testthis prediction, we noted that CDI–Sb analysis had already determined
b
0 50,000 150,0000
2
4
6 FR
Dfree
YFPEYFP-PrelQ3–IQ–AD[hum]
CFPFRET pair
α1D–long[hum]
IQ A B ICDIEFC
ECFP–ICDID[hum]
ECFP–ICDID[rat]
N
FRET pair
α1D–long[rat]
IQ A B ICDIEFCN
0 50,000 150,0000
2
4
6
Peptide
CD
I–1
(f 50–1
)
6
2
α1D–long[hum]
α1DΔ[rat]
α1DΔ[rat]–(ABI)F
[ApoCaM]–1 (μM–1)10 3
Holochannela
0
6
2
4
01/Kd-FRET-peptide (μM–1)
Kd
-cha
nnel
-ap
par
ent (μM
)
20 40
c
[ApoCaM] (μM)
CD
I (f 5
0)
00
0.6
5 10 25
α1D–long[rat]
α1D–long[hum]
α1DΔ[rat]
α1DΔ[rat]–(ABI)FNaturalrange
30
d ApoCaM
Ca2+ entry
Elevated(+CaM)
Intermediate Depleted(+neuromodulin)
e
100 ms
f50 = 0.63 ± 0.04 (4) 0.35 ± 0.03 (4) 0.02 ± 0.01 (8)
Ca2+ entry
α1D–long[rat]
EYFP-PrelQ3–IQ–AD[rat]
YFP
CFP
2
15 20
Figure 4 | Molecular interactions and biology of competitive inhibitorytuning. a, Reciprocal-plot representation of the relations in Fig. 3d–g.b, FRET assays characterizing presumed peptide interactions underlyingholochannel competition (as in a). c, Linear relation between holochanneland peptide competition parameters. d, Linear format of quantitative tuning
relations. Natural range (green), 99% boundaries23. e, Consequences ofconnectivity in the long variant of human CaV1.3. Natural variability ofnative CaM buffers (neuromodulin) affects CDI and Ca21 entry for the longvariant of human CaV1.3. Left, CaM co-expression; middle, endogenousCaM; right, neuromodulin co-expression.
NATURE | Vol 463 | 18 February 2010 LETTERS
971Macmillan Publishers Limited. All rights reserved©2010
Kd-channel-apparent for channels with three different ICDIs (Figs 3d, f, gand Fig. 4a). Also, Kd-FRET-peptide for the CaV1.4 ICDI was measured inFig. 2a and the remaining Kd-FRET-peptide values are deduced in Fig. 4b.The resulting linear plot (Fig. 4c) indicates that ICDI/IQ binding doesunderlie holochannel competition, and that apoCaM pre-associationwith channels involves the IQ domain with Kd-channel < 10 nM (Fig. 3eand Supplementary Information, section 4.1).
Transforming the reciprocal plots (Fig. 4a) into normal format raisesdiverse biological issues (Fig. 4d). The dogma has been that Ca21
channels have an ultrastrong apoCaM affinity8, ensuring maximalCDI over the natural range23 (green), as confirmed for channels lackingICDI (Fig. 4d, grey curve). Earlier reports that ICDI simply ‘switches off’CDI11,12 further promoted this perceived dissociation of CDI andapoCaM fluctuations. By contrast, we show here that ICDI retunesCDI–[apoCaM] relations, such that natural variations of apoCaMmodulate CDI and overall Ca21 entry (Fig. 4d). Such interconnectionopens many new possibilities, given the widespread impact and distri-bution of CaV1.3 and CaV1.4 channels13–15, and the regulation of CaM23.For example, co-expressing neuromodulin (a biomolecule that affectssynaptic growth/remodelling/plasticity and buffers apoCaM24) with thelong variant of human CaV1.3 channels decreases apoCaM concentra-tion sufficiently to eliminate CDI and promote Ca21 entry (Fig. 4e andSupplementary Information, section 4.3). This outcome may bear onschizophrenia, in which the concentration of hippocampal neuromo-dulin is decreased25. Moreover, neurodegenerative diseases are poten-tially associated with Ca21 dysregulation and, thereby, alteredapoCaM26. In Parkinson’s disease, excess a-synuclein is pathogenic27,these molecules bind apoCaM28, and elevated substantia nigral CaV1.3activity predisposes for disease29. In Alzheimer’s disease, CaM isdepleted26. More broadly, certain models of heart failure featureincreased CaM30. In all, exploring the physiological and pathophysio-logical sequelae of Ca21 channel connectivity with CaM is now animportant frontier of research.
METHODS SUMMARYMolecular biology. We made channel chimaeras, mutants and CFP/YFP-tagged
FRET constructs using standard molecular biological techniques. Detailed strat-
egies for engineering various constructs are detailed in Methods.
Transfection of HEK293 cells. We transiently expressed channels in HEK293
cells using established Ca21-phosphate-based procedures6,8.
Whole-cell electrophysiology. We performed whole-cell recordings in HEK293
cells at room temperature (20–22 uC) on an Axopatch 200A amplifier (Axon
Instruments). The series resistance was 1–3 MV, before series resistance com-
pensation of 80%. P/8 leak subtraction was used throughout. We low-passfiltered current records at 2 kHz and digitized them at rates several times greater.
Detailed experimental conditions are described at length in Methods.
FRET optical imaging. We carried out FRET two-hybrid experiments in
HEK293 cells and analysed them as previously described6. During imaging, the
bath solution was either a Tyrode’s buffer containing 2 mM Ca21 or the standard
electrophysiological-recording bath solution. Concentration-dependent spuri-
ous FRET was subtracted from the raw data before binding-curve analysis17.
Full Methods and any associated references are available in the online version ofthe paper at www.nature.com/nature.
Received 16 July; accepted 4 December 2009.Published online 7 February 2010.
1. Jeong, H., Tombor, B., Albert, R., Oltvai, Z. N. & Barabasi, A.-L. The large-scaleorganization of metabolic networks. Nature 407, 651–654 (2000).
2. Alseikhan, B. A., DeMaria, C. D., Colecraft, H. M. & Yue, D. T. Engineeredcalmodulins reveal the unexpected eminence of Ca21 channel inactivation incontrolling heart excitation. Proc. Natl Acad. Sci. USA 99, 17185–17190 (2002).
3. Xu, J. & Wu, L. G. The decrease in the presynaptic calcium current is a major causeof short-term depression at a calyx-type synapse. Neuron 46, 633–645 (2005).
4. Krey, J. F. & Dolmetsch, R. E. Molecular mechanisms of autism: a possible role forCa21 signaling. Curr. Opin. Neurobiol. 17, 112–119 (2007).
5. Yang, P. S., Mori, M. X., Antony, E. A., Tadross, M. R. & Yue, D. T. A singlecalmodulin imparts distinct N- and C-lobe regulatory processes to individualCaV1.3 channels. Biophys. J. Suppl. abstr. 1669-Plat (2007).
6. Erickson, M. G., Liang, H., Mori, M. X. & Yue, D. T. FRET two-hybrid mappingreveals function and location of L-type Ca21 channel CaM preassociation. Neuron39, 97–107 (2003).
7. Liang, H. et al. Unified mechanisms of Ca21 regulation across the Ca21 channelfamily. Neuron 39, 951–960 (2003).
8. Yang, P. S. et al. Switching of Ca21-dependent inactivation of CaV1.3 channels bycalcium binding proteins of auditory hair cells. J. Neurosci. 26, 10677–10689 (2006).
9. Black, D. J., Leonard, J. & Persechini, A. Biphasic Ca21-dependent switching in acalmodulin-IQ domain complex. Biochemistry 45, 6987–6995 (2006).
10. Singh, A. et al. Modulation of voltage- and Ca21-dependent gating of CaV1.3L-type calcium channels by alternative splicing of a C-terminal regulatory domain.J. Biol. Chem. 283, 20733–20744 (2008).
11. Singh, A. et al. C-terminal modulator controls Ca21-dependent gating of CaV1.4L-type Ca21 channels. Nature Neurosci. 9, 1108–1116 (2006).
12. Wahl-Schott, C. et al. Switching off calcium-dependent inactivation in L-typecalcium channels by an autoinhibitory domain. Proc. Natl Acad. Sci. USA 103,15657–15662 (2006).
13. Platzer, J. et al. Congenital deafness and sinoatrial node dysfunction in micelacking class D L-type Ca21 channels. Cell 102, 89–97 (2000).
14. Namkung, Y. et al. Requirement for the L-type Ca21 channel a1D subunit inpostnatal pancreatic b cell generation. J. Clin. Invest. 108, 1015–1022 (2001).
15. Strom, T. M. et al. An L-type calcium-channel gene mutated in incompleteX-linked congenital stationary night blindness. Nature Genet. 19, 260–263 (1998).
16. Doering, C. J., Hamid, J., Simms, B., McRory, J. E. & Zamponi, G. W. CaV1.4encodes a calcium channel with low open probability and unitary conductance.Biophys. J. 89, 3042–3048 (2005).
17. Dick, I. E. et al. A modular switch for spatial Ca21 selectivity in the calmodulinregulation of CaV channels. Nature 451, 830–834 (2008).
18. Peterson, B. Z. et al. Critical determinants of Ca21-dependent inactivation withinan EF-hand motif of L-type Ca21 channels. Biophys. J. 78, 1906–1920 (2000).
19. Griessmeier, K. et al. Calmodulin is a functional regulator of CaV1.4 L-type Ca21
channels. J. Biol. Chem. 284, 29809–29816 (2009).20. Cantor, C. R. & Schimmel, P. R. Biophysical Chemistry: Part III: The Behavior of
Biological Macromolecules 11th edn, 887–978 (Macmillan, 1980).21. Kim, J., Ghosh, S., Nunziato, D. A. & Pitt, G. S. Identification of the components
controlling inactivation of voltage-gated Ca21 channels. Neuron 41, 745–754 (2004).22. Xiong, L., Kleerekoper, Q. K., He, R., Putkey, J. A. & Hamilton, S. L. Sites on
calmodulin that interact with the C-terminal tail of CaV1.2 channel. J. Biol. Chem.280, 7070–7079 (2005).
23. Black, D. J., Tran, Q. K. & Persechini, A. Monitoring the total available calmodulinconcentration in intact cells over the physiological range in free Ca21. Cell Calcium35, 415–425 (2004).
24. Slemmon, J. R., Feng, B. & Erhardt, J. A. Small proteins that modulate calmodulin-dependent signal transduction: effects of PEP-19, neuromodulin, and neurograninon enzyme activation and cellular homeostasis. Mol. Neurobiol. 22, 99–113 (2000).
25. Chambers, J. S., Thomas, D., Saland, L., Neve, R. L. & Perrone-Bizzozero, N. I.Growth-associated protein 43 (GAP-43) and synaptophysin alterations in thedentate gyrus of patients with schizophrenia. Prog. Neuropsychopharmacol. Biol.Psychiatry 29, 283–290 (2005).
26. Bezprozvanny, I. Calcium signaling and neurodegenerative diseases. Trends Mol.Med. 15, 89–100 (2009).
27. Masliah, E. et al. Dopaminergic loss and inclusion body formation in a-synucleinmice: implications for neurodegenerative disorders. Science 287, 1265–1269(2000).
28. Lee, D., Lee, S. Y., Lee, E. N., Chang, C. S. & Paik, S. R. a-Synuclein exhibitscompetitive interaction between calmodulin and synthetic membranes.J. Neurochem. 82, 1007–1017 (2002).
29. Chan, C. S. et al. ‘Rejuvenation’ protects neurons in mouse models of Parkinson’sdisease. Nature 447, 1081–1086 (2007).
30. Ikeda, S. et al. MicroRNA-1 negatively regulates expression of the hypertrophy-associated calmodulin and Mef2a genes. Mol. Cell. Biol. 29, 2193–2204 (2009).
Supplementary Information is linked to the online version of the paper atwww.nature.com/nature.
Acknowledgements We thank M. Tadross, I. Dick and members of the CalciumSignals Laboratory for comments; M. Tadross for data-acquisition software;D. J. Black and A. Persechini for BSCaMIQ and neuromodulin complementary DNA;J. McRory and T. Snutch for human a1F cDNA; J. Streissnig for human a1D cDNA;and V. Wu for earlier foundational experiments. This work is supported by grantsfrom the US National Institute of Mental Health, the US National Heart, Lung, andBlood Institute and the US National Institute of Neurological Disorders and Stroke.
Author Contributions X.L. devised and refined experimental design, carried out allphases of the experiments and performed extensive data analysis. P.S.Y. consultedon initial molecular biology approaches, constructed certain channels with ICDIpoint mutations and contributed importantly to CaV1.4 expression strategies andelectrophysiological characterization. W.Y. conducted FRET experiments,undertook molecular biology and extensively managed technical aspects of theproject. D.T.Y. conceived, refined and oversaw the experiments, performed FRETexperiments, analysed data and wrote the manuscript. All authors commented onand edited the manuscript.
Author Information Reprints and permissions information is available atwww.nature.com/reprints. The authors declare no competing financial interests.Correspondence and requests for materials should be addressed to D.T.Y.([email protected]).
LETTERS NATURE | Vol 463 | 18 February 2010
972Macmillan Publishers Limited. All rights reserved©2010
METHODSMolecular biology. We engineered the rat CaV1.3 long variant (a1D,
AF370009.1) as follows. For Fig. 1, a unique XbaI site was introduced by PCR
following the IQ domain. The DCT of humana1F (NP005174) was amplified and
cloned non-directionally via the unique XbaI site, yielding the sequence in
Supplementary Information, section 1.1. For Supplementary Fig. 3.4, a similar
process was performed, except appropriate sections of the DCT of rat CaV1.3
long variant (a1D, AF370009.1) were first PCR amplified with flanking SpeI and
XbaI sites (compatible ends) and cloned into the aforementioned unique XbaI
site, leaving a unique XbaI site after the inserted section of the rat DCT.
Appropriate segments of the ICDI segment of the human CaV1.3 long variant
(a1D, NM000718) were then PCR-amplified with flanking SpeI and XbaI sites
and cloned into the unique XbaI site, leaving a unique XbaI site after the inserted
ICDI segment. For the V41A insertion (Supplementary Fig. 3.4d), the human
ICDI was point mutated using QuikChange mutagenesis (Strategene) before
PCR amplification and insertion into the channel construct. For the A41V inser-
tion (Supplementary Fig. 3.4e), the rat ICDI was similarly point-mutated before
cloning into the unique XbaI site of the aforementioned engineered rat CaV1.3long variant. For FRET two-hybrid constructs, fluorophore-tagged CaM con-
structs were made as described previously6. We made other FRET constructs by
replacing CaM with appropriate PCR-amplified segments, via unique NotI and
XbaI sites flanking CaM6. Details of CaM sponges can be found in Supplemen-
tary Information, section 3.1. All segments subject to PCR or QuikChange were
verified in their entirety by sequencing.
Transfection of HEK293 cells. For electrophysiology experiments, HEK293 cells
were cultured in 10-cm plates, and channels were transiently transfected follow-
ing a calcium phosphate protocol6,8. We applied 8mg of cDNA encoding the a1
subunit of the desired channel, along with 8 mg of rat brain b2a subunit (M80545)
and 8 mg of rat brain a2d subunit (NM012919.2). b2a minimized voltage inac-
tivation, enhancing resolution of CDI. Additional cDNA was added as required
in co-transfections. All of the above cDNA constructs were driven by a cyto-
megalovirus promoter. To enhance expression, cDNA for simian virus 40
T antigen (1–2mg) was co-transfected. For FRET two-hybrid experiments, trans-
fections and experiments were performed as described previously6.
Electrophysiology and FRET were done at room temperature (20–22 uC)
1–2 days after transfection.
Whole-cell recording. Whole-cell recordings were obtained at room tem-
perature using an Axopatch 200A amplifier (Axon Instruments). Electrodes were
pulled with borosilicate glass capillaries (MTW 150-F4, World Precision
Instruments), resulting in 1–3-MV resistances, before series resistance com-
pensation of 80%. The internal solutions contained 135 mM CsMeSO3, 5 mM
CsCl2, 1 mM MgCl2, 4 mM MgATP, 5mM HEPES (pH 7.3) and 5 mM EGTA, at
290 mosM, adjusted with glucose. The bath solution contained 140 mM TEA-
MeSO3, 10 mM HEPES (pH 7.3) and 10mM CaCl2 or BaCl2, at 300 mosM,
adjusted with glucose. These are as reported previously8. To augment currents
for the full-length CaV1.4 experiments in Fig. 2e, we used 40 mM CaCl2 or BaCl2in the bath solution and adjusted TEA-MeSO3 downwards to preserve osmolar-
ity. Furthermore, 5mM Bay K 8644 was present in the bath throughout to further
enhance currents.
FRET optical imaging. FRET two-hybrid experiments were carried out in
HEK293 cells and analysed as described previously6. During imaging, the bath
solution was either a Tyrode’s buffer containing 2 mM Ca21 or the standard
electrophysiological-recording bath solution described earlier. Concentration-
dependent spurious FRET was subtracted from the raw data before binding-
curve analysis17. For simultaneous BSCaMIQ imaging and patch-clamp recording,
three-cube FRET measurements were obtained before whole-cell break-in, and
did not change appreciably thereafter. For ICDI binding curves in Figs 2a and 4b,
an unlabelled IQ domain of neuromodulin (see Supplementary Information,
section 3.1, for sequence) was co-expressed to reduce interference from endogen-
ous CaM.
doi:10.1038/nature08766
Macmillan Publishers Limited. All rights reserved©2010
CORRIGENDUMdoi:10.1038/nature09034
Enzyme-inhibitor-like tuning of Ca21
channel connectivity with calmodulinXiaodong Liu, Philemon S. Yang, Wanjun Yang & David T. Yue
Nature 463, 968–972 (2010)
In the Acknowledgements section of this Letter, the work was in-correctly listed as being funded in part by the US National Instituteof Neurological Disorders and Stroke. This work was in fact funded bythe US National Institute on Deafness and Other CommunicationDisorders.
CORRECTIONS & AMENDMENTS NATUREjVol 464j29 April 2010
1390Macmillan Publishers Limited. All rights reserved©2010


![Lobe Specific Ca2 -Calmodulin Nano-Domain in Neuronal ... · induction of NMDA receptor dependent LTP and LTD require ... Shaevitz et al. [29] used an algebraic recursive method to](https://img.pdfslide.us/doc/110x75/5fc975367e3ee357443ed9d1/lobe-specific-ca2-calmodulin-nano-domain-in-neuronal-induction-of-nmda-receptor.jpg)