Embed Size (px)
Citation preview
Biophysical Journal Volume 72 February 1997 522-532
Enzyme-inhibitor Association Thermodynamics: Explicit and ContinuumSolvent Studies
Haluk Resat, Tami J. Marrone, and J. Andrew McCammonDepartment of Chemistry and Biochemistry, and Department of Pharmacology, University of California at San Diego, La Jolla, California92093-0365 USA
ABSTRACT Studying the thermodynamics of biochemical association reactions at the microscopic level requires efficientsampling of the configurations of the reactants and solvent as a function of the reaction pathways. In most cases, theassociating ligand and receptor have complementary interlocking shapes. Upon association, loosely connected or discon-nected solvent cavities at and around the binding site are formed. Disconnected solvent regions lead to severe statisticalsampling problems when simulations are performed with explicit solvent. It was recently proposed that, when such limitationsare encountered, they might be overcome by the use of the grand canonical ensemble. Here we investigate one such caseand report the association free energy profile (potential of mean force) between trypsin and benzamidine along a chosenreaction coordinate as calculated using the grand canonical Monte Carlo method. The free energy profile is also calculatedfor a continuum solvent model using the Poisson equation, and the results are compared to the explicit water simulations. Thecomparison shows that the continuum solvent approach is surprisingly successful in reproducing the explicit solventsimulation results. The Monte Carlo results are analyzed in detail with respect to solvation structure. In the binding sitechannel there are waters bridging the carbonyl oxygen groups of Aspl 89 with the NH2 groups of benzamidine, which aredisplaced upon inhibitor binding. A similar solvent-bridging configuration has been seen in the crystal structure of trypsincomplexed with bovine pancreatic trypsin inhibitor. The predicted locations of other internal waters are in very goodagreement with the positions found in the crystal structures, which supports the accuracy of the simulations.
INTRODUCTION
Understanding how reactant molecules associate, and therelative stabilities of their different arrangements, has longbeen an important goal of the chemical sciences. In bio-chemical applications, knowledge of the free energy profile(i.e., the potential of mean force between the solutes) canaid in the design of biologically active agents, and it ishelpful in the analysis of binding kinetics (Lybrand, 1995;Marrone et al., 1997). Although knowledge of the potentialof mean force (pmf) is valuable in the understanding ofmolecular associations, calculations of such quantities usingsimulations with explicit solvent models have mostly beenlimited to small solutes because of computational expense(Pratt et al., 1994).
Appropriate sampling of the solvent degrees of freedomis essential for an accurate determination of free energies ofbinding. However, configurational sampling is especiallydifficult-and the calculations are correspondingly moreexpensive-when binding of the solutes involves the trap-ping of solvent molecules within concave binding surfaces.For example, in ligand-receptor binding, water molecules
Received for publication 26 August 1996 and in final form 5 November1996.Address reprint requests to Dr. Tami J. Marrone, Department of Chemistryand Biochemistry, University of California at San Diego, 9500 GilmanDrive, Department 0365, La Jolla, CA 92093-0365. Tel.: 619-822-0255;Fax: 619-534-7042; E-mail: [email protected]. Resat's present address is Department of Physics, Koc University,Istinye, Istanbul 80860, Turkey. E-mail: [email protected]. McCammon's E-mail address is [email protected] 1997 by the Biophysical Society0006-3495/97/02/522/11 $2.00
may have to be emptied out of a binding channel as theligand starts to penetrate. The capping of the channel by theligand may form a confined space, i.e., a water pocket, andthis pocket gets smaller as the ligand moves down thechannel. Using the usual canonical or microcanonical sim-ulation methods, it would be very hard to represent theequilibration of the water molecules that must be expelled.However, as discussed in earlier reports (Resat and Mezei,1994, 1996; Resat et al., 1996), the sampling difficulties dueto the changes in the solvation pattem during docking canbe relieved in principle by utilizing grand canonical ratherthan the more conventional canonical or microcanonicalensemble simulation methods. The grand canonical ensem-ble Monte Carlo (GCMC) simulation method has beenshown to be quite efficient in obtaining good statisticalconvergence for predicting the solvation patterns in thecrystal hydrates of a polydisaccharide (Resat and Mezei,1994) and of a nucleic acid/drug system (Resat and Mezei,1996). The equivalence of the grand canonical and canon-ical ensemble in pmf calculations was shown by computingthe pmf between oppositely charged ions and between smallhydrophobic particles (Resat et al., 1996). Following up onthe earlier successes in overcoming the confined spaceeffects, we employ the GCMC simulation method in thepresent work to calculate the pmf along a one-dimensionalcurvilinear reaction coordinate between the enzyme trypsinand its inhibitor benzamidine, a prototypical ligand-receptorsystem.
Although explicit solvent simulations are the preferredchoice whenever feasible, their computational expensemakes pmf calculations difficult for large biomolecular as
522
Enzyme-inhibitor Association Thermodynamics
semblies. The use of simplified but less expensive theoret-ical approaches such as continuum dielectric representationsof solvent (Madura et al., 1994; Honig and Nicholls, 1995;Gilson, 1995) or integral equation methods (Friedman,1985; Pettitt et al., 1986) can be helpful for such cases. Forthis reason, another aim of the present work is to comparethe results of the explicit solvent GCMC simulations withthose of continuum solvent Poisson equation calculations.The benzamidine-trypsin system should be a particularlydifficult test case for continuum methods, because individ-ual water molecules bridge charged solute groups duringbinding. Nevertheless, our investigation with different setsof parameters shows that the continuum solvent approachperforms surprisingly well.
POTENTIAL OF MEAN FORCE
We have recently presented the details of the grand canon-ical ensemble pmf calculations. Therefore, the underlyingtheory will be repeated here only briefly; further details maybe found in Resat et al. (1996) and in Friedman (1985). Thepmf, W(R), is the free energy of a system as a function of aselected set of coordinates (reaction coordinates, R). It isrelated to the equilibrium probability distribution p of statesas
,3W(R) = -ln p(R) + IC, (1)
where ,B = I/kBT, T is the temperature, and C is a constant.In the above equation, the reaction coordinate R may bemultidimensional.
In many instances, calculating the probability distributionfunction p(R) using a direct Boltzmann sampling in a com-puter simulation is not practical (Mezei and Beveridge,1986; Straatsma and McCammon, 1992). Therefore, to ob-tain adequate sampling, the pmf calculations are generallydone utilizing non-Boltzmann or biased (umbrella) sam-pling (Patey and Valleau, 1975). Even though the use of abiasing potential alters the Hamiltonian We used in the sim-ulations, it can be shown that the effects of the biasing canbe eliminated from the calculated thermodynamic quanti-ties. If the biasing potential is Ub(R), then the pmf is givenas
f3W(R) = -ln pb(R) - 3Ub(R) + ln(e1Ub(R))b + 'C (2)
where pb(R) and ...)b, respectively, are the probability dis-tribution and the ensemble average of the enclosed quantitycalculated using the biased Hamiltonian, We + Ub(R). AsEq. 2 shows, a uniform sampling of the distribution ofstates, i.e., Pb = constant, would be obtained if an optimalchoice for the biasing potential, Ub(R) = - W(R), could bemade. In most cases, the pmf does not have a simple form,and it is difficult to choose a near-optimal biasing potential.To avoid such problems and to obtain the optimal sampling,Mezei (1987) developed the adaptive umbrella samplingscheme, which is used in this study. In the adaptive um-
potential is self-consistently determined and refined duringthe simulation, and the simulation is run until an acceptableconvergence is obtained. In other words, the biasing poten-tial is updated and adapted at regular intervals during thesimulation.
COMPUTATIONS
Crystal structure
The crystal structure for the trypsin-benzamidine complexwas taken from the Protein Data Bank (PDB) archives(name: 3ptb.pdb); it had been deposited by Bode andSchwager (1975). It is the structure for bovine f3-trypsinrefined to 1.8-A resolution with an R factor of 0.23. Theestimated standard deviation of the atomic coordinates isless than 0.1 A. The amidinium group of the inhibitorbenzamidine is twisted out of the benzene plane by about70. Coordinates of the waters used in the analysis of thebridging waters at the binding site, discussed in the Results/Internal waters section, were taken from the crystal structureof the free trypsin (PDB: 2ptn.pdb) deposited by Walter etal. (1982). For this, the free trypsin crystal structure wassuperimposed on the trypsin structure in the enzyme-inhib-itor complex. The two structures are almost identical. Anextensive study of solvent structure in crystals of trypsinmay be found in Finer-Moore et al. (1992).
Reaction coordinate assignment
Even for small flexible molecules, the reaction coordinate inEq. 1 will typically have many degrees of freedom. Thislarge dimensionality makes the computational approach dif-ficult and expensive. For this reason, computations areusually feasible only when various approximations are em-ployed. For example, the free energy calculations can beperformed along a certain reaction coordinate of reduceddimensionality, assuming that the predetermined reactioncoordinate appropriately represents the physical process.For this initial study of a biomolecular system, we simplyuse rigid geometries for the enzyme and the inhibitor, to-gether with a prescribed path of relative displacement. An-other major reason for using rigid molecules was to be ableto appropriately compare with the continuum solvent (Pois-son equation) calculations.The reaction coordinate was defined as a curvilinear
one-dimensional path, along which the inhibitor slightlyrotates as it moves down the binding site channel. Althoughdetailed realism is not a primary goal of the current study,the use of rigid molecules is perhaps not a drastic approx-imation, because the crystal structures of free trypsin andtrypsin inhibited by benzamidine are very similar (Bode andSchwager, 1975; Bode et al., 1976; Marquart et al., 1983).Earlier simulation studies also suggest that the structuralfluctuations in and around the binding site channel are quitesmall, irrespective of the inhibitor position (Wong and Mc-
brella sampling algorithm, the optimal umbrella sampling
523Resat et al.
Cammon, 1986a,b; Luty et al., 1995).

Volume 72 February 1997
The reaction coordinate (Fig. 1) was determined by visualanalysis of the binding site channel. For simplicity, theenzyme was fixed during the simulation, and only the in-hibitor was moved along the reaction coordinate as a func-tion of the coupling parameter. The motion of benzamidinewas defined, using analytical formulas, as a curved line thatlies approximately at the centerline of the binding sitechannel. The curvature of the linear path was small, and theinhibitor was also slightly rotated around its central axis asit was translated. The maximum span of the path was suchthat benzamidine does not go beyond the entrance to thebinding site channel, because it is difficult to define aunique path outside this channel. It has been shown inearlier studies that once the benzamidine enters the channel,it will bind with almost absolute certainty. Docking studies(Luty et al., 1995) further suggest that benzamidine does nottumble inside the channel. These observations and the largeassociation constant (Mares-Guia et al., 1977; Bode andSchwager, 1975) help to motivate the rigid geometry as-sumption and the empirical selection of the reaction coor-dinate.
Protonation state assignment
The protonation states of the trypsin residues were deter-mined using the algorithm developed by Antosiewitz et al.(1994). The pKa calculations were performed for the iso-lated protein, and all polar residues were explicitly includedin the calculations. The pH was 7. The computed protona-tion states were equivalent to the charge states calculatedusing the standard model at this pH; Lys and Arg residueswere positively charged, and Glu and Asp residues werenegatively charged. The N- and C-termini were in theircharged states. For His57 and Tyr39, the Antosiewitz et al.algorithm predicted charges of +0.289 and -0.145, respec-tively; however, we chose to assign total charges of zero forthose two residues to be able to use standard force-fieldparameters. Thus, the total charge of trypsin was +6 (= 14Lys + 2 Arg - 4 Glu - 6 Asp + Ilel6 - Asn245).The site charges for the inhibitor benzamidine were de-
rived from the electrostatic potentials determined usingquantum calculations employing the 6-31g** basis set (Fig.2). Starting with the crystal coordinates, the Gaussian-92
FIGURE 1 Reaction coordinate utilized in the calculations. Stereo pictures from two different angles show the path traveled by benzamidine. For clarity,only a portion of trypsin is shown, and the dashed line connects the locations of C7:Ben along the path.
524 Biophysical Journal

Enzyme-Inhibitor Association Thermodynamics
H3
H4 ( C4 C1 7(077(+0.164) (-0.048) (+0.025) / \
, A (-0.909) HA
H3 (+0.160) (+0.146) H2
BENZAMIDINE
FIGURE 2 Benzamidine site labels and charges used in the simulation.
program (Frisch et al., 1992) was used to calculate theelectrostatic potential distribution, which was then fitted toderive the site charges, using Merz-Kollman algorithm asimplemented in the same program. All hydrogens wereexplicitly included, and the total charge of the inhibitorwas +1.
Grand canonical Monte Carlo simulation setup
Starting with the published crystal structure (Bode andSchwager, 1975), the trypsin-benzamidine complex wasrotated in the simulation unit cell until all atoms wereseparated from any of the closest image atoms by more than12 A. This optimization also placed the binding site regionin such an orientation that the movement of the inhibitoralong the defined reaction pathway was almost along aprincipal diagonal of the unit cell. This optimized orienta-tion minimized the replication effects due to the appliedperiodic boundary conditions. The resulting rectangular unitcell box size was 51.56 X 51.26 X 52.46 A3. Using thevolume available to the solvent, the unit cell should containapproximately 3664 waters. The excess chemical potential wasadjusted appropriately to obtain the estimated solvent density.As discussed in the previous section, pKa studies resulted
in the standard residue protonation states at pH 7. For theenzyme, only polar hydrogens and the capping protons ofthe N-terminus residue were included as hydrogen interac-tion sites, and united atom models were employed for non-polar protons. Site charges and short-range interaction pa-rameters for the protein were taken from the OPLS forcefield library (Jorgensen and Tirado-Rives, 1988). As de-scribed above, inhibitor site charges (Fig. 2) were deter-mined using ab initio methods, and all hydrogens wereincluded as interaction sites. The short-range parameters forthe ring part were assigned using the OPLS parameters forbenzene, and analogous arginine parameters were assignedto the amidinium group. The water molecules were modeledwith the TIP3P model (Jorgensen et al., 1983).
The solute-solvent and solvent-solvent interactions weretruncated, using a spherical cutoff at 11 iA. The solute-solvent cutoff criteria were based on the distance from awater to the nearest site of the solute groups, and eachprotein residue and the benzamidine were treated as a sep-arate group. Solute and solvent move step sizes were chosensuch that the average move acceptance rate was approxi-mately 50%. To accelerate the sampling rate, distance-dependent preferential sampling was employed both for theregular moves and for the insertion/deletion attempts. Thedistance dependence of the preferential sampling was im-plemented using the carboxylate group of Aspl89 as thecenter. The preferential sampling adopted a l/r3 form forwaters at distances greater than 8 A from the Asp 189carboxylate group, and the preferential sampling weightfunction was uniform for distances smaller than 8 A. Thisallowed for an enhanced sampling of the waters in or aroundthe binding site channel.The reaction coordinate was divided into four windows to
reduce the size of the reaction coordinate region covered ineach simulation for more efficient sampling. The regionswere R < 5.84 A, 5.36 A <R < 6.78 A, 6.31A <R< 8.78A, and 8.43 A < R for windows 1 to 4, respectively. Theconstant (Q,V,T) ensemble grand canonical Monte Carlo(GCMC) molecular simulations (Adams, 1975; Resat et al.,1996) for each region were performed using adaptive um-brella sampling (Mezei, 1987). Simulations were run for 30,60, 50, and 48 million steps (one step = one regular move +one insertion/deletion step) for windows 1 to 4, respectively, at298 K. The convergence of the simulations was determined bythe changes in the calculated pmf, and the estimated statisticalsampling error was approximately ± 1 kcallmol.
Poisson equation calculations
To determine how well they compare with the explicitsolvent simulation results, the pmf utilizing a continuumsolvent was also computed using the Poisson equation(Honig and Nicholls, 1995; Gilson, 1995; Madura et al.,1994; Pratt et al., 1994; Soman et al., 1989). The Poissonequation was solved using a finite-difference algorithm andfocusing within the UHBD program (Davis et al., 1991).Calculations utilized a 1103 grid with focusing to a finalgrid spacing of 0.25 A. Dielectric constants of 1 and 78were assigned for the trypsin-benzamidine complex and forthe continuum solvent, respectively. The dielectric bound-ary between the solvent and the biomolecules was definedusing a molecular surface with different surface probe radii(further details are given in the next section). To ensureproper focusing, the focusing volume was defined afterinvestigating how the electrostatic potentials on protein siteschange as the reaction coordinate is varied. This was doneby comparing the electrostatic potentials when the inhibitorwas at its bound position VB and when the inhibitor was atthe entrance to the channel Vu, i.e., at the opposite ends ofthe investigated pathway. Fig. 3 reports the difference AV =
525Resat et al.
Volume 72 February 1997
60
40
20
0
-20
-40
-60
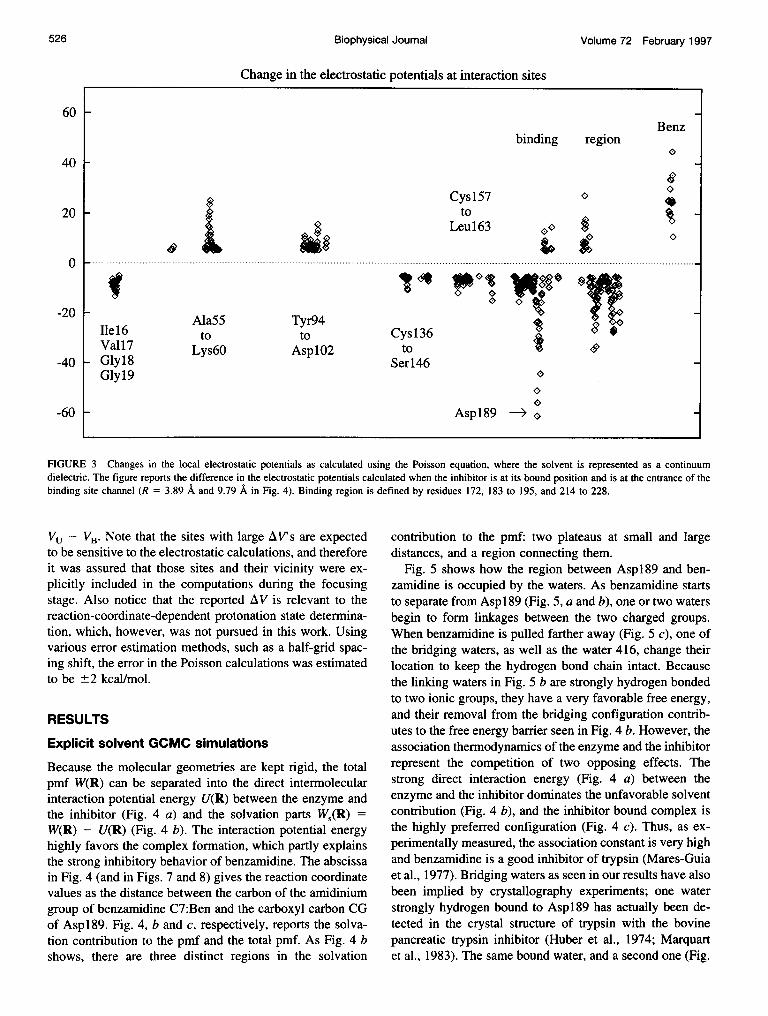
FIGURE 3 Changes in the local electrostatic potentials as calculated using the Poisson equation, where the solvent is represented as a continuumdielectric. The figure reports the difference in the electrostatic potentials calculated when the inhibitor is at its bound position and is at the entrance of thebinding site channel (R = 3.89 A and 9.79 A in Fig. 4). Binding region is defined by residues 172, 183 to 195, and 214 to 228.
VU- VB. Note that the sites with large AV's are expectedto be sensitive to the electrostatic calculations, and thereforeit was assured that those sites and their vicinity were ex-plicitly included in the computations during the focusingstage. Also notice that the reported AV is relevant to thereaction-coordinate-dependent protonation state determina-tion, which, however, was not pursued in this work. Usingvarious error estimation methods, such as a half-grid spac-ing shift, the error in the Poisson calculations was estimatedto be ±2 kcal/mol.
RESULTS
Explicit solvent GCMC simulations
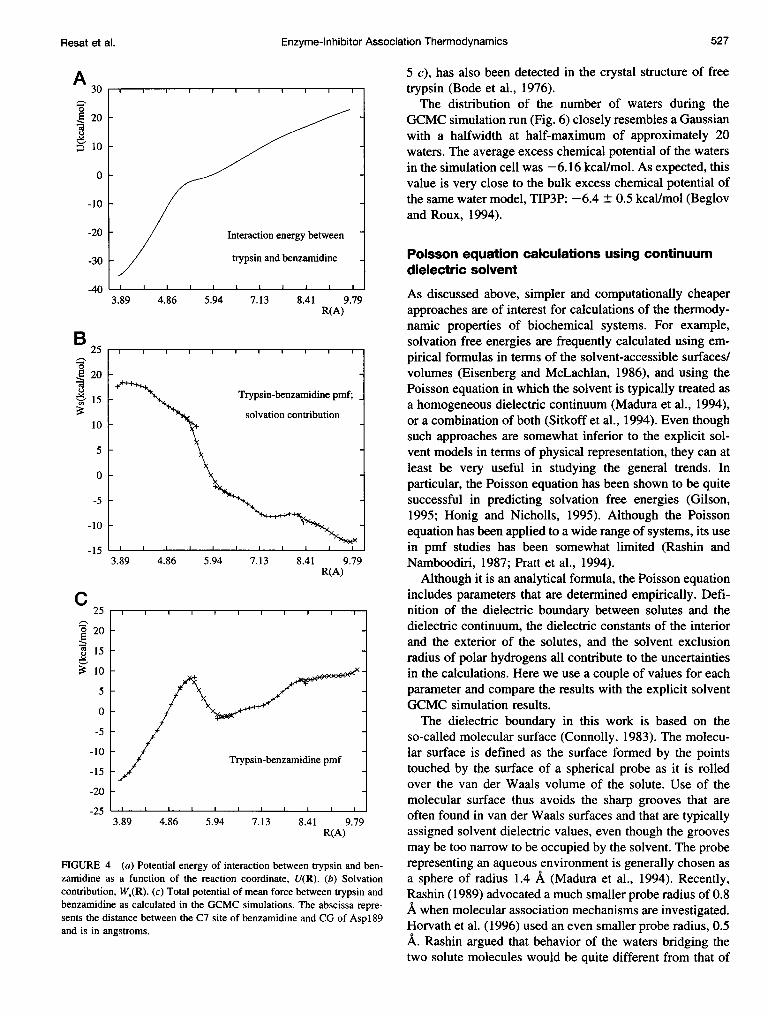
Because the molecular geometries are kept rigid, the totalpmf W(R) can be separated into the direct intermolecularinteraction potential energy U(R) between the enzyme andthe inhibitor (Fig. 4 a) and the solvation parts Ws(R) =W(R) - U(R) (Fig. 4 b). The interaction potential energyhighly favors the complex formation, which partly explainsthe strong inhibitory behavior of benzamidine. The abscissain Fig. 4 (and in Figs. 7 and 8) gives the reaction coordinatevalues as the distance between the carbon of the amidiniumgroup of benzamidine C7:Ben and the carboxyl carbon CGof Aspl89. Fig. 4, b and c, respectively, reports the solva-tion contribution to the pmf and the total pmf. As Fig. 4 bshows, there are three distinct regions in the solvation
contribution to the pmf: two plateaus at small and largedistances, and a region connecting them.
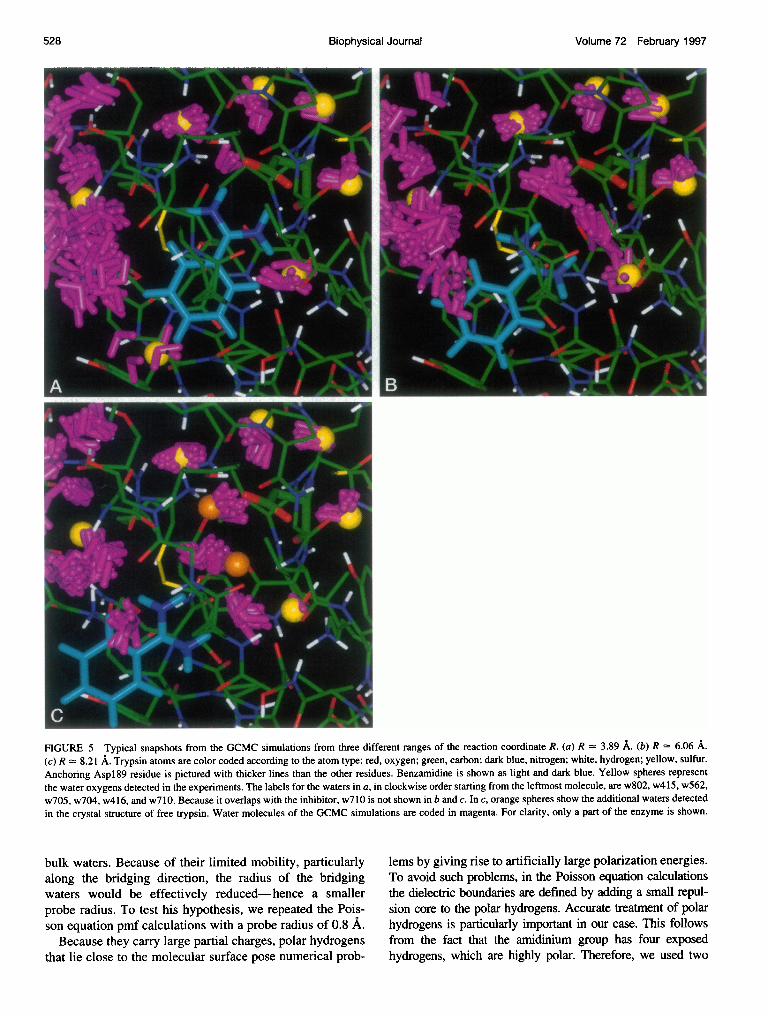
Fig. 5 shows how the region between Aspl89 and ben-zamidine is occupied by the waters. As benzamidine startsto separate from Asp189 (Fig. 5, a and b), one or two watersbegin to form linkages between the two charged groups.When benzamidine is pulled farther away (Fig. 5 c), one ofthe bridging waters, as well as the water 416, change theirlocation to keep the hydrogen bond chain intact. Becausethe linking waters in Fig. 5 b are strongly hydrogen bondedto two ionic groups, they have a very favorable free energy,and their removal from the bridging configuration contrib-utes to the free energy barrier seen in Fig. 4 b. However, theassociation thermodynamics of the enzyme and the inhibitorrepresent the competition of two opposing effects. Thestrong direct interaction energy (Fig. 4 a) between theenzyme and the inhibitor dominates the unfavorable solventcontribution (Fig. 4 b), and the inhibitor bound complex isthe highly preferred configuration (Fig. 4 c). Thus, as ex-perimentally measured, the association constant is very highand benzamidine is a good inhibitor of trypsin (Mares-Guiaet al., 1977). Bridging waters as seen in our results have alsobeen implied by crystallography experiments; one waterstrongly hydrogen bound to Asp189 has actually been de-tected in the crystal structure of trypsin with the bovinepancreatic trypsin inhibitor (Huber et al., 1974; Marquartet al., 1983). The same bound water, and a second one (Fig.
Change in the electrostatic potentials at interaction sites
Benzbinding region
Cysl57to
Leul63
-............. ..................................................................................................................................................................................
Ala55 Tyr94C 3Ilel6 to to Cysl36 <
Vall7 tot
Vl7Lys60 AsplO2 to- Glyl8 Serl46
Glyl9
Aspl89 e < 7
526 Biophysical Journal
Enzyme-Inhibitor Association Thermodynamics
A30
1-
| 20
D 10
0
-10 -
-20 F
-30 -
-40
B25
1-1
20
wt 15
10
5
0
-5
-10
-15
C25
I--,
C) 20
Y 15
W 10
lo5
0
-5
-10
-15
-20
-25
3.89 4.86 5.94 7.13 8.41 9.79R(A)
Trypsin-benzamidine pmf;
solvation contribution
3.89 4.86 5.94 7.13 8.41 9.79R(A)
X Trypsin-benzamidine pmf
3.89 4.86 5.94 7.13 8.41 9.79R(A)
FIGURE 4 (a) Potential energy of interaction between trypsin and ben-zamidine as a function of the reaction coordinate, U(R). (b) Solvationcontribution, W.(R). (c) Total potential of mean force between trypsin andbenzamidine as calculated in the GCMC simulations. The abscissa repre-sents the distance between the C7 site of benzamidine and CG of Aspl189and is in angstroms.
F
two solute molecules would be quite different from that of
Interaction energy between
trypsin and benzamidine
5 c), has also been detected in the crystal structure of freetrypsin (Bode et al., 1976).The distribution of the number of waters during the
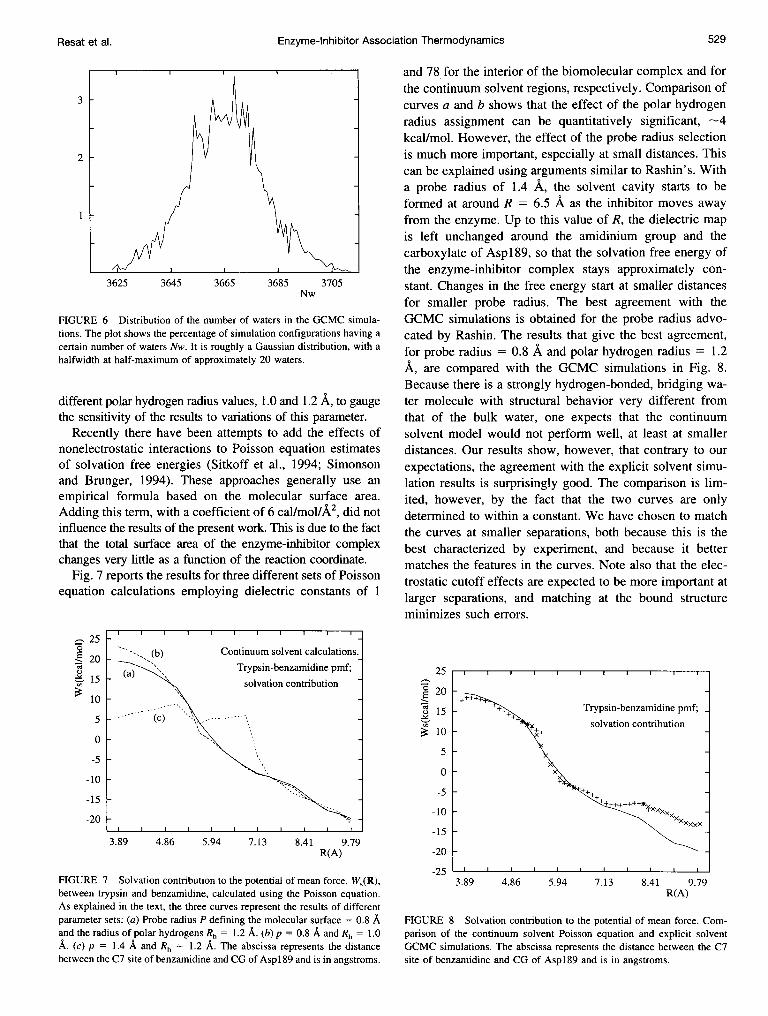
GCMC simulation run (Fig. 6) closely resembles a Gaussianwith a halfwidth at half-maximum of approximately 20waters. The average excess chemical potential of the watersin the simulation cell was -6.16 kcal/mol. As expected, thisvalue is very close to the bulk excess chemical potential ofthe same water model, TIP3P: -6.4 ± 0.5 kcallmol (Beglovand Roux, 1994).
Poisson equation calculations using continuumdielectric solvent
As discussed above, simpler and computationally cheaperapproaches are of interest for calculations of the thermody-namic properties of biochemical systems. For example,solvation free energies are frequently calculated using em-pirical formulas in terms of the solvent-accessible surfaces/volumes (Eisenberg and McLachlan, 1986), and using thePoisson equation in which the solvent is typically treated asa homogeneous dielectric continuum (Madura et al., 1994),or a combination of both (Sitkoff et al., 1994). Even thoughsuch approaches are somewhat inferior to the explicit sol-vent models in terms of physical representation, they can atleast be very useful in studying the general trends. Inparticular, the Poisson equation has been shown to be quitesuccessful in predicting solvation free energies (Gilson,1995; Honig and Nicholls, 1995). Although the Poissonequation has been applied to a wide range of systems, its usein pmf studies has been somewhat limited (Rashin andNamboodiri, 1987; Pratt et al., 1994).
Although it is an analytical formula, the Poisson equationincludes parameters that are determined empirically. Defi-nition of the dielectric boundary between solutes and thedielectric continuum, the dielectric constants of the interiorand the exterior of the solutes, and the solvent exclusionradius of polar hydrogens all contribute to the uncertaintiesin the calculations. Here we use a couple of values for eachparameter and compare the results with the explicit solventGCMC simulation results.The dielectric boundary in this work is based on the
so-called molecular surface (Connolly, 1983). The molecu-lar surface is defined as the surface formed by the pointstouched by the surface of a spherical probe as it is rolledover the van der Waals volume of the solute. Use of themolecular surface thus avoids the sharp grooves that areoften found in van der Waals surfaces and that are typicallyassigned solvent dielectric values, even though the groovesmay be too narrow to be occupied by the solvent. The proberepresenting an aqueous environment is generally chosen asa sphere of radius 1.4 A (Madura et al., 1994). Recently,Rashin (1989) advocated a much smaller probe radius of 0.8A when molecular association mechanisms are investigated.Horvath et al. (1996) used an even smaller probe radius, 0.5A. Rashin argued that behavior of the waters bridging the
Resat et al. 527
Volume 72 February 1997
FIGURE 5 Typical snapshots from the GCMC simulations from three different ranges of the reaction coordinate R. (a) R = 3.89 A. (b) R = 6.06 A.(c) R = 8.21 A. Trypsin atoms are color coded according to the atom type: red, oxygen; green, carbon; dark blue, nitrogen; white, hydrogen; yellow, sulfur.Anchoring Aspl89 residue is pictured with thicker lines than the other residues. Benzamidine is shown as light and dark blue. Yellow spheres representthe water oxygens detected in the experiments. The labels for the waters in a, in clockwise order starting from the leftmost molecule, are w802, w415, w562,w705, w704, w416, and w710. Because it overlaps with the inhibitor, w710 is not shown in b and c. In c, orange spheres show the additional waters detectedin the crystal structure of free trypsin. Water molecules of the GCMC simulations are coded in magenta. For clarity, only a part of the enzyme is shown.
bulk waters. Because of their limited mobility, particularlyalong the bridging direction, the radius of the bridgingwaters would be effectively reduced-hence a smallerprobe radius. To test his hypothesis, we repeated the Pois-son equation pmf calculations with a probe radius of 0.8 A.
Because they carry large partial charges, polar hydrogensthat lie close to the molecular surface pose numerical prob-
lems by giving rise to artificially large polarization energies.To avoid such problems, in the Poisson equation calculationsthe dielectric boundaries are defined by adding a small repul-sion core to the polar hydrogens. Accurate treatment of polarhydrogens is particularly important in our case. This followsfrom the fact that the amidinium group has four exposedhydrogens, which are highly polar. Therefore, we used two
528 Biophysical Journal
Enzyme-inhibitor Association Thermodynamics
3
2
1
3625 3645 3665 3685 3705Nw
FIGURE 6 Distribution of the number of waters in the GCMC simula-tions. The plot shows the percentage of simulation configurations having acertain number of waters Nw. It is roughly a Gaussian distribution, with ahalfwidth at half-maximum of approximately 20 waters.
different polar hydrogen radius values, 1.0 and 1.2 A, to gaugethe sensitivity of the results to variations of this parameter.
Recently there have been attempts to add the effects ofnonelectrostatic interactions to Poisson equation estimatesof solvation free energies (Sitkoff et al., 1994; Simonsonand Brunger, 1994). These approaches generally use anempirical formula based on the molecular surface area.Adding this term, with a coefficient of 6 cal/mol/A2, did notinfluence the results of the present work. This is due to the factthat the total surface area of the enzyme-inhibitor complexchanges very little as a function of the reaction coordinate.
Fig. 7 reports the results for three different sets of Poissonequation calculations employing dielectric constants of 1
25
20
A- 15
10
5
0
-5
-10
-15
-20
3.89 4.86 5.94 7.13 8.41 9.79R(A)
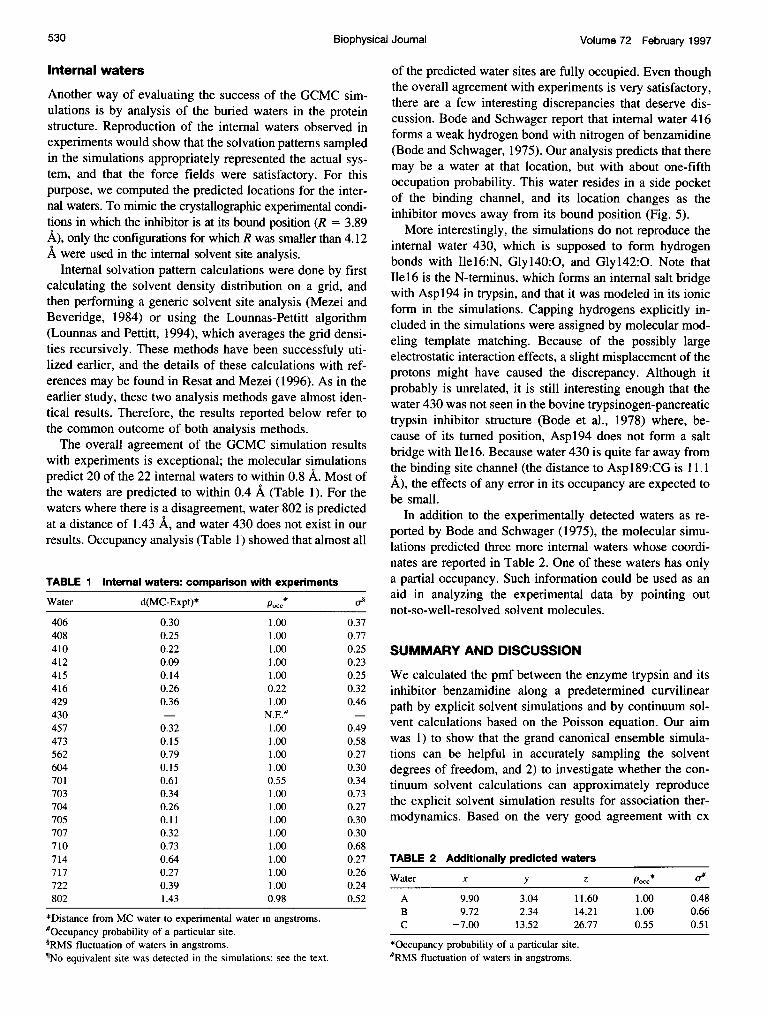
FIGURE 7 Solvation contribution to the potential of mean force, WJ(R),between trypsin and benzamidine, calculated using the Poisson equation.As explained in the text, the three curves represent the results of differentparameter sets: (a) Probe radius P defining the molecular surface = 0.8 Aand the radius of polar hydrogens Rh = 1.2 A. (b) p = 0.8 A and Rh = 1.0A. (c) p = 1.4 A and Rh = 1.2 A. The abscissa represents the distancebetween the C7 site of benzamidine and CG of Asp 189 and is in angstroms.
and 78 for the interior of the biomolecular complex and forthe continuum solvent regions, respectively. Comparison ofcurves a and b shows that the effect of the polar hydrogenradius assignment can be quantitatively significant, -4kcal/mol. However, the effect of the probe radius selectionis much more important, especially at small distances. Thiscan be explained using arguments similar to Rashin's. Witha probe radius of 1.4 A, the solvent cavity starts to beformed at around R = 6.5 A as the inhibitor moves awayfrom the enzyme. Up to this value of R, the dielectric mapis left unchanged around the amidinium group and thecarboxylate of AspI89, so that the solvation free energy ofthe enzyme-inhibitor complex stays approximately con-stant. Changes in the free energy start at smaller distancesfor smaller probe radius. The best agreement with theGCMC simulations is obtained for the probe radius advo-cated by Rashin. The results that give the best agreement,for probe radius = 0.8 A and polar hydrogen radius = 1.2A, are compared with the GCMC simulations in Fig. 8.Because there is a strongly hydrogen-bonded, bridging wa-ter molecule with structural behavior very different fromthat of the bulk water, one expects that the continuumsolvent model would not perform well, at least at smallerdistances. Our results show, however, that contrary to ourexpectations, the agreement with the explicit solvent simu-lation results is surprisingly good. The comparison is lim-ited, however, by the fact that the two curves are onlydetermined to within a constant. We have chosen to matchthe curves at smaller separations, both because this is thebest characterized by experiment, and because it bettermatches the features in the curves. Note also that the elec-trostatic cutoff effects are expected to be more important atlarger separations, and matching at the bound structureminimizes such errors.
25I--
E 20
o 15
: 10
5
0
-5
-10
-15
-20
-253.89 4.86 5.94 7.13 8.41 9.79
R(A)
FIGURE 8 Solvation contribution to the potential of mean force. Com-parison of the continuum solvent Poisson equation and explicit solventGCMC simulations. The abscissa represents the distance between the C7site of benzamidine and CG of Asp189 and is in angstroms.
-(b) Continuum solvent calculationsTrypsin-benzamidine pmf;
- ( solvation contribution
(c)---'''--'' (c) ' --~ :
529Resat et al.
s.
Volume 72 February 1997
Internal waters
Another way of evaluating the success of the GCMC sim-ulations is by analysis of the buried waters in the proteinstructure. Reproduction of the internal waters observed inexperiments would show that the solvation patterns sampledin the simulations appropriately represented the actual sys-tem, and that the force fields were satisfactory. For thispurpose, we computed the predicted locations for the inter-nal waters. To mimic the crystallographic experimental condi-tions in which the inhibitor is at its bound position (R = 3.89A), only the configurations for which R was smaller than 4.12A were used in the internal solvent site analysis.
Internal solvation pattern calculations were done by firstcalculating the solvent density distribution on a grid, andthen performing a generic solvent site analysis (Mezei andBeveridge, 1984) or using the Lounnas-Pettitt algorithm(Lounnas and Pettitt, 1994), which averages the grid densi-ties recursively. These methods have been successfuly uti-lized earlier, and the details of these calculations with ref-erences may be found in Resat and Mezei (1996). As in theearlier study, these two analysis methods gave almost iden-tical results. Therefore, the results reported below refer tothe common outcome of both analysis methods.The overall agreement of the GCMC simulation results
with experiments is exceptional; the molecular simulationspredict 20 of the 22 internal waters to within 0.8 A. Most ofthe waters are predicted to within 0.4 A (Table 1). For thewaters where there is a disagreement, water 802 is predictedat a distance of 1.43 A, and water 430 does not exist in ourresults. Occupancy analysis (Table 1) showed that almost all
TABLE 1 Intemal waters: comparison with experimentsWater d(MC-Expt)* POCC O
406 0.30 1.00 0.37408 0.25 1.00 0.77410 0.22 1.00 0.25412 0.09 1.00 0.23415 0.14 1.00 0.25416 0.26 0.22 0.32429 0.36 1.00 0.46430 N.E.#457 0.32 1.00 0.49473 0.15 1.00 0.58562 0.79 1.00 0.27604 0.15 1.00 0.30701 0.61 0.55 0.34703 0.34 1.00 0.73704 0.26 1.00 0.27705 0.11 1.00 0.30707 0.32 1.00 0.30710 0.73 1.00 0.68714 0.64 1.00 0.27717 0.27 1.00 0.26722 0.39 1.00 0.24802 1.43 0.98 0.52
*Distance from MC water to experimental water in angstroms.#Occupancy probability of a particular site.§RMS fluctuation of waters in angstroms.INo equivalent site was detected in the simulations; see the text.
of the predicted water sites are fully occupied. Even thoughthe overall agreement with experiments is very satisfactory,there are a few interesting discrepancies that deserve dis-cussion. Bode and Schwager report that internal water 416forms a weak hydrogen bond with nitrogen of benzamidine(Bode and Schwager, 1975). Our analysis predicts that theremay be a water at that location, but with about one-fifthoccupation probability. This water resides in a side pocketof the binding channel, and its location changes as theinhibitor moves away from its bound position (Fig. 5).More interestingly, the simulations do not reproduce the
internal water 430, which is supposed to form hydrogenbonds with Ilel6:N, Glyl40:0, and Gly142:0. Note thatIlel6 is the N-terminus, which forms an internal salt bridgewith Asp194 in trypsin, and that it was modeled in its ionicform in the simulations. Capping hydrogens explicitly in-cluded in the simulations were assigned by molecular mod-eling template matching. Because of the possibly largeelectrostatic interaction effects, a slight misplacement of theprotons might have caused the discrepancy. Although itprobably is unrelated, it is still interesting enough that thewater 430 was not seen in the bovine trypsinogen-pancreatictrypsin inhibitor structure (Bode et al., 1978) where, be-cause of its turned position, Asp194 does not form a saltbridge with Ile 16. Because water 430 is quite far away fromthe binding site channel (the distance to Aspi 89:CG is 11.1A), the effects of any error in its occupancy are expected tobe small.
In addition to the experimentally detected waters as re-ported by Bode and Schwager (1975), the molecular simu-lations predicted three more internal waters whose coordi-nates are reported in Table 2. One of these waters has onlya partial occupancy. Such information could be used as anaid in analyzing the experimental data by pointing outnot-so-well-resolved solvent molecules.
SUMMARY AND DISCUSSION
We calculated the pmf between the enzyme trypsin and itsinhibitor benzamidine along a predetermined curvilinearpath by explicit solvent simulations and by continuum sol-vent calculations based on the Poisson equation. Our aimwas 1) to show that the grand canonical ensemble simula-tions can be helpful in accurately sampling the solventdegrees of freedom, and 2) to investigate whether the con-tinuum solvent calculations can approximately reproducethe explicit solvent simulation results for association ther-modynamics. Based on the very good agreement with ex
TABLE 2 Additionally predicted waters
Water x y z POCC aXA 9.90 3.04 11.60 1.00 0.48B 9.72 2.34 14.21 1.00 0.66C -7.00 13.52 26.77 0.55 0.51
*Occupancy probability of a particular site.#RMS fluctuation of waters in angstroms.
530 Biophysical Journal

Resat et al. Enzyme-inhibitor Association Thermodynamics 531
periments in reproducing the internal water positions andthe structural properties around the binding site residueAspl89, our results clearly show that the grand canonicalensemble simulations can be very useful in such systems. Itwas also found that the Poisson equation calculations cangive results that are in reasonable agreement with the ex-plicit solvent simulations. However, the quality of the agree-ment strongly depends on the choice of empirical parameters.Further studies that investigate a variety of systems and em-ploy a wider range of parameters are certainly needed.
We would like to thank to Chung Wong for his help in the initial stages ofthe project and Jan Antosiewicz for his help with the pKa calculations.
Financial support for this research was provided by NSF and the NSFSupercomputer Centers MetaCenter Program. TJM is a National Institutesof Health postdoctoral fellow.
REFERENCES
Adams, D. J. 1975. Grand canonical ensemble (Monte Carlo) for a Len-nard-Jones fluid. Mol. Phys. 29:307-311.
Antosiewicz, J., J. A. McCammon, and M. K. Gilson. 1994. Prediction ofpH-dependent properties of proteins J. Mol. Biol. 238:415-436.
Beglov, D., and B. Roux. 1994. Finite representation of an infinite bulksystem: solvent boundary potential for computer simulations. J. Chem.Phys. 100:9050-9063.
Bode, W., and P. Schwager. 1975. The refined crystal structure of bovinef3-trypsin at 1.8 A resolution. II. Crystallographic refinement, calciumbinding site, benzamidine binding site and active site at pH 7.0. J. Mol.Biol. 98:693-717.
Bode, W., P. Schwager, and R. Huber. 1976. Structural studies of thepancreatic trypsin inhibitor-trypsin complex and its free components:structure and function relationship in serine protease inhibition andcatalysis. In Proteolysis and Physiological Regulation, Miami WinterSymposia Series, Vol. 11. D. W. Ribbons and K. Brew, editors. Aca-demic Press, New York. 43-76.
Bode, W., P. Schwager, and R. Huber. 1978. The transition of bovinetrypsinogen to a trypsin-like state upon strong ligand binding. Therefined crystal structures of the bovine trypsinogen-pancreatic trypsininhibitor and of its temary complex with Ile-Val at 1.9 A resolution. J.Mol. Biol. 118:99-112.
Connolly, M. L. 1983. Analytical molecular surface calculation. J. Appl.Crystall. 16:548-558.
Davis, M. E., J. D. Madura, B. A. Luty, and J. A. McCammon. 1991.Electrostatics and diffusion of molecules in solution: simulations withthe University of Houston Brownian dynamics program. Comput. Phys.Commun. 62:187-197.
Eisenberg, D., and A. D. McLachlan. 1986. Solvation energy in proteinfolding and binding. Nature. 319:199-203.
Finer-Moore, J. S., A. A. Kossiakoff, J. H. Hurley, T. Earnest, and R. M.Stroud. 1992. Solvent structure in crystals of trypsin determined by X-rayand neutron diffraction. Proteins Struct. Funct. Genet. 12:203-222.
Friedman, H. L. 1985. A Course in Statistical Mechanics. Prentice-Hall,Englewood Cliffs, NJ.
Frisch, M. J., G. W. Trucks, M. Head-Gordon, P. M. W. Gill, M. W.Wongand, J. B. Foresman, B. G. Johnson, H. B. Schlegel, M. A. Robb,E. S. Replogle, R. Gomperts, J. L. Andres, K. Raghavachari, J. S.Binkley, C. Gonzalez, R. L. Martin, D. J. Fox, D. J. Defrees, J. Baker,J. J. P. Stewart, and J. A. Pople. 1992. Baussian 92. Gaussian, Inc.,Pittsburgh, PA.
Gilson, M. 1995. Theory of electrostatic interactions in macromoleculesCurr. Opin. Struct. Biol. 5:216-223.
Honig, B., and A. Nicholls. 1995. Classical electrostatics in biology andchemistry. Science. 268:1144-1149.
Horvath, D., D. van Belle, G. Lippens, and S. J. Wodak. 1996. Develop-ment and parametrization of continuum solvent models. I. Models basedon the boundary element method. J. Chem. Phys. 104:6679-6695.
Huber, R., D. Kukla, W. Bode, P. Schwager, K. Bartels, J. Deisenhofer,and W. Steigemann. 1974. Structure of the complex formed by bovinetrypsin and bovine pancreatic trypsin inhibitor. II. Crystallographicrefinement at 1.9 A resolution. J. Moi. Bio. 89:73-101.
Jorgensen, W. L., J. Chandrasekhar, J. D. Madura, R. W. Impey, and M. L.Klein. 1983. Comparison of simple potential functions for simulatingliquid water. J. Chem. Phys. 79:926-935.
Jorgensen, W. L., and J. Tirado-Rives. 1988. The OPLS potential functionsfor proteins. Energy minimizations for crystals of cyclic peptides andcrambin. J. Am. Chem. Soc. 110:1657-1666.
Lounnas, V., and B. M. Pettitt. 1994. A connected-cluster of hydrationaround myoglobin: correlation between molecular dynamics simulationsand experiment. Proteins Struct. Funct. Genet. 18:133-147.
Luty, B. A., Z. R. Wasserman, P. F. W. Stouten, C. N. Hodge, M.Zacharias, and J. A. McCammon. 1995. A molecular mechanics/gridmethod for evaluation of ligand-receptor interactions. J. Comp. Chem.16:454-464.
Lybrand, T. P. 1995. Ligand-protein docking and rational drug design.Curr. Opin. Struct. Biol. 5:224-228.
Madura, J. D., M. E. Davis, M. K. Gilson, R. C. Wade, B. A. Luty, and J.A. McCammon. 1994. Biological applications of electrostatic calcula-tions and brownian dynamics simulations. Rev. Comp. Chem.5:229-267.
Mares-Guia, M., D. L. Nelson, and E. Rogana. 1977. Electronic effects inthe interaction of para-substituted benzamidines with trypsin: the in-volvement of the ir-electronic density at the central atom of the sub-stituent in binding. J. Am. Chem. Soc. 99:2331-2336.
Marquart, M., J. Walter, J. Deisenhofer, W. Bode, and R. Huber. 1983. Thegeometry of the reactive site and of the peptide groups in trypsin, trypsino-gen and its complexes with inhibitors. Acta Crystallogr. B. 39:480-490.
Marrone, T. J., J. M. Briggs, and J. A. McCammon. 1997. Structure baseddrug design: computational advances. Annu. Rev. PharmacoL Toxicol.37: in presss.
Mezei, M. 1987. Adaptive umbrella sampling: self-consistent determina-tion of the non-Boltzmann bias. J. Comput. Phys. 68:237-248.
Mezei, M., and D. L. Beveridge. 1984. Generic solvent sites in a crystal. J.Comput. Chem. 5:523-527.
Mezei, M., and D. L. Beveridge. 1986. Free energy simulations. Ann. N. Y.Acad. Sci. 482:1-23.
Patey, G. N., and J. P. Valleau. 1975. A Monte Carlo method for obtainingthe interionic potential of mean force inionic solution. J. Chem. Phys.63:2334-2339.
Pettitt, B. M., M. Karplus, and P. J. Rossky. 1986. Integral equation modelfor aqueous solvation of polyatomic solutes: application to the determi-nation of the free energy surface for the internal motion of biomolecules.J. Phys. Chem. 90:6335-6345.
Pratt, L. R., G. Hummer, and A. E. Garcia. 1994. Ion pair potentials ofmean force in water. Biophys. Chem. 51:147-165.
Rashin, A. A. 1989. Electrostatics of ion-ion interactions in solution. J.Phys. Chem. 93:4664-4669.
Rashin, A. A., and K. Namboodiri. 1987. A simple method for the calcu-lation of hydration enthalpies of polar molecules with arbitrary shapes.J. Phys. Chem. 91:6003-6012.
Resat, H., and M. Mezei. 1994. Grand canonical Monte Carlo simulation ofwater positions in crystal hydrates. J. Am. Chem. Soc. 116:7451-7452.
Resat, H., and M. Mezei. 1996. Grand canonical ensemble Monte Carlosimulation of the dCpG/proflavine crystal hydrate. Biophys. J. 71:1179-1190.
Resat, H., M. Mezei, and J. A. McCammon. 1996. Use of the grandcanonical ensemble in potential of mean force calculations. J. Phys.Chem. 100:1426-1433.
Simonson, T., and A. T. Brunger. 1994. Solvation free energies estimatedfrom macroscopic continuum theory: an accuracy assessment. J. Phys.Chem. 98:4683-4694.
Sitkoff, D., K. A. Sharp, and B. Honig. 1994. Accurate calculation ofhydration free energies using macroscopic solvent models. J. Phys.Chem. 98:1978-1988.

532 Biophysical Journal Volume 72 February 1997
Soman, K., A.-S. Yang, B. Honig, and R. Fletterick. 1989. Electricalpotentials in trypsin isozymes. Biochemistry. 28:9918-9926.
Straatsma, T. P., and J. A. McCammon. 1992. Computational alchemy.Annu. Rev. Phys. Chem. 43:407-35.
Walter, J., W. Steigemann, T. P. Singh, H. Bartunik, W. Bode, and R.Huber. 1982. On the disordered activation domain in trypsinogen.
Chemical labelling and low-temperature crystallography. Acta Crystal-logr., Sect. B. 38:1462.
Wong, C. F., and J. A. McCammon. 1986a. Computer simulation and thedesign of new biological molecules. Isr. J. Chem. 27:211-215.
Wong, C. F., and J. A. McCammon. 1986b. Dynamics and design ofenzymes and inhibitors. J. Am. Chem. Soc. 108:3830-3832.