Embed Size (px)
Citation preview
Master Thesis
Enzyme engineering of a haloacid dehalogenase-like phosphatase from
Thermotoga neopolitana for optimization of substrate specificity
Submitted to
Lund University
Faculty of Engineering
Division of Biotechnology
and
Prof. Dr. Volker Sieber
Technische Universität München
Lehrstuhl für Chemie Biogener Rohstoffe
Presented by
Samuel Sutiono
19911006-7759
Lund, May 2016

ii
Performed at:
Technische Universität München, Lehrstuhl für Chemie Biogener Rohstoffe
Wissenschaftszentrum Straubing, Straubing, Germany
Supervised by:
Prof. Dr. Volker Sieber
Technische Universität München
Lehrstuhl für Chemie Biogener Rohstoffe
Co-supervised by:
Dr. Javier A Linares-Pastén
Assistant Lecturer
Lund University
Division of Biotechnology
André Pick, Dipl. Biologie
PhD Student
Technische Universität München
Lehrstuhl für Chemie Biogener Rohstoffe
Examined by:
Prof. Patrick Adlercreutz
Lund University
Division of Biotechnology

iii
Declaration of originality
I hereby declare that this master thesis project was entirely and solely my own independent
work and any direct or indirect aids have been faithfully acknowledged. I have also read
Lund University policy of plagiarism and fully aware of the consequences of noncompliance.
Lund, May 2016
Place and Date of Submission
Samuel Sutiono

iv
Abstract
Haloacid dehalogenase (HAD)-like hydrolases represent a vast superfamily characterised by
their ability to form covalent enzyme-substrate intermediates facilitating the cleavage of C-
Cl, C-P, or CO-P bonds. Within this work one member of this superfamily, HAD from
Thermotoga neopolitana (HADTn) exhibiting a phosphatase (P-O bond cleavage) like
activity was investigated in the context of altering the substrate specificity. The enzyme
shows different affinities for sugar phosphates, e.g. fructose-6-phosphate (F6P) and glucose-
6-phosphate (G6P) at high temperatures, which is of great interest for industrial applications.
In this study, HADTn was engineered using semi rational site saturation mutagenesis to
increase its specificity toward F6P for use in enzymatic cascade reactions. At first, several
mutants were generated to deduce the role of different amino acids. Results suggested that
serine at position 166 (S166) played an important role in catalysis, presumably in the
positioning of Mg (II). Additionally, glutamic acid at position 47 (E47) was identified to
influence substrate recognition. Based on these findings, degenerate primers using an NNK
motif were designed to generate libraries for six different amino acid positions (Y19, M8,
P46, E47, P110, R117) around the catalytic centre. High-throughput screening of the libraries
with two different substrates (F6P and G6P) resulted in an improved variant that had a
mutation at position 46 from proline to threonine (P46T). Further characterisation of
HADTnP46T was performed for F6P and G6P with respect to the wild type and the results
showed almost a two-fold increase in the ratio of the catalytic efficiency (kcat/Km). Moreover,
thermal stability studies revealed that HADTnP46T had a half-life of 392 min at 94oC;
similar to that of the WT. Addition of Mg (II) doubled the half-life for both the enzymes.
Fructose and glucose inhibited both enzymes via a noncompetitive mechanism. These
findings support the already existing proposal of the presence of a probable fifth loop in the
HAD family that plays a pivotal role in substrate specificity.
Keywords: Haloacid dehalogenase-like hydrolase, Enzyme engineering, Catalytic efficiency,
Thermal stability, Inhibition

v
Sammanfattning
Hydrolaser av Haloacid dehalogenase (HAD)-typ utgör en omfattande superfamilj
kännetecknad av deras förmåga att bilda kovalenta enzymsubstratsintermediärer som
underlättar brytandet av C-Cl P-C eller P-O-bindningar. I detta arbete undersöktes vilken
påverkan ett enzym i denna superfamilj, HAD från Thermotoga neopolitana (HADTn), har
på substratspecificitet. Detta enzym uppvisar en fosfatas-liknande aktivitet och bryter med
andra ord P-O-bindningar. Det har olika affinitet för olika sockerfosfater t.ex. fruktos-6-fosfat
(F6P) och glukos-6-fosfat (G6P), vid höga temperaturer vilket är av stort intresse för
industriella användningar. I studien konstruerades HADTn för att skifta dess specificitet mot
F6P för användning i enzymatiska kaskadreaktioner, genom semirationella punktmättnads-
mutationer. Först skapades ett flertal mutanter för att undersöka rollen hos olika aminosyror.
Resultaten indikerade att serin på position 166 (S166) spelade en viktig roll i katalys, troligen
vid positioneringen av Mg (II). Dessutom visades att glutaminsyra på position 47 (E47)
påverkade igenkänning av substrat. Grundat på dessa upptäckter designades degenererade
primrar, med hjälp av NNK-motif, för att skapa bibliotek för 6 olika aminosyrapositioner
(Y19, M8, P46, E47, P110, R117) kring det katalytiska centrat. Högkapacitets-screening av
biblioteken med två olika substrat (F6P och G6P) resulterade i en förbättrad variant med en
mutation från prolin till treonin på position 46 (P46T). Ytterligare undersökning av
HADTnP46T med avseende på F6P och G6P visade en nästan tvåfaldig ökning av det
katalytiska effektsförhållandet (kcat/Km) jämfört med vildtypen. Dessutom visade studier av
termisk stabilitet att halveringstiden för HADTnP46T var 392 min vid 94oC, inte långt från
vildtypens halveringstid. Addition av Mg (II) fördubblade halveringstiden för båda
enzymerna. Fruktos och glukos inhiberade båda enzymerna via en icke-kompetitiv
mekanism. Dessa resultat stödjer den redan existerande modellen av förekomsten av en femte
loop, med stor betydelse för substratspecificitet, i HAD-familjen.
Nyckelord: Hydrolaser av Haloacid dehalogenase (HAD)-typ, Enzymteknik, katalytiska
effektivitet, Termisk stabilitet, Inhibition
vi
Zusammenfassung
Halosäure-Dehalogenase-ähnliche (HAD) Hydrolasen repräsentieren eine vielseitige
Überfamilie, welche durch die Ausbildung eines kovalenten Enzym-Substrat Komplexes im
Verlauf des katalytischen Zyklus in der Lage sind C-Cl, P-C oder P-O Bindungen zu spalten.
In dieser Arbeit wurde ein Enzym aus dieser Familie, HAD von Thermatoga neopolitana
(HADTn), welches eine Phosphatase-ähnliche (P-O-Spaltung) Aktivität aufweist, in Bezug
auf einer Optimierung der Substratspezifität eingehend untersucht. Das Enzym zeigt
unterschiedliche Affinitäten für Zuckerphosphate, z.B. Fruktose-6-Phosphat (F6P) und
Glukose-6-Phosphat (G6P), bei hohen Temperaturen, was für industrielle Anwendungen von
großem Interesse ist. In dieser Studie wurde HADTn durch halb rationale ortsgerichtete
Mutagenese verändert, um seine Spezifität zu F6P für enzymatische Kaskadereaktionen zu
erhöhen. In einem ersten Schritt wurden mehrere Mutanten generiert, um die Rolle
verschiedener Aminosäuren im aktiven Zentrum des Enzyms für die Substraterkennung zu
bestimmen. Die Ergebnisse wiesen auf eine wichtige Rolle des Serin in Position 166 (S166)
für die Katalyse hin, vermutlich für die Mg (II) Positionierung. Außerdem wurde der Einfluss
der Glutaminsäure in Position 47 auf die Substraterkennung identifiziert. Basierend auf
diesen Erkenntnissen wurden mit Hilfe von degenerierten Primern (NNK Triplet Motiv)
Bibliotheken für sechs verschiedene Aminosäurepositionen (Y19, M8, P46, E47, P110,
R117) erstellt. Ein Hochdurchsatz-Screening der Bibliotheken mit zwei verschiedenen
Substraten (F6P und G6P) führte zur Identifizierung einer verbesserten Variante, bei der
Prolin an Position 46 zu Threonin (P46T) ausgetauscht war. Die anschließende
Charakterisierung von HADTnP46T für die Substrate F6P und G6P zeigte eine nahezu
zweifache Erhöhung der Rate der katalytischen Effizienz für F6P bezogen auf den Wildtyp
(Vmax/Km). Außerdem zeigten thermale Stabilitätsstudien, dass HADTnP46T eine
Halbwertszeit von 392 min bei 94 °C aufweist, welche ähnlich zu der des Wildtyps ist. Der
Zusatz von Mg (II) verdoppelte die Halbwertszeit für beide Enzyme. Die Produkte Fruktose
und Glukose hemmten beide Enzyme durch einen nicht-kompetitiven Mechanismus. Die
Identifizierung von Position 46 in Bezug auf die Substraterkennung unterstützt Erkenntnisse
für die Präsenz eines fünften Loops in der HAD Familie, welcher eine zentrale Rolle für die
Substratspezifität spielt.
Schlüsselwörter: Halosäure-Dehalogenase-ähnliche Hydrolasen, Enzymengineering,
katalytische Effizienz, Thermostabilität, Inhibition

vii
Acknowledgements
“I was taught that the way of progress was neither swift nor easy.”
Marie Skłodowska Curie (1867 – 1934)
I am genuinely grateful for this exciting period in my life. I give thank for being able to learn
state-of-the-art of protein engineering and acquire know-how from the experts in this field. I
could not be any luckier to get the opportunity to study this particular topic further. Nothing
is possible without the supports of some people, at whom I want to thank cordially.
At first, I would like to thank Prof. Dr. Volker Sieber for having allowed me to conduct my
thesis in his research group as well as for his direct and indirect supervision. I am also deeply
thankful for the opportunity and trust from him such that I can continue working in his group
after my Master studies.
Second, I would like to thank Prof. Patrick Adlercreutz for his encouragement to me to
pursue a PhD and his invaluable comments regarding this work. Further to Dr. Javier
Linares-Pastén for the share of his knowledge and his time to correct my thesis as well as his
assistance for organising my defence in Lund University.
I also want to show deep appreciation to my supervisor and also my friend, André Pick for
his assistance in planning the experiments, his shrewd ideas to tackle problems during the
experiments, and for the possibility of testing my own ideas. I also want to thank him for his
time and patience in correcting my thesis as well as his tremendous support and example to
always work hard and give 110% for research.
Without neglecting the importance of personal supports I also would like to thank all friends
at Lehrstuhl für Chemie Biogener Rohstoffe for their friendliness and enthusiasm, in
particular to Jörg Carsten for invaluable discussions, to Michael Loscar, Daniel Bauer, and
Herbert Goldinger for always staying late, and to Alfiya Wohn for her help in molecular
biology. Special thanks to Sumanths Ranganathan for proof-reading, to Lisa Steiner, Anja
Schmidt, and Edilberto Medina for warm atmosphere in the office. Further thanks to all
friends in Lund for great companionship, to Erik Karlström for his help in translating my
abstract to Swedish, and to Franziska Olm for her help in rewriting my abstract in German.
Last but not least is to my family who always supported me unconditionally to do what I
love.
Finally, I have to thank Swedish Institute for academic and financial supports during my
studies in Sweden. Its scholarship not only gave me the opportunity to earn a Master’s degree
from the prestigious Lund University, but also helped me broaden my horizons toward
openness and sustainability. Further, I want to acknowledge Lund University’s Erasmus
Traineeship program for the additional stipend to perform this work.
viii
Table of Contents
List of Tables ............................................................................................................................. x
List of Figures ........................................................................................................................... xi
List of Abbreviations ............................................................................................................... xii
1 Introduction ........................................................................................................................ 1
1.1 Enzyme as biocatalyst ................................................................................................. 1
1.2 Haloacid Dehalogenase (HAD) Superfamily .............................................................. 5
1.3 Enzyme engineering .................................................................................................... 7
1.3.1 Directed evolution ................................................................................................ 7
1.3.2 Rational design of enzymes ................................................................................. 8
1.3.3 Semi-rational site mutagenesis as a hybrid technique ......................................... 9
1.4 Objective ................................................................................................................... 10
2 Materials and Methods ..................................................................................................... 11
2.1 Materials .................................................................................................................... 11
2.2 Methods ..................................................................................................................... 13
2.2.1 Computational methods ..................................................................................... 13
2.2.2 Molecular biology methods ............................................................................... 14
2.2.3 Biochemical methods ......................................................................................... 15
2.2.4 High throughput screening ................................................................................. 17
2.2.5 Final characterisation ......................................................................................... 18
3 Results .............................................................................................................................. 19
3.1 Sequence alignment and in silico analysis for possible mutations............................ 19
3.2 Initial wild type characterisation ............................................................................... 22
3.3 High-Throughput Screening ...................................................................................... 26
3.3.1 High-Throughput Screening development ......................................................... 26
3.3.2 High-Throughput Screening for Library ............................................................ 29
3.4 Final Characterisation ............................................................................................... 35
4 Discussion ......................................................................................................................... 40
4.1 Identification of catalytic centre and substrate docking ............................................ 40
4.2 Initial characterisation ............................................................................................... 41
4.3 High-throughput screening analysis .......................................................................... 43
4.4 Final characterisation ................................................................................................ 44
5 Conclusion and Future Outlook ........................................................................................ 46
5.1 Conclusion ................................................................................................................. 46
5.2 Future outlook ........................................................................................................... 46

ix
References ................................................................................................................................ 48
Appendices ............................................................................................................................... 52

x
List of Tables
Table 2.1. List of strain of bacteria .......................................................................................... 11
Table 2.2. List of media ........................................................................................................... 11
Table 2.3. List of reagents used ............................................................................................... 12
Table 2.4. List of disposable goods used ................................................................................. 12
Table 2.5. List of molecular biology reagents ......................................................................... 13
Table 2.6. List of instruments used .......................................................................................... 13
Table 3.1. Conserved amino acids in HAD family .................................................................. 19
Table 3.2. Summary of YASARA docking calculations ......................................................... 21
Table 3.3. Turnover number (kcat) and catalytic efficiency of mutants .................................. 25
Table 3.4. Turnover number (kcat) and catalytic efficiency of mutants .................................. 26
Table 3.5. Correlation of Z-factor value to screening performance ........................................ 27
Table 3.6 List of libraries screened .......................................................................................... 30
Table 3.7. Thermal stability parameters for wild type and D46T HADTn. ............................. 38
Table 3.8. Effect of product inhibition..................................................................................... 39
xi
List of Figures
Figure 1.1. Lineweaver-Burk double reciprocal plot of different mechanisms of inhibition. ... 3
Figure 1.2. Arrhenius plot of hydrolysis of pNPP by carbohydrate anhydrase ......................... 5
Figure 1.3. Proposed mechanisms of P-type phosphatase member of HAD. ............................ 6
Figure 1.4. Three dimensional structure of HADTm ((PDB entry: 3KBB) .............................. 7
Figure 1.5. List of degenerate primers commonly used for semi rational site mutagenesis ...... 9
Figure 3.1. One of docking results of wild type enzyme proposed by YASARA ................... 20
Figure 3.2. Enzyme kinetics toward G6P ................................................................................ 22
Figure 3.3. Effect of different buffers and pH on enzyme activity .......................................... 23
Figure 3.4. Effect of cofactor concentration on enzyme activity ............................................. 23
Figure 3.5. Effect of Mg (II) concentration on enzyme activity. ............................................. 24
Figure 3.6. Result of Z’ value of wild type landscape tested on 96 well plate format ............ 27
Figure 3.7. Activity landscape of wild type toward F6P tested on 96 well plate format ......... 28
Figure 3.8. Activity landscape of wild type toward G6P tested on 96 well plate format ........ 29
Figure 3.9. Ratio of activity landscape of wild type tested on 96 well plate format ............... 29
Figure 3.10. Activity assay of P46NNK library from 4 plates toward F6P ............................. 31
Figure 3.11. Activity assay of P46NNK library from 4 plates toward G6P ............................ 32
Figure 3.12. Ratio of activity assay (F6P/G6P) of P46NNK library from 4 plates ................. 32
Figure 3.13. Result of second screening of P46NNK library .................................................. 33
Figure 3.14. Result of third screening from second screening of P46NNK ............................ 34
Figure 3.15 Summary of HTS for library ................................................................................ 34
Figure 3.16. Kinetic parameters for final characterisation ...................................................... 35
Figure 3.17. Visualisation of possible interaction of amino acid at position 46. ..................... 36
Figure 3.18. Visualisation of the possible fifth loop of HADTnP46T..................................... 36
Figure 3.19. Effect of Mg (II) addition on enzymes’ temperature stability (G6P) .................. 37
Figure 3.20. Effect of Mg (II) addition on enzymes’ temperature stability (F6P)................... 38
Figure 3.21. Lineweaver-Burk plot of the enzymes activity in the presence of glucose. ........ 39
Figure 3.22. Lineweaver-Burk plot of the enzymes activity in the presence of fructose ........ 39

xii
List of Abbreviations
F6P Fructose-6-phosphate
G6P Glucose-6-phosphate
Vmax Maximum rate
Km Michaelis-Menten constant
min Minute
h Hour
SD Standard deviation
Avg average
HAD Haloacid Dehalogenase
PCR Polymerase Chain Reactions
QC QuikChangeTM Site-Directed Mutagenesis
WT Wild type
Introduction 1
1 Introduction
The demand to replace fossil fuels with greener resources is increasing in the last decades.
Application of green chemistry for industrial processes is also urged since its introduction in
1990 (Centi & Perathoner, 2009). Re-utilisation of catalysts is one of the 12 principles
described in the green chemistry (Anastas & Warner, 1998). However, conventional chemical
catalysts are not biodegradable and are sometimes toxic (Greimel, et al., 2013). Application
of these catalysts for food and pharmaceutical industries are not advised. Enzymes, on the
other hand, have been gaining more interest recently due to their biodegradability and activity
that are similar to chemical catalysts. They are regarded as safe thus application in food and
pharmaceutical industries are encouraged (Illanes, 2008). However, not all enzymes can be
directly compatible for industrial application. Several improvements need to be done to make
these enzymes able to compete with chemical catalysts in terms of productivity. There are
two major strategies that are being implemented. The first strategy is to discover new
enzymes to cater to the needs of the industry, while the second strategy is to engineer an
enzyme with a known function to increase its characteristics. The second approach is applied
in this work.
1.1 Enzyme as biocatalyst
Most biochemical reactions cannot occur fast enough without any catalyst to sustain life due to a large
energy barrier. Enzymes are the natural counterpart to chemical catalysts and indispensable for
biochemical reactions. Similar to catalysts in chemical reactions, enzymes act by lowering the
activation energy and thereby increasing the reaction rate. Enzymes decrease the activation energy by
several mechanisms such as substrate activation, stabilisation of the transition state, and providing an
alternative route for a reaction to occur (Benkovic & Hammes-Schiffer, 2003). However, enzymes do
not change the direction of reactions. Enzymes are not able to catalyse reactions that are by nature not
spontaneous (positive Gibbs free energy). In most cases, the kinetics of an enzyme is best described
by the Michaelis-Menten model. Although this model is one of the very first models to be proposed, it
is still widely used today. In this model, the enzymatic reaction is considered to happen in two steps.
Firstly, a reversible step to form an enzyme-substrate complex, followed by a second catalysis step, in
which the substrate is converted to a product. According to the model, enzyme activity will increase
linearly with an increase of substrate concentration up to a certain point till all the enzymes are
saturated, after which, any further increase in substrate concentration will not increase the reaction
rate. This model is given below,
Equation 1
Two important parameters can be derived from this model, Vmax and Km. Vmax is the
maximum rate of enzyme activity and usually has the unit of μmol/min*mg. In addition, Km
has the unit mM and is defined as the concentration of substrate at which the rate (V) is a half
of Vmax. The double reciprocal plot or Lineweaver-Burk plot has been widely used to
calculate these two parameters from the model. However, with recent developments in
computer software, nonlinear regression is commonly used in research replacing the
Lineweaver-Burk plot (Ranaldi, et al., 1999).
Further useful parameters that are widely used to compare enzymes are the turn over
number or kcat and catalytic efficiency or kcat/Km. Turn over number is the amount of product
formed by one molecule of an enzymes per second and the formula is described in Equation
2. Reciprocal of kcat can be defined as the time needed to convert one molecule of substrate

Introduction 2
into product by one enzyme. Catalytic efficiency is the measure of how efficient an enzyme
converts its substrates thus kcat/Km is also known as specificity constant. Catalytic efficiency
is a powerful indicator of the efficiency of an enzyme in converting two or more substrates.
Catalytic efficiency, however, should not be used to compare two enzymes acting on the
same substrates (Eisenthal, et al., 2007).
Equation 2
Although many enzymes obey Michaelis-Menten model, some enzymes show a
deviation. There are many factors that cause this deviation. The Michaelis-Menten model is
based on the assumption that the amount of substrate used is very large compared to the
amount of enzyme. This model also assumes that the initial rate of enzyme is the initial rate
where substrate and product inhibition have yet to occur. However, some enzymes may be
inhibited by their substrates or products. Substrate and product inhibition of enzymes are
important and a common mechanisms exist for cells to control their metabolism (Nelson &
Cox, 2008). Inhibition in general can be classified into two types, reversible and irreversible
inhibition.
Reversible inhibition
This type of inhibition can inhibit the enzymes’ activity in a reversible way. There are
four mechanisms of reversible inhibition. A Lineweaver-Burk plot of each mechanism
and the modification of Michaelis-Menten model is presented in Figure 1.1.
o Competitive inhibition
Inhibitors from this class compete with substrates to bind to the active site of
enzymes resulting in a lower Vmax. Addition of substrates will rescue the activity,
thus the amount of substrate to reach the same activity is higher in the presence of
the inhibitors. That results in a decrease of an apparent Km. The structure of the
inhibitors usually resembles the structure of the substrates.
o Uncompetitive inhibition
Inhibitors that exhibit uncompetitive mechanism bind to the enzyme-substrate
complex, unlike competitive inhibition, the binding site of these inhibitors is not
the active site. This results in a decrease of Vmax and Km upon the presence of this
inhibition due to a decreased amount of the active enzyme-substrate complex.
Addition of more substrate does not increase the Vmax.
o Noncompetitive inhibition
In the presence of noncompetitive inhibitors, Vmax of the reaction decreases but
not the Km. This is because inhibitors from this class bind to the site of enzymes
other than the active site. Unlike uncompetitive inhibitors, these inhibitors do not
bind to enzyme-substrate complex. Upon inhibitor binding, the active site of the
enzymes is unavailable for substrates. This is due to slight conformation changes
by the inhibitor, which block the access to the active site.
o Mixed-type inhibition
These inhibitors have a similar mechanism as the noncompetitive inhibitors but
inhibitors from this class can also bind to the enzyme-substrate complex. This
type of inhibition results in a decrease of the apparent the Vmax and an increase in
the apparent Km. Further addition of substrates will slightly increase the enzyme
activity but will not be able to achieve the initial rate.

Introduction 3
Irreversible inhibition
Covalent modification of enzymes is the common in this type of inhibition. Inhibitors
will bind to the active site of enzymes covalently causing a conformation change in
the active site of the enzyme rendering the enzymes inactive. This mechanism of
inhibition is different than irreversible inactivation of enzymes, e.g. by extreme pH
and temperature. The latter has nonspecific effects and destroy the structure of
enzymes.
Figure 1.1. Lineweaver-Burk double reciprocal plot of different mechanisms of inhibition. CI is competitive
inhibition; NCI is noncompetitive inhibition; UCI is uncompetitive inhibition; MTI is mixed-type inhibition.
Adapted from (Illanes, 2008).
Enzymes as biocatalysts also show superiority over chemical catalysts. In general, enzymes
show high specificity toward substrates and selectivity of products (stereoselectivity). Some
enzymes are able to catalyse very complex reactions under mild conditions that chemical
catalysts are incapable of. However, enzymes possess also some drawbacks. Chemical
catalysts have benefit by being robust for industrial application in part due to their small size.
In many cases it is also cheaper to produce and maintain chemical catalysts than enzymes
(Illanes, 2008). Those disadvantages are account for the fact that enzymes are protein. Unlike
chemical catalysts, protein is not designed by the nature to be robust for industrial
applications, rather it is designed to be active and to sustain life of organisms in the mild
conditions.
Activity of an enzyme is determined by several amino acids situated in a small region
of an enzyme called the active site. In addition to the active site, the enzyme structure is also

Introduction 4
important for enzyme activity. An enzyme’s structure can be divided into four levels:
primary, secondary, tertiary, and quaternary structures. Intermolecular forces that sustain
tertiary and quaternary structures of enzymes (three-dimensional structure) are weaker than
covalent bonds in the primary structure. Several parameters can affect the stability of the
three-dimensional (3D) structure of enzymes. Stability is not something quantifiable, activity,
on the other hand is. As mentioned earlier, the activity of enzymes directly correlates with
their stability thus stability at different conditions could be measured by comparing enzymes’
activity at those conditions. However, this approach should be understood with attention.
Temperature and pH are examples of parameters that influence enzymes’ activity
independent to the enzymes’ stability. Those two parameters also have effects on enzyme
stability that will affect enzymes’ activity.
As discussed earlier, amino acids in the active site of enzymes play a significant role
in enzymes’ activity. Some amino acids are influenced by pH while others are less sensitive
to a pH fluctuation. Charged amino acids such as arginine (R), histidine (H), lysine (L),
aspartic acid (D) and glutamic acid (E) are examples of amino acids that are strongly
influenced by pH. Numbers of enzymes have those amino acids in their active site. RNAse,
for example, is a class of enzymes that has histidine in their active site with an optimum pH
at 5.5 (Thompson & Raines, 1994) and pepsin with pH optimum below 2 uses aspartic acid in
its active site to catalyse the hydrolysis of proteins (Antonov, et al., 1978). If the reaction
carried out at a suboptimal pH this will result in lower activity but this lower activity is not
the result of enzyme destabilisation. In extreme pH conditions, decrease of activity is not
reversible. That is the result of an irreversible inactivation of the enzyme. At very high pH
(>11), all positively charged amino acids will be deprotonated in the same way as very low
pH (<1), where, all negatively charged amino acids will be protonated. Protonation and
deprotonation will result in loss of ionic interactions that help stabilise 3D structure of a
protein. At high pH, disulphide bridges could also be broken.
However, the effect of temperature is different from the effect of pH. The pattern is
similar to that of a chemical reaction; enzymatic reaction is also increased with an increase in
temperature. Arrhenius law is widely used to represent the effect of temperature to the rate of
reaction. At higher temperature, the kinetic energy of molecules is increased thus the
probability of collision between molecules are also increased. In enzymatic reactions, the
collision is between the enzyme and its substrate. Kinetic energy does not only represent the
movement of molecules in the solution relative to its primary position, it also represents the
movements (translational, vibrational, and rotational) of atoms constructing the molecule. For
biomolecules like enzymes, movements of atoms of each amino acid are limited to the
enzymes’ 3D structure. With an increase in temperature, movements of the atoms could be so
high such that the intermolecular forces compromising the 3D structure disappear. The effect
of temperature on enzyme activity is then a competition of increased activity due to higher
probability of collisions and decreased activity due to the denaturation of enzymes. The
temperature at which the interaction of these two factors results in the highest possible
activity is considered as the optimum temperature (Figure 1.2).
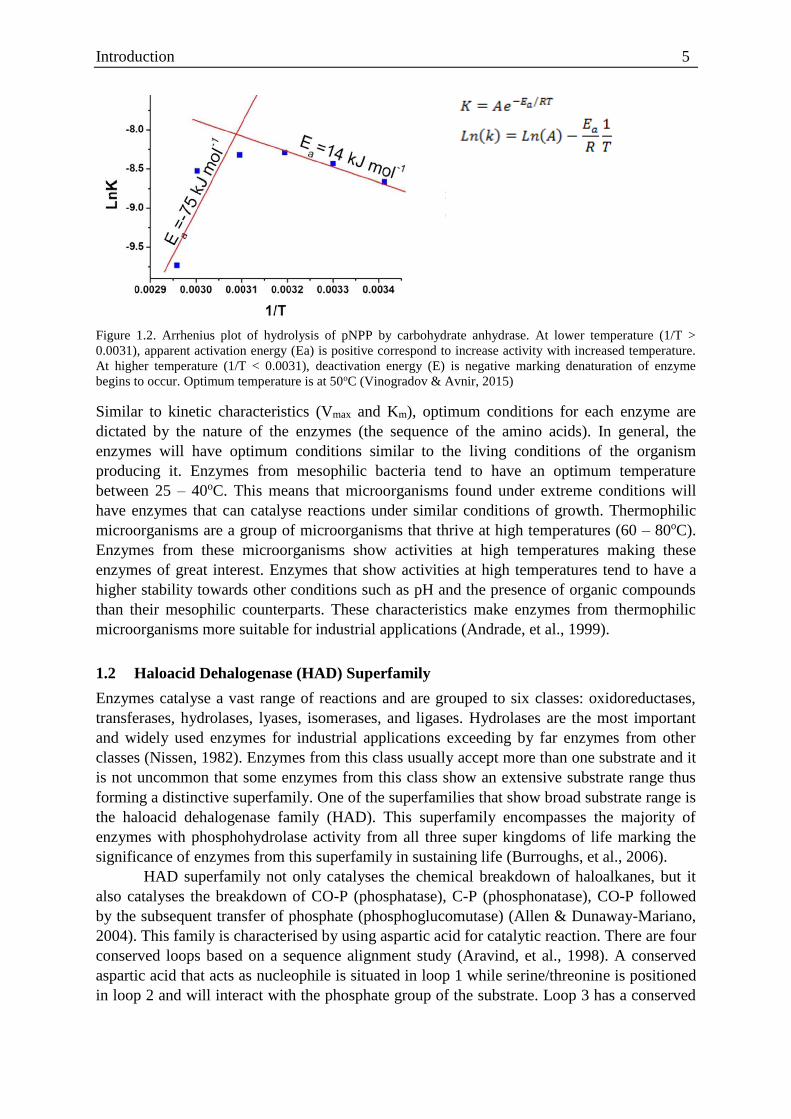
Introduction 5
Figure 1.2. Arrhenius plot of hydrolysis of pNPP by carbohydrate anhydrase. At lower temperature (1/T >
0.0031), apparent activation energy (Ea) is positive correspond to increase activity with increased temperature.
At higher temperature (1/T < 0.0031), deactivation energy (E) is negative marking denaturation of enzyme
begins to occur. Optimum temperature is at 50oC (Vinogradov & Avnir, 2015)
Similar to kinetic characteristics (Vmax and Km), optimum conditions for each enzyme are
dictated by the nature of the enzymes (the sequence of the amino acids). In general, the
enzymes will have optimum conditions similar to the living conditions of the organism
producing it. Enzymes from mesophilic bacteria tend to have an optimum temperature
between 25 – 40oC. This means that microorganisms found under extreme conditions will
have enzymes that can catalyse reactions under similar conditions of growth. Thermophilic
microorganisms are a group of microorganisms that thrive at high temperatures (60 – 80oC).
Enzymes from these microorganisms show activities at high temperatures making these
enzymes of great interest. Enzymes that show activities at high temperatures tend to have a
higher stability towards other conditions such as pH and the presence of organic compounds
than their mesophilic counterparts. These characteristics make enzymes from thermophilic
microorganisms more suitable for industrial applications (Andrade, et al., 1999).
1.2 Haloacid Dehalogenase (HAD) Superfamily
Enzymes catalyse a vast range of reactions and are grouped to six classes: oxidoreductases,
transferases, hydrolases, lyases, isomerases, and ligases. Hydrolases are the most important
and widely used enzymes for industrial applications exceeding by far enzymes from other
classes (Nissen, 1982). Enzymes from this class usually accept more than one substrate and it
is not uncommon that some enzymes from this class show an extensive substrate range thus
forming a distinctive superfamily. One of the superfamilies that show broad substrate range is
the haloacid dehalogenase family (HAD). This superfamily encompasses the majority of
enzymes with phosphohydrolase activity from all three super kingdoms of life marking the
significance of enzymes from this superfamily in sustaining life (Burroughs, et al., 2006).
HAD superfamily not only catalyses the chemical breakdown of haloalkanes, but it
also catalyses the breakdown of CO-P (phosphatase), C-P (phosphonatase), CO-P followed
by the subsequent transfer of phosphate (phosphoglucomutase) (Allen & Dunaway-Mariano,
2004). This family is characterised by using aspartic acid for catalytic reaction. There are four
conserved loops based on a sequence alignment study (Aravind, et al., 1998). A conserved
aspartic acid that acts as nucleophile is situated in loop 1 while serine/threonine is positioned
in loop 2 and will interact with the phosphate group of the substrate. Loop 3 has a conserved
Introduction 6
arginine/lysine to stabilise the intermediate together with serine/threonine from loop 2
(Lahiri, et al., 2002) and motif 4 has two to three aspartic acid responsible for the
coordination of Mg (II) (Morais, et al., 2000). Loop 1-4 are organised in such a way that in
three-dimensional forming active site of HAD hydrolase. Many members of the HAD family
have a second domain (cap domain) besides the main catalytic domain. The cap domain
contains an additional loop comprised of helix-loop-helix that is proposed to be involved in
the substrate recognition. Glycine is a conserved amino acid found in the fifth loop (Lahiri, et
al., 2004).
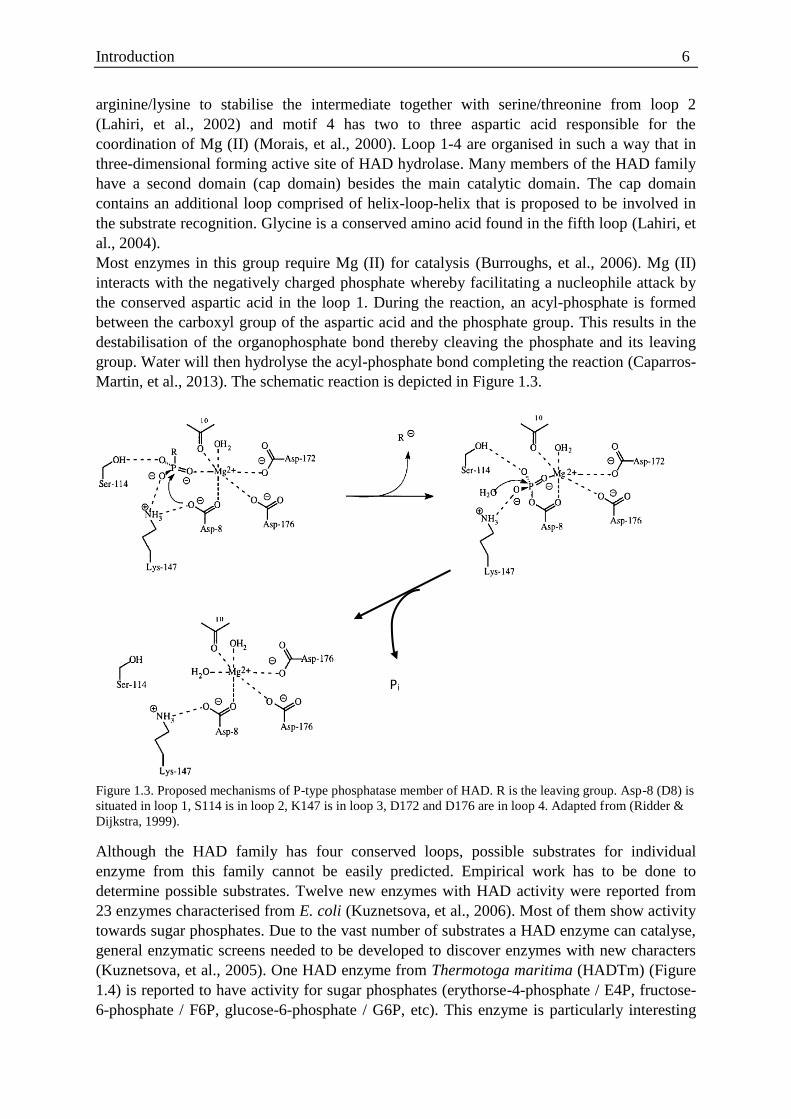
Most enzymes in this group require Mg (II) for catalysis (Burroughs, et al., 2006). Mg (II)
interacts with the negatively charged phosphate whereby facilitating a nucleophile attack by
the conserved aspartic acid in the loop 1. During the reaction, an acyl-phosphate is formed
between the carboxyl group of the aspartic acid and the phosphate group. This results in the
destabilisation of the organophosphate bond thereby cleaving the phosphate and its leaving
group. Water will then hydrolyse the acyl-phosphate bond completing the reaction (Caparros-
Martin, et al., 2013). The schematic reaction is depicted in Figure 1.3.
Figure 1.3. Proposed mechanisms of P-type phosphatase member of HAD. R is the leaving group. Asp-8 (D8) is
situated in loop 1, S114 is in loop 2, K147 is in loop 3, D172 and D176 are in loop 4. Adapted from (Ridder &
Dijkstra, 1999).
Although the HAD family has four conserved loops, possible substrates for individual
enzyme from this family cannot be easily predicted. Empirical work has to be done to
determine possible substrates. Twelve new enzymes with HAD activity were reported from
23 enzymes characterised from E. coli (Kuznetsova, et al., 2006). Most of them show activity
towards sugar phosphates. Due to the vast number of substrates a HAD enzyme can catalyse,
general enzymatic screens needed to be developed to discover enzymes with new characters
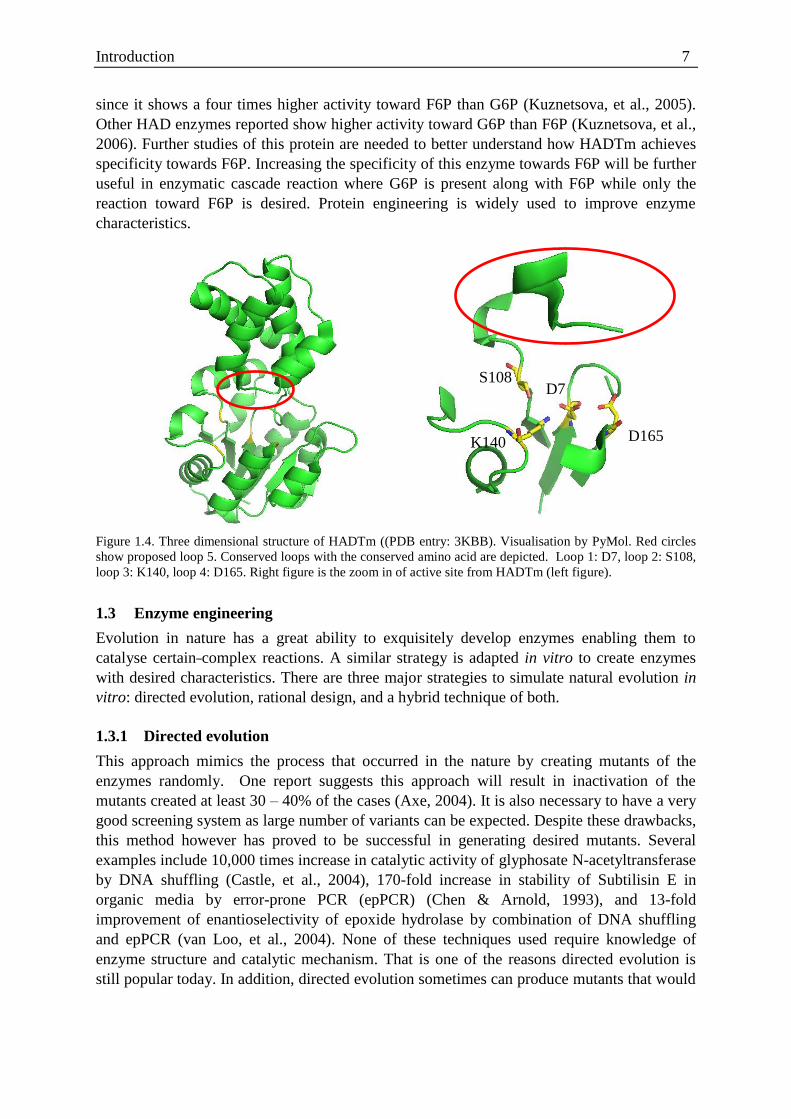
(Kuznetsova, et al., 2005). One HAD enzyme from Thermotoga maritima (HADTm) (Figure
1.4) is reported to have activity for sugar phosphates (erythorse-4-phosphate / E4P, fructose-
6-phosphate / F6P, glucose-6-phosphate / G6P, etc). This enzyme is particularly interesting
Pi
Introduction 7
since it shows a four times higher activity toward F6P than G6P (Kuznetsova, et al., 2005).
Other HAD enzymes reported show higher activity toward G6P than F6P (Kuznetsova, et al.,
2006). Further studies of this protein are needed to better understand how HADTm achieves
specificity towards F6P. Increasing the specificity of this enzyme towards F6P will be further
useful in enzymatic cascade reaction where G6P is present along with F6P while only the
reaction toward F6P is desired. Protein engineering is widely used to improve enzyme
characteristics.
Figure 1.4. Three dimensional structure of HADTm ((PDB entry: 3KBB). Visualisation by PyMol. Red circles
show proposed loop 5. Conserved loops with the conserved amino acid are depicted. Loop 1: D7, loop 2: S108,
loop 3: K140, loop 4: D165. Right figure is the zoom in of active site from HADTm (left figure).
1.3 Enzyme engineering
Evolution in nature has a great ability to exquisitely develop enzymes enabling them to
catalyse certain complex reactions. A similar strategy is adapted in vitro to create enzymes
with desired characteristics. There are three major strategies to simulate natural evolution in
vitro: directed evolution, rational design, and a hybrid technique of both.
1.3.1 Directed evolution
This approach mimics the process that occurred in the nature by creating mutants of the
enzymes randomly. One report suggests this approach will result in inactivation of the
mutants created at least 30 – 40% of the cases (Axe, 2004). It is also necessary to have a very
good screening system as large number of variants can be expected. Despite these drawbacks,
this method however has proved to be successful in generating desired mutants. Several
examples include 10,000 times increase in catalytic activity of glyphosate N-acetyltransferase
by DNA shuffling (Castle, et al., 2004), 170-fold increase in stability of Subtilisin E in
organic media by error-prone PCR (epPCR) (Chen & Arnold, 1993), and 13-fold
improvement of enantioselectivity of epoxide hydrolase by combination of DNA shuffling
and epPCR (van Loo, et al., 2004). None of these techniques used require knowledge of
enzyme structure and catalytic mechanism. That is one of the reasons directed evolution is
still popular today. In addition, directed evolution sometimes can produce mutants that would
D7 S108
D165 K140
Introduction 8
not be created by rational design due to unpredictable effects of mutations (Leisola &
Turunen, 2007).
1.3.1.1 DNA shuffling
This technique is based on the concept of mutation that happens in the nature. DNA shuffling
is performed by cutting the desired DNA using DNAse or defined restriction enzymes
creating a library of small DNA fragments. Subsequent PCR is performed without any
primers so the small fragments will anneal to each other for sequences that have overlapping
regions (natural primers). PCR is then run several times and a final annealing with primers
specific to the end sequences of the native DNA to amplify complete DNA (Cohen, 2001).
This approach is used to limit the sequence inside the original gene family because random
sequences often produce non-functional proteins. A modification of this technique using
nonhomologous recombination can increase the performance of DNA shuffling. The
modified method using exon for shuffling instead of DNA template (Leisola & Turunen,
2007).
1.3.1.2 Error-prone PCR (epPCR)
This technique is the simplest and commonly used one to create a library based on a single
gene. Unlike ordinary PCR, the low fidelity of Taq DNA polymerase is used to generate
mutations. Several additional modifications are also performed such as using imbalance
concentration of dNTPs (Cadwell & Joyce, 1992), addition of MnCl2, or increased extension
time (Leung, et al., 1989). Serial dilutions of every fourth PCR cycle are also implemented to
enrich single point mutations (McCullum, et al., 2010).
1.3.2 Rational design of enzymes
Although structure and catalytic mechanisms are needed for successful application of this
approach, enzymes by design have advantages over directed evolution. A smaller number of
variants are generated by this approach so that the screening effort is reduced. High-
throughput screening (HTS) is not always possible to implement. There are also more factors
to be considered and more importantly, HTS is not a cheap technology (Porter, et al., 2016).
There is no single defined protocol for rational designs like DNA shuffling and epPCR in
directed evolution. However, rational design is always started by in silico analysis as a
thorough knowledge of the structure is essential.
The structure of some enzymes has been devised and stored in PDB and for those
enzymes, rational design can be started directly. For other enzymes without crystal structures,
homology modelling needs to be done prior to rational design. There are various
bioinformatics tools that can be used for homology modelling, YASARA is one such tool and
was used in this project. In general, 30% of similarity in any sequence is needed to produce a
reliable homology model (Sander & Schneider, 1991). YASARA has been designed to
perform well in homology modelling with its multi-level optimisation by considering course-
grained feature, clipping class costs, and mainly tweaking torsion angles. It is shown to have
a comparable performance with related tools, e.g. Rosetta and Undertaker (Krieger, et al.,
2009). Depending on the purpose of the rational design, in the case of substrate specificity
study, ligand docking may be done. YASARA is also able to execute this task with its default
VINA docking. However, this tool is not suitable for protein-protein docking (Trott & Olson,
2010).
Introduction 9
Site-directed mutagenesis is the continuation of in silico analysis in rational design.
QuikChange™ site-directed mutagenesis (QC) represents an improved method compared to
conventional PCR based site-directed mutagenesis. QC bypasses the restriction and ligation
steps necessary in the conventional method. This method was invented and patented by
Stratagene. Two important factors contribute to the success of QC: primer design and DpnI
digestion. In the standard QC protocol, plasmid DNA is used as a template and a primer
containing the desired mutation is used. During the PCR reaction, linear DNA will be used
with staggered end located at mutation point designed. DpnI is used to degrade parental
plasmid DNAs that are methylated (Agilent, 2005). Several proposed modifications to the
standard QC protocol are reported (Liu & Naismith, 2008; Zheng, et al., 2004). Both of them
suggest to use a set of primer that contains non-overlapping regions. This additional
modification will give improvement to the standard protocol as it will decrease the likelihood
of primer dimer formation and less parental DNA template could be used, thereby reducing
the amount of parental DNA not degraded by Dpn1 (Xia, et al., 2014).
1.3.3 Semi-rational site mutagenesis as a hybrid technique
This technique combines the advantages of directed evolution and rational design for
generating library sizes that facilitate handling with the precise exchange of a defined amino
acid (semi-rational). This approach still needs solid knowledge of protein structure but a
much higher quality of the library is generated compared to the directed evolution (Lutz,
2010). This technique is based on the utilisation of degenerate primers to create the library
(Figure 1.5).
Figure 1.5. List of degenerate primers commonly used for semi rational site mutagenesis. Adapted from (Currin,
et al., 2015)
Successful employment of this method for generating desired mutations have already been
reported. Synthetic capacity of γ-humulene to produce different sesquiterpenes is increased
by a systematic recombination of the amino acids near the active site (Yoshikuni, et al.,
2006). Alcohol dehydrogenase from E. coli K-12 was improved in its specificity toward
Introduction 10
NADH cofactor over NADPH by degenerate primers containing the NDT triplet modifying
amino acids in the binding site of NADPH (Pick, et al., 2014).
1.4 Objective
HAD superfamily is a family known to date to have phosphatase activity more than any
phosphatases from different families (Koonin & Tatusov, 1994). Phosphatases together with
kinases are the two most important groups in metabolic regulation as 40% of metabolomes
have a phosphate functional group (Nobeli, et al., 2003). The significant role of enzymes
from the HAD superfamily in metabolism is, however, largely unexplored (Kuznetsova, et
al., 2006). Thus more research exploring the potential roles of enzymes from this superfamily
needs to done. In this work, one enzyme that belongs to HAD superfamily from Thermatoga
neapolitana (HADTn) will be studied in respect to its substrate specificity. This enzyme
shares 99% sequence similarity with HADTm, a previously studied enzyme that shows four
times higher activity toward fructose-6-phosphate (F6P) than glucose-6-phosphate (G6P)
(Kuznetsova, et al., 2005). This characteristic is rather unusual because enzymes of the same
family from E. coli act otherwise (Kuznetsova, et al., 2006). The main focus of this work is to
identify amino acids that play a role in substrate specificity in HADTn and to further increase
the specificity toward F6P over G6P employing recent technologies in protein engineering.
The improved mutants could be used later for different purposes, one of them is in enzymatic
cascade reactions that requires enzymes with high substrate specificity.
In silico analysis is the first step that will be used to understand the protein.
Homology modelling with HADTm which crystal structure has been devised will be done
using YASARA version 15 (Krieger & Vriend, 2014). Sequence alignment and three
dimensional structure comparison to other enzymes from the same family will be performed
to be done to locate the active site and predict possible catalytic mechanisms. The results will
be used to simulate and calculate the effect of the mutations on substrate specificity. Along
with in silico analysis, the initial characterisation of WT needs be done to determine the
optimum condition for the enzyme assay. Possible mutation with improved specificity toward
F6P predicted by YASARA will be generated using QuikChange™ site-directed mutagenesis
and later purified by FPLC. Turn over number and catalytic activity are the two parameters
that will be used to compare the mutants with WT. Based on those findings, gene libraries for
several different positions of a particular amino acid will be generated by site-saturation
mutagenesis (NNK motif). A high-throughput screening method will be developed to screen
large number of the libraries. Final characterisations of improved variants will be carried out
to determine the effect of the mutations on the intrinsic characteristic of the enzymes, e.g.
substrate specificity, temperature stability, and inhibition mechanism.
Materials and Methods 11
2 Materials and Methods
2.1 Materials
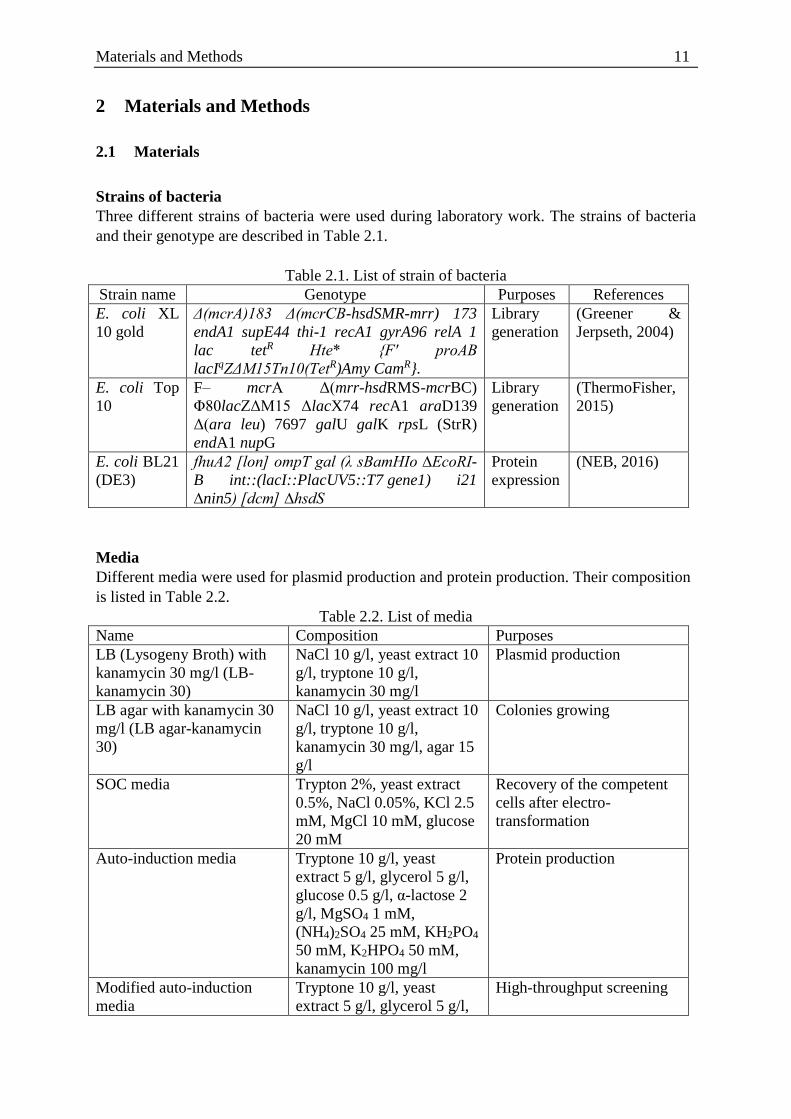
Strains of bacteria
Three different strains of bacteria were used during laboratory work. The strains of bacteria
and their genotype are described in Table 2.1.
Table 2.1. List of strain of bacteria
Strain name Genotype Purposes References
E. coli XL
10 gold
Δ(mcrA)183 Δ(mcrCB-hsdSMR-mrr) 173
endA1 supE44 thi-1 recA1 gyrA96 relA 1
lac tetR Hte* {F′ proAB
lacIqZΔM15Tn10(TetR)Amy CamR}.
Library
generation
(Greener &
Jerpseth, 2004)
E. coli Top
10
F– mcrA Δ(mrr-hsdRMS-mcrBC)
Φ80lacZΔM15 ΔlacX74 recA1 araD139
Δ(ara leu) 7697 galU galK rpsL (StrR)
endA1 nupG
Library
generation
(ThermoFisher,
2015)
E. coli BL21
(DE3)
fhuA2 [lon] ompT gal (λ sBamHIo ∆EcoRI-
B int::(lacI::PlacUV5::T7 gene1) i21
∆nin5) [dcm] ∆hsdS
Protein
expression
(NEB, 2016)
Media
Different media were used for plasmid production and protein production. Their composition
is listed in Table 2.2.
Table 2.2. List of media
Name Composition Purposes
LB (Lysogeny Broth) with
kanamycin 30 mg/l (LB-
kanamycin 30)
NaCl 10 g/l, yeast extract 10
g/l, tryptone 10 g/l,
kanamycin 30 mg/l
Plasmid production
LB agar with kanamycin 30
mg/l (LB agar-kanamycin
30)
NaCl 10 g/l, yeast extract 10
g/l, tryptone 10 g/l,
kanamycin 30 mg/l, agar 15
g/l
Colonies growing
SOC media Trypton 2%, yeast extract
0.5%, NaCl 0.05%, KCl 2.5
mM, MgCl 10 mM, glucose
20 mM
Recovery of the competent
cells after electro-
transformation
Auto-induction media Tryptone 10 g/l, yeast
extract 5 g/l, glycerol 5 g/l,
glucose 0.5 g/l, α-lactose 2
g/l, MgSO4 1 mM,
(NH4)2SO4 25 mM, KH2PO4
50 mM, K2HPO4 50 mM,
kanamycin 100 mg/l
Protein production
Modified auto-induction
media
Tryptone 10 g/l, yeast
extract 5 g/l, glycerol 5 g/l,
High-throughput screening
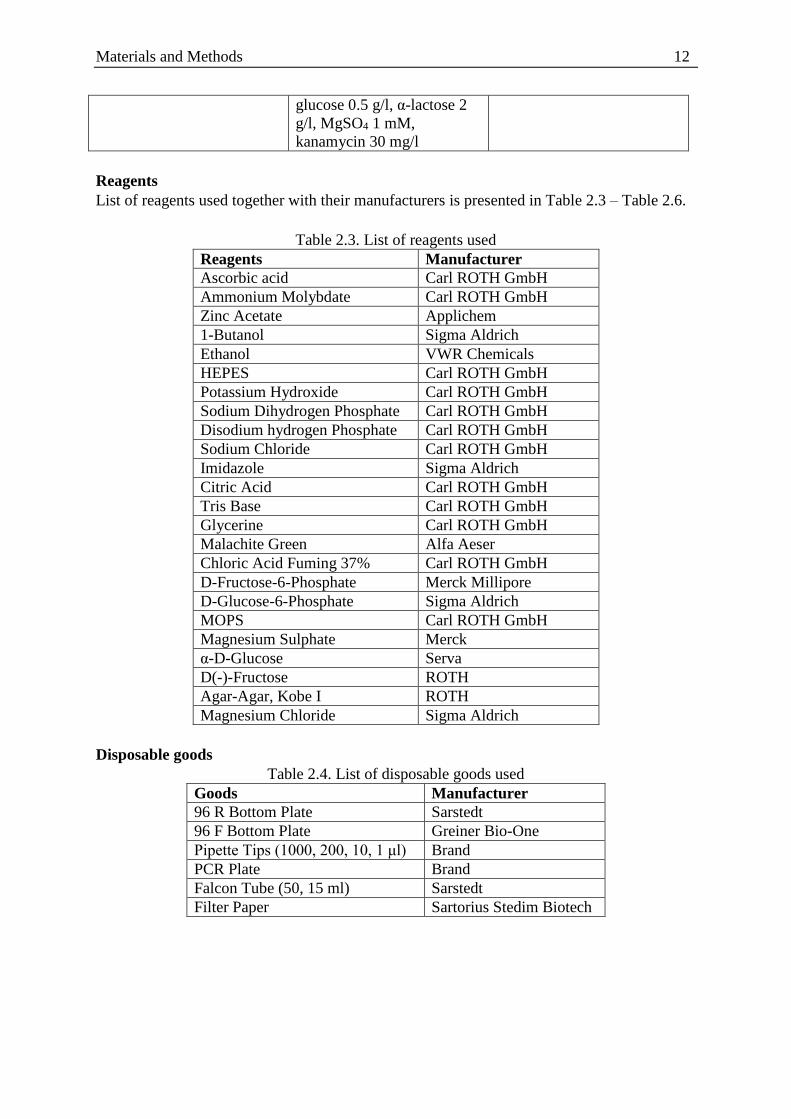
Materials and Methods 12
glucose 0.5 g/l, α-lactose 2
g/l, MgSO4 1 mM,
kanamycin 30 mg/l
Reagents
List of reagents used together with their manufacturers is presented in Table 2.3 – Table 2.6.
Table 2.3. List of reagents used
Reagents Manufacturer
Ascorbic acid Carl ROTH GmbH
Ammonium Molybdate Carl ROTH GmbH
Zinc Acetate Applichem
1-Butanol Sigma Aldrich
Ethanol VWR Chemicals
HEPES Carl ROTH GmbH
Potassium Hydroxide Carl ROTH GmbH
Sodium Dihydrogen Phosphate Carl ROTH GmbH
Disodium hydrogen Phosphate Carl ROTH GmbH
Sodium Chloride Carl ROTH GmbH
Imidazole Sigma Aldrich
Citric Acid Carl ROTH GmbH
Tris Base Carl ROTH GmbH
Glycerine Carl ROTH GmbH
Malachite Green Alfa Aeser
Chloric Acid Fuming 37% Carl ROTH GmbH
D-Fructose-6-Phosphate Merck Millipore
D-Glucose-6-Phosphate Sigma Aldrich
MOPS Carl ROTH GmbH
Magnesium Sulphate Merck
α-D-Glucose Serva
D(-)-Fructose ROTH
Agar-Agar, Kobe I ROTH
Magnesium Chloride Sigma Aldrich
Disposable goods
Table 2.4. List of disposable goods used
Goods Manufacturer
96 R Bottom Plate Sarstedt
96 F Bottom Plate Greiner Bio-One
Pipette Tips (1000, 200, 10, 1 μl) Brand
PCR Plate Brand
Falcon Tube (50, 15 ml) Sarstedt
Filter Paper Sartorius Stedim Biotech
Materials and Methods 13
Molecular Biology
Table 2.5. List of molecular biology reagents
Reagent Manufacturer
Phusion® GC Reaction Buffer 5x New England Biolabs
dNTP-Mix-10 Rapidozym
Phusion® HF Polymerase New England Biolabs
DpnI New England Biolabs
DNAse Applichem
Lysozyme Carl ROTH GmbH
Plasmid Miniprep Kit Thermo Scientific
Instruments
Table 2.6. List of instruments used
Instrument Manufacturer
Micro PulserTM Biorad
Nanophotometer P330 Implen
Aekta Purifier GE Healthcare Life Science
pH Meter Five Easy Mettler Toledo
Microplate Shaker TiMix5 Edmund Buehler GmbH
Thermal Cycler C100TM Biorad
Centrifuge Hereus Pico 21 Thermo Scientific
Centrifuge RC 6 Plus Sorva
Scale AW 320 Shimadazu
Colony picker: CP-7200 Norgren Systems
Electrophoresis SDS Bio Rad
Microplate spectrophotometer Multiskan® Thermo scientific
Microplate dispenser Microflo Select Biotek
2.2 Methods
2.2.1 Computational methods
2.2.1.1 In silico analysis of mutants
Structure modelling of wild type enzyme haloacid dehalogenase from Thermotoga
neopolitana (HADTn) was carried out using YASARA version 15 (sequence of the enzyme
is presented in Appendix 1A and B) (Krieger & Vriend, 2014). Putatative β-
phosphoglucomutase (PDB entry: 3KBB) was used as a template. Sequence alignment with
other phosphatases from HAD family from literature was carried out using Clustal Omega
(EMBL-EBI, 2016) to identify amino acids that participate in the catalytic reaction. Ligands,
glucose-6-phosphate (G6P) and fructose-6-phosphate (F6P), were generated using YASARA.
Docking (dock_run) to HADTn wild type was run for every ligand using YASARA. Twenty-
five runs based on VINA docking (Trott & Olson, 2010) were performed for each docking.
Energy minimisation of ligands was always employed prior to dockings. Amino acids that
showed interactions with ligands from the docking calculation but seemed to not be
conserved amino acids for catalytic activity based on sequence alignment study were chosen
to build new mutant with single or double mutation. New mutants were developed using the
Materials and Methods 14
same template (3KBB). Docking of ligands was performed under exactly the same conditions
as for wild type. Mutations were analysed based on binding energy and dissociation constant
calculated by YASARA.
2.2.1.2 Primers designs
Several sets of primers were designed to develop mutants based on the analysis of
calculations performed by YASARA. Primers were ordered from Biomers.net GmbH (Ulm,
Germany). It was suggested that the primers have length between 25 to 45 bases and should
terminate in either G or C. Melting temperature (Tm) should also be higher than 78oC
(Agilent, 2005). Several modifications to enhance performance of the original QuikChangeTM
protocol developed by Stratagene in regard to the primer design have been reported. Instead
of complete overlapping primers, it was suggested that the primers have at least 8 non-
overlapping bases (Liu & Naismith, 2008; Zheng, et al., 2004)/ At least each primer designed
contained ten or more non-overlapping bases. For insertion mutation, primer design followed
the suggestion by (Liu & Naismith, 2008). Tm for each primer was calculated by the online
program, Primertemp developed by (Kim, 2015). Other primer properties such as Gibbs free
energy (ΔG) for individual primers, ΔG for cross dimer between forward and reverse primers,
and numbers of overlapping base pairs, were calculated by OligoAnalyzer 3.1 (Integrated
DNA Technologies, Inc, 2015). ΔG for cross dimer was kept as low as possible compared to
individual primer so as the numbers of overlapping base pairs.
2.2.2 Molecular biology methods
2.2.2.1 Electrocompetent cells preparation
One colony of a cell strain was inoculated to 30 ml LB-low media and incubated overnight at
37oC. The culture was transferred to 270 ml of LB-low media and incubated at 37oC until
optical density at 600 nm (OD600) reached 0.5 – 0.6. The culture was divided into 6 Falcon
tubes and centrifuged at 4600 x g at 4oC for 20 min. The supernatant was decanted and each
cell pellet was resuspended using 50 ml sterile ddH2O and then centrifuged again at 4600 x g
at 4oC for 20 min. After supernatant was decanted, 50 ml of sterile 10% (w/v) glycerine was
used to resuspend the cell pellet. The tubes were centrifuged at 4600 x g at 4oC for 20 min.
After the supernatant was decanted, cell pellets from each Falcon tube were resuspended with
25 ml of sterile 10% (w/v) glycerine and two volumes were combined into one Falcon tube
followed by centrifugation at 4600 x g at 4oC for 25 min. After discarding the supernatant,
the remaining solution in each Falcon tube was used to resuspend every cell pellet and
thereupon they were combined into one Falcon tube. Sterile 10% (w/v) glycerine was used to
dilute the solution until OD600 = 50. The solution was aliquoted (70 μl) into microtubes and
subsequently frozen in liquid nitrogen. Competent cells were stored at -80oC.
2.2.2.2 QuikChangeTM site-directed mutagenesis (QC)
QuikChangeTM was performed in two steps using the protocol descried by Wang & Malcom
(1999). The first step was to run a reaction with each primer in 50 μl volume for 4 cycles. The
second step was to combine 25 μl of each PCR mix containing primer set into a new tube
making 50 μl reaction volume, the PCR was then continued for 18 cycles. PCR mix contains
10 μl Phusion® 5x HF, 50 pmol primer, 10 nmol dNTPs, 75 ng template plasmid DNA
(plasmid construct can be seen in Appendix 1C), 100 units (U) Phusion polymerase, and
autoclaved ddH2O up to 50 μl. PCR was done as follows:
Materials and Methods 15
Firstly, the lid temperature was set at 105oC and hot start was at 98oC for 3 min.
This was followed by denaturation at 98oC for 30 s, and then by annealing at 50 –
55oC for 30 s.
Elongation was carried out at 72oC for 210 s.
The final step was set at 70oC for 5 s.
Fifteen units of DpnI was added to PCR product to remove methylated DNA (wild type) and
the mix was incubated at 37oC overnight, additional 10 U of Dpn was added for at least 5
hours. Plasmid was purified by adding 1 ml butanol from -20oC and centrifuged for 20 min at
4oC, 21,100 x g. After decanting supernatant, 1 ml of 70% ethanol from -20oC was added and
centrifuged for 20 min at 4oC, 21,100 x g. After decanting supernatant and drying at 50oC, 10
μl of ddH2O was added and incubated at room temperature for 30 min.
2.2.2.3 Plasmid transformation (Electroporation)
Competent cells (E. coli XL 10 gold or Top 10) were thawed on ice. Four microliter of
purified QC product were transferred to the competent cells and mixed gently. The competent
cells were transferred to an electroporation cuvette (2 mm) and placed in the electroporator
(2.5 kV). 1 ml SOC media preincubated at 37oC was transferred subsequently to the cuvette.
The solution was transferred to a microtube and incubated at 37oC, 150 rpm for 1 hour. Serial
dilutions with LB were made to achieve desired number of colonies (< 400) per one plate and
100 μl of each of them was plated on LB agar-kanamycin 30 and incubated overnight at
37oC.
2.2.2.4 Plasmid production, purification and sequencing
One colony from LB agar-kanamycin 30 was inoculated to LB-kanamycin 30 and incubated
at 37oC, 150 rpm overnight. The culture was transferred to a 2 ml microtube and centrifuged
at 17,000 x g and supernatant was removed. Plasmid was purified using GeneJET Plasmid
Miniprep Kit (Thermo Fisher Scientific). After purification, plasmid concentration was
measured using IMPLEN nanophotometer prior to sequencing by GATC GmbH (Cologne,
Germany).
2.2.3 Biochemical methods
2.2.3.1 Protein production and purification
Mutant plasmids were transformed to E. coli BL21 (DE3) followed the same protocol
described previously. One colony from LB agar-kanamycin was transferred to 20 ml LB-
kanamycin 30 and incubated at 37oC, 150 rpm overnight. Twenty millilitre of the culture
were transferred to 200 ml auto-induction media and grown 48 hours for enzyme production.
The cells were harvested by centrifugation at 10.000 g, at room temperature for 20 minutes.
After supernatant decantation, binding buffer (HEPES-K buffer 100 mM pH 7.5, NaCl 500
mM, imidazole 20 mM, glycerine 10%) was used to resuspend the cells. Cell lysis was
performed by sonication using a Hielscher sonicator (amplitude 10, cycle 0.5 s) for 30 min
with constant cooling of the cell solution in an ice bath. Twenty millimolar of Mg (II) and 10
μg/ml of DNAse were added to the solution and centrifuged at 10.000 x g, room temperature
for 20 minutes. The Supernatant was filtered using a 0.45 μm syringae filter and purified with
ÄKTA purifier 10 GE Healthcare. His Trap™ FF crude 5 ml was used to capture the histidine
containing enzyme. After washing with binding buffer, elution buffer (HEPES-K buffer 100
Materials and Methods 16
mM pH 7.5, NaCl 500 mM, imidazole 500 mM, glycerine 10%) was applied to elute the
enzyme. Desalting was performed using the same instrument but Hi PrepTM 26/10 Desalting
column and the elution buffer was Tris-HCl 50 mM pH 7.5.
2.2.3.2 Phosphate assays
Three different assays were employed. The first assay (P I assay) is based on complexation of
phosphate, molybdate, and malachite green (Hoenig, et al., 1989). The second assay (P II
assay) is based on reduction of phosphate-molybdate complex with ascorbic acid (Drueckes,
et al., 1995). The third assay (P III assay) is the modification of second method for high
throughput screening. All three phosphate assays are end point assay.
P I assay: 20 μl of sample was incubated with 180 μl reagent containing reagent A :
reagent B 36:1. Reagent A consisted of sodium molybdate 2.6% w/v: HCl 2.5 N 1:1. Reagent
B consisted of malachite green 0.126% w/v. Incubation was performed for 120 s at 30oC and
final absorbance was read with Multiskan at 620 nm.
P II assay: 30 μl of sample was incubated with 125 μl reagent containing reagent C :
reagent D 1:4. Reagent C contained Zn Acetate 15 mM, ammonium heptamolybdate 10 mM
pH 5 while reagent D contained ascorbid acid 10% (prepared fresh daily) pH 5. Incubation
was performed for 10 minutes at 30oC and final absorbance was read with Multiskan at 850
nm. Reagent C is stable for six months when it is stored at 4oC (Drueckes, et al., 1995).
P III assay: exactly the same procedure for P II assay was followed. The only
modification was pH for ascorbic acid was not adjusted making the final pH of the mixture
between reagent C and D become 2.5
2.2.3.3 Initial wild type characterisation
Wild type enzyme 0.05 mg/ml was incubated in reaction buffer (HEPES-K 50 mM pH 7.5,
Mg (II) 5 mM) containing different G6P (0.1, 0.25, 0.5, 0.75, 1, 5, 10, 25, 50 mM) and
incubated in PCR tube at 70oC. This reaction buffer followed suggestion by (Kuznetsova, et
al., 2005). Enzyme activity was measured by following the release of phosphate in a time
course of 0, 15, 30, 45 minutes. P I assay was used to determine phosphate produced from
G6P concentration up to 1 mM while P II assay was used to determine phosphate produced
from higher G6P concentration. Maximum rate (Vmax) and Michaelis constant (Km) were
calculated using SigmaPlot.
Different buffers (citrate, MES, Bis-Tris, Tris-HCl, MOPS, HEPES-K) 50 mM and
pH (6 – 9) were used to test enzyme activity. Enzyme activity tests were performed by
incubating 0.05 mg/ml wild type enzyme in buffer solution containing Mg (II) 5 mM and
G6P 5 mM for 1 hour at 70oC
Different concentrations of Mg (II) and Mn (II) were tested after optimum buffer and
pH had been determined. Enzyme activity was performed by incubating 0.05 mg/ml wild
type enzyme in HEPES-K 50 mM pH 7 containing G6P 5 mM for 1 hour at 70oC.
For kinetic characterisation, six to seven different concentrations of F6P or G6P were
used fordetermination of enzyme activities. The concentrations were 1, 2.5, 5, 7.5, 10, 15, 25
mM for both substrates. The assay was performed in PCR plates containing HEPES-K 50
mM pH 7, Mg (II) 5mM at 70oC (standard condition). Activity was followed at time 0, 15, 30
min. Phosphate production was measured using P II assay.

Materials and Methods 17
2.2.4 High throughput screening
2.2.4.1 High throughput screening development
Eighty-four colonies of E. coli BL21 (DE3) containing wild type enzyme were inoculated
randomly into a 96 deep well plate containing 1.2 ml modified auto-induction media. Eight E.
coli BL21 (DE3) containing empty pET28 plasmid were also inoculated to the 96 well plate
for negative control to see basal activity of indigenous phosphatase. Four remaining wells
containing the media were used to check if there was any contamination. All colonies were
inoculated using Colony picker (Norgern System) and plates were filled with the media using
Microplate dispenser (Biotek). Incubation was performed at 37oC and 1000 rpm for 24 hours
(Micorplate Shaker TiMix5, Edmund Bühler GmbH). After incubation, 50 μl culture from
each well was transferred to F bottom plate for OD600 measurement. OD600 measurement was
performed in Microplate spectrophotometer Multiskan® after diluting the sample 5 times
using NaCl 0.85%. In addition, the other 100 μl culture from each well was transferred to R
bottom plate and subsequently centrifuged at 4,600 x g) for 30 minutes at 4oC. Following
centrifugation, supernatant was decanted and the plate containing cell pellets was kept at -
20oC overnight to improve lysis. Lysis procedure followed the protocol described by (Pick, et
al., 2014) with some slight modification. The plate from -20oC was incubated at 37oC for 1
hour. Fifty microliter solution containing DNAse 10 μg/ml, lysozyme 100 μg/ml, Mg (II)
5 mM, HEPES-K 50 mM pH 7 was transferred to the R bottom plate and followed by
incubation in the Micorplate Shaker at 37oC, 1200 rpm for one hour. One hundred microliter
solution containing HEPES-K 50 mM pH 7 and Mg (II) 5 mM was transferred to each well
prior to centrifugation at 4,600 x g for 30 minutes at 4oC.
For wild type landscape and Z’ determination, 15 μl of supernatant was transferred to
PCR plate containing 135 μl of HEPES-K 50 mM, pH 7 and Mg (II) 5 mM (reaction
solution) with different substrate concentration (0.1, 0.5, and 1 mM). The enzyme assay was
performed in a thermal cycler at 70oC.Sampling time was 0, 15, 60 and minutes. Z’ value was
obtained by average of two independent plates. P III assay was used for determining
phosphate concentration. The effect of incubation time, substrate concentration, and OD600
toward Z’ value was calculated.
2.2.4.2 High throughput screening for library
Six microliter of purified QC product was transformed to E. coli BL21 (DE3) following
previously described protocol. E. coli BL21 (DE3) colonies on LB agar-kanamycin 30 were
inoculated to 96 deep-well plate containing modified auto-induction media. As a positive
control E. coli BL21 (DE3) bearing wild type enzyme (inoculated randomly in 8 wells) used
was. Negative controls were E. coli BL21 (DE3) bearing empty pET28 plasmid (4 wells) and
media only (4 wells). Other steps were performed the same as previous described, but in
addition to the transfer of 50 μl and 100 μl culture to F and R bottom plate, additional 50 μl
of the expression cultures were transferred to 50% glycerol (in 384 deep well plate) and
stored at -80oC. Lysis procedure was performed exactly the same as well as the assay.
The screening procedure consisted of three rounds following the protocol described by Pick,
et al. (2014). The first screening round was performed to screen library developed from
transformation of QC product. Improved variants characterised by 20% higher activity than
average plus one-time standard deviation of controls were picked for second screening (detail
of criteria are presented in Result. Second screening was performed by transferring 10 μl of

Materials and Methods 18
glycerol stock of variants that appeared to belong to group A, B, or C from first screening to
1 ml modified auto-induction media in 96 deep well plate (three replicates were made).
Sampling, lysis step, and enzymatic assay were performed the same as first screening.
Several variants that showed behaviour that appeared to belong to group A, B, or C from
second screening glycerol stock were inoculated to LB-kanamycin 30 for plasmid production.
Plasmid was purified using GeneJET Plasmid Miniprep Kit (Thermo Fisher Scientific) and
transformed to E. coli BL21 (DE3) according to previously described protocol. Third
screening round was done by inoculating six to eight colonies of each variant to 1 ml
modified auto-induction media in 96 deep well plate. Incubation, lysis, and activity assays
were performed exactly the same as previously described. Best variants were determined and
their plasmids were sent for sequencing.
2.2.5 Final characterisation
Mutant obtained from library screening as well as WT enzyme were produced and purified
according the same protocol previously described. Mutant and wild type enzymes were
characterised to determine their kinetic parameters, effect of product inhibition, and their
stability at elevated temperatures. For determination of kinetic parameters, the experiment
was performed as described in the Initial Characterisation.
Product inhibition was studied by incubating 0.01 mg/ml enzyme in reaction solution
with two combinations of substrate and inhibitor. Fructose (0, 100, 200, 300 mM) was added
to every reaction solution containing F6P (1, 5, 10 mM). Glucose (0, 500, 1000, 1500 mM)
was added to every reaction solution containing G6P (1, 5, 10 mM). Phosphate produced was
followed every 10 minutes and measured using P II assay. Activity was determined by
calculating the slope of phosphate produced over time.
Thermal inactivation of the mutant and wild type enzymes was studied by incubating 1.7
mg/ml of the enzyme in Tris-HCl 50 mM pH 7.5 (desalting solution) at 70, 80, 90, 94oC.
Magnesium 100 mM was added to half of the incubation buffers. An aliquot of the enzyme
was sampled after 30, 60, 120, 240, 480, 1440 minutes of incubation and transferred to the
reaction solution containing 5 mM of G6P or F6P to measure its remaining activity. The
activity was determined after 15 minutes of incubation in the reaction solution. Phosphate
released was measured with P II assay.
Results 19
3 Results
3.1 Sequence alignment and in silico analysis for possible mutations
Sequence alignment studies were carried out using Clustal omega (EMBL-EBI, 2016) in
order to identify the amino acids that may play a pivotal role in the catalytic reaction and the
result is shown in Appendix 1D. Four proteins that are reported to have phosphatase like
activity were used for sequence alignment. This study revealed that there were at least seven
conserved amino acids for the wild type enzyme (WT) (Table 3.1). Conserved amino acids
were identified by considering sequence alignment and 3D structures of each reported
protein.
Table 3.1. Conserved amino acids in HAD family
Location WT P-type
ATPase1
P-type
ATPase2
Phosphatase
(T. maritima)3
Phosphoserine
phosphatase4
Motif I D7 D10 D8 D8 D11
D9 D10 D13
G10 G10 G11
T15 T14 T12
Motif II S108 S118 S114 S41 S99
Motif III K140 K151 K147 K191 K144
Motif IV E164
D165 D176 D172 D214 D167
D180 D176 N217 D171 1 (Aravind, et al., 1998). 2 (Ridder & Dijkstra, 1999). 3 (Shin, et al., 2003). 4 (Wang, et al., 2001)
Grey marks represent there are no comparable amino acids found based on sequence alignment and comparison
of 3D structure
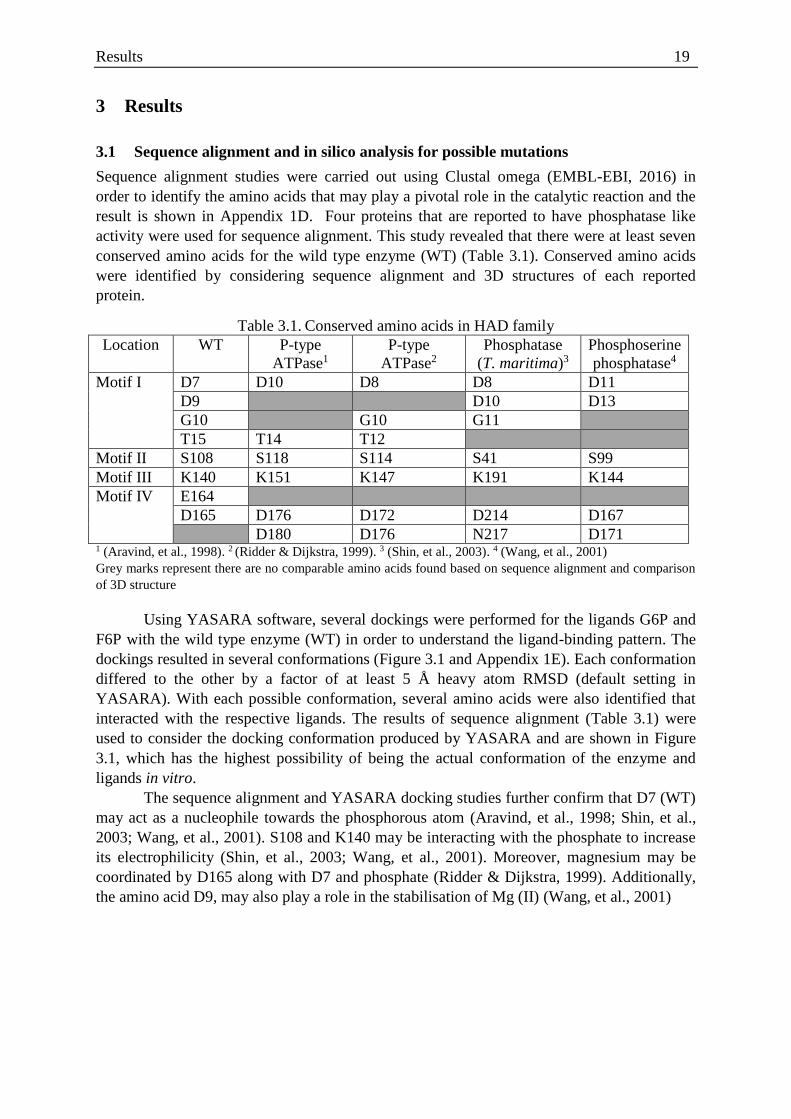
Using YASARA software, several dockings were performed for the ligands G6P and
F6P with the wild type enzyme (WT) in order to understand the ligand-binding pattern. The
dockings resulted in several conformations (Figure 3.1 and Appendix 1E). Each conformation
differed to the other by a factor of at least 5 Å heavy atom RMSD (default setting in
YASARA). With each possible conformation, several amino acids were also identified that
interacted with the respective ligands. The results of sequence alignment (Table 3.1) were
used to consider the docking conformation produced by YASARA and are shown in Figure
3.1, which has the highest possibility of being the actual conformation of the enzyme and
ligands in vitro.
The sequence alignment and YASARA docking studies further confirm that D7 (WT)
may act as a nucleophile towards the phosphorous atom (Aravind, et al., 1998; Shin, et al.,
2003; Wang, et al., 2001). S108 and K140 may be interacting with the phosphate to increase
its electrophilicity (Shin, et al., 2003; Wang, et al., 2001). Moreover, magnesium may be
coordinated by D165 along with D7 and phosphate (Ridder & Dijkstra, 1999). Additionally,
the amino acid D9, may also play a role in the stabilisation of Mg (II) (Wang, et al., 2001)
Results 20
Figure 3.1. One of docking results of wild type enzyme to (A) G6P and (B) F6P proposed by YASARA. Right
side is the zoom in of active site consisting of some amino acids that may play role in catalytic reaction based on
sequence alignment. Cyan-filled circle was manually drawn to represent possible position of Mg (II) (the size of
the circle does not represent the actual size of magnesium ion). Carbon atoms of ligands are given in blue and of
amino acids are in yellow. Picture was generated by PyMol.
In addition to amino acids that may play a role in the catalytic reaction, YASARA dockings
also suggested several other amino acids that showed interaction with each ligand such as-
D14, E16, E47, R117, S166. Furthermore, several single or double mutations based on these
amino acids were generated with YASARA. These dockings were performed for every
mutant and ligand (G6P and F6P) in order to calculate the affinity of the enzyme toward its
ligands. Affinity was represented by binding energy and dissociation constant (Kd) that were
calculated for every docking. The binding energy is defined as the energy needed to
dissociate an enzyme from its ligand (G6P or F6P) (European Nuclear Society, 2016). The
higher the energy, the stronger the interaction between enzyme and its ligand. The
dissociation constant is defined as the constant calculating inclination of enzyme-ligand
complex dissociates into enzyme and ligand in equilibrium. The higher this value, the more
inclined an enzyme-ligand complex dissociates. A higher affinity is characterised by a high
binding energy and low Kd. Each docking was performed at least 25 times by YASARA.
D165
S108
K140 D7
D165
S108
K140 D7
A
B

Results 21
Only binding energy and Kd from enzyme-ligand complexes that had the highest probability
considering HAD conserved active site and catalytic mechanism are summarised in Table 3.2
Table 3.2. Summary of YASARA docking calculations
No Mutation Ligand Binding energy
[kcal/mol]1 Kd [mM]2
Ratio of binding
energy3
Ratio of Kd4
1 WT1 Glu6P 5.96 42.57
0.97 1.31 Fru6P 5.81 55.57
2 D14P Glu6P 6.06 36.44
0.98 1.22 Fru6P 5.94 44.33
3 E47D Glu6P 5.75 60.78
0.92 2.18 Fru6P 5.29 132.33
4 D14E Glu6P 5.47 97.66
1.00 1.00 Fru6P 5.47 97.33
5 D14G Glu6P 5.80 56.52
0.98 1.26 Fru6P 5.66 71.47
6 D14H Glu6P 5.85 51.25
0.94 1.81 Fru6P 5.50 92.52
7 D14P
E47D
Glu6P 6.12 32.71 1.06 0.53
Fru6P 6.50 17.25
8
D14P
E47G
Glu6P 5.06 197.08 1.05 0.63
Fru6P 5.33 124.95
9 D14P
E47R
Glu6P 5.93 45.00 0.88 3.42
Fru6P 5.20 153.77
10 D14P
E16D
Glu6P 5.90 47.18 0.93 1.93
Fru6P 5.51 91.28
11 D14P
E16H
Glu6P 6.09 34.24 0.91 2.52
Fru6P 5.54 86.34
12 D14P
R117N
Glu6P 5.51 91.75 0.90 2.47
Fru6P 4.97 226.33
13 D14P
E113R
Glu6P 5.53 88.10 0.91 2.41
Fru6P 5.01 212.63
14 D14P
K75R
Glu6P 5.63 74.80 0.95 1.56
Fru6P 5.36 116.99 1Binding energy is defined as the energy needed to dissemble ligand from enzyme 2Kd is a constant that measuring the extent of ligand and enzyme dissociate 3Ratio of binding energy is the ratio of binding energy of F6P to G6P, the higher the value the higher
affinity of the enzyme toward F6P is 4Ratio of Kd is the ratio of Kd of F6P to G6P, the lower the value the higher the affinity of the enzyme
toward F6P
The highest ratio of binding energy and the lowest ratio of Kd is marked bold in Table
3.2. Based on YASARA docking calculation, D14P gave slightly higher ratio of binding
energy and lower ratio of Kd. Other single mutations at this position did not give desired
effect thus D14P was used as a template to create double mutations. A combination of D14P
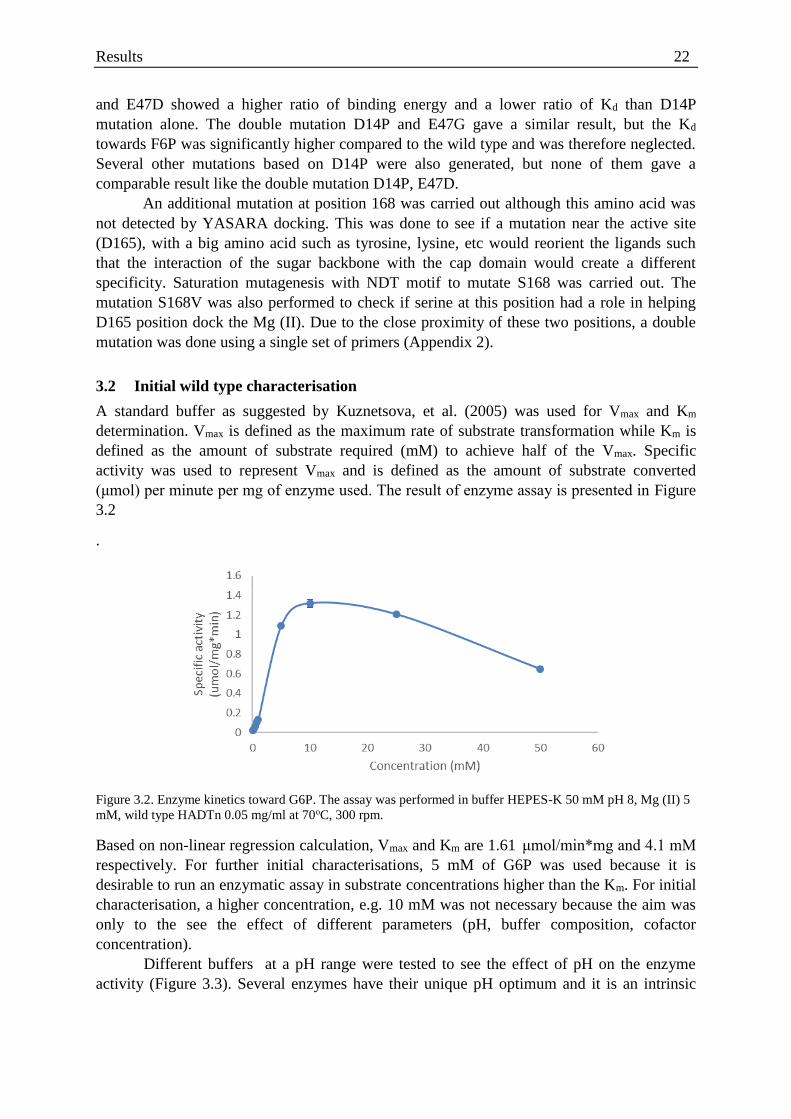
Results 22
and E47D showed a higher ratio of binding energy and a lower ratio of Kd than D14P
mutation alone. The double mutation D14P and E47G gave a similar result, but the Kd
towards F6P was significantly higher compared to the wild type and was therefore neglected.
Several other mutations based on D14P were also generated, but none of them gave a
comparable result like the double mutation D14P, E47D.
An additional mutation at position 168 was carried out although this amino acid was
not detected by YASARA docking. This was done to see if a mutation near the active site
(D165), with a big amino acid such as tyrosine, lysine, etc would reorient the ligands such
that the interaction of the sugar backbone with the cap domain would create a different
specificity. Saturation mutagenesis with NDT motif to mutate S168 was carried out. The
mutation S168V was also performed to check if serine at this position had a role in helping
D165 position dock the Mg (II). Due to the close proximity of these two positions, a double
mutation was done using a single set of primers (Appendix 2).
3.2 Initial wild type characterisation
A standard buffer as suggested by Kuznetsova, et al. (2005) was used for Vmax and Km
determination. Vmax is defined as the maximum rate of substrate transformation while Km is
defined as the amount of substrate required (mM) to achieve half of the Vmax. Specific
activity was used to represent Vmax and is defined as the amount of substrate converted
(μmol) per minute per mg of enzyme used. The result of enzyme assay is presented in Figure
3.2
.
Figure 3.2. Enzyme kinetics toward G6P. The assay was performed in buffer HEPES-K 50 mM pH 8, Mg (II) 5
mM, wild type HADTn 0.05 mg/ml at 70oC, 300 rpm.
Based on non-linear regression calculation, Vmax and Km are 1.61 μmol/min*mg and 4.1 mM
respectively. For further initial characterisations, 5 mM of G6P was used because it is
desirable to run an enzymatic assay in substrate concentrations higher than the Km. For initial
characterisation, a higher concentration, e.g. 10 mM was not necessary because the aim was
only to the see the effect of different parameters (pH, buffer composition, cofactor
concentration).
Different buffers at a pH range were tested to see the effect of pH on the enzyme
activity (Figure 3.3). Several enzymes have their unique pH optimum and it is an intrinsic

Results 23
characteristic of that particular enzyme. Reaction of the enzymes in higher or lower pH will
affect their activity. Optimum pH was determined with different buffer.
Figure 3.3. Effect of different buffers and pH on enzyme activity. The assay was performed in buffer 50 mM,
Mg (II) 5 mM, G6P 5 mM, and wild type HADTn 0.05 mg/ml at 70oC, 300 rpm, and 60 minutes. Line is drawn
to ease reading.
Results of the buffer tests (Figure 3.3) showed that pH 7 was the optimum pH for
maximum enzyme activity and no difference in activity was observed for Tris, MOPS, and
HEPES-K at pH 7. It is to be noted that no activity was observed when citrate buffer was
used, irrespective of the pH, hence, this buffer was not used for further tests.
Mn (II) 0.5 mM was suggested to be used along with Mg (II) in a general phosphate
assay (Kuznetsova, et al., 2005). The effect of Mn (II) addition was tested by incubating the
enzyme in a buffer solution containing different concentration of Mg (II) and Mn (II), which
showed that the addition of Mn (II) decreased the enzyme activity (Figure 3.4).
Figure 3.4. Effect of cofactor concentration on enzyme activity. The assay was performed in buffer HEPES-K
50 mM, pH 7, G6P 5 mM, and wild type HADTn 0.05 mg/ml at 70oC, 300 rpm, and 60 minutes.
Mg (II) at different concentrations and its effect on enzyme activity was also studied.
It showed that there was no increased enzyme activity observed when the concentration of
Mg (II) was higher than 2.5 mM (Figure 3.5). This study also confirmed that Mg (II) is
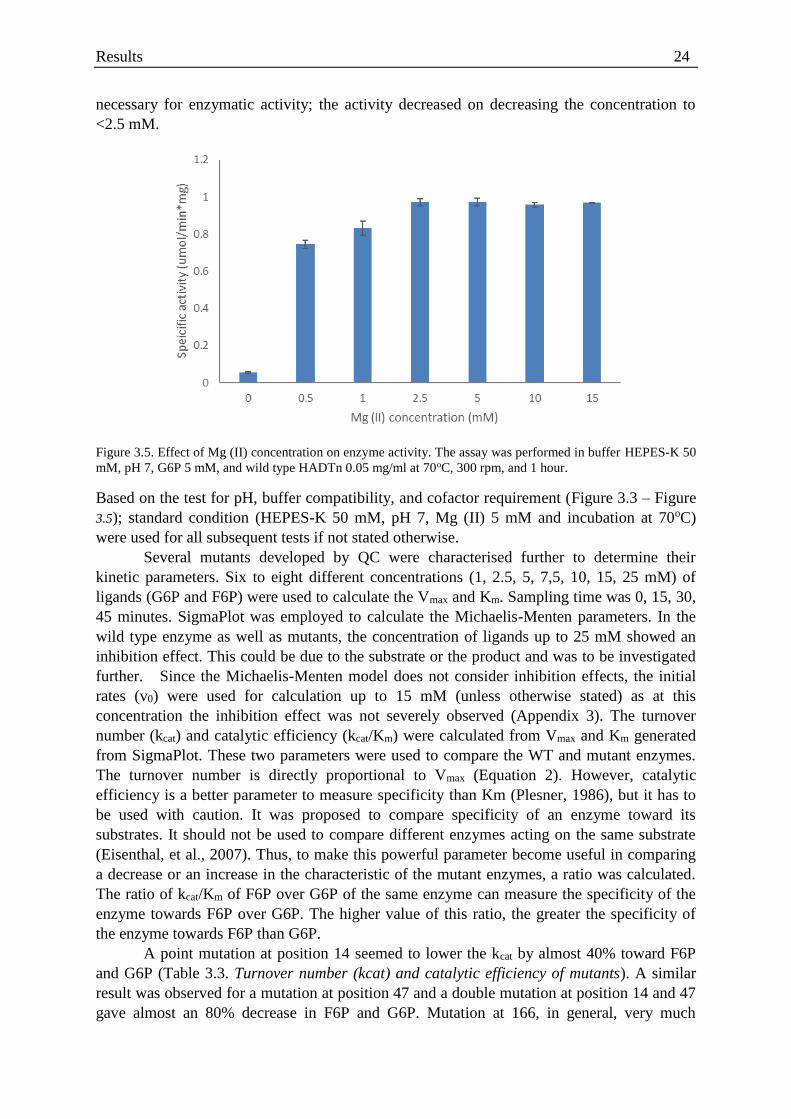
Results 24
necessary for enzymatic activity; the activity decreased on decreasing the concentration to
<2.5 mM.
Figure 3.5. Effect of Mg (II) concentration on enzyme activity. The assay was performed in buffer HEPES-K 50
mM, pH 7, G6P 5 mM, and wild type HADTn 0.05 mg/ml at 70oC, 300 rpm, and 1 hour.
Based on the test for pH, buffer compatibility, and cofactor requirement (Figure 3.3 – Figure
3.5); standard condition (HEPES-K 50 mM, pH 7, Mg (II) 5 mM and incubation at 70oC)
were used for all subsequent tests if not stated otherwise.
Several mutants developed by QC were characterised further to determine their
kinetic parameters. Six to eight different concentrations (1, 2.5, 5, 7,5, 10, 15, 25 mM) of
ligands (G6P and F6P) were used to calculate the Vmax and Km. Sampling time was 0, 15, 30,
45 minutes. SigmaPlot was employed to calculate the Michaelis-Menten parameters. In the
wild type enzyme as well as mutants, the concentration of ligands up to 25 mM showed an
inhibition effect. This could be due to the substrate or the product and was to be investigated
further. Since the Michaelis-Menten model does not consider inhibition effects, the initial
rates (v0) were used for calculation up to 15 mM (unless otherwise stated) as at this
concentration the inhibition effect was not severely observed (Appendix 3). The turnover
number (kcat) and catalytic efficiency (kcat/Km) were calculated from Vmax and Km generated
from SigmaPlot. These two parameters were used to compare the WT and mutant enzymes.
The turnover number is directly proportional to Vmax (Equation 2). However, catalytic
efficiency is a better parameter to measure specificity than Km (Plesner, 1986), but it has to
be used with caution. It was proposed to compare specificity of an enzyme toward its
substrates. It should not be used to compare different enzymes acting on the same substrate
(Eisenthal, et al., 2007). Thus, to make this powerful parameter become useful in comparing
a decrease or an increase in the characteristic of the mutant enzymes, a ratio was calculated.
The ratio of kcat/Km of F6P over G6P of the same enzyme can measure the specificity of the
enzyme towards F6P over G6P. The higher value of this ratio, the greater the specificity of
the enzyme towards F6P than G6P.
A point mutation at position 14 seemed to lower the kcat by almost 40% toward F6P
and G6P (Table 3.3. Turnover number (kcat) and catalytic efficiency of mutants). A similar
result was observed for a mutation at position 47 and a double mutation at position 14 and 47
gave almost an 80% decrease in F6P and G6P. Mutation at 166, in general, very much
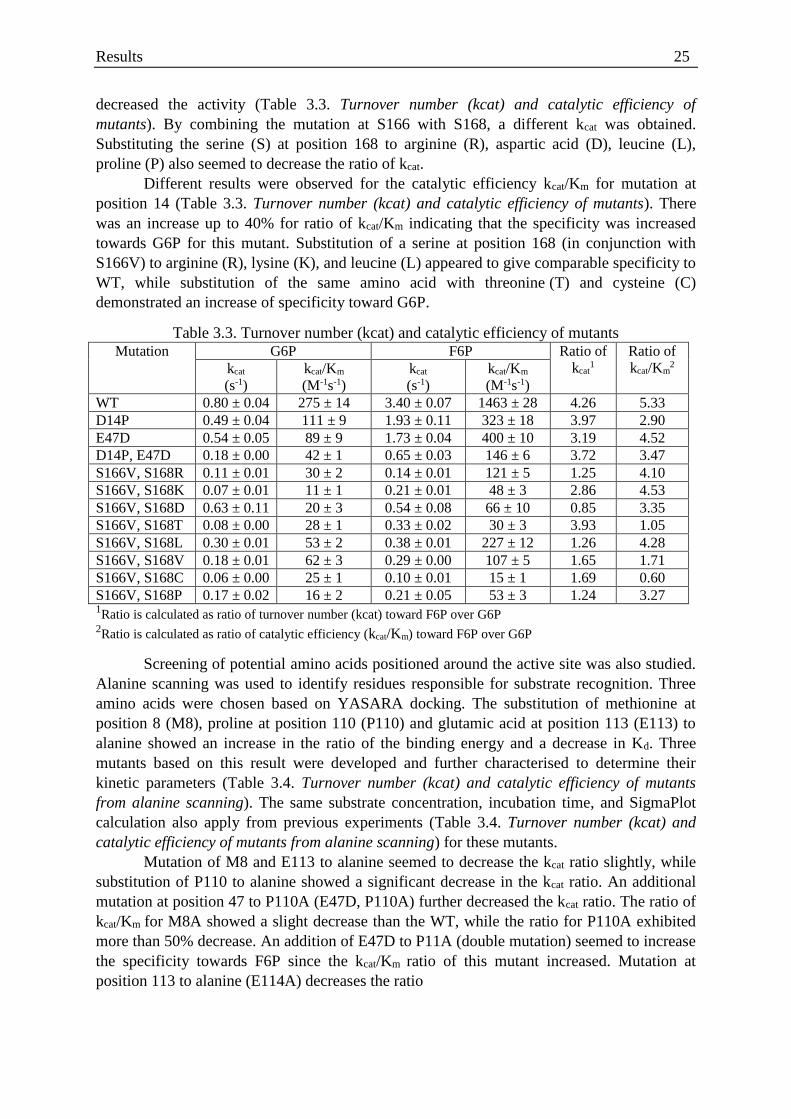
Results 25
decreased the activity (Table 3.3. Turnover number (kcat) and catalytic efficiency of
mutants). By combining the mutation at S166 with S168, a different kcat was obtained.
Substituting the serine (S) at position 168 to arginine (R), aspartic acid (D), leucine (L),
proline (P) also seemed to decrease the ratio of kcat.
Different results were observed for the catalytic efficiency kcat/Km for mutation at
position 14 (Table 3.3. Turnover number (kcat) and catalytic efficiency of mutants). There
was an increase up to 40% for ratio of kcat/Km indicating that the specificity was increased
towards G6P for this mutant. Substitution of a serine at position 168 (in conjunction with
S166V) to arginine (R), lysine (K), and leucine (L) appeared to give comparable specificity to
WT, while substitution of the same amino acid with threonine (T) and cysteine (C)
demonstrated an increase of specificity toward G6P.
Table 3.3. Turnover number (kcat) and catalytic efficiency of mutants Mutation G6P F6P Ratio of
kcat1
Ratio of
kcat/Km2 kcat
(s-1)
kcat/Km
(M-1s-1)
kcat
(s-1)
kcat/Km
(M-1s-1)
WT 0.80 ± 0.04 275 ± 14 3.40 ± 0.07 1463 ± 28 4.26 5.33
D14P 0.49 ± 0.04 111 ± 9 1.93 ± 0.11 323 ± 18 3.97 2.90
E47D 0.54 ± 0.05 89 ± 9 1.73 ± 0.04 400 ± 10 3.19 4.52
D14P, E47D 0.18 ± 0.00 42 ± 1 0.65 ± 0.03 146 ± 6 3.72 3.47
S166V, S168R 0.11 ± 0.01 30 ± 2 0.14 ± 0.01 121 ± 5 1.25 4.10
S166V, S168K 0.07 ± 0.01 11 ± 1 0.21 ± 0.01 48 ± 3 2.86 4.53
S166V, S168D 0.63 ± 0.11 20 ± 3 0.54 ± 0.08 66 ± 10 0.85 3.35
S166V, S168T 0.08 ± 0.00 28 ± 1 0.33 ± 0.02 30 ± 3 3.93 1.05
S166V, S168L 0.30 ± 0.01 53 ± 2 0.38 ± 0.01 227 ± 12 1.26 4.28
S166V, S168V 0.18 ± 0.01 62 ± 3 0.29 ± 0.00 107 ± 5 1.65 1.71
S166V, S168C 0.06 ± 0.00 25 ± 1 0.10 ± 0.01 15 ± 1 1.69 0.60
S166V, S168P 0.17 ± 0.02 16 ± 2 0.21 ± 0.05 53 ± 3 1.24 3.27 1Ratio is calculated as ratio of turnover number (kcat) toward F6P over G6P
2Ratio is calculated as ratio of catalytic efficiency (kcat/Km) toward F6P over G6P
Screening of potential amino acids positioned around the active site was also studied.
Alanine scanning was used to identify residues responsible for substrate recognition. Three
amino acids were chosen based on YASARA docking. The substitution of methionine at
position 8 (M8), proline at position 110 (P110) and glutamic acid at position 113 (E113) to
alanine showed an increase in the ratio of the binding energy and a decrease in Kd. Three
mutants based on this result were developed and further characterised to determine their
kinetic parameters (Table 3.4. Turnover number (kcat) and catalytic efficiency of mutants
from alanine scanning). The same substrate concentration, incubation time, and SigmaPlot
calculation also apply from previous experiments (Table 3.4. Turnover number (kcat) and
catalytic efficiency of mutants from alanine scanning) for these mutants.
Mutation of M8 and E113 to alanine seemed to decrease the kcat ratio slightly, while
substitution of P110 to alanine showed a significant decrease in the kcat ratio. An additional
mutation at position 47 to P110A (E47D, P110A) further decreased the kcat ratio. The ratio of
kcat/Km for M8A showed a slight decrease than the WT, while the ratio for P110A exhibited
more than 50% decrease. An addition of E47D to P11A (double mutation) seemed to increase
the specificity towards F6P since the kcat/Km ratio of this mutant increased. Mutation at
position 113 to alanine (E114A) decreases the ratio

Results 26
Table 3.4. Turnover number (kcat) and catalytic efficiency of mutants from alanine scanning Mutation G6P F6P Ratio of
kcat1
Ratio of
kcat/Km2 kcat
(s-1)
kcat/Km
(M-1s-1)
kcat
(s-1)
kcat/Km
(M-1s-1)
WT 0.80 ± 0.04 275 ± 14 3.40 ± 0.07 1463 ± 28 4.26 5.33
M8A 0.43 ± 0.01 71 ± 2 1.35 ± 0.05 285 ± 10 3.14 4.00
P110A 0.99 ± 0.01 334 ± 2 2.02 ± 0.06 638 ± 19 2.03 1.91
P110A, E47D 1.33 ± 0.17 145 ± 18 1.77 ± 0.13 433 ± 31 1.33 2.99
E113A 0.40 ± 0.00 153 ± 2 1.07 ± 0.01 441 ± 8 2.65 2.89 1Ratio is calculated as ratio of turnover number (kcat) toward F6P over G6P
2Ratio is calculated as ratio of catalytic efficiency (kcat/Km) toward F6P over G6P
3.3 High-Throughput Screening
Before any experiments to develop the screening method were performed, two important
problems needed to be addressed. First being the media used and second is the method used
to quantify phosphate produced. In a standard auto-induction media, a considerable amount
of phosphate is present (Table 2.2). This was a problem because the product measured was
also phosphate. On modifying the media with no or negligible amount of phosphate, E. coli
BL21 (DE3) strain could not grow. Kanamycin concentration was lowered to compromise the
lack of phosphate components. With the new modified auto-induction media (Table 2.2), E.
coli BL21 (DE3) was able to grow and produce the protein.
The second problem that needed to be addressed was the method of detection. It was
preferable to use low substrates’ concentration because the number of libraries would be
used. A sensitive method needed to be devised. P I assay is sensitive but a quick incubation
(2 minutes) was not preferable. Higher concentrations of cations in P II assay was tested and
the sensitivity of the method was greatly improved (Appendix 5.1-D). It could reach the same
sensitivity as in P I assay (100 μM or 3 nmol). However, at high Mo (IV) concentrations,
precipitation occurred in the storage condition (4oC). In the modified method, the pH of
ascorbic acid was not adjusted to 5 as in P II assay, rather it was kept unadjusted. At a low
pH, the sensitivity of this modified method (P III assay) was greatly increased. With this
method, it was possible to detect phosphate concentrations below 3 nmol (100 μM)
(Appendix 5.1-C). These two modifications allowed the HTS to be performed even at low
substrates concentrations.
3.3.1 High-Throughput Screening development
Reliability and quality are the main criteria for the evaluation of a screening method. Several
parameters were tested such as concentration of substrates, incubation time, and whether or
not to include OD in the calculation for their effect. In a high throughput screening, one
important consideration is the distribution of variation. Using the standard deviation is one
possibility to interpret the distribution of variation. One statistical test that is widely used for
high throughput screening is based on the Z-factor (Z’) (Zhang, et al., 1999). The Z-factor
formula is described in Equation 3
Equation 3
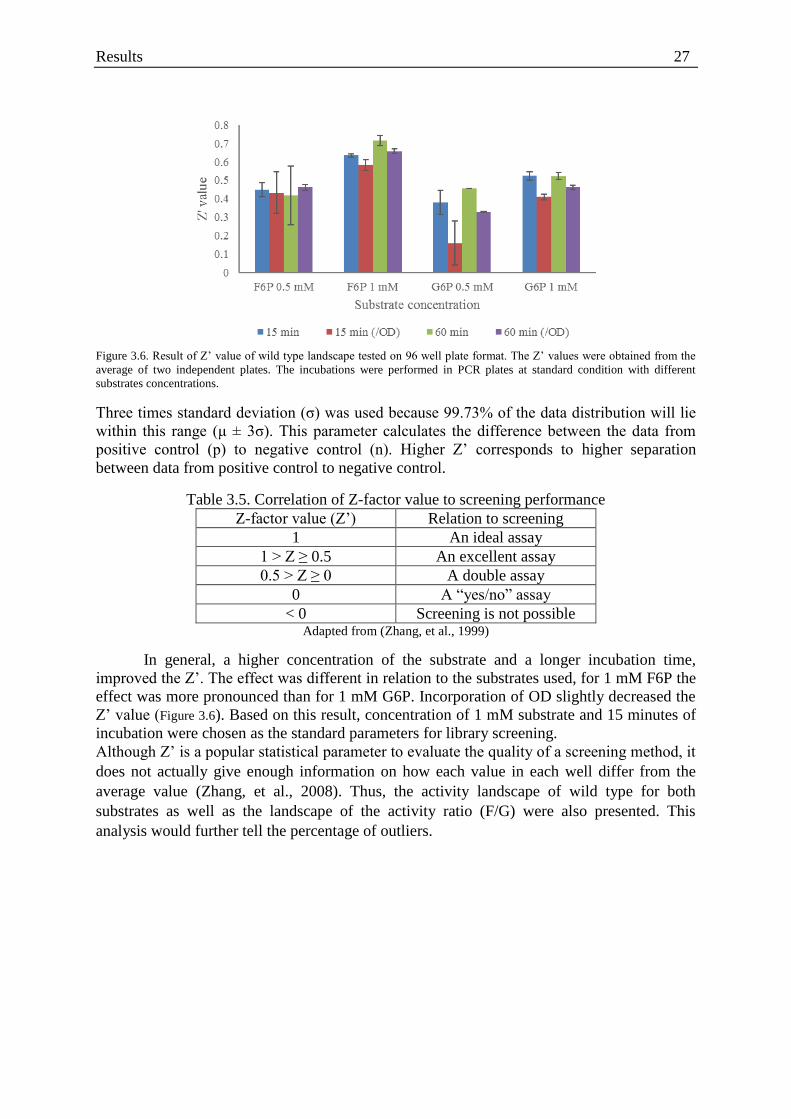
Results 27
Figure 3.6. Result of Z’ value of wild type landscape tested on 96 well plate format. The Z’ values were obtained from the
average of two independent plates. The incubations were performed in PCR plates at standard condition with different
substrates concentrations.
Three times standard deviation (σ) was used because 99.73% of the data distribution will lie
within this range (μ ± 3σ). This parameter calculates the difference between the data from
positive control (p) to negative control (n). Higher Z’ corresponds to higher separation
between data from positive control to negative control.
Table 3.5. Correlation of Z-factor value to screening performance
Z-factor value (Z’) Relation to screening
1 An ideal assay
1 > Z ≥ 0.5 An excellent assay
0.5 > Z ≥ 0 A double assay
0 A “yes/no” assay
< 0 Screening is not possible Adapted from (Zhang, et al., 1999)
In general, a higher concentration of the substrate and a longer incubation time,
improved the Z’. The effect was different in relation to the substrates used, for 1 mM F6P the
effect was more pronounced than for 1 mM G6P. Incorporation of OD slightly decreased the
Z’ value (Figure 3.6). Based on this result, concentration of 1 mM substrate and 15 minutes of
incubation were chosen as the standard parameters for library screening.
Although Z’ is a popular statistical parameter to evaluate the quality of a screening method, it
does not actually give enough information on how each value in each well differ from the
average value (Zhang, et al., 2008). Thus, the activity landscape of wild type for both
substrates as well as the landscape of the activity ratio (F/G) were also presented. This
analysis would further tell the percentage of outliers.

Results 28
Figure 3.7. Activity landscape of wild type toward F6P tested on 96 well plate format. The values were obtained
from the average of two independent plates. The incubations were performed for 15 minutes at 70oC in PCR
tubes at standard condition with F6P 1 mM.
The analysis of the activity landscape for F6P shows that there are 28 variants of the
wild type (17.5%) showed a higher activity than the average plus one standard deviation
(μp + σp) while 26 variants (16.3%) showed a lower activity than μp – σp. There are 5 variants
(3%) that showed a higher activity than μp + 2σp and 3 variants (1.9%) that showed lower
activity than μp – 2σp (Figure 3.7).
A similar result was observed when G6P was used as the substrate. From the analysis
of the result (Figure 3.8). 23 of wild type variants (14%) showed a higher activity than μp +
σp and 56 variants (35%) showed lower activity than μp – σp. These make it a total of up to
50% of the variants outside the range of μp ± σp. It is because the activity between each plate
differed noticeably (18% difference calculated from the plate with smallest activity). The
result of the activity landscape towards G6P also shows that there are 4 variants (2.5%) that
had a higher activity than μp + 2σp and 2 variants (1.3%) lower than μp – 2σp. This finding
confirms that a reliable comparison can only be performed within one plate and not between
plates.
The result of the activity landscape towards F6P (Figure 3.7) and G6P (Figure 3.8)
were used to calculate the ratio of the activity (Figure 3.9). This value is important for
consideration in determining the improved variants so the evaluation of data variation
homogenous to WT was needed. Results presented in Figure 3.9 show that there were 58
variants (36%) that lie outside the range of μp ± σp (20% higher and 16% lower). There are 5
variants (3%) that showed an activity outside the range of μp ± 2σp (2% higher and 1%
lower).

Results 29
Figure 3.8. Activity landscape of wild type toward G6P tested on 96 well plate format. The values were
obtained from the average of two independent plates. The incubations were performed for 15 minutes at
70oC in PCR tubes at standard condition with G6P 1 mM.
Figure 3.9. Ratio of activity landscape of wild type tested on 96 well plate format. The values were obtained
from the ratio of activity from two independent plates (value of each well from Figure 3.7 divided by value from
respective well in Figure 3.8)
3.3.2 High-Throughput Screening for Library
HTS for the library evaluation was aimed to screen variants from several libraries developed
through QuikChangeTM Site-Directed Mutagenesis (Table 3.6). The HTS consisted of three
screening rounds to ensure the detection of improved variants.
3.3.2.1 First screening
This step was to detect possible improved variants. There were certain criteria set to decide
whether one variant (from one well) is a hit or not. Variants were considered for the next
screening if and only if it showed one of these behaviours (the cut-off),
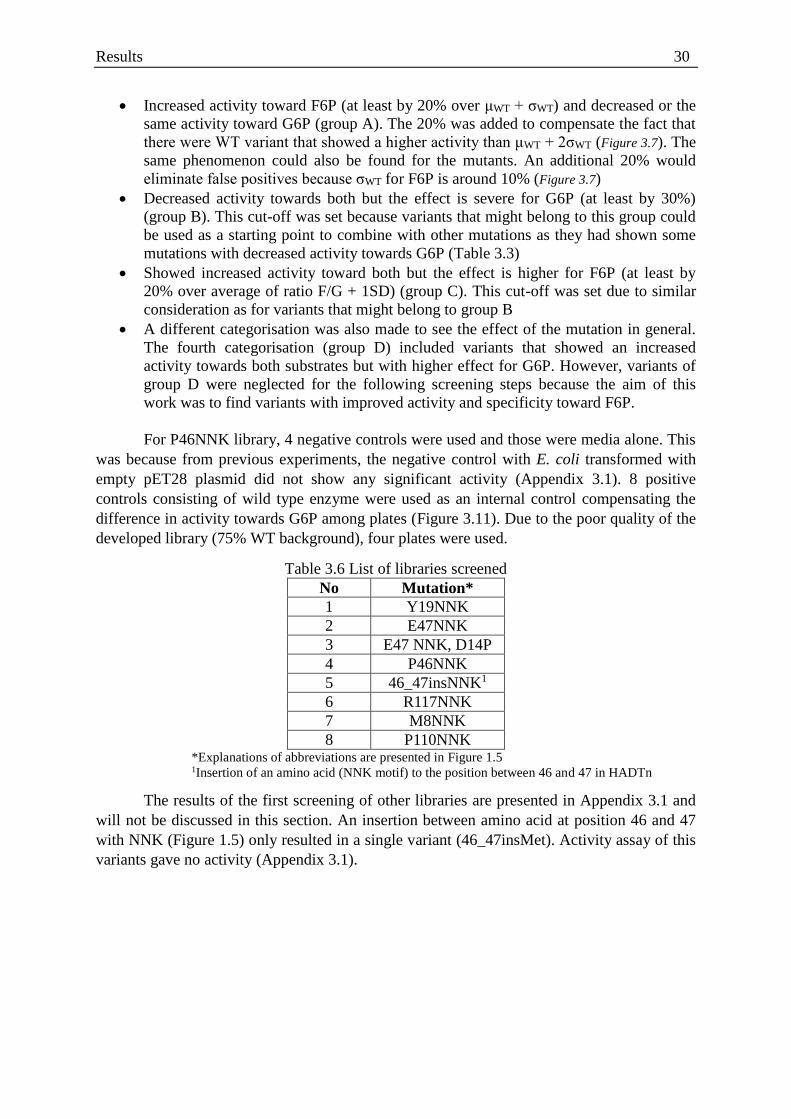
Results 30
Increased activity toward F6P (at least by 20% over μWT + σWT) and decreased or the
same activity toward G6P (group A). The 20% was added to compensate the fact that
there were WT variant that showed a higher activity than μWT + 2σWT (Figure 3.7). The
same phenomenon could also be found for the mutants. An additional 20% would
eliminate false positives because σWT for F6P is around 10% (Figure 3.7)
Decreased activity towards both but the effect is severe for G6P (at least by 30%)
(group B). This cut-off was set because variants that might belong to this group could
be used as a starting point to combine with other mutations as they had shown some
mutations with decreased activity towards G6P (Table 3.3)
Showed increased activity toward both but the effect is higher for F6P (at least by
20% over average of ratio F/G + 1SD) (group C). This cut-off was set due to similar
consideration as for variants that might belong to group B
A different categorisation was also made to see the effect of the mutation in general.
The fourth categorisation (group D) included variants that showed an increased
activity towards both substrates but with higher effect for G6P. However, variants of
group D were neglected for the following screening steps because the aim of this
work was to find variants with improved activity and specificity toward F6P.
For P46NNK library, 4 negative controls were used and those were media alone. This
was because from previous experiments, the negative control with E. coli transformed with
empty pET28 plasmid did not show any significant activity (Appendix 3.1). 8 positive
controls consisting of wild type enzyme were used as an internal control compensating the
difference in activity towards G6P among plates (Figure 3.11). Due to the poor quality of the
developed library (75% WT background), four plates were used.
Table 3.6 List of libraries screened
No Mutation*
1 Y19NNK
2 E47NNK
3 E47 NNK, D14P
4 P46NNK
5 46_47insNNK1
6 R117NNK
7 M8NNK
8 P110NNK *Explanations of abbreviations are presented in Figure 1.5 1Insertion of an amino acid (NNK motif) to the position between 46 and 47 in HADTn
The results of the first screening of other libraries are presented in Appendix 3.1 and
will not be discussed in this section. An insertion between amino acid at position 46 and 47
with NNK (Figure 1.5) only resulted in a single variant (46_47insMet). Activity assay of this
variants gave no activity (Appendix 3.1).

Results 31
Figure 3.10. Activity assay of P46NNK library from 4 plates toward F6P. Zero value represents no difference
with WT. Total variants in one plate are 84. Average of activity of WT in plate 1 was 13.5±10.8%, in plate 2
was 14.4±11%, in plate 3 was 17±7.1%, and in plate 4 was 15.5±8.1% ng/min.
A mutation at this position (P46NNL) gave 80 variants (26.8%) that appeared to have
an increased activity (activity > μWT + σWT for each plate), while 111 variants (33%) seemed
to show decreased activity (activity < μWT – σWT for each plate) towards F6P (Figure 3.10). A
similar result was observed towards G6P; there were 109 variants (32.4%) that appeared to
have an increased activity and 110 variants (32.7%) that appeared to have a decreased
activity (Figure 3.11). The F/G ratio is an important parameter to confirm further if an
increase in activity toward F6P also observed for G6P. 110 variants (27.1%) appeared to have
a higher F/G ratio and 131 variants (39%) appeared to have lower F/G ratio (Figure 3.12)
Based on the cut-off set previously, there were 33 variants picked for the second
screening. Fifteen variants (4.5%) appeared to belong to the group A, 9 variants (2.7%)
seemed to belong to group B, and 9 variants (2.7%) appeared to belong to group C. There
were 4 variants (1.2%) that belonged to group D, but these variants were not of interest for
further screening
.
A
C D
B
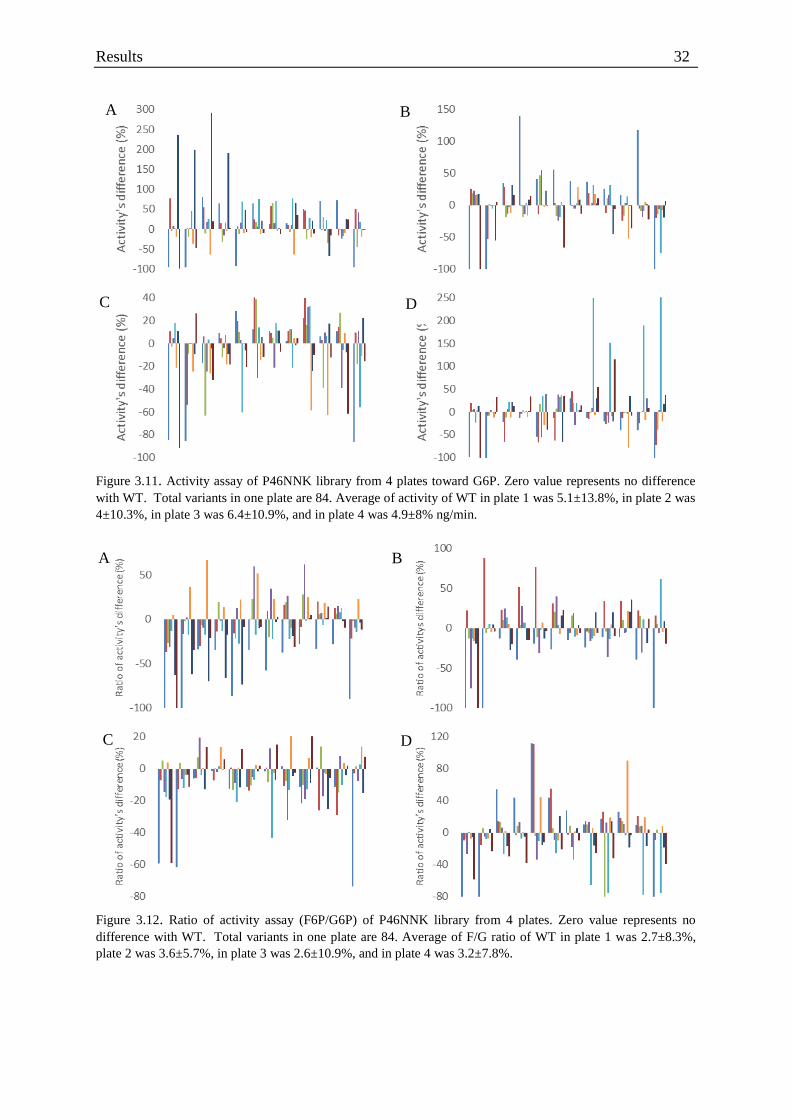
Results 32
Figure 3.11. Activity assay of P46NNK library from 4 plates toward G6P. Zero value represents no difference
with WT. Total variants in one plate are 84. Average of activity of WT in plate 1 was 5.1±13.8%, in plate 2 was
4±10.3%, in plate 3 was 6.4±10.9%, and in plate 4 was 4.9±8% ng/min.
Figure 3.12. Ratio of activity assay (F6P/G6P) of P46NNK library from 4 plates. Zero value represents no
difference with WT. Total variants in one plate are 84. Average of F/G ratio of WT in plate 1 was 2.7±8.3%,
plate 2 was 3.6±5.7%, in plate 3 was 2.6±10.9%, and in plate 4 was 3.2±7.8%.
A
D C
B
A B
C D
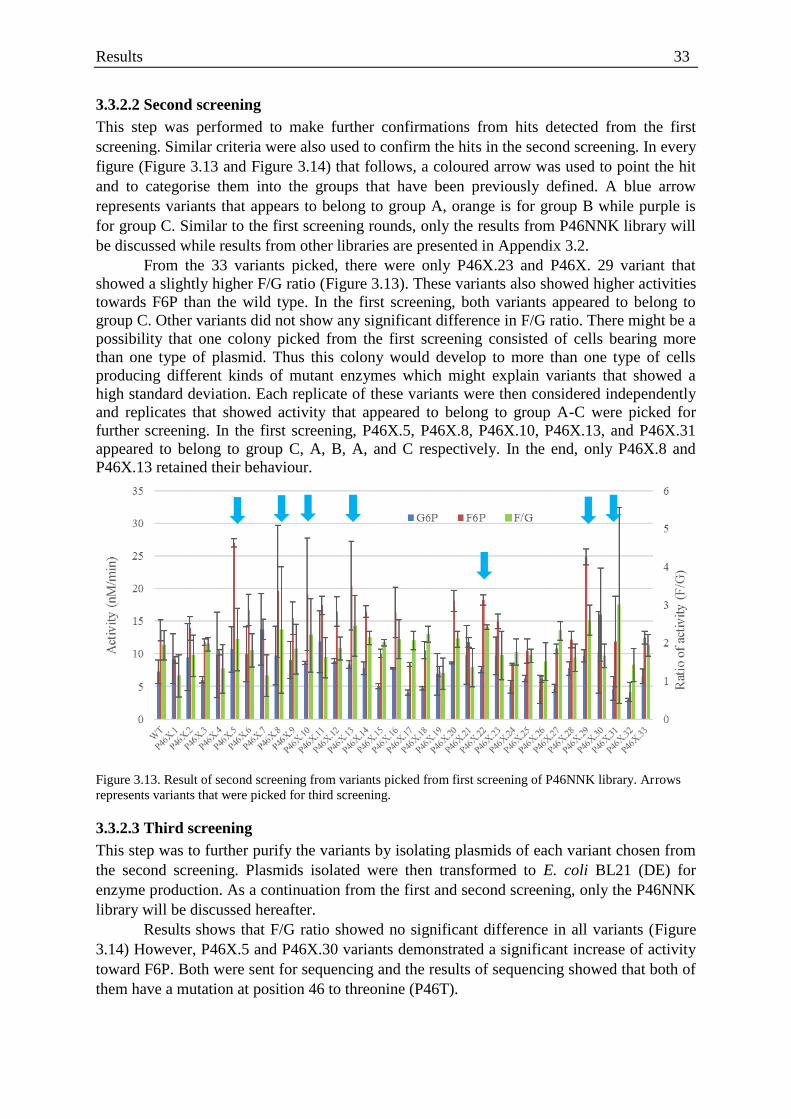
Results 33
3.3.2.2 Second screening
This step was performed to make further confirmations from hits detected from the first
screening. Similar criteria were also used to confirm the hits in the second screening. In every
figure (Figure 3.13 and Figure 3.14) that follows, a coloured arrow was used to point the hit
and to categorise them into the groups that have been previously defined. A blue arrow
represents variants that appears to belong to group A, orange is for group B while purple is
for group C. Similar to the first screening rounds, only the results from P46NNK library will
be discussed while results from other libraries are presented in Appendix 3.2.
From the 33 variants picked, there were only P46X.23 and P46X. 29 variant that
showed a slightly higher F/G ratio (Figure 3.13). These variants also showed higher activities
towards F6P than the wild type. In the first screening, both variants appeared to belong to
group C. Other variants did not show any significant difference in F/G ratio. There might be a
possibility that one colony picked from the first screening consisted of cells bearing more
than one type of plasmid. Thus this colony would develop to more than one type of cells
producing different kinds of mutant enzymes which might explain variants that showed a
high standard deviation. Each replicate of these variants were then considered independently
and replicates that showed activity that appeared to belong to group A-C were picked for
further screening. In the first screening, P46X.5, P46X.8, P46X.10, P46X.13, and P46X.31
appeared to belong to group C, A, B, A, and C respectively. In the end, only P46X.8 and
P46X.13 retained their behaviour.
Figure 3.13. Result of second screening from variants picked from first screening of P46NNK library. Arrows
represents variants that were picked for third screening.
3.3.2.3 Third screening
This step was to further purify the variants by isolating plasmids of each variant chosen from
the second screening. Plasmids isolated were then transformed to E. coli BL21 (DE) for
enzyme production. As a continuation from the first and second screening, only the P46NNK
library will be discussed hereafter.
Results shows that F/G ratio showed no significant difference in all variants (Figure
3.14) However, P46X.5 and P46X.30 variants demonstrated a significant increase of activity
toward F6P. Both were sent for sequencing and the results of sequencing showed that both of
them have a mutation at position 46 to threonine (P46T).
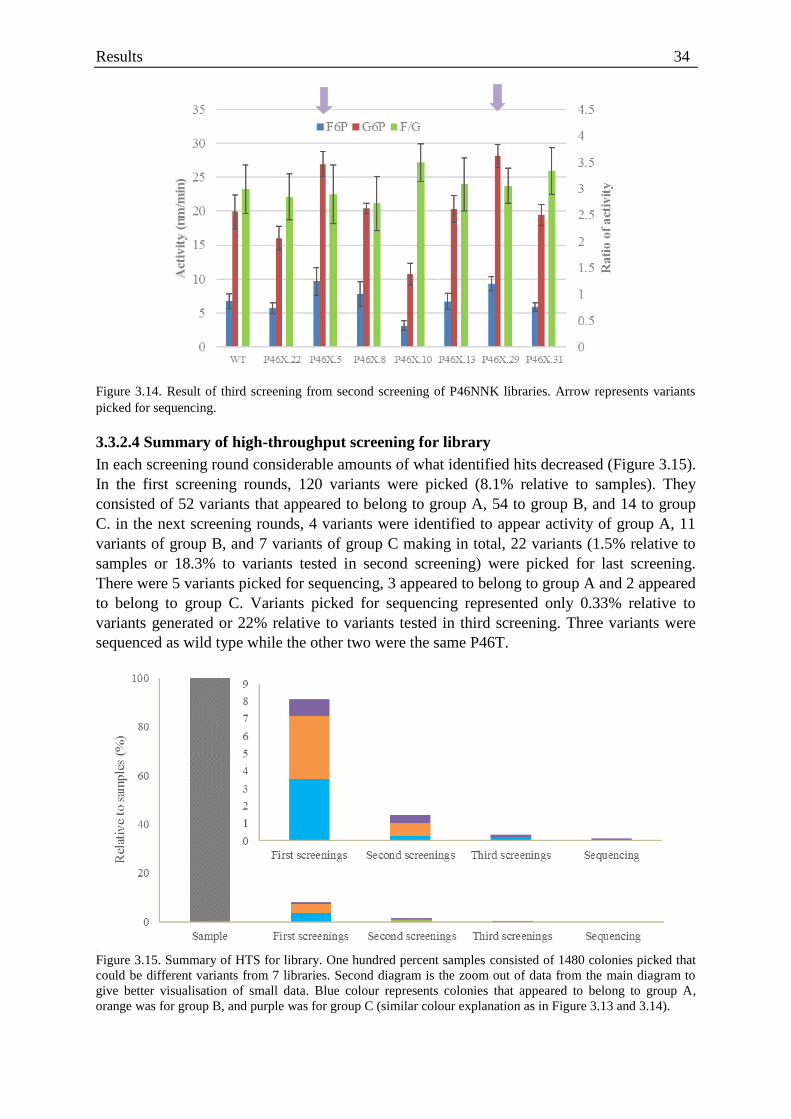
Results 34
Figure 3.14. Result of third screening from second screening of P46NNK libraries. Arrow represents variants
picked for sequencing.
3.3.2.4 Summary of high-throughput screening for library
In each screening round considerable amounts of what identified hits decreased (Figure 3.15).
In the first screening rounds, 120 variants were picked (8.1% relative to samples). They
consisted of 52 variants that appeared to belong to group A, 54 to group B, and 14 to group
C. in the next screening rounds, 4 variants were identified to appear activity of group A, 11
variants of group B, and 7 variants of group C making in total, 22 variants (1.5% relative to
samples or 18.3% to variants tested in second screening) were picked for last screening.
There were 5 variants picked for sequencing, 3 appeared to belong to group A and 2 appeared
to belong to group C. Variants picked for sequencing represented only 0.33% relative to
variants generated or 22% relative to variants tested in third screening. Three variants were
sequenced as wild type while the other two were the same P46T.
a
Figure 3.15. Summary of HTS for library. One hundred percent samples consisted of 1480 colonies picked that
could be different variants from 7 libraries. Second diagram is the zoom out of data from the main diagram to
give better visualisation of small data. Blue colour represents colonies that appeared to belong to group A,
orange was for group B, and purple was for group C (similar colour explanation as in Figure 3.13 and 3.14).

Results 35
3.4 Final Characterisation
The wild type enzyme as well as HADTnP46T were purified for final characterisations.
Kinetic characterisation was performed as previously described. The mutant enzyme showed
an increased kcat compared to wild type toward both substrates. Km of HADTnP46T appeared
to decrease for F6P and increase for G6P in relation to WT. Catalytic efficiency (kcat//Km) of
the wild type enzyme was higher towards F6P than G6P. The mutant also exhibited a higher
kcat//Km towards F6P than G6P. Ratio of catalytic activity (F6P/G6P) of WT is 5.5 while for
HADTnP46T is 8.8 (Figure 3.16). A possible interaction of the amino acid at position 46 is
depicted in Figure 3.17.
Figure 3.16. Kinetic parameters for final characterisation. Mutant enzyme was P46T. Unit for Vmax, Km and
Vmax/Km is μmol/min*mg, mM, x 1000 M-1s-1) respectively. The incubations were performed in PCR tubes
with standard condition using different G6P and F6P concentration
A probable fifth loop that may play a role in the substrate recognition proposed by
(Lahiri, et al., 2004) is depicted in Figure 3.18. The fifth loop is a helix-loop-helix and started
with conserved glycine (in HADTn is G44). Mutations of amino acids in this loop performed
in this work (P46T, E47D) are also depicted to give a view of the relative mutations to the
substrate (F6P).
The temperature stability was also investigated. In this final characterisation,
concentration of Mg (II) in the incubation buffer was increased to 100 mM because it was
observed in previous experiments that adding Mg (II) up to 5 mM did not give any effect on
temperature stability. Incubation time in Tris buffer (desalting solution) was also prolonged
from 240 minutes to 1440 minutes. Two substrates (G6P and F6P) were used. Results showed
that prolonged incubation at high temperatures decreased the enzyme activity towards G6P
(Figure 3.19) and F6P (Figure 3.20). There was no apparent difference for wild type and
mutant enzyme in term of activities. Both showed lower enzyme activity after 1440 minutes
of incubation at high temperatures. Addition of 100 mM magnesium ions seemed to stabilise
the enzyme, for both the wild type and mutant (P46T).

Results 36
Figure 3.17. Visualisation of possible interaction of amino acid at position 46 from wild type (A, B, C) and
mutant enzyme (D, E, F) toward G6P (B, E) and F6P (C, F). Mutation of proline at position 46 to threonine (T)
was done in PyMol using the result of docking by YASARA (Figure 3.1). Carbon atoms of mutant (Threonine)
are given in white.
Figure 3.18. Visualisation of the possible fifth loop (red circles) of HADTnP46T according to the proposal by
(Lahiri, et al., 2004) docked with F6P.
D165
K140 S108
D7
G44
D47 T46
D165
D7
K140
S108
T46
D165
D7
K140
S108
P46
D165
D7
K140
S108
T46
D165
D7
K140
S108
P46
A
D E F
B C

Results 37
Further analyses were performed to see the effect of Mg (II) and mutation in relation
to the enzyme stability at higher temperatures. Two useful parameters were used, thermal
inactivation constant (k) and half-life (t1/2). Thermal inactivation constant (k) describes the
rate of loss of enzyme activity in relation to the temperature. A higher value of k corresponds
to a more pronounced effect of temperature to an enzyme. Half-life (t1/2) is defined as the
time at which the enzyme retains 50% of its activity. A shorter half-life corresponds to a
higher k value. A simple first order kinetic reaction was used to calculate the values as per the
work by Sadana (1988). For this purpose, the enzyme stability data at 94oC with F6P as
substrate (Figure 3.20) were used to calculate k and t1/2.
The result clearly shows that the addition of Mg (II) helps to stabilise the enzyme at a
high temperature (Table 3.7). The half-time of WT and mutant enzymes were doubled in the
presence of magnesium (100 mM). Mutation at position 47 appeared to decrease the enzyme
stability slightly with a shorter half-life for the mutant rather than the wild type in the absence
of magnesium. The assumption that the reaction was of first order was also investigated to be
correct, as seen from high R2 values (>0.96).
HADTnWT HADTnP46T
Figure 3.19. Effect of Mg (II) addition on wild type (A, C) and mutant enzyme (P46T) (B, D) stability at
different temperatures over time measured as activity toward G6P. The incubations were performed in PCR
tubes containing enzyme 1.7 mg/ml for both in buffer Tris-HCl 50 mM pH 7.5 with Mg (II) 100 mM (C, D) and
without (A, B). After rapid cooling, the remaining activity was measured in standard condition with G6P 5 mM,
and enzyme concentration 0.01 mg/ml at 70oC for 15 minutes. One hundred percent activity is 1.2 (A, C), 2.2
(B, D) μmol/min*mg.
A B
C D

Results 38
HADTnWT HADTnP46T
Figure 3.20. Effect of Mg (II) addition on wild type (A, C) and mutant enzyme (P46T) (B, D) stability at
different temperatures over time measured as activity toward F6P. All condition was performed the same as in
Figure 3.19. One hundred percent activity is 1.1 (A), 4.8 (C), 7.5 (B, D) μmol/min*mg.
Table 3.7. Thermal stability parameters for wild type and D46T HADTn.
Parameters*
Enzyme
Wild type Mutant P47T
Without Mg (II) With Mg (II) Without Mg (II) With Mg (II)
k (x 10-3 min-1) 1.52 ± 0.09 0.94 ± 0.04 1.77 ± 0.04 0.86 ± 0.02
t1/2 (min) 454 ± 26 736 ± 30 392 ± 9 809 ± 17
R2 0.9929 0.9694 0.9957 0.9742
*All values were calculated at temperature 94oC from Figure 3.20.
The effect of product inhibition was tested in two different setting. Fructose was used
for reaction with F6P as substrate and glucose was used for reaction with G6P as substrate.
Different concentration of fructose and glucose as well as F6P and G6P were used to
determine the type of product inhibition. A lineweaver-Burk plot was derived to determine
the type of inhibition. However, the plots could not show clear-cut distinction making the
determination of inhibition type became difficult. Further analysis was carried out to make
unbiased judgement. There parameters (Vmax, Km, and slope) were calculated from the plots
(Figure 3.21 and Figure 3.22). Further analysis of those values shows Km from all combination
of inhibitors and enzymes had the lowest standard deviation compared to standard deviation
of Vmax and slope (Table 3.8. Effect of product inhibition.). Based on these results, the
observed inhibition was classified as a noncompetitive inhibition (Figure 1.1).
A B
C D
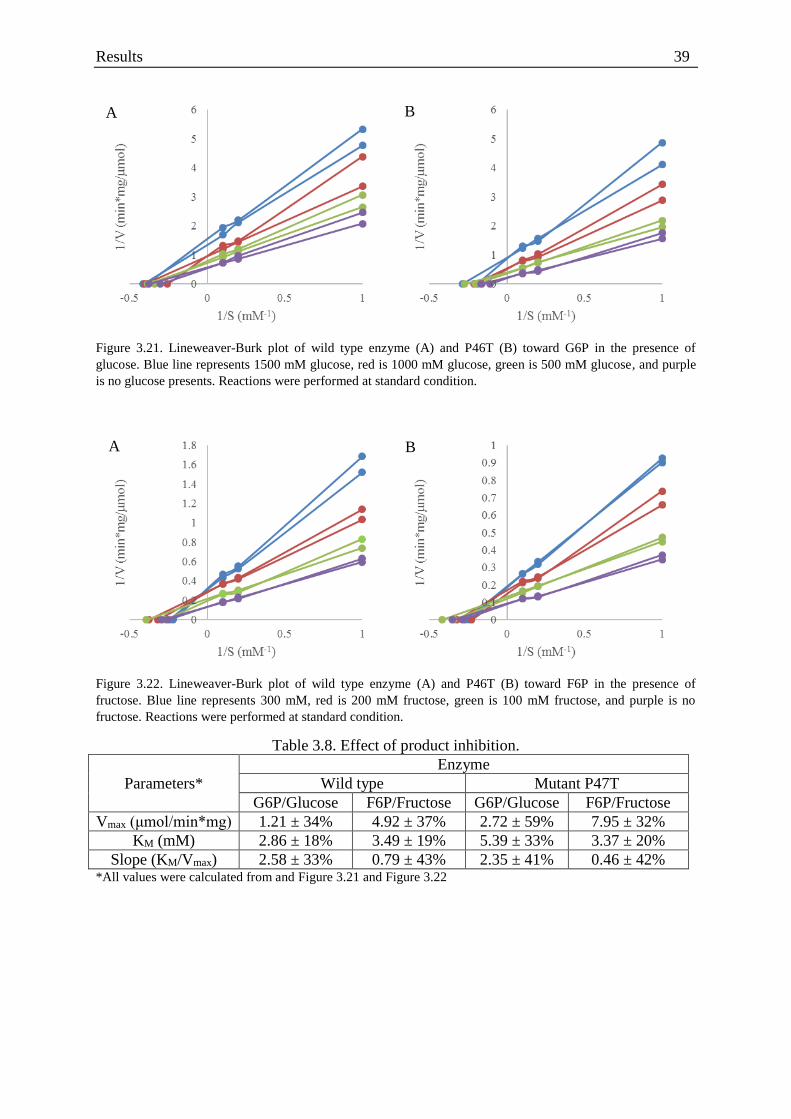
Results 39
Figure 3.21. Lineweaver-Burk plot of wild type enzyme (A) and P46T (B) toward G6P in the presence of
glucose. Blue line represents 1500 mM glucose, red is 1000 mM glucose, green is 500 mM glucose, and purple
is no glucose presents. Reactions were performed at standard condition.
Figure 3.22. Lineweaver-Burk plot of wild type enzyme (A) and P46T (B) toward F6P in the presence of
fructose. Blue line represents 300 mM, red is 200 mM fructose, green is 100 mM fructose, and purple is no
fructose. Reactions were performed at standard condition.
Table 3.8. Effect of product inhibition.
Parameters*
Enzyme
Wild type Mutant P47T
G6P/Glucose F6P/Fructose G6P/Glucose F6P/Fructose
Vmax (μmol/min*mg) 1.21 ± 34% 4.92 ± 37% 2.72 ± 59% 7.95 ± 32%
KM (mM) 2.86 ± 18% 3.49 ± 19% 5.39 ± 33% 3.37 ± 20%
Slope (KM/Vmax) 2.58 ± 33% 0.79 ± 43% 2.35 ± 41% 0.46 ± 42% *All values were calculated from and Figure 3.21 and Figure 3.22
A B
A B
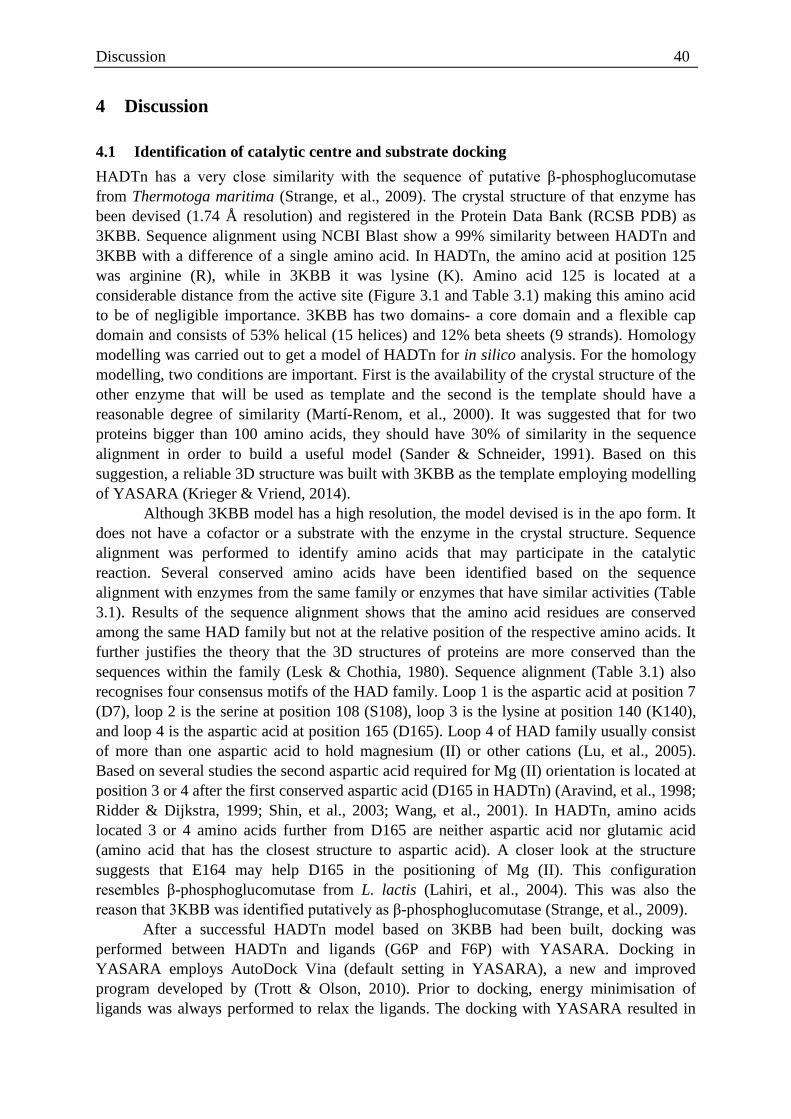
Discussion 40
4 Discussion
4.1 Identification of catalytic centre and substrate docking
HADTn has a very close similarity with the sequence of putative β-phosphoglucomutase
from Thermotoga maritima (Strange, et al., 2009). The crystal structure of that enzyme has
been devised (1.74 Å resolution) and registered in the Protein Data Bank (RCSB PDB) as
3KBB. Sequence alignment using NCBI Blast show a 99% similarity between HADTn and
3KBB with a difference of a single amino acid. In HADTn, the amino acid at position 125
was arginine (R), while in 3KBB it was lysine (K). Amino acid 125 is located at a
considerable distance from the active site (Figure 3.1 and Table 3.1) making this amino acid
to be of negligible importance. 3KBB has two domains- a core domain and a flexible cap
domain and consists of 53% helical (15 helices) and 12% beta sheets (9 strands). Homology
modelling was carried out to get a model of HADTn for in silico analysis. For the homology
modelling, two conditions are important. First is the availability of the crystal structure of the
other enzyme that will be used as template and the second is the template should have a
reasonable degree of similarity (Martí-Renom, et al., 2000). It was suggested that for two
proteins bigger than 100 amino acids, they should have 30% of similarity in the sequence
alignment in order to build a useful model (Sander & Schneider, 1991). Based on this
suggestion, a reliable 3D structure was built with 3KBB as the template employing modelling
of YASARA (Krieger & Vriend, 2014).
Although 3KBB model has a high resolution, the model devised is in the apo form. It
does not have a cofactor or a substrate with the enzyme in the crystal structure. Sequence
alignment was performed to identify amino acids that may participate in the catalytic
reaction. Several conserved amino acids have been identified based on the sequence
alignment with enzymes from the same family or enzymes that have similar activities (Table
3.1). Results of the sequence alignment shows that the amino acid residues are conserved
among the same HAD family but not at the relative position of the respective amino acids. It
further justifies the theory that the 3D structures of proteins are more conserved than the
sequences within the family (Lesk & Chothia, 1980). Sequence alignment (Table 3.1) also
recognises four consensus motifs of the HAD family. Loop 1 is the aspartic acid at position 7
(D7), loop 2 is the serine at position 108 (S108), loop 3 is the lysine at position 140 (K140),
and loop 4 is the aspartic acid at position 165 (D165). Loop 4 of HAD family usually consist
of more than one aspartic acid to hold magnesium (II) or other cations (Lu, et al., 2005).
Based on several studies the second aspartic acid required for Mg (II) orientation is located at
position 3 or 4 after the first conserved aspartic acid (D165 in HADTn) (Aravind, et al., 1998;
Ridder & Dijkstra, 1999; Shin, et al., 2003; Wang, et al., 2001). In HADTn, amino acids
located 3 or 4 amino acids further from D165 are neither aspartic acid nor glutamic acid
(amino acid that has the closest structure to aspartic acid). A closer look at the structure
suggests that E164 may help D165 in the positioning of Mg (II). This configuration
resembles β-phosphoglucomutase from L. lactis (Lahiri, et al., 2004). This was also the
reason that 3KBB was identified putatively as β-phosphoglucomutase (Strange, et al., 2009).
After a successful HADTn model based on 3KBB had been built, docking was
performed between HADTn and ligands (G6P and F6P) with YASARA. Docking in
YASARA employs AutoDock Vina (default setting in YASARA), a new and improved
program developed by (Trott & Olson, 2010). Prior to docking, energy minimisation of
ligands was always performed to relax the ligands. The docking with YASARA resulted in

Discussion 41
several possible conformations (Figure 3.1 and Appendix 1D). A plausible conformation was
decided by considering the conformation at which a phosphate was situated in the active site
(Figure 3.1) because crystal structure of 3KBB is in apoenzyme form without substrates and
cofactor. It was the case for both ligands that the conformations were calculated to have the
highest binding energy and the lowest Kd (Appendix 1D-A and -B) had a lesser likelihood to
be the correct conformation than the conformation with lower binding energy and higher Kd
(Figure 3.1). Phosphates in those conformations (Appendix 1D.A and B) are facing to the cap
domain while the active site is situated in the core domain (Lu, et al., 2005). This approach
was also used to analyse the result of the docking towards mutants (Table 3.2).
4.2 Initial characterisation
The standard buffer suggested by Kuznetsova, et al. (2005) was used for initial
characterisation. For phosphate quantification, two spectrophotometric methods were used. P
I assay was able to detect phosphate released in amounts up to 100 μM (2 nmol) making this
method very sensitive. In general, a sensitive method is desirable, but for the kinetic
characterisation Phosphate I was not suitable. It was used to measure phosphate only when
the G6P was used below a concentration of 1 mM. Higher concentrations of G6P, produced
phosphate that were higher than the range of Phosphate I. Dilution could have been done but
during quantitative measurement, fewer steps are preferable to minimise errors. Thus, P II
assay was used. This method has a detection range between 0.1 to 5 mM (3 – 150 nmol). This
method bases its detection on the reduction of the molybdate-phosphatase complex with
ascorbic acid. P II assay was also more suitable than PI assay because of a very short
incubation time in P I assay (2 minutes) compared to 10 minutes of incubation in P II assay.
Very short incubation time was a problem for this experiment because all the measurements
were based on microtiter (96 well plate). Thus, the short difference in incubation between
wells in row A and row H was unavoidable and also cannot be neglected. There was also
always a small difference in the reading of the results from the wells in row A than row H. As
a result, Phosphate I was no longer used after the initial kinetic characterisation of HADTn
with G6P (Figure 3.2). Initial kinetic characterisation showed an inhibition effect of G6P to
HADTn in higher concentration than 10 mM. Substrate inhibition could be regarded as a
deviation from the Michaelis Menten model. Thus, the calculation of kinetic parameters only
considers reaction rates when inhibition effects had not been observed (G6P = 10 mM).
Substrate inhibition may play an important role in the metabolic regulation in several
organisms. One example is inhibition of phosphofructokinase, a glycolysis enzyme by ATP.
This could be explained because the aim of glycolysis is to produce ATP and higher ATP
concentration tells that glycolysis may not be needed (Reed, et al., 2010). For HADTn, its
role has yet to be explored, but this result may suggest that it may play an important role in
bacterial metabolism.
HADTn showed the highest activity at pH = 7 (Figure 3.3) for Tris, MOPS, and
HEPES. A decreased activity at higher pH may be associated with partial deprotonation of
the lysine (pKa=10.67). Lysine has a pivotal role in intermediate stabilisation (Burroughs, et
al., 2006). Lower activity of HADTn in Bis-Tris than in Tris at the same pH suggest that the
additional two hydroxylethyl groups in Bis-Tris had a negative effect on the enzyme activity.
No enzyme activity in citrate buffer confirmed that Mg (II) is essential for enzyme activity.
Citrate can form complex with magnesium at relatively low concentration (Walser, 1961)
hence, Mg (II) would not be available for the enzyme. HADTn can also interact with other

Discussion 42
divalent cations, such as Mn (II). A decreased activity when small amount of Mn (II) was
used in the presence of Mg (II) (1:10) may suggest that HADTn has a higher affinity toward
Mn (II) than Mg (II) (Figure 3.4). It was suggested that Mn (II) has very similar properties to
Mg (II) (Zea, et al., 2008). However, manganese as cofactor is more likely to be found with
enzyme that has amino acids with a nitrogen side chain (e.g. histidine and lysine) (Bock, et
al., 1999). HADTn contains only a few of histidine (H) and several lysine (K) residues, but
none of them are situated near the active site (except for K140). In some enzymes, replacing
Mg (II) by Mn (II) will increase the enzyme’s activity as a part of the enzyme regulation
(Brown & Cook, 1981). One report suggests that Mn (II) would have an activating effect if it
were used at a higher concentration than Mg (II). In low concentration, Mn (II) could have a
reversal effect (Sakharov & Makarova, 1988). In a standard buffer suggested by (Kuznetsova,
et al., 2005), zinc (II) was added for the enzymatic activity of HAD. However, it has also
been known that zinc (II) is one of the most potent inhibitors of bacterial phosphatase
(Muginova & Zhavoronkova, 2005). Thus, the effect of this cation was not tested further. An
optimum concentration of Mg (II) was also tested and concentrations higher than 2.5 mM did
not show any increased activity suggesting that 2.5 mM Mg (II) had saturated the active site
of 0.05 mg/ml HADTn. For further experiments, 5 mM Mg (II) was used.
The results suggested that the dissociation constant calculated by YASARA (Table
3.2) did not correspond to the Km obtained from experiments (Table 3.3 and Appendix 2). In
general, docking is a relatively cheap method for ligand prediction. However, the accuracy of
docking depends on many factors. In one case, the docking prediction could result in a 50 to
70% deviation (Totrov & Abagyan, 2008). The docking calculations can have as low as 0%
accuracy to as high as 93% accuracy compared to experimental results (Chen, 2015). A
decreased kcat in variants with S166V mutation (Table 3.3) revealed that this amino acid is
important for catalytic activity. One possible role is in the positioning of Mg (II) due to its
close proximity to D165, conserved aspartic acid for holding Mg (II). In general, the decrease
in the ratio of kcat was followed by a decrease in the ratio of kcat/Km. However, a double
mutation (D14P, E47D) had a lower ratio of kcat/Km than D14P alone, while the ratio of kcat
for both were comparable. The ratio of the double mutation showed an increase in the ratio of
kcat but a decrease in the ratio of kcat/Km in comparison to the single mutation at position 47
(E47D). This suggests that either one of those amino acids may have a role in substrate
recognition. Another double mutation was generated (P110A, E47D) to see if amino acid at
47 play the role of substrate recognition. Both ratios of kcat and kcat/Km for P110A, E47D
decreased in comparison to E47D, thus following the general rule discussed before. A
different result was observed if both ratios (kcat and kcat/Km) from P110A, E47D were
compared to the ones from the single mutation at 110 alone (P110A). The ratio of kcat of
P110A, E47D decreased but the ratio of kcat/Km increased in comparison to P110A. This
deviation from the general rule suggests that the amino acid at position 47 has a role in
substrate recognition and in the direction of favouring F6P. If the addition of a mutation
results in a decreased in the ratio of kcat, it will also decrease the ratio of kcat/Km by default. A
deviation from this behaviour could only be caused if the ratio of Km (F6P over G6P) for the
mutation is very much lower than the ratio of Km of the variant without that particular
mutation such that it could compensate the decrease of ratio of kcat. The ratio of Km (F6P over
G6P) could be considered as a parameter to an extent as it describes the affinity of the
enzymes. A higher value of this ratio implies a lower affinity towards F6P and vice versa.
Discussion 43
4.3 High-throughput screening analysis
At high substrate concentration, the enzymatic reaction is faster than at lower substrates
concentration. It explained a higher Z’ with increasing substrate concentration. Z’ value is
calculated as the difference of the lowest value of the positive control’s activity (μp – 3σp)
and the highest value of the negative control’s activity (μn + 3σn). Due to fast reaction at
higher substrate concentrations, the difference between the positive and negative controls will
be greater at any given time compared to low substrate’ concentration. This was also shown
by the Z’ of HADTn’s activity toward F6P and G6P. In the same concentration, Z’ is greater
toward F6P than G6P. Enzymatic reaction is faster towards F6P (almost 2.5 times faster) and
activity towards F6P was also much more constant between two independent plates than the
activity towards G6P. Reliable comparison could only be performed within one plate.
Incorporation of OD600 in the Z’ calculation did not lead to huge improvements.
In order to compensate the difference in activity of the WT toward G6P that would
also happen for mutant enzymes, a cut-off was set and has been explained previously (3.4.2).
1n total, 1480 variants were generated and two variants that had the same mutation (D46T)
were confirmed by sequencing. The ratio of mutants obtained to the samples size is only
0.13%. The efficiency of screening depends on many factors. In these experiments, the
factors were the choice of amino acids, QC performance, and HTS method. Choice of amino
acid is the first and very critical step. Numbers of amino acids could be chosen, but if by
nature those amino acids did not play any role in the substrate specificity then it would be a
futile attempt. A rational design was employed by considering the docking calculations of
YASARA but as presented earlier, YASARA prediction quite deviated from results generated
by the in vitro experiments. Interaction of two mutations (double mutation) also gave
unexpected results making the rational design even more challenging. The other factor is the
limitation of QC for generating libraries. It is reported that QC for site saturation mutagenesis
is 10 to 54% (Zheng, et al., 2004). Ideally from 7 independent saturation mutagenesis with
NNK degenerated primer, 672 variants (96 variants for each position) are enough to cover
90% probability that all variants are present (Nov, 2012). However, with a library generated
by QC having a mutation rate lower than 100%, more plates needed to be screened to achieve
the same level of 90% coverage. Thus, initial variants screened were doubled. Using the
primers designed in this work (Appendix 2), a mutant library could be generated with a
higher mutation rate (25 to 75%) than the one reported by (Zheng, et al., 2004). One hundred
percent efficiency was reported by (Liu & Naismith, 2008), but they used a single point
mutation and not site saturation mutagenesis. One method has been devised to increase the
mutation efficiency in site saturation mutagenesis up to 100%but the primers need to be
phosphorylated (Hogrefe, et al., 2002). Several other approaches have been tested in the
experiment, e.g. addition of DMSO to the QC, increasing primers’ concentration, and running
the reaction in a single pot. However, none of them gave any improvement in a predicted way
rather, improvement happened in several cases randomly.
There were 3 variants sequenced as wild type after third screening from R117NNK
library. This might show that the cut-off set for HTS for the library was not enough to
eliminate wild type variants. Stricter cut-offs could have been set, i.e. μp + 3σp, but with
stricter cut-off no variant would be picked for further screening. The other problem observed
during the screening was some variants showed a different behaviour in different screenings.
For example, P46X.5 and P46X.29 appeared to belong to group A in the second screening
(Figure 3.13) but they showed activity that may belong to group C in the third screening
Discussion 44
(Figure 3.14). These phenomena could also happen for other variants with other mutation
contributing to a lower number of success rates. The reason for these phenomena is unknown
since that happened in some libraries randomly. One of the improvement that could be done
to eliminate this problem is by increasing concentration of substrates used, in particular G6P.
It was shown earlier that higher substrate concentration contributed to higher Z’ (Figure 3.6).
The presence of wild type variants after sequencing also rule out the assumption used that
during second and third screenings, a variant that showed high standard deviation might
consist of cells bearing different mutant plasmids. P46T mutant showed higher activity than
wild type in every screening round (P46X.5 and P6X.29 in Figure 3.13 and 3.14). They also
showed acceptable standard deviations (<10%).
4.4 Final characterisation
In addition to four conserved loops, an additional loop located in the cap domain was be
hypothesised to play a role in substrate recognition (Lahiri, et al., 2004). They propose a
conserved glycine at position 46 in β-phosphoglucomutase (G44 in HADTn) to identify the
fifth loop. They show mutation of G46 and adjacent amino acid (R49) severely decreased
catalytic efficiency. The possibility of fifth loop playing a role in substrate recognition is also
supported by findings in this work. The mutant enzyme (HADTnP46T) showed an
improvement in the catalytic efficiency than the wild type enzyme (Figure 3.16). The ratio of
catalytic efficiency of F6P/G6P is a good index to compare specificity between two enzymes
because direct comparison of the catalytic efficiency for the wild type and mutant enzyme for
each substrate would be misleading (Eisenthal, et al., 2007). It was shown that the ratio of
catalytic efficiency is higher for the mutant than for the wild type enzyme (8.8 to 5.5). Amino
acid at position 46 is located in the fifth loop (Figure 3.18) and is located quite distant from
the active site (Figure 3.17). This importance of the fifth loop is further supported by the fact
that an insertion mutation between position 46 and 47 (46_57insMet) showed no activity,
Stability of the mutant enzyme was slightly lower than the wild type enzyme while
incubated at 94oC (Table 3.7). Proline is a rigid amino acid and this amino acid is suggested
to have a role in enzymtica thermostability (Matthews, et al., 1987). The effect of proline
mutation depends on the position of the respective amino acid. It was shown by (Li, et al.,
1997) that the mutation of partially buried serine to proline show an increase in the
thermostability by presumably decreasing the entropy of the unfolded state. The number of
prolines introduced or replaced also play a significant role in enzyme thermostability (Suzuki,
et al., 1991). Addition of 100 mM Mg (II) was shown to increase significantly the wild type
and mutant enzymes’ thermostability (Table 3.4). Higher concentration of Mg (II) was used
because in the previous experiment, addition of 5 mM Mg (II) did not give any positive
effect. Half-life of each enzyme was two times longer than without Mg (II). This finding
suggests that Mg (II) helps to stabilise the active form of enzymes at higher temperature.
Effect of stabilisation may be dependent on the cation used (Heinen & Lauwers, 1976) thus it
might be interesting to see if other divalent ions would have a similar effect.
Both enzymes appeared to be inhibited by either glucose or fructose via a non-
competitive mechanism since there was no apparent change in the Km (Table 3.8). There is no
report describing the effect of product inhibition for this class of enzyme. One small molecule
is reported to inhibit HAD enzyme via noncompetitive mechanisms (Seifried, et al., 2013). A
Nnoncompetitive inhibitor, also known as allosteric inhibitor is commonly found in

Discussion 45
metabolisms (Kent, 2000). Further experiments with different ligands’ concentration and
their respective sugar is needed to reliably determine inhibition constants.

Conclusion and Future Outlook 46
5 Conclusion and Future Outlook
5.1 Conclusion
Haloacid dehalogenase (HAD) superfamily is a family of hydrolases that is able to catalyse a
broad set of reactions (CO-P, C-halogen, C-P) and can be found in all super kingdoms
(Burroughs, et al., 2006). Phosphatase-like activity of this superfamily is known to exceed
other phosphatases (Koonin & Tatusov, 1994) marking the significance of these enzymes in
the control of metabolic fluxes as metabolomes with phosphate functional groups account up
to 40% (Nobeli, et al., 2003). One enzyme that belongs to HAD super family from
Thermatoga neapolitana (HADTn) was studied due to its distinctive characteristic of a higher
activity towards fructose-6-phosphate (F6P) than glucose-6-phosphate (G6P). This work was
presented as the preliminary study of this enzyme to probably increase its specificity toward
F6P even further. Sequence alignment and three dimensional comparisons together with
docking calculations toward both substrates by YASARA were performed in order to identify
potential amino acids for substrate recognition. Characterisation of the wild type showed that
HADTn can use Mg (II) and Mn (II) as cofactor, but Mg (II) gave a higher activity. Optimum
pH of HADTn was 7, with the same compatibility among HEPES, MOPS, and Tris buffers.
Single and double mutations predicted by YASARA and further tested by in vitro
experiments suggested that S166 is important for the enzyme activity and E47 appeared to
have a role in substrate recognitions. Mutants were developed by employing QuikChange™
site-directed mutagenesis. Several libraries based on site-saturation mutagenesis with NNK
motifs were developed to investigate the role of six different amino acids (8M, Y19, P46,
E47, P110, R117) independently in the enzyme activity and specificity. High-throughput
screening method has been developed to screen those libraries for an improved variant. The
variant has mutation at position 46 to threonine (P46T). Kinetic characterisations showed that
HADTnP46T had almost doubled specificity toward F6P than the wild type, calculated by the
ratio of kcat/Km of F6P over G6P. Temperature stability studies revealed that the addition of
100 mM Mg (II) could prolong the half-life of HADTnP46T and the wild type enzyme by a
factor of two. The studies also showed that HADTnP46T had a slight decrease in temperature
stability at 94oC than the wild type enzyme. Inhibition studies with its respective sugar
exhibited inhibition followed noncompetitive mechanisms. Findings from this work were
similar to the proposal by (Lahiri, et al., 2004) that there is an additional fifth loop in the
HAD superfamily located in the cap domain that play a role in substrate recognition.
HADTnP46T discovered from this work could be also used as a good starting template for
future research aiming to improve the specificity towards F6P.
5.2 Future outlook
The results of this work have indicated the presence of a loop located in the cap domain of
HADTn that could play a pivotal role in substrate recognition. In the future, experiments
should be directed to generate mutations of amino acids in this loop to further justify if this
loop really has a significant role in the substrate recognition as suggested by (Lahiri, et al.,
2004) and this work. Due to a huge cleft between the main domain and the cap domain, it
would be interesting to test the activity of HADTn toward different sugar phosphates. The
findings from that investigation may further imply the importance of the proposed loop.
Conclusion and Future Outlook 47
Besides engineering of the enzyme, other parameters from this work can still be
improved. Reaction rates at different temperatures with different incubation time could be
performed to find the best combinations yielding the highest activity. Specificity of the
enzyme may be changed at different temperatures, thus it is also interesting to investigate if
that is true. Although high-throughput screening developed from this work was robust
enough to screen the libraries generated, higher concentration of substrates, in particular G6P
could be tested if that would be possible to achieve an ideal assay performance (Z’ = 1). With
higher Z’, screening can be done with different concentrations of substrates, e.g. 1, 5, 10 mM
like the one reported by (Pick, et al., 2014) such that catalytic efficiency (kcat/Km) can be
compared during the screening resulted in a much improved screening approach.
References 48
References
Agilent, 2005. QuikChange® Site-Directed Mutagenesis Kit. [Online]
Available at: https://www.agilent.com/cs/library/usermanuals/Public/200523.pdf
[Accessed 25 November 2015].
Akhtar, M., Ahmad, A. & Bhakuni, V., 2002. Divalent cation induced changes in structural properties of the
dimeric enzyme glucose oxidase: dual effect of dimer stabilization and dissociation with loss of
cooperative interactions in enzyme monomer. Biochemistry, 41(22), pp. 142-149.
Allen, K. & Dunaway-Mariano, D., 2004. Phosphoryl group transfer: evolution of a catalytic scaffold. Trends
Biochem Sci, Volume 29, pp. 495-503.
Anastas, P. & Warner, J., 1998. Green chemistry: theory and practice. New York: Oxford University Press.
Andrade, C., Pereira, N. J. & Antranikian, G., 1999. Extremely thermophilic microorganisms and their polymer-
hidrolytic enzymes. Rev. Microbiol. , 30(4), pp. 287-298.
Antonov, A. et al., 1978. Mechanisms of Pepsin Catalysis: General Base Catalysis By The Active Site
Carboxylate Ion. FEBS Letter, 88(1), pp. 87-90.
Aravind, L., Galperin, M. & Koonin, E., 1998. The catalytic domain of the P-type ATPase has the haloacid
dehalogenase fold. TIBS, Volume 23, pp. 127-129.
Axe, D., 2004. Estimating the prevalence of protein sequences adopting functional enzyme folds. J Mol Bio,
Volume 341, pp. 1295-1315.
Baykov, A. A., Evtushenko, O. A. & Avaeva, S. M., 1988. A Malachite Green Procedure for Orthophosphate
Determination and Its Use in Alkaline Phosphatase-Based Enzyme Immunoassay. Analytical
Biochemistry, Volume 171, pp. 266-270.
Benkovic, S. & Hammes-Schiffer, S., 2003. A Perspective on Enzyme Catalysis. Science, Volume 301, pp.
1196-1202.
Bock, C. W. et al., 1999. Manganese as a Replacement for Magnesium and Zinc: Functional Comparison of
DIvalent Ions. J. Am. Chem. Soc., Volume 121, pp. 7360-7372.
Brown, D. & Cook, R., 1981. Role of metal cofactors in enzyme regulation. Differences in the regulatory
properties of the Escherichia coli nicotinamide adenine dinucleotide phosphate specific malic enzyme,
depending on whether magnesium ion or manganese ion serves as divalent cation. Biochemistry, 20(9),
pp. 2503-2512.
Bunchanan, C. et al., 1999. An extremely thermostable aldolase from Sulfolobus solfataricus with specificity for
non-phosphorylated substrates. Biochem J., Volume 343, pp. 563-570.
Burroughs, A., Allen, K., Dunaway-Mariano, D. & Aravind, L., 2006. Evolutionary Genomics of the HAD
Superfamily: Understanding the Structural Adaptations and Catalytic Diversity in a Superfamily of
Phosphoesterases and Allied Enzymes. J. Mol. Biol., Volume 361, p. 1003–1034.
Cadwell, R. & Joyce, G., 1992. Randomization of genes by PCR mutagenesis. PCR Methods Appl, Volume 2,
pp. 28-33.
Caparros-Martin, J., McCarthy-Suarez, I. & Culianez-Macia, F., 2013. HAD hydrolase function unveiled by
substrate screening: enzymatic characterization of Arabidopsis thaliana subclass I phosphosugar
phosphatase AtSgpp. Planta, Volume 237, p. 943–954.
Caravaca, J. & Grisolia, S., 1959. Decrease in thermal stability of frog liver carbamyl phosphate synthetase by
substrates and cofactors. Biochemical and Biophysical Research Communications, 1(2), pp. 94-97.
Castle, L. et al., 2004. Discovery and directed evolution of a glyphosate tolerance gene. Science, Volume 304,
pp. 1151-1154.
Centi, G. & Perathoner, S., 2009. From Green to Sustainable Industrial Chemistry. In: F. Cavani, G. Centi & S.
T. F. Perathoner, eds. Sustainable Industrial Processes. Weinheim: WILEY-VCH Verlag GmbH & Co.,
pp. 1-72.
Chen, K. & Arnold, F., 1993. Tuning the activity of an enzyme for unusual environments: sequential random
mutagenesis of Subtilisin E for catalysis in dimethylformamide. Proc Natl Acad Sci USA, Volume 90, pp.
5618-5622.
Chen, Y.-C., 2015. Beware of Docking!. Trends in Pharmacological Sciences , 36(2), pp. 78-95.
Cohen, J., 2001. How DNA Shuffling Works. Science, Volume 293, p. 237.
Currin, A., Swainston, N., Day, P. & Kell, D., 2015. Synthetic biology for the directed evolution of protein
biocatalysts: navigating sequence space intelligently. Chem. Soc. Rev., Volume 44, pp. 1172-1239.
Drueckes, P., Schinzel, R. & Palm, D., 1995. Photometric Microtiter Assay of Inorganic Phosphate in the
Presence of Acid-Labile Organic Phosphates. Analyticial Biochemistry, Volume 230, pp. 173-177.
Eisenthal, R., Danson, M. J. & Hough, D. W., 2007. Catalytic efficiency and kcat/KM: a useful comparator?.
Trends in Biotechnology, 25(6), pp. 247-249.
References 49
EMBL-EBI, 2016. Clustal Omega. [Online]
Available at: http://www.ebi.ac.uk/Tools/msa/clustalo/
[Accessed 22 May 2016].
European Nuclear Society, 2016. Binding Energy. [Online]
Available at: http://www.euronuclear.org/info/encyclopedia/bindingenergy.htm
[Accessed 11 05 2016].
Greener, A. L. & Jerpseth, B. D., 2004. Highly transformable bacterial cells and methods for producing the
same. United States of America, Patent No. US 6706525 B1.
Greimel, K. et al., 2013. Banning toxic heavy-metal catalysts from paint: enzymatic cross-linking of alkyd
resins. Green Chemistry, 381-388(2), p. 15.
Heinen, W. & Lauwers, A., 1976. Amylase activity and stability at high and low temperature depending on
calcium and other divalent cations. Experientia Suppl. , Volume 26, pp. 77-89.
Hoenig, M., Lee, R. J. & C, F. D., 1989. A microtiter late assay for inorganic phosphate. Journal of Biochemical
and Biophysical Methods, Volume 19, pp. 249-252.
Hogrefe, H., Cline, J., Youngblood, G. & Allen, R., 2002. Creating randomized amino acid libraries with the
QuickChange Multi Site-Directed Mutagenesis kit. BioTechniques, Volume 33, pp. 1151-1165.
Illanes, A., 2008. Enzyme Biocatalysis. 9 ed. Dordrecht: Springer Science + Business Media B.V..
Integrated DNA Technologies, Inc, 2015. OlygoAnalyzer 3.1. [Online]
Available at: https://eu.idtdna.com/calc/analyzer
[Accessed 25 November 2015].
Kent, M., 2000. Advanced Biology. 10 ed. Oxford: Oxford University Press.
Kim, D., 2015. Baker Laboratory. [Online]
Available at: http://depts.washington.edu/bakerpg/primertemp/
[Accessed 25 November 2015].
Koonin, E. & Tatusov, R., 1994. Computer Analysis of Bacterial Haloacid Dehalogenases Defines a Large
Superfamily of Hydrolases with Diverse Specificity: Application of an Iterative Approach to Database
Search. Journal of Molecular Biology, 244(1), pp. 125-132.
Kriege, E. et al., 2009. Improving physical realism, stereochemistry, and side-chain accuracy in homology
modelling:: Four approaches that performed well in CASP8. Proteins, 77(9), pp. 114-122.
Krieger, E., n.d. Docking a ligand to a receptor. [Online]
Available at: http://www.yasara.org/dock_run.mcr
[Accessed 11 05 2016].
Krieger, E. & Vriend, G., 2014. YASARA View - molecular graphics for all devices - from smartphones to
workstations. Bioinformatics , Volume 30, pp. 2981-2982.
Kuznetsova, E. et al., 2006. Genome-wide Analysis of Substrate Specificities of the Escherichia coli Haloacid
Dehalogenase-like Phosphatase Family. The Journal of Biological Chemistry, 281(47), p. 36149 –36161.
Kuznetsova, E. et al., 2005. Enzyme genomics: Application of general enzymatic screens to discover new
enzymes. FEMS Microbiology Reviews, Volume 29, pp. 263-279.
Lahiri, S. D. et al., 2004. Analysis of the Substrate Specificity Loop of the HAD Superfamily Cap Domain.
Biochemistry, Volume 43, pp. 2812-2820.
Lahiri, S., Zhang, G., Dunaway-Mariano, D. & Allen, K., 2002. Caught in the act: the structure of
phosphorylated beta-phosphoglucomutase from Lactococcus lactis. Biochemistry, Volume 41, p. 8351–
8359.
Leisola, M. & Turunen, O., 2007. Protein engineering: opportunities and challenges. Appl Microbiol Biotechnol
, Volume 75, pp. 1225-1232.
Lesk, A. & Chothia, C., 1980. How different amino acids sequences determine similar protein structures: The
structure and evolutionary dynamics of globins. J. Mol Biol., Volume 136, pp. 225-270.
Leung, D., Chen, E. & Goeddel, D., 1989. A method for random mutagenesis of a defined DNA segment using
a modified polymerase chain reaction. Technique, Volume 1, pp. 11-15.
Liu, H. & Naismith, J., 2008. An efficient one-step site-directed deletion, insertion, single and multiple-site
plasmid mutagenesis protocol. BMC Biotechnology, 8(91).
Li, Y., Reilly, P. & Ford, C., 1997. Effect of introducing proline residues on the stability of Aspergillus
awamori. Protein Eng., 10(10), pp. 1199-1204.
Lutz, S., 2010. Beyond directed evolution - semi-rational protein engineering and design. Curr Opin Biotechnol,
21(6), p. 734–743.
Lu, Z., Dunaway-Mariano, D. & Allen, K. N., 2005. HAD Superfamily Phosphotransferase Substrate
Diversification: Structure and Function Analysis of HAD Subclass IIB Sugar Phosphatase BT4131.
Biochemistry, Volume 44, pp. 8684-8696.
Martí-Renom, M. A. et al., 2000. Comparative Protein Structure Modeling of Genes and Genomes. Annu. Rev.
Biophys. Biomol. Struct. , Volume 29, p. 291–325.
References 50
Matthews, B., Nicholson, H. & WJ, B., 1987. Enhanced protein thermostability from site-directed mutations that
decrease the entropy of unfolding. Proc Natl Acad Sci U S A, 84(19), pp. 6663-6637.
McCullum, E., Williams, B., Zhang, J. & Chaput, J., 2010. Random mutagenesis by error-prone PCR. Methods
Mol Biol, Volume 634, pp. 103-109.
Morais, M. et al., 2000. The crystal structure of Bacillus cereus phosphonoacetaldehyde hydrolase: insight into
catalysis of phosphorus bond cleavage and catalytic diversification within the HAD enzyme superfamily.
Biochemistry, Volume 39, p. 10385–10396.
Muginova, S. & Zhavoronkova, A. S. T., 2005. Potentialities and Prospects for the Use of Alkaline
Phosphatases for Determining Metal Ions. Journal of Analytical Chemistry, 60(3), p. 247–263.
NEB, 2016. BL21(DE3) Competent E. coli. [Online]
Available at: https://www.neb.com/products/c2527-bl21de3-competent-e-coli
[Accessed 9 May 2016].
Nelson, D. & Cox, M., 2008. Lehninger Principles of Biochemistry. 5 ed. s.l.:W. H. Freeman and Company.
Nissen, J. A., 1982. Limited enzymic degradation of proteins: A new approach in the industrial application of
hydrolases. Journal of Chemical Technology and Biotechnology, 32(1), p. 138–156.
Nobeli, I., Ponstingl, H., Krissinel, E. & Thornton, J., 2003. A Structure-based Anatomy of the E. coli
Metabolome. Journal of Molecular Biology, 334(4), p. 697–719.
Nov, Y., 2012. When Second Best Is Good Enough: Another Probabilistic Look at Saturation Mutagenesis. Appl
Environ Microbiol., 78(1), p. 258–262.
Pick, A. et al., 2014. Improving the NADH-cofactor specificity of the highly active AdhZ3and AdhZ2 from
Escherichia coli K-12. Journal of Biotechnology 189 , Volume 189, p. 157–165.
Plesner, I., 1986. The apparent Km is a misleading kinetic indicator. BIochem J., Volume 239, pp. 175-178.
Porter, J., Rusli, R. & Ollis, D. L., 2016. Directed Evolution of Enzymes for Industrial Biocatalysis.
ChemBioChem, Volume 17, pp. 197-203.
Premier Biosoft, 2016. PCR Primer Design Guidelines. [Online]
Available at: http://www.premierbiosoft.com/tech_notes/PCR_Primer_Design.html
[Accessed 11 May 2016].
Ranaldi, F., Vanni, P. & Giachetti, E., 1999. What students must know about the determination of enzyme
kinetic parameters. Biochemical Education, Volume 27, pp. 87-81.
Reed, M. C., Lieb, A. & Nijhout, H. F., 2010. The biological significance of substrate inhibition: A mechanism
with diverse functions. Bioessays, Volume 32, p. 422–429.
Ridder, I. & Dijkstra, B., 1999. Identification of the Mg2+-binding site in the P-type ATPase and phosphatase
members of the HAD (haloacid dehalogenase) superfamily by structural similarity to the response
regulator protein CheY. Biochem J., Volume 339, pp. 223-226.
Sadana, A., 1988. Enzyme deactivation. Biotechnol Adv, 6(3), pp. 349-446.
Sakharov, I. Y. & Makarova, I. E. G., 1988. Biokhimiya, 53(6), p. 974.
Sander, C. & Schneider, R., 1991. Database of homology-derived protein structures and the structural meaning
of sequence alignment. Protein, 9(1), pp. 56-68.
Seifried, A., Schultz, J. & Gohla, A., 2013. Human HAD phosphatases: structure, mechanism, and roles in
health and disease. FEBS Journal, Volume 280, pp. 549-571.
Shin, D. H. et al., 2003. Crystal structure of a phosphatase with a unique substrate binding domain from
Thermotoga maritima. Protein Science, Volume 12, p. 1464–1472.
Sigma Aldrich, 2015. Buffer Refence Center. [Online]
Available at: http://www.sigmaaldrich.com/life-science/core-bioreagents/biological-buffers/learning-
center/buffer-reference-center.html
[Accessed 26 December 2015].
Strange, R. et al., 2009. Structure of a putative beta-phosphoglucomutase (TM1254) from Thermotoga maritima.
Acta Crystallogr Sect F Struct Biol Cryst Commun, Volume 65, pp. 1218-1221.
Suzuki, Y., Hatagaki, K. & Oda, H., 1991. A hyperthermostable pullulanase produced by an extreme
thermophile, Bacillus flavocaldarius KP 1228, and evidence for the proline theory of increasing protein
thermostability. Appl Microbiol Biotechnol, 34(6), pp. 707-714.
Tenenbaum, D. J., 2008. Food vs. Fuel: Diversion of Crops Could Cause More Hunger. Environmental Health
Perspectives, 116(6), pp. A254-A257.
ThermoFisher, 2015. One Shot® TOP10 Electrocomp™ E. coli. [Online]
Available at: https://www.thermofisher.com/order/catalog/product/C404052
[Accessed 30 04 2016].
Thomas, T. & Scopes, R., 1998. The effects of temperature on the kinetics and stability of mesophilic and
thermophilic 3-phosphoglycerate kinases. Biochem. J., Volume 330, pp. 1087-1095.
Thompson, J. & Raines, R., 1994. Value of General Acid–Base Catalysis to Ribonuclease A. J Am Chem Soc.,
116(12), p. 5467–5468.
References 51
Totrov, M. & Abagyan, R., 2008. Flexible ligand docking to multiple receptor conformations: a practical
alternative. Curr Opin Struct Biol., 18(2), pp. 178-184.
Trott, O. & Olson, A., 2010. AutoDock VINA: improving the speed and accuracy of docking with a new scoring
function, efficient optimization and multithreading. J.Comput.Chem., Volume 31, pp. 455-461.
Trott, O. & Olson, J., 2010. AutoDock VINA: improving the speed and accuracy of docking with a new scoring
function, efficient optimization and multithreading. J.Comput.Chem., Volume 31, pp. 455-461.
van Loo, B. et al., 2004. Directed evolution of epoxide hydrolase from A. radiobacter toward higher
enantioselectivity by error-prone PCR and DNA shuffling. Chem Bio, Volume 11, pp. 981-990.
Vinogradov, V. & Avnir, D., 2015. Enzyme renaturation to higher activity driven by the sol-gel transition:
Carbonic anhydrase. Scientific Report, Volume 5, pp. 1-7.
Walser, M., 1961. Ion Association. V. DIssociation Constans for Complexesof Citrate with Sodium, Potassium,
Calcium, and Magnesium Ions. J. Phys. Chem., Volume 65, p. 159–161.
Wang, W. et al., 2001. Crystal Structure of Phosphoserine Phosphatase from Methanococcus jannaschii, a
Hyperthermophile, at 1.8 A°. Structure, Volume 9, p. 65–71.
Wang, W. & Malcom, B., 1999. Two-stage PCR protocol allowing introduction of multiple mutations, deletions
and insertions using Quik-Change site-diredetd mutagenesis. BioTechniques, Volume 26, pp. 680-682.
Xia, Y., Chu, W., Qi, Q. & Xun, L., 2014. New insights into the QuikChangeTM process guide the use of
Phusion DNA polymerase for site-directed mutagenesis. Nucleic Acids Research, Volume 1, pp. 1-9.
Yoshikuni, Y., Ferrin, T. & Keasling, J., 2006. Designed divergent evolution of enzyme function. Nature,
Volume 440, pp. 1078-1082.
Zea, C. J., Camci-Unal, G. & Pohl, N. L., 2008. Thermodynamics of binding of divalent magnesium and
manganese to uridine phosphates: implications for diabetes-related hypomagnesaemia and carbohydrate
biocatalysis. Chem Cent J., 2(15).
Zhang, J.-H., Chung, T. D. Y. & Oldenburg, K. R., 1999. A Simple Statistical Parameter for Use in Evaluation
and Validation of High Throughput Screening Assays. Journal of Biomolecular Screening, 4(2), pp. 67-
73.
Zhang, X. D. et al., 2008. Integrating Experimental and Analytic Approaches to Improve Data Quality in
Genome-wide RNAi Screens. Journal of Biomolecular Screening, 13(5), pp. 378-389.
Zheng, L., Baumann, U. & Reymond, J.-L., 2004. An efficient one-step site-directed and site-saturation
mutagenesis protocol. Nucleic Acids Research, 32(14), p. 115.

Appendices 52
Appendices
Appendix 1. Supporting Data for In Silico Analysis
Appendix 1A. DNA sequence of wild type enzyme (haloacid dehalogenase from Thermatoga
neaopolitana)
ATGGAAGCGGTGATTTTCGACATGGATGGAGTGCTCATGGACACAGAGCCTCTCTACTTCGAAGCT
TACAGAAGAGTCGCGGAAAGCTATGGAAAACCTTACACGGAGGATCTCCACAGGAGAATAATGG
GAGTTCCTGAAAGAGAAGGTCTTCCCATCCTCATGGAAGCTCTGGAGATAAAAGATTCTCTGGAG
AACTTCAAAAAGAGGGTCCACGAAGAAAAAAAGCGCGTTTTCTCTGAGCTTCTCAAGGAAAATCC
GGGTGTAAGAGAGGCGCTCGAGTTCGTAAAGAGCAAAAGAATAAAACTCGCGCTCGCAACCTCCA
CACCACAGCGAGAAGCGCTGGAGAGATTGAGAAGACTCGATCTCGAAAGGTACTTCGATGTCATG
GTGTTCGGTGATCAGGTGAAGAACGGAAAGCCTGATCCAGAGATATACCTTCTCGTTCTGGAAAG
GTTGAATGTGGTCCCAGAGAAGGTTGTGGTCTTCGAAGACTCAAAGAGCGGTGTTGAAGCCGCAA
AAAGCGCCGGCATAGAAAGAATCTATGGAGTCGTTCACTCTTTGAACGACGGTAAAGCGCTTCTTG
AAGCGGGTGCGGTTGCTCTGGTGAAACCCGAGGAAATCCTGAACGTTCTCAAAGAGGTTCTTTAA
Appendix 1B. Amino acid sequence of wild type enzyme.
MEAVIFDMDGVLMDTEPLYFEAYRRVAESYGKPYTEDLHRRIMGVPEREGLPILMEALEIKDSLENFK
KRVHEEKKRVFSELLKENPGVREALEFVKSKRIKLALATSTPQREALERLRRLDLERYFDVMVFGDQV
KNGKPDPEIYLLVLERLNVVPEKVVVFEDSKSGVEAAKSAGIERIYGVVHSLNDGKALLEAGAVALVK
PEEILNVLKEVL
Appendix 1C. Plasmid construct of wild type enzyme. This picture was obtained from Clone
Manager 9 Professional
pET28-NH-had-p-Tm
5972 bps
1000
2000
3000
4000
5000
DraIIIPsiI
AsiSIPvuI
SmaIXmaI
ClaINruI
Eco57I
AlwNI
BssSI
PciI
SapITatI
Bst1107ITth111I
PpuMIFspAI
FspIBglI
PshAI
HpaIEcoRVBssHII
ApaIPspOMI
BstEII
BclIMluI
BstAPI
SphI
SgrAIBglII
XbaINcoINdeIHindIII
XhoIBclI
SacISalI
HindIIINotI
EagIXhoI
BlpI
f1 origin
Kan
pBR322
lacI
had-phosphatase
MCS'
Appendix 1D. Sequence alignment of wild type enzyme (HADTn) to several homolog
proteins (protein are presented under PDB entry). Alignment was performed using Clustal

Appendices 53
Omega (EMBL-EBI, 2016). Psp is Pseudomonas, Xa is xanto, Tm is Thermatoga maritima,
and Mj is Methanococcus jannaschii. Red marks represent conserved amino acids in the four
motifs situated in the active site of HAD family. Motif I contains D and G, motif II contains
S, motif III contains K, and motif IV contains D. Note the distant position of S (motif II) in
1NF2_Tm relative to other proteins.
CLUSTAL O (1.2.1) multiple sequence alignment
HADTn ----MEAVIFDMDGVLMDTEPLYFEA---YR----RVAESYGKP-YTEDLHRRIMGV---
1JUD_Psp -
MDYIKGIAFDLYGTLFDVHSVVGRCDEAFPGRGREISALWRQKQLEYTWLRSLMNRYVN
1QQ5_Xa ---
MIKAVVFDAYGTLFDVQSVADATERAYPGRGEYITQVWRQKQLEYSWLRALMGRYAD
1NF2_Tm ---MYRVFVFDLDGTLLNDNLEISEKDRRNI------EKLSRKCYVVFASGRMLVST-LN
1F5S_Mj MEKKKKLILFDFDSTLVNNETIDEIAREAGV------EEEVKKITK-----EAMEGK-LN
. . ** ..*.: . : . :
HADTn ---P----EREGLPILMEALEIKDSLENFKKRVHEEKKRVFSELLKEN------------
1JUD_Psp FQQA----TEDALRFTCRHLGLDLD-ARTRSTLC----DAYL-RLAPF------------
1QQ5_Xa FWSV----TREALAYTLGTLGLEPD-ESFLADMA----QAYN-RLTPY------------
1NF2_Tm VEKKYFKRTFPTIAYNGAIVYLPEEGVILNEKIPPEVAKDIIEYIKPLNVHWQAYIDDVL
1F5S_Mj FEQSLRK------------------RVSLLKDLPIEKVEKAIKRITPT------------
: :
HADTn --PG-----------------VREALEFVKSKRIKLALATSTPQREALERLRRLDLERYF
1JUD_Psp --SE-----------------VPDSLRELKRRGLKLAILSNGSPQSIDAVVSHAGLRDGF
1QQ5_Xa --PD-----------------AAQCLAELA--PLKRAILSNGAPDMLQALVANAGLTDSF
1NF2_Tm YSEKDNEEIKSYARHSNVDYRVEPNLSELVSKMGTTKLLLIDTPERLDELKEILSERF--
1F5S_Mj --EGAEETIKELKN---RGYVVAVV-------SGGFDI-------AVNKIKEKLGLDYAF
. :
HADTn DVMVFGDQVKNGKPDPE-------------IYLLVLERLNVVPEKVVVFEDSKSGVEAAK
1JUD_Psp DHLLSVDPVQVYKPDNR-------------VYELAEQALGLDRSAILFVSSNAWDATGAR
1QQ5_Xa DAVISVDAKRVFKPHPD-------------SYALVEEVLGVTPAEVLFVSSNGFDVGGAK
1NF2_Tm KDVV-----KVFKSFPTYLEIVPKNVDKGKALRFLRERMNWKKEEIVVFGDNENDLFMFE
1F5S_Mj ANRLI---VKDGKLTGDVEGEVLKENAKGEILEKIAKIEGINLEDTVAVGDGANDISMFK
: : * : : . . .
HADTn SAGIERIYGVVHSLNDGKALLEAGAVALV-----------------KPEEILNVLKEVL-
1JUD_Psp YFGFPTCWINRTGNVFE-------------------------EMGQTPDWEVTSLRAVVE
1QQ5_Xa NFGFSVARVARLSQEALARELVSGTIAPLTMFKA--LRMREETYAEAPDFVVPALGDLPR
1NF2_Tm EAGLRVAMENAIEKVKEASDIVTLTNN-DSGVSYVLERISTDCLDE--------------
1F5S_Mj KAGLKIAFCAKPI-LKEKADICIEKRDLREILKYIK------------------------
*:
HADTn --------------
1JUD_Psp LFETAAGKAEKG--
1QQ5_Xa LVRGMAGAHLAPAV
1NF2_Tm --------------
1F5S_Mj --------------
Appendices 54
Appendix 1E. Other possible docking conformations of wild type enzyme to glucose-6-
phosphate (G6P) or to fructose-6-phosphate (F6P). Docking was performed using YASARA
and pictures were generated by PyMol. The ligand for picture A, C, E, G is G6P wile for B,
D, F, H is F6P. The pictures are arranged such that from top to bottom (A to G or B to H) the
likelihood of the respective conformation decreases. Decreased likelihood is represented by
decreased binding energy and increased dissociation constant (Kd).
A B
C D

Appendices 55
E F
G H
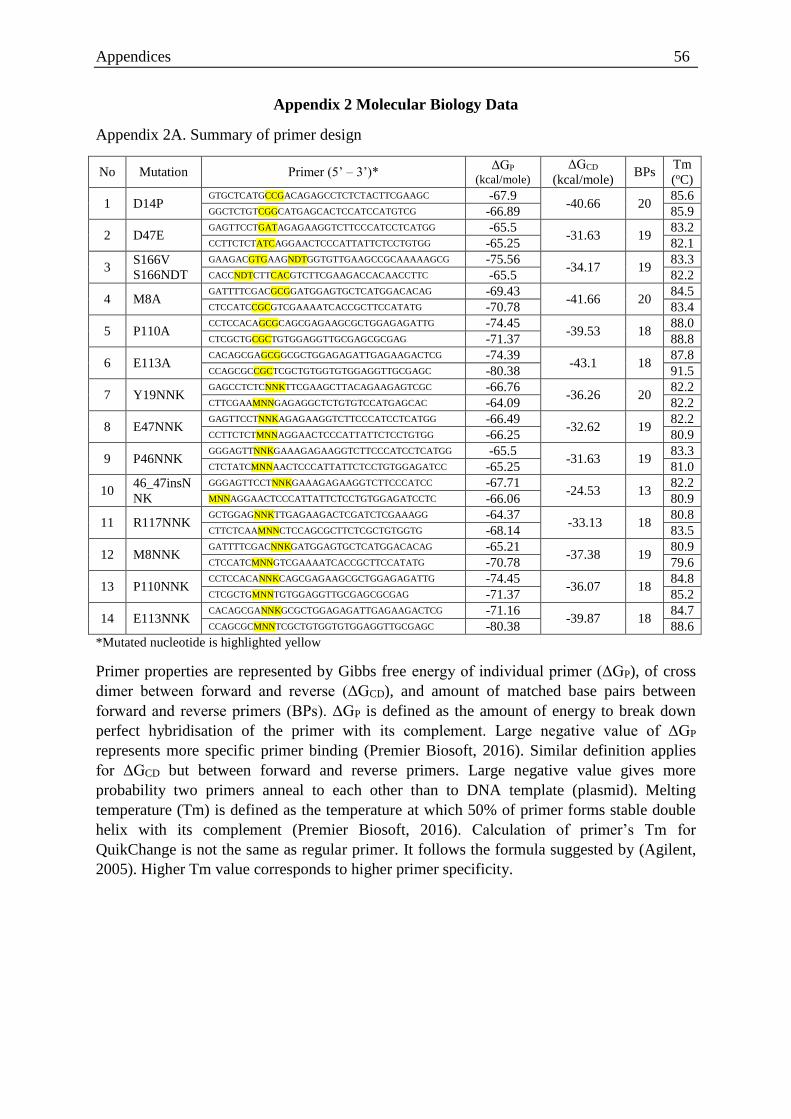
Appendices 56
Appendix 2 Molecular Biology Data
Appendix 2A. Summary of primer design
No Mutation Primer (5’ – 3’)* ΔGP
(kcal/mole)
ΔGCD
(kcal/mole) BPs
Tm
(oC)
1 D14P GTGCTCATGCCGACAGAGCCTCTCTACTTCGAAGC -67.9
-40.66 20 85.6
GGCTCTGTCGGCATGAGCACTCCATCCATGTCG -66.89 85.9
2 D47E GAGTTCCTGATAGAGAAGGTCTTCCCATCCTCATGG -65.5
-31.63 19 83.2
CCTTCTCTATCAGGAACTCCCATTATTCTCCTGTGG -65.25 82.1
3 S166V
S166NDT
GAAGACGTGAAGNDTGGTGTTGAAGCCGCAAAAAGCG -75.56 -34.17 19
83.3 CACCNDTCTTCACGTCTTCGAAGACCACAACCTTC -65.5 82.2
4 M8A GATTTTCGACGCGGATGGAGTGCTCATGGACACAG -69.43
-41.66 20 84.5
CTCCATCCGCGTCGAAAATCACCGCTTCCATATG -70.78 83.4
5 P110A CCTCCACAGCGCAGCGAGAAGCGCTGGAGAGATTG -74.45
-39.53 18 88.0
CTCGCTGCGCTGTGGAGGTTGCGAGCGCGAG -71.37 88.8
6 E113A CACAGCGAGCGGCGCTGGAGAGATTGAGAAGACTCG -74.39
-43.1 18 87.8
CCAGCGCCGCTCGCTGTGGTGTGGAGGTTGCGAGC -80.38 91.5
7 Y19NNK GAGCCTCTCNNKTTCGAAGCTTACAGAAGAGTCGC -66.76
-36.26 20 82.2
CTTCGAAMNNGAGAGGCTCTGTGTCCATGAGCAC -64.09 82.2
8 E47NNK GAGTTCCTNNKAGAGAAGGTCTTCCCATCCTCATGG -66.49
-32.62 19 82.2
CCTTCTCTMNNAGGAACTCCCATTATTCTCCTGTGG -66.25 80.9
9 P46NNK GGGAGTTNNKGAAAGAGAAGGTCTTCCCATCCTCATGG -65.5
-31.63 19 83.3
CTCTATCMNNAACTCCCATTATTCTCCTGTGGAGATCC -65.25 81.0
10 46_47insN
NK
GGGAGTTCCTNNKGAAAGAGAAGGTCTTCCCATCC -67.71 -24.53 13
82.2 MNNAGGAACTCCCATTATTCTCCTGTGGAGATCCTC -66.06 80.9
11 R117NNK GCTGGAGNNKTTGAGAAGACTCGATCTCGAAAGG -64.37
-33.13 18 80.8
CTTCTCAAMNNCTCCAGCGCTTCTCGCTGTGGTG -68.14 83.5
12 M8NNK GATTTTCGACNNKGATGGAGTGCTCATGGACACAG -65.21
-37.38 19 80.9
CTCCATCMNNGTCGAAAATCACCGCTTCCATATG -70.78 79.6
13 P110NNK CCTCCACANNKCAGCGAGAAGCGCTGGAGAGATTG -74.45
-36.07 18 84.8
CTCGCTGMNNTGTGGAGGTTGCGAGCGCGAG -71.37 85.2
14 E113NNK CACAGCGANNKGCGCTGGAGAGATTGAGAAGACTCG -71.16
-39.87 18 84.7
CCAGCGCMNNTCGCTGTGGTGTGGAGGTTGCGAGC -80.38 88.6
*Mutated nucleotide is highlighted yellow
Primer properties are represented by Gibbs free energy of individual primer (ΔGP), of cross
dimer between forward and reverse (ΔGCD), and amount of matched base pairs between
forward and reverse primers (BPs). ΔGP is defined as the amount of energy to break down
perfect hybridisation of the primer with its complement. Large negative value of ΔGP
represents more specific primer binding (Premier Biosoft, 2016). Similar definition applies
for ΔGCD but between forward and reverse primers. Large negative value gives more
probability two primers anneal to each other than to DNA template (plasmid). Melting
temperature (Tm) is defined as the temperature at which 50% of primer forms stable double
helix with its complement (Premier Biosoft, 2016). Calculation of primer’s Tm for
QuikChange is not the same as regular primer. It follows the formula suggested by (Agilent,
2005). Higher Tm value corresponds to higher primer specificity.
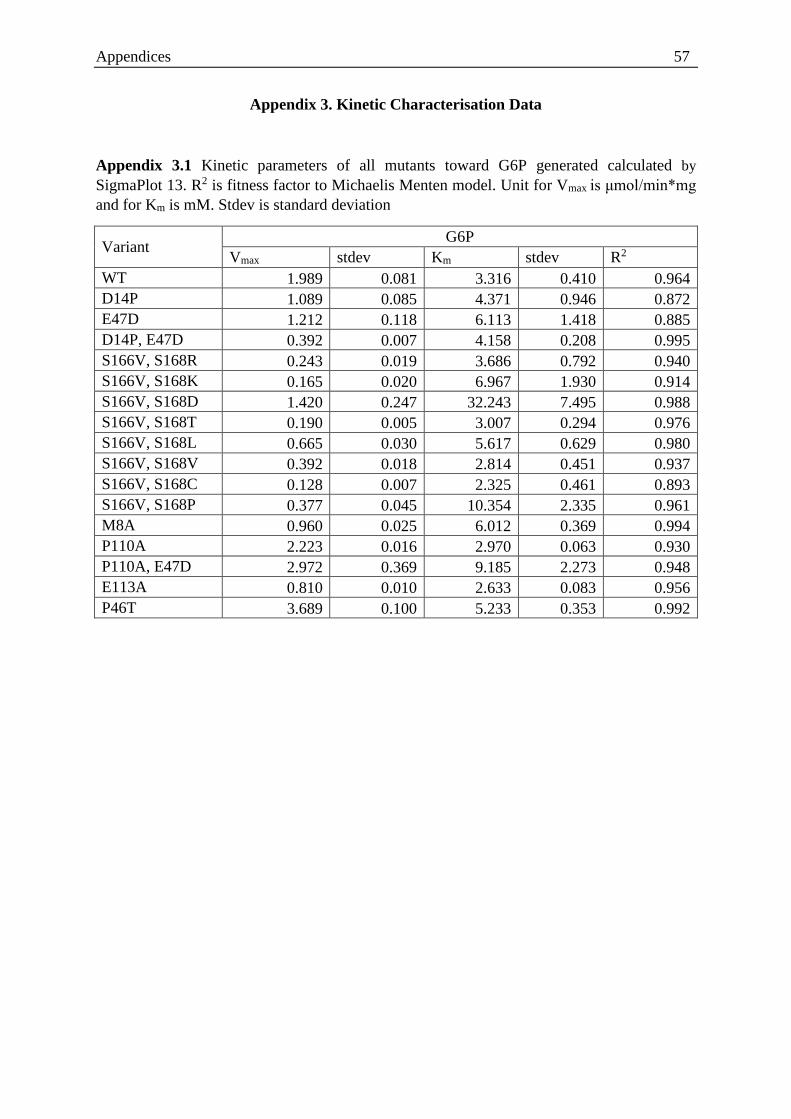
Appendices 57
Appendix 3. Kinetic Characterisation Data
Appendix 3.1 Kinetic parameters of all mutants toward G6P generated calculated by
SigmaPlot 13. R2 is fitness factor to Michaelis Menten model. Unit for Vmax is μmol/min*mg
and for Km is mM. Stdev is standard deviation
Variant G6P
Vmax stdev Km stdev R2
WT 1.989 0.081 3.316 0.410 0.964
D14P 1.089 0.085 4.371 0.946 0.872
E47D 1.212 0.118 6.113 1.418 0.885
D14P, E47D 0.392 0.007 4.158 0.208 0.995
S166V, S168R 0.243 0.019 3.686 0.792 0.940
S166V, S168K 0.165 0.020 6.967 1.930 0.914
S166V, S168D 1.420 0.247 32.243 7.495 0.988
S166V, S168T 0.190 0.005 3.007 0.294 0.976
S166V, S168L 0.665 0.030 5.617 0.629 0.980
S166V, S168V 0.392 0.018 2.814 0.451 0.937
S166V, S168C 0.128 0.007 2.325 0.461 0.893
S166V, S168P 0.377 0.045 10.354 2.335 0.961
M8A 0.960 0.025 6.012 0.369 0.994
P110A 2.223 0.016 2.970 0.063 0.930
P110A, E47D 2.972 0.369 9.185 2.273 0.948
E113A 0.810 0.010 2.633 0.083 0.956
P46T 3.689 0.100 5.233 0.353 0.992

Appendices 58
Appendix 3.1 Kinetic parameters of all mutants toward F6P generated calculated by
SigmaPlot 13. R2 is fitness factor to Michaelis Menten model. Unit for Vmax is μmol/min*mg
and for Km is mM. Stdev is standard deviation
Variant G6P
Vmax stdev Km stdev R2
WT 7.611 0.148 2.325 0.106 0.985
D14P 4.324 0.237 5.990 0.788 0.975
E47D 3.870 0.097 4.320 0.303 0.990
D14P, E47D 1.458 0.057 4.456 0.479 0.979
S166V, S168R 0.305 0.013 1.128 0.287 0.774
S166V, S168K 0.473 0.026 4.398 0.671 0.960
S166V, S168D 1.203 0.174 8.151 2.471 0.913
S166V, S168T 0.747 0.067 11.289 1.868 0.980
S166V, S168L 0.841 0.045 1.658 0.376 0.882
S166V, S168V 0.648 0.029 2.715 0.433 0.927
S166V, S168C 0.217 0.009 6.591 0.644 0.987
S166V, S168P 0.467 0.026 3.919 0.647 0.947
M8A 3.018 0.110 4.726 0.460 0.984
P110A 4.513 0.136 3.162 0.314 0.977
P110A, E47D 3.959 0.280 4.087 0.833 0.928
E113A 2.387 0.045 2.417 0.158 0.992
P46T 10.205 0.357 1.647 0.241 0.928
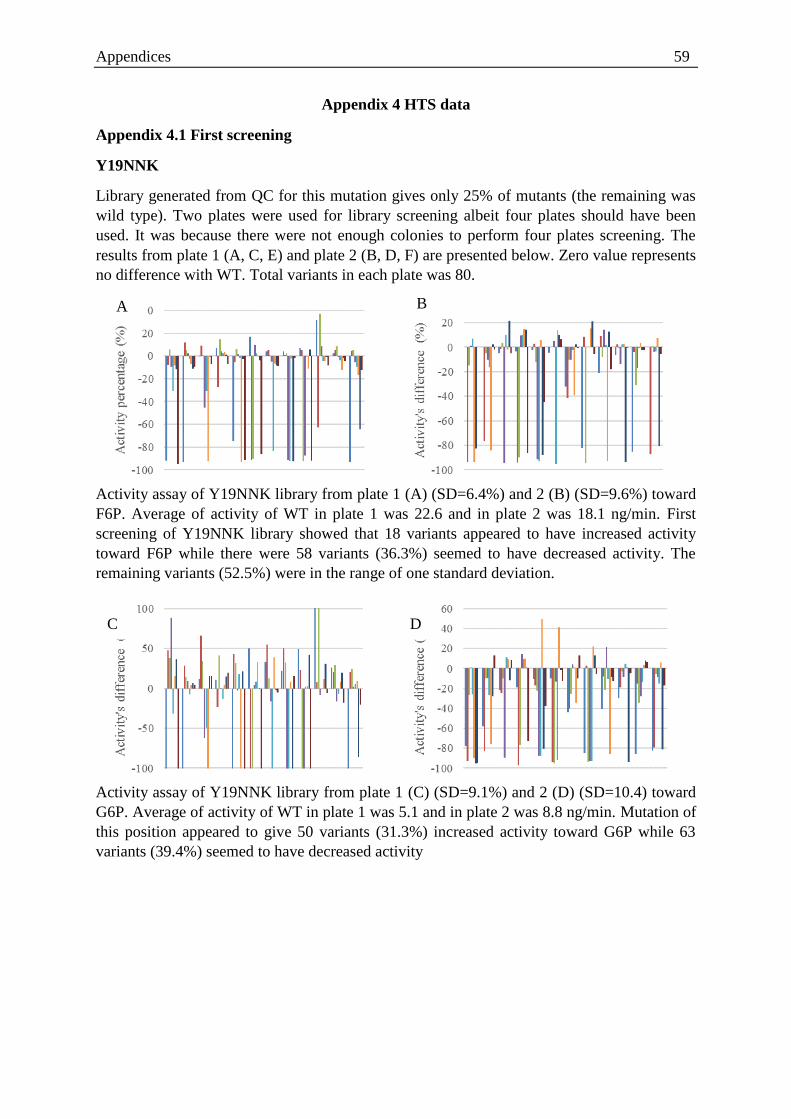
Appendices 59
Appendix 4 HTS data
Appendix 4.1 First screening
Y19NNK
Library generated from QC for this mutation gives only 25% of mutants (the remaining was
wild type). Two plates were used for library screening albeit four plates should have been
used. It was because there were not enough colonies to perform four plates screening. The
results from plate 1 (A, C, E) and plate 2 (B, D, F) are presented below. Zero value represents
no difference with WT. Total variants in each plate was 80.
Activity assay of Y19NNK library from plate 1 (A) (SD=6.4%) and 2 (B) (SD=9.6%) toward
F6P. Average of activity of WT in plate 1 was 22.6 and in plate 2 was 18.1 ng/min. First
screening of Y19NNK library showed that 18 variants appeared to have increased activity
toward F6P while there were 58 variants (36.3%) seemed to have decreased activity. The
remaining variants (52.5%) were in the range of one standard deviation.
Activity assay of Y19NNK library from plate 1 (C) (SD=9.1%) and 2 (D) (SD=10.4) toward
G6P. Average of activity of WT in plate 1 was 5.1 and in plate 2 was 8.8 ng/min. Mutation of
this position appeared to give 50 variants (31.3%) increased activity toward G6P while 63
variants (39.4%) seemed to have decreased activity
C D
A B
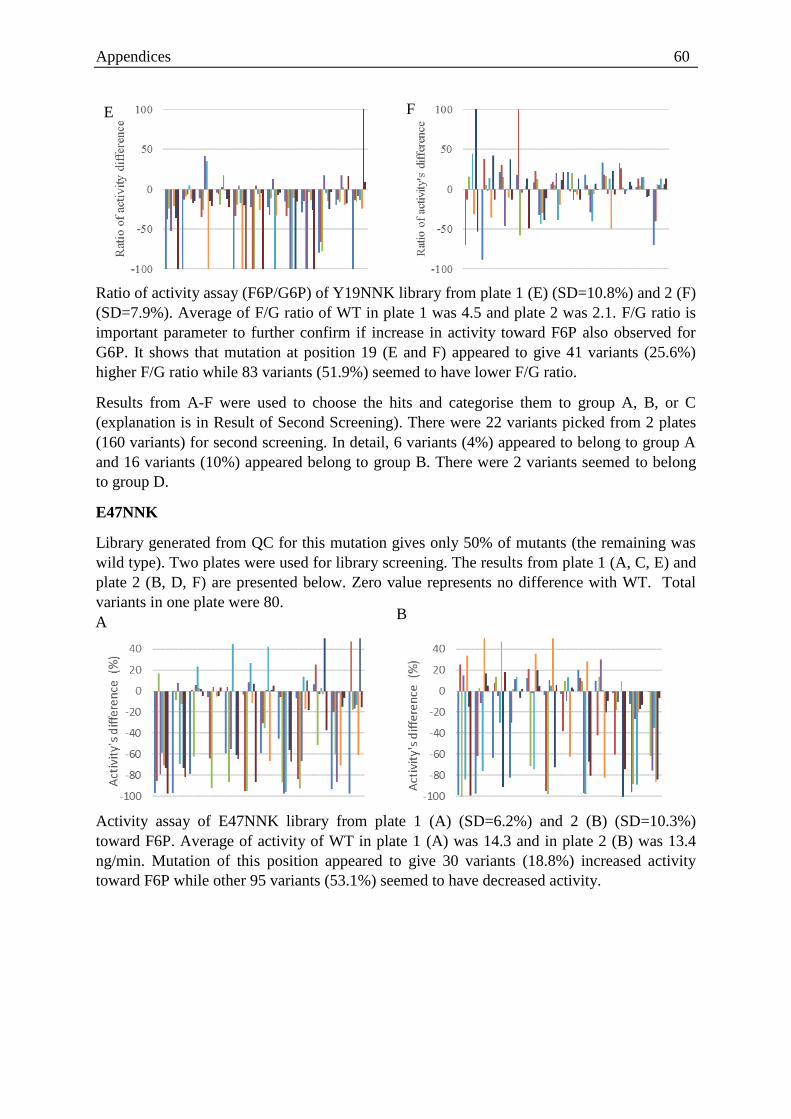
Appendices 60
Ratio of activity assay (F6P/G6P) of Y19NNK library from plate 1 (E) (SD=10.8%) and 2 (F)
(SD=7.9%). Average of F/G ratio of WT in plate 1 was 4.5 and plate 2 was 2.1. F/G ratio is
important parameter to further confirm if increase in activity toward F6P also observed for
G6P. It shows that mutation at position 19 (E and F) appeared to give 41 variants (25.6%)
higher F/G ratio while 83 variants (51.9%) seemed to have lower F/G ratio.
Results from A-F were used to choose the hits and categorise them to group A, B, or C
(explanation is in Result of Second Screening). There were 22 variants picked from 2 plates
(160 variants) for second screening. In detail, 6 variants (4%) appeared to belong to group A
and 16 variants (10%) appeared belong to group B. There were 2 variants seemed to belong
to group D.
E47NNK
Library generated from QC for this mutation gives only 50% of mutants (the remaining was
wild type). Two plates were used for library screening. The results from plate 1 (A, C, E) and
plate 2 (B, D, F) are presented below. Zero value represents no difference with WT. Total
variants in one plate were 80.
Activity assay of E47NNK library from plate 1 (A) (SD=6.2%) and 2 (B) (SD=10.3%)
toward F6P. Average of activity of WT in plate 1 (A) was 14.3 and in plate 2 (B) was 13.4
ng/min. Mutation of this position appeared to give 30 variants (18.8%) increased activity
toward F6P while other 95 variants (53.1%) seemed to have decreased activity.
E F
A B
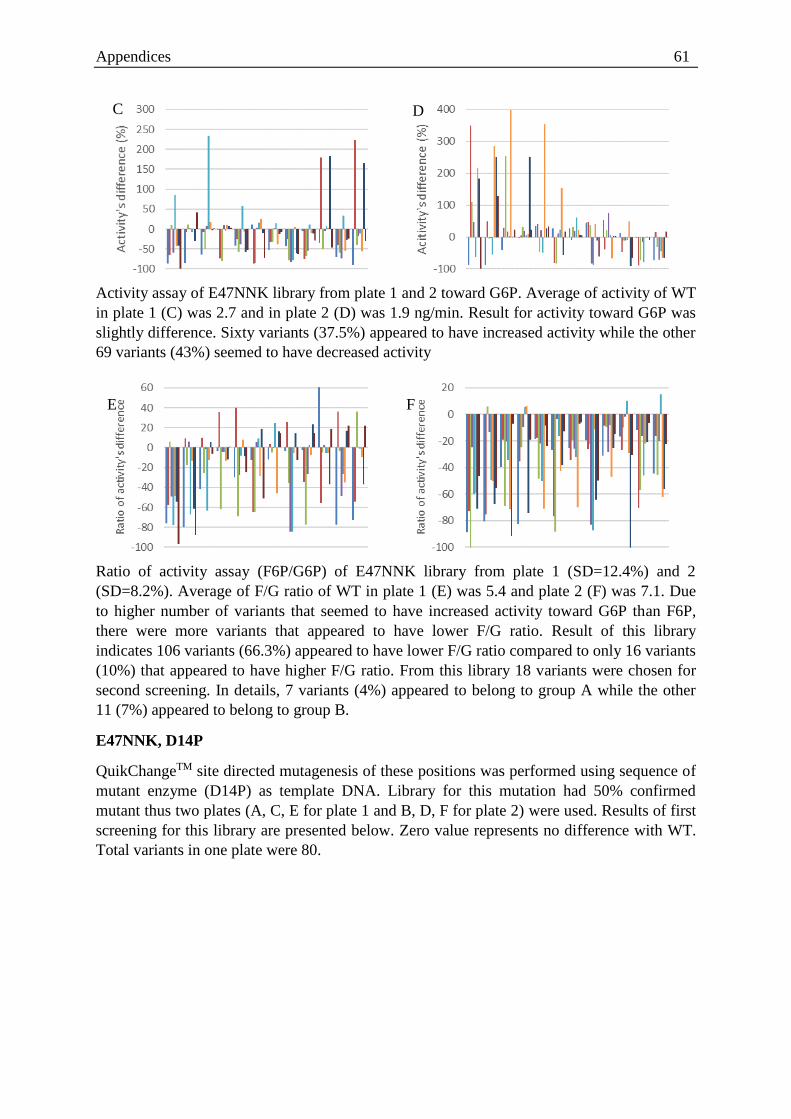
Appendices 61
Activity assay of E47NNK library from plate 1 and 2 toward G6P. Average of activity of WT
in plate 1 (C) was 2.7 and in plate 2 (D) was 1.9 ng/min. Result for activity toward G6P was
slightly difference. Sixty variants (37.5%) appeared to have increased activity while the other
69 variants (43%) seemed to have decreased activity
Ratio of activity assay (F6P/G6P) of E47NNK library from plate 1 (SD=12.4%) and 2
(SD=8.2%). Average of F/G ratio of WT in plate 1 (E) was 5.4 and plate 2 (F) was 7.1. Due
to higher number of variants that seemed to have increased activity toward G6P than F6P,
there were more variants that appeared to have lower F/G ratio. Result of this library
indicates 106 variants (66.3%) appeared to have lower F/G ratio compared to only 16 variants
(10%) that appeared to have higher F/G ratio. From this library 18 variants were chosen for
second screening. In details, 7 variants (4%) appeared to belong to group A while the other
11 (7%) appeared to belong to group B.
E47NNK, D14P
QuikChangeTM site directed mutagenesis of these positions was performed using sequence of
mutant enzyme (D14P) as template DNA. Library for this mutation had 50% confirmed
mutant thus two plates (A, C, E for plate 1 and B, D, F for plate 2) were used. Results of first
screening for this library are presented below. Zero value represents no difference with WT.
Total variants in one plate were 80.
C D
E F

Appendices 62
Activity assay of E47NNK, D14P library from plate 1 (SD=9.8%) and 2 (SD=8.7%) toward
F6P. Average of activity of WT in plate 1 (A) was 15.5 and in plate 2 (B) was 15.1 ng/min.
Additional mutation at position 14 (D14P) to 47’s library apparently decreased the activity of
enzyme. There were no variants that appeared to have higher activity than wild type, rather
all variants from this library showed decreased activity toward F6P
Activity assay of E47NNK, D14P library from plate 1 (SD=6.5%) and 2 (SD=9.9%) toward
G6P. Average of activity of WT in plate 1 (C) was 3.6 and in plate 2 (D) was 3.3 ng/min.
Similar result was found for G6P. There were only 3 variants (1.9%) that seemed to increase
activity toward G6P while others show apparent decreased activity.
Ratio of activity assay (F6P/G6P) of E47NNK, D14P library from plate 1 (SD=12%) and 2
(SD=10.1%). Average of F/G ratio of WT in plate 1 (E) was 4.2 and plate 2 (F) was 4.6.
Although variants from this library almost all showed decreased activity toward both
substrates. The effect is not the same for every variant. Results (E and F) show 53 variants
(33.1%) appeared to have higher F/G ratio while 72 variants (45%) appeared to have lower
F/G ratio. Higher F/G ratio for variants that have decreased activity toward F6P and G6P
means that the decrease of activity is much higher for G6P than F6P. Due to no positive
A B
C D
E F
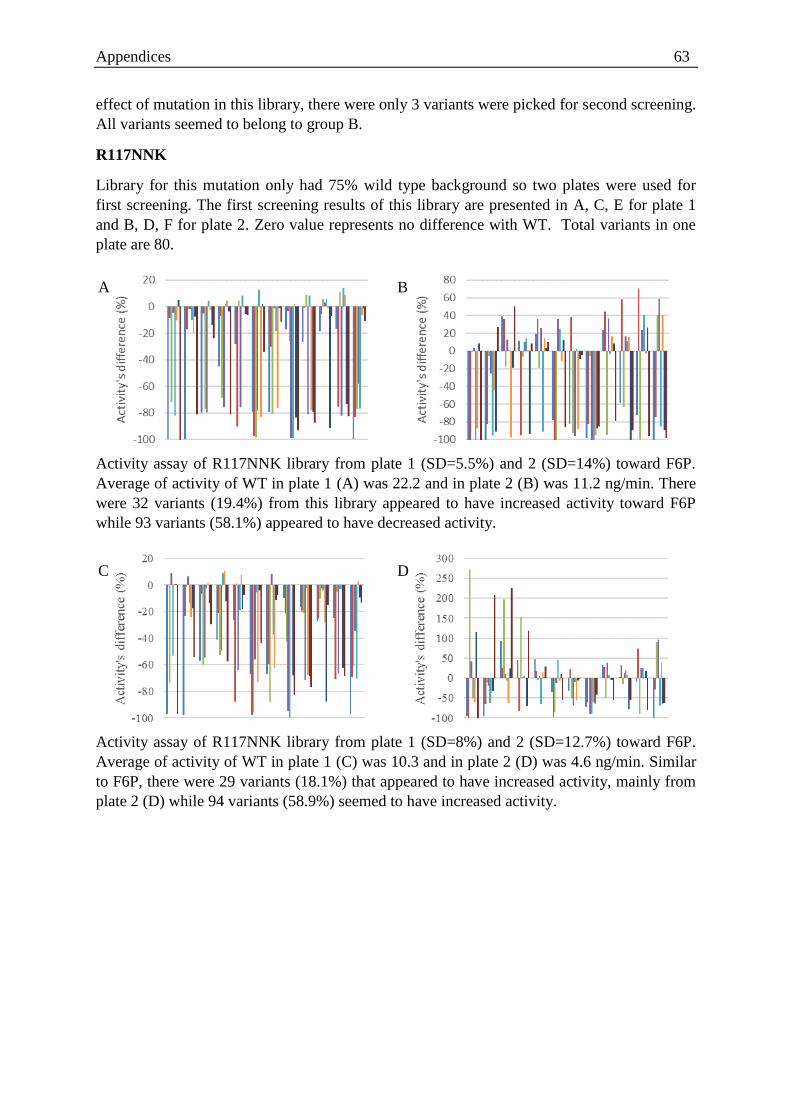
Appendices 63
effect of mutation in this library, there were only 3 variants were picked for second screening.
All variants seemed to belong to group B.
R117NNK
Library for this mutation only had 75% wild type background so two plates were used for
first screening. The first screening results of this library are presented in A, C, E for plate 1
and B, D, F for plate 2. Zero value represents no difference with WT. Total variants in one
plate are 80.
Activity assay of R117NNK library from plate 1 (SD=5.5%) and 2 (SD=14%) toward F6P.
Average of activity of WT in plate 1 (A) was 22.2 and in plate 2 (B) was 11.2 ng/min. There
were 32 variants (19.4%) from this library appeared to have increased activity toward F6P
while 93 variants (58.1%) appeared to have decreased activity.
Activity assay of R117NNK library from plate 1 (SD=8%) and 2 (SD=12.7%) toward F6P.
Average of activity of WT in plate 1 (C) was 10.3 and in plate 2 (D) was 4.6 ng/min. Similar
to F6P, there were 29 variants (18.1%) that appeared to have increased activity, mainly from
plate 2 (D) while 94 variants (58.9%) seemed to have increased activity.
A B
C D
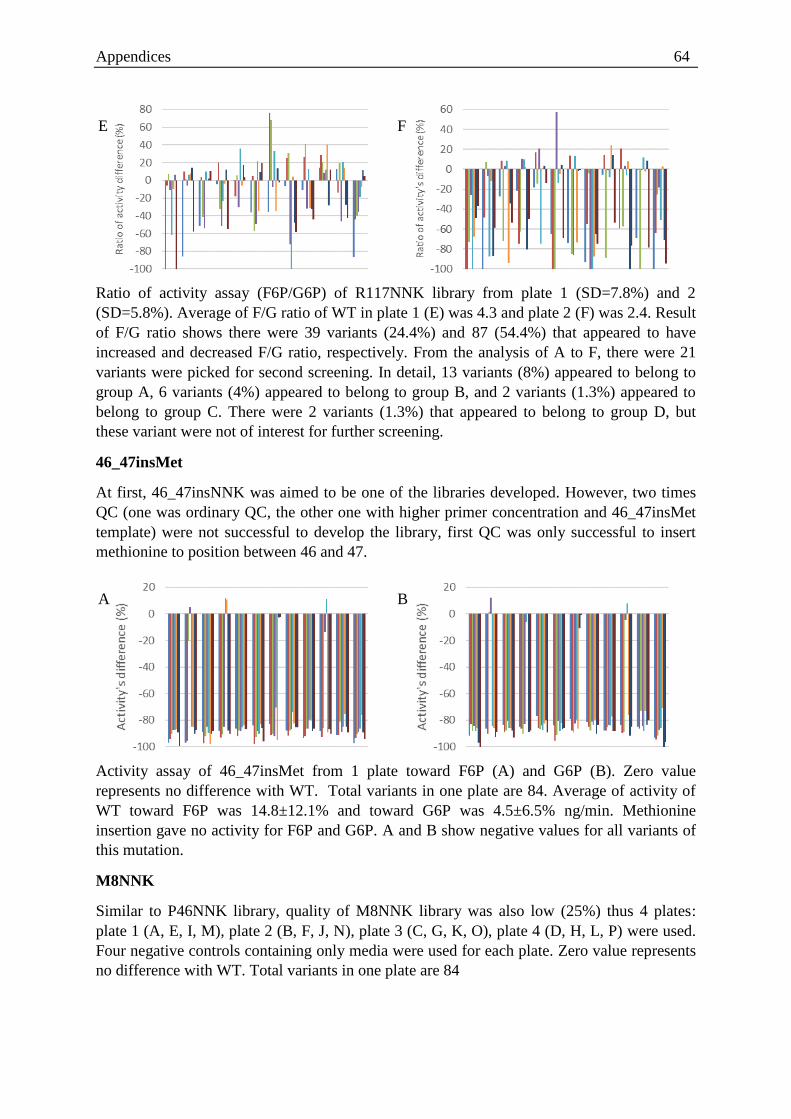
Appendices 64
Ratio of activity assay (F6P/G6P) of R117NNK library from plate 1 (SD=7.8%) and 2
(SD=5.8%). Average of F/G ratio of WT in plate 1 (E) was 4.3 and plate 2 (F) was 2.4. Result
of F/G ratio shows there were 39 variants (24.4%) and 87 (54.4%) that appeared to have
increased and decreased F/G ratio, respectively. From the analysis of A to F, there were 21
variants were picked for second screening. In detail, 13 variants (8%) appeared to belong to
group A, 6 variants (4%) appeared to belong to group B, and 2 variants (1.3%) appeared to
belong to group C. There were 2 variants (1.3%) that appeared to belong to group D, but
these variant were not of interest for further screening.
46_47insMet
At first, 46_47insNNK was aimed to be one of the libraries developed. However, two times
QC (one was ordinary QC, the other one with higher primer concentration and 46_47insMet
template) were not successful to develop the library, first QC was only successful to insert
methionine to position between 46 and 47.
Activity assay of 46_47insMet from 1 plate toward F6P (A) and G6P (B). Zero value
represents no difference with WT. Total variants in one plate are 84. Average of activity of
WT toward F6P was 14.8±12.1% and toward G6P was 4.5±6.5% ng/min. Methionine
insertion gave no activity for F6P and G6P. A and B show negative values for all variants of
this mutation.
M8NNK
Similar to P46NNK library, quality of M8NNK library was also low (25%) thus 4 plates:
plate 1 (A, E, I, M), plate 2 (B, F, J, N), plate 3 (C, G, K, O), plate 4 (D, H, L, P) were used.
Four negative controls containing only media were used for each plate. Zero value represents
no difference with WT. Total variants in one plate are 84
E F
A B
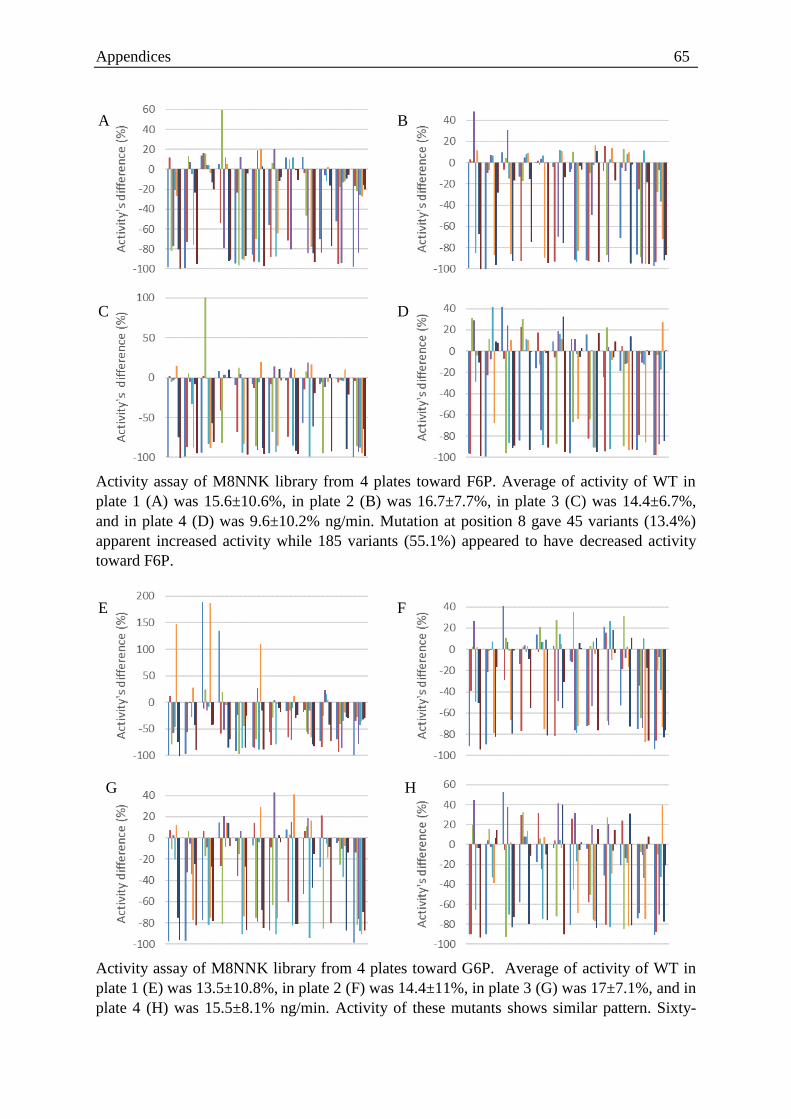
Appendices 65
Activity assay of M8NNK library from 4 plates toward F6P. Average of activity of WT in
plate 1 (A) was 15.6±10.6%, in plate 2 (B) was 16.7±7.7%, in plate 3 (C) was 14.4±6.7%,
and in plate 4 (D) was 9.6±10.2% ng/min. Mutation at position 8 gave 45 variants (13.4%)
apparent increased activity while 185 variants (55.1%) appeared to have decreased activity
toward F6P.
Activity assay of M8NNK library from 4 plates toward G6P. Average of activity of WT in
plate 1 (E) was 13.5±10.8%, in plate 2 (F) was 14.4±11%, in plate 3 (G) was 17±7.1%, and in
plate 4 (H) was 15.5±8.1% ng/min. Activity of these mutants shows similar pattern. Sixty-
A B
C D
E F
G H
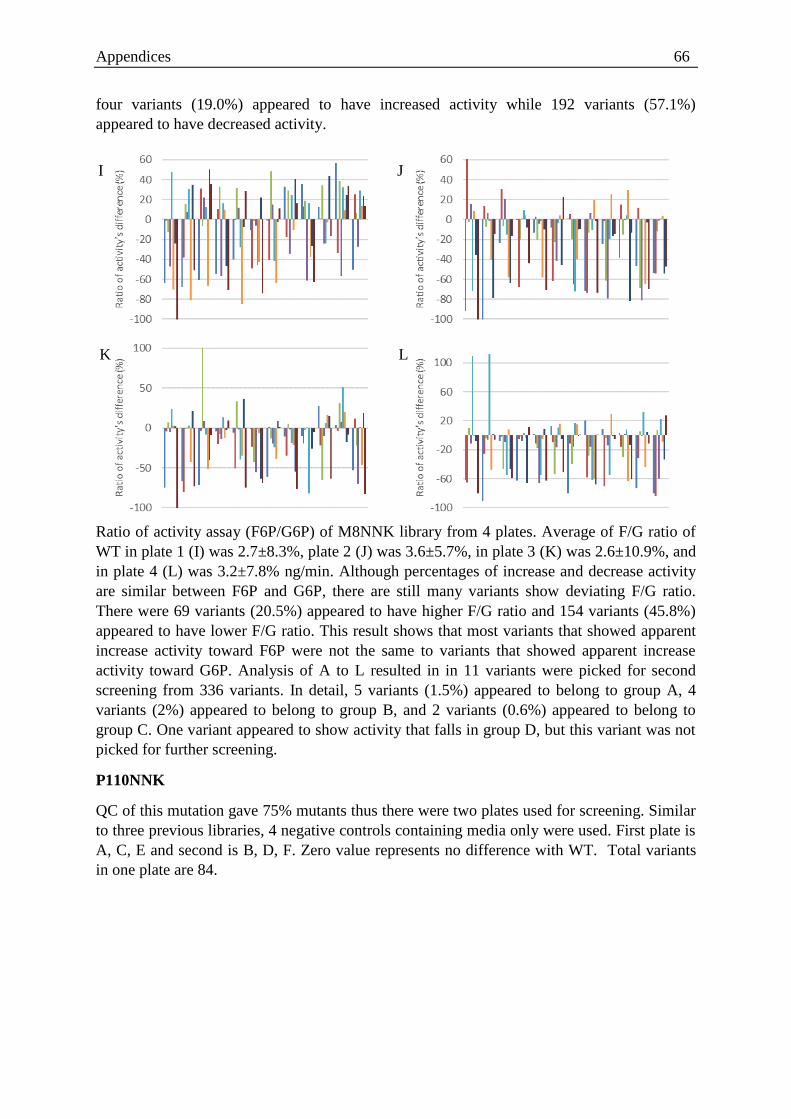
Appendices 66
four variants (19.0%) appeared to have increased activity while 192 variants (57.1%)
appeared to have decreased activity.
Ratio of activity assay (F6P/G6P) of M8NNK library from 4 plates. Average of F/G ratio of
WT in plate 1 (I) was 2.7±8.3%, plate 2 (J) was 3.6±5.7%, in plate 3 (K) was 2.6±10.9%, and
in plate 4 (L) was 3.2±7.8% ng/min. Although percentages of increase and decrease activity
are similar between F6P and G6P, there are still many variants show deviating F/G ratio.
There were 69 variants (20.5%) appeared to have higher F/G ratio and 154 variants (45.8%)
appeared to have lower F/G ratio. This result shows that most variants that showed apparent
increase activity toward F6P were not the same to variants that showed apparent increase
activity toward G6P. Analysis of A to L resulted in in 11 variants were picked for second
screening from 336 variants. In detail, 5 variants (1.5%) appeared to belong to group A, 4
variants (2%) appeared to belong to group B, and 2 variants (0.6%) appeared to belong to
group C. One variant appeared to show activity that falls in group D, but this variant was not
picked for further screening.
P110NNK
QC of this mutation gave 75% mutants thus there were two plates used for screening. Similar
to three previous libraries, 4 negative controls containing media only were used. First plate is
A, C, E and second is B, D, F. Zero value represents no difference with WT. Total variants
in one plate are 84.
I J
K L
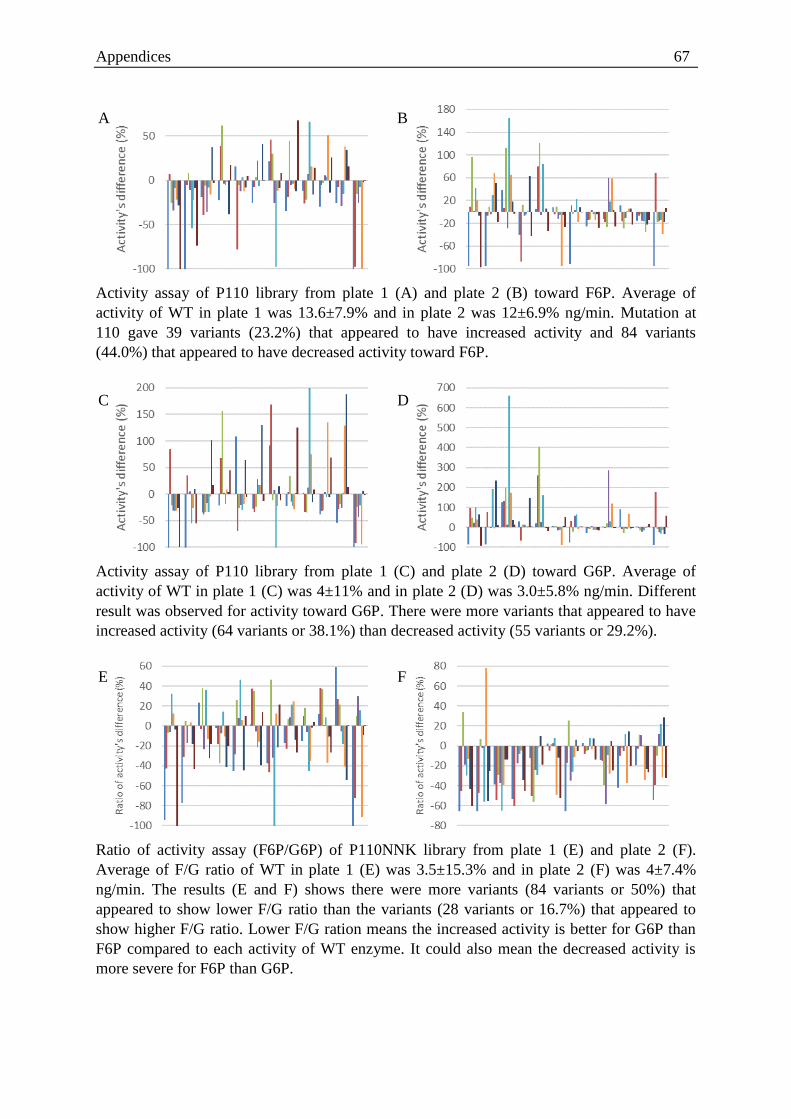
Appendices 67
Activity assay of P110 library from plate 1 (A) and plate 2 (B) toward F6P. Average of
activity of WT in plate 1 was 13.6±7.9% and in plate 2 was 12±6.9% ng/min. Mutation at
110 gave 39 variants (23.2%) that appeared to have increased activity and 84 variants
(44.0%) that appeared to have decreased activity toward F6P.
Activity assay of P110 library from plate 1 (C) and plate 2 (D) toward G6P. Average of
activity of WT in plate 1 (C) was 4±11% and in plate 2 (D) was 3.0±5.8% ng/min. Different
result was observed for activity toward G6P. There were more variants that appeared to have
increased activity (64 variants or 38.1%) than decreased activity (55 variants or 29.2%).
Ratio of activity assay (F6P/G6P) of P110NNK library from plate 1 (E) and plate 2 (F).
Average of F/G ratio of WT in plate 1 (E) was 3.5±15.3% and in plate 2 (F) was 4±7.4%
ng/min. The results (E and F) shows there were more variants (84 variants or 50%) that
appeared to show lower F/G ratio than the variants (28 variants or 16.7%) that appeared to
show higher F/G ratio. Lower F/G ration means the increased activity is better for G6P than
F6P compared to each activity of WT enzyme. It could also mean the decreased activity is
more severe for F6P than G6P.
A B
C D
E F

Appendices 68
In total only 4 variants were picked for second screening. Two of them appeared to belong to
group A and the remaining appeared to belong to group B and C each. Subsequent analysis
shows that there were 24 variants (14%) that appeared to belong to group D. These variants
were not considered for further screening.
Appendix 3.2 Second screening
E47NNK
There were 18 variants were picked for this library. The result of the screening is presented in
below
Result of second screening from variants picked from first screening of E47NNK library.
Arrows represents variants that were picked for third screening. In general, result above
shows there were no significant different based on F/G ratio amongst variants. E47X.17
variant showed slight increase in F/G ratio but its activity toward F6P decreased so this
variant was not a good candidate for further screening. Analysis for second screening was
then based on assumption that there is possibility if one colony that had been picked from
first screening bearing more than one type of plasmid thus that colony would develop to more
than one type of cell producing different kind of mutant enzymes. With this assumption, each
replicate of each variant from this second screening could be different cells producing
different mutant enzymes thus variants that showed high standard deviation were of interest.
One replicate from E47X.4 and E47X.9 appeared to belong to group A. From previous
screening E47X.4 appeared to belong to group B while E47X.9 appeared to belong to group
A. Other replicate from E47X.10 and E47X.18 were of interest too as it appeared to belong to
group B and C respectively. In previous screening, E47X.10 appeared to be in group B while
E47X.18 appeared to be in group C. This result shows there was change between first and
second screening.
Y19NNK, E47NNK & D14P
There were 22 variants from Y19NNK library and 3 variants from E47NNK & D14P were
picked from first screening. The result of second screening is presented below
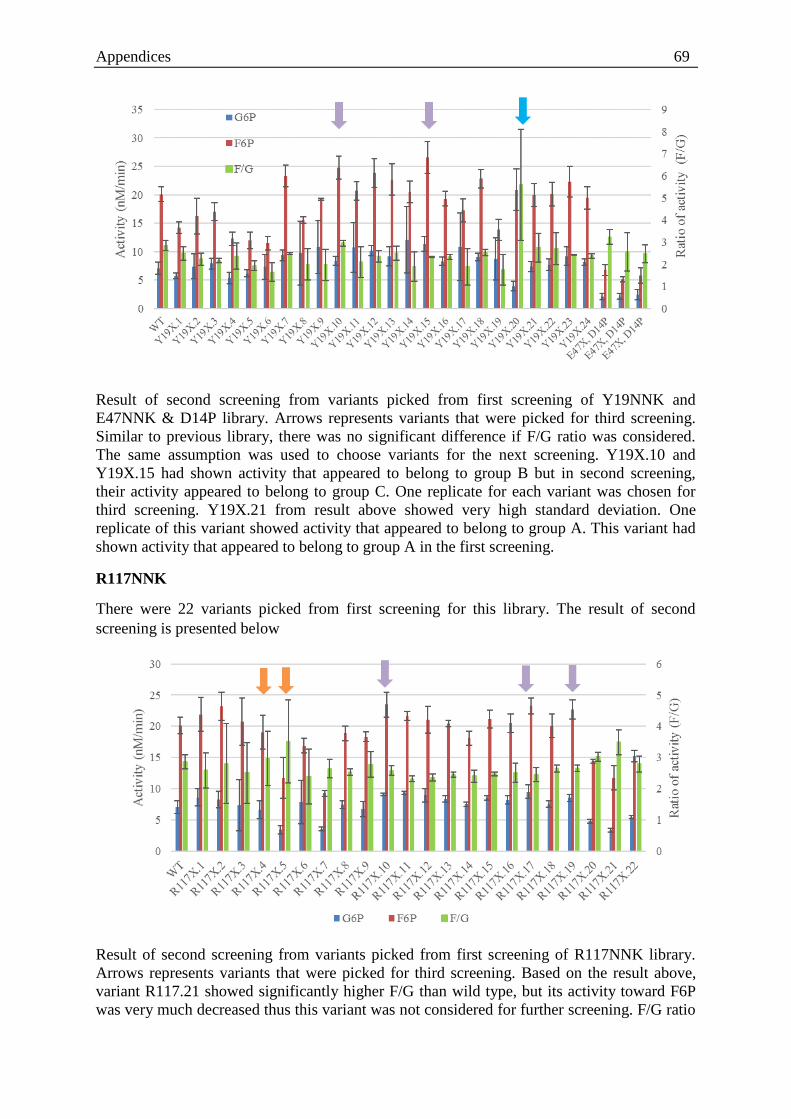
Appendices 69
Result of second screening from variants picked from first screening of Y19NNK and
E47NNK & D14P library. Arrows represents variants that were picked for third screening.
Similar to previous library, there was no significant difference if F/G ratio was considered.
The same assumption was used to choose variants for the next screening. Y19X.10 and
Y19X.15 had shown activity that appeared to belong to group B but in second screening,
their activity appeared to belong to group C. One replicate for each variant was chosen for
third screening. Y19X.21 from result above showed very high standard deviation. One
replicate of this variant showed activity that appeared to belong to group A. This variant had
shown activity that appeared to belong to group A in the first screening.
R117NNK
There were 22 variants picked from first screening for this library. The result of second
screening is presented below
Result of second screening from variants picked from first screening of R117NNK library.
Arrows represents variants that were picked for third screening. Based on the result above,
variant R117.21 showed significantly higher F/G than wild type, but its activity toward F6P
was very much decreased thus this variant was not considered for further screening. F/G ratio

Appendices 70
of other variants seemed to not have significant difference with wildtype. As a result, the
same assumption as mentioned earlier was used to pick promising variants for further
screening. One replicate of R117X.4 and R117X.5 appeared to have activity that belongs to
group B thus these variants were picked for further screening. All of them appeared to belong
to group B in the first screening. One replicate from R117X.10, R117X.17, and R117.19
appeared to show activity that belong to group C. In the first screening each of them belong
to group A, C, B respectively. Only the replicate from variant R117X.17 appeared to show
constant behaviour.
M8NNK, P110NNK
There were 11 variants picked from first screening for M8NNK library and 4 variants from
P110NNK library. The result is presented below
Result of second screening from variants picked from first screening of M8NNK and P110X
library. Arrows represents variants that were picked for third screening. Variant M8X.1 and
M8X.3 showed higher F/G ratio than wild type. Both of them also showed increased activity
toward F6P thus they were of interest for further screening. In the first screening, both of
them appeared to belong to group C. However, in the second screening, M8X.1 showed
activity that appeared to belong to group A. P110X.3 variant showed slightly higher F/G
ratio, this variant was chosen for the third screening although these variants showed
decreased activity toward F6P.
Appendix 3.3 Third screening
This step was to make sure there were no either cells bearing more than one type of mutant
enzymes or different cells observed as one activity in one well. This step included plasmid
purification and transformation to eliminate those two possibilities.
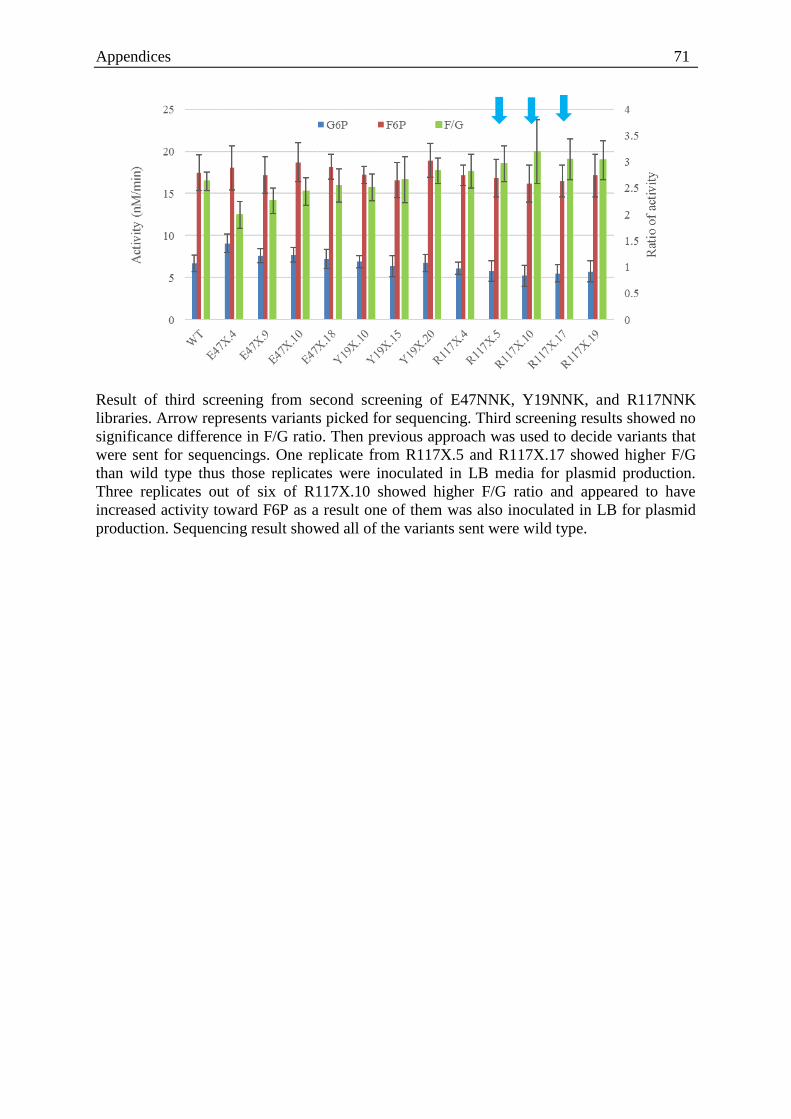
Appendices 71
Result of third screening from second screening of E47NNK, Y19NNK, and R117NNK
libraries. Arrow represents variants picked for sequencing. Third screening results showed no
significance difference in F/G ratio. Then previous approach was used to decide variants that
were sent for sequencings. One replicate from R117X.5 and R117X.17 showed higher F/G
than wild type thus those replicates were inoculated in LB media for plasmid production.
Three replicates out of six of R117X.10 showed higher F/G ratio and appeared to have
increased activity toward F6P as a result one of them was also inoculated in LB for plasmid
production. Sequencing result showed all of the variants sent were wild type.

Appendices 72
Appendix 5 Biochemistry data
5.1 Standard curve for malachite green (P I assay)
100 μM corresponds to 2 nmol (20 μl of sample used).
5.2 Standard curve for ascorbic acid based method (PII assay)
5 mM corresponds to 150 nmol (30 μl of sample used).
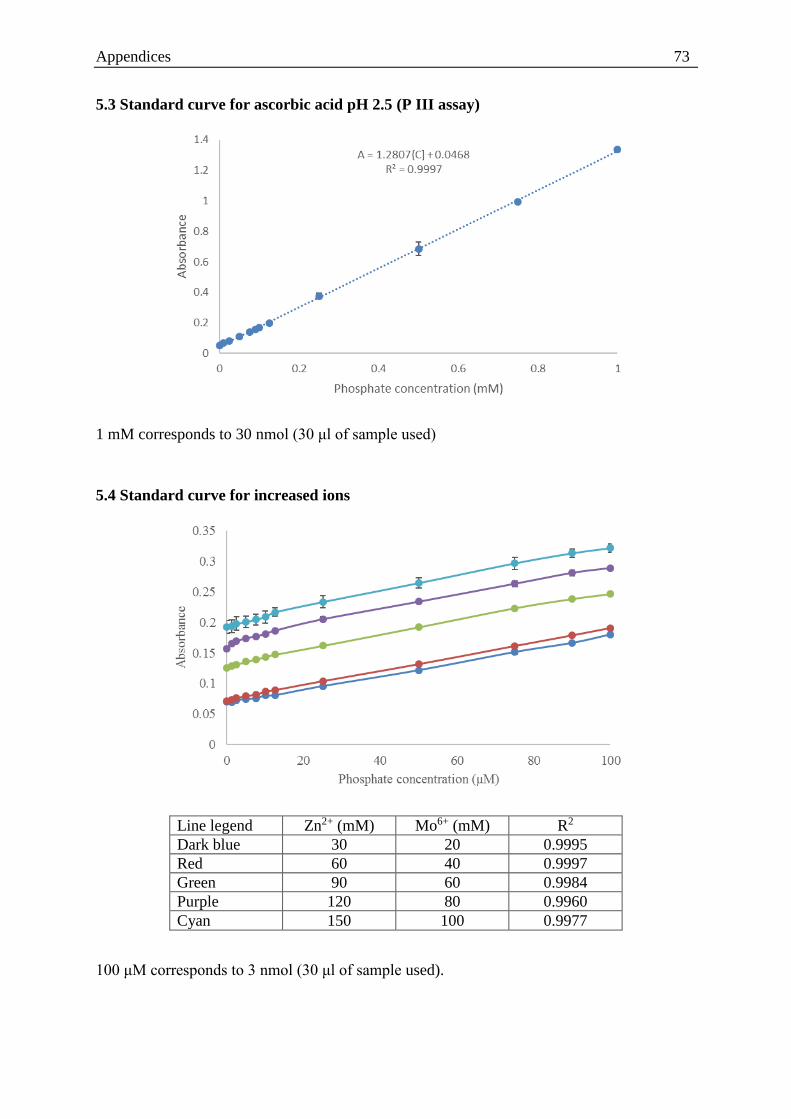
Appendices 73
5.3 Standard curve for ascorbic acid pH 2.5 (P III assay)
1 mM corresponds to 30 nmol (30 μl of sample used)
5.4 Standard curve for increased ions
Line legend Zn2+ (mM) Mo6+ (mM) R2
Dark blue 30 20 0.9995
Red 60 40 0.9997
Green 90 60 0.9984
Purple 120 80 0.9960
Cyan 150 100 0.9977
100 μM corresponds to 3 nmol (30 μl of sample used).