Embed Size (px)
Citation preview
Pag
e 1
utd
alla
s.edu
/~m
etin
1
Environmentally Friendly SCs
Pag
e 2
utd
alla
s.edu
/~m
etin
Outline
Sustainability
Environmentally Conscious SCM = ECSCM – Operations
– Product Design
– Sourcing
Reverse Logistics
Directives and Standards

Pag
e 3
utd
alla
s.edu
/~m
etin
Sustainability vs. Environmental Impact
Does your company define sustainability? (sample size 138 respondents)
– 67% Yes among Large companies, >$1000 M annual sales
– 47% Yes among Medium companies, $100 M < • < $1000 M annual sales
– 33% Yes among Small companies, <$100 M annual sales
What do companies include within sustainability? (ss 62 respondents)
– 84% Environmental Impact
– 76% Social Responsibility (child labor, inhumane working conditions)
– 69% Business Process Improvement
– 65% Health & Safety
– 53% Ethics
Conclusion: Companies often equate sustainability to environmental impact.
Above questions come from “Environmental Sustainability Benchmark Study: Leaders Prepare for the
“Greening” Supply Chain” by J. Blaeser. Published by American Shipper www.americanshipper.com in Feb 2011. This document is referred to as Sustainability Survey in the remainder. Respondents were about 200 shippers and third party logistics providers. 36% in 3PL; 23% in Retail/Wholesale; 29 % in Manufacturing, and so on.
Pag
e 4
utd
alla
s.edu
/~m
etin
Compete on Environment
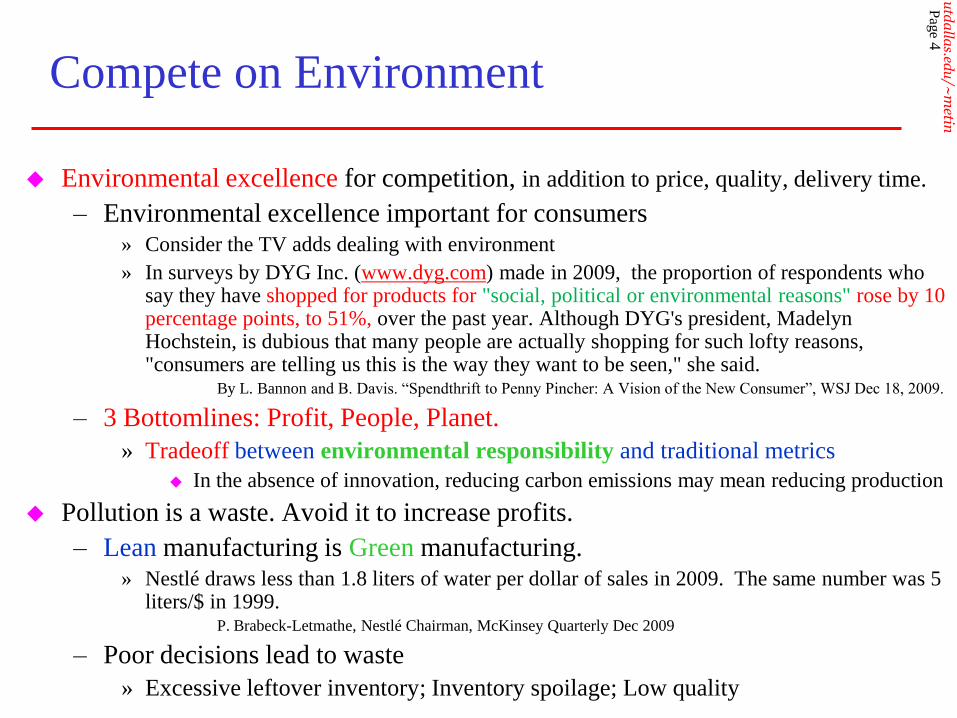
Environmental excellence for competition, in addition to price, quality, delivery time.
– Environmental excellence important for consumers » Consider the TV adds dealing with environment
» In surveys by DYG Inc. (www.dyg.com) made in 2009, the proportion of respondents who say they have shopped for products for "social, political or environmental reasons" rose by 10 percentage points, to 51%, over the past year. Although DYG's president, Madelyn Hochstein, is dubious that many people are actually shopping for such lofty reasons, "consumers are telling us this is the way they want to be seen," she said.
By L. Bannon and B. Davis. ―Spendthrift to Penny Pincher: A Vision of the New Consumer‖, WSJ Dec 18, 2009.
– 3 Bottomlines: Profit, People, Planet.
» Tradeoff between environmental responsibility and traditional metrics
In the absence of innovation, reducing carbon emissions may mean reducing production
Pollution is a waste. Avoid it to increase profits.
– Lean manufacturing is Green manufacturing. » Nestlé draws less than 1.8 liters of water per dollar of sales in 2009. The same number was 5
liters/$ in 1999. P. Brabeck-Letmathe, Nestlé Chairman, McKinsey Quarterly Dec 2009
– Poor decisions lead to waste
» Excessive leftover inventory; Inventory spoilage; Low quality

Pag
e 5
utd
alla
s.edu
/~m
etin
ECSCM
1. Internal Operations
Environmentally conscious manufacturing
– Sony’s ―care for the environment‖ program » Reduced material use, Energy savings, Shorter product disassembly times, Increased
recyclability.
» Reduced use of harmful substances: Keep a database of all environmentally sensitive materials used in production
Environmentally conscious transportation
– Nestlé’s efficient supply chain explained by chairman P. Brabeck-Letmathe in
McKinsey Quarterly Dec 2009:
» In a traditional milk supply chain—with open, uncooled containers from farm to consumer,
on oxcarts or bikes — losses of milk are on the order of 16-27%. When Nestlé collects milk
directly from farmers and uses refrigerated trucks to transport it, these losses go down to less
than 0.6%. Based on the total amount of milk Nestlé purchases directly each year in
countries such as Pakistan, India, and China (that is, in relatively difficult climatic
conditions) and further on the average water requirements for producing milk on farms, this
reduction in waste means saving 815*106 - 1,375*106 m3 water per year. … the positive
impact of our efficient supply chain for milk happens to be greatest in countries where the
water situation is most dire.

Pag
e 6
utd
alla
s.edu
/~m
etin
ECSCM
1. Internal Operations
Accounting and Goal setting for the environment
– Measuring the benefit of environmentally sound management » ECSCM Metrics: Energy savings; Carbon footprint
– Herman Miller, a furniture manufacturer, monitors » gallons of oil used,
» number of trees cut,
» wasted fabric, foam, leather, paper and polyvinyl film.
– A Korean consumer products company, received $30M fine for non-compliance, is implementing an environmental program with quantitative goals

Pag
e 7
utd
alla
s.edu
/~m
etin
ECSCM
2. Product Design
Lighter PET (polyethylene terephthalate) bottles used by water bottlers: Aquafina, Dasani and Nestle.
UTD Business idea competition in 2007: MBA students Sriram Jayaram and Ritesh Shah created ―Hara
Bhara‖ environmentally friendly tableware made of leaves. Hara Bhara means ―Go Green‖ in Hindi.
A high-end furniture manufacturer worked with its paint supplier to eliminate solvent-based painting. They developed water-based and powder-based paints, which requires no solvents for cleanup. 3M also adapted water based coatings.
Pag
e 8
utd
alla
s.edu
/~m
etin
ECSCM
2. Product Design
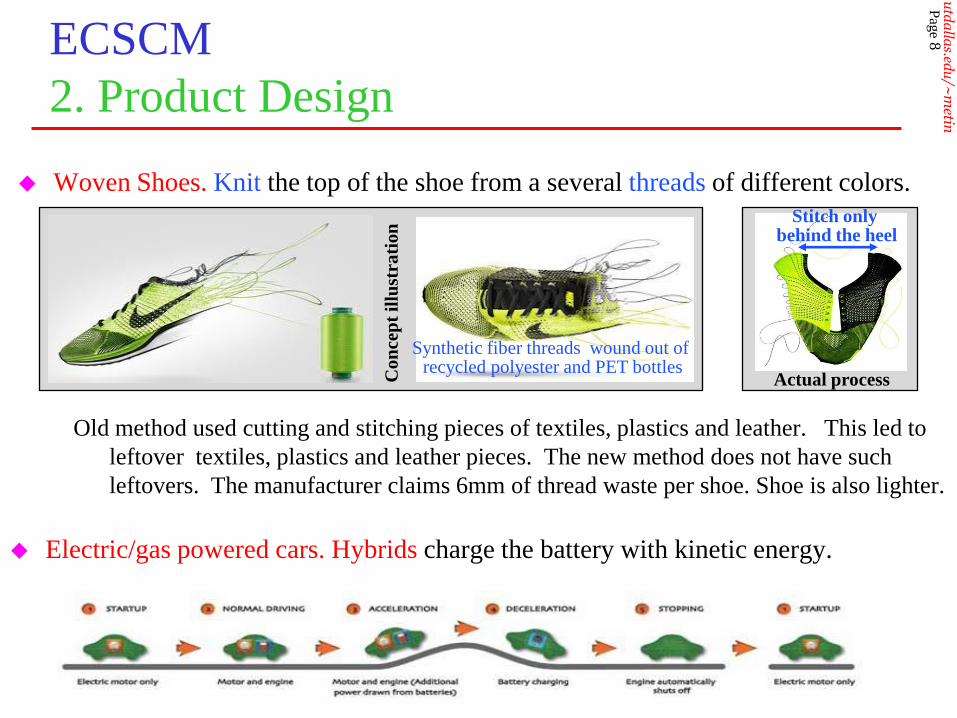
Electric/gas powered cars. Hybrids charge the battery with kinetic energy.
Woven Shoes. Knit the top of the shoe from a several threads of different colors.
Old method used cutting and stitching pieces of textiles, plastics and leather. This led to
leftover textiles, plastics and leather pieces. The new method does not have such
leftovers. The manufacturer claims 6mm of thread waste per shoe. Shoe is also lighter.
Co
nce
pt
illu
stra
tion
Actual process
Stitch only behind the heel
Synthetic fiber threads wound out of recycled polyester and PET bottles

Pag
e 9
utd
alla
s.edu
/~m
etin
ECSCM
3. Sourcing
Integrate ―green‖ measures into strategies?
– Transportation of hazardous materials (gasses, explosives) » Away from public places, as fast as possible
» Haz(ardous) Mat(erials) transportation received big attention after 9/11. Dow corporation realized that environmental hazards happen not in manufacture but in transportation. It spent over $800 M to educate drivers about emergencies.
– Price of resources » Air: Locally scarce resource. What is the cost $$ of reversing a typical burning reaction?
From forward CH4 + 2O2 CO2 + 2H2O + $$ to reverse CO2 + 2H2O + $$ CH4 + 2O2
» Water: Regionally scarce but subsidized for farmers. What is the cost of replenishing water?
Examine environmentally sensitive components
List components / suppliers – Whole Foods stops selling some fishes (gray sole and skate)
and restricts others (Atlantic code if caught with trawlers) – Cathay Pacific stops carrying unsustainably sourced shark
and related products (e.g., shark fin used in soups). – Environmental record, previous fines, databases; Towards a
―green score‖ for each company like credit score for individuals.
» Chrysler, Quad Graphics, Baxter and AT&T have a database of ―green‖
measures for their major suppliers

Pag
e 10
utd
alla
s.edu
/~m
etin
ECSCM
3. Sourcing. Water as a Resource
Public utilities deliver more than 80% of USA’s water to residential / industrial
consumers and issue billions of dollars’ worth of bonds to fund infrastructure.
Few participants in the bond market (investors, bond rating agencies, utilities) are
accounting for growing water scarcity, legal conflicts and other threats.
How much does the water cost? 1000 gallons cost $2 in Plano. http://plano.gov/Departments/CUS/General_Information/Pages/water_sewer_rates.aspx. The same amount costs
$2.88 in Las Vegas; $5.28 in Atlanta; $7.60 in Seattle. Atlanta has 10 times more rainfall than Las
Vegas and it rains everyday in Seattle. The cost of water does not reflect its scarcity.
States are fighting for water rights.
– Colorado River Basin
– Apalachicola-Chattahoochee-Flint (ACF) River Basin
– Red River Basin
Risks: Amount of water and Quality of water.
Utilities do not account for risks properly when issuing bonds!
Pag
e 11
utd
alla
s.edu
/~m
etin
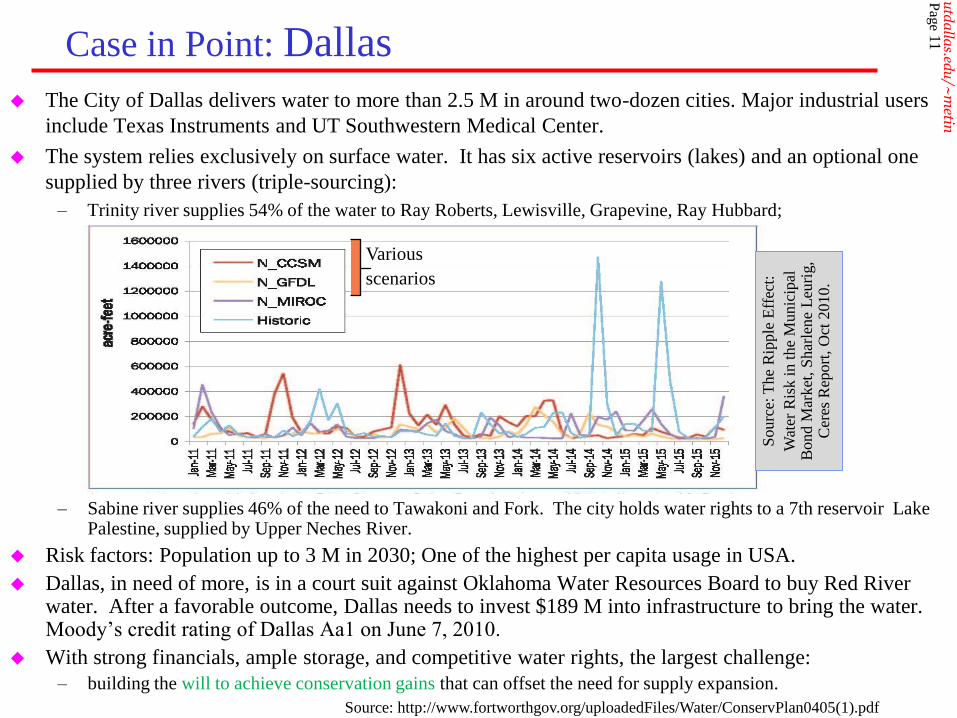
Case in Point: Dallas
The City of Dallas delivers water to more than 2.5 M in around two-dozen cities. Major industrial users
include Texas Instruments and UT Southwestern Medical Center.
The system relies exclusively on surface water. It has six active reservoirs (lakes) and an optional one
supplied by three rivers (triple-sourcing):
– Trinity river supplies 54% of the water to Ray Roberts, Lewisville, Grapevine, Ray Hubbard;
– Sabine river supplies 46% of the need to Tawakoni and Fork. The city holds water rights to a 7th reservoir Lake Palestine, supplied by Upper Neches River.
Risk factors: Population up to 3 M in 2030; One of the highest per capita usage in USA.
Dallas, in need of more, is in a court suit against Oklahoma Water Resources Board to buy Red River water. After a favorable outcome, Dallas needs to invest $189 M into infrastructure to bring the water. Moody’s credit rating of Dallas Aa1 on June 7, 2010.
With strong financials, ample storage, and competitive water rights, the largest challenge:
– building the will to achieve conservation gains that can offset the need for supply expansion.
Source: http://www.fortworthgov.org/uploadedFiles/Water/ConservPlan0405(1).pdf
Various
scenarios
Sourc
e: T
he
Rip
ple
Eff
ect:
Wat
er R
isk i
n t
he
Munic
ipal
B
ond M
arket
, S
har
lene
Leu
rig,
Cer
es R
eport
, O
ct 2
010.

Pag
e 12
utd
alla
s.edu
/~m
etin
Another Case in Point: Forth Worth (Tarrant County)
The Tarrant Regional Water District delivers water to more than 1.8 M in around 40
municipalities. Major industrial user is Brazos Electric Power Cooperative.
The Tarrant water system relies exclusively on surface water. It has five active reservoirs
(lakes). All supplied by a single river (single-sourcing).
– Trinity river supplies 100% of the water need to Bridgeport, Eagle-Mountain, Benbrook, Cedar
Creek, Richland-Chambers.
Single sourcing implies higher scarcity score than Dallas.
Tarrant per capita water usage is 30% less than that of Dallas.
Tarrant (along with Dallas) wants to buy more resources and is in a court suit against
Oklahoma Water Resources Board to buy Red River water. After a favorable outcome,
Tarrant needs to invest $ 441 M into infrastructure to bring the water. Moody’s credit rating
of Tarrant Aa1 on May 7, 2010.
Source: http://www.fortworthgov.org/uploadedFiles/Water/ConservPlan0405(1).pdf

Pag
e 13
utd
alla
s.edu
/~m
etin
Integrate measures into strategy?
– Herman Miller works only with suppliers who have forest sustainment
programs
» Forests are divided into lots. Lots are cut cyclically. Cycle may repeat
every 50 years: the same lot is cut once in 50 years.
Continue to monitor suppliers
1 2 3 10 4 5 6 7 8 9
21 22 23 30 24 25 26 27 28 29
20 19 18 11 17 16 15 14 13 12
40 39 38 31 37 36 35 34 33 32
41 42 43 50 44 45 46 47 48 49
ECSCM
3. Sourcing. Forests as Resource

Pag
e 14
utd
alla
s.edu
/~m
etin
Green Tactics
Pag
e 15
utd
alla
s.edu
/~m
etin
Reverse Logistics
Supply Chains are becoming Supply Cycles
Instead of selling goods rent/lease them. When the rented items are
returned, they may need refurbishing so send them to upstream
supply chain (reverse logistics).
At the end of the lease term, the manufacturer is responsible to
collect goods
» Investigated by car manufacturers / tire manufacturers
How many tires are left to decompose in nature in the US every year?
» European companies accept used packaging at the store
Inspection of incoming used products is a challenge
This inspection also provides useful information
Manufacturer can easily recycle used goods
Recycling is a profitable business, one with minimum material costs

Pag
e 16
utd
alla
s.edu
/~m
etin
Closed-loop Supply Chains
Goods are brought back from consumers to suppliers
Closed-loop supply chains as a result of reverse logistics
– 1: Technical remanufacturing. How to best remanufacture/reuse returned items, with little
regard to how they come back or where they go after remanufacturing.
– 2: Valuing reverse logistics. How items coming back to a supplier can create value for that supplier. How to address the front end acquisition of items.
– 3: Coordinating decisions. Marrying the forward supply chain with the reverse supply chain.
– 4: Dynamic decisions over the lifecycle of products. One aspect of this is the need to spend money to make money. Consider a "recycled" computer: one that is only a few weeks old is much more valuable than one that is months old. Investments to increase the speed of the reverse supply chain.
– 5: The final phase of research, which should have been the first one, is: Is there a market?
How can these insights be made more popular in application. – Accounting: how to value the returns
– Marketing: how to handle cannibalism between original and remanufactured products?

Pag
e 17
utd
alla
s.edu
/~m
etin
ISO 14000 - International standards for assessing a firm’s environmental performance
According to ISO 14000 companies can be held accountable for their waste
Standards in three major areas
– Management systems: Systems development and integration of environmental responsibilities into planning
– Operations: Consumption of natural resources and energy
– Environmental systems: Measuring, assessing and managing emissions, effluents, and other waste
The Waste Electrical and Electronic Equipment (WEEE) is a EU directive on recycling regulations became effective in Aug 2005.
Restriction of Hazardous Substances (RoHS) is another legislation that started on July 1, 2006. It limits the amount of several elements that can be used in products. Some examples of hazardous elements are lead, mercury, cadmium.
ISO 14000, WEEE, RoHS
Standards and Directives
Pag
e 18
utd
alla
s.edu
/~m
etin
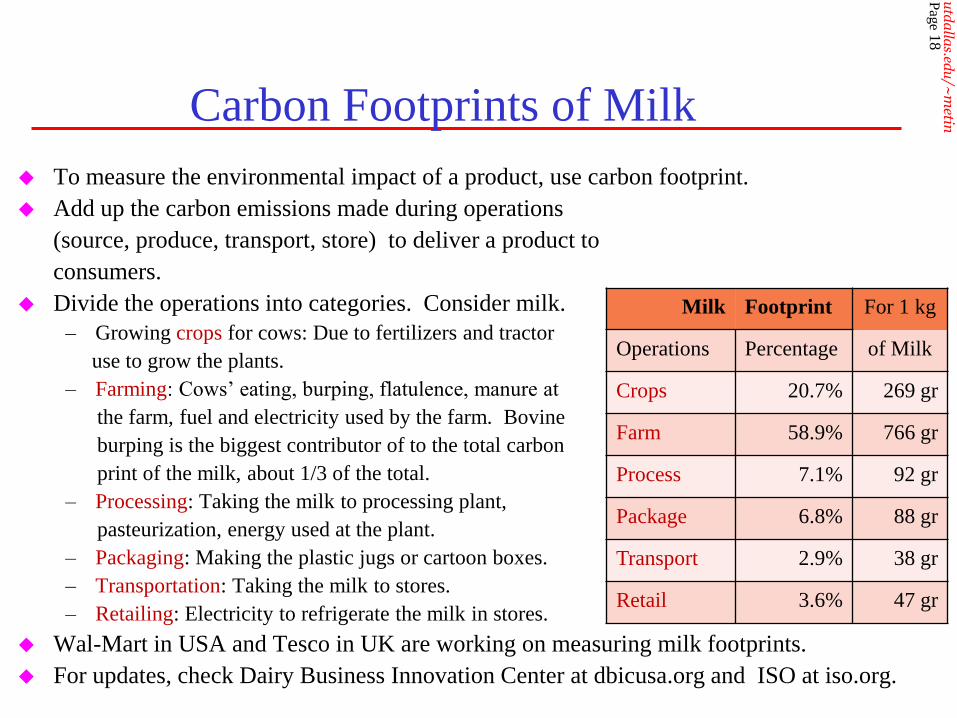
To measure the environmental impact of a product, use carbon footprint.
Add up the carbon emissions made during operations
(source, produce, transport, store) to deliver a product to
consumers.
Divide the operations into categories. Consider milk.
– Growing crops for cows: Due to fertilizers and tractor
use to grow the plants.
– Farming: Cows’ eating, burping, flatulence, manure at
the farm, fuel and electricity used by the farm. Bovine
burping is the biggest contributor of to the total carbon
print of the milk, about 1/3 of the total.
– Processing: Taking the milk to processing plant,
pasteurization, energy used at the plant.
– Packaging: Making the plastic jugs or cartoon boxes.
– Transportation: Taking the milk to stores.
– Retailing: Electricity to refrigerate the milk in stores.
Wal-Mart in USA and Tesco in UK are working on measuring milk footprints.
For updates, check Dairy Business Innovation Center at dbicusa.org and ISO at iso.org.
Carbon Footprints of Milk
Milk Footprint For 1 kg
Operations Percentage of Milk
Crops 20.7% 269 gr
Farm 58.9% 766 gr
Process 7.1% 92 gr
Package 6.8% 88 gr
Transport 2.9% 38 gr
Retail 3.6% 47 gr

Pag
e 19
utd
alla
s.edu
/~m
etin
Carbon footprints for iPhone over its lifetime (about 2 years)
Carbon Footprints of iPhone
iPhone Footprint For 1
Operations Percentage iPhone
Production 45% 24.75 kg
Transportation 5% 2.75 kg
Customer use 49% 26.95 kg
Recycling 1% 0.55 kg
Besides, Apple claims
No arsenic in glass; No brominated flame retardant;
No PVC; No mercury in LCD display
Packaging material made from post-consumer recycled fiberboard and bio-based materials

Pag
e 20
utd
alla
s.edu
/~m
etin
Drivers, ROI and Obstacles for
Sustainability Adoption
Pag
e 21
utd
alla
s.edu
/~m
etin
Summary
Environmentally Conscious SCM = ECSCM – Operations
– Product Design
– Sourcing
Reverse Logistics
Directives and Standards – ISO
– WEEE
– RoHS
– Carbon Footprint
How committed is your industry?
Pag
e 22
utd
alla
s.edu
/~m
etin
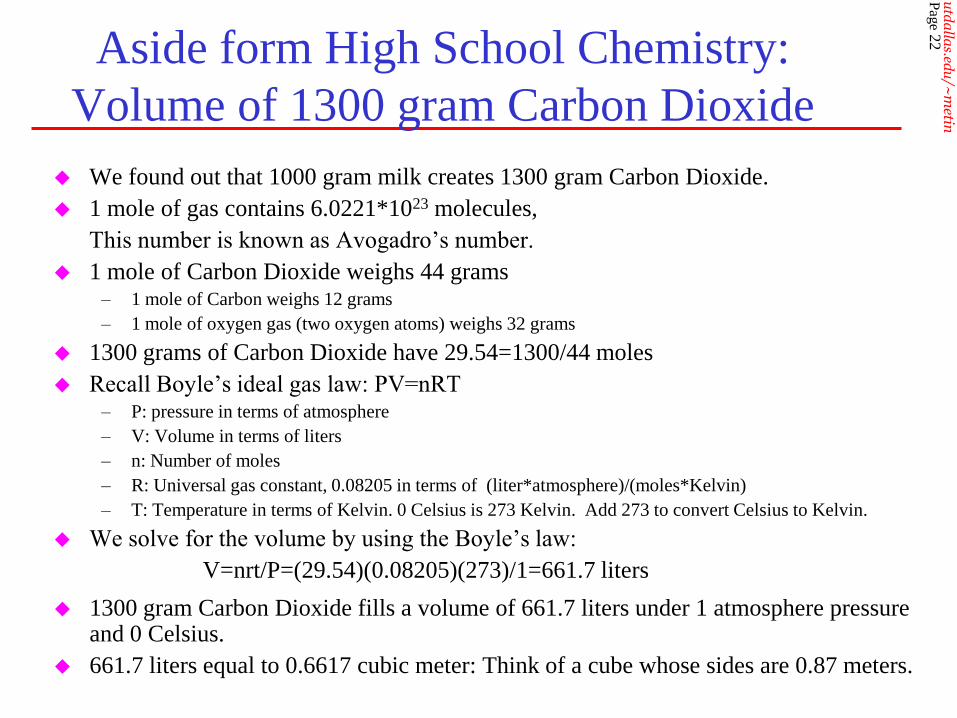
We found out that 1000 gram milk creates 1300 gram Carbon Dioxide.
1 mole of gas contains 6.0221*1023 molecules,
This number is known as Avogadro’s number.
1 mole of Carbon Dioxide weighs 44 grams – 1 mole of Carbon weighs 12 grams
– 1 mole of oxygen gas (two oxygen atoms) weighs 32 grams
1300 grams of Carbon Dioxide have 29.54=1300/44 moles
Recall Boyle’s ideal gas law: PV=nRT – P: pressure in terms of atmosphere
– V: Volume in terms of liters
– n: Number of moles
– R: Universal gas constant, 0.08205 in terms of (liter*atmosphere)/(moles*Kelvin)
– T: Temperature in terms of Kelvin. 0 Celsius is 273 Kelvin. Add 273 to convert Celsius to Kelvin.
We solve for the volume by using the Boyle’s law:
V=nrt/P=(29.54)(0.08205)(273)/1=661.7 liters
Aside form High School Chemistry:
Volume of 1300 gram Carbon Dioxide
1300 gram Carbon Dioxide fills a volume of 661.7 liters under 1 atmosphere pressure and 0 Celsius.
661.7 liters equal to 0.6617 cubic meter: Think of a cube whose sides are 0.87 meters.
Pag
e 23
utd
alla
s.edu
/~m
etin
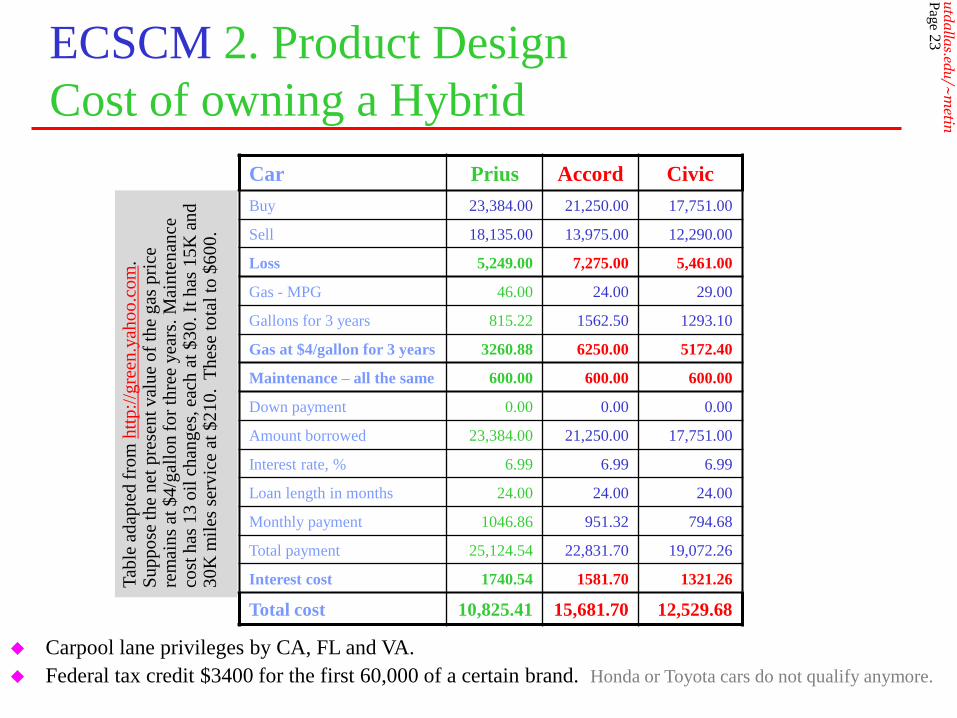
ECSCM 2. Product Design
Cost of owning a Hybrid
Carpool lane privileges by CA, FL and VA.
Federal tax credit $3400 for the first 60,000 of a certain brand. Honda or Toyota cars do not qualify anymore.
Car Prius Accord Civic
Buy 23,384.00 21,250.00 17,751.00
Sell 18,135.00 13,975.00 12,290.00
Loss 5,249.00 7,275.00 5,461.00
Gas - MPG 46.00 24.00 29.00
Gallons for 3 years 815.22 1562.50 1293.10
Gas at $4/gallon for 3 years 3260.88 6250.00 5172.40
Maintenance – all the same 600.00 600.00 600.00
Down payment 0.00 0.00 0.00
Amount borrowed 23,384.00 21,250.00 17,751.00
Interest rate, % 6.99 6.99 6.99
Loan length in months 24.00 24.00 24.00
Monthly payment 1046.86 951.32 794.68
Total payment 25,124.54 22,831.70 19,072.26
Interest cost 1740.54 1581.70 1321.26
Total cost 10,825.41 15,681.70 12,529.68
Tab
le a
dap
ted
fro
m h
ttp
://g
reen
.yah
oo
.com
.
Su
pp
ose
th
e n
et p
rese
nt
val
ue
of
the
gas
pri
ce
rem
ain
s at
$4
/gal
lon f
or
thre
e yea
rs.
Mai
nte
nan
ce
cost
has
13
oil
ch
ang
es, ea
ch a
t $
30
. It
has
15
K a
nd
3
0K
mil
es s
erv
ice
at $
21
0. T
hes
e to
tal
to $
60
0.

Pag
e 24
utd
alla
s.edu
/~m
etin
Aside
The Alternative: Global Warming. Fact or Fiction?

Pag
e 25
utd
alla
s.edu
/~m
etin
Can the Warming be Explained by Natural Forces
(Volcanoes/Solar Activity) or Human Factors?
Source: Climate change 2007:
The physical science basis. www.ipcc.ch.
Black line is the observed temperature
Blue band is 5-95% confidence interval
based only on natural forces
Red band is 5-95% confidence interval
based on natural forces and human factors