Embed Size (px)
Citation preview

Environmental taxes: economic principles and the UK experience
Andrew Leicester
Acknowledgments
This paper is the English translation of the chapter ‘Tributación medioambiental: principios
económicos y experiencia en el Reino Unido’ published in Pelegry, E. and M. Larrea Basterra (eds.)
(2013), Energía y Tributación Ambiental, Orkestra, Basque Institute for Competitiveness.† A version
of the paper was presented at the workshop on energy and environmental taxation held at Deusto
University, Bilbao, on 25th September 2012. The author would like to thank the workshop organisers
(Economics for Energy and the Energy Chair of Orkestra, Basque Institute for Competitiveness) and
participants at the event. Thanks are also given to Paul Johnson for comments on an earlier draft of
this paper. Funding assistance from the ESRC Centre for the Microeconomic Analysis of Public Policy
(RES-544-28-5001) at IFS is gratefully acknowledged. Data from the UK Living Costs and Food Survey
are collected by the Office for National Statistics and distributed by the Economic and Social Data
Service. Crown copyright material is reproduced with the permission of the Controller of HMSO and
the Queen’s Printer for Scotland.
Note that all views expressed are those of the author alone and not of the Institute for Fiscal Studies.
Any errors are the author’s responsibility.
Address for correspondence: Institute for Fiscal Studies, 7 Ridgmount Street, London WC1E 7AE, UK.
Email: [email protected].
† Available from
http://www.orkestra.deusto.es/index.php?option=com_fabrik&c=form&view=details&Itemid=265&fabrik=12&tableid=12&rowid=225&lang=es.
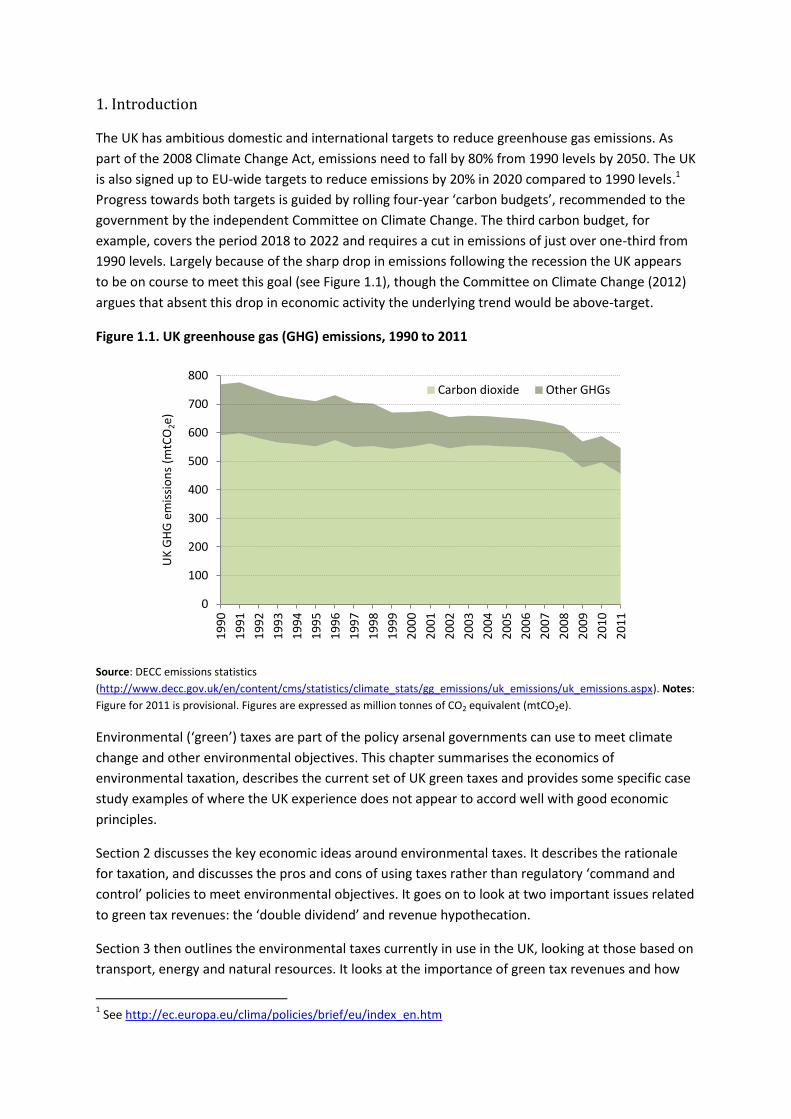
1. Introduction
The UK has ambitious domestic and international targets to reduce greenhouse gas emissions. As
part of the 2008 Climate Change Act, emissions need to fall by 80% from 1990 levels by 2050. The UK
is also signed up to EU-wide targets to reduce emissions by 20% in 2020 compared to 1990 levels.1
Progress towards both targets is guided by rolling four-year ‘carbon budgets’, recommended to the
government by the independent Committee on Climate Change. The third carbon budget, for
example, covers the period 2018 to 2022 and requires a cut in emissions of just over one-third from
1990 levels. Largely because of the sharp drop in emissions following the recession the UK appears
to be on course to meet this goal (see Figure 1.1), though the Committee on Climate Change (2012)
argues that absent this drop in economic activity the underlying trend would be above-target.
Figure 1.1. UK greenhouse gas (GHG) emissions, 1990 to 2011
Source: DECC emissions statistics
(http://www.decc.gov.uk/en/content/cms/statistics/climate_stats/gg_emissions/uk_emissions/uk_emissions.aspx). Notes:
Figure for 2011 is provisional. Figures are expressed as million tonnes of CO2 equivalent (mtCO2e).
Environmental (‘green’) taxes are part of the policy arsenal governments can use to meet climate
change and other environmental objectives. This chapter summarises the economics of
environmental taxation, describes the current set of UK green taxes and provides some specific case
study examples of where the UK experience does not appear to accord well with good economic
principles.
Section 2 discusses the key economic ideas around environmental taxes. It describes the rationale
for taxation, and discusses the pros and cons of using taxes rather than regulatory ‘command and
control’ policies to meet environmental objectives. It goes on to look at two important issues related
to green tax revenues: the ‘double dividend’ and revenue hypothecation.
Section 3 then outlines the environmental taxes currently in use in the UK, looking at those based on
transport, energy and natural resources. It looks at the importance of green tax revenues and how
1 See http://ec.europa.eu/clima/policies/brief/eu/index_en.htm
0
100
200
300
400
500
600
700
800
19
90
19
91
19
92
19
93
19
94
19
95
19
96
19
97
19
98
19
99
20
00
20
01
20
02
20
03
20
04
20
05
20
06
20
07
20
08
20
09
20
10
20
11
UK
GH
G e
mis
sio
ns
(mtC
O2e
)
Carbon dioxide Other GHGs

this has changed over time, before considering whether commitments by the current and previous
UK governments to raise a larger share of revenues from green taxes have any sensible economic
rationale and whether there is scope to raise a much larger share of UK receipts from environmental
taxes.
Section 4 then discusses three examples of where UK green tax policy does not match up to good
economic principles. First, it examines the wide range of implicit prices policy places on carbon
emissions from different fuels and different end-users. This price variation means emissions
abatement is being carried out at an inefficiently high cost. Second, the tax on landfill in the UK is
used to highlight the importance of basing green tax rates of evidence about the environmental
costs of different activities as much as possible, and the problems that can be caused by
environmental targets which appear to have little basis on such evidence. Third, the structure of
taxes on motoring is compared to the environmental and other external costs generated by road
use, to show how poorly-targeted green taxes can impose large economic costs.
Much of the material in this chapter is drawn from four key references, and interested readers are
encouraged to look at those for more details. Leicester (2006) provides an accessible (but now
slightly outdated) account of the UK environmental tax system and many of the issues discussed in
this chapter. The chapter (and associated commentaries) on environmental taxes from the first
volume of the IFS Mirrlees Review (Fullerton et al., 2010) covers in more depth the economics of
environmental taxation and other aspects of taxes on carbon, transport and waste, and provides key
references to many of the academic papers which underlie the principles discussed. Chapters on
environmental tax, climate change and motoring taxes in the second editorial volume of the Review
(Mirrlees et al., 2011) also cover similar ground and make more explicit recommendations for policy
reform. Finally, Johnson et al. (2012) goes into much more detail regarding the economics of
motoring-related taxes and the failures of the current UK system.

2. Economic principles of environmental taxation
2.1 The rationale for taxes
The first important question in thinking about the economics of environmental taxes is why they are
needed at all. Normally, taxing some things more heavily than others imposes economic distortions
on decision-making, and so reduces overall economic welfare. This may not be true in the case of
environmental taxes, where market failures lead to inefficient decisions being made in the first place
which taxation can help to correct.
The key market failure for environmental taxes comes from ‘externalities’. Environmental costs are
not felt by the people carrying out environmentally-damaging activities – they are ‘external’ costs to
society at large. These costs include global climate change following the release of greenhouse gases
(GHGs) into the atmosphere, as well as localised costs of pollution in various forms. When weighing
up how much of a harmful activity to engage in, people will weigh up their private costs and benefits
but because the external costs are not taken into account, too much of the activity is carried out
from a social perspective. Environmental taxes can therefore be used to help people recognise the
full social costs of their behaviour – to ‘internalise the externality’ – and thus reduce harmful
activities to socially optimal levels, creating an overall welfare gain from taxation.
The idea is illustrated simply in Figure 2.1 below. Imagine a factory situated in a town deciding how
much output to product. Each unit of output incurs a private cost to the factory, given by the
upward-sloping marginal private cost (MPC) curve. As production levels increase, the additional cost
to producing each unit gets larger and larger, perhaps as the firm has to run its capital more
intensively and pay higher labour costs. The value to the firm of extra output is given by the
downward-sloping marginal private benefit (MPB) curve. As output levels increase, each unit sell for
a lower price. Taking a private decision, the factory will produce output level Q0 and sell at price P0.
Figure 2.1. The externality rationale for environmental taxation
A B
P0
P1
Q0 Q1 Quantity
MSC
MPC
MPC + t
Costs, benefits
MPB
t

However, each unit of output produced by the factory generates a certain amount of pollution which
imposes external costs on the residents of the town – perhaps health costs associated with the
pollution as well as the costs of noise and other disamenity costs associated with the factory’s
operation. At low levels of output, the additional external costs might be quite low, but as output
increases, the marginal externality gets larger – the factory may have to run outside normal hours
and pollution may only impose health risks once output exceeds a certain level. Based on the full
marginal social costs (MSC, private and external costs combined) of its production, the optimal social
level of output is lower, at Q1, and should be sold at the higher price P1. At the privately optimal
outcome, there is a welfare cost given by the shaded area A. This is the total amount by which the
social costs of producing output Q0 exceed the benefits of producing this output.
To obtain the optimal social level of output, the government can impose a tax equal to t per unit of
output. This shifts the factory’s MPC curve upwards to the point where the private and socially
optimal output levels are aligned.2 The increase in social welfare is given by the shaded area A and
revenue equal to the shaded area B (the tax rate multiplied by the post-tax output level Q1) is
generated for the government.
Of course, Figure 2.1 presents a very stylised example. Nevertheless, some key points can be drawn:
Environmental taxes should be set according to the marginal external cost at the socially
optimal output level. The ‘right’ tax rate is not found by estimating the total value of all
external costs and dividing by the amount of output (the average external cost). If marginal
external costs are roughly constant then average and marginal externalities will be the
same. If marginal external costs get larger as output increases, the optimal externality-
correcting tax will be higher than the average externality, and vice-versa if marginal external
costs fall with output. Estimating the average externality may be much more
straightforward than estimating the marginal externality, but in general caution should be
exercised in using such estimates as a guide to optimal policy making.
The optimal pollution level is not generally zero. The intention should be to determine the
socially efficient level of output once environmental externalities are taken into account.
The tax should be levied directly on the externality or a close proxy for it. To impose taxes on
something requires that it be measurable and verifiable, which in the case of environmental
externalities (such as the harmful pollutants coming from vehicle exhausts) can be difficult,
at least at reasonable cost. In such cases, ‘piggy-backing’ green taxes on existing observable
market transactions (such as vehicle type or fuel purchases) that are directly related to the
externality of interest may be better. However, such indirect targeting of the externalities
will be ineffective if there is no relationship between the market transaction being taxed
and the external cost. It may also have other important repercussions. For example, as it is
very hard to measure actual carbon emissions from electricity generation, taxes may be
imposed fuels used in generation based on their carbon content. However, such taxes
would discourage incentives to develop and invest in technology to capture and remove
carbon from the generation process, as the carbon is still present at the fuel input stage.
2 Environmental taxes used to internalise external costs are an example of so-called ‘Pigouvian taxes’ after the
seminal work of Pigou (1920) who first introduced the idea.

2.2 The pros and cons of environmental taxes
Having outlined the basic economic rationale for environmental taxes, it is worth considering the
advantages and disadvantages of taxes against other policies which might be implemented to
achieve the same outcome. Rather than taxes, Governments can use more direct regulation to
control pollution, forcing polluters to change their behaviour in particular ways to generate
perceived environmental benefits. Such ‘command and control’ (CAC) regulation has long been part
of observed policy and undoubtedly will continue to be used in the future – for example, the
increasing tightening of ‘Euro’ standards for new cars which regulate maximum volumes of exhaust
emissions of various pollutants for new cars sold in the EU.3
Before beginning our discussion of the pros and cons of taxes, a note on where emissions trading
schemes fit in to our analysis is important. Particularly at the international level, emissions trading
has become a fundamental part of environmental policy making, with the EU Emissions Trading
Scheme (ETS) the largest example of its kind. Both taxes and trading are examples of economic
instruments for environmental policy, and they are closely related. An environmental tax sets a price
for pollution, at which a new equilibrium quantity of pollution is generated. A trading scheme fixes
the quantity of pollution, and allows pollution to be bought and sold by those operating in the
scheme to determine the price.
In principle, both instruments generate the same outcome under various assumptions, most
importantly that the costs and benefits of pollution control are known. The key insight is that taxes
give certainty over the cost of pollution control (by fixing the price) but leave the outcome level of
pollution uncertain. Trading gives certainty over the pollution outcome (by fixing the quantity) but
leave the cost of achieving that outcome uncertain. The choice between instruments will depend on
how much weight policy makers place on having certain pollution outcomes. Further, when policy is
made without knowing precisely the costs and benefits of pollution control, the welfare costs of
getting the policy wrong will differ between taxes and trading schemes depending on the relative
slopes of the marginal cost and benefit curves when pollution is reduced (Weitzman, 1974).
Given their close relationship, the rest of this chapter will essentially treat emissions trading as
another form of ‘environmental tax’. Interested readers are invited to look at Section 5.2.4 of
Fullerton et al. (2010) for a more detailed discussion of the factors which might influence the choice
between taxes and trading.
Advantages of taxes
Static efficiency gains
Figure 2.1 above gave a simple example where there was a single polluter. When there are many
polluters, each of them might have different costs of reducing emissions. Taxes and other economic
instruments can reduce the total cost of abatement compared to simple regulations which might not
be able to take this variation in abatement costs into account. Figure 2.2 illustrates the issue.
3 For details of the current ‘Euro 5’ standards see
http://europa.eu/legislation_summaries/environment/air_pollution/l28186_en.htm.

Figure 2.2. The static efficiency cost of a CAC equal abatement policy
Suppose that there are two firms, A and B, which generate pollution. The external costs of the
pollution do not depend on which firm produced it, and the pollution generated by each firm is
observable and therefore taxable. The socially optimal outcome determined by the size of the
externality is for pollution to be reduced by the length of the horizontal axis 0A0B. The firms have
different marginal costs of reducing pollution (marginal abatement costs MAC, read from the left-
hand axis for firm A and the right-hand axis for firm B). In this example, firm A can abate its pollution
more cheaply than firm B, shown by the more gently upward-sloping MACA curve.
If the government does not know the MAC schedules for the two firms, and had to simply regulate
the emissions of each to achieve the desired total abatement, it may decide for equity reasons to
impose an equal share of the total abatement on each firm. Firm A would reduce pollution by 0AQ½
and firm B would reduce pollution by Q½0B to give the necessary total reduction. The cost of
reducing emissions would be given by the area under the two MAC curves at this outcome.
However, if the government were to impose a pollution tax at rate T (with both firms facing the
same tax rate), the required abatement would be achieved at the lowest possible cost. Each firm
would be willing to abate up to the point where its marginal abatement cost equalled the tax (since
the marginal abatement cost represents the cost of reducing emissions by one more unit whereas
the tax rate represents the benefit of doing so in terms of reduced tax payments). Firm A would
reduce emissions by 0AQ*, and firm B would reduce emissions by Q*0B. Comparing the total cost of
this division of the necessary abatement, the saving under the tax approach relative to the equal
division CAC approach is given by the shaded area.
Dynamic incentives to reduce emissions
Taxes give incentives to reduce emissions (or the harmful taxable activity linked to emissions) in the
form of reduced tax payments. When a firm’s ability to abate changes, it will take advantage of these
incentives to reduce emissions. For example, in Figure 2.2 suppose Firm B’s MAC curve rotated
downwards, reflecting a new technology making pollution reduction cheaper. Firm B would then
reduce emissions to the point where the tax saving made it worthwhile. If Firm B had been regulated
under a CAC regime to reduce emissions by a certain amount, there would be no incentive to reduce
Required total abatement Q* Q½ 0B 0A
T T
Cost
(firm A)
Cost
(firm B)
MACB
MACA
emissions further if it became cheaper to do so, and so no incentive for Firm B to invest in
technology which would reduce its marginal abatement costs.
Reduced need for negotiation with individual polluters
In principle, an efficient outcome could be achieved with a CAC approach. In Figure 2.2, the
government could, given knowledge of the MAC schedules, require firm A to shoulder more of the
abatement than firm B rather than dividing the burden equally. However, in practice, to know these
schedules the government would need to discuss and negotiate individually with each firm since
information on abatement costs is unlikely to be public knowledge. This gives firms a significant
informational advantage over the government which can result in ‘regulatory capture’ in which the
authorities have to pay a price to firms (such as less stringent abatement targets) in return for the
information being released. In the green tax case, the risk of such capture is reduced since the
authorities simply set the tax rate and allow firms to reveal their own abatement costs in response.4
Revenue raising
As we discuss further in Section 2.3, green taxes raise revenue for the government whereas CAC
policies do not.
Disadvantages of taxes
Inefficient uniform taxes
If the size of the marginal externality varies according to the source of pollution, then imposing the
same tax rate on all sources will not result in an efficient outcome. One example may be where the
damage varies by geography: the externality from air pollution associated with respiratory problems
may be much larger in more densely populated areas, say. In principle, the tax rates could then vary
by geography with higher pollution taxes in or near cities. In practice, such differentiation may be
hard if people can simply pay tax in the low-tax areas. For example, it may be sensible to charge
higher vehicle fuel excise taxes in cities both because of the air pollution costs and because
congestion externalities are higher (see Section 4.3). However, people in cities would then travel to
country areas to pay the reduced rate, exacerbating the problem. Further, determining different the
optimal set of tax rates for different polluters requires individual negotiation between the tax
authorities and polluters, thus negating one of the benefits of green taxes.
Unintended consequences
Green taxes should work by providing incentives for people to reduce environmentally-damaging
behaviour in legitimate ways and thus reduce their tax liabilities. However, people may engage in
avoidance behaviours which have more costly environmental or other consequences than the
behaviour which was being taxed in the first place. For example, imposing taxes on household waste
bags collected at the roadside could lead to people dumping waste illegally, avoiding the tax but not
4 Of course the risk is not eliminated. Governments are unlikely to introduce new green taxes without
consulting those firms or other agents likely to be affected, not least to have some sense of what tax rate will be needed to achieve the abatement desired. When there is a small group of powerful actors they may well be able to exert some influence over the final policy; the risk is smaller when there are many agents.
reducing the quantity of waste generated. Attempts to monitor the impact of environmental taxes
should as far as possible try to assess their effects on these sorts of avoidance activities.
Taxes and firm decision-making
When environmental taxes are imposed on firms, it may be that (except in very small organisations)
decentralisation of decision-making means that the people responsible for tax planning and
payment are different from the people responsible for the input and output decisions which form
the basis of the tax. Unless the tax incentives are fairly large, it may not be worth the cost to re-
organise the decision-making structures in the firm that would be needed to make ‘optimal’
production decisions following the tax.
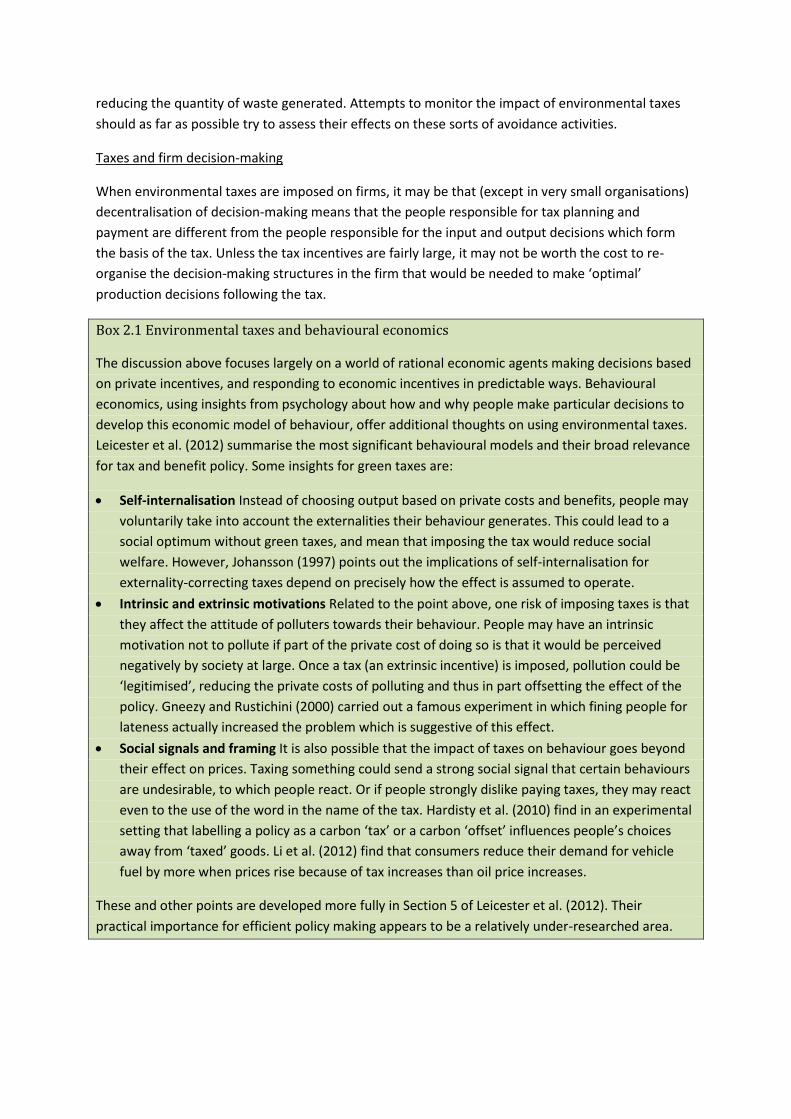
Box 2.1 Environmental taxes and behavioural economics
The discussion above focuses largely on a world of rational economic agents making decisions based
on private incentives, and responding to economic incentives in predictable ways. Behavioural
economics, using insights from psychology about how and why people make particular decisions to
develop this economic model of behaviour, offer additional thoughts on using environmental taxes.
Leicester et al. (2012) summarise the most significant behavioural models and their broad relevance
for tax and benefit policy. Some insights for green taxes are:
Self-internalisation Instead of choosing output based on private costs and benefits, people may
voluntarily take into account the externalities their behaviour generates. This could lead to a
social optimum without green taxes, and mean that imposing the tax would reduce social
welfare. However, Johansson (1997) points out the implications of self-internalisation for
externality-correcting taxes depend on precisely how the effect is assumed to operate.
Intrinsic and extrinsic motivations Related to the point above, one risk of imposing taxes is that
they affect the attitude of polluters towards their behaviour. People may have an intrinsic
motivation not to pollute if part of the private cost of doing so is that it would be perceived
negatively by society at large. Once a tax (an extrinsic incentive) is imposed, pollution could be
‘legitimised’, reducing the private costs of polluting and thus in part offsetting the effect of the
policy. Gneezy and Rustichini (2000) carried out a famous experiment in which fining people for
lateness actually increased the problem which is suggestive of this effect.
Social signals and framing It is also possible that the impact of taxes on behaviour goes beyond
their effect on prices. Taxing something could send a strong social signal that certain behaviours
are undesirable, to which people react. Or if people strongly dislike paying taxes, they may react
even to the use of the word in the name of the tax. Hardisty et al. (2010) find in an experimental
setting that labelling a policy as a carbon ‘tax’ or a carbon ‘offset’ influences people’s choices
away from ‘taxed’ goods. Li et al. (2012) find that consumers reduce their demand for vehicle
fuel by more when prices rise because of tax increases than oil price increases.
These and other points are developed more fully in Section 5 of Leicester et al. (2012). Their
practical importance for efficient policy making appears to be a relatively under-researched area.

Distributional consequences
The focus so far has been on green taxes and economic efficiency. One issue which has not been
considered is that of equity: does the burden of green taxes fall more heavily on poorer or richer
households? To the extent that both equity and efficiency are important in determining the welfare
consequences of policy, it seems important to consider distributional issues as well when thinking
about environmental taxes. Taxes are said to be ‘regressive’ when the tax payment makes up a
larger share of expenditure for poorer (low-spending) households than richer (high-spending) ones.5
If green taxes are regressive, this could be seen as an additional disadvantage in their use.
A number of general points are worth making. First, whilst it is often assumed that green taxes are
regressive, the evidence on specific taxes in the UK is rather mixed. Taxes on domestic energy are
without doubt regressive. Fullerton et al. (2010) show that in 2005, the poorest 10% of households
spent on average 12% of their budget on energy whilst the richest 10% spent around 4%. However,
taxes on vehicle fuel look, if anything, broadly progressive, largely because vehicle ownership rates
are low among poor households. Johnson et al. (2012) show that the poorest 10% of households
spent 3% of their budget on vehicle fuel in 2009, whilst the richest 10% spent on average almost
5%.6 Green taxes on aviation use are also likely to be progressive though accurate estimates of this
are hard to derive (Leicester and O’Dea, 2008).
Second, in general it is not clear that regressivity alone is a good reason not to implement an
efficient environmental tax reform. Green taxes form only part of the wider tax and benefit system
which governments can use to redistribute income. It may be possible to use some or all of the
revenue from regressive green taxes to compensate poorer households through other levers, such
as increases in particular benefits, leaving the overall tax and benefit system no less progressive than
before. The relative merits of different compensation packages of course have to be considered, and
in many cases (particularly in terms of taxes on energy) though it may be possible to design a
package which leaves progressivity no different on average, there may still be groups of winners and
losers within the overall reform because of large variation in energy consumption between
households with similar living standards (see for example Dresner and Ekins, 2006).
Third, the discussion here has focused on taxes compared to other approaches to environmental
policy. These other approaches also have distributional consequences, but in contrast to taxes they
may be much more opaque and thus hard to compensate. Regulating the emissions which firms can
make, for example, will increase costs. Firms could respond by raising prices, and if the firm’s output
is consumed more heavily by poorer households this would be regressive. Or they may absorb the
cost themselves but reduce wages or dividends, which again has distributional implications. Deciding
not to use economic instruments for environmental policy does not mean there are no equity issues.
5 Regressivity can also be judged against income. More broadly, both income and expenditure are trying to
capture variation in living standards, with the idea being that regressive taxes impose a relatively larger burden on those with the lowest living standards. In general, economists tend to favour expenditure over income as a measure of living standards since people are assumed to smooth out the value of their expenditure over temporary income shocks. For more on this, see for example Meyer and Sullivan (2012) in the US and Brewer and O’Dea (2012) for the UK. 6 This uses income as a measure of living standards. Results based on spending show similar patterns.

2.3 Green tax revenues: hypothecation and the double dividend
One of the benefits of green taxes discussed above was that they raise revenue. As we show in
Section 3, green taxes in the UK generated roughly £43 billion in 2011, or 8% of total revenue. In
thinking about the economics of green tax policy, then, it is important to consider not only how the
revenues are generated, but also how they are used. Two related issues are particularly important.
First, is there an economic case for hypothecation – that is, should the revenues be ear-marked for
particular purposes? Second, can green taxes generate a double dividend – that is, as well as any
environmental benefit, can green taxes generate a more efficient tax system overall?
Hypothecation
The idea of hypothecation is to use revenues from a given tax for a particular purpose, most often
for spending on a particular function. For example, the UK House of Commons Environmental Audit
Committee (2011) came out in favour of spending at least part of the revenue from higher green
taxes on public transport. However, as Advani et al. (2011a) point out, there is in general no good
economic rationale for tying spending on particular activities to the revenues raised from a certain
tax or set of taxes. In an ideal world, the marginal pound of public expenditure will be spent in the
most efficient way and raised in the most efficient way, and there is no reason to believe the
efficient pattern of spending and revenues will line up in any clearly-related manner. Further, if the
idea is simply to use additional revenue from a given tax increase to raise the amount spent in a
particular area, then unless there had been detailed, concrete plans laid out for spending before the
tax rise it will in effect be impossible to verify that the additional revenues had in fact been spent in
the intended manner.
It may be that hypothecation has a political rationale if it is used as a way to defend or win public
support for particular tax reforms. Given that hypothecation is essentially inefficient or meaningless,
though, it would appear a poor substitute for proper argument of the economic case for proposed
tax changes.
Double dividend
In some cases, green tax revenues are notionally hypothecated by promising to reduce other taxes
by an equivalent amount. For example, in the UK, new green taxes introduced over the last 15 years
on energy use by firms, landfill and the extraction of aggregates were all accompanied by reductions
in the rate of National Insurance Contributions (NICs) paid by employers on their employee’s wages
in a bid to make the changes ‘revenue neutral’ for businesses.7
This form of hypothecation appeals quite strongly to the notion that environmental taxes can
generate a ‘double dividend’. The first dividend is the environmental benefit detailed in Figure 2.1,
which comes from reducing emissions to socially optimal levels and internalising the external costs.
The second dividend comes from using the revenue to reduce other taxes (on labour income, say)
which impose economic distortions on labour supply decisions (Terkla, 1984). This is known as the
7 In fact, if anything, it seems likely that the revenue losses from the reduced NICs outweighed the revenue
increases from the new green taxes, at least in the early years. As we note in Section 4, annual tax revenues from landfill have increased markedly in recent years, from around £300 to £400 million in the late 1990s to £1.1 billion in 2011. This increase was not accompanied by any further reduction in employer NICs.

‘revenue-recycling effect’. The implication of a double dividend is that even without the
environmental benefit, the new green tax or increase in the tax rate would be worthwhile. It is easy
to understand why such a concept proves attractive for policy makers and campaigners for increases
in environmental taxes.
However, in reality, the existence of a double dividend is extremely controversial. Higher green taxes
in themselves generate economic distortions for labour supply: if they result in higher prices, then
the real value of people’s labour income is reduced, which reduces the incentive to work (see e.g.
Bovenberg and de Mooij, 1994). This ‘tax interaction effect’ could be larger or smaller than the
improved incentives from reduced labour taxes, but there is no reason in advance to believe that the
overall effect will be to improve work incentives.
Fullerton et al. (2010, Section 5.4) give a full account of the double dividend discussion. As they point
out, ultimately the value of the debate may be to make clear that, all else equal, the value of green
taxes compared to CAC approaches is that they raise revenue and allow for the possibility of
reducing other taxes, or raising spending elsewhere, or reducing budget deficits more rapidly. CAC
approaches will also raise product prices as we mentioned earlier, and so reduce real purchasing
power with negative labour supply effects, without any revenue gain.

3. Environmental taxes in the UK: an overview
3.1 Current taxes
Table 3.1 outlines the current (as of September 2012) set of environmentally-related taxes in the UK.
The central London Congestion Charge, which is not levied by central government, is not included,
but an account of the scheme can be found in Johnson et al. (2012).
Transport-related taxes Rate(s) Revenue
Fuel duty A per-litre excise tax on vehicle fuels. Between 1993 and 1999, rates increased above inflation each year as part of an ‘escalator’ policy, during which real rates increased by 71%. Since then, rates have been adjusted on an ad-hoc basis but have fallen by 17% in real-terms. VAT is charged at the full rate (20%) on top of the duty. Duty on petrol and diesel was equalised in 1994. The UK is the only EU member state which charges the same tax on diesel as on petrol. Taxes on biofuels were reduced by 20p per litre between 2002 and 2010, but this reduction was then removed amid concerns that the environmental impact of biofuels was not properly understood.
57.95p/litre £26.9 bn
Vehicle excise duty (VED)
An annual ownership tax for road vehicles. Rates vary according to the type of vehicle. Since 2001 the rate for cars has depended on fuel efficiency (measured as carbon dioxide emissions per kilometre driven). Cars are currently allocated to one of 13 bands. Since 2010, new cars have also paid a different rate in their first year of registration, with much stronger differentials in this first year rate across emissions bands. Cars registered before 2001 pay VED according to the engine size of the vehicle.
Registered in or after March 2001 £0‒£475 per year according to vehicle emissions (£0‒£1,030 in first year). Registered before March 2001 £135 (engine ≤1,549cc) £220 (engine ≥1,550cc)
£5.8 bn
Air passenger duty (APD)
A tax on passengers departing from UK airports, first levied in 1994. Since 2009, the tax has varied according to distance flown (divided into four bands) and the class of flight. Distance is determined by the distance between London and the capital city of the destination country. There are exemptions for those flying on very small aircraft, aged under two, flying from airports in the Scottish Highlands and Islands, and for transfer/transit passengers. Passengers flying from Northern Ireland also pay the short-haul (Band A) rate regardless of distance, because of concerns about lower passenger taxes in the Irish Republic.
≤2,000 miles £13 (economy) £26 (other) 2,001‒4,000 miles £65 (economy) £130 (other) 4,001‒6,000 miles £81 (economy) £162 (other) ≥6,001 miles £92 (economy) £184 (other)
£2.7 bn
Company car and fuel taxes
Taxes on company cars and fuel assign an assumed income from the benefit in kind to which standard income tax rates are applied. From 2002, the assumed value for cars is a percentage of the vehicle list price, with less polluting cars attracting a lower percentage (and thus less tax). Diesel cars have a 3 percentage point supplement, though this is to be abolished in 2016. Electric vehicles pay no company car tax, though this exemption is set to end in 2015.
Company car tax The assumed percentage of the list price to calculate the benefit in kind varies from 0% to 35% according to fuel type and fuel efficiency.
£2.1 bn (2009/10)
a

The benefit in kind from vehicle fuel is given by multiplying the company car percentage by a fixed ‘scale charge’, again meaning those driving less polluting cars pay less.
Company fuel tax The same percentage of £20,200 gives the benefit in kind.
Energy and carbon-related taxes Rate(s) Revenue
Climate change levy (CCL)
A tax on business and commercial energy use, first levied in 2001. Rates vary by the type of energy (electricity, gas, solid fuel such as coal and liquid petroleum gas), though renewable energy is exempt. Energy intensive industries that are significantly exposed to international competition can see their liabilities reduced by 65% (rising to 90% in 2013) if they sign up to a ‘Climate Change Agreement’ to improve their energy efficiency and reduce emissions. From 2013, the CCL will be extended to cover fuels supplied for energy generation and rates set to reflect the carbon content of different fuels. The rates of this ‘carbon price support’ will be set based on expectations of the EU ETS trading price to generate a more stable long-run upward trajectory for the total carbon price.
Electricity: 0.509p/kWh Gas: 0.177p/kWh LPG: 1.137p/kg Solid fuel: 1.387p/kg
£0.7 bn
Renewables obligation (RO)
Introduced in April 2002, the RO is a requirement that energy companies source a percentage of their energy from renewable sources each year (set at 15.8% in 2012/13). Each MWh of renewable energy yields a varying number of ‘RO certificates’, and energy companies must have enough certificates to meet their RO target relative to the total amount of energy they produce.
b Firms that fail to do so
can buy out their unfulfilled obligation at a set price. The total value of buyout payments is recycled to energy companies in proportion to the total number of RO certificates they have.
Buyout price is £40.71 per RO certificate.
£0.4 bn of buyout payments (2010/11)
Auctioned EU emissions trading permits
Phase II of the EU ETS (running 2008 to 2012) made provision for up to 10% of the permits allocated to member states to be auctioned. The UK carried out its first auction in 2008 and plans to auction at least 7% of its allocation.
c
The most recent auction (6 September 2012) cleared at €8.11 per permit.
£0.3 bn
Carbon Reduction Commitment (CRC)
The CRC began in April 2010. Initially intended to be a trading system for relatively large firms and public sector organisations which were not part of the ETS, it has undergone repeated and extensive reform and is currently under consultation on further reform and could ultimately simply come to resemble an additional carbon tax on the organisations affected. A ‘league table’ ranking organisations according to their performance on a number of carbon and criteria is also produced as part of the policy, designed to generate reputational incentives as well as financial ones to reduce energy use and emissions.
d
£12/t CO2 £0.7 bn
Other energy-related levies
Two energy-related levies on energy bills which are used for specific purposes are treated as taxes and expenditures in government accounts. Social tariffs give reduced prices for domestic energy for low-income and vulnerable households. Feed-in tariffs are payments made to people producing small amounts of renewable energy (e.g. through solar panels) which is sold back to the grid.
£0.2 bn £0.2bn

Natural resource and waste taxes Rate(s) Revenue
Landfill tax A tax on waste sent to landfill, first imposed in 1996. A reduced rate applies to ‘inert’ wastes such as rocks, ash and water which do not decompose to produce methane. Rates for standard waste have been increased annually since 1999, and will rise by £8 per tonne in 2013 and 2014. The rate will be held at no less than £80 per tonne from 2014 until at least 2020.
£64/tonne (standard) £2.50/tonne (inert)
£1.2 bn
Aggregates levy
A tax on the commercial exploitation of sand, gravel and rock first imposed in April 2002.
£2/tonne £0.3 bn
Note: Revenue figures are 2011/12 forecasts from the Office for Budget Responsibility (http://budgetresponsibility.independent.gov.uk/economic-and-fiscal-outlook-march-2012/) unless otherwise stated . a HMRC Benefits in Kind Statistics July 2012 (http://www.hmrc.gov.uk/stats/taxable_benefits/expen-ben-stats.pdf)
b The number of RO certificates for different types of renewable energy can be found at
http://www.decc.gov.uk/en/content/cms/meeting_energy/renewable_ener/renew_obs/ro_support/ro_support.aspx c Details of all auctions to date can be found at http://www.dmo.gov.uk/index.aspx?page=ETS/AuctionInfo.
d The first league table covering 2,103 organisations was published in November 2011 and is available at
http://crc.environment-agency.gov.uk/pplt/web/plt/public/2010-11/CRCPerformanceLeagueTable20102011. 803 organisations - 40% of the total – tied for last place.
Figures from the UK Office for National Statistics (ONS) suggest that environmental taxes in the UK
generated in total around £43.3 billion in 2011, making up 8.0% of all revenues and equivalent to
2.9% of national income. This is based on a slightly different definition of environmental taxes from
those in Table 3.1. The main differences are that the ONS figure includes the additional 20% VAT
paid on top of excise duty on vehicle fuel, but does not include revenues from auctioned EU ETS
permits, the Carbon Reduction Commitment, or ‘other energy-related levies’.8
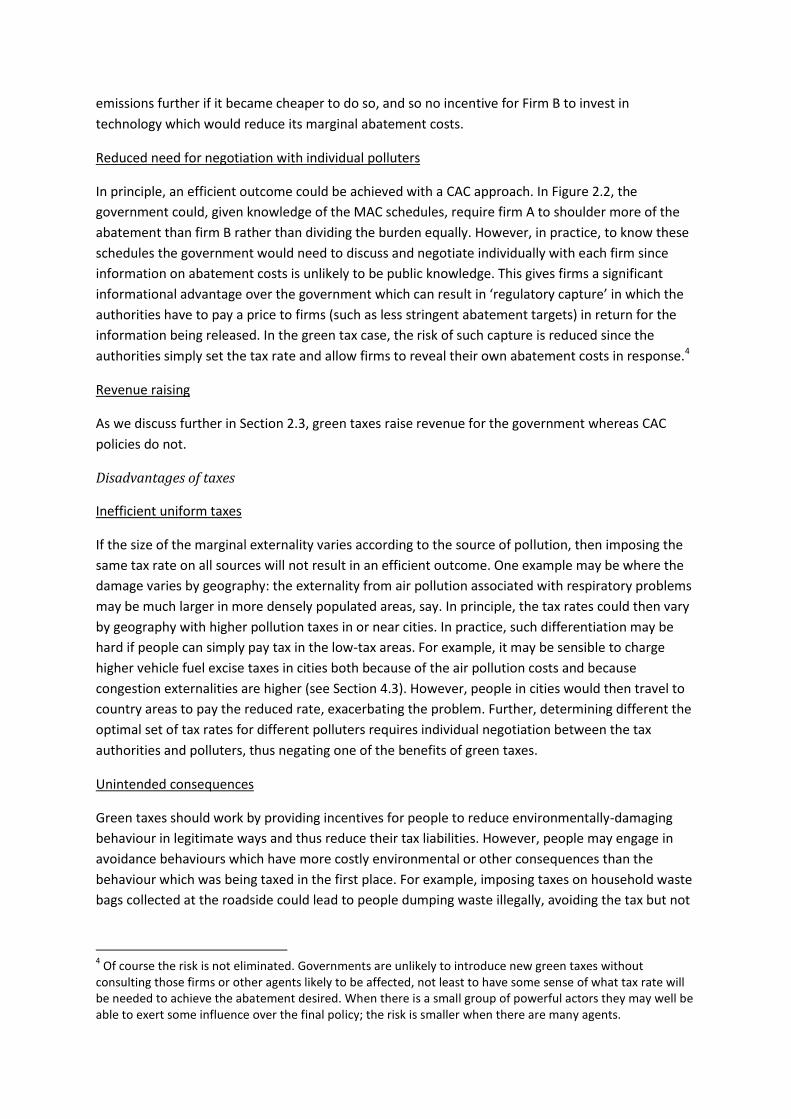
Figure 3.1 shows how these revenues break down across different taxes, grouped into transport
based taxes on fuel, car ownership and air travel; energy-based taxes on renewable generation and
business energy; and resource-based taxes on landfill and aggregates.
Transport taxes, and particularly fuel duty, dominate UK environmental tax receipts. Excluding VAT,
fuel duty accounted for £26.9 billion of revenue in 2011, 62% of total green taxes. Including VAT, fuel
duty made up 75% of green revenues. Other transport taxes, VED and APD, accounted for 19% of
revenues, meaning that altogether transport-based green taxes made up 94% of environmental
receipts. By contrast, other green taxes are quite small. Energy-based taxes and resource-based
taxes each accounted for about 3% of receipts.
8 ONS figures are published in the annual Environmental Accounts report, see http://www.ons.gov.uk/ons/guide-
method/method-quality/specific/economy/environmental-accounts/index.html. The rationale for including VAT charged on top of fuel duty is somewhat unclear, and international convention tends to exclude VAT from the definition of environmental taxes (see e.g. Eurostat, 2001). In principle, VAT simply increases the duty rate by an additional 20%. In practice, the VAT due on vehicle fuel used as a business input will be reclaimed, and VAT charged on other environmentally-damaging goods such as electricity and gas is also excluded from the ONS figure.
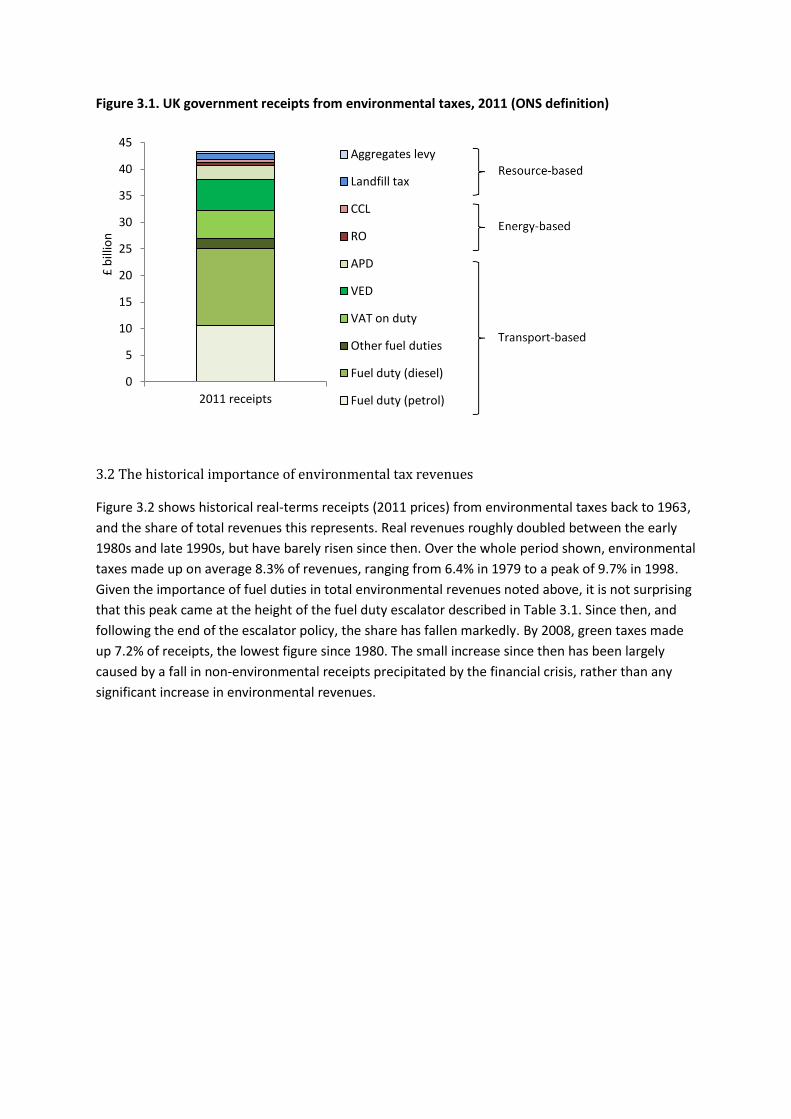
Figure 3.1. UK government receipts from environmental taxes, 2011 (ONS definition)
3.2 The historical importance of environmental tax revenues
Figure 3.2 shows historical real-terms receipts (2011 prices) from environmental taxes back to 1963,
and the share of total revenues this represents. Real revenues roughly doubled between the early
1980s and late 1990s, but have barely risen since then. Over the whole period shown, environmental
taxes made up on average 8.3% of revenues, ranging from 6.4% in 1979 to a peak of 9.7% in 1998.
Given the importance of fuel duties in total environmental revenues noted above, it is not surprising
that this peak came at the height of the fuel duty escalator described in Table 3.1. Since then, and
following the end of the escalator policy, the share has fallen markedly. By 2008, green taxes made
up 7.2% of receipts, the lowest figure since 1980. The small increase since then has been largely
caused by a fall in non-environmental receipts precipitated by the financial crisis, rather than any
significant increase in environmental revenues.
0
5
10
15
20
25
30
35
40
45
2011 receipts
£ b
illio
n
Aggregates levy
Landfill tax
CCL
RO
APD
VED
VAT on duty
Other fuel duties
Fuel duty (diesel)
Fuel duty (petrol)

Figure 3.2. Environmental tax revenues (2011 values and as a % of total receipts), UK, 1963 to 2011
Source: Author’s estimates based on ONS tax revenue data and HM Treasury GDP deflator figures. Notes: Revenues based
on current ONS definition of environmental taxes. Receipts figures in 2011 prices deflated by the GDP deflator.
Box 3.1 Raising the share of revenues from green taxes
Governments in the UK have long expressed an ambition to rely more heavily on green taxes as a
source of revenue. On coming to office in 1997, the Labour government stated its intention to “...
shift the burden of tax from ‘goods’ to ‘bads’ *to+ deliver a ... cleaner environment”.a In a more
formal declaration, the current Conservative/Liberal Democrat coalition government which took
office in 2010 pledged to “increase the proportion of tax revenue accounted for by environmental
taxes.”b Despite these intentions, though, the green tax revenue share has fallen quite markedly in
the UK over the last 15 years or so as Figure 3.2 demonstrated.
To what extent is raising the green tax revenue share a worthwhile policy objective? Governments
may perceive it as a signal of their environmental credentials. However, the proportion of revenues
which come from environmental taxes is not necessarily a good measure of how ‘green’ a
government is for several reasons:
1. Environmental policies such as regulation or the use of freely allocated emissions trading
permits do not raise revenues;
2. Taxes can be made more ‘environmental’ without necessarily raising more revenue, such as the
switch to varying Vehicle Excise Duty payments in the UK according fuel efficiency in 2001;
3. In some cases, environmental tax revenues may be eroded away as people switch their
behaviour away from harmful activities;
4. As argued in Section 2, optimal environmental taxes should be set according to the marginal
external cost associated with particular activities, rather than being raised indiscriminately to
meet an arbitrary revenue target;
5. Targeting the share of receipts means the target is sensitive to receipts of non-environmental
taxes as well – as we saw in Figure 3.1, the share rose markedly in the UK in 2009 because
0%
1%
2%
3%
4%
5%
6%
7%
8%
9%
10%
0
5
10
15
20
25
30
35
40
45
50
19
63
19
66
19
69
19
72
19
75
19
78
19
81
19
84
19
87
19
90
19
93
19
96
19
99
20
02
20
05
20
08
20
11
% o
f to
tal r
even
ues
Rea
l rev
enu
es (
£ b
illio
n, 2
01
1 p
rice
s)
Real revenues (left axis)
% total revenues (right axis)

receipts from income tax and corporation tax in particular were hit hard by the financial crisis,
not because of any particular policy action taken by the government at the time.
There does not therefore seem to be any compelling economic rationale for wanting to raise a larger
share of revenue from green taxes, unless it is clear that environmentally-damaging activities are
taxed below optimal levels. Politically, if governments can also set the parameters against which
such targets are assessed, they may be rendered largely meaningless. For example, the current
government made its pledge in May 2010, but took until July 2012 to define what it meant by
‘environmental taxes’.c Ultimately, a very narrow definition of environmental tax was adopted
(excluding, for example, fuel taxes and other transport-related taxes) and the government was able
to predict that their revenue share would roughly double from 0.5% to 1.0% over five years,
seemingly meeting the pledge with ease. Prior to this, IFS analysis (most recently in Johnson et al.,
2012) based on a much wider definition of environmental taxes more in line with the ONS figures
described above, had suggested that the government was only barely set to hit the target,
forecasting an increase from 7.8% to 8.0%. Importantly for the government, its adoption of a very
narrow definition of environmental taxes means it can continue put off increases in fuel taxes (see
Section 4) without jeopardising the pledge.
There has been much discussion in the UK about the potential for a substantial ‘green switch’,
raising significantly more revenue from environmental taxes and using some or all of the revenues to
reduce taxes on earnings, consumption and so on. For example, the Green Fiscal Commission
recommended that around 20% of revenues should come from environmental taxes, more than
double the current share.d Such a shift would necessitate raising tens of billions of pounds more
environmental tax revenue than at present. However, it is hard to see where such extra revenue
could come from, at least without raising some taxes to levels that would clearly be beyond any
economically efficient levels given current estimates of the environmental externalities involved.
Brewer et al. (2010) note that realistically, substantial extra green tax revenues could only come
from taxes on road transport or carbon, as other green taxes are just too small (even in
combination) to raise the sums required. On road transport, they suggest that the economic case for
raising extra revenues is not very compelling: whilst there is a strong rationale for taxing congestion
more directly, this should really be accompanied by reductions in taxes on fuel (we return to this in
Section 4). On carbon, they estimate that full auctioning of EU ETS permits, alongside a
comprehensive carbon tax at the same rate on emissions not covered by the ETS, could raise
something like £13 billion. In reality, the potential revenues would probably be lower for three
reasons. First, such a tax would ideally be partly offset by reductions in other domestic taxes that
have some carbon component, including taxes on vehicle fuel, business energy use, and air travel.
Second, there would be enormous political pressure to exempt domestic energy users from the full
effects of the tax. Together, these offsets and exemptions reduce the revenue yield by up more than
£6 billion. Finally, the estimate excludes any behavioural response by energy users or generators. a HM Treasury (1997), Environmental taxation: statement of intent (http://www.hm-
treasury.gov.uk/tax_environment_statement_of_intent.htm) b HM Government (2010), The Coalition: our programme for government
(http://www.direct.gov.uk/prod_consum_dg/groups/dg_digitalassets/@dg/@en/documents/digitalasset/dg_187876.pdf) c HM Treasury (2012), Definition of environmental tax published (http://www.hm-treasury.gov.uk/press_60_12.htm)
d http://www.greenfiscalcommission.org.uk/
4. Are UK environmental taxes consistent with good economic principles?
Section 2 outlined the main economic principles which should guide how environmental taxes are
designed and implemented, and Section 3 gave an overview of the current UK system. Here, we use
three case study examples to highlight where UK environmental taxes do not appear to be well-
designed in the light of sensible economic principles.
4.1 The inconsistency of effective prices on carbon
Section 2 highlighted that a green tax should be set at a rate at which the marginal benefits from
reduced pollution equal the marginal costs of abatement. In the case of carbon, measuring the costs
and benefits to try and calculate the right ‘carbon price’ is incredibly difficult. The problems are set
out in Fullerton et al. (2010). It is extremely hard to put an accurate marginal external cost on
climate change. There is huge uncertainty in the scientific and economic modelling. Further, carbon
costs are felt not just today but also long into the future, meaning a difficult decision has to be made
on how to evaluate the welfare of future generations compared to the current generation. In 2009,
the UK government revised its approach to valuing carbon. Rather than trying to quantify climate
change costs, it instead asked what the carbon price would need to be in order to reduce emissions
by enough to meet its domestic and international carbon targets, though even this approach faces
considerable uncertainty around the marginal cost of emissions reduction.9 Discussion of the
approaches can be found in DECC (2009).
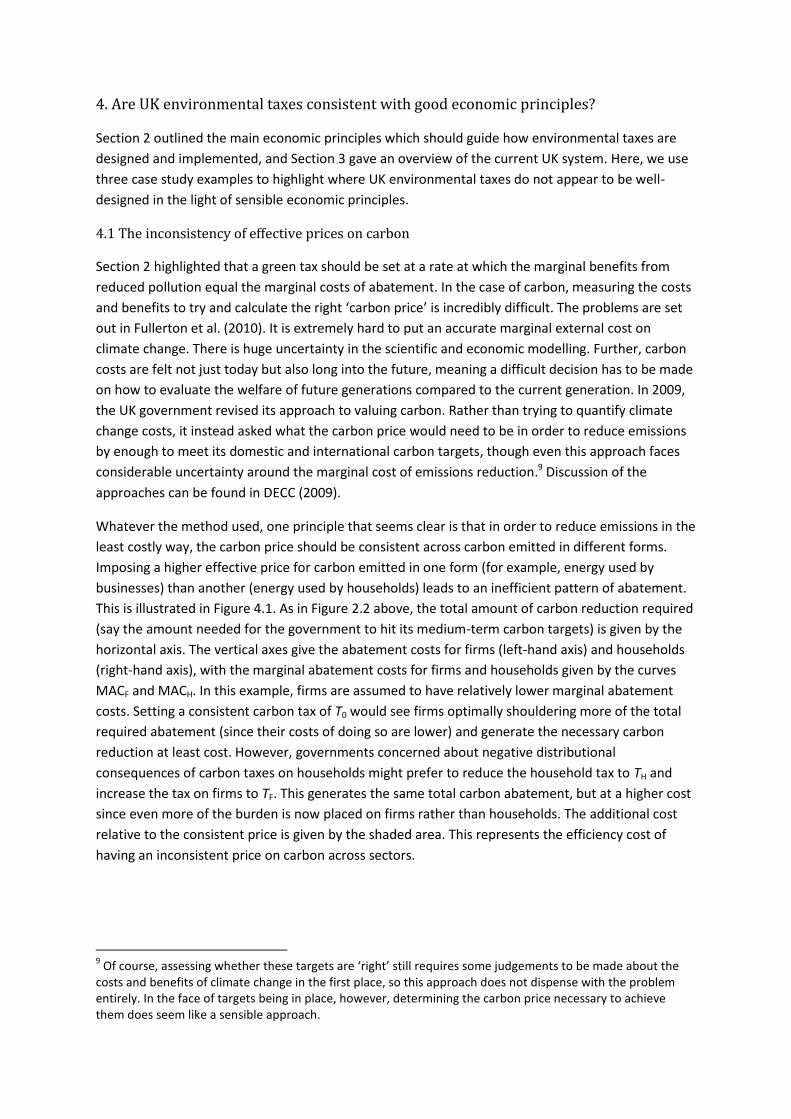
Whatever the method used, one principle that seems clear is that in order to reduce emissions in the
least costly way, the carbon price should be consistent across carbon emitted in different forms.
Imposing a higher effective price for carbon emitted in one form (for example, energy used by
businesses) than another (energy used by households) leads to an inefficient pattern of abatement.
This is illustrated in Figure 4.1. As in Figure 2.2 above, the total amount of carbon reduction required
(say the amount needed for the government to hit its medium-term carbon targets) is given by the
horizontal axis. The vertical axes give the abatement costs for firms (left-hand axis) and households
(right-hand axis), with the marginal abatement costs for firms and households given by the curves
MACF and MACH. In this example, firms are assumed to have relatively lower marginal abatement
costs. Setting a consistent carbon tax of T0 would see firms optimally shouldering more of the total
required abatement (since their costs of doing so are lower) and generate the necessary carbon
reduction at least cost. However, governments concerned about negative distributional
consequences of carbon taxes on households might prefer to reduce the household tax to TH and
increase the tax on firms to TF. This generates the same total carbon abatement, but at a higher cost
since even more of the burden is now placed on firms rather than households. The additional cost
relative to the consistent price is given by the shaded area. This represents the efficiency cost of
having an inconsistent price on carbon across sectors.
9 Of course, assessing whether these targets are ‘right’ still requires some judgements to be made about the
costs and benefits of climate change in the first place, so this approach does not dispense with the problem entirely. In the face of targets being in place, however, determining the carbon price necessary to achieve them does seem like a sensible approach.

Figure 4.1 Efficiency cost of inconsistent carbon prices
In reality, of course, there are many different sources of carbon emissions – different groups using
different types of fuel with different carbon content – and so much greater scope for carbon prices
to vary. Further, the UK government has introduced or signed up to a large number of different
policies which impose implicit or explicit prices on carbon. In the absence of a single, comprehensive
carbon tax, these policies add up to give very different effective carbon prices across the economy,
suggesting the potential for large efficiency costs in how carbon targets are being met.
Evidence on the variation in carbon prices across the UK is starting to emerge and a debate on how a
more consistent and cost-effective approach should best be developed is urgently needed. IFS
research in Johnson et al. (2010) and the recent update by Advani et al. (2011b) took the set of
policies which impose an effective price on carbon or energy (including the EU ETS, CCL, CRC and RO)
to assess how carbon prices vary by end-user (household or business) and fuel (electricity generated
by different sources and gas used for heating) and how future reforms might affect this. Their
findings are reproduced in Figure 4.2below. Businesses face a higher electricity carbon price than
households, since households are not covered by policies such as the CRC and CCL.10 Gas-fired
electricity faces effectively higher carbon prices than coal-fired because the CCL, RO and CRC do not
differentiate between electricity according to the type of fuel used, treating all ‘non-renewable’
sources the same. However, estimates from DECC (2012) are that a GWh of coal-fired electricity
generates 912 tonnes of CO2 whilst a GWh of gas-fired electricity generates 392 tonnes. Finally, gas
for heating attracts a lower carbon tax than electricity. Indeed, domestic gas consumption (which in
2010 generated around 26% of UK greenhouse gas emissions)11 faces no carbon tax at all. Future
reforms look set to do little to address these differences.
10
From 2013, when the CCL is extended to cover energy generation under the ‘carbon price support’ system, households will in effect face a carbon price through the CCL as well. 11
Source: DECC emissions statistics, 2010 final UK figures (http://www.decc.gov.uk/en/content/cms/statistics/climate_stats/gg_emissions/uk_emissions/uk_emissions.aspx).
MACF
T0
TF
Cost
(households)
T0
Required total carbon abatement
Cost
(firms)
0F 0H
TH
MACH

Figure 4.2 Effective carbon prices from UK energy policies, by fuel type and end-user
Source: Advani et al. (2011b). Note: businesses are assumed to be participating in the CRC. Details of methods can be
found in Appendix B of Brewer, M., C. Emmerson and H. Miller (eds). (2011), The IFS Green Budget: February 2011
(http://www.ifs.org.uk/budgets/gb2011/11apps.pdf).
In reality, in fact, the variation in carbon prices is far more pronounced even than this. For example,
some businesses in energy-intensive industries pay 65% lower rates of CCL because they participate
in Climate Change Agreements which commit them to improve energy efficiency. Small firms, and
those large enough to participate directly in the EU ETS, are not part of the CRC policy and so will
face lower carbon prices. Non-tax instruments, including regulation, also impose implicit carbon
prices which are hard to value. Even more strikingly, households are effectively subsidised for their
energy use since they pay a reduced rate of VAT (5%) on energy bills.12 Whilst it is hard to convert
this directly into an effective value per tonne of carbon, a sense of the scale of the subsidy can be
found by looking at how much it reduces household energy bills. DECC (2011) estimate that the
average household energy bill (gas and electricity) in 2011 was £1,249. Had VAT been charged at the
full 20% rate, the bill would be £1,427, meaning the subsidy was worth around £178 to the average
household. This compares to a total estimated cost of energy and climate change policies in the
same year of just £19 on the average household bill – in other words, the VAT subsidy reduced
household energy bills by almost nine times more than energy policies increased them. The cost of
the VAT subsidy for domestic energy is estimated at around £5.5 billion per year.13
A recent study by Vivid Economics (2012) tried to draw out this more diverse set of carbon prices for
different end-use emissions for the UK and several other EU member states. They find effective
prices ranging from ‒€33/t CO2 for residential electricity (i.e. a subsidy given the reduced VAT rate)
to +€284/t CO2 for petrol. However, as we discuss in Section 4.2, the large tax rates on vehicle fuel
are not wholly ‘carbon’ taxes since a large part is probably rationalised by congestion costs.
12
Poorer households able to benefit from ‘social tariffs’ which energy companies are obligated to supply, funded by a supplement on all energy bills, face even larger subsidies. 13
See http://www.hmrc.gov.uk/stats/tax_expenditures/table1-5.pdf.
0 10 20 30 40 50 60 70
Gas (for heating) - business
Gas (for heating) - household
Gas-fired electricity - business
Gas-fired electricity - household
Coal-fired electricity - business
Coal-fired electricity - household
Effective tax rate (£/t CO2), 2011 prices 2011/12 2013/14
The much lower carbon prices faced by households than firms is almost certainly the result of fears
about the distributional impact of higher energy costs, as discussed in Section 2.14 Whilst the
variation in energy use by households with similar incomes makes it hard to design a straightforward
package to compensate poor households, it nevertheless seems extremely hard to justify such large
domestic energy subsidies from an environmental and efficiency perspective. Further, loading more
of the burden for emissions reduction on the business sector is not without its own distributional
implications, since it will lead almost certainly to higher prices for relatively energy-intensive
products. If these are a more important part of the expenditure of poorer households, then these
policies are also regressive, but in a much less straightforward and transparent way than direct
carbon pricing for household energy. Further research into this issue would be welcome.
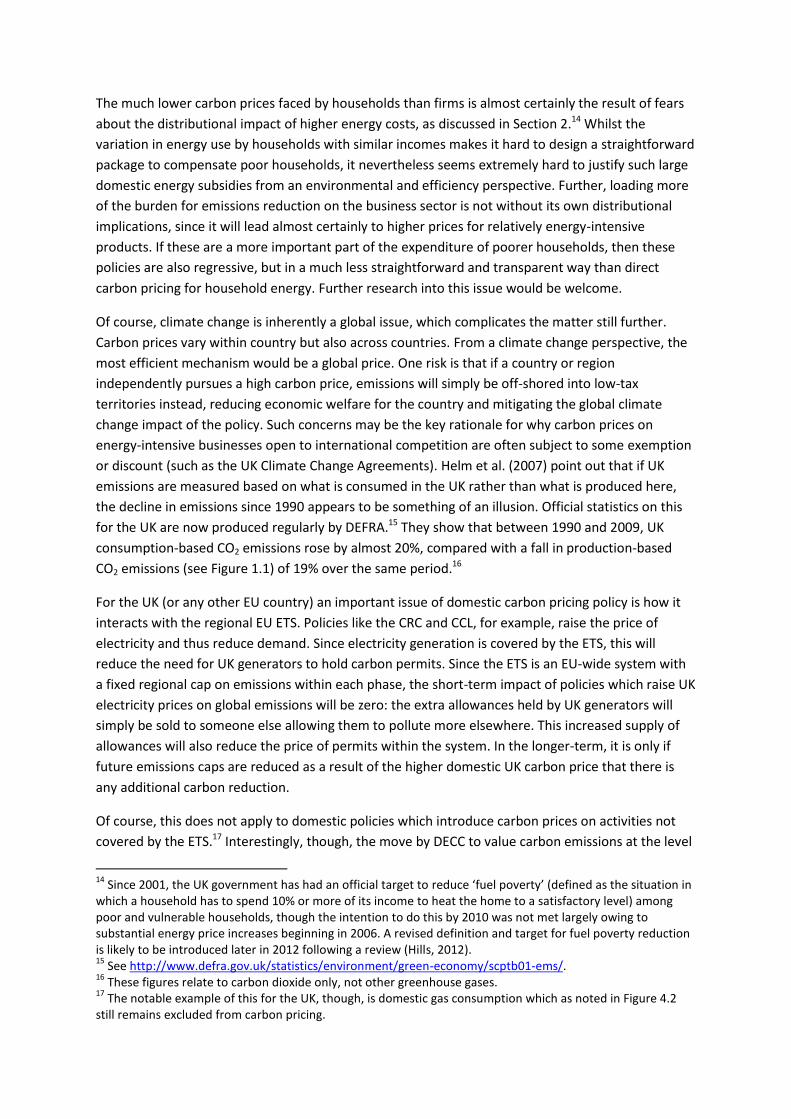
Of course, climate change is inherently a global issue, which complicates the matter still further.
Carbon prices vary within country but also across countries. From a climate change perspective, the
most efficient mechanism would be a global price. One risk is that if a country or region
independently pursues a high carbon price, emissions will simply be off-shored into low-tax
territories instead, reducing economic welfare for the country and mitigating the global climate
change impact of the policy. Such concerns may be the key rationale for why carbon prices on
energy-intensive businesses open to international competition are often subject to some exemption
or discount (such as the UK Climate Change Agreements). Helm et al. (2007) point out that if UK
emissions are measured based on what is consumed in the UK rather than what is produced here,
the decline in emissions since 1990 appears to be something of an illusion. Official statistics on this
for the UK are now produced regularly by DEFRA.15 They show that between 1990 and 2009, UK
consumption-based CO2 emissions rose by almost 20%, compared with a fall in production-based
CO2 emissions (see Figure 1.1) of 19% over the same period.16
For the UK (or any other EU country) an important issue of domestic carbon pricing policy is how it
interacts with the regional EU ETS. Policies like the CRC and CCL, for example, raise the price of
electricity and thus reduce demand. Since electricity generation is covered by the ETS, this will
reduce the need for UK generators to hold carbon permits. Since the ETS is an EU-wide system with
a fixed regional cap on emissions within each phase, the short-term impact of policies which raise UK
electricity prices on global emissions will be zero: the extra allowances held by UK generators will
simply be sold to someone else allowing them to pollute more elsewhere. This increased supply of
allowances will also reduce the price of permits within the system. In the longer-term, it is only if
future emissions caps are reduced as a result of the higher domestic UK carbon price that there is
any additional carbon reduction.
Of course, this does not apply to domestic policies which introduce carbon prices on activities not
covered by the ETS.17 Interestingly, though, the move by DECC to value carbon emissions at the level
14
Since 2001, the UK government has had an official target to reduce ‘fuel poverty’ (defined as the situation in which a household has to spend 10% or more of its income to heat the home to a satisfactory level) among poor and vulnerable households, though the intention to do this by 2010 was not met largely owing to substantial energy price increases beginning in 2006. A revised definition and target for fuel poverty reduction is likely to be introduced later in 2012 following a review (Hills, 2012). 15
See http://www.defra.gov.uk/statistics/environment/green-economy/scptb01-ems/. 16
These figures relate to carbon dioxide only, not other greenhouse gases. 17
The notable example of this for the UK, though, is domestic gas consumption which as noted in Figure 4.2 still remains excluded from carbon pricing.

consistent with the UK meeting its carbon reduction targets in itself has introduced inconsistency
into the carbon pricing regime. The carbon price for emissions covered by the ETS has to be taken as
given for the reason set out above: attempts to increase it in the UK alone will simply lead to
increases in emissions elsewhere in the system. That means it is the price of non-traded emissions
which has to adjust to meet the carbon reduction targets. The latest valuation estimates for 2012
are that a tonne of CO2 emitted in the traded sector will attract a price set by the ETS of around £14.
This then implies the value of a tonne of CO2 emissions in the non-traded sector is £56, four times as
high.18 What this suggests is that domestic carbon reduction targets for the UK are much more
stringent than those implied by the emissions caps within the ETS. To hit the domestic targets, taking
the carbon reduction within the traded sector as a given, the non-traded sector will have to abate
much more heavily than would be the case if EU-wide policy could be made consistent with UK
policy. This means that unless future ETS caps can be tightened, the cost of meeting UK carbon
targets will be met inefficiently, falling disproportionately on the non-traded sector.
4.2 Setting environmental taxes based on marginal external costs: the Landfill Tax
A difficult issue for environmental policy concerns waste disposal. Dumping waste is associated with
potentially significant external costs which, unless properly reflected in the price of landfill, will
result in too much waste being landfilled. These externalities rationalise a need for corrective
taxation, and include:
greenhouse gas emissions and other pollutants (for example, landfill accounted for around
36% of UK methane emissions in 2010);19
the risk of contamination of water systems;
environmental and other externalities associated with transporting waste to landfill;
disamenity costs to residents living near landfill sites;
social benefits not exploited if alternatives to landfill (e.g. incineration) could generate
energy in less polluting ways than other forms of energy supply.
A study commissioned by the former UK Department of the Environment (CSERGE et al., 1993)
estimated that across the whole waste stream, the average marginal external cost of landfill was £7
per tonne for ‘active’ wastes (biodegradable wastes which release emissions) and £2 per tonne for
‘inactive’ (non-biodegradable) waste. Shortly afterwards, the government announced a new Landfill
Tax payable by local authorities or other organisations wishing to dispose waste in landfill sites.20
The rates were set to match the typical marginal external cost estimated in the quantitative study:
£7 and £2 per tonne depending on the type of waste. At the time of its introduction in 1996, then,
the Landfill Tax represented an example of a new environmental tax introduced on the basis of
empirical evidence as to the scale of the various marginal external costs involved.
18
See Table 3 of http://www.decc.gov.uk/media/viewfile.ashx?filetype=4&filepath=Statistics/analysis_group/81-iag-toolkit-tables-1-29.xls&minwidth=true. 19
Source: DECC emissions statistics. 20
It is worth noting that there is no direct system in the UK that charges households for waste disposal. The costs are met by local authorities and paid for alongside other municipal services via the annual ‘council tax’ which varies by local authority and (loosely) house value. As a result, there is no direct way for local authorities to pass on this price signal to households which weakens the ability of Landfill Tax to incentivise households directly to change their behaviour.

In 1999 the European Landfill Directive was introduced.21 The Directive set targets for EU member
states to reduce volumes of waste sent to landfill, with penalties imposed for failure to hit the
objectives. For the UK, the targets were to reduce landfill by 25% compared to 1995 levels by 2010,
50% by 2013 and 65% by 2020.
Beginning in 1999, there was a steady increase in the rate of Landfill Tax for active wastes. Rates
rose by £1 per year between 1999 and 2005, then by £3 per year until 2007, and £8 per year since
then. By 2012, the rate had reached £64 per tonne, with further increases scheduled to take the rate
to £80 per tonne by 2014.22 This will be more than ten times higher than the initial rate.
Is it possible that the initial estimates of the marginal external costs of a tonne of waste sent to
landfill were more than an order of magnitude too low? It is highly likely that estimates of the
marginal climate change costs of greenhouse gas emissions would be higher now than in the 1993
CSERGE et al. estimates which gave a range of £0.86 to £5.40 per tonne of waste sent to landfill
owing to methane emissions and £0.08 to £1.27 per tonne owing to carbon dioxide emissions.
Estimates suggest that a tonne of ‘mixed municipal waste’ sent to landfill generates around 0.29
tonnes of emissions measured on a CO2 equivalent basis (Higher Education Funding Council for
England, 2012). At current non-traded carbon values of £56 per tonne, this equates to an externality
of around £16 per tonne, significantly higher than the CSERGE et al. figure, but still much below
current Landfill Tax rates. It may be that non-climate change externalities from landfill are also
higher than previously estimated, but it seems unlikely they would make up the difference given
they were smaller in scale than the climate change externalities.
Thus the primary driver of the higher Landfill Tax rates has been the need to meet the objectives laid
out in the Landfill Directive. As argued in Fullerton et al. (2010) the implication is that:
“ ... these targets [appear] not to have been based on quantitative assessment of
landfill externalities, nor on the relative external costs of different disposal
options, and measures to achieve these targets therefore imply tax rates well in
excess of marginal external costs.” (p. 495)
In other words, the Landfill Directive targets appear to be much too strict given the costs associated
with landfill.
Indeed, despite the rapid acceleration of Landfill Tax rates, there was still concern that the UK would
fail to meet the European Directive. As a result, from 2005 the government introduced a quantity-
based instrument, the Landfill Allowance Trading Scheme (LATS). This gave local authorities an
annual landfill allowance, which could be traded between authorities and had some flexibility to
bank and borrow allowances over time. The total allowances fell over time to ensure the UK
complied with the Directive. With the LATS in place, the environmental impact of the Landfill Tax
was essentially zero: the landfill allowance cap ensured a certain volume of landfill each year and the
Landfill Tax simply reduced, pound for pound, the price which authorities would be willing to pay for
allowances under the trading system.
21
See http://ec.europa.eu/environment/waste/landfill_index.htm. 22
The rate for inactive waste was increased to £2.50 per tonne in 2008, but has not changed since then.

However, in 2011 it was announced that the LATS would close from 2013 as part of the
government’s Waste Review (DEFRA, 2011). In effect, the government acknowledged that the
Landfill Tax, rather than the LATS, had become the binding economic instrument. In other words, at
current levels, Landfill Tax rates are so high that they alone will be enough to reduce landfill levels to
those compliant with the Directive. This would create an excess supply of allowance under LATS,
effectively making them worthless.23 Given this, and the fact that the Directive imposed targets that
were too severe relative to the economic costs associated with landfill, it seems very hard to
rationalise the further planned increases in Landfill Tax rates in 2013 and 2014.
4.3 Targeting the externality directly: road transport taxes
One of the key economic principles for environmental taxes discussed in Section 2 was that, as far as
possible, the tax incentive should be targeted as closely as possible on the environmental problem it
is designed to address. In the case of road transport, taxes do not appear to meet this principle at all
well, with substantial potential economic welfare benefits being available from a reformed system.
The external costs of road transport are summarised in Parry et al. (2007). They include:
Local air pollution from exhaust pipe emissions, including carbon monoxide, nitrogen
oxides, volatile organic compounds, sulphur dioxides and particulates. These pollutants are
associated with respiratory problems.
Global pollutants which contribute to climate change, such as CO2 released when vehicle
fuels are burnt.
Congestion costs imposed by an increase in traffic volumes on a given road space.
Accidents including death and injury to pedestrians and passengers and the public health
insurance costs of treating drivers, and damage to property.
Noise costs imposed on local residents living near to roads.
Road damage costs imposed by the wear and tear costs motorists contribute which affect
other motorists and road users.
As described in Section 3, motoring taxes are dominated in the UK by excise duties on vehicle fuel.
Taxes on fuel are well-suited to targeting the external costs associated with carbon emissions from
motoring: the amount of CO2 released depends almost entirely on fuel consumption. Johnson et al.
(2012) estimate that the marginal climate change externality for a litre of petrol is around 14 pence.
However, current fuel excise taxes are 57.95 pence per litre, around four times higher than the
climate change externality alone would justify. Of course, as is clear above, there are other
externalities associated with road use, but fuel use is a rather poor proxy for some of them. In
particular, congestion and noise costs depend very heavily on where and when someone drives. A
motorist driving through central London at 8am imposes a much larger marginal congestion
externality than one driving on a country road at 2am, for example. Yet both motorists face the
same rate of fuel tax, which cannot easily be varied by time or location.
Figure 4.3, reproduced from Johnson et al. (2012), highlights the problem. It draws on estimates
from the UK Department for Transport (2010) of how the total marginal external cost of motoring
23
Indeed, statistics suggest that landfill volumes in 2009 were already around one-third below those necessary to hit the 2010 target (see http://www.defra.gov.uk/news/2010/09/08/landfill-directive-target/).

(from all sources of externality) varies across different types of road with different levels of
congestion, and the proportion of all vehicle kilometres driven in each road type/congestion level
category. The chart shows the cumulative distribution of marginal externalities, with the least costly
kilometres driven on the left and the most costly on the right. It shows that, for example, roughly
90% of kilometres driven in 2010 were associated with a marginal external cost of 25 pence or less.
What is clear from the chart is that there is an enormous range of marginal externalities for different
kilometres driven in the UK. This is driven largely by variation in congestion costs. Marginal climate
change externalities vary only slightly for different kilometres, ranging from 0.35 pence to 0.46
pence depending on average fuel consumption rates on different roads. By contrast, the marginal
congestion externality varies from 0.03 pence per kilometre on uncongested motorways in rural
areas, to 240 pence on heavily congested A-roads in urban conurbations.24
The horizontal dotted line shows the rate of fuel duty expressed in pence per kilometre for a car of
average efficiency. This is assumed to be essentially the same regardless of area and congestion
level, amounting to around 5.5 pence. Of course, there will be some variation owing to the different
amount of fuel needed to travel a kilometre on more congested roads but this is likely to be small
relative to the variation in marginal congestion costs on these roads. This figure suggests that
around half of all kilometres driven in the UK are (slightly) overtaxed relative to the marginal
external cost, around a quarter taxed at roughly the right level, and around a quarter taxed too little,
in some cases substantially so.
Figure 4.3. Distribution of the marginal external costs of motoring (2010 estimates)
Source: Johnson et al. (2012) based on DfT (2010) data.
From an economic efficiency perspective, the tax per kilometre would track the distribution of
marginal external cost per kilometre as closely as possible. The clear failure of this here is caused by
the simple inability of a tax on vehicle fuel to proxy the variation in congestion externalities. The
24
Figure 4.3 will understate the range in marginal externalities. It is based on estimates of externalities and proportion of kilometres driven for 40 possible outcomes (8 road types and 5 congestion levels), but of course within these there will still be significant variation in congestion costs on particular roads at particular times.
0
25
50
75
100
125
150
175
200
225
250
0% 10% 20% 30% 40% 50% 60% 70% 80% 90% 100%
Mar
gin
al e
xter
nal
co
st (
pen
ce/k
m)
Cumulative km by marginal externality (lowest to highest)
Marginal external cost (per km)
Fuel duty (per km, average efficiency)

inescapable conclusion is that there are potentially significant efficiency gains to be made from
moving towards a system of congestion charging where motorists would be taxed per kilometre
driven with the tax rate varying over time and location. This would much more accurately target the
congestion externality and allow taxes on fuel to be reduced towards levels more commensurate
with the climate change externalities. In the UK, the review by Eddington (2006) estimated that a
sophisticated national road pricing scheme made up of 75 charging bands could generate annual
welfare gains of up to £25 billion by 2025 (2002 prices).
Of course, moving towards road pricing is fraught with practical and political difficulties, including
the likely costs of the technology needed to monitor where and when people drive and public
unwillingness for such a scheme. These issues are discussed in depth in Section 6 of Johnson et al.
(2012). However the economic case for change is overwhelming.
There is also a growing fiscal case for reform, as noted by Johnson et al. (2012) and Mirrlees et al.
(2011). Forecasts from the UK government’s independent fiscal watchdog the Office for Budget
Responsibility (2011) suggest that revenues from motoring-related taxes will decline by around 0.9%
of GDP between 2011/12 and 2020/30 (from 2.1% of national income to 1.2%, equivalent to some
£13 billion).This decline is partly driven by fuel taxes increasing less quickly than national income.
The majority of the drop, though, is explained by forecast improvements in the fuel efficiency of the
vehicle fleet. By 2030, the Committee on Climate Change (2010) estimates that the average vehicle
on the road will consume only around one-third as much fuel to cover a kilometre as the average
vehicle in 2011. Yet this forecast merely highlights the problems of using fuel taxes when the largest
externalities of road use are not fuel related: in the extreme case in which all vehicles stop using
petrol and diesel altogether and run off electric batteries, the congestion costs remain but motoring
tax revenues disappear altogether. Ultimately, it may be fiscal pressures rather than the logic of
economic efficiency that finally spurs policy makers to act.

5. Conclusions
There is a clear economic rationale for using environmental taxes. The costs of environmental
damage are not in general borne by those who produce it. Appropriately designed taxes can be
effective in changing this by ‘internalising the externality’, leading to gains in economic welfare from
pollution being at socially optimal (rather than privately optimal) levels. They can generate particular
environmental outcomes at the lowest economic cost and provide ongoing incentives for people to
reduce emissions and invest in technologies which help them to do so more cheaply. The rate at
which they are set should, in an ideal world, be based on evidence about the size of the marginal
environmental costs involved. They should be levied as closely as possible on the source of the
externality or, if this is not possible, on some market transaction that is very closely related.
This does not mean that environmental taxes are always justified or appropriate. Increasing taxes
well beyond levels that are commensurate with the externalities, or levying them on an activity
which has little to do with the environmental costs of interest, does not represent good policy
making. Well-informed, well-targeted taxes in cases where there are lots of agents each with
different marginal costs of changing their behaviour in response to the tax incentive are likely to be
the most effective use of green tax instruments. When there is a considerable premium placed on a
certain environmental outcome, then instruments including regulation and emissions trading will
also play a valuable role in environmental policy.
Relative to other policies that have similar environmental outcomes, one of the clear attractions of
environmental taxes is that they raise revenue. From an environmental perspective, policies ‘work’
by restricting output and raising prices. Regulations on emissions leave the gains from the higher
price in the hands of firms, whereas taxes at least allow the government to obtain the revenues
themselves. The revenue could be used to partly ameliorate the impact of higher prices for poorer
households, if there are concerns that the tax is likely to be regressive (though this needs to be
based on evidence rather than conjecture, not least in order to design an appropriate compensation
package). The revenue might also be used to reduce other taxes, though appeals to the idea of a
‘double dividend’ where green taxes are seen to be less distorting for labour supply decisions than
other taxes ought to be treated with considerable caution. Ultimately, environmental taxes should
be introduced or raised first and foremost because of their environmental impact.
In common with many countries, and despite the pronouncements of successive governments, the
UK has seen a fall in the importance of green taxes in total receipts over the last 15 years or so. This
is not necessarily a cause for alarm, and raising green taxes in order to hit an essentially arbitrary
target to reverse this is not a particularly sensible policy. Indeed, the scope to significantly raise the
share of revenues from green taxes in economically sensible ways may be rather limited.
This does not mean there is no case for any reform of the UK’s green tax structure. In several
important instances, there appear to be clear cases for change: treating carbon more consistently in
the tax system, re-designing the way in which transport externalities are taxed, and taking a more
evidence-based approach to waste management. Except perhaps in the carbon case, these reforms
would not necessarily lead to more green tax revenue, but they would almost certainly improve the
efficiency of the tax system and raise overall social welfare.

References
Advani, A., A. Leicester and P. Levell (2011a), Hyping Hypothecation: Should Green Tax Revenues be
Earmarked?, IFS Observation (http://www.ifs.org.uk/publications/5622)
Advani, A., P. Levell and G. Stoye (2011b), Inconsistent and Inefficient UK Carbon Prices, IFS
Observation (http://www.ifs.org.uk/publications/5927)
Bovenberg, A. and R. de Mooij (1994), ‘Environmental levies and distortionary taxation’, American
Economic Review, 84, 1085–1089
Brewer, M., J. Browne, A. Leicester and H. Miller (2010), ‘Options for fiscal tightening: tax increases
and benefit cuts’, in Chote, R., C. Emmerson and J. Shaw (eds.), The IFS Green Budget: February
2010, London: IFS (http://www.ifs.org.uk/budgets/gb2010/10chap7.pdf)
Brewer, M. and C. O’Dea (2012), Measuring Living Standards With Income and Consumption:
Evidence from the UK, IFS Working Paper W12/12, London: IFS
(http://www.ifs.org.uk/publications/6276)
Committee on Climate Change (2010), The Fourth Carbon Budget – Reducing Emissions Through the
2020s, London: Committee on Climate Change (http://www.theccc.org.uk/reports/fourth-carbon-
budget)
Committee on Climate Change (2012), Meeting Carbon Budgets – 2012 Progress Report to
Parliament, London: Committee on Climate Change (http://www.theccc.org.uk/reports/2012-
progress-report)
CSERGE, Warren Spring Laboratory and EFTEC (1993), Externalities from Landfill and Incineration,
London: HMSO
DECC (2009), Carbon Valuation in UK Policy Appraisal: a Revised Approach, London: Department for
Energy and Climate Change
(http://www.decc.gov.uk/assets/decc/what%20we%20do/a%20low%20carbon%20uk/carbon%20val
uation/1_20090715105804_e_@@_carbonvaluationinukpolicyappraisal.pdf)
DECC (2011), Estimated Impacts of Energy and Climate Change Policies on Energy Prices and Bills,
London: Department for Energy and Climate Change
(http://www.decc.gov.uk/assets/decc/11/about-us/economics-social-research/3593-estimated-
impacts-of-our-policies-on-energy-prices.pdf)
DECC (2012), Digest of UK Energy Statistics (DUKES) 2012, London: Department for Energy and
Climate Change (http://www.decc.gov.uk/assets/decc/11/stats/publications/dukes/5949-dukes-
2012-exc-cover.pdf)
DfT (2010), Transport Analysis Guidance (TAG) Unit 3.9.5: MSA Major Schemes Appraisal Road
Decongestion Benefits (http://www.dft.gov.uk/webtag/documents/expert/pdf/unit3.9.5.pdf)
Dresner, S. and P. Ekins (2006), ‘Economic instruments to improve UK home energy efficiency
without negative social impacts’, Fiscal Studies, 27 (1), 47–74

Eddington, R. (2006), The Eddington Transport Study, London: Department for Transport
Environmental Audit Committee (2011), Budget 2011 and Environmental Taxes: Sixth Report of
Session 2010–12, Volume I, London: the Stationery Office Limited
(http://www.publications.parliament.uk/pa/cm201012/cmselect/cmenvaud/878/878.pdf)
Eurostat (2001), Environmental Taxes – a Statistical Guide, Luxembourg: Office for Official
Publications of the European Communities
(http://epp.eurostat.ec.europa.eu/portal/page/portal/environmental_accounts/documents/2.pdf)
Fullerton, D., A. Leicester and S. Smith (2010), ‘Environmental taxation’, in Mirrlees, J., S. Adam, T.
Besley, R. Blundell, S. Bond, R. Chote, M. Gammie, P. Johnson, G. Myles and J. Poterba (eds.),
Dimensions of Tax Design: the Mirrlees Review, Oxford: Oxford University Press
(http://www.ifs.org.uk/mirrleesreview/dimensions/ch5.pdf)
Gneezy, U. and A. Rustichini (2000), ‘A fine is a price’, Journal of Legal Studies, 29 (1), 1–17
Hardisty, D., E. Johnson and E. Weber (2010), ‘A dirty word or a dirty world? Attribute framing,
political affiliation and query theory’, Psychological Science, 21 (1), 86–92
Helm, D., R. Smale and J. Phillips (2007), Too Good to be True? The UK’s Climate Change Record
(http://www.dieterhelm.co.uk/sites/default/files/Carbon_record_2007_1.pdf)
Higher Education Funding Council for England (2012), Measuring Scope 3 Carbon Emissions – Water
and Waste: a Guide to Good Practice (available from
http://www.hefce.ac.uk/pubs/rereports/year/2012/scope3carbon/)
Hills, J. (2012), Getting the Measure of Fuel Poverty: Final Report of the Fuel Poverty Review, Centre
for the Analysis of Social Exclusion Report 72, London: CASE
(http://www.decc.gov.uk/assets/decc/11/funding-support/fuel-poverty/4662-getting-measure-fuel-
pov-final-hills-rpt.pdf)
Johnson, P., A. Leicester and P. Levell (2010), Environmental Policy Since 1997, IFS Briefing Note 94,
London: IFS (http://www.ifs.org.uk/bns/bn94.pdf)
Johnson, P., A. Leicester and G. Stoye (2012), Fuel for Thought: The What, Why and How of Motoring
Taxation, London: RAC Foundation
(http://www.racfoundation.org/assets/rac_foundation/content/downloadables/fuel_for_thought-
johnson_et_al-150512.pdf)
Leicester, A. (2006), The UK tax system and the environment, IFS Report 68, London: IFS
(http://www.ifs.org.uk/comms/r68.pdf)
Leicester, A., P. Levell and I. Rasul (2012), Tax and Benefit Policy: Insights from Behavioural
Economics, IFS Commentary C125, London: IFS (http://www.ifs.org.uk/comms/comm125.pdf)
Leicester, A. and C. O’Dea (2008), ‘Aviation taxes’, in Chote, R., C. Emmerson, D. Miles and J. Shaw
(eds.), The IFS Green Budget: January 2008, London: IFS
(http://www.ifs.org.uk/budgets/gb2008/08chap9.pdf)

Li, S., J. Linn and E. Muehlegger (2012), Gasoline Taxes and Consumer Behavior, NBER Working Paper
17891 (http://www.nber.org/papers/w17891)
Meyer, B. and J. Sullivan (2012), ‘Identifying the disadvantaged: official poverty, consumption
poverty and the new Supplemental Poverty Measure’, Journal of Economic Perspectives, 26 (3), 111–
136
Mirrlees, J., S. Adam, , T. Besley, R. Blundell, S. Bond, R. Chote, M. Gammie, P. Johnson, G. Myles and
J. Poterba (2011), Tax By Design: the Mirrlees Review, Oxford: Oxford University Press
(http://www.ifs.org.uk/mirrleesreview/design/taxbydesign.pdf)
Office for Budget Responsibility (2011), Fiscal Sustainability Report: July 2011, London: The
Stationery Office Limited
(http://budgetresponsibility.independent.gov.uk/wordpress/docs/FSR2011.pdf)
Parry, I., M. Walls and W. Harrington (2007), ‘Automobile externalities and policies’, Journal of
Economic Literature, 45 (2), 373–399
Pigou, A. (1920), The Economics of Welfare, London: Macmillan
(http://www.econlib.org/library/NPDBooks/Pigou/pgEW.html)
Terkla, D. (1984), ‘The efficiency value of effluent tax revenues’, Journal of Environmental Economics
and Management, 11, 107–123
Vivid Economics (2012), Carbon Taxation and Fiscal Consolidation: the Potential of Carbon Pricing to
Reduce Europe’s Fiscal Deficits, report prepared for the European Climate Foundation and Green
Budget Europe (http://www.vivideconomics.com/uploads/reports/fiscal-consolidation-and-carbon-
fiscal-measures/Carbon_taxation_and_fiscal_consolidation.pdf)
Weitzman, M. (1974), ‘Prices versus quantities’, Review of Economic Studies, 41, 477–491