Embed Size (px)
Citation preview
Environmental Sustainability of Canadian AgricultureAgri-Environmental Indicator Report Series
Report #2
© Her Majesty the Queen in Right of Canada, 2005
To obtain additional copies:
Publications Section
Agriculture and Agri-Food Canada
Sir John Carling Building
930 Carling Avenue
Ottawa, Ontario K1A 0C5
(613) 759-6626
This publication is also available electronically on the World Wide Web at the following address: http://www.agr.gc.ca/env/naharp-pnarsa/index_e.php
Canadian Cataloguing in Publication Data
Main entry under title:Environmental Sustainability of Canadian Agriculture: Agri-Environmental Indicator Report Series – Report #2
Issued also in French under title:L’agriculture écologiquement durable au Canada : Série sur les indicateurs agroenvironnementaux – Rapport No 2
Cat. No. A22-201/2005E
ISBN 0-662-42205-8
AAFC No. 10081E
This report can be cited as follows:Lefebvre, A., W. Eilers, et B. Chunn (eds.), 2005. Environmental Sustainability of Canadian Agriculture: Agri-Environmental IndicatorReport Series – Report #2. Agriculture and Agri-Food Canada, Ottawa, Ontario.
Each chapter can be cited as follows:[Name(s) of chapter author(s)]. 2005. [Chapter heading]. Pages […] – […] in Lefebvre, A., W. Eilers, et B. Chunn (eds.). 2005.Environmental Sustainability of Canadian Agriculture: Agri-Environmental Indicator Report Series – Report #2. Agriculture and Agri-Food Canada, Ottawa, Ontario.
Printed on recycled paper
Environmental Sustainability of Canadian AgricultureAgri-Environmental Indicator Report Series
Report #2
A. Lefebvre, W. Eilers, and B. Chunn (editors)
Agriculture and Agri-Food Canada
2005

Contents i
ContentsA Word from the Minister of Agriculture and Agri-Food Canada . . . . . . . . . . . . . . . . . . . . . . . . . . . iii
Executive Summary . . . . . . . . . . . . . . . . . . . . . . . . . . . . . . . . . . . . . . . . . . . . . . . . . . . . . . . . . . . . . . . iv
A) INTRODUCTION 1. Introduction . . . . . . . . . . . . . . . . . . . . . . . . . . . . . . . . . . . . . . . . . . . . . . . . . . . . . . . . . . . . . . 2
2. Assessing the Environmental Sustainability of Agriculture . . . . . . . . . . . . . . . . . . . . . . . . . . 7
3. Driving Forces Affecting the Environmental Sustainability of Agriculture . . . . . . . . . . . . . 18
4. Overview of Agriculture in Canada . . . . . . . . . . . . . . . . . . . . . . . . . . . . . . . . . . . . . . . . . . . 24
5. Linking Science to Policy . . . . . . . . . . . . . . . . . . . . . . . . . . . . . . . . . . . . . . . . . . . . . . . . . . . 36
B) ENVIRONMENTAL FARM MANAGEMENT6. Agriculture Land Use Change . . . . . . . . . . . . . . . . . . . . . . . . . . . . . . . . . . . . . . . . . . . . . . . . 42
7. Farm Environmental Management Practices . . . . . . . . . . . . . . . . . . . . . . . . . . . . . . . . . . . . 49
8. Soil Cover . . . . . . . . . . . . . . . . . . . . . . . . . . . . . . . . . . . . . . . . . . . . . . . . . . . . . . . . . . . . . . . 61
9. Nitrogen Use Efficiency . . . . . . . . . . . . . . . . . . . . . . . . . . . . . . . . . . . . . . . . . . . . . . . . . . . . 69
10. Energy Use Efficiency . . . . . . . . . . . . . . . . . . . . . . . . . . . . . . . . . . . . . . . . . . . . . . . . . . . . . . 76
11. Water Use Efficiency: Irrigation . . . . . . . . . . . . . . . . . . . . . . . . . . . . . . . . . . . . . . . . . . . . . . 83
12. Integrated Pest Management . . . . . . . . . . . . . . . . . . . . . . . . . . . . . . . . . . . . . . . . . . . . . . . . 85
C) SOIL QUALITY13. Soil Erosion . . . . . . . . . . . . . . . . . . . . . . . . . . . . . . . . . . . . . . . . . . . . . . . . . . . . . . . . . . . . . . 90
14. Soil Organic Carbon . . . . . . . . . . . . . . . . . . . . . . . . . . . . . . . . . . . . . . . . . . . . . . . . . . . . . . 108
15. Soil Salinity . . . . . . . . . . . . . . . . . . . . . . . . . . . . . . . . . . . . . . . . . . . . . . . . . . . . . . . . . . . . . 114
16. Trace Elements . . . . . . . . . . . . . . . . . . . . . . . . . . . . . . . . . . . . . . . . . . . . . . . . . . . . . . . . . . 119
ii
D) WATER QUALITY17. Nitrogen . . . . . . . . . . . . . . . . . . . . . . . . . . . . . . . . . . . . . . . . . . . . . . . . . . . . . . . . . . . . . . . 124
18. Phosphorus . . . . . . . . . . . . . . . . . . . . . . . . . . . . . . . . . . . . . . . . . . . . . . . . . . . . . . . . . . . . . 131
19. Pesticides . . . . . . . . . . . . . . . . . . . . . . . . . . . . . . . . . . . . . . . . . . . . . . . . . . . . . . . . . . . . . . . 136
20. Pathogens . . . . . . . . . . . . . . . . . . . . . . . . . . . . . . . . . . . . . . . . . . . . . . . . . . . . . . . . . . . . . . 138
E) AIR QUALITY21. Greenhouse Gases . . . . . . . . . . . . . . . . . . . . . . . . . . . . . . . . . . . . . . . . . . . . . . . . . . . . . . . .142
22. Ammonia . . . . . . . . . . . . . . . . . . . . . . . . . . . . . . . . . . . . . . . . . . . . . . . . . . . . . . . . . . . . . . .149
23. Particulate Matter . . . . . . . . . . . . . . . . . . . . . . . . . . . . . . . . . . . . . . . . . . . . . . . . . . . . . . . .153
F) BIODIVERSITY24. Wildlife Habitat on Farmland . . . . . . . . . . . . . . . . . . . . . . . . . . . . . . . . . . . . . . . . . . . . . . .158
25. Wildlife Damage to Crops and Livestock . . . . . . . . . . . . . . . . . . . . . . . . . . . . . . . . . . . . . .165
26. Invasive Alien Species . . . . . . . . . . . . . . . . . . . . . . . . . . . . . . . . . . . . . . . . . . . . . . . . . . . . .168
27. Soil Biodiversity . . . . . . . . . . . . . . . . . . . . . . . . . . . . . . . . . . . . . . . . . . . . . . . . . . . . . . . . . .171
G) FOOD AND BEVERAGE INDUSTRY28. Energy Use and Greenhouse Gas Emission . . . . . . . . . . . . . . . . . . . . . . . . . . . . . . . . . . . . .176
29. Water Use and Effluent Generation . . . . . . . . . . . . . . . . . . . . . . . . . . . . . . . . . . . . . . . . . . .180
30. Organic Solid Residues and Packaging Wastes . . . . . . . . . . . . . . . . . . . . . . . . . . . . . . . . . .184
H)NATIONAL AND REGIONAL SUMMARY31. National and Regional Summary . . . . . . . . . . . . . . . . . . . . . . . . . . . . . . . . . . . . . . . . . . . . 190
I) ANNEXESGlossary . . . . . . . . . . . . . . . . . . . . . . . . . . . . . . . . . . . . . . . . . . . . . . . . . . . . . . . . . . . . . . . . . . . 206
Contributing Authors . . . . . . . . . . . . . . . . . . . . . . . . . . . . . . . . . . . . . . . . . . . . . . . . . . . . . . . . 212
Acknowledgements . . . . . . . . . . . . . . . . . . . . . . . . . . . . . . . . . . . . . . . . . . . . . . . . . . . . . . . . . . 215
Environmental Sustainability of Canadian Agriculture: Agri-Environmental Indicator Report Series—Report #2
iii
The environmental challenges of today in agriculture are many and complex. As a result,decision makers at all levels need reliable information to better understand and managethe links between human activity, the economy and the environment.
To better assess the impact of agricultural policies on the environment, in 1993Agriculture and Agri-Food Canada began developing science-based environmental indicators for the agriculture and agri-food sector. As these tools have improved, so toohas our ability to help guide and measure the environmental performance of the sector. In2000, we published the first agri-environmental indicator report.
As Minister of Agriculture and Agri-Food Canada, I am pleased to present this secondreport on national agri-environmental indicators. This report provides an updated pictureof the progress that Canadian agriculture has made in both conserving the naturalresource base upon which it depends, as well as supporting surrounding natural ecosystems. It also informs us about more work that must be done. By doing this, thereport can help us tackle the environmental challenges of our day—challenges that callupon us to find better ways to improve productivity and competitiveness, while ensuringthat whatever we do sustains a healthy environment.
Agriculture and Agri-Food Canada will continue to work closely with producers and partners to generate this important information. In so doing, we will contribute to building the foundation of the environmental policies and programs of the future, andensuring Canada’s place as the world leader in environmentally responsible agricultureproduction.
Andy Mitchell
MESSAGE FROM THE MINISTEROF AGRICULTURE AND AGRI-FOOD
iv Environmental Sustainability of Canadian Agriculture: Agri-Environmental Indicator Report Series—Report #2
CONTEXTThe agriculture and agri-food industry operatesin close connection with the surrounding environment. Environmental sustainability— producing and processing food and fibre in a way that protects or enhances the naturalresources which support production and is compatible with the surrounding natural systems—is therefore not a new concept for the sector. Producers have for a long time been adopting technologies, production strate-gies and beneficial management practices thatimprove their environmental performance.
In recent decades, globalization, market pressuresand technological innovations have spurredCanadian agriculture to increase output and productivity. This has engendered structuralchanges in the industry, characterized by theadoption of new technologies and a gradual shift towards larger, more intensified operations.Social preferences of Canadians have alsoevolved, and concerns have been raised about the possible impact of food production on theenvironment—on soil, water and air quality, and biodiversity. Canadians have supported agrowing array of domestic and internationalagreements, regulations and research programsdesigned to protect the environmental systemswith which agriculture interacts. Agriculturetoday has to balance a wide range of continuallyevolving environmental demands and expec-tations. Achieving the goal of long-termenvironmental sustainability has become a more pressing challenge and one that involvesincreasingly complex issues.
Farmers, governments and other stakeholders in Canada’s agricultural industry have becomeincreasingly aware of the need to integrate environmental factors into their decision-making processes. Decision makers at all levelsshare a common need for objective informationon the current environmental performance ofthe agricultural sector, to determine whetherthis performance is satisfactory and how it islikely to behave in response to the decisionsthey make.
AGRI-ENVIRONMENTALINDICATORS
Agriculture and Agri-Food Canada has developeda set of agri-environmental indicators (AEIs) specific to the agriculture and agri-food sector toassess how well agriculture and agri-food systemsmanage and conserve natural resources and howcompatible they are with the natural systemsand processes in the broader environment. These AEIs are a practical means of assessingenvironmental sustainability by combining current scientific knowledge and understandingwith available information on resources and agricultural practices. The intent is to provide an objective, science-based assessment of theoverall environmental sustainability of agricul-ture. These agri-environmental indicators canthen be used to:
• track progress and measure performance inachieving priority environmental objectives;
• draw public attention to important environmental issues;
• translate scientific knowledge and research results into a form that can be understood and used by citizens anddecision makers; and
• educate students and citizens interested inunderstanding agri-environmental issuesand their implications.
Agri-environmental indicators are calculatedusing mathematical models or formulas thatintegrate biophysical information (on soil, climate and landscape) with land use and farmmanagement data generalized to portray certainenvironmental conditions in the landscape at a given time. They are primarily intended toprovide information on a national, provincialand regional scale, in a manner that is both sensitive to regional variations in agricultureand consistent across Canada. However, to make national assessments, it is necessary towork at broad temporal and spatial scales and touse units that are usually not homogeneous interms of either farm management practices orbiophysical conditions. The aggregated resultmay therefore obscure local reality, and because
Executive Summary
vExecutive Summary
of this the indicators cannot be interpreted asshowing any specific on-site conditions such as at an individual farm.
A first set of AEI results was published in 2000covering a 15-year period (1981 to 1996).Building on this initial work, and in light of current and future needs for this kind ofinformation, AAFC established the NationalAgri-Environmental Health Analysis andReporting Program (NAHARP) to strengthen itscapacity to develop AEIs and tools to integratethem with policy development. This report, thesecond of the Agri-Environmental Indicator ReportSeries, can be viewed as an incremental steptowards the objective of periodically reportingon the environmental sustainability of Canadianagriculture. The work on agri-environmentalindicators involves a process of continuousimprovement, and most of the indicators fromthe first report have been updated, extendingthe temporal coverage to 2001. Improvementshave also been made to existing methodologiesand datasets, which means that results andtrends for these indicators have been re-assessedfor the entire 20-year period covered (1981 to2001). This second report also provides informa-tion on new indicators that are in various stagesof development and are expected to generateresults in the near future.
SUMMARY OF RESULTSThe AEIs included in this report focus on fourkey components of the environmental sustain-ability of primary agriculture: soil quality, waterquality, air quality and biodiversity. The resultsreveal some consistent national trends, as wellas considerable differences in various agri-environmental conditions across Canada.Overall, the results suggest that considerableprogress has been achieved towards environ-mental sustainability, but that further expansionand intensification of cropping and livestockproduction has the potential to exacerbate theenvironmental risks unless appropriate actionsare taken to manage them. The main AEI resultsfor the period 1981 to 2001 can be summarizedas follows:
• Environmental farm management: This component consists of five indicators,including three that currently providenational coverage (Soil Cover, Residual Soil
Nitrogen and Energy Use Efficiency). Resultsare mixed, with soil cover showing overallimprovement, whereas nitrogen use effi-ciency and energy use efficiency havedeclined. The two other indicators are stillunder development (Water Use Efficiency:Irrigation and Integrated Pest Management).
• Soil quality: There are five soil qualityindicators with results, including separateindicators for assessing the risk of soil erosion by water, wind and tillage. The Soil Organic Carbon Change Indicator tracks changes in soil carbon content, andestimates CO2 sequestration in agriculturalsoils. The Risk of Soil Salinization Indicator is designed to assess the change in soil salinity on the Prairies. All five indicatorsshowed improvement, with a majority ofland in the very low risk classes for erosionand salinity and most land falling into theincreasing classes for soil organic carbonchange. An additional indicator, the Risk of Soil Contamination by Trace Elements, is being developed to gain a better under-standing of how agricultural managementpractices can affect the levels of trace elements in the soil and change theirbioavailability.
• Water quality: On the water quality front, two separate indicators were used toassess the Risk of Water Contamination byNitrogen and by Phosphorus, taking intoaccount changes in land use (e.g. shifts incrop area) and management practices (e.g.fertilizer inputs). Mixed results were obtainedfor these two indicators. While close to two-thirds of the land shows a low or very low risk of water contamination bynitrogen, the 20-year trend is worsening. By contrast, the trend for the risk of watercontamination by phosphorus (Quebeconly) is improving, although only a third of farmland is in the lowest risk classes. Twoadditional indicators, dealing with pesticidesand pathogens, are still under development.
• Air quality: One air quality indicator is currently available—the AgriculturalGreenhouse Gas Budget estimates green-house gas (nitrous oxide, methane andcarbon dioxide) emissions from agriculturalsources. The indicator shows a positive
13
vi
national trend, with a 4% reduction in netGHG emissions during the period underreview. This trend is largely attributable toan increase in soil carbon sequestration,which compensated for a rise in nitrousoxide and methane emissions. Work is con-tinuing on the development of indicatorsfor measuring agricultural emissions ofammonia and particulate matter.
• Biodiversity: Biodiversity is assessed using the Indicator of Wildlife Habitaton Farmland, which provides insight intotrends in wildlife habitat availability onCanadian farms. Somewhat negative resultswere obtained for this indicator, with more
farmland showing a decreasing trend inhabitat capacity than a rising trend. Severalother indicators are currently under develop-ment: risk of wildlife damage; invasive alienspecies; and soil biodiversity.
• Food and Beverage Industry: AAFC’s science-based indicator approach is beingexpanded to include eco-efficiency indicatorsfor the food and beverage industry as well.These indicators, still under development,will cover the following environmentalissues: energy use and greenhouse gas emis-sions; water use and effluent generation; andorganic solid residues and packaging wastes.
Environmental Sustainability of Canadian Agriculture: Agri-Environmental Indicator Report Series—Report #2
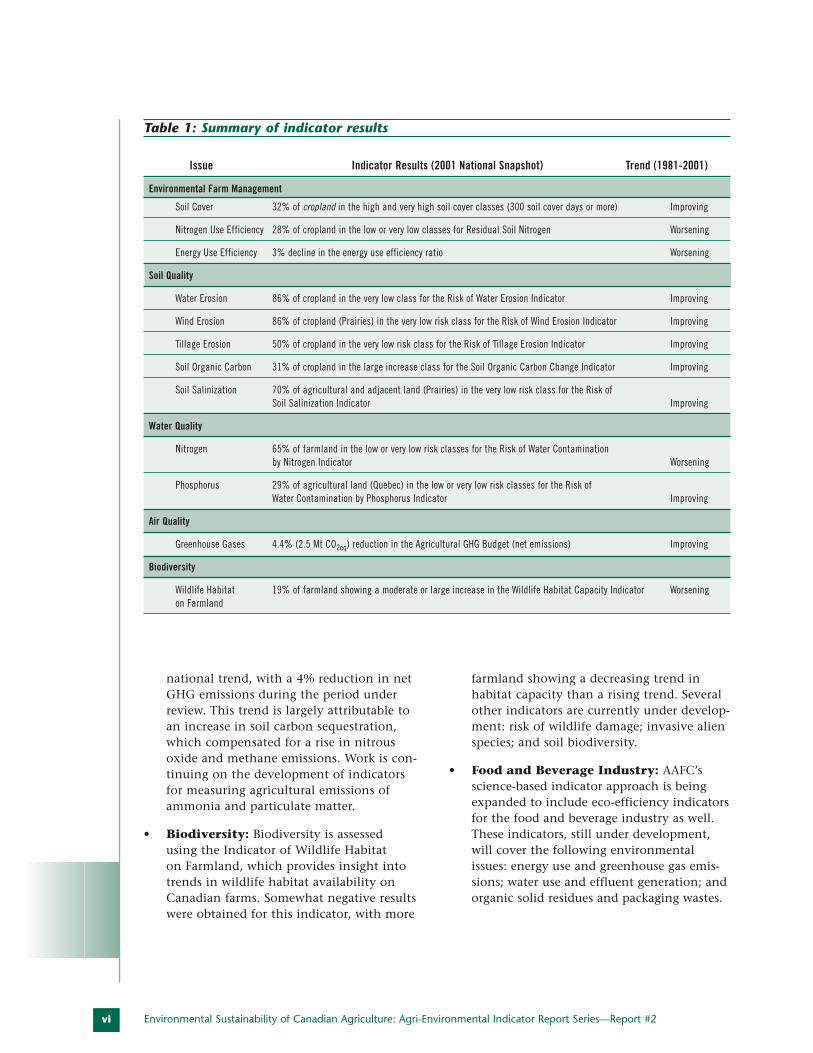
Issue Indicator Results (2001 National Snapshot) Trend (1981-2001)
Environmental Farm Management
Soil Cover 32% of cropland in the high and very high soil cover classes (300 soil cover days or more) Improving
Nitrogen Use Efficiency 28% of cropland in the low or very low classes for Residual Soil Nitrogen Worsening
Energy Use Efficiency 3% decline in the energy use efficiency ratio Worsening
Soil Quality
Water Erosion 86% of cropland in the very low class for the Risk of Water Erosion Indicator Improving
Wind Erosion 86% of cropland (Prairies) in the very low risk class for the Risk of Wind Erosion Indicator Improving
Tillage Erosion 50% of cropland in the very low risk class for the Risk of Tillage Erosion Indicator Improving
Soil Organic Carbon 31% of cropland in the large increase class for the Soil Organic Carbon Change Indicator Improving
Soil Salinization 70% of agricultural and adjacent land (Prairies) in the very low risk class for the Risk ofSoil Salinization Indicator Improving
Water Quality
Nitrogen 65% of farmland in the low or very low risk classes for the Risk of Water Contamination by Nitrogen Indicator Worsening
Phosphorus 29% of agricultural land (Quebec) in the low or very low risk classes for the Risk of Water Contamination by Phosphorus Indicator Improving
Air Quality
Greenhouse Gases 4.4% (2.5 Mt CO2eq) reduction in the Agricultural GHG Budget (net emissions) Improving
Biodiversity
Wildlife Habitat 19% of farmland showing a moderate or large increase in the Wildlife Habitat Capacity Indicator Worseningon Farmland
Table 1: Summary of indicator results
AIntroduction
ENVIRONMENTAL SUSTAINABILITY: A PRIORITY IN AGRICULTURE
Sustainable development is a concept that integrates environmental, economic and socialinterests in a way that allows today’s needs to be met without compromising the ability offuture generations to meet their own needs. Inthe agriculture and agri-food sector, sustainabledevelopment calls for ways of producing andprocessing food and fibre that protect orenhance the natural resources which supportagricultural production, are compatible with surrounding natural systems and processes, contribute to the economic and social well-being of all citizens, ensure a safe and high-quality supply of agricultural products and safeguard the livelihood and well-being ofagricultural and agri-food businesses, workersand their families (Agriculture and Agri-FoodCanada 2003). This report focuses on environ-mental sustainability which is a key aspect of sustainable development in agriculture.
The agriculture and agri-food industry has aclose connection with the environment, andenvironmental issues are not new to the sector.Canadians generally appreciate the environmen-tal benefits that agriculture provides, includingwildlife habitat, beautiful landscapes and naturalprocesses such as nutrient cycling, and water storage and filtering. In recent decades, how-ever, Canada’s agricultural industry has seensignificant changes, with the adoption of newtechnologies and a gradual shift towards larger,more intensified operations, in order to meetthe growing global demand for agriculturalproducts and to increase the country’s share of global markets. These changes have raisedquestions about the implications of expandedproduction for the long-term sustainability of cropping practices and about the potential for environmental costs, such as declining water quality, loss of wildlife habitat, reducedbiodiversity and greenhouse gas emissions. In light of the growing concerns, all sectors of agricultural production and processing arebeing urged to maintain acceptable levels ofenvironmental stewardship. In some cases,
heightened public concern now poses a directconstraint to agricultural growth. Furthermore,since globalization of markets has exposedCanadian agricultural products to greater numbers of consumers, these same concerns areexpected to increasingly affect the sector’s abilityto retain and compete for international markets.
Consequently, agriculture today must balance awide and continually evolving array of demandsand environmental challenges. Governments,farmers and other stakeholders are workingtogether to promote research, programming and related actions to address environmentalconcerns. The initial focus on conserving thenatural resource base upon which agriculturedepends—particularly soil, water and geneticresources for crops and livestock—has broadenedto include other priority areas such as nutrientsurpluses, the entry of pesticides and pathogensinto water, the loss of soil organic matter, therelease of particulate matter, odours and green-house gases, wildlife habitat availability andconservation of species at risk. Achieving thegoal of long-term environmental sustainabilityin the agriculture and agri-food sector hasbecome a more pressing challenge and one that involves increasingly complex issues.
INFORMATION FOR DECISION-MAKING: THEROLE OF INDICATORS
The individual decisions of Canada’s agriculturalproducers and processors have a direct influenceon environmental sustainability. These decisionsare influenced by a variety of factors and stake-holders beyond the farm gate. Governmentsinfluence decisions through the development of agricultural policies and programs, researchersdevelop new technologies for improved produc-tivity and sustainability, and consumers influencethe marketplace through their purchasingchoices. Farmers, governments, researchers, environmentalists, processors and consumers areall concerned about ensuring the sustainability of Canada’s agriculture industry and each ofthese different groups can influence the outcomeof this undertaking in unique ways. However,they all share a common need for environmentalinformation.
2 Environmental Sustainability of Canadian Agriculture: Agri-Environmental Indicator Report Series—Report #2
AUTHOR:
A. Lefebvre
1. Introduction
ADAPTEDFROM:
McRae, 2000
3A. Introduction
Decision makers at all levels need objective and reliable information on the current andexpected future evolution of environmental performance in the agricultural sector. Theyneed to know whether the current performanceis satisfactory and how it is likely to behave inresponse to the decisions they make. If giventhis type of information, decision makers arelikely to have a better understanding of the pressures they face and of the needs and opportunities to change the system.
Historically, governments and all sectors of economic activity have invested considerableresources to promote economic development andthe use of systematic approaches and indicatorsfor measuring economic performance. Theseapproaches have, however, largely ignored envi-ronmental impacts, and the most commonlyused economic indicators do not considerchanges in the value of environmental assets and services. As a result, decision makers whorely solely on such indicators run the risk ofachieving economic goals at the expense of environmental and other objectives. To address this problem, work is now under way to develop environmental indicators and tools for integrating these environmental indicatorswith economic and social information, in orderto better understand and manage the linksbetween human activity, the environment and the economy.
Environmental indicators are typically designedto measure and represent trends related to signifi-cant aspects of environmental sustainability such as the stresses that impact ecosystems, theresponse of ecosystems to change and societalactions to prevent or reduce these stresses. Whileindicators have often been described as “earlywarning signals” for emerging environmentalconcerns, they have also been criticized for fail-ing to live up to this expectation. In reality, bythe time environmental data are available andwork has begun on a specific indicator, the envi-ronmental concern of interest is often no longeran “emerging” issue; instead it may have becomea fairly high priority for the general public andpolicy makers alike (Bond et al. 2005). More
appropriate expectations for environmental indicators would typically be along the lines of:
• tracking progress and measuring perform-ance in achieving priority environmentalobjectives;
• drawing public attention to important environmental issues;
• translating scientific knowledge and research results into a form that can beunderstood and used by citizens and decision makers; and
• educating students and citizens interested in understanding environmental issues andtheir implications.
In 1993, in response to the need for agri-environmental information and to assess theimpact of agricultural policies on the environ-ment, Agriculture and Agri-Food Canada began to develop a set of science-based environmentalindicators specific to the agriculture and agri-foodsector. These agri-environmental indicators (AEIs)are designed to:
• inform agricultural and other decision makers about environmental performance in agriculture;
• determine how environmental conditionswithin agriculture are changing over time;
• provide information on the impact of theadoption of stewardship principles and onthe use of environmentally sound practices;
• support the development of strategies andactions targeted at areas and resources thatremain at environmental risk; and
• facilitate the environmental analysis of agricultural policies and programs and the monitoring of their performance.
A first set of AEI results was published inFebruary 2000, in the report, EnvironmentalSustainability of Canadian Agriculture: Report of the Agri-Environmental Indicator Project(McRae et al. 2000).
4
Building on this initial work, and in light of current and future needs for this kind of information, AAFC has established theNational Agri-Environmental Health Analysisand Reporting Program (NAHARP). Its purpose is to strengthen departmental capacity todevelop and continuously enhance AEIs and tools to integrate these indicators with policy development, using the following three complementary approaches:
1) Update the existing set of AEIs by enhancingmethodologies and underlying data whenappropriate and possible and develop newindicators to address key gaps in environmen-tal information in the agricultural productionand food processing sectors.
2) Improve the quality and reliability of tools thatintegrate agri-environmental indicators witheconomic information. While indicators pro-vide a historical perspective on environmentalperformance, this integrated economic/envi-ronmental modelling provides an improvedpredictive capacity for testing different scenarios, for example, to better understandhow changes to agricultural policies and programs may affect the sector’s future environmental performance.
3) Develop the capacity to quantify the eco-nomic costs and benefits of environmentalimpacts in agriculture, for both farmers andsociety. There are no market mechanisms for determining the value of many impacts of agriculture on the environment, such as water quality, and wildlife habitat. Byassigning an economic value to these issues,we will be able to perform quantitative trade-off analyses of environmental versuseconomic impacts.
Agriculture is linked to many global environmen-tal issues, and agricultural products are a keyelement of global trade. Consequently, severalinternational agencies are also working todevelop and use environmental indicators foragriculture. The use of international indicatorsarises from the need to better understand thehealth of the global environment, to guide and evaluate international efforts to reduce environmental stresses and to help ensure thatcountries do not distort global markets andenhance their competitiveness through lax
environmental standards or environmentallyharmful subsidies. One international organizationin particular, the Organisation for Economic Co-operation and Development (OECD) is co-ordinating efforts among its member countriesto develop a set of agri-environmental indicatorsthat are based on consistent and compatiblemethodologies. The OECD’s indicators are beingdeveloped to:
• provide information on the current stateand changes in environmental conditionswithin agriculture;
• better understand the linkages between theenvironmental impacts of agriculture, agri-cultural policy reform, trade liberalizationand environmental measures along with theassociated causes, and guide the responses to changes in environmental conditions;
• evaluate the effectiveness of policies addressing agri-environmental concerns and promoting sustainable agriculture(Organisation for Economic Co-operationand Development 2001).
The development of environmental indicators atthe international level is especially challengingbecause of differences in environmental condi-tions, economic activity, national priorities andavailability of data across countries. ThroughAAFC’s work on agri-environmental indicators,Canada actively contributes to OECD efforts and benefits from the co-operation and exchangeof results.
THE AGRI-ENVIRONMENTALINDICATORS REPORT
Objectives of this report
This comprehensive report on national agri-environmental indicators is the second in whatis envisioned to be periodic reporting on theenvironmental sustainability of Canadian agri-culture. Its main objective is to communicatethe results of work based on the concept of agri-environmental indicators and to attempt to answer some fundamental questions:
• To what extent do farmers and food processors use environmentally sound management practices?
Environmental Sustainability of Canadian Agriculture: Agri-Environmental Indicator Report Series—Report #2
5A. Introduction
• How are environmental conditions andtrends within agriculture changing overtime?
• What areas and resources remain at significant environmental risk?
As already indicated, the first report of the serieswas published in 2000. It presented results for asuite of 14 indicators, typically reporting trendsfor the period 1981 to 1996. This second reportcan be viewed as an intermediate step towardsthe objective of reporting on a comprehensiveset of AEIs for Canada. Most of the indicatorsfrom the first report have been updated, extend-ing the temporal coverage to 2001. Much of thetext and reporting style for the indicators havebeen maintained or adapted from the firstreport, to ensure continuity. The present reportalso provides information on new AEIs that arein various stages of development.
The report is intended for all persons interestedin the environmental sustainability of Canadianagriculture, particularly decision makers, keepingin mind that different stakeholders have differentconcerns and operate at different levels. Forexample, farmers decide which production strategies to use on their farms. Farm leaders andgovernment policy makers interact with broadergroups of producers, such as commodity groupsor producer groups within particular regions, and deal with outside developments that affectagriculture (i.e. international environmental andtrade agreements). And environmentalists areconcerned with the developments within specificregions, specific environmental threats from agriculture or the health of specific componentsof the environment.
Often, these different stakeholders seek differentpolicy outcomes and compete for attention onwhat can be a crowded and complex policyagenda. The objective of this report is neither to promote nor to reject various claims related to the environmental sustainability of the agriculture and agri-food sector. The intent is to provide an objective, science-based assessmentof the overall environmental sustainability ofagriculture, with a focus on farm management,soil, water and air quality, biodiversity and eco-efficiency.
Scope and limitations of this assessment
As a federal department, AAFC’s goal is to pro-vide a national assessment of the environmentalperformance of agriculture. Therefore, in thecontext of NAHARP, AEIs are primarily intendedto provide information at a national, provincialand regional scale, in a manner that is both sensitive to regional variations in agricultureand consistent across Canada. However, to makenational assessments, it is necessary to work atbroad temporal and spatial scales and to useunits that are usually not homogeneous in terms of either farm management practices orbiophysical conditions. While we are confidentthat the current set of indicators provides agood preliminary assessment of the sector’s performance in the pursuit of environmentalsustainability, they are all subject to some levelof uncertainty (see Chapter 2).
Indicators usually do not give a very precise picture of the farming or environmental condi-tions at specific locations. Accordingly, they are rarely applicable at the farm level, and thiswork is not intended as a guide to on-farm bestmanagement practices. AAFC, in partnershipwith the provinces and the agricultural industry,is involved in efforts to develop other tools that farmers can use to make informed on-farmland-use and management decisions, such asEnvironmental Farm Planning. Nonetheless, farmers should find this report useful as anintroduction to environmentally sustainableagriculture and it may alert them to environ-mental conditions that pertain to their region.We encourage all users to exercise caution ininterpreting and using this report.
Reading this report
The report is divided into eight parts:
• Section A gives the background of the study, including the general concepts, principles and approaches used to producethe indicators, and an overview of agricul-ture in Canada and of the driving forces that affect environmental trends in agricul-ture. The chapters in this section will helpthe reader to better understand the findingsand conclusions of the overall report.
6
• Section B presents information and agri-environmental indicators that arespecifically related to environmental farm management and agricultural production intensity.
• Sections C through F present agri-environmental indicators related to soil quality, water quality, air quality and agro-ecosystem biodiversity.
• Section G presents eco-efficiency indicatorsfor the food and beverage industry.
• Section H summarizes indicator findings on a regional basis.
We wanted this report to be understood by laypersons, not just scientists and agriculturalexperts, and so we have tried to minimize theuse of technical words and concepts. Any spe-cialized terms used are italicized the first timethey appear in the text and defined in a glossaryat the end of the report. Each chapter is writtento stand alone and may be cited as an individualdocument (the correct citation is given on page ii). However, we encourage readers toperuse the entire report.
As mentioned earlier, the work on agri-environmental indicators involves a process of continuous improvement. Hence, althoughsome indicators have been reported on previ-ously, improvements have been made tomethodologies and datasets in most cases. Resultsand trends for these indicators have therefore not only been updated with more recent data,but all calculations have been re-done for theentire period covered (see Chapter 2 for details).It is therefore not appropriate to compare theresults provided in this report with those in theprevious report, published in 2000. It is better toconsider this report as “replacing” the previousAEI report.
Finally, since space is limited in a printed report, the information presented here must beviewed as an overall summary of the work doneon Canadian agri-environmental indicators.Interested readers are invited to consult the on-line version of this report, where they may findadditional details and more detailed technicaldescriptions of each indicator, particularly the
detailed methods of calculation and meta-datainformation. Over time they may also findupdated information and results published on-line, as scientific research and efforts toaddress AEI gaps and limitations continue, furthering AAFC’s commitment to continuouslyimprove agri-environmental indicators.
REFERENCESAgriculture and Agri-Food Canada, 2003.Sustainable Agriculture: Our Path Forward, AAFC’s third Sustainable Development Strategy (SDS). Ottawa (Ont.). www.agr.gc.ca/policy/environment/pdfs/sds/SDSIII_e.pdf
Bond, W.D., D. O’Farrell, G. Ironside, B. Buckland,and R. Smith, 2005. “Current Status, Trends, andPerceptions Regarding Environmental Indicators andState of the Environment Reporting in Canada”.Background paper to an Environmental Indicatorsand State of the Environment Reporting Strategy,2004–2009. Environment Canada, NationalIndicators and Reporting Office, Gatineau (Que.).www.ec.gc.ca/soer-ree/English/documents/bg_paper1_e.cfm
McRae, T., 2000. “Introduction”. In McRae T.,C.A.S. Smith, and L.J. Gregorich (eds) 2000.Environmental Sustainability of CanadianAgriculture: Report of the Agri-EnvironmentalIndicator Project. Agriculture and Agri-FoodCanada, Ottawa. www.agr.gc.ca/env/naharp-pnarsa/ (Go to related documents)
McRae, T., C.A.S. Smith, and L.J. Gregorich (eds),2000. Environmental Sustainability of CanadianAgriculture: Report of the Agri-EnvironmentalIndicator Project. Agriculture and Agri-FoodCanada, Ottawa. www.agr.gc.ca/env/naharp-pnarsa/ (Go to related documents)
Organisation for Economic Co-operation andDevelopment (OECD), 2001. EnvironmentalIndicators for Agriculture, Volume 3: Methods and Results. OECD. Paris (France).www.oecd.org/dataoecd/0/9/1916629.pdf(Executive Summary only)
Environmental Sustainability of Canadian Agriculture: Agri-Environmental Indicator Report Series—Report #2
7A. Introduction
CONTEXTAgro-ecosystems result from human manipula-tion of natural ecosystems to produce food, fibre and other products for society. This trans-formation begins when the land is first clearedof natural vegetation, and domestic crops areseeded and harvested. Production-enhancingtechniques may be employed, such as tilling ofthe soil, supplementing natural precipitationwith irrigation, applying additional nutrients and controlling weeds and animal pests. Agro-ecosystems, like natural ecosystems, aredynamic, with a constant flow of energy, waterand chemical elements entering and leaving the system in cycles. The rates of flow of thesecomponents may, however, differ considerablybetween the two systems.
Interactions between the practice of agricultureand the surrounding environment are inevitable.However, this does not mean that environmentaldegradation is also an inevitable consequence of agriculture. To an ever-greater extent, we arelearning ways to practice agriculture that canminimize environmental degradation and evenenhance natural ecosystems, for example, by pro-viding wildlife habitat or storing carbon in soils.
Understanding how well agriculture and agri-foodsystems manage and conserve natural resourcesand how compatible they are with the naturalsystems and processes in the broader environ-ment is critical for assessing their environmentalsustainability. Agri-environmental indicators(AEIs) can be defined as “measures of key environmental conditions, risks, or changes
SUMMARYThis chapter presents an overview of the approach used by AAFC to conduct comprehensive national assess-
ments and report on the key environmental issues that the Canadian agri-food sector faces. By agri-food
sector, we mean both primary agriculture and the food and beverage processing industry. Section A presents
the approach used to assess five key aspects of the environmental sustainability of agro-ecosystems, in the
context of primary agriculture: environmental farm management, soil quality, water quality, air quality
and agricultural biodiversity. Section B discusses the approach that is currently being developed to assess
eco-efficiency of the food and beverage industry, likewise with a focus on five aspects: energy, greenhouse
gas emissions, water use and liquid effluents, solid organic waste generation and packaging wastes. This
attempt to provide a more comprehensive assessment of the agri-food sector by including food and beverage
processing represents a much broader approach than in previous assessments of environmental sustainabil-
ity in agriculture.
2. Assessing the EnvironmentalSustainability of Agriculture
A) Primary agriculture
AUTHORS:
W. Eilers and A. Lefebvre
ADAPTEDFROM:
Smith and McRae, 2000
8
resulting from agriculture, or of managementpractices used by producers” (McRae et al. 2000).They are the main tools harnessed in this reportto outline the current scientific understanding of these interactions between agriculture andnature. Survey based information is also drawn on to provide additional context for the evaluation of environmental sustainability.
AGRI-ENVIRONMENTAL INDICATORS
Agri-environmental indicators are a practicalmeans of assessing environmental sustainabilityby combining scientific knowledge and understanding with available information onresources and agricultural practices. To ensurecredibility and rigour in this assessment process,all agri-environmental indicators have to meet a set of fundamental criteria. They have to be:
• policy relevant: indicators should relate tothe key environmental issues that govern-ments and other stakeholders in theagriculture sector are seeking to address;
• scientifically sound: indicators shouldrely on methodologies that are scientificallysound, reproducible, defensible andaccepted, recognizing that their develop-ment may involve successive stages ofimprovement;
• understandable: the significance of the indicator values that are reported should be readily understood by policy makers and the wider public;
• capable of identifying geospatial andtemporal change: indicators should allowspatial and temporal trends to be identified;
• feasible: indicators should make use of existing data as much as possible and they should not be prohibitively expensiveto develop.
To further guide our efforts to identify anddevelop appropriate indicators of environmentalsustainability in agriculture, we used a conceptualframework that characterizes the environmentalaspects and influences of agricultural productionpractices. This framework, called the “Pressure–
Outcome–Response Framework,” considers threebroad areas that, when applied to agri-environ-mental sustainability, can be described as follows:
• Pressure: environmental stresses that mayinfluence important aspects of agriculturalproduction, such as the selection of crops andmanagement practices used for production.
• Outcome: ultimate impact of agricultural production on the health of the environment(soil, air, water, biodiversity).
• Response: use by producers of key manage-ment options which influence the impact of agriculture on the environment.
While this framework provides a context forindividual indicators, agricultural productionand its interactions and linkages with the environment are complex and multi-faceted.Additional (non-environmental) pressures orresponses such as markets, government policiesand private expenditure also influence the sector’s environmental performance. Althoughthese additional pressures are not covered inthis assessment, Chapter 3 discusses the effortsthat are under way to link them to the agri-environmental indicators.
CALCULATION METHODThe agri-environmental indicators that are covered in this report are designed to be responsive to changes in key land use and farmmanagement practices, to lend themselves tobroad spatial scales and to zero in on the agri-culture sector’s positive and negative impacts on the environment. They typically fall into one of three categories:
• risk indicators: estimate of the likelihood of a potential environmental impact;
• state indicators: estimate of the actual presence and degree of an impact;
• eco-efficiency indicators: estimate ofresource use efficiency, typically by compar-ing inputs and outputs of some material.
Agri-environmental indicators are calculatedusing mathematical models or formulas thatintegrate biophysical information (on soil,
Environmental Sustainability of Canadian Agriculture: Agri-Environmental Indicator Report Series—Report #2
9A. Introduction
climate and landscape), which is taken mainlyfrom the Soil Landscapes of Canada, with landuse and farm management data from the Censusof Agriculture and other custom data sets (fromprovincial agencies, private sector, remote sensing, etc.) generalized to portray an environ-mental condition on the landscape at a giventime. These mathematical models and formulashave been adapted or developed on the basis of scientific knowledge and understanding ofthe interactions between various aspects of agricultural practices and the environment. This approach was selected instead of, for example, detailed environmental monitoring,because it lends itself well to calculations atbroad spatial scales, can isolate the specificimpact of agriculture on the environment, eliminates the time lag between land use ormanagement change and actual measurableimpact, and is compatible with forward lookingintegrated economic/environmental modelsused for policy analysis (see Chapter 5).
Summarized results from the Census ofAgriculture, special surveys such as the FarmEnvironmental Management Survey (StatisticsCanada, Agriculture Division 2002) or combina-tions of these two sources are also used in thisreport to complement the information providedby the agri-environmental indicators. Theseresults are not considered indicators per se, butare nevertheless important for carrying out acomprehensive assessment of environmentalsustainability of agriculture.
Geospatial framework: Indicators aredesigned to estimate changes and trends in time and space. Most indicators use a suite ofdata that are collected at various temporal and geographical scales. A great deal of effort goesinto developing proper ways of interpreting andintegrating these data in a common geospatialframework to allow indicator calculation.
The spatial basis, or the areas used for most of the indicator model calculations reported on in this document, are polygons of the SoilLandscapes of Canada (SLC) map series. Thesemaps portray generalized soil and landscapeinformation at a scale of 1:1 million and areintegrated into the National Ecological Frameworkfor Canada. In 2004, SLC polygons (landscapeunits) for agricultural regions of Canada wereupdated to provide more accurate placement ofpolygon boundaries and, more importantly, to
include additional information on the soilsfound within the polygon mapping units.Polygon size varies, ranging from about 10,000 ha to 1 million ha. Using these mappingunits allows soil and landscape data to be inte-grated with farm management data for indicatorcalculation. Results can then be rolled up andreported at larger scales suitable for a nationalassessment like this one.
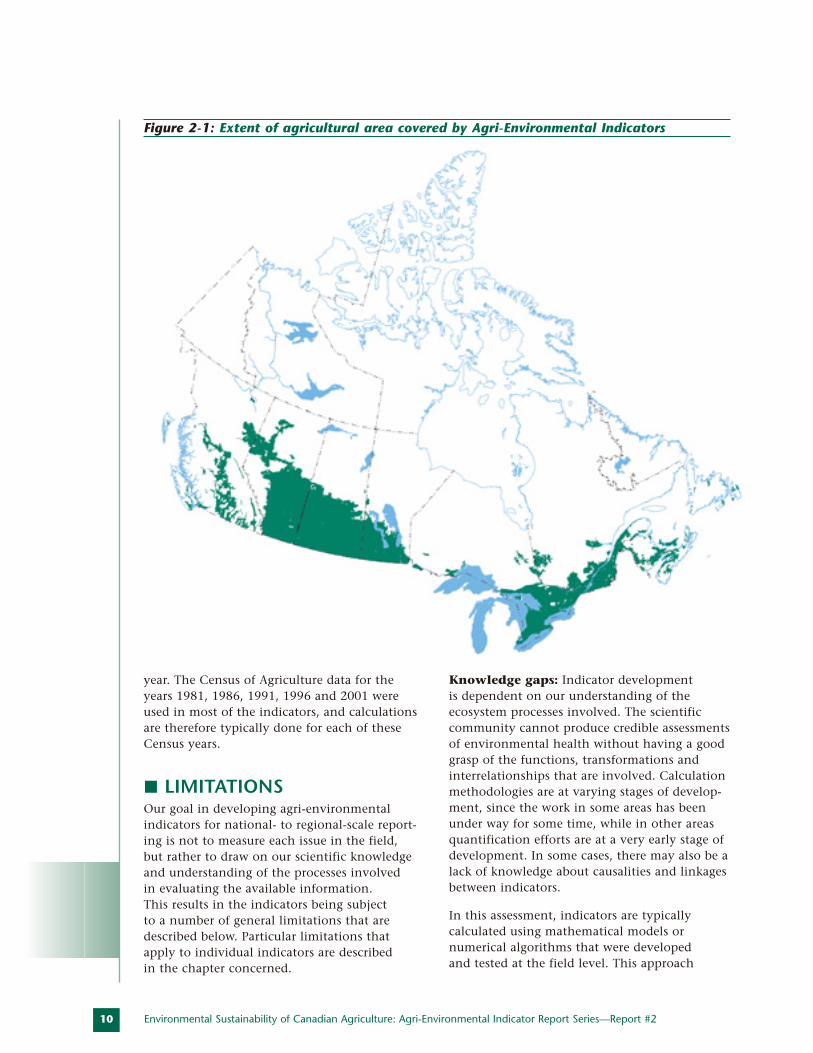
A common set of agricultural SLC polygons was used to calculate the agri-environmentalindicators described in this report. For most ofCanada, in order to be included in the set, thepolygons had to have at least 5% of their areareported as farmland in each of the 1981, 1986,1991, 1996 and 2001 Census years. As a result of these requirements, many polygons in thefringe areas where agricultural activities arehighly dispersed were excluded from the calculations. Agriculture in the Yukon Territory,the Northwest Territories and Nunavut wasexcluded from the study, as was agriculturealong the northern fringes or in outlying areasof the provinces. In the Atlantic Provinces,where agriculture may represent only small portions of SLC polygons, all areas reportingagriculture in the Census years were included in the analysis. Figure 2-1 shows a map of the2,780 polygons that met this requirement,defining the extent of the agricultural area covered by agri-environmental indicators in this report.
Re-allocation of data from the Census of Agriculture (AAFC 2004): Most indicatorsuse information on crops, land use, land management and livestock derived from theCensus of Agriculture. However the Census ofAgriculture is compiled using Statistics Canada’sgeographic units, which are aligned to politicalboundaries and cannot easily be linked to biophysical information such as that embodiedin the Soil Landscapes of Canada. An area-weighting method was devised to calculate andre-assign the Census data to the SLC polygons.Data suppression was maintained by StatisticsCanada to protect producer confidentiality afterthe re-allocations. AAFC then estimated valuesfor suppressed locations for use in the calcula-tions. Since the boundaries of the Census areaschange from year to year based on the numberof respondents in an area, this reassignment ofdata to SLC polygons was done for each Census
10
year. The Census of Agriculture data for theyears 1981, 1986, 1991, 1996 and 2001 wereused in most of the indicators, and calculationsare therefore typically done for each of theseCensus years.
LIMITATIONSOur goal in developing agri-environmental indicators for national- to regional-scale report-ing is not to measure each issue in the field, but rather to draw on our scientific knowledgeand understanding of the processes involved in evaluating the available information. This results in the indicators being subject to a number of general limitations that aredescribed below. Particular limitations thatapply to individual indicators are described in the chapter concerned.
Knowledge gaps: Indicator development is dependent on our understanding of theecosystem processes involved. The scientificcommunity cannot produce credible assessmentsof environmental health without having a goodgrasp of the functions, transformations andinterrelationships that are involved. Calculationmethodologies are at varying stages of develop-ment, since the work in some areas has beenunder way for some time, while in other areasquantification efforts are at a very early stage ofdevelopment. In some cases, there may also be alack of knowledge about causalities and linkagesbetween indicators.
In this assessment, indicators are typically calculated using mathematical models or numerical algorithms that were developed and tested at the field level. This approach
Environmental Sustainability of Canadian Agriculture: Agri-Environmental Indicator Report Series—Report #2
Figure 2-1: Extent of agricultural area covered by Agri-Environmental Indicators
11A. Introduction
provides a good theoretical foundation to help define how management practices interactwith landscape conditions and ecologicalprocesses to produce an environmental effect.However, any modelling approach is an estima-tion, which is limited by our incomplete andstill evolving scientific knowledge of these interactions. Confidence is lessened when thefield-tested models are used at broader scales.This is why national evaluations such as thisone are limited to potential risk assessments for some issues as opposed to an effort to determine actual physical contributions to the environment from agriculture.
Data issues: The data neededto calculate the indicators werenot always available or notavailable for the entire country.This occurs either because aparticular parameter has notbeen measured or surveyed, or because data have been suppressed for reasons of confidentiality (e.g. StatisticsCanada may suppress livestocknumbers and associated landareas when there are only a fewinstances of a particular farmactivity in a given area). When tallied over anentire province or ecozone, considerable datamay be lost and results skewed. Alternativeapproaches are being developed and, when possible, used to overcome these limitations and obtain or estimate the missing information.
Indicators are also often calculated using dataitems that have been re-allocated to a differentspatial basis from that at which they were collected. A prime example of this approach isthe re-assignment of Statistics Canada Census of Agriculture data to the Soil Landscapes ofCanada polygons. Experts have developedrational means of doing such spatial re-alloca-tion; however, issues still remain that can resultin errors in the information. In many regions ofthe country, agriculture is the dominant landuse and minor errors in this assignment shouldnot unduly influence the indicator results.However, much of Canada’s agricultural produc-tion takes place on landscapes where agricultureis not the dominant land use, and indeed where agriculture may occur on such small proportionsof the SLC polygon area that there is no way
of being certain that the re-allocation of data iscorrect. Efforts are continuing to improve thisre-allocation process through the use of satellitedata, manual data checks and validationsagainst field observations.
Recent improvements to the SLC data haveallowed the soils and landscapes in the SLCpolygons to be represented to a greater extent in the indicators; however, the data on specificsoil properties that are required to calculatemany of the indicators are often based on relatively crude estimates, increasing the uncertainty surrounding indicator analysis.
Reliability: In developingagri-environmental indicators,scientists are forced to operatewithin their partial knowledgeof the system and within theprecision limits of the data attheir disposal. All measureddata used in calculating theindicators have an intrinsicuncertainty associated withthem. In this report we wereunable to use statistical meth-ods to determine the actualuncertainty associated with the
indicator results. This is an issue that we plan toaddress in future indicator analyses and reports.
UNDERSTANDING RESULTSAgri-environmental indicators are key science-based tools that can be used to provide a pictureof environmental sustainability in agriculture.Despite their limitations, the indicators are sensitive to changing farm management practicesand are able to show patterns of environmentalrisk and conditions that reflect the intensity ofagricultural production in regions across Canada.They provide a trend line over time that indicateswhether the agriculture sector is moving towardsor away from environmental sustainability. Inthis regard, they can be used to point out areas in which further research and investigation arerequired before actions can be taken, and provideuseful additional information to decision makersfor developing and evaluating agricultural policy.The indicator results presented in this report aredesigned to provide information on the environ-mental risks and conditions in agriculture at aregional to national scale. This information can
Agri-environmental
indicators are key
science-based tools that
can be used to provide
a picture of
environmental
sustainability
in agriculture.
Classes Meaning Implication
12
be used to provide a report card for producers,consumers and the international community onbroad trends in the environmental performanceof Canadian agriculture.
Map presentations for indicator results representthe most recent assessments of the conditions,which correspond to the status of the indicatorsas of 2001. In these map presentations, entireSLCs or other spatial polygons are assigned avalue. However, the reader must be aware thatthe results apply only to the agricultural portionof these polygons and that, within a given area,there will undoubtedly be zones of greater andlesser concern that the indicator averages out to a single value. The aggregated result mayobscure local reality, and because of this, as well as the various limitations described above,the indicators cannot be interpreted as showingany specific on-site conditions such as at anindividual farm.
The trends in an indicator over time are just asimportant as the current condition or status ofthe indicators. This aspect is generally presentedin tabular format, setting out actual results forCanada and individual provinces that covereach year for which the indicator was calcu-lated. The agriculture sector’s interactions withthe environment are complex, and caution mustbe exercised in seeking to make overall interpre-tations from the trends observed in individualindicators. Positive trends in one indicator maylead to negative trends in another. A nationaland regional summary of indicator trends is presented in Section H.
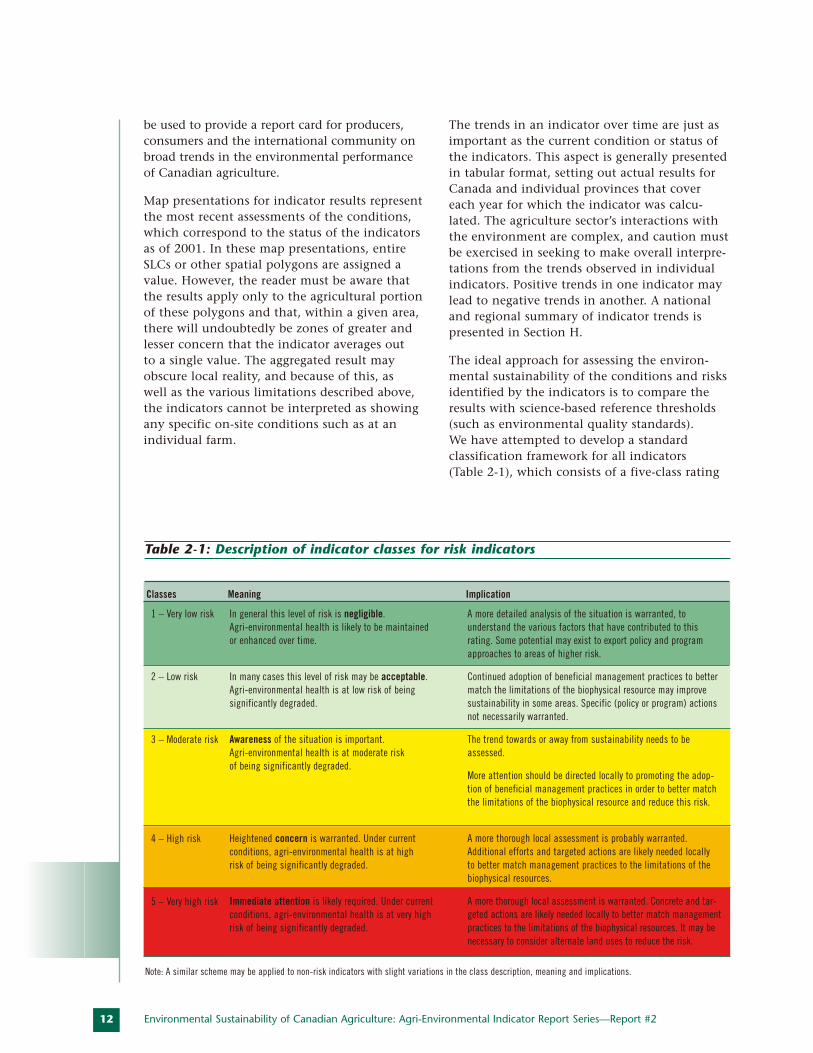
The ideal approach for assessing the environ-mental sustainability of the conditions and risksidentified by the indicators is to compare theresults with science-based reference thresholds(such as environmental quality standards). We have attempted to develop a standard classification framework for all indicators (Table 2-1), which consists of a five-class rating
Environmental Sustainability of Canadian Agriculture: Agri-Environmental Indicator Report Series—Report #2
Table 2-1: Description of indicator classes for risk indicators
1 – Very low risk
2 – Low risk
3 – Moderate risk
4 – High risk
5 – Very high risk
In general this level of risk is negligible. Agri-environmental health is likely to be maintained or enhanced over time.
In many cases this level of risk may be acceptable. Agri-environmental health is at low risk of being significantly degraded.
Awareness of the situation is important. Agri-environmental health is at moderate risk of being significantly degraded.
Heightened concern is warranted. Under current conditions, agri-environmental health is at high risk of being significantly degraded.
Immediate attention is likely required. Under current conditions, agri-environmental health is at very highrisk of being significantly degraded.
A more detailed analysis of the situation is warranted, to understand the various factors that have contributed to this rating. Some potential may exist to export policy and programapproaches to areas of higher risk.
Continued adoption of beneficial management practices to better match the limitations of the biophysical resource may improve sustainability in some areas. Specific (policy or program) actions not necessarily warranted.
The trend towards or away from sustainability needs to beassessed.
More attention should be directed locally to promoting the adop-tion of beneficial management practices in order to better matchthe limitations of the biophysical resource and reduce this risk.
A more thorough local assessment is probably warranted.Additional efforts and targeted actions are likely needed locally to better match management practices to the limitations of thebiophysical resources.
A more thorough local assessment is warranted. Concrete and tar-geted actions are likely needed locally to better match managementpractices to the limitations of the biophysical resources. It may benecessary to consider alternate land uses to reduce the risk.
Note: A similar scheme may be applied to non-risk indicators with slight variations in the class description, meaning and implications.
13A. Introduction
system, in which each class has a general mean-ing in terms of environmental sustainability or a given implication from a policy perspective.However, thresholds that would allow us to dif-ferentiate between the five classes are typicallynot available, and most of the indicators wereestablished on the basis of expert knowledge, an approach that is subject to additional interpretation. AAFC is currently working inpartnership with Environment Canada todevelop a systematic approach to establishingreference thresholds.
The indicators presented in this report are avehicle for communicating information in summary form about important issues from abiophysical perspective. However their use is not strictly limited to showing present statusand trends. While in most cases the direction of change may be unambiguous in terms of the environmental impact of an increase or adecrease in a specific indicator, it is preferablenot to interpret indicators in isolation. There are often important trade-off questions, and oneindicator cannot easily be interpreted withoutconsidering a broader framework, such as determining the overall socio-economic andenvironmental costs and benefits associatedwith the adoption of alternative land use ormanagement practices. As part of its efforts todevelop agri-environmental indicators, AAFC isalso developing tools and approaches for linkingthese indicators to economic and policy models,in order to provide guidance for policy and program evaluation and development. Use of the indicators in policy development is discussed in greater detail in Chapter 5.
REFERENCESAgriculture and Agri-Food Canada (AAFC), 2004.Census of Agriculture: Soil Landscapes of Canada(SLC), v.3 and Water Survey of Canada sub-subdrainage area (WSCSSDA), v.5, Re-allocation.Unpublished data for research purposes. AAFC,Ottawa (Ont.).
Ecological Stratification Working Group, 1995. A National Ecological Framework for Canada.Report and national map at 1:7,500,000 scale.Agriculture and Agri-Food Canada andEnvironment Canada, Ottawa (Ont.).http://sis.agr.gc.ca/cansis/publications/ecostrat/intro.html
McRae, T., C.A.S. Smith, and L.J. Gregorich (eds),2000. Environmental Sustainability of CanadianAgriculture: Report of the Agri-EnvironmentalIndicator Project. Agriculture and Agri-FoodCanada, Ottawa (Ont.).www.agr.gc.ca/env/naharp-pnarsa/ (Go to related documents)
Smith, C.A.S. and T. McRae, 2000. “Understandingand Assessing the Environmental Sustainability ofAgriculture”. In McRae T., C.A.S. Smith, and L.J. Gregorich (eds), Environmental Sustainability of Canadian Agriculture: Report of the Agri-Environmental Indicator Project. Agriculture and Agri-Food Canada, Ottawa (Ont.).www.agr.gc.ca/env/naharp-pnarsa/ (Go to related documents)
Statistics Canada, 2002. Farm EnvironmentalManagement in Canada. Statistics Canada,Agriculture Division, Ottawa (Ont).www.statcan.ca:8096/bsolc/english/bsolc?catno=21-021-M
CONTEXT The food and beverage processing industry (FBI),which is classified as a manufacturing industry,is a major intermediary in the food chain. It isthe pathway of almost half of Canada’s raw primary agricultural output, and around 70% of FBI’s inputs come, directly or indirectly, from agricultural production or fisheries. Theseinputs are processed into awide range of food productsprior to shipping to domestic(75%) or international consumers (25%). It is an important industry in allprovinces and generally ranks among the top threemanufacturing sectors in termsof shipments and jobs. The food and beverage industryuses a wide range of technolo-gies to achieve its two primary objectives: to carry out thedesired processing (e.g. bread production); andto stabilize foods and beverages so they willhave a longer shelf life (e.g. milk pasteurization).The manufacturing steps and processes for mostfoods and beverages are well known and usuallyfall into the following categories:
• preparing raw materials (washing, cutting,mixing, homogenization);
• utilizing heat (sterilization, pasteurization);
• utilizing cold (refrigeration, freezing);
• removing water (drying, evaporation, pressing, filtration);
• modulating product composition (pH, salts, sugars, preservatives, smoking, fermentation);
• modulating the product environment (dissolved oxygen, modified or controlledatmosphere, active packaging); and
• separating/concentrating the components of agricultural products (extraction, membrane, distillation).
As in all other sectors, food and beverage processing plants are required to meet variousenvironmental performance standards, whichmay be critical for competing on the world market. In manufacturing food products, thefood and beverage industry uses a significantamount of resources (raw agricultural productsor ingredients, energy, water). It also generates
gaseous emissions, liquid wastesand solid organic residues.While most packaging waste is generated at the consump-tion level, almost all of it entersthe system at the processingstage. Five issues (or environ-mental loads) have beenidentified for the developmentof eco-efficiency indicators forthe food and beverage process-ing industry:
• Energy use;
• Greenhouse gas (GHG) generation;
• Water use and waste water production (e.g. black water, effluents and contaminants);
• Solid organic residue generation; and
• Packaging waste generation.
THE INDICATORSThe indicators will be based on the concept of eco-efficiency, which is a widely recognizedconcept in the manufacturing industry that isoften used to help companies characterize andmeet both environmental and economic objec-tives (Verfaillie and Bidwell, WBCSD 2000).Eco-efficiency is defined as a process duringwhich goods or services of greater value or ingreater quantity are produced using fewer rawmaterials, and less water and energy, therebyreducing natural resource depletion and pollu-tion (NRTEE 2001). The indicators essentiallycompare the environmental factors or “loads” to the quantity of products manufactured. While this actually provides an intensity rating
14 Environmental Sustainability of Canadian Agriculture: Agri-Environmental Indicator Report Series—Report #2
AUTHORS:
M. Marcotte, D. Maxime
and Y. Arcand
B) Food and Beverage Processing Industry
Five issues have
been identified for
the development of
eco-efficiency indicators
for the food and
beverage processing
industry.
15A. Introduction
(which is the inverse of efficiency), the use of a common denominator (physical productionunit) will facilitate comparison within each subsector for each of the five issues of interest.
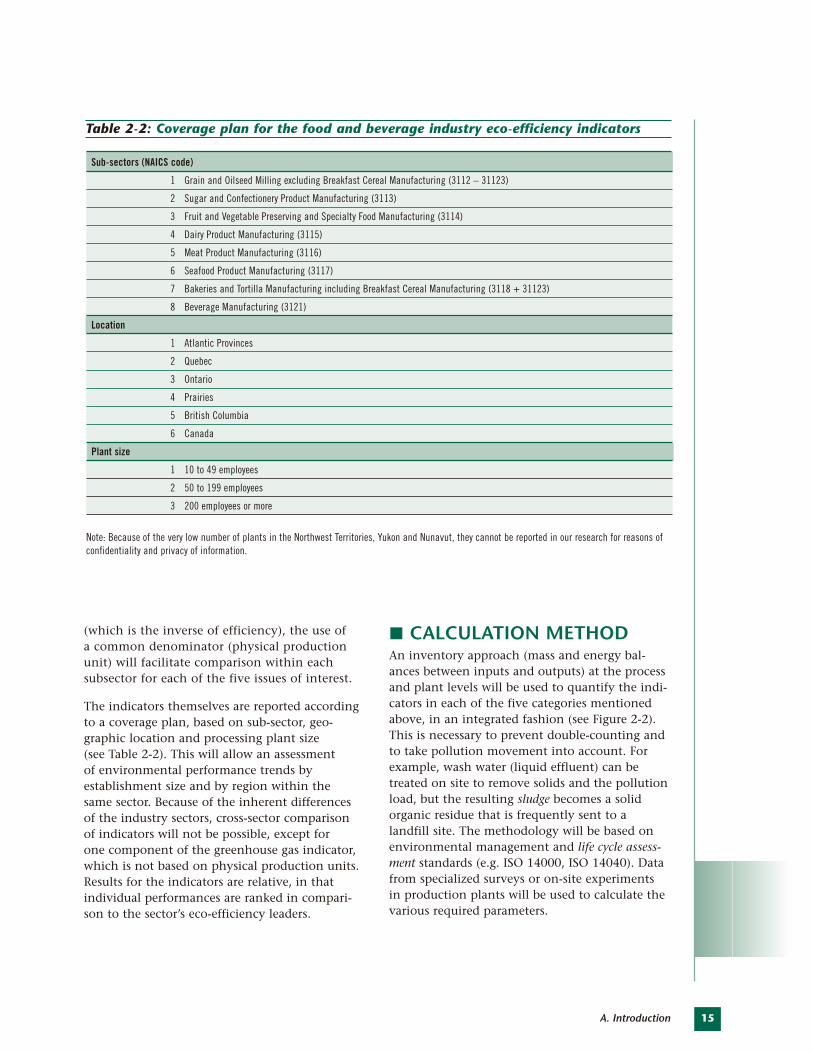
The indicators themselves are reported accordingto a coverage plan, based on sub-sector, geo-graphic location and processing plant size (see Table 2-2). This will allow an assessment of environmental performance trends by establishment size and by region within the same sector. Because of the inherent differencesof the industry sectors, cross-sector comparison of indicators will not be possible, except for one component of the greenhouse gas indicator,which is not based on physical production units.Results for the indicators are relative, in that individual performances are ranked in compari-son to the sector’s eco-efficiency leaders.
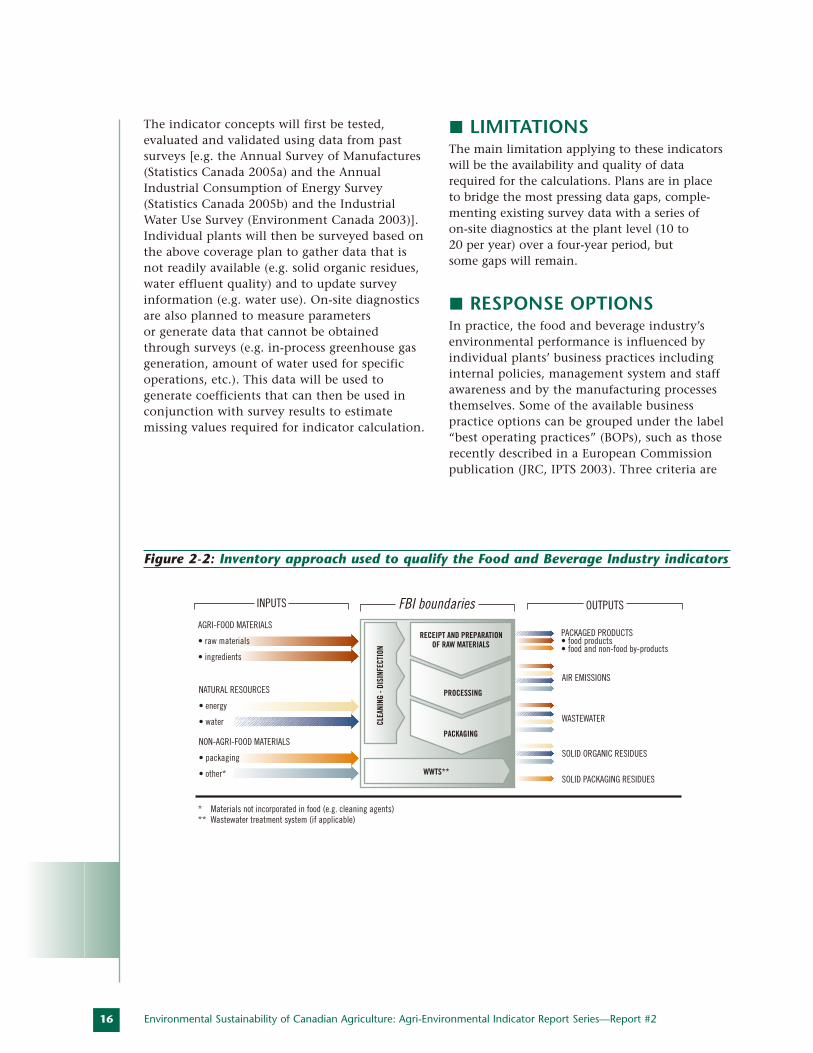
CALCULATION METHODAn inventory approach (mass and energy bal-ances between inputs and outputs) at the processand plant levels will be used to quantify the indi-cators in each of the five categories mentionedabove, in an integrated fashion (see Figure 2-2).This is necessary to prevent double-counting andto take pollution movement into account. Forexample, wash water (liquid effluent) can betreated on site to remove solids and the pollutionload, but the resulting sludge becomes a solidorganic residue that is frequently sent to a landfill site. The methodology will be based onenvironmental management and life cycle assess-ment standards (e.g. ISO 14000, ISO 14040). Datafrom specialized surveys or on-site experiments in production plants will be used to calculate thevarious required parameters.
Sub-sectors (NAICS code)
1 Grain and Oilseed Milling excluding Breakfast Cereal Manufacturing (3112 – 31123)
2 Sugar and Confectionery Product Manufacturing (3113)
3 Fruit and Vegetable Preserving and Specialty Food Manufacturing (3114)
4 Dairy Product Manufacturing (3115)
5 Meat Product Manufacturing (3116)
6 Seafood Product Manufacturing (3117)
7 Bakeries and Tortilla Manufacturing including Breakfast Cereal Manufacturing (3118 + 31123)
8 Beverage Manufacturing (3121)
Location
1 Atlantic Provinces
2 Quebec
3 Ontario
4 Prairies
5 British Columbia
6 Canada
Plant size
1 10 to 49 employees
2 50 to 199 employees
3 200 employees or more
Note: Because of the very low number of plants in the Northwest Territories, Yukon and Nunavut, they cannot be reported in our research for reasons ofconfidentiality and privacy of information.
Table 2-2: Coverage plan for the food and beverage industry eco-efficiency indicators
16
The indicator concepts will first be tested, evaluated and validated using data from pastsurveys [e.g. the Annual Survey of Manufactures(Statistics Canada 2005a) and the AnnualIndustrial Consumption of Energy Survey(Statistics Canada 2005b) and the IndustrialWater Use Survey (Environment Canada 2003)].Individual plants will then be surveyed based onthe above coverage plan to gather data that isnot readily available (e.g. solid organic residues,water effluent quality) and to update surveyinformation (e.g. water use). On-site diagnosticsare also planned to measure parameters or generate data that cannot be obtained through surveys (e.g. in-process greenhouse gasgeneration, amount of water used for specificoperations, etc.). This data will be used to generate coefficients that can then be used inconjunction with survey results to estimatemissing values required for indicator calculation.
LIMITATIONS The main limitation applying to these indicatorswill be the availability and quality of datarequired for the calculations. Plans are in place to bridge the most pressing data gaps, comple-menting existing survey data with a series ofon-site diagnostics at the plant level (10 to 20 per year) over a four-year period, but some gaps will remain.
RESPONSE OPTIONS In practice, the food and beverage industry’senvironmental performance is influenced byindividual plants’ business practices includinginternal policies, management system and staffawareness and by the manufacturing processesthemselves. Some of the available business practice options can be grouped under the label“best operating practices” (BOPs), such as thoserecently described in a European Commissionpublication (JRC, IPTS 2003). Three criteria are
Environmental Sustainability of Canadian Agriculture: Agri-Environmental Indicator Report Series—Report #2
AGRI-FOOD MATERIALS
• raw materials
• ingredients
NATURAL RESOURCES
• energy
• water
NON-AGRI-FOOD MATERIALS
• packaging
• other*
PACKAGED PRODUCTS• food products• food and non-food by-products
OUTPUTS
AIR EMISSIONS
WASTEWATER
SOLID ORGANIC RESIDUES
SOLID PACKAGING RESIDUES
INPUTS FBI boundaries
* Materials not incorporated in food (e.g. cleaning agents)** Wastewater treatment system (if applicable)
CLEA
NING
- DI
SINF
ECTI
ON
WWTS**
Figure 2-2: Inventory approach used to qualify the Food and Beverage Industry indicators
A. Introduction 17
generally used to prioritize and classify thesepractices: the investment cost to adopt them,quantification of the anticipated environmentalgains (made apparent by the indicators), and thereturn-on-investment period. Once calculated,the indicators will shed light on the extent to which these best operating practices are being implemented and, in a sense, quantify a company’s efforts towards environmental sustainability (Richard 2003; Industry Canada2001). As indicator development proceeds, thespecific quantitative contribution of variousBOPs will be determined.
REFERENCESEnvironment Canada, 2003. Industrial Water Use, 1996. Environment Canada, SustainableWater Use Branch, Ottawa (Ont.). www.ec.gc.ca/water/en/info/pubs/sss/e_ind96.htm
Hendrik, A. Verfaillie and Robin Bidwell (eds),2000. Measuring Eco-efficiency: A Guide toReporting Company Performance. World Business Council for Sustainable Development(WBCSD), Geneva (Switzerland).www.wbcsd.org/DocRoot/RvsdQEHXvwt12dx39nCF/MeasuringEE.pdf
Industry Canada, 2001. Three Steps to Eco-efficiency. Industry Canada, Ottawa (Ont.).http://strategis.ic.gc.ca/epic/internet/inee-ee.nsf/vwapj/finaltool.PDF/ $FILE/ finaltool.PDF
Joint Research Centre of the EuropeanCommission (JRC), Institute for ProspectiveTechnological Studies (IPTS), 2003. IntegratedPollution Prevention Control (IPPC): Draft ReferenceDocument on Best Available Techniques in the Food, Drink and Milk Industry. Seville (Spain).www.epa.ie/Licensing/IPPCLicensing/BREFDocuments/FileUpload,501,en.pdf
National Round Table on the Environment and the Economy (NRTEE), 2001. Eco-efficiencyIndicators. Calculating Eco-Efficiency Indicators: A Workbook for Industry. NRTEE, Ottawa (Ont.).www.nrtee-trnee.ca/Publications/HTML/ Complete-Documents/Eco-efficiency_Workbook/index.html
Richard, F. (ed.), 2003. Waste Management Guidefor Small and Medium Enterprises – CanadianVersion. Éditions Ruffec and NI Environnement,Montreal (Que.).www.qc.ec.gc.ca/dpe/Anglais/dpe_main_en.asp?innov_guide_mat_residuelles
Statistics Canada, 2005a. Annual Survey ofManufactures. Statistics Canada, Ottawa (Ont.).www.statcan.ca/english/sdds/2103.htm
Statistics Canada, 2005b. Annual IndustrialConsumption of Energy Survey. Statistics Canada,Ottawa (Ont.).www.statcan.ca/english/sdds/5047.htm
INTRODUCTIONAgriculture is inextricably connected to thebroader policy, economic and social trends ofthe world. Globalization, trade agreements,changing domestic and world demand, changing market structure and technologicalinnovations all have an influence on the decisions made by agricultural producers.Farmers consider the overall operating contextshaped by these forces and select productionstrategies that will allow them to achieve desiredoutcomes most efficiently. These forces alsoaffect the environmental risks and benefits ofagricultural production, which can vary signifi-cantly depending on the methods of productionselected and the local ecosystems to which theyare applied. The Pressure–Outcome–ResponseFramework that is used to guide the develop-ment of the agri-environmental indicators (see Chapter 2) integrates these socio-economicpressures (driving forces), which affect the management decisions (response) of farmers,and ultimately, the health of the environment(outcome). All of the pressures, outcomes andresponses are interrelated.
Throughout the past century these drivingforces have evolved, becoming more complex,changing even more quickly in recent years.New issues have emerged as the farm sector con-tinues to broaden its environmental approachfrom a limited “on-farm” resource conservationapproach to one that addresses the effects ofagricultural operations on the larger ecosystem.Driving forces will continue to evolve, and risksto the environment will remain a concern asoutput expands. Policy, technology and otherinstruments will be required to respond to thesedriving forces so that economic, environmentaland social objectives can all be achieved.
MARKET DEMANDThe expanding world population, higher dispos-able incomes and increased life expectancies inNorth America and elsewhere have boostedglobal demand for food. With rising incomes in both developed and developing countries, consumer preferences are changing and diets are becoming more varied and include moreexpensive livestock products and fresh fruits and vegetables along with the more traditional
SUMMARYThe driving forces affecting agriculture have evolved considerably over the past 20 years. Globalization,
market pressures and technological innovations have spurred Canadian agriculture to increase output
and productivity in an effort to keep pace with growing domestic and world demand. To achieve this,
the sector has undergone structural changes, some of which have environmental implications. Over the
past two decades, the social preferences of Canadians have also evolved. Concerns have been raised about
the environmental costs of food production. Canadians have supported a growing array of domestic and
international agreements and regulations designed to protect the environmental systems with which agricul-
ture interacts. The sector has responded to these driving forces in many ways. More and more, agriculture
is looking for ways to integrate environmental factors into decision-making processes on the farm and in
policy development. The sector is continually adopting new technologies and developing and carrying out
voluntary initiatives to improve environmental outcomes. This chapter reviews some of the changes in
these driving forces which have likely influenced the agriculture sector’s environmental performance in
ways that may be measured by the agri-environmental indicators presented in this report.
18 Environmental Sustainability of Canadian Agriculture: Agri-Environmental Indicator Report Series—Report #2
AUTHORS:
B. Junkins, H. Clark,
R.J. MacGregorand T. McRae
ADAPTEDFROM:
MacGregor andMcRae, 2000
3. Driving Forces Affecting theEnvironmental Sustainability of Agriculture
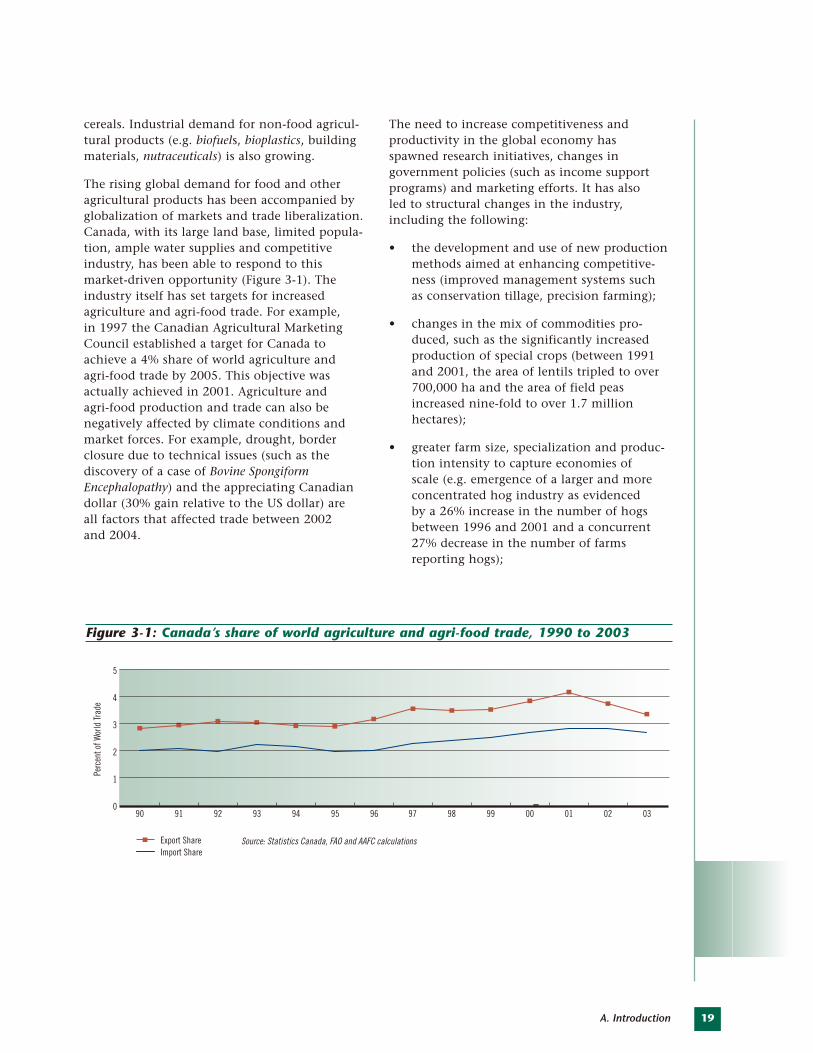
A. Introduction 19
cereals. Industrial demand for non-food agricul-tural products (e.g. biofuels, bioplastics, buildingmaterials, nutraceuticals) is also growing.
The rising global demand for food and otheragricultural products has been accompanied byglobalization of markets and trade liberalization.Canada, with its large land base, limited popula-tion, ample water supplies and competitiveindustry, has been able to respond to this market-driven opportunity (Figure 3-1). Theindustry itself has set targets for increased agriculture and agri-food trade. For example, in 1997 the Canadian Agricultural MarketingCouncil established a target for Canada toachieve a 4% share of world agriculture andagri-food trade by 2005. This objective was actually achieved in 2001. Agriculture and agri-food production and trade can also be negatively affected by climate conditions andmarket forces. For example, drought, border closure due to technical issues (such as the discovery of a case of Bovine SpongiformEncephalopathy) and the appreciating Canadiandollar (30% gain relative to the US dollar) are all factors that affected trade between 2002 and 2004.
The need to increase competitiveness and productivity in the global economy has spawned research initiatives, changes in government policies (such as income supportprograms) and marketing efforts. It has also led to structural changes in the industry, including the following:
• the development and use of new productionmethods aimed at enhancing competitive-ness (improved management systems suchas conservation tillage, precision farming);
• changes in the mix of commodities pro-duced, such as the significantly increasedproduction of special crops (between 1991and 2001, the area of lentils tripled to over700,000 ha and the area of field peasincreased nine-fold to over 1.7 millionhectares);
• greater farm size, specialization and produc-tion intensity to capture economies of scale (e.g. emergence of a larger and moreconcentrated hog industry as evidenced by a 26% increase in the number of hogsbetween 1996 and 2001 and a concurrent27% decrease in the number of farms reporting hogs);
Perc
ent o
f Wor
ld Tr
ade
Export ShareImport Share
0
1
2
3
4
5
90 91 92 93 94 95 96 97 98 99 00 01 02 03
Source: Statistics Canada, FAO and AAFC calculations
Figure 3-1: Canada’s share of world agriculture and agri-food trade, 1990 to 2003
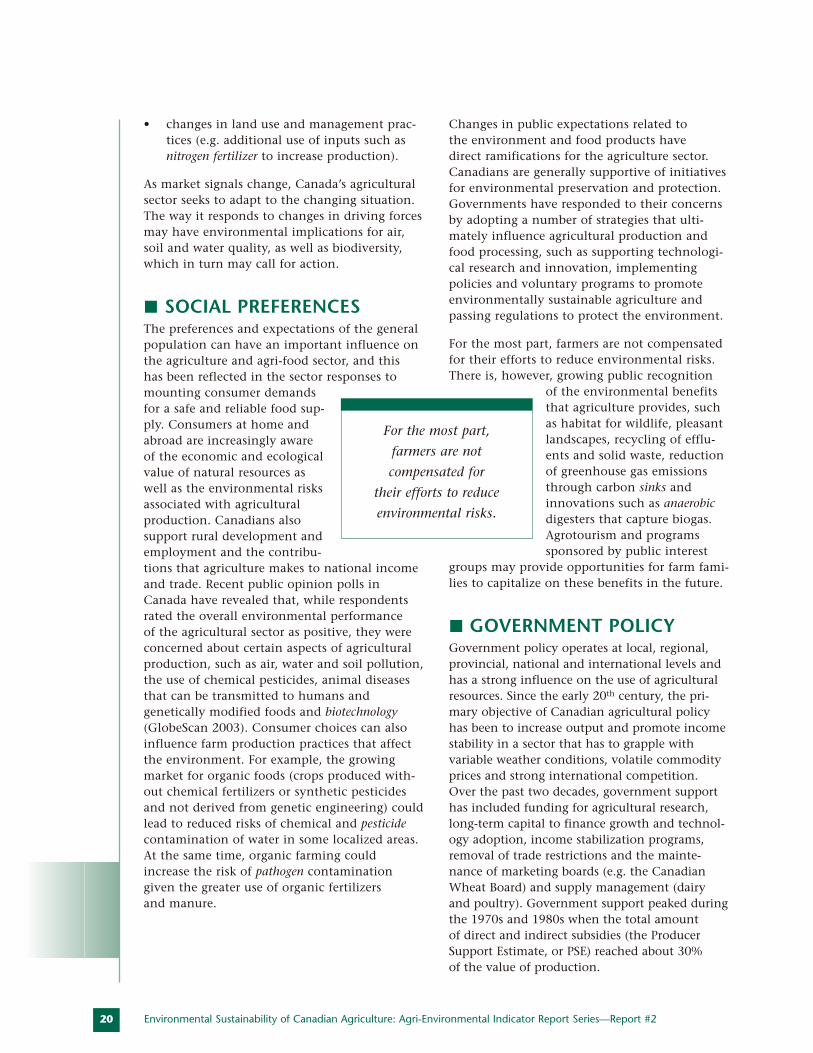
20
• changes in land use and management prac-tices (e.g. additional use of inputs such asnitrogen fertilizer to increase production).
As market signals change, Canada’s agriculturalsector seeks to adapt to the changing situation.The way it responds to changes in driving forcesmay have environmental implications for air,soil and water quality, as well as biodiversity,which in turn may call for action.
SOCIAL PREFERENCESThe preferences and expectations of the generalpopulation can have an important influence onthe agriculture and agri-food sector, and this has been reflected in the sector responses tomounting consumer demandsfor a safe and reliable food sup-ply. Consumers at home andabroad are increasingly awareof the economic and ecologicalvalue of natural resources aswell as the environmental risksassociated with agriculturalproduction. Canadians alsosupport rural development andemployment and the contribu-tions that agriculture makes to national incomeand trade. Recent public opinion polls inCanada have revealed that, while respondentsrated the overall environmental performance of the agricultural sector as positive, they wereconcerned about certain aspects of agriculturalproduction, such as air, water and soil pollution,the use of chemical pesticides, animal diseasesthat can be transmitted to humans and genetically modified foods and biotechnology(GlobeScan 2003). Consumer choices can alsoinfluence farm production practices that affectthe environment. For example, the growingmarket for organic foods (crops produced with-out chemical fertilizers or synthetic pesticidesand not derived from genetic engineering) couldlead to reduced risks of chemical and pesticidecontamination of water in some localized areas.At the same time, organic farming couldincrease the risk of pathogen contaminationgiven the greater use of organic fertilizers and manure.
Changes in public expectations related to the environment and food products have direct ramifications for the agriculture sector.Canadians are generally supportive of initiativesfor environmental preservation and protection.Governments have responded to their concernsby adopting a number of strategies that ulti-mately influence agricultural production andfood processing, such as supporting technologi-cal research and innovation, implementingpolicies and voluntary programs to promoteenvironmentally sustainable agriculture andpassing regulations to protect the environment.
For the most part, farmers are not compensatedfor their efforts to reduce environmental risks.There is, however, growing public recognition
of the environmental benefitsthat agriculture provides, suchas habitat for wildlife, pleasantlandscapes, recycling of efflu-ents and solid waste, reductionof greenhouse gas emissionsthrough carbon sinks and innovations such as anaerobicdigesters that capture biogas.Agrotourism and programssponsored by public interest
groups may provide opportunities for farm fami-lies to capitalize on these benefits in the future.
GOVERNMENT POLICYGovernment policy operates at local, regional,provincial, national and international levels andhas a strong influence on the use of agriculturalresources. Since the early 20th century, the pri-mary objective of Canadian agricultural policyhas been to increase output and promote incomestability in a sector that has to grapple with variable weather conditions, volatile commodityprices and strong international competition. Over the past two decades, government supporthas included funding for agricultural research,long-term capital to finance growth and technol-ogy adoption, income stabilization programs,removal of trade restrictions and the mainte-nance of marketing boards (e.g. the CanadianWheat Board) and supply management (dairyand poultry). Government support peaked duringthe 1970s and 1980s when the total amount of direct and indirect subsidies (the ProducerSupport Estimate, or PSE) reached about 30% of the value of production.
Environmental Sustainability of Canadian Agriculture: Agri-Environmental Indicator Report Series—Report #2
For the most part,
farmers are not
compensated for
their efforts to reduce
environmental risks.
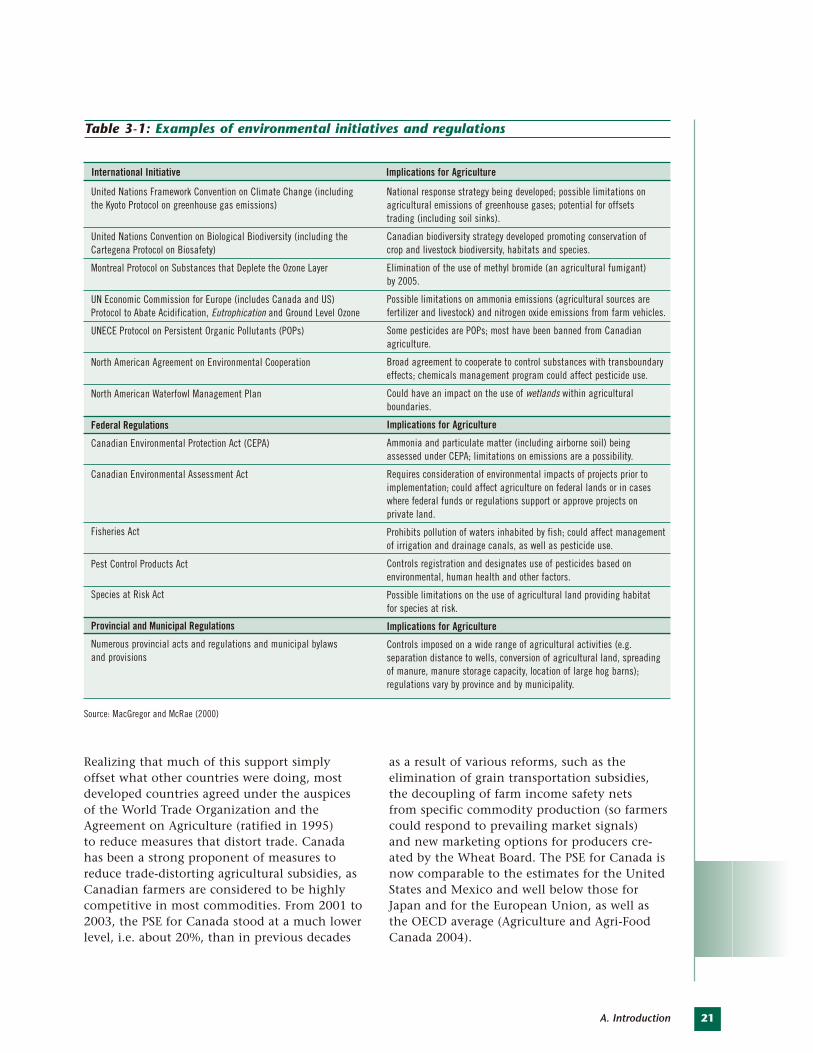
21A. Introduction
Realizing that much of this support simply offset what other countries were doing, mostdeveloped countries agreed under the auspicesof the World Trade Organization and theAgreement on Agriculture (ratified in 1995) to reduce measures that distort trade. Canadahas been a strong proponent of measures toreduce trade-distorting agricultural subsidies, asCanadian farmers are considered to be highlycompetitive in most commodities. From 2001 to2003, the PSE for Canada stood at a much lowerlevel, i.e. about 20%, than in previous decades
as a result of various reforms, such as the elimination of grain transportation subsidies,the decoupling of farm income safety nets from specific commodity production (so farmerscould respond to prevailing market signals) and new marketing options for producers cre-ated by the Wheat Board. The PSE for Canada isnow comparable to the estimates for the UnitedStates and Mexico and well below those forJapan and for the European Union, as well asthe OECD average (Agriculture and Agri-FoodCanada 2004).
International Initiative Implications for Agriculture
Table 3-1: Examples of environmental initiatives and regulations
United Nations Framework Convention on Climate Change (including the Kyoto Protocol on greenhouse gas emissions)
United Nations Convention on Biological Biodiversity (including theCartegena Protocol on Biosafety)
Montreal Protocol on Substances that Deplete the Ozone Layer
UN Economic Commission for Europe (includes Canada and US) Protocol to Abate Acidification, Eutrophication and Ground Level Ozone
UNECE Protocol on Persistent Organic Pollutants (POPs)
North American Agreement on Environmental Cooperation
North American Waterfowl Management Plan
Federal Regulations
Canadian Environmental Protection Act (CEPA)
Canadian Environmental Assessment Act
Fisheries Act
Pest Control Products Act
Species at Risk Act
Provincial and Municipal Regulations
Numerous provincial acts and regulations and municipal bylaws and provisions
National response strategy being developed; possible limitations on agricultural emissions of greenhouse gases; potential for offsets trading (including soil sinks).
Canadian biodiversity strategy developed promoting conservation of crop and livestock biodiversity, habitats and species.
Elimination of the use of methyl bromide (an agricultural fumigant) by 2005.
Possible limitations on ammonia emissions (agricultural sources are fertilizer and livestock) and nitrogen oxide emissions from farm vehicles.
Some pesticides are POPs; most have been banned from Canadian agriculture.
Broad agreement to cooperate to control substances with transboundaryeffects; chemicals management program could affect pesticide use.
Could have an impact on the use of wetlands within agriculturalboundaries.
Implications for Agriculture
Ammonia and particulate matter (including airborne soil) beingassessed under CEPA; limitations on emissions are a possibility.
Requires consideration of environmental impacts of projects prior toimplementation; could affect agriculture on federal lands or in caseswhere federal funds or regulations support or approve projects on private land.
Prohibits pollution of waters inhabited by fish; could affect managementof irrigation and drainage canals, as well as pesticide use.
Controls registration and designates use of pesticides based on environmental, human health and other factors.
Possible limitations on the use of agricultural land providing habitat for species at risk.
Implications for Agriculture
Controls imposed on a wide range of agricultural activities (e.g. separation distance to wells, conversion of agricultural land, spreadingof manure, manure storage capacity, location of large hog barns); regulations vary by province and by municipality.
Source: MacGregor and McRae (2000)
22
Not all government policy is geared to expand-ing production. Although farmers have longbeen admirable stewards of Canada’s land and water resources, growing concern that the increase in agricultural output was causingenvironmental damage prompted governmentsto focus to a greater extent on improving theenvironmental performance of Canadian farmsand harnessing the resulting benefits. Globalpressures related to issues such as climatechange, ozone depletion, organic pollutants,wildlife habitat and biological diversity havegiven rise to a number of international initia-tives. Furthermore, a wide range of policies and initiatives have been adopted at all levels of government with important implications for Canadian agricultural production and theenvironment (Table 3-1).
The federal, provincial and territorial Ministersof Agriculture recently developed a five-year(2003-2008) comprehensive Agricultural PolicyFramework (APF). The APF is composed of fivekey elements, one of which involves enhancingthe environmental performance of farms acrossCanada. Specific goals have been set for watersupply and water quality, air quality and soil structure and biodiversity maintenance.Management goals include the voluntary imple-mentation of environmental farm plans and theadoption of beneficial farm management prac-tices (BMP). Where environmental risks areidentified, remedial action is encouragedthrough targeted incentives for producers toadopt BMPs. Some of the performance targetsset under the APF will be measured and reportedon using agri-environmental indicators.
With regard to the environment, agricultureremains largely unregulated. However, the overall trend is toward more government intervention, mostly at the provincial and municipal levels. The federal government’s role centres on providing agricultural research,funding agri-environmental programs, providingmarket information, identifying and promotingenvironmentally beneficial management practices, reforming trade policy and fulfillingCanada’s international commitments. To providefarmers with an incentive to meet environmentalgoals and standards, some countries have madeeligibility for farm program support contingenton environmental compliance—a practice
known as cross-compliance. Canada’s main thrust to date has consisted of voluntary measures and incentives.
TECHNOLOGICAL CHANGEAt the farm level, the technological developmentsof the past 200 years have significantly alteredthe way in which producers use resources. This is particularly true of the technology explosionthat marked the latter part of the 20th century.Noteworthy technological advances of the last 10 to 20 years include new farm implements (e.g. no-till seeders), major improvements ininformation technology and genetic engineeringand the advent of precision farming. As well,structural changes have been made in order toexploit economies of scale (e.g. fewer and largerfarms, intensive livestock operations). Between1991 and 2001, the use of no-till methods morethan quadrupled (from 7% to 30% of cultivatedland), producing many positive environmentaleffects: improved soil quality, reduced erosion,enhanced water quality, reduced greenhouse gasemissions through increased carbon sequestrationin the soil and enhanced biodiversity. In 2001,39% of Census farms had a computer to assistwith farm management, compared with 11% in 1991. These developments are shifting theemphasis in agriculture away from physical pro-duction to activities based more on knowledgeand skills. Modern agriculture is characterized by a reduction in physical labour and a movetowards specialization, concentration and consolidation. Specialization has spread throughentire regions where specific crops are mostprofitable. The farms in such regions previouslysupplied a wider range of crops to local markets.Since the prices for specialized crops tend tofluctuate, farmers have also had to adapt byadding value through processing, introducingand developing markets and production practices for new crops, and becoming moreinvolved in crop selling on-line or via marketagents. Institutions such as the Wheat Boardhave had to adapt their selling practices tochanging farmer needs and expectations. Formost commodities, distance to market is nolonger the most important factor in decidingwhere production should take place. Selectingthe right physical and economic environment is a key factor for success in today’s competitiveworld marketplace.
Environmental Sustainability of Canadian Agriculture: Agri-Environmental Indicator Report Series—Report #2
A. Introduction 23
The environmental effects of technologicalchange are the subject of considerable debate.Some technologies have had unanticipated,adverse effects on the environment. For example,the fumigant methyl bromide provided benefitsfor agriculture for a number of years, but its use isbeing phased out because of negative effects onstratospheric ozone. Once these adverse effectsbecame known, a new driving force for changewas created, both to control the widespread useof these chemicals and to search for better alter-natives. Looking at the other side of the coin,there are many examples of new technologiesand practices that reduce environmental risks,such as biological pest control methods, improvedmanure management systems, more efficient livestock diets and conservation tillage.Biotechnology and genetic engineering poten-tially offer considerable advantages to farmers forimproving crop yields. Herbicide tolerance andinsect resistance—the dominant traits of geneti-cally modified crops—can help to increase cropproductivity and reduce the use of externalinputs such as pesticides. However, in Canadaand elsewhere there has been considerable debate about the merits of this technology. Many countries oppose GM products due to the unknown effects on the environment andhuman health. While farmers do benefit frombiotechnology in terms of reduced costs for pestand weed control, consumers are concernedabout how GMOs and biotechnology may affect the food products sold in Canada(GlobeScan 2003).
Another emerging technology relates to the use of agricultural feedstocks such as grain andcellulose for the production of biofuels. Risingfossil fuel prices, better harvests and lower grain prices have sparked interest in the domes-tic production of ethanol and other biofuels.Some stakeholders see renewable fuels as a wayto help achieve Canada’s commitment under the Kyoto Protocol to reduce its greenhouse gasemissions (e.g. mandating the use of ethanolblends). The economics of biofuel productionand the life cycle impacts on the environmentrequire further study.
REFERENCESAgriculture and Agri-Food Canada, 2004. Farm Income, Financial Conditions and Government Assistance Data Book. AAFC, Research and Analysis Directorate, Ottawa (Ont.). www.agr.gc.ca/spb/fiap-dpraa/publications/dbkrdd/2004/sep2004/databook_web_e.pdf
GlobeScan Inc, 2003. Food Issues Monitor –Canada Tables. GlobeScan, Toronto (Ont.).
MacGregor, R.J., and T. McRae, 2000. “Driving Forces Affecting the EnvironmentalSustainability of Agriculture”. Chapter 3 in Environmental Sustainability of CanadianAgriculture: Report of the Agri-EnvironmentalIndicator Project, Edited by T. McRae, C.A.S.Smith and L.J. Gregorich. Agriculture and Agri-Food Canada, Ottawa (Ont.). www.agr.gc.ca/env/naharp-pnarsa/(Go to related documents)
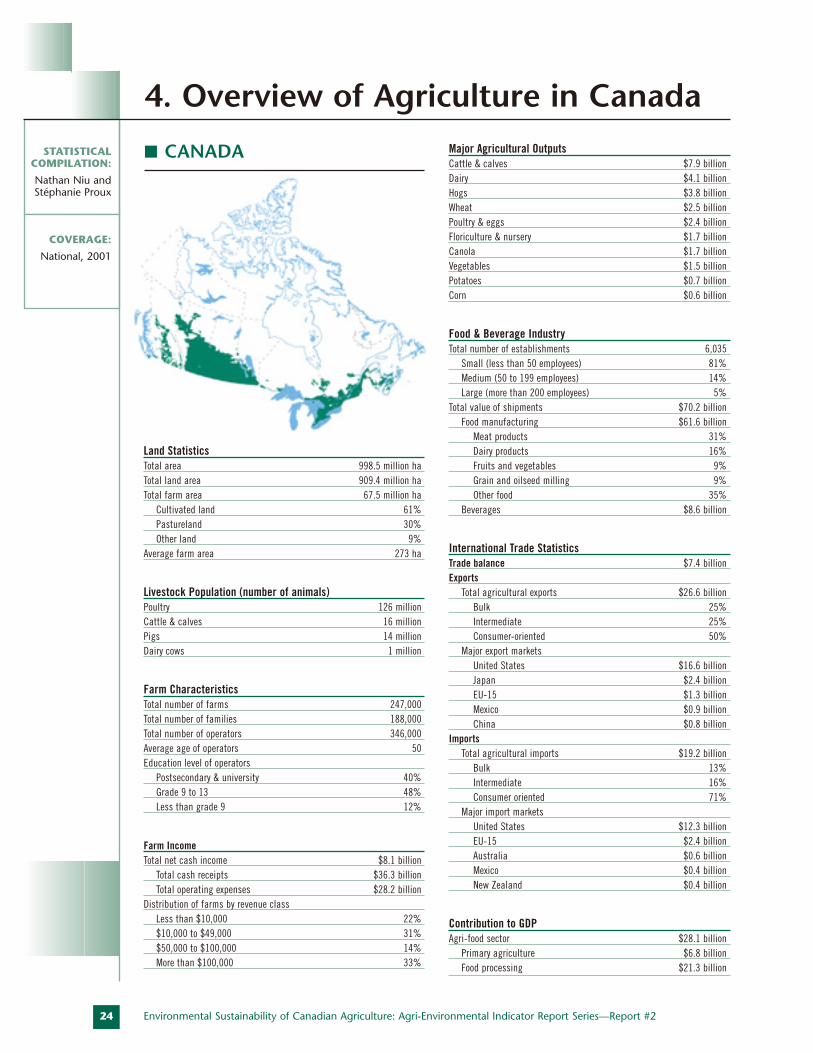
CANADA
Land StatisticsTotal area 998.5 million haTotal land area 909.4 million haTotal farm area 67.5 million ha
Cultivated land 61%Pastureland 30%Other land 9%
Average farm area 273 ha
Livestock Population (number of animals)Poultry 126 million Cattle & calves 16 million Pigs 14 million Dairy cows 1 million
Farm CharacteristicsTotal number of farms 247,000 Total number of families 188,000 Total number of operators 346,000 Average age of operators 50Education level of operators
Postsecondary & university 40%Grade 9 to 13 48%Less than grade 9 12%
Farm IncomeTotal net cash income $8.1 billion
Total cash receipts $36.3 billionTotal operating expenses $28.2 billion
Distribution of farms by revenue class Less than $10,000 22%$10,000 to $49,000 31%$50,000 to $100,000 14%More than $100,000 33%
Major Agricultural OutputsCattle & calves $7.9 billion Dairy $4.1 billion Hogs $3.8 billion Wheat $2.5 billion Poultry & eggs $2.4 billion Floriculture & nursery $1.7 billion Canola $1.7 billion Vegetables $1.5 billion Potatoes $0.7 billion Corn $0.6 billion
Food & Beverage Industry Total number of establishments 6,035
Small (less than 50 employees) 81%Medium (50 to 199 employees) 14%Large (more than 200 employees) 5%
Total value of shipments $70.2 billionFood manufacturing $61.6 billion
Meat products 31%Dairy products 16%Fruits and vegetables 9%Grain and oilseed milling 9%Other food 35%
Beverages $8.6 billion
International Trade StatisticsTrade balance $7.4 billionExports
Total agricultural exports $26.6 billionBulk 25%Intermediate 25%Consumer-oriented 50%
Major export marketsUnited States $16.6 billionJapan $2.4 billionEU-15 $1.3 billionMexico $0.9 billionChina $0.8 billion
ImportsTotal agricultural imports $19.2 billion
Bulk 13%Intermediate 16%Consumer oriented 71%
Major import markets United States $12.3 billionEU-15 $2.4 billionAustralia $0.6 billionMexico $0.4 billionNew Zealand $0.4 billion
Contribution to GDPAgri-food sector $28.1 billion
Primary agriculture $6.8 billionFood processing $21.3 billion
24 Environmental Sustainability of Canadian Agriculture: Agri-Environmental Indicator Report Series—Report #2
STATISTICALCOMPILATION:
Nathan Niu andStéphanie Proux
COVERAGE:
National, 2001
4. Overview of Agriculture in Canada
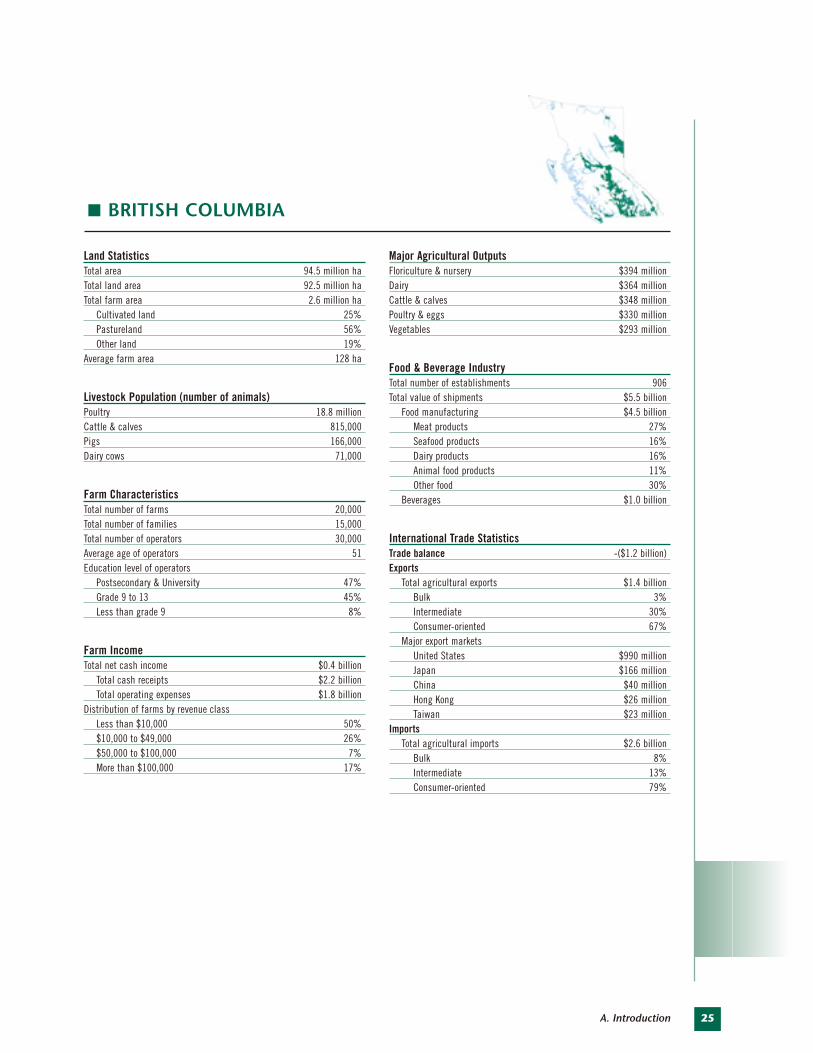
A. Introduction 25
Land StatisticsTotal area 94.5 million haTotal land area 92.5 million haTotal farm area 2.6 million ha
Cultivated land 25%Pastureland 56%Other land 19%
Average farm area 128 ha
Livestock Population (number of animals)Poultry 18.8 million Cattle & calves 815,000 Pigs 166,000 Dairy cows 71,000
Farm CharacteristicsTotal number of farms 20,000 Total number of families 15,000 Total number of operators 30,000 Average age of operators 51Education level of operators
Postsecondary & University 47%Grade 9 to 13 45%Less than grade 9 8%
Farm IncomeTotal net cash income $0.4 billion
Total cash receipts $2.2 billionTotal operating expenses $1.8 billion
Distribution of farms by revenue class Less than $10,000 50%$10,000 to $49,000 26%$50,000 to $100,000 7%More than $100,000 17%
Major Agricultural OutputsFloriculture & nursery $394 million Dairy $364 million Cattle & calves $348 million Poultry & eggs $330 million Vegetables $293 million
Food & Beverage Industry Total number of establishments 906Total value of shipments $5.5 billion
Food manufacturing $4.5 billionMeat products 27%Seafood products 16%Dairy products 16%Animal food products 11%Other food 30%
Beverages $1.0 billion
International Trade StatisticsTrade balance -($1.2 billion)Exports
Total agricultural exports $1.4 billionBulk 3%Intermediate 30%Consumer-oriented 67%
Major export marketsUnited States $990 millionJapan $166 millionChina $40 millionHong Kong $26 millionTaiwan $23 million
ImportsTotal agricultural imports $2.6 billion
Bulk 8%Intermediate 13%Consumer-oriented 79%
BRITISH COLUMBIA
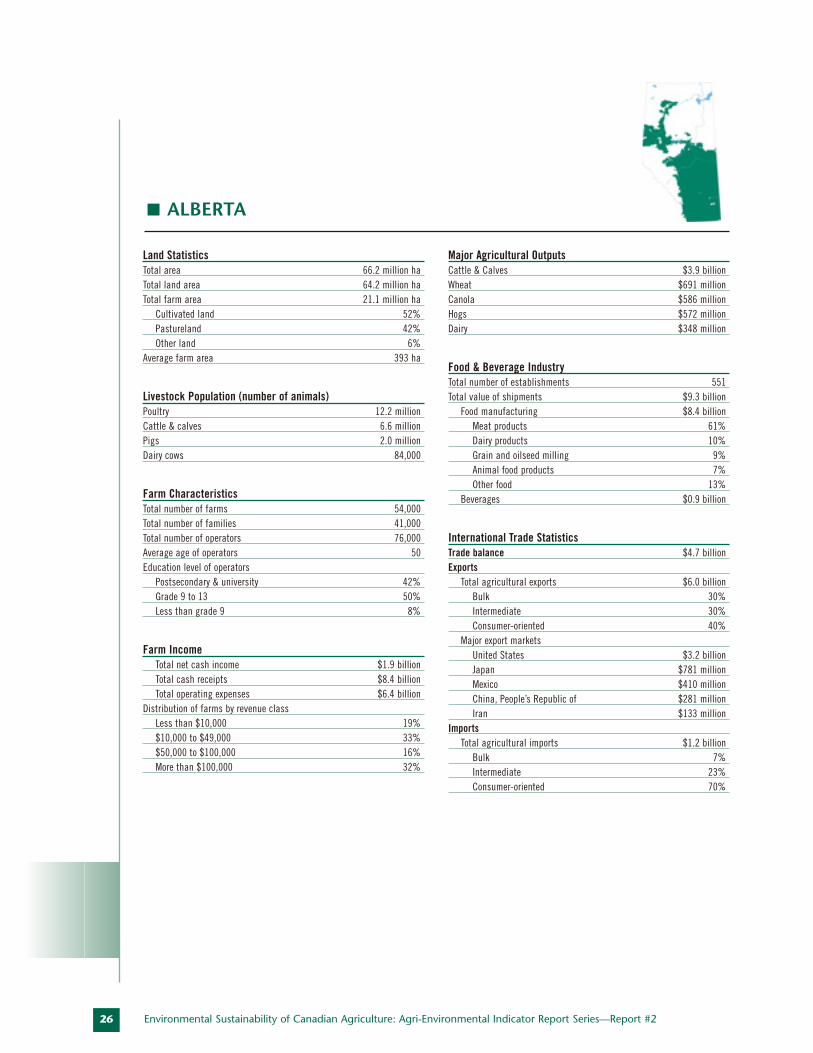
26 Environmental Sustainability of Canadian Agriculture: Agri-Environmental Indicator Report Series—Report #2
Land StatisticsTotal area 66.2 million haTotal land area 64.2 million haTotal farm area 21.1 million ha
Cultivated land 52%Pastureland 42%Other land 6%
Average farm area 393 ha
Livestock Population (number of animals)Poultry 12.2 million Cattle & calves 6.6 million Pigs 2.0 million Dairy cows 84,000
Farm CharacteristicsTotal number of farms 54,000 Total number of families 41,000 Total number of operators 76,000 Average age of operators 50Education level of operators
Postsecondary & university 42%Grade 9 to 13 50%Less than grade 9 8%
Farm IncomeTotal net cash income $1.9 billionTotal cash receipts $8.4 billionTotal operating expenses $6.4 billion
Distribution of farms by revenue class Less than $10,000 19%$10,000 to $49,000 33%$50,000 to $100,000 16%More than $100,000 32%
Major Agricultural OutputsCattle & Calves $3.9 billion Wheat $691 million Canola $586 million Hogs $572 million Dairy $348 million
Food & Beverage Industry Total number of establishments 551Total value of shipments $9.3 billion
Food manufacturing $8.4 billionMeat products 61%Dairy products 10%Grain and oilseed milling 9%Animal food products 7%Other food 13%
Beverages $0.9 billion
International Trade StatisticsTrade balance $4.7 billionExports
Total agricultural exports $6.0 billionBulk 30%Intermediate 30%Consumer-oriented 40%
Major export marketsUnited States $3.2 billionJapan $781 millionMexico $410 millionChina, People’s Republic of $281 millionIran $133 million
ImportsTotal agricultural imports $1.2 billion
Bulk 7%Intermediate 23%Consumer-oriented 70%
ALBERTA
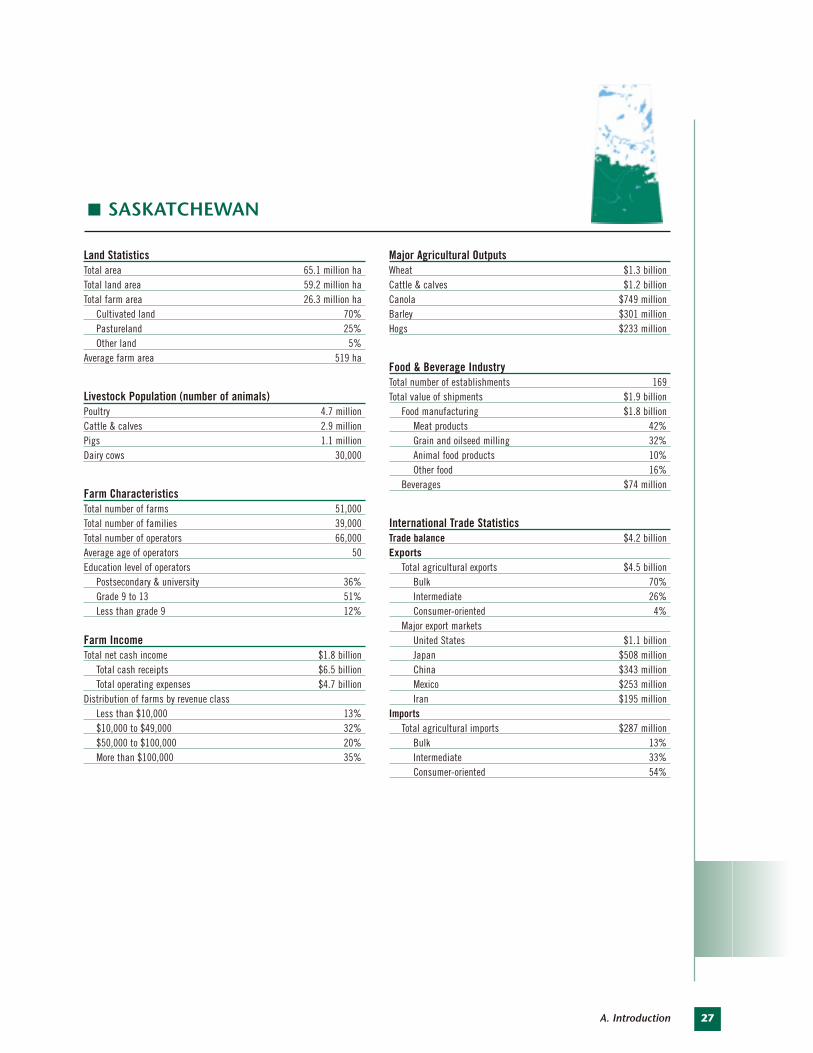
27A. Introduction
Land StatisticsTotal area 65.1 million haTotal land area 59.2 million haTotal farm area 26.3 million ha
Cultivated land 70%Pastureland 25%Other land 5%
Average farm area 519 ha
Livestock Population (number of animals)Poultry 4.7 million Cattle & calves 2.9 million Pigs 1.1 million Dairy cows 30,000
Farm CharacteristicsTotal number of farms 51,000 Total number of families 39,000 Total number of operators 66,000 Average age of operators 50Education level of operators
Postsecondary & university 36%Grade 9 to 13 51%Less than grade 9 12%
Farm IncomeTotal net cash income $1.8 billion
Total cash receipts $6.5 billionTotal operating expenses $4.7 billion
Distribution of farms by revenue class Less than $10,000 13%$10,000 to $49,000 32%$50,000 to $100,000 20%More than $100,000 35%
Major Agricultural OutputsWheat $1.3 billion Cattle & calves $1.2 billion Canola $749 million Barley $301 million Hogs $233 million
Food & Beverage Industry Total number of establishments 169Total value of shipments $1.9 billion
Food manufacturing $1.8 billionMeat products 42%Grain and oilseed milling 32%Animal food products 10%Other food 16%
Beverages $74 million
International Trade StatisticsTrade balance $4.2 billionExports
Total agricultural exports $4.5 billionBulk 70%Intermediate 26%Consumer-oriented 4%
Major export marketsUnited States $1.1 billionJapan $508 millionChina $343 millionMexico $253 millionIran $195 million
ImportsTotal agricultural imports $287 million
Bulk 13%Intermediate 33%Consumer-oriented 54%
SASKATCHEWAN
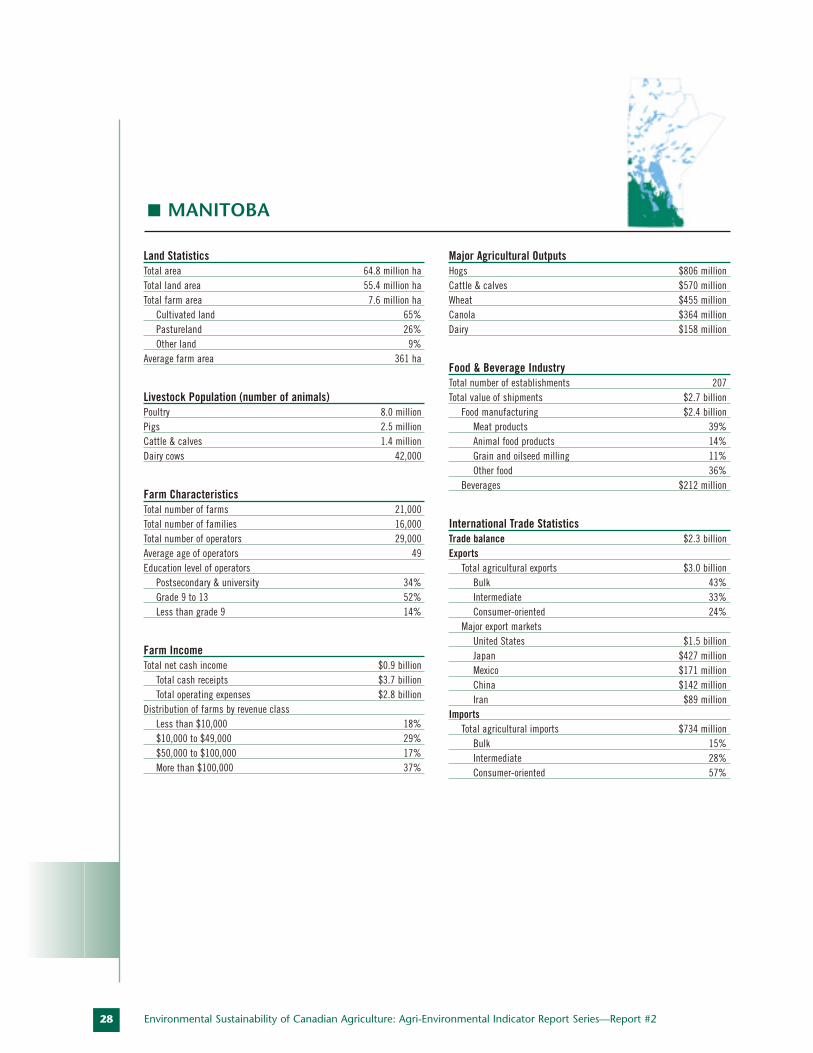
28 Environmental Sustainability of Canadian Agriculture: Agri-Environmental Indicator Report Series—Report #2
Land StatisticsTotal area 64.8 million haTotal land area 55.4 million haTotal farm area 7.6 million ha
Cultivated land 65%Pastureland 26%Other land 9%
Average farm area 361 ha
Livestock Population (number of animals)Poultry 8.0 million Pigs 2.5 million Cattle & calves 1.4 million Dairy cows 42,000
Farm CharacteristicsTotal number of farms 21,000 Total number of families 16,000 Total number of operators 29,000 Average age of operators 49Education level of operators
Postsecondary & university 34%Grade 9 to 13 52%Less than grade 9 14%
Farm IncomeTotal net cash income $0.9 billion
Total cash receipts $3.7 billionTotal operating expenses $2.8 billion
Distribution of farms by revenue class Less than $10,000 18%$10,000 to $49,000 29%$50,000 to $100,000 17%More than $100,000 37%
Major Agricultural OutputsHogs $806 million Cattle & calves $570 million Wheat $455 million Canola $364 million Dairy $158 million
Food & Beverage Industry Total number of establishments 207Total value of shipments $2.7 billion
Food manufacturing $2.4 billionMeat products 39%Animal food products 14%Grain and oilseed milling 11%Other food 36%
Beverages $212 million
International Trade StatisticsTrade balance $2.3 billionExports
Total agricultural exports $3.0 billionBulk 43%Intermediate 33%Consumer-oriented 24%
Major export marketsUnited States $1.5 billionJapan $427 millionMexico $171 millionChina $142 millionIran $89 million
ImportsTotal agricultural imports $734 million
Bulk 15%Intermediate 28%Consumer-oriented 57%
MANITOBA
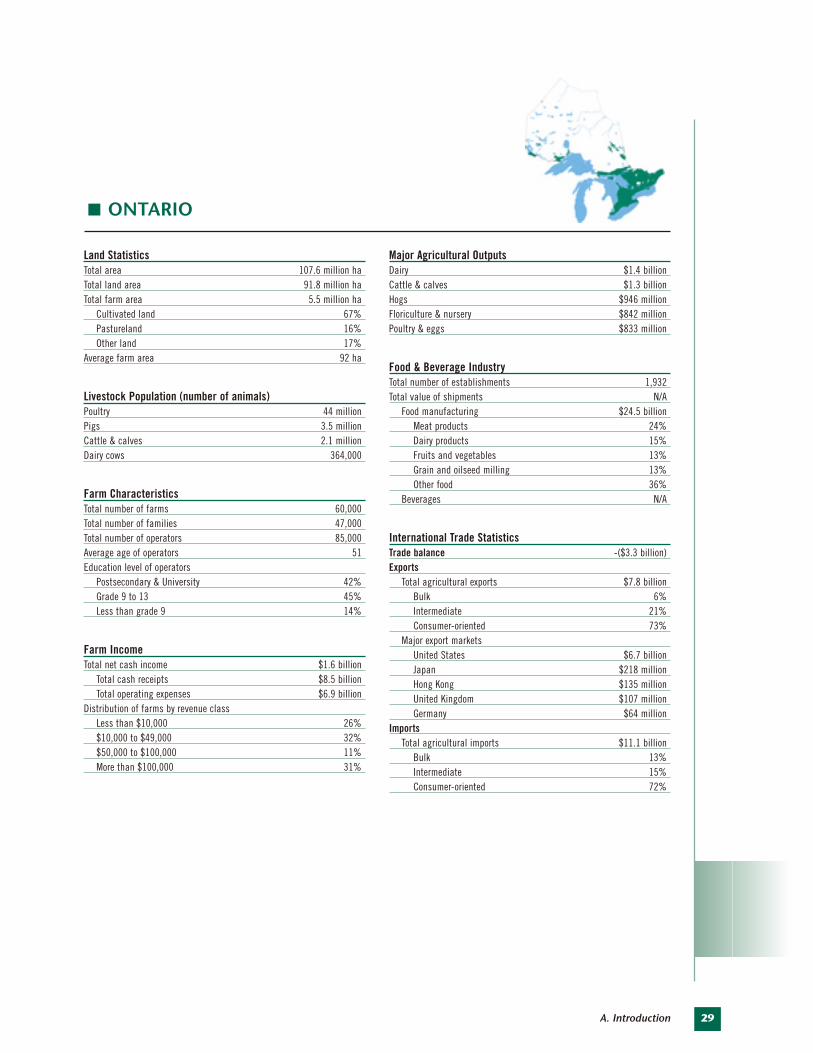
29A. Introduction
Land StatisticsTotal area 107.6 million haTotal land area 91.8 million haTotal farm area 5.5 million ha
Cultivated land 67%Pastureland 16%Other land 17%
Average farm area 92 ha
Livestock Population (number of animals)Poultry 44 million Pigs 3.5 million Cattle & calves 2.1 million Dairy cows 364,000
Farm CharacteristicsTotal number of farms 60,000 Total number of families 47,000 Total number of operators 85,000 Average age of operators 51Education level of operators
Postsecondary & University 42%Grade 9 to 13 45%Less than grade 9 14%
Farm IncomeTotal net cash income $1.6 billion
Total cash receipts $8.5 billionTotal operating expenses $6.9 billion
Distribution of farms by revenue class Less than $10,000 26%$10,000 to $49,000 32%$50,000 to $100,000 11%More than $100,000 31%
Major Agricultural OutputsDairy $1.4 billion Cattle & calves $1.3 billion Hogs $946 million Floriculture & nursery $842 million Poultry & eggs $833 million
Food & Beverage Industry Total number of establishments 1,932Total value of shipments N/A
Food manufacturing $24.5 billionMeat products 24%Dairy products 15%Fruits and vegetables 13%Grain and oilseed milling 13%Other food 36%
Beverages N/A
International Trade StatisticsTrade balance -($3.3 billion)Exports
Total agricultural exports $7.8 billionBulk 6%Intermediate 21%Consumer-oriented 73%
Major export marketsUnited States $6.7 billionJapan $218 millionHong Kong $135 millionUnited Kingdom $107 millionGermany $64 million
ImportsTotal agricultural imports $11.1 billion
Bulk 13%Intermediate 15%Consumer-oriented 72%
ONTARIO
30 Environmental Sustainability of Canadian Agriculture: Agri-Environmental Indicator Report Series—Report #2
Land StatisticsTotal area 154.2 million haTotal land area 136.5 million haTotal farm area 3.4 million ha
Cultivated land 54%Pastureland 11%Other land 35%
Average farm area 106 ha
Livestock Population (number of animals)Poultry 29.2 million Pigs 4.3 million Cattle & calves 1.4 million Dairy cows 407,000
Farm CharacteristicsTotal number of farms 32,000 Total number of families 23,000 Total number of operators 47,000 Average age of operators 47Education level of operators
Postsecondary & university 37%Grade 9 to 13 44%Less than grade 9 18%
Farm IncomeTotal net cash income $1.3 billion
Total cash receipts $5.8 billionTotal operating expenses $4.5 billion
Distribution of farms by revenue class Less than $10,000 17%$10,000 to $49,000 27%$50,000 to $100,000 13%More than $100,000 44%
Major Agricultural OutputsDairy $1.5 billion Hogs $1.1 billion Poultry & eggs $588 million Cattle & calves $533 million Vegetables $282 million
Food & Beverage Industry Total number of establishments 1,481Total value of shipments N/A
Food manufacturing $14.2 billionMeat products 32%Dairy products 23%Fruits and vegetables 6%Other food 38%
Beverages N/A
International Trade StatisticsTrade balance $0.4 billionExports
Total agricultural exports $3.2 billionBulk 4%Intermediate 15%Consumer-oriented 82%
Major export marketsUnited States $2.4 billionJapan $211 millionMexico $41 millionCuba $40 millionFrance $33 million
ImportsTotal agricultural imports $2.8 billion
Bulk 20%Intermediate 16%Consumer-oriented 64%
QUEBEC
31A. Introduction
Land StatisticsTotal area 7.3 million ha Total land area 7.1 million ha Total farm area 388,000 ha
Cultivated land 39%Pastureland 12%Other land 50%
Average farm area 128 ha
Livestock Population (number of animals)Poultry 3.5 million Pigs 137,000 Cattle & calves 91,000 Dairy cows 19,000
Farm CharacteristicsTotal number of farms 3,034 Total number of families 2,260 Total number of operators 3,900 Average age of operators 51Education level of operators
Postsecondary & university 40%Grade 9 to 13 44%Less than grade 9 16%
Farm IncomeTotal net cash income $72 million
Total cash receipts $412 millionTotal operating expenses $340 million
Distribution of farms by revenue class Less than $10,000 39%$10,000 to $49,000 28%$50,000 to $100,000 8%More than $100,000 26%
Major Agricultural OutputsPotatoes $100 million Dairy $68 million Poultry & eggs $65 million Floriculture & nursery $46 million Hogs $38 million
Food & Beverage Industry Total number of establishments 199Total value of shipments $2.1 billion
Food manufacturing $1.9 billionSeafood products 45%Dairy products 7%Animal food products 6%Bakeries and tortilla products 3%Other food 39%
Beverages $210 million
International Trade StatisticsTrade balance $119 millionExports
Total agricultural exports $378 millionBulk 0%Intermediate 9%Consumer-oriented 91%
Major export marketsUnited States $308 millionJapan $30 millionPhilippines $6 millionVenezuela $5 millionTaiwan $5 million
ImportsTotal agricultural imports $259 million
Bulk 11%Intermediate 14%Consumer-oriented 75%
NEW BRUNSWICK

32 Environmental Sustainability of Canadian Agriculture: Agri-Environmental Indicator Report Series—Report #2
Land StatisticsTotal area 5.5 million haTotal land area 5.3 million haTotal farm area 407,000 ha
Cultivated land 29%Pastureland 14%Other land 57%
Average farm area 104 ha
Livestock Population (number of animals)Poultry 4.1 million Pigs 125,000 Cattle & calves 108,000 Dairy cows 24,000
Farm CharacteristicsTotal number of farms 3,923 Total number of families 3,025 Total number of operators 5,070 Average age of operators 51Education level of operators
Postsecondary & university 52%Grade 9 to 13 39%Less than grade 9 9%
Farm IncomeTotal net cash income $70 million
Total cash receipts $421 millionTotal operating expenses $351 million
Distribution of farms by revenue class Less than $10,000 40%$10,000 to $49,000 32%$50,000 to $100,000 7%More than $100,000 22%
Major Agricultural OutputsDairy $96 million Poultry & eggs $86 million Hogs $39 million Floriculture & nursery $35 million Cattle & calves $34 million
Food & Beverage Industry Total number of establishments 323Total value of shipments N/A
Food manufacturing $2.0 billionSeafood products 43%Other food 22%Dairy products 16%Meat products 13%Animal food products 6%
Beverages N/A
International Trade StatisticsTrade balance $6 millionExports
Total agricultural exports $174 millionBulk 0%Intermediate 8%Consumer-oriented 92%
Major export marketsUnited States $130 millionJapan $11 millionGermany $10 millionUnited Kingdom $ 5 millionFrance $3 million
ImportsTotal agricultural imports $180 million
Bulk 42%Intermediate 3%Consumer-oriented 56%
NOVA SCOTIA
33A. Introduction
Land StatisticsTotal area 566,000 ha Total land area 566,000 ha Total farm area 261,000 ha
Cultivated land 67%Pastureland 9%Other land 23%
Average farm area 142 ha
Livestock Population (number of animals)Poultry 365,000 Pigs 126,000 Cattle & calves 85,000 Dairy cows 15,000
Farm CharacteristicsTotal number of farms 1,845 Total number of families 1,425 Total number of operators 2,455 Average age of operators 49Education level of operators
Postsecondary & university 41%Grade 9 to 13 47%Less than grade 9 12%
Farm IncomeTotal net cash income $45 million
Total cash receipts $337 millionTotal operating expenses $292 million
Distribution of farms by revenue class Less than $10,000 19%$10,000 to $49,000 28%$50,000 to $100,000 13%More than $100,000 40%
Major Agricultural OutputsPotatoes $124 million Dairy $52 million Hogs $34 million Cattle & calves $28 million Vegetables $10 million
Food & Beverage Industry Total number of establishments 88Total value of shipments N/A
Food manufacturing $859 millionSeafood products 34%Other food 66%Beverages N/A
International Trade StatisticsTrade balance $285 millionExports
Total agricultural exports $288 millionBulk 0%Intermediate 1%Consumer-oriented 99%
Major export marketsUnited States $265 millionVenezuela $4 millionTrinidad-Tobago $4 millionUruguay $2 millionBarbados $1 million
ImportsTotal agricultural imports $3 million
Bulk 8%Intermediate 16%Consumer-oriented 76%
PRINCE EDWARD ISLAND
34 Environmental Sustainability of Canadian Agriculture: Agri-Environmental Indicator Report Series—Report #2
Land StatisticsTotal area 40.5 million ha Total land area 37.4 million ha Total farm area 41,000 ha
Cultivated land 21%Pastureland 24%Other land 55%
Average farm area 60 ha
Livestock Population (number of animals)Poultry 1.7 million Cattle & calves 9,000 Dairy cows 5,000 Pigs 3,000
Farm CharacteristicsTotal number of farms 643 Total number of families 430 Total number of operators 790 Average age of operators 51Education level of operators
Postsecondary & university 46%Grade 9 to 13 37%Less than grade 9 16%
Farm IncomeTotal net cash income $8 million
Total cash receipts $79 millionTotal operating expenses $71 million
Distribution of farms by revenue class Less than $10,000 45%$10,000 to $49,000 28%$50,000 to $100,000 8%More than $100,000 20%
Major Agricultural OutputsDairy $27 million Poultry & eggs $10 million Floriculture & nursery $10 million Vegetables $3 million Cattle & calves $2 million
Food & Beverage Industry Total number of establishments 179Total value of shipments N/A
Food manufacturing $1 millionSeafood products 81%Other food 19%Beverages N/A
International Trade StatisticsTrade balance -($14 million)Exports
Total agricultural exports $1 millionBulk 0%Intermediate 12%Consumer-oriented 88%
Major export marketsUnited States $410,000United Kingdom $290,000Germany $250,000Russia $140,000St. Pierre-Miquelon $110,000
ImportsTotal agricultural imports $15 million
Bulk 0%Intermediate 1%Consumer-oriented 99%
NEWFOUNDLAND AND LABRADOR
35A. Introduction
DATA SOURCESThe main source for statistics on land use, livestock populations, farm characteristics and farm income is: Statistics Canada, 2001.Census of Agriculture.
Major agricultural outputs: Statistics Canada,2001. Farm Cash Receipts.
Food and beverage industry: Statistics Canada,2001. Annual Survey of Manufactures.
International trade, import and export markets, contribution to GDP: Statistics Canada, 2001. Canadian InternationalMerchandise Trade Database.
Note: Some provincial data on the agricultureand agri-food sector are underreported owing to data confidentiality or gaps in the data. As a result, provincial totals may not add up to the values reported for Canada as a whole.
INTRODUCTIONAgri-environmental indicators (AEI) provide ahistorical perspective on the agriculture sector’senvironmental performance. However, in orderfor the sector to manage its natural resources ina manner that is environmentally, socially andeconomically sustainable, there is a need tounderstand how changes to agricultural policesand programs will affect the sector’s economicand environmental outcomes and how to produce outcomes that are consistent with government goals and objectives. Science must be harnessed in the policy developmentprocess to generate reliable quantitative infor-mation about environmental effects and supportanalytical tools that allow this information to be integrated into the policy decision-makingprocess. In the present context, this involvesintegrating agri-environmental indicator modelswith policy models. Such integrated models canthen be used to evaluate existing policies andprograms relative to their combined economicand environmental performance, as well as toestimate or predict the economic and environ-mental impacts of proposed programs andpolicies.
LINKING AGRI-ENVIRONMENTAL INDICATORS TO POLICY MODELS
Building this type of integrated modellingcapacity requires a multidisciplinary approachinvolving both research scientists and econo-mists. The integrated economic/environmentalmodelling system under development at AAFCuses a policy model to estimate changes in farmresource allocations (crops and livestock) relativeto a baseline level for selected scenarios andfeeds this information into AEI models to assessa suite of potential environmental outcomes(Figure 5-1). The economic model used is theCanadian Regional Agricultural Model (CRAM)(Horner at al. 1992). It is capable of estimatingthe change in resource allocations for variouscrop and livestock activities in response tochanges in technology, government programsand policies or market conditions.
This integrated economic/environmental modelling approach was first developed toenable AAFC to estimate the economic and environmental consequences of wind and water erosion on the Prairies (Bouzaher et al. 1995). AAFC subsequently enhanced themethodology and used it to assess erosionimpacts following the elimination of theWestern Grain Transportation Act (WGTA) subsidy and the reform of the Canadian Wheat
SUMMARYUnderstanding how changes to agricultural polices and programs will impact the sector’s future economic
and environmental outcomes is critical for the policy development and evaluation process. Achieving this
insight necessitates linking science to analytical policy tools. Agriculture and Agri-Food Canada (AAFC)
has used a multidisciplinary approach to develop this kind of integrated modelling capacity by linking the
Canadian Regional Agricultural Model (CRAM), a policy model, to agri-environmental indicators. In recent
years, this science-based analytical approach has proven very useful for agricultural policy analysis, for
example to assess possible greenhouse gas (GHG) mitigation strategies and to support the selection of
quantitative environmental performance targets under the Agricultural Policy Framework (APF). While
the demand for this type of analysis is increasing, many methodological issues still need to be ironed out.
36 Environmental Sustainability of Canadian Agriculture: Agri-Environmental Indicator Report Series—Report #2
AUTHOR:
B. Junkins
5. Linking Science to Policy
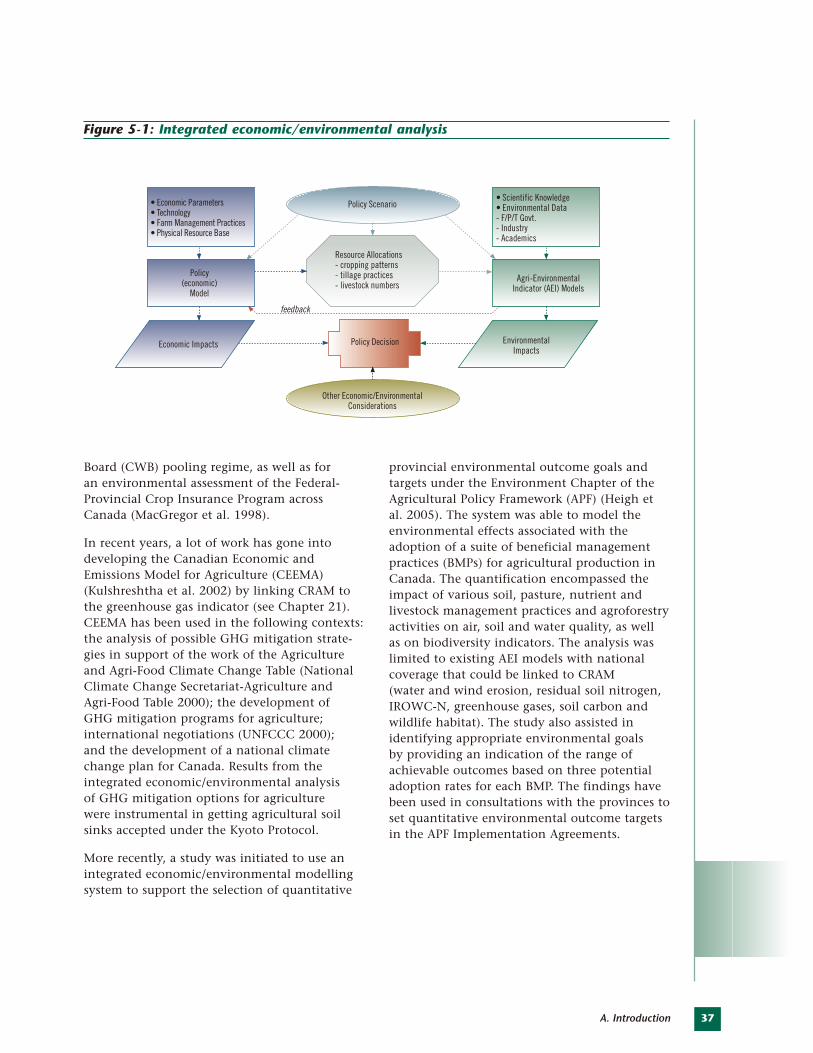
37A. Introduction
Board (CWB) pooling regime, as well as for an environmental assessment of the Federal-Provincial Crop Insurance Program acrossCanada (MacGregor et al. 1998).
In recent years, a lot of work has gone intodeveloping the Canadian Economic andEmissions Model for Agriculture (CEEMA)(Kulshreshtha et al. 2002) by linking CRAM tothe greenhouse gas indicator (see Chapter 21).CEEMA has been used in the following contexts:the analysis of possible GHG mitigation strate-gies in support of the work of the Agricultureand Agri-Food Climate Change Table (NationalClimate Change Secretariat-Agriculture and Agri-Food Table 2000); the development of GHG mitigation programs for agriculture; international negotiations (UNFCCC 2000); and the development of a national climatechange plan for Canada. Results from the integrated economic/environmental analysis of GHG mitigation options for agriculture were instrumental in getting agricultural soilsinks accepted under the Kyoto Protocol.
More recently, a study was initiated to use anintegrated economic/environmental modellingsystem to support the selection of quantitative
provincial environmental outcome goals andtargets under the Environment Chapter of theAgricultural Policy Framework (APF) (Heigh etal. 2005). The system was able to model theenvironmental effects associated with the adoption of a suite of beneficial managementpractices (BMPs) for agricultural production inCanada. The quantification encompassed theimpact of various soil, pasture, nutrient andlivestock management practices and agroforestryactivities on air, soil and water quality, as well as on biodiversity indicators. The analysis waslimited to existing AEI models with nationalcoverage that could be linked to CRAM (water and wind erosion, residual soil nitrogen,IROWC-N, greenhouse gases, soil carbon andwildlife habitat). The study also assisted in identifying appropriate environmental goals by providing an indication of the range ofachievable outcomes based on three potentialadoption rates for each BMP. The findings havebeen used in consultations with the provinces toset quantitative environmental outcome targetsin the APF Implementation Agreements.
feedback
Other Economic/EnvironmentalConsiderations
Policy Scenario
Resource Allocations- cropping patterns- tillage practices- livestock numbers
• Economic Parameters• Technology• Farm Management Practices• Physical Resource Base
Economic Impacts
• Scientific Knowledge• Environmental Data- F/P/T Govt.- Industry- Academics
EnvironmentalImpacts
Policy Decision
Policy(economic)
Model
Agri-EnvironmentalIndicator (AEI) Models
Figure 5-1: Integrated economic/environmental analysis
38
LIMITATIONS AND FUTURE DIRECTIONS
Analytical models based on sound science haveproven very useful for policy evaluation anddevelopment purposes, and the demand for thistype of analysis is increasing. However, this isgroundbreaking work. Development of the analytical capacity has just begun and there arestill many unresolved issues related to resources,data, models, science and spatial aspects. Someof the main limitations in terms of the currentcapacity to do this type of integrated modelling,as well as future directions envisaged for thiswork, are described below.
As a policy tool, the Canadian RegionalAgricultural Model (CRAM) is based on politicalboundaries that are dictated bythe available economic data (22 crop production regions inthe Prairies, provincial basis forcrops in other regions and forlivestock). Yet, environmentalissues are inherently local innature, which is why agri-environmental indicators are based on much smaller eco-logical regions (Soil Landscapeof Canada (SLC) polygons).Consequently, the output fromCRAM needs to be brokendown to the SLC level so thatthe cropping and management practice scenarios from the policy model can be assignedto specific locations within the landscape. Atpresent, this is done by assuming a uniform distribution. Work is under way to improve this aspect of the analytical system throughdeveloping a Land Use Allocation Model(LUAM), which would predict spatially explicit land use change based on factors such as attributes of the land that affect its resilience/suitability (soils, topography, climate), competing land use demands, proximity to markets, production costs, existing land use and its adaptability to change.
The scenarios and agri-environmental indicatorsthat have been used in the analyses to date are constrained by the availability of integratedmodels. As a result, some important farm management options (e.g. manure management)are left out of the analyses. Similarly, quantita-tive assessments of the “on-farm” economicimpacts of environmental management scenar-ios are limited by the lack of relevant economicinformation. For many scenarios, informedassumptions about BMP adoption rates havebeen imposed, and so the results are not drivenby the underlying economics of the policymodel. Finally, the existing integrated modellingsystem does not include any feedback linkagesbetween the economic and environmental components in the sense that outputs from
policy model scenarios are used as input to the AEI modelsto estimate the environmentalimpacts, but not vice versa(changes in environmentalindicators could have economicconsequences).
Development of integratedmodelling capacity and of applications for policy analysisis an ongoing process. A revisedversion of CRAM, which is cur-rently being tested, incorporatesa number of improvements,
such as the addition of an agricultural waterdemand component and the division of Ontario, Quebec and British Columbia into multiple regions. Studies are also planned on the farm-level costs and benefits of adoptingenvironmentally friendly BMPs, and the informa-tion that is obtained will be fed into CRAM toenhance economic analysis for selected scenarios.Since the existing AEI models are being updatedand new ones developed, linkages between CRAMand the AEIs will require ongoing adjustment. Inthe future, an estimate of the level of uncertaintyassociated with model results will be required forinformed policy decision making.
Environmental Sustainability of Canadian Agriculture: Agri-Environmental Indicator Report Series—Report #2
Analytical models
based on sound science
have proven very useful
for policy evaluation
and development
purposes, and the
demand for this type of
analysis is increasing.
39A. Introduction
Integrated economic/environmental models pro-vide the capacity to estimate the environmentalimpacts of agricultural programs and policies inphysical terms (e.g. soil erosion in tonnes/ha/yror greenhouse gas emissions in tonnes/yr), aswell as the economic consequences for produc-ers. However, to permit a complete cost-benefitanalysis, a monetary value must first be assignedto these environmental impacts and a trade-offanalysis of the economic and environmentaloutcomes can then be performed.
There is increasing demand for this type of integrated analysis among policy makers.Ongoing and future applications of the inte-grated economic/environmental modellingsystem include the following: refining the environmental outcome targets of the APF and evaluating new technologies and the nextgeneration of BMPs for the next version of theAPF; tackling climate change by developing adomestic emissions trading (DET) and offsetssystem, analysing a more aggressive set of mitigation options including environmental co-benefits and assessing the impacts of climatechange on the agriculture sector along with possible adaptation strategies; and carrying out environmental assessments of agriculturalpolicies and programs (e.g. World TradeOrganization negotiations).
REFERENCESBouzaher, A., J.F. Shogren, D. Holtkamp, P. Gassman, D Archer, P. Lakshminarayan, A. Carriquiry, R. Reese, D. Kakani, W.H. Furtan,R.C. Izaurralde, and J. Kiniry, 1996. AgriculturalPolicies and Soil Degradation in Western Canada: An Agro-Ecological Economic Assessment. Report 5:Project Summary. Technical Report No. 2-95.Agriculture and Agri-Food Canada, Ottawa (Ont.).
Heigh, L., B. Junkins, R.J. MacGregor, R. Gill, J. Heigh, T. Huffman, J. Yang, L. van Vliet, G. Padbury, and M. Boehm, 2004. QuantitativeAnalysis of the Impact of Agricultural ManagementStrategies on Environmental Indicators. Agricultureand Agri-Food Canada, Ottawa (Ont.).www.agr.gc.ca/spb/rad-dra/publications/isie/ise_e.pdf
Horner, G.L., J. Corman, R.E. Howitt, C.A. Carter,and R.J. MacGregor, 1992. The Canadian RegionalAgriculture Model Structure, Operation andDevelopment. Agriculture and Agri-Food Canada,Ottawa (Ont.).
Kulshreshtha, S.N., R. Gill, B. Junkins, R. Desjardins, M. Boehm and M. Bonneau, 2002.Canadian Economic and Emissions Model for Agriculture (C.E.E.M.A. 2.0): TechnicalDocumentation. CSALE Working Paper #12.University of Saskatchewan, Saskatoon (Sas.).www.csale.usask.ca/PDFDocuments/cndEconEmissionMdl.pdf
MacGregor, R.J., J. Giraldez, I. Campbell, G. Wall,B. Junkins, R. Gill, I. Shelton, B. Stephen, and G. Padbury, 1998. The Federal-Provincial CropInsurance Program: An Integrated Environmental-Economic Assessment. Agriculture and Agri-FoodCanada, Ottawa (Ont.). www.agr.gc.ca/spb/rad-dra/publications/fedprov/fedprov_e.php
National Climate Change Secretariat-Agricultureand Agri-Food Table, 2000. Options Report:Reducing Greenhouse Gas Emissions from CanadianAgriculture. Agriculture and Agri-Food ClimateChange Table. Agriculture and Agri-Food Canada,Ottawa (Ont.).http://dsp-psd.pwgsc.gc.ca/Collection/ M22-132-1-2000E.pdf
United Nations Framework Convention onClimate Change (UNFCCC), 2000. ProposalsRelated to Kyoto Protocol Articles 3.3 and 3.4.Paper No. 3, pp. 46-104. UNFCCC Secretariat,Subsidiary Body for Scientific and TechnologicalAdvice (SBSTA), Lyon (France).http://unfccc.int/resource/docs/2000/sbsta/misc06.pdf

BEnvironmental FarmManagement
THE ISSUEThe idea of using agri-environmental indicatorsto track changes in a broad and varied industrylike agriculture arose because of the impracticalityof repeatedly measuring a wide range of specificconditions across all the agricultural landscapesof Canada. The development of science-basedagri-environmental indicators is predicated onapplying current scientific knowledge to under-standing the effects that a limited number of keyland use and management practices have on theenvironment. Trends in such key variables areassessed over time and interpreted with referenceto individual indicators. As an example, withinthe farmland sphere, different crops and land usetypes have differing propensities for creating conditions that are conducive to soil erosion. A shift toward increasing area under row crops,such as potatoes or corn, or under summerfallow,generally indicates movement toward higher erosion risk, whereas an increase in the area ofhay crops signals a lower risk of erosion. The risklevel may be altered, that is, either increased ordecreased, by the specific management practicesthat are applied.
This chapter presents some of the key adjust-ments in land use and agricultural managementpractices that occurred between 1981 and 2001in Canada based on an evaluation of data fromthe Census of Agriculture. This national surveyconducted by Statistics Canada every five yearsencompasses a wide variety of variables and
ensures consistent coverage of all farms. It therefore has tremendous potential as a tool for assessing changes in land use trends at theprovincial and national levels. The types ofenvironmental impacts these changes have generated are captured and explored in the agri-environmental indicator chapters presentedin this report.
LAND USE INFORMATIONWithin the farmland sphere, different crops andland use types have different propensities forcausing environmental impacts. To present anoverview of long-term trends in land use for the individual provinces and nationally, six keyCensus variables have been used:
1) Area of farmland
2) Area of cultivated farmland
3) Area of pasture (improved pasture andnative pasture)
4) Area of row crops (corn for grain and silage,vegetables, potatoes, tobacco)
5) Area of summerfallow
6) Area of “other land,” or the area of farmlanddevoted to uses other than crops or livestock(e.g. farm buildings, barnyards, greenhouses,woodlots, windbreaks, marshes).
SUMMARY Over the 20-year period from 1981 to 2001, agricultural land use intensity increased across Canada.
Noteworthy developments in Western Canada include a marked decline in the area of summerfallow,
an increase in the area of forages and expanded use of soil-conserving practices for tillage as well as
summerfallow. Diversification of cropping has been a prominent feature of the changing situation of
land use in the West, particularly on the Prairies, and this is evidenced by a decrease in the area of the
more traditional cereal grains and an increase in the area of oilseed and pulse crops. In Eastern Canada,
whereas the overall amount of farmland decreased during the 20-year period under review, the area of
cropped land actually increased in every province. In general, this expansion in the area of cropland
occurred at the expense of pasture and summerfallow.
42 Environmental Sustainability of Canadian Agriculture: Agri-Environmental Indicator Report Series—Report #2
AUTHORS:
W. Eilers and T. Huffman
INFORMATIONSOURCE:
Census ofAgriculture
STATUS:
National coverage,
1981 to 2001
6. Agriculture Land Use Change
43B. Environmental Farm Management
CROPPING PRACTICESIn addition to land use information, it is impor-tant to know the types and trends in crops that are typically grown in the regions, becausedifferent cropping patterns typically have differing effects on the environment. Seven key Census crop type variables are used:
1) Area of annually cropped land (land used to produce crops, excluding summerfallowand pasture);
2) Area of cereal crops (wheat, barley, oats);
3) Area of oilseeds (canola, mustard, flax, safflower, sunflower);
4) Area of corn (grain corn, silage corn);
5) Area of potatoes;
6) Area of pulse crops and legumes (beans,lentils, chick peas, dry field peas);
7) Area of forage crops (alfalfa and alfalfamixes, other tame hay and fodder crops cutfor hay or silage, forage harvested for seed).
TILLAGE PRACTICESAs noted earlier, the management practicesemployed by farmers need to be considered ininterpreting land use trends. Tillage practiceshave been evaluated in the Census of Agriculturesince 1991 using six different variables:
1) Area of cropland prepared for seeding usingconventional tillage practices (tillage thatturns over the top 15 to 20 cm of soil, burying plant residues and exposing the soil, followed by secondary tillage to breakup soil aggregates and produce a smooth,even seedbed);
2) Area of land prepared for seeding using conservation tillage (tillage practices thatbreak up the soil and kill weeds but do notturn the soil over);
3) Area of land prepared for seeding using no-till (management practice that maintainsall plant residues on the surface);
4) Area of summerfallow maintained by tillageweed control (the practice of fallowing traditionally required that tillage be carriedout periodically during the growing season);
5) Area of summerfallow maintained by a combination of chemical and tillage weedcontrol (chemical and tillage weed controlreduces the amount of tillage involved in weed control, through either reduced-frequency tillage or “spot cultivation”);
6) Area of summerfallow maintained by chemical-only weed control.
LIMITATIONSThe main limitations relating to the numbersreported in this chapter consist of the possibilitythat producers misinterpreted the Census questions and changes in the questions overtime. For example, according to StatisticsCanada (1997), in 1981, the area of unimprovedland was underreported in the four westernprovinces. This affected the area of total farm-land and all “other land” categories for each of the western provinces and for Canada as awhole. Also producers may have had difficultywith interpretation of the terms for differenttypes of tillage practices. This may have influ-enced the areas reported. A more completedescription of potential errors and data qualityis provided in Statistics Canada (1997).
OBSERVED TRENDS National and provincial land use trends, derivedfrom Statistics Canada’s Census of Agriculture,are provided in Tables 6-1, 6-2 and 6-3 forCensus years 1981 through 2001 (except fortillage data which are available only for 1991,1996 and 2001).
Canada: The total amount of farmland inCanada remained relatively stable between 1981(65.9 million ha) and 2001 (67.5 million ha),largely because the vast majority of land that issuitable for agriculture is already being used forthat purpose. For similar reasons, the propor-tions of cultivated farmland (61%), pasture(30%), row crops (3%) and “other land” (9%)also remained fairly constant.
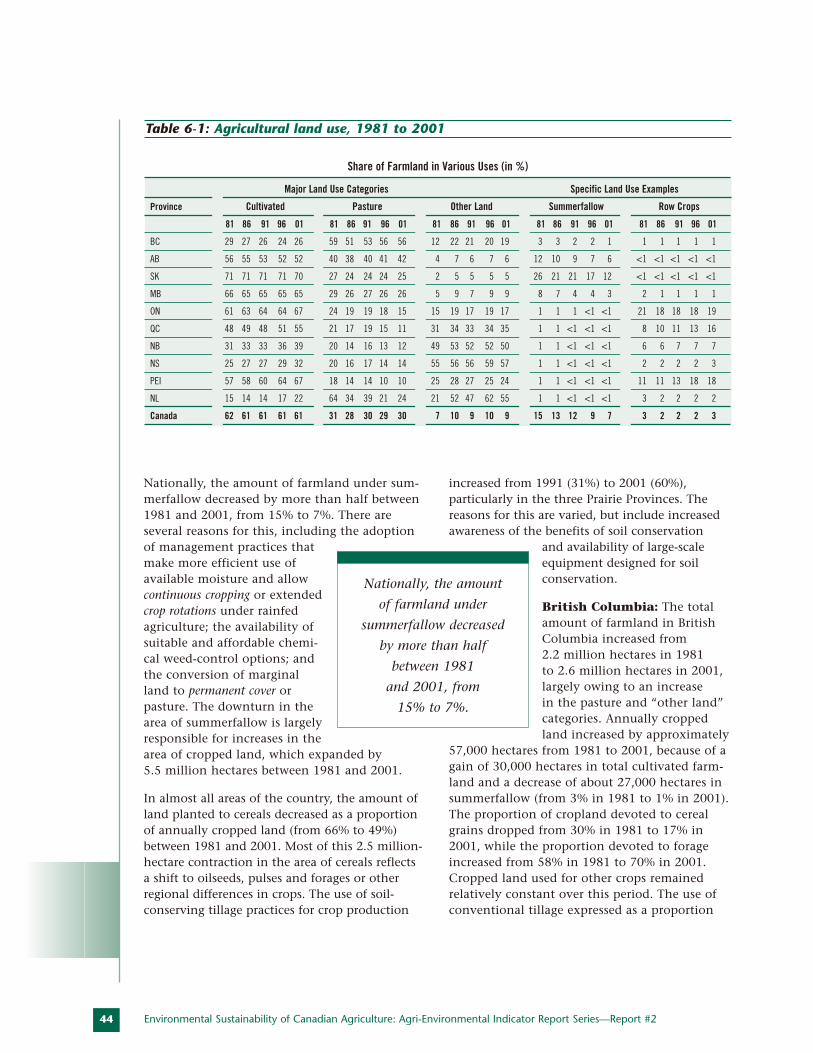
44
Nationally, the amount of farmland under sum-merfallow decreased by more than half between1981 and 2001, from 15% to 7%. There are several reasons for this, including the adoptionof management practices thatmake more efficient use ofavailable moisture and allow continuous cropping or extendedcrop rotations under rainfedagriculture; the availability of suitable and affordable chemi-cal weed-control options; andthe conversion of marginalland to permanent cover or pasture. The downturn in thearea of summerfallow is largelyresponsible for increases in thearea of cropped land, which expanded by 5.5 million hectares between 1981 and 2001.
In almost all areas of the country, the amount ofland planted to cereals decreased as a proportionof annually cropped land (from 66% to 49%)between 1981 and 2001. Most of this 2.5 million-hectare contraction in the area of cereals reflectsa shift to oilseeds, pulses and forages or otherregional differences in crops. The use of soil-conserving tillage practices for crop production
increased from 1991 (31%) to 2001 (60%), particularly in the three Prairie Provinces. Thereasons for this are varied, but include increasedawareness of the benefits of soil conservation
and availability of large-scale equipment designed for soil conservation.
British Columbia: The totalamount of farmland in BritishColumbia increased from 2.2 million hectares in 1981 to 2.6 million hectares in 2001,largely owing to an increase in the pasture and “other land”categories. Annually croppedland increased by approximately
57,000 hectares from 1981 to 2001, because of again of 30,000 hectares in total cultivated farm-land and a decrease of about 27,000 hectares insummerfallow (from 3% in 1981 to 1% in 2001).The proportion of cropland devoted to cerealgrains dropped from 30% in 1981 to 17% in2001, while the proportion devoted to forageincreased from 58% in 1981 to 70% in 2001.Cropped land used for other crops remained relatively constant over this period. The use ofconventional tillage expressed as a proportion
Environmental Sustainability of Canadian Agriculture: Agri-Environmental Indicator Report Series—Report #2
Share of Farmland in Various Uses (in %)
Major Land Use Categories Specific Land Use Examples
Province Cultivated Pasture Other Land Summerfallow Row Crops
81 86 91 96 01 81 86 91 96 01 81 86 91 96 01 81 86 91 96 01 81 86 91 96 01
BC 29 27 26 24 26 59 51 53 56 56 12 22 21 20 19 3 3 2 2 1 1 1 1 1 1
AB 56 55 53 52 52 40 38 40 41 42 4 7 6 7 6 12 10 9 7 6 <1 <1 <1 <1 <1
SK 71 71 71 71 70 27 24 24 24 25 2 5 5 5 5 26 21 21 17 12 <1 <1 <1 <1 <1
MB 66 65 65 65 65 29 26 27 26 26 5 9 7 9 9 8 7 4 4 3 2 1 1 1 1
ON 61 63 64 64 67 24 19 19 18 15 15 19 17 19 17 1 1 1 <1 <1 21 18 18 18 19
QC 48 49 48 51 55 21 17 19 15 11 31 34 33 34 35 1 1 <1 <1 <1 8 10 11 13 16
NB 31 33 33 36 39 20 14 16 13 12 49 53 52 52 50 1 1 <1 <1 <1 6 6 7 7 7
NS 25 27 27 29 32 20 16 17 14 14 55 56 56 59 57 1 1 <1 <1 <1 2 2 2 2 3
PEI 57 58 60 64 67 18 14 14 10 10 25 28 27 25 24 1 1 <1 <1 <1 11 11 13 18 18
NL 15 14 14 17 22 64 34 39 21 24 21 52 47 62 55 1 1 <1 <1 <1 3 2 2 2 2
Canada 62 61 61 61 61 31 28 30 29 30 7 10 9 10 9 15 13 12 9 7 3 2 2 2 3
Table 6-1: Agricultural land use, 1981 to 2001
Nationally, the amount
of farmland under
summerfallow decreased
by more than half
between 1981
and 2001, from
15% to 7%.
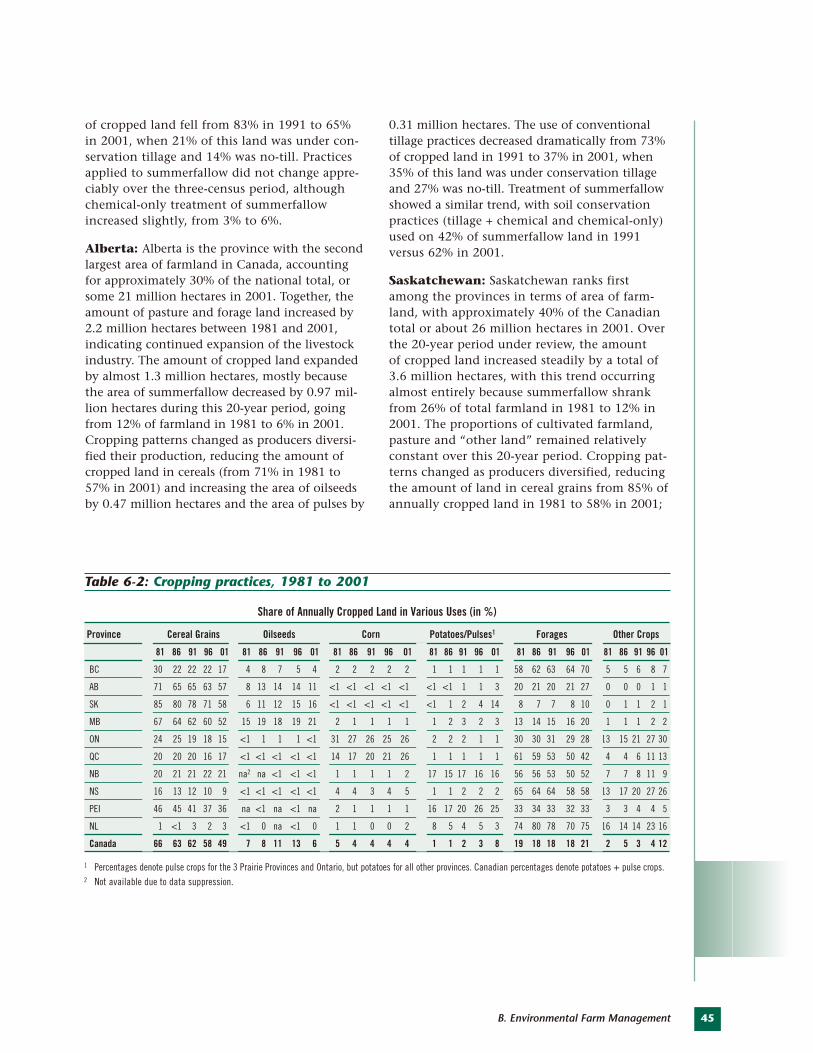
45B. Environmental Farm Management
Share of Annually Cropped Land in Various Uses (in %)
Province Cereal Grains Oilseeds Corn Potatoes/Pulses1 Forages Other Crops
81 86 91 96 01 81 86 91 96 01 81 86 91 96 01 81 86 91 96 01 81 86 91 96 01 81 86 91 96 01
BC 30 22 22 22 17 4 8 7 5 4 2 2 2 2 2 1 1 1 1 1 58 62 63 64 70 5 5 6 8 7
AB 71 65 65 63 57 8 13 14 14 11 <1 <1 <1 <1 <1 <1 <1 1 1 3 20 21 20 21 27 0 0 0 1 1
SK 85 80 78 71 58 6 11 12 15 16 <1 <1 <1 <1 <1 <1 1 2 4 14 8 7 7 8 10 0 1 1 2 1
MB 67 64 62 60 52 15 19 18 19 21 2 1 1 1 1 1 2 3 2 3 13 14 15 16 20 1 1 1 2 2
ON 24 25 19 18 15 <1 1 1 1 <1 31 27 26 25 26 2 2 2 1 1 30 30 31 29 28 13 15 21 27 30
QC 20 20 20 16 17 <1 <1 <1 <1 <1 14 17 20 21 26 1 1 1 1 1 61 59 53 50 42 4 4 6 11 13
NB 20 21 21 22 21 na2 na <1 <1 <1 1 1 1 1 2 17 15 17 16 16 56 56 53 50 52 7 7 8 11 9
NS 16 13 12 10 9 <1 <1 <1 <1 <1 4 4 3 4 5 1 1 2 2 2 65 64 64 58 58 13 17 20 27 26
PEI 46 45 41 37 36 na <1 na <1 na 2 1 1 1 1 16 17 20 26 25 33 34 33 32 33 3 3 4 4 5
NL 1 <1 3 2 3 <1 0 na <1 0 1 1 0 0 2 8 5 4 5 3 74 80 78 70 75 16 14 14 23 16
Canada 66 63 62 58 49 7 8 11 13 6 5 4 4 4 4 1 1 2 3 8 19 18 18 18 21 2 5 3 4 12
Table 6-2: Cropping practices, 1981 to 2001
1 Percentages denote pulse crops for the 3 Prairie Provinces and Ontario, but potatoes for all other provinces. Canadian percentages denote potatoes + pulse crops.2 Not available due to data suppression.
of cropped land fell from 83% in 1991 to 65%in 2001, when 21% of this land was under con-servation tillage and 14% was no-till. Practicesapplied to summerfallow did not change appre-ciably over the three-census period, although chemical-only treatment of summerfallowincreased slightly, from 3% to 6%.
Alberta: Alberta is the province with the secondlargest area of farmland in Canada, accountingfor approximately 30% of the national total, orsome 21 million hectares in 2001. Together, theamount of pasture and forage land increased by2.2 million hectares between 1981 and 2001,indicating continued expansion of the livestockindustry. The amount of cropped land expandedby almost 1.3 million hectares, mostly becausethe area of summerfallow decreased by 0.97 mil-lion hectares during this 20-year period, goingfrom 12% of farmland in 1981 to 6% in 2001.Cropping patterns changed as producers diversi-fied their production, reducing the amount ofcropped land in cereals (from 71% in 1981 to57% in 2001) and increasing the area of oilseedsby 0.47 million hectares and the area of pulses by
0.31 million hectares. The use of conventionaltillage practices decreased dramatically from 73%of cropped land in 1991 to 37% in 2001, when35% of this land was under conservation tillageand 27% was no-till. Treatment of summerfallowshowed a similar trend, with soil conservationpractices (tillage + chemical and chemical-only)used on 42% of summerfallow land in 1991 versus 62% in 2001.
Saskatchewan: Saskatchewan ranks firstamong the provinces in terms of area of farm-land, with approximately 40% of the Canadiantotal or about 26 million hectares in 2001. Overthe 20-year period under review, the amount of cropped land increased steadily by a total of3.6 million hectares, with this trend occurringalmost entirely because summerfallow shrankfrom 26% of total farmland in 1981 to 12% in2001. The proportions of cultivated farmland,pasture and “other land” remained relativelyconstant over this 20-year period. Cropping pat-terns changed as producers diversified, reducingthe amount of land in cereal grains from 85% ofannually cropped land in 1981 to 58% in 2001;
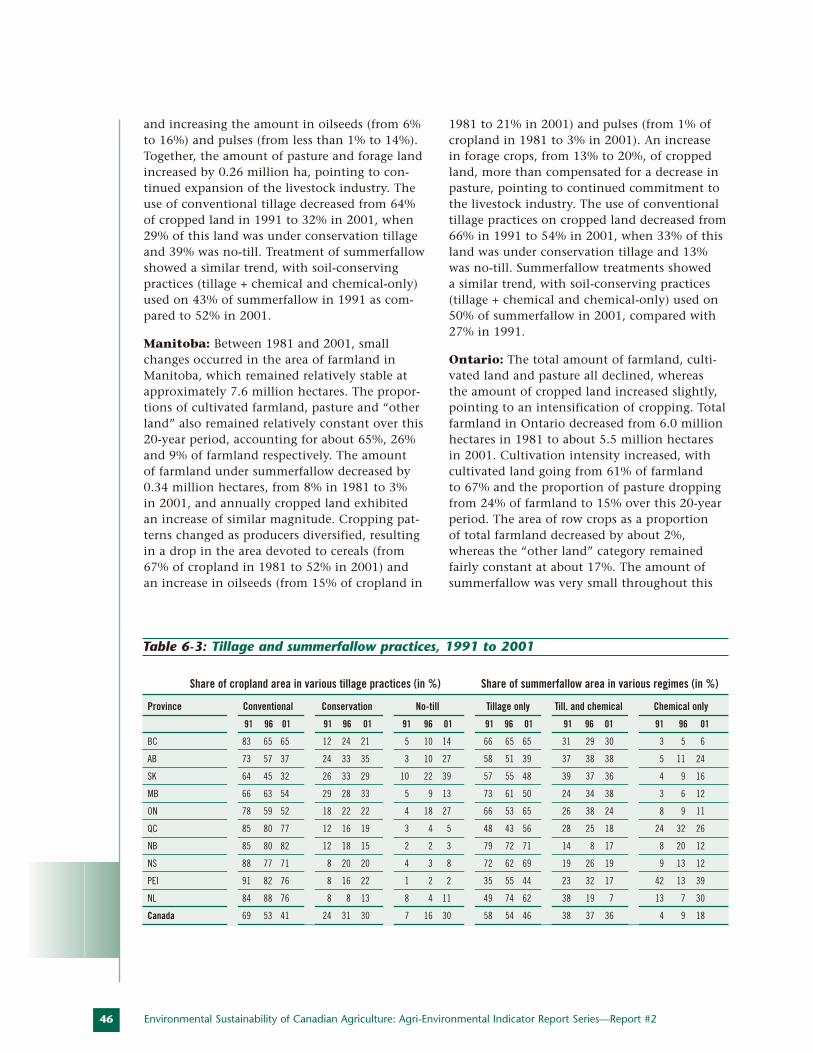
46
and increasing the amount in oilseeds (from 6%to 16%) and pulses (from less than 1% to 14%).Together, the amount of pasture and forage landincreased by 0.26 million ha, pointing to con-tinued expansion of the livestock industry. Theuse of conventional tillage decreased from 64%of cropped land in 1991 to 32% in 2001, when29% of this land was under conservation tillageand 39% was no-till. Treatment of summerfallowshowed a similar trend, with soil-conservingpractices (tillage + chemical and chemical-only)used on 43% of summerfallow in 1991 as com-pared to 52% in 2001.
Manitoba: Between 1981 and 2001, smallchanges occurred in the area of farmland inManitoba, which remained relatively stable atapproximately 7.6 million hectares. The propor-tions of cultivated farmland, pasture and “otherland” also remained relatively constant over this20-year period, accounting for about 65%, 26%and 9% of farmland respectively. The amount of farmland under summerfallow decreased by0.34 million hectares, from 8% in 1981 to 3% in 2001, and annually cropped land exhibitedan increase of similar magnitude. Cropping pat-terns changed as producers diversified, resultingin a drop in the area devoted to cereals (from67% of cropland in 1981 to 52% in 2001) andan increase in oilseeds (from 15% of cropland in
1981 to 21% in 2001) and pulses (from 1% ofcropland in 1981 to 3% in 2001). An increase in forage crops, from 13% to 20%, of croppedland, more than compensated for a decrease inpasture, pointing to continued commitment tothe livestock industry. The use of conventionaltillage practices on cropped land decreased from66% in 1991 to 54% in 2001, when 33% of thisland was under conservation tillage and 13%was no-till. Summerfallow treatments showed a similar trend, with soil-conserving practices(tillage + chemical and chemical-only) used on50% of summerfallow in 2001, compared with27% in 1991.
Ontario: The total amount of farmland, culti-vated land and pasture all declined, whereas the amount of cropped land increased slightly,pointing to an intensification of cropping. Totalfarmland in Ontario decreased from 6.0 millionhectares in 1981 to about 5.5 million hectares in 2001. Cultivation intensity increased, withcultivated land going from 61% of farmland to 67% and the proportion of pasture droppingfrom 24% of farmland to 15% over this 20-yearperiod. The area of row crops as a proportion of total farmland decreased by about 2%,whereas the “other land” category remainedfairly constant at about 17%. The amount ofsummerfallow was very small throughout this
Environmental Sustainability of Canadian Agriculture: Agri-Environmental Indicator Report Series—Report #2
Share of cropland area in various tillage practices (in %) Share of summerfallow area in various regimes (in %)
Province Conventional Conservation No-till Tillage only Till. and chemical Chemical only
91 96 01 91 96 01 91 96 01 91 96 01 91 96 01 91 96 01
BC 83 65 65 12 24 21 5 10 14 66 65 65 31 29 30 3 5 6
AB 73 57 37 24 33 35 3 10 27 58 51 39 37 38 38 5 11 24
SK 64 45 32 26 33 29 10 22 39 57 55 48 39 37 36 4 9 16
MB 66 63 54 29 28 33 5 9 13 73 61 50 24 34 38 3 6 12
ON 78 59 52 18 22 22 4 18 27 66 53 65 26 38 24 8 9 11
QC 85 80 77 12 16 19 3 4 5 48 43 56 28 25 18 24 32 26
NB 85 80 82 12 18 15 2 2 3 79 72 71 14 8 17 8 20 12
NS 88 77 71 8 20 20 4 3 8 72 62 69 19 26 19 9 13 12
PEI 91 82 76 8 16 22 1 2 2 35 55 44 23 32 17 42 13 39
NL 84 88 76 8 8 13 8 4 11 49 74 62 38 19 7 13 7 30
Canada 69 53 41 24 31 30 7 16 30 58 54 46 38 37 36 4 9 18
Table 6-3: Tillage and summerfallow practices, 1991 to 2001
47B. Environmental Farm Management
period, falling to less than 1% in 2001. The proportion of annually cropped land devoted to cereal grains dropped from 24% in 1981 to 15% in 2001. The proportion of cropped land used for other crops remained relativelyconstant over this period, with the exception of corn, which decreased from 31% in 1981 to 26% in 2001. The use of conventional tillage on cropped land decreased from 78% in 1991 to 52% in 2001, when 22% was under conserva-tion tillage and 27% was no-till.
Quebec: As in Ontario, the changes in agriculturalland point to an intensification of cropping. Thetotal area of farmland decreased from 3.8 millionhectares in 1981 to about 3.4 million hectares in2001, whereas the amount of cropped landincreased by about 0.1 million hectares.Cultivation intensity increased, with cultivatedland going from making up 48% of farmland to55% and the proportion of pasture declining from21% to 11% of farmland over this 20-year period.The proportion of annually cropped land devotedto cereal grains dropped from 20% in 1981 to 17% in 2001, whereas the proportion ofcropped land used for other crops remained relatively constant over this period, with theexception of corn, which increased from 14% to26%, and forage, which decreased from 61% to42%. The area planted to row crops increased from8% of all farmland to16%, whereas the “otherland” category remained fairly constant at about34%. The use of conventional tillage declined from85% of cropped land in 1991 to 77% in 2001,when 19% of this land was under conservationtillage and 5% was no-till. The amount of summer-fallow was very small throughout this period,falling to less than 1% in 2001.
New Brunswick: Changes in agricultural land use in New Brunswick likewise indicate anintensification of cropping. The total amount of farmland in New Brunswick decreased fromabout 0.44 million hectares in 1981 to about0.39 million hectares in 2001. Cultivation intensity increased, with cultivated land goingfrom making up 31% of farmland to 39% andthe proportion of pasture declining from 20% to12% over this 20-year period. The proportion offarmland in row crops and in the “other land”category remained relatively constant at about7% and 50% respectively. The amount of annu-ally cropped land increased by slightly morethan 20,000 hectares from 1981 to 2001. The
proportion of cropland devoted to cereal grains,corn and potatoes remained fairly constant atapproximately 21%, 2% and 16% respectively.Forages decreased from 56% of cropped land to 52% over the 20-year period. No clear trend is evident in the mix of tillage practices, as conventional tillage practices were used onapproximately 82% of cropped land throughoutthe period. In 2001, approximately 15% ofcropped land was under conservation tillage and 3% was no-till. The amount of summerfal-low was very small throughout the period,falling to less than 1% in 2001.
Nova Scotia: The total amount of farmland andpasture in Nova Scotia decreased, whereas theamount of cropped land increased slightly, indicat-ing an intensification of cropping. The total areaof farmland in Nova Scotia decreased from about0.47 million hectares in 1981 to about 0.41 mil-lion hectares in 2001. Cultivation intensityincreased, with cultivated land going from 25% offarmland to 32% and the proportion of pasturedecreasing from 20% to 14% over this 20-yearperiod. The proportion of farmland in row cropsand in the “other land” category remained relatively constant at approximately 2% and 57% respectively. The amount of cropped landexpanded by slightly more than 15,000 hectaresbetween 1981 and 2001. The proportion of cropland devoted to cereal grains decreased from16% in 1981 to 9% in 2001, a decline of about6,000 hectares. Corn and potatoes remained rela-tively constant over this period at approximately4% and 2% respectively. The proportion ofcropped land used for forage fluctuated around60%. The use of conventional tillage on croppedland decreased from 88% in 1991 to 71% in2001, when 20% was under conservation tillageand 8% was no-till. The amount of summerfallowwas very small throughout the period, falling toless than 1% in 2001.
Prince Edward Island: The total amount offarmland and pasture in Prince Edward Islanddecreased, whereas the amount of cropped land increased slightly between 1981 and 2001.Farmland in Prince Edward Island decreasedfrom about 0.28 million hectares in 1981 toabout 0.26 million hectares in 2001. Cultivationintensity increased, with cultivated land goingfrom 57% of farmland to 67% and the propor-tion of pasture declining from 18% to 10%. Theproportion of farmland in row crops increased
48
from 11% in 1981 to 18% in 2001. The propor-tion of land in the “other land” category fluctuated around 25%. The area ofcropped land increased by slightly more than17,000 hectares between 1981 and 2001. Theproportion of cropland used for cereal grainsdecreased from 46% in 1981 to 36% in 2001,whereas the proportion in potatoes increasedfrom 16% in 1981 to 25% in 2001. The propor-tion of cropped land in corn and foragesremained relatively constant at 1% and 33%respectively. The use of conventional tillagedecreased from 91% of cropped land in 1991 to76% in 2001, when 22% was under conservationtillage and 2% was no-till. The amount of landunder summerfallow was very small throughoutthis period, falling to less than 1% in 2001.
Newfoundland and Labrador: Between 1981and 2001, the total amount of farmland inNewfoundland increased from about 33,000hectares to about 40,000 hectares. Cultivatedland increased slightly as a proportion of farm-land, from 15% to 22%, whereas pasture shrankfrom 64% to 24% over the 20-year period. Theproportion of farmland in row crops remainedrelatively stable at about 2%, and the proportionof “other land” fluctuated between about 50%and 60%. The amount of annually cropped landincreased by slightly more than 4,000 hectares,
with the proportion devoted to cereal grainsincreasing from 1% in 1981 to 3% in 2001. The proportion in potatoes decreased from 8%in 1981 to 3% in 2001, whereas forages fluctu-ated between about 75% and 80%. The use of conventional tillage on cropped landdecreased from 84% in 1991 to 76% in 2001,when 13% was under conservation tillage and 11% was no-till.
REFERENCESAgriculture and Agri-Food Canada (AAFC), 2004.Census of Agriculture: Soil Landscapes of Canada(SLC), v.3 and Water Survey of Canada Sub-subDrainage Area (WSCSSDA), v.5, Re-allocation.Unpublished data for research purposes. AAFC,Ottawa (Ont.).
Dumanski, J., L.J.Gregorich, V. Kirkwood, M.A. Cann, J.L.B. Culley and D.R. Coote, 1994.The Status of Land Management Practices onAgricultural Land in Canada. Compiled from the1991 Canada Census of Agriculture. TechnicalBulletin 1994-3E. Agriculture and Agri-FoodCanada, Ottawa (Ont.).
Statistics Canada, 1997. Historical Overview of Canadian Agriculture. Statistics Canada,Agriculture Division, Ottawa (Ont.).
Environmental Sustainability of Canadian Agriculture: Agri-Environmental Indicator Report Series—Report #2
7. Farm Environmental Management Practices
THE ISSUEFrom an environmental perspective, many farmmanagement decisions are important becausethey represent a direct link between the primarilyeconomic focus of agriculture and the potentialenvironmental consequences of agricultural pro-duction. However, producers sometimes perceivechanges in farming practices that are made solelyfor environmental reasons as being detrimentalto farm profitability. Fortunately, this kind oftrade-off does not always occur, as producers canadopt some beneficial management practices thatallow them to maintain or improve productivity
while protecting the environment. This chapterexamines the extent to which the practices ofCanadian farmers correspond to the notion ofBMPs. The variables reported on here are not agri-environmental indicators per se. Rather, they are key pieces of information that providevaluable insight into the results and trendsrevealed by the indicators covered in this report.More specifically, the present chapter focuses onthe level of adoption of a subset of key BMPsrelated to mineral fertilizers, manure, pesticidesand water management.
SUMMARYFarm environmental management has important implications for the environmental sustainability of
the agriculture sector and Canadian producers can implement environmentally beneficial management
practices (BMPs) without compromising profitability. This chapter examines the level of adoption of
beneficial management practices related to agricultural inputs such as mineral fertilizers, pesticides
and manure, as well as water management. The analyses are based on a national farm environmental
management survey conducted in 2001, but also make use of data obtained from other related information
sources. For example, temporal trends in manure storage and application practices, identified through
comparison with a 1995 survey, are also discussed.
In 2001, most Canadian farms used mineral fertilizers and one-half conducted soil testing, as recom-
mended, at least once every three years. Producers tend to reduce fertilizer use when nutrients are supplied
through manure spreading. With respect to fertilizer application methods, only 9% of farms used knifing-in
or injection, the most environmentally beneficial approaches. However, application with seed, also a good
practice because of the reduced potential for nutrient loss, was the prevalent method used throughout the
grain growing regions of the Prairies, particularly in Saskatchewan (58%). About 62% of farms store
manure from livestock in solid form. Liquid manure storage has gained increasing acceptance in the dairy
sector, and liquid manure storage capacity is generally sufficient to ensure that good manure management
practices can prevail. Manure application methods have changed little, but the optimal approach of
injecting liquid manure is on the rise. Timing of manure incorporation is not always optimal, as many
farms incorporate manure late or not at all, and only 15% use the most beneficial practice of promptly
incorporating manure. However, as the prevalence of liquid manure systems increases, the practice of
prompt incorporation is also expected to rise. Although pesticides are typically applied by a certified
operator, the equipment is usually only calibrated at the start of the season; few producers re-calibrate
before using a different pesticide. The timing of insecticide applications tends to be optimal, i.e. done
when pest numbers exceed acceptable levels, especially in the Prairies. By contrast, the environmentally
optimal signal for herbicide application—weeds exceeding acceptable levels—is not widely used. Overall,
Canadian producers are maintaining vegetated riparian strips and keeping livestock away from water
bodies, thereby helping to minimize adverse effects on surface waters.
49B. Environmental Farm Management
AUTHORS:
R. Koroluk, A. Piau, J. Grimard,L. Bourque and M. Korol
INFORMATIONSOURCE:
Farm EnvironmentalManagementSurvey
STATUS:
National coverage, 2001
50
Mineral fertilizers: An adequate supply ofnutrients, especially nitrogen, phosphorus andpotassium, is essential to good plant growth.Many farmers seek to maximize the productivityand economic returns of their crops by applyingmineral fertilizers. When correctly applied in the right amounts, these inputs help produce a robust crop that will yield a good harvest. An undersupply can lead to depletion of thenutrients in the soil and in turn spell economiclosses for farmers. The total economic costs ofadding inputs—purchase, transportation andapplication—is a significant part of the farmbudget. The environmental costs of applyingnutrients can also be high. Excess nutrients can be lost from farmland through leaching,evaporation or run-off, potentially creating environmental problems such as surface andgroundwater pollution, deposi-tion of ammonia and acid rain,and emissions of nitrous oxide(a greenhouse gas). By applyingbeneficial management prac-tices to optimize fertilizer use,farmers can improve yieldswhile keeping costs down andprotecting the environment.
Manure: Growing livestockpopulations and greater concentrations of animals incertain geographic areas haveled to heightened concernsabout methods of manure storage and application. This is perhaps thegreatest environmental challenge that livestockproducers face, a challenge that is likely toincrease as livestock numbers grow and farmingoperations become larger and more intensive. Asan agricultural input, manure can be an inex-pensive source of crop nutrients, offsetting thecost and the potential environmental risks ofmineral fertilizers. However, excessive or incor-rect application can give rise to environmentalproblems such as run-off into surface waters andleaching into groundwater. This is particularlyproblematic in local areas with limited farm-land, high livestock concentrations andencroaching urban populations.
Pesticides: Chemical pesticides are used tolimit damage to crops and mitigate economiclosses caused by crop pests. However, they, too,can contribute to environmental degradation.Although the newer pesticide products are generally safer and pose fewer environmentalrisks, there is still concern about the impacts ofpesticides on non-target species and on waterquality. Poor choice of pesticides and inappro-priate timing and application may lessen soiland water quality because of the presence ofpesticide residues, reduced air quality from spray drift and vapour from volatilized spraymaterials. Furthermore, there may be negativeimpacts on biodiversity because of the effects onnon-target species and interference with normalpredator–prey relationships.
Water: The protection of waterquality is a top environmentalpriority for all Canadians, asevidenced by recent healthconcerns related to domesticwater supplies. Furthermore,agricultural producers requirereliable supplies of high-qualitywater for irrigation and live-stock watering. Changes inproduction practices and landuse in many areas in recentdecades have had negativeimpacts on water quality,mainly through increased presence of sediment,
pathogens, nutrients and pesticides in nearbywater bodies. In addition to effective nutrientand pesticide management, producers can applysome beneficial management practices to mini-mize the risk of water contamination, such as protecting riparian areas and controlling access to waterways by grazing animals.
THE SURVEYIn March 2002, Statistics Canada, in partnershipwith Agriculture and Agri-Food Canada, con-ducted a survey on environmentally-related farm management practices—the 2001 FarmEnvironmental Management Survey or FEMS(Statistics Canada 2002). A questionnaire with
Environmental Sustainability of Canadian Agriculture: Agri-Environmental Indicator Report Series—Report #2
In March 2002,
Statistics Canada,
in partnership with
Agriculture and
Agri-Food Canada,
conducted a survey
on environmentally-
related farm
management practices.
51B. Environmental Farm Management
57 questions on various aspects of the manage-ment of manure, fertilizers, pesticides, water and land, as well as on environmental farmplanning, was sent to 22,000 farms acrossCanada (excluding the Yukon, NorthwestTerritories and Nunavut) with sales of greaterthan $10,000. The survey was designed to pro-vide results complementing the informationcompiled in the 2001 Census of Agriculture(Statistics Canada 2001). It was well receivedand achieved an overall response rate of morethan 76%.
The information presented in this chapter hasbeen compiled from a subset of 15 variablesanalysed in FEMS. The comprehensive results of FEMS are available from Statistics Canada.Additionally, the manure storage and applica-tion results of FEMS are compared with thosefrom a similar survey—the 1995 Farm InputsManagement Survey or FIMS (Statistics Canada1995). This was done to provide a time-basedcomparison of the level of adoption of specificbeneficial management practices.
LIMITATIONSFarm management practices and their environ-mental impacts vary regionally since agriculturalproduction, soil quality, landscape, weather and other aspects also vary from one region toanother. This regional variation sometimes makes it difficult to interpret survey results in a consistent way. For example, practices thatentail higher risks in one region may well beacceptable in other regions. Readers are advisedto use caution when interpreting the FEMS results presented in this chapter. Though interesting and relevant, these results are insufficient in themselves to assess environmen-tal risks. The FEMS data are meant to provide an overall picture of the level of adoption of various farming practices that may affect theenvironment. To have a full appreciation of theimplementation of environmental managementpractices and of their impacts (positive or nega-tive) on agroecosystems, additional informationand more comprehensive analysis is required.Such information is provided by the agri-environmental indicators presented in this report. Finally, for manure management practices,differences in survey design between FIMS and
FEMS may have affected comparisons of the 1995and 2001 results, although attempts have beenmade to account for this.
Results and Interpretation
Mineral fertilizer: Results are presented inTable 7-1. The proportion of farms that use min-eral fertilizer on crops is provided for reference.In 2001, 75% of farms in Canada used fertilizer,with the highest proportion in Prince EdwardIsland (85%) and Ontario (81%). BritishColumbia had the lowest proportion of farmsusing fertilizer (62%), followed by Alberta andNew Brunswick (69% each).
1) Method of fertilizer application: Thisaspect is expressed as the proportion of farmsthat use the following methods of mineral fer-tilizer placement (ranked from most to leastenvironmentally desirable): injected into soil(liquid fertilizers and anhydrous ammonia) or banded (dry fertilizer), applied with seed,broadcast or other. Injection reduces odoursand volatilization of nitrogen and enhancescrop uptake, whereas banding increases crop uptake by placing fertilizer near the root. Broadcasting accounted for about one-third of all mineral fertilizer applicationin Canada, as did application with seed.Broadcasting was the most popular method in all provinces except in the Prairies, where applying fertilizer with seed was more commonplace. The most environmen-tally friendly option of knifing-in or injecting fertilizer into the ground accounted for only 9% of all commercial fertilizer applica-tion methods in Canada. This practice wasmost prevalent in the Prairies. Bandingaccounted for a little over 17% of all methods.
2) Use and frequency of soil nutrient testing: This is expressed as the proportionof farms using mineral fertilizer that con-duct soil tests at specified intervals: everyyear; every two to three years; every four tofive years; at intervals of over five years; andsoil not tested. The greater the frequency ofsoil testing, the greater the likelihood thatnutrient application rates will be matched tocrop requirements. Soil testing at least onceevery three years is desirable. FEMS results
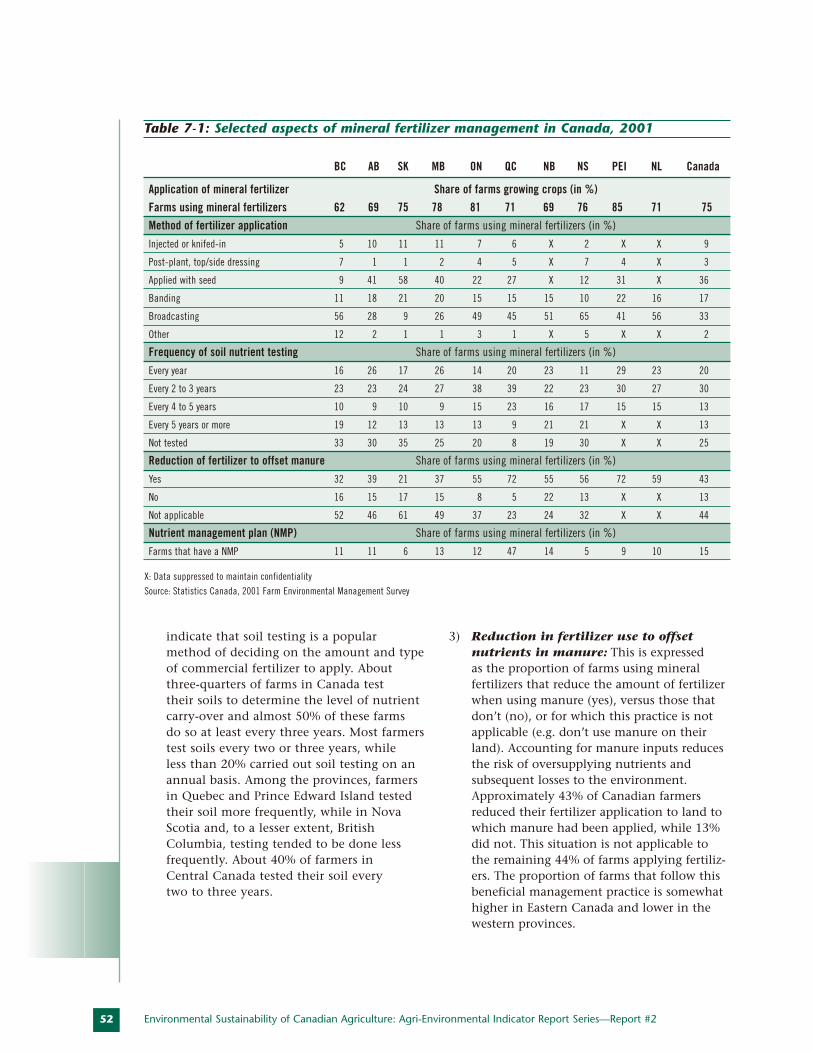
52
indicate that soil testing is a popularmethod of deciding on the amount and typeof commercial fertilizer to apply. About three-quarters of farms in Canada test their soils to determine the level of nutrientcarry-over and almost 50% of these farms do so at least every three years. Most farmerstest soils every two or three years, while less than 20% carried out soil testing on anannual basis. Among the provinces, farmersin Quebec and Prince Edward Island testedtheir soil more frequently, while in NovaScotia and, to a lesser extent, BritishColumbia, testing tended to be done less frequently. About 40% of farmers in Central Canada tested their soil everytwo to three years.
3) Reduction in fertilizer use to offsetnutrients in manure: This is expressed as the proportion of farms using mineral fertilizers that reduce the amount of fertilizerwhen using manure (yes), versus those thatdon’t (no), or for which this practice is notapplicable (e.g. don’t use manure on theirland). Accounting for manure inputs reducesthe risk of oversupplying nutrients and subsequent losses to the environment.Approximately 43% of Canadian farmersreduced their fertilizer application to land towhich manure had been applied, while 13%did not. This situation is not applicable tothe remaining 44% of farms applying fertiliz-ers. The proportion of farms that follow thisbeneficial management practice is somewhathigher in Eastern Canada and lower in thewestern provinces.
Environmental Sustainability of Canadian Agriculture: Agri-Environmental Indicator Report Series—Report #2
BC AB SK MB ON QC NB NS PEI NL Canada
Application of mineral fertilizer Share of farms growing crops (in %)
Farms using mineral fertilizers 62 69 75 78 81 71 69 76 85 71 75
Method of fertilizer application Share of farms using mineral fertilizers (in %)
Injected or knifed-in 5 10 11 11 7 6 X 2 X X 9
Post-plant, top/side dressing 7 1 1 2 4 5 X 7 4 X 3
Applied with seed 9 41 58 40 22 27 X 12 31 X 36
Banding 11 18 21 20 15 15 15 10 22 16 17
Broadcasting 56 28 9 26 49 45 51 65 41 56 33
Other 12 2 1 1 3 1 X 5 X X 2
Frequency of soil nutrient testing Share of farms using mineral fertilizers (in %)
Every year 16 26 17 26 14 20 23 11 29 23 20
Every 2 to 3 years 23 23 24 27 38 39 22 23 30 27 30
Every 4 to 5 years 10 9 10 9 15 23 16 17 15 15 13
Every 5 years or more 19 12 13 13 13 9 21 21 X X 13
Not tested 33 30 35 25 20 8 19 30 X X 25
Reduction of fertilizer to offset manure Share of farms using mineral fertilizers (in %)
Yes 32 39 21 37 55 72 55 56 72 59 43
No 16 15 17 15 8 5 22 13 X X 13
Not applicable 52 46 61 49 37 23 24 32 X X 44
Nutrient management plan (NMP) Share of farms using mineral fertilizers (in %)
Farms that have a NMP 11 11 6 13 12 47 14 5 9 10 15
X: Data suppressed to maintain confidentiality
Source: Statistics Canada, 2001 Farm Environmental Management Survey
Table 7-1: Selected aspects of mineral fertilizer management in Canada, 2001
53B. Environmental Farm Management
4) Nutrient management plans (NMP):This reflects the proportion of farms thathave developed a nutrient managementplan—a formal written plan that is preparedby a trained person or specialist and that considers issues such as application methodand timing, carry-over of nutrients and distance from water bodies. These plans maybe developed out of a desire to increase theefficiency of nutrient use and to minimizerisks to the environment, or in accordancewith provincial government regulations.According to FEMS, 47% of farms in Quebechave a NMP, a significantly higher percent-age than in other Canadian provinces.
Manure: Results are presented in Table 7-2(manure storage) and Table 7-3 (manure applica-tion). Survey results showed that, in 2001, animalmanure was stored on about 76% of Canadianfarms with livestock. About 62% of these farms stored manure in solid form, 7% in liquidform and 7% in both solid and liquid form.Comparisons between 1995 and 2001 relating to five variables are discussed below. Generally,survey results suggest that significant recentinvestments in the livestock sector have included investments in new state-of-the-art liquid systems.
5) Storage methods for solid and liquidmanure: This is expressed as the percentageof animals (dairy cattle, beef cattle and hogs)for which various storage systems are used.For solid manure, storage methods includethe following: covered storage pad (optimal),open pad with run-off containment, openpad without containment, manure pack, covered open pile, uncovered open pile (riskiest) and other methods. For liquidmanure, storage methods consist of a sealedcovered tank (optimal), tank below slattedfloor, open tank, lined lagoon, unlinedlagoon (riskiest) and other methods. Liquidmanure systems are sometimes consideredenvironmentally safer than solid manure systems because of the greater level ofmanure containment they provide andbecause they are usually designed by engi-neers and companies that specialize in theirconstruction. Nonetheless, liquid systemsoften require more labour and greater management intervention for effective
operation. Furthermore, solid systems arenot necessarily environmentally detrimentalgiven favourable factors like production system or agronomic conditions.
In dairy production, liquid manure storage isincreasingly being used, as evidenced by theexpanding proportion of dairy cattle man-aged with liquid manure systems between1995 and 2001. Increases in the use of these systems are observed in most regions,especially in Manitoba and Saskatchewan. In addition, the type of liquid system in usehas improved as farmers have moved fromlow-containment solid systems, such as openpiles without roofs, to high-containmenttank-based liquid systems. Although morebeef farms are using liquid systems, they stillrepresent a very small segment of the beefsector. More importantly, beef producershave shifted from lower containment solidsystems (open piles without a roof/open padwithout containment) to higher contain-ment systems (open piles with a roof/openpad with containment). In 1995, hog pro-ducers mainly used liquid manure storagesystems in all regions except AtlanticCanada. By 2001, however, Atlantic regionhog production had shifted to liquid systemsto the same extent as the rest of the country.
6) Manure application method: This isexpressed as the percentage of crop areareceiving manure through various applica-tion methods. For liquid manure, injectiondirectly into the soil is considered the bestpractice. Surface application and irrigation-system application typically produce moreodours and are often more susceptible tonutrient run-off and ammonia nitrogenlosses. Methods of manure application toland did not change significantly between1995 and 2000. Solid manure application by spreader declined in all provinces exceptBritish Columbia, a trend likely related tothe larger number of liquid manure storagesystems across Canada. Application throughirrigation systems, never a prevalent practiceand noteworthy only in Ontario and BritishColumbia, shows a downtrend across thecountry. The practice of applying liquidmanure to the surface increased in each ofthe eastern provinces but declined in three
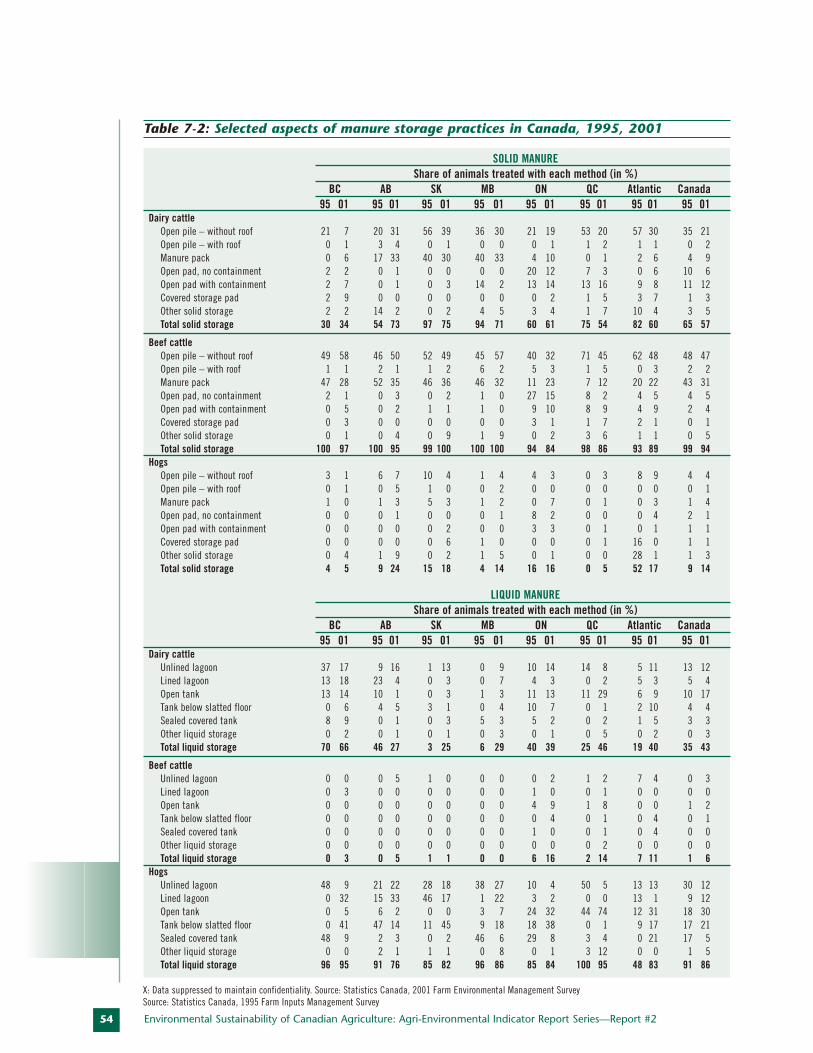
54 Environmental Sustainability of Canadian Agriculture: Agri-Environmental Indicator Report Series—Report #2
SOLID MANUREShare of animals treated with each method (in %)
BC AB SK MB ON QC Atlantic Canada95 01 95 01 95 01 95 01 95 01 95 01 95 01 95 01
Dairy cattleOpen pile – without roof 21 7 20 31 56 39 36 30 21 19 53 20 57 30 35 21 Open pile – with roof 0 1 3 4 0 1 0 0 0 1 1 2 1 1 0 2 Manure pack 0 6 17 33 40 30 40 33 4 10 0 1 2 6 4 9 Open pad, no containment 2 2 0 1 0 0 0 0 20 12 7 3 0 6 10 6 Open pad with containment 2 7 0 1 0 3 14 2 13 14 13 16 9 8 11 12 Covered storage pad 2 9 0 0 0 0 0 0 0 2 1 5 3 7 1 3 Other solid storage 2 2 14 2 0 2 4 5 3 4 1 7 10 4 3 5 Total solid storage 30 34 54 73 97 75 94 71 60 61 75 54 82 60 65 57
Beef cattleOpen pile – without roof 49 58 46 50 52 49 45 57 40 32 71 45 62 48 48 47 Open pile – with roof 1 1 2 1 1 2 6 2 5 3 1 5 0 3 2 2 Manure pack 47 28 52 35 46 36 46 32 11 23 7 12 20 22 43 31 Open pad, no containment 2 1 0 3 0 2 1 0 27 15 8 2 4 5 4 5 Open pad with containment 0 5 0 2 1 1 1 0 9 10 8 9 4 9 2 4 Covered storage pad 0 3 0 0 0 0 0 0 3 1 1 7 2 1 0 1 Other solid storage 0 1 0 4 0 9 1 9 0 2 3 6 1 1 0 5 Total solid storage 100 97 100 95 99 100 100 100 94 84 98 86 93 89 99 94
HogsOpen pile – without roof 3 1 6 7 10 4 1 4 4 3 0 3 8 9 4 4 Open pile – with roof 0 1 0 5 1 0 0 2 0 0 0 0 0 0 0 1 Manure pack 1 0 1 3 5 3 1 2 0 7 0 1 0 3 1 4 Open pad, no containment 0 0 0 1 0 0 0 1 8 2 0 0 0 4 2 1 Open pad with containment 0 0 0 0 0 2 0 0 3 3 0 1 0 1 1 1 Covered storage pad 0 0 0 0 0 6 1 0 0 0 0 1 16 0 1 1 Other solid storage 0 4 1 9 0 2 1 5 0 1 0 0 28 1 1 3 Total solid storage 4 5 9 24 15 18 4 14 16 16 0 5 52 17 9 14
LIQUID MANUREShare of animals treated with each method (in %)
BC AB SK MB ON QC Atlantic Canada95 01 95 01 95 01 95 01 95 01 95 01 95 01 95 01
Dairy cattleUnlined lagoon 37 17 9 16 1 13 0 9 10 14 14 8 5 11 13 12 Lined lagoon 13 18 23 4 0 3 0 7 4 3 0 2 5 3 5 4 Open tank 13 14 10 1 0 3 1 3 11 13 11 29 6 9 10 17 Tank below slatted floor 0 6 4 5 3 1 0 4 10 7 0 1 2 10 4 4 Sealed covered tank 8 9 0 1 0 3 5 3 5 2 0 2 1 5 3 3 Other liquid storage 0 2 0 1 0 1 0 3 0 1 0 5 0 2 0 3 Total liquid storage 70 66 46 27 3 25 6 29 40 39 25 46 19 40 35 43
Beef cattleUnlined lagoon 0 0 0 5 1 0 0 0 0 2 1 2 7 4 0 3 Lined lagoon 0 3 0 0 0 0 0 0 1 0 0 1 0 0 0 0 Open tank 0 0 0 0 0 0 0 0 4 9 1 8 0 0 1 2 Tank below slatted floor 0 0 0 0 0 0 0 0 0 4 0 1 0 4 0 1 Sealed covered tank 0 0 0 0 0 0 0 0 1 0 0 1 0 4 0 0 Other liquid storage 0 0 0 0 0 0 0 0 0 0 0 2 0 0 0 0 Total liquid storage 0 3 0 5 1 1 0 0 6 16 2 14 7 11 1 6
HogsUnlined lagoon 48 9 21 22 28 18 38 27 10 4 50 5 13 13 30 12 Lined lagoon 0 32 15 33 46 17 1 22 3 2 0 0 13 1 9 12 Open tank 0 5 6 2 0 0 3 7 24 32 44 74 12 31 18 30 Tank below slatted floor 0 41 47 14 11 45 9 18 18 38 0 1 9 17 17 21 Sealed covered tank 48 9 2 3 0 2 46 6 29 8 3 4 0 21 17 5 Other liquid storage 0 0 2 1 1 1 0 8 0 1 3 12 0 0 1 5 Total liquid storage 96 95 91 76 85 82 96 86 85 84 100 95 48 83 91 86
Table 7-2: Selected aspects of manure storage practices in Canada, 1995, 2001
X: Data suppressed to maintain confidentiality. Source: Statistics Canada, 2001 Farm Environmental Management SurveySource: Statistics Canada, 1995 Farm Inputs Management Survey
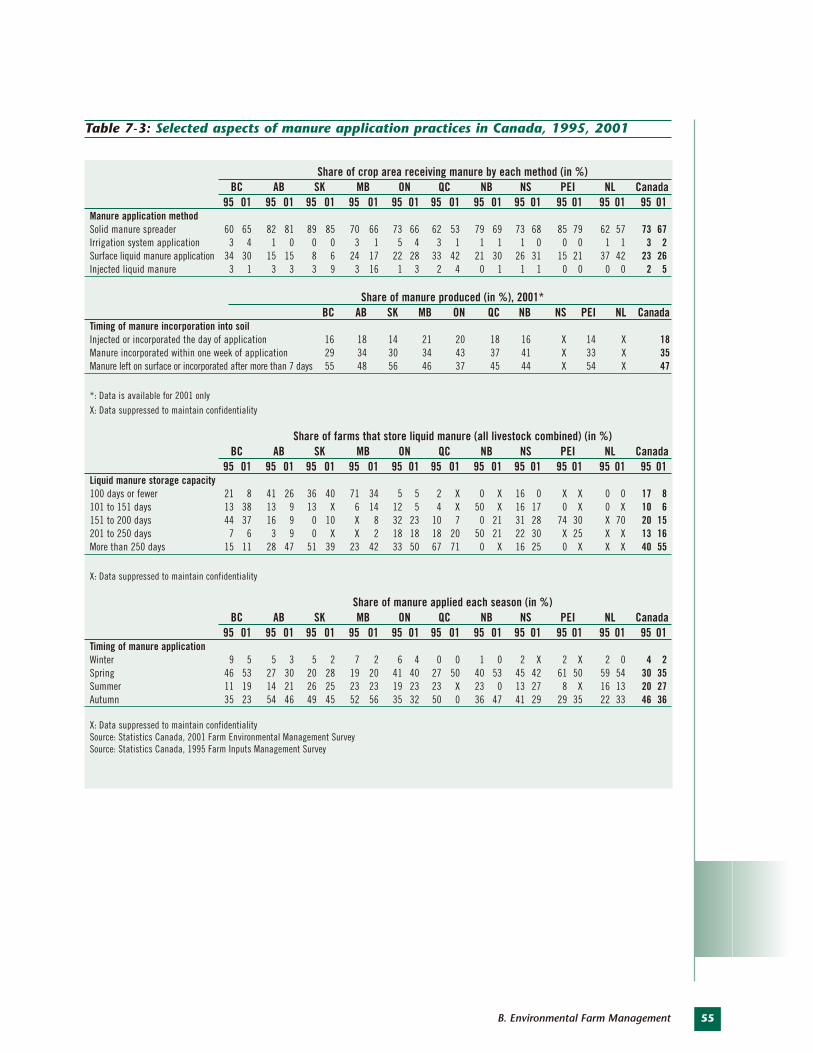
55B. Environmental Farm Management
Share of crop area receiving manure by each method (in %)BC AB SK MB ON QC NB NS PEI NL Canada
95 01 95 01 95 01 95 01 95 01 95 01 95 01 95 01 95 01 95 01 95 01Manure application methodSolid manure spreader 60 65 82 81 89 85 70 66 73 66 62 53 79 69 73 68 85 79 62 57 73 67Irrigation system application 3 4 1 0 0 0 3 1 5 4 3 1 1 1 1 0 0 0 1 1 3 2Surface liquid manure application 34 30 15 15 8 6 24 17 22 28 33 42 21 30 26 31 15 21 37 42 23 26Injected liquid manure 3 1 3 3 3 9 3 16 1 3 2 4 0 1 1 1 0 0 0 0 2 5
Share of manure produced (in %), 2001*BC AB SK MB ON QC NB NS PEI NL Canada
Timing of manure incorporation into soilInjected or incorporated the day of application 16 18 14 21 20 18 16 X 14 X 18Manure incorporated within one week of application 29 34 30 34 43 37 41 X 33 X 35Manure left on surface or incorporated after more than 7 days 55 48 56 46 37 45 44 X 54 X 47
*: Data is available for 2001 only
X: Data suppressed to maintain confidentiality
Share of farms that store liquid manure (all livestock combined) (in %)BC AB SK MB ON QC NB NS PEI NL Canada
95 01 95 01 95 01 95 01 95 01 95 01 95 01 95 01 95 01 95 01 95 01Liquid manure storage capacity 100 days or fewer 21 8 41 26 36 40 71 34 5 5 2 X 0 X 16 0 X X 0 0 17 8101 to 151 days 13 38 13 9 13 X 6 14 12 5 4 X 50 X 16 17 0 X 0 X 10 6151 to 200 days 44 37 16 9 0 10 X 8 32 23 10 7 0 21 31 28 74 30 X 70 20 15201 to 250 days 7 6 3 9 0 X X 2 18 18 18 20 50 21 22 30 X 25 X X 13 16More than 250 days 15 11 28 47 51 39 23 42 33 50 67 71 0 X 16 25 0 X X X 40 55
X: Data suppressed to maintain confidentiality
Share of manure applied each season (in %)BC AB SK MB ON QC NB NS PEI NL Canada
95 01 95 01 95 01 95 01 95 01 95 01 95 01 95 01 95 01 95 01 95 01Timing of manure applicationWinter 9 5 5 3 5 2 7 2 6 4 0 0 1 0 2 X 2 X 2 0 4 2Spring 46 53 27 30 20 28 19 20 41 40 27 50 40 53 45 42 61 50 59 54 30 35Summer 11 19 14 21 26 25 23 23 19 23 23 X 23 0 13 27 8 X 16 13 20 27Autumn 35 23 54 46 49 45 52 56 35 32 50 0 36 47 41 29 29 35 22 33 46 36
X: Data suppressed to maintain confidentialitySource: Statistics Canada, 2001 Farm Environmental Management SurveySource: Statistics Canada, 1995 Farm Inputs Management Survey
Table 7-3: Selected aspects of manure application practices in Canada, 1995, 2001
56
of the four western provinces (thoughAlberta essentially shows no change).Injection of liquid manure has increased in all provinces (except British Columbia),particularly in Manitoba and Saskatchewan,the two provinces showing the largest shiftsfrom solid manure systems to liquid manuresystems in their dairy sectors.
7) Timing of manure incorporation intosoil: This is expressed as the percentage of manure incorporated into the soil at various time periods following application.Immediate injection or incorporation assoon as possible after spreading are consid-ered the most environmentally beneficialpractices, as they reduce odour problemsand risks associated with run-off and nutri-ent losses. On average, only 15% of farmsinject liquid manure or incorporate solidmanure the same day as it is applied to land.The farms that do this tend to be larger thanaverage, collectively accounting for 18% ofthe manure produced.Incorporation within aweek of application, thesecond best practice, isdone by 32% of farms comprising 35% of manureproduction. The least environmentally favourablepractice of late or no incorporation characterizesmore than half (52%) of all farms, represent-ing slightly less than half (47%) of themanure produced. The patterns of manureincorporation do not differ significantlyamong the provinces, although broadlyspeaking, New Brunswick, Quebec andOntario tend to incorporate surface-appliedmanure more promptly than the otherprovinces. It should be noted that informa-tion on this variable is available only for2001, so comparisons cannot be made with 1995.
8) Liquid manure storage capacity: This is expressed as the percentage of all farms that use liquid manure storage systems ofdifferent capacities. Ideally, this capacityshould be sufficient to provide flexibility inthe timing of manure application, allowingthis to be done when both environmentally
and economically optimal. The optimumtime frame for application varies by region,but a minimum capacity of 200 days is considered a good benchmark. In general,liquid manure storage capacity increasedbetween 1995 and 2001 on all farms withthese systems. The number of lower capacitysystems, holding fewer than 200 days of production, has declined and have beenreplaced by higher capacity storage systems.Over half (55%) of farms with liquid systemsin 2001 could store more than 250 days ofmanure production compared to 40% in1995. In fact, 10% of farms could store more than 400 days of manure production.
9) Timing of manure application: This is expressed as the percentage of manure applied during each season. Application in the summer after planting makes nutrients immediately available to growing crops, reducing the risk of losses to the environ-ment. Application in spring, prior to
planting, and in fall, after harvest, is more prone to somenutrient losses. Winter applica-tion is generally not consideredappropriate, although it cansafely be practiced in some areas with very short winters,such as southern Ontario andVancouver Island. Elsewherethough, losses to the environ-
ment are likely to be high because of theinability of frozen ground to absorb manurenutrients. Although most manure in Canadais applied in autumn and spring respectively,application patterns differ from region toregion because of differences in the type oflivestock and crops produced. Farmers inBritish Columbia, Ontario and the AtlanticRegion apply the bulk of their manure pro-duction in the spring. Conversely, farmers inthe Prairie Provinces apply the bulk of theirmanure production in the autumn.
Pesticides: Results are presented in Table 7-4.The proportion of farms growing crops that usepesticides (herbicides, insecticides and fungi-cides) is provided for reference. In 2001, 73% of farms in Canada used at least one pesticide.This represents a slight drop of 4% from 1995(not shown in table). The largest percentage
Environmental Sustainability of Canadian Agriculture: Agri-Environmental Indicator Report Series—Report #2
In general, liquid
manure storage capacity
increased between 1995
and 2001.
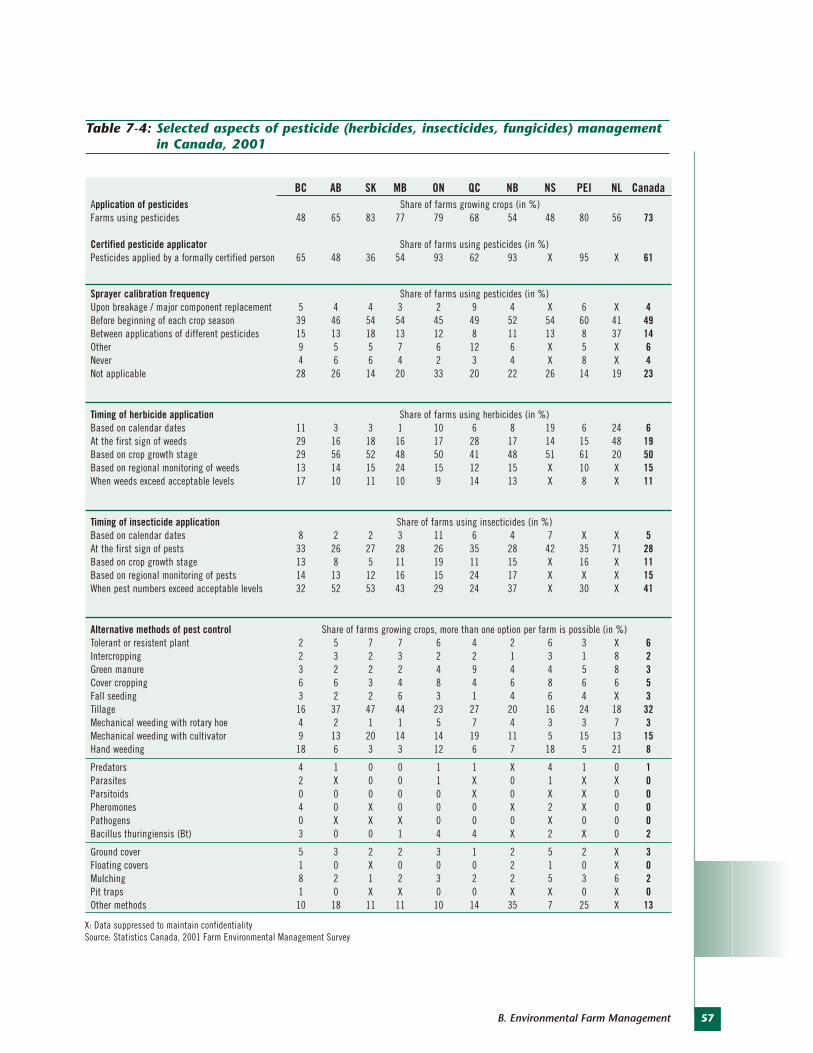
57B. Environmental Farm Management
BC AB SK MB ON QC NB NS PEI NL CanadaApplication of pesticides Share of farms growing crops (in %)Farms using pesticides 48 65 83 77 79 68 54 48 80 56 73
Certified pesticide applicator Share of farms using pesticides (in %)Pesticides applied by a formally certified person 65 48 36 54 93 62 93 X 95 X 61
Sprayer calibration frequency Share of farms using pesticides (in %)Upon breakage / major component replacement 5 4 4 3 2 9 4 X 6 X 4Before beginning of each crop season 39 46 54 54 45 49 52 54 60 41 49Between applications of different pesticides 15 13 18 13 12 8 11 13 8 37 14Other 9 5 5 7 6 12 6 X 5 X 6Never 4 6 6 4 2 3 4 X 8 X 4Not applicable 28 26 14 20 33 20 22 26 14 19 23
Timing of herbicide application Share of farms using herbicides (in %)Based on calendar dates 11 3 3 1 10 6 8 19 6 24 6At the first sign of weeds 29 16 18 16 17 28 17 14 15 48 19Based on crop growth stage 29 56 52 48 50 41 48 51 61 20 50Based on regional monitoring of weeds 13 14 15 24 15 12 15 X 10 X 15When weeds exceed acceptable levels 17 10 11 10 9 14 13 X 8 X 11
Timing of insecticide application Share of farms using insecticides (in %)Based on calendar dates 8 2 2 3 11 6 4 7 X X 5At the first sign of pests 33 26 27 28 26 35 28 42 35 71 28Based on crop growth stage 13 8 5 11 19 11 15 X 16 X 11Based on regional monitoring of pests 14 13 12 16 15 24 17 X X X 15When pest numbers exceed acceptable levels 32 52 53 43 29 24 37 X 30 X 41
Alternative methods of pest control Share of farms growing crops, more than one option per farm is possible (in %)Tolerant or resistent plant 2 5 7 7 6 4 2 6 3 X 6Intercropping 2 3 2 3 2 2 1 3 1 8 2Green manure 3 2 2 2 4 9 4 4 5 8 3Cover cropping 6 6 3 4 8 4 6 8 6 6 5Fall seeding 3 2 2 6 3 1 4 6 4 X 3Tillage 16 37 47 44 23 27 20 16 24 18 32Mechanical weeding with rotary hoe 4 2 1 1 5 7 4 3 3 7 3Mechanical weeding with cultivator 9 13 20 14 14 19 11 5 15 13 15Hand weeding 18 6 3 3 12 6 7 18 5 21 8
Predators 4 1 0 0 1 1 X 4 1 0 1Parasites 2 X 0 0 1 X 0 1 X X 0Parsitoids 0 0 0 0 0 X 0 X X 0 0Pheromones 4 0 X 0 0 0 X 2 X 0 0Pathogens 0 X X X 0 0 0 X 0 0 0Bacillus thuringiensis (Bt) 3 0 0 1 4 4 X 2 X 0 2
Ground cover 5 3 2 2 3 1 2 5 2 X 3Floating covers 1 0 X 0 0 0 2 1 0 X 0Mulching 8 2 1 2 3 2 2 5 3 6 2Pit traps 1 0 X X 0 0 X X 0 X 0Other methods 10 18 11 11 10 14 35 7 25 X 13
Table 7-4: Selected aspects of pesticide (herbicides, insecticides, fungicides) managementin Canada, 2001
X: Data suppressed to maintain confidentialitySource: Statistics Canada, 2001 Farm Environmental Management Survey
58
of farmers who applied pesticides are found inSaskatchewan (83%), followed by Prince EdwardIsland (80%) and Ontario (79%). BritishColumbia and Nova Scotia have the smallestproportion of farmers using pesticides (48%).
10) Certified pesticide applicator: This isexpressed as the proportion of farms usingpesticides where pesticide application ishandled by someone with certified trainingto do so. Given the nature of pesticides andthe importance of proper handling andapplication, producers were asked whetherpesticide application on their farm is doneby a formally certified person. Nationally,61% of farmers responded affirmatively. InOntario, Prince Edward Island and NewBrunswick, the percentage of certified applicators was well over 90%.
11) Sprayer calibration frequency: This is expressed as the percentage of farms thatapply pesticides using equipment that has been calibrated at specified intervals:between applications of different herbicides(optimal); at the start of the crop season;when the sprayer breaks down or majorparts are replaced; other and not applicable(pesticides not applied with a sprayer).Calibration before applying a different pesticide helps ensure that application is at the correct rate. Almost half of thefarmers in Canada only calibrate theirsprayers at the start of each season. Only14% of Canadian farmers calibrate theirsprayer between applications of differentpesticides (the best practice), indicating that there is room for improvement.
12) Timing of herbicide and insecticideapplication: This is expressed as the proportion of farms using herbicides wheretreatment is timed according to one of thefollowing: when weeds exceed acceptablelevel (e.g. economic injury threshold),which is the optimal practice; regional monitoring of weeds; crop growth stage; first sign of weeds; or calendar dates (riskiestpractice). Applying pesticides only whenweed pressures approach or exceed eco-nomic levels reduces quantities used andassociated costs and environmental risks.
Half (50%) of the farms in Canada applyherbicides based on the growth stage oftheir crop. All provinces reported similarpercentages, except Newfoundland andLabrador (NL) and British Columbia, whichhad much lower values. The second mostfrequent trigger for herbicide applicationwas the first sign of weeds (19%), followedby regional monitoring of pests (15%). The former method was popular inNewfoundland and Labrador and BritishColumbia. The riskiest practice—applyingherbicides based on calendar date—was theleast used method in all provinces exceptOntario (only 10%) and Newfoundland andLabrador (24%). This approach was fairlyprevalent in Nova Scotia (19%). With respectto insecticide use, 41% of farmers appliedinsecticides when they felt that the level ofpests exceeded acceptable levels (optimalpractice). While considerable variation wasobserved across Canada, this method wasespecially popular in the Prairies (between43% and 53%). Another 28% of Canadianfarmers applied insecticides at the first signof pests (Newfoundland and Labrador hadthe highest proportion, at 71%).
Environmental Sustainability of Canadian Agriculture: Agri-Environmental Indicator Report Series—Report #2
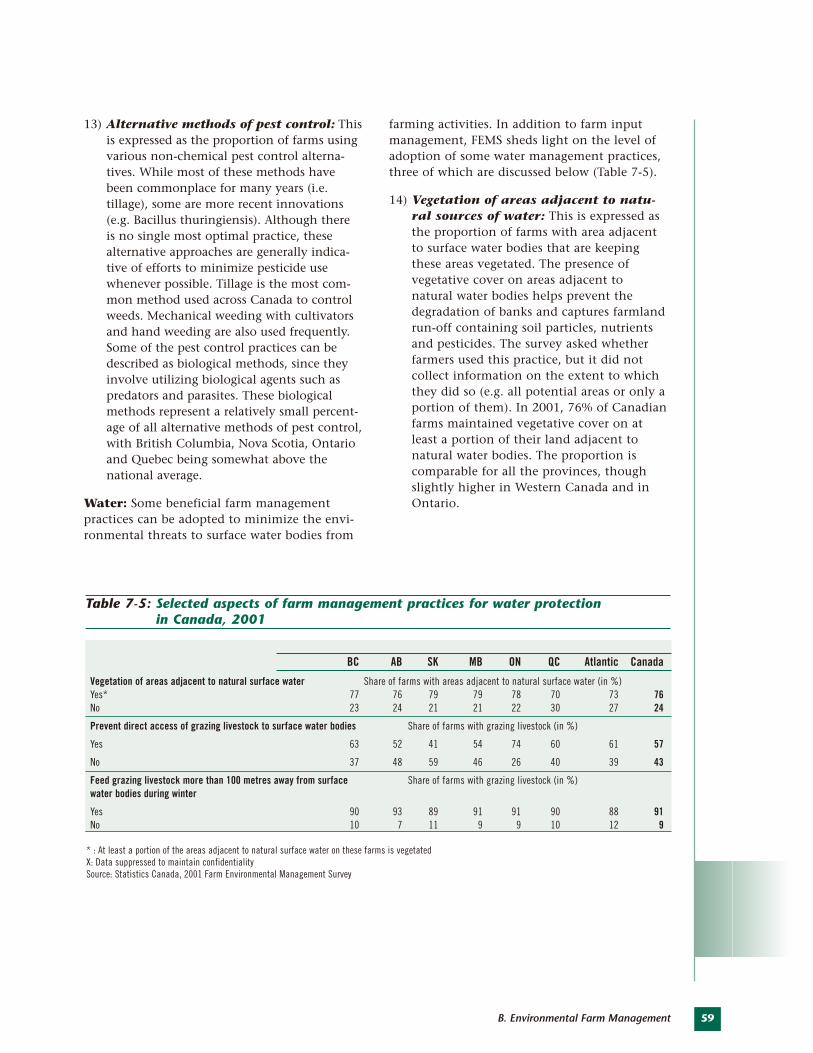
59B. Environmental Farm Management
13) Alternative methods of pest control: Thisis expressed as the proportion of farms usingvarious non-chemical pest control alterna-tives. While most of these methods havebeen commonplace for many years (i.e.tillage), some are more recent innovations(e.g. Bacillus thuringiensis). Although there is no single most optimal practice, these alternative approaches are generally indica-tive of efforts to minimize pesticide usewhenever possible. Tillage is the most com-mon method used across Canada to controlweeds. Mechanical weeding with cultivatorsand hand weeding are also used frequently.Some of the pest control practices can bedescribed as biological methods, since theyinvolve utilizing biological agents such aspredators and parasites. These biologicalmethods represent a relatively small percent-age of all alternative methods of pest control,with British Columbia, Nova Scotia, Ontarioand Quebec being somewhat above thenational average.
Water: Some beneficial farm management practices can be adopted to minimize the envi-ronmental threats to surface water bodies from
farming activities. In addition to farm inputmanagement, FEMS sheds light on the level ofadoption of some water management practices,three of which are discussed below (Table 7-5).
14) Vegetation of areas adjacent to natu-ral sources of water: This is expressed asthe proportion of farms with area adjacentto surface water bodies that are keepingthese areas vegetated. The presence of vegetative cover on areas adjacent to natural water bodies helps prevent thedegradation of banks and captures farmlandrun-off containing soil particles, nutrientsand pesticides. The survey asked whetherfarmers used this practice, but it did not collect information on the extent to whichthey did so (e.g. all potential areas or only aportion of them). In 2001, 76% of Canadianfarms maintained vegetative cover on atleast a portion of their land adjacent to natural water bodies. The proportion is comparable for all the provinces, thoughslightly higher in Western Canada and inOntario.
BC AB SK MB ON QC Atlantic Canada
Vegetation of areas adjacent to natural surface water Share of farms with areas adjacent to natural surface water (in %)Yes* 77 76 79 79 78 70 73 76No 23 24 21 21 22 30 27 24
Prevent direct access of grazing livestock to surface water bodies Share of farms with grazing livestock (in %)
Yes 63 52 41 54 74 60 61 57
No 37 48 59 46 26 40 39 43
Feed grazing livestock more than 100 metres away from surface Share of farms with grazing livestock (in %)water bodies during winter
Yes 90 93 89 91 91 90 88 91No 10 7 11 9 9 10 12 9
Table 7-5: Selected aspects of farm management practices for water protection in Canada, 2001
* : At least a portion of the areas adjacent to natural surface water on these farms is vegetatedX: Data suppressed to maintain confidentialitySource: Statistics Canada, 2001 Farm Environmental Management Survey
60
15) Prevention of livestock access to surfacewater bodies: This is expressed as the proportion of farms with grazing livestockthat prevent these animals from havingdirect access to surface water bodies. Grazinganimals can deposit manure directly in thewater, increasing the load of nutrients and the risk of pathogen contamination.They can also alter riparian areas, causingincreased erosion, compaction and sedimen-tation. Nationally, in 2001, 57% of farmswith grazing livestock did not allow live-stock access to surface water bodies, with the highest proportions observed for easternprovinces (especially Ontario) and BritishColumbia (higher than 60% in all cases).
16) Feeding of grazing livestock away fromsurface water bodies during wintermonths: This is expressed as the proportionof farms with grazing livestock that do notfeed their animals within 100 metres of surface water bodies during the winter. Thefeeding of grazing livestock in concentratedareas near surface water bodies could havenegative impacts on water quality throughrun-off losses of nutrients and pathogensfrom feeding areas. Feeding livestock inareas away from surface water bodies is aneffective way to reduce this type of risk. In 2001, this BMP was adopted by almost all farms with grazing livestock, as 91% ofCanadian farms with grazing livestockreported that they did not feed animalswithin 100 metres of surface water bodiesduring the winter. This very high percentagewas very consistent among the provinces.
RESPONSE OPTIONSThe findings presented in this chapter show that good practices related to mineral fertilizers,manure, pesticides and water management arebeing applied on farms across Canada. Althoughmanure management practices have improvedsomewhat, the findings suggest that there is still considerable room for improvement in thisarea. The overall trend in Canadian agricultureis toward increased specialization and intensifi-cation of production, along with the use ofmore sophisticated processes and technologies.As agriculture continues to move to larger and more intensive operations, sound farmmanagement practices will be critical for environmental protection, especially in areas of intensive crop or livestock production and inareas where landscape and climatic conditionsare susceptible to increased environmental risks.In most cases, reducing the environmental risksassociated with input management goes hand in hand with farm profitability.
REFERENCESStatistics Canada, 2001. Census of Agriculture.Statistics Canada, Agricultural Division, Ottawa (Ont.).www.statcan.ca/english/agcensus2001/index.htm
Statistics Canada, 2002. Farm EnvironmentalManagement in Canada. Statistics Canada,Agriculture Division, Ottawa (Ont.).www.statcan.ca:8096/bsolc/english/bsolc?catno=21-021-M
Statistics Canada, 1995. Farm Inputs ManagementSurvey (FIMS) 1995: A Survey of Manure,Commercial Fertilizer and Commercial PesticideManagement Practices on Canadian Farms.Statistics Canada, Agricultural Division, Ottawa (Ont.).
Environmental Sustainability of Canadian Agriculture: Agri-Environmental Indicator Report Series—Report #2
THE ISSUEBare soil is more susceptible to soil degradationprocesses such as wind and water erosion, loss oforganic matter, breakdown of soil structure andloss of fertility. A variety of factors influence theproportion and the amount of time that soil isleft bare over a production cycle, including thefollowing: the type of crop, the amount of vege-tative growth and the tillage practices employed.Most perennial field crops such as hay offergood soil coverage year-round, while annual row crops such as cereals leave soil exposed atparticular times such as planting. Other annualcrops such as pulses (beans, peas, etc.) andoilseeds (canola, flax, etc.) tend to producelower residue levels, leaving more soil exposed.Soil productivity and climatic or weather condi-tions also affect soil cover by influencing theamount of vegetative growth, and thus theamount of crop residue available as cover overthe fall, winter and spring. The tillage methodalso influences the amount of soil cover, assome tillage practices turn most of the cropresidue into the soil to leave a clean surface forseeding (referred to as “conventional tillage”),while “conservation tillage” leaves more cropresidue on the soil surface, increasing soil cover.
Increasing the amount of soil cover in an agroecosystem has a number of benefits:
• offering protection against wind and water erosion;
• adding organic matter to the soil, which helps to maintain soil health;
• promoting carbon sequestration in soil, which helps to reduce levels of atmosphericcarbon dioxide; and
• providing better wildlife habitat, which supports biodiversity.
THE INDICATOR The Soil Cover Indicator summarizes the num-ber of days per year that agricultural soils arecovered in a typical crop production cycle. A“soil cover day” can be achieved with 100%cover for one day, 50% cover for 2 days, 10%cover for 10 days, and so on. The indicator considers the soil cover provided by cropcanopy, crop residues on the soil surface andsnow. As an example, a perennial hay crop typically has over 300 soil cover days per year,since there is very little soil exposed at any time.By contrast, a soybean crop in an area of lowsnowfall and without a winter cover crop mayhave less than half of that.
SUMMARYAgricultural soil that is left unprotected and exposed to the elements (bare soil) is susceptible to degrada-
tion processes such as wind and water erosion, loss of organic matter, breakdown of soil structure and loss
of fertility. The amount of time that soil is left bare depends on a variety of factors such as the type of crop,
the amount of vegetative growth and the tillage practices employed. The Soil Cover Indicator summarizes
the number of days of the year that agricultural soils are covered. An increase in the number of soil cover
days over time indicates an improvement and a declining likelihood that soils will become degraded or
contribute to degradation of the surrounding environment.
Between 1981 and 2001, average levels of soil cover in Canada increased by over 5%. This improvement
came primarily as a result of the widespread adoption of reduced tillage and the decreased use of summer-
fallow in the Prairies. Increases in soil cover associated with reduced-tillage practices were offset to a
considerable degree by cropping intensification (shifts from perennial to annual crops) and by increases
in the area of crops such as potatoes, canola and soybeans, which produce inherently less crop residue.
61B. Environmental Farm Management
AUTHORS:
E. Huffman, D. Coote, J.Y. Yang and F. Chen
INDICATOR NAME:
Soil CoverIndicator
STATUS:
National coverage, 1981 to 2001
8. Soil Cover
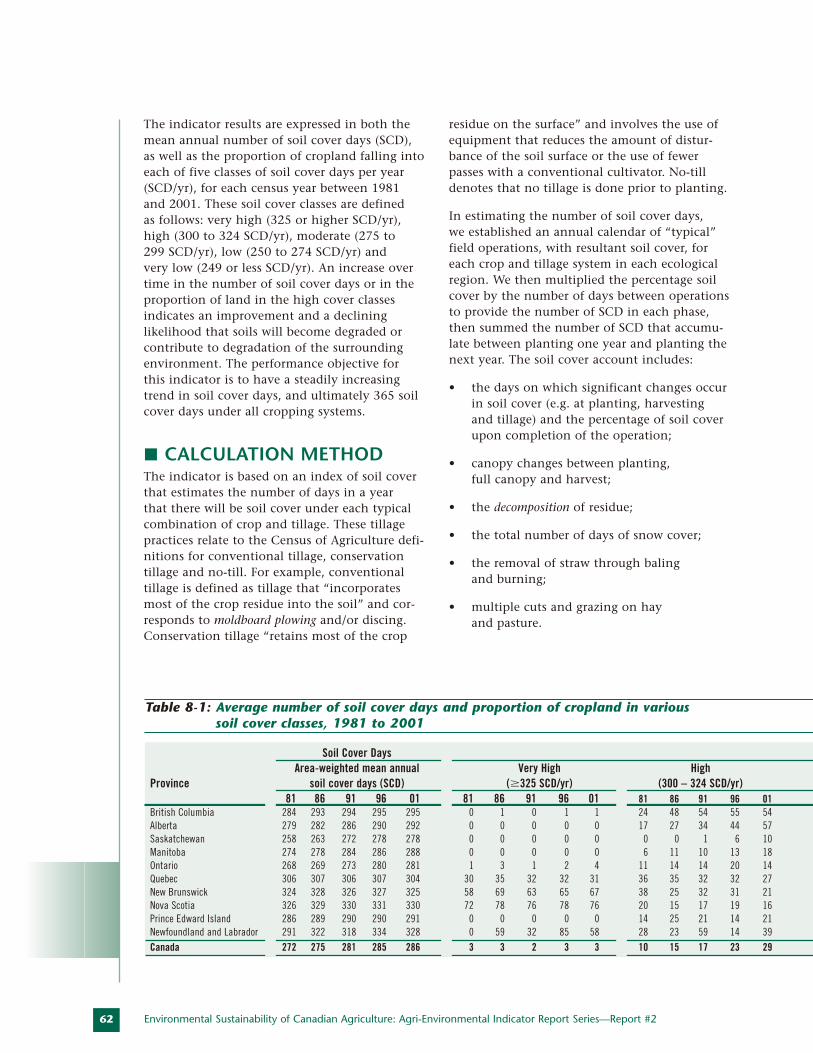
62
The indicator results are expressed in both themean annual number of soil cover days (SCD),as well as the proportion of cropland falling intoeach of five classes of soil cover days per year(SCD/yr), for each census year between 1981and 2001. These soil cover classes are defined as follows: very high (325 or higher SCD/yr),high (300 to 324 SCD/yr), moderate (275 to 299 SCD/yr), low (250 to 274 SCD/yr) and very low (249 or less SCD/yr). An increase overtime in the number of soil cover days or in theproportion of land in the high cover classesindicates an improvement and a declining likelihood that soils will become degraded orcontribute to degradation of the surroundingenvironment. The performance objective for this indicator is to have a steadily increasingtrend in soil cover days, and ultimately 365 soilcover days under all cropping systems.
CALCULATION METHODThe indicator is based on an index of soil coverthat estimates the number of days in a year that there will be soil cover under each typicalcombination of crop and tillage. These tillagepractices relate to the Census of Agriculture defi-nitions for conventional tillage, conservationtillage and no-till. For example, conventionaltillage is defined as tillage that “incorporatesmost of the crop residue into the soil” and cor-responds to moldboard plowing and/or discing.Conservation tillage “retains most of the crop
residue on the surface” and involves the use ofequipment that reduces the amount of distur-bance of the soil surface or the use of fewerpasses with a conventional cultivator. No-tilldenotes that no tillage is done prior to planting.
In estimating the number of soil cover days, we established an annual calendar of “typical”field operations, with resultant soil cover, foreach crop and tillage system in each ecologicalregion. We then multiplied the percentage soilcover by the number of days between operationsto provide the number of SCD in each phase,then summed the number of SCD that accumu-late between planting one year and planting thenext year. The soil cover account includes:
• the days on which significant changes occurin soil cover (e.g. at planting, harvesting and tillage) and the percentage of soil coverupon completion of the operation;
• canopy changes between planting, full canopy and harvest;
• the decomposition of residue;
• the total number of days of snow cover;
• the removal of straw through baling and burning;
• multiple cuts and grazing on hay and pasture.
Environmental Sustainability of Canadian Agriculture: Agri-Environmental Indicator Report Series—Report #2
Soil Cover DaysArea-weighted mean annual Very High High
Province soil cover days (SCD) (�325 SCD/yr) (300 – 324 SCD/yr)81 86 91 96 01 81 86 91 96 01 81 86 91 96 01
British Columbia 284 293 294 295 295 0 1 0 1 1 24 48 54 55 54Alberta 279 282 286 290 292 0 0 0 0 0 17 27 34 44 57Saskatchewan 258 263 272 278 278 0 0 0 0 0 0 0 1 6 10Manitoba 274 278 284 286 288 0 0 0 0 0 6 11 10 13 18Ontario 268 269 273 280 281 1 3 1 2 4 11 14 14 20 14Quebec 306 307 306 307 304 30 35 32 32 31 36 35 32 32 27New Brunswick 324 328 326 327 325 58 69 63 65 67 38 25 32 31 21Nova Scotia 326 329 330 331 330 72 78 76 78 76 20 15 17 19 16Prince Edward Island 286 289 290 290 291 0 0 0 0 0 14 25 21 14 21Newfoundland and Labrador 291 322 318 334 328 0 59 32 85 58 28 23 59 14 39Canada 272 275 281 285 286 3 3 2 3 3 10 15 17 23 29
Table 8-1: Average number of soil cover days and proportion of cropland in various soil cover classes, 1981 to 2001
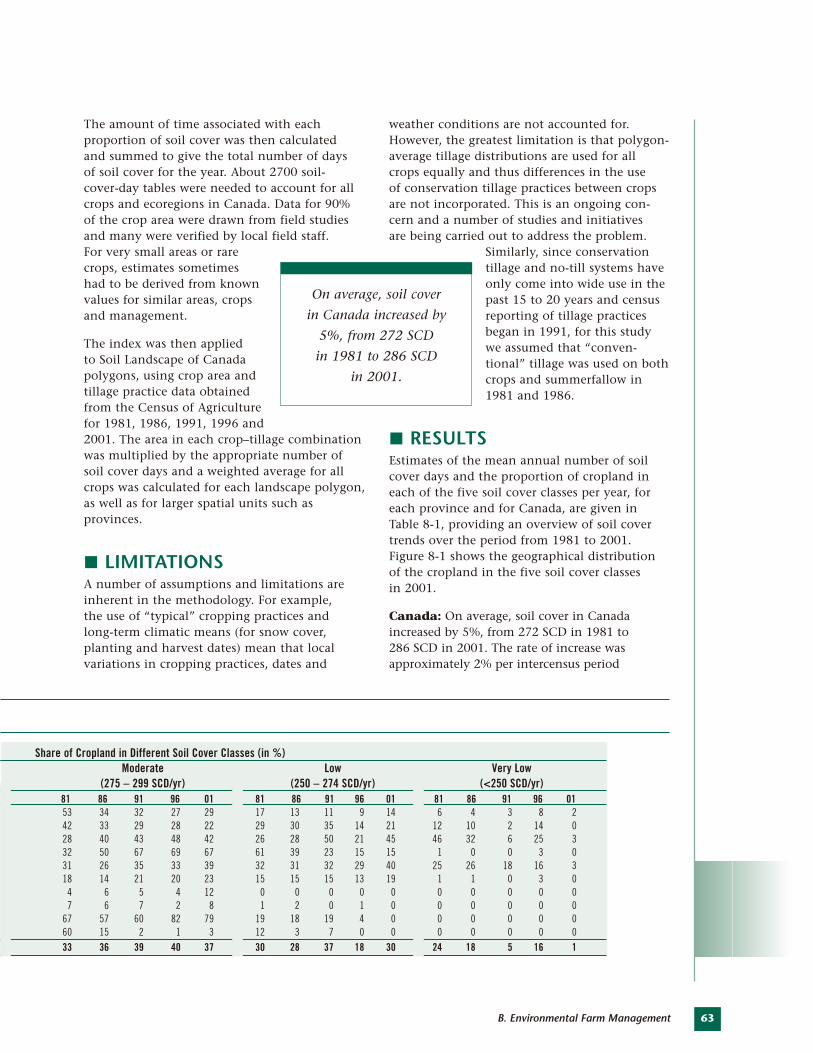
63B. Environmental Farm Management
The amount of time associated with each proportion of soil cover was then calculated and summed to give the total number of days of soil cover for the year. About 2700 soil-cover-day tables were needed to account for allcrops and ecoregions in Canada. Data for 90%of the crop area were drawn from field studiesand many were verified by local field staff. For very small areas or rarecrops, estimates sometimes had to be derived from known values for similar areas, cropsand management.
The index was then applied to Soil Landscape of Canadapolygons, using crop area andtillage practice data obtainedfrom the Census of Agriculturefor 1981, 1986, 1991, 1996 and2001. The area in each crop–tillage combinationwas multiplied by the appropriate number ofsoil cover days and a weighted average for allcrops was calculated for each landscape polygon,as well as for larger spatial units such asprovinces.
LIMITATIONSA number of assumptions and limitations areinherent in the methodology. For example, the use of “typical” cropping practices and long-term climatic means (for snow cover, planting and harvest dates) mean that local variations in cropping practices, dates and
weather conditions are not accounted for.However, the greatest limitation is that polygon-average tillage distributions are used for all crops equally and thus differences in the use of conservation tillage practices between cropsare not incorporated. This is an ongoing con-cern and a number of studies and initiatives are being carried out to address the problem.
Similarly, since conservationtillage and no-till systems haveonly come into wide use in thepast 15 to 20 years and censusreporting of tillage practicesbegan in 1991, for this studywe assumed that “conven-tional” tillage was used on bothcrops and summerfallow in1981 and 1986.
RESULTSEstimates of the mean annual number of soilcover days and the proportion of cropland ineach of the five soil cover classes per year, foreach province and for Canada, are given inTable 8-1, providing an overview of soil covertrends over the period from 1981 to 2001. Figure 8-1 shows the geographical distributionof the cropland in the five soil cover classes in 2001.
Canada: On average, soil cover in Canadaincreased by 5%, from 272 SCD in 1981 to 286 SCD in 2001. The rate of increase wasapproximately 2% per intercensus period
Share of Cropland in Different Soil Cover Classes (in %)Moderate Low Very Low
(275 – 299 SCD/yr) (250 – 274 SCD/yr) (<250 SCD/yr)81 86 91 96 01 81 86 91 96 01 81 86 91 96 0153 34 32 27 29 17 13 11 9 14 6 4 3 8 242 33 29 28 22 29 30 35 14 21 12 10 2 14 028 40 43 48 42 26 28 50 21 45 46 32 6 25 332 50 67 69 67 61 39 23 15 15 1 0 0 3 031 26 35 33 39 32 31 32 29 40 25 26 18 16 318 14 21 20 23 15 15 15 13 19 1 1 0 3 0
4 6 5 4 12 0 0 0 0 0 0 0 0 0 07 6 7 2 8 1 2 0 1 0 0 0 0 0 0
67 57 60 82 79 19 18 19 4 0 0 0 0 0 060 15 2 1 3 12 3 7 0 0 0 0 0 0 033 36 39 40 37 30 28 37 18 30 24 18 5 16 1
On average, soil cover
in Canada increased by
5%, from 272 SCD
in 1981 to 286 SCD
in 2001.
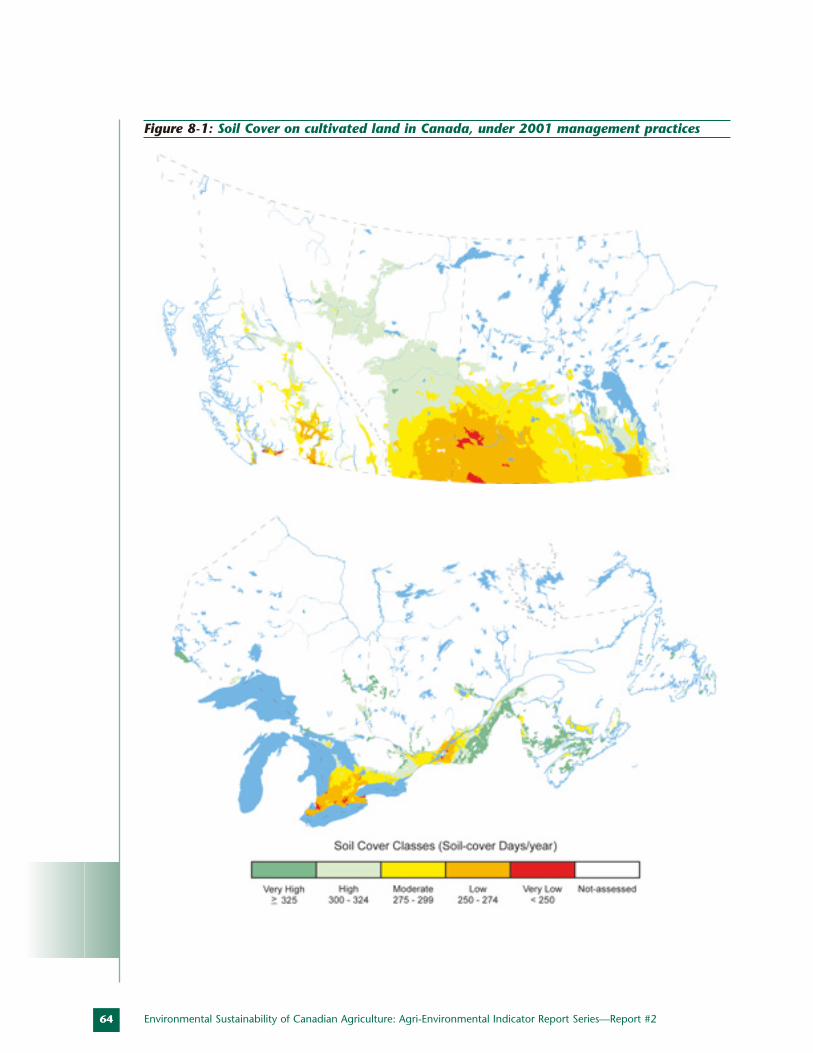
64 Environmental Sustainability of Canadian Agriculture: Agri-Environmental Indicator Report Series—Report #2
Figure 8-1: Soil Cover on cultivated land in Canada, under 2001 management practices
65B. Environmental Farm Management
between 1981 and 1996 and levelled off between1996 and 2001. A national trend of improvingsoil cover between 1981 and 2001 is reflected inthe dramatic increase in the proportion of crop-land in the high soil cover category. Although the proportion in the very high cover class heldsteady at about 3% throughout the period, theproportion in the high cover category increasedfrom 10% of cropland in 1981 to 29% in 2001.National values are driven primarily by changesin the Prairie Provinces, masking some of theprovincial and regional variation.
British Columbia: Mean annual soil coverincreased by 4% (from 284 to 295 SCD) over the 20-year period, with most of the increaseoccurring between 1981 and 1986. The increasecontinued between 1986 and 2001, but at a very small and declining rate. The proportion of cropland in the highest soil cover categoryremained at 1%, but the proportion in the high cover class increased from 24% to 54%,accompanied by a decrease in the lower classes.Considerable variation in soil cover changeoccurred within the province, with the LowerMainland showing a 2% increase in SCD, theInterior a 3% increase and the Peace River district a 5% increase.
Alberta: Overall, the province showed a 5%increase in soil cover between 1981 and 2001,increasing from 279 SCD to 292 SCD, with afairly consistent change between each censusyear. Alberta had no cropland in the very highcover class in any year, but the proportion ofcropland in the high cover class increased from24% to 54%, and the proportion of cropland inthe very low cover category declined from 12%to 0%. The southeastern region of the province(Brown Soil zone) showed a 4% increase in soilcover, while the change in the central region(Dark Brown and Black Soil zones) was about 6%to 7%. As in British Columbia, soil cover in thePeace River area increased by 5%.
Saskatchewan: This province posted one ofthe highest average increases in soil cover at 7% (from 258 SCD to 278 SCD). The largestincreases occurred between 1986 and 1991 (3%)and between 1991 and 1996 (2%), comparedwith an increase of less than 1% between 1996and 2001. Increases ranged from 4% in thesouthwest to between 6% and 7% in the northand the east. None of the cropland had a very
high soil cover rating, but the proportion in thehigh cover category increased from 0% to 10%and the moderate cover class increased from28% to 42%. Meanwhile the very low soil cover class declined from 46% to 3% of cropland during the study period.
Manitoba: Soil cover in this province increasedfrom 274 SCD to 288 SCD (5%) between 1981and 2001, with the greatest increases occurringbetween 1981 and 1991. Although still positive,the rate of change has declined since 1991. The southwest portion of the province showedan increase of 6%, but the provincial averagewas reduced considerably by an average changeof only 3% in the Lake Winnipeg Plain. As inthe other Prairie Provinces, no cropland fell intothe very high cover class. Nonetheless, the pro-portion of cropland in the high cover categorytripled, from 6% to 18%, and the moderatecover class increased from 32% to 67%.
Ontario: The proportion of cropland in thevery high and high soil cover classes increasedslightly between 1981 and 2001, from 1% to 4%and from 11% to 14% respectively. The mostsignificant change came from the very low coverclass, which decreased from 25% to 3%. The 5%average increase in soil cover (from 268 SCD to281 SCD) is similar to the change recorded inBritish Columbia, Alberta and Manitoba, but the greatest rate of change occurred later in time(between 1991 and 1996) than in the westernprovinces. The highest rate of change (7%)occurred in southwestern Ontario, whereas the central portion of the province showed anaverage increase of 3% and the eastern part a1% decrease.
Quebec: Very high levels of soil cover character-ized about 30% of Quebec cropland throughoutthe period under study. A decrease from 36% to27% in cropland with high soil cover coincidedwith increases in the area with moderate cover(from 18% to 23%) and low cover (from 15% to19%). Average soil cover in Quebec was higherthan in Ontario and the western provinces forall census years, but a slight and steady declineoccurred over the period, from 306 SCD in 1981to 304 SCD in 2001 (-1%). This overall declinemasks a slight improvement that occurredbetween 1981 and 1986. Only the EasternTownships and the south shore regions showedan increase (1%) over the 20-year period.
66
New Brunswick: Results are similar to Quebec,with an increase between 1981 and 1986 andthen a decline to 2001. However, the overall 20-year change consisted of an increase of lessthan 1%. The provincial average reflects a verysmall decrease in soil cover in the primary agricultural areas (St. John River Valley and theSuffolk region) and a small improvement in therest of the province. The proportion of croplandin the very high cover class increased from 58%to 67%, but the amount in the high cover category decreased from 38% to 21% and the amount in the moderate cover categoryincreased from 4% to 12%. No cropland fell intoeither the low or the very low soil cover class.
Nova Scotia: This provincehad the highest proportion ofcropland in the very high soilcover category, with an increasefrom 72% to 76% between1981 and 2001. Soil cover in Nova Scotia increased by justover 1% between 1981 and2001, with most of the increase coming between 1981 and1986. Soil cover increased byless than 1% in the AnnapolisValley, slightly more than 1%in the Truro area and about 2%in the southern coastal areas.
Prince Edward Island: No cropland fell intothe very high or the very low soil cover class,and the amount in the low cover category fell from 19% to 0% during the 20-year studyperiod. This was reflected in increases in thehigh soil cover class (14% to 21%) and the moderate class (67% to 79%). Provincially, soil cover increased by five SCD between 1981and 2001.
Newfoundland and Labrador: This provincehad the greatest increase in soil cover on crop-land between 1981 and 2001 (12%), along withthe largest increase in the very high cover class, which went from 0% to 58%. There was a dramatic increase between 1981 and 1986, aslight decline between 1986 and 1991, anotherincrease between 1991 and 1996 and a declineagain between 1996 and 2001.
INTERPRETATIONAs noted previously, changes in soil coveraccount for two factors related to cropping practices: changes in tillage practices such asthe adoption of conservation tillage and no-till and changes in the area of crops. Thus,although the adoption of conservation practicesmay increase soil cover by up to 100% or more for a specific crop, a shift from no-till on a high-residue crop, such as corn, to no-till on a low-residue crop, such as soybeans, canresult in a decrease in soil cover.
Canada: A national improvement in soil coverbetween 1981 and 2001 is reflected in the dra-matic increase in the proportion of cropland
in the high soil cover categoryand the decline in the very lowcover category. These changesresulted from a decrease in theproportion of cropland underconventional tillage, a decreasein the area of summerfallowand increases in conservationtillage and no-till and in thearea of forage crops. Anincrease in cropland area andshifts to lower-cover crops suchas canola, potatoes and soy-beans put downward pressureon soil cover change.
British Columbia: The proportion of croplandin the high soil cover class increased at theexpense of the lower cover classes. This positivechange came from a 42% reduction in summer-fallow, a 13% increase in forage and the adoptionof reduced-tillage practices on 34% of croplandand 37% of summerfallow. Factors countering the positive effect included a 10% increase incropland, a 38% and 50% reduction in the area of higher-residue spring and winter cerealsrespectively and an expansion of the area underthe lower-residue crops of peas, beans, lentils,berries and grapes.
Alberta: Soil cover increased in this province,primarily owing to the elimination of conven-tional tillage on 63% of cropland and on 61% of summerfallow. In addition, summerfallowarea and flax area (low-cover land uses)decreased by 44% and 61% respectively and
Environmental Sustainability of Canadian Agriculture: Agri-Environmental Indicator Report Series—Report #2
Changes resulted
from a decrease in the
proportion of cropland
under conventional
tillage, a decrease in the
area of summerfallow
and increases in
conservation tillage.
67B. Environmental Farm Management
forage area increased by 49%. As elsewhere inCanada, gains in soil cover were partially offsetby other changes in cropping patterns, mostnotably a 15% increase in cropland area, a 72%increase in canola, large increases in potatoes,peas, beans and lentils, a 65% decrease in wintercereals and an 8% decrease in spring cereals.
Saskatchewan: The increases in the higher soilcover classes in Saskatchewan resulted from theadoption of reduced-tillage systems on 68% ofcropland and on 53% of summerfallow, a 53%reduction in summerfallow area and a 60%increase in forages. The improvement in soilcover was attained despite a 31% expansion ofcropland, large increases in canola, flax, pota-toes, peas, beans and lentils, an 11% decrease in spring cereals and a 34% decrease in wintercereals.
Manitoba: The observed increases in soil cover can be attributed to a 57% reduction insummerfallow, a 38% reduction in flax, a 41%increase in forages and the use of reduced-tillageon 46% of cropland and on 50% of summerfal-low. Decreases in the area of higher-residuecrops (spring cereals, -17%; grain corn, -50%)and increases in the area of lower-residue crops(canola, up 192%; potatoes, up 90%; peas, beansand lentils up 174%) had a negative effect onsoil cover between 1981 and 2001.
Ontario: The increases in the proportion ofcropland in the moderate to very high soil coverclasses resulted from the elimination of conven-tional tillage on 48% of cropland and from a50% reduction in corn silage area. Thesechanges would have contributed a higher gainin soil cover, but a shift away from forages (-24%), grain corn (-8%) and spring cereals (-22%) to soybeans (+227%) depressed theamount of available residue.
Quebec: Factors contributing to the overall shiftin cropland from the high soil cover class to themoderate and low cover levels include an 18%increase in the area of cropland under conven-tional tillage, a decrease of 36% in forage area,
an increase from 2000 hectares to 156,000hectares under bean production, a 34% increasein vegetable area and a 300% increase in berrycultivation. Increases in higher residue graincorn and spring cereal area (164% and 45%,respectively) and a 38% decrease in silage cornalso pushed up soil cover values.
New Brunswick: The increases in the amountof cropland in the very high and moderate covercategories are explained by various land usechanges: a 28% increase in spring cereals, a250% increase in winter cereals, a 70% declinein vegetables, a 16% increase in cropland, a 15%decrease in forages, an 8% increase in potatoesand a 6% increase in conventionally tilled cropland.
Nova Scotia: The slight changes observed inNova Scotia came as a result of a 22% decrease inthe area of cropland under conventional tillage,while increases in cropland (14%), grain corn(50%), potatoes (34%) and berries (156%) anddecreases in forages (-18%), spring cereals (-25%)and winter cereals (-43%) also played a role.
Prince Edward Island: The land use changesthat had a positive effect on soil cover include adecrease in cropland under conventional tillage (-11%), decreases in silage corn (-39%) and vegetables (-40%) and increases in grain corn(750%) and winter cereals (125%). These weresomehow counteracted by negative influencesfrom increases in cropland (11%), potatoes(68%) and soybeans (from 42 to 6600 hectares:up by 6600%) and decreases in forages (-20%)and spring cereals (-12%).
Newfoundland and Labrador: The increasein the high and very high cover classes resultedfrom upturns in total cropland area (85%), forages (19%), spring cereals (382%) and wintercereals (1400%), along with decreases in conven-tionally tilled cropland (-7%) and in the area ofpotatoes (-24%) and vegetables (-19%).
68
RESPONSE OPTIONSThe national increase in soil cover shows a highrate of change in the early to mid-1990s and amuch more modest rise in the latter part of thedecade. This suggests that the rate of adoptionof conservation tillage practices is reaching aplateau and that further expansion may notkeep up with the negative influence of croppingsystem changes. Changes in cropping patternsthat are slowing the improving trend of soilcover in Canada, such as expanding productionof pulse crops, oilseeds and potatoes, can beexpected to continue as producers diversify andfollow the markets. To increase the level of soilprotection, it is therefore necessary to expandand improve techniques for increasing andmaintaining crop canopy and residues.
It appears that there is still opportunity forexpansion of reduced-tillage systems, especiallyno-till in British Columbia, Manitoba, Quebecand the Atlantic Provinces, where it was used onless than 15% of cropland in 2001. There aretechnical and financial concerns related to theadoption of reduced tillage, and although thistype of system cannot be used on all crops,continued expansion is expected, albeit at alower rate than over the past 25 years.
Of perhaps greater importance in view of the growing area of low-residue crops such as potatoes, canola, sugar beets, soybeans andhorticultural crops is the use of practices toenhance soil cover in these cropping systems.Planting a “green manure” crop or a wintercover crop where feasible promptly after har-vesting would provide a greater degree of soilcover over the long period between harvestingand planting. Similarly, the use of cereals orperennial grass in the interrow area of perennialhorticultural crops would increase soil cover.
The soil cover situation should eventuallyreceive a boost from research on the develop-ment of suitable companion and over-wintercrops, cold-germination varieties of crops for use under no-till, equipment to better maintainsurface residues while performing productionoperations satisfactorily, and perhaps even cropswith a greater mass of more durable foliage.
REFERENCESDumanski, J. , L.J.Gregorich, V. Kirkwood, M.A. Cann, J.L.B. Culley and D.R. Coote, 1994. The Status of Land Management Practices onAgricultural Land in Canada: Compiled From the1991 Canada Census of Agriculture. TechnicalBulletin 1994-3E, Agriculture and Agri-FoodCanada, Ottawa (Ont.).
Huffman, E. , R.G. Eilers, G. Padbury, G. Wall,and K.B. MacDonald, 2000. Canadian Agri-Environmental Indicators Related to Land Quality:Integrating Census and Biophysical Data toEstimate Soil Cover, Wind Erosion and Soil Salinity. Agriculture, Ecosystems andEnvironment. 81(2): 113-123.http://cgrg.geog.uvic.ca//abstracts/HuffmanCanadianA.html
Lobb, D.A., E. Huffman, and D. Reicosky, 2005.“Importance of Information on Tillage Practices inthe Modelling of Environmental Processes and in theUse of Environmental Indicators”. In Proceedingsof OECD Expert Meeting on Farm ManagementIndicators and the Environment, PalmerstonNorth, New Zealand, March 8 – 12, 2004. OECD,Paris (France).
Prairie Farm Rehabilitation Administration(PFRA), 2003. Managing Crop Residues on thePrairies. Crop Residue Survey on the Prairies(online document). Agriculture and Agri-Food Canada, PFRA, Regina (Man.). www.agr.gc.ca/pfra/soil/residue_e.htm
Statistics Canada, 2005. Census of Agriculture.Statistics Canada, Ottawa (Ont.).www.statcan.ca/english/sdds/3438.htm
Steiner, J.L., H.H. Schomberg, and P.W. Unger,1999. “Predicting Crop Residue Decomposition andCover for Wind Erosion Simulation”. In WindErosion, an International Symposium/Workshop(online proceedings of the 1997 InternationalWind Erosion Symposium). U.S. Department ofAgriculture, Agricultural Research Service, WindErosion Research Unit, Manhatten (Kansas). www.weru.ksu.edu/symposium/proceedings/steiner.pdf
Environmental Sustainability of Canadian Agriculture: Agri-Environmental Indicator Report Series—Report #2
THE ISSUENitrogen is an essential nutrient required by allcrops. Legumes (e.g. soybean, alfalfa, red clover)fix nitrogen from the atmosphere, but non-legu-minous crops (e.g. corn, cereal crops, potatoes)require applied nitrogen for optimal growth andyield (Drury and Tan 1995). Nitrogen is added to these non-leguminous crops through fertilizerand manure, atmospheric deposition and mineralization of crop residues and soil organicnitrogen. Nitrogen must be properly managed to reduce costs to farmers (from purchasing,transporting and applying mineral fertilizers), to maximize productivity and to curb losses of this key nutrient from agricultural land to the environment.
Losses occur because not all of the applied nitrogen is used by the crop, and some inorganic nitrogen inevitably remains in the soil at the end of the growing season (residual soilnitrogen). Environmental risks may be associ-ated with unduly large surpluses in the soil,particularly in humid regions. Most of the residual inorganic nitrogen, which is in the form of nitrate, is water soluble and is susceptible to leaching through the soil intogroundwater or to loss through tile drainageinto ditches, streams and lakes. High nitrate levels in surface waters contribute to algaegrowth and eutrophication, and they may posea threat to human health in the case of drinkingwater (Chambers et al. 2001). Under anaerobicconditions, nitrate can also be lost (through
denitrification) from the soil to the atmospherein the form of nitric oxide, nitrous oxide (apotent greenhouse gas) and nitrogen gas.
Management of nitrogen is further complicatedby climatic conditions (drought, excess rain,early frost, etc.) and other soil physical andchemical factors, which can limit crop growthand therefore nitrogen uptake. This can in turn lead to further increases in the amount of residual soil nitrogen at the end of the growing season.
THE INDICATORThe Residual Soil Nitrogen (RSN) Indicator wasdeveloped to estimate the quantity of nitrogenin the soil that is provided in excess of croprequirements and therefore remains in the fieldafter harvest (MacDonald, 2000). It is the differ-ence between the amount of nitrogen that isavailable to the growing crop from all sourcesand the amount removed in the harvested cropportion under average conditions along withgaseous losses to the atmosphere.
The indicator in itself does not give any insightinto the environmental effects of various levels ofRSN in different environmental settings. Surplusnitrogen may pose a risk to the environment, butthis risk is also sensitive to other factors such assoil type and climatic conditions. Thus, a secondagri-environmental indicator, the Indicator of Risk of Water Contamination by Nitrogen
SUMMARYResidual soil nitrogen (RSN) is the amount of nitrogen that has been applied to soil but not removed in
the harvested portion of crops. The Residual Soil Nitrogen Indicator was calculated as the difference
between all nitrogen (N) inputs (fertilizer, manure, biological fixation and atmospheric deposition) and
all nitrogen outputs (N removed in crop harvest, N lost through ammonia volatilization and N lost
through denitrification), for each of the five Census years from 1981 to 2001.
On average over the five Census years, most of the farmland in Canada (63%) was in the very low (24%)
and low (39%) RSN classes. RSN remained relatively stable between 1981 and 1996 (16.1–18.1 kg of
N per ha) and then dramatically increased by about 50% to 27.6 kg of N per ha in 2001. This rise was
mainly due to an increase in pulse crop acreage (i.e. greater natural biological fixation) without a concur-
rent decrease in fertilizer application and to significantly lower crop yields and reduced N uptake as a
result of climatic constraints (droughts) which were prevalent in many regions in Canada in 2001.
69B. Environmental Farm Management
AUTHORS:
C. F. Drury, J.Y. Yang, R. De Jong, T. Huffman, V. Kirkwood, X. M. Yang and K. Reid.
INDICATOR NAME:
Residual SoilNitrogen
STATUS:
National coverage, 1981 to 2001
9. Nitrogen Use Efficiency
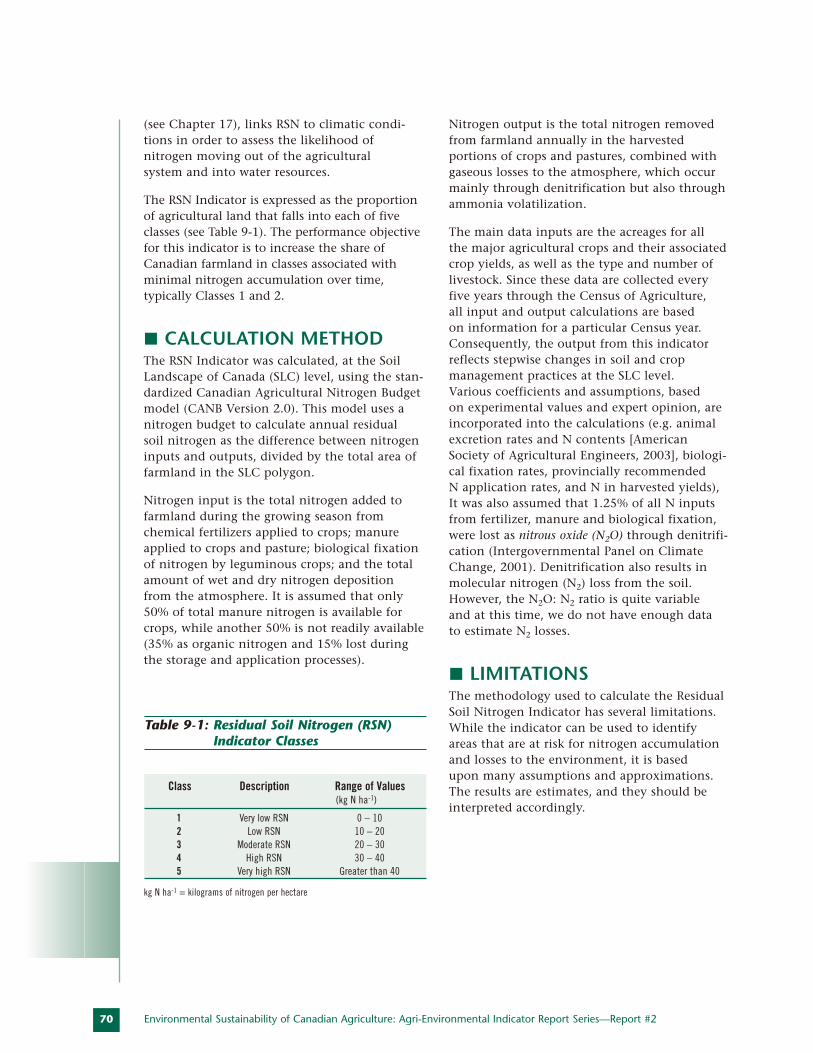
70
(see Chapter 17), links RSN to climatic condi-tions in order to assess the likelihood ofnitrogen moving out of the agricultural system and into water resources.
The RSN Indicator is expressed as the proportionof agricultural land that falls into each of fiveclasses (see Table 9-1). The performance objectivefor this indicator is to increase the share ofCanadian farmland in classes associated withminimal nitrogen accumulation over time, typically Classes 1 and 2.
CALCULATION METHODThe RSN Indicator was calculated, at the SoilLandscape of Canada (SLC) level, using the stan-dardized Canadian Agricultural Nitrogen Budgetmodel (CANB Version 2.0). This model uses anitrogen budget to calculate annual residual soil nitrogen as the difference between nitrogeninputs and outputs, divided by the total area offarmland in the SLC polygon.
Nitrogen input is the total nitrogen added tofarmland during the growing season from chemical fertilizers applied to crops; manureapplied to crops and pasture; biological fixationof nitrogen by leguminous crops; and the totalamount of wet and dry nitrogen depositionfrom the atmosphere. It is assumed that only50% of total manure nitrogen is available forcrops, while another 50% is not readily available(35% as organic nitrogen and 15% lost duringthe storage and application processes).
Nitrogen output is the total nitrogen removedfrom farmland annually in the harvested portions of crops and pastures, combined withgaseous losses to the atmosphere, which occurmainly through denitrification but also throughammonia volatilization.
The main data inputs are the acreages for all the major agricultural crops and their associatedcrop yields, as well as the type and number oflivestock. Since these data are collected everyfive years through the Census of Agriculture, all input and output calculations are based on information for a particular Census year.Consequently, the output from this indicatorreflects stepwise changes in soil and crop management practices at the SLC level. Various coefficients and assumptions, based on experimental values and expert opinion, areincorporated into the calculations (e.g. animalexcretion rates and N contents [AmericanSociety of Agricultural Engineers, 2003], biologi-cal fixation rates, provincially recommended N application rates, and N in harvested yields),It was also assumed that 1.25% of all N inputsfrom fertilizer, manure and biological fixation,were lost as nitrous oxide (N2O) through denitrifi-cation (Intergovernmental Panel on ClimateChange, 2001). Denitrification also results inmolecular nitrogen (N2) loss from the soil.However, the N2O: N2 ratio is quite variable and at this time, we do not have enough data to estimate N2 losses.
LIMITATIONSThe methodology used to calculate the ResidualSoil Nitrogen Indicator has several limitations.While the indicator can be used to identify areas that are at risk for nitrogen accumulationand losses to the environment, it is based upon many assumptions and approximations.The results are estimates, and they should beinterpreted accordingly.
Environmental Sustainability of Canadian Agriculture: Agri-Environmental Indicator Report Series—Report #2
Class Description Range of Values(kg N ha-1)
1 Very low RSN 0 – 102 Low RSN 10 – 203 Moderate RSN 20 – 304 High RSN 30 – 405 Very high RSN Greater than 40
Table 9-1: Residual Soil Nitrogen (RSN)Indicator Classes
kg N ha-1 = kilograms of nitrogen per hectare
71B. Environmental Farm Management
One of these assumptions involves reliance on official provincial recommendations fornitrogen input, which may not reflect the most recent changes and which are not adjustedfor factors such as the nitrogen released frommanure applications in previous years. We alsoassumed that a fixed proportion (15%) of thenitrogen contained in manure would be lostduring storage and handling. However we know that nitrogen losses during manure stor-age vary with manure source, storage methodand manure form (liquid, solid, compost). Intime, better data and more dynamic models maybecome available, enabling us to make betterestimates of nitrogen inputs, for example, byincluding differences in manure types and storage methods.
Although soil nitrogen mineral-ization (conversion of organic N to inorganic N) and immobi-lization (conversion of inorganicN to organic N) occur on a seasonal basis, it is assumed that the soils are in a steadystate with no net change in soilorganic carbon (C) and organicnitrogen (N) from one year to the next. If a managementpractice is adopted that favours C and N seques-tration, then some of the RSN will go into theorganic N pool until a new steady-state organic C and N value is reached. During this process,RSN would over-estimate the amount of mineralN remaining in the soil following harvest. This will be examined in greater detail in future studies.
Another obvious limitation in the applicationand interpretation of results from the RSN indi-cator is the low frequency of Census data (onceevery 5 years). This poses a problem particularlywith respect to yield variability resulting fromyear-to-year climatic variation. In the comingyears, complementary approaches will be evaluated to better estimate RSN values andaddress the issue of indicator sensitivity tosevere climatic variability (and resultantdecreases in crop yields) coinciding with aCensus year.
RESULTSEstimates of the proportion of farmland in eachRSN class for each province and for Canada are provided in Table 9-2. Figure 9-1 shows thegeographical distribution of the farmland in thefive RSN classes in 2001. For simplicity, unlessotherwise specified, the results provided belowrefer to the average proportions of farmland invarious RSN classes observed over the 20 yearsof the study period (five Census years: 1981,1986, 1991, 1996, and 2001). Refer to Table 9-1for details on the RSN classes.
Canada: On average, most of the farmland in Canada (63%) was in the very low (24%) and low (39%) RSN classes. However, a fairlycontinuous decline occurred in the proportion
of farmland in these twoclasses, mostly with a concurrent increase in themoderate RSN class. Between1981 and 1996, at most 14% of Canadian farmland fell inthe high and very high RSNclasses. However, in 2001 theproportion of farmland inthese two classes increased sig-nificantly, to 43% (high: 28%;very high: 15%).
British Columbia: Similar to the nationaltrends, 68% of the farmland in BC was in thevery low and low RSN classes, while only 13% offarmland was in the high and very high classes.Here again, there was a gradual decline in thepercentage of farmland in the very low RSNclass coupled with an increase in the moderateclass from 1981 to 2001.
Prairies: Alberta and Saskatchewan exhibitedsimilar trends with, on average, high propor-tions of farmland in the very low and low RSNclasses (AB: 83%; SK: 70%). However, these proportions changed in 2001 with a significantincrease in the proportion of farmland in themoderate and high RSN classes combined (AB: 44%; SK: 80%). In Manitoba, the situationis different, with an average of only 5% of farmland in the very low and low RSN classes.On average, most of the farmland in Manitoba(84%) is in the high and very high RSN classescombined, with 72% of farmland in the veryhigh RSN class for 2001.
On average, most of
the farmland
in Canada (63%) was
in the very low (24%)
and low (39%)
RSN classes.
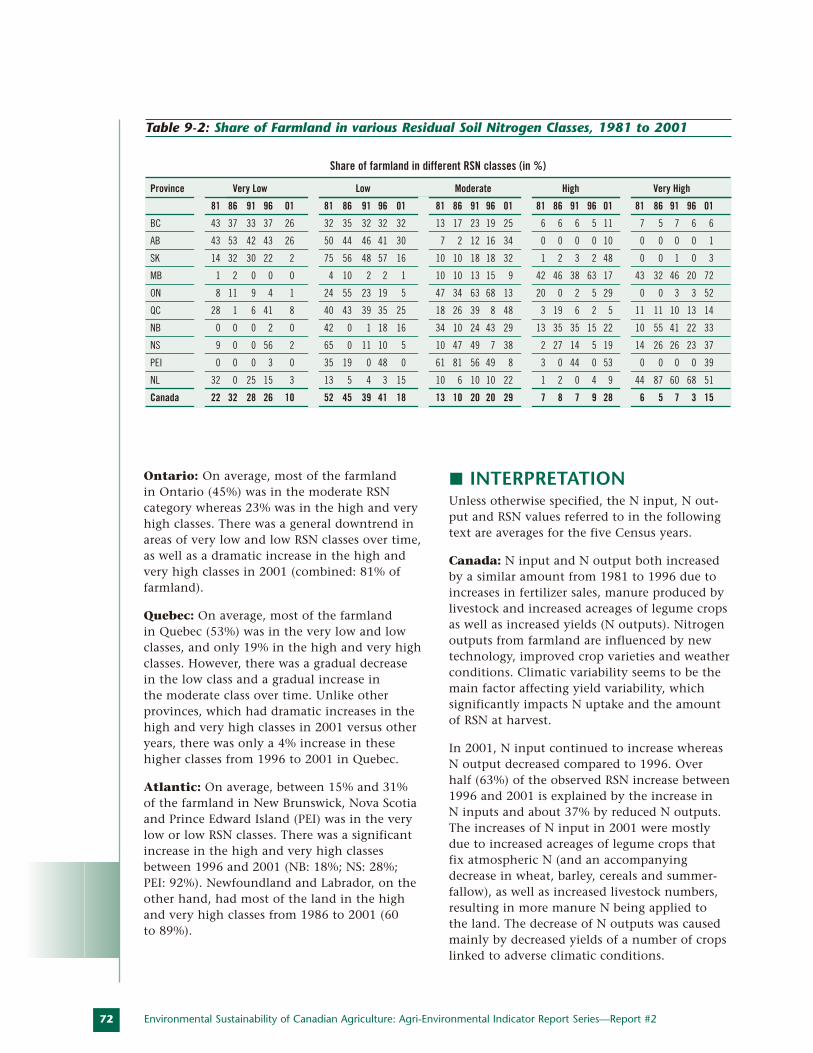
72
Ontario: On average, most of the farmland in Ontario (45%) was in the moderate RSN category whereas 23% was in the high and veryhigh classes. There was a general downtrend inareas of very low and low RSN classes over time,as well as a dramatic increase in the high andvery high classes in 2001 (combined: 81% offarmland).
Quebec: On average, most of the farmland in Quebec (53%) was in the very low and lowclasses, and only 19% in the high and very highclasses. However, there was a gradual decrease in the low class and a gradual increase in the moderate class over time. Unlike otherprovinces, which had dramatic increases in thehigh and very high classes in 2001 versus otheryears, there was only a 4% increase in thesehigher classes from 1996 to 2001 in Quebec.
Atlantic: On average, between 15% and 31% of the farmland in New Brunswick, Nova Scotiaand Prince Edward Island (PEI) was in the verylow or low RSN classes. There was a significantincrease in the high and very high classesbetween 1996 and 2001 (NB: 18%; NS: 28%; PEI: 92%). Newfoundland and Labrador, on theother hand, had most of the land in the highand very high classes from 1986 to 2001 (60 to 89%).
INTERPRETATIONUnless otherwise specified, the N input, N out-put and RSN values referred to in the followingtext are averages for the five Census years.
Canada: N input and N output both increasedby a similar amount from 1981 to 1996 due toincreases in fertilizer sales, manure produced bylivestock and increased acreages of legume cropsas well as increased yields (N outputs). Nitrogenoutputs from farmland are influenced by newtechnology, improved crop varieties and weatherconditions. Climatic variability seems to be themain factor affecting yield variability, which significantly impacts N uptake and the amountof RSN at harvest.
In 2001, N input continued to increase whereasN output decreased compared to 1996. Over half (63%) of the observed RSN increase between1996 and 2001 is explained by the increase in N inputs and about 37% by reduced N outputs.The increases of N input in 2001 were mostlydue to increased acreages of legume crops thatfix atmospheric N (and an accompanyingdecrease in wheat, barley, cereals and summer-fallow), as well as increased livestock numbers,resulting in more manure N being applied to the land. The decrease of N outputs was causedmainly by decreased yields of a number of cropslinked to adverse climatic conditions.
Environmental Sustainability of Canadian Agriculture: Agri-Environmental Indicator Report Series—Report #2
Share of farmland in different RSN classes (in %)
Province Very Low Low Moderate High Very High
81 86 91 96 01 81 86 91 96 01 81 86 91 96 01 81 86 91 96 01 81 86 91 96 01
BC 43 37 33 37 26 32 35 32 32 32 13 17 23 19 25 6 6 6 5 11 7 5 7 6 6
AB 43 53 42 43 26 50 44 46 41 30 7 2 12 16 34 0 0 0 0 10 0 0 0 0 1
SK 14 32 30 22 2 75 56 48 57 16 10 10 18 18 32 1 2 3 2 48 0 0 1 0 3
MB 1 2 0 0 0 4 10 2 2 1 10 10 13 15 9 42 46 38 63 17 43 32 46 20 72
ON 8 11 9 4 1 24 55 23 19 5 47 34 63 68 13 20 0 2 5 29 0 0 3 3 52
QC 28 1 6 41 8 40 43 39 35 25 18 26 39 8 48 3 19 6 2 5 11 11 10 13 14
NB 0 0 0 2 0 42 0 1 18 16 34 10 24 43 29 13 35 35 15 22 10 55 41 22 33
NS 9 0 0 56 2 65 0 11 10 5 10 47 49 7 38 2 27 14 5 19 14 26 26 23 37
PEI 0 0 0 3 0 35 19 0 48 0 61 81 56 49 8 3 0 44 0 53 0 0 0 0 39
NL 32 0 25 15 3 13 5 4 3 15 10 6 10 10 22 1 2 0 4 9 44 87 60 68 51
Canada 22 32 28 26 10 52 45 39 41 18 13 10 20 20 29 7 8 7 9 28 6 5 7 3 15
Table 9-2: Share of Farmland in various Residual Soil Nitrogen Classes, 1981 to 2001
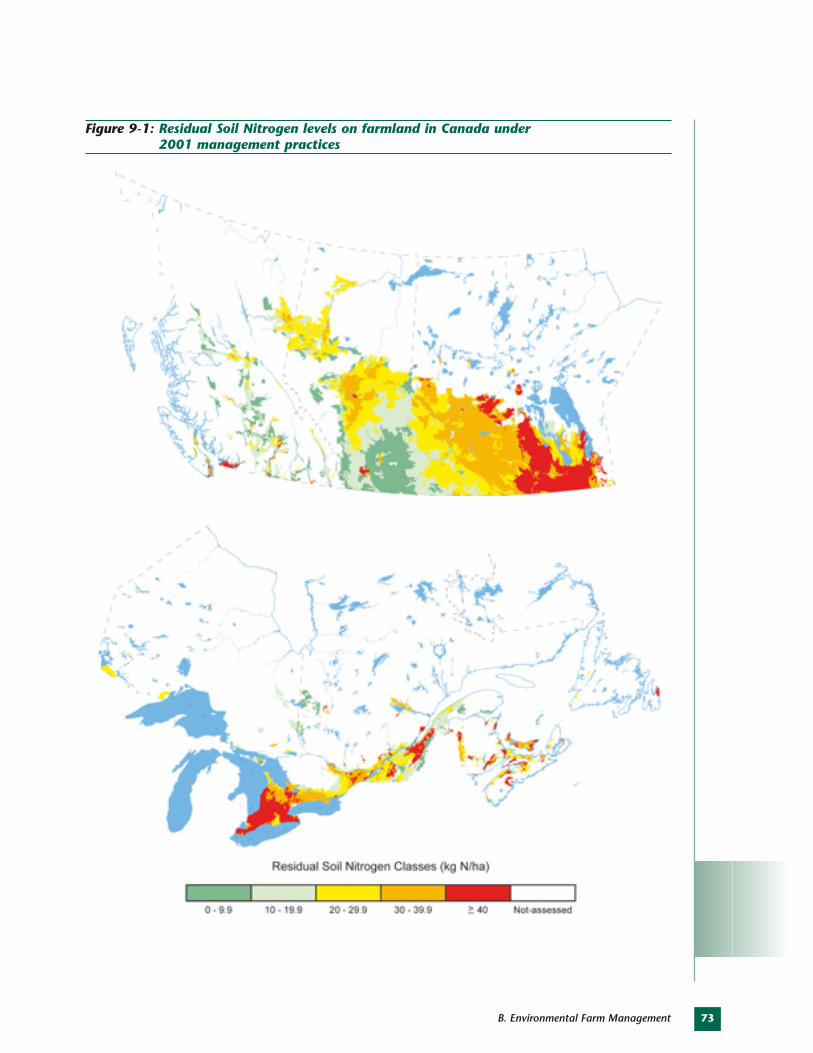
73B. Environmental Farm Management
Figure 9-1: Residual Soil Nitrogen levels on farmland in Canada under 2001 management practices
74
British Columbia: Nitrogen input increasedbut N output decreased slightly from 1981 to2001. During that period, the amount of fertil-izer sold in BC was relatively constant, increasesin N input being mostly driven by the increasein manure N (mostly from poultry). Similar to the national trend, the crop area of wheat,barley and cereals decreased, while the area of pulse, forage and alfalfa increased.
Alberta: While Alberta has low N inputs and outputs in its agricultural sector, fertilizersales and manure (cattle and pig) productionincreased dramatically over the 20-year period,contributing to a gradual increase in the propor-tion of land in the moderate RSN class (Table 9.2).Nevertheless, Alberta was the province with thelowest RSN value (12 kg N ha-1) over the fiveCensus years. There was also a decrease inwheat, cereals, flax and summerfallow acreages,and an increase in pulses, forages, potato, alfalfaand improved pasture acreages. At the sametime, yield increases contributed to higher Noutput, which limited the increase in RSN.
Saskatchewan: Saskatchewan has the largestarea of farmland in Canada, the lowest N inputand fairly low animal densities. This resulted inthe second lowest RSN values overall, althoughboth nitrogen input and output increased gradu-ally over the 20-year period studied. The Ninput increase is mainly explained by dramaticincreases in fertilizer sales and manure produc-tion. In keeping with the national trend, cropareas increased for pulses, canola, hay andalfalfa, whereas the wheat area decreased.
Manitoba: Manitoba has the highest RSN ofthe Prairie Provinces (37 kg N ha-1), mostly as aresult of relatively high N inputs (81 kg N ha-1).Nitrogen inputs also increased linearly from1981 to 2001 due to increases in fertilizer sales,livestock numbers and manure nitrogen. Hereagain, crop areas increased dramatically forpulses and canola, with smaller increases inpotatoes and alfalfa, and a decrease in the summerfallow area.
Ontario: Ontario has higher N inputs (112 kg N ha-1) and outputs (87 kg N ha-1) than thePrairie Provinces, and both inputs and outputsincreased over the 20-year period under study.While fertilizer sales declined in Ontario from1986 to 2001, N inputs rose overall, mostly dueto higher biological fixation from increased
soybean (20% each year) and alfalfa acreages aswell as increased livestock numbers (manure Nfrom poultry and hog operations). Increases ofwheat areas were offset by a reduction in othercereal crops. Pasture areas also steadily declined.
Quebec: In Quebec, nitrogen inputs and out-puts increased over time. N inputs (110 kg N ha-1) and N outputs (84 kg N ha-1) and RSN (26 kg N ha-1) values in Quebec were similar to those in Ontario. Increases in N inputs weredriven by continued increases in fertilizer salesand increases in manure resulting from higherpoultry and hog numbers. Legume crop (pulse,soybean and alfalfa) acreages increased, whereaspasture areas decreased in Quebec.
Atlantic: High N inputs and comparatively low N outputs resulted in somewhat higher RSN values in New Brunswick, Nova Scotia and Newfoundland and Labrador compared to Alberta, Saskatchewan, Ontario and Quebec.N inputs increased over the 20-year period in all Atlantic Provinces and N outputs increased in New Brunswick and Newfoundland andLabrador between 1981 and 2001. N inputincreases were primarily attributable to higherlivestock numbers (poultry and pig). Field cropsincreased in wheat, soybean, canola, forage and alfalfa acreages, whereas pasture and sum-merfallow areas decreased. In general, PEI has a medium N input and high N output leading to a lower RSN compared to the other MaritimeProvinces. Here again, there was an increase in cereals, soybean, potato and alfalfa acreageswhile improved pasture decreased over the 20-year period. Newfoundland and Labradorposted the highest RSN values among all theprovinces across all Census years. The RSN value for Newfoundland and Labrador exceeded100 kg N ha-1 in 1986, 1996 and 2001. Thesehigh values reflect higher livestock numbers and the limited area of farmland available formanure application. For example in 2001, 75%of the N inputs were from manure and 21%from biological fixation by leguminous cropsbut only 2% was from applied N fertilizer and1% from atmospheric deposition. Manure nitrogen inputs more than doubled between1981 and 1986, and they continued to risebetween 1991 and 2001. Crop types were dominated by pasture, which nonethelessdecreased whereas hay and alfalfa acreagesincreased.
Environmental Sustainability of Canadian Agriculture: Agri-Environmental Indicator Report Series—Report #2
75B. Environmental Farm Management
RESPONSE OPTIONSAreas with high and very high levels of residualnitrogen (Classes 4 and 5) should be examinedin more detail to determine the probable cause.Soil testing can be used to confirm the results.Where high levels of residual nitrogen are confirmed, steps should be taken to correct this situation, and beneficial management practices (BMP) employed to control or reducethe amount of residual nitrogen present in thesoil at the end of the growing season. Regularsoil testing, reduction of the N fertilizer applica-tion rate, improved N mineralization estimatesand synchronization with N demand by cropsrepresent other avenues for increasing nitrogenuse efficiency. It is also necessary to consider Ninputs from all legume crops when N fertiliza-tion recommendations are made. This isespecially true for high nitrogen-fixing cropssuch as soybean and alfalfa. Cover crops can beused in areas that have high RSN levels, notonly to remove nitrate present in the soil at theend of the growing season, but also to increasesoil organic carbon levels and improve the physical quality of the soil (Drury et al. 1999).
In areas where high livestock density is a key contributing factor to high and very highRSN values (Lower Mainland region of BC,south-central Alberta, southern Ontario, the St. Lawrence Lowlands in Quebec and coastallowland regions in Atlantic Canada), unless livestock numbers are reduced, or the land baseavailable for manure application is increased, it may be necessary to investigate alternativemethods of treating the manure or diverting itto other purposes, such as biogas production.Improved animal feeding efficiencies throughbetter management practices and feed additivescan also contribute to reduce nutrient loads by reducing the amount of N excreted in themanure. Reducing fertilizer application rates in areas with high manure application and/orleguminous crops is another management practice that could be used to a greater extent to lower RSN values.
REFERENCES American Society of Agricultural Engineers(ASAE), 2003. “Manure Production andCharacteristics”. Pages 683-685 in ASAEStandards 2003, 50th ed. ASAE-The Society for Engineering in Agricultural, Food, andBiological Systems. St. Joseph (Michigan).
Chambers, P.A., M. Guy, E.S. Roberts, M.N.Charlton, R. Kent, C. Gagnon, G. Grove, and N. Foster, 2001. Nutrients and Their Impact on theCanadian Environment. Environment Canada,Ottawa (Ont.).
Drury, C.F. and C.S. Tan, 1995. Long-Term (35 Years) Effects of Fertilization, Rotation andWeather on Corn Yields. Canadian Journal ofPlant Science. 75: 355-362.
Drury, C.F., C.S. Tan, T.W. Welacky, T.O. Oloya,A.S. Hamill, and S.E. Weaver, 1999. Red Cloverand Tillage Influence on Soil Temperature, Moistureand Corn Emergence. Agronomy Journal. 91: 101-108.
Intergovernmental Panel on Climate Change(IPCC), 2001. Climate Change 2001: The Scientific Basis – Contribution of Working Group I to the Third Assessment Report of theIntergovernmental Panel on Climate Change(J.T. Houghton, et al, eds). Cambridge University Press, Cambridge (UK).www.grida.no/climate/ipcc_tar/wg1/index.htm
MacDonald, K.B, 2000. “Residual Nitrogen”. In McRae, T., Smith, C.A.S., and Gregorich, L.J. (eds). Environmental Sustainability ofCanadian Agriculture; Report of the Agri-Environmental Indicator Project. Agricultureand Agri-Food Canada, Ottawa (Ont.).www.agr.gc.ca/env/naharp-pnarsa/
THE ISSUEIn agriculture, energy inputs are used to powervehicles and farm machinery, manufactureequipment and chemicals (e.g. mineral fertiliz-ers, pesticides) and perform other tasks. Whilemuch of this energy comes from outside theagricultural sector (e.g. from petroleum sources),some is supplied by the sector itself (e.g. feed forlivestock production). Energy eventually leavesthe agricultural system in the form of commodi-ties such as cereals, horticultural crops andlivestock, or through losses to the environment.
Sustaining today’s highly mechanized agricul-ture, or increasing production on a fixed landbase with limited natural soil fertility, typicallyrequires increasing amounts of energy input(e.g. fertilizer use) and/or introducing new technologies (e.g. higher-yielding grain varieties)or management strategies (e.g. minimum andno-till practices). Changes in the amount ofenergy input or output can be short or longterm, and are a reflection of changes in the following areas: technology or farm manage-ment practices, government policies that affectdecisions on input use or output products, andweather patterns that affect yields (which canhave significant impact on the energy output).
From an economic perspective, agricultural producers stand to benefit from using inputs as efficiently as possible, minimizing their direct costs and maximizing profit. In addition,more efficient or reduced input use is often associated with reduced environmental risk. For example, fossil fuels and nitrogen fertilizersare recognized as sources of greenhouse gasemissions. Understanding the amount and formof energy that is used and produced in agricul-ture, along with how these components arechanging over time, provides some informationon how the system is performing.
THE INDICATORThe Energy Use Efficiency Ratio essentially consists of two sub-indicators. The first one—Energy Input—estimates the amount of energycontained in agricultural inputs. The second—Energy Output—estimates the amount of energycontained in agricultural products. An increasein Energy Input will generally imply a greaterintensity of resource use and a higher level ofenvironmental risk. Conversely, an increase inEnergy Output, without a significant change in the mix of agricultural products, is a sign ofimproved productivity.
SUMMARYAgriculture, like other human activities, requires energy as an input and turns out products that contain
energy. Agricultural producers have an economic incentive to minimize energy inputs (often associated with
reduced environmental risks) as long as they can maintain or increase their agricultural (energy) outputs. The
Energy Use Efficiency Ratio (Energy Output per unit of Energy Input) has been used to evaluate the energy
use efficiency of the agricultural sector. The indicator shows that the Energy Use Efficiency Ratio for Canadian
agriculture decreased by 3% between the two periods 1981-1985 and 1997-2001. During these two periods
combined, the total energy input increased by 16% and energy output rose by 13%. Changes in the overall
energy input are mostly due to increases in the energy inputs represented by diesel fuel and fertilizer. Energy
outputs varied from year to year and between provinces, but they largely reflected a 31% decrease in wheat
and a 169% increase in canola. Together, these two crops accounted for 53% of the total energy output
in 1997-2001.
76 Environmental Sustainability of Canadian Agriculture: Agri-Environmental Indicator Report Series—Report #2
AUTHORS:
A. Piau and M. Korol
INDICATOR NAME:
Energy UseEfficiency Ratio
STATUS:
National coverage,
1981 to 2001
10. Energy Use Efficiency
77B. Environmental Farm Management
These two sub-indicators are combined to createa ratio (Energy Output per unit of Energy Input)which is used to evaluate energy use efficiency.By carefully examining the Energy Input andEnergy Output measures, it is then possible toexplain changes in the Energy Use EfficiencyRatio. The performance objective for this indicator is an Energy Use Efficiency Ratio that increases over time.
CALCULATION METHODThe calculations for Energy Input, EnergyOutput and the Energy Use Efficiency Ratio(total Energy Output divided by total EnergyInput) were carried out at theprovincial and national levelsfor each year between 1981 and2001. The results for 1981 to1996 are from Weseen andLindenbach (1998), but theyhave been adjusted to reflectthe updated approach used forthe 1997-2001 estimates. Theresults are reported for threetime periods: 1981-1985, 1989-1993 and 1997-2001. Thisaggregation of the results intothree five-year periods provides a more mean-ingful basis of comparison by smoothing outsignificant annual fluctuations in output values.
The Energy Input component was evaluatedusing the methodology described in “Energy Use Trends in Canadian Agriculture” (Coxworth1997). This method was modified in order to deal with a scarcity of information at theprovincial level. The energy inputs included inthe calculations consist of refined petroleumproducts (natural gas, gasoline, diesel fuel andnatural gas liquids, e.g. propane and butane),electricity, energy used to produce mineral fertilizers and pesticides and energy embodied in buildings and machinery. Data for the EnergyInput calculations came directly or indirectlyfrom Statistics Canada publications and otherenergy reports. When data were lacking for cer-tain years, values were estimated using knowndata. To ensure consistency with other studies,
we did not include values for energy resourcedepletion (a factor that accounts for the extrac-tion, refining and transportation of fossil fuelsto the final user). Direct solar energy is alsoexcluded from the calculations. Whenever possible, values for refined petroleum productsand electricity were corrected to account fornon-farm business usage.
The energy outputs were determined for 34 ofthe most abundantly produced commodities in Canada (see Table 10-1) by multiplying theamount of each commodity produced by anenergy content coefficient. Production data were obtained from Statistics Canada databases,
and the energy content coeffi-cients from the US Departmentof Agriculture NutrientDatabase. The amount of grainfed to livestock, along with pasture and hay, was excludedfrom the calculations to avoiddouble-counting (this energycontent is embodied in live-stock production).
The metric unit measure forenergy used in the indicator is a petajoule, or PJ (1 PJ =
1015 joules). Note that 1 calorie is equal to 4.17 joules; 1 British Thermal Unit (BTU) equals 1,054.6 joules.
LIMITATIONSThe results for the Energy Use Efficiency Ratiopresented here can be used, with appropriatecaution, to identify trends in energy use efficiency in Canadian agriculture. However, the indicator cannot be considered a precisemeasure. This would require a complete understanding of the full life cycle of energy in relation to present and past technologies. As calculated, an increase in the output/inputratio may not necessarily mean that energy useefficiency has improved. This is because agricul-tural production (and thus energy input andoutput) is influenced by a variety of climaticand economic factors. For example, given a
Understanding the
amount and form of
energy that is used and
produced in agriculture,
provides some
information on how the
system is performing.
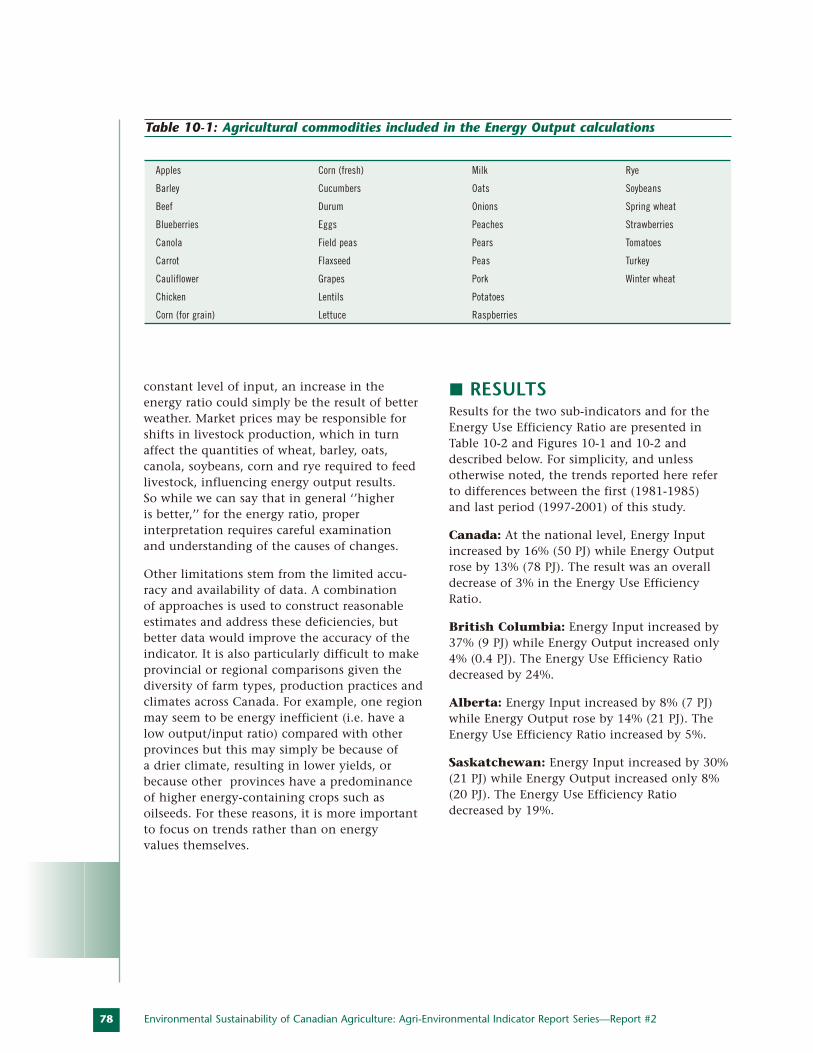
78
constant level of input, an increase in theenergy ratio could simply be the result of betterweather. Market prices may be responsible forshifts in livestock production, which in turnaffect the quantities of wheat, barley, oats,canola, soybeans, corn and rye required to feedlivestock, influencing energy output results. So while we can say that in general ‘’higher is better,’’ for the energy ratio, proper interpretation requires careful examination and understanding of the causes of changes.
Other limitations stem from the limited accu-racy and availability of data. A combination of approaches is used to construct reasonableestimates and address these deficiencies, but better data would improve the accuracy of theindicator. It is also particularly difficult to makeprovincial or regional comparisons given thediversity of farm types, production practices andclimates across Canada. For example, one regionmay seem to be energy inefficient (i.e. have alow output/input ratio) compared with otherprovinces but this may simply be because of a drier climate, resulting in lower yields, orbecause other provinces have a predominanceof higher energy-containing crops such asoilseeds. For these reasons, it is more importantto focus on trends rather than on energy values themselves.
RESULTSResults for the two sub-indicators and for theEnergy Use Efficiency Ratio are presented inTable 10-2 and Figures 10-1 and 10-2 anddescribed below. For simplicity, and unless otherwise noted, the trends reported here referto differences between the first (1981-1985) and last period (1997-2001) of this study.
Canada: At the national level, Energy Inputincreased by 16% (50 PJ) while Energy Outputrose by 13% (78 PJ). The result was an overalldecrease of 3% in the Energy Use EfficiencyRatio.
British Columbia: Energy Input increased by37% (9 PJ) while Energy Output increased only4% (0.4 PJ). The Energy Use Efficiency Ratiodecreased by 24%.
Alberta: Energy Input increased by 8% (7 PJ)while Energy Output rose by 14% (21 PJ). TheEnergy Use Efficiency Ratio increased by 5%.
Saskatchewan: Energy Input increased by 30%(21 PJ) while Energy Output increased only 8%(20 PJ). The Energy Use Efficiency Ratiodecreased by 19%.
Environmental Sustainability of Canadian Agriculture: Agri-Environmental Indicator Report Series—Report #2
Apples Corn (fresh) Milk Rye
Barley Cucumbers Oats Soybeans
Beef Durum Onions Spring wheat
Blueberries Eggs Peaches Strawberries
Canola Field peas Pears Tomatoes
Carrot Flaxseed Peas Turkey
Cauliflower Grapes Pork Winter wheat
Chicken Lentils Potatoes
Corn (for grain) Lettuce Raspberries
Table 10-1: Agricultural commodities included in the Energy Output calculations
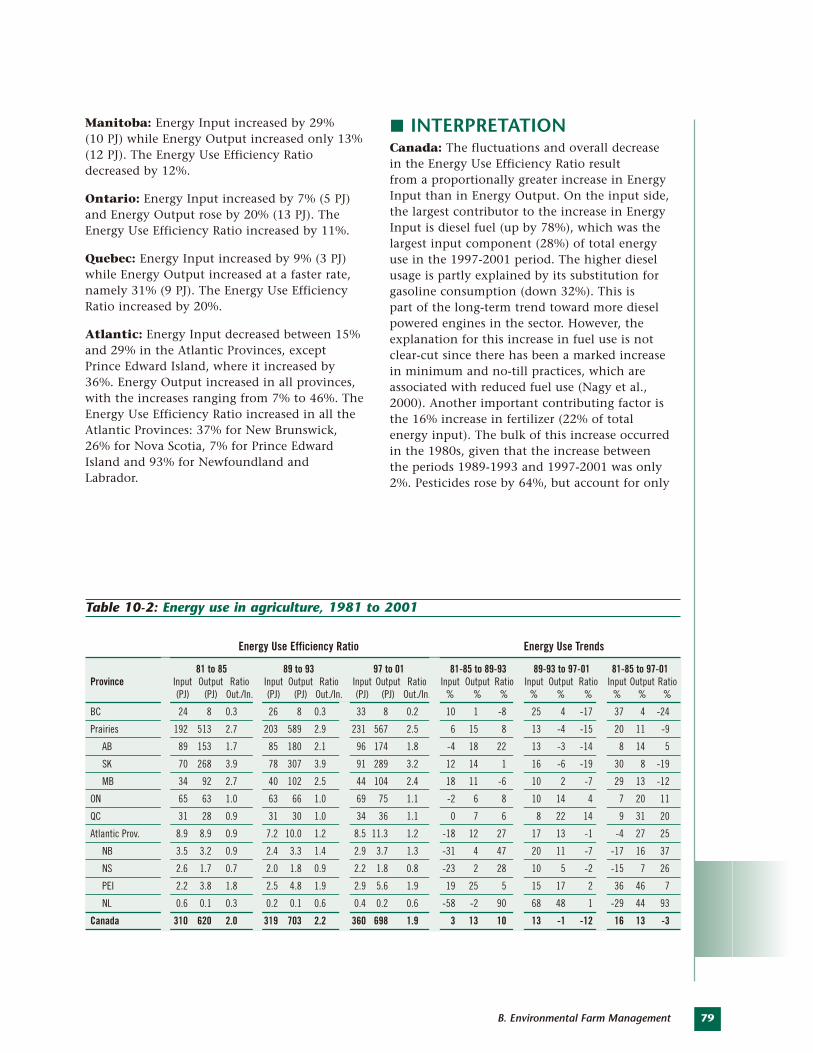
79B. Environmental Farm Management
Energy Use Efficiency Ratio Energy Use Trends
81 to 85 89 to 93 97 to 01 81-85 to 89-93 89-93 to 97-01 81-85 to 97-01Province Input Output Ratio Input Output Ratio Input Output Ratio Input Output Ratio Input Output Ratio Input Output Ratio
(PJ) (PJ) Out./In. (PJ) (PJ) Out./In. (PJ) (PJ) Out./In. % % % % % % % % %
BC 24 8 0.3 26 8 0.3 33 8 0.2 10 1 -8 25 4 -17 37 4 -24
Prairies 192 513 2.7 203 589 2.9 231 567 2.5 6 15 8 13 -4 -15 20 11 -9
AB 89 153 1.7 85 180 2.1 96 174 1.8 -4 18 22 13 -3 -14 8 14 5
SK 70 268 3.9 78 307 3.9 91 289 3.2 12 14 1 16 -6 -19 30 8 -19
MB 34 92 2.7 40 102 2.5 44 104 2.4 18 11 -6 10 2 -7 29 13 -12
ON 65 63 1.0 63 66 1.0 69 75 1.1 -2 6 8 10 14 4 7 20 11
QC 31 28 0.9 31 30 1.0 34 36 1.1 0 7 6 8 22 14 9 31 20
Atlantic Prov. 8.9 8.9 0.9 7.2 10.0 1.2 8.5 11.3 1.2 -18 12 27 17 13 -1 -4 27 25
NB 3.5 3.2 0.9 2.4 3.3 1.4 2.9 3.7 1.3 -31 4 47 20 11 -7 -17 16 37
NS 2.6 1.7 0.7 2.0 1.8 0.9 2.2 1.8 0.8 -23 2 28 10 5 -2 -15 7 26
PEI 2.2 3.8 1.8 2.5 4.8 1.9 2.9 5.6 1.9 19 25 5 15 17 2 36 46 7
NL 0.6 0.1 0.3 0.2 0.1 0.6 0.4 0.2 0.6 -58 -2 90 68 48 1 -29 44 93
Canada 310 620 2.0 319 703 2.2 360 698 1.9 3 13 10 13 -1 -12 16 13 -3
Table 10-2: Energy use in agriculture, 1981 to 2001
Manitoba: Energy Input increased by 29% (10 PJ) while Energy Output increased only 13%(12 PJ). The Energy Use Efficiency Ratiodecreased by 12%.
Ontario: Energy Input increased by 7% (5 PJ)and Energy Output rose by 20% (13 PJ). TheEnergy Use Efficiency Ratio increased by 11%.
Quebec: Energy Input increased by 9% (3 PJ)while Energy Output increased at a faster rate,namely 31% (9 PJ). The Energy Use EfficiencyRatio increased by 20%.
Atlantic: Energy Input decreased between 15%and 29% in the Atlantic Provinces, except Prince Edward Island, where it increased by36%. Energy Output increased in all provinces,with the increases ranging from 7% to 46%. TheEnergy Use Efficiency Ratio increased in all theAtlantic Provinces: 37% for New Brunswick,26% for Nova Scotia, 7% for Prince EdwardIsland and 93% for Newfoundland andLabrador.
INTERPRETATIONCanada: The fluctuations and overall decreasein the Energy Use Efficiency Ratio result from a proportionally greater increase in EnergyInput than in Energy Output. On the input side,the largest contributor to the increase in EnergyInput is diesel fuel (up by 78%), which was thelargest input component (28%) of total energyuse in the 1997-2001 period. The higher dieselusage is partly explained by its substitution forgasoline consumption (down 32%). This is part of the long-term trend toward more dieselpowered engines in the sector. However, theexplanation for this increase in fuel use is notclear-cut since there has been a marked increasein minimum and no-till practices, which areassociated with reduced fuel use (Nagy et al.,2000). Another important contributing factor isthe 16% increase in fertilizer (22% of totalenergy input). The bulk of this increase occurredin the 1980s, given that the increase betweenthe periods 1989-1993 and 1997-2001 was only2%. Pesticides rose by 64%, but account for only
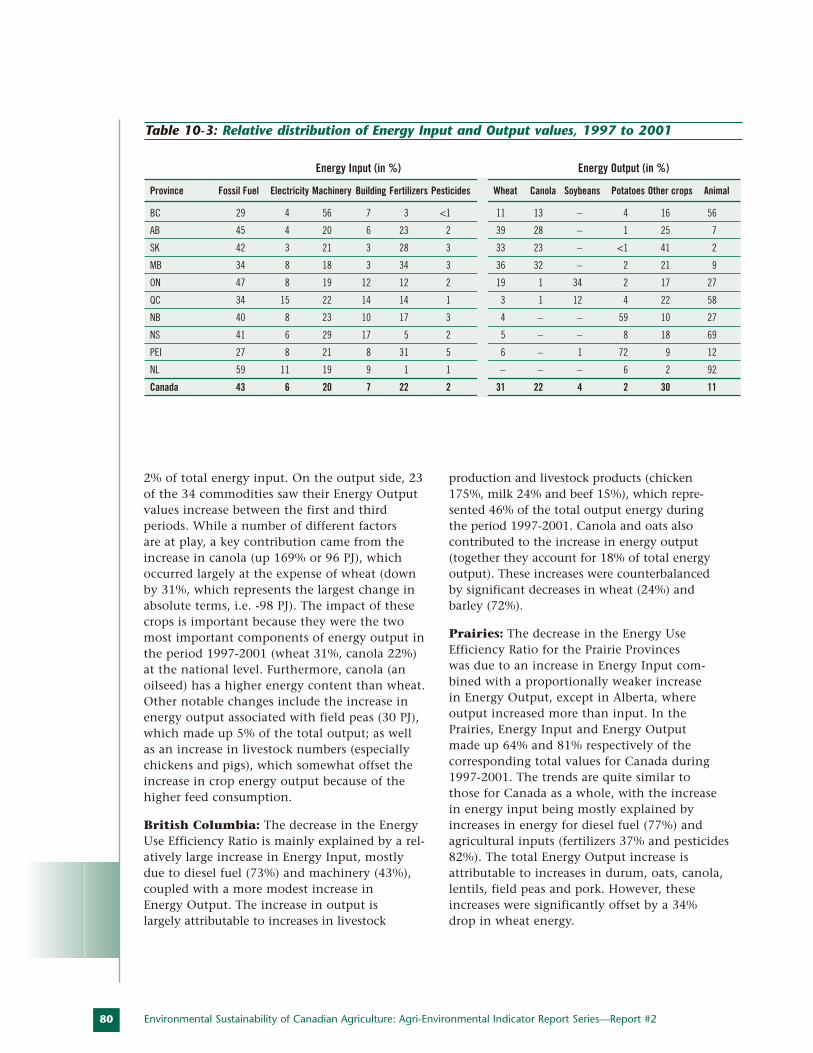
80
2% of total energy input. On the output side, 23of the 34 commodities saw their Energy Outputvalues increase between the first and third periods. While a number of different factors are at play, a key contribution came from theincrease in canola (up 169% or 96 PJ), whichoccurred largely at the expense of wheat (downby 31%, which represents the largest change inabsolute terms, i.e. -98 PJ). The impact of thesecrops is important because they were the twomost important components of energy output inthe period 1997-2001 (wheat 31%, canola 22%)at the national level. Furthermore, canola (anoilseed) has a higher energy content than wheat.Other notable changes include the increase inenergy output associated with field peas (30 PJ),which made up 5% of the total output; as wellas an increase in livestock numbers (especiallychickens and pigs), which somewhat offset theincrease in crop energy output because of thehigher feed consumption.
British Columbia: The decrease in the EnergyUse Efficiency Ratio is mainly explained by a rel-atively large increase in Energy Input, mostlydue to diesel fuel (73%) and machinery (43%),coupled with a more modest increase in Energy Output. The increase in output is largely attributable to increases in livestock
production and livestock products (chicken175%, milk 24% and beef 15%), which repre-sented 46% of the total output energy during the period 1997-2001. Canola and oats also contributed to the increase in energy output(together they account for 18% of total energyoutput). These increases were counterbalanced by significant decreases in wheat (24%) and barley (72%).
Prairies: The decrease in the Energy UseEfficiency Ratio for the Prairie Provinces was due to an increase in Energy Input com-bined with a proportionally weaker increase in Energy Output, except in Alberta, where output increased more than input. In thePrairies, Energy Input and Energy Output made up 64% and 81% respectively of the corresponding total values for Canada during1997-2001. The trends are quite similar to those for Canada as a whole, with the increasein energy input being mostly explained byincreases in energy for diesel fuel (77%) andagricultural inputs (fertilizers 37% and pesticides82%). The total Energy Output increase is attributable to increases in durum, oats, canola,lentils, field peas and pork. However, theseincreases were significantly offset by a 34% drop in wheat energy.
Environmental Sustainability of Canadian Agriculture: Agri-Environmental Indicator Report Series—Report #2
Energy Input (in %) Energy Output (in %)
Province Fossil Fuel Electricity Machinery Building Fertilizers Pesticides Wheat Canola Soybeans Potatoes Other crops Animal
BC 29 4 56 7 3 <1 11 13 – 4 16 56
AB 45 4 20 6 23 2 39 28 – 1 25 7
SK 42 3 21 3 28 3 33 23 – <1 41 2
MB 34 8 18 3 34 3 36 32 – 2 21 9
ON 47 8 19 12 12 2 19 1 34 2 17 27
QC 34 15 22 14 14 1 3 1 12 4 22 58
NB 40 8 23 10 17 3 4 – – 59 10 27
NS 41 6 29 17 5 2 5 – – 8 18 69
PEI 27 8 21 8 31 5 6 – 1 72 9 12
NL 59 11 19 9 1 1 – – – 6 2 92
Canada 43 6 20 7 22 2 31 22 4 2 30 11
Table 10-3: Relative distribution of Energy Input and Output values, 1997 to 2001
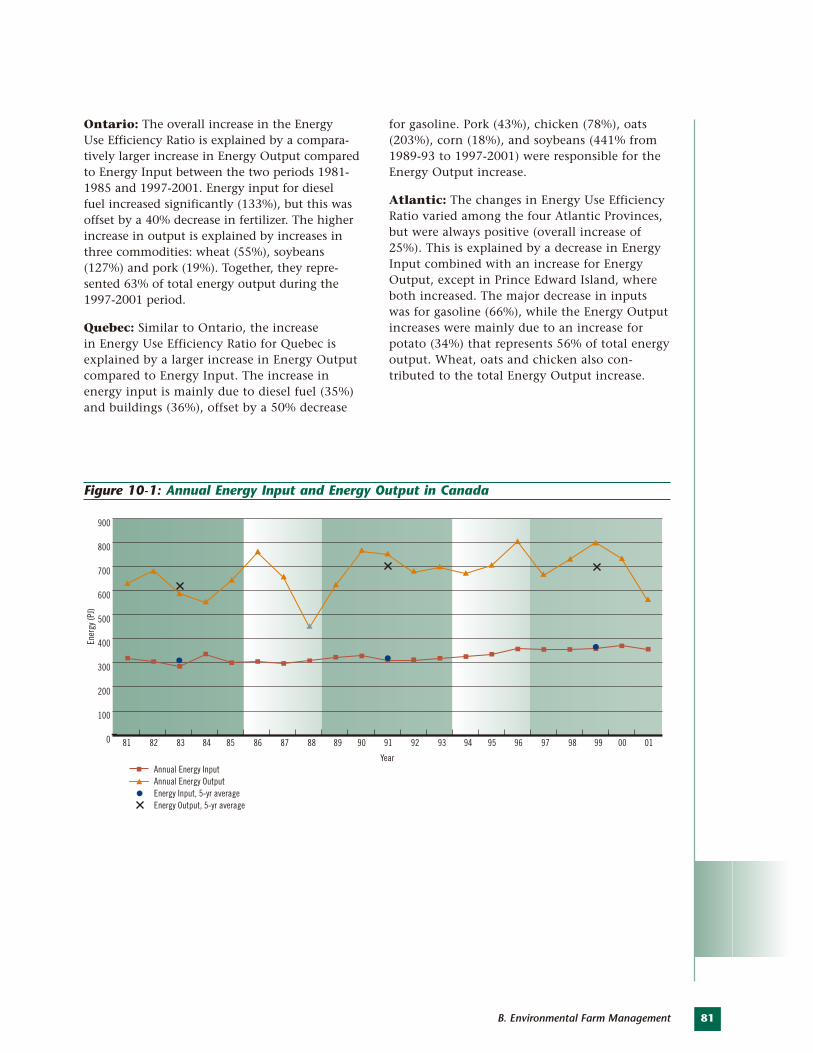
81B. Environmental Farm Management
Ontario: The overall increase in the Energy Use Efficiency Ratio is explained by a compara-tively larger increase in Energy Output comparedto Energy Input between the two periods 1981-1985 and 1997-2001. Energy input for diesel fuel increased significantly (133%), but this wasoffset by a 40% decrease in fertilizer. The higherincrease in output is explained by increases inthree commodities: wheat (55%), soybeans(127%) and pork (19%). Together, they repre-sented 63% of total energy output during the1997-2001 period.
Quebec: Similar to Ontario, the increase in Energy Use Efficiency Ratio for Quebec isexplained by a larger increase in Energy Outputcompared to Energy Input. The increase inenergy input is mainly due to diesel fuel (35%)and buildings (36%), offset by a 50% decrease
for gasoline. Pork (43%), chicken (78%), oats(203%), corn (18%), and soybeans (441% from1989-93 to 1997-2001) were responsible for theEnergy Output increase.
Atlantic: The changes in Energy Use EfficiencyRatio varied among the four Atlantic Provinces,but were always positive (overall increase of25%). This is explained by a decrease in EnergyInput combined with an increase for EnergyOutput, except in Prince Edward Island, whereboth increased. The major decrease in inputswas for gasoline (66%), while the Energy Outputincreases were mainly due to an increase forpotato (34%) that represents 56% of total energyoutput. Wheat, oats and chicken also con-tributed to the total Energy Output increase.
Figure 10-1: Annual Energy Input and Energy Output in Canada
81 82 83
Ener
gy (P
J)
84 85 86 87 88 89 90 91 92 93 94 95 96 97 98 99 00 010
100
200
300
400
500
600
700
800
900
Annual Energy InputAnnual Energy OutputEnergy Input, 5-yr averageEnergy Output, 5-yr average
Year
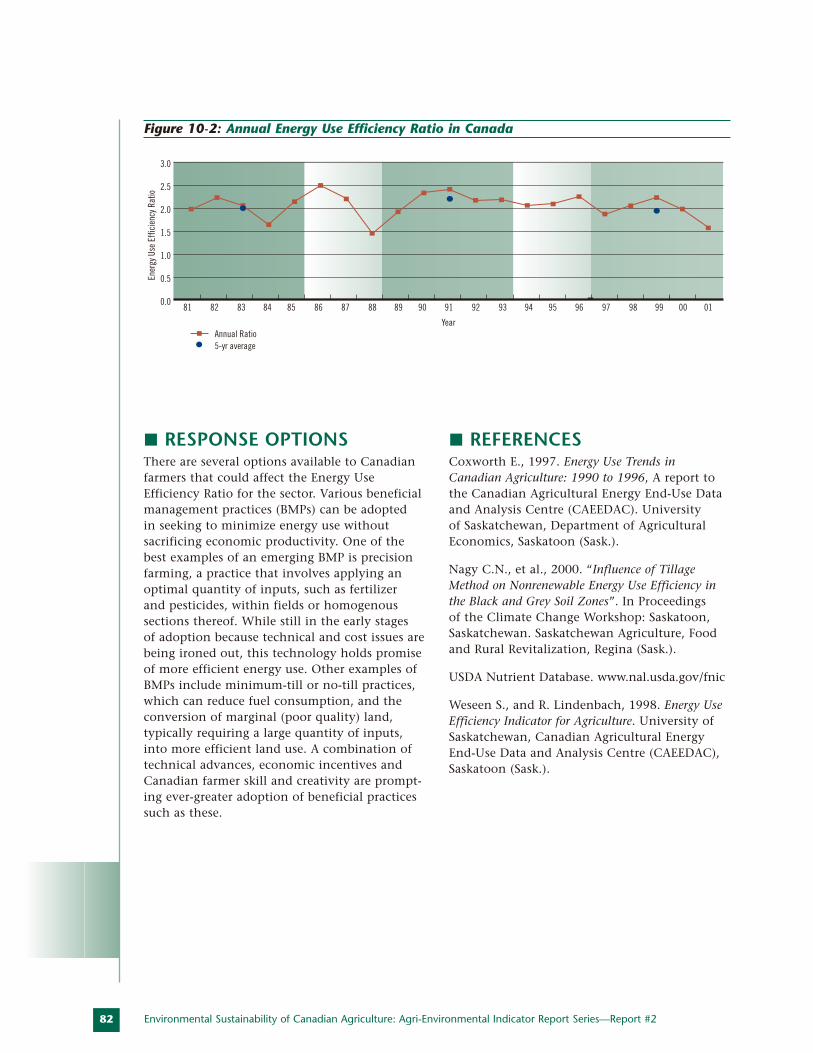
82
RESPONSE OPTIONSThere are several options available to Canadianfarmers that could affect the Energy UseEfficiency Ratio for the sector. Various beneficialmanagement practices (BMPs) can be adopted in seeking to minimize energy use without sacrificing economic productivity. One of thebest examples of an emerging BMP is precisionfarming, a practice that involves applying anoptimal quantity of inputs, such as fertilizer and pesticides, within fields or homogenous sections thereof. While still in the early stages of adoption because technical and cost issues arebeing ironed out, this technology holds promiseof more efficient energy use. Other examples ofBMPs include minimum-till or no-till practices,which can reduce fuel consumption, and theconversion of marginal (poor quality) land, typically requiring a large quantity of inputs,into more efficient land use. A combination oftechnical advances, economic incentives andCanadian farmer skill and creativity are prompt-ing ever-greater adoption of beneficial practicessuch as these.
REFERENCES Coxworth E., 1997. Energy Use Trends inCanadian Agriculture: 1990 to 1996, A report tothe Canadian Agricultural Energy End-Use Dataand Analysis Centre (CAEEDAC). University of Saskatchewan, Department of AgriculturalEconomics, Saskatoon (Sask.).
Nagy C.N., et al., 2000. “Influence of TillageMethod on Nonrenewable Energy Use Efficiency inthe Black and Grey Soil Zones”. In Proceedings of the Climate Change Workshop: Saskatoon,Saskatchewan. Saskatchewan Agriculture, Foodand Rural Revitalization, Regina (Sask.).
USDA Nutrient Database. www.nal.usda.gov/fnic
Weseen S., and R. Lindenbach, 1998. Energy UseEfficiency Indicator for Agriculture. University ofSaskatchewan, Canadian Agricultural EnergyEnd-Use Data and Analysis Centre (CAEEDAC),Saskatoon (Sask.).
Environmental Sustainability of Canadian Agriculture: Agri-Environmental Indicator Report Series—Report #2
Figure 10-2: Annual Energy Use Efficiency Ratio in Canada
81 82 83
Ener
gy U
se E
ffici
ency
Rat
io
84 85 86 87 88 89 90 91 92 93 94 95 96 97 98 99 00 01
Annual Ratio5-yr average
0.0
0.5
1.0
1.5
2.0
2.5
3.0
Year
THE ISSUEIrrigation or the artificial watering of the landmay have both beneficial and harmful effects on the environment. Positive effects includegroundwater recharge, regula-tion of run-off and floodcontrol, re-use of water, protec-tion against soil erosion andcreation of wildlife habitatwith increased biodiversity.Harmful effects may includesoil salinization and water-logging, damage to riverecosystems from decreasedflows, reduced water qualityand pollution due to greaterinput use and transport of contaminants (Redaud 1998).
Irrigation is used in semi-aridregions of Canada such as thePrairie Provinces and, duringdry years, in the more humidregions of central and Atlantic Canada, whenwater supplies are insufficient to meet croprequirements. The high cost of developing new water sources limits creation of new watersupplies. This can potentially lead to trade-offs and even conflicts between agricultural production and other water uses. Where theseconstraints persist, the result may be reducedagricultural production, lower water supply forall users and a reduction in water quality (Wolffand Stein 1999).
THE INDICATOR A Water Use Efficiency Indicator for Irrigation is currently being developed to assess the use offreshwater resources for irrigation and the mass
production and economic pro-ductivity of the water used forthat purpose. This indicatorencompasses three sub-indicators:
• Water Use Intensity (WUI):to measure annual abstrac-tion (irrigation relative to renewable freshwaterresources) and set the context for the othertwo sub-indicators;
• Water Use TechnicalEfficiency (WUTE): to assess the production efficiency of irrigationwater used directly in crop production; and
• Water Use Economic Efficiency (WUEE): toassess the value of agricultural productionper unit volume of irrigation water useddirectly for crops.
CALCULATION METHOD During the initial testing phase of indicatordevelopment, the Water Use Intensity Indicator(WUI) will be calculated using the national esti-mates for irrigation water use and for freshwaterresources compiled by Statistics Canada. Themethod used to estimate irrigation water useand return flow will be refined to provide accurate indicator values valid across Canada.
SUMMARYThe agriculture sector faces increasing competition from other water users for water resources. The greatest
use of agricultural water is for irrigation. An indicator is currently being developed to quantify the use of
freshwater resources for irrigation and to assess the efficiency of this practice. The Water Use Efficiency
Indicator for Irrigation is comprised of three sub-indicators: Water Use Intensity, Water Use Technical
Efficiency and Water Use Economic Efficiency. A method for calculating these indicators has been suggested
using a pilot area approach as a starting point.
83B. Environmental Farm Management
AUTHORS:
L. Tollefson and J. Harrington
INDICATOR NAME:
Water UseEfficiency Indicatorfor Irrigation
STATUS:
Currently underdevelopment
11. Water Use Efficiency: Irrigation
A Water Use Efficiency
Indicator for Irrigation
is currently being
developed to assess the
use of freshwater
resources for irrigation
and the mass
production and
economic productivity
of the water used for
that purpose.
84
The Water Use Technical Efficiency (WUTE) sub-indicator will then be calculated as the massof agricultural production of selected crops perunit volume of water extracted or diverted for irrigation, minus return flows. Three proxy crops will be used for estimating WUTE (potato,hard red spring wheat and alfalfa). They willprovide a basis for national comparison and for comparison with rainfed yields if required.
The Water Use Economic Efficiency (WUEE) sub-indicator will be calculated as the value ofcrop production (all crops) per unit volume of irrigation water used.
The sub-indicators will be reported at a watershed, regional, provincial or national scale.
LIMITATIONSAt the heart of the water use indicators is thecollection of reliable water data on a large scale.Existing water use data in Canada are often ofpoor quality and must be compiled from differ-ent sources. Some data are derived from primaryestimates (measurements by the investigator)while other data will come from secondarysources (modelling, indirect estimates, etc.).Initially, gaps in the data will be overcome bymaking reasoned assumptions. As the indicatorsevolve, means of acquiring data through fieldmeasurements, weather-based models or remotesensing will be developed. Other challenges to indicator development lie in the scaling-up of information to the provincial and nationallevels, the uncertainties in regional water andcrop estimates and the variability in price information.
RESULTSThis indicator is currently under development.Results are not yet available.
RESPONSE OPTIONS In the long term, these sub-indicators will be sensitive to changes in farm-level managementpractices, such as agronomic advances (improvedvarieties, efficient input use), improved irrigationmanagement (irrigation scheduling, system type),on-farm water management (mulches, avoidinghigh evapo-transpiration periods) and adoptionof new technology (laser levelling, water savingsystems). The indicators will also respond toregional (e.g. irrigation districts) changes in watermanagement, such as improved infrastructureoperation and maintenance, re-allocation ofwater to higher-value crops or uses, water pricing,improved management skills as a result of farmer training and advances in forecasting crop water requirements as well as water conservation methods.
REFERENCESBurt, C.M., A.J. Clemmens, and K.H. Solomon,1995. “Identification and Quantification ofEfficiency and Uniformity Components”. Pages1526-1530 in Proceedings of the ASCE WaterConference in San Antonio, Texas (WaterResources Engineering), ITRC Paper No. 95-005.
Redaud, J.L., 1998. “Indicators to Measure theImpact of Agriculture on Water Use: Pricing andCost of Water Services”. In Proceedings of: The Sustainable Management of Water inAgriculture: Issues and Policies – The AthensWorkshop. OECD, Paris (France).
Wells, C. and A. Barber, 1998. Field TestingIndicators of Sustainable Irrigated Agriculture Study. Policy Technical Paper 00/04, NewZealand Ministry of Agriculture and Forestry,Wellington (NZ).
Environmental Sustainability of Canadian Agriculture: Agri-Environmental Indicator Report Series—Report #2
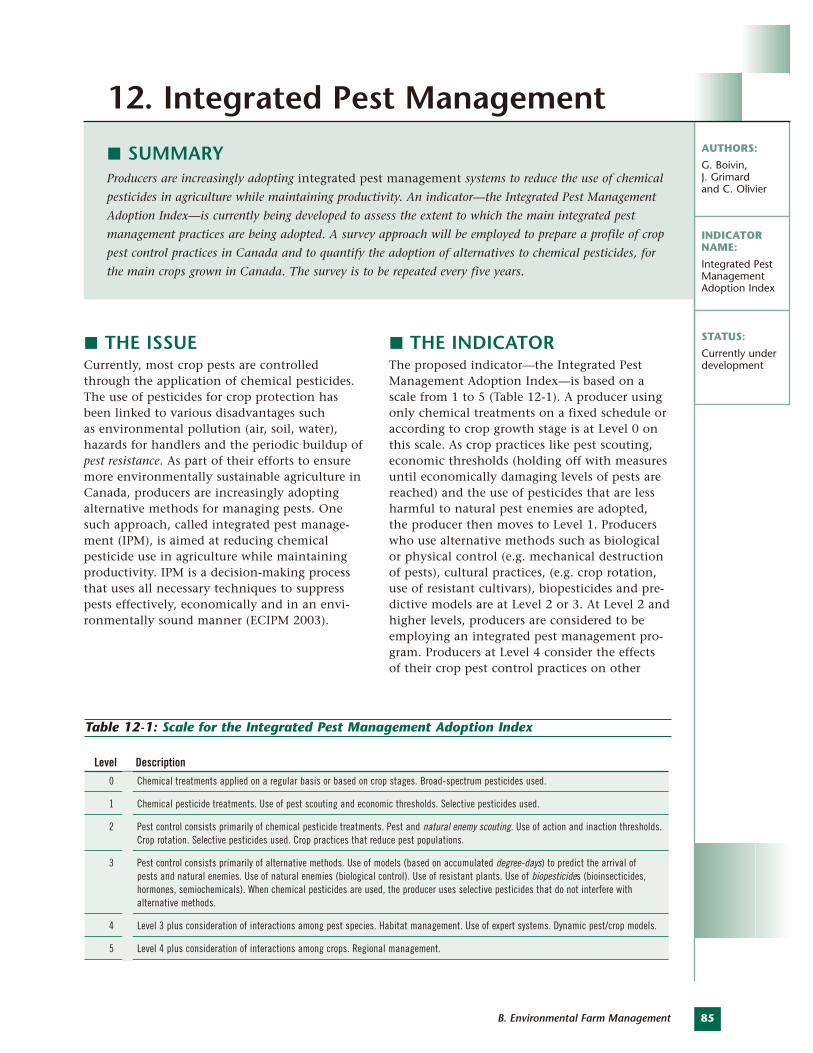
THE ISSUECurrently, most crop pests are controlledthrough the application of chemical pesticides. The use of pesticides for crop protection hasbeen linked to various disadvantages such as environmental pollution (air, soil, water),hazards for handlers and the periodic buildup ofpest resistance. As part of their efforts to ensuremore environmentally sustainable agriculture inCanada, producers are increasingly adoptingalternative methods for managing pests. Onesuch approach, called integrated pest manage-ment (IPM), is aimed at reducing chemicalpesticide use in agriculture while maintainingproductivity. IPM is a decision-making processthat uses all necessary techniques to suppresspests effectively, economically and in an envi-ronmentally sound manner (ECIPM 2003).
THE INDICATORThe proposed indicator—the Integrated PestManagement Adoption Index—is based on ascale from 1 to 5 (Table 12-1). A producer usingonly chemical treatments on a fixed schedule oraccording to crop growth stage is at Level 0 onthis scale. As crop practices like pest scouting,economic thresholds (holding off with measuresuntil economically damaging levels of pests arereached) and the use of pesticides that are lessharmful to natural pest enemies are adopted, the producer then moves to Level 1. Producerswho use alternative methods such as biologicalor physical control (e.g. mechanical destructionof pests), cultural practices, (e.g. crop rotation,use of resistant cultivars), biopesticides and pre-dictive models are at Level 2 or 3. At Level 2 andhigher levels, producers are considered to beemploying an integrated pest management pro-gram. Producers at Level 4 consider the effectsof their crop pest control practices on other
SUMMARYProducers are increasingly adopting integrated pest management systems to reduce the use of chemical
pesticides in agriculture while maintaining productivity. An indicator—the Integrated Pest Management
Adoption Index—is currently being developed to assess the extent to which the main integrated pest
management practices are being adopted. A survey approach will be employed to prepare a profile of crop
pest control practices in Canada and to quantify the adoption of alternatives to chemical pesticides, for
the main crops grown in Canada. The survey is to be repeated every five years.
85B. Environmental Farm Management
AUTHORS:
G. Boivin, J. Grimard and C. Olivier
INDICATOR NAME:
Integrated PestManagementAdoption Index
STATUS:
Currently underdevelopment
12. Integrated Pest Management
Level Description
0 Chemical treatments applied on a regular basis or based on crop stages. Broad-spectrum pesticides used.
1 Chemical pesticide treatments. Use of pest scouting and economic thresholds. Selective pesticides used.
2 Pest control consists primarily of chemical pesticide treatments. Pest and natural enemy scouting. Use of action and inaction thresholds.Crop rotation. Selective pesticides used. Crop practices that reduce pest populations.
3 Pest control consists primarily of alternative methods. Use of models (based on accumulated degree-days) to predict the arrival of pests and natural enemies. Use of natural enemies (biological control). Use of resistant plants. Use of biopesticides (bioinsecticides, hormones, semiochemicals). When chemical pesticides are used, the producer uses selective pesticides that do not interfere with alternative methods.
4 Level 3 plus consideration of interactions among pest species. Habitat management. Use of expert systems. Dynamic pest/crop models.
5 Level 4 plus consideration of interactions among crops. Regional management.
Table 12-1: Scale for the Integrated Pest Management Adoption Index
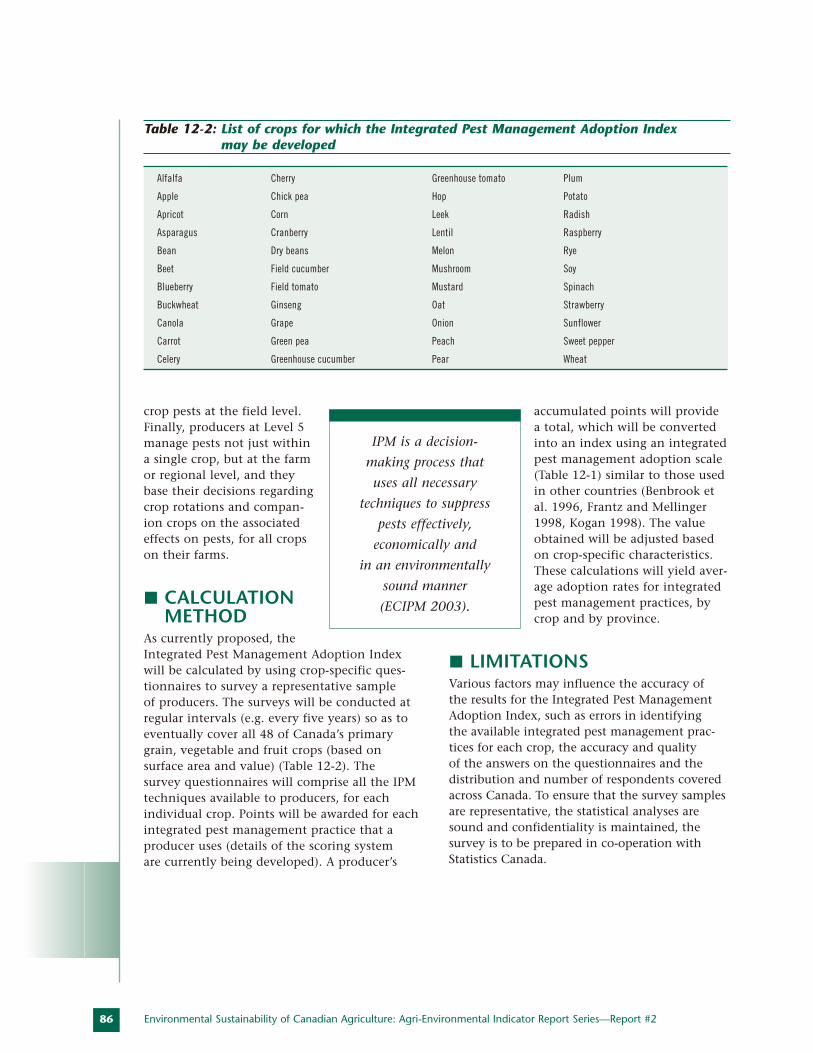
86
crop pests at the field level.Finally, producers at Level 5manage pests not just withina single crop, but at the farmor regional level, and theybase their decisions regardingcrop rotations and compan-ion crops on the associated effects on pests, for all cropson their farms.
CALCULATIONMETHOD
As currently proposed, theIntegrated Pest Management Adoption Indexwill be calculated by using crop-specific ques-tionnaires to survey a representative sample of producers. The surveys will be conducted atregular intervals (e.g. every five years) so as toeventually cover all 48 of Canada’s primarygrain, vegetable and fruit crops (based on surface area and value) (Table 12-2). The survey questionnaires will comprise all the IPMtechniques available to producers, for each individual crop. Points will be awarded for eachintegrated pest management practice that a producer uses (details of the scoring system are currently being developed). A producer’s
accumulated points will provide a total, which will be convertedinto an index using an integratedpest management adoption scale(Table 12-1) similar to those usedin other countries (Benbrook etal. 1996, Frantz and Mellinger1998, Kogan 1998). The valueobtained will be adjusted basedon crop-specific characteristics.These calculations will yield aver-age adoption rates for integratedpest management practices, bycrop and by province.
LIMITATIONSVarious factors may influence the accuracy of the results for the Integrated Pest ManagementAdoption Index, such as errors in identifying the available integrated pest management prac-tices for each crop, the accuracy and quality of the answers on the questionnaires and the distribution and number of respondents coveredacross Canada. To ensure that the survey samplesare representative, the statistical analyses aresound and confidentiality is maintained, the survey is to be prepared in co-operation withStatistics Canada.
Environmental Sustainability of Canadian Agriculture: Agri-Environmental Indicator Report Series—Report #2
Alfalfa Cherry Greenhouse tomato Plum
Apple Chick pea Hop Potato
Apricot Corn Leek Radish
Asparagus Cranberry Lentil Raspberry
Bean Dry beans Melon Rye
Beet Field cucumber Mushroom Soy
Blueberry Field tomato Mustard Spinach
Buckwheat Ginseng Oat Strawberry
Canola Grape Onion Sunflower
Carrot Green pea Peach Sweet pepper
Celery Greenhouse cucumber Pear Wheat
Table 12-2: List of crops for which the Integrated Pest Management Adoption Index may be developed
IPM is a decision-
making process that
uses all necessary
techniques to suppress
pests effectively,
economically and
in an environmentally
sound manner
(ECIPM 2003).
87B. Environmental Farm Management
RESULTSThis indicator is currently under developmentand results are not yet available.
RESPONSE OPTIONSWhen fully developed, this indicator will assesschanges in the adoption of IPM systems by producers. An increase in the level of adoptionof integrated pest management over the yearswould show that producers are successfullyadopting alternatives to chemical pesticides. If the adoption level is considered to be unsatis-factory, the underlying information will aid in determining whether the low adoption levelis connected with a lack of viable alternativemethods (necessitating research efforts), limitedavailability (requiring marketing) or insufficientinformation for producers (necessitating exten-sion). The survey approach may make producersaware of the alternative pest management methods that are available for their crops andmay encourage them to adopt such measures.
REFERENCESBenbrook, C.M., E. Groth III, J.M. Halloren, M.K. Hansen, and S. Marquardt, 1966. PestManagement at the Crossroads. Consumers Union, Yonkers (N.Y.).
ECIPM (Expert Committee on Integrated PestManagement), 2003. Resources on IPM (Web site).www.carc-crac.ca/english/ECIPM/ ecipm.htm
Frantz, G. and H.C. Mellinger, 1998. “MeasuringIntegrated Pest Management Adoption in SouthFlorida Vegetable Crops”. Paper No. 132,Proceedings of the Annual Meeting of theFlorida State Horticultural Society, Vol. 111, pp. 1-15.

CSoil Quality
THE ISSUERainfall and surface run-off are the drivingforces for water-induced soil erosion. Springmeltwaters and heavy summer storms have the greatest potential for causing water erosion;however, water erosion can occur any time, contributing to large soil losses from farm fieldsover time and soil degradation. Eroded soil iscarried in run-off to agricultural drains, ditchesand other waterways, where it can affect waterquality, given that suspended soil particles
increase the turbidity (cloudiness) of the waterand add to sediment build-up. This sedimenta-tion may reduce the water’s suitability as habitatfor fish and other aquatic organisms, alter theflow of the water and eventually clog channels,making clean-up necessary. In addition, cropnutrients, pesticides and bacteria are oftenattached to the eroding soil particles and so are also carried into water bodies, adding to thewater quality impacts. Curtailing water erosioncan help to protect both soil and water quality.
SUMMARYSoil erosion, the movement of soil from one area to another, occurs through three main processes. It occurs
naturally on cropland through the action of wind and water, which can be accelerated by some farming
activities (e.g. summerfallow, row cropping). It is also caused directly by the farming practice of tillage,
which causes the progressive downslope movement of soil, resulting in soil loss from hilltops and soil
accumulation at the base of hills. Soil erosion is a major threat to the sustainability of agriculture in
Canada. It removes topsoil, reduces soil organic matter and contributes to the breakdown of soil structure.
These effects in turn adversely affect soil fertility, the movement of water into and from the soil surface
and ultimately crop yields and profitability. Yields from severely eroded soils may be substantially lower
than those from stable soil in the same field. Erosion can also have significant “off-site” adverse impacts
on the environment through the physical transport and deposition of soil particles and through the nutri-
ents, pesticides, pathogens and toxins that are released by erosive processes or carried by eroded sediments.
This chapter deals with three distinct indicators that are used to assess the risk of soil erosion by the
action of water, wind and tillage.
90 Environmental Sustainability of Canadian Agriculture: Agri-Environmental Indicator Report Series—Report #2
13. Soil Erosion
SUMMARYSoil erosion by water has long been recognized as a serious threat to agricultural sustainability in Canada,
albeit to a lesser extent on the Prairies. Results from the Risk of Water Erosion Indicator point to an overall
decrease in water erosion risk in most provinces of Canada, between 1981 and 2001, contributing to a
national decrease of 8%. This positive trend resulted mostly from changes in cropping measures and the
increased use of conservation tillage and no-till. In 2001, 86% of cropland in Canada exhibited sustainable
levels of erosion (very low risk class). The remaining 14% of Canadian cropland, which is still subject to
unsustainable water erosion, typically consists of areas used for summerfallow and row cropping on
sloping land.
AUTHORS:
L.J.P van Vliet,G.A. Padbury,
H.W. Rees and M.A. Matin
INDICATOR NAME:
Risk of WaterErosion
STATUS:
National coverage,
1981 to 2001
A) Water Erosion
91C. Soil Quality
THE INDICATORThe Risk of Water Erosion Indicator is used toidentify areas at risk of significant water erosionand to assess how this risk is changing over timeunder prevailing management practices. Thisrisk is expressed in five classes: very low (lessthan 6 tonnes per hectare per year), low (6 to 11 t ha-1 yr-1), moderate (11 to 22 t ha-1 yr-1),high (22 to 33 t ha-1 yr-1) and very high (greaterthan 33 t ha-1 yr-1). Areas in the very low riskclass are considered, under current conditions,able to sustain long-term crop production andmaintain agri-environmental health. The otherfour classes represent the risk of unsustainableconditions that call for soil con-servation practices to supportcrop production over the longterm as well as to reduceimpacts on water quality. Theperformance objective for thisindicator is to increase the proportion of cropland in the very low risk class.
CALCULATION METHODThe rate of water erosion was estimated usingthe Revised Universal Soil Loss Equation forApplication in Canada (Wall et al. 2002). TheSoil Landscapes of Canada (SLC) maps (version3.0) and its attribute files provided informationon the location of soils in the landscape andcorresponding slope gradient (steepness) andlength, along with soil properties for each mapping area. Data for soil properties, extractedfrom the SLC soil layer files, were used to calculate the inherent erodibility of each soil (K value). Values for the rainfall-run-off factor(R) were tabulated from existing data sources for each SLC mapping area.
The change in rate of water erosion over timewas calculated by considering the effects ofchanges in land use and tillage practices acrossCanada, such as fluctuations in cropland areas,shifts in the types of crops grown and the use of conservation tillage and no-till. Thisinformation was obtained from the Census of Agriculture for 1981, 1986, 1991, 1996 and 2001, and also linked to each SLC mappingarea. The proportion of cropland falling intoeach of the risk classes outlined above was
calculated for Canada and for each province.Changes over time in the percent value for eachclass in each area provides an indication ofwhether the overall risk of erosion is increasingor decreasing.
LIMITATIONSThe indicator is subject to the following limitations:
• calculations did not account for some erosion control practices such as grassedwaterways, strip cropping, terracing, contourcultivation and winter cover crops.
• Census data linked to map-ping areas were assumed tobe equally distributed overthe entire mapping area,because crop types andtillage practices could not be directly linked to specific soil types orlandscape features withineach SLC mapping area.
• Census information is not detailed enoughto reflect the geographic distribution ofmanagement practices in landscapes wherefarmland is fragmented.
• slope lengths were determined for each landform, and did not account for interception of run-off by roadways, field boundaries, ditches, ponds anddrainage ways.
• the indicator is based on long-term averageannual rainfall data that may not reflect single high intensity rainfall events that can cause significant soil erosion.
RESULTSThe risk of water erosion in Canada and in eachprovince is shown for 1981, 1986, 1991, 1996and 2001 in Table 13-1. Figure 13-1 shows thedistribution of the various risk classes inWestern and Eastern Canada in 2001.
Canada: In 2001, 86% of Canadian croplandwas in the very low (tolerable) water erosion risk class, up by 8% from the 1981 level. Hence,
In 2001, 86% of
Canadian cropland was
in the very low water
erosion risk class.
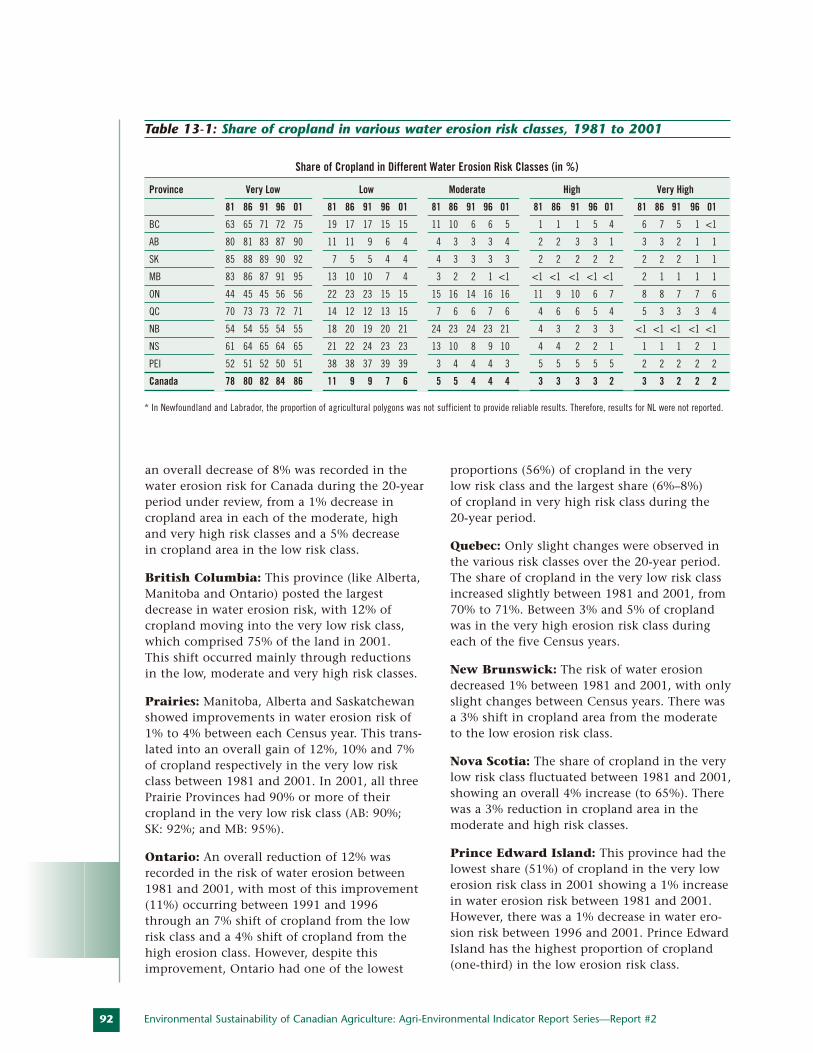
an overall decrease of 8% was recorded in thewater erosion risk for Canada during the 20-yearperiod under review, from a 1% decrease incropland area in each of the moderate, high and very high risk classes and a 5% decrease in cropland area in the low risk class.
British Columbia: This province (like Alberta,Manitoba and Ontario) posted the largestdecrease in water erosion risk, with 12% of cropland moving into the very low risk class,which comprised 75% of the land in 2001. This shift occurred mainly through reductionsin the low, moderate and very high risk classes.
Prairies: Manitoba, Alberta and Saskatchewanshowed improvements in water erosion risk of1% to 4% between each Census year. This trans-lated into an overall gain of 12%, 10% and 7%of cropland respectively in the very low riskclass between 1981 and 2001. In 2001, all threePrairie Provinces had 90% or more of their cropland in the very low risk class (AB: 90%; SK: 92%; and MB: 95%).
Ontario: An overall reduction of 12% wasrecorded in the risk of water erosion between1981 and 2001, with most of this improvement(11%) occurring between 1991 and 1996through an 7% shift of cropland from the lowrisk class and a 4% shift of cropland from thehigh erosion class. However, despite thisimprovement, Ontario had one of the lowest
proportions (56%) of cropland in the very low risk class and the largest share (6%–8%) of cropland in very high risk class during the20-year period.
Quebec: Only slight changes were observed inthe various risk classes over the 20-year period.The share of cropland in the very low risk classincreased slightly between 1981 and 2001, from70% to 71%. Between 3% and 5% of croplandwas in the very high erosion risk class duringeach of the five Census years.
New Brunswick: The risk of water erosiondecreased 1% between 1981 and 2001, with onlyslight changes between Census years. There wasa 3% shift in cropland area from the moderateto the low erosion risk class.
Nova Scotia: The share of cropland in the verylow risk class fluctuated between 1981 and 2001,showing an overall 4% increase (to 65%). Therewas a 3% reduction in cropland area in themoderate and high risk classes.
Prince Edward Island: This province had thelowest share (51%) of cropland in the very lowerosion risk class in 2001 showing a 1% increasein water erosion risk between 1981 and 2001.However, there was a 1% decrease in water ero-sion risk between 1996 and 2001. Prince EdwardIsland has the highest proportion of cropland(one-third) in the low erosion risk class.
92 Environmental Sustainability of Canadian Agriculture: Agri-Environmental Indicator Report Series—Report #2
Share of Cropland in Different Water Erosion Risk Classes (in %)
Province Very Low Low Moderate High Very High
81 86 91 96 01 81 86 91 96 01 81 86 91 96 01 81 86 91 96 01 81 86 91 96 01
BC 63 65 71 72 75 19 17 17 15 15 11 10 6 6 5 1 1 1 5 4 6 7 5 1 <1
AB 80 81 83 87 90 11 11 9 6 4 4 3 3 3 4 2 2 3 3 1 3 3 2 1 1
SK 85 88 89 90 92 7 5 5 4 4 4 3 3 3 3 2 2 2 2 2 2 2 2 1 1
MB 83 86 87 91 95 13 10 10 7 4 3 2 2 1 <1 <1 <1 <1 <1 <1 2 1 1 1 1
ON 44 45 45 56 56 22 23 23 15 15 15 16 14 16 16 11 9 10 6 7 8 8 7 7 6
QC 70 73 73 72 71 14 12 12 13 15 7 6 6 7 6 4 6 6 5 4 5 3 3 3 4
NB 54 54 55 54 55 18 20 19 20 21 24 23 24 23 21 4 3 2 3 3 <1 <1 <1 <1 <1
NS 61 64 65 64 65 21 22 24 23 23 13 10 8 9 10 4 4 2 2 1 1 1 1 2 1
PEI 52 51 52 50 51 38 38 37 39 39 3 4 4 4 3 5 5 5 5 5 2 2 2 2 2
Canada 78 80 82 84 86 11 9 9 7 6 5 5 4 4 4 3 3 3 3 2 3 3 2 2 2
Table 13-1: Share of cropland in various water erosion risk classes, 1981 to 2001
* In Newfoundland and Labrador, the proportion of agricultural polygons was not sufficient to provide reliable results. Therefore, results for NL were not reported.
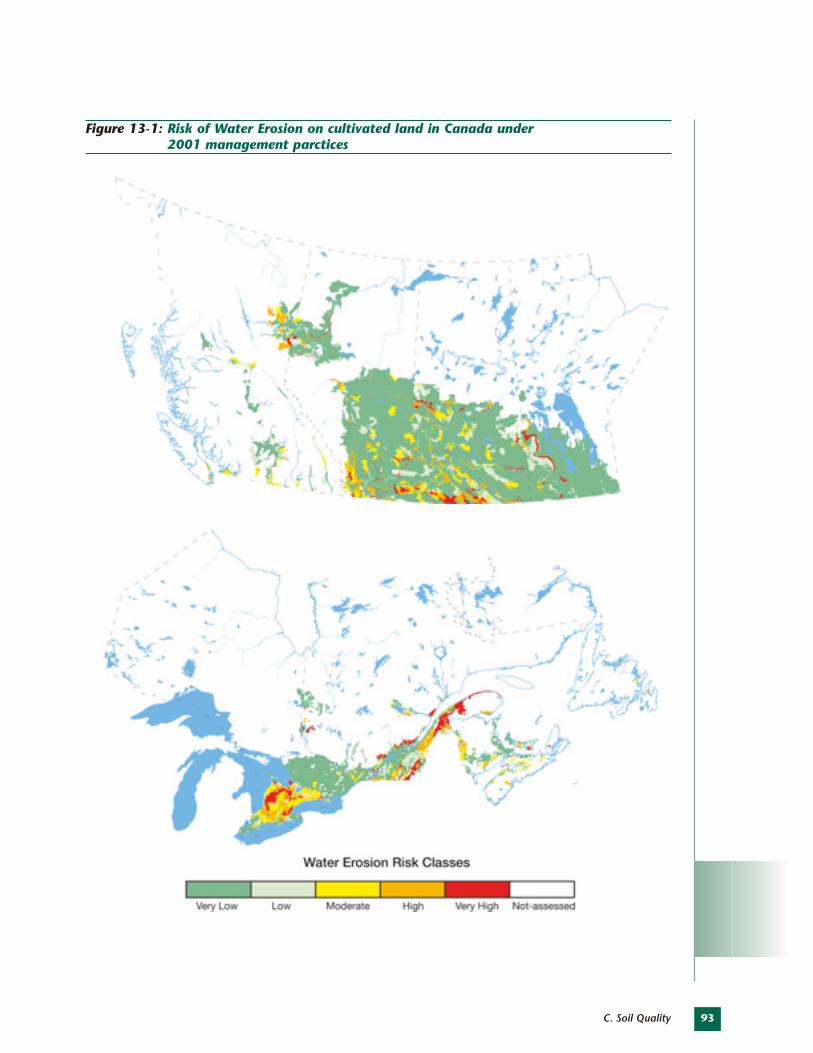
93C. Soil Quality
Figure 13-1: Risk of Water Erosion on cultivated land in Canada under 2001 management parctices
94
Newfoundland and Labrador: Only a fewagricultural map areas were included in theanalysis for Newfoundland and Labrador. A shiftin class by one or two map areas resulted in adramatic change in the share of cropland in thedifferent risk classes. Consequently, the resultswere not reliable and could not be used in the same way as for the other provinces, eachwith several hundreds of map areas. Therefore,results for Newfoundland and Labrador are not reported.
INTERPRETATIONIn the following national and provincial descrip-tions, changes in erosion risk are stated for theperiod 1981 to 2001.
Canada: The general trend of decreasing watererosion risk between 1981 and 2001 in Canadareflects the degree to which changes have beenmade in cropping systems andtillage practices. Despite a netincrease of nearly 0.4 millionhectares in cropland area, acombination of reduced tillage,less-intensive crop production,decreased summerfallow andremoval of marginal land fromproduction all contributed tolower erosion rates. Substantialprogress has been made in the adoption of no-till andconservation tillage since 1981, to the extent that in 2001, 58% of Canadian cropland istilled in a conventional waycompared with approximately100% in 1981. The area in summerfallow hasalso decreased dramatically by just over half.
British Columbia: A combination of reducedtillage, less-intensive crop production anddecreased summerfallow all contributed to the decline in the risk of water erosion. A large increase in cropland area used for alfalfaproduction and the substantial decrease in summerfallow, mainly in the Central Interiorand Peace River regions, more than offset the
higher risk of erosion caused by the intensifica-tion of farming in the South Coastal region.Conservation tillage and no-till were practisedon about 35% of British Columbia’s cropland in 2001.
Prairies: In the Prairies, which account for 85%of Canada’s cropland area, the risk of water ero-sion, already quite low, dropped by between 7%and 12%, because of the growing use of conserva-tion tillage and no-till, the reduced summerfallowarea and shifts in the type of crops grown, while total cropland area remained fairly con-stant. The improvement in erosion risk wasparticularly marked in regions of less-intensiveagriculture, such as the Eastern ContinentalRanges (foothills area) and the Western AlbertaUplands (Grey-Wooded soil zone). Nationally,the Prairie Provinces posted the largest gains in reduced-tillage use. Areas remaining in thehigh and very high risk classes tend to be char-
acterized by erosion-prone soilsand steeper landscapes; they would benefit from greateradoption of conservation practices. In Manitoba, the drop in erosion risk is attributedto a 50% drop in summerfallowand an associated expansion incontinuous cropping as well asto the recent trend of enhancedcrop diversification. This trendhas resulted in more land beingused to produce annual crops,as well as longer rotationsbecause of the inclusion of new crops.
Ontario: This province had one of the smallestproportions of cropland in the very low watererosion risk class and 6% of cropland in the veryhigh risk class, in 2001. Although the overallrisk of erosion dropped substantially (12%), just under half of cropland remained in theunsustainable risk classes (low risk and higher)in 2001, principally owing to the large area inrow crops. Of all provinces in Canada, Ontariohas the highest proportion (over half) of itscropland in row crops, such as corn, soybeansand vegetables. Of all crops, row crops have
Environmental Sustainability of Canadian Agriculture: Agri-Environmental Indicator Report Series—Report #2
A combination of
reduced tillage,
less-intensive crop
production, decreased
summerfallow and
removal of marginal
land from production
all contributed to lower
erosion rates.
95C. Soil Quality
the largest proportion of bare soil and the least amount of crop canopy, which spells poorprotection of soil from raindrop impact and run-off erosion. Ontario’s improved water erosion risk is mainly attributable to the highreduced-tillage adoption rate, which has had apositive effect on the large areas planted to cornand soybeans because of the residues retained.
Quebec: Major shifts in cropland area occurredbetween alfalfa, tame hay and fodder crops and row crops, such as grain corn, soybeans,vegetables and berries, which provide much lesserosion protection. However, the reduced-tillageadoption rate of 20% has generally offset theshift to intensified row crop production. Despitevariable cropland area over the five Census yearsand some shifts in other crops, only smallimprovements have occurred in the risk of watererosion. Still, Quebec has a low overall risk com-pared to other eastern provinces, mainly becauseof its gently rolling agricultural landscapes andless erosive soils.
Atlantic: Of all the provinces, Prince EdwardIsland and New Brunswick had the lowest share of cropland at very low risk of water ero-sion in 2001. Both provinces have a significantproportion of cropland in row crops, mostly inpotatoes (65,000 ha in total). Potatoes are veryerosion-prone, because the exposed soil and limited canopy cover provide little protectionagainst water erosion. Also, decades of continu-ous potato production have reduced the organicmatter content in the surface soil by half, makingthe soils more erodible. Soil erodibility associatedwith spring cereals planted after potatoes isgreater than that associated with spring cerealsplanted after a forage crop.
New Brunswick’s rolling, moderately longslopes and intensive cropping are conducive towater erosion. The high risk lands consist prima-rily of those under potato production in thenorthwest of the province. New Brunswick has arelatively low share of cropland in the very lowrisk class, but less than 1% of its cropland is inthe very high erosion risk class.
The drop in erosion risk for Nova Scotiabetween 1981 and 2001 points to the successfuladoption of conservation tillage and, to a lesserextent, the growing of crops, such as hay andcereal grains, that are less erosion-prone thanrow crops. Nova Scotia tends to receive moreprecipitation than the other Atlantic Provincesand it has a greater potential for erosion by rainfall, snowmelt and winter run-off. It has amuch smaller area of potato production thanNew Brunswick or Prince Edward Island, butlarger areas under vegetables and berries. Theerosive effects of the greater cropland area inberries, grain corn and vegetables in 2001 wereoffset by increases in tame hay area and in con-servation tillage, bringing a small improvementin erosion risk.
Prince Edward Island, the only province withan increase in erosion risk (1%), had less thanhalf of its cropland in the very low risk class,and 7% of cropland was still in the high andvery high erosion risk classes between 1981 and2001. Fine sandy loam soils that erode easily arethe most common. The area of erosion-pronerow crops, particularly potatoes, increased significantly between 1991 and 1996, causing an increase in erosion risk of 2%. However,intensification in cropping was partially offsetby increases in the use of conservation tillage,tame hay and crop rotations. Adoption of no-till remains very limited.
RESPONSE OPTIONSManagement practices that aid in controllingerosion include the following: using conserva-tion tillage and managing crop residues;including forages in rotations; planting rowcrops across the slope or following the land’scontours; strip cropping; growing cover crops;interseeding row crops with other crops, such asred clover; winter cover cropping where soils are at risk of erosion by winter run-off. Moreresearch needs to be done on alternatives to no-till for areas where this practice is not viable,such as areas of intensive horticultural or potatoproduction. Where water erosion is very high,
96
conservation tillage and cropping systems might be inadequate to control erosion and run-off. Erosion control structures, often morecostly and labour-intensive than managementpractices, might be needed. These include terraces, or steps, to reduce slope steepness and length; permanent small earth berms or diversions running along the contours; and grassed waterways, which trap sedimentmoving off the field.
Considering the potential amount of soil loss—calculated by multiplying the share of croplandin each erosion risk class by the erosion rate forthe class, we can estimate that 16% of the totalannual soil loss occurs in the very high riskclass, hence affecting less than 2% of Canada’stotal cropland area. Targeting agronomic andengineering practices to erosion-prone sites insuch areas would help to significantly reducewater erosion in Canada. Soil landscapes inOntario, Prince Edward Island, New Brunswickand Nova Scotia should be the primary focus ofremedial measures, because these areas have thegreatest share of cropland in the unsustainableerosion classes. Furthermore, they are generallythe areas most prone to erosion because of pre-cipitation patterns, intensive row cropping andcrop production on unsuitable slope positions.
Erodible landscapes are often localized and relatively small but they can be major sites of soil loss. These areas are sometimes over-looked in broad-scale conservation programsand they should be targeted through practices,programs and policies tailored to their needs.Such a targeted approach is of crucial impor-tance in the following regions: intensivelycropped areas in Ontario, particularly those in the very high erosion class; potato growingareas on Prince Edward Island, the potato belt of northwestern New Brunswick; and broad areas of Nova Scotia used to grow potatoes, vegetables, grain corn and berries.
REFERENCESWall, G.J., D.R. Coote, E.A. Pringle, and I.J. Shelton (eds), 2002. RUSLEFAC – RevisedUniversal Soil Loss Equation for Application inCanada: A Handbook for Estimating Soil Loss From Water Erosion in Canada. Agriculture and Agri-Food Canada, Ottawa (Ont.). http://res2.agr.ca/ecorc/pubs/pdf/rusle_e.pdf
Environmental Sustainability of Canadian Agriculture: Agri-Environmental Indicator Report Series—Report #2
THE ISSUEWhile wind erosion is a concern in many areasof Canada—from the sandy soils along the FraserRiver in British Columbia to the coastal areas of the Atlantic Provinces—it is in the PrairieRegion that the potential for wind erosion is byfar the greatest. This situation stems from theregion’s dry climate and vast expanses of culti-vated land with little protection from the wind.Since the Dust Bowl of the 1930s, the risk ofwind erosion has been significantly reducedthrough improved land management, mostnotably the conversion of the more susceptiblelands to perennial forages and more recently thetrend toward less summerfallow and reduced-tillage. Whereas during the 1930s and the 1940s,intensive tillage with disc-type implements wasrequired to prepare the seedbed, today’s seedingequipment can seed and apply fertilizer in onepass, even with high residues.
THE INDICATORThe Risk of Wind Erosion Indicator (RWndE) isused to assess how the risk of soil degradationfrom wind erosion on cultivated agriculturallands is changing relative to changes in farmingpractices. The risk is expressed in five relativeclasses: very low, low, moderate, high and veryhigh. The indicator is applied to the agriculturalregions of Manitoba, Saskatchewan and Alberta,as well as to the Peace River area of BritishColumbia, where this issue is of prime concern.Wind erosion can and does occur in other partsof Canada, and procedures are being developedto apply the RWndE Indicator there as well. Theperformance objective is to have all agriculturallands in the low or very low risk class.
CALCULATION METHODThe rate of wind erosion was estimated usingthe Wind Erosion Equation (WEQ), (Woodruffand Siddoway 1965). The model utilizes a cli-matic factor based on wind speed and rainfall,along with soil factors largely related to soil texture. Superimposed on the soil and climatefactors is a vegetation factor based on cropresidue levels. Crop and tillage information from the Census of Agriculture findings for1981, 1986, 1991,1996 and 2001, linked to Soil Landscape of Canada polygons, was used to provide an estimate of change in land useand management on different soil types.
Conceptually, the estimation of wind erosionrisk involves first calculating the risk on bare,unprotected soil and then reducing that riskaccording to the amount of crop residues left on the soil surface and their effectiveness incontrolling erosion. The risk of wind erosionwas calculated for the April–May period afterseeding, when residue levels are lowest andwind speeds are highest. Estimates of residuelevels for different crops under different tillageregimes were derived from the AgricultureCanada research of McConkey et al. (2000) andfrom the study by Moulin and Beimuts (2000).More specifically, initial post-harvest residues foreach crop in a particular region were estimatedusing average yields and a harvest index; theywere then reduced according to the number andtype of tillage operations associated with theconventional tillage, conservation tillage andno-till regimes in each region. Since tillageinformation was not compiled in the Censusprior to 1991, for 1981 it was assumed that alltillage was conventional and for 1986 it wasassumed that tillage levels were mid-waybetween those of 1981 and 1991.
SUMMARYSoil erosion by wind has long been a concern in many areas of Canada, especially in the semi-arid Prairies
where the climate is dry and large tracts of cultivated land lie unprotected from the wind. Results from the
Risk of Wind Erosion Indicator reveal that from 1981 to 2001 the risk of wind erosion in the Prairie region
declined by about 40%, to the point where over 90% of the arable land is now in the very low to low wind
erosion risk classes, and only 3% is in the high to very high risk classes. This decline is attributable to
higher residue levels resulting from a 50% decrease in the amount of summerfallow, a doubling of forage
area and a significant increase in reduced-tillage practices.
97C. Soil Quality
AUTHORS:
H. Rostad and G. Padbury
INDICATOR NAME:
Risk of Wind Erosion
STATUS:
Provincial coverage (BC, AB, SK, MB),1981 to 2001
B) Wind Erosion
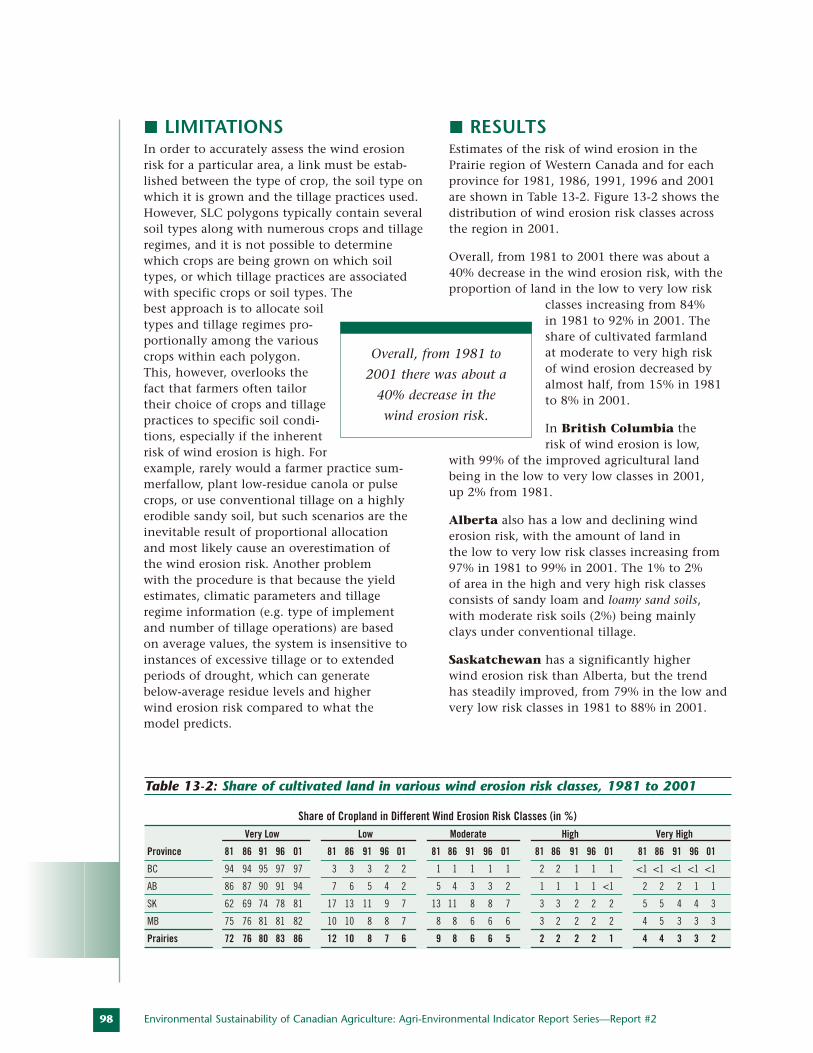
98
LIMITATIONSIn order to accurately assess the wind erosionrisk for a particular area, a link must be estab-lished between the type of crop, the soil type onwhich it is grown and the tillage practices used.However, SLC polygons typically contain severalsoil types along with numerous crops and tillageregimes, and it is not possible to determinewhich crops are being grown on which soiltypes, or which tillage practices are associatedwith specific crops or soil types. The best approach is to allocate soiltypes and tillage regimes pro-portionally among the variouscrops within each polygon.This, however, overlooks thefact that farmers often tailortheir choice of crops and tillagepractices to specific soil condi-tions, especially if the inherentrisk of wind erosion is high. Forexample, rarely would a farmer practice sum-merfallow, plant low-residue canola or pulsecrops, or use conventional tillage on a highlyerodible sandy soil, but such scenarios are theinevitable result of proportional allocation and most likely cause an overestimation of the wind erosion risk. Another problem with the procedure is that because the yield estimates, climatic parameters and tillage regime information (e.g. type of implement and number of tillage operations) are based on average values, the system is insensitive toinstances of excessive tillage or to extended periods of drought, which can generate below-average residue levels and higher wind erosion risk compared to what the model predicts.
RESULTSEstimates of the risk of wind erosion in thePrairie region of Western Canada and for eachprovince for 1981, 1986, 1991, 1996 and 2001are shown in Table 13-2. Figure 13-2 shows thedistribution of wind erosion risk classes acrossthe region in 2001.
Overall, from 1981 to 2001 there was about a40% decrease in the wind erosion risk, with theproportion of land in the low to very low risk
classes increasing from 84% in 1981 to 92% in 2001. Theshare of cultivated farmland at moderate to very high risk of wind erosion decreased byalmost half, from 15% in 1981to 8% in 2001.
In British Columbia the risk of wind erosion is low,
with 99% of the improved agricultural landbeing in the low to very low classes in 2001, up 2% from 1981.
Alberta also has a low and declining wind erosion risk, with the amount of land in the low to very low risk classes increasing from97% in 1981 to 99% in 2001. The 1% to 2% of area in the high and very high risk classesconsists of sandy loam and loamy sand soils, with moderate risk soils (2%) being mainly clays under conventional tillage.
Saskatchewan has a significantly higher wind erosion risk than Alberta, but the trendhas steadily improved, from 79% in the low andvery low risk classes in 1981 to 88% in 2001.
Environmental Sustainability of Canadian Agriculture: Agri-Environmental Indicator Report Series—Report #2
Share of Cropland in Different Wind Erosion Risk Classes (in %)Very Low Low Moderate High Very High
Province 81 86 91 96 01 81 86 91 96 01 81 86 91 96 01 81 86 91 96 01 81 86 91 96 01
BC 94 94 95 97 97 3 3 3 2 2 1 1 1 1 1 2 2 1 1 1 <1 <1 <1 <1 <1
AB 86 87 90 91 94 7 6 5 4 2 5 4 3 3 2 1 1 1 1 <1 2 2 2 1 1
SK 62 69 74 78 81 17 13 11 9 7 13 11 8 8 7 3 3 2 2 2 5 5 4 4 3
MB 75 76 81 81 82 10 10 8 8 7 8 8 6 6 6 3 2 2 2 2 4 5 3 3 3
Prairies 72 76 80 83 86 12 10 8 7 6 9 8 6 6 5 2 2 2 2 1 4 4 3 3 2
Table 13-2: Share of cultivated land in various wind erosion risk classes, 1981 to 2001
Overall, from 1981 to
2001 there was about a
40% decrease in the
wind erosion risk.
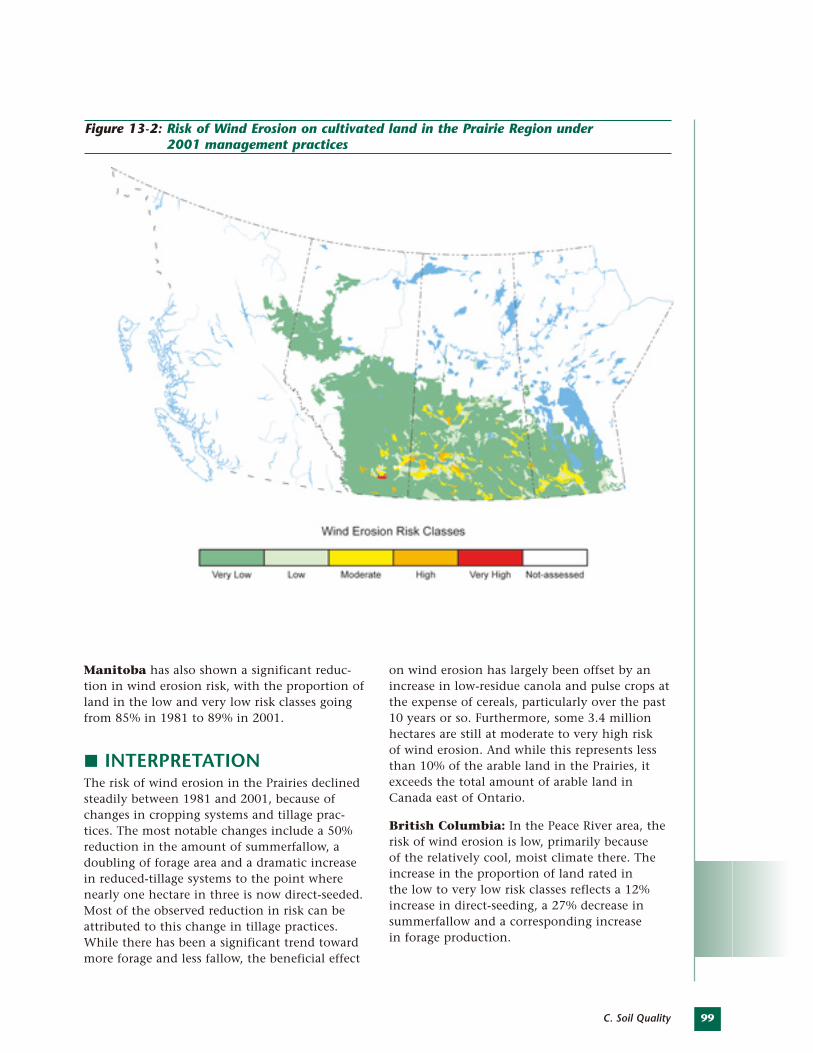
99C. Soil Quality
Manitoba has also shown a significant reduc-tion in wind erosion risk, with the proportion ofland in the low and very low risk classes goingfrom 85% in 1981 to 89% in 2001.
INTERPRETATIONThe risk of wind erosion in the Prairies declinedsteadily between 1981 and 2001, because ofchanges in cropping systems and tillage prac-tices. The most notable changes include a 50%reduction in the amount of summerfallow, adoubling of forage area and a dramatic increasein reduced-tillage systems to the point wherenearly one hectare in three is now direct-seeded.Most of the observed reduction in risk can beattributed to this change in tillage practices.While there has been a significant trend towardmore forage and less fallow, the beneficial effect
on wind erosion has largely been offset by anincrease in low-residue canola and pulse crops atthe expense of cereals, particularly over the past10 years or so. Furthermore, some 3.4 millionhectares are still at moderate to very high risk of wind erosion. And while this represents lessthan 10% of the arable land in the Prairies, itexceeds the total amount of arable land inCanada east of Ontario.
British Columbia: In the Peace River area, therisk of wind erosion is low, primarily because of the relatively cool, moist climate there. Theincrease in the proportion of land rated in the low to very low risk classes reflects a 12%increase in direct-seeding, a 27% decrease insummerfallow and a corresponding increase in forage production.
Figure 13-2: Risk of Wind Erosion on cultivated land in the Prairie Region under 2001 management practices
100
Alberta: This province likewise has a low winderosion risk, attributable in part to the cool,moist climate of the Peace River area and othernorthern regions. However, the risk level is loweven in the arid southern regions because most(80%) of the cultivated soils there are loamy textured and thus relatively resistant to winderosion, and because many of the susceptiblesoil types have been planted to forage. About20% of cultivated land in the Brown and DarkBrown soil zones of Alberta is used for forage,while in similar regions of neighbouringSaskatchewan, the corresponding proportion is less than 10%.
Saskatchewan: The wind erosion risk is higherhere than in Alberta mainly because of thehigher proportion of cultivated land in the more arid Brown and Dark Brown soil zones andthe slightly higher proportion of erosion-pronesandy and clayey soils. Nonetheless, the trendhas improved, owing to a 50% reduction in thearea of summerfallow and a dramatic increase in the use of direct-seeding technologies, to thepoint where nearly 40% of the area seeded eachyear is a one-pass operation.
Manitoba: This province has also seen a signifi-cant decline in the wind erosion risk, andalthough it has a significantly wetter climatethan Saskatchewan, with proportionally less fallow and more forage, the erosion risk is comparable owing to the higher proportion ofcultivated sandy (22%) and clayey (23%) soils.
RESPONSE OPTIONSApproximately 20% of the area at moderate tovery high risk in the Prairies is comprised ofloamy sand soils, where planting perennial forages is the most practical response option. In the northern areas, though, the risk can bediminished sufficiently using a strict no-tillregime. For sandy loam soils, which account
for about a third of those at risk, summerfallowshould be avoided, although chem-fallow can be used in the Black and Gray soil zones. Direct-seeding is the best option when planting intopulse or canola residues. The remaining area atrisk is comprised of loamy or clayey soils thatare either under conventional fallow or plantedinto pulse or canola residues using conventionaltillage. It is generally agreed that the trendtoward reduced-tillage and less summerfallow in the Prairies is attributable to several factorsbesides soil conservation, including reducedlabour, energy and machinery requirements, better weed control options and increased moisture efficiency. Producers have been able to capitalize on new seeding equipment that is capable of seeding and applying fertilizer in one pass, even with high residues. These benefits, combined with the fact that 40% of the area still uses conventional tillage, suggestthat the current trend toward conservationtillage is likely to continue, spurring a furtherdecline in the wind erosion risk.
REFERENCESMcConkey, B., T. McInnis, and W. Eilers, 2000.Environmentally Sustainable Production Practicesfor Diversified Cropping Systems in the SemiaridPrairie – Final Report for the Canada-Saskatchewan Agri-Food Innovation Fund(Project 96000486). Agriculture and Agri-FoodCanada, Semiarid Prairie Agricultural ResearchCentre, Swift Current (Sask.).
Moulin, A.P., and R. Beimuts, 2000. ResidueTillage (Decision) Support System (RTDS) Version 1.1. Documentation. Agriculture and Agri-Food Canada, Brandon (Man.).
Woodruff, N.P., and F.H. Siddoway, 1965. A Wind Erosion Equation. Soil Science Society of America Proceedings. 29 (5): 602-608.
Environmental Sustainability of Canadian Agriculture: Agri-Environmental Indicator Report Series—Report #2

THE ISSUEMany farm implements move soil and, on sloping land, this movement is influenced bygravity, causing more soil to be moved whensoil is tilled downslope than when tilled ups-lope. Even when tilling is done across the slope, more soil will be moved downslope thanupslope. The resulting progressive downslopemovement of soil from hilltops and soil accu-mulation at the base of hills is called tillageerosion (Govers et al. 1999). Evidence of tillageerosion is ubiquitous on hilly land. This form of erosion is most severe on land that has manyshort, steep slopes and in areas where intensivecropping and tillage practices are used. Althoughdistinct from wind and water erosion, tillageerosion influences wind and water erosion byexposing the subsoil, which is more sensitive tothese erosion processes, and by delivering soil to portions of the landscape where water erosionis most intense. As such, tillage erosion alsocontributes to the off-site environmentalimpacts of soil erosion.
THE INDICATORThe Tillage Erosion Risk Indicator (TillERI) isused to assess how the risk of soil degradationfrom tillage erosion on cultivated agriculturallands is changing relative to changes in landmanagement. Tillage erosion is a function of theerodibility of the landscape and the erosivity ofthe tillage system used. Hilly landscapes withshort, steep slopes are highly erodible. An exam-ple is steep hummocky landscapes. Crops thatare frequently tilled with implements that movelarge amounts of soil over great distances arehighly erosive. Conventionally tilled potato production is an example.
The rate of soil loss by tillage erosion is calculated and reported in five risk classes, corresponding to five erosion rate classes: very low (less than 6 tonnes per hectare peryear), low (6 to 11 t ha-1 yr-1), moderate (11 to 22 t ha-1 yr-1), high (22 to 33 t ha-1 yr-1) andvery high (greater than 33 t ha-1 yr-1). Areas inthe very low risk class are considered capableof sustaining long-term crop production and
maintaining agri-environmental health, undercurrent conditions. The other four classes repre-sent the risk of unsustainable conditions thatcall for soil conservation practices to supportcrop production over the long term and toreduce water quality impacts. The performanceobjective for this indicator is to increase the pro-portion of cropland in the very low risk class.
CALCULATION METHODThe model that underlies the Tillage ErosionRisk Indicator was developed by Lobb (1997).The rate of soil loss by tillage erosion is calculated by multiplying tillage erosivity andlandscape erodibility together. This rate is calcu-lated for individual Soil Landscape of Canadapolygons. For analysis and reporting purposes,tillage erosivity, landscape erodibility and tillageerosion values are aggregated, or scaled up toprovincial, regional and national levels.
Tillage erosivity is ascertained for each SoilLandscape of Canada (SLC v 3.0) polygon fromthe cropping and tillage practices reported inthe Census of Agriculture database. Croppingand tillage practices in this database are groupedin classes (e.g. grain corn under conventionaltillage, grain corn under conservation tillage orgrain corn under no-till). Erosivity values areassigned to each class based on the character of
SUMMARYTillage erosion is a significant form of soil erosion that has caused considerable degradation of soils and
landscapes across the country. Results from the Tillage Erosion Risk Indicator reveal that, between 1981
and 2001, the risk of tillage erosion in Canada decreased by nearly 50%, a substantial decline. In 2001,
almost 50% of cropland was at very low risk of tillage erosion. This positive trend is attributable mainly
to the decline in the erosivity of tillage practices (e.g. increase in no-till). However, erosive tillage practices
persist in some regions including some with highly erodible landscapes (e.g. Ontario, Prince Edward Island,
New Brunswick).
101C. Soil Quality
AUTHOR:
D. Lobb
INDICATOR NAME:
Risk of TillageErosion
STATUS:
National coverage, 1981 to 2001
C) Tillage Erosion
102
the tillage operations representing each class oftillage and cropping system within the variousagroecosystems across Canada, and based onexperimental data (Lobb et al. 1995, 1999).
Each SLC polygon is characterized by one or more representative landforms, and eachlandform is characterized by hillslope segments(upper, mid and lower slopesand depression), and each hills-lope segment is characterizedby a slope gradient and slopelength. Landscape erodibilityvalues are calculated for eachlandform as a function of thegradient of the mid-slope (the maximum slope gradient,which determines the total soilloss on a landform), the lengthof the upper slope (the convex portion of thelandform, which determines the area over whichsoil is lost) and the total slope length (whichdetermines the density of hillslopes within agiven area). Landform data and the associatedtopographic data were obtained from theNational Soil DataBase.
LIMITATIONSIn comparison to other soil erosion processes,there are very few experimental data on tillageerosion. Tillage erosivity values for the classes of cropping and tillage systems are estimatesgenerated from a few experiments carried out in Canada and elsewhere around the world andfrom expert opinion on the character of thetillage operations representing each class oftillage and cropping system. The landform dataused to derive landscape erodibility values havenot been adequately verified. Landforms are rep-resented by simple, two-dimensional hillslopes;as such, the landform data do not reflect thetopographic complexity that exists for somelandforms. It is assumed that soil loss by tillageerosion is uniformly distributed over convexportions of landforms and that there are no field boundaries over the length of hillslopes.Within each SLC polygon, it is assumed thatcrops are distributed evenly between and overthe landforms within the polygon.
The ability of the Tillage Erosion Risk Indicatorto make accurate assessments will be enhancedas the body of research on tillage erosivityexpands, and as the landform data undergo morerigorous verification. Through this research andthrough validation of the indicator results, it willbe possible to assess the certainty of the indica-tor findings. As well, there is a need to better
understand how soil erosionprocesses interact. It is knownthat soil losses caused by tillageerosion increase the erosivepotential of the soil in responseto wind and water; and soileroded by tillage erosion isdelivered to areas of the land-scape where water erosion ismost intense. A better under-standing of these interactions
will lead to a more comprehensive and moreaccurate assessment of soil erosion risk.
RESULTSThe risk of tillage erosion in Canada and in each province is shown for 1981, 1986, 1991,1996 and 2001 in Table 13-3. Figure 13-3 showsthe distribution of the various risk classes inWestern and Eastern Canada in 2001.
Canada: There was a steady decrease in the risk of tillage erosion in Canada between 1981and 2001. In that period, a 43% reduction intillage erosivity resulted in a 48% reduction intillage erosion. (Only minor changes occur inlandscape erodibility, resulting from changes in cropped land.) The majority of this changeoccurred between 1996 and 2001. In 2001,almost 50% of Canadian cropland was in the very low, or “sustainable,” tillage erosionrisk class, a considerable improvement over the 1981 level (38%).
British Columbia: British Columbia followedthe national trend, with a 25% decrease intillage erosivity between 1981 and 2001 and anattendant 27% decrease in tillage erosion. Theproportion of cropland in the very low risk classincreased from 20% in 1981 to 34% in 2001.
Environmental Sustainability of Canadian Agriculture: Agri-Environmental Indicator Report Series—Report #2
There was a steady
decrease in the
risk of tillage erosion
in Canada between
1981 and 2001.
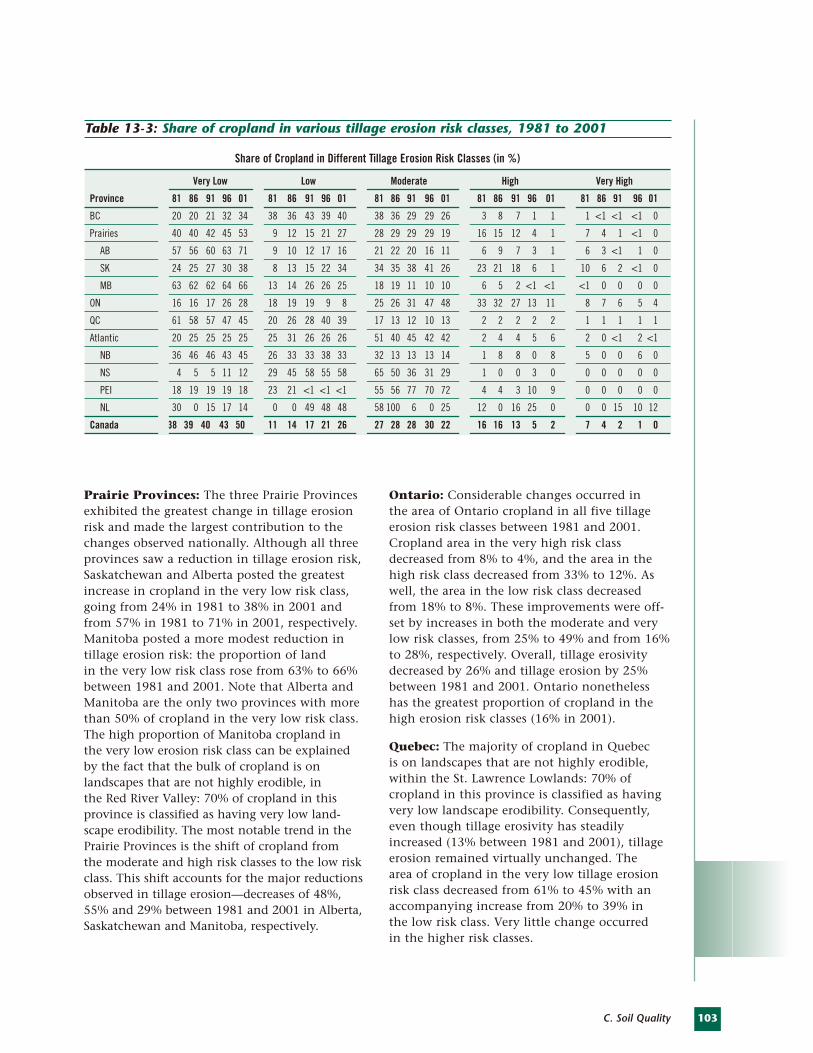
103C. Soil Quality
Prairie Provinces: The three Prairie Provincesexhibited the greatest change in tillage erosionrisk and made the largest contribution to thechanges observed nationally. Although all threeprovinces saw a reduction in tillage erosion risk,Saskatchewan and Alberta posted the greatestincrease in cropland in the very low risk class,going from 24% in 1981 to 38% in 2001 andfrom 57% in 1981 to 71% in 2001, respectively.Manitoba posted a more modest reduction intillage erosion risk: the proportion of land in the very low risk class rose from 63% to 66%between 1981 and 2001. Note that Alberta andManitoba are the only two provinces with morethan 50% of cropland in the very low risk class.The high proportion of Manitoba cropland in the very low erosion risk class can be explainedby the fact that the bulk of cropland is on landscapes that are not highly erodible, in the Red River Valley: 70% of cropland in thisprovince is classified as having very low land-scape erodibility. The most notable trend in thePrairie Provinces is the shift of cropland from the moderate and high risk classes to the low riskclass. This shift accounts for the major reductionsobserved in tillage erosion—decreases of 48%,55% and 29% between 1981 and 2001 in Alberta,Saskatchewan and Manitoba, respectively.
Ontario: Considerable changes occurred in the area of Ontario cropland in all five tillageerosion risk classes between 1981 and 2001.Cropland area in the very high risk classdecreased from 8% to 4%, and the area in thehigh risk class decreased from 33% to 12%. Aswell, the area in the low risk class decreasedfrom 18% to 8%. These improvements were off-set by increases in both the moderate and verylow risk classes, from 25% to 49% and from 16%to 28%, respectively. Overall, tillage erosivitydecreased by 26% and tillage erosion by 25%between 1981 and 2001. Ontario nonethelesshas the greatest proportion of cropland in thehigh erosion risk classes (16% in 2001).
Quebec: The majority of cropland in Quebec is on landscapes that are not highly erodible,within the St. Lawrence Lowlands: 70% of cropland in this province is classified as havingvery low landscape erodibility. Consequently,even though tillage erosivity has steadilyincreased (13% between 1981 and 2001), tillageerosion remained virtually unchanged. The area of cropland in the very low tillage erosionrisk class decreased from 61% to 45% with anaccompanying increase from 20% to 39% in the low risk class. Very little change occurred in the higher risk classes.
Share of Cropland in Different Tillage Erosion Risk Classes (in %)
Very Low Low Moderate High Very High
Province 81 86 91 96 01 81 86 91 96 01 81 86 91 96 01 81 86 91 96 01 81 86 91 96 01
BC 20 20 21 32 34 38 36 43 39 40 38 36 29 29 26 3 8 7 1 1 1 <1 <1 <1 0
Prairies 40 40 42 45 53 9 12 15 21 27 28 29 29 29 19 16 15 12 4 1 7 4 1 <1 0
AB 57 56 60 63 71 9 10 12 17 16 21 22 20 16 11 6 9 7 3 1 6 3 <1 1 0
SK 24 25 27 30 38 8 13 15 22 34 34 35 38 41 26 23 21 18 6 1 10 6 2 <1 0
MB 63 62 62 64 66 13 14 26 26 25 18 19 11 10 10 6 5 2 <1 <1 <1 0 0 0 0
ON 16 16 17 26 28 18 19 19 9 8 25 26 31 47 48 33 32 27 13 11 8 7 6 5 4
QC 61 58 57 47 45 20 26 28 40 39 17 13 12 10 13 2 2 2 2 2 1 1 1 1 1
Atlantic 20 25 25 25 25 25 31 26 26 26 51 40 45 42 42 2 4 4 5 6 2 0 <1 2 <1
NB 36 46 46 43 45 26 33 33 38 33 32 13 13 13 14 1 8 8 0 8 5 0 0 6 0
NS 4 5 5 11 12 29 45 58 55 58 65 50 36 31 29 1 0 0 3 0 0 0 0 0 0
PEI 18 19 19 19 18 23 21 <1 <1 <1 55 56 77 70 72 4 4 3 10 9 0 0 0 0 0
NL 30 0 15 17 14 0 0 49 48 48 58 100 6 0 25 12 0 16 25 0 0 0 15 10 12
Canada 38 39 40 43 50 11 14 17 21 26 27 28 28 30 22 16 16 13 5 2 7 4 2 1 0
Table 13-3: Share of cropland in various tillage erosion risk classes, 1981 to 2001
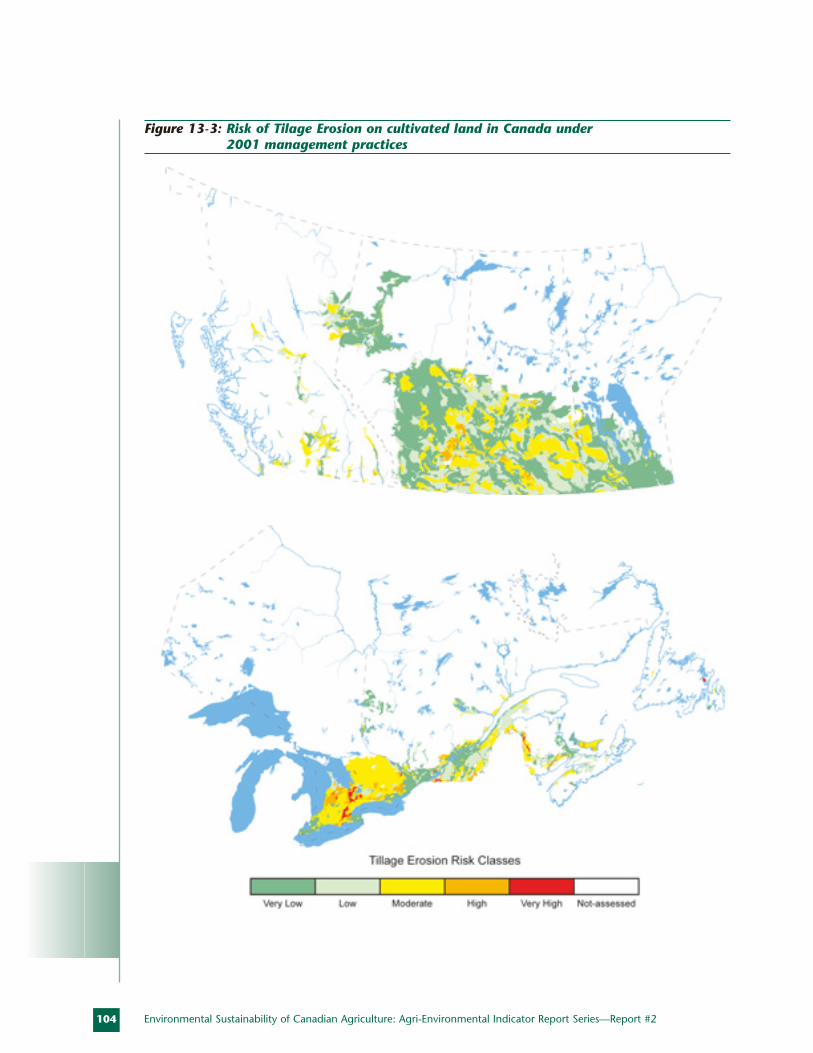
104 Environmental Sustainability of Canadian Agriculture: Agri-Environmental Indicator Report Series—Report #2
Figure 13-3: Risk of Tilage Erosion on cultivated land in Canada under 2001 management practices
105C. Soil Quality
Atlantic Provinces: Between 1981 and 2001,there was very little reduction in tillage erosivityin the Atlantic Provinces (6%); consequently,the reduction in tillage erosion is minimal (3%).The area of cropland in the very low tillage erosion risk class is relatively small and onlyincreased from 20% to 25%. With 26% of cropland area in the low risk class throughoutthe period, about 50% of the cropland was atmoderate to very high risk of tillage erosion(54% in 1981 versus 49% in 2001).
The results for individual provinces in theAtlantic Region differ greatly. Tillage erosivityand tillage erosion increased in both PrinceEdward Island (erosion increase of 19%) andNewfoundland and Labrador (erosion increase of14%), whereas they decreased in New Brunswick(erosion decrease of 17%) and Nova Scotia (erosion decrease of 24%). New Brunswick sawincreases in cropland area in the very low (36%in 1981 versus 45% in 2001) and low (26% versus 34%) tillage erosion risk classes, and adecrease in the higher risk classes, particularlythe moderate risk class (32% in 1981 versus 14%in 2001). In contrast, the area of Prince EdwardIsland cropland increased in the moderate (55% versus 72%) and high (4% versus 9%) riskclasses. The area in the low erosion risk classdecreased from 23% in 1981 to 0% in 2001, butthere was no change in the very low (18% from1981 to 2001) and very high (0%) risk classes.
INTERPRETATIONCanada: The decrease in tillage erosion risk inCanada is linked to a decrease in tillage erosivity.Landscape erodibility varies greatly from regionto region across the country, but it does notchange over time. The slight changes in land-scape erodibility that do occur are the result ofland moving into and out of crop production.Consequently, it is the change in the erosivity oftillage practices that drives the changes observedin tillage erosion. Decreases in tillage erosivityand, therefore, tillage erosion result from theadoption of conservation tillage practices and/orthe growing of crops that require less tillage. Thedecrease in tillage erosion in Canada is largelydue to the widespread adoption of conservationtillage practices (60% of seeded land in 2001),
particularly no-till systems (representing half of the land in conservation tillage), in mostprovinces. Changes in crops grown were less of acontributing factor. Crops requiring more inten-sive tillage, making them more erosive, such ascorn, potatoes and beans, increased in area and as a share of cropland in specific reporting years,from 6% in 1981 to 15% in 2001. This uptrendwas offset by the decrease in summerfallow, from22% in 1981 to 12% in 2001, and by the increasein crops requiring very little tillage such as alfalfaand hay, from 13% in 1981 to 18% in 2001. Byfar, the most dominant crops are cereals, makingup nearly 60% of cropland in all reporting years.Although most crops have seen a reduction intillage intensity, the adoption of direct-seeding(no-till/zero-till) in cereals has had the greatestinfluence on tillage erosivity and tillage erosion,owing to the large share of cropland devoted tocereals. Although improvements in tillage erosionrisk have been made since 1981, less than 50% ofCanada’s cropland was in the very low risk classin 2001.
British Columbia: British Columbia has had a steady decrease in tillage erosivity and an accompanying decline in tillage erosion risk.The primary cause for this improvement hasbeen the conversion from crops requiring inten-sive tillage to crops requiring very little tillage,rather than the adoption of conservation tillage.Cropping changes were dominated by the reduction in cereals from 49% of cropland in 1981 to 20% in 2001, and the increase inalfalfa and hay from 39% in 1981 to 66% in2001. The adoption of conservation tillage practices has been relatively limited, with 21% of seeded area in conservation tillage in 2001 and 14% direct-seeded (no-till) in 2001. Changesin this province, which has less than 1% ofCanada’s cropland, are not reflected in thenational analysis.
Prairies: Given their large share of Canada’scropland (85%), the Prairie Provinces dominatethe national analysis; consequently, the inter-pretation of this region’s results dominates thenational interpretation. The decrease in tillageerosivity and, therefore, tillage erosion is attrib-utable in part to the reduction in land undersummerfallow: reductions from 12% to 5%, 36%
106
to 17% and 19% to 11% were recorded between1981 and 2001 in Manitoba, Saskatchewan andAlberta, respectively. The increased adoption ofdirect-seeding (13%, 39% and 27% of seededland in 2001 in Manitoba, Saskatchewan andAlberta, respectively) is largely responsible forthe decrease in tillage erosivity and tillage erosion. While more modest improvementsoccurred in Manitoba than in Alberta andSaskatchewan, much of the cropland in thisprovince (70%) is classified as having very lowlandscape erodibility and therefore the risk oftillage erosion is low, even with intensive tillage.
Ontario: Between 1981 and 2001, Ontario had one of the highest levels of tillage erosivityand tillage erosion in the country. This can beexplained by the high proportion of intensivelytilled crops (e.g., corn and soybeans) grownhere. The share of land planted to such cropsincreased from 39% to 56% between 1981 and2001. This increase is largely linked to a triplingof the area seeded to soybeans. Although thearea of these crops increased, the intensity of tillage used to grow them decreased as conservation tillage practices were implemented,causing overall decreases in tillage erosivity andtillage erosion.
Quebec: The risk of tillage erosion in Quebecremained relatively low and nearly constantover the 20-year period studied. The low levelsof tillage erosion and the lack of change can beexplained by the fact that a large portion of thecropped land is nearly level and hence not veryerodible. In 2001, this province had one of thehighest tillage erosivity levels in the countryand it was one of only two provinces to see anincrease in tillage erosivity (increase of 13%since 1981). This increase in tillage erosivityresulted from an increase in the area seeded tocorn and soybeans (10% of seeded area in 1981versus 35% in 2001). The adoption of conserva-tion tillage practices for these crops has limitedthe increase in tillage erosivity to 13%, andsince these crops are seeded on land with verylow erodibility, there has been very little changein tillage erosion.
Atlantic Provinces: The tillage erosion risk inthis region is a concern—highly erosive crop-ping and tillage systems (i.e. potato production)are often used on highly erodible landscapes.The levels of tillage erosion have remained relatively high, with only a slight decrease intillage erosion between 1981 and 2001. Therehave been considerable improvements in NewBrunswick and Nova Scotia, but they are offsetby the change in Prince Edward Island. Notethat owing to its small area of cropland, thechanges in Newfoundland and Labrador are difficult to interpret and have little influence onthe regional results. In New Brunswick between1981 and 2001, there was a 9% increase in thearea of potato crops, an 8% increase in alfalfa andhay and a 28% increase in cereals. This changein crops, accompanied by a modest reduction in tillage intensity, resulted in a 17% reductionin tillage erosion. By contrast, Prince EdwardIsland posted a 68% increase in the area ofpotato crops, a 14% increase in alfalfa and hayand a 14% decrease in cereals. These changes,accompanied by a modest reduction in tillageintensity, spelled a 19% increase in tillage ero-sion. Potato production is highly erosive, evenwhen conservation tillage practices are used.Consequently, changes in the area of potatocrops greatly influence tillage erosion trends.
RESPONSE OPTIONSEfforts to reduce tillage erosion should befocused on landscapes that are hilly and therefore more susceptible to tillage erosion.Tillage erosion is controlled by modifying tillage practices. By eliminating tillage, tillageerosion can be stopped. The adoption of a no-till cropping system or the growing of cropsthat require no tillage, such as forage, are themost effective means of reducing tillage erosion.However, even practices such as seeding and fertilizer injection can cause significant levels of soil movement and tillage erosion.
Environmental Sustainability of Canadian Agriculture: Agri-Environmental Indicator Report Series—Report #2
107C. Soil Quality
Many cropping systems, such as potatoes, willalways entail some form of soil disturbance leading to soil movement and tillage erosion. In these production systems, it is important toselect tillage implements and carry out tillagepractices in a way that minimizes tillage erosion.Implements that move less soil and move it over a shorter distance will generate less tillageerosion. More uniform speed and depth of oper-ation will lessen tillage erosion. In landscapeswhere contour tillage is practical, this approachmay result in less tillage erosion than tilling up and down hillslopes, particularly if greateruniformity of tillage depth and speed can beachieved by tilling along the contours.
Tillage practices that are effective in controllingwind and water erosion are not necessarily effec-tive in controlling tillage erosion. For example,the chisel plough leaves more crop residues onthe soil surface than the moldboard plough, providing more protection against wind andwater erosion; however, the chisel plough canmove soil over a much greater distance andcause more tillage erosion. In fact, a rollovermoldboard plough can be a very effective conservation tool when the furrow is thrownupslope. The upslope movement of soil by themoldboard plough may offset the downslopemovement by other tillage operations. Fencelines, shelterbelts, water diversion terraces and so on may reduce wind and water erosion, but they result in more widespread soil lossesassociated with tillage erosion.
Although it is possible to stop tillage erosion,extraordinary measures may be required if thereis a long history of tillage erosion. The land-scape areas that are subject to the most severe
soil losses, specifically hilltops, also have thepoorest ability to regenerate topsoil. Some farmers focus manure application on these areas to enhance soil regeneration. Other farmers remove soil that has accumulated at the base of hills and apply it to these severelyeroded areas to restore the landscape.
REFERENCESGovers, G., D.A. Lobb, and T.A. Quine, 1999.Tillage Erosion and Translocation: Emergence of aNew Paradigm in Soil Erosion Research. Journal ofSoil and Tillage Research. 51 (3-4): 167-174.
Lobb, D.A., Tillage 1997. Erosion Risk Indicator. Methodology and Progress Report. Agri-Environmental Indicator Project. Agricultureand Agri-Food Canada, Ottawa (Ont.).
Lobb, D.A., R.G. Kachanoski, and M.H. Miller,1995. Tillage Translocation and Tillage Erosion on Shoulder Slope Landscape Positions MeasuredUsing 137Cs as a Tracer. Canadian Journal of Soil Science. 75: 211-218.
Lobb, D.A., and R.G. Kachanoski, 1999.Modelling Tillage Erosion on the TopographicallyComplex Landscapes of Southwestern Ontario.Journal of Soil and Tillage Research. 51: 261-277.
Lobb, D.A., R.G. Kachanoski, and M.H. Miller,1999. Tillage Translocation and Tillage Erosion inthe Complex Upland Landscapes of SouthwesternOntario. Journal of Soil and Tillage Research. 51: 189-209.
THE ISSUECarbon (C) is the basic building block of all living things and the main component of soilorganic matter. Carbon is first captured from the air as carbon dioxide by plants during photosynthesis. This carbon enters the soil upon the death of plants or of animals that directly or indirectly ate the plants. Most of this carbonis quickly returned to the atmosphere duringinitial decomposition of the plant and animalremains. However, through the decompositionprocess, a small portion of organic carbon from plant and animals becomes soil organicmaterials that are less easily decomposed. Overtime, soil organic matter builds in the soil untila “steady-state” level of soil organic matter isreached when new organic carbon additionsfrom dead plants and animals exactly balancelosses of organic carbon from decomposition.Soil organic matter is generally considered to be 58% carbon by mass so the terms soil organic carbon and soil organic matter are used interchangeably.
Soil organic matter strongly influences manyimportant aspects of soil quality and is a keycomponent of good soil health. It helps holdsoil particles together and stabilizes the soil
structure, making the soil less prone to erosionand improving the ability of the soil to storeand convey air and water. The improved soilstructure helps make the soil more workable and maintain an uncompacted state. Soilorganic matter stores and supplies many nutrients needed for the growth of plants and soil organisms. It binds potentially harmfulsubstances, such as heavy metals and pesticides.Finally, it acts as storage for carbon dioxide (a major greenhouse gas) captured from theatmosphere.
Losses of soil organic matter, contribute todegraded soil structure, increased soil vulnerabil-ity to erosion and lower fertility, ultimatelyleading to lower yields and reduced sustainabilityof the soil resource.
THE INDICATORThe Soil Organic Carbon Change Indicator hasbeen developed to assess how organic carbonlevels are changing over time in Canadian agri-cultural soils. The indicator estimates the rate ofchange in soil organic carbon and provides anestimate of current levels of soil organic carbon,considering the effects of present land use andmanagement practices. The change in soil
SUMMARYSoil organic matter is related to many important aspects of soil quality and is a key component of good
soil health and fertility. An indicator—the Soil Organic Carbon Change Indicator—has been developed
to assess how organic carbon levels are changing over time in Canadian agricultural soils. The change
in soil organic carbon (SOC) is a useful indicator of general soil health and also serves to estimate how
much carbon dioxide is removed from the atmosphere and sequestered in agricultural soils. The rate of
soil organic carbon change is estimated by incorporating generalized scenarios of past and current land-use
and management practices into the Century simulation model.
The results indicate that, in terms of soil organic carbon, Canada’s cropland has gone from a net loss
position in 1991 and earlier years to a net gain situation since 1996. Most of the gains have occurred
on the Prairies, where the increased adoption of reduced tillage, the reduction in summerfallow and the
increase in hay crops all have helped to replenish soil organic matter. Overall, the mean rate of SOC change
on Canada’s cropland in 2001 was 29 kg ha-1 yr-1. This rate suggests that Canada’s cropland operated
as a net sink of 4.4 Mt of carbon dioxide (CO2) that year. Despite the general good news story of increas-
ing SOC, 15% of Canada’s cropland was predicted to undergo a large decrease in soil organic carbon (losses
of 50 kg ha-1 yr-1 or greater).
108 Environmental Sustainability of Canadian Agriculture: Agri-Environmental Indicator Report Series—Report #2
AUTHORS:
B. McConkey, J. Hutchinson,
W. Smith, B. Grant and R. Desjardins
INDICATOR NAME:
Soil OrganicCarbon Change
STATUS:
National coverage,
1981 to 2001
14. Soil Organic Carbon
109C. Soil Quality
organic carbon is a useful indicator of long-termtrends in general soil health. The indicator alsoserves to estimate how much carbon dioxide isremoved from the atmosphere by plants andstored (or sequestered) as SOC in agriculturalsoils. Thus, in addition to indicating change insoil health, the change in SOC also provides anindication of the potential reduction in atmos-pheric CO2 that can offset some CO2 emissionsfrom the burning of fossil fuels.
The indicator results are given as the percentageof total cropland that falls into each of five different SOC change classes expressed in kg ha-1 yr-1 (kilograms per hectare per year).Negative values represent a loss of SOC from the soil and positive values represent a gain ofSOC. The five classes are defined as follows: largeincrease (gain more than 50 kg ha-1 yr-1), moder-ate increase (10 to 50 kg ha-1 yr-1), negligible tosmall change (-10 to 10 kg ha-1 yr-1), moderatedecrease (-10 to -50 kg ha-1 yr-1) and large decrease(losses more than -50 kg ha-1 yr-1). If soil is wellmanaged over a long time period, the soilorganic matter should show little change over time. Thusincreasing soil organic carbon is not necessarily preferred over a situation of no change.However, if the soil has beendegraded in the past, a signifi-cant increase in SOC is clearlydesirable as it indicates that the soil is being restored to better soil health and function.Therefore, the preferred valuesfor this indicator are no loss of soil organic carbon in allagricultural soils and carbon accumulation in soils where those soils were low in organic matter.
CALCULATION METHODIndicator calculation is based on the methodol-ogy of Smith et al. (1997; 2000). Briefly, theindicator uses version 4 of the Century model(Parton et al. 1987; 1988) to predict the rate ofchange in organic carbon in Canada’s agriculturalsoils. The Century model is a computer simula-tion tool that uses simplified soil–plant–climaterelationships to describe the dynamics of soil carbon and nitrogen in grasslands, croplands,forests and savannas. It simulates above- and
below-ground production of plant material asa function of soil temperature and water andnutrient availability. This model has been tested extensively under different soil, climaticand agricultural practices such as planting, fertilizer application, tillage, grazing and organic matter addition.
Deriving the indicator requires data on severalagricultural management practices, includingcrop rotation, fertilizer application and tillage.Much of the information on cropland manage-ment, such as tillage and crop proportions, was obtained from the Census of Agriculture.Soil data were taken from the Canadian SoilInformation System (CANSIS) and climate datawere obtained from weather stations within the Soil Landscape of Canada (SLC) polygons.The erosion calculations were based on the assumption that 15% of eroded soil istransported out of the agricultural landscape by watercourses except on the Prairies (Alberta,Saskatchewan and Manitoba), where it isassumed that erosion only redistributes soil
within the farmed landscape.Erosion rates were taken fromcalculations of the Indicator for Risk of Water Erosion(Shelton et al. 2000).
Simulations were performed on a sample (15%) of Canada’sagricultural soils, chosen tobe representative of various
soil types and textures acrossCanada. They encompassedmultiple soil landscape poly-gons and were scaled up to the
provincial level. The rate of SOC change wasdetermined for the years 1981, 1986, 1991, 1996and 2001, by taking the slope of a 10-year regres-sion centred on each particular year, to accountfor rotations several years long.
LIMITATIONSThe calculation method is based on taking asampling of SLC polygons and using highly gen-eralized scenarios of past, current and futurecropland management. Although a single SOCchange rate is calculated for each SLC polygon,within any given SLC polygon, there will beareas of decreasing, stable and increasing SOCbecause of differing management practices at
For Canada as a
whole, there has been
a dramatic shift from a
net loss position for
SOC during the 1980s
to a general uptrend in
SOC levels in 2001.
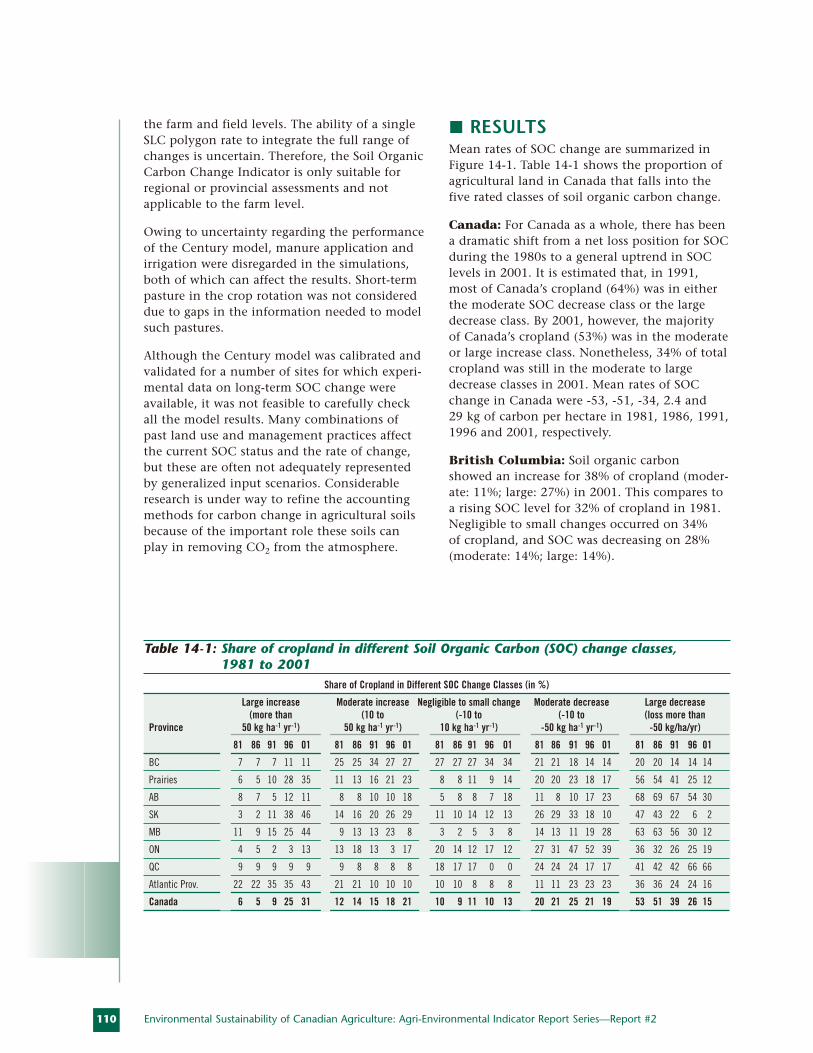
110
the farm and field levels. The ability of a singleSLC polygon rate to integrate the full range ofchanges is uncertain. Therefore, the Soil OrganicCarbon Change Indicator is only suitable forregional or provincial assessments and notapplicable to the farm level.
Owing to uncertainty regarding the performanceof the Century model, manure application andirrigation were disregarded in the simulations,both of which can affect the results. Short-termpasture in the crop rotation was not considereddue to gaps in the information needed to modelsuch pastures.
Although the Century model was calibrated andvalidated for a number of sites for which experi-mental data on long-term SOC change wereavailable, it was not feasible to carefully checkall the model results. Many combinations ofpast land use and management practices affectthe current SOC status and the rate of change,but these are often not adequately representedby generalized input scenarios. Considerableresearch is under way to refine the accountingmethods for carbon change in agricultural soilsbecause of the important role these soils canplay in removing CO2 from the atmosphere.
RESULTSMean rates of SOC change are summarized inFigure 14-1. Table 14-1 shows the proportion ofagricultural land in Canada that falls into thefive rated classes of soil organic carbon change.
Canada: For Canada as a whole, there has beena dramatic shift from a net loss position for SOCduring the 1980s to a general uptrend in SOClevels in 2001. It is estimated that, in 1991,most of Canada’s cropland (64%) was in eitherthe moderate SOC decrease class or the largedecrease class. By 2001, however, the majority of Canada’s cropland (53%) was in the moderateor large increase class. Nonetheless, 34% of totalcropland was still in the moderate to largedecrease classes in 2001. Mean rates of SOCchange in Canada were -53, -51, -34, 2.4 and 29 kg of carbon per hectare in 1981, 1986, 1991,1996 and 2001, respectively.
British Columbia: Soil organic carbon showed an increase for 38% of cropland (moder-ate: 11%; large: 27%) in 2001. This compares toa rising SOC level for 32% of cropland in 1981.Negligible to small changes occurred on 34% of cropland, and SOC was decreasing on 28%(moderate: 14%; large: 14%).
Environmental Sustainability of Canadian Agriculture: Agri-Environmental Indicator Report Series—Report #2
Share of Cropland in Different SOC Change Classes (in %)
Large increase Moderate increase Negligible to small change Moderate decrease Large decrease(more than (10 to (-10 to (-10 to (loss more than
Province 50 kg ha-1 yr-1) 50 kg ha-1 yr-1) 10 kg ha-1 yr-1) -50 kg ha-1 yr-1) -50 kg/ha/yr)
81 86 91 96 01 81 86 91 96 01 81 86 91 96 01 81 86 91 96 01 81 86 91 96 01
BC 7 7 7 11 11 25 25 34 27 27 27 27 27 34 34 21 21 18 14 14 20 20 14 14 14
Prairies 6 5 10 28 35 11 13 16 21 23 8 8 11 9 14 20 20 23 18 17 56 54 41 25 12
AB 8 7 5 12 11 8 8 10 10 18 5 8 8 7 18 11 8 10 17 23 68 69 67 54 30
SK 3 2 11 38 46 14 16 20 26 29 11 10 14 12 13 26 29 33 18 10 47 43 22 6 2
MB 11 9 15 25 44 9 13 13 23 8 3 2 5 3 8 14 13 11 19 28 63 63 56 30 12
ON 4 5 2 3 13 13 18 13 3 17 20 14 12 17 12 27 31 47 52 39 36 32 26 25 19
QC 9 9 9 9 9 9 8 8 8 8 18 17 17 0 0 24 24 24 17 17 41 42 42 66 66
Atlantic Prov. 22 22 35 35 43 21 21 10 10 10 10 10 8 8 8 11 11 23 23 23 36 36 24 24 16
Canada 6 5 9 25 31 12 14 15 18 21 10 9 11 10 13 20 21 25 21 19 53 51 39 26 15
Table 14-1: Share of cropland in different Soil Organic Carbon (SOC) change classes, 1981 to 2001
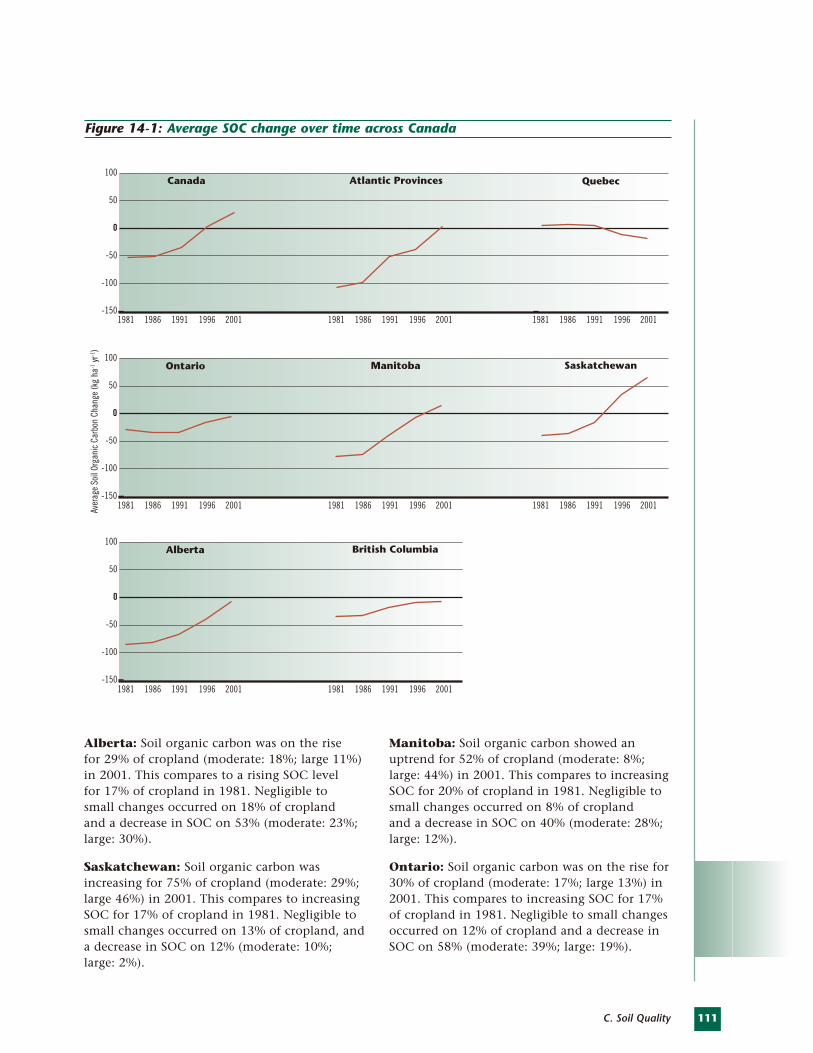
111C. Soil Quality
ManitobaOntario
-150
-100
-50
0
50
100
Quebec
Aver
age
Soil
Orga
nic
Carb
on C
hang
e (k
g ha
-1 yr
-1)
Atlantic Provinces
1981 1986 1991 1996 2001 1981 1986 1991 1996 20011981 1986 1991 1996 2001
1981 1986 1991 1996 2001 1981 1986 1991 1996 20011981 1986 1991 1996 2001
1981 1986 1991 1996 2001 1981 1986 1991 1996 2001
Canada
-150
-100
-50
0
50
100
Saskatchewan
Alberta
-150
-100
-50
0
50
100British Columbia
Figure 14-1: Average SOC change over time across Canada
Alberta: Soil organic carbon was on the rise for 29% of cropland (moderate: 18%; large 11%)in 2001. This compares to a rising SOC level for 17% of cropland in 1981. Negligible to small changes occurred on 18% of cropland and a decrease in SOC on 53% (moderate: 23%;large: 30%).
Saskatchewan: Soil organic carbon wasincreasing for 75% of cropland (moderate: 29%;large 46%) in 2001. This compares to increasingSOC for 17% of cropland in 1981. Negligible tosmall changes occurred on 13% of cropland, anda decrease in SOC on 12% (moderate: 10%;large: 2%).
Manitoba: Soil organic carbon showed anuptrend for 52% of cropland (moderate: 8%;large: 44%) in 2001. This compares to increasingSOC for 20% of cropland in 1981. Negligible tosmall changes occurred on 8% of cropland and a decrease in SOC on 40% (moderate: 28%;large: 12%).
Ontario: Soil organic carbon was on the rise for30% of cropland (moderate: 17%; large 13%) in2001. This compares to increasing SOC for 17%of cropland in 1981. Negligible to small changesoccurred on 12% of cropland and a decrease inSOC on 58% (moderate: 39%; large: 19%).
112
Quebec: Soil organic carbon was increasing for17% of cropland (moderate: 8%; large 9%) in2001. This compares to increasing SOC for 18%of cropland in 1981. No negligible to smallchanges were recorded, and SOC was decreasingon 83% of cropland (moderate: 17%; large: 66%).
Atlantic Provinces: Soil organic carbon wasincreasing for 53% of cropland (moderate: 10%;large: 43%) in 2001. This compares to increasingSOC for 43% of cropland in 1981. Negligible tosmall changes occurred on 8% of cropland, andSOC was decreasing on 39% (moderate: 23%;large: 16%).
INTERPRETATIONCanada: The Soil Organic Carbon ChangeIndicator clearly shows the beneficial effectsthat improvements in farm management havehad on agricultural soils in Canada over the last 15 years or so. The general uptrend in soilorganic carbon since 1986 can be attributed tothree main changes in cropland management:reduction in tillage intensity (especiallyincreased no-till) in all provinces, a reduction in summerfallow on the Prairies and an increasein hay and forage crops in most provinces.
The indicator does not provide a rigorous orcomplete inventory of SOC changes like thekind that would be needed to achieve a preciseassessment of how Canada’s cropland is affect-ing the atmospheric CO2 balance. Nevertheless,the indicator suggests that Canada’s croplandwent from being a net source of 5.1 Mt of CO2
per year in 1991 to a net sink of 4.4 Mt of CO2
per year by 2001. This represents an additionalenvironmental benefit of enhanced croplandmanagement practices.
Western Canada
Prairies: The general situation on the Prairies isthat past practices such as frequent summerfal-low, intensive tillage and few hay or foragecrops significantly degraded soil organic matter.The two goals for soil organic carbon changeshould be: (1) to stop soil organic carbon loss,especially where significant degradation isoccurring, and (2) to attain soil organic carbonchange rates that correspond to the moderate or large increase classes and that can reverseSOC degradation.
Recent changes in cropland management,including the adoption of reduced (AB: 36%; SK: 29%; MB: 33%) or no-tillage practices (AB: 27%; SK: 39%, MB: 13%), the reduction insummerfallow (e.g. between 1991 and 2001,summerfallow decreased from 16% to 11% ofcropland in AB, from 30% to 17% in SK, andfrom 6% to 5% in MB) and the increase in hayand forage crops (e.g. between 1991 and 2001,these crops increased from 16% to 24% of crop-land in AB, from 5% to 9% in SK and from 14%to 19% in MB) have either halted soil organiccarbon loss or produced soil organic carbongains. The Soil Organic Carbon ChangeIndicator shows a dramatic shift in the Prairieprovinces between 1991 and 2001 from a carbonloss position to a gain position. Relatively littleland fell into the “negligible to small change”class. However, the soil organic carbon gains onthe Prairies will not continue indefinitely. It ispredicted that, within a decade or two, the rateof gain will decrease as the soils approach a new“steady-state” SOC level on more cropland.
British Columbia: Like the Prairie provinces,British Columbia has increased the area of foragecrops (e.g. from 53% to 67% of cropland between1991 and 2001) and reduced summerfallow (from9% in 1991 to 6% in 2001). Although the rate ofreduced tillage adoption has not been as great asin the Prairies, the proportion of land on whichreduced or no-till approaches were appliedincreased from 17% in 1991 to 36% in 2001.Concurrently with these changes in managementpractices, the average SOC change situation wentfrom a moderate loss in 1991 and earlier years toa small change in 2001.
Eastern Canada
Overall, there has been less SOC degradation in the eastern provinces compared with the west-ern provinces, since farming practices historicallyhave involved more cropland devoted to hay pro-duction and no use of summerfallow. Therefore,in the eastern provinces, large increases in soilorganic carbon are not generally expected, excepton land where soil organic carbon has becomeseverely depleted due to excessive erosion. Thethree goals for Eastern Canada should thereforebe: (1) to stop soil organic carbon loss, especiallywhere the rate of loss is significant; (2) to increasesoil organic carbon wherever there has been significant loss; and (3) to maintain soil organiccarbon levels.
Environmental Sustainability of Canadian Agriculture: Agri-Environmental Indicator Report Series—Report #2
113C. Soil Quality
One-third (33%) of the cropland in the easternprovinces is predicted to experience a largedecrease in soil organic carbon. This problem isprimarily due to SOC loss due to excessive ero-sion on cropland with annual crops. Stoppingexcessive erosion is the recommended action tomaintain and improve soil health and function.
Quebec is the only province that showed a pat-tern opposite to the national trend, having hadmoderate soil organic carbon increases duringthe 1980s followed by moderate SOC decreases.Among the eastern provinces, Quebec aloneposted a significant decrease in total hay andfodder crops in recent years (from 0.87 M ha in 1991 to 0.78 M ha in 2001). In comparison,total hay and fodder crops remained relativelyconstant in Ontario (at about 1 M ha) andincreased in Atlantic Canada (from 0.19 M ha in1991 to 0.22 M ha in 2001). Furthermore, therehas been relatively little adoption of reducedtillage practices that have the potential to boost SOC levels (77% of cropland seeded withresidue-incorporating intensive tillage in 2001,compared with 52% in Ontario). Although thedowntrend in soil organic carbon is a matter of concern, the mean rate of SOC change inQuebec in 2001 does not differ greatly from that recorded for the rest of Eastern Canada(ON: -4 kg ha-1 yr-1; QC: -18 kg ha-1 yr-1;Atlantic: 3 kg ha-1 yr-1).
RESPONSE OPTIONSMaintaining soil organic carbon requires that asufficient amount of organic residues be addedto offset the carbon lost through decompositionand erosion. Reducing soil erosion is critical formaintaining or increasing SOC. Practices thatcan help to reduce soil erosion include reducingtillage, planting cover crops, strip cropping,tillage along contours, grassed waterways andwater control structures, as well as reducing bare summerfallow.
Practices that can increase organic residuesinclude the following: removing crop residuesseldom or not at all; refraining from burningcrop residues; applying manure or compost tosoils (especially to soils that are degraded inSOC); reducing the amount of summerfallow;providing adequate crop fertilization; proper irrigation scheduling; rotating crops that pro-duce little crop residue, such as potato, with
crops that produce abundant crop residue, such as grains, growing cover crops and/or greenmanure crops; and maintaining good range andpasture conditions. Practices that help to lessenthe decomposition of SOC include reducingtillage, growing perennial crops and reducingsummerfallow.
REFERENCESParton, W.J., D.S. Schimel, C.V. Cole, and D.S.Ojima, 1987. Analysis of factors controlling soilorganic matter levels in Great Plains grasslands.Soil Science Society of America Journal. 51: 173-1179.
Parton, W.J., J.W.B. Stewart, C.V. Cole, 1988.Dynamics of C, N, P and S in grassland soils: a model. Biogeochemistry. 5: 109-131.
Shelton, I.J., G.J. Wall, J.-M. Cossette, R. Eilers, B. Grant, D. King, G. Padbury, H. Rees, J. Tajek, and L. van Vliet, 2000. “Risk of water erosion”. Pages 59-67 inEnvironmental Sustainability of CanadianAgriculture: Report of the Agri-EnvironmentalIndicator Project, Edited by T. McRae, C.A.S.Smith and L.J. Gregorich. Agriculture and Agri-Food Canada, Ottawa (Ont.). www.agr.gc.ca/env/naharp-pnarsa
Smith, W.N., P. Rochette, C. Monreal, R.L.Desjardins, E. Pattey, and A. Jaques, 1997. The Rate of Carbon Change in Agricultural Soils in Canada at the Landscape Level. CanadianJournal of Soil Science. 77 (2): 219-229.
Smith, W.N., G. Wall, R.L. Desjardins, and B.Grant, 2000. “Soil Organic Carbon”. Pages 85-92in Environmental Sustainability of CanadianAgriculture: Report of the Agri-EnvironmentalIndicator Project, Edited by T. McRae, C.A.S.Smith and L.J. Gregorich. Agriculture and Agri-Food Canada, Ottawa (Ont.).www.agr.gc.ca/env/naharp-pnarsa
Smith, W.N., R.L. Desjardins, and E. Pattey,2000. The Net Flux of Carbon From AgriculturalSoils in Canada 1970–2010. Global ChangeBiology. 6(5): 557-568.
THE ISSUEMany prairie soils contain naturally high levelsof water-soluble salts, including the sulphates ofsodium, calcium and magnesium. At very lowlevels, some of these salts are used as nutrientsby plants. However, as soluble salts accumulatein the plant root zone during the naturalprocess called soil salinization, they canadversely affect plant growth. The effect of salin-ization on plants is similar to drought becauseas the concentration of dissolved salts increases,the ability of the plant roots to absorb bothwater and nutrients decreases. At high levels ofsalts, normal crop growth is restricted and yieldsare reduced. For example, moderate to severesoil salinity can reduce yields of most cereal andoilseed crops by at least 50%. Depending on thetype of salts present, toxicity may result fromboron, sodium and/or chloride in isolated cases.
The process of dryland soil salinization beginswhen water from excess precipitation in onepart of the landscape moves down below theroot zone, carrying dissolved salts to the water
table. Groundwater flow then carries these dissolved salts to low-lying areas, where thewater table is typically closer to the soil surface.The process ends in these locations when thewater evaporates, leaving the salts behind, andthey accumulate at or near the soil surface aswhite crusts or as crystalline precipitates in the soil profile.
Although a water deficit is the prime factor necessary for salinization to occur, several otherfactors help to control the process, most of thembeyond human control: topography, inherent saltcontent of the soil parent material, the underly-ing geology and hydrology. Land use practicescan also have a major impact on local hydrology,either exacerbating or mitigating soil salinization.A primary example is the practice of summerfal-low, in which some land is maintained withoutactively growing plant cover during the growingseason. The lack of plant cover allows more pre-cipitation to be stored in the soil, sometimescausing the water table to rise. Permanent plantcover and continuous cropping are practices that
SUMMARYAt very low levels, some salts that are naturally present in soils are taken up by plants as nutrients. However,
at higher levels, soluble salts can inhibit the ability of the plant roots to absorb both water and nutrients and
thus restrict crop growth, resulting in lower yields. Some land use practices contribute substantially to soil
salinization by affecting the quantity and the flow of water and salts through the root zone. The practice of
summerfallow typically increases water content in the root zone, which can lead to an elevated water table and
increasing levels of soluble salts at or near the soil surface. By contrast, permanent cover and continuous crop-
ping are two practices that promote water use from the root zone, lower the water table and reduce the potential
for salinization. The Risk of Soil Salinization Indicator (RSS) has been developed to assess changes in the risk of
dryland soil salinization in the Prairies as a function of changing land-use and management practices that
influence the amount and movement of water and salts in the root zone.
In 2001, almost 12% of the land area in the agricultural regions of the Prairies (8 million ha) was rated as
having a moderate, high or very high risk of salinization. This represents a significant improvement from
the 1981 value of 18%. The decline in the higher risk classes is balanced by an increase in the proportion
of land presenting a very low risk of salinization, which went from 62% to 70% over the 20-year period
studied. This improvement can largely be attributed to the reduction in summerfallow, which went from
an area of 9.5 million hectares in 1981 to 4.6 million hectares by 2001, as farmers moved to implement
continuous cropping. The area under permanent cover also increased but this change was less dramatic
and had a smaller impact on the risk of soil salinization. Although the problem is far from eliminated,
there is a trend towards greater soil health and agri-environmental sustainability, which is attributed to
current land use and management practices, programs and policies.
114 Environmental Sustainability of Canadian Agriculture: Agri-Environmental Indicator Report Series—Report #2
AUTHORS:
B.H. Wiebe, R.G. Eilers,
W.D. Eilers andJ.A. Brierley
INDICATOR NAME:
Risk of SoilSalinization
STATUS:
Provincial coverage
(AB, SK, MB), 1981 to 2001
15. Soil Salinity
115C. Soil Quality
help to keep excess soil water from becomingredistributed within the landscape, since theplant cover or crops absorb more of the waterwhere it enters the soil, thereby reducing therisk of salinization occurring in other areas.
THE INDICATORThe Risk of Soil Salinization Indicator has beendeveloped to assess and track changes in the risk of soil salinization in the Prairies relative tochanges in land use and management practices.The indicator does not measure the actual area ofsaline land or the area affected by an increase inthe degree or extent of salinity. Instead, it evalu-ates the potential for increasing soil salinity that isassociated with the agricultural land use patternsof the day. This indicator therefore reflects howthe agricultural industry is performing with respectto the goals of sustainable agriculture, specificallythe long-term impacts on quality of agriculturalsoils and adjacent non-agricultural soils.
The indicator results are expressed in five classes of risk for potential degradation of soilquality: very low (risk is negligible); low (risk isacceptable); moderate (awareness of the situa-tion is important); high (heightened concern is warranted); and very high (immediate attention is likely required). The class limitswere determined by first calculating assumedbest and worst case scenarios and then subdivid-ing the continuum to reflect relative levels ofland use and management impacts. The mapclasses are based on weighted average risks forgiven land areas (polygons), and therefore themost sensitive portions will be at higher risk andthe remainder at lower risk than indicated bythe risk class. The performance objective for thisindicator is to have an increasing portion ofland in the very low and low risk classes.
CALCULATION METHODThe Risk of Soil Salinization Indicator (RSS) isderived by calculating a salinity risk index (SRI)(Eilers et al. 1997). The SRI is used to rank indi-vidual land areas according to the relative risk of the areas becoming more saline under a givenmanagement program. The following factors are used in the calculation:
• Soil salinity status within the landscape,which is derived from a new soil salinitymap showing the presence and extent of
salinity in the agricultural regions of theCanadian Prairies; the map itself represents a compilation of information available from recent, detailed digital databases foreach province, salinity surveys, published soilsurvey reports and provincial expert opinion.
• Topography and soil drainage classes were obtained from the Soil Landscapes of Canada (SLC) version 3.0 polygon component table for the provinces.
• Growing season climatic moisture deficits(May through August) were derived from the ecodistrict precipitation and potentialevapotranspiration values calculated using the 1961-1990 30-year climate normals(Agriculture and Agri-Food Canada 1997).
• Land use data were obtained from theCensus of Agriculture for the 1981, 1986,1991, 1996 and 2001 Census years.
The first three factors were considered to remain constant over the time period covered by the analysis in order to isolate the impact of land use changes as determined from Censusof Agriculture data. Land under summerfallowwas considered to be at highest risk; land under permanent cover was associated with the lowest risk; and land under annual croppingwas deemed to be at an intermediate risk level.Because the Census does not distinguish betweenannual and perennial forage crops (other thanalfalfa and silage corn), the area of “other tamehay and fodder crops” was included as perma-nent cover for the purposes of this analysis.
An expert committee for soil salinity in thePrairies developed a weighting for the differentfactors to be used in calculating the SRI, based on the presumed influence of these factors onthe process of soil salinization. The weighting of the land use factor was based on the percentof permanent cover in each SLC polygon, combined with the portion of annual croplanddevoted to summerfallow. The SRI is the unitlessmultiplicative total of the individual factor values for each component soil. The values forthe components within a polygon were thenarea-weighted to arrive at the SRI value for thepolygon. The SRI values were grouped into fiverisk classes for the RSS Indicator, which weresubsequently displayed on a map to spatiallyillustrate the change in risk from one Censusyear to the next.
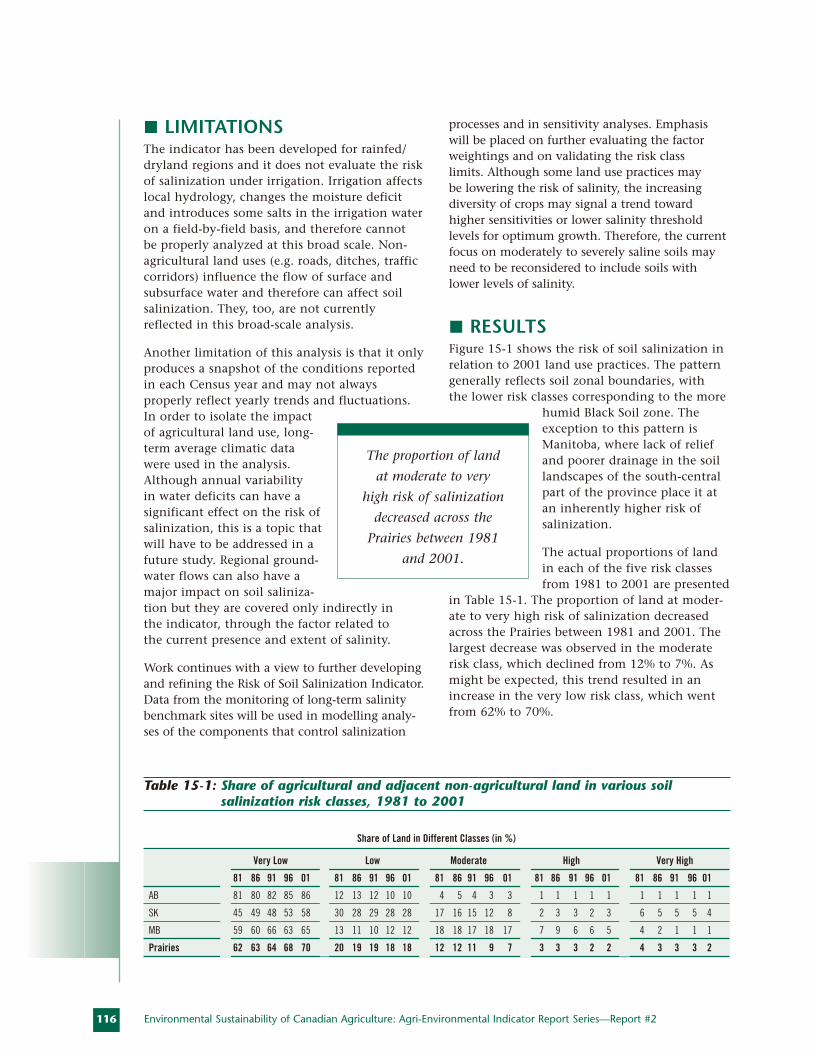
116
LIMITATIONSThe indicator has been developed for rainfed/dryland regions and it does not evaluate the riskof salinization under irrigation. Irrigation affectslocal hydrology, changes the moisture deficitand introduces some salts in the irrigation wateron a field-by-field basis, and therefore cannot be properly analyzed at this broad scale. Non-agricultural land uses (e.g. roads, ditches, trafficcorridors) influence the flow of surface and subsurface water and therefore can affect soilsalinization. They, too, are not currentlyreflected in this broad-scale analysis.
Another limitation of this analysis is that it onlyproduces a snapshot of the conditions reportedin each Census year and may not always properly reflect yearly trends and fluctuations.In order to isolate the impactof agricultural land use, long-term average climatic datawere used in the analysis.Although annual variability in water deficits can have asignificant effect on the risk ofsalinization, this is a topic thatwill have to be addressed in afuture study. Regional ground-water flows can also have amajor impact on soil saliniza-tion but they are covered only indirectly in the indicator, through the factor related to the current presence and extent of salinity.
Work continues with a view to further developingand refining the Risk of Soil Salinization Indicator.Data from the monitoring of long-term salinitybenchmark sites will be used in modelling analy-ses of the components that control salinization
processes and in sensitivity analyses. Emphasiswill be placed on further evaluating the factorweightings and on validating the risk class limits. Although some land use practices may be lowering the risk of salinity, the increasingdiversity of crops may signal a trend towardhigher sensitivities or lower salinity threshold levels for optimum growth. Therefore, the currentfocus on moderately to severely saline soils mayneed to be reconsidered to include soils withlower levels of salinity.
RESULTSFigure 15-1 shows the risk of soil salinization inrelation to 2001 land use practices. The patterngenerally reflects soil zonal boundaries, with the lower risk classes corresponding to the more
humid Black Soil zone. Theexception to this pattern isManitoba, where lack of reliefand poorer drainage in the soillandscapes of the south-centralpart of the province place it atan inherently higher risk ofsalinization.
The actual proportions of landin each of the five risk classesfrom 1981 to 2001 are presented
in Table 15-1. The proportion of land at moder-ate to very high risk of salinization decreasedacross the Prairies between 1981 and 2001. Thelargest decrease was observed in the moderaterisk class, which declined from 12% to 7%. Asmight be expected, this trend resulted in anincrease in the very low risk class, which wentfrom 62% to 70%.
Environmental Sustainability of Canadian Agriculture: Agri-Environmental Indicator Report Series—Report #2
Share of Land in Different Classes (in %)
Very Low Low Moderate High Very High
81 86 91 96 01 81 86 91 96 01 81 86 91 96 01 81 86 91 96 01 81 86 91 96 01
AB 81 80 82 85 86 12 13 12 10 10 4 5 4 3 3 1 1 1 1 1 1 1 1 1 1
SK 45 49 48 53 58 30 28 29 28 28 17 16 15 12 8 2 3 3 2 3 6 5 5 5 4
MB 59 60 66 63 65 13 11 10 12 12 18 18 17 18 17 7 9 6 6 5 4 2 1 1 1
Prairies 62 63 64 68 70 20 19 19 18 18 12 12 11 9 7 3 3 3 2 2 4 3 3 3 2
Table 15-1: Share of agricultural and adjacent non-agricultural land in various soil salinization risk classes, 1981 to 2001
The proportion of land
at moderate to very
high risk of salinization
decreased across the
Prairies between 1981
and 2001.
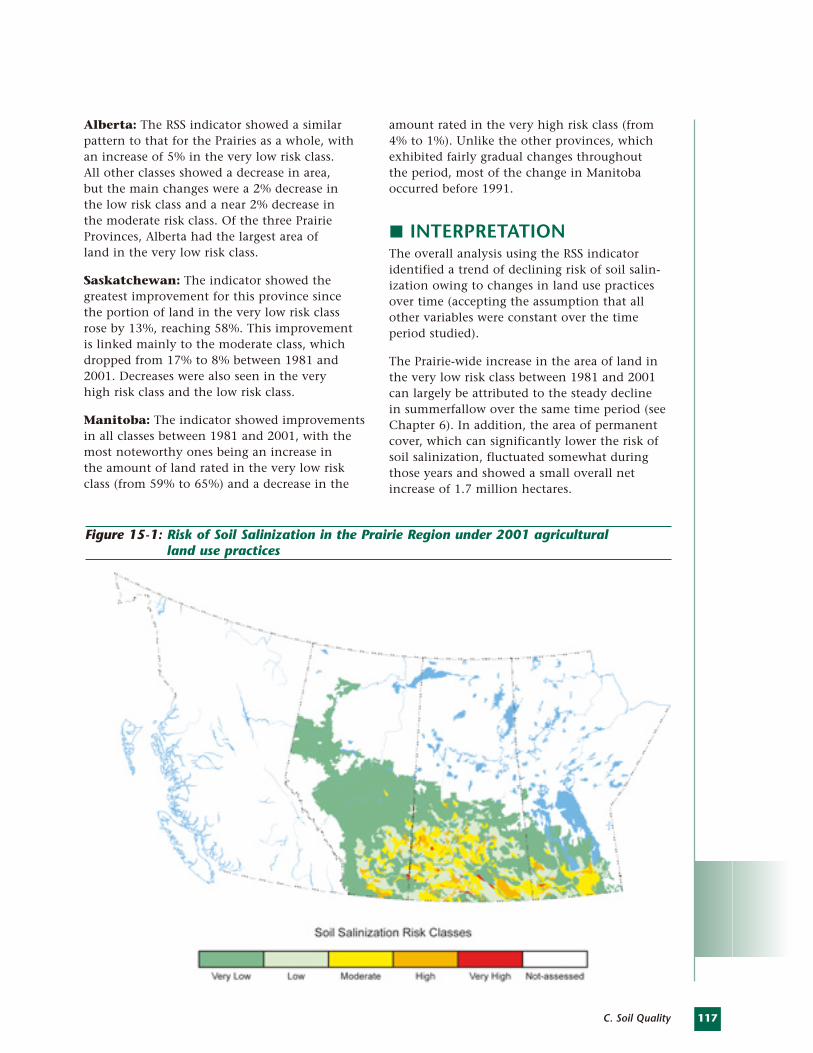
117C. Soil Quality
Alberta: The RSS indicator showed a similarpattern to that for the Prairies as a whole, withan increase of 5% in the very low risk class. All other classes showed a decrease in area, but the main changes were a 2% decrease in the low risk class and a near 2% decrease in the moderate risk class. Of the three PrairieProvinces, Alberta had the largest area of land in the very low risk class.
Saskatchewan: The indicator showed thegreatest improvement for this province since the portion of land in the very low risk classrose by 13%, reaching 58%. This improvementis linked mainly to the moderate class, whichdropped from 17% to 8% between 1981 and2001. Decreases were also seen in the very high risk class and the low risk class.
Manitoba: The indicator showed improvementsin all classes between 1981 and 2001, with themost noteworthy ones being an increase in the amount of land rated in the very low riskclass (from 59% to 65%) and a decrease in the
amount rated in the very high risk class (from4% to 1%). Unlike the other provinces, whichexhibited fairly gradual changes throughout the period, most of the change in Manitobaoccurred before 1991.
INTERPRETATIONThe overall analysis using the RSS indicatoridentified a trend of declining risk of soil salin-ization owing to changes in land use practicesover time (accepting the assumption that allother variables were constant over the timeperiod studied).
The Prairie-wide increase in the area of land inthe very low risk class between 1981 and 2001can largely be attributed to the steady decline in summerfallow over the same time period (seeChapter 6). In addition, the area of permanentcover, which can significantly lower the risk ofsoil salinization, fluctuated somewhat duringthose years and showed a small overall netincrease of 1.7 million hectares.
Figure 15-1: Risk of Soil Salinization in the Prairie Region under 2001 agricultural land use practices
118
Alberta: The decrease in risk level across muchof the agricultural region paralleled the steadydecrease in summerfallow area between 1981and 2001, as farmers gradually moved to continuous cropping, even in the Brown SoilZone. Changes in permanent cover did not havea detectable impact on the risk of salinizationexcept for a few areas in the southern and east-ern regions of the province, where the situationimproved due to both a decrease in summerfal-low and an increase in permanent cover.
Saskatchewan: The steady decrease in salinization risk observed in Saskatchewan wasmirrored by an analogous trend in the use ofsummerfallow. Summerfallow decreased inalmost all of the agricultural regions of theprovince, with the exception of some areas inthe west and southwest.
Manitoba: A decrease in risk of salinizationalso occurred in Manitoba, but a different pattern is seen than in the other two PrairieProvinces. The area in each risk class remainedfairly constant from one Census year to thenext, except for a significant decrease in riskbetween 1986 and 1991 coinciding with a 40%reduction in summerfallow area. Despite severaldrier than normal years, reductions in summer-fallow between 1986 and 1991 apparentlyreflected a continuation of an earlier trend thatwas likely driven by a greater than three-foldincrease in the price of wheat between 1971 and 1981 (Manitoba 2004). Although the area of permanent cover did increase across theprovince, mostly between 1996 and 2001, this change was not accompanied by a similardecrease in salinization risk. The south-centralregion of the province showed little change in land use and hence little change in salinization risk.
RESPONSE OPTIONSBeneficial management practices that producerscan use to reduce the risk of dryland salinizationfocus on soil-water management. The majorityof these involve land use changes designed toincrease the use of precipitation where it falls
and hence reduce the movement of excess water(and leaching of salts) through the soil to thewater table. Where high water tables are alreadya concern, increased water extraction from thesubsoil by deep-rooted plants tends to reducesurface evaporation of water and therefore salinization. Land and water management practices that help to reduce the risk of drylandsalinization include reducing summerfallow;increasing the area of perennial forages, pastureand tree crops; increasing minimum tillage or no-till; including more salt-tolerant crops inrotations in regions affected by soil salinity;planting deep-rooting perennial crops in placeswhere excess moisture is causing salinization;using inputs such as mineral fertilizer and ani-mal manures more effectively; using appropriate surface drainage; installing interceptor foragestrips or strategic subsurface tile (plastic)drainage; managing snow to prevent deep snowdrifts which can cause localized excessmoisture; using new technologies such as precision farming; and monitoring groundwaterdepth in sensitive areas as an aid in selectingcrop rotations.
REFERENCESAgriculture and Agri-Food Canada, 1997.Canadian Ecodistrict Climate Normals 1961-1990.http://sis.agr.gc.ca/cansis/nsdb/ecostrat/district/climate.html
Eilers, R.G., W.D. Eilers, and M.M. Fitzgerald,1997. A Salinity Risk Index for Soils of theCanadian Prairies. Hydrogeology Journal. 5 (1): 68-79.
Manitoba Agriculture, Food and RuralInitiatives, 2004. Manitoba Agriculture Yearbook2002, 39th ed. Manitoba Agriculture, Food andRural Initiatives, Program and Policy AnalysisBranch, Winnipeg (Man.).
Environmental Sustainability of Canadian Agriculture: Agri-Environmental Indicator Report Series—Report #2
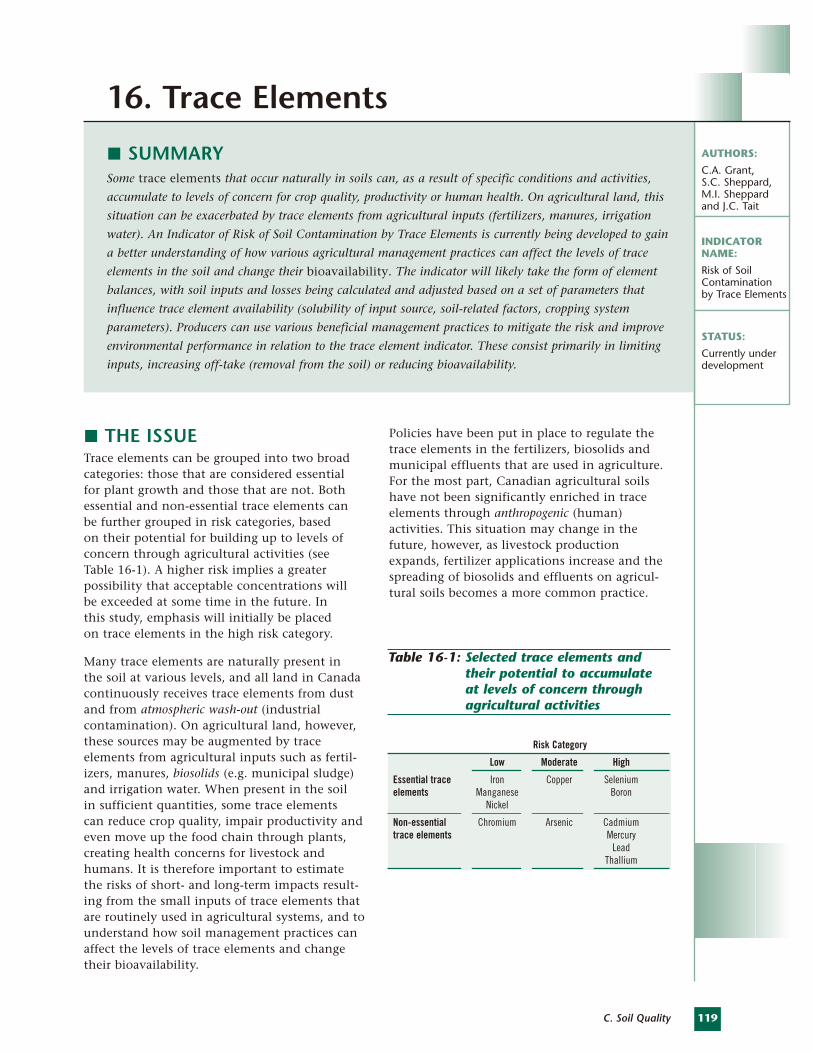
C. Soil Quality
THE ISSUETrace elements can be grouped into two broadcategories: those that are considered essential for plant growth and those that are not. Bothessential and non-essential trace elements canbe further grouped in risk categories, based on their potential for building up to levels ofconcern through agricultural activities (see Table 16-1). A higher risk implies a greater possibility that acceptable concentrations will be exceeded at some time in the future. In this study, emphasis will initially be placed on trace elements in the high risk category.
Many trace elements are naturally present in the soil at various levels, and all land in Canadacontinuously receives trace elements from dustand from atmospheric wash-out (industrial contamination). On agricultural land, however,these sources may be augmented by trace elements from agricultural inputs such as fertil-izers, manures, biosolids (e.g. municipal sludge)and irrigation water. When present in the soil in sufficient quantities, some trace elements can reduce crop quality, impair productivity andeven move up the food chain through plants,creating health concerns for livestock andhumans. It is therefore important to estimatethe risks of short- and long-term impacts result-ing from the small inputs of trace elements thatare routinely used in agricultural systems, and tounderstand how soil management practices canaffect the levels of trace elements and changetheir bioavailability.
Policies have been put in place to regulate thetrace elements in the fertilizers, biosolids andmunicipal effluents that are used in agriculture.For the most part, Canadian agricultural soilshave not been significantly enriched in traceelements through anthropogenic (human) activities. This situation may change in thefuture, however, as livestock productionexpands, fertilizer applications increase and thespreading of biosolids and effluents on agricul-tural soils becomes a more common practice.
SUMMARYSome trace elements that occur naturally in soils can, as a result of specific conditions and activities,
accumulate to levels of concern for crop quality, productivity or human health. On agricultural land, this
situation can be exacerbated by trace elements from agricultural inputs (fertilizers, manures, irrigation
water). An Indicator of Risk of Soil Contamination by Trace Elements is currently being developed to gain
a better understanding of how various agricultural management practices can affect the levels of trace
elements in the soil and change their bioavailability. The indicator will likely take the form of element
balances, with soil inputs and losses being calculated and adjusted based on a set of parameters that
influence trace element availability (solubility of input source, soil-related factors, cropping system
parameters). Producers can use various beneficial management practices to mitigate the risk and improve
environmental performance in relation to the trace element indicator. These consist primarily in limiting
inputs, increasing off-take (removal from the soil) or reducing bioavailability.
119
AUTHORS:
C.A. Grant, S.C. Sheppard,M.I. Sheppardand J.C. Tait
INDICATOR NAME:
Risk of SoilContamination by Trace Elements
STATUS:
Currently underdevelopment
16. Trace Elements
Risk Category
Low Moderate High
Essential trace Iron Copper Seleniumelements Manganese Boron
Nickel
Non-essential Chromium Arsenic Cadmiumtrace elements Mercury
LeadThallium
Table 16-1: Selected trace elements andtheir potential to accumulate at levels of concern throughagricultural activities
120
THE INDICATORAn Indicator of Risk of Soil Contamination byTrace Elements is currently being developed toprovide a means of estimating the accumulationof trace elements in agricultural soils. Amongother attributes, this indicator will have thecapacity to:
• estimate inputs to all major agriculturalresources across Canada;
• be responsive to management measures that are initiated to control inputs;
• account for toxic or health effect thresholds;
• account for the cumulativeeffects of multiple contaminants;
• be sensitive to various soilconditions that influencethe bioavailability of trace elements;
• accommodate all Canadianclimatic conditions.
The indicator will calculate abalance for individual trace elements by considering soil inputs and losses,and it will integrate both temporal and spatialaspects. The model used will also allow an over-all indicator to be calculated for all the traceelements combined, and it will take background(natural) concentrations of the trace elementsinto account. These calculations will be done fora series of Soil Landscape of Canada (SLC) units.The “picture” that is obtained will nonethelessinclude the potential impact of “hot spots,” orsmall areas where the risk level is higher thanfor the summarized SLC situation. When themodel is ready, it will be applied to a region on a pilot basis to evaluate the proposedmethodology before it is used at the nationalscale. Information will be obtained to determinethe critical load of these trace elements such as done for smelter emissions by Doyle et al.(2003). These critical loads could be based, for example, on CCME (Canadian Council of Ministers of the Environment) guidelines (CCME 2002).
CALCULATION METHOD The Indicator of Risk of Soil Contamination by Trace Elements will be calculated using amathematical model that will determine traceelement availability, based on net accumulation,relevant soil characteristics and managementfactors. The net accumulation of trace elementsfrom agricultural activity will be determinedusing a total input minus total loss approach.The net accumulation information will then beadjusted to account for a series of parametersthat influence trace element availability, such as the solubility of the input source; soil-related factors (e.g. pH, organic matter
content); environmental factors (e.g. climate); croppingsystem parameters (e.g. tillagesystem, nutrient rate, cropselection and rotation)(Sheppard and Sheppard,2004). The data needed to compute the indicator havebeen reviewed. In general, the indicator will harness georeferenced soil data to create a base map that will belayered with the trace element
information. However, the information abouttrace element inputs is not georeferenced in sufficient detail at present.
In toxicity assessment, multiple contaminantsare typically present and they can interact with one another. A conceptual model has been developed that sums up the risk of impactsassociated with a variety of trace elements frommultiple sources. This will allow the indicator to be reported as a single quantity (as opposedto having a separate quantity for each trace ele-ment). This single quantity may be expressed asthe relative proportions of agricultural land thatfall in defined risk categories, representing therisk of eventually exceeding acceptable soil concentrations of trace elements.
LIMITATIONSAlthough creating the Indicator of Risk of SoilContamination by Trace Elements is a feasibletask, and one that involves drawing on relatedindicators described in the literature, there are a number of factors pertaining to both themodel itself and the input data that may limitthe indicator results.
Environmental Sustainability of Canadian Agriculture: Agri-Environmental Indicator Report Series—Report #2
When present in
the soil in sufficient
quantities, some trace
elements can reduce
crop quality, impair
productivity and even
move up the food chain.
121C. Soil Quality
• There is likely to be a large degree of spatialvariability in the inputs that will need to beaddressed to account for the impact on soilareas near urban centres and to be able toidentify “hot spots” within these definedareas. A method will have to be developedto account for the fact that, for example,some farms may accept urban biosolids butadjacent farms may not.
• The CCME guidelines (CCME 2002) do notsufficiently reflect soil properties, and onechallenge facing us will be to derive accept-able upper-limit soil concentrations that are a function of soil properties.
• Since there is no simple and inclusivemethod for assessing the impact of multiplecontaminants, several approaches may needto be considered.
• There is no central registry to track inputsfrom soil amendments such as biosolids, so inputs will have to be estimated from regional averages and statistical characteristics.
• Biosolids and wastewater quality and characteristics vary among the provincesand municipalities, and records of thesehave only begun to be maintained recently.
• Information on the levels of trace elementsin feed supplements belongs to the feedmanufacturers; and so a method will have to be developed to calculate a probablerange of values.
RESULTSThis indicator is currently under developmentand results are not yet available.
RESPONSE OPTIONS There are some beneficial management practicesthat producers can implement to mitigate riskand improve environmental performance inrelation to the trace element indicator. Theseconsist mainly in limiting inputs, increasing off-take or reducing bioavailability. Limitingcontaminant inputs at source is certainly theoverriding mitigation factor, particularly in areas where the bioavailability of added traceelements is likely to be high. This can be
achieved by controlling trace element levels infeed and fertilizer sources, reducing these inputsthrough improved nutrient use efficiency andreducing trace elements in biosolids or manureused for land application.
Beneficial management practices that canincrease off-take include promoting optimumcrop yields and bioremediation based on removing crop residues from accumulator crops and using them in non-food systems(ethanol production, straw board, flax fibreuses), to prevent the transfer of trace elementsto the food chain. Finally, practices that canreduce bioavailability include targeted nitrogenapplication rates (as nitrogen can increase the solubility of some trace elements), fertilizer source (as the source can influence the bioavailability of trace elements), cropsequencing, optimizing micronutrients, pHmodification in acid soils, organic mattermanipulation, crop and cultivar selection andavoiding the addition of chloride in irrigationwater (Grant et al. 1999).
REFERENCESCCME (Canadian Council of Ministers of theEnvironment) and the National Guidelines and Standards Office (NGSO), 2002. CanadianEnvironmental Quality Guidelines. EnvironmentCanada, NGSO, Ottawa (Ont.).www.ec.gc.ca/CEQG-RCQE/ English/default.cfm
Doyle, P. J., D.W. Gutzman, M.I. Sheppard, S.C. Sheppard, G.A. Bird, and D. Hrebenyk,2003. An Ecological Risk Assessment of AirEmissions of Trace Metals From Copper And ZincProduction Facilities. Human and Ecological Risk Assessment. 9 (2): 607-636.
Grant, C.A., L.D. Bailey, M.J. McLaughlin andB.R. Singh, 1999. “Management Factors WhichInfluence Cadmium Concentrations in Crops”.Pages 151-198 in Cadmium in Soils and Plants,McLaughlin M.J. and B.R. Singh (eds). KluwerAcademic Publishers, Dordrecht (Netherlands).
Sheppard, S.C. and M.I. Sheppard, 2004. TraceElement Contamination – NAHARP Scoping Paper.Agriculture and Agri-Food Canada, NAHARP(National Agri-Environmental Health Analysisand Reporting Program), Ottawa (Ont.).

DWater Quality
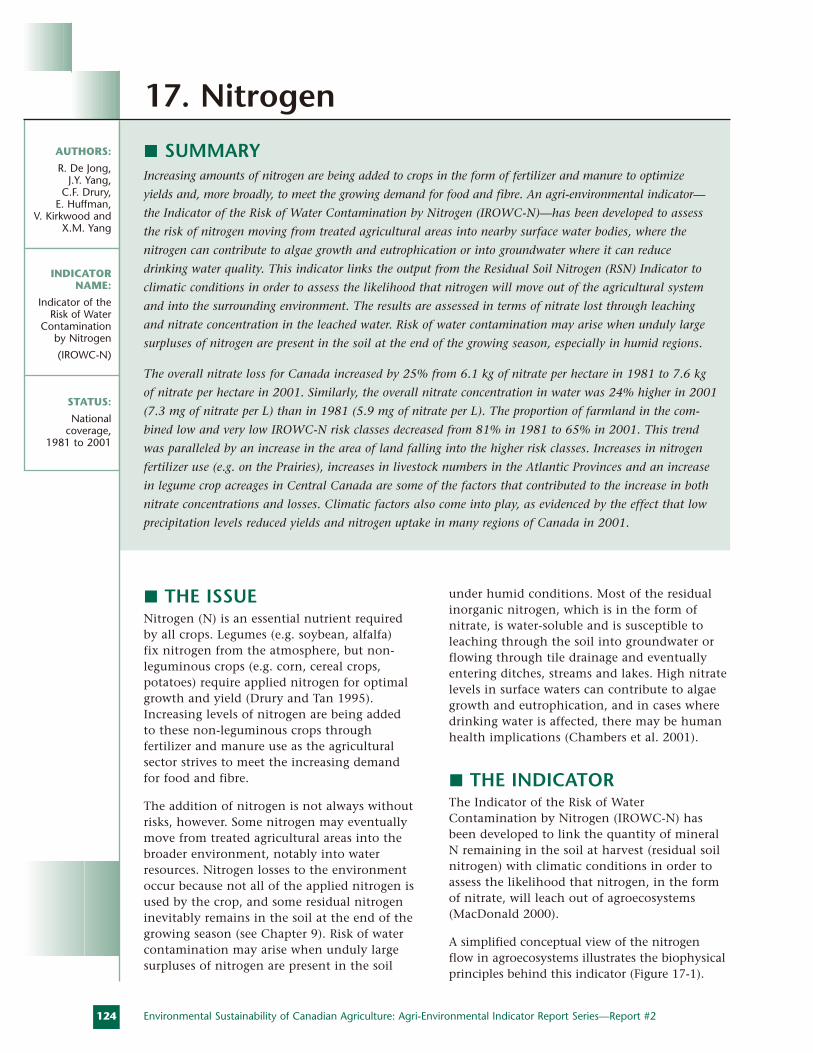
THE ISSUENitrogen (N) is an essential nutrient required by all crops. Legumes (e.g. soybean, alfalfa) fix nitrogen from the atmosphere, but non-leguminous crops (e.g. corn, cereal crops, potatoes) require applied nitrogen for optimalgrowth and yield (Drury and Tan 1995).Increasing levels of nitrogen are being added to these non-leguminous crops through fertilizer and manure use as the agricultural sector strives to meet the increasing demand for food and fibre.
The addition of nitrogen is not always withoutrisks, however. Some nitrogen may eventuallymove from treated agricultural areas into thebroader environment, notably into waterresources. Nitrogen losses to the environmentoccur because not all of the applied nitrogen isused by the crop, and some residual nitrogeninevitably remains in the soil at the end of thegrowing season (see Chapter 9). Risk of watercontamination may arise when unduly large surpluses of nitrogen are present in the soil
under humid conditions. Most of the residualinorganic nitrogen, which is in the form ofnitrate, is water-soluble and is susceptible toleaching through the soil into groundwater orflowing through tile drainage and eventuallyentering ditches, streams and lakes. High nitratelevels in surface waters can contribute to algaegrowth and eutrophication, and in cases wheredrinking water is affected, there may be humanhealth implications (Chambers et al. 2001).
THE INDICATORThe Indicator of the Risk of WaterContamination by Nitrogen (IROWC-N) hasbeen developed to link the quantity of mineralN remaining in the soil at harvest (residual soilnitrogen) with climatic conditions in order toassess the likelihood that nitrogen, in the formof nitrate, will leach out of agroecosystems(MacDonald 2000).
A simplified conceptual view of the nitrogen flow in agroecosystems illustrates the biophysicalprinciples behind this indicator (Figure 17-1).
SUMMARYIncreasing amounts of nitrogen are being added to crops in the form of fertilizer and manure to optimize
yields and, more broadly, to meet the growing demand for food and fibre. An agri-environmental indicator—
the Indicator of the Risk of Water Contamination by Nitrogen (IROWC-N)—has been developed to assess
the risk of nitrogen moving from treated agricultural areas into nearby surface water bodies, where the
nitrogen can contribute to algae growth and eutrophication or into groundwater where it can reduce
drinking water quality. This indicator links the output from the Residual Soil Nitrogen (RSN) Indicator to
climatic conditions in order to assess the likelihood that nitrogen will move out of the agricultural system
and into the surrounding environment. The results are assessed in terms of nitrate lost through leaching
and nitrate concentration in the leached water. Risk of water contamination may arise when unduly large
surpluses of nitrogen are present in the soil at the end of the growing season, especially in humid regions.
The overall nitrate loss for Canada increased by 25% from 6.1 kg of nitrate per hectare in 1981 to 7.6 kg
of nitrate per hectare in 2001. Similarly, the overall nitrate concentration in water was 24% higher in 2001
(7.3 mg of nitrate per L) than in 1981 (5.9 mg of nitrate per L). The proportion of farmland in the com-
bined low and very low IROWC-N risk classes decreased from 81% in 1981 to 65% in 2001. This trend
was paralleled by an increase in the area of land falling into the higher risk classes. Increases in nitrogen
fertilizer use (e.g. on the Prairies), increases in livestock numbers in the Atlantic Provinces and an increase
in legume crop acreages in Central Canada are some of the factors that contributed to the increase in both
nitrate concentrations and losses. Climatic factors also come into play, as evidenced by the effect that low
precipitation levels reduced yields and nitrogen uptake in many regions of Canada in 2001.
124 Environmental Sustainability of Canadian Agriculture: Agri-Environmental Indicator Report Series—Report #2
AUTHORS:
R. De Jong, J.Y. Yang,
C.F. Drury, E. Huffman,
V. Kirkwood andX.M. Yang
INDICATOR NAME:
Indicator of theRisk of Water
Contamination by Nitrogen
(IROWC-N)
STATUS:
National coverage,
1981 to 2001
17. Nitrogen
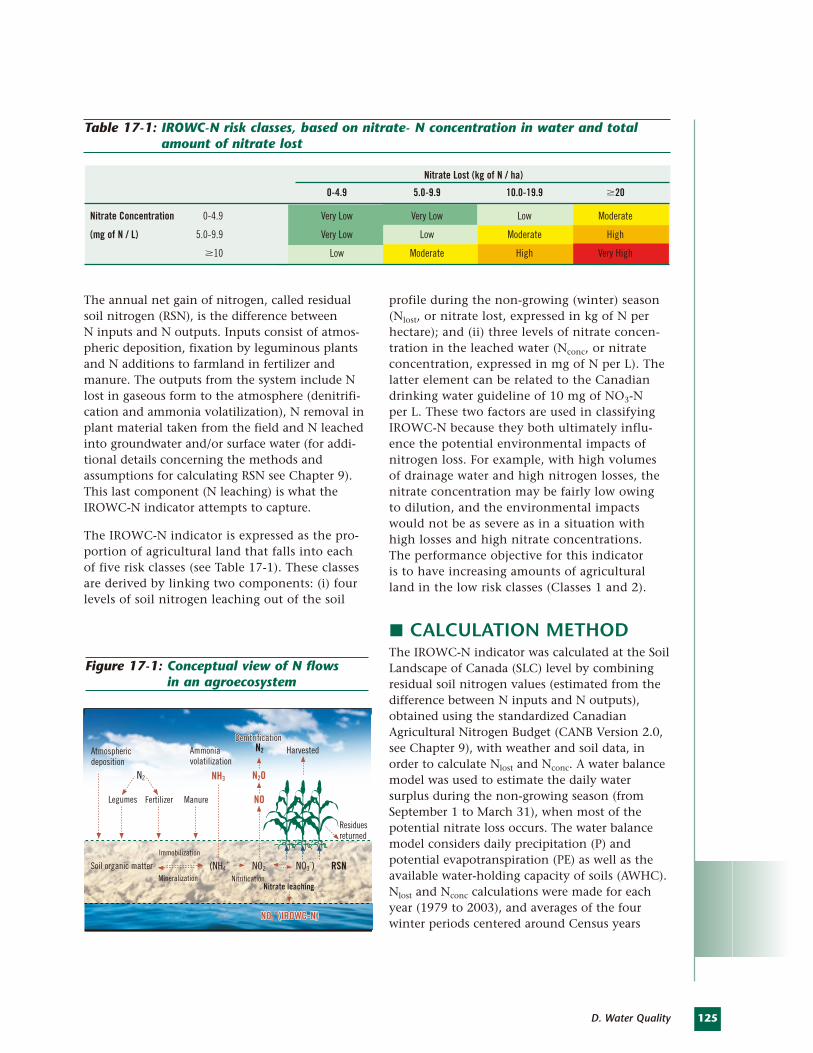
125D. Water Quality
The annual net gain of nitrogen, called residualsoil nitrogen (RSN), is the difference between N inputs and N outputs. Inputs consist of atmos-pheric deposition, fixation by leguminous plantsand N additions to farmland in fertilizer andmanure. The outputs from the system include Nlost in gaseous form to the atmosphere (denitrifi-cation and ammonia volatilization), N removal inplant material taken from the field and N leachedinto groundwater and/or surface water (for addi-tional details concerning the methods andassumptions for calculating RSN see Chapter 9).This last component (N leaching) is what theIROWC-N indicator attempts to capture.
The IROWC-N indicator is expressed as the pro-portion of agricultural land that falls into eachof five risk classes (see Table 17-1). These classesare derived by linking two components: (i) fourlevels of soil nitrogen leaching out of the soil
profile during the non-growing (winter) season(Nlost, or nitrate lost, expressed in kg of N perhectare); and (ii) three levels of nitrate concen-tration in the leached water (Nconc, or nitrateconcentration, expressed in mg of N per L). Thelatter element can be related to the Canadiandrinking water guideline of 10 mg of NO3-N per L. These two factors are used in classifyingIROWC-N because they both ultimately influ-ence the potential environmental impacts ofnitrogen loss. For example, with high volumesof drainage water and high nitrogen losses, thenitrate concentration may be fairly low owing to dilution, and the environmental impactswould not be as severe as in a situation withhigh losses and high nitrate concentrations. The performance objective for this indicator is to have increasing amounts of agriculturalland in the low risk classes (Classes 1 and 2).
CALCULATION METHODThe IROWC-N indicator was calculated at the SoilLandscape of Canada (SLC) level by combiningresidual soil nitrogen values (estimated from thedifference between N inputs and N outputs),obtained using the standardized CanadianAgricultural Nitrogen Budget (CANB Version 2.0,see Chapter 9), with weather and soil data, inorder to calculate Nlost and Nconc. A water balancemodel was used to estimate the daily water surplus during the non-growing season (fromSeptember 1 to March 31), when most of thepotential nitrate loss occurs. The water balancemodel considers daily precipitation (P) andpotential evapotranspiration (PE) as well as theavailable water-holding capacity of soils (AWHC).Nlost and Nconc calculations were made for eachyear (1979 to 2003), and averages of the four winter periods centered around Census years
Soil organic matter
Legumes
Harvested
Fertilizer Manure
Ammoniavolatilization
DenitrificationDenitrificationDenitrification
NitrificationNitrate leachingNitrate leaching
NH3
(NH4+ NO2
- NO3
-) RSN
N2O
N2
N2
NO
NONO3-(IROWC-N)(IROWC-N)
Immobilization
Mineralization
Atmosphericdeposition
Residuesreturned
NO3-(IROWC-N)
Figure 17-1: Conceptual view of N flows in an agroecosystem
Nitrate Lost (kg of N / ha)
0-4.9 5.0-9.9 10.0-19.9 �20
Nitrate Concentration 0-4.9 Very Low Very Low Low Moderate
(mg of N / L) 5.0-9.9 Very Low Low Moderate High
�10 Low Moderate High Very High
Table 17-1: IROWC-N risk classes, based on nitrate- N concentration in water and totalamount of nitrate lost
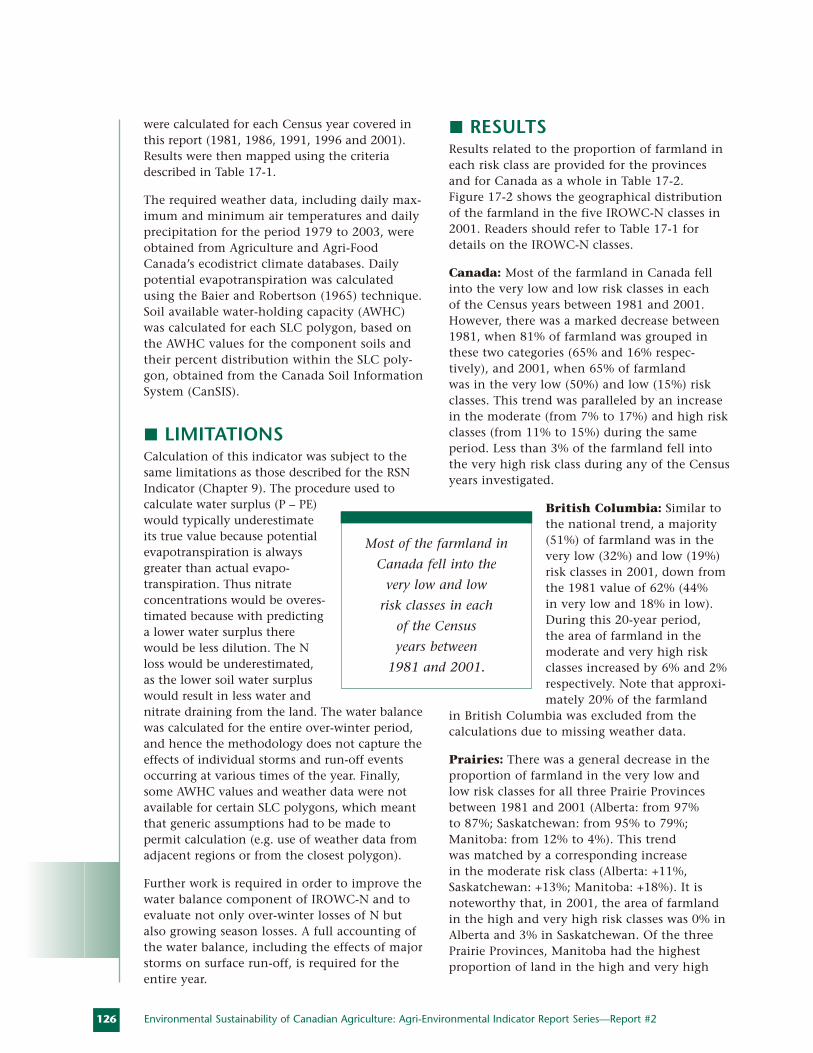
126
were calculated for each Census year covered inthis report (1981, 1986, 1991, 1996 and 2001).Results were then mapped using the criteriadescribed in Table 17-1.
The required weather data, including daily max-imum and minimum air temperatures and dailyprecipitation for the period 1979 to 2003, wereobtained from Agriculture and Agri-FoodCanada’s ecodistrict climate databases. Dailypotential evapotranspiration was calculatedusing the Baier and Robertson (1965) technique.Soil available water-holding capacity (AWHC)was calculated for each SLC polygon, based onthe AWHC values for the component soils andtheir percent distribution within the SLC poly-gon, obtained from the Canada Soil InformationSystem (CanSIS).
LIMITATIONSCalculation of this indicator was subject to thesame limitations as those described for the RSNIndicator (Chapter 9). The procedure used to calculate water surplus (P – PE)would typically underestimateits true value because potentialevapotranspiration is alwaysgreater than actual evapo-transpiration. Thus nitrateconcentrations would be overes-timated because with predictinga lower water surplus therewould be less dilution. The Nloss would be underestimated,as the lower soil water surpluswould result in less water andnitrate draining from the land. The water balancewas calculated for the entire over-winter period,and hence the methodology does not capture theeffects of individual storms and run-off eventsoccurring at various times of the year. Finally,some AWHC values and weather data were notavailable for certain SLC polygons, which meantthat generic assumptions had to be made to permit calculation (e.g. use of weather data fromadjacent regions or from the closest polygon).
Further work is required in order to improve thewater balance component of IROWC-N and toevaluate not only over-winter losses of N butalso growing season losses. A full accounting ofthe water balance, including the effects of majorstorms on surface run-off, is required for theentire year.
RESULTSResults related to the proportion of farmland ineach risk class are provided for the provincesand for Canada as a whole in Table 17-2. Figure 17-2 shows the geographical distributionof the farmland in the five IROWC-N classes in2001. Readers should refer to Table 17-1 fordetails on the IROWC-N classes.
Canada: Most of the farmland in Canada fellinto the very low and low risk classes in each of the Census years between 1981 and 2001.However, there was a marked decrease between1981, when 81% of farmland was grouped inthese two categories (65% and 16% respec-tively), and 2001, when 65% of farmland was in the very low (50%) and low (15%) riskclasses. This trend was paralleled by an increasein the moderate (from 7% to 17%) and high riskclasses (from 11% to 15%) during the sameperiod. Less than 3% of the farmland fell intothe very high risk class during any of the Censusyears investigated.
British Columbia: Similar tothe national trend, a majority(51%) of farmland was in thevery low (32%) and low (19%)risk classes in 2001, down fromthe 1981 value of 62% (44% in very low and 18% in low).During this 20-year period, the area of farmland in the moderate and very high riskclasses increased by 6% and 2%respectively. Note that approxi-mately 20% of the farmland
in British Columbia was excluded from the calculations due to missing weather data.
Prairies: There was a general decrease in theproportion of farmland in the very low and low risk classes for all three Prairie Provincesbetween 1981 and 2001 (Alberta: from 97% to 87%; Saskatchewan: from 95% to 79%;Manitoba: from 12% to 4%). This trend was matched by a corresponding increase in the moderate risk class (Alberta: +11%,Saskatchewan: +13%; Manitoba: +18%). It isnoteworthy that, in 2001, the area of farmlandin the high and very high risk classes was 0% inAlberta and 3% in Saskatchewan. Of the threePrairie Provinces, Manitoba had the highest proportion of land in the high and very high
Environmental Sustainability of Canadian Agriculture: Agri-Environmental Indicator Report Series—Report #2
Most of the farmland in
Canada fell into the
very low and low
risk classes in each
of the Census
years between
1981 and 2001.
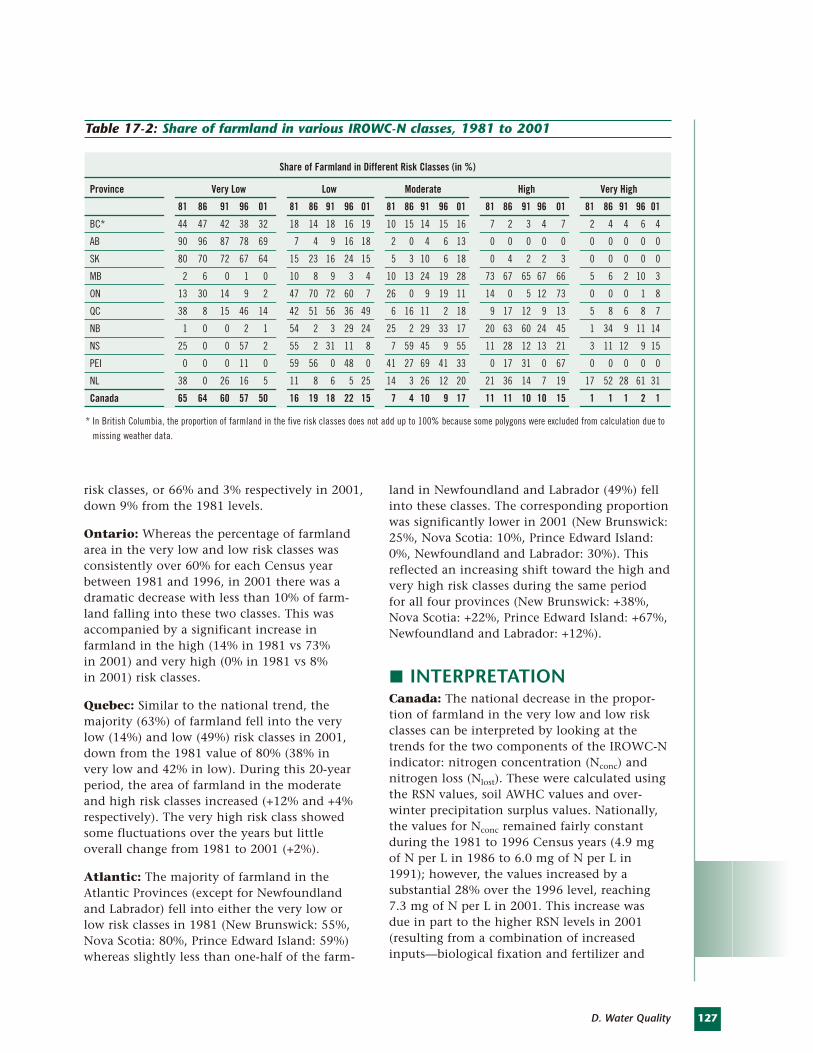
127D. Water Quality
risk classes, or 66% and 3% respectively in 2001,down 9% from the 1981 levels.
Ontario: Whereas the percentage of farmlandarea in the very low and low risk classes wasconsistently over 60% for each Census yearbetween 1981 and 1996, in 2001 there was adramatic decrease with less than 10% of farm-land falling into these two classes. This wasaccompanied by a significant increase in farmland in the high (14% in 1981 vs 73% in 2001) and very high (0% in 1981 vs 8% in 2001) risk classes.
Quebec: Similar to the national trend, themajority (63%) of farmland fell into the verylow (14%) and low (49%) risk classes in 2001,down from the 1981 value of 80% (38% in very low and 42% in low). During this 20-yearperiod, the area of farmland in the moderateand high risk classes increased (+12% and +4%respectively). The very high risk class showedsome fluctuations over the years but little overall change from 1981 to 2001 (+2%).
Atlantic: The majority of farmland in theAtlantic Provinces (except for Newfoundlandand Labrador) fell into either the very low orlow risk classes in 1981 (New Brunswick: 55%,Nova Scotia: 80%, Prince Edward Island: 59%)whereas slightly less than one-half of the farm-
land in Newfoundland and Labrador (49%) fellinto these classes. The corresponding proportionwas significantly lower in 2001 (New Brunswick:25%, Nova Scotia: 10%, Prince Edward Island:0%, Newfoundland and Labrador: 30%). Thisreflected an increasing shift toward the high andvery high risk classes during the same period for all four provinces (New Brunswick: +38%,Nova Scotia: +22%, Prince Edward Island: +67%,Newfoundland and Labrador: +12%).
INTERPRETATIONCanada: The national decrease in the propor-tion of farmland in the very low and low riskclasses can be interpreted by looking at thetrends for the two components of the IROWC-Nindicator: nitrogen concentration (Nconc) andnitrogen loss (Nlost). These were calculated usingthe RSN values, soil AWHC values and over-winter precipitation surplus values. Nationally,the values for Nconc remained fairly constantduring the 1981 to 1996 Census years (4.9 mg of N per L in 1986 to 6.0 mg of N per L in1991); however, the values increased by a substantial 28% over the 1996 level, reaching7.3 mg of N per L in 2001. This increase was due in part to the higher RSN levels in 2001(resulting from a combination of increasedinputs—biological fixation and fertilizer and
Share of Farmland in Different Risk Classes (in %)
Province Very Low Low Moderate High Very High
81 86 91 96 01 81 86 91 96 01 81 86 91 96 01 81 86 91 96 01 81 86 91 96 01
BC* 44 47 42 38 32 18 14 18 16 19 10 15 14 15 16 7 2 3 4 7 2 4 4 6 4
AB 90 96 87 78 69 7 4 9 16 18 2 0 4 6 13 0 0 0 0 0 0 0 0 0 0
SK 80 70 72 67 64 15 23 16 24 15 5 3 10 6 18 0 4 2 2 3 0 0 0 0 0
MB 2 6 0 1 0 10 8 9 3 4 10 13 24 19 28 73 67 65 67 66 5 6 2 10 3
ON 13 30 14 9 2 47 70 72 60 7 26 0 9 19 11 14 0 5 12 73 0 0 0 1 8
QC 38 8 15 46 14 42 51 56 36 49 6 16 11 2 18 9 17 12 9 13 5 8 6 8 7
NB 1 0 0 2 1 54 2 3 29 24 25 2 29 33 17 20 63 60 24 45 1 34 9 11 14
NS 25 0 0 57 2 55 2 31 11 8 7 59 45 9 55 11 28 12 13 21 3 11 12 9 15
PEI 0 0 0 11 0 59 56 0 48 0 41 27 69 41 33 0 17 31 0 67 0 0 0 0 0
NL 38 0 26 16 5 11 8 6 5 25 14 3 26 12 20 21 36 14 7 19 17 52 28 61 31
Canada 65 64 60 57 50 16 19 18 22 15 7 4 10 9 17 11 11 10 10 15 1 1 1 2 1
Table 17-2: Share of farmland in various IROWC-N classes, 1981 to 2001
* In British Columbia, the proportion of farmland in the five risk classes does not add up to 100% because some polygons were excluded from calculation due to
missing weather data.
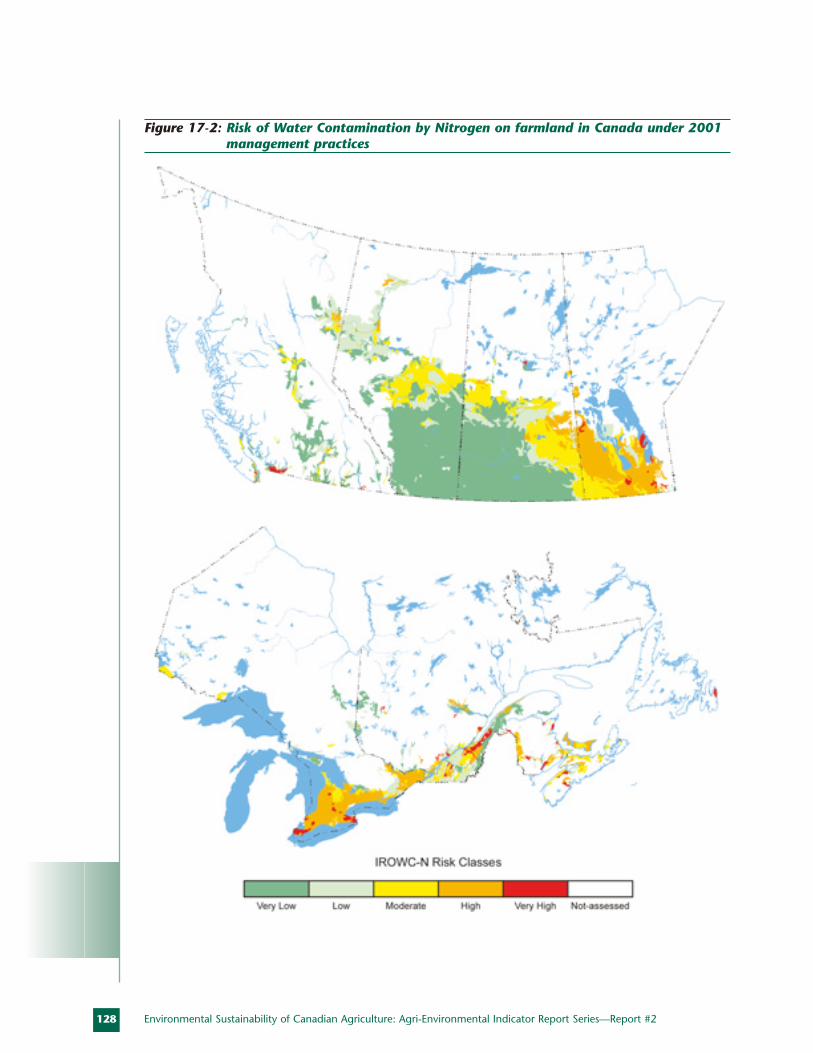
128 Environmental Sustainability of Canadian Agriculture: Agri-Environmental Indicator Report Series—Report #2
Figure 17-2: Risk of Water Contamination by Nitrogen on farmland in Canada under 2001management practices
129D. Water Quality
manure N additions—and lower outputs owingto reduced crop yields), coupled with a decreasein the over-winter precipitation surplus in 2001.Nconc values were always below 10 mg of N per L in all provinces, except Manitoba andNewfoundland and Labrador. Between 1981 and2001, nitrogen losses through leaching were lessthan 50 kg of N per hectare in all provinces,except for Nova Scotia in 2001 (50.2 kg of N perha) and Newfoundland and Labrador from 1986to 2001 (67.1 to 121.6 kg N per ha). In contrastto Newfoundland and Labrador with its highlosses, Alberta and Saskatchewan—togetheraccounting for 70% of the total farmland area in Canada—had very low N losses ( i.e. < 5 kg of N per ha), because of the small over-winterprecipitation surplus and the slightly higher soil AWHC.
British Columbia: The increase in farmlandarea in the moderate and high risk classes canbe attributed to an increase in the Nconc values,which reached 9.1 mg of N per L in 2001. Nlost
increased steadily to a high of 27.5 kg of N perhectare in 2001. These trends can in turn beexplained by high nitrogen fertilizer sales andhigh values of available manure-N, particularlyin areas on southeastern Vancouver Island andin the Lower Mainland. Furthermore, the RSNvalues were higher and over-winter precipitationsurplus values were lower in 2001.
Alberta: Nconc values were low (between 2.7and 5.6 mg of N per L) because the correspon-ding RSN values were low. Similarly, N losseswere low (below 5 kg of N per ha) during each of the Census years, as the over-winter precipitation surplus was low. In southernAlberta, there was an over-winter precipitationdeficit, resulting in no N leaching at all.
Saskatchewan: This province had slightlyhigher RSN values than Alberta, but because theover-winter precipitation surplus was generallylower, Nlost and IROWC-N values were similar tothose in Alberta. The highest risk areas were inthe Black soil zone, where annual N fertilizersales ranged from 15 to 75 kg of N per ha, ahigher level than in the rest of the province.
Manitoba: Manitoba had the highest nitrateconcentrations (11.8 to 15.5 mg of N per L) andthe greatest N losses (11.9 to 15.7 kg of N perha) of all the Prairie Provinces. This was causedprimarily by much higher RSN values (at least50% higher than in Alberta or Saskatchewan),giving rise to 2.5 times higher Nconc and 4 timeshigher N losses. Nitrogen concentrations (Nconc)were consistently above the 10 mg of N per litrereference level (drinking water guideline used inCanada) during the 20-year period. Figure 17-2shows that, in 2001, the high risk and very highrisk classes occurred in the Lake of the Woods,Interlake Plain and Lake Manitoba Plain regions.
Ontario: Compared to Manitoba, Ontarioshowed higher Nlost (12.4 to 28.6 kg of N per ha) but lower Nconc (2.7 to 6.6 mg of N per L), a situation that relates to the differingclimatic conditions. In Ontario, a greater over-winter precipitation surplus contributes to moreN loss in drainage water, but the greater precipi-tation also results in increased dilution. Nconc
values in Ontario increased in 2001 to 6.6 mg ofN per L, as did the Nlost values (28.6 kg of N perha) as compared to the values in 1996 (4.2 mgof N per L and 17.9 kg of N per ha). Figure 17-2shows that in 2001 some regions of southwest-ern Ontario fell into the very high risk class. In the Lake Erie Lowlands region, availablemanure-N was high, causing large areas of thisregion to fall into the very high risk class.
Quebec: Provincial averages of Nconc values wereconsistently below 6 mg of N per L throughoutthe study period, and Nlost values ranged from17.7 to 26.5 kg of N per hectare. However, localized high risk areas are evident on the 2001IROWC-N map (Figure 17-2). The three regionsshowing the highest Nlost and Nconc values werethe Southern Laurentians, the Appalachians and the St. Lawrence Lowlands. The high valueswere mainly caused by high livestock popula-tions and available manure-N.
New Brunswick: Nconc values were below 7.5 mg of N per L in all years except 1986, when the value reached the reference level of 10 mg of N per L. Nlost values ranged between24.1 and 41.5 kg of N per hectare. The RSN values were approximately 50% higher than inQuebec, but nitrogen leaching (Nlost) was 63%
130
higher than in Quebec, primarily because of thehigher over-winter precipitation surpluses andthe lower soil AWHC values. As in the case ofQuebec, Figure 17-2 shows that the highest riskareas are in the high livestock density areas ofNew Brunswick: the Uplands, the MaritimeLowlands and the Bay of Fundy coastal regions.
Nova Scotia: RSN, Nlost and Nconc values allincreased considerably between 1996 and 2001,mainly as a result of higher N inputs and lower crop yields. The highest Nconc and Nlost
occurred in 2001 (7.2 mg of N per L and 50.2 kgof N per ha). The average AWHC of the soils inNova Scotia is low, because the soils are sandyand therefore vulnerable to nitrogen lossesthrough leaching. The very high risk classes ofIROWC-N were located in the Southern NovaScotia Uplands, the Nova Scotia Highlands and the Annapolis-Minas Lowlands.
Prince Edward Island: This province showedhigher RSN, Nlost and Nconc values in 2001 ascompared to 1996, a performance very similar to that of Nova Scotia. The 2001 Nlost value(34.1 kg of N per ha) was twice as high as in1996 (17.3 kg of N per ha). This can be attrib-uted to slightly higher inputs and lower outputsof the RSN balance. Nconc values were below 6 mg of N per L during the 20-year period.
Newfoundland and Labrador:Newfoundland’s RSN values were by far thehighest in the country, and since the over-winter precipitation surplus was also the highest (> 720 mm), N losses were much higherthan in other provinces (35.9 to 122 kg of N perha). Although nitrate concentrations were high(4.5 to 17.4 mg of N per L), these were dilutedby the large over-winter precipitation surpluses.It would seem that the amount of manure produced is excessive relative to the land areaavailable for spreading it.
RESPONSE OPTIONSSince neither AWHC values nor weather variables (precipitation and potential evapotran-spiration) are easily amenable to producerintervention, targeting residual soil nitrogen(RSN) is the only practical option for managingthe risk of water contamination by nitrogen.The only exception might be to use irrigation tocompensate for insufficient precipitation. Whenepisodes of drought during the growing season
hinder crop growth and N uptake, supplementalirrigation can be used to both increase yieldsand reduce the amount of RSN. Moreover, Druryet al. (1996) found that by manipulating thewater table depth, nitrate losses could bedecreased and the nitrate concentration in tiledrainage water reduced. Management practicesthat can help to mitigate the risk of elevatedRSN, and thus reduce the risk of water contami-nation by nitrogen, are described in Chapter (9)on RSN.
Another management option available to producers consists in growing cover crops(lower-value crops planted in the fall after themain higher-value crop has been harvested). Thecover crop would take up excess soil nitrogen,thereby preventing leaching losses, and theywould also extend the growing season, helpingto reduce the over-winter precipitation surplus.
REFERENCES Baier, W. and G.W. Robertson, 1965. Estimationof Latent Evaporation From Simple WeatherObservations. Canadian Journal of Plant Science.45: 276 – 284.
Chambers, P.A., M. Guy, E.S. Roberts, M.N.Charlton, R. Kent, C. Gagnon, G. Grove, and N.Foster (eds), 2001. Nutrients and Their Impact onthe Canadian Environment. Environment Canada,Ottawa (Ont.).
Drury, C.F. and C.S. Tan, 1995. Long-Term (35 Years) Effects of Fertilization, Rotation andWeather on Corn Yields. Canadian Journal ofPlant Science. 75: 355-362.
Drury, C.F., C.S. Tan, J.D. Gaynor, T.O. Oloya,and T.W. Welacky, 1996. Influence of ControlledDrainage-Subirrigation on Surface and Tile DrainageNitrate Loss. Journal of Environmental Quality.25: 317-324.
MacDonald, K.B., 2000. “Risk of WaterContamination by Nitrogen”. Pages 117-123 inEnvironmental Sustainability of CanadianAgriculture: Report of the Agri-EnvironmentalIndicator Project, T. McRae, C.A.S. Smith, andL.J. Gregorich (eds.). Agriculture and Agri-FoodCanada, Ottawa (Ont.).www.agr.gc.ca/env/naharp-pnarsa
Environmental Sustainability of Canadian Agriculture: Agri-Environmental Indicator Report Series—Report #2
THE ISSUEPhosphorus (P) is an essential nutrient for plantgrowth. Crop fertilization with this nutrient hasbecome a common agronomic practice since thelate 1950s. Phosphorus is added to agriculturalsoils in the form of inorganic fertilizers, manureand other organic products to optimize agro-nomic yields and the economic viability ofagricultural enterprises, as well as to meet theincreasing demand for food and fibre.
However, the addition of phosphorus is notalways without risks. Some phosphorus mayeventually move from treated agricultural areasinto the surrounding environment, notably into water resources. When phosphorus becomesconcentrated in surface waters, it can cause veryhigh levels of algal growth and decomposition,leading to eutrophication of the aquatic envi-ronment (Carpenter et al. 1998). A number of environmental measures have been imple-mented to reduce or eliminate point sources of anthropogenic phosphorus inputs to water(e.g. detergents, municipal wastewater), resulting
in positive effects on water quality. In manyareas, remaining phosphorus inputs to water arenow largely agricultural in origin. Controllingnon-point source phosphorus pollution fromagricultural soils is therefore a major challengein efforts to protect surface waters. The problemis more significant in areas where the risk ofwater erosion or run-off is combined with thepresence of P-rich soils that have a reducedcapacity to retain phosphorus owing to repeatedfertilizer and manure applications (for example,areas with high livestock density) and in areaswhere the soil P content exceeds plant needs(Beauchemin and Simard 2000).
THE INDICATORThe processes by which phosphorus is trans-ferred from soils to water bodies are complex,and little is known about the amount thatreaches surface waters naturally. It is thereforedifficult to measure how much phosphorus fromfarmland actually reaches surface waters. TheIndicator of the Risk of Water Contamination byPhosphorus (IROWC-P) has been developed as a
SUMMARYPhosphorus is added to agricultural soils in the form of inorganic fertilizers, manure and other organic
products to optimize agronomic yields and, more broadly speaking, to meet the increasing demand for
food and fibre. The Indicator of the Risk of Water Contamination by Phosphorus (IROWC-P) has been
developed to assess the relative risk of phosphorus moving from treated agricultural areas into nearby
water bodies, where it can contribute to algae growth and eutrophication. Risk of water contamination
by phosphorus may be especially high in areas where agricultural soils are rich in phosphorus or have
excess phosphorus relative to crop needs. The risk is higher in areas that have a high potential for soil
erosion and surface run-off.
The IROWC-P could only be derived for Quebec because of limited data availability for the other provinces.
Most of the farmland in Quebec falls into the low risk and moderate risk classes (30% and 50% respec-
tively in 2001). In 2001, 15% of agricultural land was in the high risk class of water contamination by
phosphorus, mostly concentrated in the regions of Montréal-Nord, Montérégie and Chaudière-Appalaches.
This high risk situation is likely due to a combination of more phosphorus-saturated soils, higher potential
for soil erosion and surface run-off and more intensive agricultural production. The indicator showed
an important shift of farmland from the high and moderate risk classes, to the low risk class during
the 20 year period (1981-2001).
131D. Water Quality
AUTHORS:
E. van Bochove,G. Thériault, F. Dechmi andM.-L. Leclerc
INDICATOR NAME:
Indicator of the Risk of WaterContamination by Phosphorus(IROWC-P)
STATUS:
Provincial coverage(Quebec), 1981 to 2001
18. Phosphorus
132
qualitative assessment tool for rating specificgeographic units—Soil Landscape of Canada(SLC) polygons with more than 5% of their areadedicated to agricultural activity—based on the relative risk (compared to other units) ofphosphorus moving from the land into adjacentsurface waters, given the soil P saturation leveland the quantity of P inputs.
The IROWC-P indicator is expressed as the proportion of agricultural land that falls into fivedifferent risk classes (very low, low, moderate,high and very high). The risk classes were estab-lished mainly on the basis of soil P chemistry and surface run-off potential. The very low tomoderate risk classes generally indicate that theenvironment can support agriculture withoutmajor changes to management practices. In contrast, the high and very high risk classes indicate that excess P is being generated, that the soils are excessively rich in P or that signifi-cant P transport mechanisms are at play. Theperformance objective for this indicator is tohave an increasing amount of agricultural land in the low risk classes (Classes 1 and 2).
CALCULATION METHODThe IROWC-P was calculated at the SLC polygonlevel for Quebec only, for the period from 1981to 2001. The indicator builds on a phosphorusindexing system initially developed by Americanscientists (Lemunyon and Gilbert 1993) and subsequently adapted to Canadian conditions(Bolinder et al. 2000). It is essentially a summa-tion of the individual risks associated with threecomponents (soil P levels, annual P balance andP movement from soil to water) that is used toassess the overall risk that an agricultural soilwith a given degree of P saturation will receive a given quantity of P and lose it to streams and rivers.
The soil phosphorous levels component (P content and degree of soil P saturation) wasestimated using the description and origin ofthe parent materials for the dominant soil seriesof each agricultural SLC polygon. This estima-tion was done on the basis of two soil studies.
For the phosphorus balance component, manureP was estimated using livestock populationnumbers from the Census of Agriculture, andfertilizer P was estimated using economic data(fertilizer sales data). Excess P (P unused bycrops) was then calculated by linking these twoestimates to crop production using croppingarea data from the Census of Agriculture (forpasture, field crops, vegetable crops and potatocrops), fertilization grid data, harvest coeffi-cients and revised yield estimates.
For the P movement component, soil erosion by water and surface run-off are considered asthe pathways of P transport from agriculturalfields to surface waters. The potential of P lossby water erosion is estimated using the RevisedUniversal Soil Loss Equation adapted forCanada, which considers rainfall pattern, topography, land use practices and crop type.The surface run-off potential is determinedusing a modified matrix initially developed byMcFarland et al. (1998) that takes into accountthe dominant soil slope class (from the SLCdescriptive database) and curve number (derivedfrom land use, cropping practices, hydrologicalconditions and soil hydrological group) for each polygon. The hydrological conditions wereconsidered good for all SLC polygons, and thesoil hydrological group was estimated on thebasis of the dominant soil series drainage class.
LIMITATIONSThe IROWC-P has been calculated only forQuebec because data on soil P content anddegree of P saturation, which are essential forcalculating phosphorus status and phosphorusbalance components, are not currently availablefor the other provinces. Because only one soilsurvey was available, it was not possible toevaluate soil-P enrichment caused by changing
agricultural management practices for the entireperiod covered. Additionally, a number of agricultural management practices that are likely to have a significant impact on the riskcalculations have not been integrated into theindicator due to a lack of data. These practicesinclude the addition of phytase to livestock feed, resulting in reduced manure P content,
Environmental Sustainability of Canadian Agriculture: Agri-Environmental Indicator Report Series—Report #2
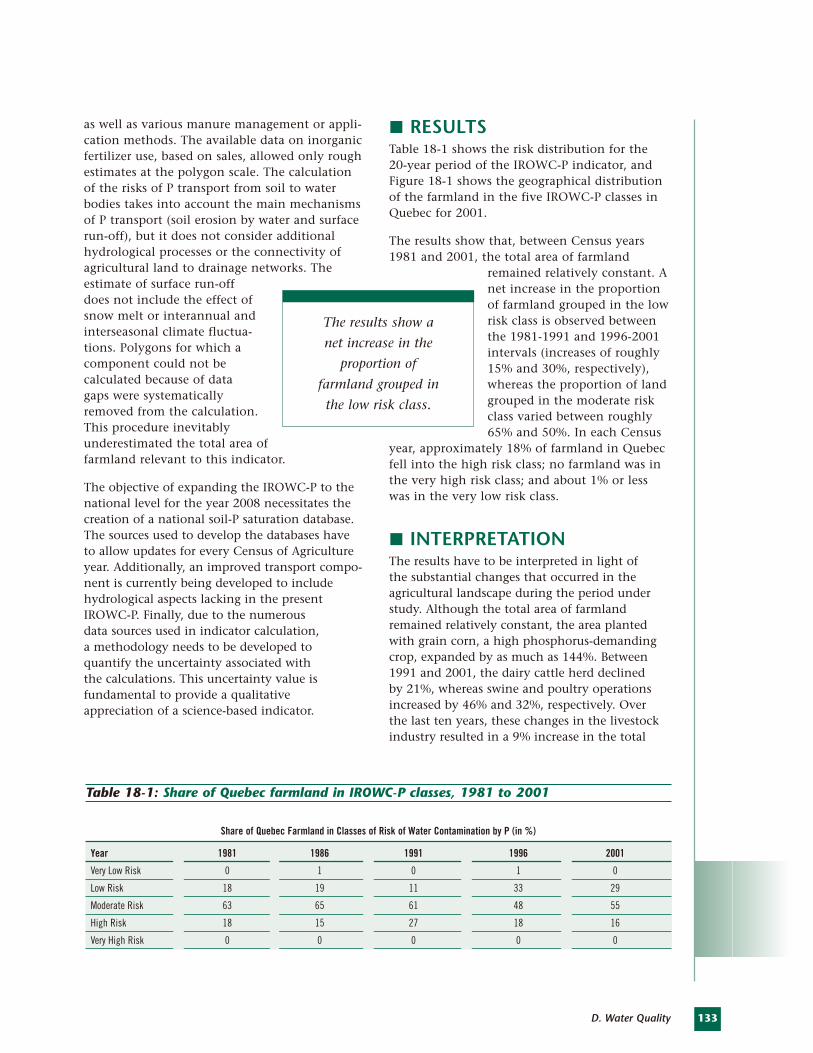
133D. Water Quality
as well as various manure management or appli-cation methods. The available data on inorganicfertilizer use, based on sales, allowed only roughestimates at the polygon scale. The calculationof the risks of P transport from soil to waterbodies takes into account the main mechanismsof P transport (soil erosion by water and surfacerun-off), but it does not consider additionalhydrological processes or the connectivity ofagricultural land to drainage networks. The estimate of surface run-off does not include the effect ofsnow melt or interannual andinterseasonal climate fluctua-tions. Polygons for which acomponent could not be calculated because of data gaps were systematicallyremoved from the calculation.This procedure inevitablyunderestimated the total area offarmland relevant to this indicator.
The objective of expanding the IROWC-P to thenational level for the year 2008 necessitates thecreation of a national soil-P saturation database.The sources used to develop the databases have to allow updates for every Census of Agricultureyear. Additionally, an improved transport compo-nent is currently being developed to includehydrological aspects lacking in the presentIROWC-P. Finally, due to the numerous data sources used in indicator calculation, a methodology needs to be developed to quantify the uncertainty associated with the calculations. This uncertainty value is fundamental to provide a qualitative appreciation of a science-based indicator.
RESULTSTable 18-1 shows the risk distribution for the 20-year period of the IROWC-P indicator, andFigure 18-1 shows the geographical distributionof the farmland in the five IROWC-P classes inQuebec for 2001.
The results show that, between Census years1981 and 2001, the total area of farmland
remained relatively constant. Anet increase in the proportionof farmland grouped in the lowrisk class is observed betweenthe 1981-1991 and 1996-2001intervals (increases of roughly15% and 30%, respectively),whereas the proportion of landgrouped in the moderate riskclass varied between roughly65% and 50%. In each Census
year, approximately 18% of farmland in Quebecfell into the high risk class; no farmland was inthe very high risk class; and about 1% or lesswas in the very low risk class.
INTERPRETATIONThe results have to be interpreted in light of the substantial changes that occurred in the agricultural landscape during the period understudy. Although the total area of farmlandremained relatively constant, the area plantedwith grain corn, a high phosphorus-demandingcrop, expanded by as much as 144%. Between1991 and 2001, the dairy cattle herd declined by 21%, whereas swine and poultry operationsincreased by 46% and 32%, respectively. Over the last ten years, these changes in the livestockindustry resulted in a 9% increase in the total
The results show a
net increase in the
proportion of
farmland grouped in
the low risk class.
Share of Quebec Farmland in Classes of Risk of Water Contamination by P (in %)
Year 1981 1986 1991 1996 2001
Very Low Risk 0 1 0 1 0
Low Risk 18 19 11 33 29
Moderate Risk 63 65 61 48 55
High Risk 18 15 27 18 16
Very High Risk 0 0 0 0 0
Table 18-1: Share of Quebec farmland in IROWC-P classes, 1981 to 2001
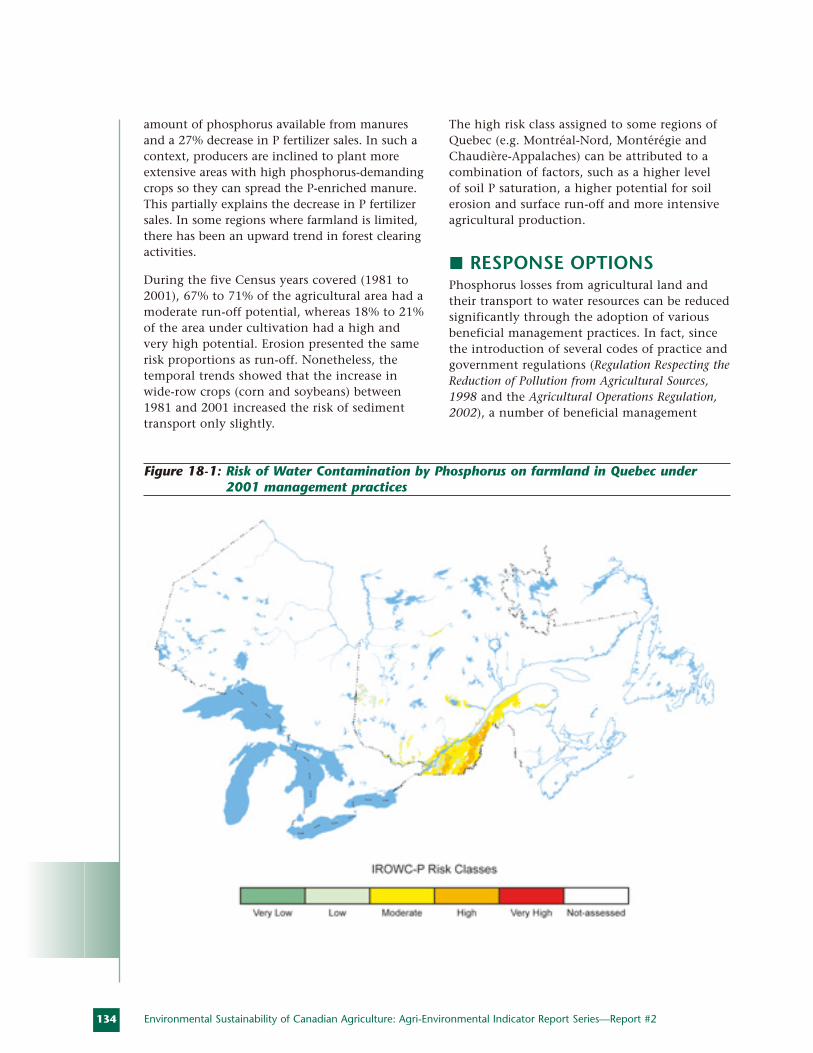
134 Environmental Sustainability of Canadian Agriculture: Agri-Environmental Indicator Report Series—Report #2
Figure 18-1: Risk of Water Contamination by Phosphorus on farmland in Quebec under2001 management practices
amount of phosphorus available from manuresand a 27% decrease in P fertilizer sales. In such acontext, producers are inclined to plant moreextensive areas with high phosphorus-demandingcrops so they can spread the P-enriched manure.This partially explains the decrease in P fertilizersales. In some regions where farmland is limited,there has been an upward trend in forest clearingactivities.
During the five Census years covered (1981 to2001), 67% to 71% of the agricultural area had amoderate run-off potential, whereas 18% to 21%of the area under cultivation had a high andvery high potential. Erosion presented the samerisk proportions as run-off. Nonetheless, thetemporal trends showed that the increase inwide-row crops (corn and soybeans) between1981 and 2001 increased the risk of sedimenttransport only slightly.
The high risk class assigned to some regions ofQuebec (e.g. Montréal-Nord, Montérégie andChaudière-Appalaches) can be attributed to acombination of factors, such as a higher level of soil P saturation, a higher potential for soilerosion and surface run-off and more intensiveagricultural production.
RESPONSE OPTIONSPhosphorus losses from agricultural land andtheir transport to water resources can be reducedsignificantly through the adoption of variousbeneficial management practices. In fact, sincethe introduction of several codes of practice andgovernment regulations (Regulation Respecting theReduction of Pollution from Agricultural Sources,1998 and the Agricultural Operations Regulation,2002), a number of beneficial management
135D. Water Quality
practices have been adopted to control watercontamination by phosphorus in Quebec, especially in intensively farmed areas withexcess phosphorus. Such practices are generallyaimed at reducing the impact of agriculturalproduction in areas that are susceptible to soilerosion by water and surface run-off, but also atbalancing plant nutrient requirements with soilP content through the development of rigorousfertilization plans.
In general, where risk is relatively low, practicesaimed at limiting phosphorus movement appearto be appropriate for reducing the risk of Ptransport from agricultural soils to surfacewaters (e.g. controlling soil erosion and surfacerun-off, preventing livestock access to streams,balancing phosphorus inputs based on croprequirements and soil P content). Areas with ahigher risk level may be richer in phosphorus ormore prone to P transport. A detailed assessmentof the causes of the high risk status must beconducted to identify suitable corrective meas-ures. These measures may include compliancewith agri-environmental fertilization plans;using high phosphorus-demanding rotationcrops; limiting manure-phosphorus production;and installing riparian buffers and windbreaks.In addition, it may be important to limit theclearing and cultivation of forested lands,organic soils and marginal lands, since they play a key role as a “phosphorus filter” at the watershed level, reducing the impact of agricultural production on water quality.
REFERENCESBeauchemin, S. and R.R. Simard, 2000.Phosphorus Status of Intensively Cropped Soils ofthe St. Lawrence Lowlands. Soil Science Society of America Journal. 64: 659-670.
Bolinder, M.A., R.R. Simard, S. Beauchemin andK.B. MacDonald, 2000. Indicator of Risk of WaterContamination by P for Soil Landscape of CanadaPolygons. Canadian Journal of Soil Science. 80: 153-163.
Carpenter, S.R., N.F. Caraco, D.L. Correll, R.W.Howath, A.N. Sharpley and V.H. Smith, 1998.Nonpoint Pollution of Surface Waters WithPhosphorus and Nitrogen. Ecological Applications.8 (3): 559-568.
Lemunyon, J. L. and R.G. Gilbert, 1993. TheConcept and Need for a Phosphorus AssessmentTool. Journal of Productive Agriculture. 6: 483-486.
McFarland, M.A.A., L. Hauck, J. White, W.Donham, J. Lemunyon, and S. Jones, 1998.“Nutrient Management Using a Phosphorus RiskIndex for Manure Application Fields”. Pages 241-244 in Proceedings of Manure Managementin Harmony with the Environment and Society,Paper No. 62 of the Manure ManagementConference Proceedings Feb.10-12, 1998. Soil and Water Conservation Society (SWCS),Ankeny (Iowa).
THE ISSUEPesticides are an important part of Canadiancrop production, with more than 45 millionkilograms of pesticides being applied annuallyin Canada. These chemicals are used to controlcrop damage and prevent economic lossescaused by crop pests. While their use has helpedto increase crop yields and value, pesticides mayalso contribute to environmental degradation.For example, pesticides in run-off may contami-nate surface waters, while leaching of thesesubstances may lead to contamination of ground water. Small amounts of pesticide residues are often found in surface and groundwaters in Canada (Donald et al. 2001, Frank etal. 1987, Frank et al. 1990, Grover et al. 1997,Lampman 1995, Rudolph and Goss 1993); however, the consequences to human health of exposure to low levels of pesticides over long periods of time or the effects on wildlifeand wildlife habitat are not well understood.The potential environmental impacts of pesticide use therefore remain an importantconcern for Canadians.
Over the past 20 years, significant progress hasbeen made in reducing the potential for themovement of pesticides from the farm field tosurface and ground waters. Beneficial manage-ment practices can be adopted that mitigate the movement of pesticides off-site or reducethe amount of pesticides applied to fields. In addition, as a result of improved pesticideefficacy, present-day pesticides tend to be moreselective and less toxic than their predecessorsand applied at lower rates of application.
THE INDICATORThe Indicator of the Risk of Water Contaminationby Pesticides (IROWC-Pest), currently underdevelopment, will assess the relative risk of watercontamination by pesticides used in agriculture.This risk will be calculated by estimating themovement of pesticides from farm fields to thesurrounding environment. The indicator willconsider the risk of ground water contaminationfrom pesticide leaching through soil to a onemetre depth, as well as the risk of surface watercontamination from pesticide drift, surface run-off and transport on water and wind eroded soil.
IROWC-Pest will take into account environmen-tal conditions, the use of agricultural beneficialmanagement practices, pesticide use (type, quan-tity), application technology, atmospheric inputsof pesticides and physical-chemical properties(e.g. pesticide field half life), all of which canaffect the movement of pesticides from the point of application. This indicator will be most responsive to the adoption of beneficialmanagement practices in Soil Landscape ofCanada (SLC) polygons where environmental factors are favourable for pesticide movement.
CALCULATION METHODThe two main factors that go into calculatingthe risk of water contamination are how muchpesticide is being applied and what proportionis moving into the surrounding environment.Estimates of pesticide movement into the surrounding environment will be made usingselected pesticide fate models which take intoaccount characteristics of the soil, climate andpesticide, as well as management practices.
SUMMARYPesticides used in agriculture may move from the area where they are applied into the broader environment
and eventually contaminate surface and ground waters, with potential environmental and human health
implications. An Indicator of the Risk of Water Contamination by Pesticides (IROWC-Pest) is currently
under development. The indicator will provide relative estimates of the risk of water contamination by
pesticides in agricultural areas of Canada, as influenced by the type and quantity of pesticide used, soil
landscape characteristics, the environmental conditions under which these substances are applied and the
use of beneficial management practices.
136 Environmental Sustainability of Canadian Agriculture: Agri-Environmental Indicator Report Series—Report #2
AUTHORS:
A. J. Cessna, A. Farenhorst
and D.A.R.McQueen
INDICATOR NAME:
Indicator of the Risk of Water
Contamination by Pesticides
(IROWC-Pest)
STATUS:
Currently underdevelopment
19. Pesticides
137D. Water Quality
Correlations between crops grown and pesticideusage will be used to establish transfer functionswhich will then be applied to Statistics Canadacropping data to determine which and thequantity of pesticides are being applied in individual SLC polygons.
Validation will be done using historical pesticidemonitoring data, collected by various organiza-tions, to determine if the risk predicted by theindicator is reflected in the pesticide concentra-tions observed in ground and surface waters.
LIMITATIONSPesticide movement is very complex andencompasses several transport pathways ormeans through which these chemicals enter thesurrounding environment. Leaching (matrixflow) is the first transport pathway that will be incorpo-rated into the indicator. Thecomplexity of the indicatorwill increase with the additionof pesticide application driftand eventually surface runoffand the transport of pesticideson wind and water eroded soil.The lack of available pesticideuse data represents a challengeto the development of this indicator, and unless this issue can be resolved for example, by farm surveys, the indicator calculations willconsist of estimates of pesticide use based ontransfer functions.
RESULTSThis indicator is currently under developmentand results are not yet available.
RESPONSE OPTIONS This indicator has not been developed sufficiently to permit assessment at present.However, when IROWC-Pest is fully developed,it should be responsive to adoption of manage-ment practices that affect the amount and typeof pesticide used, as well as the environmentaland agronomic conditions under which pesticides are applied. Management practices
that reduce pesticide transport from the area ofapplication to the broader environment includeintegrated pest management (IPM), low driftnozzles, and buffer strips.
REFERENCESDonald, D.B., N.P. Gurprassad, L. Quinnett-Abbott, and K. Cash, 2001. Diffuse geographicdistribution of herbicides in northern prairie wetlands. Environmental Toxicology andChemistry. 20: 273-279.
Frank, R., B.S. Clegg, B.D. Ripley, and H.E. Braun, 1987. Investigations of pesticide contamination in rural wells, 1979-1984, Ontario, Canada. Archives of EnvironmentContamination and Toxicology. 16: 9-22.
Frank, R., H.E. Braun, B.D.Ripley, and B.S. Clegg, 1990.Contamination of rural ponds with pesticide, 1971-85,Ontario, Canada. Bulletin ofEnvironment Contaminationand Toxicology. 44: 401-409.
Grover, R., D.T. Waite, A.J. Cessna, W. Nicholaichuk,D.G. Irvine, L.A. Kerr, and
K. Best, 1997. Magnitude and persistence of herbicide residues in farm dugouts and ponds in the Canadian prairies. Environmental Toxicologyand Chemistry. 16: 638-643.
Lampman, M., 1995. Susceptibility of groundwaterto pesticide and nitrate contamination in predis-posed areas of southwestern Ontario. Water QualityResearch Journal of Canada. 30: 443-468.
McNaughton, D.C., and A.S. Crowe, 1995.Investigation of Pesticides in Groundwater at ThreeIrrigated Sites Near Outlook, Saskatchewan. WaterQuality Research Journal of Canada. 30 (3) :399-427.
Rudolph, D. and M. Goss (eds.), 1993. Ontariofarm groundwater quality survey: summer, 1992.Agriculture Canada, Federal-Provincial LandManagement Assistance Program, Ottawa (Ont.).162 p.
The Indicator will
assess the relative risk
of water contamination
by pesticides used
in agriculture.
THE ISSUEBovine, swine and poultry manures areextremely valuable sources of nutrients and are used by many producers to optimize cropgrowth. Since manure can harbour pathogenicorganisms, including bacteria, viruses and parasites, the use of these materials as fertilizersmay pose risks to human health and the envi-ronment. Under certain conditions, pathogenicmicro-organisms from stored or applied manurecan migrate from farmland into groundwater or be carried into surface water by run-off. Theconsequences of high levels of contamination of recreational or drinking water by these organisms can include human illness, increasedcapital costs for water treatment and economicloss through denial of use of recreational waters. This may also translate into more severe restrictions on the expansion or siting of livestock production facilities.
THE INDICATORThe Indicator of the Risk of WaterContamination by Pathogens (IROWC-Path) iscurrently in the early stages of development.Once completed, it will permit assessment of the potential risk of water becoming exposed to fecal pollution of agricultural origin by considering the following key elements:
• Manure application: The manure applicationrate influences the level of risk (proportionalto application rate). The risk is mitigatedthrough various application practices (e.g. incorporation of manure into the soil).
• Manure storage: The duration of storage and the form in which manure is stored caninfluence pathogen content (longer storageis better than short; liquid is generally saferthan solid).
• Manure treatment: Various manure treat-ments can attenuate pathogen content and reduce risk (e.g. composting).
• Persistence: The viability of pathogens inthe environment is influenced by a varietyof factors such as the soil temperature during manure application periods.
• Hydrological considerations: Major exposurepathways (preferential flow, drainage, run-off)affect the distribution of pathogens in sur-face water and groundwater. Land and soilcharacteristics, such as slope and soil textureand connectivity to water bodies, also havean effect.
CALCULATION METHODThe Indicator of the Risk of Water Contaminationby Pathogens will be calculated at both the SoilLandscape Canada (SLC) polygon level and thewatershed level. The quantity and quality ofmanure used on agricultural land will be linkedwith a hydrologic component to assess the likeli-hood that pathogenic micro-organisms in themanure will reach surface water or groundwater.
Data on the quantity of manure used at the SLCpolygon level are already available from theCensus of Agriculture database. This variable consists of a summation of the annual calculatedmanure production from major livestock cate-gories (beef, dairy, pigs, poultry, etc.). Attenuationand amplification weighting coefficients specific
SUMMARYThe use of bovine, swine and poultry manures to optimize crop growth may pose risks to human health and
the environment, as various pathogenic organisms, including bacteria, viruses and parasites, may be found
in these products. Under certain conditions, these pathogenic micro-organisms can migrate from farmland
into groundwater or be carried into surface water by run-off. An indicator is being developed—the Indicator
of the Risk of Water Contamination by Pathogens—for assessing the likelihood that pathogenic micro-
organisms in manure will reach surface water. The indicator will initially focus on enteric bacteria.
138 Environmental Sustainability of Canadian Agriculture: Agri-Environmental Indicator Report Series—Report #2
AUTHORS:
E. Topp, E. van Bochove,
G. Thériault, F. Dechmi and
D. Lapen
INDICATOR NAME:
Indicator of theRisk of Water
Contamination by Pathogens(IROWC-Path)
STATUS:
Currently underdevelopment
20. Pathogens
139D. Water Quality
to the origin of the manure, to the different man-agement practices (storage and treatment), to theclimatic conditions at the time of application andto any other conditions that have a direct effecton micro-organism persistence will be used in theindicator algorithm. Although these coefficientsmay be subjective, they will be science-based andagreed upon by subject-matter experts at theprovincial and national levels prior to their use in indicator calculation.
Pathogen transport will be estimated on thebasis of surface run-off and subsurface flow aswell as other factors accounting for hydrologicalconnectivity between sourcesand water bodies. A soil-waterbalance approach will be usedto quantify excess soil waterthat runs off cropland as surface and/or subsurface flowusing the modified VersatileSoil Moisture Budget model(Akinremi et al. 1996). The soil-water balance will be calculated daily, to takepathogen survival time intoaccount. The hydrological connectivity betweenpathogen sources and water bodies will then bemodelled using data on the following aspects: (i) the propensity of an area to water excess run-off (topographic index); (ii) the potential for pathogens to be exported from soils that areintensively drained (tile drainage, preferentialflow); and (iii) surface drainage density (ditches,brooks, rivers, ponds, lakes, etc.).
LIMITATIONSThere are still a lot of unknowns regarding thepathogen content of various manures and thespecific impact that various treatments andexposure pathways have on the persistence ofthese pathogenic micro-organisms in the envi-ronment following manure application. Also,the pathogens considered by this indicator will, at least initially, only include pathogenicbacteria. It is still not known whether the kinetics of persistence and the exposure pathways used in the calculations will be applicable to other micro-organisms of concern (e.g. enteric viruses or parasites such as Cryptosporidium).
RESULTSThis indicator is currently under developmentand results are not yet available.
RESPONSE OPTIONSThis indicator is not yet sufficiently developedto make specific suggestions on the approachesthat producers in different regions of Canadacould adopt in order to minimize the risk ofcontamination of water by pathogenic micro-organisms. However, when IROWC-Path is fully developed, it will be responsive to the
key changes in managementpractices that affect the amountand characteristics of manureused on agricultural land, aswell as the environmental and agronomic conditionsunder which they are applied.Beneficial management practices that can reducepathogen movement are likely to include a variety ofmanure management optionsfor treatment (e.g. composting),
application (e.g. rate) and land use (e.g. offset distances), as well as erosion and surface run-off control measures, such as riparian buffer strips.
REFERENCESAkinremi, O.O., S.M. McGinn, and A.G. Barr,1996. Simulation of Soil Moisture and OtherComponents of the Hydrological Cycle Using aWater Budget Approach. Canadian Journal of SoilScience. 76 (2):133-142.
Kirkby, M.J., 1975. “Hydrograph ModellingStrategies”. Pages 69-90 in Processes in Physicaland Human Geography, R. Peel, M. Chisholm,and P. Haggett (eds). Heinemann, London(England).
U.S. Department of Agriculture, 1972.“Hydrology”. Chapter 10.5-10.6 in NationalEngineering Handbook. USDA, SoilConservation Service, Washington.
The Indicator will
permit assessment of
the potential risk of
water becoming exposed
to fecal pollution of
agricultural origin.

EAir Quality
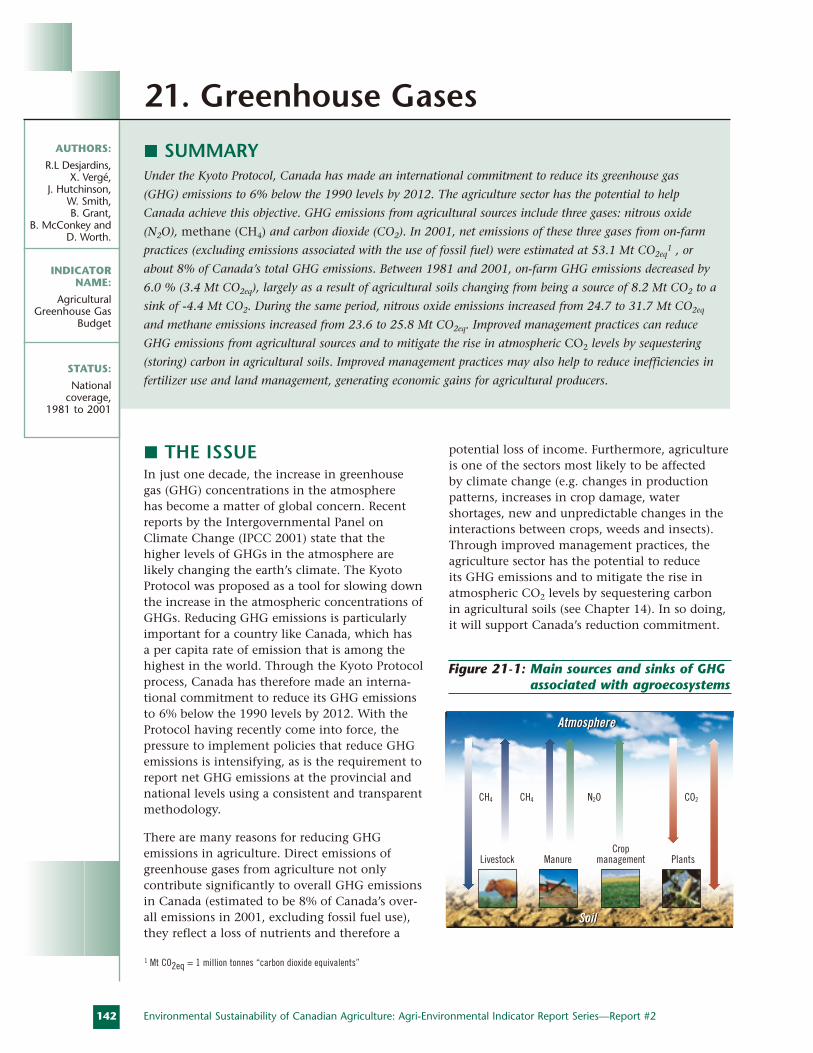
THE ISSUEIn just one decade, the increase in greenhouse gas (GHG) concentrations in the atmosphere has become a matter of global concern. Recentreports by the Intergovernmental Panel onClimate Change (IPCC 2001) state that thehigher levels of GHGs in the atmosphere arelikely changing the earth’s climate. The KyotoProtocol was proposed as a tool for slowing downthe increase in the atmospheric concentrations ofGHGs. Reducing GHG emissions is particularlyimportant for a country like Canada, which has a per capita rate of emission that is among thehighest in the world. Through the Kyoto Protocolprocess, Canada has therefore made an interna-tional commitment to reduce its GHG emissionsto 6% below the 1990 levels by 2012. With theProtocol having recently come into force, thepressure to implement policies that reduce GHGemissions is intensifying, as is the requirement toreport net GHG emissions at the provincial andnational levels using a consistent and transparentmethodology.
There are many reasons for reducing GHG emissions in agriculture. Direct emissions ofgreenhouse gases from agriculture not only contribute significantly to overall GHG emissionsin Canada (estimated to be 8% of Canada’s over-all emissions in 2001, excluding fossil fuel use),they reflect a loss of nutrients and therefore a
potential loss of income. Furthermore, agricultureis one of the sectors most likely to be affected by climate change (e.g. changes in productionpatterns, increases in crop damage, water shortages, new and unpredictable changes in theinteractions between crops, weeds and insects).Through improved management practices, theagriculture sector has the potential to reduce its GHG emissions and to mitigate the rise inatmospheric CO2 levels by sequestering carbon in agricultural soils (see Chapter 14). In so doing,it will support Canada’s reduction commitment.
SUMMARYUnder the Kyoto Protocol, Canada has made an international commitment to reduce its greenhouse gas
(GHG) emissions to 6% below the 1990 levels by 2012. The agriculture sector has the potential to help
Canada achieve this objective. GHG emissions from agricultural sources include three gases: nitrous oxide
(N2O), methane (CH4) and carbon dioxide (CO2). In 2001, net emissions of these three gases from on-farm
practices (excluding emissions associated with the use of fossil fuel) were estimated at 53.1 Mt CO2eq1 , or
about 8% of Canada’s total GHG emissions. Between 1981 and 2001, on-farm GHG emissions decreased by
6.0 % (3.4 Mt CO2eq), largely as a result of agricultural soils changing from being a source of 8.2 Mt CO2 to a
sink of -4.4 Mt CO2. During the same period, nitrous oxide emissions increased from 24.7 to 31.7 Mt CO2eq
and methane emissions increased from 23.6 to 25.8 Mt CO2eq. Improved management practices can reduce
GHG emissions from agricultural sources and to mitigate the rise in atmospheric CO2 levels by sequestering
(storing) carbon in agricultural soils. Improved management practices may also help to reduce inefficiencies in
fertilizer use and land management, generating economic gains for agricultural producers.
142 Environmental Sustainability of Canadian Agriculture: Agri-Environmental Indicator Report Series—Report #2
AUTHORS:
R.L Desjardins, X. Vergé,
J. Hutchinson, W. Smith, B. Grant,
B. McConkey and D. Worth.
INDICATOR NAME:
AgriculturalGreenhouse Gas
Budget
STATUS:
National coverage,
1981 to 2001
21. Greenhouse Gases
1 Mt CO2eq = 1 million tonnes “carbon dioxide equivalents”
AtmosphereAtmosphere
SoilSoil
Plants
CO2CH4 CH4 N2O
Livestock ManureCrop
management
Figure 21-1: Main sources and sinks of GHGassociated with agroecosystems
143E. Air Quality
THE INDICATORFigure 21-1 shows the main sources and sinks of greenhouse gases associated with agroecosys-tems. The Agricultural Greenhouse Gas BudgetIndicator was developed to provide an estimateof the on-farm net emissions (emissions minusabsorption) of three gases: nitrous oxide,methane and carbon dioxide.
There are three sources of nitrous oxide emis-sions: (1) direct emissions from agricultural fields (arising from mineral fertilizers, manureused as fertilizer, crop residues and the cultiva-tion of organic soils); (2) direct emissions fromanimal production systems (collection and storage of manure and direct deposition ofmanure on pasture by grazing animals); and (3)indirect emissions (volatilization and atmosphericdeposition of ammonia, nitrogen leaching andrun-off). Methane emissions come mainly fromfarm animals, from the anaerobic decompositionof manure and from soils which may act as asource or sink for methane, depending on moisture conditions. In this report, direct carbondioxide emission (or absorption) by soils is captured by the Soil Organic Matter on CroplandIndicator (see Chapter 14 for details). It should benoted that carbon dioxide is also emitted duringfossil fuel combustion by farm machinery andfrom the manufacturing of fertilizers andmachinery used in agriculture. However, theseindirect sources of GHGs are typically capturedunder transportation and manufacturing sectorreporting and are therefore not included in theestimates presented in this report. The perform-ance objective for this indicator is to havedeclining net emissions of greenhouse gases over time (a specific reduction target has not yet been established for agriculture).
CALCULATION METHOD The methodology of the IntergovernmentalPanel on Climate Change (IPCC) was used tocalculate nitrous oxide and methane emissions,whereas the Century Model was used to estimate net carbon dioxide exchange. The IPCC methodology involves three basic steps:
1) collecting information on animal popula-tions, amount of manure produced, manurestorage and treatment system used, amountof fertilizer applied, type of crop planted, etc.
2) selecting the emission factors associated withvarious management practices, either taken from the literature or based on experimental data.
3) calculating the GHG emissions by multiplying the emission factors by either the amount, the population or the area involved.
Methane is emitted through enteric fermenta-tion and manure management. For entericfermentation these three steps are performed at two levels of detail (Vergé et al. 2005). Thefirst level of detail relies on the use of defaultemission factors from the IPCC. It is used to calculate methane emissions for animal categories considered to be of lesser importanceas a methane source (sheep, goats, horses, bison and swine). The second level of detail uses country-specific information to calculateemissions for animals considered to be the mainsources of methane (dairy and non-dairy cattle).For manure management, the second level ofdetail was used for all livestock categories.
In the case of nitrous oxide, a recently revisedIPCC methodology, adjusted for conditions in Canada, was used to calculate emissions(Hutchinson et al. 2005). Finally, carbon dioxideemissions from soils were estimated using theCentury Model (see Chapter 14).
The Global Warming Potential (GWP) of each gaswas used to allow comparison and combinedreporting. GWP is the contribution that a gasmakes to the greenhouse effect according to itscapacity to absorb radiation and its residencetime in the atmosphere. Although slightly different GWPs were recently estimated formethane and nitrous oxide (IPCC 2001), for this report we will use the GWPs commonlyused for Kyoto Protocol reporting, namely 1 for carbon dioxide, 21 for methane and 310 for nitrous oxide (IPCC 1996). This means thatone molecule of nitrous oxide or methane is 310 and 21 times more powerful greenhouse gas than carbon dioxide, respectively. Results are presented in table and map form, and areexpressed in Mt CO2eq or kg CO2eq. Map scaleswere selected to best represent the variation inemissions across the country.
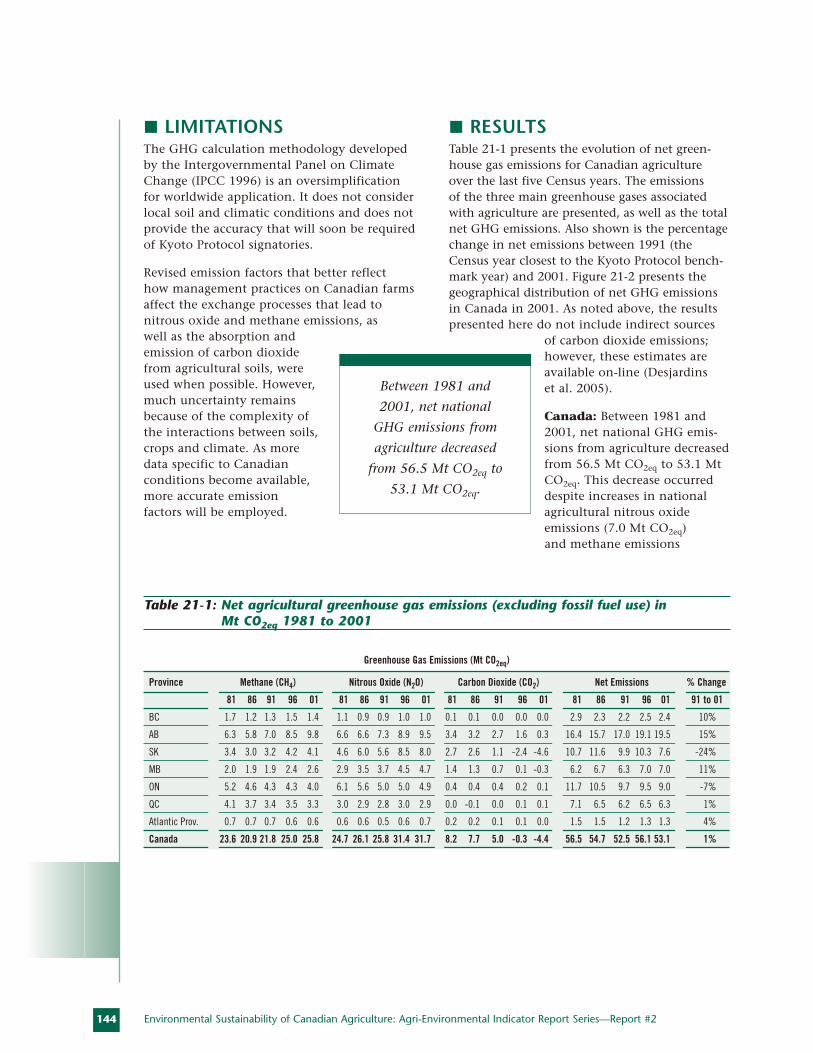
144
LIMITATIONSThe GHG calculation methodology developedby the Intergovernmental Panel on ClimateChange (IPCC 1996) is an oversimplification for worldwide application. It does not considerlocal soil and climatic conditions and does notprovide the accuracy that will soon be requiredof Kyoto Protocol signatories.
Revised emission factors that better reflect how management practices on Canadian farmsaffect the exchange processes that lead tonitrous oxide and methane emissions, as well as the absorption andemission of carbon dioxidefrom agricultural soils, wereused when possible. However,much uncertainty remainsbecause of the complexity ofthe interactions between soils,crops and climate. As moredata specific to Canadian conditions become available,more accurate emission factors will be employed.
RESULTSTable 21-1 presents the evolution of net green-house gas emissions for Canadian agriculture over the last five Census years. The emissions of the three main greenhouse gases associatedwith agriculture are presented, as well as the totalnet GHG emissions. Also shown is the percentagechange in net emissions between 1991 (theCensus year closest to the Kyoto Protocol bench-mark year) and 2001. Figure 21-2 presents thegeographical distribution of net GHG emissionsin Canada in 2001. As noted above, the resultspresented here do not include indirect sources
of carbon dioxide emissions;however, these estimates areavailable on-line (Desjardins et al. 2005).
Canada: Between 1981 and2001, net national GHG emis-sions from agriculture decreasedfrom 56.5 Mt CO2eq to 53.1 MtCO2eq. This decrease occurreddespite increases in nationalagricultural nitrous oxide emissions (7.0 Mt CO2eq) and methane emissions
Environmental Sustainability of Canadian Agriculture: Agri-Environmental Indicator Report Series—Report #2
Greenhouse Gas Emissions (Mt CO2eq)
Province Methane (CH4) Nitrous Oxide (N2O) Carbon Dioxide (CO2) Net Emissions % Change
81 86 91 96 01 81 86 91 96 01 81 86 91 96 01 81 86 91 96 01 91 to 01
BC 1.7 1.2 1.3 1.5 1.4 1.1 0.9 0.9 1.0 1.0 0.1 0.1 0.0 0.0 0.0 2.9 2.3 2.2 2.5 2.4 10%
AB 6.3 5.8 7.0 8.5 9.8 6.6 6.6 7.3 8.9 9.5 3.4 3.2 2.7 1.6 0.3 16.4 15.7 17.0 19.1 19.5 15%
SK 3.4 3.0 3.2 4.2 4.1 4.6 6.0 5.6 8.5 8.0 2.7 2.6 1.1 -2.4 -4.6 10.7 11.6 9.9 10.3 7.6 -24%
MB 2.0 1.9 1.9 2.4 2.6 2.9 3.5 3.7 4.5 4.7 1.4 1.3 0.7 0.1 -0.3 6.2 6.7 6.3 7.0 7.0 11%
ON 5.2 4.6 4.3 4.3 4.0 6.1 5.6 5.0 5.0 4.9 0.4 0.4 0.4 0.2 0.1 11.7 10.5 9.7 9.5 9.0 -7%
QC 4.1 3.7 3.4 3.5 3.3 3.0 2.9 2.8 3.0 2.9 0.0 -0.1 0.0 0.1 0.1 7.1 6.5 6.2 6.5 6.3 1%
Atlantic Prov. 0.7 0.7 0.7 0.6 0.6 0.6 0.6 0.5 0.6 0.7 0.2 0.2 0.1 0.1 0.0 1.5 1.5 1.2 1.3 1.3 4%
Canada 23.6 20.9 21.8 25.0 25.8 24.7 26.1 25.8 31.4 31.7 8.2 7.7 5.0 -0.3 -4.4 56.5 54.7 52.5 56.1 53.1 1%
Table 21-1: Net agricultural greenhouse gas emissions (excluding fossil fuel use) in Mt CO2eq 1981 to 2001
Between 1981 and
2001, net national
GHG emissions from
agriculture decreased
from 56.5 Mt CO2eq to
53.1 Mt CO2eq.
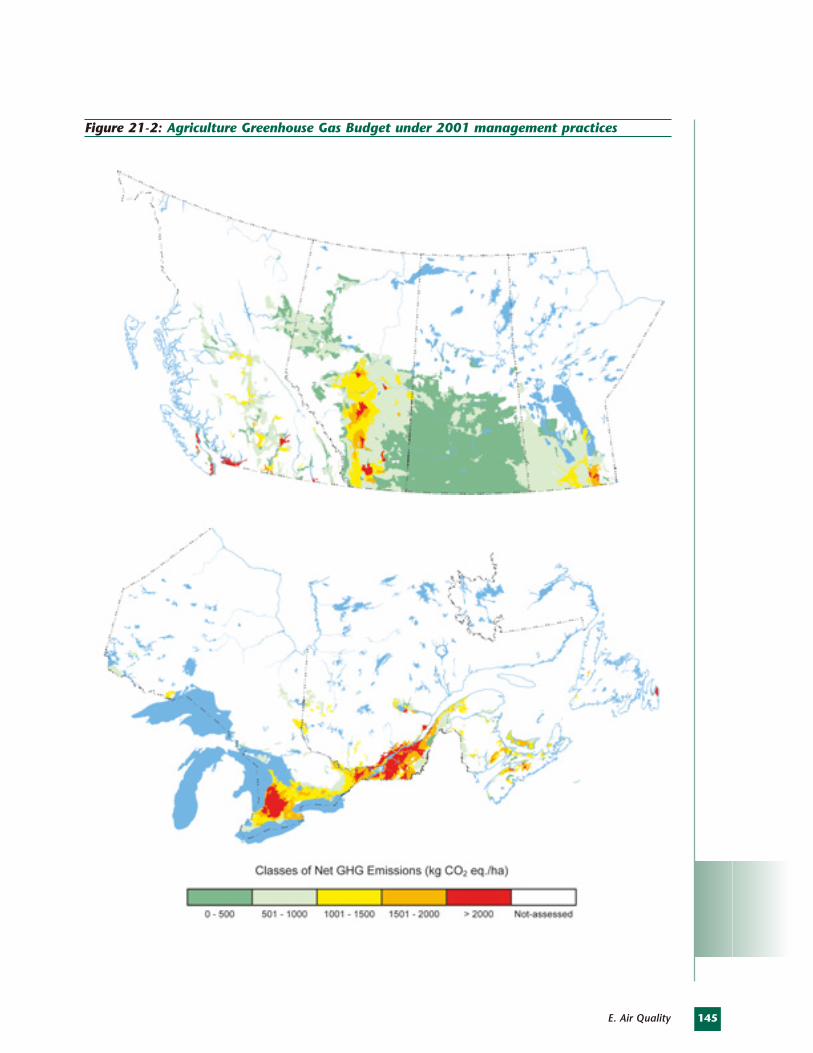
145E. Air Quality
Figure 21-2: Agriculture Greenhouse Gas Budget under 2001 management practices
146
(2.2 Mt CO2eq). This decrease is due to a substantial increase in carbon sequestration in agricultural soils, which went from being a source of 8.2 Mt CO2eq in 1981 to a sink of -4.4 Mt CO2eq by 2001. The distribution andintensity of GHG emissions across the country(Figure 21-2) are directly related to the area andintensity of agricultural production.
British Columbia: There was a small decrease(-0.5 MT CO2eq) in net GHG emissions in BCbetween 1981 and 2001, largely as a result of a reduction in CH4 emissions (-0.3 MT CO2eq).There was a little change in N2O and CO2
emissions over that time period.
Alberta: Of all the provinces, Alberta had thesharpest increase in GHG emissions between1981 and 2001, from 16.4 to 19.5 Mt CO2eq dueto increases in methane (3.5 Mt CO2eq) and innitrous oxide (2.9 Mt CO2eq). These increaseswere partly compensated by a reduction in CO2
emissions (-3.1 Mt CO2eq).
Saskatchewan: Emissions from Saskatchewandecreased by 3.1 Mt CO2eq between 1981 and2001, a trend largely explained by the fact thatagricultural soils went from being a source ofCO2 in 1981 (2.7 Mt CO2eq) to being a sink (-4.6 Mt CO2eq) in 2001. This was sufficient tooffset increases in methane and nitrous oxideemissions during that period (0.7 Mt CO2eq and3.4 Mt CO2eq respectively).
Manitoba: GHG emissions from Manitobaincreased by 0.8 Mt CO2eq between 1981 and2001. As in Saskatchewan, soils went from beinga source of CO2 (1.4 Mt CO2eq) to being a sink (-0.3 Mt CO2eq). However, this reduction was not as significant as the combined increase inmethane (0.6 Mt CO2eq) and nitrous oxide (1.8 Mt CO2eq).
Ontario: Emissions from Ontario decreased by2.7 Mt CO2eq between 1981 and 2001, with thisdowntrend encompassing in all three GHGs:methane (-1.2 Mt CO2eq), nitrous oxide (-1.2 MtCO2eq) and CO2 (-0.3 Mt CO2eq).
Quebec: Emissions from Quebec decreasedslightly (-0.8 Mt CO2eq) between 1981 and 2001.This downturn was supported by a decrease inmethane (-0.8 Mt CO2eq) and in nitrous oxide (-0.1 Mt CO2eq), while CO2 emissions increasedslightly (0.1 Mt CO2eq).
Atlantic: Combined GHG emissions from the four Atlantic Provinces showed a decrease of -0.2 Mt CO2eq during the 20-year period, as aresult of decreases in CO2 and methane emis-sions. Note that results for the provinces ofNewfoundland and Labrador, Prince EdwardIsland, Nova Scotia and New Brunswick havebeen combined, as emissions from theseprovinces are small.
INTERPRETATIONNet on-farm national GHG emissions, whichhad increased substantially in 1996, are close tothose calculated in 1991, the closest comparisonyear to the Kyoto Protocol baseline of 1990. This decrease is mainly the result of changes inland use and management practices that led to areduction in the area under summerfallow andan increase in the area under reduced tillage andno-tillage. These practices have significantlyincreased carbon sequestration in the agricul-tural soils of the Prairie Provinces by slowing the decomposition of crop residues. An increasein carbon sequestration has occurred in the agricultural soils of British Columbia and ofEastern Canada, but its magnitude is muchsmaller than the sequestration in prairie soils.Therefore, nationally, carbon sequestration inagricultural soils between 1981 and 2001 morethan offset substantial increases in nitrous oxide and methane emissions.
Nationally, nitrous oxide emissions increased by 28% between 1981 and 2001. The largestincreases in nitrous oxide emissions occurred in the Prairie Provinces primarily as a result of a large increase in the use of nitrogen fertilizer.This is especially true in Saskatchewan, wherefertilizer sales increased by more than 200%between 1981 and 2001, as the traditional
Environmental Sustainability of Canadian Agriculture: Agri-Environmental Indicator Report Series—Report #2
147E. Air Quality
practice of underfertilization was reduced inorder to better balance the removal/replacementratio of nitrogen in prairie soils. In the AtlanticProvinces and in British Columbia, emissionswere virtually unchanged between 1981 and2001, while emissions decreased in Quebec andOntario. This downturn reflects a 17% decreasein nitrogen fertilizer sales in Ontario and areduction in emissions from animal waste andmanure storage in both Ontario and Quebec as a result of a decrease in the total dairy and beefcattle population, which is discussed in moredetail in the following paragraph.
Methane emissions are mainly due to entericfermentation which represents 85% of the totalmethane emitted by livestock. The nationalincrease observed between 1981 and 2001 islargely the result of an increase in enteric fer-mentation by growing beef cattle populations.The change in methane emissions was not uniform across the country, since emissionsdecreased or remained constant in EasternCanada, but increased in Western Canada. Thisdifference is mainly due to the type of cattlebeing produced and the change in the animalpopulation in the east compared to the west.Eastern provinces posted a significant decreasein total dairy cow population from 1.4M head in 1981 to 0.8M head in 2001. At the same time,the total beef cattle population in the east hasdeclined since 1981, with the exception ofQuebec, where the population increased slightly(0.1M head). Since the methane emission factorfor dairy cows is almost twice that for beef cat-tle, the decrease in the dairy cow populationresulted in a net decrease in methane emissionsin Eastern Canada. On the other hand, in thewestern provinces, the dairy cattle populationwas halved from 0.4M head in 1981 to 0.2Mhead in 2001, but the resulting decrease inmethane emissions was small compared to theincrease in methane emissions due to significantgrowth in the beef cattle population, which wentfrom 7.4M head in 1981 to 10.5M head in 2001.
RESPONSE OPTIONSThere are many options available to Canadianfarmers to reduce GHG emissions and increasesoil sequestration of CO2, through improvedmanagement practices (Janzen et al. 1999) suchas improving the timing and rate of fertilizerapplication to suit crop and soil needs. In addition to sequestering CO2, many of thesemanagement practices that can reduce GHGemissions may benefit producers by reducinginefficiencies in fertilizer use and land management.
Reductions in net GHG emissions from agricul-tural soils and increased carbon sequestrationcan be promoted by following recommendedsoil conservation practices, such as includingmore forage crops in rotations, using reducedtillage, decreasing land under summerfallow and converting marginal agricultural land topermanent grasslands.
Methane is produced mainly through entericfermentation. The production of methane canbe reduced by changing animal feed to reducedigestion time. This can be accomplished byusing more easily digested feeds such as grains,legumes and silage; by harvesting forages at anearlier, more succulent growth stage; by feedingconcentrated supplements as required; and byadding edible oils to the diet. Methane is alsoproduced during the storage and decompositionof manure. If manure is stored as a liquid, or inpoorly aerated piles, a lack of oxygen preventsthe total decomposition of organic matter tocarbon dioxide, resulting in the production ofmethane. Methane emissions from manure canbe reduced by increasing aeration, by reducingmanure storage time and by reducing theamount of bedding in manure.
Nitrous oxide emissions are usually associatedwith a buildup of nitrate (NO3
-) in soils.Practices that have the potential to minimizethis buildup include matching fertilizer applica-tion to crop needs, using slow release fertilizers,avoiding excessive manure applications, opti-mizing the timing of fertilizer application, usingmore appropriate fertilizer placement and usingcover crops.
148
REFERENCESDesjardins, R.L., X. Vergé, J. Hutchinson, W. Smith, B. Grant, B. McConkey, D. Worth,2005. The Greenhouse Gas Indicator for CanadianAgriculture. Agriculture and Agri-Food Canada,Ottawa (Ont.).
Hutchinson, J.J., Desjardins R.L., D. Worth, Vergé X., 2005. Agri-Environmental Indicator,Greenhouse Gas Emissions: Nitrous OxideComponent. Agriculture and Agri-Food Canada, Ottawa (Ont.).
Intergovernmental Panel on Climate Change(IPCC), 1997. “Chapter 4, Agriculture” in Revised1996 IPCC Guidelines for National GreenhouseGas Inventories – Reference Manual, Vol. 3.IPCC, Bracknell (UK). http://www.ipcc-nggip.iges.or.jp/public/gl/invs6.htm
Intergovernmental Panel on Climate Change(IPCC), 2001. Climate Change 2001: The Scientific Basis. Contribution of Working Group I to the Third Assessment Report of theIntergovernmental Panel on Climate Change,Houghton, J.T., Y. Ding, D.J. Griggs, M. Noguer,P.J. van der Linden, X. Dai, K. Maskell, and C.A. Johnson (eds). Cambridge University Press,Cambridge (UK), 881pp. http://www.grida.no/climate/ipcc_tar/wg1/index.htm
Janzen, H.H., R.L. Desjardins, J.M.R. Asselin, and B. Grace, 1998. The Health of our Air: Toward Sustainable Agriculture in Canada.Agriculture and Agri-Food Canada, Ottawa(Ont.). http://res2.agr.ca/publications/ha/index_e.htm
Vergé, X., Desjardins R.L., D. Worth, J. Hutchinson, 2005. Agri-Environmental Indicator, Greenhouse Gas Emissions: MethaneComponent. Agriculture and Agri-Food Canada,Ottawa (Ont.).
Environmental Sustainability of Canadian Agriculture: Agri-Environmental Indicator Report Series—Report #2
THE ISSUE In Canada, anthropogenic ammonia emissionsto the atmosphere are dominated by agriculturalsources, mainly livestock production. Only asmall proportion (roughly one-fifth) of thenitrogen consumed by farm animals in feed isretained by the animal; the rest is excreted infeces, urine and uric acid (poultry). Some of thisnitrogen (especially in urine) will be convertedto ammonia and emitted soon after excretion or during manure storage and application.Fertilizer, especially ammoniacal and urea fertil-izer, is another potential source of ammonia.
Ammonia (NH3) is a colourless gas, lighter than air, with a sharp odour. In the atmosphere,excess concentrations of ammonia have beenlinked locally (0.1–10 km from the emissionsource) to direct toxicity to vegetation andeutrophication of nitrogen-sensitive environ-ments (Sheppard 2002). On a larger, regionalscale (10–100 km from the source), ammoniacontributes to acid rain and is a precursor toaerosol formation. These aerosols, primarilyammonium sulphate and ammonium nitrate,form in the atmosphere and contribute to theformation of fine particulate matter (PM2.5),which is linked to the formation of smog and to potential health effects (see Chapter 23).There are two major areas of NH3-mediatedsmog in Canada: the Fraser Valley and theWindsor–Montreal corridor.
Concern about the role of ammonia as a precursor to environmental and health impactsled Environment Canada to declare ammonia as a toxic substance under the CanadianEnvironmental Protection Act (CEPA) in June of 2003. Many countries, especially in Europeand North America, have recognized theseissues. This is evidenced by the inclusion ofammonia in the international GothenburgProtocol, which requires that all signatorynations quantify and reduce their emissions in relation to 1990 levels.
THE INDICATORWhile several options exist for the basic formu-lation of the Indicator of Ammonia Emissionsfrom Agriculture, the approaches used in otherparts of the world, notably Europe, may not beadequate for the Canadian situation. The majorseasonal variations in climate and activities in Canada, as well as the focus on ammoniaemissions as a precursor to smog episodes (notjust toxicity to vegetation or eutrophication) has profound implications for both the indicatormodel formulation and the selection of parame-ter values.
The envisioned Indicator of Ammonia Emissionsfrom Agriculture will therefore:
• be a total emissions indicator (depositionand net emission to be considered later);
SUMMARYAmmonia (NH3) emissions are an environmental and health concern in many nations, particularly owing
to the potential for direct toxicity to natural vegetation, eutrophication of surface waters and production of
fine particulate matter. An Indicator of Ammonia Emissions from Agriculture is being developed to assess
the agricultural sector’s contribution to this problem. The indicator will be based on total ammoniacal
nitrogen and will cover aspects of feed nitrogen management and manure management as well as fertilizer
sources. Several approaches may be available to decrease the total ammoniacal nitrogen in manure or to
reduce ammonia losses from animal housing, manure storage and land application.
149E. Air Quality
AUTHORS:
S.C. Sheppard, S. Bittman and J. Tait
INDICATOR NAME:
AmmoniaEmissions fromAgriculture
STATUS:
Currently underdevelopment
22. Ammonia
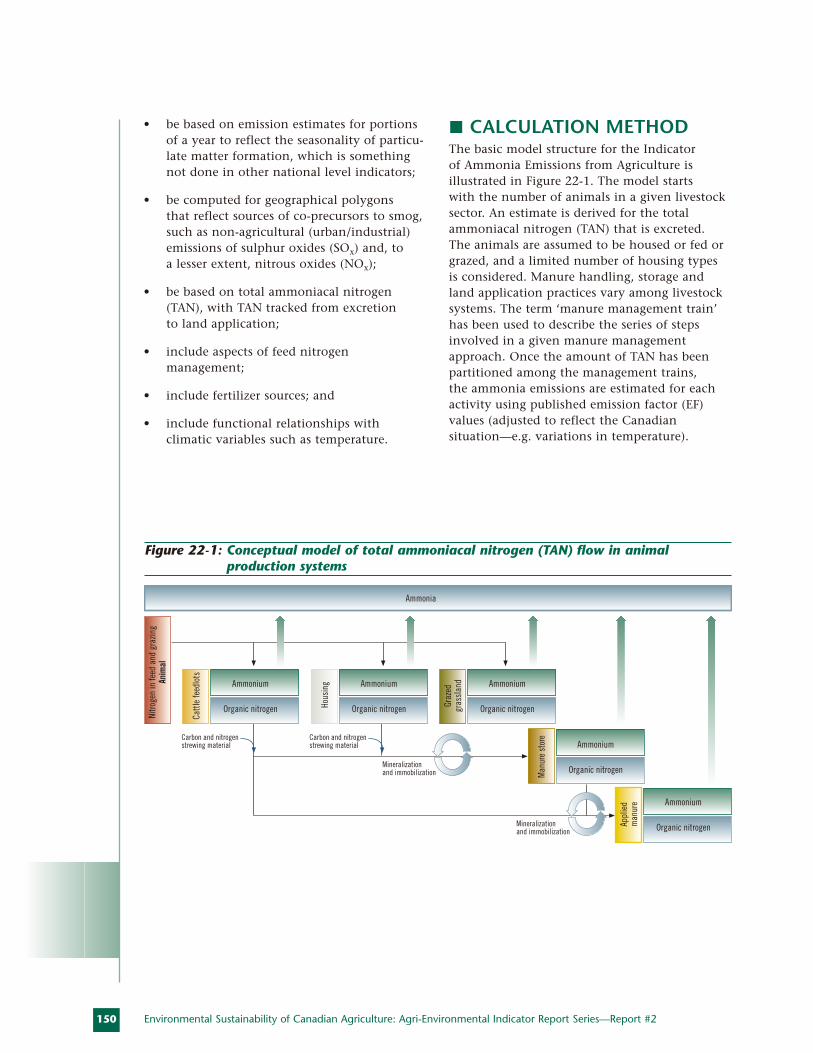
150
• be based on emission estimates for portionsof a year to reflect the seasonality of particu-late matter formation, which is somethingnot done in other national level indicators;
• be computed for geographical polygons that reflect sources of co-precursors to smog,such as non-agricultural (urban/industrial)emissions of sulphur oxides (SOx) and, to a lesser extent, nitrous oxides (NOx);
• be based on total ammoniacal nitrogen(TAN), with TAN tracked from excretion to land application;
• include aspects of feed nitrogen management;
• include fertilizer sources; and
• include functional relationships with climatic variables such as temperature.
CALCULATION METHODThe basic model structure for the Indicator of Ammonia Emissions from Agriculture is illustrated in Figure 22-1. The model starts with the number of animals in a given livestocksector. An estimate is derived for the totalammoniacal nitrogen (TAN) that is excreted.The animals are assumed to be housed or fed orgrazed, and a limited number of housing typesis considered. Manure handling, storage andland application practices vary among livestocksystems. The term ‘manure management train’has been used to describe the series of stepsinvolved in a given manure managementapproach. Once the amount of TAN has beenpartitioned among the management trains, the ammonia emissions are estimated for eachactivity using published emission factor (EF) values (adjusted to reflect the Canadian situation—e.g. variations in temperature).
Environmental Sustainability of Canadian Agriculture: Agri-Environmental Indicator Report Series—Report #2
Ammonium
Cattl
e fe
edlo
ts
Nitro
gen
in fe
ed a
nd g
razin
gAn
imal
Organic nitrogen
Ammonium
Ammonia
Hou
sing
Organic nitrogen
Ammonium
Graz
edgr
assl
and
Organic nitrogen
Ammonium
Man
ure
stor
e
Organic nitrogen
Ammonium
Appl
ied
man
ure
Organic nitrogen
Carbon and nitrogenstrewing material
Carbon and nitrogenstrewing material
Mineralizationand immobilization
Mineralizationand immobilization
Figure 22-1: Conceptual model of total ammoniacal nitrogen (TAN) flow in animal production systems
151E. Air Quality
This computational process isreplicated across the animalsectors (poultry, pig, beef anddairy), with separate account-ing within these sectors fordifferent animal classes (e.g.boars, sows and fatteners inthe swine sector). Total ammo-nia emissions are summedacross all animal sectors andclasses, and all steps in themanagement trains. To this isadded an estimate of NH3
emissions from grazing andfrom fertilizers. These computations will bedone for specific time periods within the year.Results will be reported as annual emissions (e.g. as Gg NH3 yr-1) of NH3 to support interna-tional reporting efforts and comparisons. Thisannual value will have less direct meaning tostakeholders, however, because it encompassesall regions and sectors. Therefore, to provide apicture of regional and seasonal impacts, additional formulations will be computed that can be related to various mapping units, such as the Fraser Valley and theWindsor–Montreal corridor.
Crucial to the indicator is the availability ofrecent and accurate data on farm activities andpractices. For example, information is needed onnitrogen in animal diets, on housing ventilationand on manure removal, storage and land-spreading practices. Surveys on farmingactivities, as well as expert opinions, will berequired to provide credible activity data for the ammonia indicator.
LIMITATIONSThe availability of comprehensive activity dataconstitutes a major limitation. The model is very data intensive, requiring hundreds ofparameters. The animal census data are the least problematic. The management activity data that will be used to define and categorizethe manure management trains will be obtainedlargely from farmer surveys and interviews. Data gaps and inaccuracies may result from thesurvey process as well as from categorization,which can mask important details.
Also uncertain are the emissionfactor (EF) values. Few have beenmeasured in Canada, and thereare large uncertainties related tomethodology and applicabilityfor those measured overseas.Extrapolation methods may berequired to adapt the EF dataobtained from Europe toCanadian conditions, especiallyto account for climate and sea-sonality effects. There are alsosome important activities inCanada that have not been
studied sufficiently in Europe. These includeextensive grazing, sometimes on frozen soils,with centralized water sources, and cattle feedlotswith compacted or frozen ground conditions.
RESULTS This indicator is currently under developmentand results are not yet available.
RESPONSE OPTIONSAmmonia emissions are linked to most majorcomponents of the livestock industry and usageof urea or ammonia containing fertilizers. As the number of potential mitigation measures in livestock systems is large, it would seem most beneficial to focus on components that also encompass other aspects of nutrient management. For example, phase feeding andrelated techniques for matching the nitrogen supply in feed to animals’ specific proteinrequirements would decrease the total ammonia-cal nitrogen in manure and may decrease feed costs. Similarly, on pasture lands, the proportion of legumes in the stand could be partially managed in order to match nutritionalneeds. Based on our sensitivity analysis, bettermanagement of nitrogen in livestock diets represents the simplest and most effective mitigation strategy and one that can reduceinputs of ammonia to farming systems. By contrast, all the other mitigation measures are designed to reduce losses of ammonia from the systems.
In Canada,
anthropogenic
ammonia emissions
to the atmosphere
are dominated by
agricultural
sources, mainly
livestock production.
152
Perhaps the next most beneficial practice would be improved landspreading technology.Emission factors can be decreased from wellabove 50% to near-zero if manure is not surface spread but is instead injected or rapidlyincorporated into the soil. This also saves nitro-gen for crop production and may enhance theavailability of other nutrients. Finally, there aresome techniques for reducing ammonia lossesfrom housing and storage, most of whichinvolve mitigation of odour (e.g. coveringmanure storage facilities).
It should be kept in mind that these mitigationmeasures are not necessarily additive. It may not be possible to reduce emissions from allstages of manure handling. In practice, reducingammonia emissions at one stage may actuallylead to larger relative emissions at a later stage.For this reason, it is probably prudent to tieammonia mitigation strategies to approachesthat also preserve the nutrient quality ofmanure and decrease odour.
REFERENCESEnvironment Canada and Health Canada, 1999.Canadian Environmental Protection Act.http://www.ec.gc.ca/CEPARegistry/gene_info/
Sheppard, S.C., 2002. Three Approaches to Define the Ecotoxicity Threshold for AtmosphericAmmonia. Canadian Journal of Soil Science. 82 (3): 341-354.
Sheppard, S.C., S.G. Sommer, and S. Bittman,2004. Plan for Developing a CanadianEnvironmental Indicator for Ammonia EmissionsFrom Agricultural Sources. Agriculture and Agri-Food Canada, Agassiz (B.C.).
United Nations Economic Commission forEurope (UNECE), 1999. Protocol to AbateAcidification, Eutrophication and Ground-levelOzone. UNECD, Gothenburg (Sweden).http://www.unece.org/env/lrtap/multi_h1.htm
Environmental Sustainability of Canadian Agriculture: Agri-Environmental Indicator Report Series—Report #2
THE ISSUE“Particulate matter” is the general term used fora mixture of solid particles and liquid droplets
found in the air. Some particles are large enoughto be seen as dust or dirt, while others are sosmall they can be detected only with an electronmicroscope. “Total Suspended Particulate (TSP)”describes the particulate loading of the atmos-phere, representing all PM sizes less than 100 µm.PM10 refers to particles that are less than 10 µm,PM2.5 describes particles that are smaller than 2.5 µm in diameter. PM2.5 emissions are the mostproblematic of PM emissions, as these particlescan travel long distances and can cause the mostharm. Particulate matter is also referred to as “primary” or “secondary” depending on its ori-gin. Primary particles, such as dust from roads orblack carbon (soot) from combustion sources, areemitted directly into the atmosphere. Secondaryparticles are formed in the atmosphere from primary gaseous emissions. Secondary PM fromagricultural emissions of ammonia makes up asignificant part of the total PM2.5 emission to the atmosphere.
Numerous epidemiological studies worldwidehave shown a positive link between ambient PM concentrations and adverse health effects(Lippmann 1998), such as increased bronchodila-tor use (Pope 1991), bronchitis and chroniccoughs in children (Dockery et al. 1989).Particulate matter may be harmful due to the particles’ chemical and/or physical characteristics;the particles may also interfere with mechanismsin the respiratory tract; or they may act as a carrier for some other harmful substance. The potential environmental impacts of
ambient PM include climate change, decreasedvisibility, stratospheric ozone depletion and airpollution (e.g. acid rain, smog).
There are many anthropogenic sources of PM,including agricultural sources. The current emissions inventory for Canada indicates thatagriculture contributes a significant portion ofthe particulate matter that is released to theatmosphere, (13% of the TSP, 20% of the PM10
and 15% of the PM2.5). At present, this inventorydoes not take into account other known sourcesof agricultural emissions, such as animal feedingfacilities, agricultural burning, or secondary PMcreated from ammonia emissions. Identificationof the sources of PM from agricultural operationsis an important step towards assessing the impactof these emissions and the implementation/development of agricultural practices that couldmitigate their eventual impacts to human andanimal health and on the environment.
THE INDICATORAn Agricultural Particulate Matter EmissionsIndicator (APMEI) is currently being developedto estimate the agriculture sector’s contributionto the problem of PM emissions and to providea means of assessing our progress towards miti-gating these emissions. Initially the indicatorwill be reported as annual PM emission at thenational scale for each PM class (PM2.5, PM10,TSP). The agricultural categories that are coveredare presented in Figure 23-1, which illustratesthe conceptual framework of the APMEI.
SUMMARYThe emission of particulate matter (PM) from agricultural operations is an emerging air quality issue in the
agriculture sector today. Ambient PM has been linked to negative impacts on human and animal health
and on the environment. Even without a complete inventory of emissions, we know that the sector is respon-
sible for a significant share of the total particulate matter generated by anthropogenic, or human, sources.
An indicator is currently being developed (i.e. the Agricultural Particulate Matter Emissions Indicator,
or APMEI) to assess the extent of and trends in agricultural emissions of particulate matter into the
atmosphere. APMEI will be used to monitor progress as corrective measures and policies are implemented.
153E. Air Quality
AUTHORS:
G. Edwards and E. Pattey
INDICATOR NAME:
AgriculturalParticulate Matter EmissionsIndicator
STATUS:
Currently underdevelopment
23. Particulate Matter
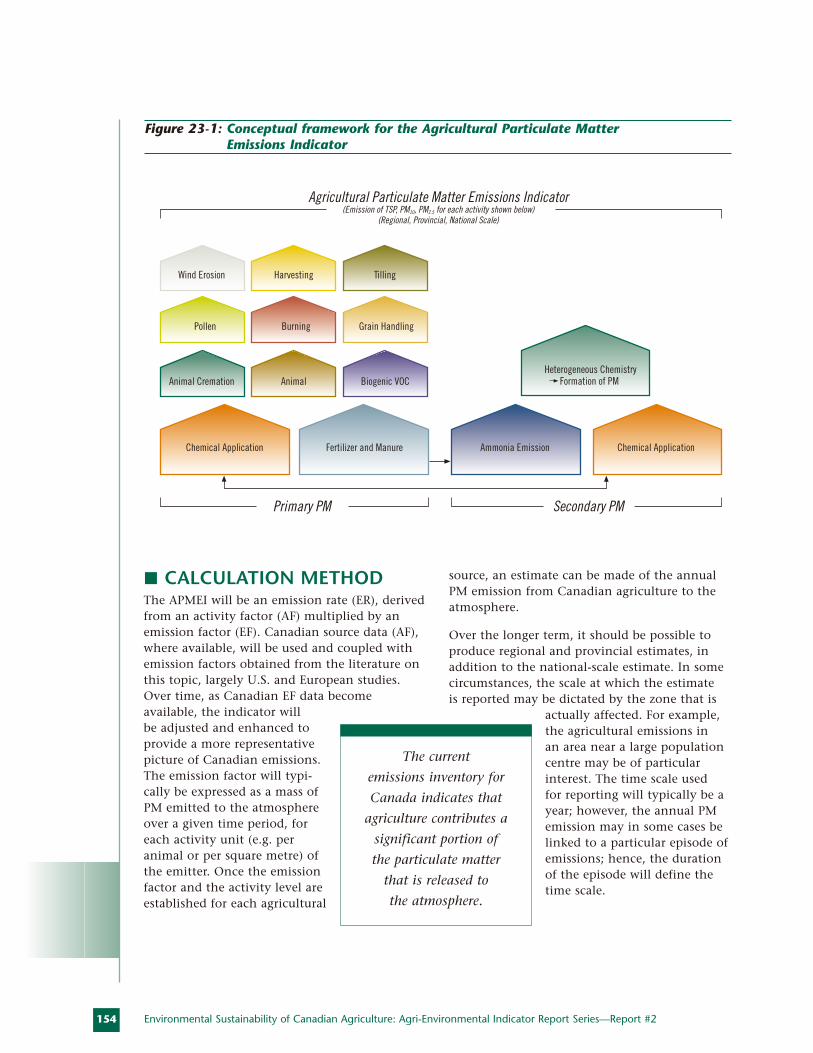
154
CALCULATION METHODThe APMEI will be an emission rate (ER), derivedfrom an activity factor (AF) multiplied by anemission factor (EF). Canadian source data (AF),where available, will be used and coupled withemission factors obtained from the literature onthis topic, largely U.S. and European studies.Over time, as Canadian EF data become available, the indicator will be adjusted and enhanced toprovide a more representativepicture of Canadian emissions.The emission factor will typi-cally be expressed as a mass ofPM emitted to the atmosphereover a given time period, foreach activity unit (e.g. per animal or per square metre) ofthe emitter. Once the emissionfactor and the activity level areestablished for each agricultural
source, an estimate can be made of the annualPM emission from Canadian agriculture to theatmosphere.
Over the longer term, it should be possible toproduce regional and provincial estimates, inaddition to the national-scale estimate. In somecircumstances, the scale at which the estimate is reported may be dictated by the zone that is
actually affected. For example,the agricultural emissions in an area near a large populationcentre may be of particularinterest. The time scale used for reporting will typically be ayear; however, the annual PMemission may in some cases belinked to a particular episode ofemissions; hence, the durationof the episode will define thetime scale.
Environmental Sustainability of Canadian Agriculture: Agri-Environmental Indicator Report Series—Report #2
Pollen
Animal Cremation
Chemical Application Fertilizer and Manure
Primary PM Secondary PM
Wind Erosion
Burning
Animal
Harvesting
Grain Handling
Biogenic VOC
Tilling
Ammonia Emission
Heterogeneous Chemistry Formation of PM
Chemical Application
Agricultural Particulate Matter Emissions Indicator(Emission of TSP, PM10, PM2.5 for each activity shown below)
(Regional, Provincial, National Scale)
Figure 23-1: Conceptual framework for the Agricultural Particulate Matter Emissions Indicator
The current
emissions inventory for
Canada indicates that
agriculture contributes a
significant portion of
the particulate matter
that is released to
the atmosphere.
155E. Air Quality
LIMITATIONSThe main limitation of this approach relates to the availability and accuracy of Canadianemission factors. In some cases, emission factorscan be obtained from other countries such asthe United States and European countries, whilein other cases there may be none available.Furthermore, the activity data that are neededfor the indicator calculations may not always be available at the desired temporal and spatialscales. In the longer term, the required datashould become available, thus allowing us toprovide an increasingly accurate portrait ofCanadian emissions and to develop regionalestimates and evaluate episodic releases.
RESULTSThis indicator is currently under developmentand results are not yet available.
RESPONSE OPTIONSEnvironmental policies are already in place todeal with PM emissions to the atmosphere fromindustrial sources, and policy coverage is likelyto be extended to the agricultural sector infuture. While the Agricultural Particulate MatterEmissions Indicator will initially be developedusing a simplified approach, it will neverthelessyield useful preliminary information on particu-late matter emissions in the agriculture sector. It will also guide decision makers with respect to the development, implementation and follow-up evaluation of beneficial managementpractices (BMPs) that can play a role in mitigat-ing PM emissions, such as the following:
• the installation of dust extraction or ventilation systems in agricultural buildings,with filters and dust-capturing systems;
• the use of mist and water sprinkling toreduce dust in the air (small water particlesencapsulate the dust particles, causing themto fall to the floor);
• the use of dust-binding components in feed and bedding material;
• the use of leak-proof ducts and enclosedconveyor systems for grains and feed to prevent particle release; and
• the use of windbreaks to control dust andodour emissions from animal buildings, aswell as pollen and other particulate matterfrom fields.
REFERENCESDockery, D.W., F.E. Speizer, D.O. Stram, J.H.Ware, J.D. Spengler, and B.G. Ferris, Jr., 1989.Effects of inhaled particles on respiratory health ofchildren. American Review of RespiratoryDisease. 139: 587-594.
Lippmann, M., 1998. Background on health effects of acid aerosols. Environmental HealthPerspectives. 79 : 3-6.
Pope, C.A., 1991. Respiratory hospital emissionsassociated with PM10 pollution in Utah, Salt Lake,and Cache valleys. Archives of EnvironmentalHealth. 46: 89-97.

FBiodiversity
THE ISSUEAgricultural productivity depends on wise, orsustainable, use of resources, including soil,water, energy and nutrients. Similarly, the con-servation of biodiversity depends on the wiseand sustainable management of the habitats on which all species rely for their continuedexistence. A suitable wildlife habitat must contain specific components that are critical for wildlife survival: food, water, shelter andspace. It must also provide for needs such as reproduction, dispersal and migration.Landscapes lacking wildlife habitats of sufficient quality or in sufficient quantity cannot sustain populations of certain species.
Agricultural land, which makes up 7.5% ofCanada’s land mass, has the most fertile soilsand the most favourable climatic conditions.Canada’s agricultural landscape is comprised ofcultivated areas and grazing land with associatedriparian land, wetlands, woodlands and naturalgrasslands. These habitats support many ofCanada’s wildlife species. Over 500 resident orvisiting species of birds, mammals, reptiles and
amphibians are known to use agricultural landsin Canada. In addition, approximately half ofthe terrestrial vertebrates currently listed asspecies at risk by the Committee on the Statusof Endangered Wildlife in Canada (COSEWIC2004) occur on agricultural lands in Canada.The existence and viability of these specieswithin the agricultural landscape depend ontheir ability to obtain the necessary resources for breeding, feeding and cover. These resourcesmust be available to the species on the agricul-tural land itself, or on adjacent habitats withintheir normal home range. As land managers,agricultural producers play a significant role insustaining biodiversity.
THE INDICATOR The Wildlife Habitat on Farmland Indicator is used to assess trends in the capacity of agricultural lands to provide suitable habitatthat will sustain populations of wild terrestrialvertebrates. The indicator relates the varioushabitats used by birds, mammals, reptiles andamphibians to five broad land cover categories
SUMMARYAgricultural land makes a significant contribution to biodiversity. The varied habitats associated with
agricultural land provide some or all of the requirements of many wildlife species across Canada. Not all
habitat types are equal, however, in their capacity to support wildlife. Wetlands, woodlots, riparian areas
and natural pasture are the most important habitat elements for wildlife in the agricultural landscape.
The Wildlife Habitat on Farmland Indicator reported on here provides insight into the trends in wildlife
habitat available on agricultural land in Canada. The indicator, by associating land area, land use and
wildlife use (habitat capacity), improves our understanding of how sectoral, market and policy issues can
affect the availability of wildlife habitat on agricultural lands.
The habitat capacity of farmland decreased in Canada between 1981 and 2001. The agricultural intensifi-
cation that has occurred in some areas of the country since 1981 has caused a decrease in wildlife habitat
capacity. In Eastern Canada, for example, increases in cropland have been a driving force in the reduction
of wildlife habitat capacity, especially where these increases occurred at the expense of more valuable
habitats such as natural pasture, wetlands and woodlands. There have also been some positive changes
for wildlife, primarily in Western Canada, through a reduction in the use of summerfallow as part of the
crop rotation. Canadian agricultural producers play a primary role in maintaining wildlife habitat capacity
through their activities and their decisions. Substantial benefits to biodiversity are realized when producers
sustain natural habitats or adopt beneficial management practices that can enhance habitat quality
without reducing productivity.
158 Environmental Sustainability of Canadian Agriculture: Agri-Environmental Indicator Report Series—Report #2
AUTHORS:
S.K. Javorek, R. Antonowitsch,C. Callaghan, M.
Grant and T. Weins
INDICATOR NAME:
Wildlife Habitaton Farmland
Indicator
STATUS:
National coverage,
1981 to 2001
24. Wildlife Habitat on Farmland
159F. Biodiversity
(habitat types) used in the Census ofAgriculture: cropland, summerfallow, tame pasture, natural pasture and “all other land”.
Habitat capacity was calculated for these fiveland cover types at the Soil Landscapes ofCanada (SLC) polygon scale, for each of theCensus years between 1981 and 2001. The indicator results are expressed in five classes ofchange in farmland wildlife habitat capacitybetween different Census years. These classes are defined as follows: large increase (>10%),moderate increase (>2.5% to 10%), negligible to small change (-2.5% to + 2.5%), moderatedecrease (<-2.5% to -10%) and large decrease (<-10%). The performance objective for the indicator is for agricultural land to fall in thefirst two classes, meaning that agro-ecosystemswould improve their capacity to provide habitatfor wildlife.
CALCULATION METHODHabitat suitability matrices were previouslydeveloped for 493 wildlife species associatedwith farmland habitat (Neave and Neave 1998).The species list was compiled using informationfrom authoritative wildlife guidebooks, andhabitat use information was gathered from a literature review and expert opinion. A matrixwas constructed for each terrestrial vertebratespecies (bird, mammal, amphibian and reptile)known to use agricultural land and adjacenthabitats in Canada for one or more specifichabitat requirements (breeding, feeding, loafing,cover, staging and wintering). Each habitat usewas ranked as primary, secondary or tertiaryaccording to the importance of the habitat tothe species.
As already mentioned, the five broad land cover (agricultural habitat) types in the habitatsuitability matrices correspond to five categoriesof agricultural land found in the Census ofAgriculture: cropland, summerfallow, tame pasture, natural pasture and “all other land”.These broad categories have been subdivided to more precisely reflect the different habitatsfound on agricultural land. For example, naturalpasture is divided into natural grassland, sage-brush/shrubs and shrubs/woodland. A HabitatCapacity Index is calculated by relating thenumber of species that use each of the fiveselected land cover categories to the relative
area occupied by each land cover type. Only primary and secondary habitat use for breeding,feeding or cover is considered in the calculations.The indicator then assesses the impact of relativechanges in land cover types on the wildlife habi-tat capacity of agricultural land in Canada.
LIMITATIONSThe following limitations apply to this indicator:
• Because the “all other land” category fromthe Census of Agriculture does not currentlycapture the area or changes in some habitattypes that are important to wildlife (e.g. wet-lands and woodlands), the trends in thesehabitats cannot be adequately differentiatedin the indicator calculations.
• The indicator does not currently capturemeasures of habitat quality (e.g. fragmenta-tion, connectivity, spatial configuration,forest interior habitat) except through theinclusion of primary and secondary habitatuses in the analysis. Smaller-scale studieshave been set up to address this informationgap and support future reporting.
• The indicator is currently unable to reflectthe beneficial effects on wildlife habitat thatare associated with some management prac-tices, such as rotational and complementarygrazing systems or conservation tillage.
• In its current form, the indicator onlyreflects habitat capacity for terrestrial vertebrates. It does not consider other elements of biodiversity, such as plants,aquatic animals or invertebrates, that could be affected by agriculture.
• The categories used to assess change inwildlife habitat capacity (five classes) werechosen subjectively. No methodology wasfound that could be used to objectively display a meaningful amount of increase ordecrease in habitat capacity. Error marginsin the data should be incorporated intofuture iterations of the indicator.
• The indicator does not currently relatechanges in the wildlife habitat capacity ofagricultural land to an actual response(increase or decrease) by wildlife populations.
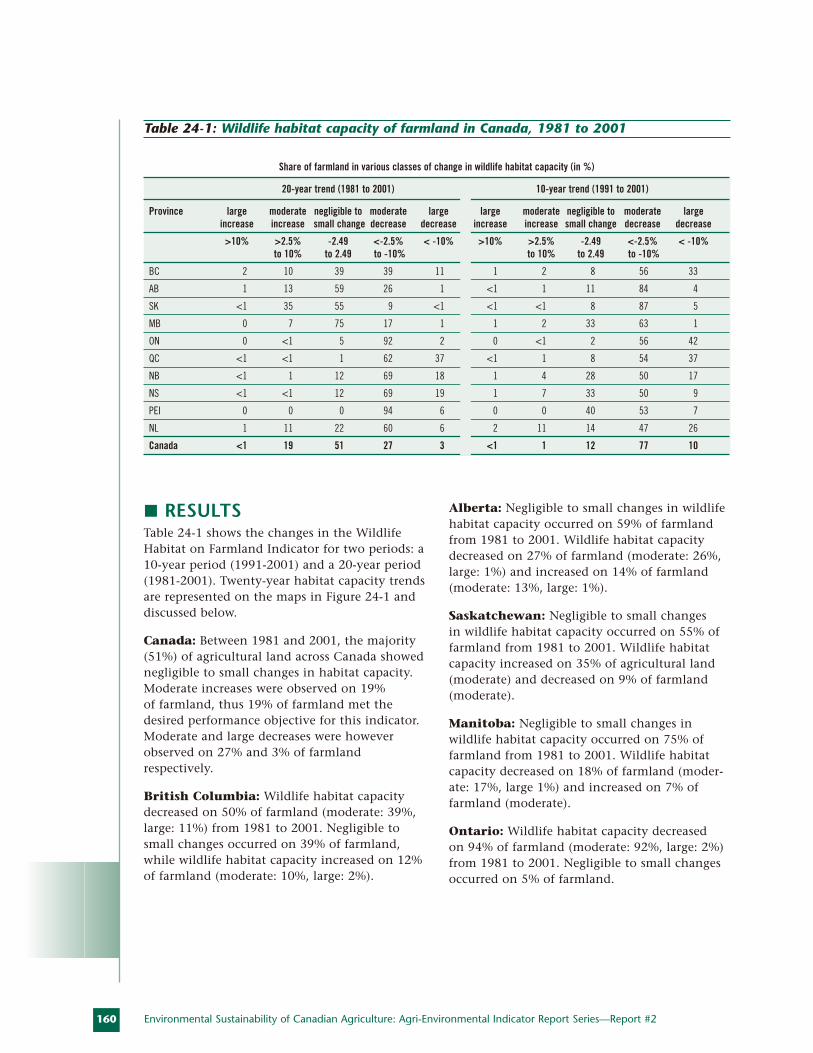
160
RESULTSTable 24-1 shows the changes in the WildlifeHabitat on Farmland Indicator for two periods: a10-year period (1991-2001) and a 20-year period(1981-2001). Twenty-year habitat capacity trendsare represented on the maps in Figure 24-1 anddiscussed below.
Canada: Between 1981 and 2001, the majority(51%) of agricultural land across Canada showednegligible to small changes in habitat capacity.Moderate increases were observed on 19% of farmland, thus 19% of farmland met thedesired performance objective for this indicator.Moderate and large decreases were howeverobserved on 27% and 3% of farmland respectively.
British Columbia: Wildlife habitat capacitydecreased on 50% of farmland (moderate: 39%,large: 11%) from 1981 to 2001. Negligible tosmall changes occurred on 39% of farmland,while wildlife habitat capacity increased on 12%of farmland (moderate: 10%, large: 2%).
Alberta: Negligible to small changes in wildlifehabitat capacity occurred on 59% of farmlandfrom 1981 to 2001. Wildlife habitat capacitydecreased on 27% of farmland (moderate: 26%,large: 1%) and increased on 14% of farmland(moderate: 13%, large: 1%).
Saskatchewan: Negligible to small changes in wildlife habitat capacity occurred on 55% offarmland from 1981 to 2001. Wildlife habitatcapacity increased on 35% of agricultural land(moderate) and decreased on 9% of farmland(moderate).
Manitoba: Negligible to small changes inwildlife habitat capacity occurred on 75% offarmland from 1981 to 2001. Wildlife habitatcapacity decreased on 18% of farmland (moder-ate: 17%, large 1%) and increased on 7% offarmland (moderate).
Ontario: Wildlife habitat capacity decreased on 94% of farmland (moderate: 92%, large: 2%)from 1981 to 2001. Negligible to small changesoccurred on 5% of farmland.
Environmental Sustainability of Canadian Agriculture: Agri-Environmental Indicator Report Series—Report #2
Share of farmland in various classes of change in wildlife habitat capacity (in %)
20-year trend (1981 to 2001) 10-year trend (1991 to 2001)
Province large moderate negligible to moderate large large moderate negligible to moderate large increase increase small change decrease decrease increase increase small change decrease decrease
>10% >2.5% -2.49 <-2.5% < -10% >10% >2.5% -2.49 <-2.5% < -10%to 10% to 2.49 to -10% to 10% to 2.49 to -10%
BC 2 10 39 39 11 1 2 8 56 33
AB 1 13 59 26 1 <1 1 11 84 4
SK <1 35 55 9 <1 <1 <1 8 87 5
MB 0 7 75 17 1 1 2 33 63 1
ON 0 <1 5 92 2 0 <1 2 56 42
QC <1 <1 1 62 37 <1 1 8 54 37
NB <1 1 12 69 18 1 4 28 50 17
NS <1 <1 12 69 19 1 7 33 50 9
PEI 0 0 0 94 6 0 0 40 53 7
NL 1 11 22 60 6 2 11 14 47 26
Canada <1 19 51 27 3 <1 1 12 77 10
Table 24-1: Wildlife habitat capacity of farmland in Canada, 1981 to 2001
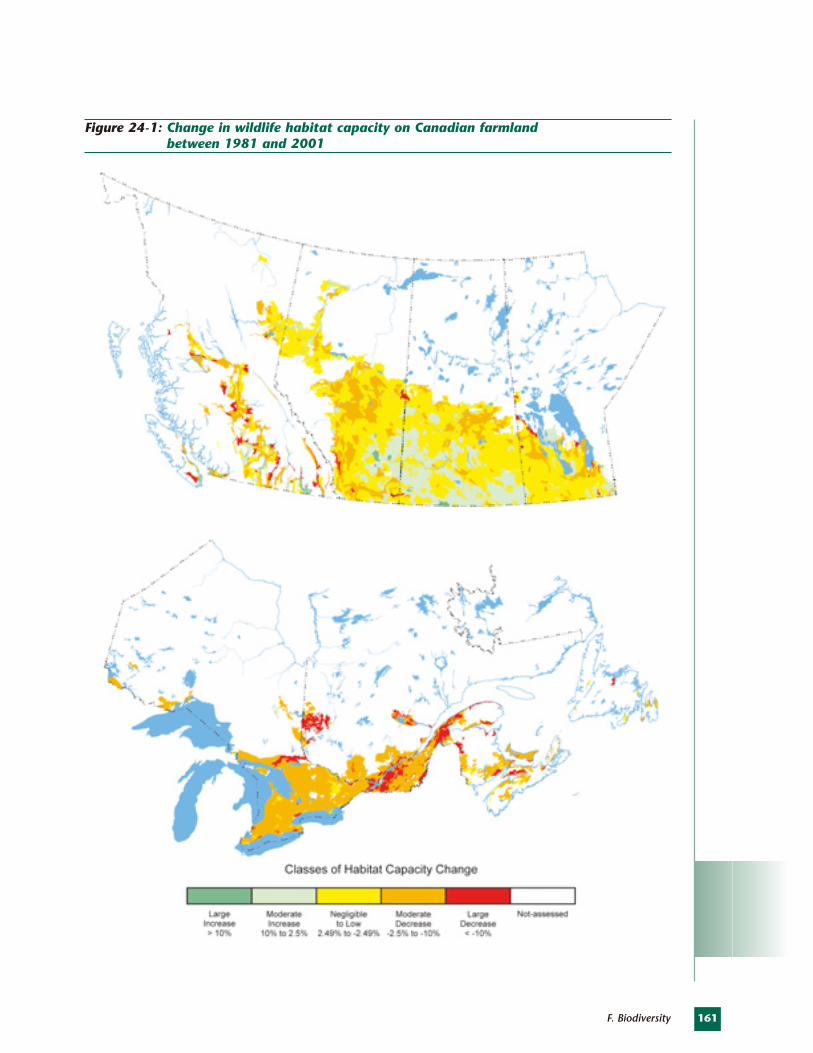
161F. Biodiversity
Figure 24-1: Change in wildlife habitat capacity on Canadian farmland between 1981 and 2001
162
Quebec: Wildlife habitat capacity decreased on99% of farmland (moderate: 62%; large: 37%)from 1981 to 2001. Negligible to small changesoccurred on 1% of farmland.
New Brunswick: Habitat capacity decreasedon 88% of farmland (moderate: 69%, large 19%)from 1981 to 2001. Negligible to small changesoccurred on 12% of farmland.
Nova Scotia: Wildlife habitat capacitydecreased on 87% of farmland (moderate: 69%,large 18%) from 1981 to 2001, while negligibleto small changes occurred on 12% of farmland.
Prince Edward Island: Habitat capacitydecreased on all farmland (moderate: 94%, large: 6%).
Newfoundland and Labrador: Negligible to small changes in habitat capacity occurred on 22% of agricultural land. Habitat capacitydecreased on 66% of farmland (moderate: 60%,large: 6%) and increased on 12% of farmland(moderate: 11%, large: 1%).
INTERPRETATIONCanada: Between 1981 and 2001, wildlife habitat capacity decreased by 5% on Canada’sagricultural land. The driving forces for thisnational decrease appear to have been an expansion in the relative percentage of crop-land, from 47% to 53% of all farmland, and a 3% decline in species-rich natural pasture.Although there were some improvements inwildlife habitat trends, they did not completelyoffset the declines. For example, the mostimportant land-cover Census category forwildlife—”all other land”—increased its share of the national agricultural landscape from 6%to 9%. Another important trend was a reduction(from 15% to 7%) in the species-impoverishedsummerfallow habitat as a proportion ofCanadian farmland. During this 20-year period,the relative percentage of tame pasture remainedstable at 7% even though agricultural perma-nent cover programs from 1989 to 1993 resultedin the conversion of about half a millionhectares of marginal cropland on the Prairies to tame forages.
British Columbia: There are currently 331 wildlife species using agricultural land in British Columbia. Between 1981 and 2001,habitat capacity decreased by less than 2%.Although farmland increased by 19%, there were only minor shifts in the relative percentagesof habitat types. Negative trends influencing theslight provincial decline in habitat capacity werea 2% drop in the relative share of farmland occu-pied by species-rich natural pasture and a declinein the relative percentage of tame pasture (from12% to 9%). These negative trends were generallycounterbalanced by an increase in the relativeshare of “all other land”.
Alberta: There are 337 wildlife species knownto use agricultural land in Alberta. Between 1981and 2001, habitat capacity decreased by lessthan 1%. During this period, farmland expandedby 10%, resulting in minor shifts in the relativepercentages of the five habitat categories. Thepositive shifts consisted of a relative increase in“all other land” (from 4% to 6%) and a reduc-tion of summerfallow (from 11% to 6%). Thenegative shifts consisted of a relative expansionof cropland (from 44% to 46%); and a drop intame pasture (from 10% to 8%). Due in part to the expansion of farmland, natural pasturereportedly increased by 10% but most of thisincrease can likely be attributed to a differencein the Census questions between 1981 and2001. Natural pasture’s relative share of the agricultural landscape remained constant.
Saskatchewan: There are about 290 wildlifespecies known to use agricultural land inSaskatchewan. This was the only province topost an overall increase in habitat capacity (1%)between 1981 and 2001. This resulted from anincrease in “all other land” from 2% to 5% of farmland and a significant reduction in therelative proportion of summerfallow (from 26%to 12%). These positive trends were slightlystronger than the negative trends, whichincluded an expansion of cropland (from 45%to 59%) and a reduction in natural pasture(from 23% to 20%).
Manitoba: Agricultural land in Manitoba pro-vides habitat for 311 wildlife species. Between1981 and 2001, habitat capacity declined by less than 1%. There were two counterbalancing
Environmental Sustainability of Canadian Agriculture: Agri-Environmental Indicator Report Series—Report #2
163F. Biodiversity
trends that resulted in fairly stable habitatcapacity at the provincial scale. The negativetrend essentially resulted from the expansion ofcropland (from 58% to 62%). Natural pastureremained constant (in relative terms). The posi-tive trends were an increase in “all other land”from 5% to 9% of farmland and a reduction insummerfallow (from 8% to 3%).
Ontario: Currently, there are 281 wildlifespecies known to use agricultural land inOntario. Between 1981 and 2001, 9% of farmland was converted to other land uses. This resulted in a 6% decline in habitat capacity,explained by an increase in the relative percent-age of cropland (from 60% to 67%), a decreasein natural pasture (from 13% to 9%) and adecrease in tame pasture (from 11% to 6%).During this period there was a slight increase in “all other land” (15% to 17% of agriculturalland cover).
Quebec: There are currently274 wildlife species that useagricultural land in Quebec. Theprimary driving force behindthe observed 10% decline inwildlife habitat capacity was adrop in the important wildlifehabitat provided by natural pasture (5% reduction or163,000 hectares) and by tame pasture (from 13% to 9%,a 260,000-hectare drop). The relative amount of cropland increased from 46% to 54%. The percentage of “all other land”stayed relatively constant.
Nova Scotia: A total of 184 wildlife species are currently known to use agricultural land inNova Scotia. The main driving force behind thehabitat capacity decrease was the expansion ofcropland (from 24% to 31% of farmland) accom-panied by a reduction in natural pasture (from10% to 7%) and tame pasture (from 9% to 5%).The relative percentage of “all other land”remained constant.
New Brunswick: A total of 197 wildlife species currently use agricultural land in NewBrunswick. Although agricultural land coverdecreased by 11% in the province between 1981and 2001, cropland increased from 30% to 39%of farmland and natural pasture decreased from10% to 7%. Tame pasture also decreased from9% to 5% of farmland. The relative percentageof “all other land” remained constant.
Prince Edward Island: There are currently174 wildlife species that use habitat within theagricultural landscape of Prince Edward Island.Habitat capacity of farmland decreased by 12%between 1981 and 2001. Although farmlanddeclined by 7%, the actual percentage of crop-land increased from 56% to 67%. This resultedin a decrease in “all other land” (from 25% to23%) and in tame pasture (from 13% to 5%).The relative percentage of natural pastureremained stable.
Newfoundland andLabrador: Given the relativelysmall percentage of agriculturalland cover, agriculture can beexpected to have minimaleffects on wildlife at theprovincial scale. A total of 214 wildlife species have beenreported to use farmland. Theexpansion of farmland and theresulting major redistributionof cover types led to an overall
decrease in habitat capacity (6%) between 1981and 2001. The major cause of this reduction was the increase in the relative proportion ofcropland (from 14% to 21%).
RESPONSE OPTIONSAgricultural producers, as land managers, play asignificant role in sustaining biodiversity. Theland use and management decisions they makecan adversely affect wildlife habitat (e.g. wetlanddrainage, overgrazing, removing or fragmentingforest cover). Management practices can also havepositive effects on wildlife, either by augmentinghabitat quality or quantity or by increasing theconnectivity between habitat patches.
Between 1981 and
2001, wildlife
habitat capacity
decreased by 5%
on Canada’s
agricultural land.
164
Maintaining or increasing the wildlife habitatcapacity of agricultural land requires a thoughtfulapproach and a clear sense of how it can be donewithout diminishing agricultural productivity.This information is best gathered regionally andlocally, where planners can work with landown-ers to set habitat goals and objectives that meetthe needs of species. Most farmers understand thevalue of conserving wildlife and wildlife habitat,but education and incentive programs can furtherthis understanding and encourage the voluntaryparticipation of landowners in implementingland management practices that favour wildlife.Such beneficial management practices include:
• Developing and implementing anEnvironmental Farm Plan
• Conserving remaining natural (native) lands (grasslands, wetlands, woodlands)
• Conserving riparian areas (buffer strips)
• Adopting conservation tillage systems
• Delayed haying and grazing
• Winter cover cropping
• Implementing rotational grazing systems
• Integrated pest management
• Woodlot management
• Planting shelterbelts and hedgerows inappropriate landscapes
• Converting marginal cropland to permanent cover
• Preventing wildlife damage.
REFERENCESCommittee on the Status of Endangered Wildlife in Canada (COSEWIC), 2004. CanadianSpecies at Risk. COSEWIC, Ottawa (Ont.). http://www.cosewic.gc.ca/eng/sct0/sar_2004_11_e.cfm
Cox, K.W., 1993. Wetlands: a Celebration of Life – Final Report of the Canadian WetlandsConservation Task Force. Sustaining WetlandsIssues Paper Series, No. 1993-1. North AmericanWetlands Conservation Council [Canada],Ottawa (Ont.).
Federal-Provincial-Territorial BiodiversityWorking Group, 1995. Canadian BiodiversityStrategy. Canada’s Response to the Convention on Biological Diversity. Environment Canada,Biodiversity Convention Office, Ottawa (Ont.). http://www.eman-rese.ca/eman/reports/ publications/rt_biostrat/intro.html
Neave, P., and E. Neave, 1998. Habitat andHabitat Availability Indicator. Report produced for Agriculture and Agri-Food Canada’s Agri-Environmental Indicator Project. Agricultureand Agri-Food Canada, Ottawa (Ont.).
Watmough, M.D., D.W. Ingstrup, D.C. Duncanand H.J. Schinke, 2002. Prairie Habitat JointVenture Monitoring Program Phase I: Recent HabitatTrends in NAWMP Targeted Landscapes (TechnicalReport Series No. 391). Environment Canada,Canadian Wildlife Service, Edmonton (Alberta).
Environmental Sustainability of Canadian Agriculture: Agri-Environmental Indicator Report Series—Report #2
THE ISSUECanadians appreciate the aesthetic, recreational,subsistence, intrinsic and ecological values ofwildlife, and maintaining wildlife populations is a major environmental priority in Canada(Federal-Provincial-Territorial Task Force on theImportance of Nature to Canadians 2000). Atthe same time, there is a growing realizationthat the creation of conservation areas such as parks, wildlife management areas and forestreserves does not provide sufficient habitat to maintain desired wildlife populations.Agricultural land has the most fertile soils with the most favourable microclimates in thecountry and historically has supported many of Canada’s wildlife species. Even today, manywildlife species continue to use farmland tomeet their needs.
Agricultural producers across Canada enjoy living in proximity to wildlife and natural areasand recognize the importance of wildlife asmuch as other Canadians. Many of them investtime and money to enhance wildlife habitat ontheir land (Environics Research Group 2000).However, interactions between wildlife and agri-cultural activities can at times result in severedamage to agricultural products. Most wildlifespecies have a benign or even beneficial effecton agriculture (e.g. songbirds and raptors helpcontrol pests), but the relatively few species thatfeed on crops, stored feed or livestock can causeyield losses, livestock losses and damage to farm
property. For example, deer and elk damage field(e.g. corn, alfalfa, soybean) and horticulturalcrops, as well as haystacks; waterfowl damagevarious crops (e.g. wheat, barley, lentils); birdssuch as starlings and blackbirds damage fruitcrops; and some carnivores kill livestock.Wildlife damage on agricultural land is mostoften caused by wildlife species that are not at risk and may actually be abundant (Conover 2002).
Although most producers tolerate some risk ofdamage in their daily operations, the actuallevel, predictability, extent and cause of wildlifedamage vary widely among the provinces, farm-ing regions and individual farms, as well as fromyear to year. In a survey conducted in 2000, 57%of rural landowners interviewed across Canadasaid that they had at some point experiencedthis type of damage in their operations. Manybelieve that wildlife activity and damage are onthe rise (Environics Research Group 2000).
THE INDICATORThe Risk of Wildlife Damage Indicator will be atool for identifying the biophysical and manage-ment factors that influence the risk of wildlifedamage to agriculture, modelling their relation-ships and determining whether the risk ofdamage is increasing, decreasing or remainingstatic over time. This risk can be expressed as a functional relationship between biophysicalfactors (weather conditions, density and
SUMMARYThe Risk of Wildlife Damage (RWD) Indicator is currently being developed to gain a better understanding
of the biophysical and management factors that influence wildlife damage to agricultural products across
Canada. This tool will also help us assess whether the actual risk of wildlife damage is increasing,
decreasing or remaining stable, in each province. Creation of the Risk of Wildlife Damage Indicator entails
the development of predictive models of damage risk that harness crop-yield loss data and spatial informa-
tion on key factors known to influence the severity of wildlife damage, such as weather events, cropping
practices, mitigation efforts, proximity of wildlife habitat and wildlife population status. Risk models,
historical data and small-scale farm surveys will be used to plot recent trends in wildlife damage and
predict the changes that may occur in the trends following the adoption of damage prevention measures.
165F. Biodiversity
AUTHORS:
D. Thompson, C. Callaghan, L. Liggins and T. Weins
INDICATOR NAME:
Risk of WildlifeDamage Indicator
STATUS:
Currently underdevelopment
25. Wildlife Damage to Crops and Livestock
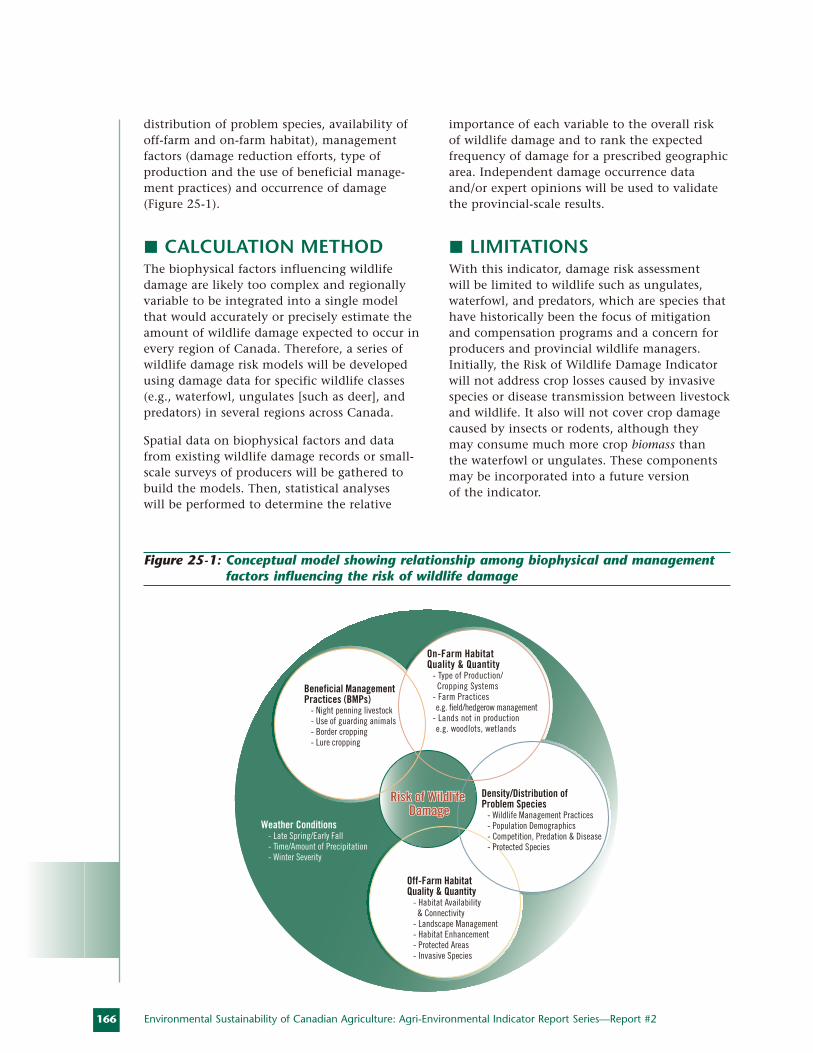
166
distribution of problem species, availability ofoff-farm and on-farm habitat), management factors (damage reduction efforts, type of production and the use of beneficial manage-ment practices) and occurrence of damage(Figure 25-1).
CALCULATION METHODThe biophysical factors influencing wildlifedamage are likely too complex and regionallyvariable to be integrated into a single modelthat would accurately or precisely estimate theamount of wildlife damage expected to occur inevery region of Canada. Therefore, a series ofwildlife damage risk models will be developedusing damage data for specific wildlife classes(e.g., waterfowl, ungulates [such as deer], andpredators) in several regions across Canada.
Spatial data on biophysical factors and datafrom existing wildlife damage records or small-scale surveys of producers will be gathered tobuild the models. Then, statistical analyses will be performed to determine the relative
importance of each variable to the overall risk of wildlife damage and to rank the expectedfrequency of damage for a prescribed geographicarea. Independent damage occurrence dataand/or expert opinions will be used to validatethe provincial-scale results.
LIMITATIONSWith this indicator, damage risk assessment will be limited to wildlife such as ungulates,waterfowl, and predators, which are species thathave historically been the focus of mitigationand compensation programs and a concern forproducers and provincial wildlife managers.Initially, the Risk of Wildlife Damage Indicatorwill not address crop losses caused by invasivespecies or disease transmission between livestockand wildlife. It also will not cover crop damagecaused by insects or rodents, although they may consume much more crop biomass than the waterfowl or ungulates. These components may be incorporated into a future version of the indicator.
Environmental Sustainability of Canadian Agriculture: Agri-Environmental Indicator Report Series—Report #2
Weather Conditions - Late Spring/Early Fall - Time/Amount of Precipitation - Winter Severity
Off-Farm HabitatQuality & Quantity - Habitat Availability & Connectivity - Landscape Management - Habitat Enhancement - Protected Areas - Invasive Species
On-Farm HabitatQuality & Quantity - Type of Production/ Cropping Systems - Farm Practices e.g. field/hedgerow management - Lands not in production e.g. woodlots, wetlands
Beneficial Management Practices (BMPs) - Night penning livestock - Use of guarding animals - Border cropping - Lure cropping
Risk of Wildlife Risk of Wildlife DamageDamage
Risk of Wildlife Damage
Density/Distribution ofProblem Species - Wildlife Management Practices - Population Demographics - Competition, Predation & Disease - Protected Species
Figure 25-1: Conceptual model showing relationship among biophysical and managementfactors influencing the risk of wildlife damage
167F. Biodiversity
RESULTSThis indicator is currently under developmentand results are not yet available.
RESPONSE OPTIONSSocio-economic and political factors influenceperceptions of damage and the approaches that are adopted to deal with wildlife damage.Consequently, strategies to reduce wildlife dam-age on farmland must reflect the diverse facets ofthe problem and they should be grounded in abroader economical, ecological and sociologicalcontext (Reed 1991). In the past, widespreadlethal control programs (e.g. kill permits forducks, poisoning of wolves) were commonly used to reduce wildlife damage to agriculture.However, this approach became increasinglyunpalatable to the public, andas societal values changed overtime, lethal methods graduallygave way to non-destructivemethods. Producers can nowlessen the susceptibility of their farms to wildlife damagethrough a variety of beneficialfarm management practicessuch as production system decisions, habitat management,harvesting practices and damage prevention measures,including:
• fencing or border cropping with unpalatablecrops for large ungulates;
• visual and audio scare devices or lure cropsfor waterfowl;
• the use of husbandry practices such as nightpenning, calving close to farm;
• use of fencing, buildings and guardian animals to reduce livestock depredationby carnivores.
Wildlife management agencies can also mitigatethe susceptibility of farmland to wildlife damagethrough wildlife and habitat managementefforts, targeted lethal control of carnivores andvarious prevention programs. Given the differ-ent damage-causing species and their diverse
behavioural and life history characteristics, it is unlikely that any single method of damageprevention can guarantee success. Strategiesemploying several management techniques inan integrated approach are likely to be the mosteffective means of reducing damage (OntarioSoil & Crop Improvement Association 2000).Once this indicator comes on stream, it will aidin assessing the effectiveness of managementstrategies for reducing wildlife damage on agriculture and increase understanding of thefactors that influence success.
REFERENCESConover, M.R., 2002. Resolving Human-WildlifeConflicts: The Science of Wildlife DamageManagement. Lewis Publishers, Boca Raton(Florida).
Environics Research Group,2000. Survey of Farmers, Ranchersand Rural Landowners: Attitudesand Behaviours Regarding LandStewardship. ERG, Toronto(Ont.).
Federal-Provincial-TerritorialTask Force on the Importance of Nature to Canadians, 2000.The Importance of Nature toCanadians: The EconomicSignificance of Nature-relatedActivities. Environment Canada,Ottawa (Ont.).
Ontario Soil and Crop ImprovementAssociation, 2000. Wildlife Impact Assessment for Ontario Agriculture. OSCIA, Guelph (Ont.).
Reed, A., 1991. “Management of Greater Snow Geese in Relation to Crop Damage: the Need for a Diversified and Integrated Approach”. Pages 93-100 in M. Van Roomen and J. Madsen (eds),Waterfowl and Agriculture: Review and FuturePerspective of the Crop Damage Conflict inEurope, proceedings of the ‘Farmers andWaterfowl: Conflict or Coexistence’ Workshop inLelystad, Netherlands. Wetlands International,Publication No. 21, Slimbridge (U.K.).
The Risk of Wildlife
Damage Indicator will
be a tool for identifying
the biophysical and
management factors
that influence the risk
of wildlife damage
to agriculture.
THE ISSUEInvasive alien species (IAS) are typically aggres-sive non-native species that, if left unchecked,will spread and dominate an ecosystem, reducethe indigenous biodiversity and, in so doing, disrupt ecosystem functions. They immigratethrough various natural pathways (seeds driftingto shore; “hitchhikers” on migrating birds,mammals and insects; spores and arthropod-borne diseases) and through human activities.Increased global trade and travel have exacerbated the problem by creating new opportunities for species introductions.
Agroecosystems, like other ecological systems,require a certain level of biodiversity to main-tain their functions. However, agroecosystemsalso tend to be ecologically simplified (e.g.monocultures) and therefore are even more susceptible to invasive alien species than natural systems. Invasive species can thereforecontribute to higher production costs and, insome cases, they may inflict a heavy toll on agricultural production itself. Invasive alienspecies have even triggered trade embargoesunder the World Trade Organization (WTO)rules (e.g. potato wart fungus, swede midge) and depressed commodity values (e.g. Solanumweeds in soybeans). In fact, a great many of the existing agricultural pests are invasive alienspecies that were introduced at some point over the last 100 years. Other productivityimpacts may result from hybridization betweennon-indigenous and closely related native species,
disruption of native predators and parasites,reduction in the biodiversity of native speciesand in their populations, global extinction of native species and changing ecosystemprocesses.
THE INDICATORThe Indicator of Risk from Invasive Alien Species will aim at assessing trends in popula-tion distributions and in numbers of invasivealien species in agricultural habitats, revealingmajor pressures or threats to agroecosystemhealth and agricultural trade posed by the following:
1) existing IAS in Canada
2) established alien species with the potentialto become invasive
3) known IAS, currently not present in Canada,but with a high potential to invade.
The Indicator of Risk from Invasive Alien Specieswill be reported as risk classes for individualspecies or groups of species (for a commodity)on a local, regional or national scale, at a giventime. By comparing the indicator results overtime, we will be able to determine whether thelevel of risk is increasing or decreasing as aresult of changes in farm management practices,including national trends in the industry (e.g. importation of seeds).
SUMMARY
Invasive alien species have a significant impact on production costs and may even represent a major threat
to agricultural production itself. The Indicator of Risk from Invasive Alien Species (IAS) is currently being
developed to help assess population trends (population size and distribution) for invasive alien species of
significance for agriculture (Table 26-1). It will also be used to provide information on the major threats that
these species pose to agroecosystem health and agricultural trade. The IAS risk indicator will be reported for
individual species or groups of species on a local, regional or national scale. It will be built using IAS presence
and abundance data and an index of invasiveness. This information will be combined with spatial data
and information on key factors known to influence the distribution of invasive species, including farm
management practices.
168 Environmental Sustainability of Canadian Agriculture: Agri-Environmental Indicator Report Series—Report #2
AUTHORS:
P.G. Mason, R.G. Foottit, S.I. Warwick
and O. Olfert
INDICATOR NAME:
Risk from InvasiveAlien Species
STATUS:
Currently underdevelopment
26. Invasive Alien Species
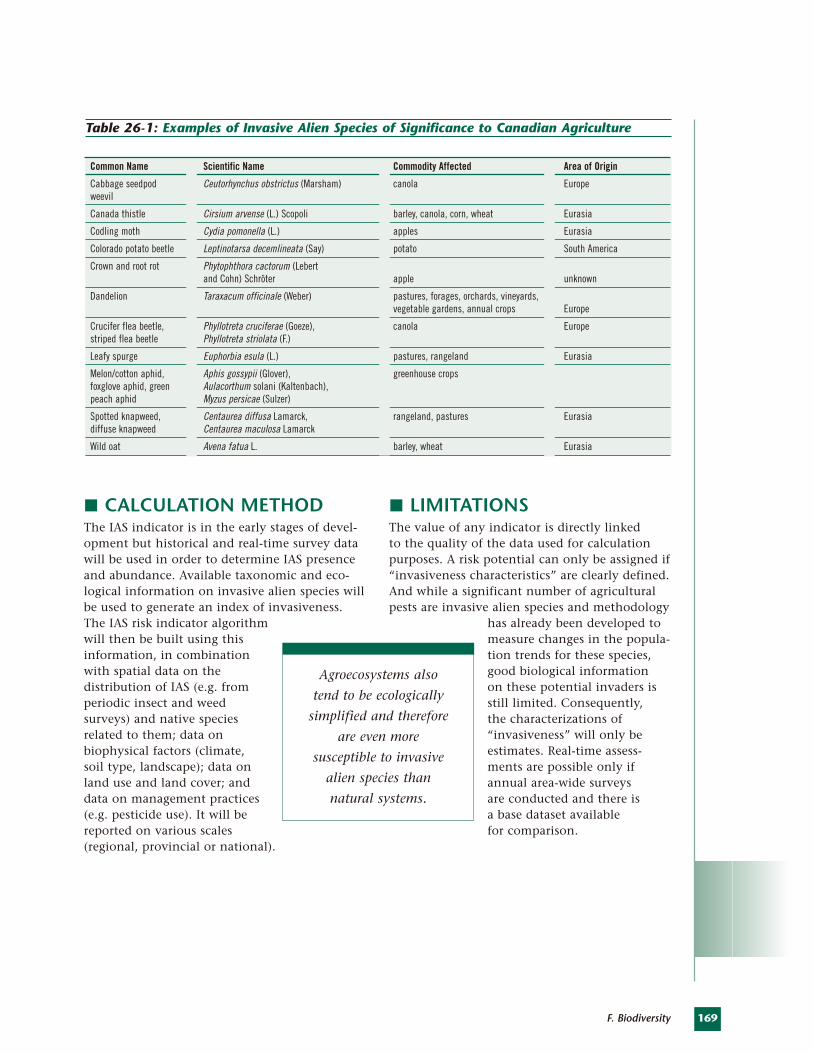
169F. Biodiversity
CALCULATION METHODThe IAS indicator is in the early stages of devel-opment but historical and real-time survey datawill be used in order to determine IAS presenceand abundance. Available taxonomic and eco-logical information on invasive alien species willbe used to generate an index of invasiveness.The IAS risk indicator algorithmwill then be built using thisinformation, in combinationwith spatial data on the distribution of IAS (e.g. fromperiodic insect and weed surveys) and native speciesrelated to them; data on biophysical factors (climate, soil type, landscape); data onland use and land cover; anddata on management practices(e.g. pesticide use). It will bereported on various scales(regional, provincial or national).
LIMITATIONSThe value of any indicator is directly linked to the quality of the data used for calculationpurposes. A risk potential can only be assigned if“invasiveness characteristics” are clearly defined.And while a significant number of agriculturalpests are invasive alien species and methodology
has already been developed tomeasure changes in the popula-tion trends for these species,good biological information on these potential invaders isstill limited. Consequently, the characterizations of “invasiveness” will only be estimates. Real-time assess-ments are possible only ifannual area-wide surveys are conducted and there is a base dataset available for comparison.
Common Name Scientific Name Commodity Affected Area of Origin
Cabbage seedpod Ceutorhynchus obstrictus (Marsham) canola Europeweevil
Canada thistle Cirsium arvense (L.) Scopoli barley, canola, corn, wheat Eurasia
Codling moth Cydia pomonella (L.) apples Eurasia
Colorado potato beetle Leptinotarsa decemlineata (Say) potato South America
Crown and root rot Phytophthora cactorum (Lebert and Cohn) Schröter apple unknown
Dandelion Taraxacum officinale (Weber) pastures, forages, orchards, vineyards, vegetable gardens, annual crops Europe
Crucifer flea beetle, Phyllotreta cruciferae (Goeze), canola Europestriped flea beetle Phyllotreta striolata (F.)
Leafy spurge Euphorbia esula (L.) pastures, rangeland Eurasia
Melon/cotton aphid, Aphis gossypii (Glover), greenhouse cropsfoxglove aphid, green Aulacorthum solani (Kaltenbach), peach aphid Myzus persicae (Sulzer)
Spotted knapweed, Centaurea diffusa Lamarck, rangeland, pastures Eurasiadiffuse knapweed Centaurea maculosa Lamarck
Wild oat Avena fatua L. barley, wheat Eurasia
Table 26-1: Examples of Invasive Alien Species of Significance to Canadian Agriculture
Agroecosystems also
tend to be ecologically
simplified and therefore
are even more
susceptible to invasive
alien species than
natural systems.
170
Ongoing research is required to improve ourknowledge and understanding of IAS, includingin-depth studies of the biology of selectedspecies to learn more about what makes theminvasive, taxonomic studies of groups known to contain IAS, and international surveys todetermine the most likely sources of potentialinvaders and invasion routes.
RESULTSThis indicator is currently under developmentand results are not yet available.
RESPONSE OPTIONS Producers can strive to reduce the pressureexerted by invasive alien species and improvethe health of the agricultural environment byadopting beneficial management practices suchas conserving habitats that enhance indigenousbiodiversity; minimizing habitat disruption (e.g. minimum tillage); applying biologicallybased integrated pest management approaches(e.g. cultivars resistant to IAS) and using biological control agents that specifically target invasive alien species.
REFERENCESHallman, G.J. and C.P. Schwalbe (eds), 2002.Invasive Arthropods in Agriculture: Problems and Solutions. Science Publishers Inc, Enfield(New Hampshire).
National Research Council (NRC), 2002.Predicting Invasions of Nonindigenous Plants andPlant Pests. NRC, Committee on the ScientificBasis for Predicting the Invasive Potential ofNonindigenous Plants and Plant Pests in theUnited States. National Academy Press,Washington (D.C.).
Pimentel, D. (ed.), 2002. Biological Invasions:Economic and Environmental Costs of Alien Plant,Animal, and Microbe Species. CRC Press, BocaRaton (Florida).
Environmental Sustainability of Canadian Agriculture: Agri-Environmental Indicator Report Series—Report #2
THE ISSUELiving organisms in the soil—or soil biota—provide essential benefits for the functioning of agroecosystems which are vital for the long-term sustainability of agriculture. They supportessential soil processes and play a key role inmaintaining the soil quality that is necessary forcrop productivity. Soil organisms help to createand maintain beneficial soil structure; suppresssoil pathogens and pests; aid in breaking up and decomposing crop residues so that valuablenutrients are released for plant growth; con-tribute to soil carbon storage by mixing organicmaterials with mineral soil; and facilitate thebreakdown of chemicals and amendments addedto the soil (Brussard et al. 1997, Altieri 1999).
Soil biota populations respondto the physical, chemical andbiological characteristics oftheir environment in additionto the various natural andanthropogenic (human-induced) pressures or stressesacting on the soil ecosystem(Fox and MacDonald 2003).Environmental stressors mayinclude soil erosion, loss of soil organic matterand climate change that affects temperature andmoisture regimes. Anthropogenic stressors thataffect soil organisms are usually related tochanges in the type, intensity and duration of land use and management practices. Thesepressures can affect the habitats of soil biota,their species composition and their populationabundance, which can, in turn, affect the abilityof soil organisms to support vital soil functionsrequired for optimal crop growth. Very little is
known at regional scales about the populationdistribution of soil biota groups across Canada’svarious agroecosystems.
THE INDICATORSoil biota population distribution patterns arecontrolled first and foremost by the environ-mental factors that characterize a given region(e.g. type of soil, landscape attributes, climaticconditions). The interactions among these envi-ronmental attributes determine the kind and thenumber of soil organisms that can exist in thesoil habitat. From this perspective, the potentialpopulation distribution pattern can be definedas the Inherent Biophysical Response (IBR).
The Soil Biodiversity Indicator(see Figure 27-1) will reflect two aspects: first, a potentialpopulation abundance pre-dicted for the different soilbiota groups based on theirInherent Biophysical Responseto the environment and second, the influence on this potentialpopulation abundance from
anthropogenic impacts (Land ManagementResponse). The anthropogenic impacts includedin the Soil Biodiversity Indicator relate to thedistribution patterns of land use (i.e. crop types)and agricultural management practices (i.e.tillage, residue) which affect the nature of thesoil habitat to which the soil biota populationsrespond positively or negatively thereby influ-encing the extent of potential abundance as wellas species composition.
SUMMARYSoil organisms are an essential component of agroecosystems, making vital contributions to soil functions
and soil processes. Without soil organisms, the soil would be a sterile medium that could not sustain crop
production. A Soil Biodiversity Indicator is currently being developed to provide a framework for assessing
how various environmental and anthropogenic factors, including land use and agricultural management
practices, affect the habitats of soil biota and their potential population abundance. How these populations
respond can affect soil functions that are required for optimal crop growth.
171F. Biodiversity
AUTHOR:
C.A. Fox
INDICATOR NAME:
Soil BiodiversityIndicator
STATUS:
Currently underdevelopment
27. Soil Biodiversity
Living organisms in the
soil provide essential
benefits for the
functioning
of agroecosystems.
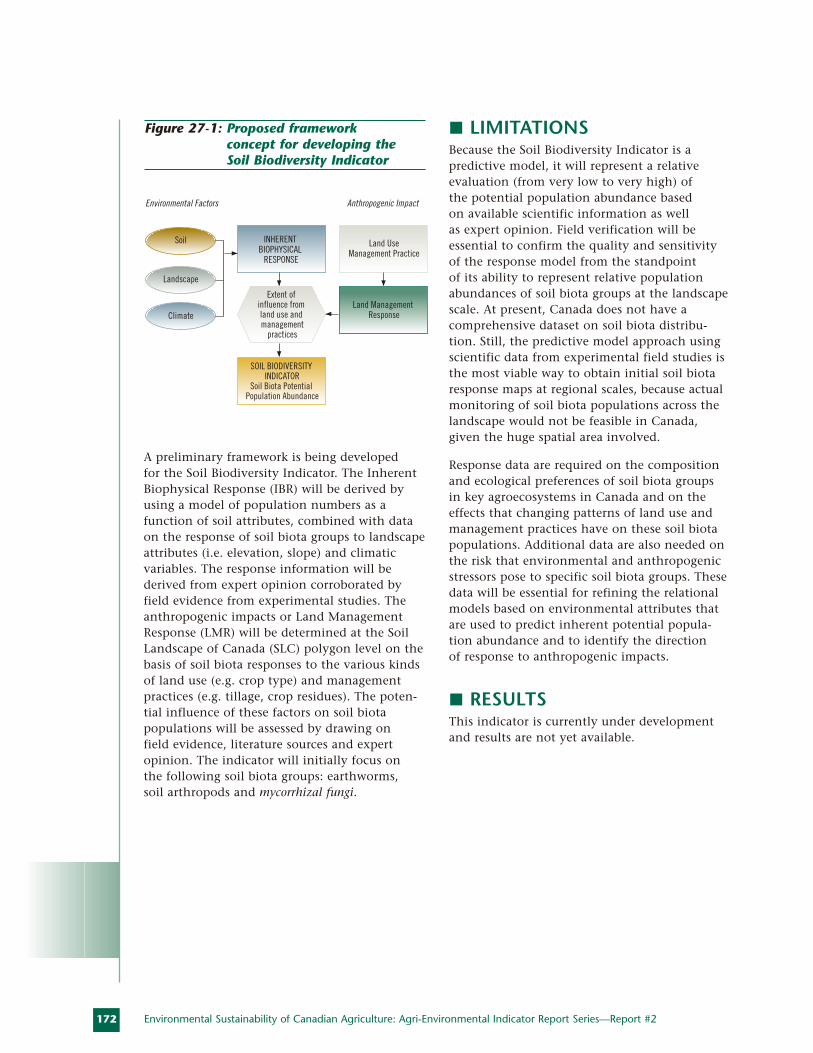
172
A preliminary framework is being developed for the Soil Biodiversity Indicator. The InherentBiophysical Response (IBR) will be derived byusing a model of population numbers as a function of soil attributes, combined with dataon the response of soil biota groups to landscapeattributes (i.e. elevation, slope) and climaticvariables. The response information will bederived from expert opinion corroborated byfield evidence from experimental studies. Theanthropogenic impacts or Land ManagementResponse (LMR) will be determined at the SoilLandscape of Canada (SLC) polygon level on thebasis of soil biota responses to the various kindsof land use (e.g. crop type) and managementpractices (e.g. tillage, crop residues). The poten-tial influence of these factors on soil biotapopulations will be assessed by drawing on field evidence, literature sources and expertopinion. The indicator will initially focus on the following soil biota groups: earthworms, soil arthropods and mycorrhizal fungi.
LIMITATIONSBecause the Soil Biodiversity Indicator is a predictive model, it will represent a relative evaluation (from very low to very high) of the potential population abundance based on available scientific information as well as expert opinion. Field verification will beessential to confirm the quality and sensitivityof the response model from the standpoint of its ability to represent relative populationabundances of soil biota groups at the landscapescale. At present, Canada does not have a comprehensive dataset on soil biota distribu-tion. Still, the predictive model approach usingscientific data from experimental field studies isthe most viable way to obtain initial soil biotaresponse maps at regional scales, because actualmonitoring of soil biota populations across thelandscape would not be feasible in Canada,given the huge spatial area involved.
Response data are required on the compositionand ecological preferences of soil biota groups in key agroecosystems in Canada and on theeffects that changing patterns of land use andmanagement practices have on these soil biotapopulations. Additional data are also needed onthe risk that environmental and anthropogenicstressors pose to specific soil biota groups. Thesedata will be essential for refining the relationalmodels based on environmental attributes thatare used to predict inherent potential popula-tion abundance and to identify the direction of response to anthropogenic impacts.
RESULTSThis indicator is currently under developmentand results are not yet available.
Environmental Sustainability of Canadian Agriculture: Agri-Environmental Indicator Report Series—Report #2
Environmental Factors Anthropogenic Impact
Soil INHERENT BIOPHYSICAL
RESPONSE
Land UseManagement Practice
Land Management Response
Extent of influence from land use and management
practices
SOIL BIODIVERSITY INDICATOR
Soil Biota Potential Population Abundance
Landscape
Climate
Figure 27-1: Proposed framework concept for developing theSoil Biodiversity Indicator

173F. Biodiversity
RESPONSE OPTIONSAccording to literature sources and experimentalstudies, soil biota populations respond positivelyto soil conditions characterized by both minimaldisturbance to soil habitat and a stable food supply (Fox 2003). Conservation tillage methodsrepresent management practices that can help tomeet these requirements, as they can maintain a reliable source of surface crop residues, reduce the effects of mechanical disturbance,compaction and soil erosion. Crop rotation, particularly if forages, legumes and cereal cropsare included, provides a food source (carbon and nitrogen) at depth from penetrating rootsystems and improves soil structure, therebyenhancing soil habitat.
REFERENCES Altieri, M.A., 1999. The Ecological Role ofBiodiversity in Agroecosystems. Agriculture,Ecosystems & Environment. 74 (1-3): 19-31.
Brusaard, L., V.M. Behanpelletier, D.E. Bignell,D.E. Brown, W. Didden, P. Folgarait, C. Fragoso,D.W. Freckman, V.V.S.R. Gupta, T. Hattori, D.L. Hawksworth, C. Klopateck, P. Lavelle, D.W. Malloch, J. Rusek, B. Soderstrom, J.M. Tiedje, and R.A. Virginia, 1997. Biodiversityand Ecosystem Functioning in Soil, Ambio, 26 (8):pp. 563-570.
Fox, C.A. and K.B. MacDonald, 2003. Challenges Related to Soil Biodiversity Research inAgroecosystems – Issues Within the Context of Scaleof Observation. Canadian Journal of Soil Science(special issue: Soil Biodiversity in CanadianAgroecosystems). 83: 231-244.
Fox, C. A., 2003. Characterizing Soil Biota inCanadian Agroecosystems: State of Knowledge inRelation to Soil Organic Matter. Canadian Journalof Soil Science (special issue: Soil Biodiversity in Canadian Agroecosystems). 83: 245-257.

GFood and Beverage Industry
THE ISSUEThe food and beverage industry requires energyfor its operations. Most plants have a centralfuel-burning boiler, and also consume electricity.This energy is distributed throughout the plantand is converted into thermal or mechanicalenergy for food processing operations, for foodpreservation and safety and for storage undercontrolled conditions as well as for packaging.Food preservation and safety are based on stricttemperature control, whereas key processesinvolve heat and mass transfers. In hot processes(e.g. drying, cooking, frying, evaporation, pasteurization, sterilization), natural gas, petro-leum-based products and electricity are generallyused as energy sources, while cold processes (e.g. freezing, cooling, refrigeration) are almostentirely dependent on electricity. The energydemand composition has been relatively con-stant over the years in the Canadian food andbeverage industry, with approximately 62% of energy derived from natural gas, 26% from electricity, 4% from fuel oil and 7% from othersources (e.g. propane, butane, coal) (Office ofEnergy Efficiency 2004).
For most FBI sectors, energy costs typically represent less than 10% of production costs,with the average proportion falling between 4%and 5% (see Table 28-1), whereas approximately80% of direct manufacturing costs come fromraw materials. This explains why there has been little incentive for the industry to pay closeattention to its energy consumption. However,in recent years energy prices have shot up, rising faster than the consumer price index. This has pushed up processing costs and thecost of raw materials (primarily due to trans-portation), typically resulting in higher food and beverage prices. Since this economic impactis readily apparent to consumers, there is adirect incentive for the industry to enhance its energy efficiency.
An additional incentive comes from the factthat, as in most manufacturing sectors, the bulk(more than 80%) of greenhouse gas emissions in the FBI are directly tied to energy utilization(Competitive Analysis Centre Inc. 1999).Increasing energy efficiency in the FBI wouldtherefore also reduce its greenhouse gas emis-sions. Over the last decade, the increase in
SUMMARYThe food and beverage industry (FBI) requires energy for food processing, preservation, safety, storage
and packaging. In most FBI subsectors, energy costs are typically small compared to raw material costs.
However, with rising energy prices, there is a growing incentive for this industry to increase its energy use
efficiency. Experts agree that there is real potential for gains in energy efficiency within this sector and that
they could translate into a competitive economic advantage. In addition, since the various energy sources
used in the FBI (natural gas, electricity, fuel oil, etc.) can affect the environment to varying degrees, energy
use efficiency can be used to capture the environmental impacts associated with the sector’s energy require-
ments. One environmental issue in particular that is closely linked to the industry’s energy consumption is
greenhouse gas (GHG) emissions. Through energy efficiency gains, the food and beverage industry has the
potential to contribute to the national effort to meet Canada’s reduction targets for GHG emissions.
Two eco-efficiency indicators are currently being developed to assess the following: (1) energy intensity in
the FBI, or the consumption of energy per physical production unit (an aspect directly related to the energy
use efficiency); and (2) GHG intensity, or the total quantity of GHG emissions generated per unit of energy
consumed; this component will be used to assess the effect on GHG emissions of the various energy sources
used in the industry.
176 Environmental Sustainability of Canadian Agriculture: Agri-Environmental Indicator Report Series—Report #2
AUTHORS:
M. Marcotte, D. Maxime and
Y. Arcand
INDICATOR NAME:
(1) EnergyIntensity Indicator
(2) Greenhouse Gas Intensity
Indicator
STATUS:
Currently underdevelopment
28. Energy Use and Greenhouse Gas Emission
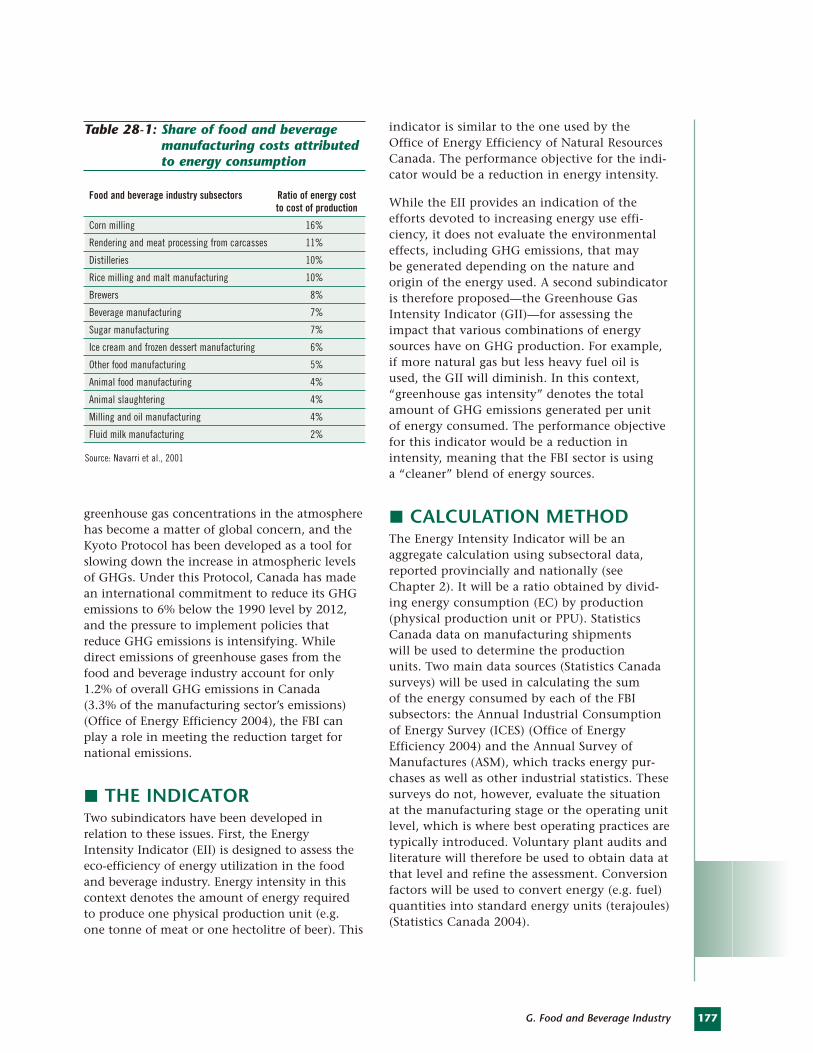
177G. Food and Beverage Industry
greenhouse gas concentrations in the atmospherehas become a matter of global concern, and theKyoto Protocol has been developed as a tool forslowing down the increase in atmospheric levelsof GHGs. Under this Protocol, Canada has madean international commitment to reduce its GHGemissions to 6% below the 1990 level by 2012,and the pressure to implement policies thatreduce GHG emissions is intensifying. Whiledirect emissions of greenhouse gases from thefood and beverage industry account for only1.2% of overall GHG emissions in Canada (3.3% of the manufacturing sector’s emissions)(Office of Energy Efficiency 2004), the FBI canplay a role in meeting the reduction target fornational emissions.
THE INDICATORTwo subindicators have been developed in relation to these issues. First, the Energy Intensity Indicator (EII) is designed to assess theeco-efficiency of energy utilization in the foodand beverage industry. Energy intensity in thiscontext denotes the amount of energy required to produce one physical production unit (e.g. one tonne of meat or one hectolitre of beer). This
indicator is similar to the one used by the Office of Energy Efficiency of Natural ResourcesCanada. The performance objective for the indi-cator would be a reduction in energy intensity.
While the EII provides an indication of theefforts devoted to increasing energy use effi-ciency, it does not evaluate the environmentaleffects, including GHG emissions, that may be generated depending on the nature and origin of the energy used. A second subindicatoris therefore proposed—the Greenhouse GasIntensity Indicator (GII)—for assessing theimpact that various combinations of energysources have on GHG production. For example,if more natural gas but less heavy fuel oil isused, the GII will diminish. In this context,“greenhouse gas intensity” denotes the totalamount of GHG emissions generated per unit of energy consumed. The performance objectivefor this indicator would be a reduction in intensity, meaning that the FBI sector is using a “cleaner” blend of energy sources.
CALCULATION METHODThe Energy Intensity Indicator will be an aggregate calculation using subsectoral data,reported provincially and nationally (seeChapter 2). It will be a ratio obtained by divid-ing energy consumption (EC) by production(physical production unit or PPU). StatisticsCanada data on manufacturing shipments will be used to determine the production units. Two main data sources (Statistics Canadasurveys) will be used in calculating the sum of the energy consumed by each of the FBI subsectors: the Annual Industrial Consumptionof Energy Survey (ICES) (Office of EnergyEfficiency 2004) and the Annual Survey ofManufactures (ASM), which tracks energy pur-chases as well as other industrial statistics. Thesesurveys do not, however, evaluate the situationat the manufacturing stage or the operating unitlevel, which is where best operating practices aretypically introduced. Voluntary plant audits andliterature will therefore be used to obtain data atthat level and refine the assessment. Conversionfactors will be used to convert energy (e.g. fuel)quantities into standard energy units (terajoules)(Statistics Canada 2004).
Food and beverage industry subsectors Ratio of energy cost to cost of production
Corn milling 16%
Rendering and meat processing from carcasses 11%
Distilleries 10%
Rice milling and malt manufacturing 10%
Brewers 8%
Beverage manufacturing 7%
Sugar manufacturing 7%
Ice cream and frozen dessert manufacturing 6%
Other food manufacturing 5%
Animal food manufacturing 4%
Animal slaughtering 4%
Milling and oil manufacturing 4%
Fluid milk manufacturing 2%
Table 28-1: Share of food and beveragemanufacturing costs attributedto energy consumption
Source: Navarri et al., 2001
178
The calculation for the GHG Intensity Indicatorwill be a ratio obtained by dividing total GHGemissions (reported in millions of tonnes (Mt) of CO2 equivalent) by total energy consumption(same as EC above). GHG emissions will bederived mostly from the same energy use data as described above, but this time, the data willbe broken down by component (electricity, nat-ural gas, fuel oil, etc.) using published emission factors (Environment Canada 2004). Four majorgreenhouse gases are generated in the food and beverage industry: carbon dioxide (CO2),methane (CH4), nitrous oxide (N2O) and refrigerants (e.g. HFC-134a). The latest GlobalWarming Potential (GWP) values derived by theIntergovernmental Panel on Climate Change for these four gases (Houghton et al. 2001) willbe used to allow comparisonand combined reporting. GWPis the contribution that a gasmakes to the greenhouse effectaccording to its capacity toabsorb radiation and its resi-dence time in the atmosphere.On-site GHG measurements areplanned in order to validateassumptions and quantify the effect of best operatingpractices, thereby refining this assessment.
LIMITATIONSThe energy consumption values obtained fromthe Annual Industrial Consumption of EnergySurvey are not broken down by region. Thiscomplicates the task of reporting results on aprovincial basis. This limitation should be partlyresolved through the concomitant use of resultsfrom the Annual Survey of Manufactures, whichhas a larger sample size.
The proposed approach based on using surveyresults can only account for GHG emissionsassociated with energy consumption. It will not take into account GHG emissions resultingfrom the breakdown of solid organic residues(estimated at 12% of total emissions). The calculated quantity will therefore underestimatethe total GHG emissions. Furthermore, the GHGestimate is calculated using statistical conversion factors and so it may not always reflect the realsituation in the industry, which will vary withthe processes used. Some assumptions will have
to be made regarding the completeness of thecombustion of petroleum-derived products atthe boiler. On-site measurements and analyseswill have to be used for validation purposes.
RESULTSBoth subindicators are currently under develop-ment and results are not yet available.
RESPONSE OPTIONSThere is an abundance of literature indicatingthat there is a huge potential for reducingenergy intensity in manufacturing sectors bymaking changes in manufacturing processes(e.g. going from batch manufacturing to
continuous production) or by adopting best operatingpractices. Even in relativelystandard processes such asthose used in milk plants, studies have shown that energyconsumption per litre of milkproduced can double or tripledepending on the practicesapplied, especially during high energy-consuming stages
such as homogenization and pasteurization(Office of Energy Efficiency 2001). Some exam-ples of best operating practices include moreefficient boilers, motors and lighting systems,waste heat recycling and variable-speed motors.Plant audits can help identify the stages inwhich the greatest gains could be made.However, since most of these practices must be introduced in the manufacturing process,case-by-case studies are usually required. A few energy efficiency guides exist for some subsectors of the food and beverage industry,including the meat, poultry, beverage and dairysectors (Natural Resources Canada and Agencede l’efficacité énergétique du Québec, 2002) and for breweries (Lom & Associates 1996), butguides like this have not been developed for all sectors yet.
The issues related to the effects of energy con-sumption on GHG emissions are well known.Best operating practices that can reduce GHGemissions are closely tied to those identified forachieving energy efficiency at the plant level.Reductions in GHG emissions can most likely be brought about by introducing basic energy
Environmental Sustainability of Canadian Agriculture: Agri-Environmental Indicator Report Series—Report #2
Increasing energy
efficiency in the FBI
would therefore also
reduce its greenhouse
gas emissions.
179G. Food and Beverage Industry
conservation technologies, improving boilercontrol systems to ensure more complete combustion, using nitrogen instead of CO2 incooling tunnels and recovering methane, as well as capturing the CO2 exhaust from boilersand converting it into non-volatile compounds.As with the energy intensity indicator, case-by-case studies will be required to identify the most beneficial best operating practices.
REFERENCES Competitive Analysis Centre Inc. (CACI), 1999.Food Processing Industry: Foundation Paper andOptions Analysis. Report of the Food ProcessingIndustry Sub-Group, prepared for the Agricultureand Agri-Food Table on Climate Change, CACI,Ottawa (Ont.).
Environment Canada, 2004. Canada’s GreenhouseGas Inventory 1990-2002. Environment Canada,Greenhouse Gas Division, Ottawa (Ont.). http://www.ec.gc.ca/pdb/ghg/1990_02_report/toc_e.cfm
Houghton, J.T., Y. Ding, D.J. Griggs, M. Noguer,P.J. van der Linden, X. Dai, K. Maskell, K. Trenberth, and C.A. Johnson (eds), 2001.Climate Change 2001: The Scientific Basis.Contribution of Working Group I to the ThirdAssessment Report of the Intergovernmental Panel on Climate Change (IPCC). Published for the IPCC,Cambridge University Press, New York (NY). http://www.grida.no/climate/ipcc_tar/wg1/
Lom & Associates, 1998. Energy EfficiencyOpportunities in the Canadian Brewing Industry.Brewers Association of Canada, Ottawa (Ont.). http://oee.rncan.gc.ca/infosource/pdfs/M27-01-945E.pdf
Natural Resources Canada, 2001. EnergyPerformance Indicator Report: Fluid Milk Plants.Natural Resources Canada, Office of EnergyEfficiency, Ottawa (Ont.).
Natural Resources Canada, 2004. Energy Use Data Handbook, 1990 and 1996 to 2002, 3rd ed. Natural Resources Canada, Office of Energy Efficiency, Ottawa (Ont.).http://oee.nrcan.gc.ca/corporate/statistics/neud/dpa/home.cfm?text=N&printview=N
Natural Resources Canada and Agence de l’efficacité énergétique du Québec, 2002. Guidesur les possibilités d’accroître l’efficacité énergétiquedans l’industrie de la transformation des viandes et volailles, des boissons et de la transformation du lait. Natural Resources Canada, CANMET Energy Technology Centre, Varennes (Quebec).http://www.aee.gouv.qc.ca/pdf/publications/guide_agroalimentaire.pdf
Navarri, P., A. Legault and S. Bédard, 2001.Process Integration. Presentation at the Seminar“Managing Waste and Wastewater in the FoodProcessing Industry”, organized by ManitobaHydro, November 21, 2001, in Winnipeg,Manitoba. Natural Resources Canada, CANMETEnergy Technology Centre, Varennes (Quebec).
Statistics Canada, 2004. Report On Energy Supply-Demand in Canada, 2003 (ongoing annual serialpublication). Statistics Canada, Ottawa (Ont.).
THE ISSUEWater holds an important place in manufactur-ing processes and in food preparation. The food and beverage industry (FBI) could simplynot function without water supplies for its food processing operations: water is used as amanufacturing ingredient (preparation medium,packing medium, major ingredient in bever-ages); as a heat transfer medium (e.g. thawing orfreezing, heating, pasteurization); as a solvent(e.g. extraction, pickling, brining); as a source ofmechanical energy (e.g. transporting products);for washing, cleaning and sanitizing; for steamproduction in boilers; and for the disposal ofcertain wastes (Kirby et al. 2003). All of theserequirements make the FBI a heavy water user,accounting for approximately 6% of total wateruse in the manufacturing sector (380.7 millioncubic metres of water in Canada, in 1996)(Environment Canada 2002). A distinctive feature of the FBI’s water use relates to the water quality that is needed. Depending on theintended use in the plant, and regardless of thesource (drawn directly from wells, rivers, lakes orestuaries, or purchased from public utilities), thewater may need to be treated before use, either
for hygienic reasons (drinking water qualityrequired for contact with food) or for technol-ogy reasons (purification required for supplyingboilers).
Increased water use efficiency will translate into reduced pressure on this finite naturalresource. Furthermore, most processes also generate effluents. Around 91% of the waterused by processing plants is returned to theenvironment (primarily through public sewersystems) as effluents carrying dissolved or suspended organic matter that may be polluting.Any measure for optimizing water use can therefore help to reduce the level of pollutiondischarged to the environment. Because thefood and beverage industry is so highly diversified, the effluents that are generated vary greatly in quantity and quality. However,there are some relatively common characteris-tics: high organic matter content (proteins,carbohydrates and fats), high chemical and biochemical oxygen demand, and, occasionally, ahigh nitrogen concentration. These effluents caneither be chanelled into a public wastewatertreatment system or treated on site in a dedicated facility prior to discharge directly
SUMMARYThe food and beverage industry (FBI) draws significant quantities of water from the environment for
its processing, product preparation and cleaning and sanitizing operations. This water use represents a
substantial operating cost and puts pressure on a finite natural resource. Water quality is of paramount
importance for meeting food hygiene and safety standards. A major portion of the water that is used
(around 91%) is eventually returned to the natural environment, primarily through the public sewer system,
as effluents carrying dissolved or suspended organic matter that may cause pollution. While these effluents
are non-toxic, they must be treated in order to comply with local environmental standards, which can
become quite onerous. Effluent quality has special significance for the industry, given the high water quality
it requires. Incentives therefore exist for the FBI to mitigate the impacts of its production on water quality
and availability.
Two eco-efficiency indicators are currently being developed for use in assessing the following: (1) the water
intake intensity of the FBI, or the amount of water drawn from the environment per physical production
unit (an aspect directly related to water use efficiency); and (2) the wastewater organic discharge intensity,
or the total quantity of organic matter contained in wastewater discharges per physical production unit.
This will partly assess the extent of potential water contamination (or treatment costs) from FBI effluents.
180 Environmental Sustainability of Canadian Agriculture: Agri-Environmental Indicator Report Series—Report #2
AUTHORS:
D. Maxime, M. Marcotte
and Y. Arcand
INDICATOR NAME:
(1) Water Intake Intensity
(2) WastewaterOrganic
Discharge Intensity
STATUS:
Currently underdevelopment
29. Water Use and Effluent Generation
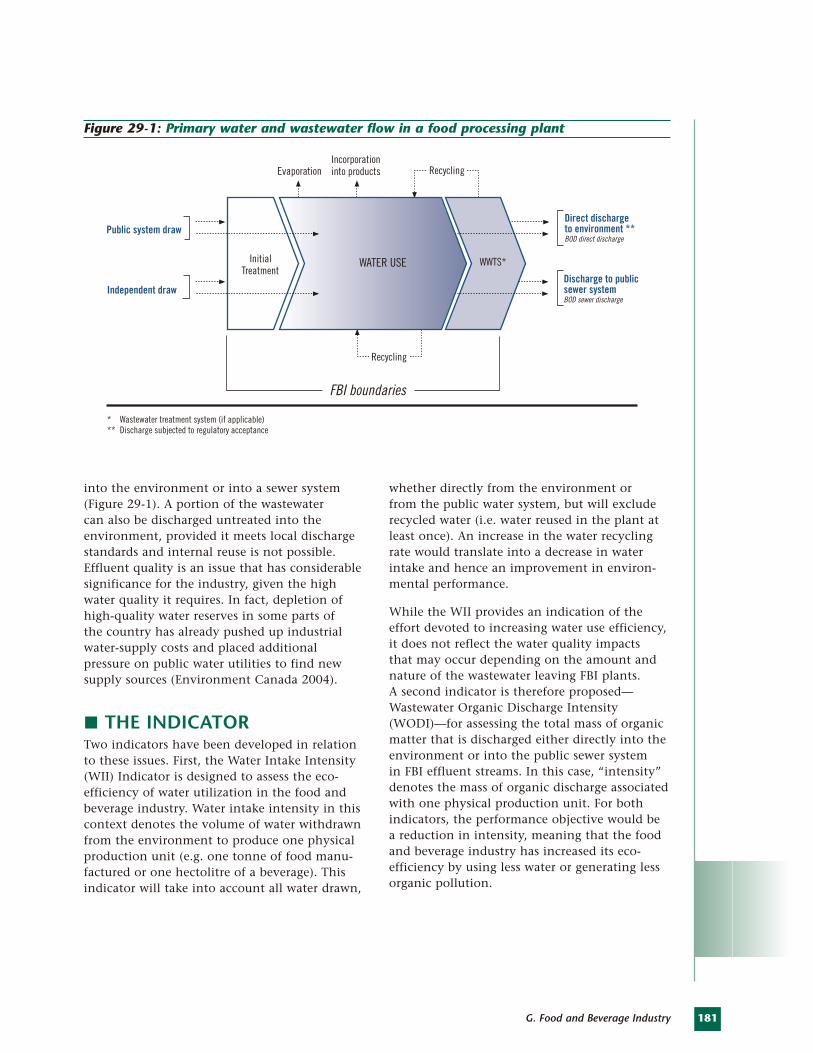
181G. Food and Beverage Industry
into the environment or into a sewer system(Figure 29-1). A portion of the wastewater can also be discharged untreated into the environment, provided it meets local dischargestandards and internal reuse is not possible.Effluent quality is an issue that has considerablesignificance for the industry, given the highwater quality it requires. In fact, depletion ofhigh-quality water reserves in some parts of the country has already pushed up industrialwater-supply costs and placed additional pressure on public water utilities to find newsupply sources (Environment Canada 2004).
THE INDICATORTwo indicators have been developed in relationto these issues. First, the Water Intake Intensity(WII) Indicator is designed to assess the eco-efficiency of water utilization in the food andbeverage industry. Water intake intensity in thiscontext denotes the volume of water withdrawnfrom the environment to produce one physicalproduction unit (e.g. one tonne of food manu-factured or one hectolitre of a beverage). Thisindicator will take into account all water drawn,
whether directly from the environment or from the public water system, but will excluderecycled water (i.e. water reused in the plant atleast once). An increase in the water recyclingrate would translate into a decrease in waterintake and hence an improvement in environ-mental performance.
While the WII provides an indication of theeffort devoted to increasing water use efficiency,it does not reflect the water quality impacts that may occur depending on the amount andnature of the wastewater leaving FBI plants. A second indicator is therefore proposed—Wastewater Organic Discharge Intensity (WODI)—for assessing the total mass of organicmatter that is discharged either directly into theenvironment or into the public sewer system in FBI effluent streams. In this case, “intensity”denotes the mass of organic discharge associatedwith one physical production unit. For bothindicators, the performance objective would be a reduction in intensity, meaning that the foodand beverage industry has increased its eco-efficiency by using less water or generating lessorganic pollution.
Independent draw
InitialTreatment
Public system draw
Evaporation
* Wastewater treatment system (if applicable)** Discharge subjected to regulatory acceptance
RecyclingIncorporation into products
Direct dischargeto environment **BOD direct discharge
Discharge to publicsewer systemBOD sewer discharge
Recycling
FBI boundaries
WATER USE WWTS*
Figure 29-1: Primary water and wastewater flow in a food processing plant
182
CALCULATION METHODThe Water Intake Intensity (WII) Indicator willbe calculated annually as the water intake vol-ume divided by production. Water intake will bethe sum of the volumes of water used (expressedin thousands of cubic metres), including allwater drawn directly from the environment(groundwater, surface water and estuarine water)and from the public water system, but excludingwater in raw materials. Rainwater and snow arealso excluded, except where they are used inprocessing operations. The total volume ofannual production will be expressed in units ofmass for the production of solid foods and inunits of volume for the production of liquids.Voluntary surveys will be used to collect data,since most plants have ready access to water use information (from purchaseinvoices and water intake state-ments) and production data.The indicator will be calculatedfor each plant surveyed andthen aggregated provinciallyand nationally. The results will also be aggregated for theeight main FBI subsectors (seeChapter 2). Traditional wateruses for an industrial plant (e.g.for staff needs and for buildingheating and air conditioning), which are usuallyincluded in statements and invoices, will be segregated in the survey. A number of detailedon-site evaluations will also be conducted toquantify the average requirements for varioususes and allow for accurate validation of the survey approach.
The Wastewater Organic Discharge Intensity(WODI) Indicator will be calculated as the totalmass of organic discharge (in kg) divided by production. Total organic discharge will be calculated for each discharge that leaves a plantby taking the product of two data items: theorganic load and the average flow. The organicload will be quantified using the total biologicaloxygen demand (BOD) of effluents leaving theplant. These quantities are usually known, asplants need this information in order to
determine their water treatment requirements in accordance with the standards established by municipal authorities and/or the provincialdepartment of the environment. Data will becollected through voluntary surveys. The indicator will be calculated for each plant surveyed and then aggregated provincially and nationally, as well as by FBI subsector.
LIMITATIONSThese two indicators have several limitations.They cannot cover every relevant aspect of water use and effluent generation. For example, wastewater reporting will be limited to organic discharge, although other parameters(e.g. nitrogen, phosphorus, pathogens, oils and
fats, pH and suspended particu-lates) could have also beenconsidered to cover a broaderrange of potential environmen-tal impacts. However, indicatorclarity would likely suffer ifthis broader approach wereadopted. Another limitationrelates to the fact that BODdoes not necessarily measurethe entire organic load con-tained in an effluent stream.
There are also some drawbacks to the chosenapproach of presenting results in aggregateform, given the widely varying water use andeffluent characteristics of processing plants, and the variations that can occur from one year to the next. Interpretation will be particu-larly difficult. For example, aggregation at the beverage subsector level may hide the factthat it takes two or three times more water, on average, to produce a litre of beer than a litre of carbonated beverage (Moletta 2002).Further limitations may be imposed by the need to protect the confidentiality of surveyrespondents, which could even preclude a regional or provincial breakdown for some subsectors.
Environmental Sustainability of Canadian Agriculture: Agri-Environmental Indicator Report Series—Report #2
Any measure for
optimizing water use
can therefore help to
reduce the level of
pollution discharged to
the environment.
183G. Food and Beverage Industry
RESULTSBoth indicators are currently under developmentand results are not yet available.
RESPONSE OPTIONSChanges in practices and procedures and technological improvements (best operatingpractices) can have a positive effect on waterintake intensity and organic discharge in effluents. For example, many industries havesignificantly reduced their water intake withoutnecessarily reducing their water requirements,simply by implementing more efficient operat-ing practices. No-cost or low-cost measures suchas automatic supply shut-off, leak detection, submetering and water use monitoring areeasy to implement and very beneficial. Waterrecycling opportunities may also be identifiedthrough process analyses or plant audits. Theygenerally lead to concomitant energy savings(Wardrop Engineering 1999) since water islargely used as a heating or cooling agent. The approach needed to minimize water consumption successfully is also applicable toreducing contaminant levels in wastewater andmay produce additional cost benefits, withoutcompromising hygiene and quality standards.Pollution prevention practices are typically more complicated and expensive to implementbecause they involve acting on processes themselves. Reduced intensity (or increased efficiency) for both of these indicators couldtranslate into substantial savings in terms ofwater use and wastewater treatment.
REFERENCESEnvironment Canada, 2002. Industrial Water Use, 1996. Environment Canada, SustainableWater Use Branch, Ottawa (Ont.). http://www.ec.gc.ca/water/en/info/pubs/sss/e_ind96.htm
Environment Canada, 2004., Threats to Water Availability in Canada. National Water Research Institute (NWRI), ScientificAssessment Report Series No. 3 and ACSDScience Assessment Series No. 1. EnvironmentCanada, NWRI, Burlington (Ont.).http://www.nwri.ca/threats2full/intro-e.html
Kirby, R.M., J. Bartram, and R. Carr, 2003. Waterin Food Production and Processing: Quantity andQuality Concerns. Food Control. 14 (5): 283-299.
Moletta, R. (ed.), 2002. Gestion des problèmes environnementaux dans les industries agroalimen-taires. (Collection Sciences & TechniquesAgroalimentaires [STAA]). Tec & Doc, Paris (France).
Wardrop Engineering Inc., 1999. Guide to Resource Conservation and Cost SavingsOpportunities in the Ontario Meat and PoultrySector. Resource conservation sector guides series for the Ontario Ministry of theEnvironment. Wardrop, Toronto (Ont.).
THE ISSUEIn 2002, more than 30.5 million tonnes of solidresidues of all types were generated in Canada,approximately 971 kg per capita, of which 211 kg was recycled. Approximately 40% of the unrecycled portion came from residentialcollection, 49% from industrial, commercial and institutional collection and 11% from con-struction, renovation and demolition (StatisticsCanada 2004). Although the food and beverageindustry produces very few toxic or hazardouswastes (barring accidents), it generates a greatdeal of organic residues and is responsible for a large volume of food packaging waste.
Organic residual materials (ORM) are the directoutcome of raw material processing. For exam-ple, in the meat processing sector, the portion of processed products that is not intended fordirect consumption often constitutes more than40% of the mass of the original raw materials(Ockerman and Hansen 1998). The edible partof fruits and vegetables is only 10% to 50% of
the raw materials (after sorting, peeling andeliminating “off-spec” products, i.e. those thatdo not meet quality standards, etc.). Some ofthese by-products are “recycled” as inputs forother products in the same or a different plant(e.g. rendering industry and production of animal feed) or as composting inputs or agricultural inputs (e.g. land application oforganic wastewater sludge). Eco-efficiency gains can be made through source reduction or through the reuse, recycling or recovery ofresidues to provide valuable inputs. When this is done, less of the residues are returned to the environment, thus avoiding some problemsthat might otherwise arise because of theirputrescible nature.
Packaging has three main functions: packagesprotect foods and beverages from spoilage; give information about products; and facilitatetransport (for consumers as well as for upstreamdistribution). Packages are made from variousmaterials (e.g. glass, metal, plastic, paper,
SUMMARYThe food and beverage industry (FBI) generates large amounts of solid residues, especially organic residues,
as well as a large volume of packaging material. Organic residues are a direct output from raw material
processing. Although they have a low toxic potential, their susceptibility to rotting (putrescibility) makes
them a possible source of problems related to public health and the environment. Food and beverage
packaging protects foods and beverages from spoilage, gives information about the products and facilitates
transport. The task of disposing of packaging residues (after food consumption) falls to consumers in most
cases. Solid residue disposal represents a direct cost for the FBI, as well as a potential lost opportunity when
these materials are not recycled into valuable inputs. Eco-efficiency gains can be made when less material
is used and less is returned to the environment. Whereas major recycling and reclamation efforts have been
put in place at the processing and post-consumer stages, little is known about the overall performance of
the Canadian food and beverage sector in this area.
Two eco-efficiency indicators are being developed to assess the following: (1) the organic residue intensity
of the FBI, or the quantity of unsold organic material per physical unit of manufactured product, which
gives an indication of the effectiveness of approaches used to minimize the quantity of organic residues
generated; and (2) required packaging intensity, which will reflect the overall amount of packaging
residues generated at the plant level and at the consumer level.
184 Environmental Sustainability of Canadian Agriculture: Agri-Environmental Indicator Report Series—Report #2
INDICATOR NAME:
(1) OrganicResidue Intensity
(ORI) Indicator
(2) RequiredPackaging
Intensity (RPI)Indicator
STATUS:
Currently underdevelopment
30. Organic Solid Residues and Packaging Wastes
AUTHORS:
Y. Arcand, M. Marcotte,
D. Maxime
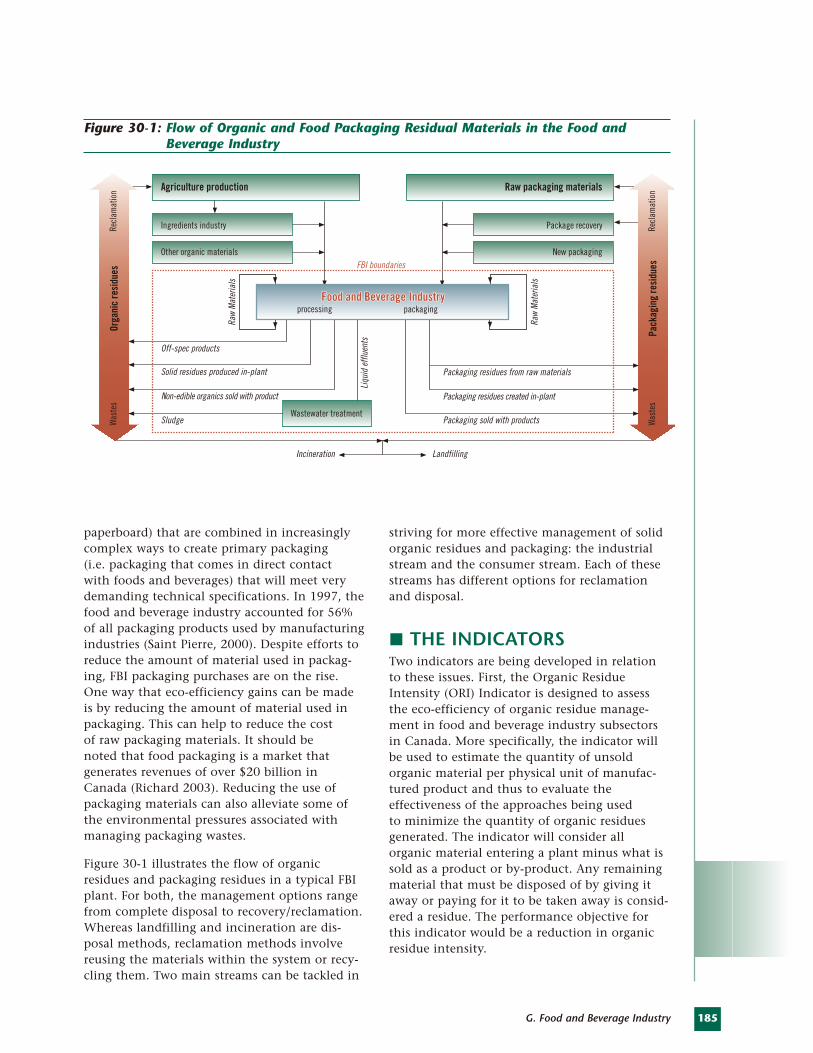
185G. Food and Beverage Industry
paperboard) that are combined in increasinglycomplex ways to create primary packaging (i.e. packaging that comes in direct contact with foods and beverages) that will meet verydemanding technical specifications. In 1997, thefood and beverage industry accounted for 56%of all packaging products used by manufacturingindustries (Saint Pierre, 2000). Despite efforts toreduce the amount of material used in packag-ing, FBI packaging purchases are on the rise.One way that eco-efficiency gains can be madeis by reducing the amount of material used inpackaging. This can help to reduce the cost of raw packaging materials. It should be noted that food packaging is a market that generates revenues of over $20 billion in Canada (Richard 2003). Reducing the use ofpackaging materials can also alleviate some ofthe environmental pressures associated withmanaging packaging wastes.
Figure 30-1 illustrates the flow of organicresidues and packaging residues in a typical FBIplant. For both, the management options rangefrom complete disposal to recovery/reclamation.Whereas landfilling and incineration are dis-posal methods, reclamation methods involvereusing the materials within the system or recy-cling them. Two main streams can be tackled in
striving for more effective management of solidorganic residues and packaging: the industrialstream and the consumer stream. Each of thesestreams has different options for reclamationand disposal.
THE INDICATORSTwo indicators are being developed in relationto these issues. First, the Organic ResidueIntensity (ORI) Indicator is designed to assessthe eco-efficiency of organic residue manage-ment in food and beverage industry subsectorsin Canada. More specifically, the indicator willbe used to estimate the quantity of unsoldorganic material per physical unit of manufac-tured product and thus to evaluate theeffectiveness of the approaches being used to minimize the quantity of organic residues generated. The indicator will consider allorganic material entering a plant minus what issold as a product or by-product. Any remainingmaterial that must be disposed of by giving itaway or paying for it to be taken away is consid-ered a residue. The performance objective forthis indicator would be a reduction in organicresidue intensity.
Agriculture production
Off-spec products
Liqu
id e
fflue
nts
Raw
Mat
eria
ls
Raw
Mat
eria
ls
Solid residues produced in-plant
Non-edible organics sold with product
Sludge
Packaging residues from raw materials
FBI boundaries
Packaging residues created in-plant
Packaging sold with products
Incineration Landfilling
Ingredients industry
Other organic materials
Raw packaging materials
Package recovery
New packaging
Orga
nic
resi
dues
Was
tes
Recl
amat
ion
Pack
agin
g re
sidu
esW
aste
sRe
clam
atio
n
Wastewater treatment
processingFood and Beverage IndustryFood and Beverage Industry
Food and Beverage Industry
packaging
Figure 30-1: Flow of Organic and Food Packaging Residual Materials in the Food andBeverage Industry
186
The second indicator that has been put forward—the Required Packaging Intensity (RPI) Indicator—will be used to estimate thequantity (mass) of packaging used per physicalproduction unit manufactured. It will providean indication of a given plant’s efforts to reducethe quantity of packaging usedannually (source reduction). Itwill take into account all pack-aging items associated withmanufactured and marketedproducts in addition toresidues generated at the plant (either received with raw materials or generated during processing). However,in the case of reused materials (e.g. wooden pallets or beerbottles), to prevent double-counting only replacementswill be calculated. The performance objective for this indicator would be to reduce the total mass of all packaging material involved in theproduction and consumption of the product.
CALCULATION METHODThe Organic Residue Intensity (ORI) Indicatorwill be an aggregate calculation using subsec-toral data reported provincially and nationally(see Chapter 2). The ORI is simply the totalquantity (dry weight) of organic material fromproduction residues, divided by production(physical production unit, or PPU). Economicdata for manufacturing shipments fromStatistics Canada will be used to determine these production units. The amount of organicresidues that are produced by and that leave agiven plant can be easily estimated from the difference between the total quantity of organicraw materials (entering the plant) used to produce one production unit and the quantityof organic material in that production unit(sold). A food company generally has these figures because it pays for raw materials andmust keep records of product composition andthe quantity of products sold. The sector-specificversions of Statistics Canada’s Annual Survey of Manufactures provide physical and financial
data on raw material purchases and the sale offinished products. They will be used for initialcalculation of the indicators as described. Amaterial balance will show the connectionbetween raw materials processed into finishedproducts and organic residual materials. In
addition, a number of plantswill be surveyed on a voluntarybasis to obtain more detaileddata, and on-site assessmentswill be conducted to validatethe quality of the data obtained.
Similarly, the RequiredPackaging Intensity (RPI)Indicator will be an aggregatecalculation using subsectoraldata reported provincially andnationally. Calculating the RPIsimply requires knowing themass of the different packagingitems that make up a transport
unit (e.g. one pallet of product sold). Althoughthese figures are not usually obtained directly,the total quantity purchased in one year dividedby the number of pallets sold in the same periodprovides an excellent estimate. Estimating thereused portion (where applicable) may be somewhat more complex; however, an excellentapproximation can be derived by estimating the purchases made to replace these items over a given period. In addition, packagingreceived with raw materials can be estimated byanalysing incoming batches of raw materials.The indicator will encompass all items used forpackaging, including primary packaging (comesin contact with food), secondary packaging(does not come in contact with food but end upin the hands of consumers) and packaging usedfor shipping (pallets, straps, film for packagingpallets, shipping crates, etc). Although these figures are not usually known directly, the totalquantity purchased in one year divided by thenumber of pallets sold in the same period can be used as an estimate. Data on packaging pur-chases can be obtained (until 2004) from theAnnual Survey of Manufactures and they will be used for initial calculation of the indicator.
Environmental Sustainability of Canadian Agriculture: Agri-Environmental Indicator Report Series—Report #2
Although the food and
beverage industry
produces very few toxic
or hazardous wastes it
generates a great deal of
organic residues and is
responsible for
a large volume of food
packaging waste.
187G. Food and Beverage Industry
LIMITATIONSComplete and representative data on organicsolid residues in the food and beverage industryare virtually non-existent (Richard 2003).Estimates will have to be derived and used inthe indicator calculations, introducing error ofunknown magnitude. Survey data will be usedfor both indicators, but they may not alwaysreflect the true situation in the industry. It isnot known at present whether the indicatorswill be sensitive to changes in operating practices that have environmental implications.On-site measurement and analysis will be a key component of the development and validation phases.
RESULTSBoth indicators are currently under developmentand results are not yet available.
RESPONSE OPTIONSIn general, applying the 4 R’s of waste manage-ment, namely reduction, reuse, recycling andrecovery (Richard 2003) should enhance theeco-efficiency of individual plants with respectto the generation of solid residues (organic andpackaging). Various management methods andoptions are available that involve reusing orrecycling organic by-products within the plant.Where this approach is applied outside the plantitself, the residue is transformed into a valuableproduct that can be used by another plant orindustry. Creating composting products or agricultural inputs is another potential optionfor dealing with organic residues. The amount of packaging material that is sent to landfill sitescan be reduced through packaging collectionand/or recycling approaches (e.g. deposits onglass containers). Some efforts have already been made to improve the materials used. Forexample, plastic packages are 20% lighter todaythan they were 25 years ago (Deschênes 1997).
Reclamation technologies are not used much for packaging; however, considerable researchhas gone into developing biodegradable, com-postable and even photodegradable packages.Life cycle assessment (LCA) is being usedincreasingly to compare the environmental pressures associated with packaging materialsand to assist managers in evaluating the environmental pressures represented by the different packaging options available to them.
REFERENCESDeschênes, L., 1997. Emballage alimentaire: Quoi de neuf pour la conservation? Le MondeAlimentaire. 1 (5): 24-28.
Ockerman, H.W. and C.L. Hansen, 2000. Animalby-product processing and utilization. Technomic,Lancaster (Pennsylvania).
Richard, F. (ed.), 2003. Waste Management Guidefor Small and Medium Enterprises – CanadianVersion. Éditions Ruffec and NI Environnement,Montreal (Quebec).http://www.qc.ec.gc.ca/dpe/Anglais/dpe_main_en.asp?innov_guide_mat_residuelles
Saint-Pierre, E., 2000. Consumption of Packaging Products by Manufacturing Industries,Portrait and Trends. Statistics Canada,Manufacturing, Construction and Energy Division, Ottawa (Ont.). http://www.statcan.ca/english/research/31F0027MIE/31F0027MIE2000001.htm
Statistics Canada, 2004. Waste ManagementIndustry Survey: Business and Government Sectors2002. Statistics Canada, Ottawa (Ont.).http://www.statcan.ca/english/freepub/16F0023XIE/16F0023XIE2002001.pdf

HNational and Regional Summary
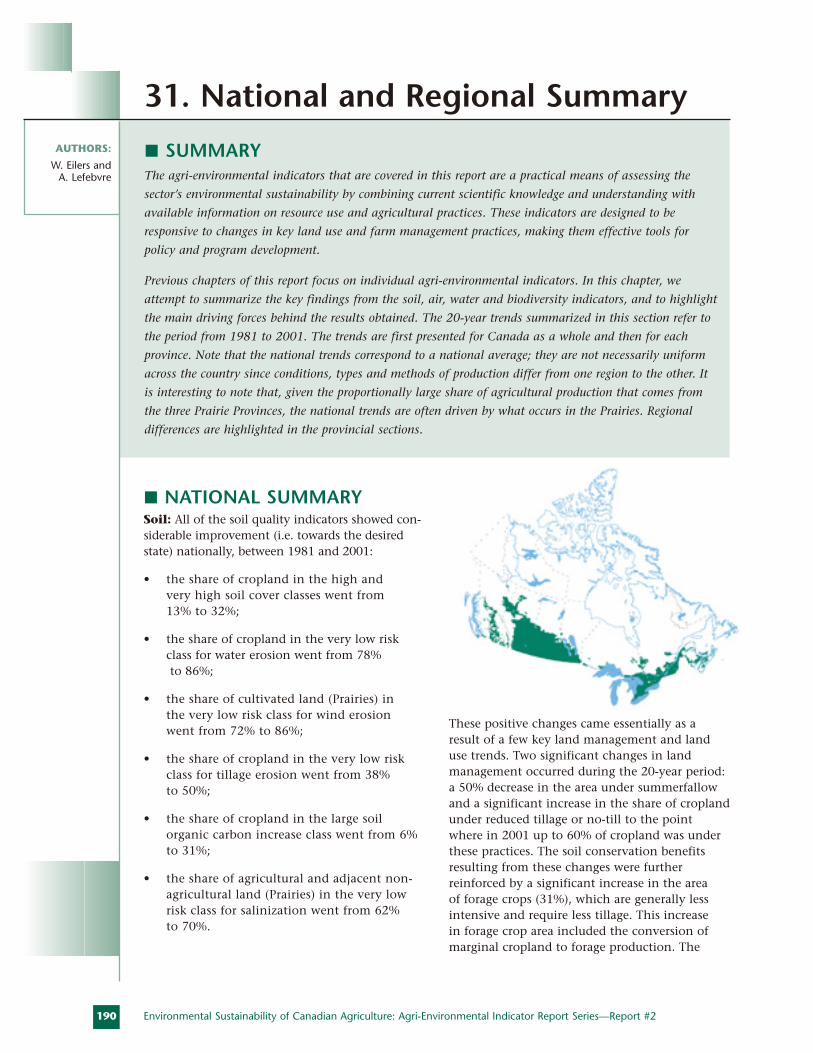
NATIONAL SUMMARYSoil: All of the soil quality indicators showed con-siderable improvement (i.e. towards the desiredstate) nationally, between 1981 and 2001:
• the share of cropland in the high and very high soil cover classes went from 13% to 32%;
• the share of cropland in the very low riskclass for water erosion went from 78%to 86%;
• the share of cultivated land (Prairies) in the very low risk class for wind erosion went from 72% to 86%;
• the share of cropland in the very low riskclass for tillage erosion went from 38% to 50%;
• the share of cropland in the large soilorganic carbon increase class went from 6%to 31%;
• the share of agricultural and adjacent non-agricultural land (Prairies) in the very lowrisk class for salinization went from 62% to 70%.
These positive changes came essentially as aresult of a few key land management and landuse trends. Two significant changes in land management occurred during the 20-year period:a 50% decrease in the area under summerfallowand a significant increase in the share of croplandunder reduced tillage or no-till to the pointwhere in 2001 up to 60% of cropland was underthese practices. The soil conservation benefitsresulting from these changes were further reinforced by a significant increase in the area of forage crops (31%), which are generally lessintensive and require less tillage. This increase in forage crop area included the conversion ofmarginal cropland to forage production. The
190 Environmental Sustainability of Canadian Agriculture: Agri-Environmental Indicator Report Series—Report #2
AUTHORS:
W. Eilers and A. Lefebvre
31. National and Regional Summary
SUMMARYThe agri-environmental indicators that are covered in this report are a practical means of assessing the
sector’s environmental sustainability by combining current scientific knowledge and understanding with
available information on resource use and agricultural practices. These indicators are designed to be
responsive to changes in key land use and farm management practices, making them effective tools for
policy and program development.
Previous chapters of this report focus on individual agri-environmental indicators. In this chapter, we
attempt to summarize the key findings from the soil, air, water and biodiversity indicators, and to highlight
the main driving forces behind the results obtained. The 20-year trends summarized in this section refer to
the period from 1981 to 2001. The trends are first presented for Canada as a whole and then for each
province. Note that the national trends correspond to a national average; they are not necessarily uniform
across the country since conditions, types and methods of production differ from one region to the other. It
is interesting to note that, given the proportionally large share of agricultural production that comes from
the three Prairie Provinces, the national trends are often driven by what occurs in the Prairies. Regional
differences are highlighted in the provincial sections.
191H. National and Regional Summary
combined effect of these positive land manage-ment and land use trends outweighed thenegative influence from a general shift to cropsthat provide lower cover and/or require moreintensive management (e.g. canola, soybeans,pulse crops, potatoes), mostly at the expense of cereal crops. An additional soil quality indicator—risk of soil contamination by trace elements is currently under development.
Water: Only one water quality indicator isreported nationally, the Indicator of the Risk ofWater Contamination by Nitrogen, along withits component farm management indicator—Residual Soil Nitrogen. These two indicatorsshowed an overall increase in risk between 1981and 2001:
• the share of cropland in the low and verylow classes for residual soil nitrogen wentfrom 74% to 28%;
• the share of farmland in the low and verylow risk class for water contamination bynitrogen (N) went from 81% to 65%.
This overall increase in residual nitrogen (nitro-gen remaining in the field after harvest) and inthe risk of water contamination by nitrogenwere also driven by land management and landuse changes. With respect to land management,there was a significant national increase in fertilizer use (especially in the Prairies). For landuse, there was an increase in the area of legumecrops (increased atmospheric N fixation) and ageneral increase in livestock numbers (resultingin more manure N being applied to the land).This increase in available N was not matched byan equivalent increase in yields, thus causing agradual and slow increase in risk between 1981and 1996. The adverse climatic conditions that prevailed in 2001 affected yields and were responsible for an even more significantincrease in risk between 1996 and 2001. Threeother indicators are under development. TheIndicator of the Risk of Water Contamination by Phosphorous is available only for Quebec (see below), but no results are available yet forthe water quality indicators related to pesticidesand pathogens.
Air: One indicator related to air quality is reported nationally—the AgriculturalGreenhouse Gas Budget. This indicator showed an overall positive trend between 1981 and 2001:
• the net GHG emissions (emissions minussinks) decreased by 2.5 Mt CO2eq, from 57.2 Mt CO2eq to 54.7 Mt CO2eq.
This overall decrease in the GHG budget for theagriculture sector mainly stems from changes in land use and management practices (reducedsummerfallow, increased conservation tillage)that led to a significant increase in soil carbonsequestration (+12.5 Mt CO2eq) (see soil indica-tors above). The increase in carbon sequestrationin agricultural soils between 1981 and 2001more than offset the appreciable increases innitrous oxide (+6.7 Mt CO2eq) and methane(+3.4 Mt CO2eq ) emissions, which are largelyattributable to the substantial increase in the use of nitrogen fertilizer and the increase in beef cattle populations already mentioned above(water quality indicator). Two additional airquality indicators are currently being developedto address agricultural emissions of ammoniaand particulate matter.
Biodiversity: For biodiversity, only one indica-tor is reported nationally—Wildlife Habitat onFarmland—which showed a slight deteriorationbetween 1981 and 2001:
• 19% of the farmland showed either a moder-ate or large increase in wildlife habitatcapacity, while 30% showed either a moderateor large decrease in wildlife habitat capacity.
This indicator was positively influenced by someof the land management trends discussed earlier(decrease in the species-impoverished summer-fallow area) and by land use changes such asincreases in the area of forage crops and the area of “all other land” (includes woodlots andwetlands), as well as by the conversion of abouthalf a million hectares of marginal cropland on the Prairies to tame forages. However, theseimprovements did not completely offset thenegative impact of the increase in the relativepercentage of farmland used as cropland (from47% to 53%) and the 3% decline in species-richnatural pastures. Three other biodiversity indica-tors are currently under development: risk ofwildlife damage, soil biodiversity and risk frominvasive alien species.
192
Soil: All of the soil quality indicators showedconsiderable improvement (i.e. towards thedesired state) in British Columbia between 1981and 2001:
• the share of cropland in the high and very high soil cover classes went from 24% to 55%;
• the share of cropland in the very low riskclass for water erosion went from 63% to 75%;
• the share of cropland (Peace River District)in the very low risk class for wind erosionwent from 94% to 97%;
• the share of cropland in the low and verylow risk class for tillage erosion went from58% to 78%;
• the share of cropland with increasing soilorganic carbon went from 32% to 38%.
These positive changes are in line with thenational trends and arose mainly from broadland management and land use changes. Two sig-nificant changes in land management, occurredduring the 20-year period of interest: a 42%decrease in area under summerfallow (from 9% to6%), mainly in the Central Interior and PeaceRiver regions, and an increase in the share ofcropland under reduced tillage or no-till (from17% to 36% of cropland). The positive effect onsoil conservation was also influenced by the shiftfrom crops requiring intensive tillage to cropsrequiring less tillage. As in the Prairies, there wasa significant increase in forage production (from53% to 67%). The combined impact of these pos-itive land management and land use trendsoutweighed the negative influence from a 10%increase in cropland; a reduction in the area ofhigher-residue spring (-38%) and winter (-50%) wheat; and an expansion of the area under lower-residue crops (e.g. pulse crops, berries andgrapes).
Water: The Indicator of Risk of WaterContamination by Nitrogen, along with its component indicator of Residual Soil Nitrogen,are applied in British Columbia. Similar to thenational trend, these two indicators showed anoverall increase in risk between 1981 and 2001:
• the share of cropland in the low and verylow classes for residual soil nitrogen wentfrom 75% to 58%;
• the share of farmland in the low and verylow risk class for water contamination by N went from 62% to 51%.
This overall increase in residual nitrogen and in the risk of water contamination by nitrogenwere driven by land management and land usechanges. For land management, important fac-tors include high nitrogen fertilizer sales andincreases in available manure N (mostly frompoultry), particularly in areas on SoutheasternVancouver Island and in the Lower Mainland.Here again, similar to the national trend, there was an increase in the legume crop area(increased atmospheric N fixation). This increasein available N was matched by a slight decreasein N outputs (yields).
Air: There were small fluctuations, but no overall change in net greenhouse gas emissionsin British Columbia between 1981 and 2001:
• the net GHG emissions (emissions minussinks) were constant at 2.6 Mt CO2eq
(approximately 5% of national agriculturalemissions).
Nitrous oxide emissions were constant at 1 MtCO2eq, whereas methane emissions rose slightly(+0.1 Mt CO2eq) mostly because of the increasein livestock populations. This increase was cancelled by an equivalent change in CO2
(-0.1 Mt CO2eq), resulting from a reduction in summerfallow and a slight increase in conservation tillage.
Environmental Sustainability of Canadian Agriculture: Agri-Environmental Indicator Report Series—Report #2
BRITISH COLUMBIA
193H. National and Regional Summary
Biodiversity: Results for the Wildlife Habitaton Farmland Indicator showed an overall deteri-oration of the situation between 1981 and 2001:
• 12% of farmland showed either a moderateor large increase in wildlife habitat capacity,while 49% showed either a moderate orlarge decrease in wildlife habitat capacity.
While the decrease in the species-impoverishedsummerfallow area and the increase in the areaof “all other land” (includes woodlots and wetlands), had a positive effect on this indicator,these improvements did not completely offsetthe negative impact of a 2% decline in species-rich natural pasture and a 3% decline in therelative percentage of tame pasture.
ALBERTA
Soil: In keeping with the national trend, all ofthe soil quality indicators showed considerableimprovement between 1981 and 2001:
• the share of cropland in the high and very high soil cover classes went from 17% to 57%;
• the share of cropland in the very low risk class for water erosion went from 80% to 90%;
• the share of cropland in the very low risk class for wind erosion went from 86% to 94%;
• the share of cropland in the low and verylow risk class for tillage erosion went from66% to 87%;
• the share of cropland with increasing soilorganic carbon went from 16% to 29%;
• the share of agricultural and adjacent landin the very low risk class for salinizationwent from 81% to 86%.
Changes in land management and land use were the most important driving forces for theseimprovements. The reduction of summerfallowarea by 44% (nearly 1 million hectares) and theincrease in the share of cropland under reducedtillage or no-till (from 27% of cropland in 1991
to 62% in 2001) were the key land managementchanges. The changes in land use contributingto this positive trend in soil conservationincluded a 49% increase in the area of foragesand a 16% increase in pastures. The combinedimpact of these positive land management and land use trends outweighed the negativeinfluence from a 15% increase in cropland, areduction in the area of higher-residue cerealcrops (-8%) and an expansion of the area under lower-residue crops such as pulses,oilseeds and potatoes.
Water: The Indicator of the Risk of WaterContamination by Nitrogen, along with its component indicator of Residual Soil Nitrogen,reflected the national trend, showing an overallincrease in risk between 1981 and 2001:
• the share of cropland in the low and verylow classes for residual soil nitrogendeclined significantly from 93% to 56%;
• the share of farmland in the low and verylow risk class for water contamination by N decreased from 97% to 87%.
Although Alberta had the lowest residual soilnitrogen (RSN) of all the Prairie Provinces, grad-ual increases in residual soil nitrogen and in therisk of water contamination by nitrogen weredriven by significant increases in fertilizer useand manure production over the 20-year period
194
under review. The increased area of N-fixinglegume crops also contributed to this uptrend,albeit to a lesser extent. Fortunately increases inyields and N outputs compensated somewhat for the increased availability of nitrogen.
Air: Alberta was the province with the largestincrease in net GHG emissions between 1981and 2001:
• the net GHG emissions (emissions minussinks) increased by 2.6 Mt CO2eq, from 17.2 to 19.8 Mt CO2eq, representing approximately 36% of national agriculturalemissions.
Nitrous oxide emissions rose by 2.4 Mt CO2eq,with this change being largely attributable toincreased fertilizer use and manure nitrogen. Anincrease in methane emissions of 3.3 Mt CO2eq
resulted from the expansion of livestock popula-tions during the 20-year period. These increases
were offset by a reduction in CO2 emissions of 3.1 Mt CO2eq, which can be explained by the contraction of summerfallow area and thesignificant increase in conservation tillage.
Biodiversity: Similar to the national trend,Alberta posted slightly negative results overallfor the Wildlife Habitat on Farmland Indicatorbetween 1981 and 2001:
• 27% of farmland showed a decrease inwildlife habitat capacity, while 14% showedan increase.
Negative influences on wildlife habitat capacityin Alberta included an expansion of both totalfarmland and cropland as well as a smalldecrease in the area of tame pasture. Habitatcapacity was positively influenced by a reduc-tion in summerfallow area and an increase inthe area of “all other land.”
Environmental Sustainability of Canadian Agriculture: Agri-Environmental Indicator Report Series—Report #2
SASKATCHEWAN
Soil: Similar to the national trend, all of the soil quality indicators showed considerableimprovement (i.e. towards the desired state)between 1981 and 2001:
• the share of cropland in the high and veryhigh soil cover classes went from 0% to10%, while the share in the very low classwent from 45% to 3%;
• the share of cropland in the very low risk class for water erosion rose from 85% to 92%;
• the share of cropland in the very low risk class for wind erosion went from 62% to 81%;
• the share of cropland in the low and very low risk class for tillage erosion went from 32% to 72%;
• the share of cropland with increasing soilorganic carbon went from 17% to 75%;
• the share of agricultural and adjacent landin the very low risk class for salinizationwent from 45% to 58%.
The general trend toward greater soil conserva-tion in Saskatchewan was driven by changes inland management and land use. The decrease in summerfallow area (from 26% to 12% of farmland) and the declining use of conventionaltillage for both summerfallow and seeding prac-
195H. National and Regional Summary
tices were the main land management changescontributing to enhanced soil conservation.Another factor behind this beneficial trend is theincreased area devoted to forage and pasture(3%). The combined effect of these positive landmanagement and land use trends outweighed the negative influence from the following: a 31%increase in cropland; reduced area of higher-residue cereal crops (-11%); and a 24% expansionin cropland producing lower-residue crops suchas pulses and oilseeds.
Water: Similar to the national trend, theResidual Soil Nitrogen Indicator showed markedincreases in residual N, while the Indicator ofthe Risk of Water Contamination by Nitrogenshowed an overall increase in risk between 1981and 2001, with most land still comprised in thelower risk classes:
• the share of cropland in the low and verylow classes for residual soil nitrogen wentfrom 89% to 18%;
• the share of farmland in the low and verylow risk class for water contamination by Nwent from 95% to 79%.
This overall increase in residual nitrogen and in the risk of water contamination by nitrogenwas driven by land management and land use changes. For land management, nitrogenfertilizer sales and available manure N (N inputs)increased throughout the period. Similar to thenational trend, there was an increase in the area of legume crops (increased atmospheric N fixation). This uptrend in available N was notmatched by an increase in N outputs. N outputsincreased slightly each year until 2001, whenclimatic conditions may have depressed crop yields.
Air: Saskatchewan made the largest contribu-tion to the national decrease in net GHGemissions between 1981 and 2001:
• the net GHG emissions (emissions minussinks) decreased by 3.1 Mt CO2eq, from 10.9to 7.8 Mt CO2eq, representing approximately14% of national agricultural emissions.
Nitrous oxide emissions increased by 3.5 MtCO2eq, largely because producers increased their fertilizer use in order to better balance the removal/replacement ratio of nitrogen in prairie soils, a movement away from the traditional practice of underfertilization. A slightincrease in methane emissions (0.8 Mt CO2eq)resulted from the expansion of livestock popula-tions over the 20-year period. Land managementand land use changes that led to a large reduction in summerfallow area and an increase in the area under reduced tillage and no-tillpractices enabled the soils of Saskatchewan tobecome a carbon dioxide sink in 1996 and 2001.CO2 emissions were 7.3 Mt CO2eq lower in 2001,with 4.6 Mt CO2eq of this amount beingsequestered in the soil as organic carbon.
Biodiversity: Results for the Wildlife Habitaton Farmland Indicator indicate an overallimprovement of the situation between 1981 and 2001:
• 35% of farmland showed either a moderateor large increase in wildlife habitat capacity,whereas 9% showed either a moderate orlarge decrease in wildlife habitat capacity.
The increase in wildlife habitat capacity inSaskatchewan can be explained by the signifi-cant decrease in summerfallow area from 26% to12% of all farmland and a small increase in the“all other land” area. Negative factors affectinghabitat capacity in Saskatchewan include anexpansion of cropland (from 45% to 59% of allfarmland) and a reduction in natural pasture(from 23% to 20% of all farmland).
196
Soil: Similar to the national trend, all of the soilquality indicators showed considerable improve-ment (i.e. towards the desired state), between1981 and 2001:
• the share of cropland in the moderate and high soil cover classes went from 38%to 85%, while the share in the low and very low soil cover classes went from 62% to 15%;
• the share of cropland in the very low riskclass for water erosion went from 83% to 95%;
• the share of cropland in the very low riskclass for wind erosion went from 75% to 82%;
• the share of cropland in the low and verylow risk class for tillage erosion went from76% to 91%;
• the share of cropland with increasing soilorganic carbon went from 20% to 52%;
• the share of agricultural and adjacent landin the very low risk class for salinizationwent from 59% to 65%.
Changes in land management and land use werethe main driving forces for these improvements.The 57% reduction of summerfallow area andthe increase in the share of cropland underreduced tillage or no-till (from 34% of croplandin 1991 to 46% in 2001) were the primary landmanagement changes. Land use changes thatsupported this positive soil conservation trendinclude a 41% increase in forage area. The com-bined effect of these positive land managementand land use trends outweighed the negativeinfluence from a 7% increase in cropland; areduction in the area of higher-residue cerealcrops (-16%); and an expansion of the areaunder lower-residue crops such as pulses,oilseeds and potatoes.
Water: Manitoba has the highest levels of residual nitrogen among the Prairie Provincesand the highest share of land in the high risk
classes of the Indicator of the Risk of WaterContamination by Nitrogen. Both indicatorsshowed an overall deterioration between 1981and 2001:
• the share of cropland in the high and veryhigh classes for residual soil nitrogen wentfrom 85% to 89%;
• the share of farmland in the low and verylow risk class for water contamination by Nwent from 12% to 4%.
The overall increase in residual nitrogen and in the risk of water contamination by nitrogenwas driven by higher N inputs from fertilizers,increased available manure N and an increase inthe area of legume crops (increased atmosphericN fixation). The increase in available N was offset somewhat by an increase in N outputs(yields) from 1981 to 1996; however, as inSaskatchewan, the level of N outputs decreasedslightly in 2001, contributing to higher residualnitrogen and a higher risk of water contamina-tion in that Census year.
Air: In contrast with the national trend, netGHG emissions in Manitoba increased between1981 and 2001:
• the net GHG emissions (emissions minussinks) increased by 1.1 Mt CO2eq, from 6.3 to 7.4 Mt CO2eq, representing approximately13% of national agricultural emissions.
Nitrous oxide emissions increased by 2.0 MtCO2eq, largely because of increases in fertilizeruse and manure nitrogen. A slight increase of0.7 Mt CO2eq in methane emissions resultedfrom the expansion of livestock populationsduring the 20-year period studied. Land manage-ment and land use changes resulting in areduction in the summerfallow area and anincrease in the area under reduced tillage andno-till practices enabled the soils of Manitoba to become a carbon dioxide sink in 2001. CO2
emissions were 1.7 Mt CO2eq lower in 2001, with0.3 Mt CO2eq of this amount being sequesteredin the soil as organic carbon.
Environmental Sustainability of Canadian Agriculture: Agri-Environmental Indicator Report Series—Report #2
MANITOBA
197H. National and Regional Summary
Biodiversity: Most of the farmland inManitoba showed negligible to small changesfor the Wildlife Habitat on Farmland Indicator,resulting in a slight overall decrease in capacitybetween 1981 and 2001:
• 7% of farmland showed either a moderate or large increase in wildlife habitat capacity,while 17% exhibited either a moderate orlarge decrease in wildlife habitat capacity.
While the large majority (75%) of Manitoba’sfarmland showed negligible or small changes inwildlife habitat capacity, thanks to the positiveinfluence of some of the land managementtrends discussed earlier (decrease in the species-impoverished summerfallow area from 8% to3%) and the increase in the area of “all otherland” (from 5% to 9% of all farmland), theseimprovements did not completely offset thenegative impact of the expansion of croplandfrom 58% to 62%.
ONTARIO
Soil: Soil quality indicators in Ontario showedresults in keeping with the national situation,with an overall improvement between 1981 and 2001:
• the share of cropland in the moderate tovery high soil cover classes went from 43%to 57%;
• the share of cropland in the very low riskclass for water erosion went from 44% to 56%;
• the share of cropland in the low and verylow risk class for tillage erosion went from16% to 28%;
• the share of cropland with increasing soilorganic carbon went from 17% to 30%.
These positive changes are similar to thenational trends and came mostly as a result ofsimilar land management and land use changes.The most significant change in land manage-ment over the 20-year period under review was the rising share of cropland under reducedtillage or no-till: by 2001, 48% of cropland wasmanaged using these practices. It should benoted, however, that a significant share of thecropland in Ontario is still at elevated risk fordegradation of soil quality. This is due to theincreasingly high share of more intensivelytilled crops grown in this province. For example,
there has been a shift away from forages (-24%),grain corn (-8%) and spring cereals (-22%) tosoybeans (+227%). Although the area of rowcrops has increased, the adoption of soil conservation tillage has tended to mitigate the overall risk of degradation of soil quality.
Water: Similar to the national trend, Ontarioshowed a general move away from the desiredobjective for both the Indicator of the Risk ofWater Contamination by Nitrogen and theResidual Soil Nitrogen Indicator between 1981and 1996, with a dramatic deterioration between1996 and 2001:
• the share of cropland in the high and veryhigh classes for residual soil nitrogen wentfrom 20% to 81%;
• the share of farmland in the low and verylow risk class for water contamination by Nwent from 60% to 9%.
This overall increase in residual nitrogen and in the risk of water contamination by nitrogenwas driven by increased N inputs, which werelinked mostly to higher biological fixation fromincreased soybean (20% each year) and alfalfaacreages as well as to increased livestock numbers (manure N from poultry and hog operations). The increase in available N was offset somewhat by higher N outputs (yields)from 1981 to 1996; however, N outputs
198
decreased in 2001, contributing to higher residual nitrogen and a higher risk of water contamination in that Census year. The greaterover-winter precipitation surplus in Ontariocontributed to the estimated higher risk of residual soil nitrogen loss through leaching. In 2001, this situation was particularly indicatedin southwestern Ontario regions such as theLake Erie Lowlands region, where availablemanure-N was high.
Air: Ontario made the second largest contribu-tion to the national decrease in net GHGemissions between 1981 and 2001:
• the net GHG emissions (emissions minussinks) decreased by 2.1 Mt CO2eq, from 11.5 to 9.4 Mt CO2eq, representing approximately 17% of national agricultural emissions.
Although Ontario still accounts for nearly a fifth of net national agricultural GHG emissions,the trend over the 20-year period under reviewhas been towards a reduction of total emissions.This downturn reflects a 17% decrease in nitro-
gen fertilizer sales in Ontario and a reduction in emissions from animals and from manurestorage linked to a decrease in the total dairyand beef cattle population. These changescaused a 0.9 Mt CO2eq decline in both methaneand nitrous oxide emissions from 1981 to 2001,while the adoption of conservation tillage practices was largely responsible for a decline of 0.3 Mt CO2eq in CO2 emissions.
Biodiversity: Contributing to the nationaldownward trend, Ontario posted an overalldecrease in wildlife habitat capacity between1981 and 2001:
• 94% of farmland showed either a moderateor large decrease in wildlife habitat capacity.
Land use changes are largely to blame for thedecline in wildlife habitat capacity in Ontario.These changes included an increase in the per-centage of farmland used for crops (from 60% to 67%) and a decrease in both natural pasture(from 13% to 9% of farmland) and tame pasture(from 11% to 6% of farmland).
Environmental Sustainability of Canadian Agriculture: Agri-Environmental Indicator Report Series—Report #2
QUEBEC
Soil: Contrary to the national trend, soil qualityindicators in Quebec did not show significantimprovements. Soil cover and soil organic carbon showed slightly negative trends. For the erosion indicators, while most of the landfell into the lower risk classes, there were onlyminor improvements between 1981 and 2001:
• the share of cropland in the high and very high soil cover classes went from 66%to 58%;
• the share of cropland in the very low riskclass for water erosion went from 70% to 71%;
• the share of cropland in the low and verylow risk class for tillage erosion went from81% to 84%;
• the share of cropland with increasing soilorganic carbon went from 18% to 17%.
Land use and management practices in Quebecunderwent a significant change over this 20-yearperiod. Changes that tended to increase the riskof soil degradation included decreases of 27% in forage area, 53% in pasture area and 10% incereal grain areas, with concomitant increases of 3% in total cultivated land and 83% in rowcrops, mainly corn and soybean. Were it not forthe moderate adoption of conservation tillage
199H. National and Regional Summary
practices on 24% of cropland by 2001 and thefact that most of these agricultural activities takeplace on landscapes and soils that are not natu-rally prone to erosion, the risk of soil qualitydegradation might have increased significantlyover this period.
Water: Similar to the national trend, Quebecshowed an overall trend away from the desiredobjective for both the Indicator of the Risk of Water Contamination by Nitrogen and theResidual Soil Nitrogen Indicator between 1981and 1996. On the other hand, the Indicator ofthe Risk of Water Contamination by Phosphorusshowed some improvements during the 20-yearperiod; however, the bulk of land still falls inthe moderate and high risk classes:
• the share of cropland in the low and verylow classes for residual soil nitrogen wentfrom 68% to 33%;
• the share of farmland in the low and very low risk class for water contaminationby N went from 80% to 63%;
• the share of farmland in the low and verylow risk class for water contamination by P went from 18% to 29%.
The overall increase in residual nitrogen and inthe risk of water contamination by nitrogen wasdriven by increased N inputs, associated mainlywith a continued uptrend in fertilizer sales andmanure increases resulting from higher poultryand hog numbers. Higher biological fixation fromincreased legume crop area also contributed tothe N inputs. The increase in available N was off-set somewhat by an increase in N outputs (yields)from 1981 to 1996; however, N outputs decreasedin 2001, contributing to higher residual nitrogenand a higher risk of water contamination in thatCensus year. The greater over-winter precipitationsurplus in Quebec contributed to losses of residual soil nitrogen through leaching. In 2001, this was particularly indicated in the SouthernLaurentians, the Appalachians and the St.Lawrence Lowlands, where the high values weremainly caused by high livestock populations andavailable manure-N. The slight improvement inthe risk of water contamination by phosphoruscan be explained by the large increase in the area
planted to grain corn, which is a high phospho-rus-demanding crop, as well by the use ofmanure as a replacement for P from fertilizers.Changes in the livestock industry in Quebechave resulted in a 9% increase in the totalamount of phosphorus available from manuresin the last 10 years.
Air: Quebec followed the national trend with asmall decrease in net GHG emissions between1981 and 2001:
• the net GHG emissions (emissions minussinks) decreased by 0.6 Mt CO2eq, from 7.1to 6.5 Mt CO2eq, representing approximately12% of national agricultural emissions.
Nitrous oxide emissions declined by 0.1 Mt CO2eq
during the 20-year period owing to reductions inemissions from animals and from manure storageassociated with a decrease in the total dairy andbeef cattle population. Methane emissionsdeclined by 0.5 Mt CO2eq because of a significantdecrease in the total dairy cattle population. Asmentioned in Chapter 21, since the methaneemission factor for dairy cattle is almost twicethat for beef cattle, the decrease in the dairy cattle population resulted in a net decrease inmethane emissions. The low to moderate adop-tion of conservation tillage did not compensatefor the decreased area of pasture and forages and the increased area under cultivation, hence a slight increase (0.1 Mt CO2eq) occurred in emissions of CO2.
Biodiversity: Similar to the situation inOntario, and also contributing to the nationaldowntrend, Quebec posted an overall decreasein wildlife habitat capacity between 1981 and 2001:
• 99% of farmland showed either a moderateor large decrease in wildlife habitat capacity.
As in Ontario, the decline in wildlife habitatcapacity in Quebec is largely attributable to landuse changes. These changes included an increasein the percentage of farmland used for crops(from 46% to 54%) and a decrease in both natural pasture (from 9% to 5% of farmland)and tame pasture (from 13% to 9% of farmland).
200
Soil: Soil quality indicators in the AtlanticProvinces showed mixed results, although there was an overall improvement between 1981 and 2001:
• the share of cropland in the moderate tovery high soil cover classes went from a low of 81% (PEI) in 1981 to 100% in all four provinces in 2001;
• the share of cropland in the very low riskclass for water erosion increased slightly inNew Brunswick from 54% to 55% and inNova Scotia from 61% to 65% but decreasedin Prince Edward Island by 1% to 51%.(water erosion in Newfoundland andLabrador was not assessed);
• the share of cropland in the low and verylow risk class for tillage erosion increasedfrom 62% to 78% in New Brunswick, from34% to 71% in Nova Scotia and from 30%to 62% in Newfoundland and Labrador but decreased from 41% to 19% in PrinceEdward Island;
• the share of cropland with increasing soilorganic carbon went from 43% to 53% inthe four provinces combined.
Although land management and land usechanges brought about a general improvementin the soil cover indicator, this was not reflected in the risk of water erosion. In all fourprovinces, the area of cropland increased andthe amount of pasture decreased. The area ofrow crops increased in Nova Scotia and PrinceEdward Island by 15% and 47% respectively. InPrince Edward Island, this situation is largelyattributable to the increase in the area of potatoes, which are particularly prone to both water and tillage erosion, even when conservation tillage practices are used. Increasesin conservation tillage practices in all fourprovinces and increases in the area of hay andfodder crops nonetheless played a beneficial role in mitigating erosion and maintaining soil organic carbon.
Water: Similar to the national trend, theAtlantic Provinces showed a general move away from the desired objective for both theIndicator of the Risk of Water Contamination by Nitrogen and the Residual Soil NitrogenIndicator between 1981 and 1996, with a dra-matic deterioration between 1996 and 2001:
• the share of cropland in the low and verylow classes for residual soil nitrogen wentfrom 42% to 16% in New Brunswick, from74% to 7% in Nova Scotia, from 35% to 0%in Prince Edward Island and from 45% to18% in Newfoundland and Labrador;
• the share of farmland in the low and verylow risk class for water contamination by Nwent from 55% to 25% in New Brunswick,from 80% to 10% in Nova Scotia, from 59%to 0% in Prince Edward Island and from49% to 30% in Newfoundland and Labrador.
The overall increase in residual nitrogen and inthe risk of water contamination by nitrogen wasdriven by higher N inputs, which were mostlylinked to increased livestock numbers (manureN from poultry and hog operations), and byhigher biological fixation from the expandedarea of alfalfa crops. The greater over-winter pre-cipitation surplus in Atlantic Canada, coupledwith the generally low available water holdingcapacity of the soils, contributes to losses ofresidual soil nitrogen through leaching.
Air: The Atlantic Provinces followed thenational trend with a small decrease in net GHGemissions between 1981 and 2001:
• the net GHG emissions (emissions minussinks) decreased by 0.4 Mt CO2eq, from 1.6 Mt CO2eq to 1.2 Mt CO2eq, in the fourprovinces combined.
Net emissions of both methane and CO2
declined over the 20-year period under study,while emissions of nitrous oxide remained virtu-ally unchanged. Methane emissions declined by0.1 Mt CO2eq because of a significant decrease
Environmental Sustainability of Canadian Agriculture: Agri-Environmental Indicator Report Series—Report #2
ATLANTIC PROVINCES
201H. National and Regional Summary
in dairy cattle and beef cattle populations. Asmentioned in Chapter 21, since the methaneemission factor for dairy cattle is almost twicethat for beef cattle, the decrease in the dairy cattle population induced a net decrease inmethane emissions. The low to moderate adop-tion of conservation tillage, combined with anincrease in the total hay and fodder crop area(from 0.19 M ha in 1991 to 0.22 M ha in 2001),was sufficient to maintain emissions of CO2
at the 1981 level despite the expansion (58 thousand ha) in the total area of cropland.
Biodiversity: Contributing to the national downward trend, the Atlantic Provinces postedan overall decrease in wildlife habitat capacitybetween 1981 and 2001:
• the share of farmland showing either a moderate or large decrease in wildlife habitat capacity was as follows: 87% in New Brunswick, 87% in Nova Scotia, 100%in Prince Edward Island and 66% inNewfoundland and Labrador.
The decline in wildlife habitat capacity in theAtlantic Provinces is largely attributable to landuse changes. These changes included an increasein the percentage of farmland used for crops(New Brunswick: from 30% to 39%: Nova Scotia:from 24% to 32%; Prince Edward Island: from56% to 67%; Newfoundland and Labrador: from14% to 21%) and decreases in total pasture areaof -48%, -40%, -50% and -55% for NewBrunswick, Nova Scotia, Prince Edward Islandand Newfoundland and Labrador, respectively.
This national and regional analysis of environ-mental indicators reveals some consistentnational trends, as well as considerable differ-ences in various agri-environmental conditionsacross Canada. All the major agricultural regionof Canada experienced some positive or negativetrends as reflected by the indicator results.Overall, we found that changes in agriculturalpractices over the 20-year period under reviewhave resulted in:
• a general improvement in soil managementwith numerous environmental benefits,including an overall reduction in soil erosion and net greenhouse gas emissions;
• increased environmental risks related toincreases in residual nitrogen and in the risk of water contamination by nitrogen;
• either a steady state or a slight decrease inwildlife habitat capacity on farmland in allprovinces except Saskatchewan.
The semi-arid prairie region is characterized by extensive crop production (cultivation ofcereals, oilseeds and pasture) and both extensiveand intensive livestock production. Together,the indicators suggest that considerable progresshas been achieved towards environmental sustainability in this region. Reductions in theuse of tillage, the area of summerfallow and the use of marginal lands have led to gains insoil conservation, soil quality and air quality,with the soils becoming a net sink for CO2 (agreenhouse gas). In many areas, these types ofland use change have also benefited wildlife.However, the expansion and intensification ofcropping and livestock production have alsoincreased emissions of the greenhouse gasesnitrous oxide and methane, decreased wildlifehabitat capacity in other areas, caused somesoils to remain at risk of degradation andincreased the chance of local water qualityimpacts because of increased fertilizer use andmore-intensive animal production. Furtherintensification of crops and livestock productionis likely to exacerbate the environmental risksunless appropriate actions are taken to managethem. Climatic, geographic and agricultural conditions are markedly different in the other(non-prairie) agricultural regions of Canada,
where the more favourable climatic conditionspermit more intensive forms of agriculture.These regions are characterized by the cultivation of higher-value crops (such as corn, potatoes, vegetables and soybeans) and by higher levels of inputs. Dairy, hog, poultryand beef operations are also prevalent. Land use changes in Central and Eastern Canada have included a reduction of total farmlandarea, but the area of cropped land has expandedin all the provinces. This more intensive form ofagriculture in an environment with abundantwater supplies may increase the potential environmental impacts associated with the agricultural sector.
Response options for environmental approachesto agriculture are provided in the different indi-cator chapters. All practices aimed at reducingsoil disturbance have beneficial implications for soil quality, as well as for air quality giventhe potential for reducing GHG and particulatematter emissions. The beneficial implications for water quality consist of reduced surface run-off and enhanced erosion control, which can reduce the amount of nutrients, pathogensand pesticides entering the watershed system.Biodiversity benefits arise from the enhancedwildlife habitats and enhanced conditions forsustaining soil biodiversity, along with a lesssuitable environment for invasive species.Beneficial practices include the expanded use of conservation tillage methods (reducedtillage and no-till systems), the reduced use ofsummerfallow, crop residue management aimedat maintaining soil cover, forage use in croprotations, strip cropping, companion or wintercover crops and efforts to target appropriateland use and management practices to the bio-physical properties and limitations of soiland landscape resources. A second means ofenhancing environmental stewardship in agriculture consists in implementing beneficialmanagement practices aimed at boosting effi-ciency in all sectors of agriculture, including thefood and beverage processing industry. Some of the main practices for increasing input useefficiency at the farm level include developingand implementing an agri-environmental nutrient plan, regular soil testing and matchingnutrient applications to crop requirements,
202 Environmental Sustainability of Canadian Agriculture: Agri-Environmental Indicator Report Series—Report #2
Conclusion
Conclusion 203
growing winter cover crops where practical toenhance the uptake of nutrients remaining after the main crop is harvested and using otherhigh nutrient-demanding crops in areas wherenutrient surpluses are identified. Improvingnutrient management in livestock diets is aneffective mitigation strategy that can help minimize nutrient emissions to air, soil andwater. Increasing the use of integrated pest management practices and new sprayer tech-nologies is an effective way to reduce pesticide
use. Increased water use efficiency contributes to maintaining or improving yields and alsoconserves water for other uses. Increased energyuse efficiency will save money for producers and benefit the environment through reducedgreenhouse gas emissions. In summary, continued improvement in farm managementand land use practices are essential for maintain-ing and furthering the advances achieved in environmental stewardship within the agriculture sector.

IAnnexes
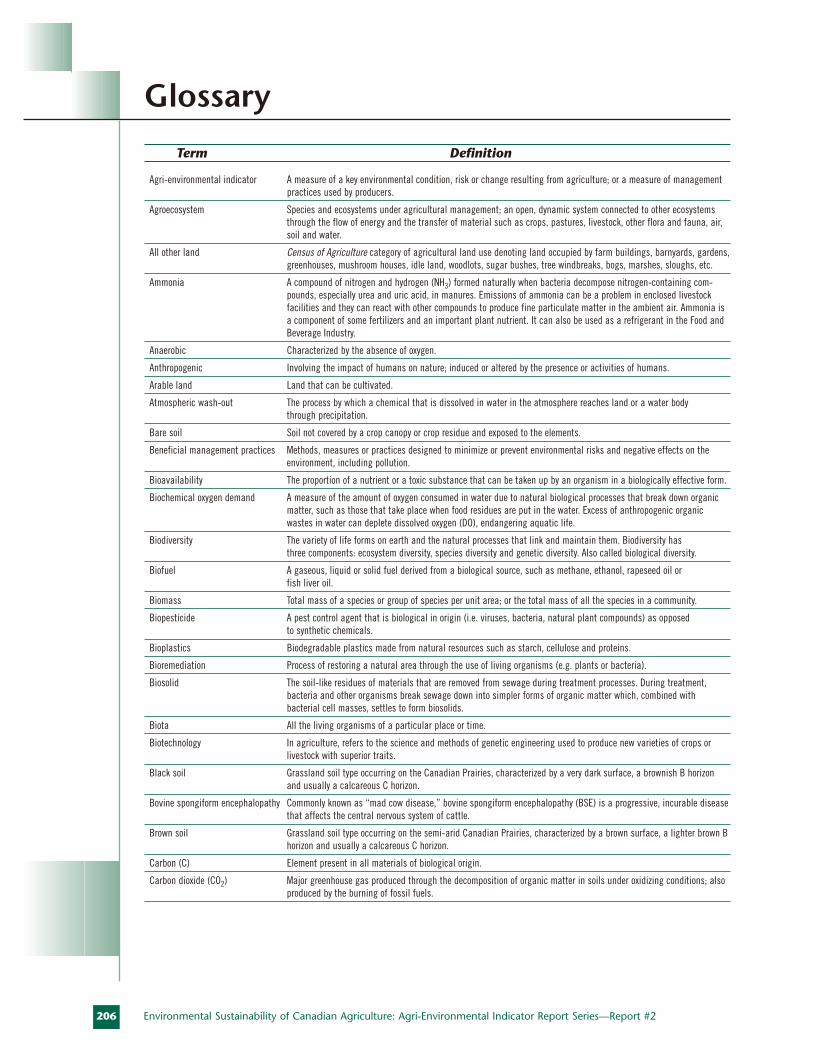
206 Environmental Sustainability of Canadian Agriculture: Agri-Environmental Indicator Report Series—Report #2
Glossary
Agri-environmental indicator A measure of a key environmental condition, risk or change resulting from agriculture; or a measure of management practices used by producers.
Agroecosystem Species and ecosystems under agricultural management; an open, dynamic system connected to other ecosystemsthrough the flow of energy and the transfer of material such as crops, pastures, livestock, other flora and fauna, air,soil and water.
All other land Census of Agriculture category of agricultural land use denoting land occupied by farm buildings, barnyards, gardens,greenhouses, mushroom houses, idle land, woodlots, sugar bushes, tree windbreaks, bogs, marshes, sloughs, etc.
Ammonia A compound of nitrogen and hydrogen (NH3) formed naturally when bacteria decompose nitrogen-containing com-pounds, especially urea and uric acid, in manures. Emissions of ammonia can be a problem in enclosed livestockfacilities and they can react with other compounds to produce fine particulate matter in the ambient air. Ammonia isa component of some fertilizers and an important plant nutrient. It can also be used as a refrigerant in the Food andBeverage Industry.
Anaerobic Characterized by the absence of oxygen.
Anthropogenic Involving the impact of humans on nature; induced or altered by the presence or activities of humans.
Arable land Land that can be cultivated.
Atmospheric wash-out The process by which a chemical that is dissolved in water in the atmosphere reaches land or a water body through precipitation.
Bare soil Soil not covered by a crop canopy or crop residue and exposed to the elements.
Beneficial management practices Methods, measures or practices designed to minimize or prevent environmental risks and negative effects on theenvironment, including pollution.
Bioavailability The proportion of a nutrient or a toxic substance that can be taken up by an organism in a biologically effective form.
Biochemical oxygen demand A measure of the amount of oxygen consumed in water due to natural biological processes that break down organicmatter, such as those that take place when food residues are put in the water. Excess of anthropogenic organicwastes in water can deplete dissolved oxygen (DO), endangering aquatic life.
Biodiversity The variety of life forms on earth and the natural processes that link and maintain them. Biodiversity has three components: ecosystem diversity, species diversity and genetic diversity. Also called biological diversity.
Biofuel A gaseous, liquid or solid fuel derived from a biological source, such as methane, ethanol, rapeseed oil or fish liver oil.
Biomass Total mass of a species or group of species per unit area; or the total mass of all the species in a community.
Biopesticide A pest control agent that is biological in origin (i.e. viruses, bacteria, natural plant compounds) as opposed to synthetic chemicals.
Bioplastics Biodegradable plastics made from natural resources such as starch, cellulose and proteins.
Bioremediation Process of restoring a natural area through the use of living organisms (e.g. plants or bacteria).
Biosolid The soil-like residues of materials that are removed from sewage during treatment processes. During treatment, bacteria and other organisms break sewage down into simpler forms of organic matter which, combined with bacterial cell masses, settles to form biosolids.
Biota All the living organisms of a particular place or time.
Biotechnology In agriculture, refers to the science and methods of genetic engineering used to produce new varieties of crops or livestock with superior traits.
Black soil Grassland soil type occurring on the Canadian Prairies, characterized by a very dark surface, a brownish B horizonand usually a calcareous C horizon.
Bovine spongiform encephalopathy Commonly known as “mad cow disease,” bovine spongiform encephalopathy (BSE) is a progressive, incurable diseasethat affects the central nervous system of cattle.
Brown soil Grassland soil type occurring on the semi-arid Canadian Prairies, characterized by a brown surface, a lighter brown Bhorizon and usually a calcareous C horizon.
Carbon (C) Element present in all materials of biological origin.
Carbon dioxide (CO2) Major greenhouse gas produced through the decomposition of organic matter in soils under oxidizing conditions; alsoproduced by the burning of fossil fuels.
Term Definition
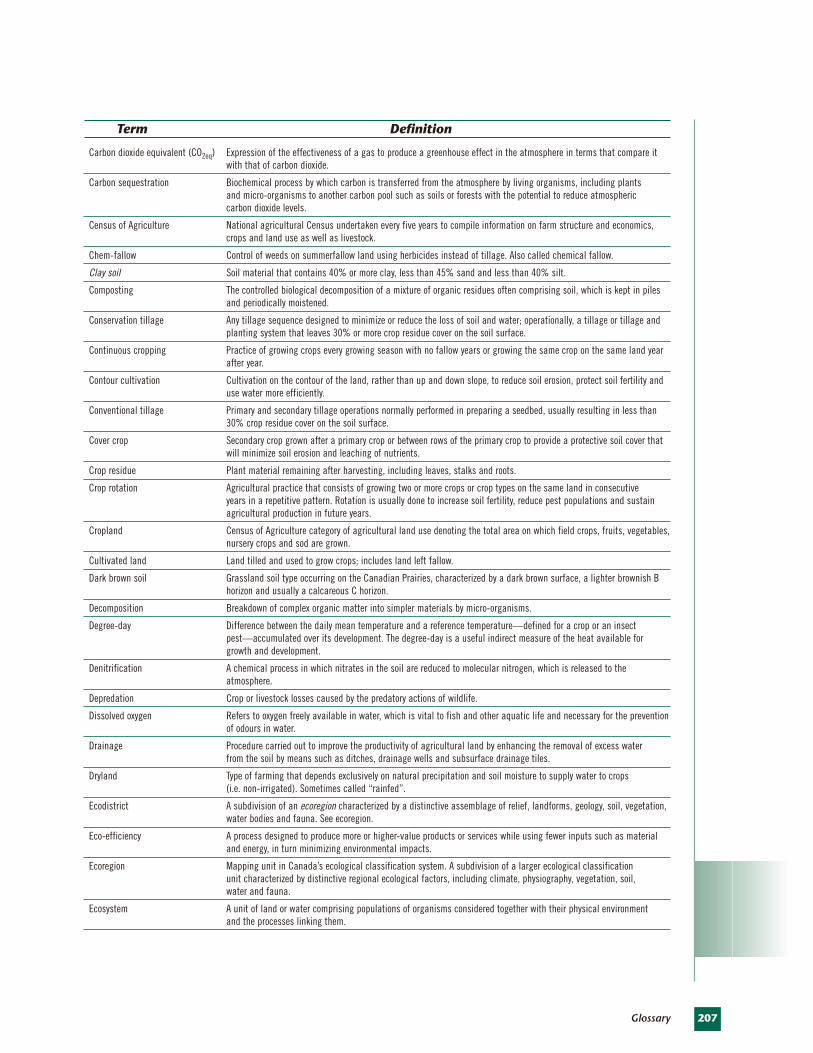
207Glossary
Carbon dioxide equivalent (CO2eq) Expression of the effectiveness of a gas to produce a greenhouse effect in the atmosphere in terms that compare itwith that of carbon dioxide.
Carbon sequestration Biochemical process by which carbon is transferred from the atmosphere by living organisms, including plants and micro-organisms to another carbon pool such as soils or forests with the potential to reduce atmospheric carbon dioxide levels.
Census of Agriculture National agricultural Census undertaken every five years to compile information on farm structure and economics,crops and land use as well as livestock.
Chem-fallow Control of weeds on summerfallow land using herbicides instead of tillage. Also called chemical fallow.
Clay soil Soil material that contains 40% or more clay, less than 45% sand and less than 40% silt.
Composting The controlled biological decomposition of a mixture of organic residues often comprising soil, which is kept in pilesand periodically moistened.
Conservation tillage Any tillage sequence designed to minimize or reduce the loss of soil and water; operationally, a tillage or tillage andplanting system that leaves 30% or more crop residue cover on the soil surface.
Continuous cropping Practice of growing crops every growing season with no fallow years or growing the same crop on the same land yearafter year.
Contour cultivation Cultivation on the contour of the land, rather than up and down slope, to reduce soil erosion, protect soil fertility anduse water more efficiently.
Conventional tillage Primary and secondary tillage operations normally performed in preparing a seedbed, usually resulting in less than30% crop residue cover on the soil surface.
Cover crop Secondary crop grown after a primary crop or between rows of the primary crop to provide a protective soil cover thatwill minimize soil erosion and leaching of nutrients.
Crop residue Plant material remaining after harvesting, including leaves, stalks and roots.
Crop rotation Agricultural practice that consists of growing two or more crops or crop types on the same land in consecutive years in a repetitive pattern. Rotation is usually done to increase soil fertility, reduce pest populations and sustainagricultural production in future years.
Cropland Census of Agriculture category of agricultural land use denoting the total area on which field crops, fruits, vegetables,nursery crops and sod are grown.
Cultivated land Land tilled and used to grow crops; includes land left fallow.
Dark brown soil Grassland soil type occurring on the Canadian Prairies, characterized by a dark brown surface, a lighter brownish Bhorizon and usually a calcareous C horizon.
Decomposition Breakdown of complex organic matter into simpler materials by micro-organisms.
Degree-day Difference between the daily mean temperature and a reference temperature—defined for a crop or an insect pest—accumulated over its development. The degree-day is a useful indirect measure of the heat available forgrowth and development.
Denitrification A chemical process in which nitrates in the soil are reduced to molecular nitrogen, which is released to the atmosphere.
Depredation Crop or livestock losses caused by the predatory actions of wildlife.
Dissolved oxygen Refers to oxygen freely available in water, which is vital to fish and other aquatic life and necessary for the preventionof odours in water.
Drainage Procedure carried out to improve the productivity of agricultural land by enhancing the removal of excess water from the soil by means such as ditches, drainage wells and subsurface drainage tiles.
Dryland Type of farming that depends exclusively on natural precipitation and soil moisture to supply water to crops (i.e. non-irrigated). Sometimes called “rainfed”.
Ecodistrict A subdivision of an ecoregion characterized by a distinctive assemblage of relief, landforms, geology, soil, vegetation,water bodies and fauna. See ecoregion.
Eco-efficiency A process designed to produce more or higher-value products or services while using fewer inputs such as materialand energy, in turn minimizing environmental impacts.
Ecoregion Mapping unit in Canada’s ecological classification system. A subdivision of a larger ecological classification unit characterized by distinctive regional ecological factors, including climate, physiography, vegetation, soil, water and fauna.
Ecosystem A unit of land or water comprising populations of organisms considered together with their physical environment and the processes linking them.
Term Definition
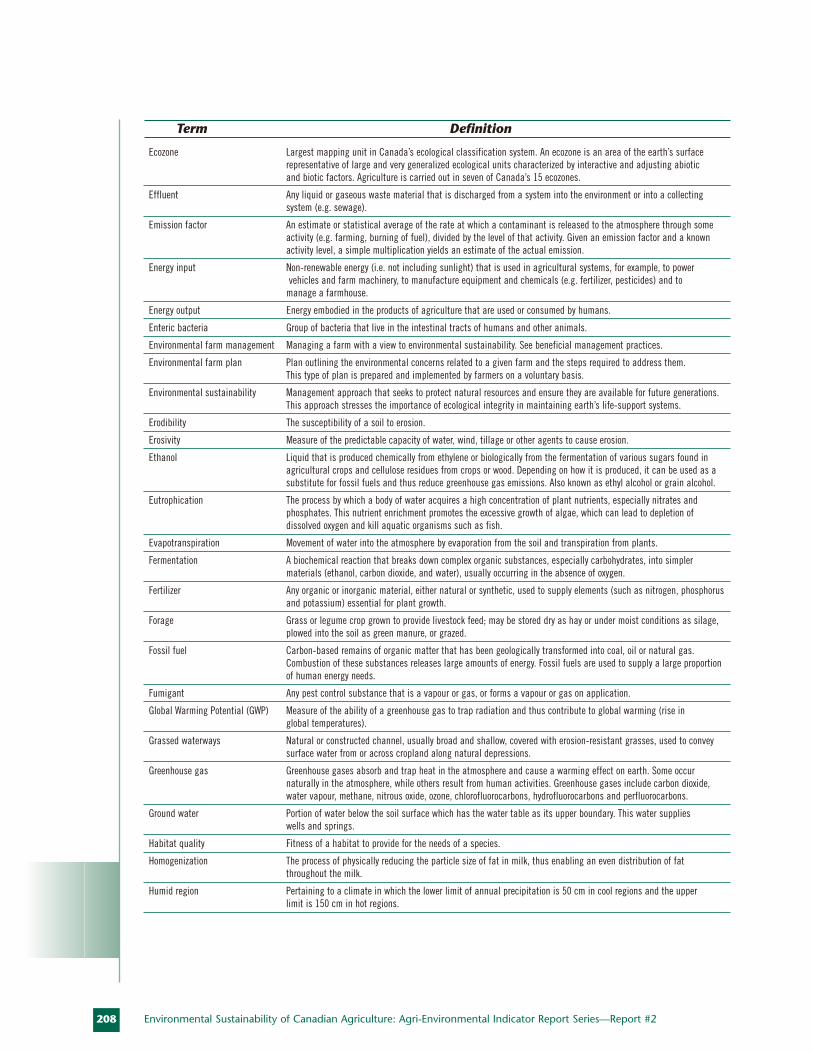
208
Ecozone Largest mapping unit in Canada’s ecological classification system. An ecozone is an area of the earth’s surface representative of large and very generalized ecological units characterized by interactive and adjusting abiotic and biotic factors. Agriculture is carried out in seven of Canada’s 15 ecozones.
Effluent Any liquid or gaseous waste material that is discharged from a system into the environment or into a collecting system (e.g. sewage).
Emission factor An estimate or statistical average of the rate at which a contaminant is released to the atmosphere through someactivity (e.g. farming, burning of fuel), divided by the level of that activity. Given an emission factor and a knownactivity level, a simple multiplication yields an estimate of the actual emission.
Energy input Non-renewable energy (i.e. not including sunlight) that is used in agricultural systems, for example, to powervehicles and farm machinery, to manufacture equipment and chemicals (e.g. fertilizer, pesticides) and to
manage a farmhouse.
Energy output Energy embodied in the products of agriculture that are used or consumed by humans.
Enteric bacteria Group of bacteria that live in the intestinal tracts of humans and other animals.
Environmental farm management Managing a farm with a view to environmental sustainability. See beneficial management practices.
Environmental farm plan Plan outlining the environmental concerns related to a given farm and the steps required to address them. This type of plan is prepared and implemented by farmers on a voluntary basis.
Environmental sustainability Management approach that seeks to protect natural resources and ensure they are available for future generations.This approach stresses the importance of ecological integrity in maintaining earth’s life-support systems.
Erodibility The susceptibility of a soil to erosion.
Erosivity Measure of the predictable capacity of water, wind, tillage or other agents to cause erosion.
Ethanol Liquid that is produced chemically from ethylene or biologically from the fermentation of various sugars found in agricultural crops and cellulose residues from crops or wood. Depending on how it is produced, it can be used as asubstitute for fossil fuels and thus reduce greenhouse gas emissions. Also known as ethyl alcohol or grain alcohol.
Eutrophication The process by which a body of water acquires a high concentration of plant nutrients, especially nitrates and phosphates. This nutrient enrichment promotes the excessive growth of algae, which can lead to depletion of dissolved oxygen and kill aquatic organisms such as fish.
Evapotranspiration Movement of water into the atmosphere by evaporation from the soil and transpiration from plants.
Fermentation A biochemical reaction that breaks down complex organic substances, especially carbohydrates, into simpler materials (ethanol, carbon dioxide, and water), usually occurring in the absence of oxygen.
Fertilizer Any organic or inorganic material, either natural or synthetic, used to supply elements (such as nitrogen, phosphorusand potassium) essential for plant growth.
Forage Grass or legume crop grown to provide livestock feed; may be stored dry as hay or under moist conditions as silage,plowed into the soil as green manure, or grazed.
Fossil fuel Carbon-based remains of organic matter that has been geologically transformed into coal, oil or natural gas.Combustion of these substances releases large amounts of energy. Fossil fuels are used to supply a large proportionof human energy needs.
Fumigant Any pest control substance that is a vapour or gas, or forms a vapour or gas on application.
Global Warming Potential (GWP) Measure of the ability of a greenhouse gas to trap radiation and thus contribute to global warming (rise in global temperatures).
Grassed waterways Natural or constructed channel, usually broad and shallow, covered with erosion-resistant grasses, used to conveysurface water from or across cropland along natural depressions.
Greenhouse gas Greenhouse gases absorb and trap heat in the atmosphere and cause a warming effect on earth. Some occur naturally in the atmosphere, while others result from human activities. Greenhouse gases include carbon dioxide,water vapour, methane, nitrous oxide, ozone, chlorofluorocarbons, hydrofluorocarbons and perfluorocarbons.
Ground water Portion of water below the soil surface which has the water table as its upper boundary. This water supplies wells and springs.
Habitat quality Fitness of a habitat to provide for the needs of a species.
Homogenization The process of physically reducing the particle size of fat in milk, thus enabling an even distribution of fat throughout the milk.
Humid region Pertaining to a climate in which the lower limit of annual precipitation is 50 cm in cool regions and the upper limit is 150 cm in hot regions.
Environmental Sustainability of Canadian Agriculture: Agri-Environmental Indicator Report Series—Report #2
Term Definition
209Glossary
Hybridization Breeding of individuals from genetically different strains, populations or species.
Indigenous biodiversity The variety of life forms that are native to a particular area and the natural processes that link and maintain them.
Inorganic Pertaining to a compound that is not organic, usually of mineral origin
Integrated pest management Decision-making process that uses all the necessary techniques to suppress pests effectively, economically and in an environmentally sound manner. Integrated pest management, or IPM, is an ecologically based strategy that relieson natural mortality factors, such as natural enemies, weather and crop management, and applies control measuresthat disrupt these factors as little as possible.
Interseeding Seeding a secondary crop into a primary crop to provide enhanced soil cover, nutrient control, pest control or otherproduction benefits.
Invasive alien species Alien (non-native) species (plant, animal or micro-organism) whose introduction causes or is likely to cause economicor environmental harm or harm to human health.
Invasiveness Ability of a plant to spread beyond its introduction site and become established in new locations, where it mayadversely affect other organisms.
Irrigation Artificial watering of crops by various methods.
Leaching Process by which soluble substances are dissolved and transported through the soil by percolating water.
Life cycle assessment Technique to assess the environmental aspects and potential impacts associated with a product, process, or service, by compiling an inventory of relevant energy and material inputs and environmental releases; evaluating the potential environmental impacts associated with all identified inputs and releases; and interpreting the results to aid in making a more informed decision.
Loamy sand soil Soil material containing a mixture of sand, clay and silt, in which sand particles are predominant, followed by clayparticles. For example, a soil sample consisting of 90% sand and 10% clay falls into the loamy sand soil category.Note that this soil contains less clay than a sandy loam soil.
Methane (CH4) Gas produced through anaerobic decomposition of waste in landfills, animal digestion, decomposition of manure, production and distribution of natural gas and oil, coal production and incomplete fuel combustion. It is one of thethree main agricultural greenhouse gas (with CO2 and N2O).
Microclimate The climate of a small area resulting from modification of the general climate by local differences in elevation orexposure.
Minimum tillage Minimum use of tillage necessary to meet crop production requirements under existing soil and climatic conditions,usually resulting in fewer tillage operations than for conventional tillage.
Moldboard plowing Tillage operation performed to break up soil with partial to complete inversion of soil.
Monoculture System of crop production that relies on a single crop species in successive years.
Mycorrhizal fungi Soil fungi that form an association (usually symbiotic) with the roots of host plants, by which energy, water, andnutrient flow between the two organisms. This type of association benefits most agricultural crops substantially.
National Ecological Approach devised to provide a consistent, national spatial context within which ecosystems at various levels ofFramework for Canada generalization can be described, monitored, and reported on. A 1996 report sets out the methodology used to
construct ecological framework maps, the hierarchical levels of generalization, descriptions of each ecozone andecoregion, their linkages to various data sources and examples of applications of the framework.
Native species Species known to have existed on a site prior to the influence of humans, possibly including long-established exotic species.
Natural enemy scouting Integrated pest management measure that involves monitoring the levels of natural enemies of a pest in fields.
Natural pasture Census of Agriculture category of agricultural land use denoting uncleared or uncultivated land used for pasture.
Nitrogen Chemical element in most natural organic substances. Also a key crop nutrient and water pollutant in soluble forms such as nitrate; also forms nitrous oxide.
Nitrous oxide (N2O) Potent naturally occurring greenhouse gas whose emissions are enhanced by anthropogenic activities such as nitrogen fertilization, crop residue decomposition and farming of organic soils as well as the deposition, storage and application of manure to agricultural land. It is one of the three main agricultural greenhouse gases (with CO2and CH4).
No-till Procedure by which a crop is planted directly into the soil using a special planter, with no primary or secondary tillageafter harvest of the previous crop.
Nutraceutical Conventional food product that has been modified (potentially by genetic engineering) to provide improved nutritionalcharacteristics and/or pharmaceutical properties.
Term Definition
210
Nutrient Substance required by a living organism for proper growth and development. Nitrogen, phosphorus and potassium are key crop nutrients.
Offset system A system that awards credits for verified greenhouse gas emissions reductions or removals by eligible projects.
Overgrazing Grazing by animals on vegetation at a rate greater than the ability of vegetation to regenerate itself.
Ozone Naturally occurring gas, formed from normal oxygen. In higher atmosphere, ozone protects the earth by filtering outultraviolet radiation from the sun.
Particulate matter Air pollutants composed of minuscule liquid or solid particles temporarily suspended in the atmosphere (e.g. dust,pollen, spores, smoke, organic compounds)
Pasteurization The process of heating food to kill pathogens such as bacteria, viruses, protozoa, and molds that may be harmful to humans.
Pathogen A disease-causing agent.
Perennial forage Grasses and legumes that regrow each spring from the rootstock of plants from the previous growing season.
Permanent cover Perennial crop that provides vegetative protection to the soil throughout the year. Can be achieved by successiveannual or biennial crops in some cases.
Pest Organism (plant or animal) that is directly or indirectly detrimental to agricultural production.
Pest resistance A situation in which exposed pests are not affected by a particular recommended application rate of pesticide.
Pesticide A substance, usually a chemical, that is used to kill or control pests. Pesticides include herbicides, insecticides,fungicides, nematocides, rodenticides and miticides.
pH An expression of the intensity of the basic or acidic condition of a liquid or of soil generally expressed on a scale ranging from 0 to 14, where values below 7 are acidic, 7 is neutral and values above 7 are considered alkaline.
Phosphorus Chemical element essential for all living organism and a key crop nutrient. Phosphorus can be the cause of eutrophication above a threshold concentration in fresh water .
Photosynthesis Process by which plants transform carbon dioxide and water into carbohydrates and other compounds using energyfrom the sun captured by the plants’ chlorophyll.
Phytase An enzyme common in malt that is widely used in the animal feed industry to increase absorption of organic phosphorus from feed and reduce phosphorus releases to the environment.
Polygon Irregularly shaped, closed delineation on a map; used in the context of mapping units in the Soil Landscapes ofCanada map series and superimposed on Census of Agriculture maps to align soil and landscape data with information on agricultural management practices.
Preferential flow Process whereby water, soluble substances and compounds such as particulate phosphorus and fecal coliforms move through soil macropores to tile drains and water table.
Pressure-outcome- Conceptual framework for assessing environmental sustainability that identifies driving forces that influenceresponse framework agricultural activities, outcomes of these activities and responses by society to shape and ensure desirable outcomes.
Pulse crop Legume that provides edible seeds, such as beans, peas and lentils.
Reduced tillage Tillage operations that involve less soil disturbance than conventional tillage, either through the use of fewer passesor special equipment. Includes minimum tillage.
Refrigerant The fluid in a refrigeration system that produce cold by changing from a liquid to a vapour and back to a liquid stateat practical pressures.
Return flow Surface and subsurface water that leaves the field following application of irrigation water.
Riparian area Land bordering a stream or other body of water.
Riparian buffer strip Narrow strip of land along a watercourse designed to reduce erosion, intercept pollutants, provide habitat for wildlifeand address other environmental concerns.
Rotation See “crop rotation”.
Row cropping A production system involving crops that are grown in widely spaced rows and that may involve tilling between therows for weed control, hilling the rows for root protection, or both. Typical row-crops include potatoes, tobacco, vegetables, beans, sugar beets and corn. Usually involves a high level of production per unit area.
Run-off The portion of precipitation and snowmelt that flows over the land into surface water (e.g. streams, marshes, lakes, etc.).
Salinization Process by which the content of soluble salts increases at the soil surface or within the root zone.
Environmental Sustainability of Canadian Agriculture: Agri-Environmental Indicator Report Series—Report #2
Term Definition
211Glossary
Sandy loam soil Soil material containing sand, clay and silt, with sand particles being predominant, followed by clay particles. For example, a sample consisting of 70% sand and 10% clay falls into the sandy loam soil category.
Sandy soil Soil material in which sand particles are very abundant.
Semi-arid region Region with minimum or little precipitation (25 to 50 cm annually). Pertaining to a climate with slightly more precipitation than an arid climate, or to a region in which such a climate prevails and sparse grasses are the charac-teristic vegetation. Dryland farming methods or irrigation are usually required for crop production in these regions.
Shelterbelt A barrier of trees, shrubs or other perennial vegetation designed to reduce wind erosion. Also called a windbreak.
Sink In soils, the capacity to assimilate substances and retain them or subsequently provide them as a source for above- and belowground vegetative growth.
Sludge The accumulated settled solids separated from various types of water or wastewater as a result of natural or artificial processes.
Smog Unhealthy air caused by smoke, chemical fumes or dust formed in the atmosphere.
Soil Landscapes of Canada National series of broad-scale (1:1 million) soil maps containing information about soil properties and landforms.
Soil organic matter Carbon-containing material in the soil that derives from living organisms.
Soil structure Physical properties of a soil relating to the arrangements and stability of soil particles, aggregates and pores.
Soil texture Relative proportion of the different sizes of mineral particles of less than 2 mm (sand, silt and clay) in soil.
Solid residues All the material inputs to a process that are not turned into products or by-products. This material is either recycled or becomes waste.
Sterilization The process (mainly by heating) to kill pathogens such as bacteria, viruses, protozoa, molds and heat resistant bacterial spores in food that may be harmful to humans.
Strip cropping Erosion control method consisting of growing crops that require different types of tillage, such as row crops and permanent grass or annual crops and fallow in alternate strips along contours.
Submetering Use of separate meters to record the water use of individual unit users while the entire complex of units continues to be metered by the main supplier.
Summerfallow Census of Agriculture category of agricultural land use and general term denoting cropland that is not cropped for at least one year, primarily for the purpose of conserving soil moisture, but is managed by cultivating or sprayingto control weeds.
Suspended particulates Small particles of solid pollutants in sewage that contribute to turbidity.
Sustainable agriculture An integrated farming system that will, over the long term, satisfy food and fibre needs, enhance environmental quality, make the most efficient use of resources, sustain the economic viability of farm operations and enhance thequality of life.
Tame pasture Census of Agriculture category of agricultural land use denoting pasture that has been improved by managementsuch as cultivation, drainage, irrigation, fertilization, seeding or spraying. Also referred to as “improved pasture” and “seeded pasture”.
Taxonomic information Information about classifying organisms based on how closely related they are.
Terracing A soil and water conservation technique consisting of a raised level space supported on one or more sides by a wall or a bank.
Trace element A chemical substance essential to plant or animal life, but required in very small amounts, e.g. less than 1 ppm in plants.
Waterlogging Situation occurring when soil is fully saturated with water.
Watershed The area of land from which a waterbody receives water. An area of land that drains water, organic matter, dissolvednutrients and sediments into a lake or stream; the topographic boundary is usually a height of land that marks thedividing line from which surface streams flow in two different directions.
Wetland Area of land inundated by surface water or groundwater. Under the Canadian Wetland Classification System, wetlands are divided into five classes: bogs, fens, marshes, swamps and shallow waters.
Wildlife All undomesticated organisms living in the wild, especially animals.
Wildlife habitat Parts of the natural environment on which an organism depends to carry out its life processes.
Windbreak A barrier that provides shelter from the wind. Also called a shelterbelt.
Winter cover crop Crop planted in the fall in order to provide cover and thus curb soil erosion during winter and spring.
Term Definition
Rolfe AntonowitschAAFC, Prairie Farm Rehabilitation AdministrationRegina, SaskatchewanEmail: [email protected]
Yves ArcandAAFC, Food Research and Development CentreSaint-Hyacinthe, QuebecEmail: [email protected]
Shabtai BittmanAAFC, Pacific Agri-Food Research Centre Agassiz, British ColumbiaEmail: [email protected]
Guy BoivinAAFC, Horticulture Research and Development CentreSaint-Jean-sur-Richelieu, QuébecEmail: [email protected]
Lucie BourqueAAFC, Strategic Policy BranchOttawa, OntarioEmail: [email protected]
Tony BrierleyAAFC, Lacombe Research CentreEdmonton, AlbertaEmail: [email protected]
Carolyn CallaghanAAFC, Eastern Cereal and Oilseed Research CentreOttawa, OntarioEmail: [email protected]
Allan J. CessnaAAFC, Lethbridge Research centreLethbridge, AlbertaEmail: [email protected]
Fulin ChenAAFC, Eastern Cereal and Oilseed Research CentreOttawa, OntarioEmail: [email protected]
Harvey ClarkAAFC, Strategic Policy BranchOttawa, OntarioEmail: [email protected]
Dick Coote ConsultantStittsville, OntarioEmail: [email protected]
Farida DechmiAAFC, Soils and Crops Research and Development CentreSainte-Foy, QuebecEmail: [email protected]
Reinder De JongAAFC, Eastern Cereal and Oilseed Research CentreOttawa, OntarioEmail: [email protected]
Raymond DesjardinsAAFC, Eastern Cereal and Oilseed Research CentreOttawa, OntarioEmail: [email protected]
Craig F. DruryAAFC, Greenhouse and Processing Crops Research CentreHarrow, OntarioEmail: [email protected]
Grant EdwardsAAFC, Eastern Cereal and Oilseed Research CentreOttawa, OntarioEmail: [email protected]
Robert G. EilersAAFC, Cereal Research CentreWinnipeg, ManitobaEmail: [email protected]
Warren D. EilersAAFC, Saskatoon Research CentreSaskatoon, SaskatchewanEmail: [email protected]
Annemieke FarenhorstUniversity of ManitobaWinnipeg, ManitobaEmail: [email protected]
Robert G. FoottitAAFC, Eastern Cereal and Oilseed Research CentreOttawa, OntarioEmail: [email protected]
Catherine A. FoxAAFC, Greenhouse and Processing Crops Research CentreHarrow, OntarioEmail: [email protected]
Brian GrantAAFC, Eastern Cereal and Oilseed Research Centre Ottawa, OntarioEmail: [email protected]
Cynthia A. GrantAAFC, Brandon Research CenterBrandon, ManitobaEmail: [email protected]
Julie GrimardAAFC, Strategic Policy BranchOttawa, OntarioEmail: [email protected]
212 Environmental Sustainability of Canadian Agriculture: Agri-Environmental Indicator Report Series—Report #2
Contributing Authors
213Contributing Authors
John HarringtonAAFC, Prairie Farm Rehabilitation AdministrationOutlook, SaskatchewanEmail: [email protected]
Edward (Ted) HuffmanAAFC, Eastern Cereal and Oilseed Research CentreOttawa, OntarioEmail: [email protected]
Julian HutchinsonAAFC, Eastern Cereal and Oilseed Research CentreOttawa, OntarioEmail: [email protected]
Steve K. JavorekAAFC, Atlantic Food and Horticulture Research Centre Kentville, Nova ScotiaEmail: [email protected]
Bruce JunkinsAAFC, Strategic Policy BranchOttawa, OntarioEmail: [email protected]
Valerie KirkwoodAAFC, Eastern Cereal and Oilseed Research CentreOttawa, OntarioEmail: [email protected]
Maurice KorolAAFC, Farm Financial Programs BranchOttawa, OntarioEmail: [email protected]
Robert KorolukAAFC, Strategic Policy BranchOttawa, OntarioEmail: [email protected]
David LapenAAFC, Eastern Cereal and Oilseed Research CentreOttawa, OntarioEmail: [email protected]
Marie-Line LeclercAAFC, Soils and Crops Research and Development CentreSainte-Foy, QuebecEmail: [email protected]
Alexandre LefebvreAAFC, Strategic Policy BranchOttawa, OntarioEmail: [email protected]
Lavona LigginsAAFC, Lethbridge Research CentreKamloops, British ColumbiaEmail: [email protected]
David LobbSoil Science, University of ManitobaWinnipeg, ManitobaEmail: [email protected]
Robert J. MacgregorAAFC, Strategic Policy BranchOttawa, OntarioEmail: [email protected]
Michèle MarcotteAAFC, Food Research and Development CentreSaint-Hyacinthe, QuebecEmail: [email protected]
Peter G. MasonAAFC, Eastern Cereal and Oilseed Research CentreOttawa, OntarioEmail: [email protected]
Abdul MatinAAFC, Pacific Agri-Food Research Centre Agassiz, British ColumbiaEmail: [email protected]
Dominique MaximeAAFC, Food Research and Development CentreSaint-Hyacinthe, QuebecEmail: [email protected]
Brian McConkeyAAFC, Semiarid Prairie Agricultural Research CentreSwift Current, SaskatchewanEmail: [email protected]
Terry McRaeEnvironment Canada, Watershed Management & Governance BranchGatineau, QuebecEmail: [email protected]
Ross McQueenUniversity of ManitobaWinnipeg, ManitobaEmail: [email protected]
Owen OlfertAAFC, Saskatoon Research CentreSaskatoon, SaskatchewanEmail: [email protected]
Chrystel OlivierAAFC, Saskatoon Research CentreSaskatoon, SaskatchewanEmail: [email protected]
Glenn PadburyAAFC, Saskatoon Research CentreSaskatoon, SaskatchewanEmail: [email protected]
214
Elizabeth PatteyAAFC, Eastern Cereal and Oilseed Research CentreOttawa, OntarioEmail: [email protected]
Alain PiauAAFC, Farm Financial Programs BranchOttawa, OntarioEmail: [email protected]
Herb ReesAAFC, Potato Research CentreFredericton, New BrunswickEmail: [email protected]
Keith ReidOntario Ministry of Agriculture and FoodStratford, OntarioEmail: [email protected]
Harold RostadConsultantSaskatoon, SaskatchewanEmail: [email protected]
Marsha I. Sheppard ConsultantPinawa, ManitobaEmail: [email protected]
Steve C. Sheppard ConsultantPinawa, ManitobaEmail: [email protected]
Ward SmithAAFC, Eastern Cereal and Oilseed Research CentreOttawa, OntarioEmail: [email protected]
John C. TaitConsultantPinawa, ManitobaEmail: [email protected]
Georges ThériaultAAFC, Soils and Crops Research and Development CentreSainte-Foy, QuebecEmail: [email protected]
Don ThompsonAAFC, Lethbridge Research centreKamloops, British ColumbiaEmail: [email protected]
Laurie C. TollefsonAAFC, Prairie Farm Rehabilitation AdministrationOutlook, SaskatchewanEmail: [email protected]
Ed ToppAAFC, Southern Crop Protection and Food Research CentreLondon, OntarioEmail: [email protected]
Eric van BochoveAAFC, Soils and Crops Research and Development CentreSainte-Foy, QuebecEmail: [email protected]
Laurens J.P. van VlietAAFC, Pacific Agri-Food Research Centre Agassiz, British ColumbiaEmail: [email protected]
Xavier VergéAAFC, Eastern Cereal and Oilseed Research CentreOttawa, OntarioEmail: [email protected]
Suzanne I. WarwickAAFC, Eastern Cereal and Oilseed Research CentreOttawa, OntarioEmail: [email protected]
Ted WeinsAAFC, Prairie Farm Rehabilitation AdministrationRegina, SaskatchewanEmail: [email protected]
Brian H. WiebeUniversity of ManitobaWinnipeg, ManitobaEmail: [email protected]
Devon WorthAAFC, Eastern Cereal and Oilseed Research CentreOttawa, OntarioEmail: [email protected]
Jingyi Y. YangAAFC, Eastern Cereal and Oilseed Research CentreOttawa, OntarioEmail: [email protected]
Xueming M. YangAAFC, Greenhouse and Processing Crops Research CentreHarrow, OntarioEmail: [email protected]
Environmental Sustainability of Canadian Agriculture: Agri-Environmental Indicator Report Series—Report #2
A report of this scope and complexity would not be possible without the ideas and support of many individuals, groups and organizations.The editors and authors of this report wish to thank the following people and groups fortheir contributions.
Members of the Steering Committee of theNational Agri-Environmental Health Analysisand Reporting Program (NAHARP), who provided the ongoing management supportrequired for program implementation as well ashelpful input and advice for various activities,including indicator development. The SteeringCommittee members are: Alexandre Lefebvre(Chair), Warren Eilers, Bruce Junkins, BryanMonette, Brook Harker, Peter Schut, and Gordon Murray.
Agriculture and Agri-Food Canada’sEnvironment Team managers and their staff,who were directly involved in all aspects of the work. The following people deserve specialmention for their support and leadership:Wayne Lindwall, Rick Butts, Gary Whitfield,Lianne Dwyer, Sherman Nelson and Scott Smithof the Research Branch; Cal Straub and AndrewCullen of the Prairie Farm RehabilitationAdministration; and Tim Marta and MichelleBrenning of the Strategic Policy Branch. Specialthanks also go to the editors (Terence McRae,Scott Smith and Joan Gregorich) and all of theauthors and co-authors (too many to list here)of the 2000 AEI report, in recognition of the factthat much of the work highlighted in this reportbuilds on—or is adapted from—that first report.
We wish to thank all those from the farmingcommunity, academe, environmental organiza-tions and government, too numerous to mentionhere, who attended the national workshops onagri-environmental indicators held in December2001 and March 2002 or participated in the peerand stakeholder reviews of the agri-environmentalindicator methods. The workshop discussions andthe comments received during the review processwere instrumental in guiding the selection anddevelopment of suitable indicators for assessingthe environmental sustainability of Canadian
agriculture. Members of the federal-provincialNational Agri-Environmental Co-ordinatingCommittee and the multi-stakeholder Agri-Environmental Advisory Committee, whichwere established to support the developmentand implementation of the Agricultural PolicyFramework, provided solid advice on the development and use of the agri-environmentalindicators. Kevin Parris, who works for theOrganisation for Economic Co-operation andDevelopment, provided a link to related workbeing done by this agency and by its membercountries.
Data processing and mapping services were provided by the Canadian Soil InformationSystem (CanSIS) group at Agriculture and Agri-Food Canada, specifically, Bryan Monette,André Villeneuve, Debbie Pagurek, DerekBrewin, Joanne McGraw and Dave Howlett. Ian Jarvis, Ted Huffman and Ryan Ogstonprocessed the Census of Agriculture enumera-tion area data for this project.
We are also grateful to all those who partici-pated in the various stages of report preparation.Stéphanie Proux of AAFC handled overall co-ordination. Robin MacKay, Lucie Beaulne,Julie Aughey, Ralph Duchesne and LorraineMorris provided production support; RégineVoyer, Karine Bazinet, Elaine Boudreault andJean-Claude Drapeau, of AAFC, helped to co-ordinate translation, as did Edith Présidentand Danielle Sénécal of the Translation Bureau,Public Works and Government Services Canada(PWGSC); Micheline Pressoir and Julie Sarrazinof the Translation Bureau handled translation;Barbara Chunn, also of the Translation Bureau,handled all the linguistic editing and her col-league, Sylvia McVicar, revised all the referencesfor accuracy. Dave Owens, Laszlo Detre, GlenSloane and François Magny provided commu-nications support; and Brenda Adams fromAccurate Design and Communications Inc. provided design services.
In the section below, the authors acknowledgethe contributions that various people made tospecific chapters of the report.
215Acknowledgments
Acknowledgments
216
Chapter 3: Driving Forces
Portions of this chapter were derived from asimilar chapter in the 2000 Report of the Agri-Environmental Indicator Project. Manythanks to Terry McRae for his contributions to that document.
Chapter 5: Linking Science to Policy
Sam Gameda is leading the development of the Land Use Allocation Model (LUAM) which is a key component for future integration of the Agri-Environmental Indicators with policy models.
Chapter 7: Farm EnvironmentalManagement Practices
Neil Rothwell and Martin Beaulieu of StatisticsCanada provided data and contributed tables from the 2001 Farm EnvironmentalManagement Survey.
Chapter 9: Nitrogen Use Efficiency
Con A. Campbell (AAFC) provided helpful suggestions on improving the nitrogen balancemethodology, along with references on nitrogenapplication rates, rotations and tillage practicesin the Prairies. K. Bruce MacDonald providedsupport for the nitrogen balance methodologyand Barry Thompson (PEI Department ofAgriculture, Fisheries and Aquaculture) provided fertilizer-N rate information for PEI.
Chapter 10: Energy Use Efficiency
Andre Hucq and Chad Wasylyniuk of theUniversity of Saskatchewan provided the 1981-1996 data and the calculation details forthe Weseen and Lindenbach (1998) work. DaveFinlayson of the Canadian Fertilizer Instituteand Chris Micek of Agrium Inc. helped securethe latest energy coefficients related to fertilizerproduction. Finally, Ewen Coxworth gavedetailed information on energy consumptionassociated with transportation which was used in deriving final fertilizer-related energycoefficients.
Chapter 11: Water Use Efficiency
Considerable thought went into the develop-ment, assessment and selection of the water use indicators. The Water Use Indicator Advisory Committee played an important role in guiding this effort and in preparing theindicator proposal and work plan. Thanks go to all the Committee members: Allan Cessna,Harvey Clark, Robert Eilers, Bruce Junkins,Alexandre Lefevbre, Isabelle Proulx and DaleTomasiewicz, of AAFC; Russ Boals ofEnvironment Canada (EC); Sietan Chieng of the University of British Columbia; Jean Louis Daigle of the Eastern Canada Soil andWater Conservation Centre; Jean-MarcelLaferriere and Aly Shady of the CanadianInternational Development Agency; BrentPaterson of Alberta Agriculture, Food and Rural Development; Rebecca Shortt of theOntario Ministry of Agriculture and Food; Suren Kulshthreshtha of the University ofSaskatchewan; and Chandra Madramootoo of the Brace Centre for Water ResourcesManagement, McGill University. MarleneMartinson of AAFC handled arrangements for meetings, conferences and travel.
Chapter 13: Soil Erosion
A) Water ErosionThanks are due to the following AAFC staff:Derek Brewin for his invaluable programmingsupport; Ken Webb, Delmar Holmstrom, Jean-Marc Cossette, David Kroetsch, Robert Eilers,Tony Brierley and Elizabeth Kenney for provid-ing data and assisting with data interpretation.
B) Wind ErosionPaul Krug, consultant, Balcarres, Saskatchewan,provided research assistance. Malcolm Black andDennis Haak of the Prairie Farm RehabilitationAdministration reviewed the chapter and pro-vided critical comments and editorial suggestions.
C) Tillage ErosionGuy Mehuys, Dan Pennock and Tom Schumacher,for their participation in this indicator project;Laurens Van Vliet, Derek Brewin and BryanMonette, for their technical assistance; and Herb Rees, Warren Eilers, Robert Eilers, TonyBrierley, Alexandre Lefebvre and Scott Smith, for their support.
Environmental Sustainability of Canadian Agriculture: Agri-Environmental Indicator Report Series—Report #2
217Acknowledgments
Chapter 15: Soil Salinity
Glenn Lelyk (AAFC) provided valuable GIS and data analysis support for this chapter. TomGoddard and Frank Hecker (Alberta Agriculture),Peter Haluschak and Glen Podolsky (ManitobaAgriculture), and Harold Steppuhn (AAFC) provided useful comments on the updated salinity map used to calculate the indicator.
Chapter 17: Nitrogen
Sam Gameda (AAFC) provided the daily ecodistrict climate database.
Chapter 18: Phosphorus
K. Bruce MacDonald, Martin Bolinder andSuzanne Beauchemin provided technical information for the first version of this indica-tor. Jean-Marc Cossette assisted with GIS dataprocessing. Luc Lamontagne and Michel Nolincontributed their expertise in pedology to thepairing of soil attributes with the GIS database.Yves Lefebvre and Richard Beaulieu of Quebec’sMinistère du Développement durable, del’Environnement et des Parcs and MartinBolinder, Luc Lamontagne and Jean-MarcCossette of AAFC, commented on a preliminaryversion of this chapter. Nadia Goussard partici-pated in the indicator development process andprovided suggestions for future enhancement.
Chapter 19: Pesticides
The participants in the March 2004 IROWC-Pestworkshop played an instrumental role in develop-ing the approach used in this indicator. Theywere: Reinder DeJong, Robert Eilers, Warren Eilers,Colleen Hyslop, Alexandre Lefebvre, ElizabethPattey, Georges Thériault Eric Van Bochove andTom Wolf (AAFC); Clair Murphy and Jane Elliot(Environment Canada); Jacques Drolet and RegiMathew (Pest Management Regulatory Agency);Esther Salvano (University of Manitoba); SuzanneAllaire (Université Laval); and K. Bruce Murray(Manitoba Agriculture and Food).
Chapter 21: Greenhouse Gases
Many colleagues across Canada assisted in thecalculation of greenhouse gas emissions. Wewould especially like to acknowledge ChangLiang of Environment Canada for his valuablecomments, as well as the AAFC Model Farm andNCGAVS (National Soil Carbon and GreenhouseGas Accounting and Verification System) teams,for their ongoing efforts to develop and improvethe national and regional emission factors.Financial assistance was received from the Panelon Energy Research and Development of NaturalResources Canada.
Chapter 22: Ammonia
The authors would like to thank Sven G. Sommer, of the Danish Institute ofAgricultural Sciences, for his valuable assistance and Jim Webb, ADAS,Wolverhampton, UK, for providing the NARSES model.
Chapter 23: Particulate Matter
Tanya Bradley of Masterloy Products, Ottawa, Ontario co-authored the scoping report on particulate matter.
Chapter 24: Wildlife Habitat on Farmland
We appreciate the contributions of Erin andPeter Neave (Neave Resource Management) to the development and enhancement of theWildlife Habitat Capacity Indicator. Lisa Toulen(Environment Canada) provided valuable speciesdistribution data. Helpful reviews and commentswere provided by Cathy Neilsen (OntarioMinistry of Natural Resources), Alain Baril andCarolyn O’Neill (Environment Canada), GeorgeHamilton, Chris Shank, Dave Prescott, HarryStelfox, Terry Kosinski John Tackaberry (AlbertaSustainable Resource Development), AmandaManuel (Keystone Agriculture Producers), KarlaGuyn (Ducks Unlimited Canada) and MichaelWatmough (Environment Canada).
218
We also extend our thanks to the following people for their valuable input: Troy Riche,Lawrence Townley-Smith, Ute Holweger, JamieHewitt, Lori Heigh, Doug Chekay, HeatherWiebe, Catherine Fox and Guy Baillargeon(AAFC); Brenda Dale, Benoit Jobin, Risa Smithand Michele Williamson (Environment Canada);Lyle Boychuk, Ken Lumbis and Gregg Brewster(Ducks Unlimited Canada); Randy Milton (NovaScotia Department of Natural Resources); LowellStrauss (Nature Conservancy of Canada); and EdWiken (Wildlife Habitat Canada).
Chapter 25: Wildlife Damage to Crops and Livestock
We appreciate the contributions of LucieBourque, Lori Heigh, J. Andrea Tanaka, BobVernon and Ian Campbell (AAFC), along withWilliam McBride (private consultant) andMichele Williamson (Environment Canada) tothe development of the Wildlife DamageIndicator. Valuable reviews and comments wereprovided by Cathy Neilsen (Ontario Ministry of Natural Resources), Ken Belcher (University of Saskatchewan), Mike Gollop (SaskatchewanEnvironment), Pat Rakowski (EnvironmentCanada), Pierre Brousseau (EnvironmentCanada), Pamela Martin (Environment Canada), Amanda Manuel (Keystone AgricultureProducers), Michael Langman (Nova ScotiaAgriculture and Fisheries), to Hugh Berges(Ontario Ministry of Agriculture and Food) andGary Coghill (Saskatchewan Agriculture, Foodand Rural Revitalization). We also wish to thankthe following people for their participation inthe 2004 wildlife damage workshop: C. CormackGates (University of Calgary) and Glen Parson(Nova Scotia Department of Natural Resources).
Chapter 27: Soil Biodiversity
Thanks are due for the valuable contributions of the Soil Biodiversity Indicator team members(Ian Jarvis, Valérie Behan-Pelletier, YolandeDalpé, Jill Clapperton, Danielle Prévost, DavidLapen (AAFC); along with Monika Joschko,
Peter Lentzsch and Marion Tauschke (Leibniz-Centre for Agricultural Landscape and Land Use Research, [ZALF], Müncheberg, Germany) tothe development of the conceptual framework.Special thanks go to Ian Jarvis, GermarieBalactico, Thierry Fisette, Pierre-Yves Gasser,Bahram Daneshfar and Greg Gibbons (AAFCREIS team, Ottawa) for GIS support for theproof-of-concept model.
Chapter 28, 29 and 30: Food and Beverage Industry
The authors are also very grateful to GlendaTaylor and Jessica Norup (Office of EnergyEfficiency, Natural Resources Canada), alongwith Mihaela Andronescu (EnvironmentCanada), for their valuable assistance in review-ing the project proposal and several manuscriptsand questionnaires. The authors gratefullyacknowledge the advice provided by BrunoPépin (Statistics Canada), Nathalie Trudeau(Office of Energy Efficiency, Natural ResourcesCanada) and John Nyboer (Canadian IndustrialEnergy End-use Data and Analysis Centre,Energy and Materials Research Group) for thedevelopment of the energy and GHG indicatorsand for improving the text content and formatthrough their comments and proofreading work.The authors extend their thanks to SophieTaillefer (Recyc-Québec) for providing publisheddata and for helping to write the manuscript on the organic solid residues and packagingindicators. Thanks are also extended to MartinLemire (Natural Resources and Waste Accounts,Statistics Canada) and Michel Villeneuve(Sustainable Water Use Branch, EnvironmentCanada) for their valuable input on the waterand wastewater indicators. Finally, the authorsare very grateful for advice and commentsreceived throughout the project from represen-tatives of selected food and beverage companies.
Environmental Sustainability of Canadian Agriculture: Agri-Environmental Indicator Report Series—Report #2

219
Notes

220
Notes