Embed Size (px)
Citation preview
ENVIRONMENTAL SENTINEL BIOMONITOR TECHNOLOGY ASSESSMENT
ECBC-TR-1074
Scott Kooistra John Walther
DIRECTORATE OF PROGRAM INTEGRATION
September 2013
Approved for public release; distribution is unlimited.
Disclaimer The findings in this report are not to be construed as an official Department of the Army position unless so designated by other authorizing documents.
REPORT DOCUMENTATION PAGE Form Approved
OMB No. 0704-0188 Public reporting burden for this collection of information is estimated to average 1 hour per response, including the time for reviewing instructions, searching existing data sources, gathering and maintaining the data needed, and completing and reviewing this collection of information. Send comments regarding this burden estimate or any other aspect of this collection of information, including suggestions for reducing this burden to Department of Defense, Washington Headquarters Services, Directorate for Information Operations and Reports (0704-0188), 1215 Jefferson Davis Highway, Suite 1204, Arlington, VA 22202-4302. Respondents should be aware that notwithstanding any other provision of law, no person shall be subject to any penalty for failing to comply with a collection of information if it does not display a currently valid OMB control number. PLEASE DO NOT RETURN YOUR FORM TO THE ABOVE ADDRESS.
1. REPORT DATE (DD-MM-YYYY)
XX-09-2013 2. REPORT TYPE
Final 3. DATES COVERED (From - To)
Sep 2009 – Aug 2010 4. TITLE AND SUBTITLE
Environmental Sentinel Biomonitor Technology Assessment
5a. CONTRACT NUMBER
5b. GRANT NUMBER
5c. PROGRAM ELEMENT NUMBER
6. AUTHOR(S)
Kooistra, Scott; and Walther, John
5d. PROJECT NUMBER
5e. TASK NUMBER
5f. WORK UNIT NUMBER
7. PERFORMING ORGANIZATION NAME(S) AND ADDRESS(ES)
Director, ECBC, ATTN: RDCB-DPB-DA, APG, MD 21010-5424
8. PERFORMING ORGANIZATION REPORT NUMBER
ECBC-TR-1074
9. SPONSORING / MONITORING AGENCY NAME(S) AND ADDRESS(ES)
U.S. Army Center for Environmental Health Research, 568 Doughten Drive,
Fort Detrick, MD 21702-5010
10. SPONSOR/MONITOR’S ACRONYM(S)
USACEHR
11. SPONSOR/MONITOR’S REPORT NUMBER(S)
12. DISTRIBUTION / AVAILABILITY STATEMENT
Approved for public release; distribution is unlimited.
13. SUPPLEMENTARY NOTES
14. ABSTRACT-LIMIT 200 WORDS
The U.S. Army Center for Environmental Health Research, with support from the U.S. Army Medical Research and Materiel
Command, is developing an Environmental Sentinel Biomonitor (ESB) system to provide rapid toxicity identification for a
broad spectrum of chemicals in water. A critical initial phase of the study was to test and evaluate toxicity sensor
technologies (also called ESB system technologies). Because there were a number of potentially feasible technologies that
could meet the goals of the ESB program, a downselection was performed to evaluate these technologies and select the most
promising technologies for further development as part of an ESB system. The methodology and process to complete the
downselection was developed with user representatives and technology experts. The methods and processes used produce
repeatable, defensible, and justifiable investment decisions.
15. SUBJECT TERMS
Environmental Sentinel Biomonitor Concept of operations Water monitoring
Multi-attribute utility decision model Toxicity sensor technology Human lethal dose
Short-term military exposure guidelines Rapid toxicity identification Decision analysis
Toxic industrial chemicals and materials Threshold requirement Downselect
16. SECURITY CLASSIFICATION OF:
17. LIMITATION OF ABSTRACT
18. NUMBER OF PAGES
19a. NAME OF RESPONSIBLE PERSON
Renu B. Rastogi a. REPORT
U
b. ABSTRACT
U
15. SUBJECT TERMS
U
UU
70
19b. TELEPHONE NUMBER (include area
code)
(410) 436-7545 Standard Form 298 (Rev. 8-98)
Prescribed by ANSI Std. Z39.18

ii
Blank
iii
PREFACE
The work described in this report was completed with support from the U.S.
Army Medical Research and Materiel Command. The work described in this report was started
in September 2009 and completed in August 2010.
This final report was prepared in response to a request from the U.S. Army Center
for Environmental Health Research (USACEHR) to develop a methodology to evaluate
Environmental Sentinel Biomonitor (ESB) technologies and then to evaluate and downselect the
most appropriate ESB technologies to further develop into an ESB system.
The use of either trade or manufacturers’ names in this report does not constitute
an official endorsement of any commercial products. This report may not be cited for purposes
of advertisement.
This report has been approved for public release.

iv
Blank
v
CONTENTS
1. OVERVIEW ............................................................................................................ 1
1.1 Introduction ....................................................................................................... 1
1.2 Background ....................................................................................................... 1
1.3 Program Objectives ........................................................................................... 2
1.4 Assessment Process Overview .......................................................................... 2
2. ASSESSMENT PROCESS AND RESULTS ......................................................... 3
2.1 Study/Assessment Team Formed ...................................................................... 3
2.2 Technical Requirements Defined ...................................................................... 3
2.3 Selected and Defined Target-Detection Range ................................................. 3
2.4 Identified ESB Technology Candidates ............................................................ 4
2.5 Quantitative Evaluation Model Developed ....................................................... 5
2.6 Analysis of Results .......................................................................................... 10
2.6.1 Overall Results .......................................................................................... 11
2.6.2 Technology Analysis ................................................................................. 13
2.6.3 Measure Analysis ...................................................................................... 15
3. CONCLUSIONS ................................................................................................... 17
4. RECOMMENDATIONS ...................................................................................... 17
5. POST-ASSESSMENT TECHNOLOGY EVALUATIONS ................................. 18
ACRONYMS AND ABBREVIATIONS ............................................................. 21
APPENDICES:
A: TRL DEFINITIONS ................................................................................. 23
B: ESB SYSTEM TECHNOLOGY ASSESSMENT IPT ............................. 25
C: ESB SYSTEM TECHNOLOGY ASSESSMENT
EXPERT PANEL TEAM .......................................................................... 27
D: ESB SYSTEM CONCEPT OF OPERATIONS ........................................ 29
E: ESB SYSTEM TECHNICAL REQUIREMENTS ................................... 31
F: ADDITIONAL INFORMATION ON MEGS .......................................... 35
vi
G: ESB SYSTEM CANDIDATE AND
WATCH-LISTED TECHNOLOGIES ...................................................... 37
H: EXAMPLE OF AN ESB TECHNOLOGY FACT SHEET ...................... 39
I: COMPARISON OF ESB SYSTEM TECHNICAL
REQUIREMENTS TO DECISION MODEL
GOALS AND CRITERIA ........................................................................ 43
J: ESB SYSTEM PROGRAMMATICS ASSESSMENT ............................ 51
K: ESB SYSTEM TECHNOLOGY STRENGTHS AND
WEAKNESSES ANALYSIS CHARTS ................................................... 53
vii
FIGURES
1. Test Turn-Around Time measure utility curve example .......................................... 6
2. ESB technology downselection decision model ..................................................... 7
3. Overall assessment of goal scores for ESB technologies ...................................... 12
4. Overall assessment of measure scores for ESB technologies ............................... 12
5. Technology strengths and weaknesses analysis chart for the
ECIS (Trout Gill) example .................................................................................... 15
TABLES
1. ESB Technologies ................................................................................................... 4
2. Rating Scheme for Measures Example ................................................................... 5
3. Model Measure Definitions, Performance Scales, and Weights ............................. 8
4. ECIS (EelB) Technology Programmatic Assessment Example ............................ 10
5. Technology Strengths and Weaknesses Analysis Narrative Summaries .............. 13
6. Measure Analysis .................................................................................................. 16

viii
Blank
1
ENVIRONMENTAL SENTINEL BIOMONITOR
TECHNOLOGY ASSESSMENT
1. OVERVIEW
The Environmental Sentinel Biomonitor (ESB) system downselection process was
conducted in FY09–FY10.* An initial assessment, completed in July 2010, was followed by a
collection of additional technical data for six of the highest scoring ESB technologies to support a
final selection of the technologies for the ESB. Although this report focuses on the initial
technology assessment, the results of the final toxicity selection process are also summarized.
1.1 Introduction
The U.S. Army Center for Environmental Health Research (USACEHR), with
support and funding from the U.S. Army Medical Research and Materiel Command, is developing
an ESB system to provide rapid toxicity identification for a broad spectrum of chemicals in water.
The focus of the ESB system is to detect toxicity associated with non-militarized chemicals (i.e.,
toxic industrial chemicals [TICs] and toxic industrial materials [TIMs]) in Army field drinking
water.
A critical initial phase of this research is to test and evaluate ESB technologies.
There are a number of potentially feasible technologies that could meet the goals of the ESB
program, so a downselection was performed to evaluate these technologies and select the most
promising ones for further development.
1.2 Background
Deployed U.S. forces face the possibility of drinking water exposed to a wide range
of toxic industrial or agricultural chemicals as a result of normal use (e.g., farm run-off), damaged
infrastructures, accidental spills, or deliberate chemical contamination of water. This is true even
with water treated with a reverse osmosis-based treatment system; although highly effective at
removing most chemicals, reverse osmosis technology is not 100% effective. Chemicals that are
present in high concentrations in source water may not be removed to a level sufficient for safe
drinking.
Currently, there are no rapid-detection capabilities for the thousands of TICs that
soldiers could ingest. Preventative medicine (PM) personnel test water using the water quality
analysis set-PM (WQAS-PM). Unfortunately, the WQAS-PM tests for only a few chemicals.
Comprehensive tests for TICs require water samples to be sent to a laboratory and can take days to
weeks to process.
* A similar type of assessment was completed in FY04–05. The report for this assessment was: Kooistra, S.;
Walther., J; Wurster, L.; Environmental Sentinel Biomonitor (ESB) System Technology Assessment; ECBC-TR-
517; U.S. Army Edgewood Chemical Biological Center: Aberdeen Proving Ground, MD, 2006; UNCLASSIFIED
Report (AD-A463 721).
2
Toxicity sensors are available that integrate biological systems with electronic
monitoring, which facilitates a rapid response to developing toxicity in water. The ESB system will
be used to monitor responses of biological components (e.g., enzymes, cells, tissues, or whole
organisms) exposed to water and provide rapid responses and warnings should toxic conditions be
present. The ESB system is intended to complement available PM field-testing methods.
1.3 Program Objectives
The ESB program will incorporate current toxicity sensor technologies into a system
having the size, weight, and logistical characteristics that are suitable for a range of Army
requirements. The ESB will also complement current chemical-monitoring systems and provide
rapid toxicity identification for a broad spectrum of chemicals in Army field drinking water
supplies. Specifically, the ESB system is to be used by PM personnel as part of the currently used
WQAS-PM. The optimal system may be a complementary set of toxicity sensors, which would
provide the following:
Rapid response: Required response time should be within 8 h.
Sensitivity: One ESB technology may not adequately detect all TICs/TIMs.
The assessment will consider which ESB technology provides the best
overall response to the test chemicals, and which set of technologies can
complement each other by filling gaps in the toxicity response of individual
technologies and by providing mutual confirmation of a toxic response.
The ESB prototype system was to be developed to a technology readiness level
(TRL) 6 by December 2012 (see Appendix A for descriptions of TRLs).
1.4 Assessment Process Overview
A decision analysis-based methodology was developed to conduct the ESB system
downselection. Decision analysis is a structured process for decision-making based on established
principles of operations research. The decision analysis process includes systematic development
and examination of alternative courses of action to define and clarify available choices and
associated advantages and disadvantages. It also includes the thorough documentation of results
and associated rationale so that final recommendations can be readily explained and defended. The
study consisted of five phases:
1. Form the study and assessment team.
2. Define the technical requirements of ESB system.
3. Identify the candidate ESB technologies and collect the required data.
4. Develop an assessment model.
5. Analyze the results.
3
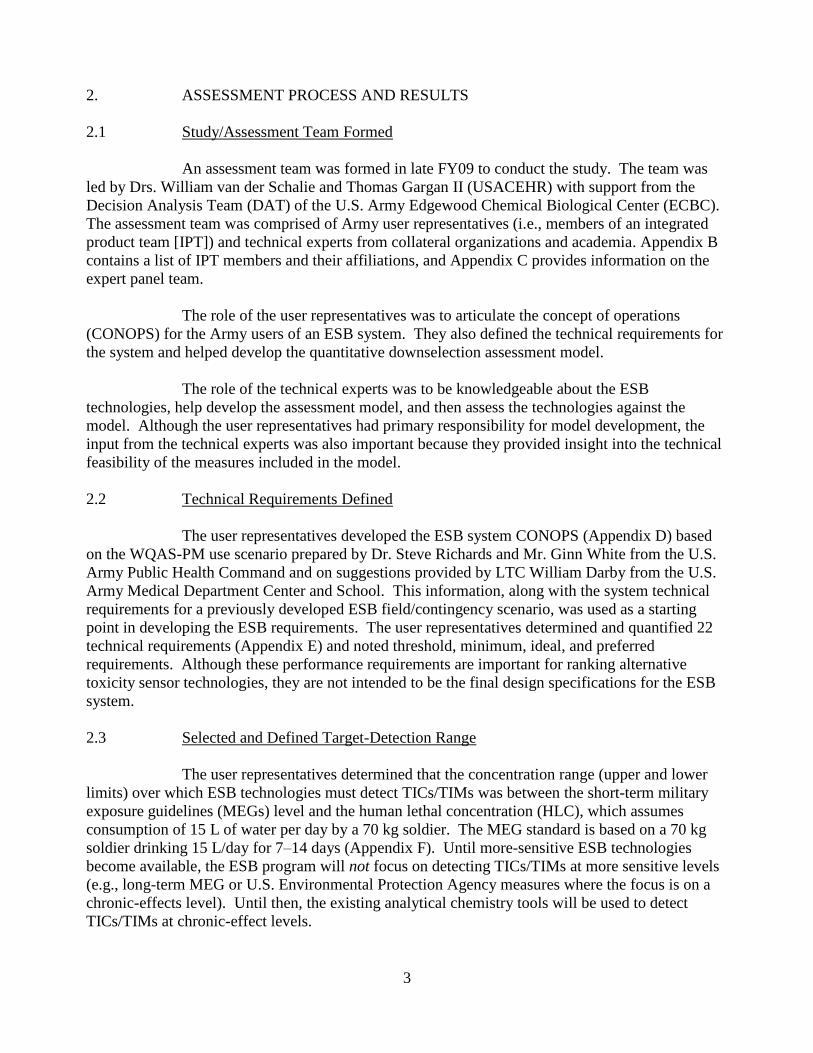
2. ASSESSMENT PROCESS AND RESULTS
2.1 Study/Assessment Team Formed
An assessment team was formed in late FY09 to conduct the study. The team was
led by Drs. William van der Schalie and Thomas Gargan II (USACEHR) with support from the
Decision Analysis Team (DAT) of the U.S. Army Edgewood Chemical Biological Center (ECBC).
The assessment team was comprised of Army user representatives (i.e., members of an integrated
product team [IPT]) and technical experts from collateral organizations and academia. Appendix B
contains a list of IPT members and their affiliations, and Appendix C provides information on the
expert panel team.
The role of the user representatives was to articulate the concept of operations
(CONOPS) for the Army users of an ESB system. They also defined the technical requirements for
the system and helped develop the quantitative downselection assessment model.
The role of the technical experts was to be knowledgeable about the ESB
technologies, help develop the assessment model, and then assess the technologies against the
model. Although the user representatives had primary responsibility for model development, the
input from the technical experts was also important because they provided insight into the technical
feasibility of the measures included in the model.
2.2 Technical Requirements Defined
The user representatives developed the ESB system CONOPS (Appendix D) based
on the WQAS-PM use scenario prepared by Dr. Steve Richards and Mr. Ginn White from the U.S.
Army Public Health Command and on suggestions provided by LTC William Darby from the U.S.
Army Medical Department Center and School. This information, along with the system technical
requirements for a previously developed ESB field/contingency scenario, was used as a starting
point in developing the ESB requirements. The user representatives determined and quantified 22
technical requirements (Appendix E) and noted threshold, minimum, ideal, and preferred
requirements. Although these performance requirements are important for ranking alternative
toxicity sensor technologies, they are not intended to be the final design specifications for the ESB
system.
2.3 Selected and Defined Target-Detection Range
The user representatives determined that the concentration range (upper and lower
limits) over which ESB technologies must detect TICs/TIMs was between the short-term military
exposure guidelines (MEGs) level and the human lethal concentration (HLC), which assumes
consumption of 15 L of water per day by a 70 kg soldier. The MEG standard is based on a 70 kg
soldier drinking 15 L/day for 7–14 days (Appendix F). Until more-sensitive ESB technologies
become available, the ESB program will not focus on detecting TICs/TIMs at more sensitive levels
(e.g., long-term MEG or U.S. Environmental Protection Agency measures where the focus is on a
chronic-effects level). Until then, the existing analytical chemistry tools will be used to detect
TICs/TIMs at chronic-effect levels.

4
The user representatives felt that the ESB technologies should detect toxicity
concentrations closer to the short-term MEG level than the HLC level and that the minimum-
detection level must be below the HLC. In addition, detecting toxicity below the short-term MEG
level was not desirable because this may have resulted in false positive readings.
2.4 Identified ESB Technology Candidates
After extensive research, 16 possible ESB technologies were initially identified,
discussed, and confirmed by the technical experts as technologies to consider (Appendix G). Later,
6 of the 16 technologies were removed from consideration (also listed in Appendix G) because the
team determined that the technologies were not sufficiently developed to meet the ESB program
requirement to achieve a TRL 6 by December 2012. The 10 technologies to be considered further
are listed in Table 1, which also provides a correlation between the proper or full ESB name and the
abbreviated ESB name. Note, for the most part, only the abbreviated ESB name is used in this
report.
The team determined that there was initially insufficient toxicity response
information for a thoroughly comparative assessment of the ESB technologies. Therefore, Dr. van
der Schalie directed additional research and testing to acquire this information. Information fact
sheets that encompass performance, operational, and logistical information were then created to
provide supplemental information to help with the technology assessment (Appendix H provides an
example).
Table 1. ESB Technologies
Abbreviation Full ESB Name
Abraxis Abraxis (Warminster, PA) organophosphate/carbanate screen
ANP ANP (ANP Technologies; Newark, DE) acetylcholinesterase test
kit
Bionas Bionas (Bionas GmbH; Rostock-Warnemünde, Germany)
toxicity sensor (trout gill)
ECIS (EelB) Electric cell–substrate impedance-sensing (ECIS) using
vertebrate cells (eel brain)
ECIS (Trout Gill) Electric cell–substrate impedance-sensing (ECIS) using
vertebrate cells (trout gill)
Eclox Enhanced chemiluminescence and oxyradical (Eclox; Hach
Company; Loveland, CO) toxicity test
Melanophore Melanophore toxicity sensor
Microtox and Deltatox Microtox and Deltatox (Modern Water; New Castle, DE)
Toxichip Toxichip (bacterial cells)
TOX-SPOT TOX-SPOT (CheckLight Ltd.; Qiryat-Tiv, Israel) toxicity test
5
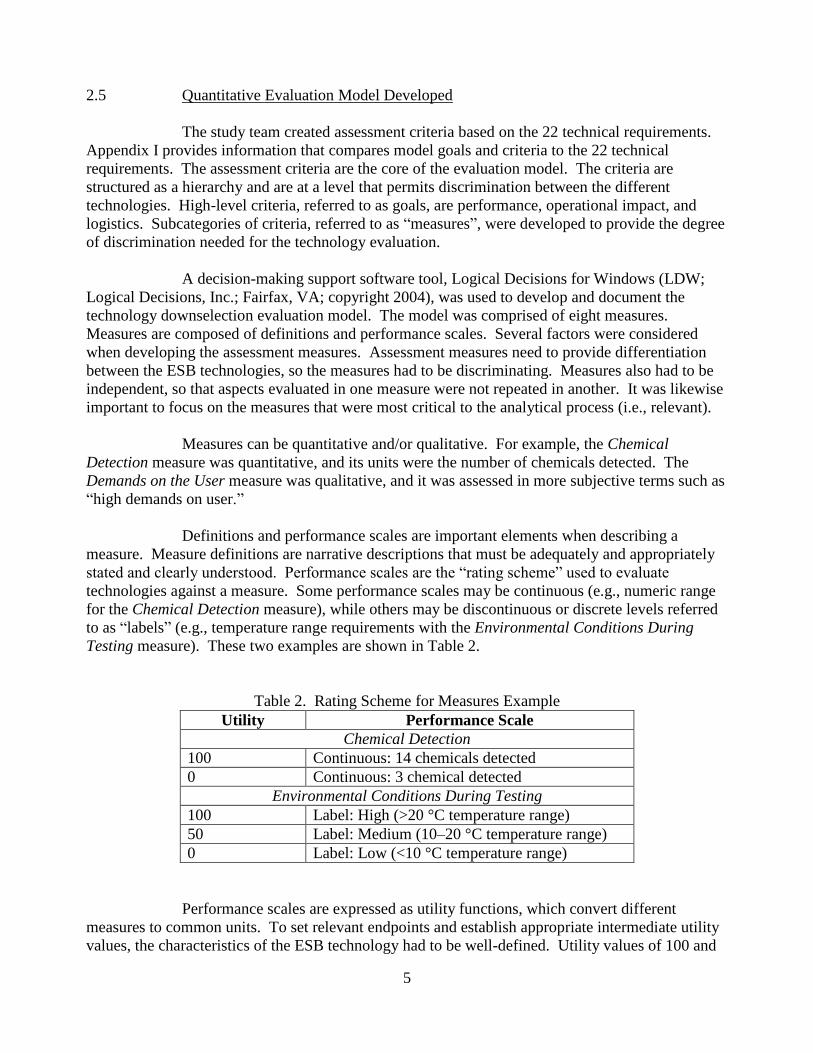
2.5 Quantitative Evaluation Model Developed
The study team created assessment criteria based on the 22 technical requirements.
Appendix I provides information that compares model goals and criteria to the 22 technical
requirements. The assessment criteria are the core of the evaluation model. The criteria are
structured as a hierarchy and are at a level that permits discrimination between the different
technologies. High-level criteria, referred to as goals, are performance, operational impact, and
logistics. Subcategories of criteria, referred to as “measures”, were developed to provide the degree
of discrimination needed for the technology evaluation.
A decision-making support software tool, Logical Decisions for Windows (LDW;
Logical Decisions, Inc.; Fairfax, VA; copyright 2004), was used to develop and document the
technology downselection evaluation model. The model was comprised of eight measures.
Measures are composed of definitions and performance scales. Several factors were considered
when developing the assessment measures. Assessment measures need to provide differentiation
between the ESB technologies, so the measures had to be discriminating. Measures also had to be
independent, so that aspects evaluated in one measure were not repeated in another. It was likewise
important to focus on the measures that were most critical to the analytical process (i.e., relevant).
Measures can be quantitative and/or qualitative. For example, the Chemical
Detection measure was quantitative, and its units were the number of chemicals detected. The
Demands on the User measure was qualitative, and it was assessed in more subjective terms such as
“high demands on user.”
Definitions and performance scales are important elements when describing a
measure. Measure definitions are narrative descriptions that must be adequately and appropriately
stated and clearly understood. Performance scales are the “rating scheme” used to evaluate
technologies against a measure. Some performance scales may be continuous (e.g., numeric range
for the Chemical Detection measure), while others may be discontinuous or discrete levels referred
to as “labels” (e.g., temperature range requirements with the Environmental Conditions During
Testing measure). These two examples are shown in Table 2.
Table 2. Rating Scheme for Measures Example
Utility Performance Scale
Chemical Detection
100 Continuous: 14 chemicals detected
0 Continuous: 3 chemical detected
Environmental Conditions During Testing
100 Label: High (>20 °C temperature range)
50 Label: Medium (10–20 °C temperature range)
0 Label: Low (<10 °C temperature range)
Performance scales are expressed as utility functions, which convert different
measures to common units. To set relevant endpoints and establish appropriate intermediate utility
values, the characteristics of the ESB technology had to be well-defined. Utility values of 100 and
6
0 were assigned to the high and low ends of each performance scale, and intermediate-level utilities
were derived through various elicitation techniques that focused on the relative importance of
moving to-and-from various points on the utility function.
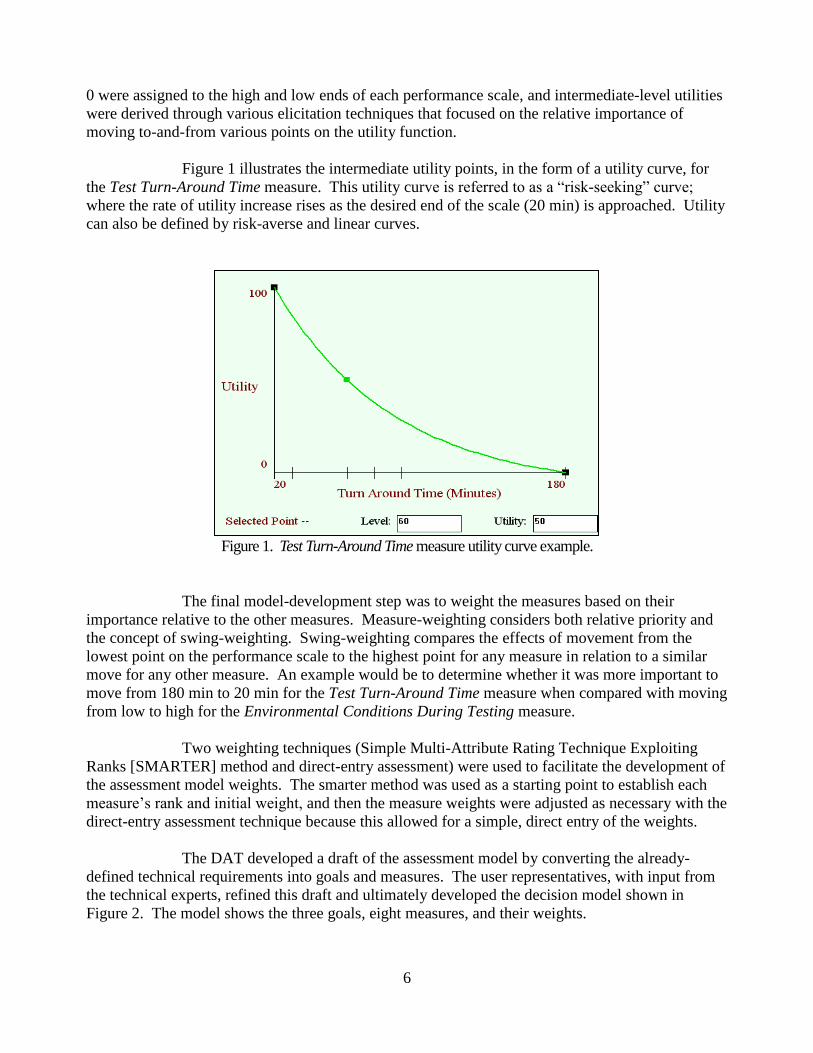
Figure 1 illustrates the intermediate utility points, in the form of a utility curve, for
the Test Turn-Around Time measure. This utility curve is referred to as a “risk-seeking” curve;
where the rate of utility increase rises as the desired end of the scale (20 min) is approached. Utility
can also be defined by risk-averse and linear curves.
Figure 1. Test Turn-Around Time measure utility curve example.
The final model-development step was to weight the measures based on their
importance relative to the other measures. Measure-weighting considers both relative priority and
the concept of swing-weighting. Swing-weighting compares the effects of movement from the
lowest point on the performance scale to the highest point for any measure in relation to a similar
move for any other measure. An example would be to determine whether it was more important to
move from 180 min to 20 min for the Test Turn-Around Time measure when compared with moving
from low to high for the Environmental Conditions During Testing measure.
Two weighting techniques (Simple Multi-Attribute Rating Technique Exploiting
Ranks [SMARTER] method and direct-entry assessment) were used to facilitate the development of
the assessment model weights. The smarter method was used as a starting point to establish each
measure’s rank and initial weight, and then the measure weights were adjusted as necessary with the
direct-entry assessment technique because this allowed for a simple, direct entry of the weights.
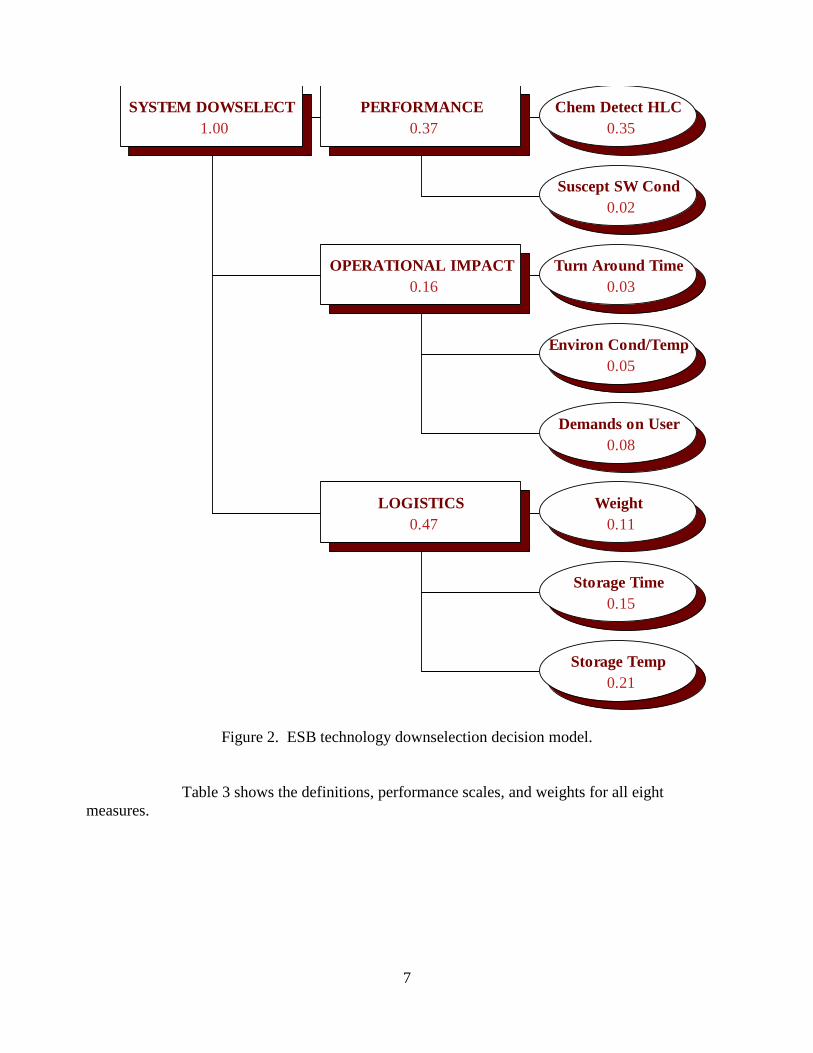
The DAT developed a draft of the assessment model by converting the already-
defined technical requirements into goals and measures. The user representatives, with input from
the technical experts, refined this draft and ultimately developed the decision model shown in
Figure 2. The model shows the three goals, eight measures, and their weights.
7
Figure 2. ESB technology downselection decision model.
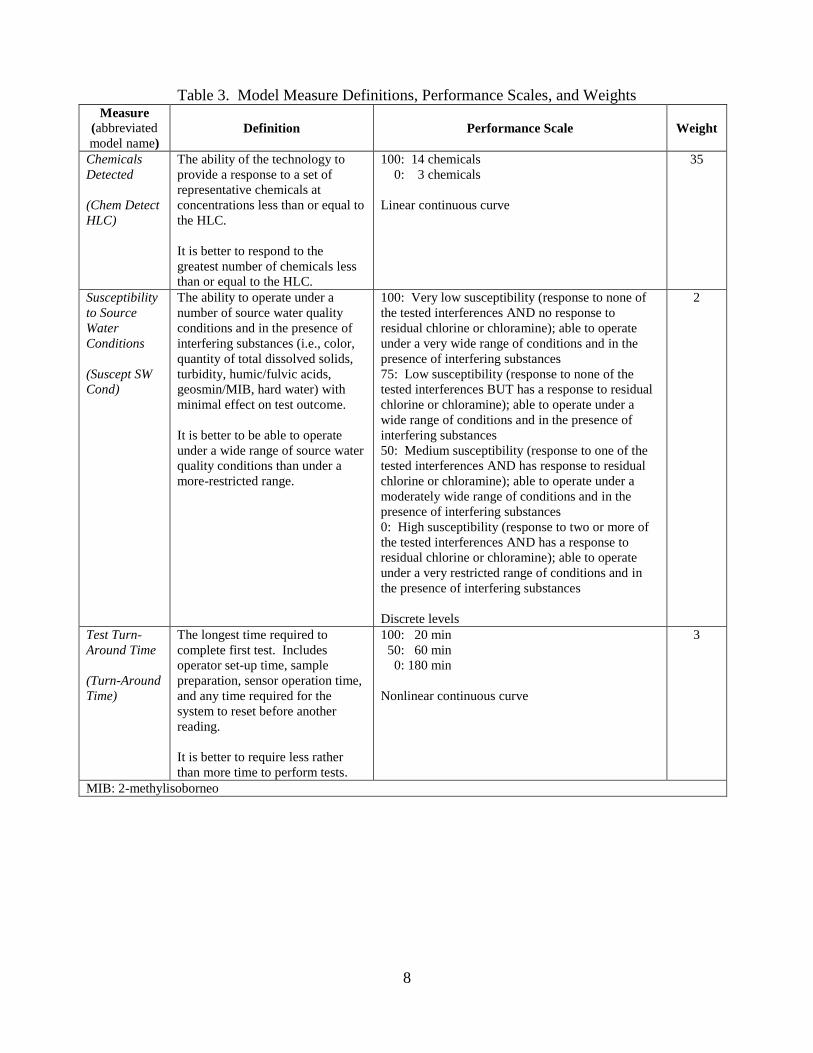
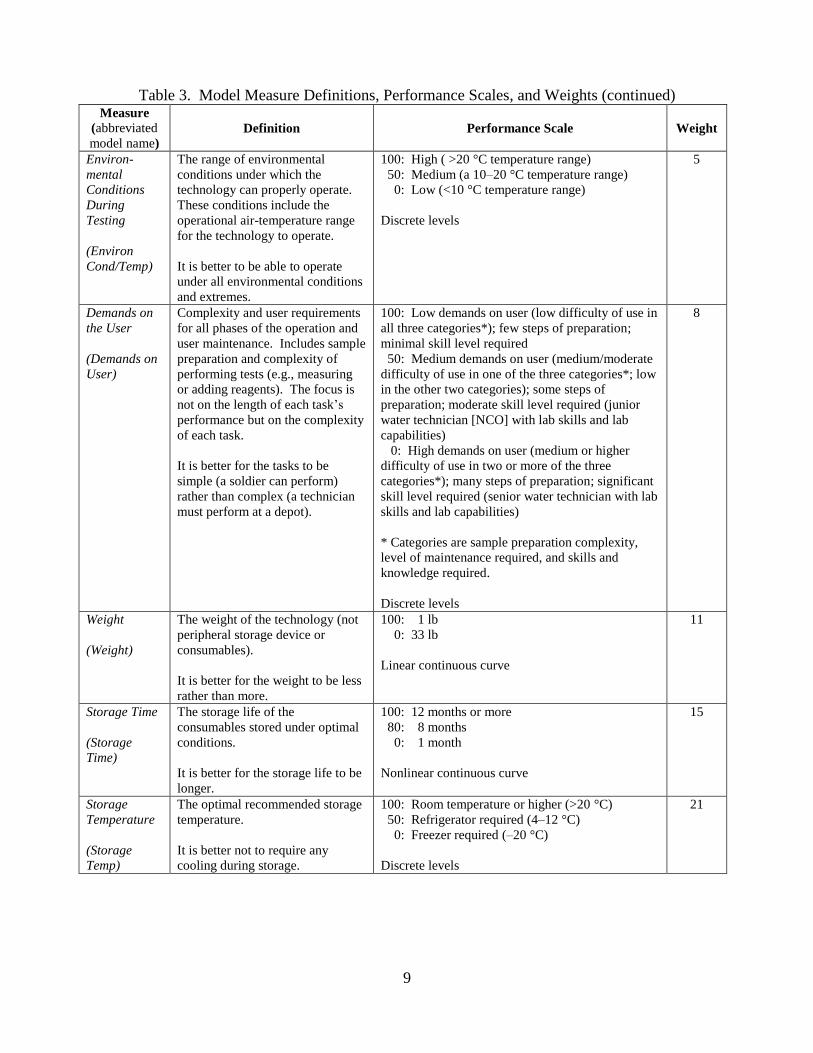
Table 3 shows the definitions, performance scales, and weights for all eight
measures.
Chem Detect HLC
0.35
Suscept SW Cond
0.02
PERFORMANCE
0.37
Turn Around Time
0.03
Environ Cond/Temp
0.05
Demands on User
0.08
OPERATIONAL IMPACT
0.16
Weight
0.11
Storage Time
0.15
Storage Temp
0.21
LOGISTICS
0.47
SYSTEM DOWSELECT
1.00
8
Table 3. Model Measure Definitions, Performance Scales, and Weights Measure
(abbreviated
model name)
Definition Performance Scale Weight
Chemicals
Detected
(Chem Detect
HLC)
The ability of the technology to
provide a response to a set of
representative chemicals at
concentrations less than or equal to
the HLC.
It is better to respond to the
greatest number of chemicals less
than or equal to the HLC.
100: 14 chemicals
0: 3 chemicals
Linear continuous curve
35
Susceptibility
to Source
Water
Conditions
(Suscept SW
Cond)
The ability to operate under a
number of source water quality
conditions and in the presence of
interfering substances (i.e., color,
quantity of total dissolved solids,
turbidity, humic/fulvic acids,
geosmin/MIB, hard water) with
minimal effect on test outcome.
It is better to be able to operate
under a wide range of source water
quality conditions than under a
more-restricted range.
100: Very low susceptibility (response to none of
the tested interferences AND no response to
residual chlorine or chloramine); able to operate
under a very wide range of conditions and in the
presence of interfering substances
75: Low susceptibility (response to none of the
tested interferences BUT has a response to residual
chlorine or chloramine); able to operate under a
wide range of conditions and in the presence of
interfering substances
50: Medium susceptibility (response to one of the
tested interferences AND has response to residual
chlorine or chloramine); able to operate under a
moderately wide range of conditions and in the
presence of interfering substances
0: High susceptibility (response to two or more of
the tested interferences AND has a response to
residual chlorine or chloramine); able to operate
under a very restricted range of conditions and in
the presence of interfering substances
Discrete levels
2
Test Turn-
Around Time
(Turn-Around
Time)
The longest time required to
complete first test. Includes
operator set-up time, sample
preparation, sensor operation time,
and any time required for the
system to reset before another
reading.
It is better to require less rather
than more time to perform tests.
100: 20 min
50: 60 min
0: 180 min
Nonlinear continuous curve
3
MIB: 2-methylisoborneo
9
Table 3. Model Measure Definitions, Performance Scales, and Weights (continued) Measure
(abbreviated
model name)
Definition Performance Scale Weight
Environ-
mental
Conditions
During
Testing
(Environ
Cond/Temp)
The range of environmental
conditions under which the
technology can properly operate.
These conditions include the
operational air-temperature range
for the technology to operate.
It is better to be able to operate
under all environmental conditions
and extremes.
100: High ( >20 °C temperature range)
50: Medium (a 10–20 °C temperature range)
0: Low (<10 °C temperature range)
Discrete levels
5
Demands on
the User
(Demands on
User)
Complexity and user requirements
for all phases of the operation and
user maintenance. Includes sample
preparation and complexity of
performing tests (e.g., measuring
or adding reagents). The focus is
not on the length of each task’s
performance but on the complexity
of each task.
It is better for the tasks to be
simple (a soldier can perform)
rather than complex (a technician
must perform at a depot).
100: Low demands on user (low difficulty of use in
all three categories*); few steps of preparation;
minimal skill level required
50: Medium demands on user (medium/moderate
difficulty of use in one of the three categories*; low
in the other two categories); some steps of
preparation; moderate skill level required (junior
water technician [NCO] with lab skills and lab
capabilities)
0: High demands on user (medium or higher
difficulty of use in two or more of the three
categories*); many steps of preparation; significant
skill level required (senior water technician with lab
skills and lab capabilities)
* Categories are sample preparation complexity,
level of maintenance required, and skills and
knowledge required.
Discrete levels
8
Weight
(Weight)
The weight of the technology (not
peripheral storage device or
consumables).
It is better for the weight to be less
rather than more.
100: 1 lb
0: 33 lb
Linear continuous curve
11
Storage Time
(Storage
Time)
The storage life of the
consumables stored under optimal
conditions.
It is better for the storage life to be
longer.
100: 12 months or more
80: 8 months
0: 1 month
Nonlinear continuous curve
15
Storage
Temperature
(Storage
Temp)
The optimal recommended storage
temperature.
It is better not to require any
cooling during storage.
100: Room temperature or higher (>20 °C)
50: Refrigerator required (4–12 °C)
0: Freezer required (–20 °C)
Discrete levels
21
10
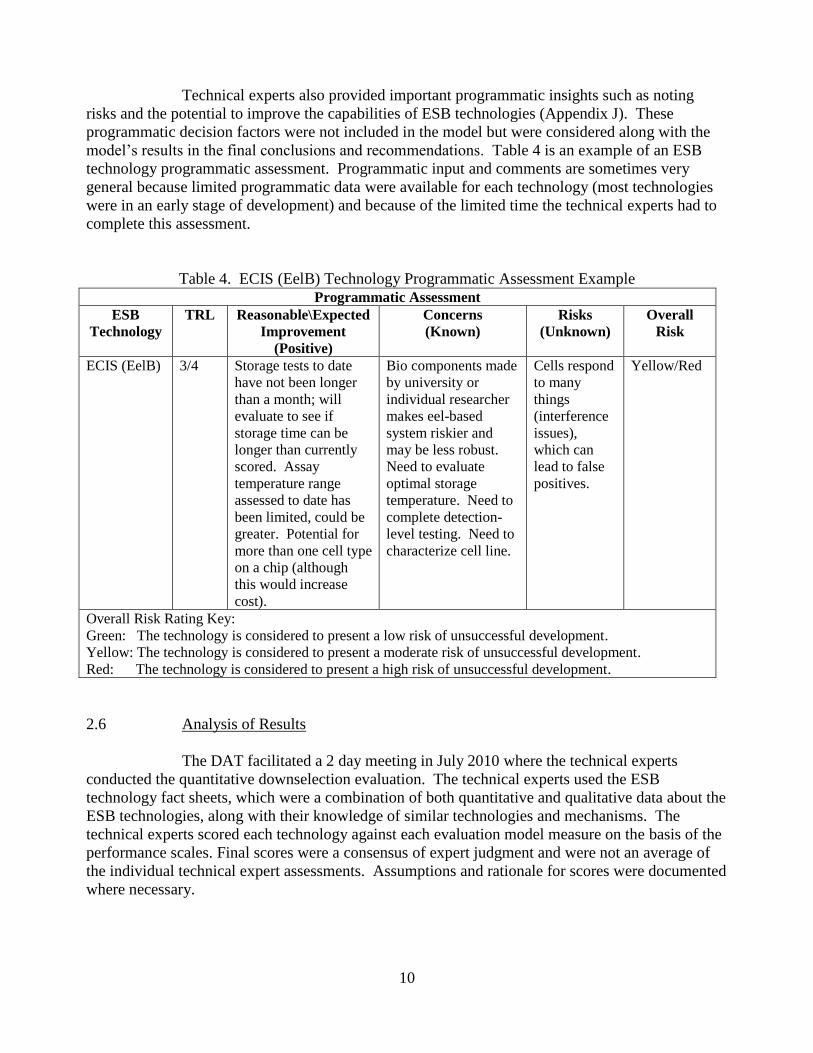
Technical experts also provided important programmatic insights such as noting
risks and the potential to improve the capabilities of ESB technologies (Appendix J). These
programmatic decision factors were not included in the model but were considered along with the
model’s results in the final conclusions and recommendations. Table 4 is an example of an ESB
technology programmatic assessment. Programmatic input and comments are sometimes very
general because limited programmatic data were available for each technology (most technologies
were in an early stage of development) and because of the limited time the technical experts had to
complete this assessment.
Table 4. ECIS (EelB) Technology Programmatic Assessment Example
Programmatic Assessment
ESB
Technology
TRL Reasonable\Expected
Improvement
(Positive)
Concerns
(Known)
Risks
(Unknown)
Overall
Risk
ECIS (EelB) 3/4 Storage tests to date
have not been longer
than a month; will
evaluate to see if
storage time can be
longer than currently
scored. Assay
temperature range
assessed to date has
been limited, could be
greater. Potential for
more than one cell type
on a chip (although
this would increase
cost).
Bio components made
by university or
individual researcher
makes eel-based
system riskier and
may be less robust.
Need to evaluate
optimal storage
temperature. Need to
complete detection-
level testing. Need to
characterize cell line.
Cells respond
to many
things
(interference
issues),
which can
lead to false
positives.
Yellow/Red
Overall Risk Rating Key:
Green: The technology is considered to present a low risk of unsuccessful development.
Yellow: The technology is considered to present a moderate risk of unsuccessful development.
Red: The technology is considered to present a high risk of unsuccessful development.
2.6 Analysis of Results
The DAT facilitated a 2 day meeting in July 2010 where the technical experts
conducted the quantitative downselection evaluation. The technical experts used the ESB
technology fact sheets, which were a combination of both quantitative and qualitative data about the
ESB technologies, along with their knowledge of similar technologies and mechanisms. The
technical experts scored each technology against each evaluation model measure on the basis of the
performance scales. Final scores were a consensus of expert judgment and were not an average of
the individual technical expert assessments. Assumptions and rationale for scores were documented
where necessary.
11
Overall scores were then calculated for each technology by multiplying the
numerical rating for each measure by its weight and summing the scores over all measures (linear
additive function). The highest possible score was 100. While the overall scores were important,
they were only used as a guide to formulate findings and conclusions.
Analyses of the results were completed by the DAT from three different
perspectives. First, the overall results were examined to discern general outcomes and trends.
Second, each technology was examined to identify strengths and weaknesses. Third, the results
specific to each measure were examined to identify potential technical obstacles or shortcomings.
LDW was used in the analysis because it has many useful tools for performing comparative analysis
and displaying and documenting results.
2.6.1 Overall Results
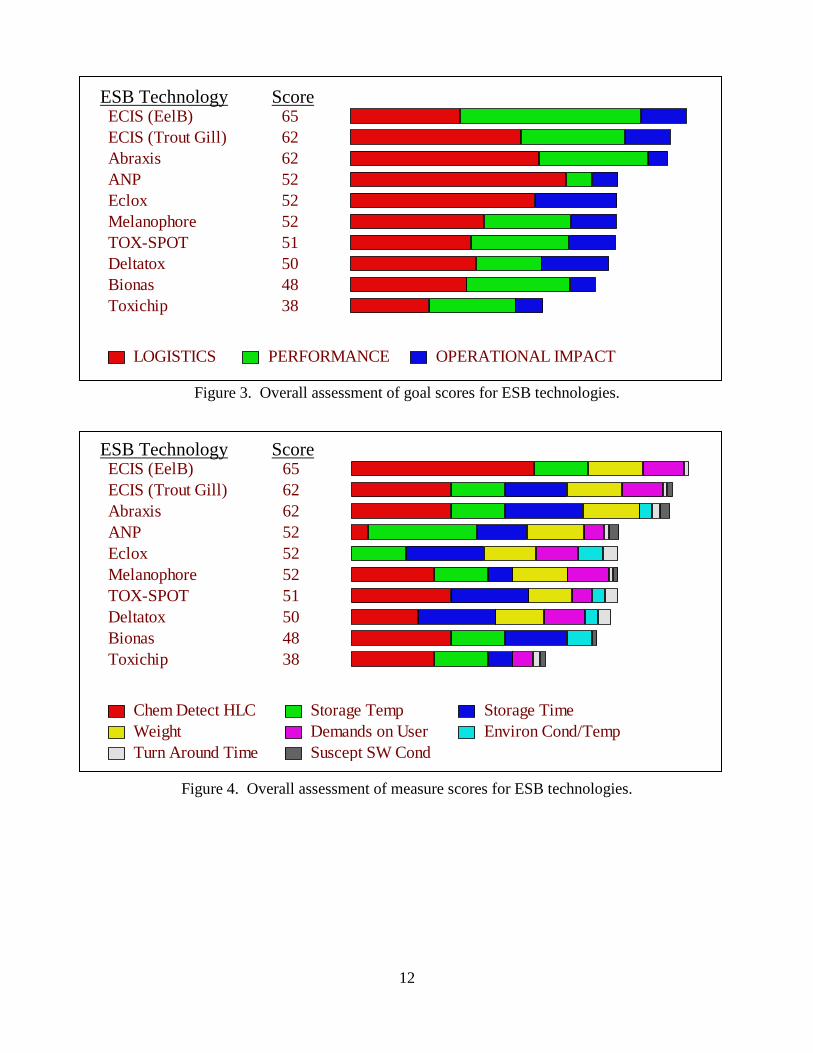
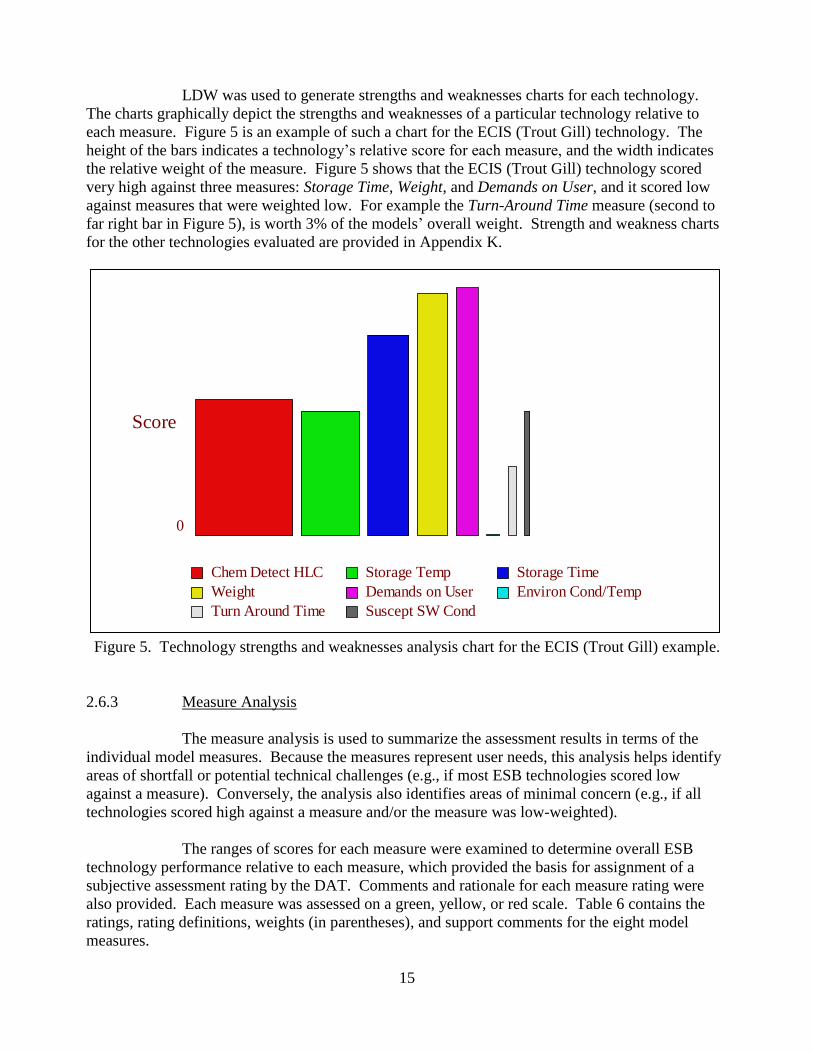
Figure 3 shows the overall model score and rank of each ESB technology, and it also
shows where each technology was strong or weak, relative to the three goals. Figure 4 shows
similar information, but presents a greater level of detail by showing how each technology scored
against the eight measures. The length of each of the sub-bars indicates how much of the
technology’s overall score was attributable to the three goals or eight measures (based on the
measure score and weight).
The model results for the ten ESB technologies were categorized into three broad
ranking tiers:
Above Average: ECIS (EelB), ECIS (Trout Gill), and Abraxis
Average: ANP, Eclox, Melansphore, TOX-SPOT, Deltatox, and Bionas
Below Average: Toxichip
Figure 3 illustrates that the logistics goal has a significant impact for most of the
ESB technology scores. This was mainly due to its high weight (47%; shown in Figure 2).
However, ECIS (EelB) had a high overall score, although it did not score high for logistics,
primarily because of its performance goal score. Overall, primarily because of its lower weight in
the model (37%), the performance goal affected the model less than the other goals. The
operational impact goal had the least impact for most of the technologies mostly because this was
the lowest-weighted goal (16%). This was best illustrated by Eclox and Deltatox, which scored
high for the operational impact goal but scored low overall.
12
ESB Technology Score
Figure 3. Overall assessment of goal scores for ESB technologies.
ESB Technology Score
Figure 4. Overall assessment of measure scores for ESB technologies.
ECIS (EelB)
ECIS (Trout Gill)
Abraxis
ANP
Eclox
Melanophore
TOX-SPOT
Deltatox
Bionas
Toxichip
65
62
62
52
52
52
51
50
48
38
LOGISTICS PERFORMANCE OPERATIONAL IMPACT
ECIS (EelB)
ECIS (Trout Gill)
Abraxis
ANP
Eclox
Melanophore
TOX-SPOT
Deltatox
Bionas
Toxichip
65
62
62
52
52
52
51
50
48
38
Chem Detect HLC
Weight
Turn Around Time
Storage Temp
Demands on User
Suscept SW Cond
Storage Time
Environ Cond/Temp

13
2.6.2 Technology Analysis
The purpose of the technology analysis was to highlight areas where particular
technologies would stand out, either positively or negatively. Table 5 contains a narrative summary
of the relative strengths and weaknesses for each technology using the terminologies “above
average” and “below average”. These ratings were subjectively determined by the DAT and were
based on the score of each ESB technology relative to the other ESB technology scores. In Table 5,
the 10 technologies are presented in the ranking order that they scored against the model (i.e.,
number in parentheses is score [e.g., 65 for ECIS (EelB)]).
Table 5. Technology Strengths and Weaknesses Analysis Narrative Summaries
Rank Summary 1 ECIS (EelB) (65):
Scored above average on three measures (Chem Detect HLC, Weight, and
Demands on User).
Scored below average on three measures (Storage Time, Environ
Cond/Temp, and Suscept SW Cond).
Used to detect 14 chemicals, which was 5 chemicals more than were
detected using the other two top-ranked technologies.
Used to detect acrylonitrile (the other technologies did not detect this
substance). 2 ECIS (Trout Gill) (62):
Scored above average on three measures (Storage Time, Weight,and
Demands on User)
Scored below average on one measure (Environ Cond/Temp).
Detected nine chemicals, which was five chemicals less than were detected
using the top-ranked technology.
Used to detect arsenic (the three top-ranked technologies did not detect this
substance). 3 Abraxis (62):
Scored above average on three measures (Storage Time, Weight, and
Suscept SW Cond).
Scored below average on one measure (Demands on User).
Used to detect nine chemicals, which was five chemicals less than were
detected using the top-ranked technology.
Detected no additional chemicals when compared with those detected using
the two top-ranked technologies. 4 ANP (52):
Scored above average on three measures (Storage Temp, Weight, and
Suscept SW Cond).
Scored below average on two measures (Chem Detect HLC and Environ
Cond/Temp).
Used to detect four chemicals, but no additional chemicals were detected
when compared with those from the three top-ranked technologies.

14
Table 5. Technology Strengths and Weaknesses Analysis Narrative Summaries (continued)
Rank Summary 5 Eclox (52):
Scored above average on five measures (Storage Time, Weight, Demands on
User, Environ Cond/Temp, and Turn-Around Time).
Scored below average on two measures (Chem Detect HLC, and Suscept SW
Cond).
Used to detected only three chemicals, which was the fewest number of
chemicals detected.
Detected no additional chemicals when compared with those detected using
the three top-ranked technologies. 6 Melanophore (52):
Scored above average on two measures (Weight and Demands on User).
Scored below average on one measure (Environ Cond/Temp).
Used to detect eight chemicals, but no additional chemicals were detected
when compared with those detected using the three top-ranked technologies. 7 TOX-SPOT (51):
Did not score above average on any measure.
Scored below average on two measures (Weight and Environ Cond/Temp).
Used to detect nine chemicals, but no additional chemicals were detected
when compared with those detected using the three top-ranked technologies. 8 Deltatox (50):
Scored above average on four measures (Storage Temp, Weight, Demands
on User, and Turn-Around Time).
Scored below average on two measures (Storage Temp and Suscept SW
Cond).
Used to detect seven chemicals, but no additional chemicals were detected
when compared with those detected using the three top-ranked technologies
detected. 9 Bionas (48):
Scored above average on two measures (Storage Time and Environ
Cond/Temp).
Scored below average on three measures (Weight, Demands on User, and
Turn-Around Time).
Used to detect nine chemicals.
Used to detect nicotine (the other technologies did not detect this
substance).
10 Toxichip (38):
Did not score above average on any measures.
Scored below average on two measures (Weight and Environ Cond/Temp).
Used to detect eight chemicals.
Used to detect paraquat (the other technologies did not detect this
substance).
15
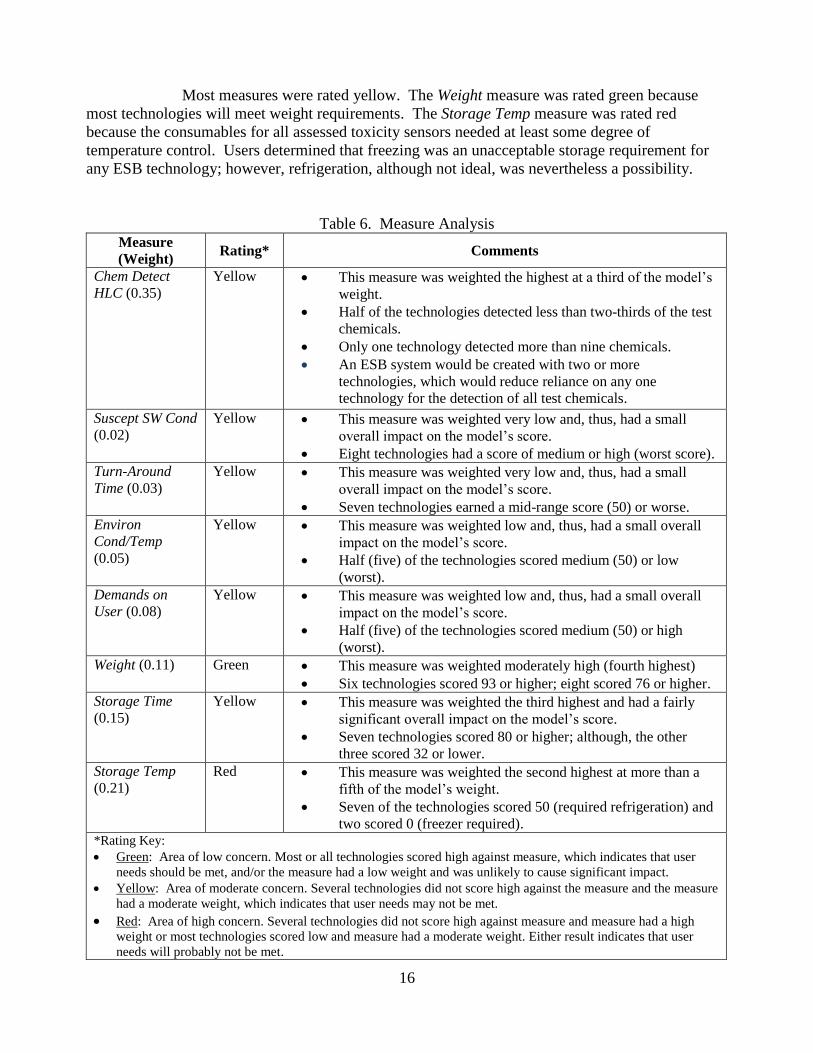
LDW was used to generate strengths and weaknesses charts for each technology.
The charts graphically depict the strengths and weaknesses of a particular technology relative to
each measure. Figure 5 is an example of such a chart for the ECIS (Trout Gill) technology. The
height of the bars indicates a technology’s relative score for each measure, and the width indicates
the relative weight of the measure. Figure 5 shows that the ECIS (Trout Gill) technology scored
very high against three measures: Storage Time, Weight, and Demands on User, and it scored low
against measures that were weighted low. For example the Turn-Around Time measure (second to
far right bar in Figure 5), is worth 3% of the models’ overall weight. Strength and weakness charts
for the other technologies evaluated are provided in Appendix K.
Figure 5. Technology strengths and weaknesses analysis chart for the ECIS (Trout Gill) example.
2.6.3 Measure Analysis
The measure analysis is used to summarize the assessment results in terms of the
individual model measures. Because the measures represent user needs, this analysis helps identify
areas of shortfall or potential technical challenges (e.g., if most ESB technologies scored low
against a measure). Conversely, the analysis also identifies areas of minimal concern (e.g., if all
technologies scored high against a measure and/or the measure was low-weighted).
The ranges of scores for each measure were examined to determine overall ESB
technology performance relative to each measure, which provided the basis for assignment of a
subjective assessment rating by the DAT. Comments and rationale for each measure rating were
also provided. Each measure was assessed on a green, yellow, or red scale. Table 6 contains the
ratings, rating definitions, weights (in parentheses), and support comments for the eight model
measures.
Score
0
Chem Detect HLC
Weight
Turn Around Time
Storage Temp
Demands on User
Suscept SW Cond
Storage Time
Environ Cond/Temp
16
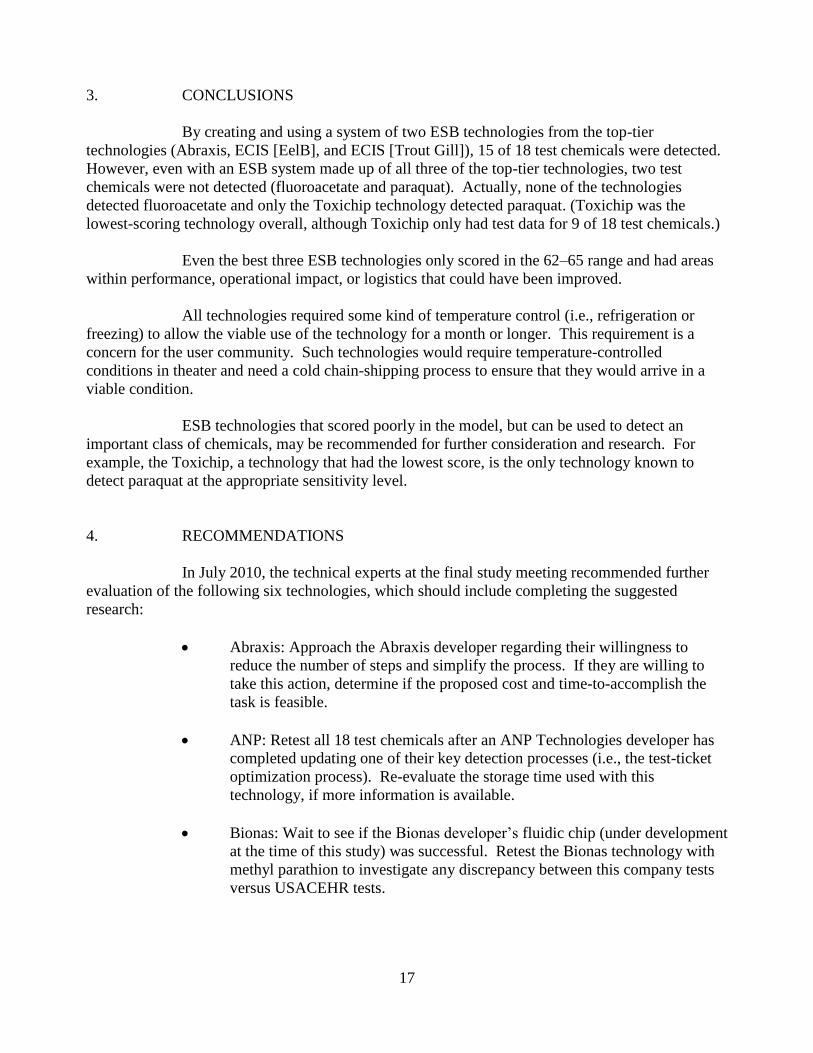
Most measures were rated yellow. The Weight measure was rated green because
most technologies will meet weight requirements. The Storage Temp measure was rated red
because the consumables for all assessed toxicity sensors needed at least some degree of
temperature control. Users determined that freezing was an unacceptable storage requirement for
any ESB technology; however, refrigeration, although not ideal, was nevertheless a possibility.
Table 6. Measure Analysis
Measure
(Weight) Rating* Comments
Chem Detect
HLC (0.35)
Yellow This measure was weighted the highest at a third of the model’s
weight.
Half of the technologies detected less than two-thirds of the test
chemicals.
Only one technology detected more than nine chemicals.
An ESB system would be created with two or more
technologies, which would reduce reliance on any one
technology for the detection of all test chemicals.
Suscept SW Cond
(0.02)
Yellow This measure was weighted very low and, thus, had a small
overall impact on the model’s score.
Eight technologies had a score of medium or high (worst score).
Turn-Around
Time (0.03)
Yellow This measure was weighted very low and, thus, had a small
overall impact on the model’s score.
Seven technologies earned a mid-range score (50) or worse.
Environ
Cond/Temp
(0.05)
Yellow This measure was weighted low and, thus, had a small overall
impact on the model’s score.
Half (five) of the technologies scored medium (50) or low
(worst).
Demands on
User (0.08)
Yellow This measure was weighted low and, thus, had a small overall
impact on the model’s score.
Half (five) of the technologies scored medium (50) or high
(worst).
Weight (0.11) Green This measure was weighted moderately high (fourth highest)
Six technologies scored 93 or higher; eight scored 76 or higher.
Storage Time
(0.15)
Yellow This measure was weighted the third highest and had a fairly
significant overall impact on the model’s score.
Seven technologies scored 80 or higher; although, the other
three scored 32 or lower.
Storage Temp
(0.21)
Red This measure was weighted the second highest at more than a
fifth of the model’s weight.
Seven of the technologies scored 50 (required refrigeration) and
two scored 0 (freezer required). *Rating Key:
Green: Area of low concern. Most or all technologies scored high against measure, which indicates that user
needs should be met, and/or the measure had a low weight and was unlikely to cause significant impact.
Yellow: Area of moderate concern. Several technologies did not score high against the measure and the measure
had a moderate weight, which indicates that user needs may not be met.
Red: Area of high concern. Several technologies did not score high against measure and measure had a high
weight or most technologies scored low and measure had a moderate weight. Either result indicates that user
needs will probably not be met.
17
3. CONCLUSIONS
By creating and using a system of two ESB technologies from the top-tier
technologies (Abraxis, ECIS [EelB], and ECIS [Trout Gill]), 15 of 18 test chemicals were detected.
However, even with an ESB system made up of all three of the top-tier technologies, two test
chemicals were not detected (fluoroacetate and paraquat). Actually, none of the technologies
detected fluoroacetate and only the Toxichip technology detected paraquat. (Toxichip was the
lowest-scoring technology overall, although Toxichip only had test data for 9 of 18 test chemicals.)
Even the best three ESB technologies only scored in the 62–65 range and had areas
within performance, operational impact, or logistics that could have been improved.
All technologies required some kind of temperature control (i.e., refrigeration or
freezing) to allow the viable use of the technology for a month or longer. This requirement is a
concern for the user community. Such technologies would require temperature-controlled
conditions in theater and need a cold chain-shipping process to ensure that they would arrive in a
viable condition.
ESB technologies that scored poorly in the model, but can be used to detect an
important class of chemicals, may be recommended for further consideration and research. For
example, the Toxichip, a technology that had the lowest score, is the only technology known to
detect paraquat at the appropriate sensitivity level.
4. RECOMMENDATIONS
In July 2010, the technical experts at the final study meeting recommended further
evaluation of the following six technologies, which should include completing the suggested
research:
Abraxis: Approach the Abraxis developer regarding their willingness to
reduce the number of steps and simplify the process. If they are willing to
take this action, determine if the proposed cost and time-to-accomplish the
task is feasible.
ANP: Retest all 18 test chemicals after an ANP Technologies developer has
completed updating one of their key detection processes (i.e., the test-ticket
optimization process). Re-evaluate the storage time used with this
technology, if more information is available.
Bionas: Wait to see if the Bionas developer’s fluidic chip (under development
at the time of this study) was successful. Retest the Bionas technology with
methyl parathion to investigate any discrepancy between this company tests
versus USACEHR tests.

18
ECIS (EelB): Retest this technology to more precisely determine the response
for 18 test chemicals between the MEG and the HLC. Characterize the cell
line and continue with research to determine the length of storage time
(>1 month is needed).
ECIS (Trout Gill): Continue research to determine if storage time is
>8 months.
Toxichip: Perform government-sponsored tests to determine the responses for
the 18 test chemicals. The results available at the time of this study were
from the Toxichip developer and were not confirmed independently by the
government. First, test to determine if the Toxichip technology detects the
test chemicals at the HLC. If so, then test the technology to determine if the
threshold for detection was above the MEG or below it.
The following four technologies were not recommended for further consideration:
Deltatox: Requires freezing for an optimal shelf life. Maintaining freezing
conditions during shipping would be very problematic and makes this
technology unusable.
Eclox: Detects only three test chemicals and two of these were below the
MEG level.
Melanophore: There was no reasonable chance to increase the 3 month shelf
life; the shelf life is driven by the biology of the technology.
TOX-SPOT: Requires freezing for an optimal shelf life. Maintaining freezing
conditions during shipping would be very problematic and makes this
technology unusable.
Decision analysis methodologies and tools can provide a framework to further
analyze current and new ESB technologies as additional data from future research becomes
available. This effort could be part of a structured reassessment process. Resource allocation
methodologies could also be used to model the various funding options for each of the technologies
chosen. This would allow the ESB system program managers to perform “what-if” analyses and
model for the maximization of benefits while addressing any potential funding cuts or additions.
5. POST-ASSESSMENT TECHNOLOGY EVALUATIONS
After July 2010, the USACEHR conducted additional testing and evaluation of the
six technologies recommended by the technical experts (Section 4). The results were as follows:
ECIS (Trout Gill): The trout gill cells have remained viable and responsive to
toxicants when stored at 6 °C for over 12 months on the fluidic biochips used
in testing. The IPT selected this toxicity sensor as one of the two ESB
19
system components because of the long-term viability of its consumable,
combined with good sensitivity to a wide range of toxicants.
ANP: Abraxis and ANP technologies focused primarily on detected
acetylcholinesterase inhibition caused by organophosphorus and carbamate
pesticides. This was considered an essential capability for an ESB system
because none of the other toxicity sensors were sensitive to these materials,
and because these chemicals were an important class of environmental
contaminants. Retesting the ANP technology using optimized test tickets
resulted in excellent detection of organophosphorus and carbamate pesticides
through the use of a simple test procedure and consumables that did not
require refrigeration. This was the second of two toxicity sensors that were
recommended by the IPT for the ESB system.
Abraxis: The Abraxis developer has been funded to develop a way to reduce
the number of steps, simplify the testing process, and provide temperature-
stabilized reagents that do not require refrigeration. If they are successful,
the Abraxis system will be considered to be a viable alternative to that of
ANP Technologies.
Bionas: Although it shows promise, the prototype Bionas fluidic chip still
needs considerable development and can be used only with an instrument that
is unsuitable for field use. Whereas the Bionas may someday be suitable for
Army needs, at the time of this study there were insufficient time and
resources to develop it further for use with the ESB.
ECIS (EelB): After this study was complete, further testing using EelB cells
led to the determination that these cells had excessive false-positive
responses to control water and to nonharmful changes in water quality, such
as small increases in hardness. EelB cells were determined to be unsuitable
for the ESB system.
Toxichip: Because of issues related to intellectual property concerns, time
and resource constraints, and the difficulties involved in dealing with a
foreign vendor, it was not possible to independently confirm the performance
of the Toxichip bacterial cells or to consider them as a potential component
of the ESB system.
In summary, on the basis of further consideration of the six technologies that were
recommended as a result of the downselection effort, the best toxicity sensor candidates for
inclusion in the ESB system were determined to be the ECIS (Trout Gill) and the ANP
Technologies acetylcholinesterase test kit. At the time of this report, plans were made to complete
TRL 6 prototypes of these two sensors and take them into a Milestone B review in December 2012.

20
Blank
21
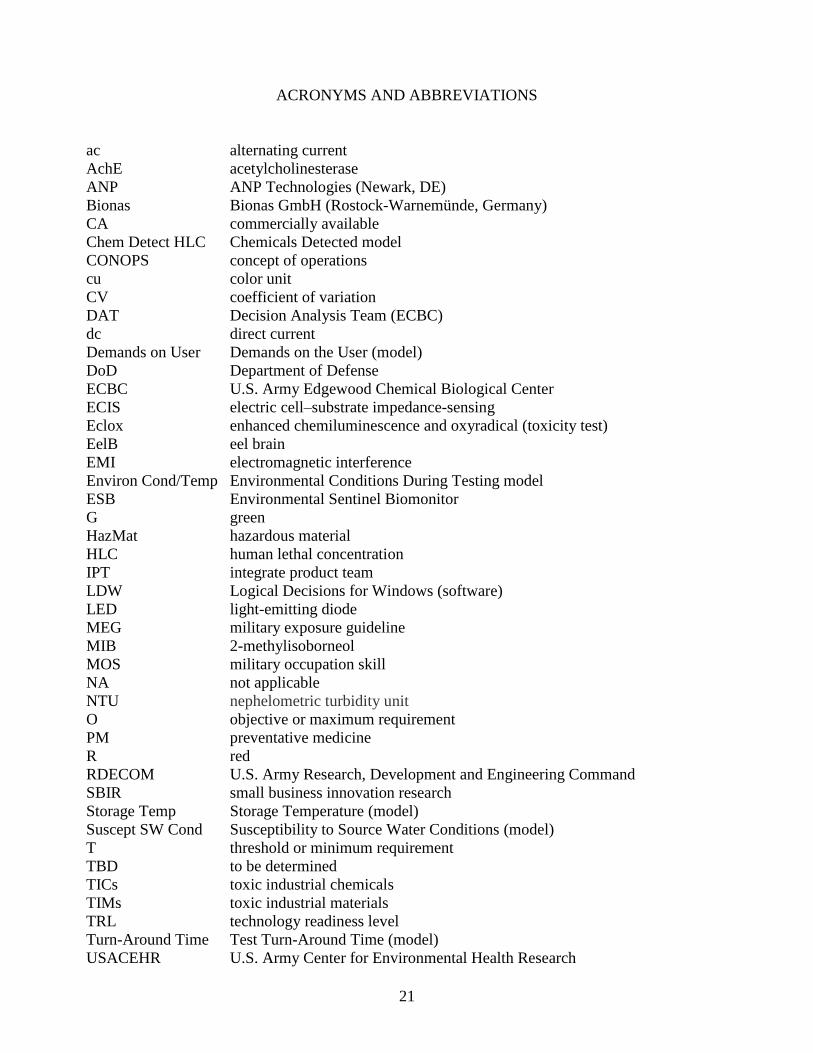
ACRONYMS AND ABBREVIATIONS
ac alternating current
AchE acetylcholinesterase
ANP ANP Technologies (Newark, DE)
Bionas Bionas GmbH (Rostock-Warnemünde, Germany)
CA commercially available
Chem Detect HLC Chemicals Detected model
CONOPS concept of operations
cu color unit
CV coefficient of variation
DAT Decision Analysis Team (ECBC)
dc direct current
Demands on User Demands on the User (model)
DoD Department of Defense
ECBC U.S. Army Edgewood Chemical Biological Center
ECIS electric cell–substrate impedance-sensing
Eclox enhanced chemiluminescence and oxyradical (toxicity test)
EelB eel brain
EMI electromagnetic interference
Environ Cond/Temp Environmental Conditions During Testing model
ESB Environmental Sentinel Biomonitor
G green
HazMat hazardous material
HLC human lethal concentration
IPT integrate product team
LDW Logical Decisions for Windows (software)
LED light-emitting diode
MEG military exposure guideline
MIB 2-methylisoborneol
MOS military occupation skill
NA not applicable
NTU nephelometric turbidity unit
O objective or maximum requirement
PM preventative medicine
R red
RDECOM U.S. Army Research, Development and Engineering Command
SBIR small business innovation research
Storage Temp Storage Temperature (model)
Suscept SW Cond Susceptibility to Source Water Conditions (model)
T threshold or minimum requirement
TBD to be determined
TICs toxic industrial chemicals
TIMs toxic industrial materials
TRL technology readiness level
Turn-Around Time Test Turn-Around Time (model)
USACEHR U.S. Army Center for Environmental Health Research

22
USAMMDA U.S. Army Medical Materiel Development Activity
WQAS-PM water quality analysis set-preventative medicine
Y yellow
23
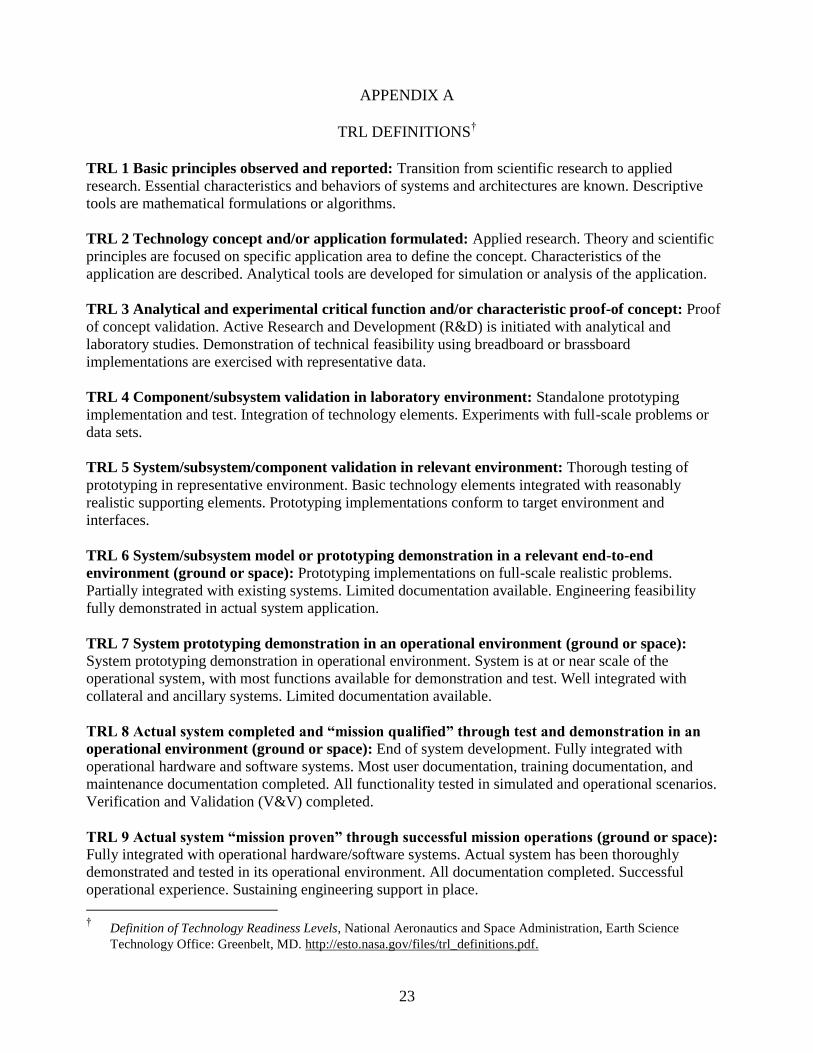
APPENDIX A
TRL DEFINITIONS†
TRL 1 Basic principles observed and reported: Transition from scientific research to applied
research. Essential characteristics and behaviors of systems and architectures are known. Descriptive
tools are mathematical formulations or algorithms.
TRL 2 Technology concept and/or application formulated: Applied research. Theory and scientific
principles are focused on specific application area to define the concept. Characteristics of the
application are described. Analytical tools are developed for simulation or analysis of the application.
TRL 3 Analytical and experimental critical function and/or characteristic proof-of concept: Proof
of concept validation. Active Research and Development (R&D) is initiated with analytical and
laboratory studies. Demonstration of technical feasibility using breadboard or brassboard
implementations are exercised with representative data.
TRL 4 Component/subsystem validation in laboratory environment: Standalone prototyping
implementation and test. Integration of technology elements. Experiments with full-scale problems or
data sets.
TRL 5 System/subsystem/component validation in relevant environment: Thorough testing of
prototyping in representative environment. Basic technology elements integrated with reasonably
realistic supporting elements. Prototyping implementations conform to target environment and
interfaces.
TRL 6 System/subsystem model or prototyping demonstration in a relevant end-to-end
environment (ground or space): Prototyping implementations on full-scale realistic problems.
Partially integrated with existing systems. Limited documentation available. Engineering feasibility
fully demonstrated in actual system application.
TRL 7 System prototyping demonstration in an operational environment (ground or space):
System prototyping demonstration in operational environment. System is at or near scale of the
operational system, with most functions available for demonstration and test. Well integrated with
collateral and ancillary systems. Limited documentation available.
TRL 8 Actual system completed and “mission qualified” through test and demonstration in an
operational environment (ground or space): End of system development. Fully integrated with
operational hardware and software systems. Most user documentation, training documentation, and
maintenance documentation completed. All functionality tested in simulated and operational scenarios.
Verification and Validation (V&V) completed.
TRL 9 Actual system “mission proven” through successful mission operations (ground or space):
Fully integrated with operational hardware/software systems. Actual system has been thoroughly
demonstrated and tested in its operational environment. All documentation completed. Successful
operational experience. Sustaining engineering support in place.
† Definition of Technology Readiness Levels, National Aeronautics and Space Administration, Earth Science
Technology Office: Greenbelt, MD. http://esto.nasa.gov/files/trl_definitions.pdf.

24
Blank
25
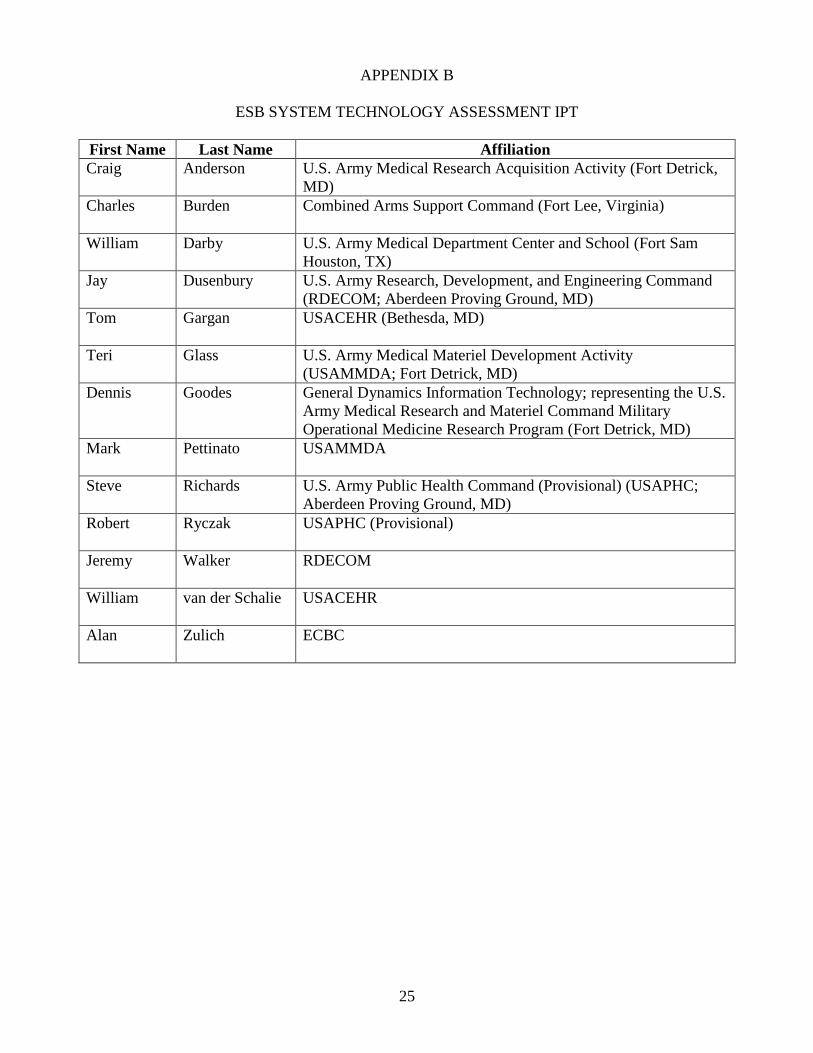
APPENDIX B
ESB SYSTEM TECHNOLOGY ASSESSMENT IPT
First Name Last Name Affiliation
Craig
Anderson U.S. Army Medical Research Acquisition Activity (Fort Detrick,
MD)
Charles
Burden Combined Arms Support Command (Fort Lee, Virginia)
William
Darby U.S. Army Medical Department Center and School (Fort Sam
Houston, TX)
Jay
Dusenbury U.S. Army Research, Development, and Engineering Command
(RDECOM; Aberdeen Proving Ground, MD)
Tom
Gargan USACEHR (Bethesda, MD)
Teri
Glass U.S. Army Medical Materiel Development Activity
(USAMMDA; Fort Detrick, MD)
Dennis
Goodes General Dynamics Information Technology; representing the U.S.
Army Medical Research and Materiel Command Military
Operational Medicine Research Program (Fort Detrick, MD)
Mark
Pettinato USAMMDA
Steve
Richards U.S. Army Public Health Command (Provisional) (USAPHC;
Aberdeen Proving Ground, MD)
Robert
Ryczak USAPHC (Provisional)
Jeremy
Walker RDECOM
William
van der Schalie USACEHR
Alan
Zulich ECBC

26
Blank

27
APPENDIX C
ESB SYSTEM
TECHNOLOGY ASSESSMENT
EXPERT PANEL TEAM
First Name Last Name Affiliation
Ric
De Leon Metropolitan Water District of Southern California (Los Angeles,
CA)
Danny
Dhanesakaran University of Oklahoma Health Sciences Center (Oklahoma City,
OK)
Jay
Dusenbury RDECOM
Tim
Fawcett BioSci Concepts (Baltimore, MD)
Tom
Gargan USACEHR
Wally
Hayes Harvard School of Public Health (Boston, MA)
Joe
Pancrazio George Mason University (Fairfax, VA)
Vipin
Rastogi RDECOM
Stanley
States Pittsburgh Water and Sewer Authority (Pittsburgh, PA)
William
van der Schalie USACEHR

28
Blank
29
APPENDIX D
ESB SYSTEM CONCEPT OF OPERATIONS
The ESB system is being developed to provide a rapid measurement (screening)
of toxicity associated with the presence of TICs in Army field drinking water supplies. The ESB
system will be used by PM personnel as part of the currently used WQAS-PM. This CONOPs
draws from a WQAS-PM use scenario prepared by Dr. Steve Richards and Mr. Ginn White (U.S.
Army Public Health Command, provisional) and from suggestions provided by LTC William
Darby (U.S. Army Medical Department Center and School).
D.1 USE OF THE ESB SYSTEM
The ESB system water testing will be conducted on raw (untreated) or processed
(treated) water. The system will be operated in conjunction with other WQAS-PM test kits
including the Hach Water Quality Laboratory (Loveland, CO) and Colilert (IDEXX
Laboratories, Westbrook, MA) microbiological tests. The ESB system will be fielded to the
brigade combat team’s PM team (level II), the PM medical detachment (level III), or the area
medical laboratory (level IV); other users may include water treatment operators. Soldiers
operating the ESB system will include PM specialists (military occupation skill [MOS] 68S),
water treatment specialists (MOS 92W), and laboratory specialists (MOS 68K). Transportation
of the ESB system within theater may be by aircraft (rotary or fixed-wing) or by ground vehicles.
PM teams may take the ESB system forward to the water production sites to conduct rapid
screening of raw water or they may collect samples and bring them back to a fixed site for batch-
sampling. The ESB system will be operational using military or civilian 110 V grid systems or
internal batteries. Electrical power at the point-of-use is expected to be operational at least 75%
of time. Environmental/climate control for hardware and reagents will be available, as will other
WQAS-PM kit components.
D.2 FREQUENCY OF ESB SYSTEM USE
Testing for water quality parameters that are evaluated with the WQAS-PM
depends on the analyzed parameter, the population size served, the water source, and the
threat/risk level. Testing for chemical parameters is typically done weekly, monthly, or
quarterly. Field storage containers are monitored daily for pH and chlorine residual. Testing
with the ESB system is expected to be done at least weekly; although, more frequent testing may
be warranted by the threat level.
D.3 USE OF ESB SYSTEM TEST RESULTS
The ESB system will be used as a rapid-screening tool for toxic contaminants in
raw and product water during deployments. A negative ESB test, by itself, will not guarantee
that the water is potable; no single water-quality test can do this. A positive ESB test will
provide an early warning of potential health risks, which can lead to appropriate mitigation
procedures. For both source and product water, a positive ESB test will indicate the need for
follow-up presumptive and confirmatory testing, sanitary assessments, and possibly additional
APPENDIX D 30
water treatment. Retesting after action is taken can indicate whether the treatment was effective
in removing toxicity. This approach is consistent with procedures already in place for the
WQAS-PM kit. When the results of water testing indicate that one or more tested parameters
exceed the recommended limits, PM personnel will evaluate the potential health impacts,
determine a course of action, and make a recommendation to the Commander with respect to
water potability and use. Possible follow-on actions might include quarantining the current
water supply, retesting the water to verify results, sending a water sample to another laboratory
for advanced testing, conducting a water survey to determine the potential source of the
contamination and initiating corrective actions, and/or recommending an alternate water source if
the problem cannot be quickly fixed.

31
APPENDIX E
ESB SYSTEM TECHNICAL REQUIREMENTS
No. Category Definition Requirements Comments
1 Detection
Does ESB technology/system need to provide a
problem/no problem reading (similar to on/off
reading) only or must it provide a gradation/sliding
scale reading (e.g., detection was closer to HLC
than to MEG for the short term)?
No technology will provide sliding-scale readout
relative to the HLC and MEG.
(T): Problem/no problem reading
(O): Sliding-scale reading
Suggestions:
(T): Calculated reading (output requires further
analysis/computation)
(O): Automated readout
2 Detection
What TICs/TIMs must the ESB technology/system
must detect?**
Are some types of chemicals more important to
detect than others (e.g., chemicals that effect
cognitive or gastrointestinal functions)? (No
chemicals are currently selected as more important
for identification than others.)
(T): A sensor within the system must detect at least one
TIC/TIM (i.e., test chemical) with one or more
physiological effects
(O): Detect all identified test chemicals
**This requirement will be
applied to the single ESB
technologies under
consideration for the
downselection process and will
be revised when the ESB
system (i.e., suite of
technologies) is selected.
3 Detection
The ESB technology/system must detect chemicals
at what level of chemical concentration?
(T): Must detect below the HLC but above the short-
term MEG
(O): Detect at the short-term MEG level
Short-term MEG is defined as
14 day exposure and 15 L/day
consumption. If information is
not available, 7 day or 1 year
MEG is used. MEGs have been
updated to reflect TG-230
(draft) revisions.
4
Environmental
Conditions
During Test
ESB technology/system must be operated and
stored in what air temperature and humidity level?
Note: Atmospheric pressure was determined to not
be an issue.
(T): For equipment (same as WQAS-PM): operation at
10 to 50 °C, RH not specified; storage at
–40 to 60 °C and 90% RH at 30 °C, 80% RH at 40 °C, or
70% RH at 50 °C
For reagents (same as WQAS-PM reagents): operation
and storage at 0 to 25 °C, RH not specified
(O): For equipment and reagents:
operation at –20 to 50 °C, 95% RH; storage at
–40 to 70 °C, 95% RH
T: threshold or minimum requirement; O: objective or maximum requirement
32
No. Category Definition Requirements Comments
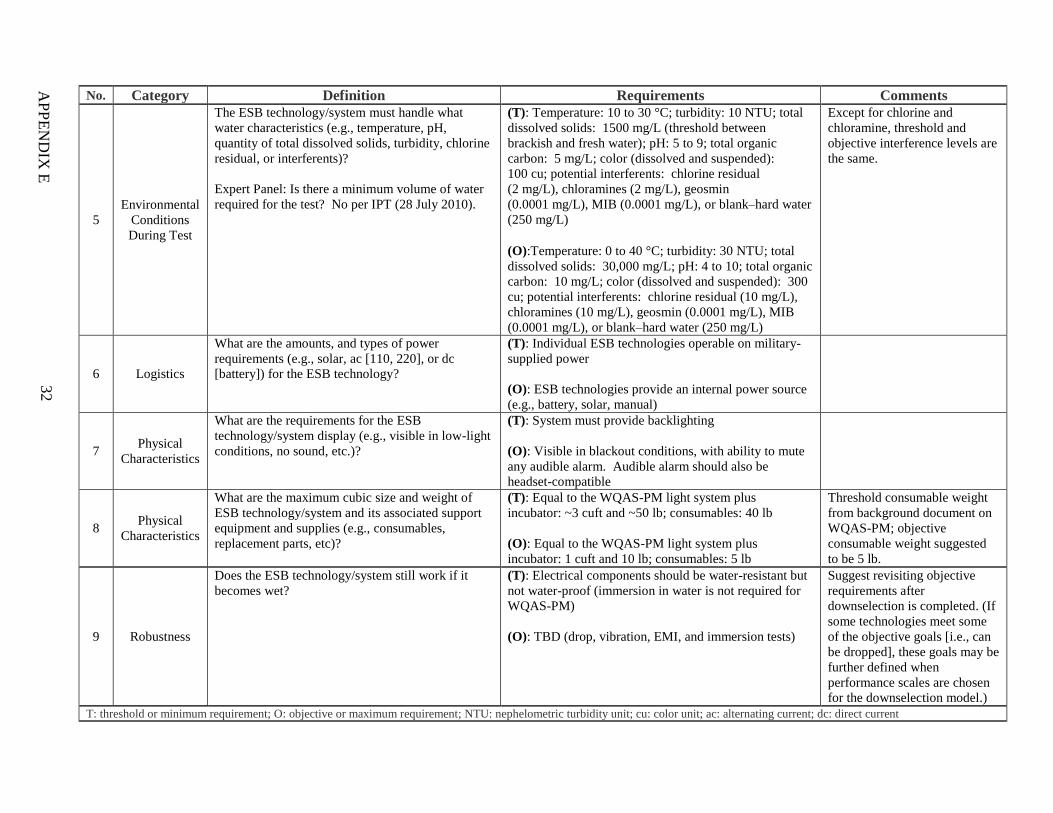
5
Environmental
Conditions
During Test
The ESB technology/system must handle what
water characteristics (e.g., temperature, pH,
quantity of total dissolved solids, turbidity, chlorine
residual, or interferents)?
Expert Panel: Is there a minimum volume of water
required for the test? No per IPT (28 July 2010).
(T): Temperature: 10 to 30 °C; turbidity: 10 NTU; total
dissolved solids: 1500 mg/L (threshold between
brackish and fresh water); pH: 5 to 9; total organic
carbon: 5 mg/L; color (dissolved and suspended):
100 cu; potential interferents: chlorine residual
(2 mg/L), chloramines (2 mg/L), geosmin
(0.0001 mg/L), MIB (0.0001 mg/L), or blank–hard water
(250 mg/L)
(O):Temperature: 0 to 40 °C; turbidity: 30 NTU; total
dissolved solids: 30,000 mg/L; pH: 4 to 10; total organic
carbon: 10 mg/L; color (dissolved and suspended): 300
cu; potential interferents: chlorine residual (10 mg/L),
chloramines (10 mg/L), geosmin (0.0001 mg/L), MIB
(0.0001 mg/L), or blank–hard water (250 mg/L)
Except for chlorine and
chloramine, threshold and
objective interference levels are
the same.
6 Logistics
What are the amounts, and types of power
requirements (e.g., solar, ac [110, 220], or dc
[battery]) for the ESB technology?
(T): Individual ESB technologies operable on military-
supplied power
(O): ESB technologies provide an internal power source
(e.g., battery, solar, manual)
7 Physical
Characteristics
What are the requirements for the ESB
technology/system display (e.g., visible in low-light
conditions, no sound, etc.)?
(T): System must provide backlighting
(O): Visible in blackout conditions, with ability to mute
any audible alarm. Audible alarm should also be
headset-compatible
8 Physical
Characteristics
What are the maximum cubic size and weight of
ESB technology/system and its associated support
equipment and supplies (e.g., consumables,
replacement parts, etc)?
(T): Equal to the WQAS-PM light system plus
incubator: ~3 cuft and ~50 lb; consumables: 40 lb
(O): Equal to the WQAS-PM light system plus
incubator: 1 cuft and 10 lb; consumables: 5 lb
Threshold consumable weight
from background document on
WQAS-PM; objective
consumable weight suggested
to be 5 lb.
9 Robustness
Does the ESB technology/system still work if it
becomes wet?
(T): Electrical components should be water-resistant but
not water-proof (immersion in water is not required for
WQAS-PM)
(O): TBD (drop, vibration, EMI, and immersion tests)
Suggest revisiting objective
requirements after
downselection is completed. (If
some technologies meet some
of the objective goals [i.e., can
be dropped], these goals may be
further defined when
performance scales are chosen
for the downselection model.)
T: threshold or minimum requirement; O: objective or maximum requirement; NTU: nephelometric turbidity unit; cu: color unit; ac: alternating current; dc: direct current
AP
PE
ND
IX E

33
No. Category Definition Requirements Comments
10 Robustness
Will TICs accumulate on a reusable ESB
technology/system “test stripe” from test to test? (If
yes, this may create a false positive.)
(T): Not required for any component of ESB
technology/system to be reusable
(O): Reusable and no accumulation of TICs
11 Robustness
Does the device have an indicator that the ESB
technology/system is still working (or has a
malfunction signal)? Example, a process failure
indicator.
(T): Must have at least a set of manual steps to follow to
ensure system is working properly
(O): Integrated, automatic indication of malfunction
12 Robustness
What are the number of tests required before
reloading or recalibrating?
(T): One. Recalibrating/reloading acceptable after each
test
(O): Multiple tests can be performed before
reloading/recalibrating
13 Robustness
What is the reliability of the ESB
technology/system in terms of device failure rate
per x amount of tests (i.e., hardware failure or
failure not caused by human error or false
positives/negatives)?
Expert Panel: It may not be feasible to evaluate the
failure rate of premature technologies. A value of
5% may be a threshold requirement that is too strict
at this stage of development. Reliability may need
to be evaluated on a more qualitative scale.
(T): 5% failure rate
(O): <1% failure rate
14 Robustness
What are the shelf lives of the device and
consumables?
(T): 30 days for consumables under threshold storage
parameters and 1 year for hardware
(O): 1 year for consumables and >1 year for hardware
15
Safety, Health,
and
Environmental
What are the requirements related to the safety and
health of the user and to the impact on the
environment?
Expert Panel: The exhibition of no safety hazards
may not be feasible for a threshold requirement. A
more appropriate threshold would be minimal risk.
(T): No safety hazard to logistics or operational
personnel. HazMat below shipping declarable limits and
complies with DoD HazMat directives
(O): No safety hazard to logistics or operational
personnel and does not contain HazMats
T: threshold or minimum requirement; O: objective or maximum requirement; TBD: to be determined; EMI: electromagnetic interference
AP
PE
ND
IX E
34
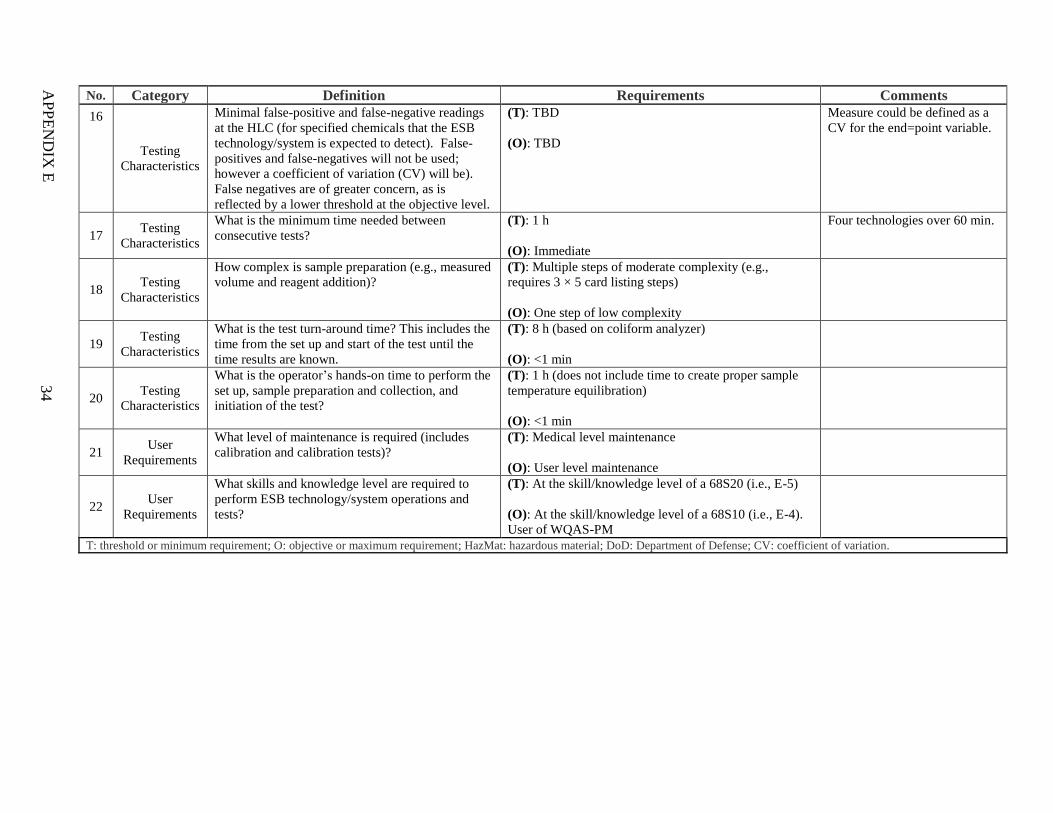
No. Category Definition Requirements Comments
16
Testing
Characteristics
Minimal false-positive and false-negative readings
at the HLC (for specified chemicals that the ESB
technology/system is expected to detect). False-
positives and false-negatives will not be used;
however a coefficient of variation (CV) will be).
False negatives are of greater concern, as is
reflected by a lower threshold at the objective level.
(T): TBD
(O): TBD
Measure could be defined as a
CV for the end=point variable.
17 Testing
Characteristics
What is the minimum time needed between
consecutive tests?
(T): 1 h
(O): Immediate
Four technologies over 60 min.
18 Testing
Characteristics
How complex is sample preparation (e.g., measured
volume and reagent addition)?
(T): Multiple steps of moderate complexity (e.g.,
requires 3 × 5 card listing steps)
(O): One step of low complexity
19 Testing
Characteristics
What is the test turn-around time? This includes the
time from the set up and start of the test until the
time results are known.
(T): 8 h (based on coliform analyzer)
(O): <1 min
20 Testing
Characteristics
What is the operator’s hands-on time to perform the
set up, sample preparation and collection, and
initiation of the test?
(T): 1 h (does not include time to create proper sample
temperature equilibration)
(O): <1 min
21 User
Requirements
What level of maintenance is required (includes
calibration and calibration tests)?
(T): Medical level maintenance
(O): User level maintenance
22 User
Requirements
What skills and knowledge level are required to
perform ESB technology/system operations and
tests?
(T): At the skill/knowledge level of a 68S20 (i.e., E-5)
(O): At the skill/knowledge level of a 68S10 (i.e., E-4).
User of WQAS-PM
T: threshold or minimum requirement; O: objective or maximum requirement; HazMat: hazardous material; DoD: Department of Defense; CV: coefficient of variation.
AP
PE
ND
IX E
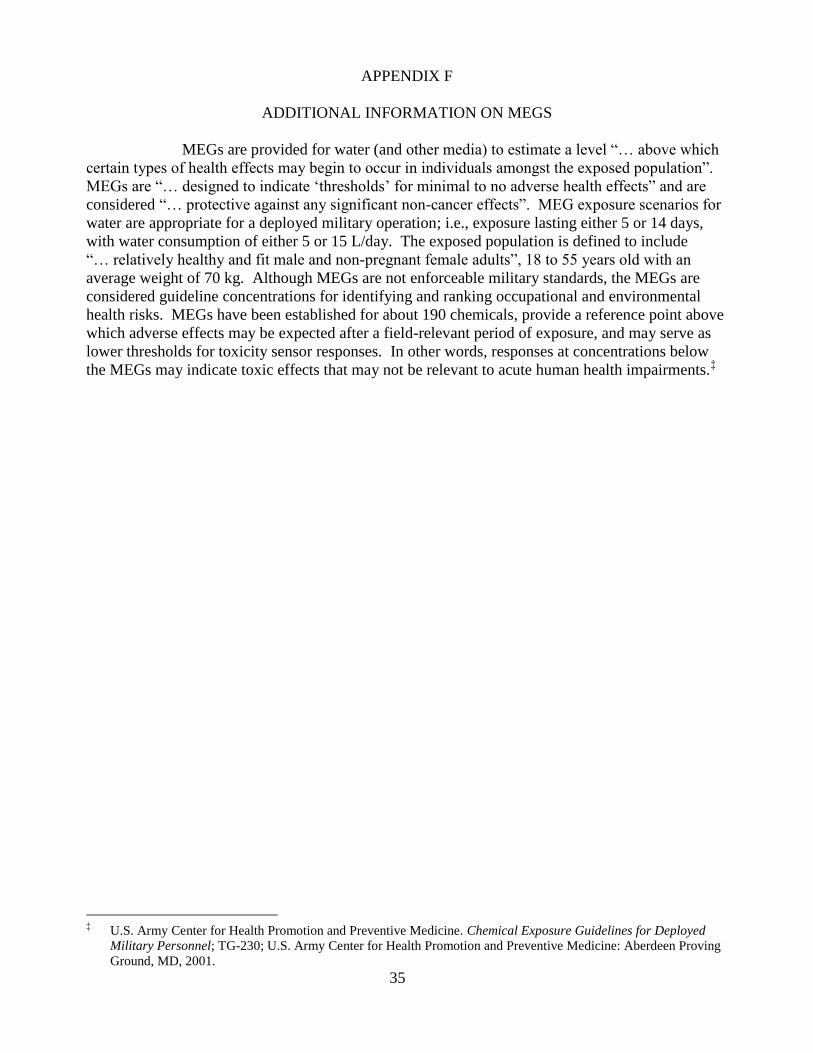
35
APPENDIX F
ADDITIONAL INFORMATION ON MEGS
MEGs are provided for water (and other media) to estimate a level “… above which
certain types of health effects may begin to occur in individuals amongst the exposed population”.
MEGs are “… designed to indicate ‘thresholds’ for minimal to no adverse health effects” and are
considered “… protective against any significant non-cancer effects”. MEG exposure scenarios for
water are appropriate for a deployed military operation; i.e., exposure lasting either 5 or 14 days,
with water consumption of either 5 or 15 L/day. The exposed population is defined to include
“… relatively healthy and fit male and non-pregnant female adults”, 18 to 55 years old with an
average weight of 70 kg. Although MEGs are not enforceable military standards, the MEGs are
considered guideline concentrations for identifying and ranking occupational and environmental
health risks. MEGs have been established for about 190 chemicals, provide a reference point above
which adverse effects may be expected after a field-relevant period of exposure, and may serve as
lower thresholds for toxicity sensor responses. In other words, responses at concentrations below
the MEGs may indicate toxic effects that may not be relevant to acute human health impairments.‡
‡ U.S. Army Center for Health Promotion and Preventive Medicine. Chemical Exposure Guidelines for Deployed
Military Personnel; TG-230; U.S. Army Center for Health Promotion and Preventive Medicine: Aberdeen Proving
Ground, MD, 2001.

36
Blank
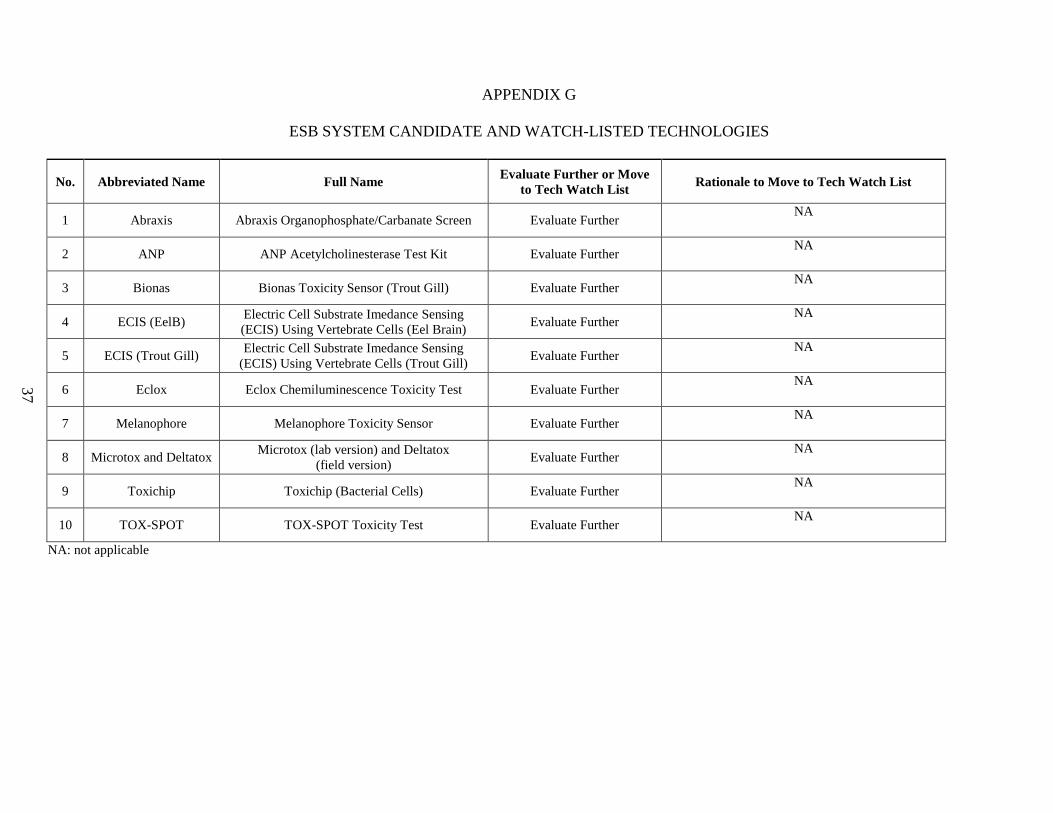
3
7
APPENDIX G
ESB SYSTEM CANDIDATE AND WATCH-LISTED TECHNOLOGIES
No. Abbreviated Name Full Name Evaluate Further or Move
to Tech Watch List Rationale to Move to Tech Watch List
1 Abraxis Abraxis Organophosphate/Carbanate Screen Evaluate Further NA
2 ANP ANP Acetylcholinesterase Test Kit Evaluate Further NA
3 Bionas Bionas Toxicity Sensor (Trout Gill) Evaluate Further NA
4 ECIS (EelB) Electric Cell Substrate Imedance Sensing
(ECIS) Using Vertebrate Cells (Eel Brain) Evaluate Further
NA
5 ECIS (Trout Gill) Electric Cell Substrate Imedance Sensing
(ECIS) Using Vertebrate Cells (Trout Gill) Evaluate Further
NA
6 Eclox Eclox Chemiluminescence Toxicity Test Evaluate Further NA
7 Melanophore Melanophore Toxicity Sensor Evaluate Further NA
8 Microtox and Deltatox Microtox (lab version) and Deltatox
(field version) Evaluate Further
NA
9 Toxichip Toxichip (Bacterial Cells) Evaluate Further NA
10 TOX-SPOT TOX-SPOT Toxicity Test Evaluate Further NA
NA: not applicable
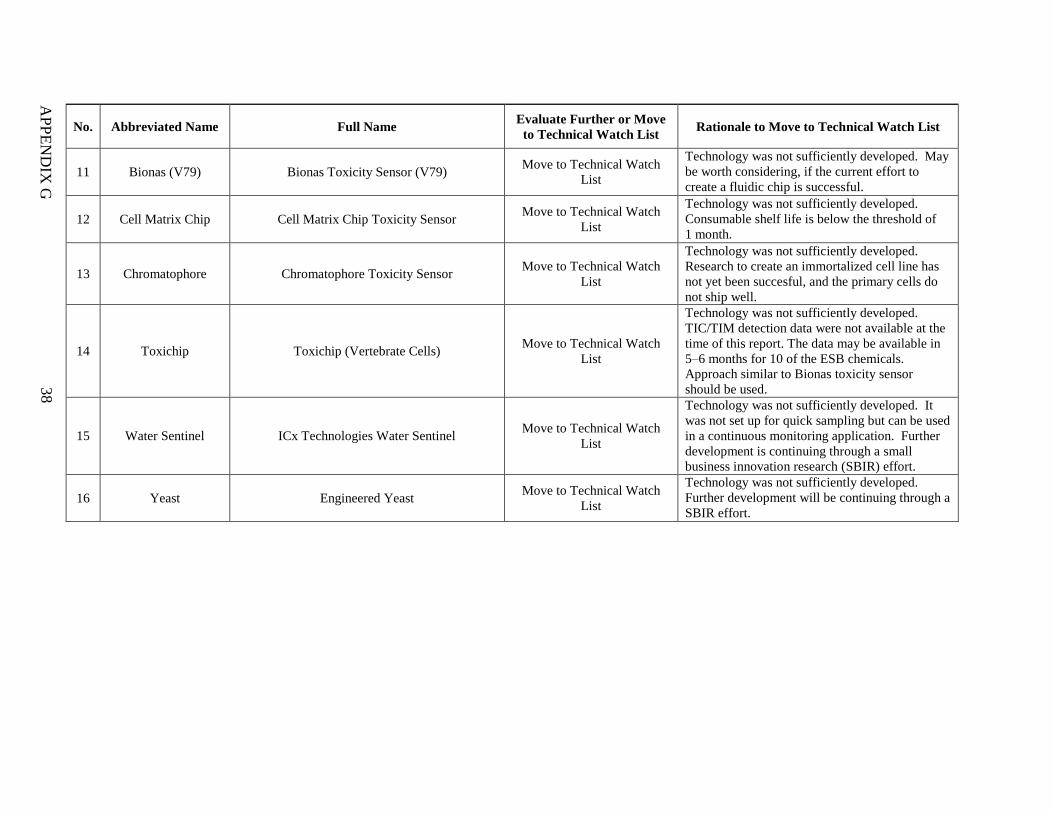
3
8
No. Abbreviated Name Full Name Evaluate Further or Move
to Technical Watch List Rationale to Move to Technical Watch List
11 Bionas (V79) Bionas Toxicity Sensor (V79) Move to Technical Watch
List
Technology was not sufficiently developed. May
be worth considering, if the current effort to
create a fluidic chip is successful.
12 Cell Matrix Chip Cell Matrix Chip Toxicity Sensor Move to Technical Watch
List
Technology was not sufficiently developed.
Consumable shelf life is below the threshold of
1 month.
13 Chromatophore Chromatophore Toxicity Sensor Move to Technical Watch
List
Technology was not sufficiently developed.
Research to create an immortalized cell line has
not yet been succesful, and the primary cells do
not ship well.
14 Toxichip Toxichip (Vertebrate Cells) Move to Technical Watch
List
Technology was not sufficiently developed.
TIC/TIM detection data were not available at the
time of this report. The data may be available in
5–6 months for 10 of the ESB chemicals.
Approach similar to Bionas toxicity sensor
should be used.
15 Water Sentinel ICx Technologies Water Sentinel Move to Technical Watch
List
Technology was not sufficiently developed. It
was not set up for quick sampling but can be used
in a continuous monitoring application. Further
development is continuing through a small
business innovation research (SBIR) effort.
16 Yeast Engineered Yeast Move to Technical Watch
List
Technology was not sufficiently developed.
Further development will be continuing through a
SBIR effort.
AP
PE
ND
IX G
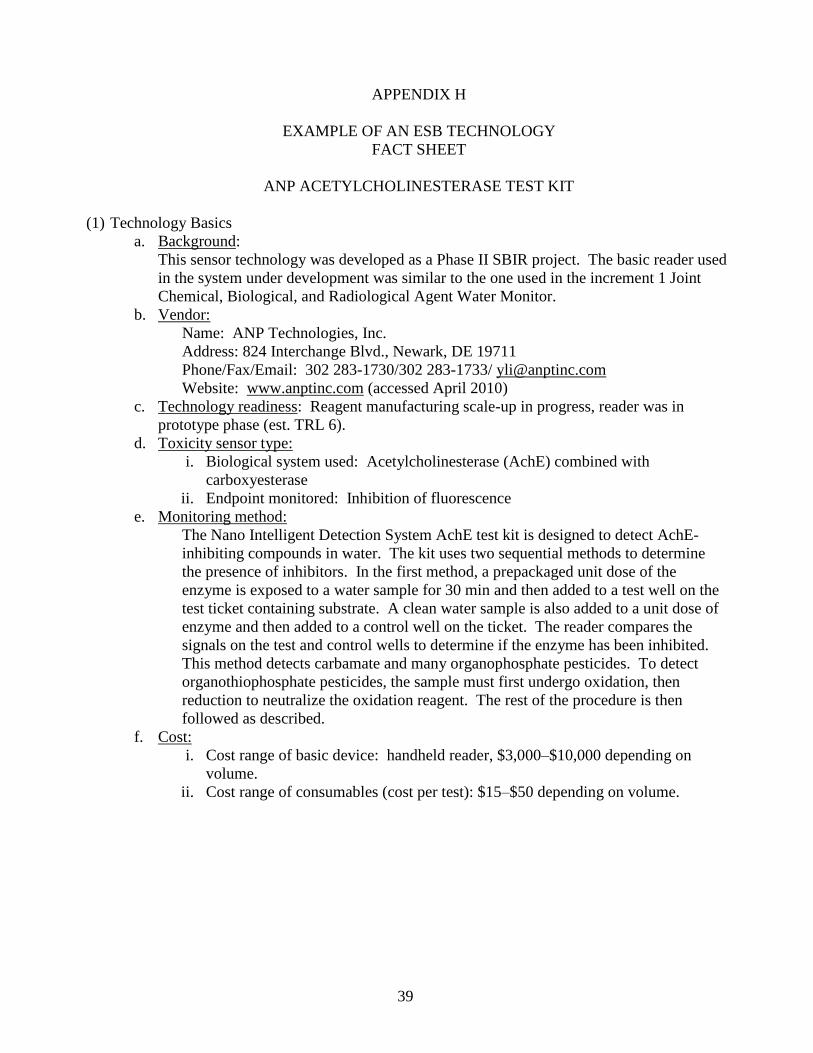
39
APPENDIX H
EXAMPLE OF AN ESB TECHNOLOGY
FACT SHEET
ANP ACETYLCHOLINESTERASE TEST KIT
(1) Technology Basics
a. Background:
This sensor technology was developed as a Phase II SBIR project. The basic reader used
in the system under development was similar to the one used in the increment 1 Joint
Chemical, Biological, and Radiological Agent Water Monitor.
b. Vendor:
Name: ANP Technologies, Inc.
Address: 824 Interchange Blvd., Newark, DE 19711
Phone/Fax/Email: 302 283-1730/302 283-1733/ [email protected]
Website: www.anptinc.com (accessed April 2010)
c. Technology readiness: Reagent manufacturing scale-up in progress, reader was in
prototype phase (est. TRL 6).
d. Toxicity sensor type:
i. Biological system used: Acetylcholinesterase (AchE) combined with
carboxyesterase
ii. Endpoint monitored: Inhibition of fluorescence
e. Monitoring method:
The Nano Intelligent Detection System AchE test kit is designed to detect AchE-
inhibiting compounds in water. The kit uses two sequential methods to determine
the presence of inhibitors. In the first method, a prepackaged unit dose of the
enzyme is exposed to a water sample for 30 min and then added to a test well on the
test ticket containing substrate. A clean water sample is also added to a unit dose of
enzyme and then added to a control well on the ticket. The reader compares the
signals on the test and control wells to determine if the enzyme has been inhibited.
This method detects carbamate and many organophosphate pesticides. To detect
organothiophosphate pesticides, the sample must first undergo oxidation, then
reduction to neutralize the oxidation reagent. The rest of the procedure is then
followed as described.
f. Cost:
i. Cost range of basic device: handheld reader, $3,000–$10,000 depending on
volume.
ii. Cost range of consumables (cost per test): $15–$50 depending on volume.
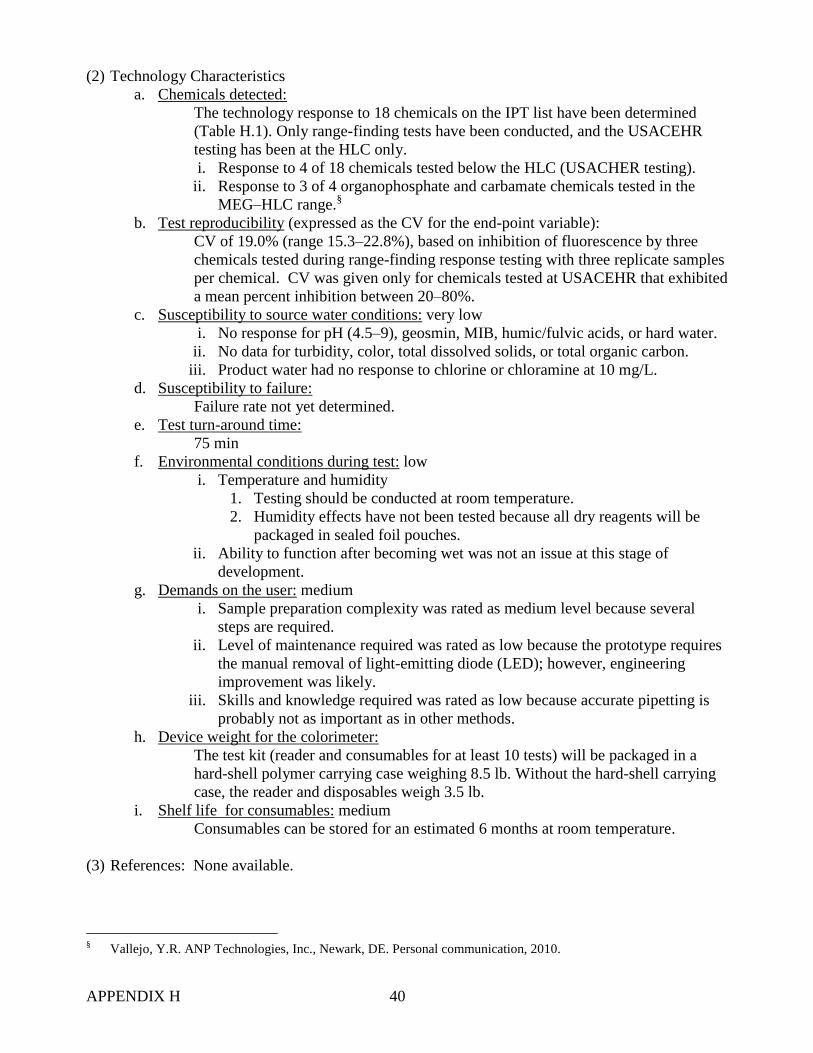
APPENDIX H 40
(2) Technology Characteristics
a. Chemicals detected:
The technology response to 18 chemicals on the IPT list have been determined
(Table H.1). Only range-finding tests have been conducted, and the USACEHR
testing has been at the HLC only.
i. Response to 4 of 18 chemicals tested below the HLC (USACHER testing).
ii. Response to 3 of 4 organophosphate and carbamate chemicals tested in the
MEG–HLC range.§
b. Test reproducibility (expressed as the CV for the end-point variable):
CV of 19.0% (range 15.3–22.8%), based on inhibition of fluorescence by three
chemicals tested during range-finding response testing with three replicate samples
per chemical. CV was given only for chemicals tested at USACEHR that exhibited
a mean percent inhibition between 20–80%.
c. Susceptibility to source water conditions: very low
i. No response for pH (4.5–9), geosmin, MIB, humic/fulvic acids, or hard water.
ii. No data for turbidity, color, total dissolved solids, or total organic carbon.
iii. Product water had no response to chlorine or chloramine at 10 mg/L.
d. Susceptibility to failure:
Failure rate not yet determined.
e. Test turn-around time:
75 min
f. Environmental conditions during test: low
i. Temperature and humidity
1. Testing should be conducted at room temperature.
2. Humidity effects have not been tested because all dry reagents will be
packaged in sealed foil pouches.
ii. Ability to function after becoming wet was not an issue at this stage of
development.
g. Demands on the user: medium
i. Sample preparation complexity was rated as medium level because several
steps are required.
ii. Level of maintenance required was rated as low because the prototype requires
the manual removal of light-emitting diode (LED); however, engineering
improvement was likely.
iii. Skills and knowledge required was rated as low because accurate pipetting is
probably not as important as in other methods.
h. Device weight for the colorimeter:
The test kit (reader and consumables for at least 10 tests) will be packaged in a
hard-shell polymer carrying case weighing 8.5 lb. Without the hard-shell carrying
case, the reader and disposables weigh 3.5 lb.
i. Shelf life for consumables: medium
Consumables can be stored for an estimated 6 months at room temperature.
(3) References: None available.
§ Vallejo, Y.R. ANP Technologies, Inc., Newark, DE. Personal communication, 2010.
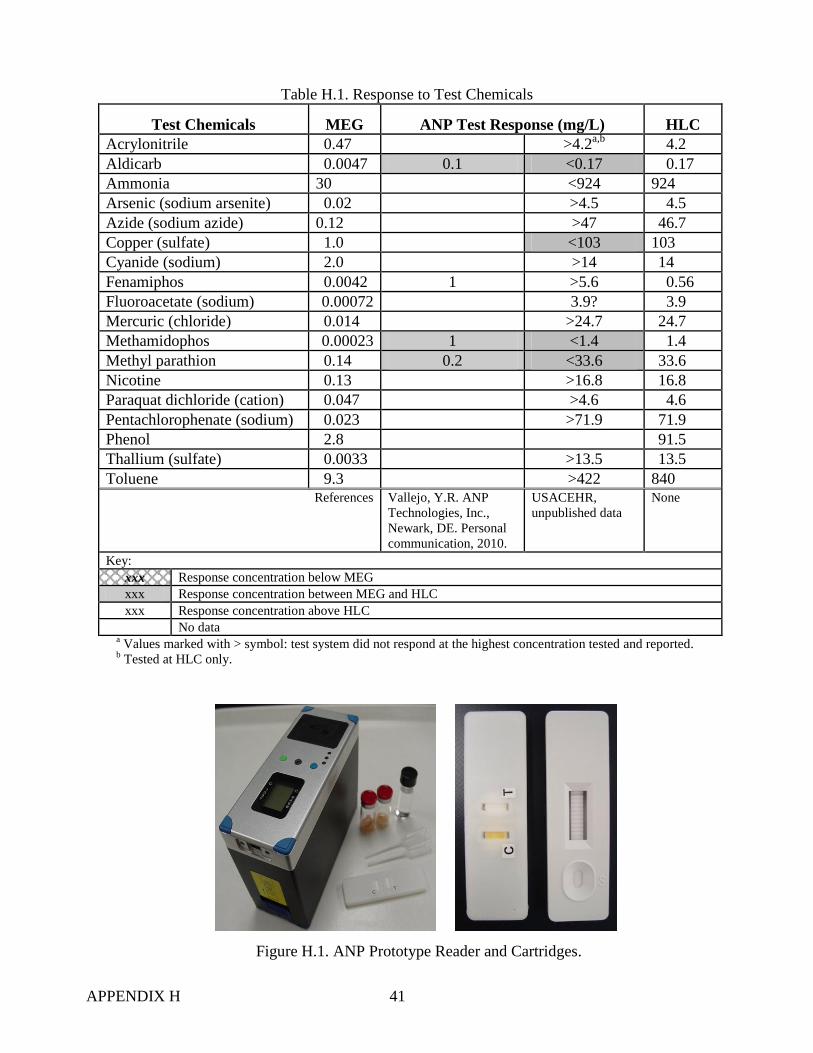
APPENDIX H 41
Table H.1. Response to Test Chemicals
a Values marked with > symbol: test system did not respond at the highest concentration tested and reported.
b Tested at HLC only.
Figure H.1. ANP Prototype Reader and Cartridges.
Test Chemicals MEG ANP Test Response (mg/L) HLC
Acrylonitrile 0.47 >4.2a,b
4.2
Aldicarb 0.0047 0.1 <0.17 0.17
Ammonia 30 <924 924
Arsenic (sodium arsenite) 0.02 >4.5 4.5
Azide (sodium azide) 0.12 >47 46.7
Copper (sulfate) 1.0 <103 103
Cyanide (sodium) 2.0 >14 14
Fenamiphos 0.0042 1 >5.6 0.56
Fluoroacetate (sodium) 0.00072 3.9? 3.9
Mercuric (chloride) 0.014 >24.7 24.7
Methamidophos 0.00023 1 <1.4 1.4
Methyl parathion 0.14 0.2 <33.6 33.6
Nicotine 0.13 >16.8 16.8
Paraquat dichloride (cation) 0.047 >4.6 4.6
Pentachlorophenate (sodium) 0.023 >71.9 71.9
Phenol 2.8 91.5
Thallium (sulfate) 0.0033 >13.5 13.5
Toluene 9.3 >422 840 References Vallejo, Y.R. ANP
Technologies, Inc.,
Newark, DE. Personal
communication, 2010.
USACEHR,
unpublished data
None
Key: xxx Response concentration below MEG
xxx Response concentration between MEG and HLC
xxx Response concentration above HLC
No data

42
Blank
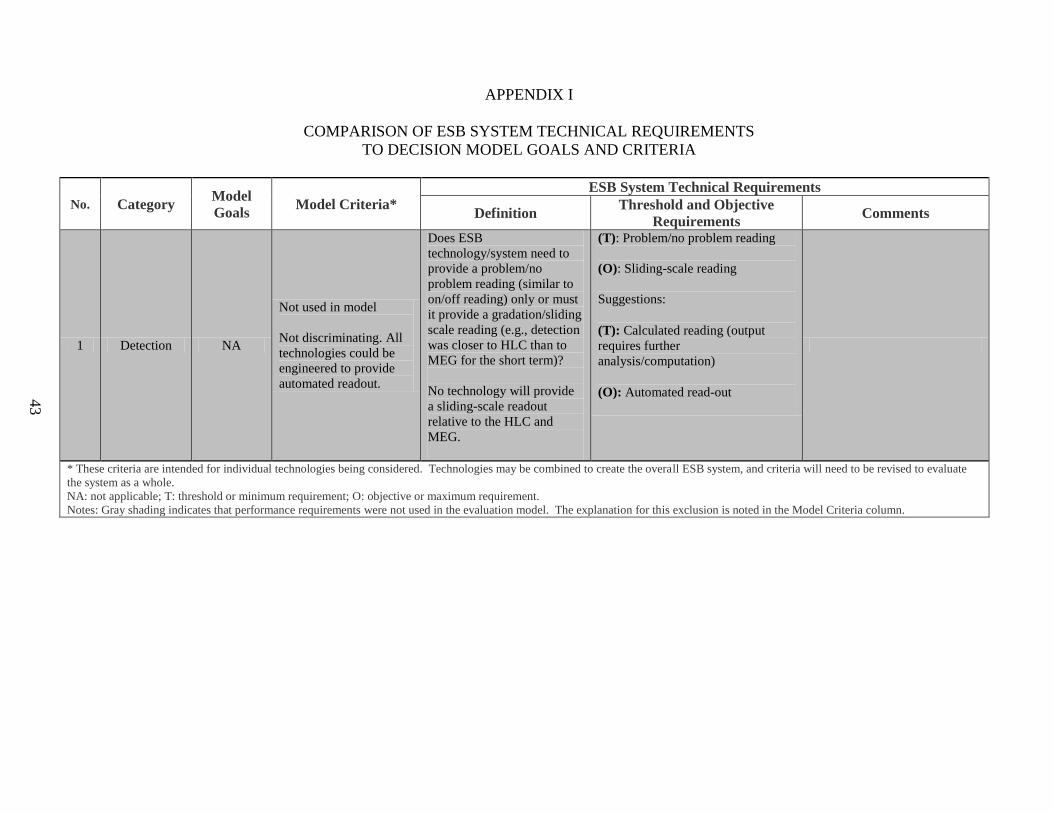
43
APPENDIX I
COMPARISON OF ESB SYSTEM TECHNICAL REQUIREMENTS
TO DECISION MODEL GOALS AND CRITERIA
No. Category Model
Goals Model Criteria*
ESB System Technical Requirements
Definition Threshold and Objective
Requirements Comments
1 Detection NA
Not used in model
Not discriminating. All
technologies could be
engineered to provide
automated readout.
Does ESB
technology/system need to
provide a problem/no
problem reading (similar to
on/off reading) only or must
it provide a gradation/sliding
scale reading (e.g., detection
was closer to HLC than to
MEG for the short term)?
No technology will provide
a sliding-scale readout
relative to the HLC and
MEG.
(T): Problem/no problem reading
(O): Sliding-scale reading
Suggestions:
(T): Calculated reading (output
requires further
analysis/computation)
(O): Automated read-out
* These criteria are intended for individual technologies being considered. Technologies may be combined to create the overall ESB system, and criteria will need to be revised to evaluate
the system as a whole.
NA: not applicable; T: threshold or minimum requirement; O: objective or maximum requirement.
Notes: Gray shading indicates that performance requirements were not used in the evaluation model. The explanation for this exclusion is noted in the Model Criteria column.
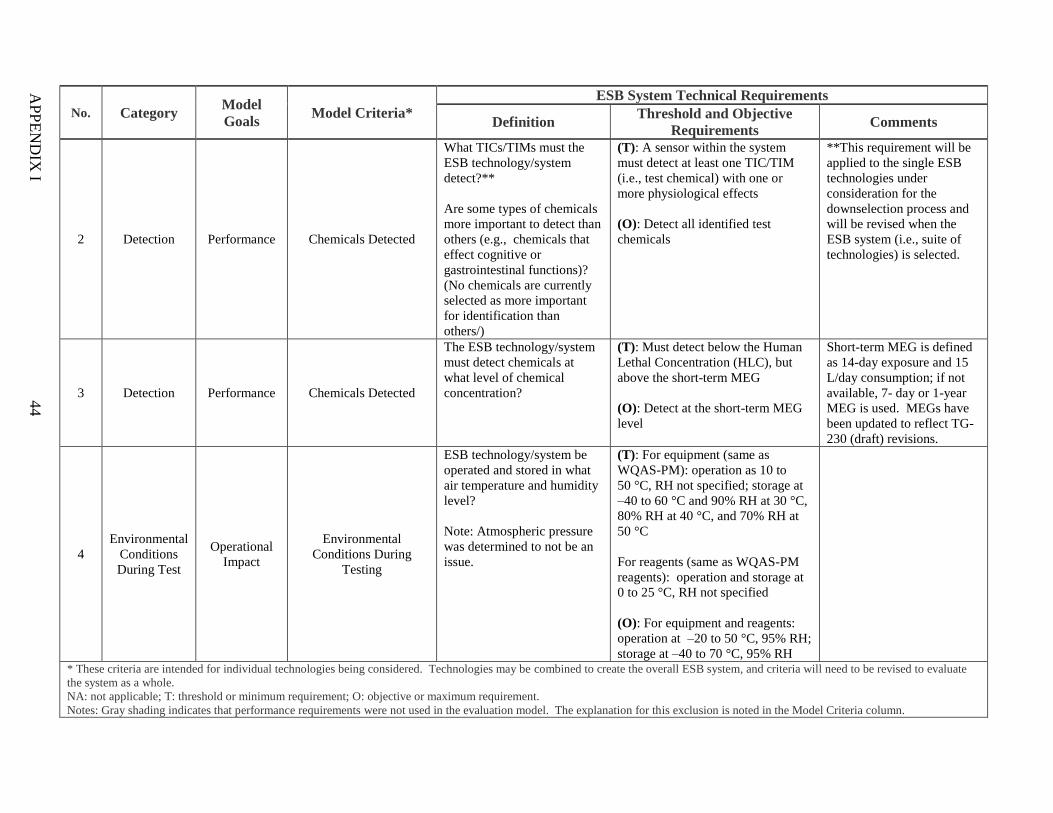
AP
PE
ND
IX I
44
No. Category Model
Goals Model Criteria*
ESB System Technical Requirements
Definition Threshold and Objective
Requirements Comments
2 Detection Performance Chemicals Detected
What TICs/TIMs must the
ESB technology/system
detect?**
Are some types of chemicals
more important to detect than
others (e.g., chemicals that
effect cognitive or
gastrointestinal functions)?
(No chemicals are currently
selected as more important
for identification than
others/)
(T): A sensor within the system
must detect at least one TIC/TIM
(i.e., test chemical) with one or
more physiological effects
(O): Detect all identified test
chemicals
**This requirement will be
applied to the single ESB
technologies under
consideration for the
downselection process and
will be revised when the
ESB system (i.e., suite of
technologies) is selected.
3 Detection Performance Chemicals Detected
The ESB technology/system
must detect chemicals at
what level of chemical
concentration?
(T): Must detect below the Human
Lethal Concentration (HLC), but
above the short-term MEG
(O): Detect at the short-term MEG
level
Short-term MEG is defined
as 14-day exposure and 15
L/day consumption; if not
available, 7- day or 1-year
MEG is used. MEGs have
been updated to reflect TG-
230 (draft) revisions.
4
Environmental
Conditions
During Test
Operational
Impact
Environmental
Conditions During
Testing
ESB technology/system be
operated and stored in what
air temperature and humidity
level?
Note: Atmospheric pressure
was determined to not be an
issue.
(T): For equipment (same as
WQAS-PM): operation as 10 to
50 °C, RH not specified; storage at
–40 to 60 °C and 90% RH at 30 °C,
80% RH at 40 °C, and 70% RH at
50 °C
For reagents (same as WQAS-PM
reagents): operation and storage at
0 to 25 °C, RH not specified
(O): For equipment and reagents:
operation at –20 to 50 °C, 95% RH;
storage at –40 to 70 °C, 95% RH
* These criteria are intended for individual technologies being considered. Technologies may be combined to create the overall ESB system, and criteria will need to be revised to evaluate
the system as a whole.
NA: not applicable; T: threshold or minimum requirement; O: objective or maximum requirement.
Notes: Gray shading indicates that performance requirements were not used in the evaluation model. The explanation for this exclusion is noted in the Model Criteria column.
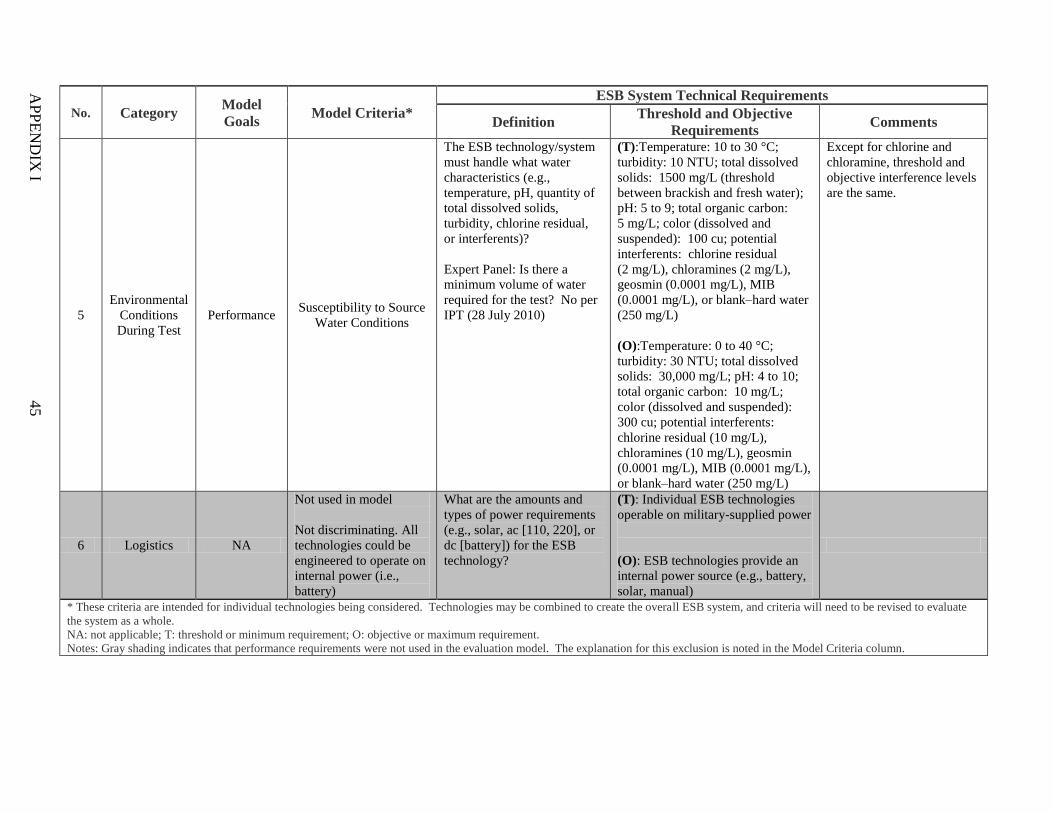
AP
PE
ND
IX I
45
No. Category Model
Goals Model Criteria*
ESB System Technical Requirements
Definition Threshold and Objective
Requirements Comments
5
Environmental
Conditions
During Test
Performance Susceptibility to Source
Water Conditions
The ESB technology/system
must handle what water
characteristics (e.g.,
temperature, pH, quantity of
total dissolved solids,
turbidity, chlorine residual,
or interferents)?
Expert Panel: Is there a
minimum volume of water
required for the test? No per
IPT (28 July 2010)
(T):Temperature: 10 to 30 °C;
turbidity: 10 NTU; total dissolved
solids: 1500 mg/L (threshold
between brackish and fresh water);
pH: 5 to 9; total organic carbon:
5 mg/L; color (dissolved and
suspended): 100 cu; potential
interferents: chlorine residual
(2 mg/L), chloramines (2 mg/L),
geosmin (0.0001 mg/L), MIB
(0.0001 mg/L), or blank–hard water
(250 mg/L)
(O):Temperature: 0 to 40 °C;
turbidity: 30 NTU; total dissolved
solids: 30,000 mg/L; pH: 4 to 10;
total organic carbon: 10 mg/L;
color (dissolved and suspended):
300 cu; potential interferents:
chlorine residual (10 mg/L),
chloramines (10 mg/L), geosmin
(0.0001 mg/L), MIB (0.0001 mg/L),
or blank–hard water (250 mg/L)
Except for chlorine and
chloramine, threshold and
objective interference levels
are the same.
6 Logistics NA
Not used in model
Not discriminating. All
technologies could be
engineered to operate on
internal power (i.e.,
battery)
What are the amounts and
types of power requirements
(e.g., solar, ac [110, 220], or
dc [battery]) for the ESB
technology?
(T): Individual ESB technologies
operable on military-supplied power
(O): ESB technologies provide an
internal power source (e.g., battery,
solar, manual)
* These criteria are intended for individual technologies being considered. Technologies may be combined to create the overall ESB system, and criteria will need to be revised to evaluate
the system as a whole.
NA: not applicable; T: threshold or minimum requirement; O: objective or maximum requirement.
Notes: Gray shading indicates that performance requirements were not used in the evaluation model. The explanation for this exclusion is noted in the Model Criteria column.
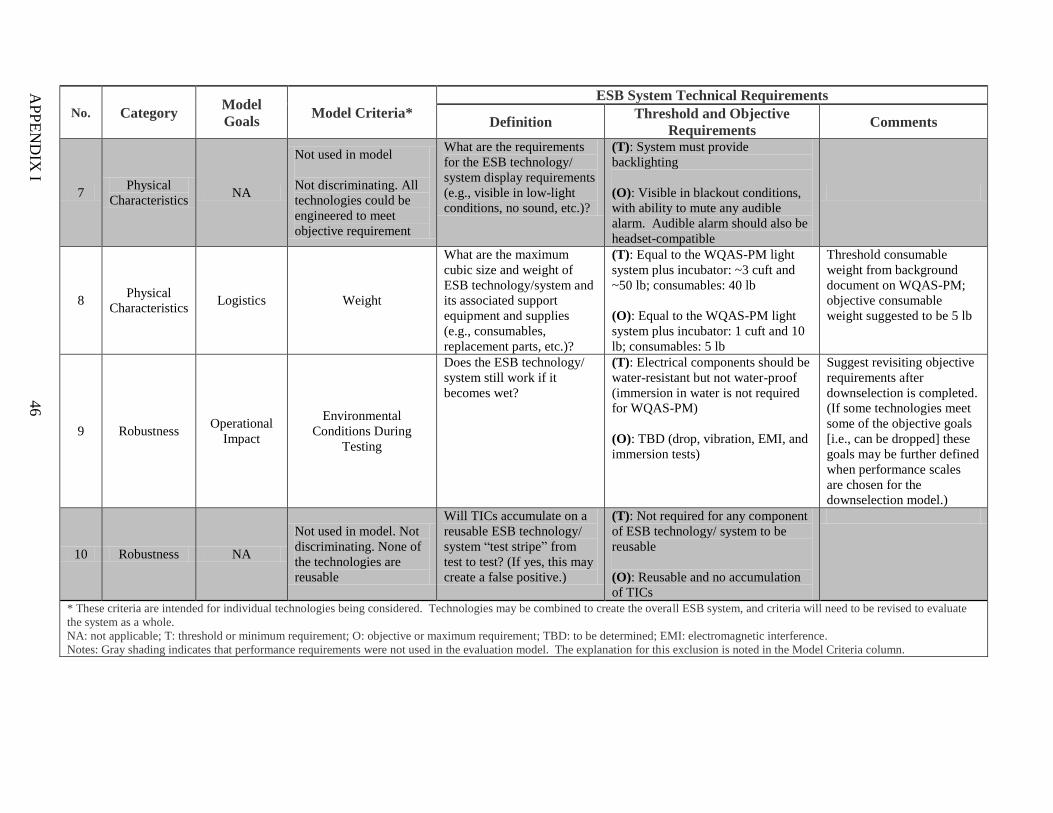
AP
PE
ND
IX I
46
No. Category Model
Goals Model Criteria*
ESB System Technical Requirements
Definition Threshold and Objective
Requirements Comments
7 Physical
Characteristics NA
Not used in model
Not discriminating. All
technologies could be
engineered to meet
objective requirement
What are the requirements
for the ESB technology/
system display requirements
(e.g., visible in low-light
conditions, no sound, etc.)?
(T): System must provide
backlighting
(O): Visible in blackout conditions,
with ability to mute any audible
alarm. Audible alarm should also be
headset-compatible
8 Physical
Characteristics Logistics Weight
What are the maximum
cubic size and weight of
ESB technology/system and
its associated support
equipment and supplies
(e.g., consumables,
replacement parts, etc.)?
(T): Equal to the WQAS-PM light
system plus incubator: ~3 cuft and
~50 lb; consumables: 40 lb
(O): Equal to the WQAS-PM light
system plus incubator: 1 cuft and 10
lb; consumables: 5 lb
Threshold consumable
weight from background
document on WQAS-PM;
objective consumable
weight suggested to be 5 lb
9 Robustness Operational
Impact
Environmental
Conditions During
Testing
Does the ESB technology/
system still work if it
becomes wet?
(T): Electrical components should be
water-resistant but not water-proof
(immersion in water is not required
for WQAS-PM)
(O): TBD (drop, vibration, EMI, and
immersion tests)
Suggest revisiting objective
requirements after
downselection is completed.
(If some technologies meet
some of the objective goals
[i.e., can be dropped] these
goals may be further defined
when performance scales
are chosen for the
downselection model.)
10 Robustness NA
Not used in model. Not
discriminating. None of
the technologies are
reusable
Will TICs accumulate on a
reusable ESB technology/
system “test stripe” from
test to test? (If yes, this may
create a false positive.)
(T): Not required for any component
of ESB technology/ system to be
reusable
(O): Reusable and no accumulation
of TICs
* These criteria are intended for individual technologies being considered. Technologies may be combined to create the overall ESB system, and criteria will need to be revised to evaluate
the system as a whole.
NA: not applicable; T: threshold or minimum requirement; O: objective or maximum requirement; TBD: to be determined; EMI: electromagnetic interference.
Notes: Gray shading indicates that performance requirements were not used in the evaluation model. The explanation for this exclusion is noted in the Model Criteria column.
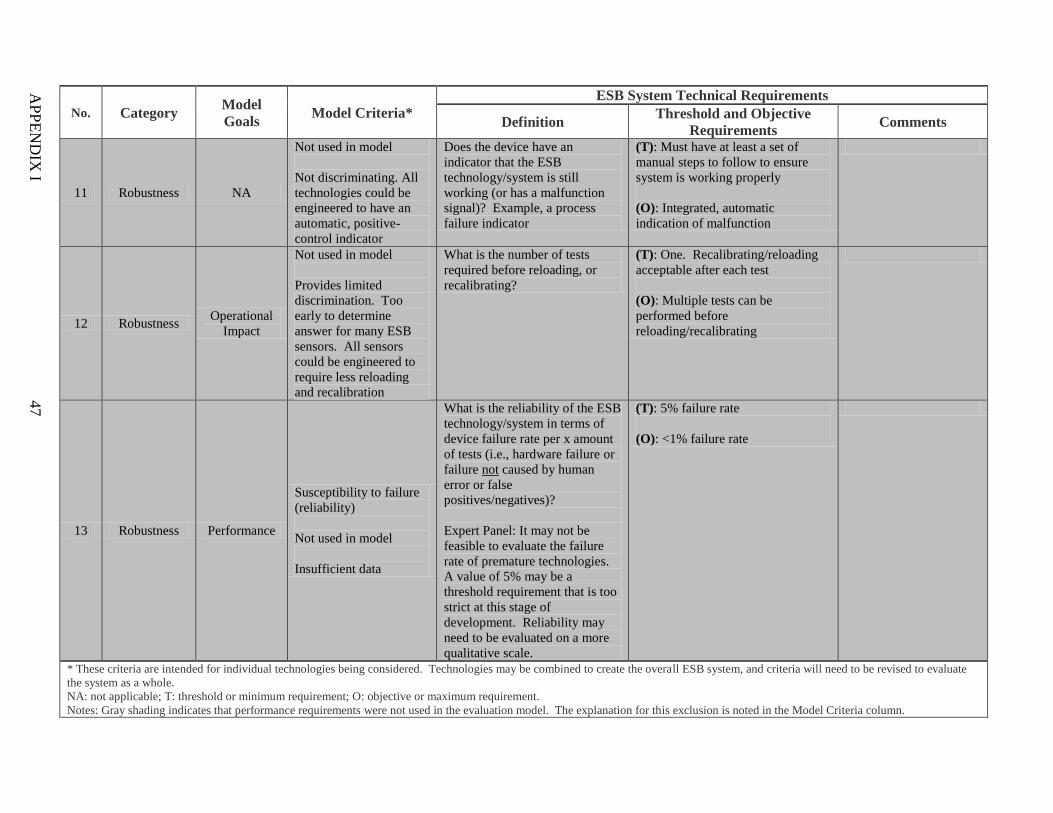
AP
PE
ND
IX I
47
No. Category Model
Goals Model Criteria*
ESB System Technical Requirements
Definition Threshold and Objective
Requirements Comments
11 Robustness NA
Not used in model
Not discriminating. All
technologies could be
engineered to have an
automatic, positive-
control indicator
Does the device have an
indicator that the ESB
technology/system is still
working (or has a malfunction
signal)? Example, a process
failure indicator
(T): Must have at least a set of
manual steps to follow to ensure
system is working properly
(O): Integrated, automatic
indication of malfunction
12 Robustness Operational
Impact
Not used in model
Provides limited
discrimination. Too
early to determine
answer for many ESB
sensors. All sensors
could be engineered to
require less reloading
and recalibration
What is the number of tests
required before reloading, or
recalibrating?
(T): One. Recalibrating/reloading
acceptable after each test
(O): Multiple tests can be
performed before
reloading/recalibrating
13 Robustness Performance
Susceptibility to failure
(reliability)
Not used in model
Insufficient data
What is the reliability of the ESB
technology/system in terms of
device failure rate per x amount
of tests (i.e., hardware failure or
failure not caused by human
error or false
positives/negatives)?
Expert Panel: It may not be
feasible to evaluate the failure
rate of premature technologies.
A value of 5% may be a
threshold requirement that is too
strict at this stage of
development. Reliability may
need to be evaluated on a more
qualitative scale.
(T): 5% failure rate
(O): <1% failure rate
* These criteria are intended for individual technologies being considered. Technologies may be combined to create the overall ESB system, and criteria will need to be revised to evaluate
the system as a whole.
NA: not applicable; T: threshold or minimum requirement; O: objective or maximum requirement.
Notes: Gray shading indicates that performance requirements were not used in the evaluation model. The explanation for this exclusion is noted in the Model Criteria column.
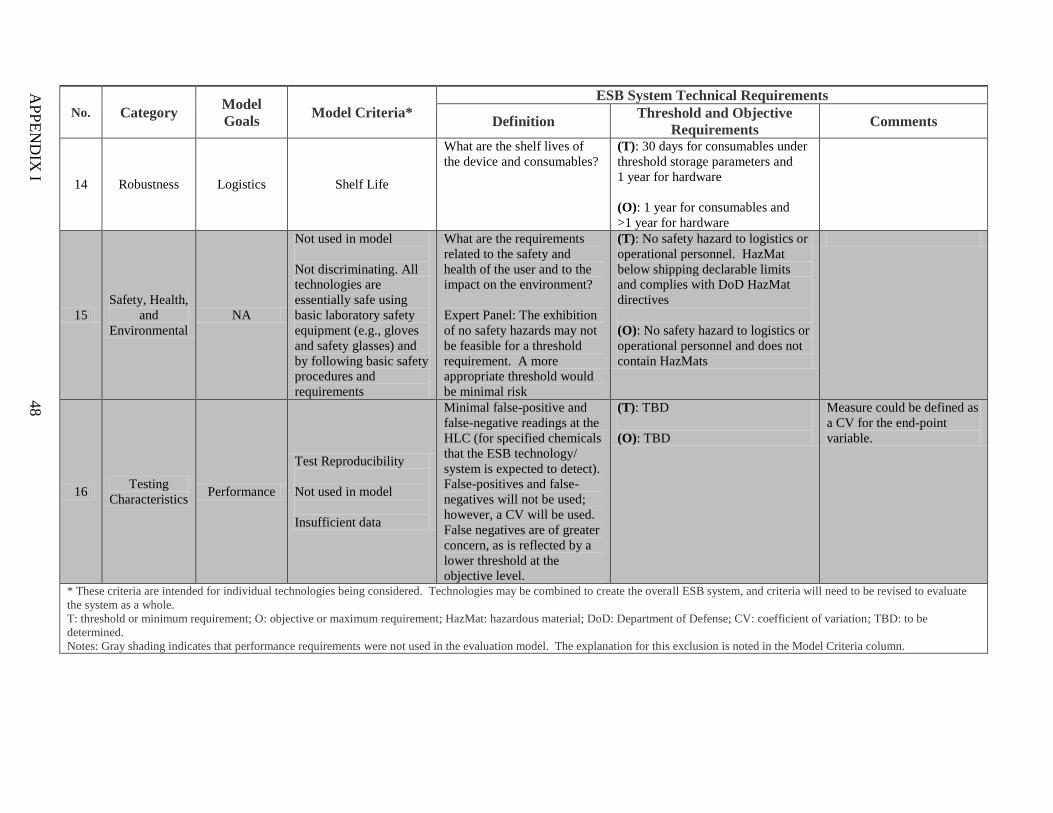
AP
PE
ND
IX I
48
No. Category Model
Goals Model Criteria*
ESB System Technical Requirements
Definition Threshold and Objective
Requirements Comments
14 Robustness Logistics Shelf Life
What are the shelf lives of
the device and consumables?
(T): 30 days for consumables under
threshold storage parameters and
1 year for hardware
(O): 1 year for consumables and
>1 year for hardware
15
Safety, Health,
and
Environmental
NA
Not used in model
Not discriminating. All
technologies are
essentially safe using
basic laboratory safety
equipment (e.g., gloves
and safety glasses) and
by following basic safety
procedures and
requirements
What are the requirements
related to the safety and
health of the user and to the
impact on the environment?
Expert Panel: The exhibition
of no safety hazards may not
be feasible for a threshold
requirement. A more
appropriate threshold would
be minimal risk
(T): No safety hazard to logistics or
operational personnel. HazMat
below shipping declarable limits
and complies with DoD HazMat
directives
(O): No safety hazard to logistics or
operational personnel and does not
contain HazMats
16 Testing
Characteristics Performance
Test Reproducibility
Not used in model
Insufficient data
Minimal false-positive and
false-negative readings at the
HLC (for specified chemicals
that the ESB technology/
system is expected to detect).
False-positives and false-
negatives will not be used;
however, a CV will be used.
False negatives are of greater
concern, as is reflected by a
lower threshold at the
objective level.
(T): TBD
(O): TBD
Measure could be defined as
a CV for the end-point
variable.
* These criteria are intended for individual technologies being considered. Technologies may be combined to create the overall ESB system, and criteria will need to be revised to evaluate
the system as a whole.
T: threshold or minimum requirement; O: objective or maximum requirement; HazMat: hazardous material; DoD: Department of Defense; CV: coefficient of variation; TBD: to be
determined.
Notes: Gray shading indicates that performance requirements were not used in the evaluation model. The explanation for this exclusion is noted in the Model Criteria column.
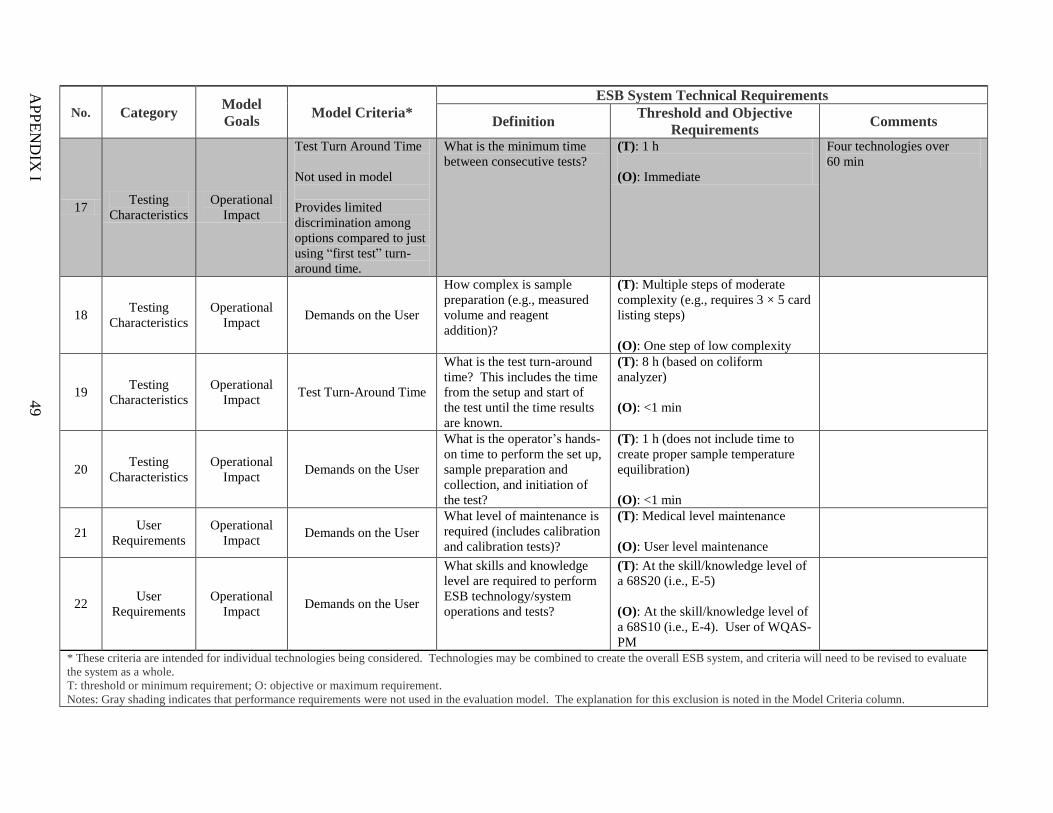
AP
PE
ND
IX I
49
No. Category Model
Goals Model Criteria*
ESB System Technical Requirements
Definition Threshold and Objective
Requirements Comments
17 Testing
Characteristics
Operational
Impact
Test Turn Around Time
Not used in model
Provides limited
discrimination among
options compared to just
using “first test” turn-
around time.
What is the minimum time
between consecutive tests?
(T): 1 h
(O): Immediate
Four technologies over
60 min
18 Testing
Characteristics
Operational
Impact Demands on the User
How complex is sample
preparation (e.g., measured
volume and reagent
addition)?
(T): Multiple steps of moderate
complexity (e.g., requires 3 × 5 card
listing steps)
(O): One step of low complexity
19 Testing
Characteristics
Operational
Impact Test Turn-Around Time
What is the test turn-around
time? This includes the time
from the setup and start of
the test until the time results
are known.
(T): 8 h (based on coliform
analyzer)
(O): <1 min
20 Testing
Characteristics
Operational
Impact Demands on the User
What is the operator’s hands-
on time to perform the set up,
sample preparation and
collection, and initiation of
the test?
(T): 1 h (does not include time to
create proper sample temperature
equilibration)
(O): <1 min
21 User
Requirements
Operational
Impact Demands on the User
What level of maintenance is
required (includes calibration
and calibration tests)?
(T): Medical level maintenance
(O): User level maintenance
22 User
Requirements
Operational
Impact Demands on the User
What skills and knowledge
level are required to perform
ESB technology/system
operations and tests?
(T): At the skill/knowledge level of
a 68S20 (i.e., E-5)
(O): At the skill/knowledge level of
a 68S10 (i.e., E-4). User of WQAS-
PM
* These criteria are intended for individual technologies being considered. Technologies may be combined to create the overall ESB system, and criteria will need to be revised to evaluate
the system as a whole.
T: threshold or minimum requirement; O: objective or maximum requirement.
Notes: Gray shading indicates that performance requirements were not used in the evaluation model. The explanation for this exclusion is noted in the Model Criteria column.

50
Blan
k
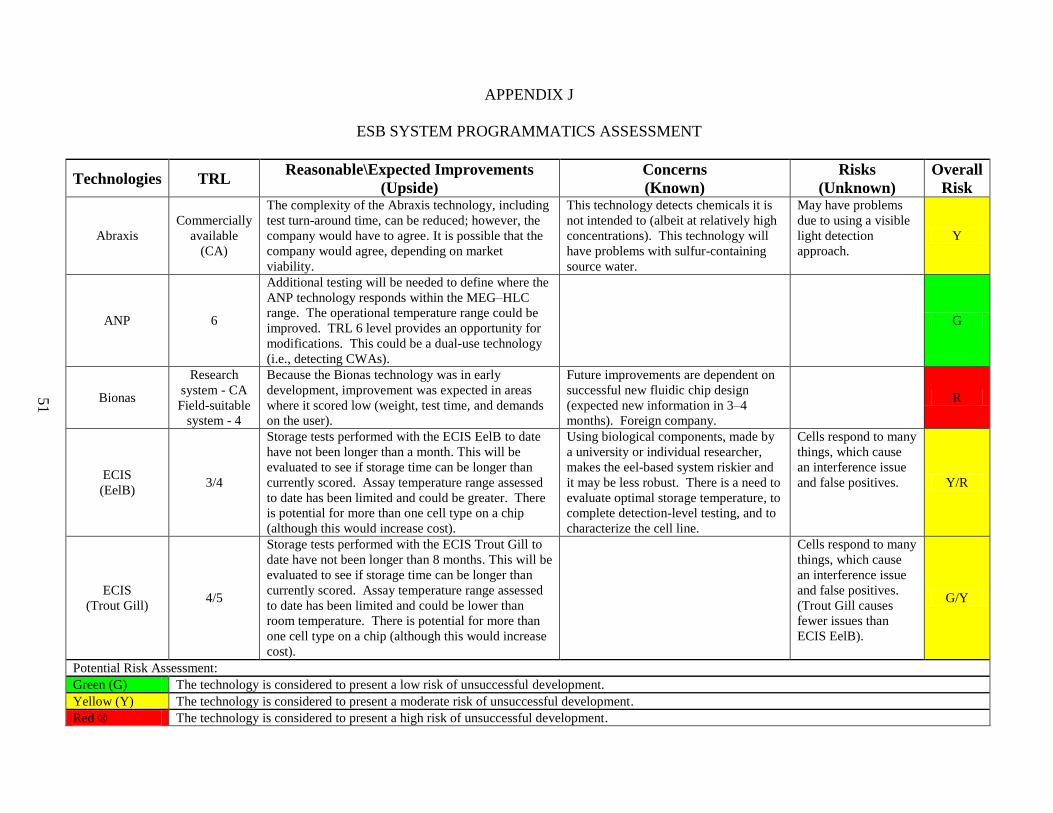
51
APPENDIX J
ESB SYSTEM PROGRAMMATICS ASSESSMENT
Technologies TRL Reasonable\Expected Improvements
(Upside)
Concerns
(Known)
Risks
(Unknown)
Overall
Risk
Abraxis
Commercially
available
(CA)
The complexity of the Abraxis technology, including
test turn-around time, can be reduced; however, the
company would have to agree. It is possible that the
company would agree, depending on market
viability.
This technology detects chemicals it is
not intended to (albeit at relatively high
concentrations). This technology will
have problems with sulfur-containing
source water.
May have problems
due to using a visible
light detection
approach.
Y
ANP 6
Additional testing will be needed to define where the
ANP technology responds within the MEG–HLC
range. The operational temperature range could be
improved. TRL 6 level provides an opportunity for
modifications. This could be a dual-use technology
(i.e., detecting CWAs).
G
Bionas
Research
system - CA
Field-suitable
system - 4
Because the Bionas technology was in early
development, improvement was expected in areas
where it scored low (weight, test time, and demands
on the user).
Future improvements are dependent on
successful new fluidic chip design
(expected new information in 3–4
months). Foreign company.
R
ECIS
(EelB) 3/4
Storage tests performed with the ECIS EelB to date
have not been longer than a month. This will be
evaluated to see if storage time can be longer than
currently scored. Assay temperature range assessed
to date has been limited and could be greater. There
is potential for more than one cell type on a chip
(although this would increase cost).
Using biological components, made by
a university or individual researcher,
makes the eel-based system riskier and
it may be less robust. There is a need to
evaluate optimal storage temperature, to
complete detection-level testing, and to
characterize the cell line.
Cells respond to many
things, which cause
an interference issue
and false positives. Y/R
ECIS
(Trout Gill) 4/5
Storage tests performed with the ECIS Trout Gill to
date have not been longer than 8 months. This will be
evaluated to see if storage time can be longer than
currently scored. Assay temperature range assessed
to date has been limited and could be lower than
room temperature. There is potential for more than
one cell type on a chip (although this would increase
cost).
Cells respond to many
things, which cause
an interference issue
and false positives.
(Trout Gill causes
fewer issues than
ECIS EelB).
G/Y
Potential Risk Assessment:
Green (G) The technology is considered to present a low risk of unsuccessful development.
Yellow (Y) The technology is considered to present a moderate risk of unsuccessful development.
Red ® The technology is considered to present a high risk of unsuccessful development.
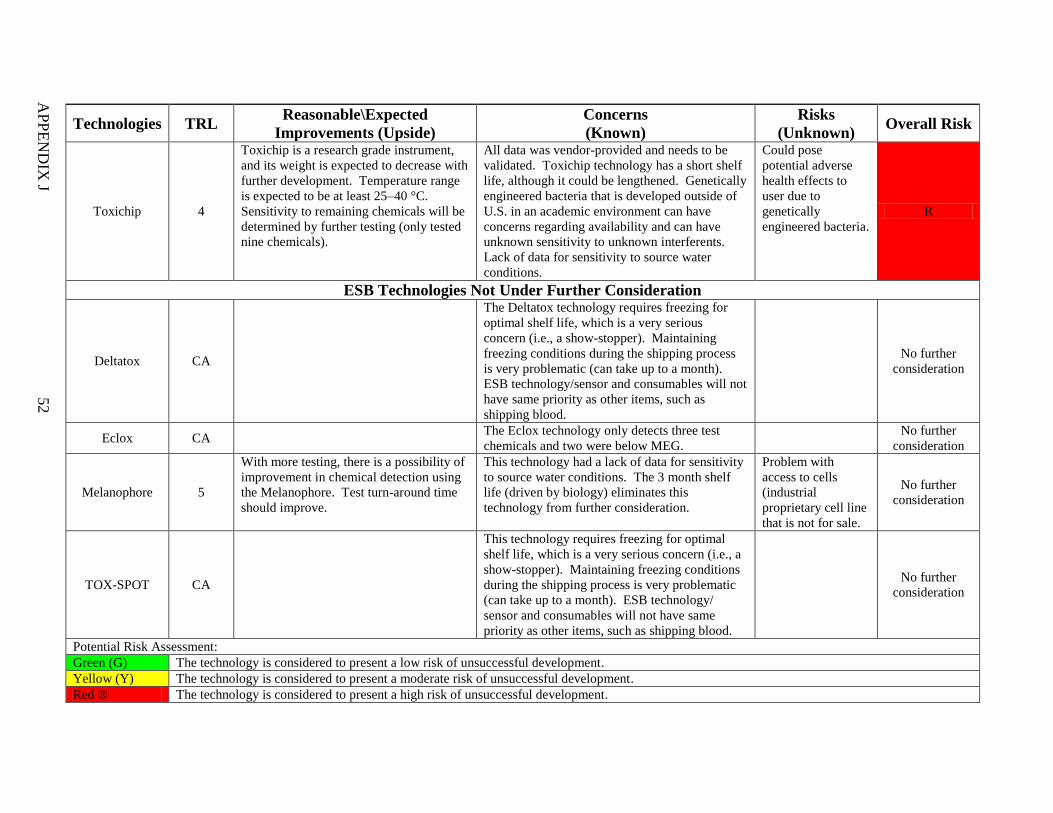
AP
PE
ND
IX J
5
2
Technologies TRL Reasonable\Expected
Improvements (Upside)
Concerns
(Known)
Risks
(Unknown) Overall Risk
Toxichip 4
Toxichip is a research grade instrument,
and its weight is expected to decrease with
further development. Temperature range
is expected to be at least 25–40 °C.
Sensitivity to remaining chemicals will be
determined by further testing (only tested
nine chemicals).
All data was vendor-provided and needs to be
validated. Toxichip technology has a short shelf
life, although it could be lengthened. Genetically
engineered bacteria that is developed outside of
U.S. in an academic environment can have
concerns regarding availability and can have
unknown sensitivity to unknown interferents.
Lack of data for sensitivity to source water
conditions.
Could pose
potential adverse
health effects to
user due to
genetically
engineered bacteria.
R
ESB Technologies Not Under Further Consideration
Deltatox CA
The Deltatox technology requires freezing for
optimal shelf life, which is a very serious
concern (i.e., a show-stopper). Maintaining
freezing conditions during the shipping process
is very problematic (can take up to a month).
ESB technology/sensor and consumables will not
have same priority as other items, such as
shipping blood.
No further
consideration
Eclox CA The Eclox technology only detects three test
chemicals and two were below MEG.
No further
consideration
Melanophore 5
With more testing, there is a possibility of
improvement in chemical detection using
the Melanophore. Test turn-around time
should improve.
This technology had a lack of data for sensitivity
to source water conditions. The 3 month shelf
life (driven by biology) eliminates this
technology from further consideration.
Problem with
access to cells
(industrial
proprietary cell line
that is not for sale.
No further
consideration
TOX-SPOT CA
This technology requires freezing for optimal
shelf life, which is a very serious concern (i.e., a
show-stopper). Maintaining freezing conditions
during the shipping process is very problematic
(can take up to a month). ESB technology/
sensor and consumables will not have same
priority as other items, such as shipping blood.
No further
consideration
Potential Risk Assessment:
Green (G) The technology is considered to present a low risk of unsuccessful development.
Yellow (Y) The technology is considered to present a moderate risk of unsuccessful development.
Red ® The technology is considered to present a high risk of unsuccessful development.
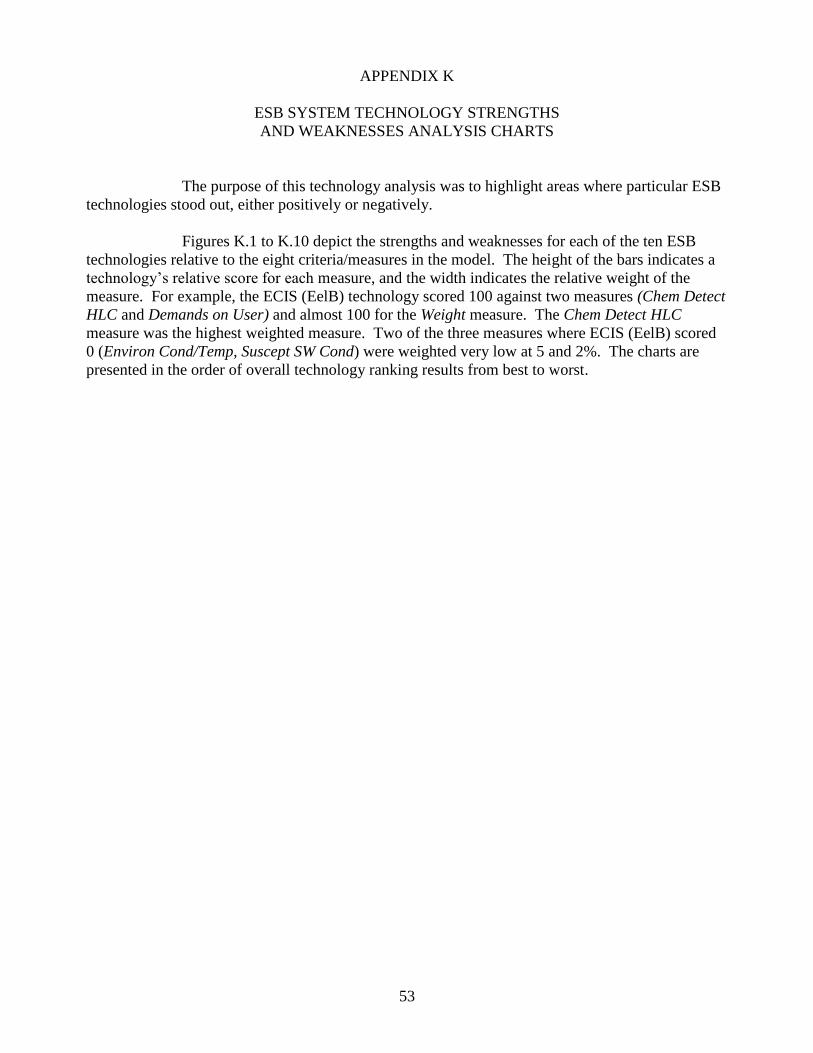
53
APPENDIX K
ESB SYSTEM TECHNOLOGY STRENGTHS
AND WEAKNESSES ANALYSIS CHARTS
The purpose of this technology analysis was to highlight areas where particular ESB
technologies stood out, either positively or negatively.
Figures K.1 to K.10 depict the strengths and weaknesses for each of the ten ESB
technologies relative to the eight criteria/measures in the model. The height of the bars indicates a
technology’s relative score for each measure, and the width indicates the relative weight of the
measure. For example, the ECIS (EelB) technology scored 100 against two measures (Chem Detect
HLC and Demands on User) and almost 100 for the Weight measure. The Chem Detect HLC
measure was the highest weighted measure. Two of the three measures where ECIS (EelB) scored
0 (Environ Cond/Temp, Suscept SW Cond) were weighted very low at 5 and 2%. The charts are
presented in the order of overall technology ranking results from best to worst.
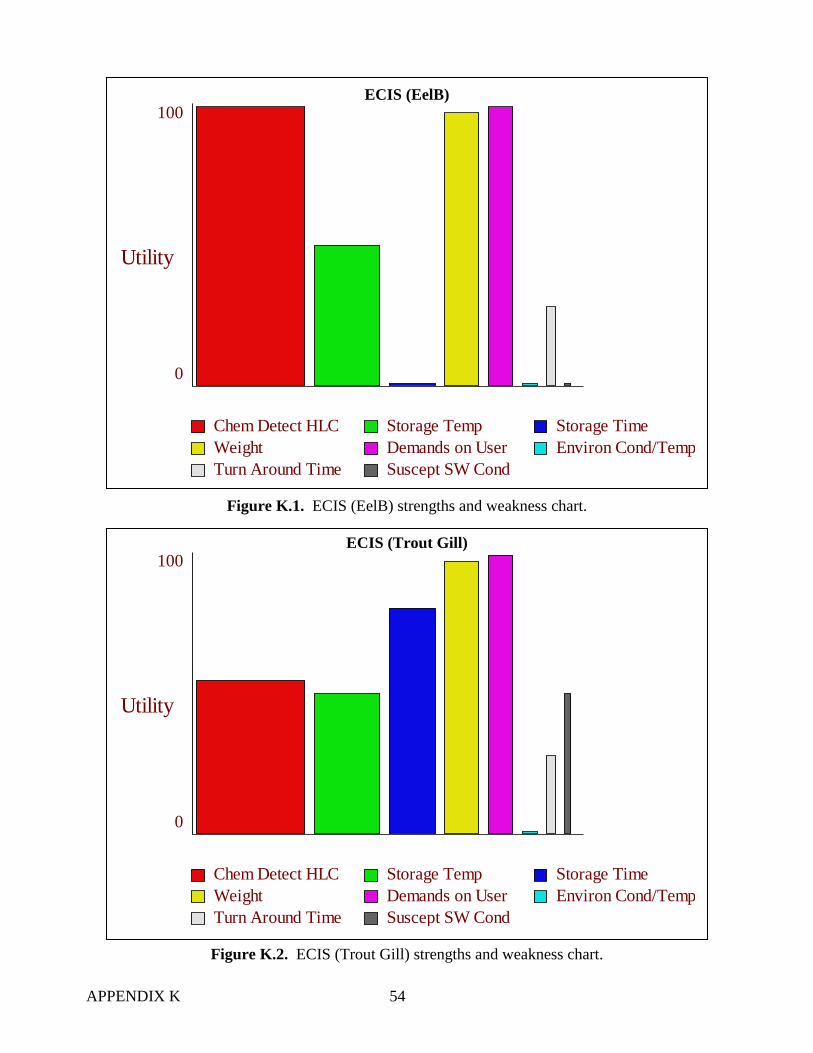
APPENDIX K 54
ECIS (EelB)
Figure K.1. ECIS (EelB) strengths and weakness chart.
ECIS (Trout Gill)
Figure K.2. ECIS (Trout Gill) strengths and weakness chart.
Utility
100
0
Chem Detect HLC
Weight
Turn Around Time
Storage Temp
Demands on User
Suscept SW Cond
Storage Time
Environ Cond/Temp
Utility
100
0
Chem Detect HLC
Weight
Turn Around Time
Storage Temp
Demands on User
Suscept SW Cond
Storage Time
Environ Cond/Temp

APPENDIX K 55
Abraxis
Figure K.3. Abraxis strengths and weakness chart.
ANP
Figure K.4. ANP strengths and weakness chart.
Utility
100
0
Chem Detect HLC
Weight
Turn Around Time
Storage Temp
Demands on User
Suscept SW Cond
Storage Time
Environ Cond/Temp
Utility
100
0
Chem Detect HLC
Weight
Turn Around Time
Storage Temp
Demands on User
Suscept SW Cond
Storage Time
Environ Cond/Temp
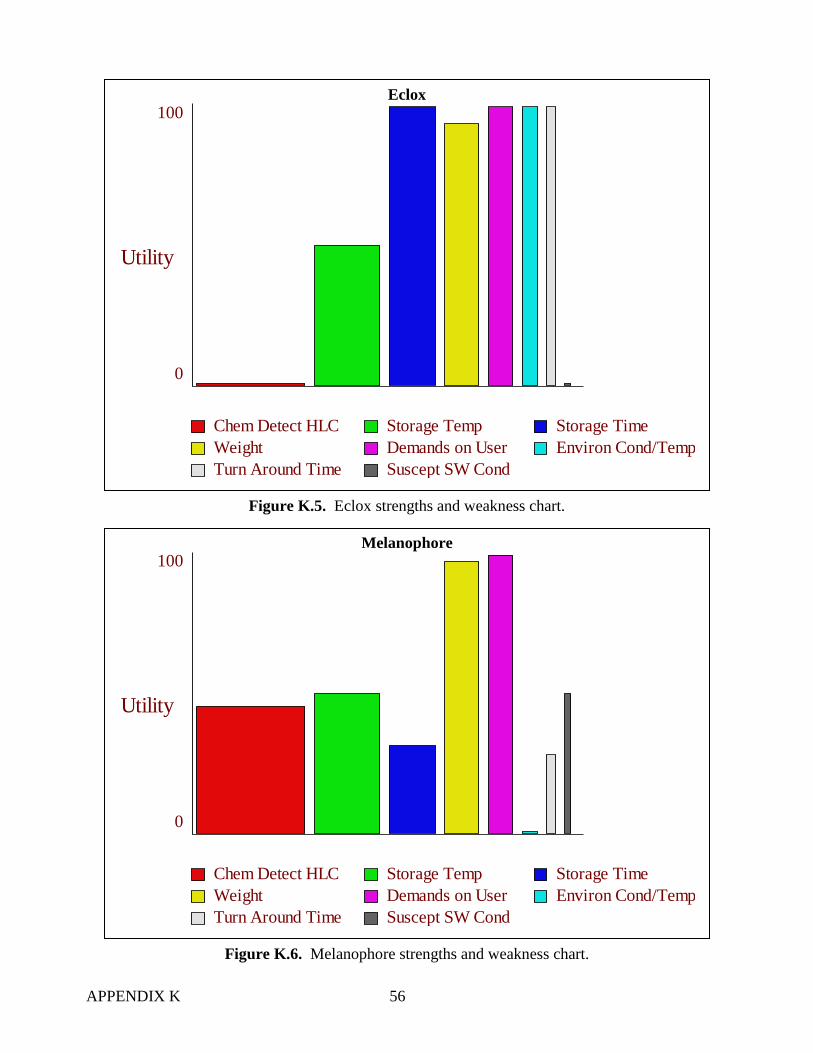
APPENDIX K 56
Eclox
Figure K.5. Eclox strengths and weakness chart.
Melanophore
Figure K.6. Melanophore strengths and weakness chart.
Utility
100
0
Chem Detect HLC
Weight
Turn Around Time
Storage Temp
Demands on User
Suscept SW Cond
Storage Time
Environ Cond/Temp
Utility
100
0
Chem Detect HLC
Weight
Turn Around Time
Storage Temp
Demands on User
Suscept SW Cond
Storage Time
Environ Cond/Temp
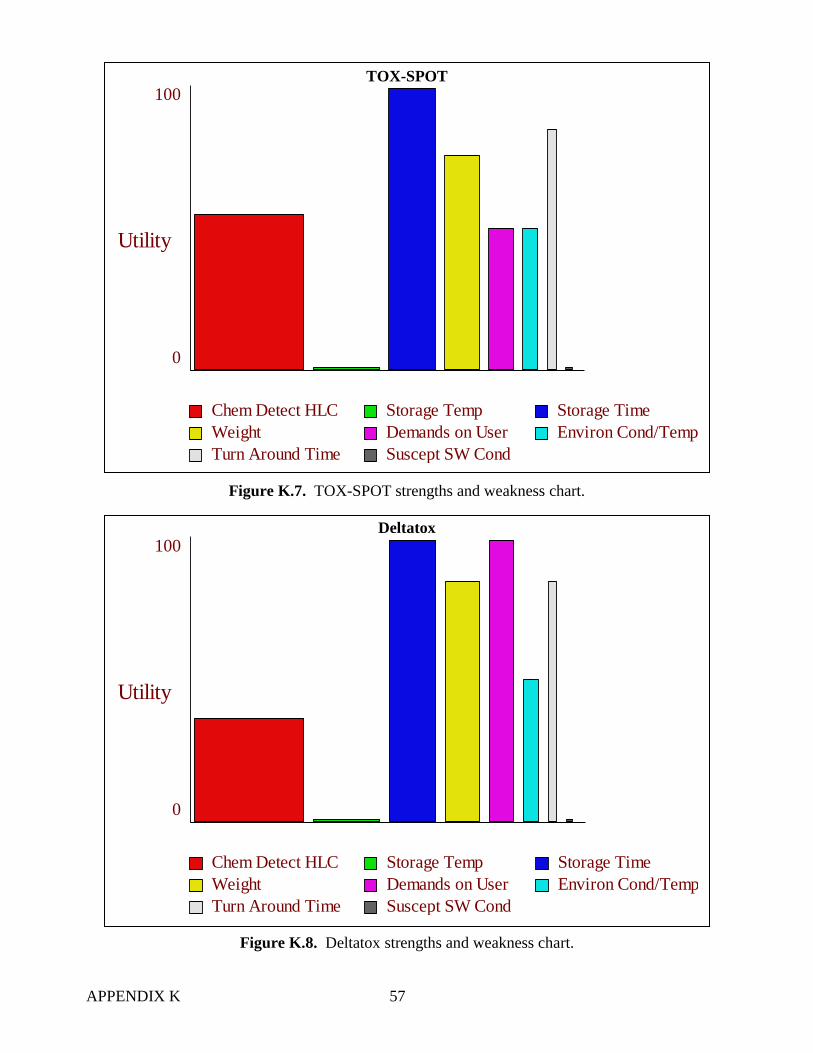
APPENDIX K 57
TOX-SPOT
Figure K.7. TOX-SPOT strengths and weakness chart.
Deltatox
Figure K.8. Deltatox strengths and weakness chart.
Utility
100
0
Chem Detect HLC
Weight
Turn Around Time
Storage Temp
Demands on User
Suscept SW Cond
Storage Time
Environ Cond/Temp
Utility
100
0
Chem Detect HLC
Weight
Turn Around Time
Storage Temp
Demands on User
Suscept SW Cond
Storage Time
Environ Cond/Temp
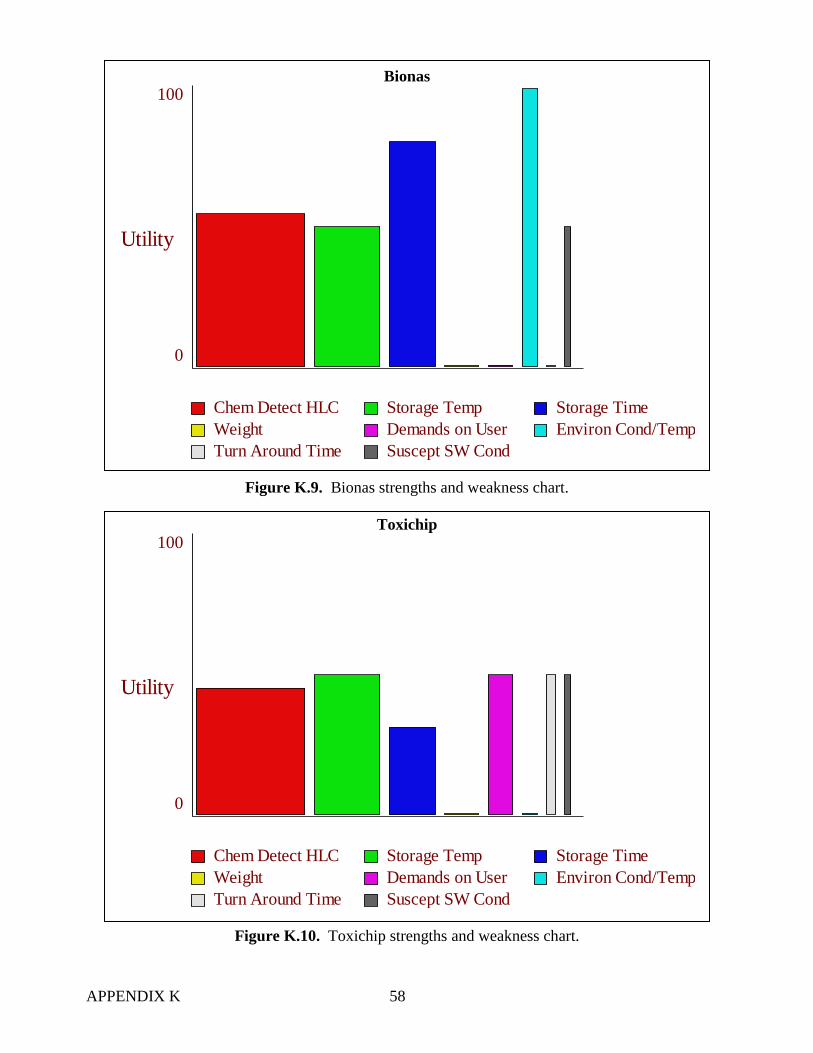
APPENDIX K 58
Bionas
Figure K.9. Bionas strengths and weakness chart.
Toxichip
Figure K.10. Toxichip strengths and weakness chart.
Utility
100
0
Chem Detect HLC
Weight
Turn Around Time
Storage Temp
Demands on User
Suscept SW Cond
Storage Time
Environ Cond/Temp
Utility
100
0
Chem Detect HLC
Weight
Turn Around Time
Storage Temp
Demands on User
Suscept SW Cond
Storage Time
Environ Cond/Temp