Embed Size (px)
Citation preview

Environmental Report
City of Helsinki 2014

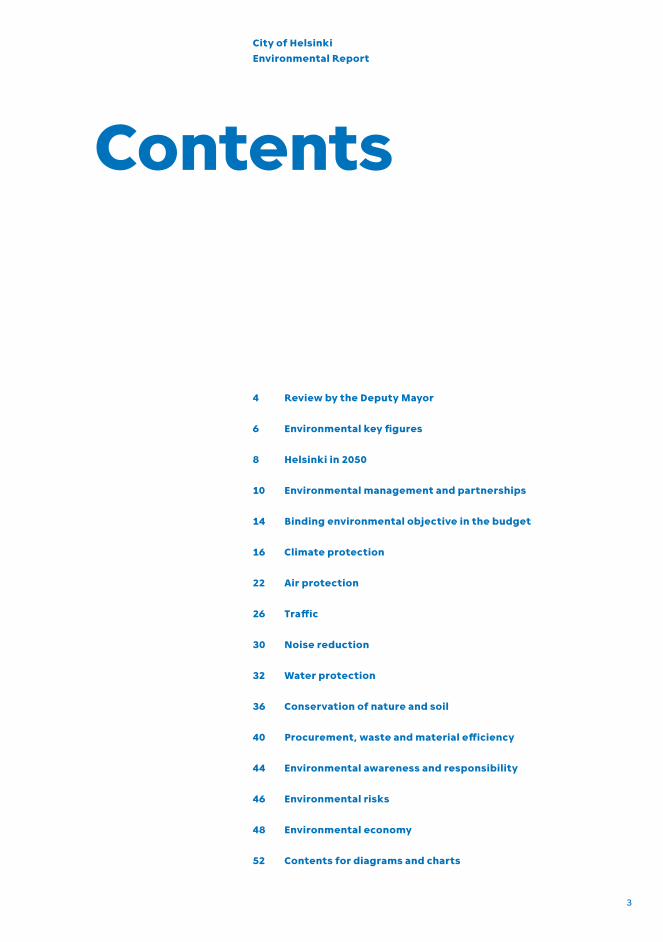
4 Review by the Deputy Mayor
6 Environmental key figures
8 Helsinki in 2050
10 Environmental management and partnerships
14 Binding environmental objective in the budget
16 Climate protection
22 Air protection
26 Traffic
30 Noise reduction
32 Water protection
36 Conservation of nature and soil
40 Procurement, waste and material efficiency
44 Environmental awareness and responsibility
46 Environmental risks
48 Environmental economy
52 Contents for diagrams and charts
City of HelsinkiEnvironmental Report
Contents
3

Review by the Deputy Mayor
Integration is the word of the day in environmental matters. In order to im-plement truly significant environmental policies, they need to be integrated with the city’s strategy and all management.
The most important environmental policy strategies have been merged with the city’s strategy for several years. Integration is also needed on other levels, so that the strategies can be implemented. Environmental manage-ment must be integrated with the management of departments and insti-tutes and environmental reporting must become a part of the normal annual and quarterly reports. The management must report about environmental matters as much as about any other important issues.
In Helsinki, environmental management has been carried out through environmental systems, programmes and reports already for several years.
Too often, environmental programmes are kept sepa-rate from other management and steered operations. Environmental reporting, however, has moved in a better direction: it is part of the city’s yearly reports, i.e. annual report, financial statement, HR report and environmental report, which have been developed as one during the recent years. There is still room for improvement: quarterly reporting should be more comprehensive in regard to environmental matters, so
that management measures would have a better knowledge basis.Climate measures are a good example of environmental matters that
should be integrated with the city’s operational management. This year, the City Council is supposed to make some historical solutions concerning energy policies, but they alone are not enough for creating a carbon-neutral Helsinki. Climate measures should also be integrated into traffic, land use and service planning as well as into procurements. The recently completed Helsinki's Climate Roadmap is a good start for this.
Protection of the Baltic Sea and our coastal waters is also a joint venture of many different operators. Point source pollution is quite well controlled in Helsinki, but in regard to diffuse sources of pollution, cooperation is needed, as is integration of water protection with the management and everyday work of several different parties. The Baltic Sea Challenge has successfully execut-ed this duty by coordinating the city’s internal Baltic Sea action programme as well as by supporting the nearly 220 other organisations in its network in their water protection work.
Helsinki has an internationally high reputation in both environmental matters and quality of life, but we should not let this reputation lull us into a sense of security. Responsibility over the environment requires constant search for new operational methods and daring solutions.
Pekka SauriDeputy Mayor
Responsibility over the environment requires daring solutions.
4 City of Helsinki


6 City of Helsinki
Environmental Key Figures
1,200
11 %
Helsinki has almost
Greenhouse gas emissions have been reduced by
Share of cycling as a transport mode
eco support persons
23 %The limit values of particles breathed in have not been exceeded in Helsinki since 2006.

Environmental Report 77
38 %
40,6 %59,9 %
70 %
of all land area is nature conservation area
of Helsinki residents are exposed to road traffic noise
of Helsinki residents participated in the environmental education events and climate and energy advisory events organised by the city
of all centralised procurements included environmental criteria
in ten years
Nitrogen emissions into the seahave decreased by
2,1 %

Helsinki in 2050
8 City of Helsinki

— Helsinki will be a carbon neutral city while being a top-tier operator on energy-efficiency, climate change control and adaptation.
— Traffic emissions and the transportation and use of renewable energy will not degrade air quality.
— The number of days when the daily limit value for the amount of particulate matter (PM10) is exceeded will have halved
— The reference values for environmental noise will not be exceeded. People will not be exposed to excessive noise that has a negative effect on health, especially noise caused by traffic.
— Helsinki’s own nutrient load on water systems will have further decreased and the utilisation of nutrients will have improved.
— The combined sewer network overflows will have decreased to half compared to the current level.
— Oil spill prevention measures will prevent oil from reaching inhabited shorelines under the most conditions.
— The urban biodiversity of Helsinki and its special characteristics will have remained as part of the consolidated city structure.
— Contaminated soil in the city will be restored at the latest during construction.
— The material and ecological efficiency of the city’s departments will have significantly improved, and these factors will be considered in all investments, procurements and notable projects.
— The environmental awareness of the employees and residents of the City of Helsinki will rank among the top three cities of Europe.
Environmental Report 99

Environmental management and partnerships
Environmental matters are an intrinsic part of the city’s strategy and an ecological approach is one of the six values of the city. The city’s strategy programme has operational strategies that have to do with green economy, climate change mitiga-tion and adaptation, saving energy, energy and resource efficiency, the promotion of public trans-portation, the environmental aspects of procure-ment, and water and nature protection.
The environmental policy complements this strategy and sets tangible and quantitative goals for the various sectors of environmental pro-tection, for both the medium term (2020) and the long term (2050). This Environmental Report reports on the realisation of the environmental policy in 2014.
ISO 14001 system is used by the Port of Helsinki, Palmia, Helen Ltd’s (previously Helsingin Energia) power plants, heat centres and district heating operations and it is being constructed in HKL. The EcoCompass environmental system is used by the Environment Centre, four libraries of the City Library, Public Works Department and Stara as well as by the RuutiExpo and Reaktori events of the Youth Department. The City Library, the Kinapori Service Centre of the Department of Social Ser-vices and Health Care, part of the Sports Depart-ment, Helsinki Zoo, Procurement Centre and Palmia are constructing the EcoCompass system. Helen Ltd and the administration of the Education Depart-ment use the WWF Green Office system, and some schools and day care centres use the Eco-Schools system or have an environmental certificate issued by the OKKA Foundation. Environmental matters have been integrated with the personnel’s bonus systems in 14/33 administrative branches.
The ISO 14001 system is in use in four sub-sidiary organisations and the EcoCompass system is currently used or being built in 11/98 subsidiary organisations.
Eco-support activity create an environmentally responsible operating culture and bring the envi-ronmental strategies and objectives of the city into tangible actions. By the end of 2014, a total of 1,173 eco-supporters had been trained for the city’s ad-ministrative branches and subsidiary organisations. The aim is to achieve a closer cooperation between the eco-supporter and EcoCompass operations by combining environmental reviews of the eco-sup-port activity to the location-specific internal audits included in the EcoCompass system. At the same time, the eco-supporters’ awareness of the goals of departments’ environmental systems is increasing. Currently, eco-support activities are carried out in accordance with the Helsinki model in 24 munic-ipalities and in the Uusimaa Centre for Economic Development, Transport and the Environment.
The city works actively with the interest groups and new partnerships are looked for constantly. A good example of these new partnerships is the Climate Partners network between the city and its business life, which creates cooperation in order to reduce climate emissions and to reinforce the competitiveness of companies. The objective of Cli-mate Partners is to create new operating methods and new business opportunities, increase new and innovative ways of cooperation to reduce emissions in the city area, operate visibly and to actively pro-vide information about the results as well as share competence of best practices.
Additionally, the city tests various methods of participation, good example of which is urban agri-culture. In 2014, Helen Ltd offered its customers space for urban agriculture in the Hanasaari power plant site. For the customers, 50 urban agriculture platforms were built in the plant’s yard. They were already filled with soil and the area also had a water station for irrigation. Urban agriculture gained a lot of interest and the platforms were reserved immediately.
10 City of Helsinki

development
development
City Council Departments and subsidiary organizations
Environmental or sustainable development programs
Implementation and eco-sup-port activity
Environmental objectives of the budget
Environmental reports and annual reports
Environment in the city’s strategy program
Environmental management systems
Environmental policy
Programs for the areas of environmental protection
Environmental Report of the City
City Board
Budget Guidelines
Model for City of Helsinki's environmental management
The observance of environmental issues in Helsinki is governed by the strategy programme and the envi-ronmental policy approved by the City Council, as well as the budget guidelines approved by the City Board. The city also has several programmes for a number of sectors in the field of environmental protection, all con tributing to the environmental management of the city. The environmental programmes of the adminis-trative branches support city-level environmental management.
11Environmental Report


Environmental management— Public utilities will have implemented an certified environmental system.— City departments and subsidiaries will include environmental management in their operations in ac-
cordance with the principles of less formal environmental systems.— Environmental management will become a part of the bonus schemes and other reward systems used
by departments and public utilities.— Every work community will have a trained eco-supporter.
Partnerships— The city will actively seek partnership and network with companies and other interest groups in order
to reach the objectives set out in its environmental policy while simultaneously supporting the imple-mentation of the city’s business strategy.
— The EcoCompass system will become a well-known tool for improving environmental management among SMEs, and it will become available to all SMEs operating in the Helsinki metropolitan area.
— The Baltic Sea challenge has been delivered to 300 operators, who the city will encourage in order to implement high-quality operating plans that enhance the conservation of the Baltic Sea.
— An environmental programme and plan will be drawn up for all major events organised in the city.
Environmental policy 2020
Indicators for environmental management and partnerships
Objective 2014
The share of administrative branches (out of all administrative branches) that carry out environmental management at least in accordance with the criteria for stream-lined environmental systems will be 100% by 2020 (environmental policy)
27%
Number of administrative branches (of administrative branches that use bonus schemes) where environmental management is part of the bonus scheme will be 100% by 2020 (environmental policy)
46%
The number of eco-supporters in the city organisation will increase, so that every work community will have a dedicated eco-supporter (environmental policy)
1,173 eco-supporters
The combined number of audited EcoCompass companies, Climate Partners com-panies and organisations that have accepted the Baltic Sea Challenge will increase (environmental policy)
325 pieces
Chart 1.
Environmental Report 13
The objective is reached or is about to be reached The realisation of the objective is proceeding It is challenging to reach the objective

The detrimental effects caused by the excavation works of Public Works Department, Helen Ltd (previously Helsingin Energia) and HKL on housing, traffic and other operations are mitigated through actions coordinated by the PWD. The duration of projects implemented within the con-structed street network as a shared worksite falls below the previous year’s result by at least 5%.
Public Works Department
This objective was not met. This was in part due to the excavation permits applied for the extensive, long-term work entities in 2014.
Executing the reporting of the city’s and administra-tive branches’ procurements through the city’s shared reporting system.
Procurement Centre
This objective was not met, as the project was put on a hiatus until the implemen-tation of the order registry, which is part of the from order to payment project, is launched.
The quantity of fine particles in street dust (PM10) do not exceed the limit valued of the air quality decree.
Public Works Department
The objective was met.
The most central streets and parks and the surroundings of public transport terminals in the inner city area and regional centres are cleaned on weekdays before 8 am.
Public Works Department
The objective was met.
The most important main streets and pedestrian and cycling lanes serving commuter traffic and belonging to the 1st maintenance class have been cleared of snow and treated against ice on weekdays before 7 am.
Public Works Department
The objective was met.
The surplus masses from the street and park construc-tion in Helsinki that are taken in the surplus receiving plants will be halved from the 2010 level to the amount of max. 175,000 m3 by processing them into soil that can be used in construction.
Public Works Department
The objective was met.
The trees removed from alleys lined with young trees will be replaced with new trees by the autumn of the next growth period, at the latest.
Public Works Department
The objective was met.
The diversity of urban nature is promoted by securing the protection of nature types and species in accordance with nature conservation strategies in all treatment of forests and the tree stock.
Public Works Department
The objective was met in all projects.
PWD’s energy saving target commitment for 2014 is 6% of the total energy consumption in 2010, including the savings targets of previous years. The total energy consumption is read from the main meters of electricity and district heating.
Public Works Department
The objective was met.
The energy saving target is 6% of the energy consump-tion in 2010, including the savings targets of previous years. This target includes the consumption of electricity and district heating.
Stara The objective was met.
The city’s budget for 2014 included 19 binding functional environmental objectives, of which 14 were fully met, one was partially met and four were not met at all.
Chart 2.Binding environmental objective in the 2014 budget
Continued on next page.
14 City of Helsinki

Street dust content at Mannerheimintie measuring station does not exceed the limit values set in the Air Quality Decree.
Environment Centre
The objective was met.
The Environment House’s total electricity consumption is 5% lower than in 2013.
Environment Centre
This objective was not met.
The customer satisfaction of tram and metro traffic re-mains at least at the level of 2012 (Tram 2012: 3.93; Metro 2012: 4.00).
HKL The objective was met.
Operating reliability of tram traffic is 99.85% (2012: 99.90%) and of metro traffic 99.96 % (2012: 99.94%).
HKL The objective was met in regard to tram traffic, but not in regard to metro traffic (main reason being the more extensive train problems than normal).
Fisheries will be developed and monitored in the 14,600 hectare water areas of Helsinki and the 3,000 hectare water areas of other municipalities.
Sports Depart-ment
The objective was met.
In accordance with the strategy programme 2013–2016, town plans for enabling the construction of around 5,500 apartments will be compiled mainly in the service areas of rail traffic (this means the zoning of around 500,000 m2 of floor area).
City Planning Department
The objective was met.
Complementary construction makes up at least 150,000 m2 of floor area of the zoned residential floor area, which means approximately 1,650 apartments.
City Planning Department
The objective was met.
The share of people using public transport when travel-ling towards the city centre in the mornings increases 0.2 percentage points compared to the realised amount in previous year (73.6% in 2012).
City Planning Department
This objective was not met, as the passenger numbers decreased in the beginning of the year.
The share of public transport in transverse transport in-creases 0.2 percentage points compared to the realised amount in previous year (18.9% in 2012).
City Planning Department
The objective was met.
Environmental Report 15

Effectivity of the climate programmesThe percentage of the whole city area’s emissions these programmes can affect
Carbon footprint
Municipal energyefficiency agreement
Covenant of Mayors
CO2emissions, kg/resident
7 300 100 %
1990 2013 2020 2050
3,6 milj. kg
4 700 –37 %
–21 %
3 900 –47 %
–30 %
400 –94 %
–92 %Total emissions
Helen Ltd's development programme
City's strategy and environmental policy
10
34 74 100
Emissions from the city organisation
City's sphere of influence
Consumption of electricity and heat
— Traffic and land use planning
— Regulations and guidelines
— Communi-cation and guidance
— District heating
— Other heating— Electricity
market— Small scale
production
— Public buildings
— Metro— Trams
— The emission share of trans-portation is 23%
16 City of Helsinki

Climate protection
Helsinki’s Climate Roadmap 2050 was completed in spring 2015. It presents how Helsinki can become a carbon-neutral city that has adapted to climate change. The Roadmap describes the climate work of Helsinki and encourages the citizens and com-panies to act in order to mitigate climate change and to adapt to it. The purpose of the Roadmap is to act as a discussion opener in climate matters in resident and business cooperation and it is also a planning tool for the city.
Helsinki’s objective is to decrease the emissions of the whole city area by 30 percent between 1990 and 2020 and to become carbon-neutral by 2050. Additional objectives have also been set for 2020, such as reducing the emissions of energy pro-duction by 20 percent and the per capita energy consumption by 20 percent. The city prepares for climate change by integrating the adaptation meas-ures to the planning systems.
At the council level, the City of Helsinki’s climate work is steered through the strategy programme 2013–2016 and environmental policies as well as through the development programme of Helen Ltd, the strategy's implementer. The strategy programme presents the objectives of the council term and the environmental and climate objectives of environmental policy from a more long-term perspective. In addition to this, the state and the city have signed an energy-efficiency agreement (KETS) and, based on an initiative by the EU, the Covenant of Mayors commitment. The Mayors of Finland’s six largest cities have their own climate network, which has agreed upon 10 concrete climate initiatives. Hel-sinki participates actively in the climate cooperation between the Helsinki Metropolitan Area’s municipal-ities through, for example, regional climate strate-gies and by funding the operations of Climateinfo.
The Climate-proof city – tools for planning
( ILKKA) project, coordinated by the City of Helsinki, was completed in the end of 2014. A planning guide for a Climate-proof city was created during the project. It includes an extensive range of best prac-tices from Finland and abroad, guidelines, method
descriptions and calculation tools for adaptation planning, run-off water management and increas-ing green infrastructure as well as information on the intensity of the urban heat island phenomena.
In the end of 2014, Helsinki’s 30 percent emis-sion reduction review was presented to the City Board. It illustrated the development of green-house gas emissions until 2020 and 2050 as well as the 18 most cost-efficient additional measures decided by the workgroup and selected during the interest group event. The emission development took into account Helen Ltd’s development project and the objective of carbon-neutral energy pro-duction by 2050. The conclusion is that emissions will be reduced by 24 percent by 2020 through the EU’s and state’s steering measures and by imple-menting the city’s current climate measures. The realisation of Helen Ltd’s development programme could reduce emissions by up to 40 percent by 2020, compared to 1990. The best way to meet the objective of making the city carbon-neutral by 2050 is to implement both the additional measures and the development programme, after which the reduction of emissions would be over 90 percent and the share of carbon dioxide to be compensated would be only 10 percent.
For more information on Helsinki’s climate work, please visit www.stadinilmasto.fi/en/.
Environmental Report 17

On page 19 can be seen the annual emission reductions (ktCO2e) from the realisation of the selected 18 additional measures and the total eco-nomic impact of the emission reductions (€/tCO2e). Positive economic impacts denote costs while negative ones denote savings.
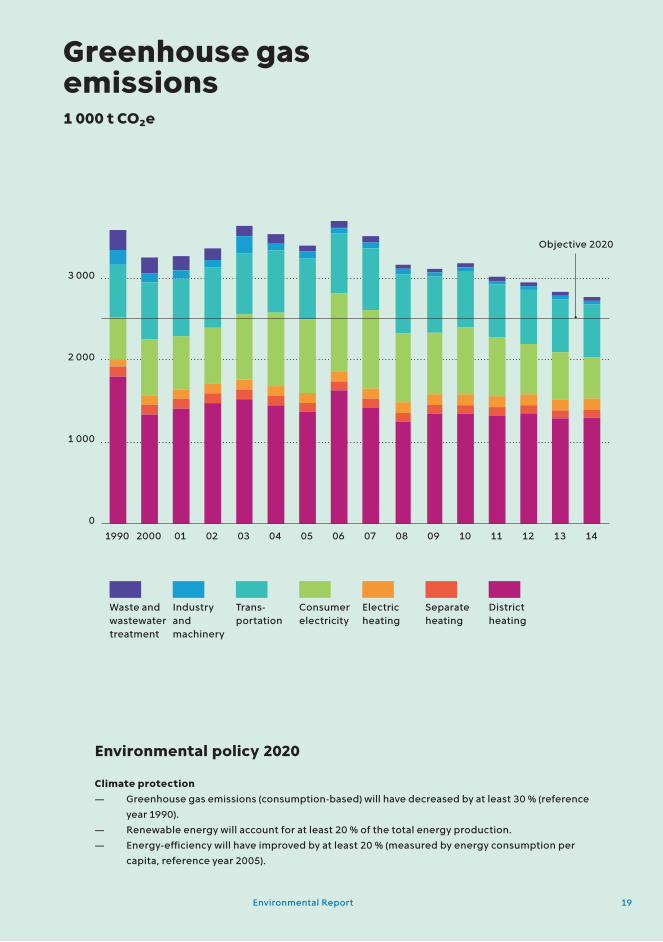
In 2014, the total greenhouse gas emissions produced by the citizens, services and industry of Helsinki were 23 percent lower than in 1990. The emissions calculated per capita were 39 percent lower than in 1990. In recent years, emissions have been reduced due to the economic downturn and the national emission reduction of electricity caused by it, the decrease of the specific emissions of Helen’s energy production and the improved energy-efficiency of the city area.
The total consumption of energy in the city area increased by 0.6 percent, but resident-spe-cific consumption decreased by one percent. The weather-corrected consumption of district heating in Helsinki increased by one percent due to the growing building stock, but electricity consump-tion continued to decrease by 0.3 percent, thanks to the improved energy-efficiency.
Seven schools in Helsinki participate in the 50–50 energy saving project, where the schools receive half of the savings while the other half is given to the city. Through active energy saving measures, five schools were able to achieve savings of thousands of euros in a few years. On average, energy consumption decreased by 10 percent and schools received 3,300 euros. The city saved the same amount. Energy was saved, for exam-ple, through communication, appropriate use of lighting and by turning off electrical equipment when they were not in use. In addition to the school’s actions, also the maintenance personnel of the buildings have carried out such measures as cleaning the ventilation ducts and adjusting the temperatures of heating network. The city’s energy specialists gave support, information and ideas to the schools. The project will be continued to the end of 2015, when the final results will be available. Based on the project experiences, the city consid-ers whether the practice can be extended to other schools and departments.
The City of Helsinki follows the principles of low-energy building design in the construction of new buildings and also applies low-energy
directives in renovations, considering the special features of each building. In 2014, the first version of design-specific instructions for nearly zero-ener-gy construction in new construction and renovation sites was completed. During the year, eight low-en-ergy service construction sites were completed, four of which were renovation sites and four new constructions.
In the autumn, the ASIAA project organised en-ergy training for the boards of housing associations in the Kontula area, concerning housing associ-ations’ energy and maintenance management, different roles of the board and resident communi-cations. After the training, the housing associations turned the ideas into action in order to achieve energy savings and control the energy costs, moti-vated by the playful energy saving competition that lasted the whole heating season. In the spring, we will find out which housing association has saved the most money – in addition to energy savings. Training also gave insight about the comprehensive operations of housing associations.
The biggest solar power station in Finland was completed in Suvilahti, in Helsinki, in March 2015. In total, the nearly 1,200 solar panels of the station produce 260 MWh of electricity in a year, equalling the annual consumption of 130 two-room apart-ments. Helen Ltd’s customers can purchase elec-tricity through their named panel. At best, one 285 watt monocrystalline solar panel produces enough electricity for more than 25 energy saving lamps.
The Sakarinmäki school centre in Östersundom tests new kind of energy solutions: the school receives over 80 percent of its heat from renew-able forms of energy; through geothermal energy and solar energy. Sufficient heating is ensured through a heating centre that uses renewable bio oil as its fuel. Heat production is also included in the school’s education: The pupils can monitor the school’s energy production in real time from screens.
The city area of Helsinki was recorded with an infra red camera from a small airplane in March 2015. The objective of this was to find out the heat loss locations of the roofs of the city’s all buildings. The results will be published in 2015 both on a map and as open data. The project is a part of the EU project Decumanus, which produces services that support environmentally sustainable decision-making.
18 City of Helsinki
Objective 2020
01990 0502 08 122000 0603 09 1301 07 1104 10 14
1 000
2 000
3 000
Greenhouse gas emissions1 000 t CO2e
District heating
Separate heating
Electric heating
Consumer electricity
Trans-portation
Industry and machinery
Waste and wastewater treatment
Climate protection— Greenhouse gas emissions (consumption-based) will have decreased by at least 30 % (reference
year 1990). — Renewable energy will account for at least 20 % of the total energy production.— Energy-efficiency will have improved by at least 20 % (measured by energy consumption per
capita, reference year 2005).
Environmental policy 2020
Environmental Report 19

Emission reductionsThe annual emission reductions (ktCO2e) from the realisation of the selected additional measures and the total economic impact of the emission reductions (€/tCO2e). Positive economic impacts denote costs while negative ones denote savings.
Measure Emission reduction
Economic impact
Economic steering measures to reduce passenger traffic 28.00 –8,928.57
Land use planning that reduces traffic emissions 4.36 –3,177.04
Mobility of the city’s employees 2.06 –2,656.30
Mobility centre 4.67 –2,656.30
Affordable financing solutions for energy-wise renovations 5.35 –1,770.64
Information sharing, tools and encouraging low emissions 4.00 –1,505.99
Land use planning that takes into consideration building emissions 0.46 –1,479.01
Recognition and notification of the energy efficiency potential of buildings 0.59 –1,454.88
Energy renaissance 10.45 –1,280.94
Development of city logistics 8.00 –1,034.62
Promoting the proliferation of low emission vehicles 2.00 –824.50
Promoting renewable small-scale production 3.70 –737.63
The city’s own low emission machinery procurements 1.31 –269.80
Utilisation of emission-free heat sources 0.59 –170.08
Increasing the share of cycling as a transport mode 5.27 –72.67
Increasing the efficiency of the city’s own energy-efficient building 0.66 –44.72
Increasing the share of public transport as a transport mode and reducing its emissions
6.50 1,020.20
Trials and development of low emission technology 0.88 1,446.15
Chart 3.
20 City of Helsinki

Indicators for climate protection
The objective is reached or is about to be reached The realisation of the objective is proceeding It is challenging to reach the objective
Chart 4.
Objective 2014
Greenhouse gas emissions corresponding to the consumption will reduce 30 % from the 1990 level by 2020 (strategy programme 2013–2016)
–23 %
Greenhouse gas emissions corresponding to the consumption in Helsinki per capita will be 4.3 t CO2 e per capita by 2030 (the climate strategy of the metropolitan area)
4,5 t CO2e/resident/a
Energy production greenhouse gas emissions will reduce 30 % from the 1990 level by 2020 (strategy programme 2013–2016)
–7 %
Energy consumption of the community per capita will reduce 20 % from the 2005 level by 2020 (environmental policy)
–11 %
Energy efficiency per capita will improve 20 % from the 2005 level by 2020 in the Helsinki region (environmental policy)
11 %
The share of renewable energy of the electricity, district heating and cooling acquisi-tions by Helen will be 20 % by the year 2020 (environmental policy)
8 %
Specific consumption of heating in new residential buildings that use district heating will be reduced (The near zero-energy building requirement by the EU in 2020)
26 kWh/m³(32 kWh/m3 year 2005)
The share of new residential building permits granted that have an energy class of A will meet the requirements in the city’s terms for surrendering plots (classification changed in 2013, to reach the new A-class, one has to have both energy efficient house and own energy production)
2 %
Energy savings in the city’s operations 129 GWh (9 %) (KETS 2005–2016) 106 GWh 82 % of the objective
With the early actions (before 2008):
161 GWh 125 % of the objective
Energy savings in the residential buildings: 49,9 GWh (7 %) (2010–2016) 26,2 GWh52,5 % of the objective
Environmental Report 21


The nitrogen dioxide concentrations continue to exceed the annual limit value of (40µg/m3) in the busiest street canyons of the inner city, which is why the EU has granted an extension until 1 January 2015. The exceeded limit value is due to the car traffic emissions and the direct nitrogen dioxide emissions of diesel vehicles, which have increased due to the technical solutions aiming to reduce particle emissions. However, reduction of particle emissions has been beneficial to health, as fine particles are more detrimental to health than ni-trogen dioxide in regards to traffic emissions. This problem also exists in other European cities, not just in Helsinki.
At the Mannerheimintie monitoring station, the nitrogen dioxide limit value has not been exceeded since 2010, but there are several street canyons in the city where the air quality is poorer and where the passive sampler measurements carried out by HSY indicate that the limit value is still being exceeded. Based on the HSY’s modelling, the limit value will also be exceeded in 2015.
In autumn 2014, HSL tightened the emission requirement in the environmental zone to the Euro 5 level. All landfill and biowaste trucks operating in the environmental zone are adhered to the Euro 5 standard. In 2014, already 74 percent of the HSL bus traffic was operated with a vehicle that adhered to at least the Euro 5 standard. Approximately 60 percents of the operations were carried out with Environmentally Enhanced Vehicles, EEVs. The share of Euro 6 buses was 8 percent, while the share of hybrids was 1 percent and electrical buses 0.2 percent.
In 2014, HSL organised two tendering process-es for its contract operators (so-called environ-ment bonus model) about measures that help to reduce the emissions of buses. As the limit value of nitrogen dioxide is exceeded in the Helsinki inner city, the harmfulness value of nitrogen dioxide was increased to its maximum level, i.e. tripled it compared to the normal level. The fleet will be introduced in 2015.
The limit values of particles breathed in have not been exceeded in Helsinki since 2006. The limit value was just exceeded in the measuring station located next to the Kehä I ring road in 2012, but this result is not reported to the EU, as there is no hous-ing near the station and no significant exposure. Based on the results, a new practice for watering of the whole Helsinki Metropolitan Area’s main roads was developed. When the limit value is about to be exceeded on the main roads, HSY will send a mes-sage to Tieliikennekeskus, which will forward the action request to the contractors. The contractors will confirm the actions they carried out through the LIITO system. This method was introduced in winter 2013, after which the limit value has not been exceeded even in measurements carried out along the main roads.
The street dust concentrations have generally decreased in Helsinki, which proves that the long-term improvements and measures of preventing street dust have been effective. Based on the REDUST street dust project that was completed in 2014, ice prevention, sanitation and dust suppres-sion practices that were shown to be effective have been actively implemented. However, the limit val-ues of particles in breathing air may be exceeded in the street canyons of the inner city and along the busiest roads, if dust suppression is not constantly kept in mind.
The workgroup of the City of Helsinki’s electric transport completed its final report in the end of 2014. At the time, 16 public charging stations with 35 charging points were available in the public areas of Helsinki. The city had a total of 10 electric cars and chargeable hybrid vehicles. Helsinki also participat-ed in the Electric Transport in the Helsinki Metropoli-tan Area project, which compiled a charging point database that covered the whole country (www.sahkoinenliikenne.fi/suomen-julkiset-latauspisteet).
The provisioning of the new air protection plan was launched in autumn 2014 with the themes transport, street dust, construction sites and small-scale combustion.
Air protection
Environmental Report 23

Air protection— The limit values for air quality will not be exceeded after 2015. The level of air impurities (including fine
particles) will continue to decrease after this.— The target values and national reference values for air quality will not be exceeded.
Environmental policy 2020
Nitrogen dioxide (NO2) concentrations
02008 2009 2010 2011 2012 2013 2014
25
50
TöölöntulliMäkelänkatuHämeentieMannerheimintie
RuneberginkatuKehä IGeneral background concentration in the city General background concentration in the country
Annual average nitrogen dioxide (NO2) concentrations measured by HSY's monitoring stations and passive samplers
EU limit value
24 City of Helsinki

Indicators for air protection
Particulate matter (PM10) concentration
Objective 2014
Annual average nitrogen dioxide concentration on the Mannerheimintie monitoring station will not exceed 40 µg/m3 in 2015 (EU directive)
37 µg/m3
Number of days when the limit value level of particulate matter exceeds on the Man-nerheimintie monitoring station will be max 35 days per year in 2010 (EU directive)
19 pcs/a
Chart 5.
The objective is reached or is about to be reached The realisation of the objective is proceeding It is challenging to reach the objective
MannerheimintieVallilaGeneral background concentration in the city
Töölöntulli (mobile)Hämeentie (mobile)Kehä I
The number of days when the limit value (50 µg/m³) for particulate matter (PM10) was exceeded in the air quality measurement stations in Helsinki
0
2005 2006 2007 2008 2009 2010 2011 2012 2013 2014
20
40
EU limit value
Environmental Report 25

Distribution of various transport methods in the public transport of Helsinki
All methods
Public transport
Walking 34
Public transport 32
Bus 15
Subway 6
Tram 6
Train 4
Taxi 1
Passenger cars 22
Bicycling 11
Others 1
TrafficTransport and the emissions of car traffic, in par-ticular, decrease the air quality in Helsinki the most, as they are released close to the breathing air. When all calculated lines were totalled up, the main road network had roughly the same amount of pas-senger car traffic than in previous year. The amount of traffic is expected to increase as new residential and workplace areas are constructed.
The passenger numbers near the peninsula’s border during autumn week days decreased both in regard to public transport vehicles and passen-ger cars. Also morning trips to the city centre de-creased 3.5 percent compared to previous year. On the borders of the inner city, on the other hand, the passenger numbers of public transport increased by 1.3 percent, but there were 5.3 percent less of people travelling by passenger cars compared to year 2010, when the border’s passenger numbers were last counted.
Cycling increased its popularity in 2014 by 2.5–11.5 percent in different measuring points. On Baana, the numbers of cyclists had increased in 2014 compared to the previous years, probably due to the relatively snow-free winter.
Based on the draft of Helsinki’s new general city plan, the Helsinki of the future will be a quickly grow-ing, urban network city of rail traffic, with an expand-ing main centre and other developing centres.
Helsinki has launched several projects that promote rail traffic. In 2014, a cross-administrative tram project was launched in order to improve the
reliability and competitiveness of tram traffic in particular on tram routes 2, 3 and 7 and to prepare for the expanding tram network.
Transverse public transport is improved through trunk lines 500 (Jokeri 0) and 560 (Jokeri 2). The project planning for Raide-Jokeri has also been launched. The operation of the West Metro should be launched in autumn 2016.
The criteria for the city’s low-emission cars were updated, so that they are now in line with the en-ergy markings of the cars. The city also continued the parking benefits of the passenger cars meeting these criteria (50 percent discount). The amount of benefits has doubled during 2014.
Helsinki aims to increase the share of cycling of all travelling to 15 percent by 2020. In 2014, the Advantages and costs of cycling in Helsinki review was published and the City Board approved a development plan for transport (LIIKE) in the beginning of 2015. This plan prioritises walking and cycling in the city centre, in particular, and sets the implementation of a main cycling network as one of its central goals.
In March 2015, the City Board approved an action plan of City Logistics, which includes, among others, the development of a parking ID for de-livery traffic and a development project for waste transport.
The transport system plan of Helsinki region (HLJ2015) was approved in March 2015. The central point is to increase the efficiency and competitive-ness of the region by investing in the trunk network of public transport and its service level as well as enhance the role of walking and cycling in the transport system.
The Kutsuplus service expanded to cover 15 vehicles (goal is 100 vehicles) and the service’s time of use was extended, which has clearly increased the number of users. CXPA Finland awarded the Kutsuplus as the best customer act in Finland.
The Helsinki region was appointed the best public transport city for the fifth consecutive time in the international BEST study.
Environmental Report 27


Indicators for traffic
Objective 2014
The share of walking, cycling and public transport will be increased by % point per year from the starting point of 75 % (strategy programme 2013 –2016)
77 %
Motorization will reduce as a part of promoting sustainable mobility (strategy programme 2013–2016)
401 passenger cars / 1000 residents (in traffic use 329)
The number of public transportation trips will increase (strategy pro-gramme 2013–2016)
384 trips/resident/a
Carbon dioxide emissions of road traffic in Helsinki will reduce 20% by 2030 (the climate strategy of the metropolitan area)
–8,2 %
Carbon dioxide emissions of passenger cars registered for the first time in Helsinki will reach the objective for average emissions 130 g CO2/km by 2015 (EU regulation)
127,4 g CO2/km
Share of cycling as a transport mode will be 15% by 2020 (the Brussels Convention 2009)
11,0 %
Chart 6.
The objective is reached or is about to be reached The realisation of the objective is proceeding It is challenging to reach the objective
0 0
300 0,6
1,2600
1990 2000 02 04 06 08 10 12 2014*
Emissions from transportCO2 emissions of different modes of transportation (left scale) and emissions per capita (right scale) in Helsinki in 1990 and 2000–2014
Rail trafficShips and boatsTrucksBusesVansPassenger carsEmissions per capita
Environmental Report 29
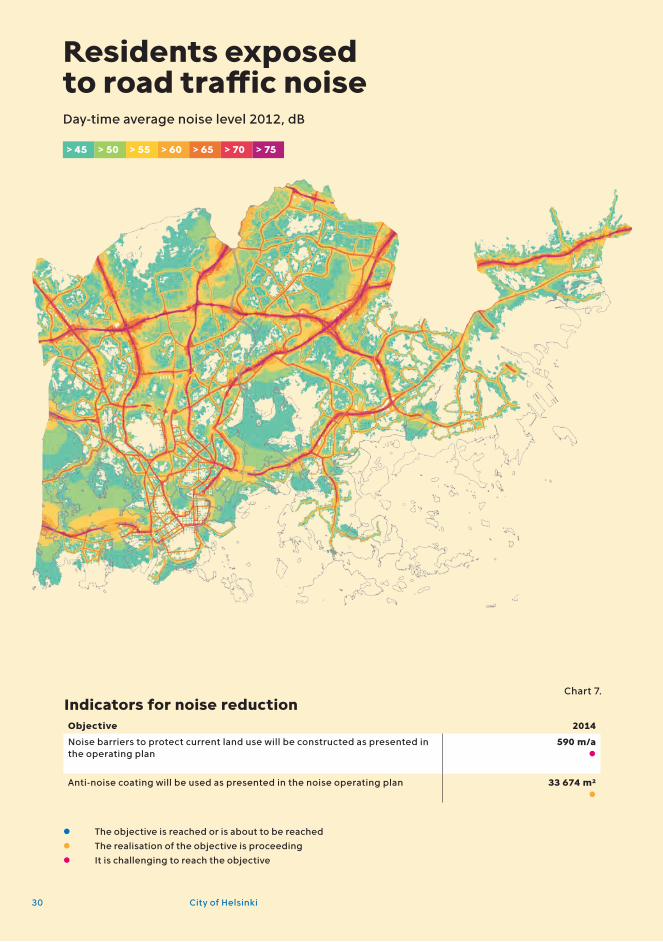
Indicators for noise reductionObjective 2014
Noise barriers to protect current land use will be constructed as presented in the operating plan
590 m/a
Anti-noise coating will be used as presented in the noise operating plan 33 674 m2
Chart 7.
The objective is reached or is about to be reached The realisation of the objective is proceeding It is challenging to reach the objective
Residents exposed to road traffic noiseDay-time average noise level 2012, dB
> 45 > 50 > 55 > 60 > 65 > 70 > 75
30 City of Helsinki

Noise reductionEnvironmental noise is one of the largest environ-mental problems in Europe and it is also a signif-icant factor in decreasing the quality and health-iness of the living environment in Helsinki. Road traffic is the most significant cause of disturbing noise in Helsinki. Almost 40 percent of the resi-dents of Helsinki live in areas where the noise level caused by road traffic exceeds the limit value of 55 dB during the day. Locally, also various construction and repair works and public events, restaurants and
deliveries may cause disturbing noise. In 2014, the Environment Centre processed, among others, the noise disturbance notifications from the construc-tion sites of Jätkäsaari, Kalasatama and Kruunu-vuorenranta construction areas. Additionally, the construction work for the central district Tripla began in Pasila.
Noise prevention is guided by the revision of the City of Helsinki noise prevention operating plan 2013, which presents a total of 26 measures. The objectives set for noise prevention are challenging, however, and they cannot be achieved without increasing the effectiveness of noise prevention significantly.
The noise prevention needs of new residential areas will be taken into account in the land use and transport plans. The city has have conscious-ly strived to decrease the need for transport by making the urban structure denser. By improving the prerequisites of public transport, pedestrian traffic and cycling, the city has aimed to steer traffic towards more sustainable forms of transport. Noise reviews have been carried out in connection to zon-ing and the noise prevention needs have been tak-en into account in zoning markings and regulations, for example. Frame-carrying noise and vibration reviews have also been carried out when necessary and their results have been taken into account when preparing city plans. Noise disturbances are
also included in tendering processes; for example, HSL has set a tendering process criterion for bus operation at noise level 75 dB.
In 2014, the “Effects of noise suppressing surface materials in urban areas” review was completed. According to this review, using surface materials that suppress noise can decrease the residents’ exposure to noise, especially in sites where the street section to be coated is the main source of noise. Largest advantages for residential comfort are achieved in areas where gardens are in the immediate vicinity of the streets.
The cross-administrative tram project has re-viewed the possibility of introducing deep groove rail crossings to HKL’s tram traffic starting from 2017. HKL has also reviewed the vibration suppres-sion structures of rail traffic and test installations have been carried out in Katajanokka.
The noise wall on the north side of Kehä I at Kivikko was completed in 2014. The surplus masses of the area’s street construction and the construc-tion of Kivikko interchange of Kehä I were used for building the wall. The noise barriers of Tapanilan-kaari between Rintamamiehentie and Moisiontie will be completed in 2015.
Almost 40% of the residents of Helsinki live in areas where the noise level caused by road traffic exceeds the limit value of 55 dB during the day.
Noise reduction— Exposure to noise will have been reduced
so that, the number of people living in areas where the average level of noise exceeds 55 dB during the day is at least 20 % lower than in 2003.
— Exposure to excessive noise, in particular, will have been reduced so that there are no residents who are exposed to average noise levels exceeding 70 dB during the day and 65 dB at night.
— The average noise levels of sites for the most noise-sensitive population groups, such as day care centres, play parks, schools and play and outdoor areas of retirement homes, fall below 60 dB during the day.
Environmental policy 2020
Environmental Report 31

Water protection
A total of 89 million m3 of water was pumped into the water system within the HSY water treatment area in 2014. The water consumption per capita in Helsinki was 189 litres per day, which was one litre less than in 2013.
In 2014, a total of 95.4 million m3 of waste water was delivered to the Viikinmäki sewage treatment plant for treatment, of which 70.6 million m3 came
from Helsinki. The amount of waste water was at the previous year’s level. The Viikinmäki wastewater treatment plant met all the permit criteria. Of the water led to Viikinmäki, 0.09 percent bypassed the usual cleaning process.
The annual treatment efficiency for phosphorus in Viikinmäki was 97 percent. For biological oxygen demand, the efficiency was 97 percent, and for nitrogen, 91 percent. The wastewaters treated at the Viikinmäki wastewater plant are conducted through rock tunnels into the edge of the open sea, about seven kilometres away from the shore. The phosphorus load from the Viikinmäki wastewater treatment plant to the sea areas in front of Helsinki was 21,000 kg/a (+5% from the 2013 level), and the nitrogen load was 424,000 kg/a (+23% from the 2013 level). For eutrophication, the nitrogen load is more significant, because it is a minimum nutrient in the waterways in the Helsinki region.
2014 was the Gulf of Finland year for Finland,
Estonia and Russia, and it aimed to bring together the specialists, decision-makers and citizens to work for a healthier and safer Gulf of Finland. The opening ceremony of the Gulf of Finland year was organised at the Helsinki City Hall in January and in connection to it the Citywater project, aiming to spread the Baltic Sea Challenge, organised an international networking event: Cities Forum: Benefits of water protection – a range of concrete measures for local actors. Additionally, the project implemented a creek restoration in Tallinn in order to promote natural management of run-off waters, and construction plans for a wetland to be built in a residential area and a bio filtering area constructed in urban area were created in Turku and Helsinki. In connection to the Baltic Sea Challenge, Baltic Sea Days event was organised in Turku in June. It brought together over a thousand visitors to the annual forum of the Baltic Sea strategy and several other events from the countries of the Baltic Sea.
The water areas in Helsinki include extensive sea areas, as well as the freshwater areas in the Van-taanjoki River, various streams, ditches, ponds, and springs. The water quality of the city is affected by the impurities in drainage water, nutrients brought by scattered loading, cleaned wastewater led to the outer archipelago, human activities, the muddy waters flowing from Vantaanjoki, and the state of the Gulf of Finland.
In addition to the environmental policy, water protection in Helsinki is regulated by the urban run-off water strategy for the City of Helsinki (2008), the City of Helsinki small-water programme (2007), and Helsinki’s updated action plan for the Baltic Sea Challenge (2013).
2014 was the Gulf of Finland year for Finland, Estonia and Russia.
32 City of Helsinki

The Environment Centre monitors the impacts of the wastewaters from the cities of Helsinki and Espoo to the water areas as well as the effects of several other actions with environmental impacts in the area. In 2014, this monitoring was implement-ed for the first time in accordance with the new overall monitoring programme of marine areas. The state of marine areas has not changed significantly during the recent years, as it still remains eutrophic and is regionally in poor condition. In connec-tion to the monitoring, the Environment Centre implemented an extensive series of tests, which monitored the changes of nutrients hindering the growth of algal community during one year. These test series will be part of the common monitoring in the future. This type of new method for monitor-ing the state of the sea is not yet used anywhere else in the world.
In 2014, the temperature of water near the bottom was at times higher than average, as in previous years. The amount of algae in the Helsinki marine areas remained quite average, although the blue-green algae blooms were very exten-sive in outer and western Gulf of Finland. The bay areas of Helsinki were also spared from extensive blue-green algae blooms. Blue-green algae was observed on the beaches of Vantaanjoki and Pikkukoski as well as in the coastal waters, but the amount of blue-green algae usually remained low.
In accordance with ecological classification, the condition of Vantaanjoki is satisfactory, but the Kytäjoki area and the upper reaches of Keravanjoki have already achieved good ecological conditions. The objective of the EU is to reach good ecologi-cal condition of water areas in 2015, but in regard to Vantaanjoki, this target will probably not be met. Eutrophication in Vantaanjoki is caused by phosphorus and nitrogen, which are generated by wastewater and agriculture. Also, untreated wastewaters were released to the river during rains and floods, which has been a problem especially for Riihimäki. The situation should improve, as an expansion to the Riihimäki wastewater treatment plant was completed, and it should ensure that spring time flooding no longer causes the sewers to flood.
The Public Works Department is renovating the Saunapellonpuisto pond in Viikki, which suffers from over eutrophication caused by a very dense fish stock. In 2014, perch were planted into the pond and they ate some of the small fish. In addi-tion, several angling events, mostly for school chil-dren, were arranged at the pond. The Environment Centre monitored the pond’s water quality.
The Environment Centre trained the officials of the cities in the Helsinki Metropolitan Area in management of run-off waters and development of cooperation concerning the run-off waters. In addition to this, the Environment Centre assisted the Building Regulation Department in compiling construction instructions in regard to the run-off waters. The run-off water matters were also on a central stage in the preparations of the city’s green roof strategy.
Helsinki will build a natural run-off water struc-ture in Maunulanpuisto, Pohjois-Pasila, during spring 2015. This structure cleans, for example, heavy metals and nutrients from the run-off waters of Maaliikennekeskus and Metsäläntie before they are conducted to Haaganpuro, which is a stream with salmon and whitefish stocks. The run-off waters coming from the current run-off water drum going under Metsäläntie will be conducted through a new pipe into a stone delaying pool in the north-ern side of the recreational route. After this, the run-off waters will be conducted into bio-filtering pools, where the used filtering materials are flood meadows and wetland plants, with several layers of sand below them.
Protection of the Baltic Sea— Helsinki’s surrounding waters will be in good
condition by 2020 in accordance with the EU Marine Strategy Framework Directive.
— The good condition of Helsinki’s coastal water bodies will be achieved by 2027 in ac-cordance with the water management plan.
Protection of Helsinki’s surface waters— A centralized water management system
will have been built on the main recreational islands of Helsinki.
— The combined sewer network overflows will have been reduced by 20% from the current level.
Environmental policy 2020
34 City of Helsinki

Indicators for water protection
Objective 2014
Nitrogen emissions to the sea from the Viikinmäki waste water treatment plan will reduce (t/a) (environmental policy)
21,0 t/a
Phosphorous emissions to the sea from the Viikinmäki waste water treatment plant will be reduced (t/a) (environmental policy)
424,0 t/a
Number of combined sewer network overflows will reduce 20% from the cur-rent level by 2020 (environmental policy)
85 743 m³
Chart 8.
The objective is reached or is about to be reached The realisation of the objective is proceeding It is challenging to reach the objective
Load to the seaNitrogen and phosphorus load channeled to the sea from the Viikinmäki treatment plant, tons per year
0
600
1 200
2002 20042003 2005 2006 2007 2008 2009 2010 2011 2012 2013 2014
Nitrogen Phosphorus
Environmental Report 35

Securing biodiversity
Helsinki’s nature management complies with City Board-approved objectives of nature management and the LUMO programme (City of Helsinki Nature Conservation Programme 2008–2017), as well as the Plan for Nature Management, approved by the Public Works Committee. The land use planning and housing programme for 2008–2017 is a central tool for guiding the development of housing
construction in the city. The implementation of the LUMO programme proceeds well. Of all actions, already 80 percent have been launched and some of them have already been completed. The impacts of climate change highlight the importance of measures planned for securing biodiversity.
Nature information system (LTJ) is now part of Helsinki’s map service (http://kartta.hel.fi), which enables mobile use and reviewing other materials simultaneously with nature information.
In order to increase the awareness of Helsinki’s nature values and the recreational use of nature, a Helsingin luontoon! (To the nature of Helsinki) brochure series was created, and its first part, Uute-la recreational area, was published in 2014.
The draft for a new nature conservation pro-gramme and forest network proposes the founding of around 50 new nature conservation area and almost doubling the total area of the conservation areas.
A draft for a maintenance and usage plan 2015–2024 was compiled for the Natura 200 area of Vanhankaupunginlahti bird habitat, and two new protected areas were added to it: The common alder forest of Pornaistenniemi and the forest of Mölylä.
A maintenance plan was compiled for the Anthyllis vulneraria ssp. polyphylla, a subspecies of Common kidneyvetch growing in Alakivenpuisto in Myllypuro. The polyphylla subspecies is critically endangered and protected species.
The bird stock review of Vanhankaupunginlahti observed two new nesting species: whooper swan and Canada goose.
During inventory, 12 territories of Siberian flying squirrel were found in the northwest Helsinki, six in Central Park and six on the western side of the park.
Polyporaceae review observed a total of five new species in Helsinki, one of which was new to Finland. All in all, 116 species of Polyporaceae were found in the reviewed areas. The recreational forests of Helsinki, and their decaying trees, have also national significance in the protection of southern species of Polyporaceae.
The lime rocks of Helsinki were inventoried and 36 sites had a lime content of over 10 percent. Most of them located in Laajasalo and Vuosaari. Lime-rich rocks are biologically valuable and endangered habitats.
Sustainable city planning
The City Planning Department has participated in the development and pilot testing of eco-efficiency tool of zoning and has also taken actively part in the preparations of the green roof strategy. The run-off water management and green roof regulations have been implemented in city plans, for example.
Protection of nature and soil
Nature information system is now part of Helsinki’s map service at kartta.hel.fi.
36 City of Helsinki

Nature conservation area (52),includes national park
National park (1)
Natura area (4)
Protected nature type (31)
Natural monument (32)
Helsinki
Espoo
Vantaa
Sipoo
Helsinki has diverse nature2.1 percent of the city’s land area and 0.5 percent of the water areas are protected under the Nature Conservation Act. There are 52 nature reserves in Helsinki. When includ-ing protected nature types, species protection areas, and Natura 2000 areas not protected by the Nature Conserva-tion Act , the total protected area amounts to 3.5 percent of land area and 1.0 percent of water areas. The nature con-servation areas are being increasingly used for recreation, which puts a strain on the natural environment in them.
37Environmental Report

Nature— The functionality of the extensive ecological network will be ensured as part of the regional whole.— Established biotopes and species will be preserved through management and restoration if necessary.
The natural structural characteristics of forests and swamps will be preserved.— The biodiversity of cultural landscapes will be preserved through renovations and long-term care.— Construction in areas designated as green areas will be compensated in land use and green area plan-
ning by, for example, improving the functionality and ecological quality of green area, restoring natural sites or by creating new local green area environments.
Maaperä— Old landfill sites in the city will be restored.— The natural characteristics and functions (biological, chemical and physical) of park soil will be pre-
served.— The preservation of significant geological sites will be secured.
Environmental policy 2020
The objective is reached or is about to be reached The realisation of the objective is proceeding It is challenging to reach the objective
Indicators for nature protection
Objective 2014
Share of nature reserves of total area (City of Helsinki Nature Conservation Programme 2008–2017)
2,1 %
The surface area of water-permeable areas in Helsinki (the urban run-off water strategy for the City of Helsinki 2008)
59,7 % (2013)
Chart 11.
Contaminated soil matter transported to treatment or final disposal in Helsinki in 2012–2014
2012 2013 2014
Soil, t 186,000 121,665 96,642
Chart 9.
The costs for the City of Helsinki caused by the restoration of contaminated soil and landfill sites in 2012–2014
2012 2013 2014
Costs, € 3,443,971 361,959 641,816
Investments, € 10,259,734 8,733,646 6,670,577
Chart 10.
38 City of Helsinki
The Östersundom project participated in the shared CITYOPT project of the city, Helen Ltd and VTT, which was launched in 2014 with the aim of developing an application for planners that enables easier selection of energy solutions in the zoned area. The objective in Östersundom is to optimise the location and size of the heat storages and choose the best possible technological storing solutions. The tool helps to compare what kind of cost and emission effect the various solutions have. The cost calculations also take into account the land value’s effect on profitability. The general plan of Östersundom also examines the conditions of utilising solar energy extensively.
The draft of Karhusaari zoning plan frame applied the principles of sustainable planning. Sufficient density, local heat production, enabling the use of renewable forms of energy, energy efficiency, high-quality recreational services, preparing for floods and both quantitative and qualitative man-agement of run-off waters have been included in the tools of planning when preparing for climate change and in the attempts to mitigate it. In connection to these, a run-off water management plan, general lay-out for public outdoor premises and regional energy model were compiled for Karhusaari in 2014.
Restoration of contaminated soil
The most significant renovation sites were the former Pasila engineering works shop and the former port areas Kalasatama and Jätkäsaari, which were all mainly transformed into residential use. The amount of soil matter transported to treatment or final disposal had decreased in recent years (see chart 9 on the previous page). The excavated,
contaminated soil matter was utilised either in landfilling of construction sites, mainly for the base structures of parks, or in landfill sites.
The costs incurred by the renovation of contam-inated areas and landfill sites have also decreased in recent years (see chart 10 on the previous page). In 2014, the operations focused more on examining the contaminated sites or sites suspected to be contaminated and on their restoration planning. The impact of the financial situation was seen in the construction field as, for example, delays in the start of constructing sites. In addition to this,
the restoration of contaminated soil has, in recent years, moved more and more towards a renovation based on risk assessment, where only soil that causes risk or has to be removed due to construc-tion is excavated from the site. The decrease in the amount of removed contaminated soil does not remove the need for examinations, but instead the need for examinations and follow-ups increases when this method is applied.
In 2014, the surplus landmasses were deliv-ered to external receiving sites from the Public Works Department’s worksites. All landmasses were utilised in the city’s sites or transported to an intermediate storage to wait for later utilisation. In 2013, 4,904 m3 of surplus landmasses were taken to receiving sites and in 2010 this amount was 350,000 m3.
The general plan of Östersundom examines the conditions of utilising solar energy extensively.
Environmental Report 39


These ambitious goals of the city’s environmen-tal policy have to do with the procurement of all administrative branches, not just centralised procurements.
The environmental network of procurements established in 2013 has reinforced the cooperation and information exchange between the parties in charge of the city’s procurements. The group has worked on, among other matters, definitions of the use of environmental criteria in Helsinki’s public
procurements and the monitoring of procure-ments. In 2014, the cooperation in the Helsinki Met-ropolitan Area was launched in order to promote sustainable procurements. Additionally, a consul-tant work aiming to find new environmental criteria for the central procurement groups of Stara, the Public Works Department, the Education Depart-ment and the Youth Department was launched. In 2015, a guide for sustainable procurements of Helsinki will be compiled, utilising the results of the consultant work more extensively and pre-senting concrete instruction and examples on how environmental criteria can be utilised in various procurements. Helsinki has also participated in the Cleantch Procurements project coordinated by SYKE, which reviews, among others, the opportu-
nities of cleantech procurements of Iso-Roobertin-katu renovations.
Tendering processes are seen to consider environmental aspects if they are included in the mandatory requirements or in the comparison criteria for the tenders. The environmental criteria considered in joint procurement processes include the requirements of the eco-label, organic prod-ucts, life cycle costs, versatility, service life, energy consumption and fuel consumption and emission classes.
Many administrative branches only procure products or services tendered by the Procurement Centre, but some of the branches carry out the tendering process of products and, in particular, services by themselves. The use of environmental criteria in tendering processes and procurements has increased. Criteria can include, for example, energy efficiency, eco-label criteria, material efficiency, waste sorting and reduction of waste, life cycle costs, environmental system or similar, chemical safety, genetically unmodified ingredi-ents, organic products, low-emissions, versatility, recyclability, noise level and special competence in energy and life cycle planning or accounting, for example.
The Procurement Centre continued its active participation in the international cooperation of sustainable development of procurements. The City of Helsinki is a member of the Procura+ cam-paign of sustainable procurements, which is run by ICLEI, the international cooperation organisation of local governments.
Procurement, waste and material efficiency
The use of environmental criteria in procurements has increased.
Environmental Report 41

Waste reporting is developed in order to receive city-specific information. The work is coordinated by the city’s internal waste management network. The objective is to receive comprehensive informa-tion from the various waste management compa-nies about the waste produced by the city organi-sation and to be able to share information through the electric maintenance system, for example.
Approximately 5–6 million tonnes of waste is generated every year in the Helsinki Metropolitan Area. Of this, some 350,000 tonnes come from private households. In 2013, the region’s residents generated an average of 318 kilos of household waste per capita.
In 2014, a new waste-to-energy plant began its operations in Långmossebergen in Vantaa. The plant will utilise all the mixed waste left over from source separation in the Helsinki metropolitan area. The waste-to-energy plant produces 600 GWh of electricity and 920 GWh of heat in a year. As its fuel, the plant utilises sorted mixed waste provided by HSY and Rosk’n Roll Oy as well as natural gas, increasing its energy efficiency factor.
As a consequence of the plant’s introduction, the amount of waste transported to the Ämmässuo landfill site has decreased significantly, but the site has started to receive and store the slag generated during combustion and has begun the stabilization of ash in a new ash treatment and final disposal area.
Pipe collection systems of waste have been introduced in Jätkäsaari and Kalasatama areas. Similar system will also be built in Kruunuvuoren-ranta area. In this system, the customers will sort their waste into mixed waste, biowaste, paper and cardboard and take the waste to the correct collec-tion points. These collection points will automat-ically empty themselves to the waste containers of the collection station. Pick-up trucks will pick up the full containers from the collection stations and transport the waste to further treatment. The centralised collection decreases traffic emissions and noise, among others.
The workgroup nominated by the Mayor for coordinating the land masses finished its devel-opment programme for the utilisation of uncon-taminated, excavated soil, which aims to compre-hensively enhance the management of surplus soil generated during construction. The work has been fruitful, as soil matter was not delivered to city’s external parties from the worksites of the Public Works Department in 2014. As recently as in 2010, the infrastructure work sites of Helsinki delivered 350,000m3 of soil matter as soil waste to the Vantaa
landfill site. The mass saving resulting from more efficient utilisation of surplus landmasses have totalled approximately 7 million euros annually in 2012–2014.
The most significant utilisation project of surplus landmasses are the forming of Vuosaari landfill site (mass quantity around 500,000 m3) and the noise barriers of Lahdenväylä (mass quantity around 150,000 million m3). In addition to this, the Public Works Department participated in the EU-Life project Absoils and the New Land Construction project, which develop new material technology for infrastructure projects.
Procurement— 50% of the city’s procurement processes will
include environmental criteria by 2015.— 100% of the city’s procurement processes
will include environmental criteria by 2020.— Environmental criteria can be either absolute
requirements or selection criteria.— All city departments and subsidiaries will be
trained to make sustainable procurements.
Waste— The amount of communal waste produced by
the city organization will stabilize to the 2013 level, and the amount of waste per employee will have decreased by 10% by 2020.
— The material utilization rate of the commu-nal waste produced by the city will have increased by 10 percentage points by 2020
— The amount of communal waste produced within the city will stabilize to the 2013 level, and the amount of waste per resident will have decreased by 10% by 2020.
— The logistics of land masses required for con-struction, surplus landmass and contaminat-ed soil will be organized in an economical and eco-efficient manner.
Environmental policy 2020
42 City of Helsinki

Indicators for procurements and wasteObjective 2014
Share of environmental criteria in the centralized acquisitions of the City of Helsinki will be 50% by 2015 and 100% by 2020 (environmental policy)
59,9 %
Amount of communal waste produced in the Helsinki metropolitan area per capita will reduce 10% by 2020 (environmental policy)
318 kg/resident/a (2013)
Chart 12.
The objective is reached or is about to be reached The realisation of the objective is proceeding It is challenging to reach the objective
Share in euro, %
Share in number, %
The share of environmental criteria in the centralised procurements of the city
Procurement Centre
Stara
Helen Oy
Helsingin Bussi liikenne
Oy
Hospital pharmacy
77,4
31
30
100
0 0
100
15
23
50
Missing criteria.
Environmental Report 43

Environmental awareness and responsibility— Helsinki will be a pioneer in environmental education— The city’s range of services will support the sustainable lifestyle of the city’s residents and make envi-
ronmental choices easy— City employees are aware of environmentally responsible practices and take them into account in their
work.— The good environmental awareness of decision-makers will lead to environmentally responsible deci-
sion-making
Environmental policy 2020
Indicator for environmental awareness
City of Helsinki environmental education and climate and energy guidanceNumber of participants
Objective 2014
The share of citizens who have taken part in the environmental education events and climate and energy guidance provided by the city will increase, so that the environmental awareness of city personnel and citizens will be improved (environmental policy)
40,6 %
Chart 14.
Chart 13.
2012 2013 2014
Environmental education 78,287 83,199 102,532
The Harakka Island nature centre (Environment Centre)
5,193 4,937 6,485
Spring cleaning events (Public Works Department) 27,628 23,700 23,800
Youth Department 3,675 5,710 5,707
Helen Oy 1,373 1,565 2,041
Helsinki Zoo 17,794 22,500 32,500
Helsinki Metropolitan Area Reuse Centre 11,495 13,582 12,878
Others (Oy Gardenia-Helsinki Ab, park walks and Park Pals (Public Works Department), and Mobility coach (HSL)
11,279 11,405 19,121
Climate and energy guidance services 174,146 145,540 149,802
Energiaa tokaluokkalaisille and others (Public Works Department)
1,184 1,733 684
Helen Oy 165,675 139,911 145,145
Climateinfo 6 750 2 096 2 473
ASIAA-project 537 1 800 1 500
Total 252,433 228,739 252,334
The objective is reached or is about to be reached The realisation of the objective is proceeding It is challenging to reach the objective
44 City of Helsinki

Environmental education reached citizens
In 2014, events related to environmental education drew nearly 103,000 visitors, which is 16.5% of the population of Helsinki.
Environmental education in Helsinki is provid-ed by the Environment Centre, the Public Works Department, the Youth Department, the Helsinki Zoo, the Helsinki Metropolitan Area Reuse Centre and Oy Helsinki-Gardenia Ab. Adult education insti-tutes also organise a wealth of courses related to the environment. Events organised during the year included nature schools, nature trips, island adven-tures, themed weeks, environmental courses and a conference for school children, as well as public events related to the environment, spring cleaning events and park walks.
The most popular outdoor excursions were Full moon toads on the Harakka Island, Easter birds of Viikki, the autumn migration of Birds in Viikki and Viikki nature on Mother’s Day. New, free of charge hour-long Sunday tours of the island and its nature were started on Harakka Island. The most popular events, based on the number of participants, were the 125th jubilee of the Helsinki Zoo’s Night of the Cats and Easter Island events (over 30,000 visitors in total). Close to 24,000 citizens also took part in the spring cleaning bee. In Central Park, a Central Park Hike was organised for the first time and it gained up to 2,500 participants.
Climate and energy guidance services
The climate and energy guidance services in 2014 reached a total of nearly 150,000 citizens, 24.1 percent of the population of Helsinki.
The most central energy and climate advisors were Helen Ltd, the Public Works Department, the
Environment Centre, Climateinfo and HSL. Energy and climate guidance is provided on-site, during events and via the phone and the Internet.
Helen Ltd encouraged citizens to save energy. During the year, over 2,000 school children and 1,300 adults in groups visited the Energy Gallery and further 500 visitors came in during public
events, such as the Theme Day of Lighting. The advisory services also had over 3,000 individual visitors. In addition to this, over 300 pupils came to see energy production process in the power plants.
The Public Works Department’s Energiaa tokaluokkalaisille (“Energy for second-graders”) campaign once again provided schools with a com-prehensive information package to be distributed to nearly 700 pupils and teachers.
Climateinfo participated in several events, such as the Recycling Factory event and the World Vil-lage festival. There were also several cycling events during the year, ranging from cycling breakfasts to an electric bike event. The Solar energy for home campaign in the spring and the Light wisely – Save now campaign that started during the Energy saving week in the autumn communicated about energy matters.
The twin school programme of HSL implement-ed a travelling plan for ten schools, in addition to which the Mobility coach visited tens of schools, explaining how to travel smartly. In addition, HSL had a campaign that aimed to attract new work places as the users of commuter travel tickets and increase the awareness of its employer-targeted services.
Environmental awareness and responsibility
Every sixth resident in Helsinki took part in environmental education in 2014.
Environmental Report 45

Indicator for environmental risksObjective 2014
Number of trained oil spill response personnel will reach a level, where the city will have a sufficient number of trained people for beach clean-up operations
750 persons*
Chart 15.
* The city’s focus point in oil prevention is at the sea and most of the oil prevention patrols trained thus far were trained for marine operations. The objective is to train 340 officers and petty officers for cleaning the shores, who will lead the companies of coastal cleaning organisation. The cleaning staff will be trained by the officers and petty officers of each company after an oil spill has occurred, immediately after the companies have been established. All in all, the objective is to train 1,000 persons for oil prevention at sea and on the coast. The training has already started for 750 people.
The objective is reached or is about to be reached The realisation of the objective is proceeding It is challenging to reach the objective
0
200
400
432
357365
319
2011 2012 2013 2014
Other areas
Important ground water areas
Drainage systemOil spill damages in Helsinki
46 City of Helsinki

Environmental risksDue to the climate change, extreme weather conditions will increase and forecasting the climate will become more difficult. Storms and floods, for example, have occurred more often than normal-ly also in Finland in recent years. The risk of oil damage is high in the Baltic Sea, which is one of the most vulnerable, yet highly trafficked sea areas in the world.
The operations for adapting to climate change have been distributed to several administrative branches, and many different operating plans pro-mote the adaptation operations. The urban run-off water and flood strategies of the City of Helsinki, as well as the LUMO programme and the objectives of nature management also include actions for adapt-ing to climate change.
The Climate-proof city – tools for planning (ILKKA) project, coordinated by the City of Helsinki, was completed in October 2014. The results of the project were compiled into the planning guide of the Climate-proof city. The guide includes various tools that support the adaptation planning for cli-mate change. In addition to these tools, the guide also presents the best adaptation practices from Finland and abroad and various reviews and reports of the effects of climate change and adapting to it.
Adaptation to climate change was also promot-ed as part of everyday operations, for example, through maintaining the vitality and good condi-tion of recreational areas. The run-off water and flood work groups ceased their operations in the end of 2014.
The oil prevention training of Helsinki was developed and stabilised actively, and the training of oil prevention remained active through the whole open water season. The preparedness of fleet located in the Santahamina oil prevention depot was improved by, for example, improving the anchoring equipment of the oil booms and the storing systems.
The Rescue Department participated actively in the development of oil prevention preparedness
both nationally and internationally through various cooperation projects with the Finnish Environment Institute (SYKE), the Ministry of the Environment and the Finnish Border Guard. The Rescue Depart-ment participates in the Interspill 2015 and EU PREDICT projects as a specialist of oil prevention work in the coastal areas and archipelago and in connection to consequences of oil spills.
The veterinarian of Helsinki Zoo was appointed as the WWF’s Chief Veterinarian in regard to oil spills. The actions of this responsibility are related to preparing for oil spills.
Adaptation to climate change— Adaptation to climate change will be inte-
grated into the operations of all city depart-ments in order to minimise risks. The effects of climate change and the measures that can be taken to prepare for it will be communi-cated to municipal residents and companies.
Oil spill prevention— The effects of Helsinki’s own oil spill preven-
tion measures on the amounts and extent of oil reaching inhabited shorelines will be significant under most natural conditions. The oil spill prevention aid offered by Helsin-ki in the archipelagos of the Baltic Sea will be considerably effective.
— Oil spill prevention measures will prevent oil from spreading, and oil collection from water surfaces and shore protection are effective. The city will have enough trained personnel for shore cleaning measures.
Environmental policy 2020
Environmental Report 47

The environmental costs of Helsinki, including amor-tisations and the costs* of HSY, added up to a total of 191 million euros (+1% from 2013). The share of HSY Water Management was 15 million euros, the share of HSY’s Waste Management was 42 million euros, and the share of HSY’s regional and environmental information was 0.5 million euros. The environmen-
tal costs based on the City of Helsinki’s own opera-tions were 134 million euros (–1 % since 2013). The environmental costs caused by the operations of the city made up 2.9 percent of the total operating costs of the city, equalling 216 euros per capita (221 euros in 2013). The city’s largest expense items were environmentally-based taxes on electricity and fuel (24%), cleaning the public areas and waste manage-ment (22%), and climate protection (13%).
The environmental investments of Helsinki, in-cluding HSY’s shares, added up to 97 million euros (+54% from 2013), of which the investments of HSY
Water Management to wastewater treatment were 16 million and those of HSY’s Waste Management were 11 million euros. The environmental invest-ments made by the City of Helsinki added up to 64 million euros, which is some 2.4 percent of the total capital investments of the city. The city’s envi-ronmental investments increased by 127 percent compared to the previous year, which was mainly due to a more detailed reporting on investments of climate and environmentally friendly transport and the increase of climate investments.
The environmental income of Helsinki, includ-ing HSY’s shares, added up to a total of 113 million euros (+0.4% from 2013). HSY’s wastewater treat-ment income was 57 million euros, and HSY’s waste transportation and treatment fees totalled 49 million euros. The internal environmental income for the City of Helsinki added up to some 8.0 million euros, making up 0.5 percent of the total operating income of the city. The greatest sources of environ-mental income for the city were the proceeds from the ticket sales of the Helsinki Zoo, vessel waste charges, and scrap metal sales.
The value of mandatory provisions and environ-mental responsibilities in the financial statements on 31st December 2013 was 28.1 million euros. These responsibilities were related to the prepa-ration for the processing of contaminated soil and the after-treatment of landfill sites.
Environmental economy
* The City of Helsinki’s computational share of the cash flows resulting from the environmental services and opera-tions of the Helsinki Region Environmental Services Authority (HSY).
The greatest sources of environmental income for the city were the proceeds from the ticket sales of the Helsinki Zoo, vessel waste charges, and scrap metal sales.
48 City of Helsinki

The city’s environmental incomeCity organisation in 2014, thousand euros
Nature protection4,287
Environmental administration119
Environmental training and education42
Actions that improve ecoefficiency170
City organisationComputational share of the cash
flows resulting from the HSY*
2013 2014 2013 2014
Air protection 979 802
Climate protection 664 358
Water protection 215 90 54,341 56,803
Waste management 1,037 953 50,265 49,606
Soil protection 287 134
Nature protection 3,359 4,287
Environmental administration 2,802 1,036
Environmental management 63 119
Environmental training and education
2 42
Actions that improve eco-efficiency
119 170
Environmental income in total 9,527 7,991 112,881 113,357
Air protection802
Waste management953
Climate protection
358
Water protection
90Soil protection
134
Environmental administration
1,036
Chart 16.
* Computational share of the cash flows resulting from the environmental services and operations of the Helsinki Region Environmental Services Authority (HSY).
49Environmental Report

The city’s environmental costs City organisation in 2014, thousand euros
Climate protection
17,519
Waste management
29,010
Environmentally based taxes
32,513 Environ mentally
friendly and ecologically sustainable
transportation15,143
Authority assignments related to environmental protection6,616
Actions that improve ecoefficiency2,303
Environmental management
3,568
Environmental training and education5,188
Nature protection
6,914 Water
protection3,749
Noise reduction
332
Soil protection1,169
City organisationComputational share of the cash
flows resulting from the HSY*
2013 2014 2013 2014
Air protection 12,857 10,353 13,121 10,605
Climate protection 22,394 17,519 22,670 17,782
Water protection 4,930 3,749 20,702 18,420
Waste management 26,290 29,010 64,321 70,669
Soil protection 945 1,169
Noise reduction 256 332
Nature protection 4,543 6,914
Environmentally based taxes 34,656 32,513
Authority assignments related to environmental protection
5,782 6,616
Environmental management 3,264 3,568
Environmental training and education
3,384 5,188
Environmentally friendly and ecologically sustainable transportation
11,234 15,143
Actions that improve eco-efficiency
5,250 2,303
Environmental costs in total 135,785 134,377 190,128 191,222
Air protection10,353
Chart 17.
* Computational share of the cash flows resulting from the environmental services and operations of the Helsinki Region Environmental Services Authority (HSY).
50 City of Helsinki

The city’s environmental investments City organisation in 2014, thousand euros
Climate protection26,411
Soil protection7,145
Nature protection
3,558
Other21,292
Noise reduction894
City organisationComputational share of the cash
flows resulting from the HSY*
2013 2014 2013 2014
Air protection 1,286 3,697 1,334 3,728
Climate protection 7,924 26,411 7,974 26,442
Water protection 977 1,028 20,603 16,943
Waste management 527 411 8,919 11,700
Soil protection 9,323 7,145
Noise reduction 264 894
Nature protection 1,111 3,558
Other 6,946 21,292 13,865 26,958
Environmental investments in total
28,357 64,436 63,393 97,367
Air protection
3,697
Water protection
1,028
Waste management411
Chart 18.
* Computational share of the cash flows resulting from the environmental services and operations of the Helsinki Region Environmental Services Authority (HSY).
Environmental Report 51

Contents for diagrams and charts
11 DIAGRAM 1 Model for City of Helsinki's
environmental management16 DIAGRAM 2 The City of Helsinki climate programmes16 DIAGRAM 3 The carbon footprint in City of Helsinki19 DIAGRAM 4 Sectoral CO2 emissions in
Helsinki in 1990–201424 DIAGRAM 5 Annual average nitrogen dioxide
(NO2) concentrations measured by HSY’s monitoring stations and passive samplers in 2008–2014
25 DIAGRAM 6 The number of days when the limit value
(50 µg/m3) for particulate matter (PM10) was exceeded in the air quality measurement stations in Helsinki in 2005–2014
26 DIAGRAM 7 Distribution of various transport methods
in the public transport of Helsinki in 201429 DIAGRAM 8 CO2 emissions of different modes
of transportation in Helsinki in 1990 and 2000–2014
30 DIAGRAM 9 The map of exposed residents
to road traffic in 201235 DIAGRAM 10 Nitrogen and phosphorus load
channeled to the sea from the Viikinmäki treatment plant in 2002–2014
37 DIAGRAM 11 Map of protected nature areas,
Natura-areas, protected nature types and species protection areas
43 DIAGRAM 12 The share of environmental criteria in the
centralised procurements of the city in 201446 DIAGRAM 13 Oil spill damages in Helsinki in 2011–201449 DIAGRAM 14 The city’s environmental income in 201450 DIAGRAM 15 The city’s environmental costs in 201451 DIAGRAM 16 The city’s environmental investments in 2014
All the materials for the Environmental Report can be found (in Finnish) at www.hel.fi/ymparistoraportti.
52 City of Helsinki

The city’s environmental policy and strategy programme set goals for the various sectors of environmental pro-tection. The environmental policy can be found in its entirety at www.hel.fi/ymparistopolitiikka, but the central objectives are also presented in this report.
All of the 29 city departments and six public utility companies have produced information for the report compiled and edited by the Environment Centre. The City of Helsinki Group also includes 11 foundations and 87 sub sidiary organisations, 64 of which submitted information for the Environmental Report.
13 CHART 1 Indicators for environmental
management and partnerships14 CHART 2 The binding environmental
objective in the 2014 budget19 CHART 3 The selected additional measures
and the total economic impact of the emission reductions
21 CHART 4 Indicators for climate protection25 CHART 5 Indicators for air protection 29 CHART 6 Indicators for traffic30 CHART 7 Indicators for noise reduction35 CHART 8 Indicators for water protection38 CHART 9 Contaminated soil matter transported
to treatment or final disposal in Helsinki in 2012–2014
38 CHART 10 The costs for the City of Helsinki caused
by the restoration of contaminated soil and landfill sites in 2012–2014
38 CHART 11 Indicators for nature protection43 CHART 12 Indicators for procurements and waste44 CHART 13 The number of participants in the City of
Helsinki environmental education and climate and energy guidance in 2011–2014
44 CHART 14 Indicator for environmental awareness
46 CHART 15 Indicator for environmental risks49 CHART 16 The environmental income of the
City of Helsinki in 2013 and 201450 CHART 17 The environmental costs of the City
of Helsinki in 2013 and 201451 CHART 18 The environmental investments of the
City of Helsinki in 2013 and 2014
Environmental Report 53

City of Helsinki Environmental report 2014
City of Helsinki, publications of the Central Administration 2015:16Publisher City of Helsinki Environment CentreGraphic designKokoro & MoiCover photoKimmo BrandtPhotospage 5: Maija Astikainenpages 8 and 12: Kimmo Brandtpage 22: Seppo Laaksopage 28: Patrik Lindströmpage 33: Lauri Rotkopage 40: Jari LeinoLayoutTuomas Kärkkäinen, City Executive OfficePrinted atSLY-Lehtipainot Oy Kirjapaino Uusimaa
ISBN 978-952-272-910-1 (printed publication)ISBN 978-952-272-911-8 (online publication)ISSN-L 2242-4504ISSN 2242-4504 (printed publication)ISSN 2323-8135 (online publication)
Keywords: environmental reporting,environmental management,environmental economy
NO
RDIC ECOLABEL
4041 0763Printed matter
54 City of Helsinki


City of Helsinki Environment Centre
Street addressViikinkaari 2 A00790 HelsinkiPostal addressP.O. Box 500FIN-00099 City of HelsinkiExchange +358(0)9 310 [email protected]/ymparistoraportti
Environm
ental Rep
ort 2014
City of H
elsinki