Embed Size (px)
Citation preview
Canada www.riotintobcoperations.com
Environmental ReportBC Works 2015
2015 Environmental Report
i
TABLE OF CONTENTS
1. About this report ....................................................................................1
About this report ..............................................................................................................1
2. Operational overview .............................................................................2
Our modernized smelter .................................................................................................2
3. Environmental management and certification .................................. 5 Independent certification ...............................................................................................5
Audit program ..................................................................................................................5
Health, Safety and Environment Policy — Aluminium ...............................................6
4. Effluents ..................................................................................................7Sources and infrastructure ..............................................................................................7
2015 performance .....................................................................................................7
Effluent water quality monitoring .................................................................................7
Flow variability .................................................................................................................8
Long-term trends ..............................................................................................................8
Dissolved fluoride .............................................................................................................8
Dissolved aluminium .......................................................................................................8
Total suspended solids (TSS) ...........................................................................................9
Cyanide ..............................................................................................................................9
Temperature ......................................................................................................................9
Conductivity, hardness, salt water addition and toxicity ...........................................9
Acidity ................................................................................................................................9
Polycyclic aromatic hydrocarbons (PAHs) ......................................................................10
2015 Environmental Report
ii
5. Emissions ................................................................................................14 Emission types ................................................................................................................14
Sources ..............................................................................................................................14
Air quality monitoring ....................................................................................................14
2015 performance .....................................................................................................14
Gaseous fluoride (Fg) .......................................................................................................14
Sulphur dioxide (SO2) .......................................................................................................15
Polycyclic aromatic hydrocarbons (PAHs) .....................................................................19
Nitrogen oxides (NOX)......................................................................................................15
Potroom dry scrubbers ....................................................................................................16
Total particulate emissions .............................................................................................16
Potroom particulate emissions ......................................................................................16
Calcined Coke Plant ........................................................................................................17
Anode Paste Plant ...........................................................................................................17
Natural gas consumption ................................................................................................17
Chlorine consumption ....................................................................................................17
Sulphur hexafluoride (SF6) consumption ......................................................................17
Greenhouse gas emissions .............................................................................................17
6. Air quality monitoring ...........................................................................25 Network overview ............................................................................................................25
Weather monitoring ........................................................................................................26
Quality assurance and control .......................................................................................26
2015 monitoring results ............................................................................................26
Hydrogen fluoride (HF)....................................................................................................26
Sulphur dioxide (SO2) .......................................................................................................26
Particulate (PM10 and PM2.5) ............................................................................................27
Polycyclic aromatic hydrocarbons (PAHs) ....................................................................27
Rain chemistry .................................................................................................................28
2015 Environmental Report
iii
7. Vegetation monitoring ...........................................................................34Introduction ...............................................................................................................34
2015 monitoring results ............................................................................................35
Fluoride content................................................................................................................35
Sulphur content ...............................................................................................................35
Qualitative assessment ....................................................................................................35
8. Waste management ................................................................................37Introduction ...............................................................................................................37
2015 performance .....................................................................................................37
Spent potlining .................................................................................................................37
Asbestos and refractory ceramic fibres (RCF) ...............................................................37
Wood waste .......................................................................................................................38
Landfill management .......................................................................................................38
9. Groundwater monitoring .......................................................................39 Introduction ...............................................................................................................39
2015 monitoring results ...........................................................................................39
Spent potlining landfill ....................................................................................................39
Dredgeate cells and SPL overburden cell .......................................................................40
10. Kemano permits .....................................................................................41 Introduction ...............................................................................................................41
2015 performance .....................................................................................................41
Kemano effluent discharge .............................................................................................41
Kemano emission discharge ............................................................................................41
Kemano landfill .................................................................................................................41
Seekwyakin camp effluent discharge ............................................................................42
11. Summary of non-compliance and spills ...............................................43 2015 performance .....................................................................................................43
Non-compliance summary ............................................................................................43
Spill summary ...................................................................................................................43
12. Glossary ..................................................................................................45
1
2015 Environmental Report
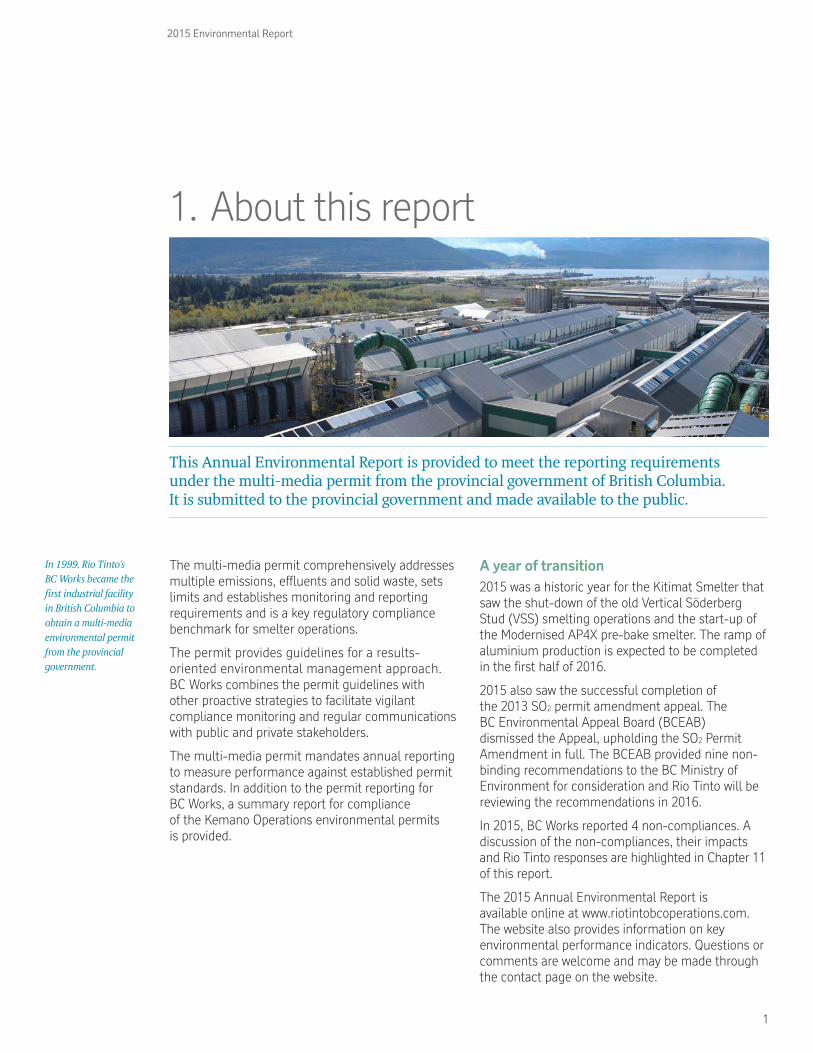
The multi-media permit comprehensively addresses multiple emissions, effluents and solid waste, sets limits and establishes monitoring and reporting requirements and is a key regulatory compliance benchmark for smelter operations.
The permit provides guidelines for a results-oriented environmental management approach. BC Works combines the permit guidelines with other proactive strategies to facilitate vigilant compliance monitoring and regular communications with public and private stakeholders.
The multi-media permit mandates annual reporting to measure performance against established permit standards. In addition to the permit reporting for BC Works, a summary report for compliance of the Kemano Operations environmental permits is provided.
A year of transition2015 was a historic year for the Kitimat Smelter that saw the shut-down of the old Vertical Söderberg Stud (VSS) smelting operations and the start-up of the Modernised AP4X pre-bake smelter. The ramp of aluminium production is expected to be completed in the first half of 2016.
2015 also saw the successful completion of the 2013 SO2 permit amendment appeal. The BC Environmental Appeal Board (BCEAB) dismissed the Appeal, upholding the SO2 Permit Amendment in full. The BCEAB provided nine non-binding recommendations to the BC Ministry of Environment for consideration and Rio Tinto will be reviewing the recommendations in 2016.
In 2015, BC Works reported 4 non-compliances. A discussion of the non-compliances, their impacts and Rio Tinto responses are highlighted in Chapter 11 of this report.
The 2015 Annual Environmental Report is available online at www.riotintobcoperations.com. The website also provides information on key environmental performance indicators. Questions or comments are welcome and may be made through the contact page on the website.
1. About this report
In 1999, Rio Tinto’s BC Works became the first industrial facility in British Columbia to obtain a multi-media environmental permit from the provincial government.
This Annual Environmental Report is provided to meet the reporting requirements under the multi-media permit from the provincial government of British Columbia. It is submitted to the provincial government and made available to the public.
2
2015 Environmental Report
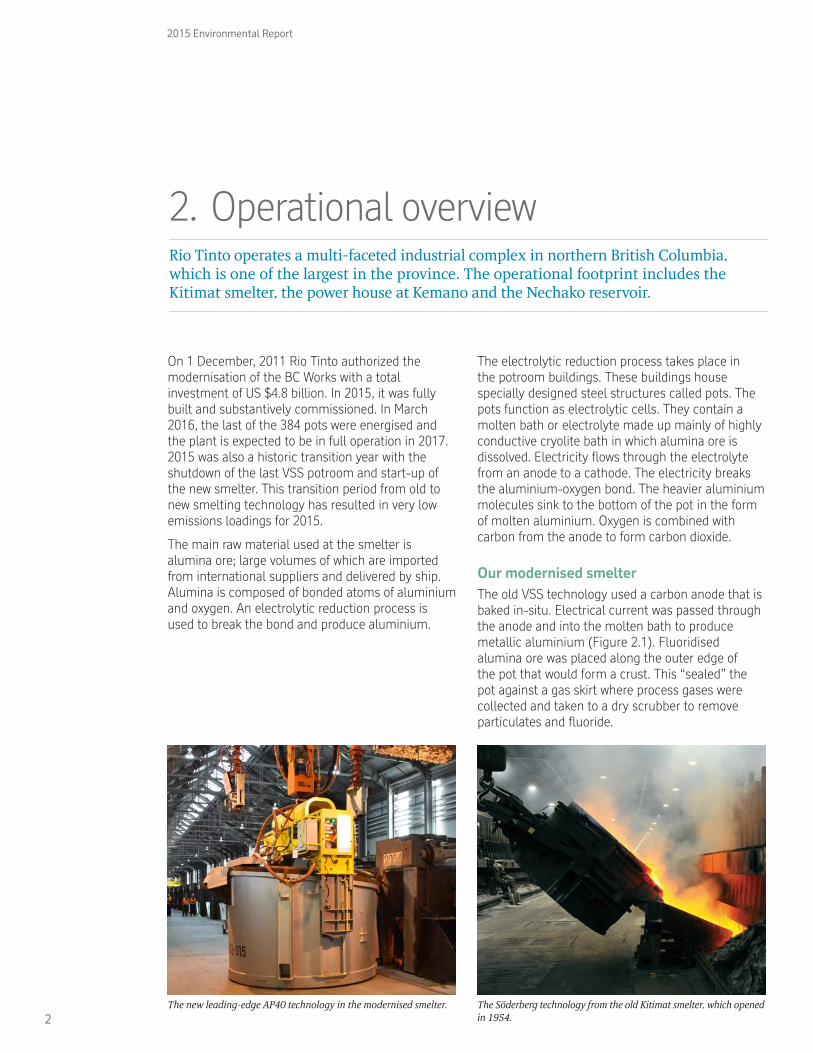
2. Operational overviewRio Tinto operates a multi-faceted industrial complex in northern British Columbia, which is one of the largest in the province. The operational footprint includes the Kitimat smelter, the power house at Kemano and the Nechako reservoir.
On 1 December, 2011 Rio Tinto authorized the modernisation of the BC Works with a total investment of US $4.8 billion. In 2015, it was fully built and substantively commissioned. In March 2016, the last of the 384 pots were energised and the plant is expected to be in full operation in 2017. 2015 was also a historic transition year with the shutdown of the last VSS potroom and start-up of the new smelter. This transition period from old to new smelting technology has resulted in very low emissions loadings for 2015.
The main raw material used at the smelter is alumina ore; large volumes of which are imported from international suppliers and delivered by ship. Alumina is composed of bonded atoms of aluminium and oxygen. An electrolytic reduction process is used to break the bond and produce aluminium.
The electrolytic reduction process takes place in the potroom buildings. These buildings house specially designed steel structures called pots. The pots function as electrolytic cells. They contain a molten bath or electrolyte made up mainly of highly conductive cryolite bath in which alumina ore is dissolved. Electricity flows through the electrolyte from an anode to a cathode. The electricity breaks the aluminium-oxygen bond. The heavier aluminium molecules sink to the bottom of the pot in the form of molten aluminium. Oxygen is combined with carbon from the anode to form carbon dioxide.
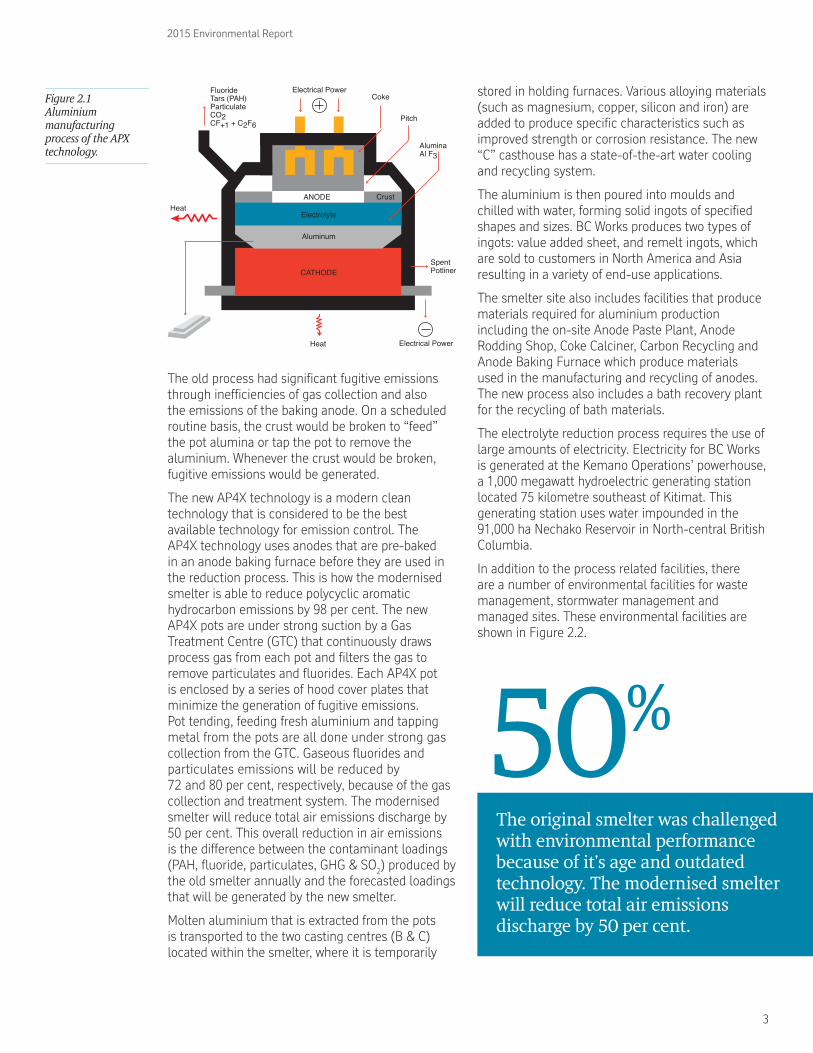
Our modernised smelterThe old VSS technology used a carbon anode that is baked in-situ. Electrical current was passed through the anode and into the molten bath to produce metallic aluminium (Figure 2.1). Fluoridised alumina ore was placed along the outer edge of the pot that would form a crust. This “sealed” the pot against a gas skirt where process gases were collected and taken to a dry scrubber to remove particulates and fluoride.
The new leading-edge AP40 technology in the modernised smelter. The Söderberg technology from the old Kitimat smelter, which opened in 1954.
3
2015 Environmental Report
50%
The original smelter was challenged with environmental performance because of it’s age and outdated technology. The modernised smelter will reduce total air emissions discharge by 50 per cent.
Figure 2.1 Aluminium manufacturing process of the APX technology.
Crust
Electrical Power
Electrical PowerHeat
Heat
FluorideTars (PAH)ParticulateCO2CF+1 + C2F6
AluminaAl F3
SpentPotliner
Electrolyte
Aluminum
ANODE
CATHODE
Coke
Pitch
The old process had significant fugitive emissions through inefficiencies of gas collection and also the emissions of the baking anode. On a scheduled routine basis, the crust would be broken to “feed” the pot alumina or tap the pot to remove the aluminium. Whenever the crust would be broken, fugitive emissions would be generated.
The new AP4X technology is a modern clean technology that is considered to be the best available technology for emission control. The AP4X technology uses anodes that are pre-baked in an anode baking furnace before they are used in the reduction process. This is how the modernised smelter is able to reduce polycyclic aromatic hydrocarbon emissions by 98 per cent. The new AP4X pots are under strong suction by a Gas Treatment Centre (GTC) that continuously draws process gas from each pot and filters the gas to remove particulates and fluorides. Each AP4X pot is enclosed by a series of hood cover plates that minimize the generation of fugitive emissions. Pot tending, feeding fresh aluminium and tapping metal from the pots are all done under strong gas collection from the GTC. Gaseous fluorides and particulates emissions will be reduced by 72 and 80 per cent, respectively, because of the gas collection and treatment system. The modernised smelter will reduce total air emissions discharge by 50 per cent. This overall reduction in air emissions is the difference between the contaminant loadings (PAH, fluoride, particulates, GHG & SO2) produced by the old smelter annually and the forecasted loadings that will be generated by the new smelter.
Molten aluminium that is extracted from the pots is transported to the two casting centres (B & C) located within the smelter, where it is temporarily
stored in holding furnaces. Various alloying materials (such as magnesium, copper, silicon and iron) are added to produce specific characteristics such as improved strength or corrosion resistance. The new “C” casthouse has a state-of-the-art water cooling and recycling system.
The aluminium is then poured into moulds and chilled with water, forming solid ingots of specified shapes and sizes. BC Works produces two types of ingots: value added sheet, and remelt ingots, which are sold to customers in North America and Asia resulting in a variety of end-use applications.
The smelter site also includes facilities that produce materials required for aluminium production including the on-site Anode Paste Plant, Anode Rodding Shop, Coke Calciner, Carbon Recycling and Anode Baking Furnace which produce materials used in the manufacturing and recycling of anodes. The new process also includes a bath recovery plant for the recycling of bath materials.
The electrolyte reduction process requires the use of large amounts of electricity. Electricity for BC Works is generated at the Kemano Operations’ powerhouse, a 1,000 megawatt hydroelectric generating station located 75 kilometre southeast of Kitimat. This generating station uses water impounded in the 91,000 ha Nechako Reservoir in North-central British Columbia.
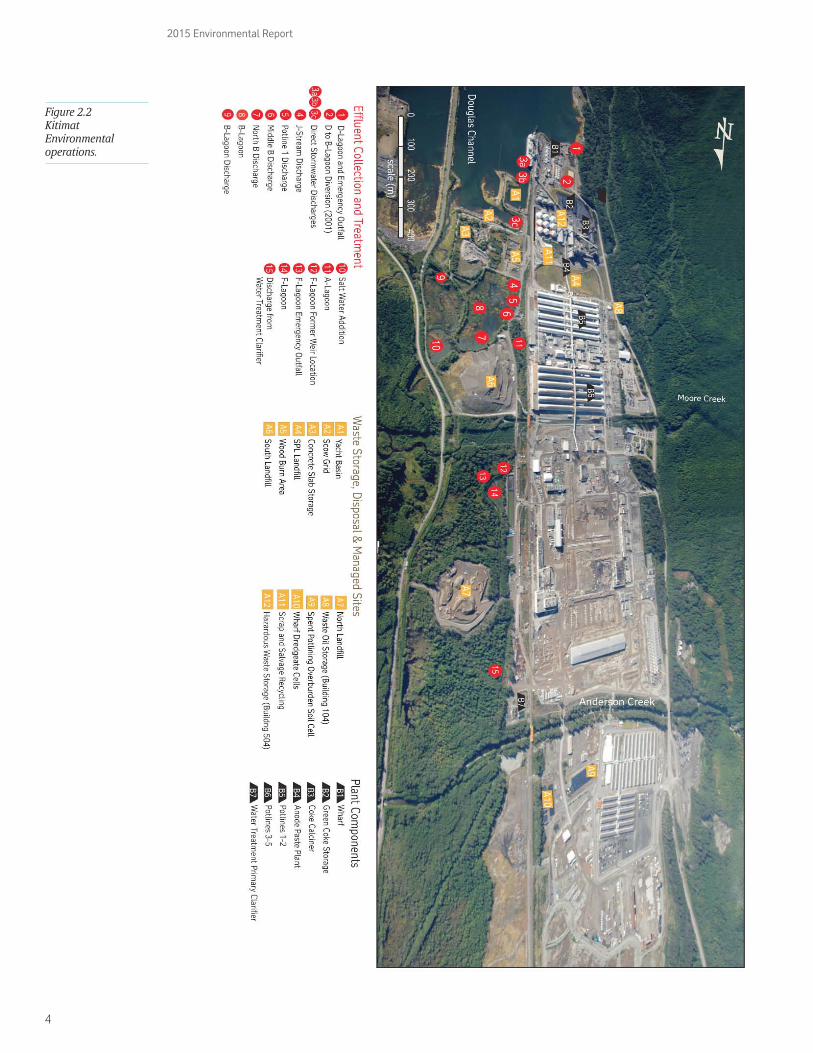
In addition to the process related facilities, there are a number of environmental facilities for waste management, stormwater management and managed sites. These environmental facilities are shown in Figure 2.2.
4
2015 Environmental Report
Figure 2.2 Kitimat Environmental operations.
5
2015 Environmental Report
3. Environmental management and certification
The foundation for environmental management throughout Rio Tinto’s global operations is the Health, Safety and Environment (HSE) Policy. HSE directives establish corporate-wide standards on major environmental, health and safety topics.
The HSE Policy and the more specific requirements of the Rio Tinto Health, Safety, Environment and Quality (HSEQ) standards are put into practice at BC Works through a comprehensive, operation specific Risk Management System. The system is maintained through adherence to the HSEQ Management System’s 17 elements encompassing the continuous improvement cycle of Plan, Do, Check and Review (PDCR).
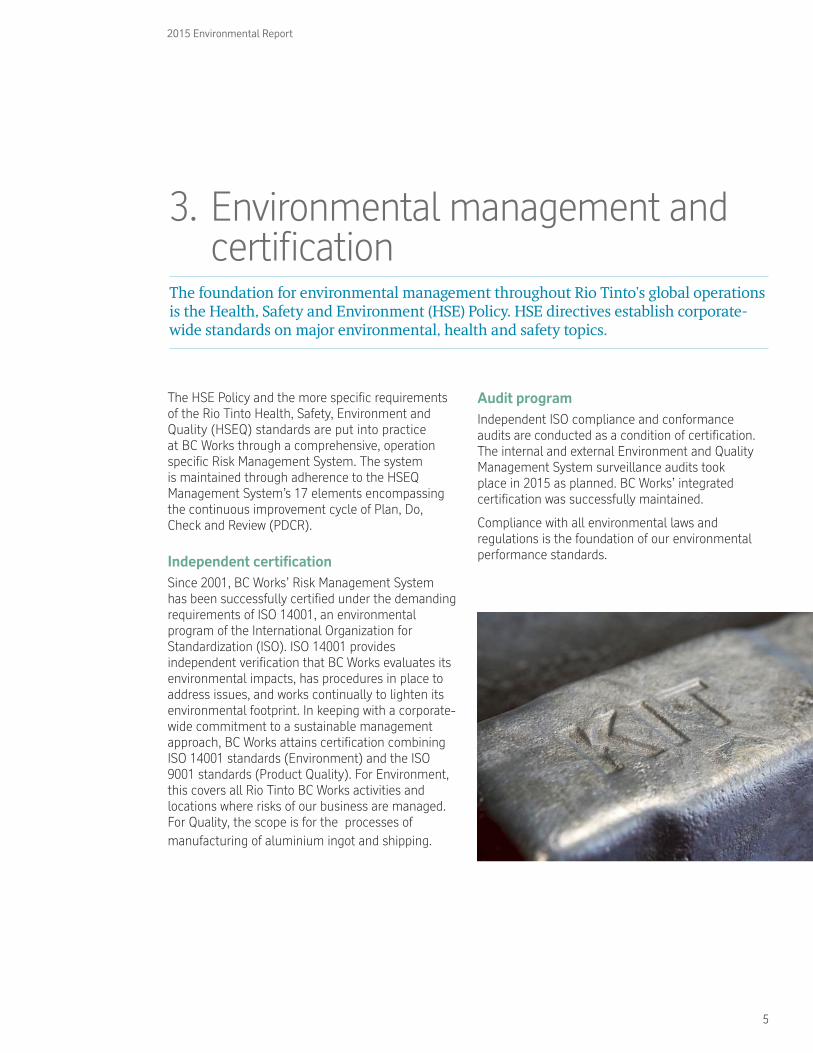
Independent certificationSince 2001, BC Works’ Risk Management System has been successfully certified under the demanding requirements of ISO 14001, an environmental program of the International Organization for Standardization (ISO). ISO 14001 provides independent verification that BC Works evaluates its environmental impacts, has procedures in place to address issues, and works continually to lighten its environmental footprint. In keeping with a corporate-wide commitment to a sustainable management approach, BC Works attains certification combining ISO 14001 standards (Environment) and the ISO 9001 standards (Product Quality). For Environment, this covers all Rio Tinto BC Works activities and locations where risks of our business are managed. For Quality, the scope is for the processes of manufacturing of aluminium ingot and shipping.
Audit programIndependent ISO compliance and conformance audits are conducted as a condition of certification. The internal and external Environment and Quality Management System surveillance audits took place in 2015 as planned. BC Works’ integrated certification was successfully maintained.
Compliance with all environmental laws and regulations is the foundation of our environmental performance standards.
6
2015 Environmental Report
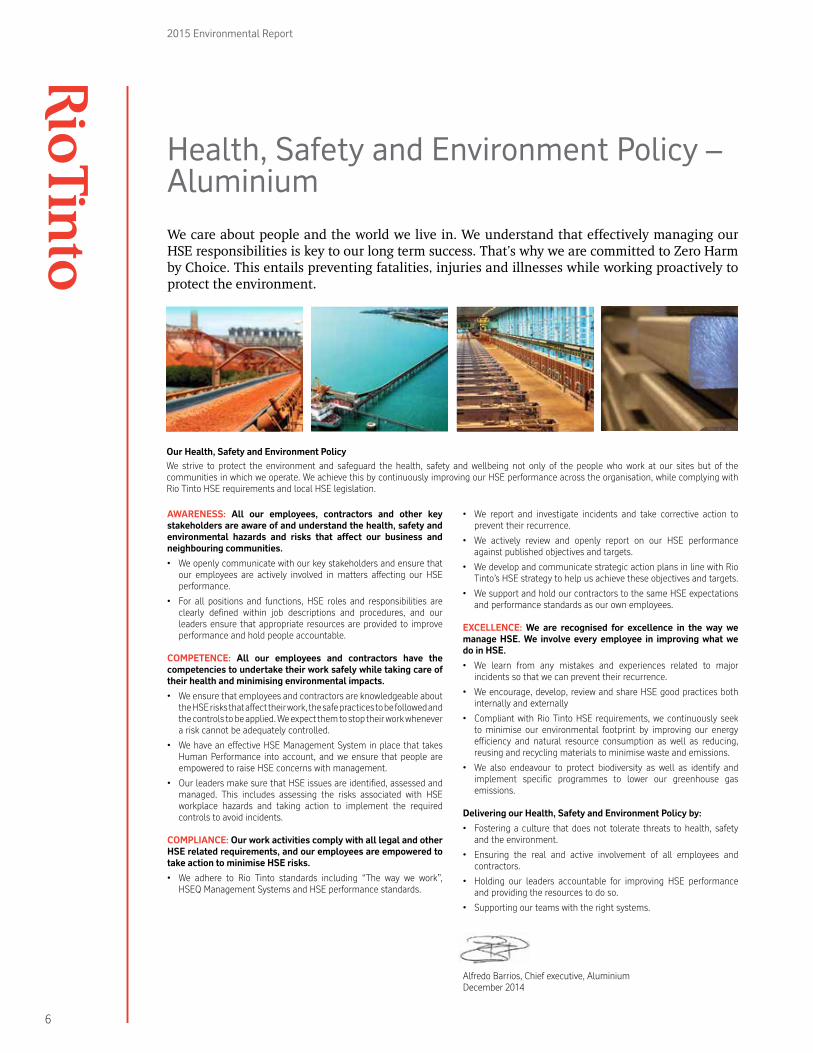
Health, Safety and Environment Policy – AluminiumWe care about people and the world we live in. We understand that effectively managing our HSE responsibilities is key to our long term success. That’s why we are committed to Zero Harm by Choice. This entails preventing fatalities, injuries and illnesses while working proactively to protect the environment.
AWARENESS: All our employees, contractors and other key stakeholders are aware of and understand the health, safety and environmental hazards and risks that affect our business and neighbouring communities.
• Weopenlycommunicatewithourkeystakeholdersandensurethatour employees are actively involved in matters affecting our HSEperformance.
• For all positions and functions,HSE roles and responsibilities areclearly defined within job descriptions and procedures, and ourleadersensurethatappropriateresourcesareprovidedtoimproveperformanceandholdpeopleaccountable.
COMPETENCE: All our employees and contractors have the competencies to undertake their work safely while taking care of their health and minimising environmental impacts.
• WeensurethatemployeesandcontractorsareknowledgeableabouttheHSErisksthataffecttheirwork,thesafepracticestobefollowedandthecontrolstobeapplied.Weexpectthemtostoptheirworkwheneverariskcannotbeadequatelycontrolled.
• WehaveaneffectiveHSEManagementSysteminplacethattakesHumanPerformance intoaccount,andweensurethatpeopleareempoweredtoraiseHSEconcernswithmanagement.
• OurleadersmakesurethatHSEissuesareidentified,assessedandmanaged. This includes assessing the risks associated with HSEworkplace hazards and taking action to implement the requiredcontrolstoavoidincidents.
COMPLIANCE: Our work activities comply with all legal and other HSE related requirements, and our employees are empowered to take action to minimise HSE risks.
• We adhere to Rio Tinto standards including “The way we work”,HSEQManagementSystemsandHSEperformancestandards.
• We report and investigate incidents and take corrective action topreventtheirrecurrence.
• We actively review and openly report on our HSE performanceagainstpublishedobjectivesandtargets.
• WedevelopandcommunicatestrategicactionplansinlinewithRioTinto’sHSEstrategytohelpusachievetheseobjectivesandtargets.
• WesupportandholdourcontractorstothesameHSEexpectationsandperformancestandardsasourownemployees.
EXCELLENCE: We are recognised for excellence in the way we manage HSE. We involve every employee in improving what we do in HSE.
• We learn from any mistakes and experiences related to majorincidentssothatwecanpreventtheirrecurrence.
• Weencourage,develop,reviewandshareHSEgoodpracticesbothinternallyandexternally
• CompliantwithRioTintoHSErequirements,wecontinuouslyseektominimiseour environmental footprint by improvingour energyefficiency and natural resource consumption as well as reducing,reusingandrecyclingmaterialstominimisewasteandemissions.
• We also endeavour to protect biodiversity as well as identify andimplement specific programmes to lower our greenhouse gasemissions.
Delivering our Health, Safety and Environment Policy by:
• Fosteringaculturethatdoesnottoleratethreatstohealth,safetyandtheenvironment.
• Ensuring the real and active involvement of all employees andcontractors.
• Holding our leaders accountable for improving HSE performanceandprovidingtheresourcestodoso.
• Supportingourteamswiththerightsystems.
AlfredoBarrios,Chiefexecutive,AluminiumDecember2014
Our Health, Safety and Environment PolicyWestrive toprotect theenvironmentandsafeguard thehealth, safetyandwellbeingnotonlyof thepeoplewhoworkatour sitesbutof thecommunitiesinwhichweoperate.WeachievethisbycontinuouslyimprovingourHSEperformanceacrosstheorganisation,whilecomplyingwithRioTintoHSErequirementsandlocalHSElegislation.
7
2015 Environmental Report
4. Effluents
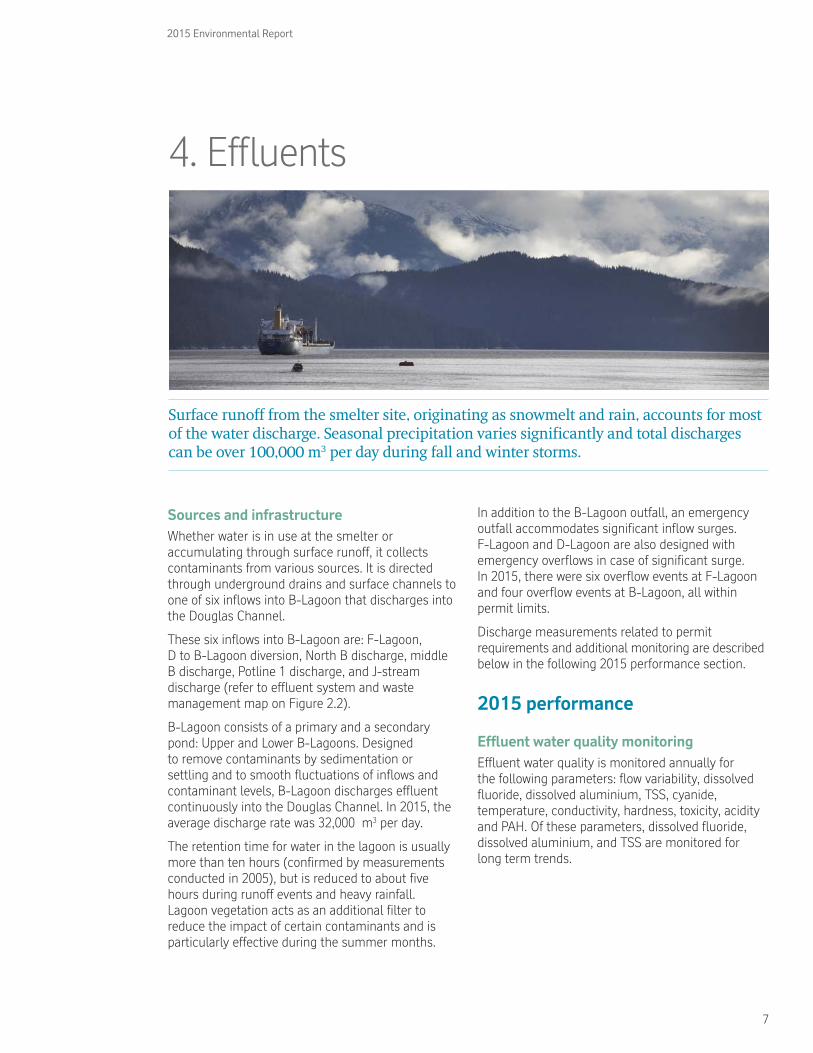
Surface runoff from the smelter site, originating as snowmelt and rain, accounts for most of the water discharge. Seasonal precipitation varies significantly and total discharges can be over 100,000 m3 per day during fall and winter storms.
Sources and infrastructureWhether water is in use at the smelter or accumulating through surface runoff, it collects contaminants from various sources. It is directed through underground drains and surface channels to one of six inflows into B-Lagoon that discharges into the Douglas Channel.
These six inflows into B-Lagoon are: F-Lagoon, D to B-Lagoon diversion, North B discharge, middle B discharge, Potline 1 discharge, and J-stream discharge (refer to effluent system and waste management map on Figure 2.2).
B-Lagoon consists of a primary and a secondary pond: Upper and Lower B-Lagoons. Designed to remove contaminants by sedimentation or settling and to smooth fluctuations of inflows and contaminant levels, B-Lagoon discharges effluent continuously into the Douglas Channel. In 2015, the average discharge rate was 32,000 m3 per day.
The retention time for water in the lagoon is usually more than ten hours (confirmed by measurements conducted in 2005), but is reduced to about five hours during runoff events and heavy rainfall. Lagoon vegetation acts as an additional filter to reduce the impact of certain contaminants and is particularly effective during the summer months.
In addition to the B-Lagoon outfall, an emergency outfall accommodates significant inflow surges. F-Lagoon and D-Lagoon are also designed with emergency overflows in case of significant surge. In 2015, there were six overflow events at F-Lagoon and four overflow events at B-Lagoon, all within permit limits.
Discharge measurements related to permit requirements and additional monitoring are described below in the following 2015 performance section.
2015 performance
Effluent water quality monitoringEffluent water quality is monitored annually for the following parameters: flow variability, dissolved fluoride, dissolved aluminium, TSS, cyanide, temperature, conductivity, hardness, toxicity, acidity and PAH. Of these parameters, dissolved fluoride, dissolved aluminium, and TSS are monitored for long term trends.
8
2015 Environmental Report
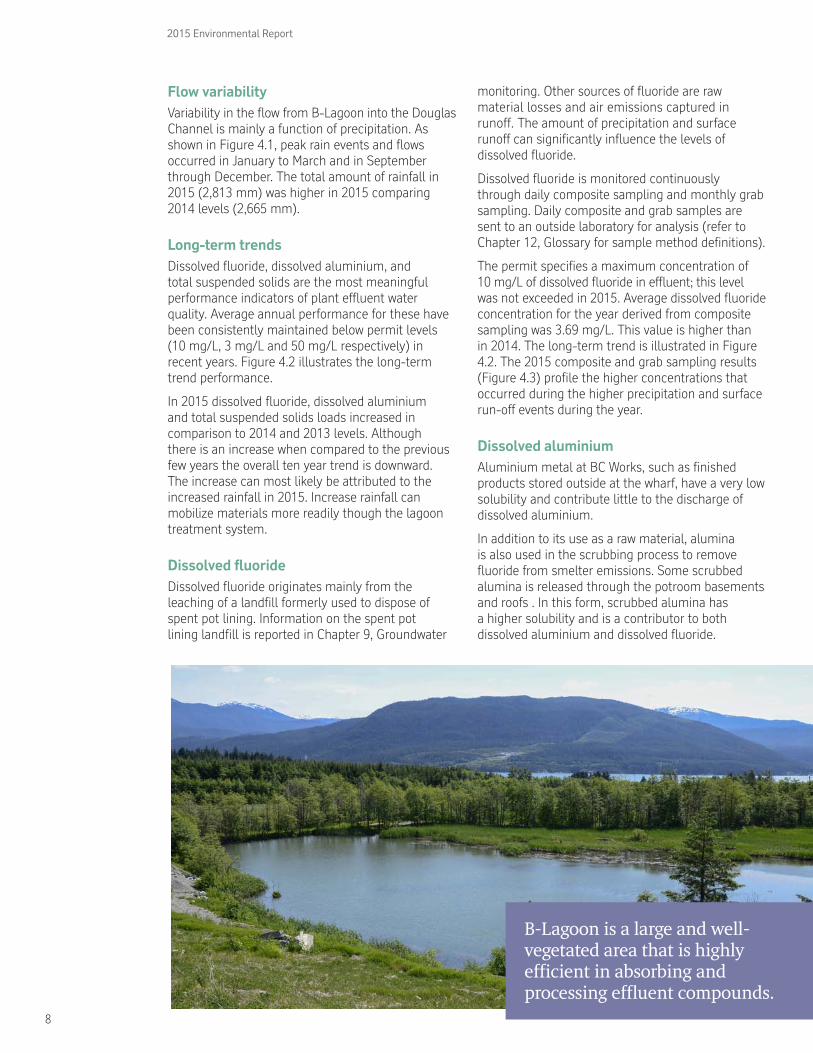
B-Lagoon is a large and well-vegetated area that is highly efficient in absorbing and processing effluent compounds.
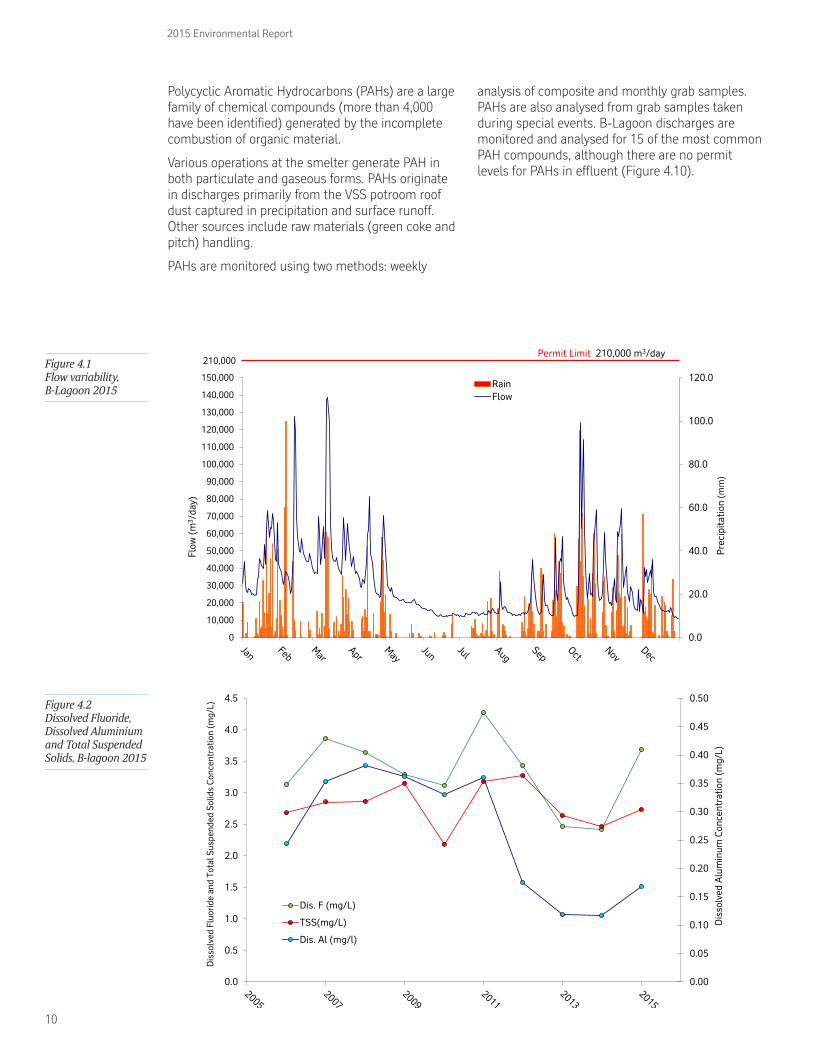
Flow variabilityVariability in the flow from B-Lagoon into the Douglas Channel is mainly a function of precipitation. As shown in Figure 4.1, peak rain events and flows occurred in January to March and in September through December. The total amount of rainfall in 2015 (2,813 mm) was higher in 2015 comparing 2014 levels (2,665 mm).
Long-term trendsDissolved fluoride, dissolved aluminium, and total suspended solids are the most meaningful performance indicators of plant effluent water quality. Average annual performance for these have been consistently maintained below permit levels (10 mg/L, 3 mg/L and 50 mg/L respectively) in recent years. Figure 4.2 illustrates the long-term trend performance.
In 2015 dissolved fluoride, dissolved aluminium and total suspended solids loads increased in comparison to 2014 and 2013 levels. Although there is an increase when compared to the previous few years the overall ten year trend is downward. The increase can most likely be attributed to the increased rainfall in 2015. Increase rainfall can mobilize materials more readily though the lagoon treatment system.
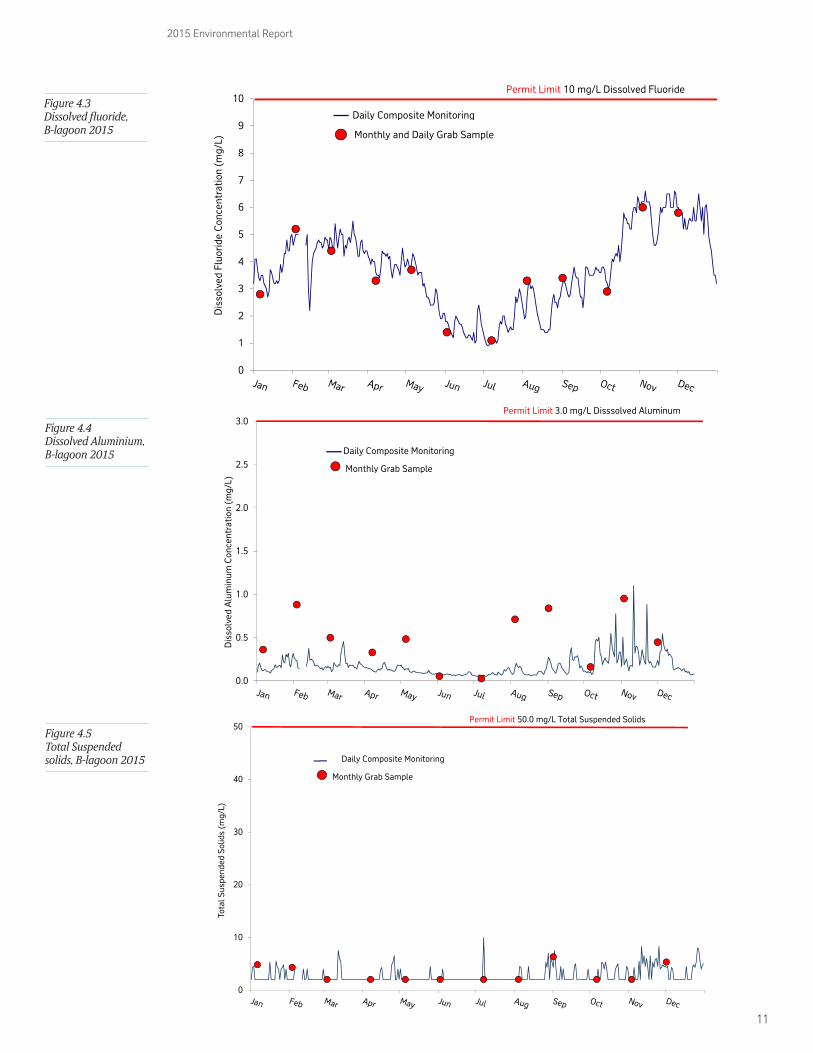
Dissolved fluorideDissolved fluoride originates mainly from the leaching of a landfill formerly used to dispose of spent pot lining. Information on the spent pot lining landfill is reported in Chapter 9, Groundwater
monitoring. Other sources of fluoride are raw material losses and air emissions captured in runoff. The amount of precipitation and surface runoff can significantly influence the levels of dissolved fluoride.
Dissolved fluoride is monitored continuously through daily composite sampling and monthly grab sampling. Daily composite and grab samples are sent to an outside laboratory for analysis (refer to Chapter 12, Glossary for sample method definitions).
The permit specifies a maximum concentration of 10 mg/L of dissolved fluoride in effluent; this level was not exceeded in 2015. Average dissolved fluoride concentration for the year derived from composite sampling was 3.69 mg/L. This value is higher than in 2014. The long-term trend is illustrated in Figure 4.2. The 2015 composite and grab sampling results (Figure 4.3) profile the higher concentrations that occurred during the higher precipitation and surface run-off events during the year.
Dissolved aluminiumAluminium metal at BC Works, such as finished products stored outside at the wharf, have a very low solubility and contribute little to the discharge of dissolved aluminium.
In addition to its use as a raw material, alumina is also used in the scrubbing process to remove fluoride from smelter emissions. Some scrubbed alumina is released through the potroom basements and roofs . In this form, scrubbed alumina has a higher solubility and is a contributor to both dissolved aluminium and dissolved fluoride.
9
2015 Environmental Report
In 2015, concentrations of dissolved aluminium did not exceed the maximum permit limit of 3.0 mg/L. The annual average of dissolved aluminium concentration was 0.17 mg/L (Figure 4.4).
Total suspended solids (TSS)Solids that remain suspended in discharge from B-Lagoon include small amounts of materials used in industrial processes at the smelter and other naturally occurring substances like dust, pollen and silt. There is a proportional relationship between TSS levels and concentrations of both dissolved aluminium and polycyclic aromatic hydrocarbons (PAHs) because these contaminants are usually bound to suspended solids in water when entering the B-Lagoon system.
B-Lagoon is a large and well-vegetated area that is highly efficient in absorbing and processing effluent compounds. The permit specifies a concentration maximum of 50 mg per litre of TSS in effluent. Concentrations in 2015 were much lower than the permit level. The annual average concentration for the composite samples was 2.7 mg/L (Figure 4.5) which is consistent with previous years.
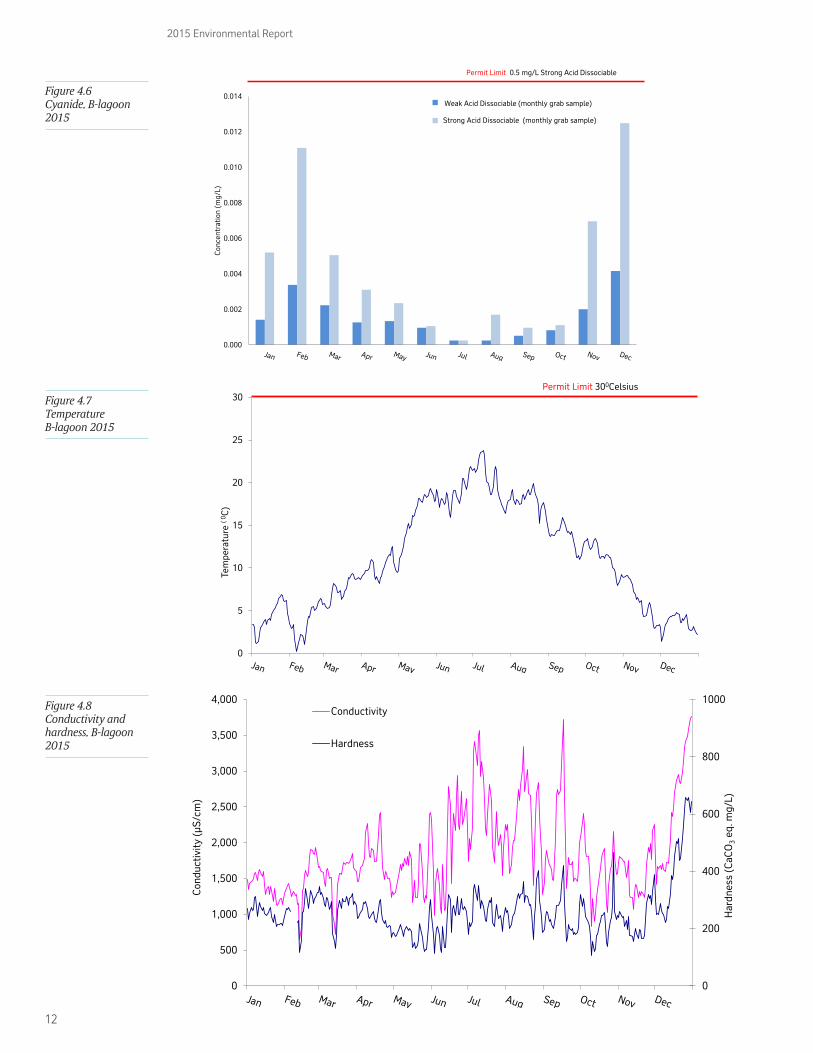
CyanideCyanide is formed during the electrolytic reduction process and retained in the cathode lining material known as spent pot lining (SPL). In the past, material in the cathode was deposited on-site at the SPL landfill. Today, all generated SPL is shipped off-site to a secure landfill. Groundwater and the bottom of the SPL landfill lining interact, generating a leachate containing cyanide. The source of the cyanide in B-Lagoon is from the J-Stream outlet.
The permit specifies a maximum concentration of 0.5 mg per litre of strong acid dissociable cyanide (the more abundant, although less toxic form) in B-Lagoon. Concentrations are determined from the monthly grab samples. The permit level was not exceeded in 2015. Weak acid dissociable cyanide is also monitored, although there is no permit requirement (Figure 4.6).
TemperatureWater used for cooling is the major source of effluent at BC Works. B-Lagoon is designed to retain effluent long enough to ensure water temperatures are not elevated when discharged. The permit
requires that the temperature of the lagoon discharge does not exceed 30°C. Temperatures were within permit requirements during 2015 (Figure 4.7).
Conductivity, hardness, salt water addition and toxicitySince 1997, salt water has been pumped into B-Lagoon at the connection between the primary and secondary ponds. As per permit requirements, the addition of salt water is monitored and managed to maintain non-toxic discharges.
In 2008, an independent consulting firm conducted a review to examine the correlation between seawater addition rates, conductivity, hardness, and toxicity. The review was in fulfillment of section 8.2.5 of the multi-media permit requirement. Results confirmed that the addition of sea water was successful at reducing the toxicity of the B-Lagoon effluent.
The data also confirmed the best way to predict toxicity is via aluminium concentration, conductivity and pH. Conductivity and hardness are monitored on a continuous and daily composite basis respectively, even though there are no permit limits for either parameter (Figure 4.8). These measures provide information that ensures the salt water addition system is contributing to the reduction of toxicity at the B-Lagoon outfall.
Water toxicity is determined through the application of a bioassay test. The toxicity of water discharged from B-Lagoon is tested by exposing juvenile rainbow trout to the effluent in a certified laboratory under controlled conditions (96LC50 bioassay test). The permit requires quarterly monitoring with a survival rate of at least 50 per cent for trout tested. All effluent discharge bioassay tests at B-Lagoon passed during 2015.
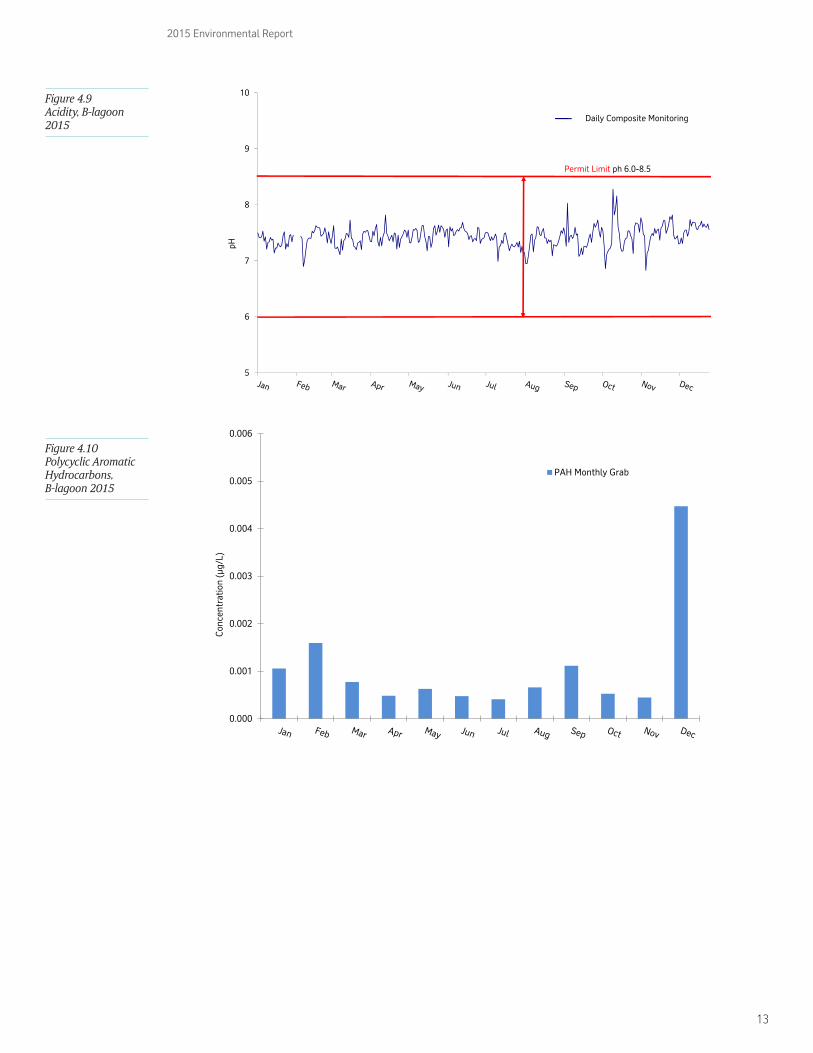
AcidityA variety of contaminants can influence the acidity of effluent, by either increasing or decreasing the pH levels. A pH level of 7.0 is neutral, and water sources found adjacent to BC Works (Anderson Creek and the Kitimat River) usually have a pH level slightly below neutral (i.e. acidic, rather than alkaline).
Acidity is monitored using a variety of methods (continuous, daily composite and monthly grab samples). Daily composite samples are provided to an external laboratory for analysis. The permit requires that the pH of the effluent is maintained between 6.0 and 8.5. The 2015 annual pH composite sample average was 7.4. All sample measurements were within the permit limits during 2015 (Figure 4.9).
Polycyclic aromatic hydrocarbons (PAHs)
Studies conducted in B-Lagoon demonstrate that the addition of salt water to the effluent reduces toxicity by increasing conductivity and hardness levels.
10
2015 Environmental Report
0.0
20.0
40.0
60.0
80.0
100.0
120.0
0
10,000
20,000
30,000
40,000
50,000
60,000
70,000
80,000
90,000
100,000
110,000
120,000
130,000
140,000
150,000
Flow
(m
3 /da
y)
RainFlow
210,000
Prec
ipita
tion
(mm
)
Permit Limit 210,000 m3/day Figure 4.1 Flow variability, B-Lagoon 2015
0.00
0.05
0.10
0.15
0.20
0.25
0.30
0.35
0.40
0.45
0.50
0.0
0.5
1.0
1.5
2.0
2.5
3.0
3.5
4.0
4.5
Dis
solv
ed A
lum
inum
Con
cent
ratio
n (m
g/L)
Dis
solv
ed F
luor
ide
and
Tota
l Sus
pend
ed S
olid
s Co
ncen
trat
ion
(mg/
L)
Dis. F (mg/L)
TSS(mg/L)
Dis. Al (mg/l)
Figure 4.2 Dissolved Fluoride, Dissolved Aluminium and Total Suspended Solids, B-lagoon 2015
Polycyclic Aromatic Hydrocarbons (PAHs) are a large family of chemical compounds (more than 4,000 have been identified) generated by the incomplete combustion of organic material.
Various operations at the smelter generate PAH in both particulate and gaseous forms. PAHs originate in discharges primarily from the VSS potroom roof dust captured in precipitation and surface runoff. Other sources include raw materials (green coke and pitch) handling.
PAHs are monitored using two methods: weekly
analysis of composite and monthly grab samples. PAHs are also analysed from grab samples taken during special events. B-Lagoon discharges are monitored and analysed for 15 of the most common PAH compounds, although there are no permit levels for PAHs in effluent (Figure 4.10).
11
2015 Environmental Report
0
1
2
3
4
5
6
7
8
9
10
Dis
solv
ed F
luor
ide
Con
cent
ratio
n (m
g/L)
Permit Limit 10 mg/L Dissolved Fluoride
Daily Composite Monitoring
Monthly and Daily Grab Sample
Figure 4.3 Dissolved fluoride, B-lagoon 2015
0.0
0.5
1.0
1.5
2.0
2.5
3.0
Dis
solv
ed A
lum
inum
Con
cent
ratio
n (m
g/L)
Permit Limit 3.0 mg/L Disssolved Aluminum
Daily Composite Monitoring
Monthly Grab Sample
Figure 4.4 Dissolved Aluminium, B-lagoon 2015
0
10
20
30
40
50
Tota
l Sus
pend
ed S
olid
s (m
g/L)
Permit Limit 50.0 mg/L Total Suspended Solids
Daily Composite Monitoring
Monthly Grab Sample
Figure 4.5 Total Suspended solids, B-lagoon 2015
12
2015 Environmental Report
Figure 4.7 Temperature B-lagoon 2015
0
5
10
15
20
25
30
Tem
pera
ture
( 0C
)
Permit Limit 300Celsius
0.000
0.002
0.004
0.006
0.008
0.010
0.012
0.014
Con
cent
ratio
n (m
g/L)
WAD Grab mg/l
SAD Grab mg/l
Permit Limit 0.5 mg/L Strong Acid Dissociable
Weak Acid Dissociable (monthly grab sample)
Strong Acid Dissociable (monthly grab sample)
Figure 4.6 Cyanide, B-lagoon 2015
0
200
400
600
800
1000
0
500
1,000
1,500
2,000
2,500
3,000
3,500
4,000
Har
dnes
s (C
aCO
3 eq
. mg/
L)
Con
duct
ivit
y (µ
S/cm
)
Conductivity
Hardness
Figure 4.8 Conductivity and hardness, B-lagoon 2015
13
2015 Environmental Report
5
6
7
8
9
10
pH
Permit Limit ph 6.0-8.5
Daily Composite Monitoring
0.000
0.001
0.002
0.003
0.004
0.005
0.006
Con
cent
ratio
n (µ
g/L)
PAH Monthly Grab
Figure 4.9 Acidity, B-lagoon 2015
Figure 4.10 Polycyclic Aromatic Hydrocarbons, B-lagoon 2015
14
2015 Environmental Report
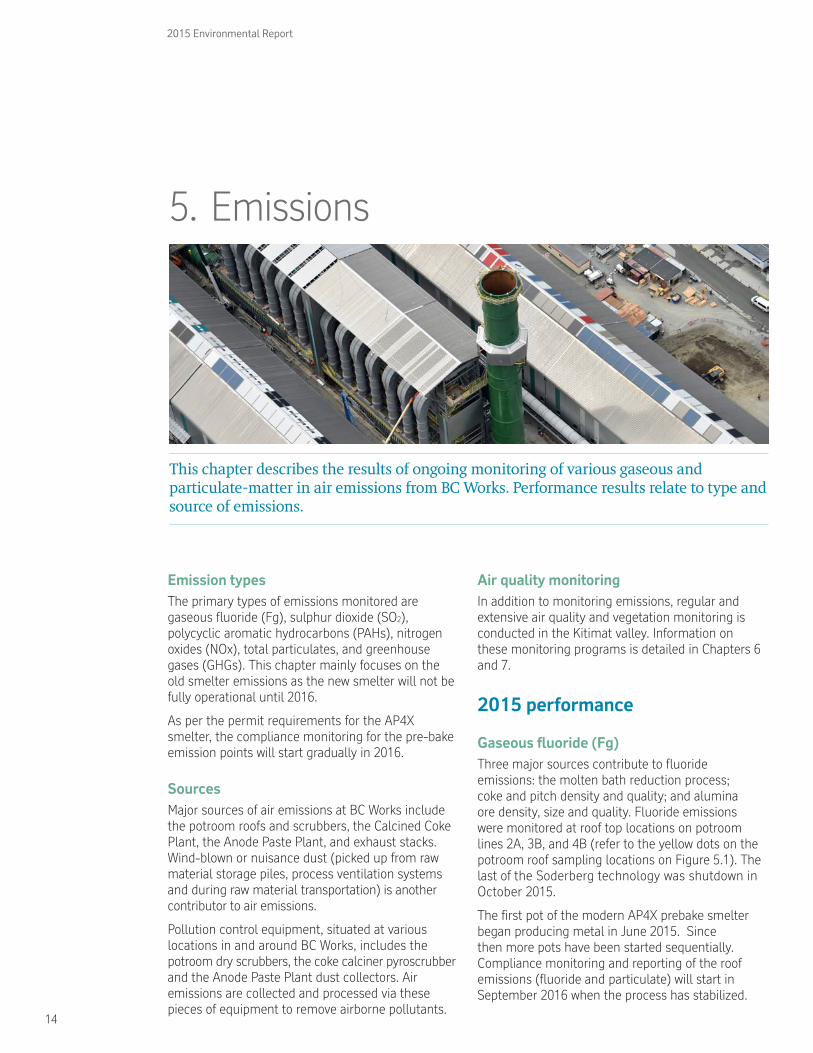
5. Emissions
This chapter describes the results of ongoing monitoring of various gaseous and particulate-matter in air emissions from BC Works. Performance results relate to type and source of emissions.
Emission types The primary types of emissions monitored are gaseous fluoride (Fg), sulphur dioxide (SO2), polycyclic aromatic hydrocarbons (PAHs), nitrogen oxides (NOx), total particulates, and greenhouse gases (GHGs). This chapter mainly focuses on the old smelter emissions as the new smelter will not be fully operational until 2016.
As per the permit requirements for the AP4X smelter, the compliance monitoring for the pre-bake emission points will start gradually in 2016.
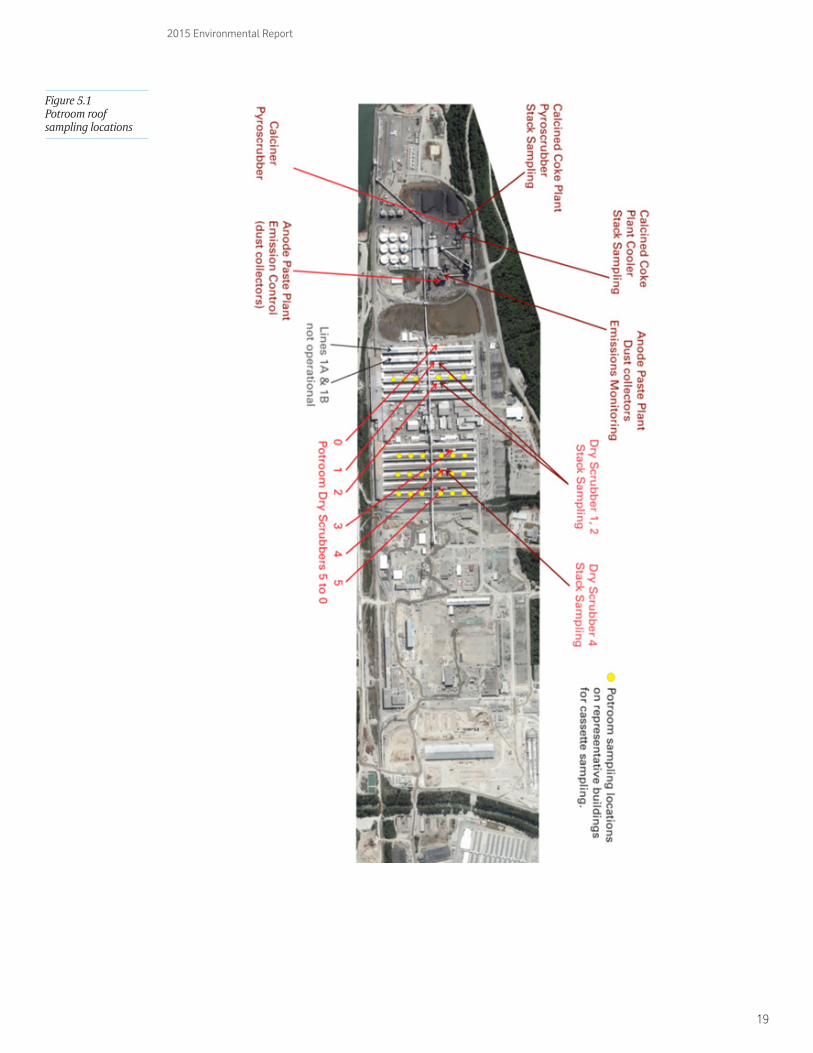
Sources Major sources of air emissions at BC Works include the potroom roofs and scrubbers, the Calcined Coke Plant, the Anode Paste Plant, and exhaust stacks. Wind-blown or nuisance dust (picked up from raw material storage piles, process ventilation systems and during raw material transportation) is another contributor to air emissions.
Pollution control equipment, situated at various locations in and around BC Works, includes the potroom dry scrubbers, the coke calciner pyroscrubber and the Anode Paste Plant dust collectors. Air emissions are collected and processed via these pieces of equipment to remove airborne pollutants.
Air quality monitoringIn addition to monitoring emissions, regular and extensive air quality and vegetation monitoring is conducted in the Kitimat valley. Information on these monitoring programs is detailed in Chapters 6 and 7.
2015 performance
Gaseous fluoride (Fg)Three major sources contribute to fluoride emissions: the molten bath reduction process; coke and pitch density and quality; and alumina ore density, size and quality. Fluoride emissions were monitored at roof top locations on potroom lines 2A, 3B, and 4B (refer to the yellow dots on the potroom roof sampling locations on Figure 5.1). The last of the Soderberg technology was shutdown in October 2015.
The first pot of the modern AP4X prebake smelter began producing metal in June 2015. Since then more pots have been started sequentially. Compliance monitoring and reporting of the roof emissions (fluoride and particulate) will start in September 2016 when the process has stabilized.
15
2015 Environmental Report
52%
The annual average fluoride emissions loading during 2015 was 11.6 tonnes gaseous fluoride per month compared to 24.3 tonnes gaseous fluoride per month in 2014, a 52 per cent reduction overall. This reduction was due to the progressive closure of the old smelter.
The molten bath dissolves the alumina ore by an electrolytic reduction process through which aluminium is produced. The bath is composed primarily of sodium fluoride and aluminium fluoride and is the main source of fluoride emissions at BC Works. In the Soderberg process more than 80 per cent of fluoride emissions were collected and recycled back into the process, but some escapes did occur due to process upsets. The modern AP4X technology has strong gas suction and hoods on the pots, so the collection of emissions and recycling of emissions back into the process is much improved. Gas collection efficiency for the new smelter is greater than 98 per cent.
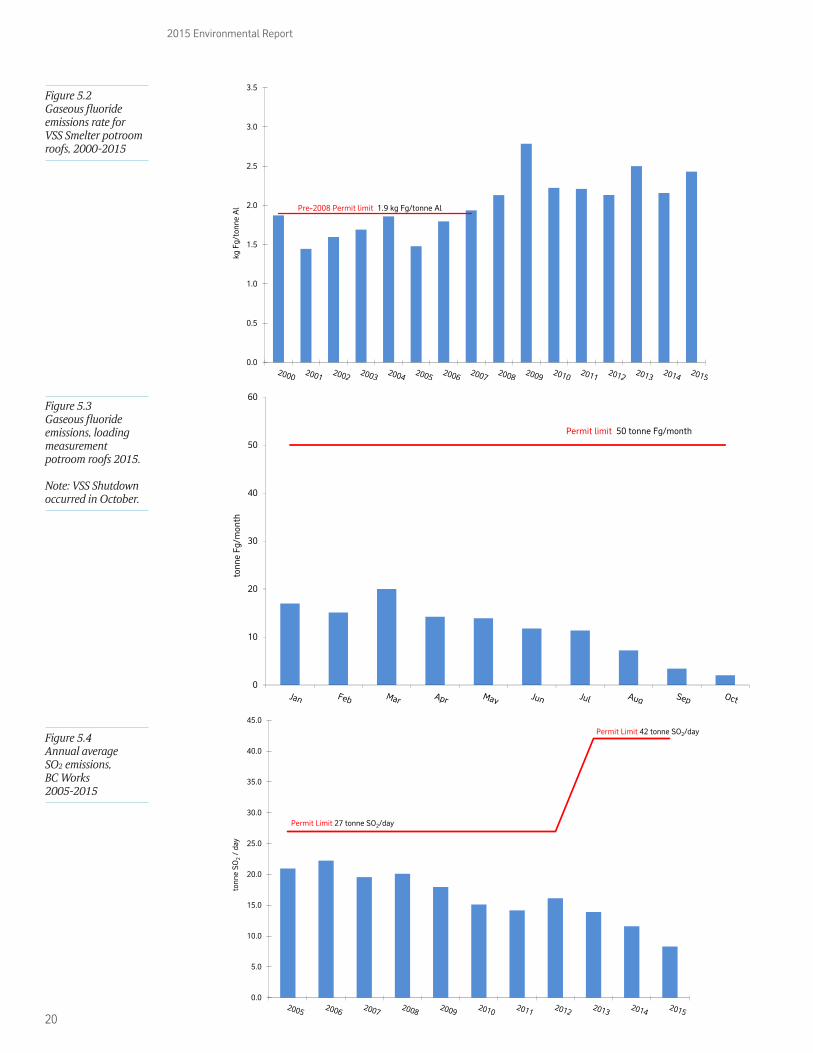
The gaseous fluoride emissions rate is tracked internally and showed an increase in 2015 compared to 2014 (Figure 5.2). This increase was due to the progressive closure of the old smelter and consequently, a lower aluminium production in 2015.
In preparation for the potlines idling, in 2008 the gaseous fluoride permit limit (including both potroom and dry scrubber emissions) was set by the Ministry at 50 tonnes of gaseous fluoride loading per month and replaced the rate measurement of gaseous fluoride per tonne of aluminium. The annual average fluoride emissions loading during 2015 was 11.6 tonnes gaseous fluoride per month compared to 24.3 tonnes gaseous fluoride per month in 2014.
This 52 per cent reduction in net fluoride emission loading is associated with the idling of Lines 2, 3 and 4. During 2015, there were no loading monthly exceedances of the gaseous fluoride emissions limit (Figure 5.3).
Gaseous fluoride is known to have negative impacts on the health of vegetation. The routine annual vegetation survey found the levels of fluoride in vegetation adjacent to the plant site were slightly higher than 2014 (refer to Chapter 7).
Sulphur dioxide (SO2)Sources of sulphur dioxide at BC Works include green coke and coal tar pitch. Both are raw materials used to manufacture anodes. Coke calcination is a process used to change green coke into a usable form. Sulphur dioxide emissions occur during calcination, baking of the anodes at the Anode Baking Furnace and the electrolytic reduction process through which aluminium is produced.
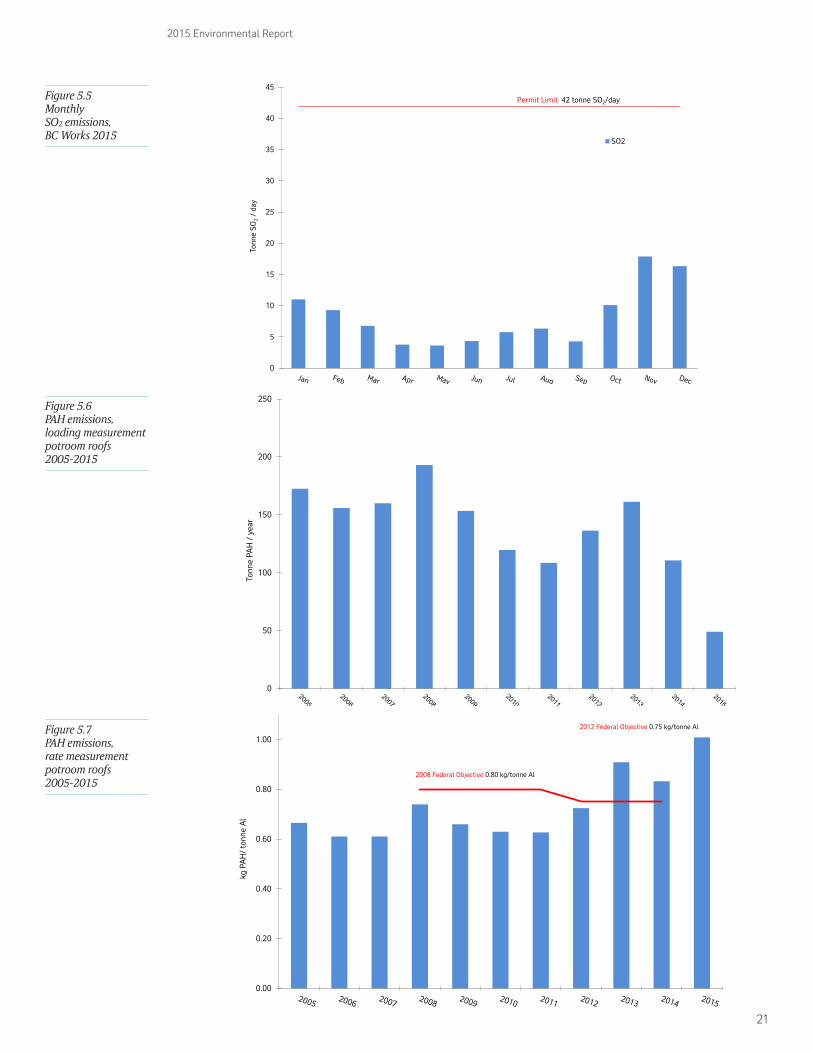
From 1993 to 1999, the permitted sulphur dioxide emission was set at 20.7 tonnes per day on an annual average. In 2000 the permitted sulphur dioxide emission was set at 27 tonne per day on annual average to reflect the quality challenges observed in the global coke market. In April 2013 the operation permit was updated to reflect the new SO2 emission permit limit (42.0 tonnes per day on annual average) in preparation to the modernised smelter production increase. The SO2 emissions decreased from 11.6 tonnes per day in 2014 to 8.3 tonnes per day in 2015 associated to a reduced metal production and calciner maintenance shutdowns. The emission levels remained well below the permit limit (Figure 5.4). Monthly average performance was also consistently below the permit limit (Figure 5.5).
Polycyclic aromatic hydrocarbons (PAHs)PAH are produced by both industrial processes and various forms of combustion such as wood-burning stoves and forest fires. They occur in emissions from the VSS Smelter primarily as a by-product of anode paste manufacturing, anode baking and anode consumption.
For the Soderberg technology the multi-media environmental permit requires the monitoring of air emissions from representative potroom buildings for 15 of the most common PAHs. PAHs content in the emissions from BC Works was lower in 2015 at 49.1 tonnes per year compared to 110.6 tonnes per year in 2014 (Figure 5.6). Since the anodes for the AP4X technology are baked before being placed in the pot the PAH emissions are greatly reduced. A measurement campaign will be done once the pots are stable to confirm the low levels of PAH emissions.
In April 2008, an agreement regarding PAH was signed between Rio Tinto and Environment Canada. The purpose of this agreement was to set environmental performance objectives with respect to atmospheric emissions of PAH from Rio Tinto’s Soderberg plants in BC (Kitimat) and Quebec (Shawinigan and Beauharnois). From 2008 to 2011, the environmental performance objective determined for BC Works was 0.8 kg per tonne of aluminium. The PAH performance agreement
16
2015 Environmental Report
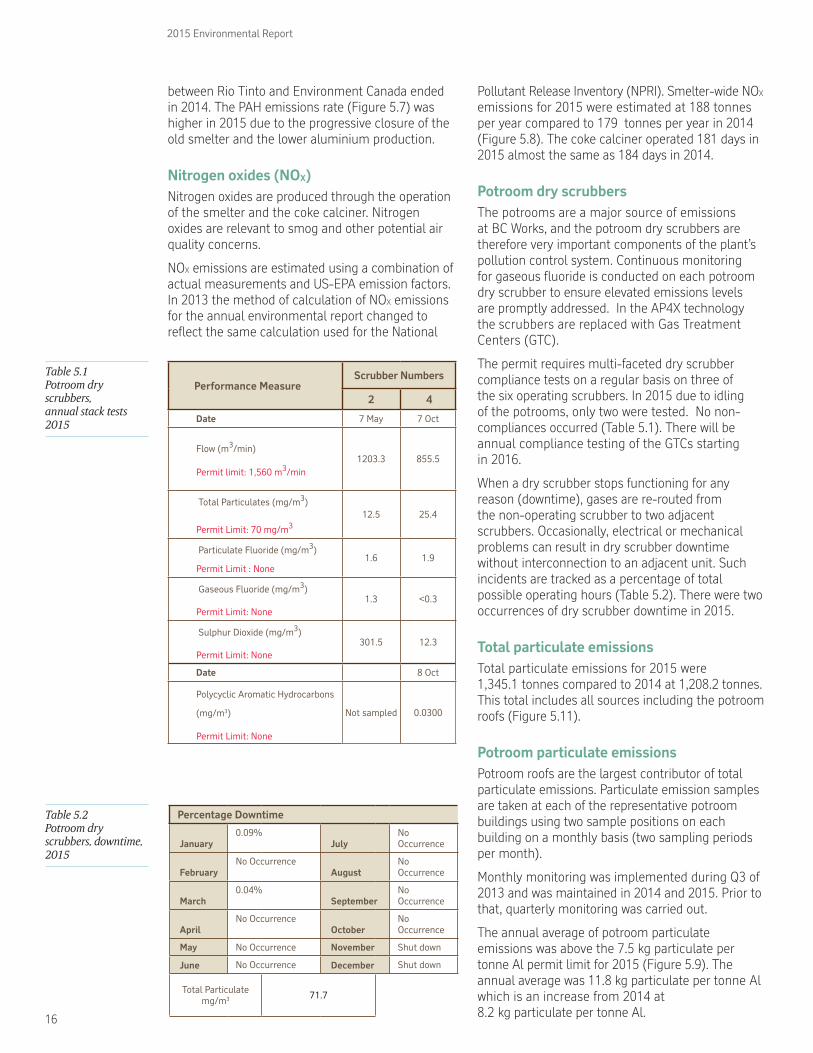
Table 5.1 Potroom dry scrubbers, annual stack tests 2015
Percentage Downtime
January0.09%
JulyNo Occurrence
FebruaryNo Occurrence
AugustNo Occurrence
March0.04%
SeptemberNo Occurrence
AprilNo Occurrence
OctoberNo Occurrence
May No Occurrence November Shut down
June No Occurrence December Shut down
Total Particulate mg/m3 71.7
Table 5.2 Potroom dry scrubbers, downtime, 2015
Performance MeasureScrubber Numbers
2 4
Date 7 May 7 Oct
Flow (m3/min)
Permit limit: 1,560 m3/min1203.3 855.5
Total Particulates (mg/m3)
Permit Limit: 70 mg/m312.5 25.4
Particulate Fluoride (mg/m3)
Permit Limit : None1.6 1.9
Gaseous Fluoride (mg/m3)
Permit Limit: None1.3 <0.3
Sulphur Dioxide (mg/m3)
Permit Limit: None301.5 12.3
Date 8 Oct
Polycyclic Aromatic Hydrocarbons
(mg/m3)
Permit Limit: None
Not sampled 0.0300
between Rio Tinto and Environment Canada ended in 2014. The PAH emissions rate (Figure 5.7) was higher in 2015 due to the progressive closure of the old smelter and the lower aluminium production.
Nitrogen oxides (NOX)Nitrogen oxides are produced through the operation of the smelter and the coke calciner. Nitrogen oxides are relevant to smog and other potential air quality concerns.
NOX emissions are estimated using a combination of actual measurements and US-EPA emission factors. In 2013 the method of calculation of NOX emissions for the annual environmental report changed to reflect the same calculation used for the National
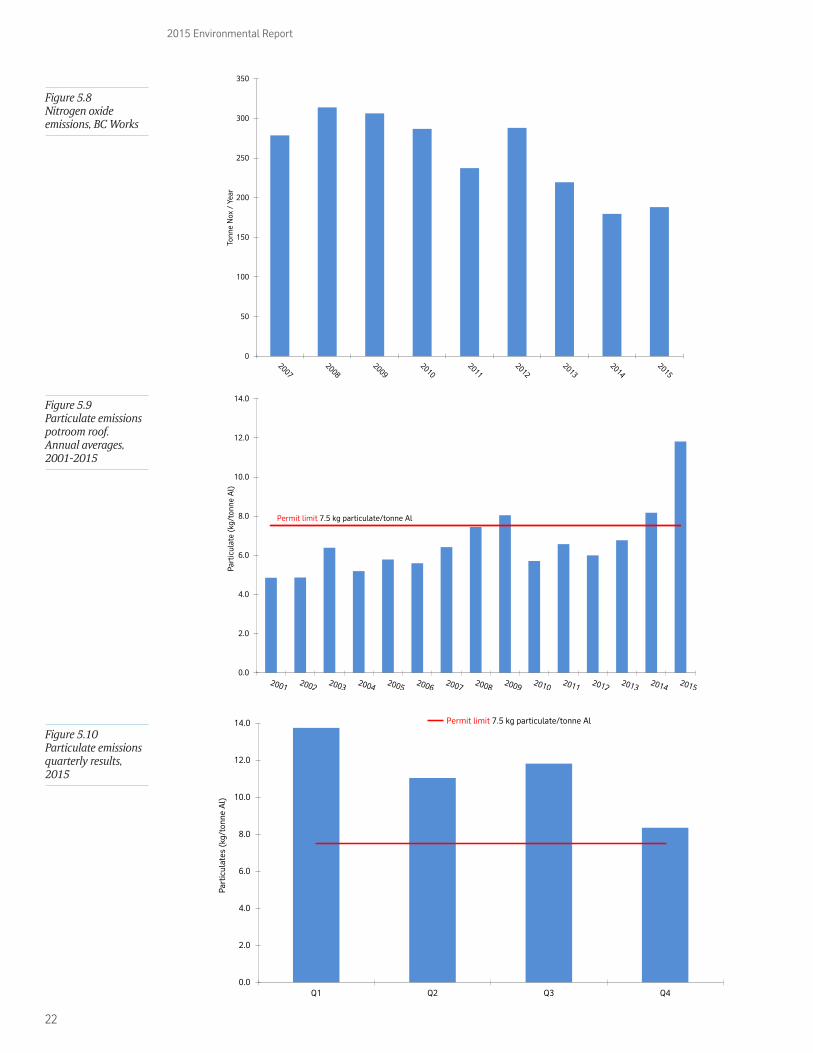
Pollutant Release Inventory (NPRI). Smelter-wide NOX emissions for 2015 were estimated at 188 tonnes per year compared to 179 tonnes per year in 2014 (Figure 5.8). The coke calciner operated 181 days in 2015 almost the same as 184 days in 2014.
Potroom dry scrubbersThe potrooms are a major source of emissions at BC Works, and the potroom dry scrubbers are therefore very important components of the plant’s pollution control system. Continuous monitoring for gaseous fluoride is conducted on each potroom dry scrubber to ensure elevated emissions levels are promptly addressed. In the AP4X technology the scrubbers are replaced with Gas Treatment Centers (GTC).
The permit requires multi-faceted dry scrubber compliance tests on a regular basis on three of the six operating scrubbers. In 2015 due to idling of the potrooms, only two were tested. No non-compliances occurred (Table 5.1). There will be annual compliance testing of the GTCs starting in 2016.
When a dry scrubber stops functioning for any reason (downtime), gases are re-routed from the non-operating scrubber to two adjacent scrubbers. Occasionally, electrical or mechanical problems can result in dry scrubber downtime without interconnection to an adjacent unit. Such incidents are tracked as a percentage of total possible operating hours (Table 5.2). There were two occurrences of dry scrubber downtime in 2015.
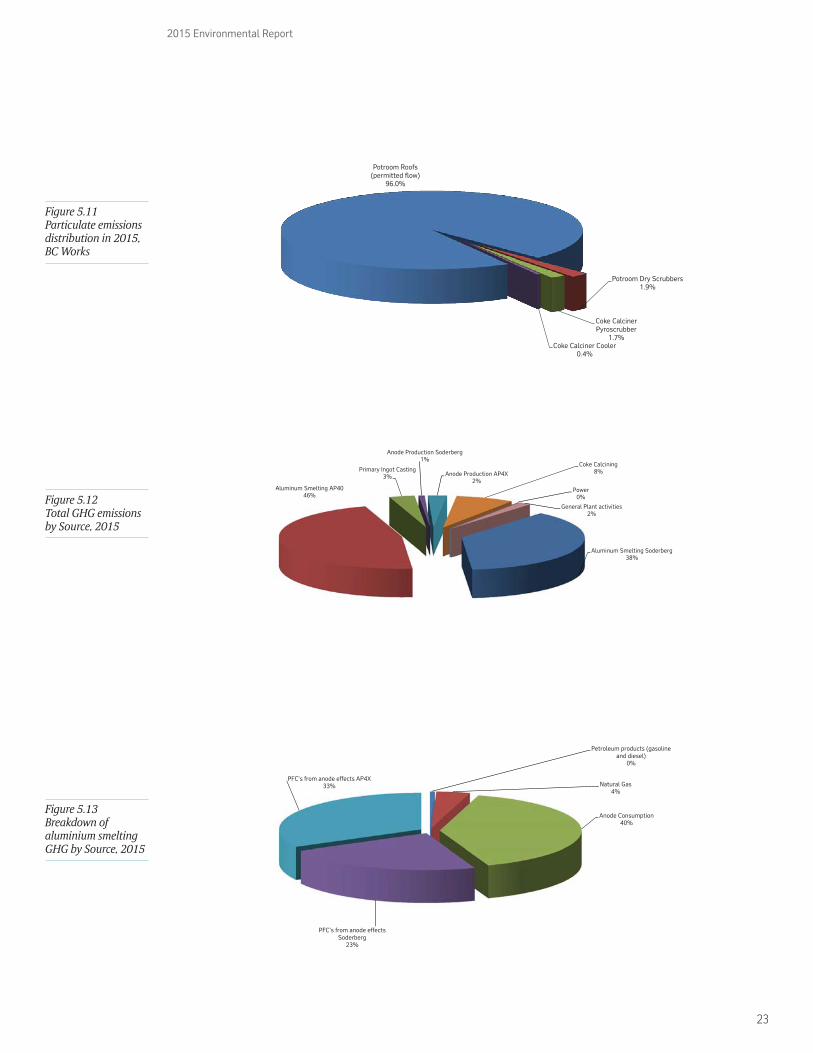
Total particulate emissionsTotal particulate emissions for 2015 were 1,345.1 tonnes compared to 2014 at 1,208.2 tonnes. This total includes all sources including the potroom roofs (Figure 5.11).
Potroom particulate emissionsPotroom roofs are the largest contributor of total particulate emissions. Particulate emission samples are taken at each of the representative potroom buildings using two sample positions on each building on a monthly basis (two sampling periods per month).
Monthly monitoring was implemented during Q3 of 2013 and was maintained in 2014 and 2015. Prior to that, quarterly monitoring was carried out.
The annual average of potroom particulate emissions was above the 7.5 kg particulate per tonne Al permit limit for 2015 (Figure 5.9). The annual average was 11.8 kg particulate per tonne Al which is an increase from 2014 at 8.2 kg particulate per tonne Al.
17
2015 Environmental Report
Table 5.3 Calcined Coke Plant, annual stack test, 2015
Table 5.4 Anode Paste Plant, annual stack test, 2015
The increase in measured particulates in 2015 was due to the progressive closure of the old smelter. The idling of the potlines in preparation for the decommissioning of the VSS technology affected the air flow rates in the potrooms which are dependent on the heat generated by the pots. This change in airflow conditions led to an over sampling error (Figure 5.10).
Particulate emissions from the potroom roofs accounted for 95.9 per cent of total particulate emissions for BC Works in 2015 (Figure 5.11). One non-compliance was reported associated with the permitted particulate rate; details are described in Chapter 11.
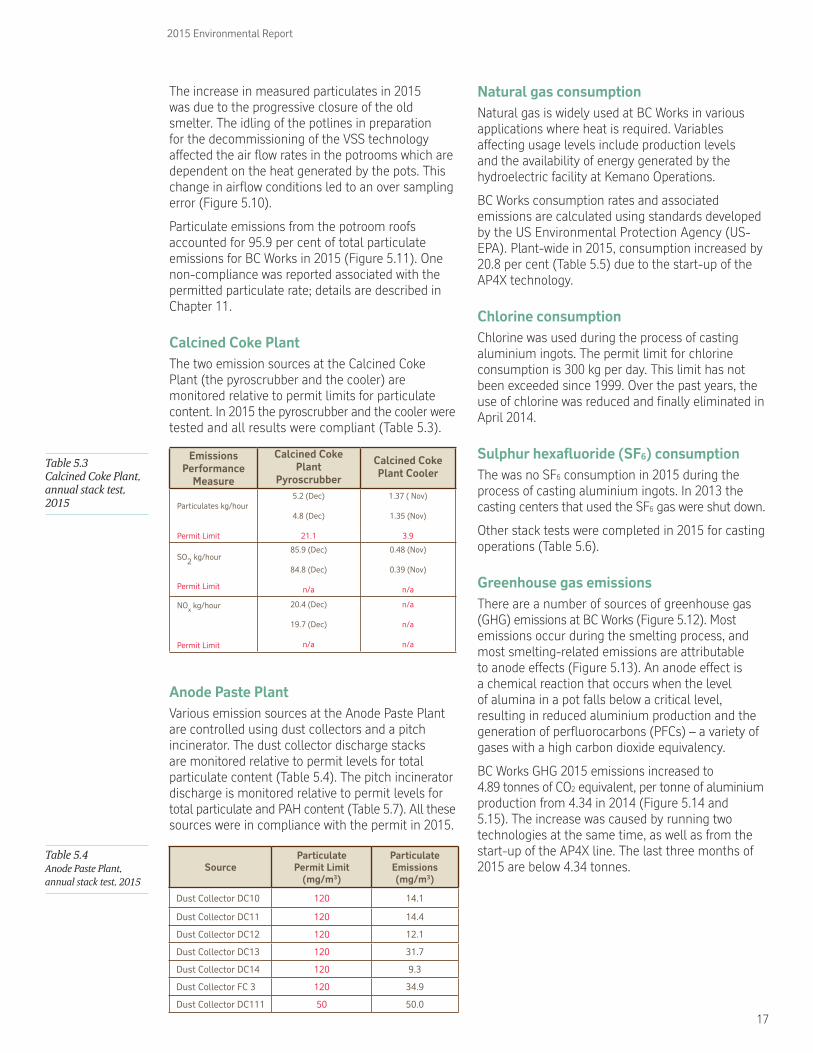
Calcined Coke PlantThe two emission sources at the Calcined Coke Plant (the pyroscrubber and the cooler) are monitored relative to permit limits for particulate content. In 2015 the pyroscrubber and the cooler were tested and all results were compliant (Table 5.3).
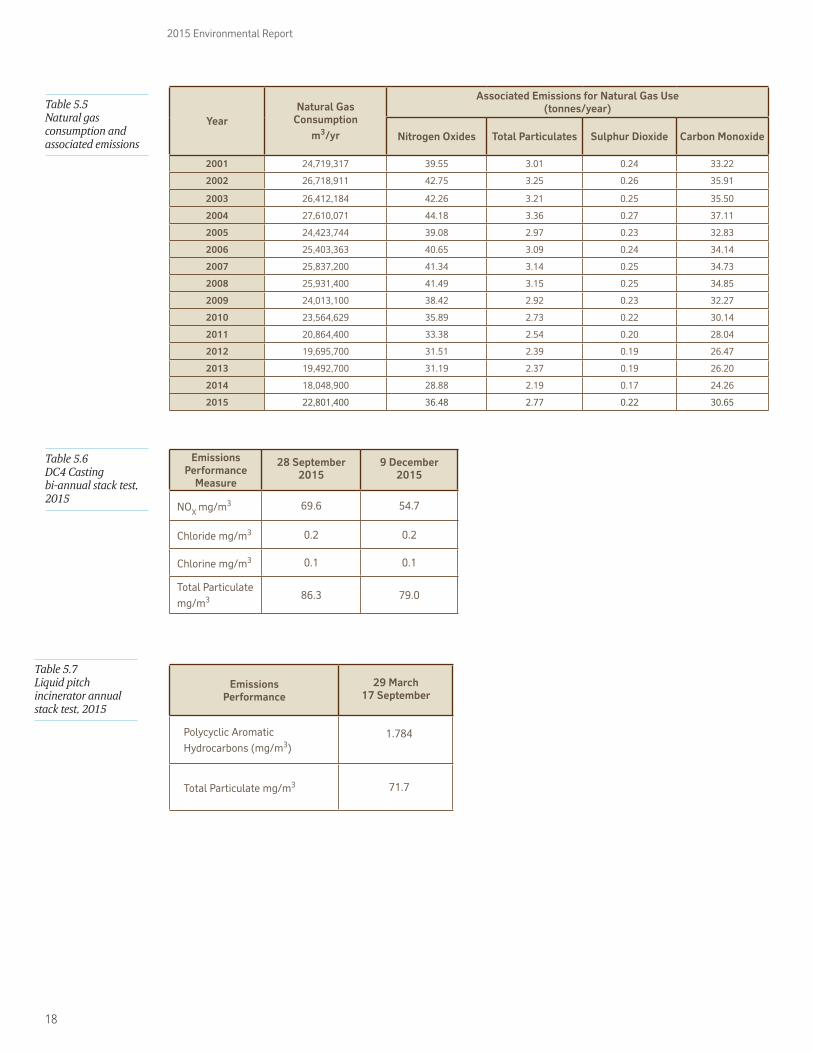
Anode Paste Plant Various emission sources at the Anode Paste Plant are controlled using dust collectors and a pitch incinerator. The dust collector discharge stacks are monitored relative to permit levels for total particulate content (Table 5.4). The pitch incinerator discharge is monitored relative to permit levels for total particulate and PAH content (Table 5.7). All these sources were in compliance with the permit in 2015.
Natural gas consumptionNatural gas is widely used at BC Works in various applications where heat is required. Variables affecting usage levels include production levels and the availability of energy generated by the hydroelectric facility at Kemano Operations.
BC Works consumption rates and associated emissions are calculated using standards developed by the US Environmental Protection Agency (US-EPA). Plant-wide in 2015, consumption increased by 20.8 per cent (Table 5.5) due to the start-up of the AP4X technology.
Chlorine consumptionChlorine was used during the process of casting aluminium ingots. The permit limit for chlorine consumption is 300 kg per day. This limit has not been exceeded since 1999. Over the past years, the use of chlorine was reduced and finally eliminated in April 2014.
Sulphur hexafluoride (SF6) consumptionThe was no SF6 consumption in 2015 during the process of casting aluminium ingots. In 2013 the casting centers that used the SF6 gas were shut down.
Other stack tests were completed in 2015 for casting operations (Table 5.6).
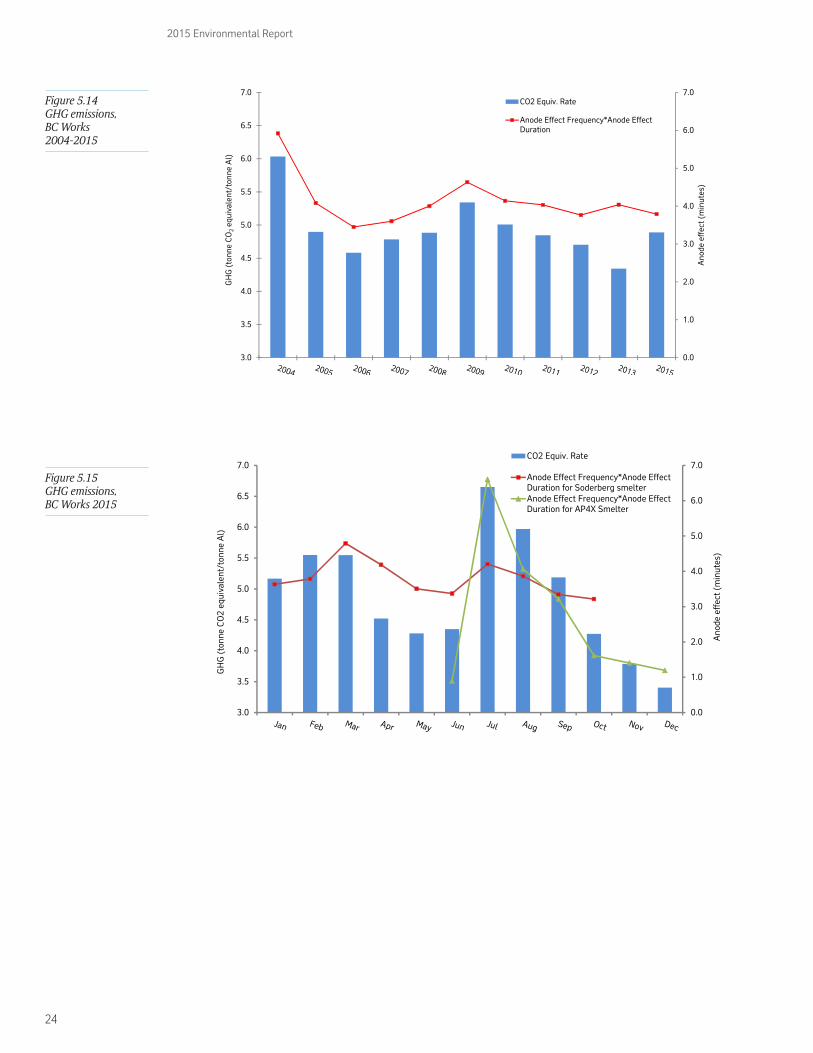
Greenhouse gas emissions There are a number of sources of greenhouse gas (GHG) emissions at BC Works (Figure 5.12). Most emissions occur during the smelting process, and most smelting-related emissions are attributable to anode effects (Figure 5.13). An anode effect is a chemical reaction that occurs when the level of alumina in a pot falls below a critical level, resulting in reduced aluminium production and the generation of perfluorocarbons (PFCs) – a variety of gases with a high carbon dioxide equivalency.
BC Works GHG 2015 emissions increased to 4.89 tonnes of CO2 equivalent, per tonne of aluminium production from 4.34 in 2014 (Figure 5.14 and 5.15). The increase was caused by running two technologies at the same time, as well as from the start-up of the AP4X line. The last three months of 2015 are below 4.34 tonnes.Source
Particulate Permit Limit
(mg/m3)
Particulate Emissions(mg/m3)
Dust Collector DC10 120 14.1
Dust Collector DC11 120 14.4
Dust Collector DC12 120 12.1
Dust Collector DC13 120 31.7
Dust Collector DC14 120 9.3
Dust Collector FC 3 120 34.9
Dust Collector DC111 50 50.0
EmissionsPerformance
Measure
Calcined Coke Plant
Pyroscrubber
Calcined Coke Plant Cooler
Particulates kg/hour
Permit Limit
5.2 (Dec)
4.8 (Dec)
21.1
1.37 ( Nov)
1.35 (Nov)
3.9
SO2 kg/hour
Permit Limit
85.9 (Dec)
84.8 (Dec)
n/a
0.48 (Nov)
0.39 (Nov)
n/a
NOx kg/hour
Permit Limit
20.4 (Dec)
19.7 (Dec)
n/a
n/a
n/a
n/a
18
2015 Environmental Report
Table 5.5 Natural gas consumption and associated emissions
YearNatural Gas
Consumption m3/yr
Associated Emissions for Natural Gas Use(tonnes/year)
Nitrogen Oxides Total Particulates Sulphur Dioxide Carbon Monoxide
2001 24,719,317 39.55 3.01 0.24 33.22
2002 26,718,911 42.75 3.25 0.26 35.91
2003 26,412,184 42.26 3.21 0.25 35.50
2004 27,610,071 44.18 3.36 0.27 37.11
2005 24,423,744 39.08 2.97 0.23 32.83
2006 25,403,363 40.65 3.09 0.24 34.14
2007 25,837,200 41.34 3.14 0.25 34.73
2008 25,931,400 41.49 3.15 0.25 34.85
2009 24,013,100 38.42 2.92 0.23 32.27
2010 23,564,629 35.89 2.73 0.22 30.14
2011 20,864,400 33.38 2.54 0.20 28.04
2012 19,695,700 31.51 2.39 0.19 26.47
2013 19,492,700 31.19 2.37 0.19 26.20
2014 18,048,900 28.88 2.19 0.17 24.26
2015 22,801,400 36.48 2.77 0.22 30.65
Emissions Performance
Measure
28 September 2015
9 December 2015
NOX mg/m3 69.6 54.7
Chloride mg/m3 0.2 0.2
Chlorine mg/m3 0.1 0.1
Total Particulatemg/m3 86.3 79.0
Emissions Performance
29 March17 September
Polycyclic Aromatic Hydrocarbons (mg/m3)
1.784
Total Particulate mg/m3 71.7
Table 5.6 DC4 Casting bi-annual stack test, 2015
Table 5.7 Liquid pitch incinerator annual stack test, 2015
19
2015 Environmental Report
Figure 5.1 Potroom roof sampling locations
20
2015 Environmental Report
0
10
20
30
40
50
60
tonn
e Fg
/mon
th
Permit limit 50 tonne Fg/month
0.0
5.0
10.0
15.0
20.0
25.0
30.0
35.0
40.0
45.0
tonn
e SO
2 /
day
Permit Limit 27 tonne SO2/day
Permit Limit 42 tonne SO2/day
Figure 5.3 Gaseous fluoride emissions, loading measurement potroom roofs 2015. Note: VSS Shutdown occurred in October.
Figure 5.4 Annual average SO2 emissions, BC Works 2005-2015
0.0
0.5
1.0
1.5
2.0
2.5
3.0
3.5
kg F
g/to
nne
Al Pre-2008 Permit limit 1.9 kg Fg/tonne Al
Figure 5.2 Gaseous fluoride emissions rate for VSS Smelter potroom roofs, 2000-2015
21
2015 Environmental Report
0
5
10
15
20
25
30
35
40
45
Tonn
e SO
2 /
day
SO2
Permit Limit 42 tonne SO2/day
Figure 5.5 Monthly SO2 emissions, BC Works 2015
0
50
100
150
200
250
Tonn
e PA
H /
yea
r
0.00
0.20
0.40
0.60
0.80
1.00
kg P
AH
/ to
nne
Al
2008 Federal Objective 0.80 kg/tonne Al
2012 Federal Objective 0.75 kg/tonne Al
Figure 5.6 PAH emissions, loading measurement potroom roofs 2005-2015
Figure 5.7 PAH emissions, rate measurement potroom roofs 2005-2015
22
2015 Environmental Report
0.0
2.0
4.0
6.0
8.0
10.0
12.0
14.0
Q1 Q2 Q3 Q4
Part
icul
ates
(kg
/ton
ne A
l)
Permit limit 7.5 kg particulate/tonne Al
Figure 5.10 Particulate emissions quarterly results, 2015
0
50
100
150
200
250
300
350
Tonn
e N
ox /
Yea
r
Figure 5.8 Nitrogen oxide emissions, BC Works
0.0
2.0
4.0
6.0
8.0
10.0
12.0
14.0
Part
icul
ate
(kg/
tonn
e A
l)
Permit limit 7.5 kg particulate/tonne Al
Figure 5.9 Particulate emissions potroom roof. Annual averages, 2001-2015
23
2015 Environmental Report
Aluminum Smelting Soderberg38%
Aluminum Smelting AP4046%
Primary Ingot Casting3%
Anode Production Soderberg1%
Anode Production AP4X2%
Coke Calcining8%
Power0%
General Plant activities2%
Potroom Roofs (permitted �ow)
96.0%
Potroom Dry Scrubbers 1.9%
Coke Calciner Pyroscrubber
1.7% Coke Calciner Cooler
0.4%
Figure 5.11 Particulate emissions distribution in 2015, BC Works
Petroleum products (gasoline and diesel)
0%
Natural Gas4%
Anode Consumption40%
PFC's from anode effects Soderberg
23%
PFC's from anode effects AP4X33%
Figure 5.13 Breakdown of aluminium smelting GHG by Source, 2015
Figure 5.12 Total GHG emissions by Source, 2015
24
2015 Environmental Report
0.0
1.0
2.0
3.0
4.0
5.0
6.0
7.0
3.0
3.5
4.0
4.5
5.0
5.5
6.0
6.5
7.0
Ano
de e
ffec
t (m
inut
es)
GH
G (
tonn
e C
O2
equi
vale
nt/t
onne
Al)
CO2 Equiv. Rate
Anode Effect Frequency*Anode EffectDuration for Soderberg smelterAnode Effect Frequency*Anode EffectDuration for AP4X Smelter
Figure 5.15 GHG emissions, BC Works 2015
0.0
1.0
2.0
3.0
4.0
5.0
6.0
7.0
3.0
3.5
4.0
4.5
5.0
5.5
6.0
6.5
7.0
Ano
de e
ffec
t (m
inut
es)
GH
G (
tonn
e C
O2
equi
vale
nt/t
onne
Al)
CO2 Equiv. Rate
Anode Effect Frequency*Anode EffectDuration
Figure 5.14 GHG emissions, BC Works 2004-2015
25
2015 Environmental Report
6. Air quality monitoring
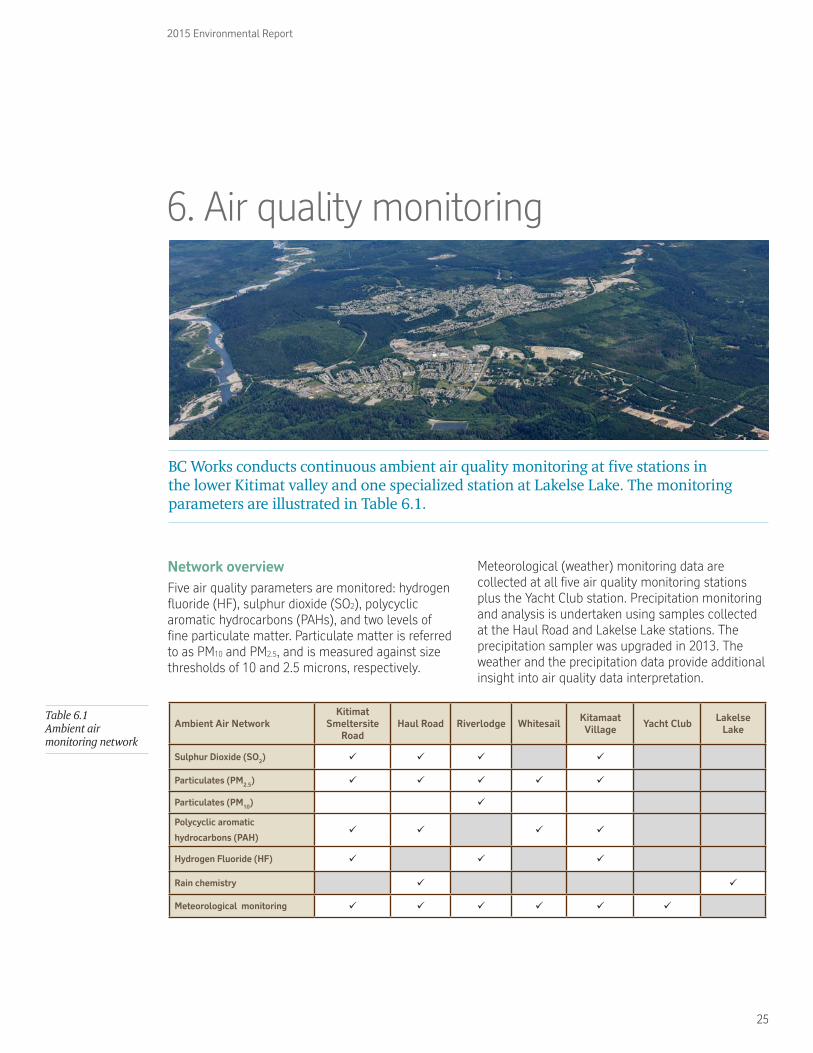
Ambient Air NetworkKitimat
Smeltersite Road
Haul Road Riverlodge Whitesail Kitamaat Village Yacht Club Lakelse
Lake
Sulphur Dioxide (SO2)
Particulates (PM2.5)
Particulates (PM10)
Polycyclic aromatic
hydrocarbons (PAH)
Hydrogen Fluoride (HF)
Rain chemistry
Meteorological monitoring
Table 6.1 Ambient air monitoring network
BC Works conducts continuous ambient air quality monitoring at five stations in the lower Kitimat valley and one specialized station at Lakelse Lake. The monitoring parameters are illustrated in Table 6.1.
Network overviewFive air quality parameters are monitored: hydrogen fluoride (HF), sulphur dioxide (SO2), polycyclic aromatic hydrocarbons (PAHs), and two levels of fine particulate matter. Particulate matter is referred to as PM10 and PM2.5, and is measured against size thresholds of 10 and 2.5 microns, respectively.
Meteorological (weather) monitoring data are collected at all five air quality monitoring stations plus the Yacht Club station. Precipitation monitoring and analysis is undertaken using samples collected at the Haul Road and Lakelse Lake stations. The precipitation sampler was upgraded in 2013. The weather and the precipitation data provide additional insight into air quality data interpretation.
26
2015 Environmental Report
Station
2015 Annual Average of 24-hour
Concentrations (ppb)
2014 Annual Average of 24-hour
Concentrations (ppb)
Riverlodge 0.4 0.3
Haul Road 1.9 1.9
Kitamaat Village 0.4 0.3
Kitimat Smeltersite Road* 3.0 3.3
Whitesail station 0.4 NA
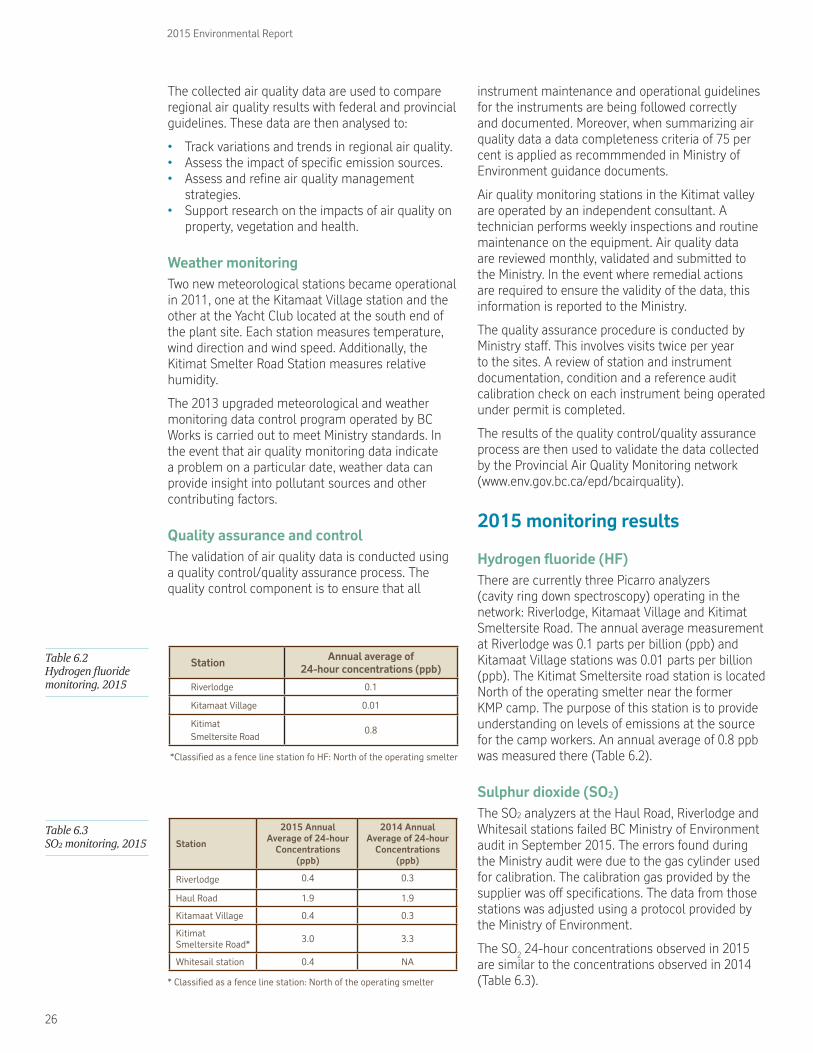
Table 6.2 Hydrogen fluoride monitoring, 2015
Table 6.3 SO2 monitoring, 2015
* Classified as a fence line station: North of the operating smelter
The collected air quality data are used to compare regional air quality results with federal and provincial guidelines. These data are then analysed to:
• Track variations and trends in regional air quality.• Assess the impact of specific emission sources.• Assess and refine air quality management
strategies.• Support research on the impacts of air quality on
property, vegetation and health.
Weather monitoringTwo new meteorological stations became operational in 2011, one at the Kitamaat Village station and the other at the Yacht Club located at the south end of the plant site. Each station measures temperature, wind direction and wind speed. Additionally, the Kitimat Smelter Road Station measures relative humidity.
The 2013 upgraded meteorological and weather monitoring data control program operated by BC Works is carried out to meet Ministry standards. In the event that air quality monitoring data indicate a problem on a particular date, weather data can provide insight into pollutant sources and other contributing factors.
Quality assurance and controlThe validation of air quality data is conducted using a quality control/quality assurance process. The quality control component is to ensure that all
instrument maintenance and operational guidelines for the instruments are being followed correctly and documented. Moreover, when summarizing air quality data a data completeness criteria of 75 per cent is applied as recommmended in Ministry of Environment guidance documents.
Air quality monitoring stations in the Kitimat valley are operated by an independent consultant. A technician performs weekly inspections and routine maintenance on the equipment. Air quality data are reviewed monthly, validated and submitted to the Ministry. In the event where remedial actions are required to ensure the validity of the data, this information is reported to the Ministry.
The quality assurance procedure is conducted by Ministry staff. This involves visits twice per year to the sites. A review of station and instrument documentation, condition and a reference audit calibration check on each instrument being operated under permit is completed.
The results of the quality control/quality assurance process are then used to validate the data collected by the Provincial Air Quality Monitoring network (www.env.gov.bc.ca/epd/bcairquality).
2015 monitoring results
Hydrogen fluoride (HF)There are currently three Picarro analyzers (cavity ring down spectroscopy) operating in the network: Riverlodge, Kitamaat Village and Kitimat Smeltersite Road. The annual average measurement at Riverlodge was 0.1 parts per billion (ppb) and Kitamaat Village stations was 0.01 parts per billion (ppb). The Kitimat Smeltersite road station is located North of the operating smelter near the former KMP camp. The purpose of this station is to provide understanding on levels of emissions at the source for the camp workers. An annual average of 0.8 ppb was measured there (Table 6.2).
Sulphur dioxide (SO2)The SO2 analyzers at the Haul Road, Riverlodge and Whitesail stations failed BC Ministry of Environment audit in September 2015. The errors found during the Ministry audit were due to the gas cylinder used for calibration. The calibration gas provided by the supplier was off specifications. The data from those stations was adjusted using a protocol provided by the Ministry of Environment.
The SO2 24-hour concentrations observed in 2015 are similar to the concentrations observed in 2014 (Table 6.3).
Station Annual average of 24-hour concentrations (ppb)
Riverlodge 0.1
Kitamaat Village 0.01
KitimatSmeltersite Road
0.8
*Classified as a fence line station fo HF: North of the operating smelter
27
2015 Environmental Report
Station
PM10 PM2.5
Annual average (of 24-hour concentration)
µg/m3
Days above reference level
50µg/m3
Annual average (of 24-hour concentrations)
µg/m3
Days above Reference Level
25µg/m3
Whitesail - - 5.0 0
Riverlodge 10.1 0 5.0 2
Haul Road - - 5 0
Kitamaat Village - - 6.5 0
Kitimat Smeltersite Rd* - - 6.2 2
Table 6.4 PM
10 and PM
2.5
Monitoring, 2015
* Classified as a fence line station: North of the operating smelter
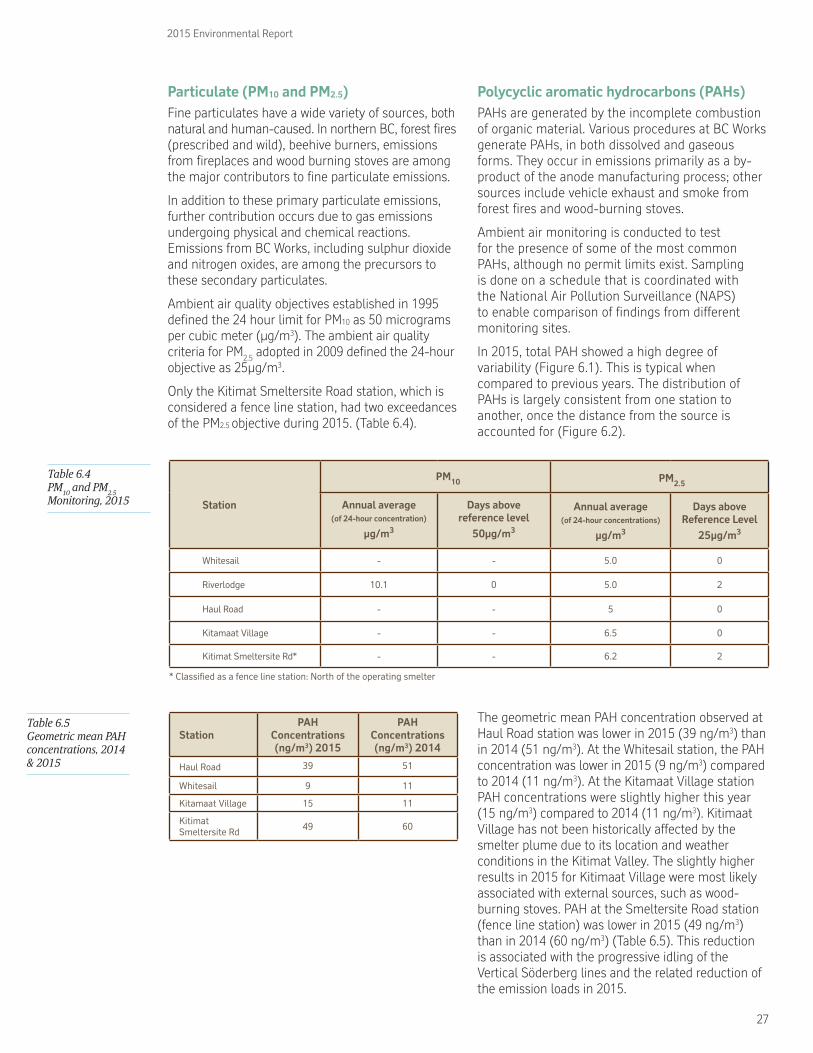
Particulate (PM10 and PM2.5)Fine particulates have a wide variety of sources, both natural and human-caused. In northern BC, forest fires (prescribed and wild), beehive burners, emissions from fireplaces and wood burning stoves are among the major contributors to fine particulate emissions.
In addition to these primary particulate emissions, further contribution occurs due to gas emissions undergoing physical and chemical reactions. Emissions from BC Works, including sulphur dioxide and nitrogen oxides, are among the precursors to these secondary particulates.
Ambient air quality objectives established in 1995 defined the 24 hour limit for PM10 as 50 micrograms per cubic meter (µg/m3). The ambient air quality criteria for PM2.5 adopted in 2009 defined the 24-hour objective as 25µg/m3.
Only the Kitimat Smeltersite Road station, which is considered a fence line station, had two exceedances of the PM2.5 objective during 2015. (Table 6.4).
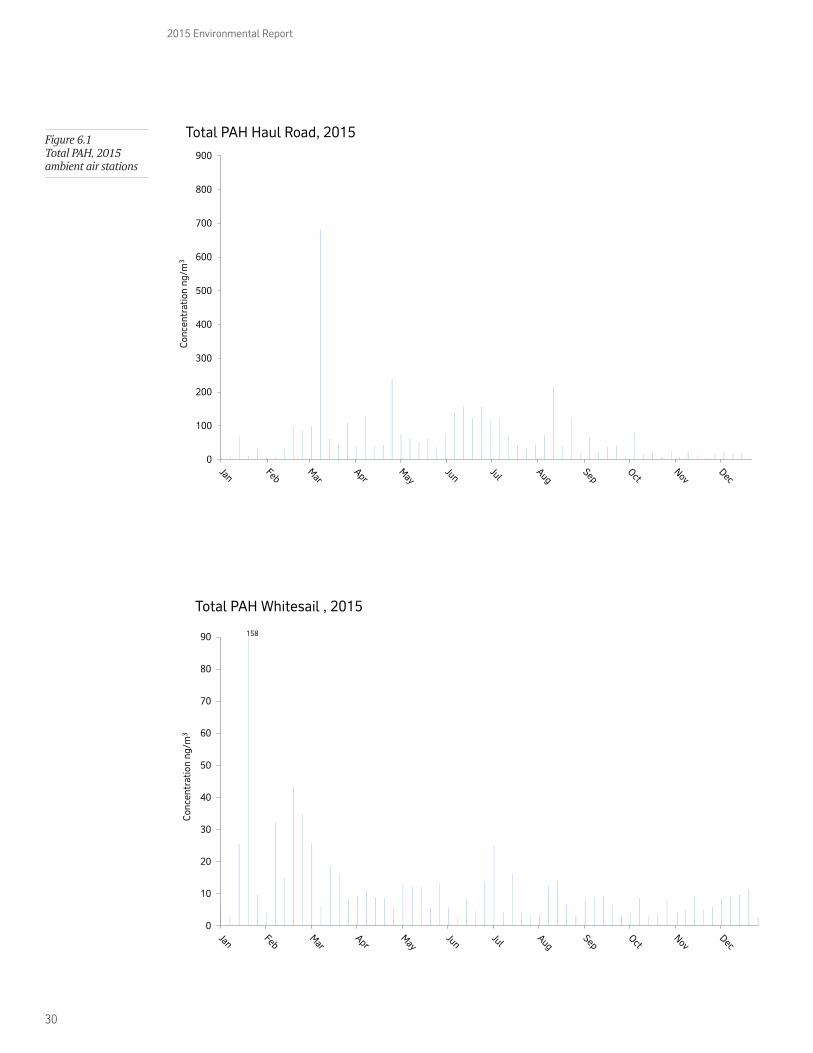
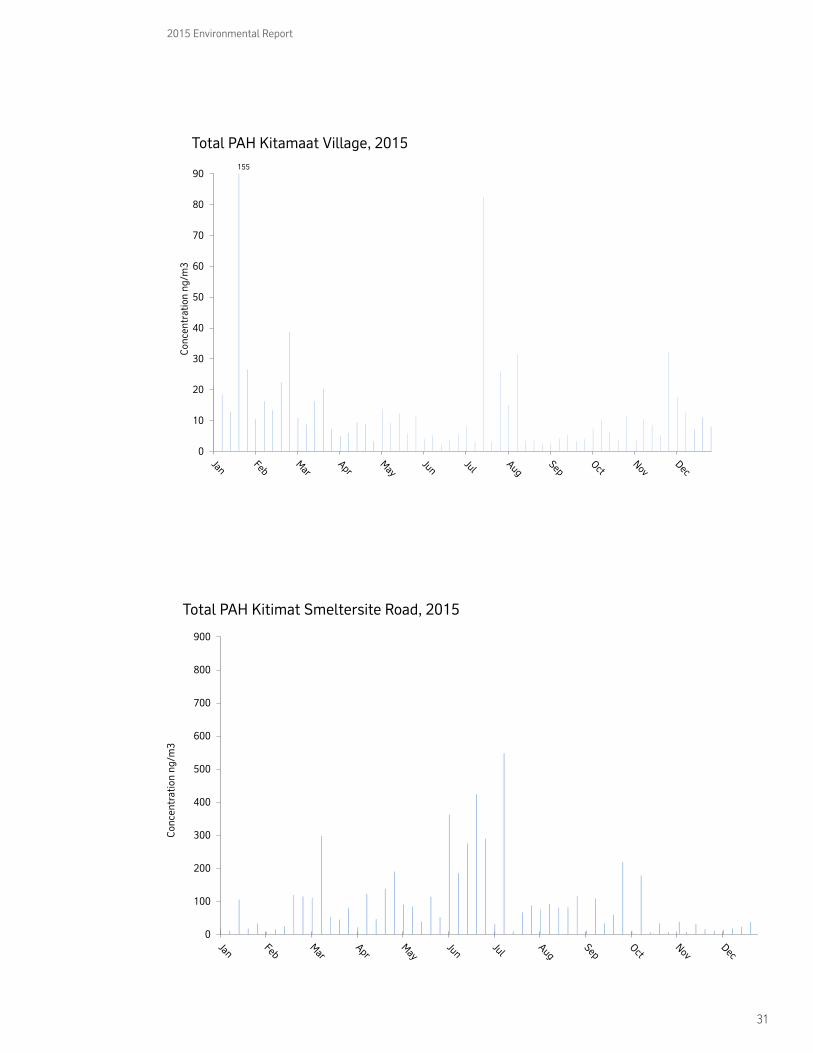
Polycyclic aromatic hydrocarbons (PAHs) PAHs are generated by the incomplete combustion of organic material. Various procedures at BC Works generate PAHs, in both dissolved and gaseous forms. They occur in emissions primarily as a by-product of the anode manufacturing process; other sources include vehicle exhaust and smoke from forest fires and wood-burning stoves.
Ambient air monitoring is conducted to test for the presence of some of the most common PAHs, although no permit limits exist. Sampling is done on a schedule that is coordinated with the National Air Pollution Surveillance (NAPS) to enable comparison of findings from different monitoring sites.
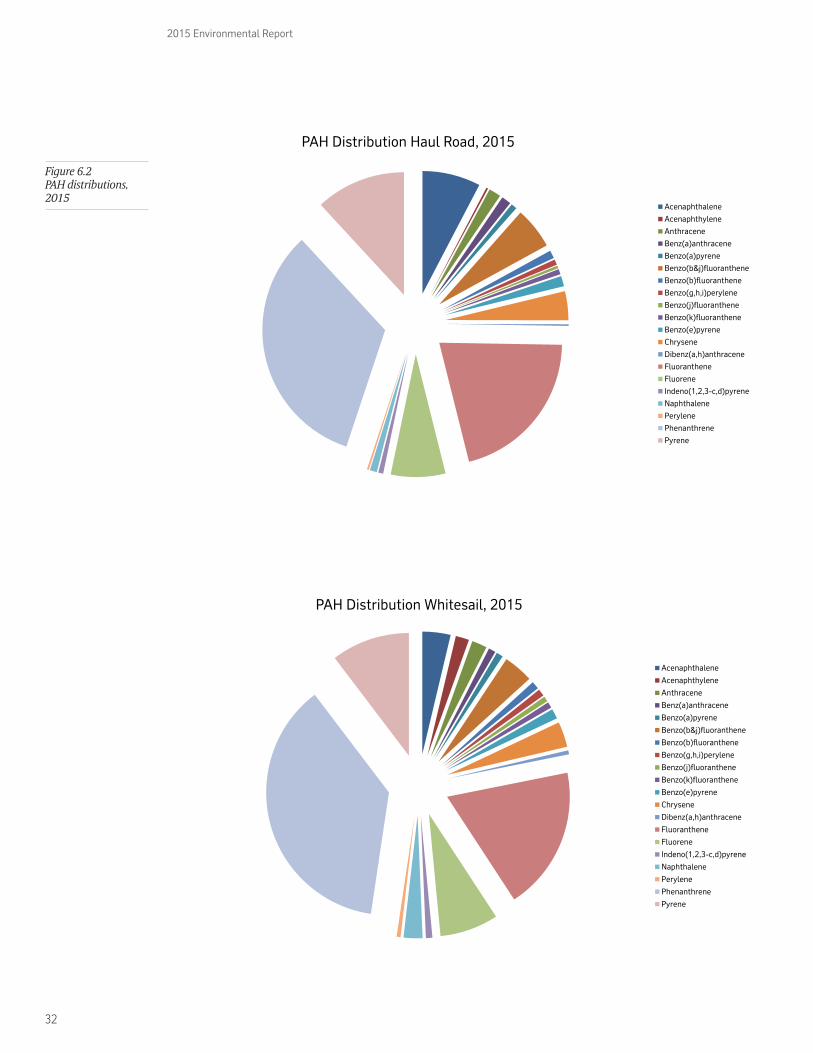
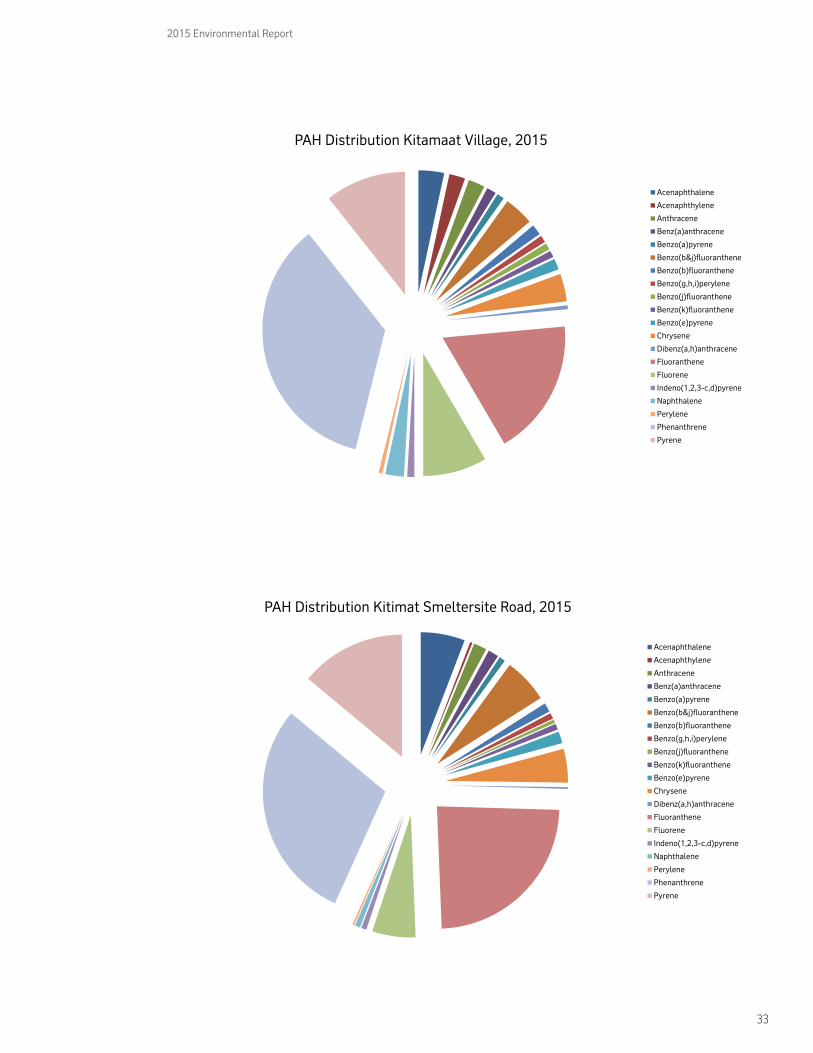
In 2015, total PAH showed a high degree of variability (Figure 6.1). This is typical when compared to previous years. The distribution of PAHs is largely consistent from one station to another, once the distance from the source is accounted for (Figure 6.2).
Table 6.5 Geometric mean PAH concentrations, 2014 & 2015
StationPAH
Concentrations (ng/m3) 2015
PAH Concentrations (ng/m3) 2014
Haul Road 39 51
Whitesail 9 11
Kitamaat Village 15 11
Kitimat Smeltersite Rd 49 60
The geometric mean PAH concentration observed at Haul Road station was lower in 2015 (39 ng/m3) than in 2014 (51 ng/m3). At the Whitesail station, the PAH concentration was lower in 2015 (9 ng/m3) compared to 2014 (11 ng/m3). At the Kitamaat Village station PAH concentrations were slightly higher this year (15 ng/m3) compared to 2014 (11 ng/m3). Kitimaat Village has not been historically affected by the smelter plume due to its location and weather conditions in the Kitimat Valley. The slightly higher results in 2015 for Kitimaat Village were most likely associated with external sources, such as wood-burning stoves. PAH at the Smeltersite Road station (fence line station) was lower in 2015 (49 ng/m3) than in 2014 (60 ng/m3) (Table 6.5). This reduction is associated with the progressive idling of the Vertical Söderberg lines and the related reduction of the emission loads in 2015.
28
2015 Environmental Report
Table 6.6 Rain chemistry monitoring - Haul Road Station, 2007-2015
Parameter 2007 2008 2009 2010 2011 2012 2013 2014 2015
Pre
cipi
tati
on
Precipitation Depth (mm)
Average 52.1 44.1 30.0 33.2 43.6 18.1 47.8 55.1 57.2
Geomean 27.2 25.3 11.1 10.6 24.7 13.4 29.5 25.2 27.9
Aci
dity
Rain (pH)Average 4.9 4.9 5.4 5.3 5.1 5.1 4.4 4.7 4.6
Geomean 4.9 4.9 5.3 5.3 5.0 5.1 4.3 4.6 4.6
Acidity (to pH 8.3)
CaCO3 (mg/L)
Average 7.1 7.3 6.0 6.8 5.2 5.5 4.4 3.5 2.2
Geomean 6.3 6.3 5.0 4.8 3.5 4.0 3.2 2.7 1.9
Acidity - Free (µeq/L)Average 30.6 27.9 12.5 12.1 17.6 18.5 24.5 15.3 9.0
Geomean 13.4 12.2 4.4 4.9 8.5 7.7 16.7 7.6 5.1
Alkalinity - Total CaCO3 (mg/L)
Average 1.1 1.8 2.2 1.5 0.5 0.6 0.3 0.7 3.7
Geomean 0.6 1.2 1.7 1.2 0.4 0.4 0.3 0.7 1.0
Con
cent
rati
on o
f Spe
cific
Sub
stan
ces
(mg/
L)
Chloride (Cl)Average 0.3 1.0 1.0 1.1 0.6 1.2 0.3 0.4 0.3
Geomean 0.3 0.9 0.9 1.0 0.5 0.8 0.2 0.2 0.2
Fluoride (F)Average 1.6 2.3 2.4 1.6 1.6 1.7 1.9 0.6 0.4
Geomean 1.4 2.0 1.7 0.9 1.1 1.3 1.4 0.4 0.3
Sulphate (SO4)Average 2.9 3.8 5.2 3.0 1.4 1.9 1.4 1.2 1.5
Geomean 2.2 2.9 3.2 1.8 1.0 1.5 1.1 0.7 0.8
Ammonia Nitrogen (NH4)
Average 0.09 0.10 0.14 0.12 0.08 0.08 0.05 0.06 0.06
Geomean 0.07 0.08 0.08 0.07 0.04 0.07 0.04 0.04 0.03
Nitrate Nitrogen (N03)Average 0.06 0.05 0.07 0.06 0.03 0.05 0.16 0.16 0.22
Geomean 0.04 0.04 0.05 0.05 0.02 0.04 0.13 0.13 0.13
Total Dissolved
Phosphate (PO4)
Average 0.02 0.03 0.04 0.01 0.01 0.02 0.01 0.01 0.01
Geomean 0.01 0.02 0.01 0.01 0.00 0.01 0.01 0.01 0.00
Aluminium (D-Al)Average 0.39 0.57 0.62 0.41 0.49 0.46 0.46 0.15 0.08
Geomean 0.31 0.45 0.37 0.22 0.31 0.34 0.24 0.10 0.06
Calcium (D-Ca)Average 0.43 0.67 0.69 0.30 0.15 0.26 0.22 0.08 0.09
Geomean 0.27 0.46 0.45 0.20 0.10 0.20 0.11 0.06 0.05
Magnesium (D-Mg)Average 0.05 0.08 0.08 0.10 0.04 0.05 0.06 0.03 0.03
Geomean 0.04 0.08 0.07 0.09 0.03 0.04 0.04 0.02 0.02
Potassium (D-K)Average 0.20 0.20 0.40 0.32 0.16 0.34 0.16 0.02 0.02
Geomean 0.11 0.20 0.22 0.19 0.06 0.15 0.06 0.01 0.01
Sodium (D-Na)Average 1.12 1.29 2.10 1.17 0.74 1.33 0.54 0.31 0.28
Geomean 0.85 1.11 1.51 0.75 0.55 1.03 0.36 0.22 0.18
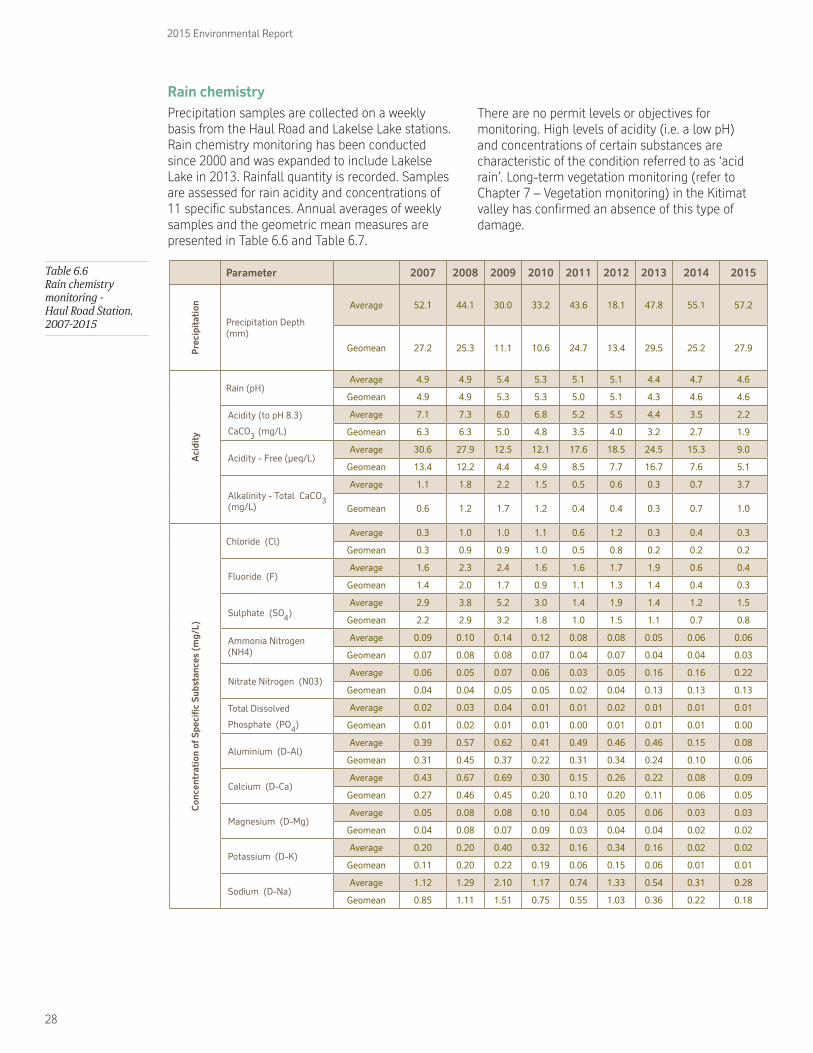
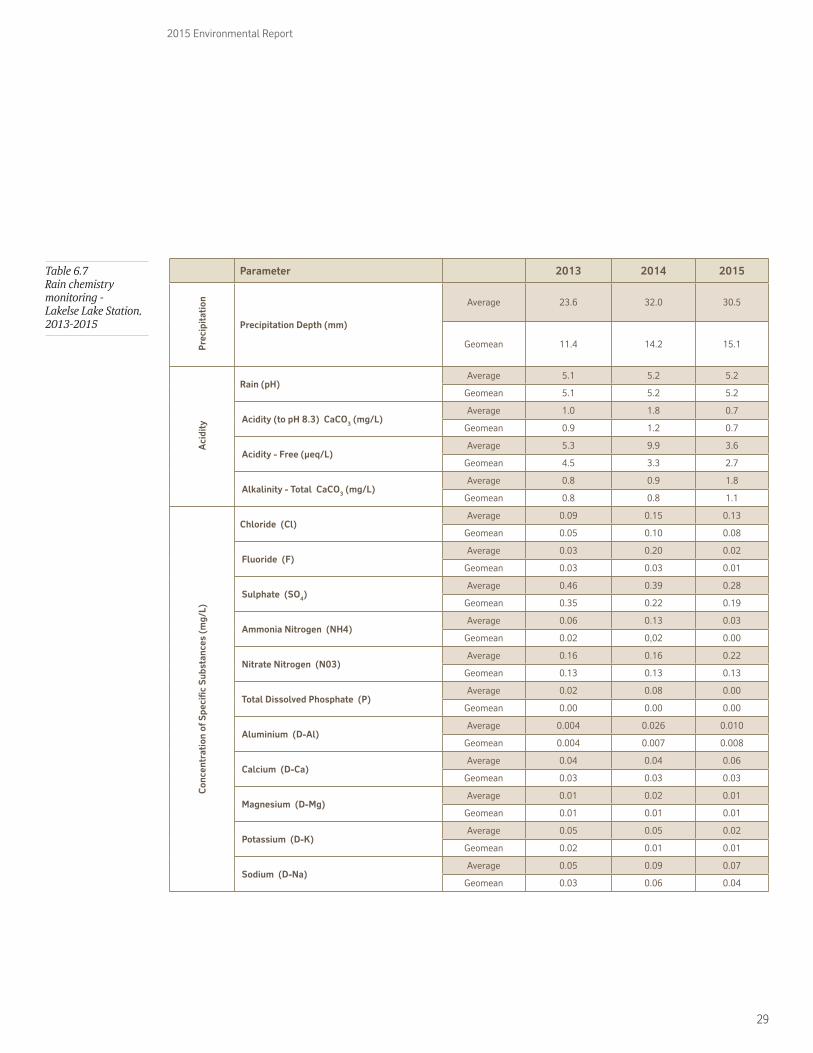
Rain chemistryPrecipitation samples are collected on a weekly basis from the Haul Road and Lakelse Lake stations. Rain chemistry monitoring has been conducted since 2000 and was expanded to include Lakelse Lake in 2013. Rainfall quantity is recorded. Samples are assessed for rain acidity and concentrations of 11 specific substances. Annual averages of weekly samples and the geometric mean measures are presented in Table 6.6 and Table 6.7.
There are no permit levels or objectives for monitoring. High levels of acidity (i.e. a low pH) and concentrations of certain substances are characteristic of the condition referred to as ‘acid rain’. Long-term vegetation monitoring (refer to Chapter 7 – Vegetation monitoring) in the Kitimat valley has confirmed an absence of this type of damage.
29
2015 Environmental Report
Parameter 2013 2014 2015
Pre
cipi
tati
on
Precipitation Depth (mm)
Average 23.6 32.0 30.5
Geomean 11.4 14.2 15.1
Aci
dity
Rain (pH)Average 5.1 5.2 5.2
Geomean 5.1 5.2 5.2
Acidity (to pH 8.3) CaCO3 (mg/L)Average 1.0 1.8 0.7
Geomean 0.9 1.2 0.7
Acidity - Free (µeq/L)Average 5.3 9.9 3.6
Geomean 4.5 3.3 2.7
Alkalinity - Total CaCO3 (mg/L)Average 0.8 0.9 1.8
Geomean 0.8 0.8 1.1
Con
cent
rati
on o
f Spe
cific
Sub
stan
ces
(mg/
L)
Chloride (Cl)Average 0.09 0.15 0.13
Geomean 0.05 0.10 0.08
Fluoride (F)Average 0.03 0.20 0.02
Geomean 0.03 0.03 0.01
Sulphate (SO4)Average 0.46 0.39 0.28
Geomean 0.35 0.22 0.19
Ammonia Nitrogen (NH4)Average 0.06 0.13 0.03
Geomean 0.02 0,02 0.00
Nitrate Nitrogen (N03)Average 0.16 0.16 0.22
Geomean 0.13 0.13 0.13
Total Dissolved Phosphate (P)Average 0.02 0.08 0.00
Geomean 0.00 0.00 0.00
Aluminium (D-Al)Average 0.004 0.026 0.010
Geomean 0.004 0.007 0.008
Calcium (D-Ca)Average 0.04 0.04 0.06
Geomean 0.03 0.03 0.03
Magnesium (D-Mg)Average 0.01 0.02 0.01
Geomean 0.01 0.01 0.01
Potassium (D-K)Average 0.05 0.05 0.02
Geomean 0.02 0.01 0.01
Sodium (D-Na)Average 0.05 0.09 0.07
Geomean 0.03 0.06 0.04
Table 6.7 Rain chemistry monitoring - Lakelse Lake Station, 2013-2015
30
2015 Environmental Report
0
100
200
300
400
500
600
700
800
900
Con
cent
ratio
n ng
/m3
Total PAH Haul Road, 2015
0
10
20
30
40
50
60
70
80
90
Con
cent
ratio
n ng
/m3
Total PAH Whitesail , 2015
158
Figure 6.1 Total PAH, 2015 ambient air stations
31
2015 Environmental Report
0
10
20
30
40
50
60
70
80
90C
once
ntra
tion
ng/m
3
Total PAH Kitamaat Village, 2015 155
0
100
200
300
400
500
600
700
800
900
Con
cent
ratio
n ng
/m3
Total PAH Kitimat Smeltersite Road, 2015
32
2015 Environmental Report
PAH Distribution Haul Road, 2015
Acenaphthalene
Acenaphthylene
Anthracene
Benz(a)anthracene
Benzo(a)pyrene
Benzo(b&j)�uoranthene
Benzo(b)�uoranthene
Benzo(g,h,i)perylene
Benzo(j)�uoranthene
Benzo(k)�uoranthene
Benzo(e)pyrene
Chrysene
Dibenz(a,h)anthracene
Fluoranthene
Fluorene
Indeno(1,2,3-c,d)pyrene
Naphthalene
Perylene
Phenanthrene
Pyrene
PAH Distribution Whitesail, 2015
Acenaphthalene
Acenaphthylene
Anthracene
Benz(a)anthracene
Benzo(a)pyrene
Benzo(b&j)�uoranthene
Benzo(b)�uoranthene
Benzo(g,h,i)perylene
Benzo(j)�uoranthene
Benzo(k)�uoranthene
Benzo(e)pyrene
Chrysene
Dibenz(a,h)anthracene
Fluoranthene
Fluorene
Indeno(1,2,3-c,d)pyrene
Naphthalene
Perylene
Phenanthrene
Pyrene
Figure 6.2 PAH distributions, 2015
33
2015 Environmental Report
PAH Distribution Kitamaat Village, 2015
Acenaphthalene
Acenaphthylene
Anthracene
Benz(a)anthracene
Benzo(a)pyrene
Benzo(b&j)�uoranthene
Benzo(b)�uoranthene
Benzo(g,h,i)perylene
Benzo(j)�uoranthene
Benzo(k)�uoranthene
Benzo(e)pyrene
Chrysene
Dibenz(a,h)anthracene
Fluoranthene
Fluorene
Indeno(1,2,3-c,d)pyrene
Naphthalene
Perylene
Phenanthrene
Pyrene
PAH Distribution Kitimat Smeltersite Road, 2015
Acenaphthalene
Acenaphthylene
Anthracene
Benz(a)anthracene
Benzo(a)pyrene
Benzo(b&j)�uoranthene
Benzo(b)�uoranthene
Benzo(g,h,i)perylene
Benzo(j)�uoranthene
Benzo(k)�uoranthene
Benzo(e)pyrene
Chrysene
Dibenz(a,h)anthracene
Fluoranthene
Fluorene
Indeno(1,2,3-c,d)pyrene
Naphthalene
Perylene
Phenanthrene
Pyrene
34
2015 Environmental Report
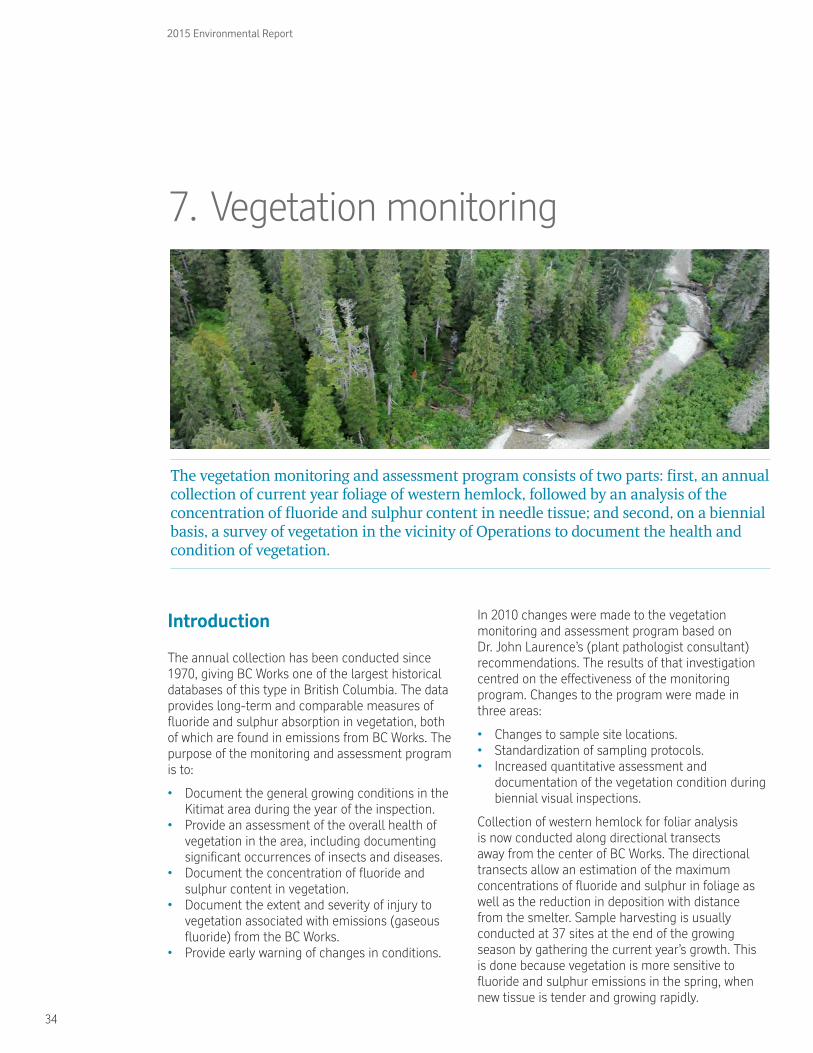
7. Vegetation monitoring
The vegetation monitoring and assessment program consists of two parts: first, an annual collection of current year foliage of western hemlock, followed by an analysis of the concentration of fluoride and sulphur content in needle tissue; and second, on a biennial basis, a survey of vegetation in the vicinity of Operations to document the health and condition of vegetation.
Introduction
The annual collection has been conducted since 1970, giving BC Works one of the largest historical databases of this type in British Columbia. The data provides long-term and comparable measures of fluoride and sulphur absorption in vegetation, both of which are found in emissions from BC Works. The purpose of the monitoring and assessment program is to:
• Document the general growing conditions in the Kitimat area during the year of the inspection.
• Provide an assessment of the overall health of vegetation in the area, including documenting significant occurrences of insects and diseases.
• Document the concentration of fluoride and sulphur content in vegetation.
• Document the extent and severity of injury to vegetation associated with emissions (gaseous fluoride) from the BC Works.
• Provide early warning of changes in conditions.
In 2010 changes were made to the vegetation monitoring and assessment program based on Dr. John Laurence’s (plant pathologist consultant) recommendations. The results of that investigation centred on the effectiveness of the monitoring program. Changes to the program were made in three areas:
• Changes to sample site locations.• Standardization of sampling protocols.• Increased quantitative assessment and
documentation of the vegetation condition during biennial visual inspections.
Collection of western hemlock for foliar analysis is now conducted along directional transects away from the center of BC Works. The directional transects allow an estimation of the maximum concentrations of fluoride and sulphur in foliage as well as the reduction in deposition with distance from the smelter. Sample harvesting is usually conducted at 37 sites at the end of the growing season by gathering the current year’s growth. This is done because vegetation is more sensitive to fluoride and sulphur emissions in the spring, when new tissue is tender and growing rapidly.
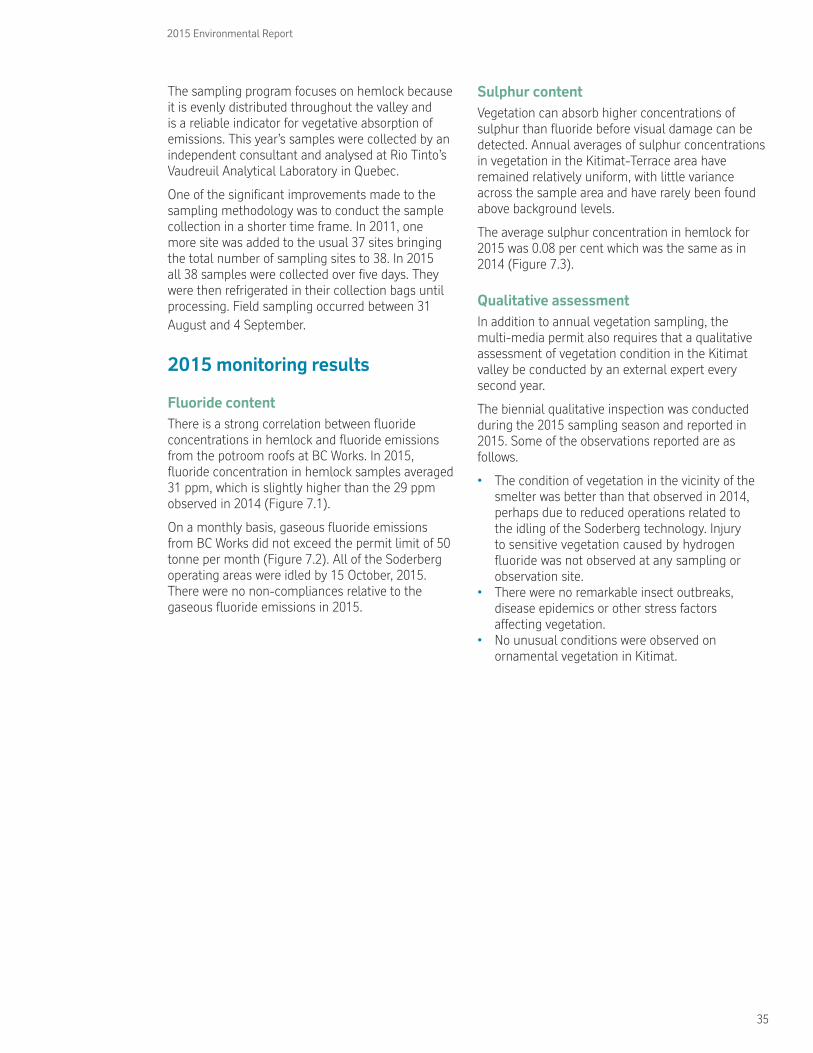
35
2015 Environmental Report
The sampling program focuses on hemlock because it is evenly distributed throughout the valley and is a reliable indicator for vegetative absorption of emissions. This year’s samples were collected by an independent consultant and analysed at Rio Tinto’s Vaudreuil Analytical Laboratory in Quebec.
One of the significant improvements made to the sampling methodology was to conduct the sample collection in a shorter time frame. In 2011, one more site was added to the usual 37 sites bringing the total number of sampling sites to 38. In 2015 all 38 samples were collected over five days. They were then refrigerated in their collection bags until processing. Field sampling occurred between 31 August and 4 September.
2015 monitoring results
Fluoride contentThere is a strong correlation between fluoride concentrations in hemlock and fluoride emissions from the potroom roofs at BC Works. In 2015, fluoride concentration in hemlock samples averaged 31 ppm, which is slightly higher than the 29 ppm observed in 2014 (Figure 7.1).
On a monthly basis, gaseous fluoride emissions from BC Works did not exceed the permit limit of 50 tonne per month (Figure 7.2). All of the Soderberg operating areas were idled by 15 October, 2015. There were no non-compliances relative to the gaseous fluoride emissions in 2015.
Sulphur content Vegetation can absorb higher concentrations of sulphur than fluoride before visual damage can be detected. Annual averages of sulphur concentrations in vegetation in the Kitimat-Terrace area have remained relatively uniform, with little variance across the sample area and have rarely been found above background levels.
The average sulphur concentration in hemlock for 2015 was 0.08 per cent which was the same as in 2014 (Figure 7.3).
Qualitative assessmentIn addition to annual vegetation sampling, the multi-media permit also requires that a qualitative assessment of vegetation condition in the Kitimat valley be conducted by an external expert every second year.
The biennial qualitative inspection was conducted during the 2015 sampling season and reported in 2015. Some of the observations reported are as follows.
• The condition of vegetation in the vicinity of the smelter was better than that observed in 2014, perhaps due to reduced operations related to the idling of the Soderberg technology. Injury to sensitive vegetation caused by hydrogen fluoride was not observed at any sampling or observation site.
• There were no remarkable insect outbreaks, disease epidemics or other stress factors affecting vegetation.
• No unusual conditions were observed on ornamental vegetation in Kitimat.
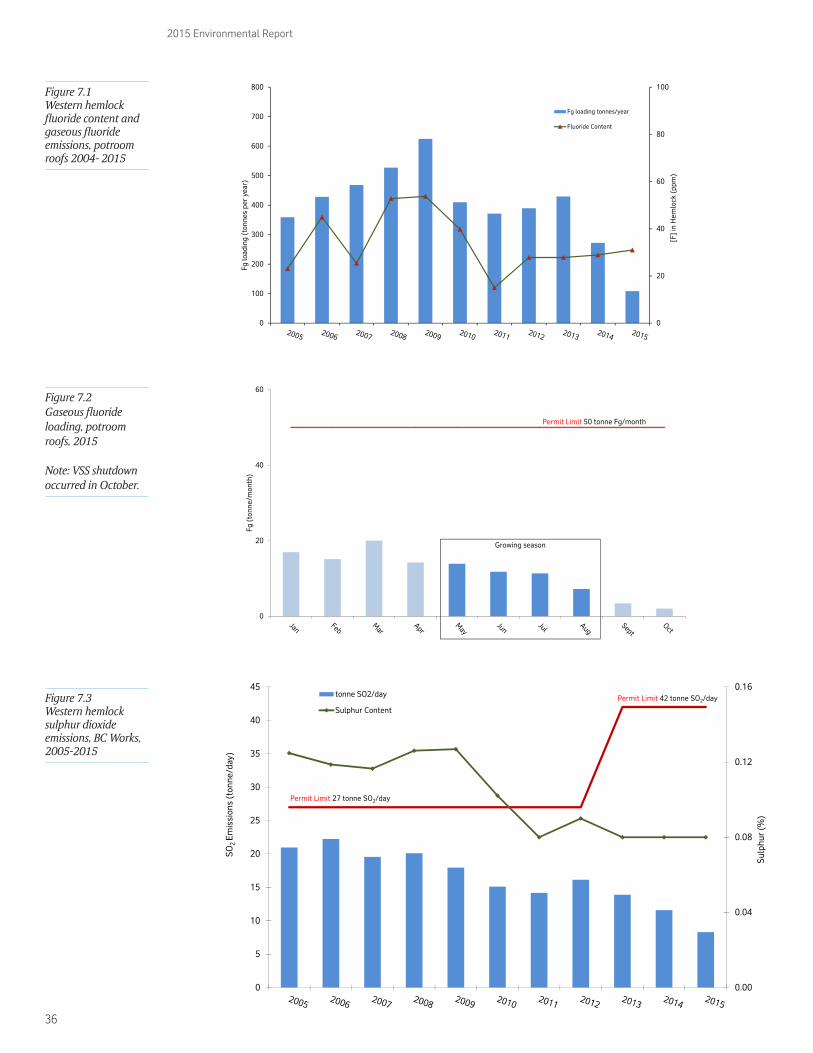
36
2015 Environmental Report
0.00
0.04
0.08
0.12
0.16
0
5
10
15
20
25
30
35
40
45
Sulp
hur
(%)
SO2
Emis
sion
s (t
onne
/day
)
tonne SO2/day
Sulphur Content
Permit Limit 27 tonne SO2/day
Permit Limit 42 tonne SO2/day
0
20
40
60
Fg (
tonn
e/m
onth
)
Permit Limit 50 tonne Fg/month
Growing season
Figure 7.2 Gaseous fluoride loading, potroom roofs, 2015 Note: VSS shutdown occurred in October.
0
20
40
60
80
100
0
100
200
300
400
500
600
700
800
[F]
in H
emlo
ck (
ppm
)
Fg lo
adin
g (t
onne
s pe
r ye
ar)
Fg loading tonnes/year
Fluoride Content
Figure 7.1 Western hemlock fluoride content and gaseous fluoride emissions, potroom roofs 2004- 2015
Figure 7.3 Western hemlock sulphur dioxide emissions, BC Works, 2005-2015
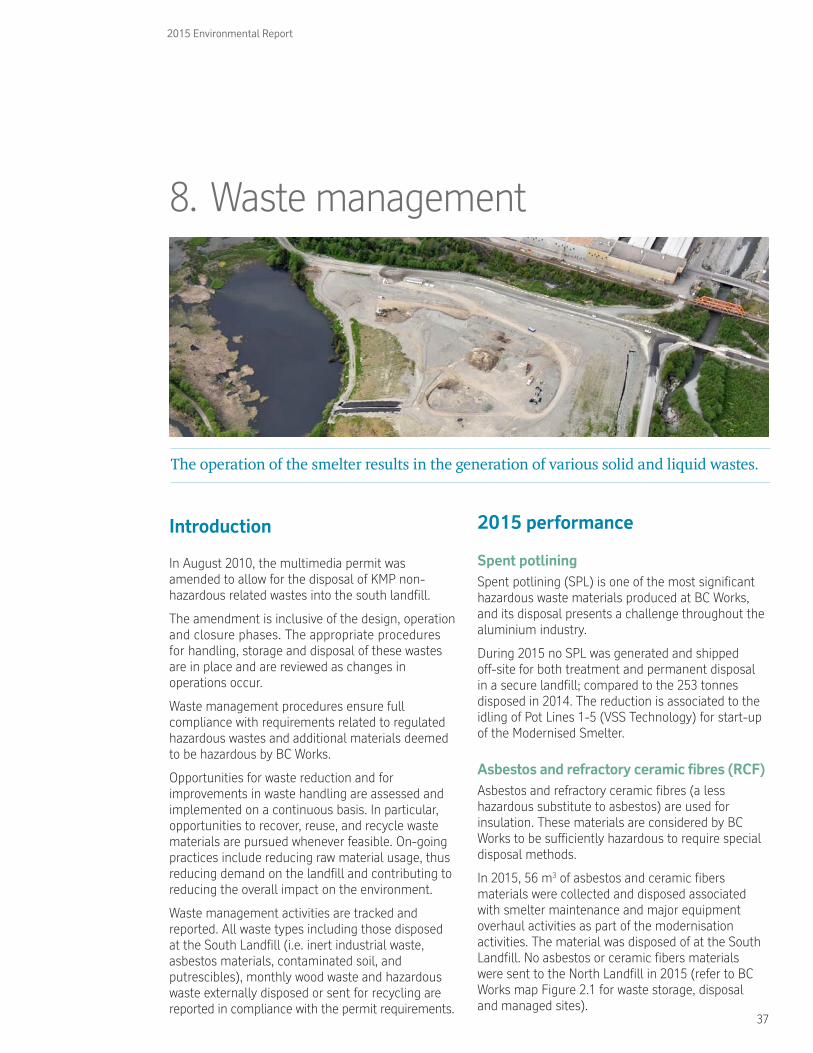
37
2015 Environmental Report
8. Waste management
The operation of the smelter results in the generation of various solid and liquid wastes.
Introduction
In August 2010, the multimedia permit was amended to allow for the disposal of KMP non-hazardous related wastes into the south landfill.
The amendment is inclusive of the design, operation and closure phases. The appropriate procedures for handling, storage and disposal of these wastes are in place and are reviewed as changes in operations occur.
Waste management procedures ensure full compliance with requirements related to regulated hazardous wastes and additional materials deemed to be hazardous by BC Works.
Opportunities for waste reduction and for improvements in waste handling are assessed and implemented on a continuous basis. In particular, opportunities to recover, reuse, and recycle waste materials are pursued whenever feasible. On-going practices include reducing raw material usage, thus reducing demand on the landfill and contributing to reducing the overall impact on the environment.
Waste management activities are tracked and reported. All waste types including those disposed at the South Landfill (i.e. inert industrial waste, asbestos materials, contaminated soil, and putrescibles), monthly wood waste and hazardous waste externally disposed or sent for recycling are reported in compliance with the permit requirements.
2015 performance
Spent potliningSpent potlining (SPL) is one of the most significant hazardous waste materials produced at BC Works, and its disposal presents a challenge throughout the aluminium industry.
During 2015 no SPL was generated and shipped off-site for both treatment and permanent disposal in a secure landfill; compared to the 253 tonnes disposed in 2014. The reduction is associated to the idling of Pot Lines 1-5 (VSS Technology) for start-up of the Modernised Smelter.
Asbestos and refractory ceramic fibres (RCF)Asbestos and refractory ceramic fibres (a less hazardous substitute to asbestos) are used for insulation. These materials are considered by BC Works to be sufficiently hazardous to require special disposal methods.
In 2015, 56 m3 of asbestos and ceramic fibers materials were collected and disposed associated with smelter maintenance and major equipment overhaul activities as part of the modernisation activities. The material was disposed of at the South Landfill. No asbestos or ceramic fibers materials were sent to the North Landfill in 2015 (refer to BC Works map Figure 2.1 for waste storage, disposal and managed sites).
38
2015 Environmental Report
Wood wasteWood waste is collected from around the smelter site on a regular basis and sent to a wood containment area. Wood is burned once sufficient volumes have accumulated at the containment area. In 2015, due to the elevated amount of wood generated by the KMP, Kitimat Operations used Air Curtain Incinerators under a separate authorization from MOE. A total of 20,646 m3 of wood waste was burned during the year using the Air Curtain Incinerators. No open burns were conducted in 2015.
Landfill managementThe South Landfill is the main landfill for smelter operations. It has been operational since the plant opened and is expected to be open until full capacity. Incoming waste streams included: industrial waste, putrescible waste, contaminated soils, asphalt and asbestos contaminated materials which include soil and concrete.
A survey is carried out once a year for reconciliation of the forecasted disposed volumes. The total volume of materials disposed at the South Landfill in 2015 was 9,045 m3, which corresponds to 13,571 metric tonnes.
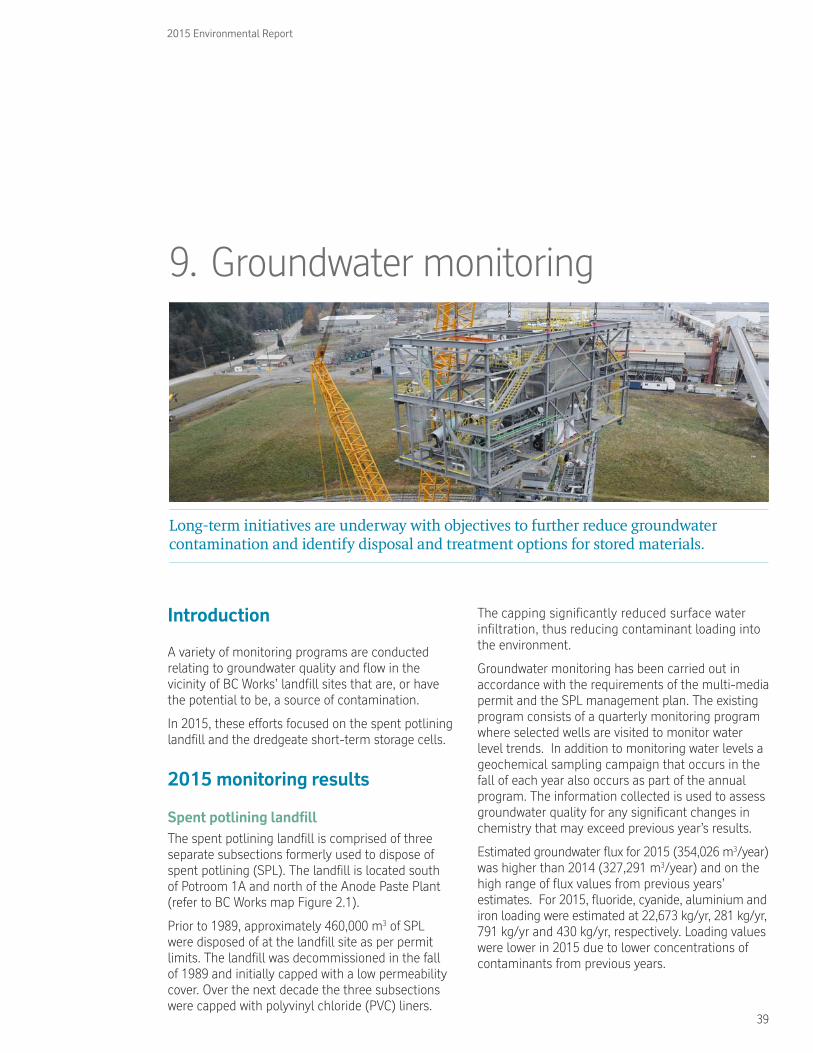
39
2015 Environmental Report
9. Groundwater monitoring
Long-term initiatives are underway with objectives to further reduce groundwater contamination and identify disposal and treatment options for stored materials.
Introduction
A variety of monitoring programs are conducted relating to groundwater quality and flow in the vicinity of BC Works’ landfill sites that are, or have the potential to be, a source of contamination.
In 2015, these efforts focused on the spent potlining landfill and the dredgeate short-term storage cells.
2015 monitoring results
Spent potlining landfillThe spent potlining landfill is comprised of three separate subsections formerly used to dispose of spent potlining (SPL). The landfill is located south of Potroom 1A and north of the Anode Paste Plant (refer to BC Works map Figure 2.1).
Prior to 1989, approximately 460,000 m3 of SPL were disposed of at the landfill site as per permit limits. The landfill was decommissioned in the fall of 1989 and initially capped with a low permeability cover. Over the next decade the three subsections were capped with polyvinyl chloride (PVC) liners.
The capping significantly reduced surface water infiltration, thus reducing contaminant loading into the environment.
Groundwater monitoring has been carried out in accordance with the requirements of the multi-media permit and the SPL management plan. The existing program consists of a quarterly monitoring program where selected wells are visited to monitor water level trends. In addition to monitoring water levels a geochemical sampling campaign that occurs in the fall of each year also occurs as part of the annual program. The information collected is used to assess groundwater quality for any significant changes in chemistry that may exceed previous year’s results.
Estimated groundwater flux for 2015 (354,026 m3/year) was higher than 2014 (327,291 m3/year) and on the high range of flux values from previous years’ estimates. For 2015, fluoride, cyanide, aluminium and iron loading were estimated at 22,673 kg/yr, 281 kg/yr, 791 kg/yr and 430 kg/yr, respectively. Loading values were lower in 2015 due to lower concentrations of contaminants from previous years.
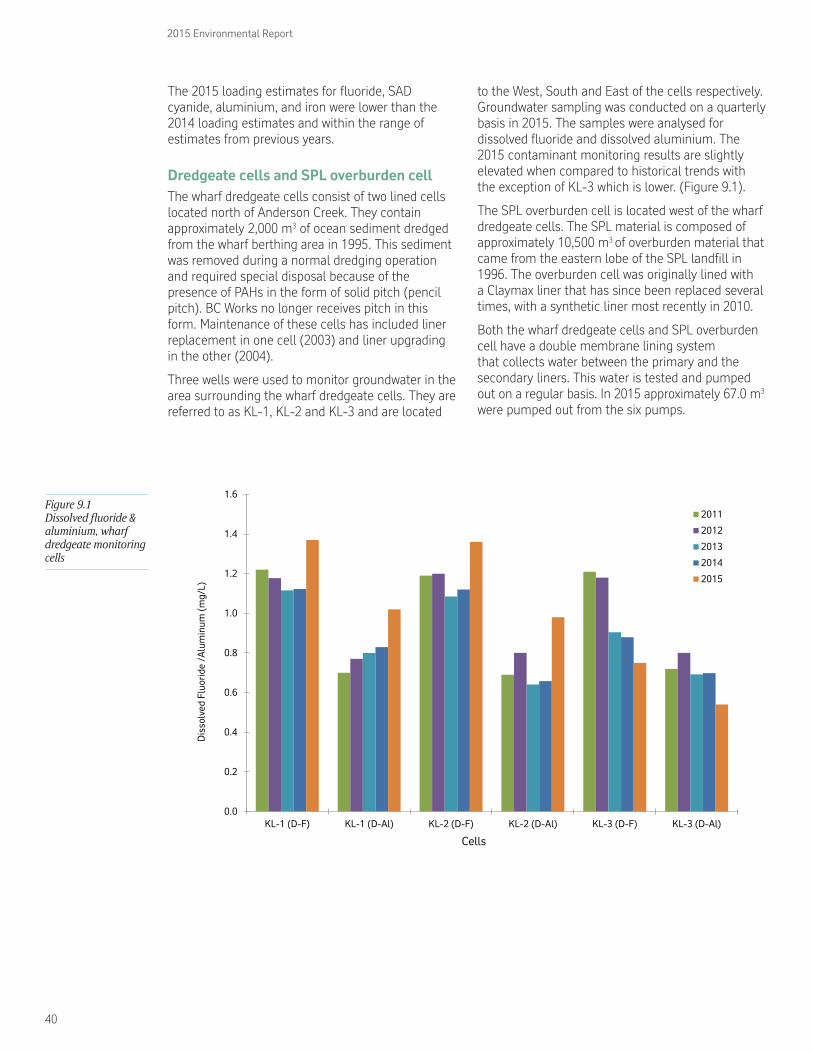
40
2015 Environmental Report
0.0
0.2
0.4
0.6
0.8
1.0
1.2
1.4
1.6
KL-1 (D-F) KL-1 (D-Al) KL-2 (D-F) KL-2 (D-Al) KL-3 (D-F) KL-3 (D-Al)
Dis
solv
ed F
luor
ide
/Alu
min
um (m
g/L)
Cells
2011
2012
2013
2014
2015
Figure 9.1 Dissolved fluoride & aluminium, wharf dredgeate monitoring cells
The 2015 loading estimates for fluoride, SAD cyanide, aluminium, and iron were lower than the 2014 loading estimates and within the range of estimates from previous years.
Dredgeate cells and SPL overburden cellThe wharf dredgeate cells consist of two lined cells located north of Anderson Creek. They contain approximately 2,000 m3 of ocean sediment dredged from the wharf berthing area in 1995. This sediment was removed during a normal dredging operation and required special disposal because of the presence of PAHs in the form of solid pitch (pencil pitch). BC Works no longer receives pitch in this form. Maintenance of these cells has included liner replacement in one cell (2003) and liner upgrading in the other (2004).
Three wells were used to monitor groundwater in the area surrounding the wharf dredgeate cells. They are referred to as KL-1, KL-2 and KL-3 and are located
to the West, South and East of the cells respectively. Groundwater sampling was conducted on a quarterly basis in 2015. The samples were analysed for dissolved fluoride and dissolved aluminium. The 2015 contaminant monitoring results are slightly elevated when compared to historical trends with the exception of KL-3 which is lower. (Figure 9.1).
The SPL overburden cell is located west of the wharf dredgeate cells. The SPL material is composed of approximately 10,500 m3 of overburden material that came from the eastern lobe of the SPL landfill in 1996. The overburden cell was originally lined with a Claymax liner that has since been replaced several times, with a synthetic liner most recently in 2010.
Both the wharf dredgeate cells and SPL overburden cell have a double membrane lining system that collects water between the primary and the secondary liners. This water is tested and pumped out on a regular basis. In 2015 approximately 67.0 m3 were pumped out from the six pumps.
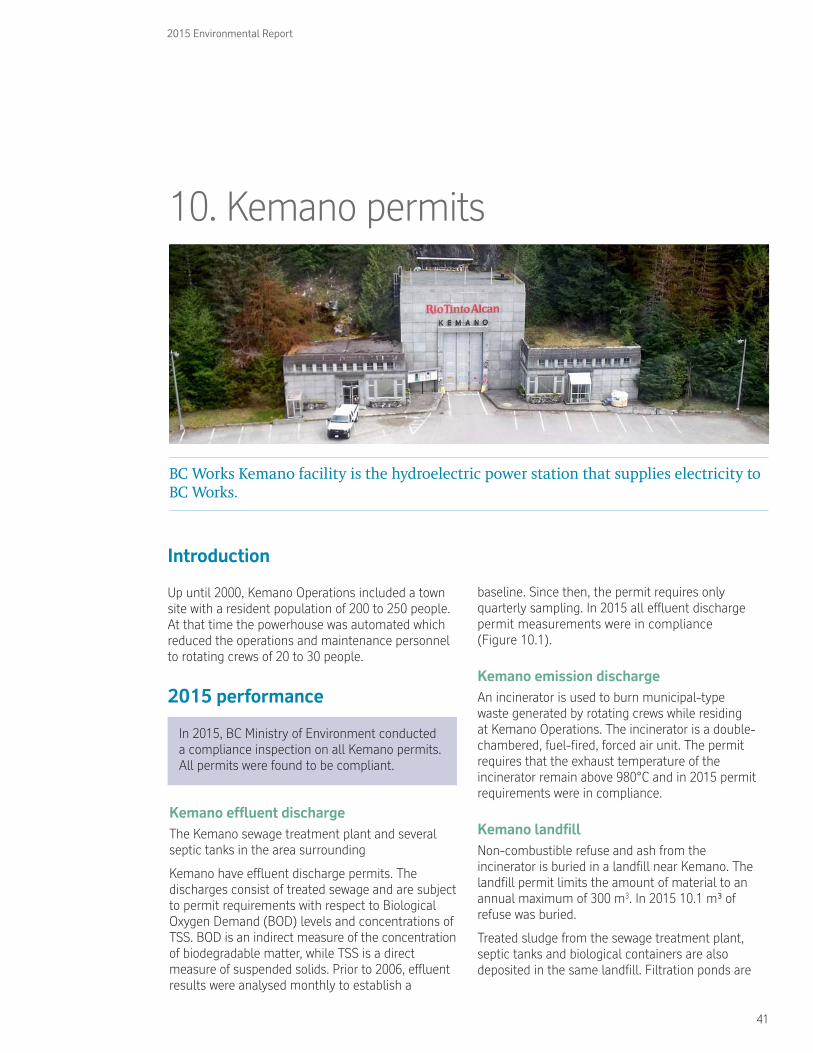
41
2015 Environmental Report
10. Kemano permits
BC Works Kemano facility is the hydroelectric power station that supplies electricity to BC Works.
Introduction
Up until 2000, Kemano Operations included a town site with a resident population of 200 to 250 people. At that time the powerhouse was automated which reduced the operations and maintenance personnel to rotating crews of 20 to 30 people.
2015 performance
In 2015, BC Ministry of Environment conducted a compliance inspection on all Kemano permits. All permits were found to be compliant.
Kemano effluent dischargeThe Kemano sewage treatment plant and several septic tanks in the area surrounding
Kemano have effluent discharge permits. The discharges consist of treated sewage and are subject to permit requirements with respect to Biological Oxygen Demand (BOD) levels and concentrations of TSS. BOD is an indirect measure of the concentration of biodegradable matter, while TSS is a direct measure of suspended solids. Prior to 2006, effluent results were analysed monthly to establish a
baseline. Since then, the permit requires only quarterly sampling. In 2015 all effluent discharge permit measurements were in compliance (Figure 10.1).
Kemano emission dischargeAn incinerator is used to burn municipal-type waste generated by rotating crews while residing at Kemano Operations. The incinerator is a double-chambered, fuel-fired, forced air unit. The permit requires that the exhaust temperature of the incinerator remain above 980°C and in 2015 permit requirements were in compliance.
Kemano landfillNon-combustible refuse and ash from the incinerator is buried in a landfill near Kemano. The landfill permit limits the amount of material to an annual maximum of 300 m3. In 2015 10.1 m³ of refuse was buried.
Treated sludge from the sewage treatment plant, septic tanks and biological containers are also deposited in the same landfill. Filtration ponds are
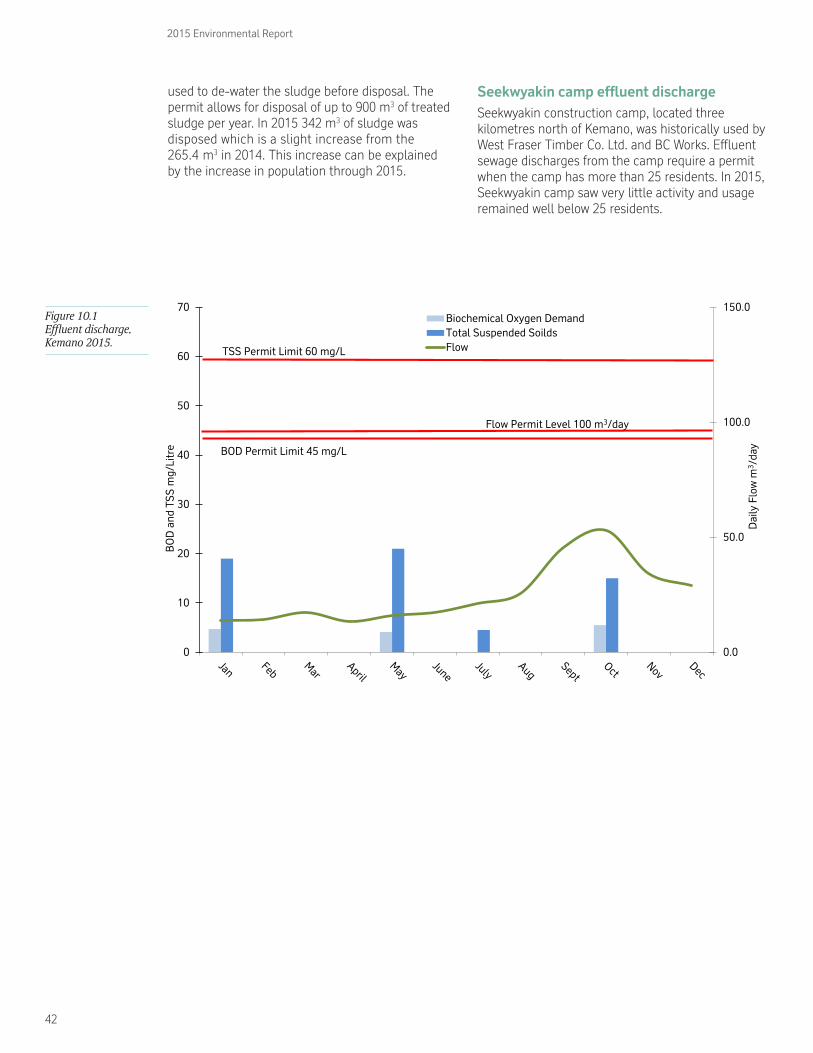
42
2015 Environmental Report
0.0
50.0
100.0
150.0
0
10
20
30
40
50
60
70
Dai
ly F
low
m3 /
day
BO
D a
nd T
SS m
g/Li
tre
Biochemical Oxygen DemandTotal Suspended SoildsFlowTSS Permit Limit 60 mg/L
BOD Permit Limit 45 mg/L
Flow Permit Level 100 m3/day
Figure 10.1 Effluent discharge, Kemano 2015.
used to de-water the sludge before disposal. The permit allows for disposal of up to 900 m3 of treated sludge per year. In 2015 342 m3 of sludge was disposed which is a slight increase from the 265.4 m3 in 2014. This increase can be explained by the increase in population through 2015.
Seekwyakin camp effluent dischargeSeekwyakin construction camp, located three kilometres north of Kemano, was historically used by West Fraser Timber Co. Ltd. and BC Works. Effluent sewage discharges from the camp require a permit when the camp has more than 25 residents. In 2015, Seekwyakin camp saw very little activity and usage remained well below 25 residents.
43
2015 Environmental Report
11. Summary of non-compliance and spills
In 2015, there were a total of four non-compliances for Kitimat and zero non-compliance for Kemano.
2015 performance
Non-compliance summary These non-compliances are summarized with a brief description of their causes and the corrective actions that are either being assessed or implemented at the time this report was prepared (Table 11.1).
Spill summarySpills at BC Works are first reported to the Plant Protection department and subsequently to the Environmental Services Department. Regulatory requirements are in place to report certain types of spills to the Ministry of Environment (referred to as “reportable” spills), depending on the nature and volume of the substance spilled. In 2015, five spills were reported to the Ministry (Table 11.2).
Spill-related awareness and prevention is a major focal point throughout BC Works. Immediate containment and minimization of potential environmental damage is the first priority. Specially equipped response teams are available when required. If appropriate, other agencies are informed and their cooperation enlisted.
Root cause analysis of reportable spills is conducted to prevent recurrence, and a system is maintained for recording and reviewing all spills and their frequency by type. This ensures that appropriate corrective actions are identified and tracked through to completion.
No known environmental damage was associated with any of the spills reported during 2015.
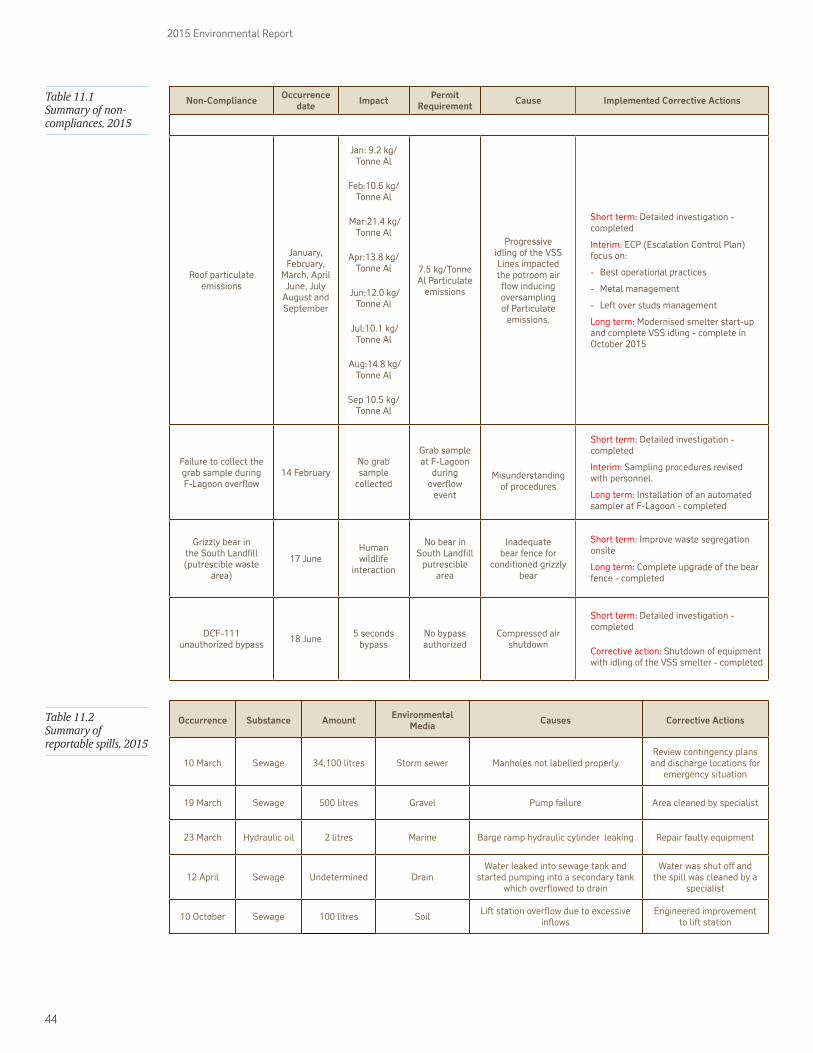
44
2015 Environmental Report
Occurrence Substance Amount Environmental Media Causes Corrective Actions
10 March Sewage 34,100 litres Storm sewer Manholes not labelled properlyReview contingency plans
and discharge locations for emergency situation
19 March Sewage 500 litres Gravel Pump failure Area cleaned by specialist
23 March Hydraulic oil 2 litres Marine Barge ramp hydraulic cylinder leaking Repair faulty equipment
12 April Sewage Undetermined DrainWater leaked into sewage tank and
started pumping into a secondary tank which overflowed to drain
Water was shut off and the spill was cleaned by a
specialist
10 October Sewage 100 litres Soil Lift station overflow due to excessive inflows
Engineered improvement to lift station
Non-Compliance Occurrence date Impact Permit
Requirement Cause Implemented Corrective Actions
Roof particulate emissions
January, February,
March, April June, July
August and September
Jan: 9.2 kg/Tonne Al
Feb:10.6 kg/Tonne Al
Mar:21.4 kg/Tonne Al
Apr:13.8 kg/Tonne Al
Jun:12.0 kg/Tonne Al
Jul:10.1 kg/Tonne Al
Aug:14.8 kg/Tonne Al
Sep 10.5 kg/Tonne Al
7.5 kg/Tonne Al Particulate
emissions
Progressive idling of the VSS Lines impacted the potroom air
flow inducing oversampling of Particulate
emissions.
Short term: Detailed investigation - completed
Interim: ECP (Escalation Control Plan) focus on:
- Best operational practices
- Metal management
- Left over studs management
Long term: Modernised smelter start-up and complete VSS idling - complete in October 2015
Failure to collect the grab sample during F-Lagoon overflow
14 FebruaryNo grab sample
collected
Grab sample at F-Lagoon
during overflow
event
Misunderstanding of procedures
Short term: Detailed investigation - completed
Interim: Sampling procedures revised with personnel.
Long term: Installation of an automated sampler at F-Lagoon - completed
Grizzly bear in the South Landfill (putrescible waste
area)
17 JuneHuman wildlife
interaction
No bear in South Landfill
putrescible area
Inadequate bear fence for
conditioned grizzly bear
Short term: Improve waste segregation onsite
Long term: Complete upgrade of the bear fence - completed
DCF-111 unauthorized bypass 18 June 5 seconds
bypassNo bypass authorized
Compressed air shutdown
Short term: Detailed investigation - completed
Corrective action: Shutdown of equipment with idling of the VSS smelter - completed
Table 11.1 Summary of non-compliances, 2015
Table 11.2 Summary of reportable spills, 2015
45
2015 Environmental Report
12. GlossaryAnodeOne of two electrodes (the positive electrode) required to carry an electric current into the molten bath, a key component of the electrolytic reduction process that transforms alumina ore into aluminium.
Anode effectsA chemical reaction that occurs when the level of alumina in a pot falls below a critical level, resulting in reduced aluminium production and the generation of perfluorocarbons (PFCs) – a variety of gases with a high carbon dioxide equivalency.
Anode pasteOne of the materials used to manufacture anodes, composed of calcined coke and coal tar pitch.
AP4XPre-bake aluminium smelting technology used in the Kitimat modernised smelter.
Attrition indexAn index used to express alumina strength; the higher the value, the weaker the alumina.
Carbon dioxide equivalency (CO2e)This is a quantity that describes, for a given mixture and amount of greenhouse gas, the amount of CO2 that would have the same global warming potential as the emission, when measured over a specified time period.
Carbon outRemoval of carbon fragments that have fallen off the anode or have formed points on part of the anode.
Cassette samplingA sampling procedure for air emissions where contaminants are collected using filters placed at regular intervals along the length of a potroom.
CathodeOne of two electrodes (the negative electrode) required to carry an electric current into the molten bath; a key component of the electrolytic reduction process that transforms alumina ore into aluminium.
Coke calcination/calcined cokeA process involving the use of high temperatures to drive off volatile matter found in green coke, thus producing calcined coke for use in anode manufacturing.
Composite sampleA composite sample is treated as a single sample, despite being made up of multiple temporally discrete samples. For example, all effluent composite samples are taken over 24 hours during which a 50mL sample is collected every 10 minutes.
46
2015 Environmental Report
DredgeateAny material removed by dredging.
Dry scrubberPollution control equipment used to remove contaminants (in gaseous or particulate forms) from air emissions.
Effluent (B-lagoon)Water discharge flowing out of the B-Lagoon outfall after treatment in the B-Lagoon system.
ElectrolyteA chemical compound that provides an electrically conductive medium when dissolved or molten.
Electrolytic reductionThis process uses electricity to remove oxygen molecules from aluminium oxide to form aluminium metal.
Exception potA pot that is not operating within the normal range and could result in openings in the alumina sealing. Exception pots are associated with increased fluoride emissions.
Fugitive dustSolid airborne particulate matter that is emitted from any source other than a stack or a chimney.
Geometric meanA geometric mean is a type of mean or average, which indicates the central tendency or typical value of a set of numbers by using the product of their values. The geometric mean is often used when comparing different items when each item has multiple properties that have different numeric ranges.
Green cokeThe raw form of coke received at BC Works, which is calcined for use in the manufacture of anodes; a by-product of oil refining.
Grab sampleA grab sample is a discrete sample used to collect information for a specific or a short time. Variability of this data is much higher than a composite sample.
LeachateA liquid which results from water collecting contaminants as it passes through waste material.
Leftover metalMetal which accumulates in a pot when the schedule to remove the metal is not followed.
LoadingLoading is the emitted amount of a contaminate in a given time period.
Low magnitude potAn exception pot which has had an anode effect with a magnitude of 25 volts or less.
Maximum allowable levelThis level provides adequate protection against pollution effects on soil, water, vegetation, materials, animals, visibility, personal comfort and well-being.
Maximum desirable levelThis level is the long-term goal for air quality programs and provides a basis for the federal government’s antidegradation policy for unpolluted parts of the country.
47
2015 Environmental Report
Maximum tolerable levelThis level denotes time-based concentrations of air contaminants beyond which appropriate action is required to protect the health of the general population.
MinistryThe British Columbia Ministry of Environment; to which BC Works reports on compliance with its permit requirements.
Off-light potPots which have gone for a long period of time (generally 40 hours) without an anode effect.
PiezometerA small diameter water well used to measure the hydraulic head of groundwater in aquifers.
PitchOne of the materials from which anodes are made, and a by-product of metallurgical coke production.
Polycyclic aromatic hydrocarbons (PAHs)A group of aromatic hydrocarbons containing three or more closed hydrocarbon rings. Certain PAH are animal and/or human carcinogens.
Pots/potroomsPots are large, specially designed steel structures within which electrolytic reduction takes place. The 588 pots at BC Works are housed within 5 pot lines (1C, 2A, 2B, 2C, 3A, 3B, 4A, 4B, 5A and 5B)
Process correctionAccessing the condition of exception or sick pots and bringing them back to normal operating conditions.
Putrescible wasteWaste that rots which can be easily broken down by bacteria, for example food and vegetable waste.
PyroscrubberA combustion-based system that controls dust emissions from the coke calciner.
Retention timeThe average time a drop of water takes to move through a lagoon from inlet to outlet.
Scow gridA dry dock for flat bottomed vessels (scows) formed from a series of piles and sills.
Sick potA pot that has an elevated bath temperature and cannot be sealed properly or is uncovered.
Spent pot lining (SPL)Lining from the inside of pots, composed of refractory bricks and carbon that has deteriorated to the point where it needs to be replaced.
StudStuds constructed of steel are inserted vertically into the anode to conduct the flow of electricity through the anode and into the electrolyte.
Total suspended solids (TSS)A water quality measurement that refers to the dry weight of particles trapped by a filter, typically of a specified pore size.

Rio Tinto Plc6 St Jame’s SquareLondon SW1Y 4ADUnited Kingdom
T +44 20 7781 2000
Rio Tinto BC Works1 Smeltersite RoadPO Box 1800Kitimat BC V8C 2H2Canada
T +1 250 639 8000
riotinto.com
www.riotintobcoperations.com
2015 Environmental Report