Embed Size (px)
Citation preview
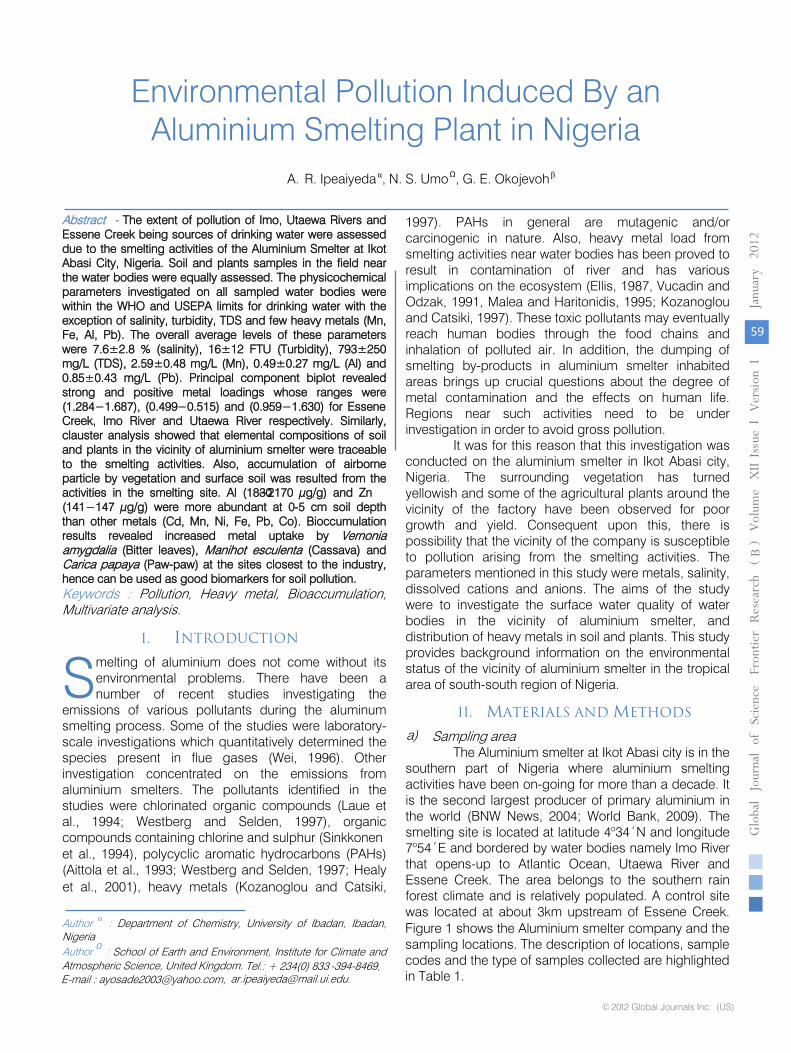
© 2012. A. R. Ipeaiyeda, N. S. Umo, G. E. Okojevoh.This is a research/review paper, distributed under the terms of the Creative Commons Attribution-Noncommercial 3.0 Unported License http://creativecommons.org/licenses/by-nc/3.0/), permitting all non commercial use, distribution, and reproduction in any medium, provided the original work is properly cited.
Environmental Pollution Induced By an Aluminium Smelting Plant in Nigeria
By A. R. Ipeaiyeda, N. S. Umo, G. E. Okojevoh University of Ibadan, Ibadan, Nigeria
Abstract - The extent of pollution of Imo, Utaewa Rivers and Essene Creek being sources of drinking water were assessed due to the smelting activities of the Aluminium Smelter at Ikot Abasi City, Nigeria. Soil and plants samples in the field near the water bodies were equally assessed. The physicochemical parameters investigated on all sampled water bodies were within the WHO and USEPA limits for drinking water with the exception of salinity, turbidity, TDS and few heavy metals (Mn, Fe, Al, Pb). The overall average levels of these parameters were 7.6±2.8 % (salinity), 16±12 FTU (Turbidity), 793±250 mg/L (TDS), 2.59±0.48 mg/L (Mn), 0.49±0.27 mg/L (Al) and 0.85±0.43 mg/L (Pb). Principal component biplot revealed strong and positive metal loadings whose ranges were (1.284−1.687), (0.499−0.515) and (0.959−1.630) for Essene Creek, Imo River and Utaewa River respectively. Similarly, clauster analysis showed that elemental compositions of soil and plants in the vicinity of aluminium smelter were traceable to the smelting activities. Also, accumulation of airborne particle by vegetation and surface soil was resulted from the activities in the smelting site. Al (1830−2170 μg/g) and Zn (141−147 μg/g) were more abundant at 0-5 cm soil depth than other metals (Cd, Mn, Ni, Fe, Pb, Co). Bioccumulation results revealed increased metal uptake by Vernonia amygdalia (Bitter leaves), Manihot esculenta (Cassava) and Carica papaya (Paw-paw) at the sites closest to the industry, hence can be used as good biomarkers for soil pollution.
Keywords : Pollution, Heavy metal, Bioaccumulation, Multivariate analysis.
GJRE Classification : FOR Code: 070105, 030201
Environmental Pollution Induced By an Aluminium Smelting Plant in Nigeria Strictly as per the compliance and regulations of:
Global Journal of Science Frontier ResearchChemistryVolume 12 Issue 1 Version 1.0 January 2012Type : Double Blind Peer Reviewed International Research JournalPublisher: Global Journals Inc. (USA)Online ISSN: 2249-4626 & Print ISSN: 0975-5896
Environmental Pollution Induced By an Aluminium Smelting Plant in Nigeria
A. R. Ipeaiyeda α, N. S. UmoΩ, G. E. Okojevoh β
Abstract - The extent of pollution of Imo, Utaewa Rivers and
Essene Creek being sources of drinking water were assessed due to the smelting activities of the Aluminium Smelter at Ikot Abasi City, Nigeria. Soil and plants samples in the field near the water bodies were equally assessed. The physicochemical parameters investigated on all sampled water bodies were within the WHO and USEPA limits for drinking water with the exception of salinity, turbidity, TDS and few heavy metals (Mn, Fe, Al, Pb). The overall average levels of these parameters were 7.6±2.8 % (salinity), 16±12 FTU (Turbidity), 793±250 mg/L (TDS), 2.59±0.48 mg/L (Mn), 0.49±0.27 mg/L (Al) and 0.85±0.43 mg/L (Pb). Principal component biplot revealed strong and positive metal loadings whose ranges were (1.284−1.687), (0.499−0.515) and (0.959−1.630) for Essene Creek, Imo River and Utaewa River respectively. Similarly, clauster analysis showed that elemental compositions of soil and plants in the vicinity of aluminium smelter were traceable to the smelting activities. Also, accumulation of airborne particle by vegetation and surface soil was resulted from the activities in the smelting site. Al (1830−2170 µg/g) and Zn (141−147 µg/g) were more abundant at 0-5 cm soil depth than other metals (Cd, Mn, Ni, Fe, Pb, Co). Bioccumulation results revealed increased metal uptake by Vernonia amygdalia
(Bitter leaves), Manihot esculenta
(Cassava) and
Carica papaya (Paw-paw) at the sites closest to the industry,
hence can be used as good biomarkers for soil pollution. Keywords
:
Pollution, Heavy metal, Bioaccumulation, Multivariate analysis.
melting of aluminium does not come without its environmental problems. There have been a number of recent studies investigating the
emissions of various pollutants during the aluminum smelting process. Some of the studies were laboratory-scale investigations which quantitatively determined the species present in flue gases (Wei, 1996). Other investigation concentrated on the emissions from aluminium smelters. The pollutants identified in the studies were chlorinated organic compounds (Laue et al., 1994; Westberg and Selden, 1997), organic compounds containing chlorine and sulphur (Sinkkonen
Author α
:
Department of Chemistry, University of Ibadan, Ibadan, Nigeria
Author Ω
:
School of Earth and Environment, Institute for Climate and Atmospheric Science, United Kingdom.
Tel.: + 234(0) 833 -394-8469,
et al., 1994), polycyclic aromatic hydrocarbons (PAHs) (Aittola et al., 1993; Westberg and Selden, 1997; Healy et al., 2001), heavy metals (Kozanoglou and Catsiki,
1997). PAHs in general are mutagenic and/or carcinogenic in nature. Also, heavy metal load from smelting activities near water bodies has been proved to result in contamination of river and has various implications on the ecosystem (Ellis, 1987, Vucadin and Odzak, 1991, Malea and Haritonidis, 1995; Kozanoglou and Catsiki, 1997). These toxic pollutants may eventually reach human bodies through the food chains and inhalation of polluted air. In addition, the dumping of smelting by-products in aluminium smelter inhabited areas brings up crucial questions about the degree of metal contamination and the effects on human life. Regions near such activities need to be under investigation in order to avoid gross pollution.
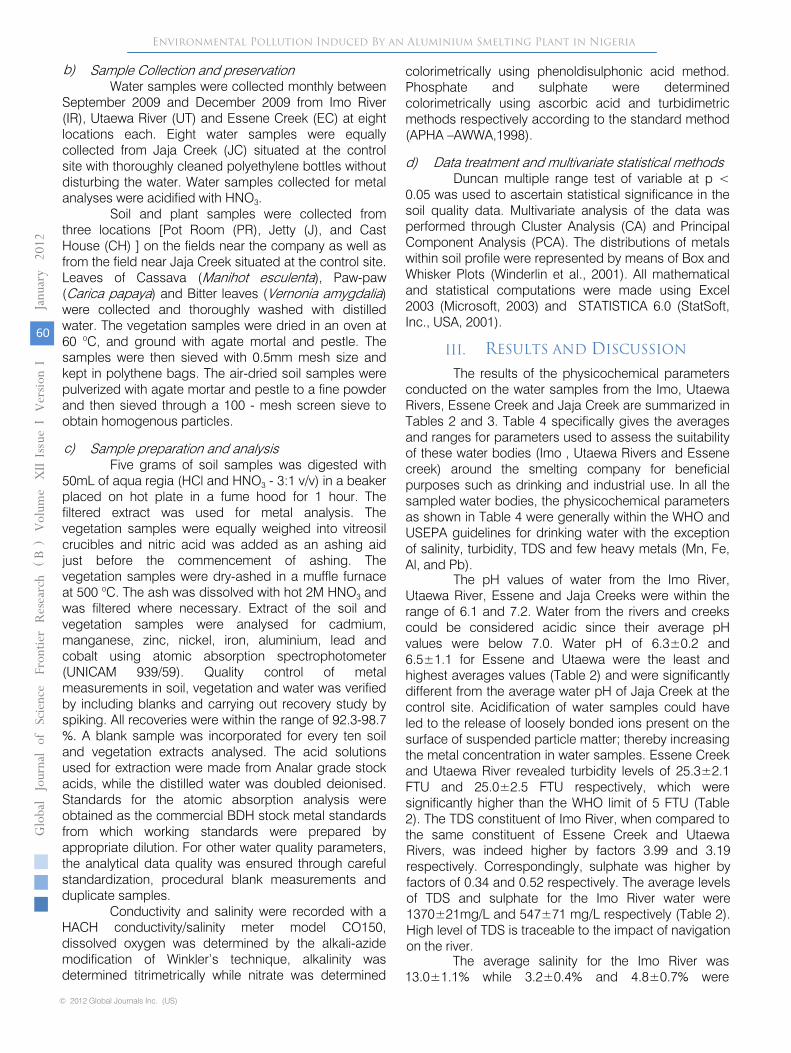
It was for this reason that this investigation was conducted on the aluminium smelter in Ikot Abasi city, Nigeria.
The surrounding vegetation has turned yellowish and some of the agricultural
plants around the vicinity of the factory have been observed for poor growth and yield. Consequent upon this, there is possibility that the vicinity of the company is susceptible to pollution arising from the smelting activities. The parameters mentioned in this study were metals, salinity, dissolved cations and anions. The aims of the study were to investigate the surface water quality of water bodies in the vicinity of aluminium smelter, and distribution of heavy metals in soil and plants. This study provides background information on the environmental status of the vicinity of aluminium smelter in the tropical area of south-south region of Nigeria.
MATERIALS AND METHODS
Sampling area
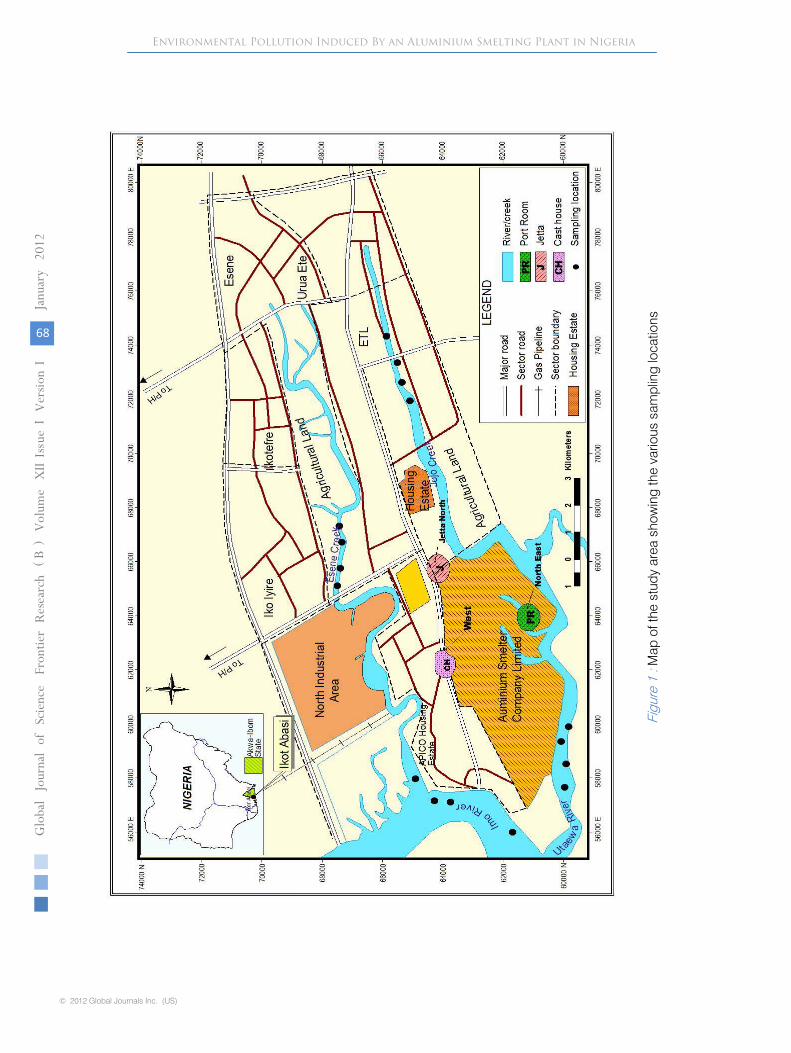
The Aluminium smelter at Ikot Abasi city is in the southern part of Nigeria where aluminium smelting activities have been on-going for more than a decade. It is the second largest producer of primary aluminium in the world (BNW News, 2004; World Bank, 2009). The smelting site is located at latitude 4o34´N and longitude 7o54´E and bordered by water bodies namely Imo River that opens-up to Atlantic Ocean, Utaewa River and Essene Creek. The area belongs to the southern rain forest climate and is relatively populated. A control site was located at about 3km upstream of Essene Creek.
S I. INTRODUCTION
II.
a)
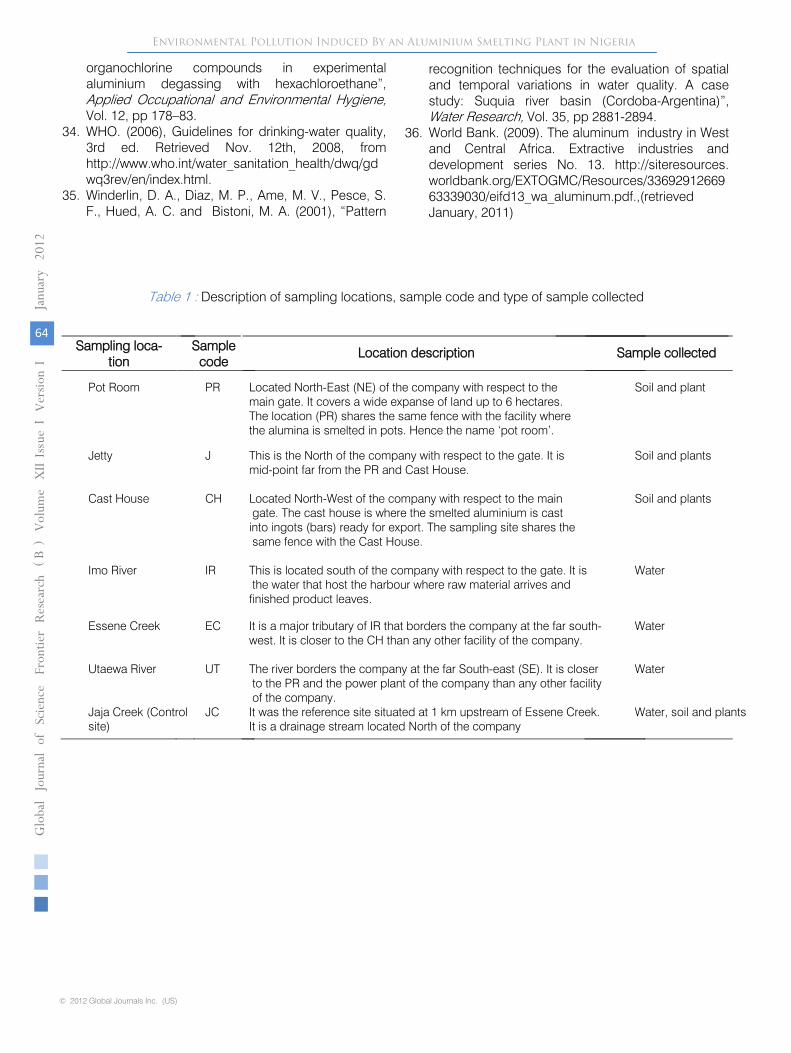
Figure 1 shows the Aluminium smelter company and the sampling locations. The description of locations, sample codes and the type of samples collected are highlighted in Table 1.
Globa
lJo
u rna
lof
Scienc
eFr
ontier
Resea
rch
V
olum
eXII
Issu
e er
sion
IV
I
59
Jan u
ary
2012
B)
)
© 2012 Global Journals Inc. (US)
Sample Collection and preservation
Water samples were collected monthly
between September 2009 and December 2009 from Imo River (IR), Utaewa River (UT) and Essene Creek (EC) at eight locations each. Eight water samples were equally collected from Jaja Creek (JC) situated at the control site with thoroughly cleaned polyethylene bottles without disturbing the water. Water samples collected for metal analyses were acidified with HNO3.
Soil and plant samples were collected from three locations [Pot Room (PR), Jetty (J), and Cast House (CH) ] on the fields near the company as well as from the field near Jaja Creek situated at the control site. Leaves of Cassava (Manihot esculenta), Paw-paw (Carica papaya) and Bitter leaves (Vernonia amygdalia) were collected and thoroughly washed with distilled water. The vegetation samples were dried in an oven at 60 oC, and ground with agate mortal and pestle. The samples were then sieved with 0.5mm mesh size and kept in polythene bags. The air-dried soil samples were pulverized with agate mortar and pestle to a fine powder and then sieved through a 100 -
mesh screen sieve to obtain homogenous particles.
Sample preparation and analysis
Five grams of soil samples was digested with 50mL of aqua regia (HCl and
HNO3
-
3:1 v/v) in a beaker placed on hot plate in a fume hood for 1 hour. The filtered extract was used for metal analysis. The vegetation samples were equally weighed into vitreosil crucibles and nitric acid was added as an ashing aid just before the commencement of ashing. The vegetation samples were dry-ashed in a muffle furnace at 500 oC. The ash was dissolved with hot 2M HNO3
and was filtered where necessary. Extract of the soil and vegetation samples were analysed for cadmium, manganese, zinc, nickel, iron, aluminium, lead and cobalt using atomic absorption spectrophotometer (UNICAM 939/59). Quality control of metal measurements in soil, vegetation and water was verified by including blanks and carrying out recovery study by spiking. All recoveries were within the range of 92.3-98.7 %. A blank sample was incorporated for every ten soil and vegetation extracts analysed. The acid solutions used for extraction were made from Analar grade stock acids, while the distilled water was doubled deionised. Standards for the atomic absorption analysis were obtained as the commercial BDH stock metal standards from which working standards were prepared by appropriate dilution. For other water quality parameters, the analytical data quality was ensured through careful standardization, procedural blank measurements and duplicate samples.
Conductivity and salinity were recorded with a HACH conductivity/salinity meter model CO150, dissolved oxygen was determined by the alkali-azide modification of Winkler’s technique, alkalinity was determined titrimetrically while nitrate was determined
colorimetrically using phenoldisulphonic acid method. Phosphate and sulphate were determined colorimetrically using ascorbic acid and turbidimetric methods respectively according to the standard method (APHA –AWWA,1998).
Data treatment and multivariate statistical methods
Duncan multiple range test of variable at p < 0.05 was used to ascertain statistical significance in the soil quality data. Multivariate analysis of the data was performed through Cluster Analysis (CA) and Principal Component Analysis (PCA). The distributions of metals within soil profile were represented by means of Box and Whisker Plots (Winderlin et al., 2001). All mathematical and statistical computations were made using Excel 2003 (Microsoft, 2003) and STATISTICA 6.0 (StatSoft, Inc., USA, 2001).
RESULTS AND DISCUSSION
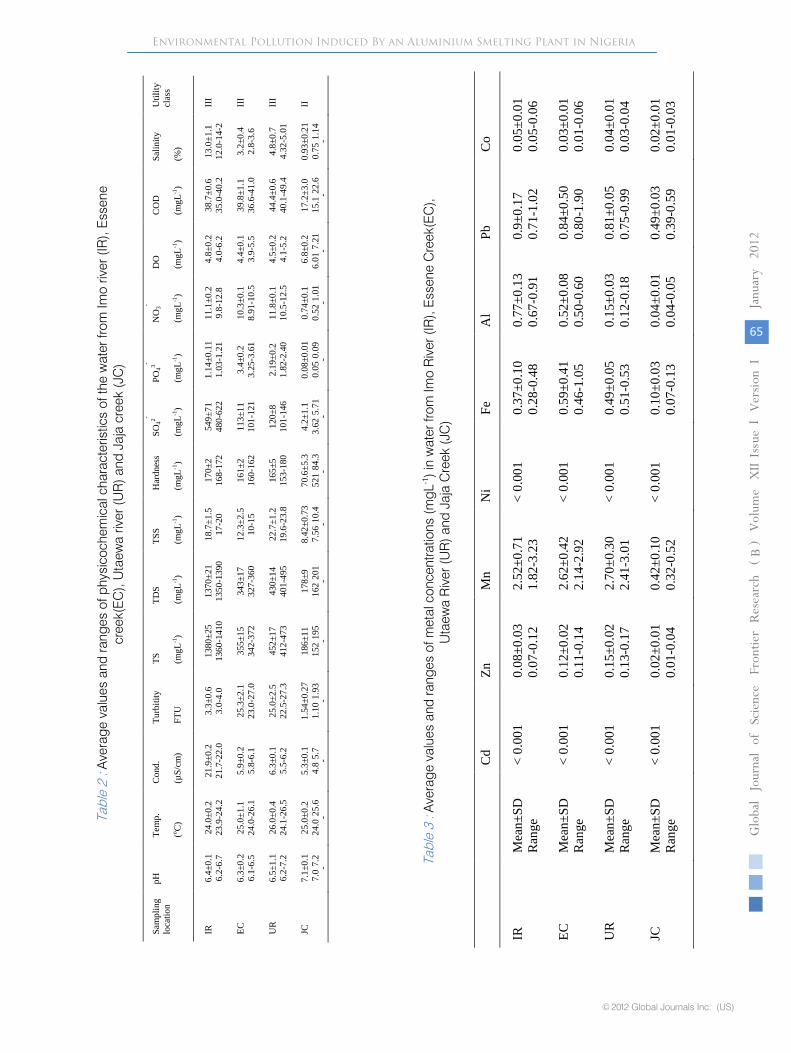
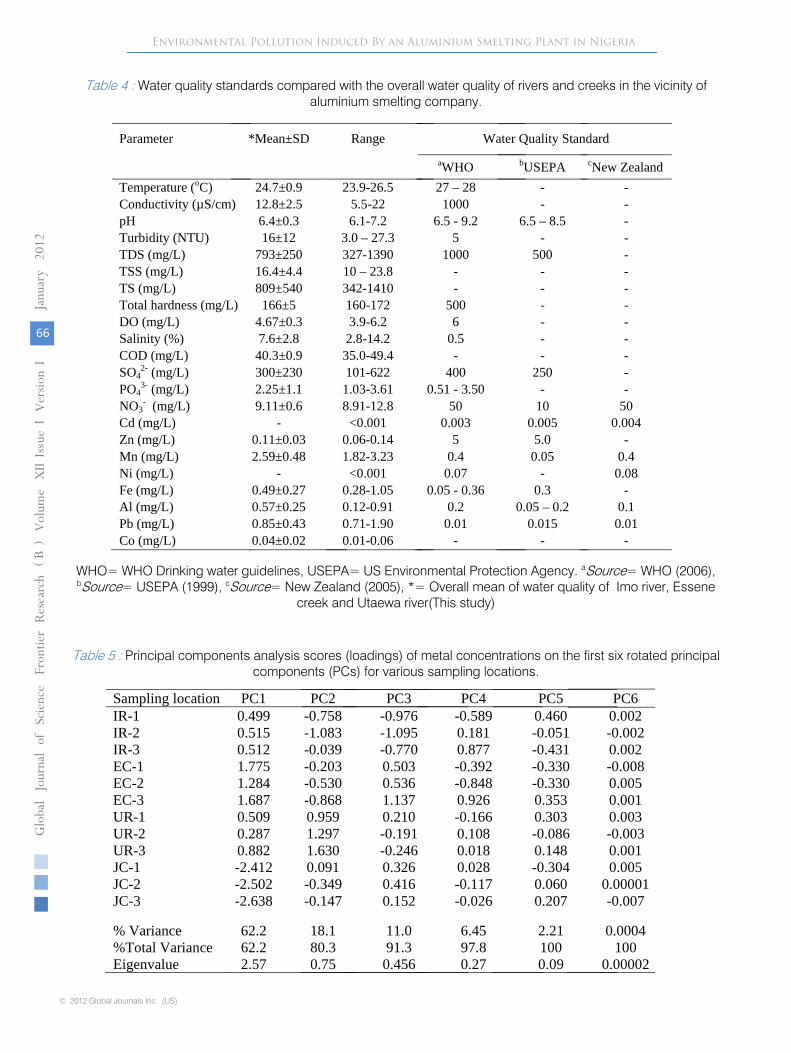
The results of the physicochemical parameters conducted on the water samples from the Imo, Utaewa Rivers, Essene Creek and Jaja Creek are summarized in Tables 2 and 3. Table 4 specifically gives the averages and ranges for parameters used to assess the suitability of these water bodies (Imo , Utaewa Rivers and Essene creek) around the smelting company for beneficial purposes such as drinking and industrial use. In all the sampled water bodies, the physicochemical parameters as shown in Table 4 were generally within the WHO and USEPA guidelines for drinking water with the exception of salinity, turbidity, TDS and few heavy metals (Mn, Fe, Al, and Pb).
The pH values of water from the Imo River, Utaewa River, Essene and Jaja Creeks were within the range of 6.1 and 7.2. Water from the rivers and creeks could be considered acidic since their average pH values were below 7.0. Water pH of 6.3±0.2 and 6.5±1.1 for Essene and Utaewa were the least and highest averages values (Table 2) and were significantly different from the average water pH of Jaja Creek at the control site. Acidification of water samples could have led to the release of loosely bonded ions present on the surface of suspended particle matter; thereby increasing the metal concentration in water samples. Essene Creek and Utaewa River revealed turbidity levels of 25.3±2.1 FTU and 25.0±2.5 FTU respectively, which were significantly higher than the WHO
limit of 5 FTU (Table 2). The TDS constituent of Imo River, when compared to the same constituent of Essene Creek and Utaewa
Environmental Pollution Induced By an Aluminium Smelting Plant in Nigeria
b)
c)
d)
III.
Rivers, was indeed higher by factors 3.99 and 3.19 respectively. Correspondingly, sulphate was higher by factors of 0.34 and 0.52 respectively. The average levels of TDS and sulphate for the Imo River water were 1370±21mg/L and 547±71 mg/L respectively (Table 2). High level of TDS is traceable to the impact of navigation on the river.
The average salinity for the Imo River was 13.0±1.1% while 3.2±0.4% and 4.8±0.7% were
Globa
lJo
urna
lof
Scienc
eFr
ontier
Resea
rch
V
olum
eXII
Issu
e er
sion
IV
I
60
Janu
ary
2012
B)
)
© 2012 Global Journals Inc. (US)
obtained for the Essene Creek and Utaewa River. These salinity levels were observed to exceed the limit of 0.5%, thus making the water toxic to sensitive freshwater life and not portable for human consumption. High salinity level indicates an increase in the concentration of total dissolved solids in water and can often be detected by an increase in the chloride, an important anion of many dissolved salts. A positive correlation coefficient (0.526) between TDS and salinity was observed. Increases in salinity up to 0.1 % (1,000mg/L) can have lethal and sub lethal effects on aquatic plants and invertebrates (Hart et al., 1991). The observed salinity levels for the Essene Creek, Imo and Utaewa Rivers are high enough to induce a variety of other effects within both aquatic and terrestrial ecosystems. These effects include acidification of the water bodies (Lofgren, 2001), mobilization of toxic metals through non-exchange (Norrstron and Bergstedt, 2001), changes in mortality and reproduction of aquatic plants and animals (Strayer and Smith, 1992; James et al., 2003; Eaton et al., 1999), altered community composition of plants (Eaton et al., 1999; Richburg et al, 2001; Elshahed et al., 2004). At relatively low concentration of salinity, salt has been shown to inhibit denitrification (Cunningham, et al., 2009, 2010; Kaushal, et al., 2005) a process critical for removing nitrate and maintaining water quality in surface waters. Increased salinity is an important ecological variable in explaining the extremely low abundance and diversity of freshwater life observed in the Imo and Utaewa Rivers.
The water quality monitoring data (Table 2) found its application in the classification of rivers into utility classes based on quality indices. Some water quality indices have been reported in different part of the world ( Pesce and Wunderlin, 2000; Simeonov et al., 2000). There is no water classification index established for Nigerian rivers and streams yet. However, the well utilized water index of Prati et al.
(1971) was applied to the data of this study using the parameters pH, turbidity, suspended solids, DO, BOD, and COD. The categories of classification ranged from Utility Class I to V which corresponds to excellent for drinking, irrigation and industrial use without treatment (Class I), suitable for drinking (Class II), slightly polluted (Class III), polluted (Class IV) and heavily polluted water which is not fit for any of these beneficial purposes (Class V). Based on the Prati scale, Imo River, Essene Creek and Utaewa River are categorized under Class III (Table 3) which is indicative of water not suitable for beneficial purposes such as drinking, irrigation and industrial use, but may be rigorously treated for use by private consumers. The classification showed that Jaja creek at the control site fell into Class II reflecting that its water sample is suitable as sources of municipal water supply.
The overall average concentrations of Mn, Fe, Al and Pb (Table 4) in surface waters studied
were higher than the WHO and USEPA limits and hence the waters portability are impaired for drinking. The only exception
was the zinc with concentration lower than the USEPA limit of 5.0 mg/L. The Imo River contained Mn, Fe and Al levels of 2.52±0.71 mg/L, 0.37±0.10 mg/L and 0.77±0.13 mg/L respectively. The respective corresponding concentrations in Essene Creek were 2.62±0.42 mg/L, 0.59±0.41mg/L and 0.52±0.08 mg/L while Utaewa River contained 2.70±0.30 mg/L, 0.49±0.05 mg/L and 0.15±0.03 mg/L respectively.
These metal concentrations that were above the limits may be attributed to deposits resulting from the company’s smelting activity. The Imo River (IR) and Essene Creek (EC) serve as water channels to ships bringing the raw materials for the company and other commercial activities. The discharge from exhausts of ships and speed boats using leaded fuels explains the high lead levels of 0.90±0.17mg/L and 0.84±0.50 mg/L in waters from the Imo River and Essene Creek. The high concentrations of aluminium with ranges of 0.67–0.91 mg/L and 0.50–0.60 mg/L for Imo River and Essene Creek (Table 3) are not unexpected as alumina (Al2O3) being the major raw material used in the company splits into water bodies occasionally during off-loading to the conveyor belt.
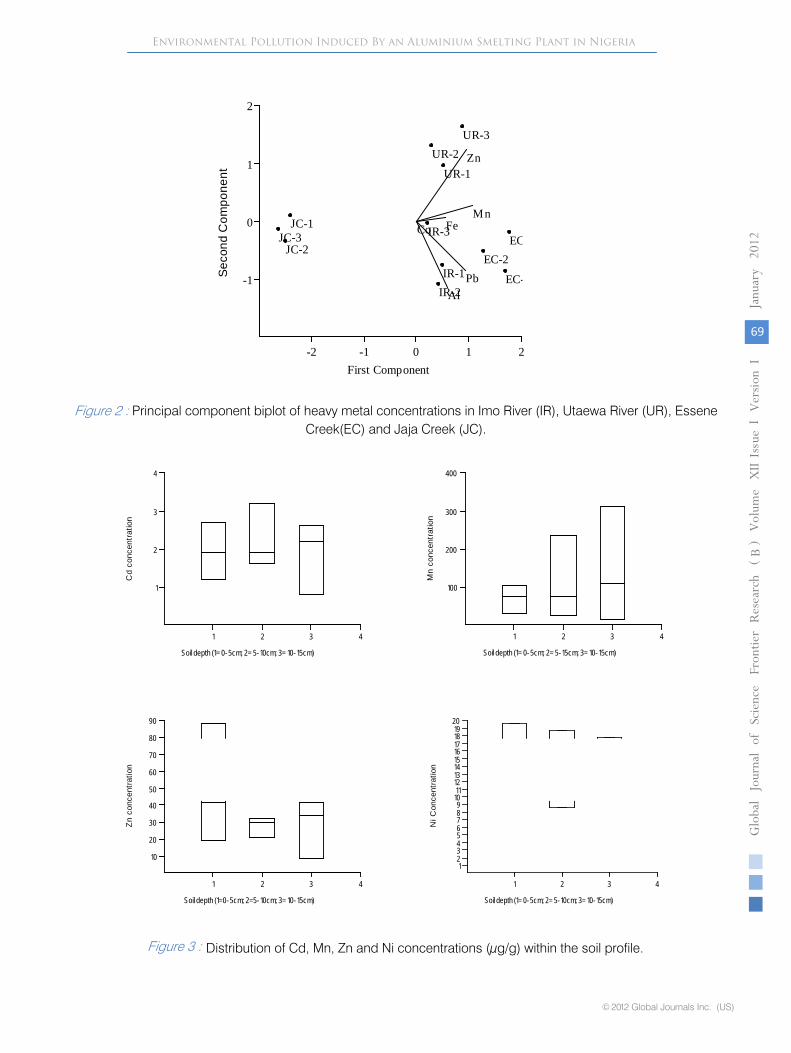
Principal Components (PC) analysis was performed on the standardized data matrix (Table 5) of metal concentrations in surface water samples. This is necessary to explain the structure of the underlying data set. The experimental data was standardized in order to
avoid mis-calculation due to wide differences in data dimensionality (Liu et al., 2003). Standardization tends to increase the influence of small variance and reduce of large ones. Furthermore, the standardization procedure eliminates the influence of different units of measurement and renders the data dimensionless (Benza-Deano et al., 2008). Liu et al.(2003) classified the factor loading as “strong”, “moderate”, and “weak” corresponding to absolute loading values of >0.75, 0.75-0.50 and 0.50-0.30 respectively. The first component (PC1) explained 62.2% of total variance (Table 5) and has strong and moderate positive metal loadings for water from Essene Creek (1.284-
1.687) and Imo River (0.499-0.515). Principal component biplot in Figure 2 indicates that Al, Pb, Co and Fe are associated with the strong and metal loadings in PC1.Essene Creek (EC) and Imo River (IR) sampling points that lie to the right of the origin on the first component axis and closer to the metal (Al, Pb, Co, and
Environmental Pollution Induced By an Aluminium Smelting Plant in Nigeria
Fe) vectors have the highest metal concentrations. The control sampling points (Jaja creek) that lie to the left of the origin and far from the metal vectors have the lowest metal concentrations. It was revealed in Figure 2 that Zn and Mn accounted for 18.1 % (as indicated by PC2) of total metal load of Utaewa River. The metal loading was strong with a range of 0.959- 1.630 (Table 5) and was an indication of water pollution arising from the fall out of scrap iron and aluminium bars during navigation.
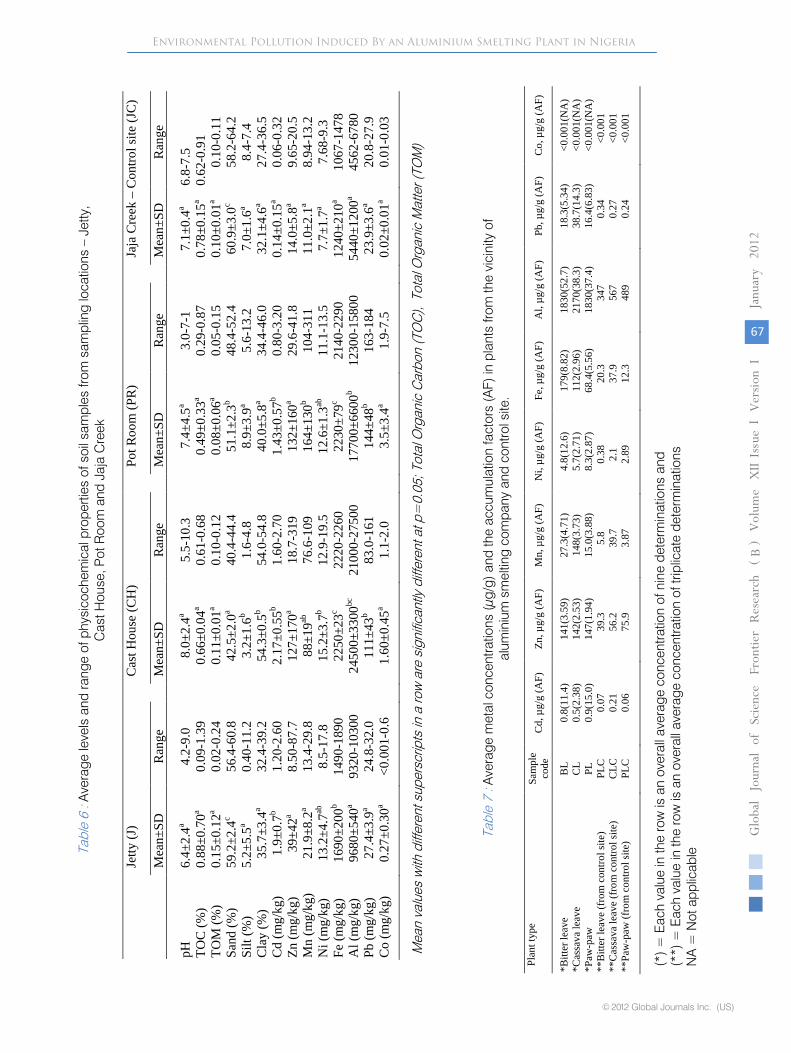
Table 6 shows that pH, total organic carbon (TOC),total organic matter (TOM), sand, silt and clay
Globa
lJo
u rna
lof
Scienc
eFr
ontier
Resea
rch
V
olum
eXII
Issu
e er
sion
IV
I
61
Jan u
ary
2012
B)
)
© 2012 Global Journals Inc. (US)
compositions of soil samples from Jetty, Cast House and Pot Room sampling points are not significantly different from the corresponding compositions of soil from the control site. Soil sample from the cast house where the smelted aluminium is processed into bars contains the highest aluminium level of 24500±3300 µg/g. The highest concentrations of Cd (2.17±0.55 µg/g), Zn (132±160 µg/g), Pb (144±48 µg/g) in the soil were above the corresponding levels of 0.125 µg/g (Cd), 59.8 µg/g (Zn), 8.62 µg/g (Pb) in smelting waste contaminated soil from Sierra Almagrera in Spain (Navarro et al., 2008). On the other hand, the highest concentrations of Ni(15.2±3.7 µg/g) and Co (3.5±3.4 µg/g) were far below levels of 119 µg/g (Ni) and 16.8 µg/g (Co) reported by Navarro et al.(2008).
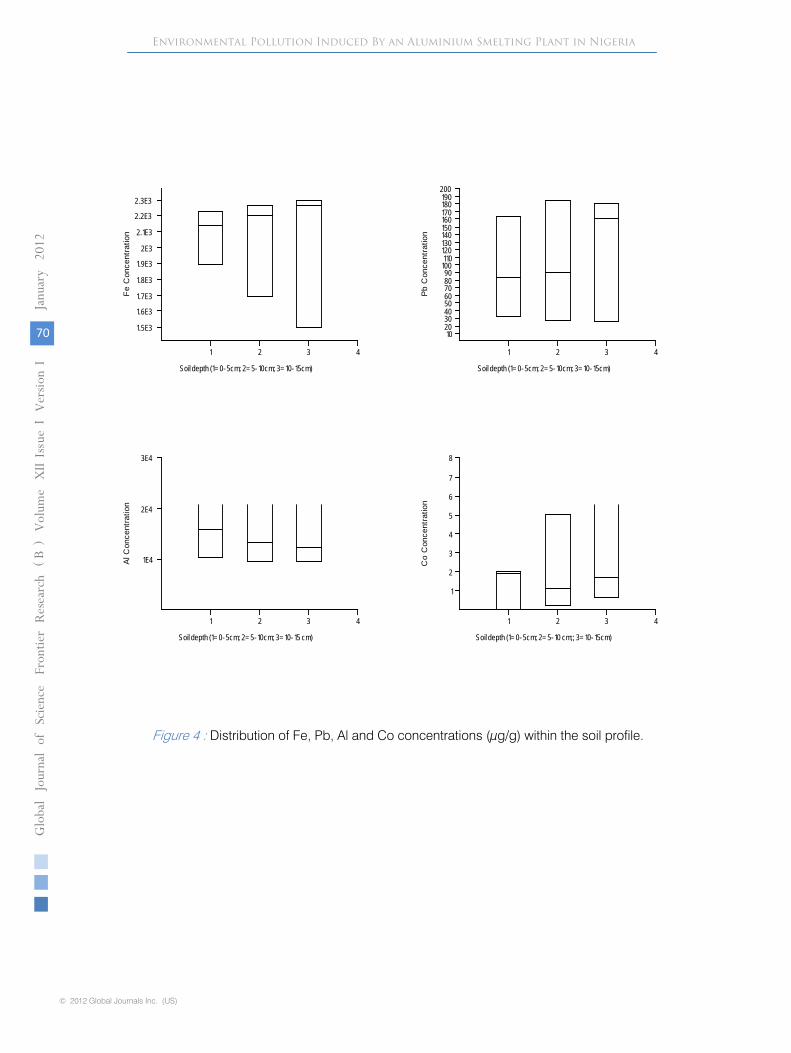
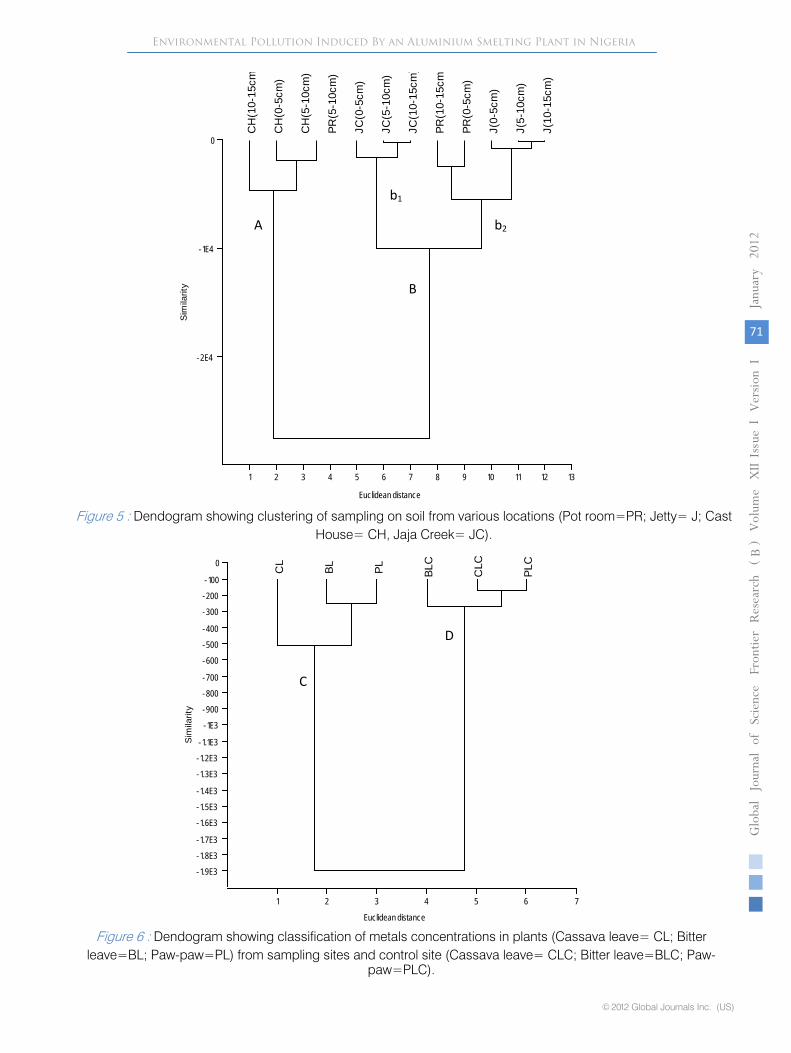
Box and Whisker plots in Figures 3 and 4 shows the distribution of Fe, Pb, Al, Co, Cd, Mn, Zn and Ni at various depths. The results indicate that Al and Zn are more abundant at 0-5cm soil depth than other metals suggesting that Al and Zn will be more readily available in soil for uptake by crops. The values for Cd, Mn, Fe and Co are highest at 10-15cm soil depth while Pb concentrations are nearly constant. The soil quality data was further subjected to cluster analysis to explore their temporal trend. A dendogram shown in Figure 5 grouped all the sampling points for soil samples into two main clusters (A and B). Cluster A includes majorly soil samples with the highest average aluminium concentration obtained from the Cast house, where bars are being packaged for export. The second cluster B includes the rest of the analyzed soil (samples from Jaja Creek, Pot Room and Jetty sites). The cluster was further divided into two sub-clusters (b1
and b2). Sub-cluster b1
includes the samples from Jaja Creek (control site) while sub-cluster b2
includes samples from the Pot room and Jetty sites. The sites in sub-cluster b2
have similar characteristics and natural sources types. This implies that the elemental composition of soil from the control site differs significantly from what obtained for Cast House, Pot Room and Jetty soil samples. Therefore, elevated metals concentrations in soil from Cast House, Pot Room and Jetty sites indicate soil contamination resulting from smelting activity around the sites.
Concentrations of metals investigated in crops and leaf samples are shown in Table 7. Crop samples contained lower metal concentrations than soil samples. Bitter leaf, a vegetable for common people, had the highest acumulation factors of 11.4 (Cd), 3.59 (Zn), 4.71 (Mn), 12.6 (Ni), 8.82 (Fe), 52.7 (Al). The highest accumlation factor of 14.3 for Pb was observed in cassava leaves. These accumulation factors reflect the generally high levels of metals and their degrees of contamination in the crops. Also, it is intresting to infer that bitter and cassava leaves can be used successfully as biomarkers for heavy metal pollution in soil. High aluminium concentration on the leaves is attributed to the atmospheric particulate deposition occurring around
the smelting area. Cluster analysis as shown in Figure 6 was able to distinguish between metal concentrations in crops from the contaminated sites and that from the control site. The classification indicates the aluminium smelter as the anthropogenic source of metal contamination for crops.
CONCLUSION
These findings revealed that smelting activities were the dominant source of contamination of Essene Creek, Imo and Utaewa Rivers which are major sources of drinking water for the community at a far distance downstream. There was an increasing evidence of metal pollution in Ikot Abasi soil and edible crops planted on it. Further research on air quality assessment of the area is necessary in drawing a better conclusion on the overall effect of the aluminium smelting on environments of Ikot Abasi.
ACKNOWLEDGEMENTS
The authors would like to acknowledge Ikot Abasi Local Government Area for giving permission to collect samples in the area and the technical assistance given by Mrs. Iniobong Ogbonna.
1.
Aittola, J-P, Paasivirta J, Vattulainen A. (1993), “Measurements of organochloro compounds at a metal reclamation plant”, Chemosphere,
Vol. 27, pp 65–72.
2.
APHA .1998. Standard methods for the examination of water and wastewater. 20th ed. Washington D.C.: American Water Works Association/Water Environment Federation.
3.
Biafra Nigeria World News (BNW News). 2004. Who takes over the Aluminium Smelter Company of Nigeria? http://news.biafranigeriaworld.com/archive/2004/aug/09/201.html., (retrieved January, 2011)
4.
Bouza-Deaño, R., Ternero-Rodriguez, M. and Fernandez-Espinosa, A. J. (2008), “Trend study and assessment of surface water quality in the Ebro
Environmental Pollution Induced By an Aluminium Smelting Plant in Nigeria
IV.
REFERENCES RÉFÉRENCES REFERENCIAS
River (Spain)”, Journal of Hydrology, Vol. 361, pp 227-239.
5. Cunningham M. A., Menking, K. M., David P. Gillikin, D. P., Smith, K. C., Freimuth, C. P., Belli, S. L., Pregnall, A. M., Schlessman, M. A., and Batur, P. (2010), “Influence of open space on water quality in an urban stream”, Physical Geography, Vol. 31, No. 4, pp 336-356.
6. Cunningham, M. A., O'Reilly, C. M., Menking, K. M., Gillikin, D. P., Smith, K. C., Foley, C. M., Belli, S. L., Pregnall, A. M., Schlessman, M. A. and Batur, P. (2009), “The suburban stream syndrome: evaluating land use and stream impairments in the suburbs”, Physical Geography, Vol. 30, No. 3, pp 269-284.
7. Eaton, L. J., Hoyle, J. and King, A. (1999), “Effects
Globa
lJo
urna
lof
Scienc
eFr
ontier
Resea
rch
V
olum
eXII
Issu
e er
sion
IV
I
62
Janu
ary
2012
B)
)
© 2012 Global Journals Inc. (US)
of deicing salt on lowbush blueberry flowering and yield”, Canadian Journal of Plant Science,
Vol. 79, No. 1, pp 125-128.
8.
Ellis, D. V.
(1987), “A decade of environmental impact assessment of marine and coastal mines” Marine mining,
Vol. 6, pp 355-417.
9.
Elshahed, M. S., Najar, F. Z., Roe, B. A., Oren, A., Dewers, T. A. and Krumholz, L. R. (2004), “Survey of archaeal diversity reveals an abundance of halophilic archaea in a low-salt, sulfide-
and sulfur-rich spring”, Applied and Environmental Microbiology,
Vol. 70, pp 2230-2239
10.
Hart, B. T., Bailey, P., Edwards, R., Hortle, K., James, K., McMahon, A., Meredith, C and Swadling, K. (1991), “A review of the salt sensitivity of the Astralian freshwater biota”, Hydrobiologia,
Vol. 210, pp 105-144.
11.
Healy, J., Bradley, S. D., Northage, C. and Scobbie, E. (2001), “Inhalation exposure in secondary aluminium smelting”, Annals of Occupational Hygiene, Vol.45, No. 3, pp 217−225
12.
James, K., Cant, B. and Ryan, T. (2003), “Responses of freshwater biota to rising salinity levels and implications for saline water management”, Australian Journal of Botany,
Vol. 51, pp 703-713.
13.
Kaushal, S. S., Groffman, P. M., Likens, G. E., Belt, K. T., Stack, W. P., Kelly, V. R., Band, L. E., and Fisher, G. T. (2005). “Increased salinization of fresh water in the northeastern United States”, Proceedings of the National Academy of Sciences of the United States of America, Vol. 102, No. 38, pp 13517-13520
14.
Kozanoglou, C. and Catsiki, V. A. (1997), “ Impact of products of a ferronickel smelting plant to the marine benthic life”, Chemoshere,
Vol. 34, No.12, pp 2673−2682
15.
Laue, G., Herrmann D, Mo¨der M, Herzschuh R. (1994), “Analysis of slags and filter dusts from aluminium recycling processes”, Chemosphere,
Vol. 29, pp 1947–56.
16.
Liu, C. W., Lin, K. H. and Kuo, Y. M. (2003), “Application of factor analysis in the assessment of groundwater quality in a blackfoot disease area in Taiwan”, Science Total Environmental,
Vol. 313, pp 77-89
17.
Lofgren, S. (2001), “The chemical effects of deicing salt on soil and stream water of five catchments in southeast Sweden”, Water, Air, and Soil Pollution, Vol. 130, pp 863-868.
18.
Malea, P. and Haritonidis, S. (1995), “Local distribution and seasonal variation of Fe, Pb, Zn, Cu, Cd, Na, K, Ca and Mg concentrations in the seagrass Cymodocea nodosa (Ucria) Asehers in the Antikyra Gulf, Greece”, Marine Ecology,
Vol. 16, No. 1 pp 41-56.
19.
Navarro, A., Cardellach, E., Mendoza, J.L., Corbella, M. and Domènech, L. M. (2008), “Metal mobilization
from base-metal smelting slag dumps in Sierra Almagrera (Almería, Spain)”, Applied Geochemistry,
Vol. 23, No. 4 pp 895–913.
20.
Norrstrom, A.-C. and E. Bergstedt. (2001), “The impact of road de-icing salts (NaCl) on colloid dispersion and base cation pools in roadside soils”, Water, Air, and Soil Pollution, Vol. 127, No. 1-4 pp 281-299.
21.
Pesce, S. F. and Wunderlin, D. A. (2000), “Use of water indices to verify the impact of Cordoba City (Argentina) on Suquia River”, Water Research,
Vol. 34, No. 11 pp 2915-2926.
22.
Prati, L., Pavanello, R. and Pesarin, F. (1971), “ Assessment of surface water quality by a single index of pollution”, Water Resources,
Vol. 5, p 741.
23.
Proceeding of the National Academy of Sciences of the United States of America U S A. (2005), September 20; Vol. 102, No. 38, pp 13517–13520.
24.
Richburg, J.A., Patterson III, W.A. and Lowenstein, F. (2001), “Effects of road salt and Phragmites australis
invasion on the vegetation of a western Massachusetts calcareous lake-basin fen”, Wetlands
Vol. 21, No. 2, pp 247-255
25.
Simeonov, V., Stefanov, S. and Tsakovki, S. (2000), “Environmentrical treatment of water quality survey data from Yantra River, Bulgaria”, Mikrochima Acta,
Vol. 134, No. 1-2, pp 15-21.
26.
Sinkkonen, S., Vattulainen, A., Aittola, J-P., Paasivirta, J., Tarhanen J and Lahtipera, M. (1994), “Metal reclamation produces sulphur analogues of toxic dioxins and furans”, Chemosphere,
Vol. 28, pp 1279–88.
27.
Sokal, R. R. and Rolf, F. J. (1981), “Biometry: The Principle and Practice of Statistics in Biological Research”, 2nd ed. New York: W. H. Freeman Company.
28.
Strayer, D. L., and L. C. Smith. (1993), “Distribution of the zebra mussel (Dreissena polymorpha) in estuaries and brackish waters”, In: Nalepa, T. F. and Schloesser, D. W. (eds.). “Zebra
Environmental Pollution Induced By an Aluminium Smelting Plant in Nigeria
Mussels: Biology, Impacts, and Control”, Lewis Publishers, Boca Raton, Florida. pp. 715-727.
29. The International Aluminium Institute (IAI). (2000), http://www.worldaluminium.org/production/smelting/index.html.,(retrieved December, 2010).
30. United State Environmental Protection (USEPA) (1999), National recommended water quality criteria-correction: EPA 822/Z-99-001. Washington, DC.
31. Vukadin, I. and Odzak, N. (1991), “ Fate and distribution of chromium in waters, sediment and mussels of the Kastela Bay”, UNEP, 1991. MAP Technical Reports Series No. 59.
32. Wei Y-L. (1996), “Distribution study of priority pollutant PAHs from a laboratory aluminium-can chip smelting furnace”, Journal of Hazardous Materials, Vol. 49, pp267–80.
33. Westberg H, Selden A. (1997), “Emissions of some
Globa
lJo
u rna
lof
Scienc
eFr
ontier
Resea
rch
V
olum
eXII
Issu
e er
sion
IV
I
63
Jan u
ary
2012
B)
)
© 2012 Global Journals Inc. (US)
organochlorine compounds in experimental aluminium degassing with hexachloroethane”, Applied Occupational and Environmental Hygiene,
Vol. 12, pp 178–83.
34.
WHO. (2006), Guidelines for drinking-water quality, 3rd ed. Retrieved Nov. 12th, 2008, from http://www.who.int/water_sanitation_health/dwq/gdwq3rev/en/index.html.
35.
Winderlin, D. A., Diaz, M. P., Ame, M. V., Pesce, S. F., Hued, A. C. and Bistoni, M. A. (2001), “Pattern
recognition techniques for the evaluation of spatial and temporal variations in water quality. A case study: Suquia river basin (Cordoba-Argentina)”, Water Research,
Vol. 35, pp 2881-2894.
36.
World Bank.
(2009). The aluminum industry in West and Central Africa. Extractive industries and development series No. 13. http://siteresources.
worldbank.org/EXTOGMC/Resources/3369291266963339030/eifd13_wa_aluminum.pdf.,(retrieved January, 2011)
Environmental Pollution Induced By an Aluminium Smelting Plant in Nigeria
Sampling loca-tion
Sample code
Location description Sample collected
Pot Room PR Located North-East (NE) of the company with respect to the main gate. It covers a wide expanse of land up to 6 hectares. The location (PR) shares the same fence with the facility where the alumina is smelted in pots. Hence the name ‘pot room’.
Soil and plant
Jetty J This is the North of the company with respect to the gate. It is mid-point far from the PR and Cast House.
Soil and plants
Cast House CH Located North-West of the company with respect to the maingate. The cast house is where the smelted aluminium is cast
into ingots (bars) ready for export. The sampling site shares thesame fence with the Cast House.
Soil and plants
Imo River IR This is located south of the company with respect to the gate. It isthe water that host the harbour where raw material arrives and
finished product leaves.
Water
Essene Creek EC It is a major tributary of IR that borders the company at the far south-west. It is closer to the CH than any other facility of the company.
Water
Utaewa River UT The river borders the company at the far South-east (SE). It is closerto the PR and the power plant of the company than any other facilityof the company.
Water
Jaja Creek (Control site)
JC It was the reference site situated at 1 km upstream of Essene Creek. It is a drainage stream located North of the company
Water, soil and plants
Table 1 : Description of sampling locations, sample code and type of sample collected
Globa
lJo
urna
lof
Scienc
eFr
ontier
Resea
rch
V
olum
eXII
Issu
e er
sion
IV
I
64
Janu
ary
2012
B)
)
© 2012 Global Journals Inc. (US)
Environmental Pollution Induced By an Aluminium Smelting Plant in Nigeria
Sam
plin
glo
catio
npH
Tem
p.C
ond.
Turb
itity
TSTD
STS
SH
ardn
ess
SO42-
PO43-
NO
3-
DO
CO
DSa
l inity
Util
ity
clas
s(o C
)(µ
S/cm
)FT
U(m
gL-1
)(m
gL-1
)(m
gL-1
)(m
gL-1
)(m
gL-1
)(m
gL-1
)(m
gL-1
)(m
gL-1
)(m
gL-1
)(%
)
IR6.
4±0.
124
.0±0
.221
.9±0
.23.
3±0.
613
80±2
513
70±2
118
.7±1
.517
0±2
549±
711.
14±0
.11
11.1
±0.2
4.8±
0.2
38.7
±0.6
13.0
±1.1
III
6.2-
6.7
23.9
-24.
221
.7-2
2.0
3.0-
4.0
1360
-141
013
50-1
390
17-2
016
8-17
248
0-62
21.
03-1
.21
9.8-
12.8
4.0-
6.2
35.0
-40.
212
.0-1
4-2
EC6.
3±0.
225
.0±1
.15.
9±0.
225
.3±2
.135
5±15
343±
1712
.3±2
.516
1±2
113±
113.
4±0.
210
.3±0
.14.
4±0.
139
.8±1
.13.
2±0.
4II
I6.
1-6.
524
.0-2
6.1
5.8-
6.1
23.0
-27.
034
2-37
232
7-36
010
-15
160-
162
101-
121
3.25
-3.6
18.
91-1
0.5
3.9-
5.5
36.6
-41.
02.
8-3.
6
UR
6.5±
1.1
26.0
±0.4
6.3±
0.1
25.0
±2.5
452±
1743
0±14
22.7
±1.2
165±
512
0±8
2.19
±0.2
11.8
±0.1
4.5±
0.2
44.4
±0.6
4.8±
0.7
III
6.2-
7.2
24.1
-26.
55.
5-6.
222
.5-2
7.3
412-
473
401-
495
19.6
-23.
815
3-18
010
1-14
61.
82-2
.40
10.5
-12.
54.
1-5.
240
.1-4
9.4
4.32
-5.0
1
JC7.
1±0.
125
.0±0
.25.
3±0.
11.
54±0
.27
186±
1117
8±9
8.42
±0.7
370
.6±5
.34.
2±1.
10.
08±0
.01
0.74
±0.1
6.8±
0.2
17.2
±3.0
0.93
±0.2
1II
7.0 -7.
224
.0-25
.64.
8 -5.7
1.10
-1.93
152 -19
516
2 -201
7.56
-10.4
521 -84
.33.
62-5.
710.
05-0.
090.
52-1.
016.
01-7.
2115
.1-22
.60.
75-1.
14
Tabl
e 2
: Ave
rage
val
ues
and
rang
es o
f phy
sico
chem
ical
cha
ract
eris
tics
of th
e w
ater
from
Imo
river
(IR
), E
ssen
e cr
eek(
EC
), U
taew
a riv
er (U
R) a
nd J
aja
cree
k (J
C)
Cd
ZnM
nN
iFe
Al
PbC
o
IRM
ean±
SD<
0.00
10.
08±0
.03
2.52
±0.7
1<
0.00
10.
37±0
.10
0.77
±0.1
30.
9±0.
170.
05±0
.01
Ra n
ge0.
07-0
.12
1.82
-3.2
30.
28-0
.48
0.67
-0.9
10.
71-1
.02
0.05
-0.0
6
ECM
ean±
SD<
0.00
10.
12±0
.02
2.62
±0.4
2<
0.00
10.
59±0
.41
0.52
±0.0
80.
84±0
.50
0.03
±0.0
1R
ange
0.11
-0.1
42.
14-2
.92
0.46
-1.0
50.
50-0
.60
0.80
-1.9
00.
01-0
.06
UR
Mea
n±SD
< 0.
001
0.15
±0.0
22.
70±0
.30
< 0.
001
0.49
±0.0
50.
15±0
.03
0.81
±0.0
50.
04±0
.01
Ran
ge0.
13-0
.17
2.41
-3.0
10.
51-0
.53
0.12
-0.1
80.
75-0
.99
0.03
-0.0
4
JCM
ean±
SD<
0.00
10.
02±0
.01
0.42
±0.1
0<
0.00
10.
10±0
.03
0.04
±0.0
10.
49±0
.03
0.02
±0.0
1R
ange
0.01
-0.0
40.
32-0
.52
0.07
-0.1
30.
04-0
.05
0.39
-0.5
90.
01-0
.03
Tabl
e 3
: Ave
rage
val
ues
and
rang
es o
f met
al c
once
ntra
tions
(mgL
-1) i
n w
ater
from
Imo
Riv
er (I
R),
Ess
ene
Cre
ek(E
C),
Uta
ewa
Riv
er (U
R) a
nd J
aja
Cre
ek (J
C)
Globa
lJo
u rna
lof
Scienc
eFr
ontier
Resea
rch
V
olum
eXII
Issu
e er
sion
IV
I
65
Jan u
ary
2012
B)
)
© 2012 Global Journals Inc. (US)
Environmental Pollution Induced By an Aluminium Smelting Plant in Nigeria
Parameter *Mean±SD Range Water Quality Standard
aWHO bUSEPA cNew Zealand Temperature (oC) 24.7±0.9 23.9-26.5 27 – 28 - -Conductivity (µS/cm) 12.8±2.5 5.5-22 1000 - -pH 6.4±0.3 6.1-7.2 6.5 - 9.2 6.5 – 8.5 -Turbidity (NTU) 16±12 3.0 – 27.3 5 - -TDS (mg/L) 793±250 327-1390 1000 500 -TSS (mg/L) 16.4±4.4 10 – 23.8 - - -TS (mg/L) 809±540 342-1410 - - -Total hardness (mg/L) 166±5 160-172 500 - -DO (mg/L) 4.67±0.3 3.9-6.2 6 - -Salinity (%) 7.6±2.8 2.8-14.2 0.5 - -COD (mg/L) 40.3±0.9 35.0-49.4 - - -SO4
2- (mg/L) 300±230 101-622 400 250 -PO4
3- (mg/L) 2.25±1.1 1.03-3.61 0.51 - 3.50 - -NO3
- (mg/L) 9.11±0.6 8.91-12.8 50 10 50Cd (mg/L) - <0.001 0.003 0.005 0.004Zn (mg/L) 0.11±0.03 0.06-0.14 5 5.0 -Mn (mg/L) 2.59±0.48 1.82-3.23 0.4 0.05 0.4Ni (mg/L) - <0.001 0.07 - 0.08Fe (mg/L) 0.49±0.27 0.28-1.05 0.05 - 0.36 0.3 -Al (mg/L) 0.57±0.25 0.12-0.91 0.2 0.05 – 0.2 0.1Pb (mg/L) 0.85±0.43 0.71-1.90 0.01 0.015 0.01Co (mg/L) 0.04±0.02 0.01-0.06 - - -
Table 4 : Water quality standards compared with the overall water quality of rivers and creeks in the vicinity of aluminium smelting company.
WHO= WHO Drinking water guidelines, USEPA= US Environmental Protection Agency. aSource= WHO (2006), bSource= USEPA (1999), cSource= New Zealand (2005), *= Overall mean of water quality of Imo river, Essene
creek and Utaewa river(This study)
Sampling location PC1 PC2 PC3 PC4 PC5 PC6IR-1 0.499 -0.758 -0.976 -0.589 0.460 0.002IR-2 0.515 -1.083 -1.095 0.181 -0.051 -0.002IR-3 0.512 -0.039 -0.770 0.877 -0.431 0.002EC-1 1.775 -0.203 0.503 -0.392 -0.330 -0.008EC-2 1.284 -0.530 0.536 -0.848 -0.330 0.005EC-3 1.687 -0.868 1.137 0.926 0.353 0.001UR-1 0.509 0.959 0.210 -0.166 0.303 0.003UR-2 0.287 1.297 -0.191 0.108 -0.086 -0.003UR-3 0.882 1.630 -0.246 0.018 0.148 0.001JC-1 -2.412 0.091 0.326 0.028 -0.304 0.005JC-2 -2.502 -0.349 0.416 -0.117 0.060 0.00001JC-3 -2.638 -0.147 0.152 -0.026 0.207 -0.007
% Variance 62.2 18.1 11.0 6.45 2.21 0.0004%Total Variance 62.2 80.3 91.3 97.8 100 100Eigenvalue 2.57 0.75 0.456 0.27 0.09 0.00002
Table 5 : Principal components analysis scores (loadings) of metal concentrations on the first six rotated principal components (PCs) for various sampling locations.
Globa
lJo
urna
lof
Scienc
eFr
ontier
Resea
rch
V
olum
eXII
Issu
e er
sion
IV
I
66
Janu
ary
2012
B)
)
© 2012 Global Journals Inc. (US)
Environmental Pollution Induced By an Aluminium Smelting Plant in Nigeria
Jetty
(J)
Cas
t Hou
se (C
H)
Pot R
oom
(PR
)Ja
ja C
reek
–C
ontro
l site
(JC
)
Mea
n ±SD
Ran
geM
ean±
SDR
ange
Mea
n±SD
Ran
geM
ean±
SDR
ange
pH6.
4±2.
4a4.
2-9.
08.
0±2.
4a5.
5-10
.37.
4±4.
5a3.
0-7-
17.
1±0.
4a6.
8-7.
5TO
C (%
)0.
88±0
.70a
0.09
-1. 3
90.
66±0
.04a
0.61
-0. 6
80.
49±0
.33a
0.29
-0. 8
70.
78±0
.15a
0.62
-0. 9
1TO
M (%
)0.
15±0
.12a
0.02
-0.2
40.
11±0
.01a
0.10
-0.1
20.
08±0
.06a
0.05
-0.1
50.
10±0
.01a
0.10
-0.1
1Sa
nd (%
)59
.2±2
.4c
56.4
-60.
842
.5±2
.0a
40.4
-44.
451
.1±2
.3b
48.4
-52.
460
.9±3
.0c
58.2
-64.
2Si
lt (%
)5.
2±5.
5a0.
40-1
1.2
3.2±
1.6b
1.6-
4.8
8.9±
3.9a
5.6-
13.2
7.0±
1.6a
8.4-
7.4
Cla
y (%
)35
.7±3
.4a
32.4
-39.
254
.3±0
.5b
54.0
-54.
840
.0±5
.8a
34.4
-46.
032
.1±4
.6a
27.4
-36.
5C
d (m
g/kg
)1.
9±0.
7b1.
20-2
.60
2.17
±0.5
5b1.
60-2
.70
1.43
±0.5
7b0.
80-3
.20
0.14
±0.1
5a0.
06-0
.32
Zn (m
g/kg
)39
±42a
8.50
-87.
712
7±17
0a18
. 7-3
1913
2±16
0a29
. 6-4
1.8
14.0
±5.8
a9.
65-2
0.5
Mn
(mg/
kg)
21.9
±8.2
a13
. 4-2
9.8
88±1
9ab76
. 6-1
0916
4±13
0b10
4 -31
111
.0±2
.1a
8.94
-13.
2N
i (m
g/kg
)13
.2±4
.7ab
8.5-
17.8
15.2
±3.7
b12
.9-1
9.5
12.6
±1.3
ab11
.1-1
3.5
7.7±
1.7a
7.68
-9.3
Fe (m
g/kg
)16
90±2
00b
1490
-189
022
50±2
3c22
20-2
260
2230
±79c
2140
-229
012
40±2
10a
1067
-147
8A
l (m
g/kg
)96
80±5
40a
9320
-10 3
0024
500±
3300
bc21
000-
2750
017
700±
6600
b12
300-
1580
054
40±1
200a
4562
-67 8
0Pb
(mg/
kg)
27.4
±3.9
a24
.8-3
2.0
111±
43b
83.0
-161
144±
48b
163-
184
23.9
±3.6
a20
.8-2
7.9
Co
(mg/
kg)
0.27
±0.3
0a<0
. 001
-0.6
1.60
±0.4
5a1.
1-2.
03.
5±3.
4a1.
9-7.
50.
02±0
.01a
0.01
-0. 0
3
Tabl
e 6
: Ave
rage
leve
ls a
nd ra
nge
of p
hysi
coch
emic
al p
rope
rties
of s
oil s
ampl
es fr
om s
ampl
ing
loca
tions
–Je
tty,
Cas
t Hou
se, P
ot R
oom
and
Jaj
a C
reek
Mea
n va
lues
with
diff
eren
t sup
ersc
ripts
in a
row
are
sig
nific
antly
diff
eren
t at p
=0.
05; T
otal
Org
anic
Car
bon
(TO
C),
Tota
l Org
anic
Mat
ter (
TOM
)
Plan
t typ
eSa
mpl
e co
deC
d, µ
g/g
(AF)
Zn,µ
g/g
(AF)
Mn,
µg/g
(AF)
Ni,
µg/g
(AF)
Fe,µ
g/g
(AF)
Al,
µg/g
(AF)
Pb,µ
g/g
(AF)
Co,
µg/g
(AF)
*Bitt
er le
ave
BL
0.8(
11.4
)14
1(3.
59)
27.3
(4.7
1)4.
8(12
.6)
179(
8.82
)18
30(5
2.7)
18.3
(5.3
4)<0
.001
(NA
)*C
assa
va le
ave
CL
0.5(
2.38
)14
2(2.
53)
148(
3.73
)5.
7(2.
71)
112(
2.96
)21
70(3
8.3)
38.7
(14.
3)<0
.001
(NA
)*P
aw-p
awPL
0.9(
15.0
)14
7(1.
94)
15.0
(3.8
8)8.
3(2.
87)
68.4
(5.5
6)18
30(3
7.4)
16.4
(6.8
3)<0
.001
(NA
)**
Bitt
er le
ave
(fro
m c
ontro
l site
)PL
C0.
0739
.35.
80.
3820
.334
70.
34<0
.001
**C
assa
va le
ave
(fro
m c
ontro
l site
)C
LC0.
2156
.239
.72.
137
.956
70.
27<0
.001
**Pa
w-p
aw (f
rom
con
trol s
ite)
PLC
0.06
75.9
3.87
2.89
12.3
489
0.24
<0.0
01
Tabl
e 7
: Ave
rage
met
al c
once
ntra
tions
(µg/
g) a
nd th
e ac
cum
ulat
ion
fact
ors
(AF)
in p
lant
s fro
m th
e vi
cini
ty o
f al
umin
ium
sm
eltin
g co
mpa
ny a
nd c
ontro
l site
.
(*) =
Eac
h va
lue
in th
e ro
w is
an
over
all a
vera
ge c
once
ntra
tion
of n
ine
dete
rmin
atio
ns a
nd(*
*) =
Eac
h va
lue
in th
e ro
w is
an
over
all a
vera
ge c
once
ntra
tion
of tr
iplic
ate
dete
rmin
atio
nsN
A =
Not
app
licab
le
Globa
lJo
u rna
lof
Scienc
eFr
ontier
Resea
rch
V
olum
eXII
Issu
e er
sion
IV
I
67
Jan u
ary
2012
B)
)
© 2012 Global Journals Inc. (US)
Environmental Pollution Induced By an Aluminium Smelting Plant in Nigeria
Fig u
re 1
: Ma p
of t
he s
tudy
are
a sh
owin
g th
e va
rious
sam
plin
g lo
catio
ns
Globa
lJo
urna
lof
Scienc
eFr
ontier
Resea
rch
V
olum
eXII
Issu
e er
sion
IV
I
68
Janu
ary
2012
B)
)
© 2012 Global Journals Inc. (US)
Zn
MnFe
AlPb
Co
IR-1IR-2
IR-3EC-1
EC-2
EC-3
UR-1
UR-2UR-3
JC-1
JC-2JC-3
-2 -1 0 1 2First Component
-1
0
1
2
Sec
o nd
Com
pone
nt
Environmental Pollution Induced By an Aluminium Smelting Plant in Nigeria
Figure 2 : Principal component biplot of heavy metal concentrations in Imo River (IR), Utaewa River (UR), Essene Creek(EC) and Jaja Creek (JC).
1 2 3 4
Soil depth (1= 0-5cm; 2= 5-15cm; 3= 10-15cm)
100
200
300
400
Mn
conc
entr
atio
n
1 2 3 4
Soil depth (1=0-5cm; 2=5-10cm; 3= 10-15cm)
10
20
30
40
50
60
70
80
90
Zn
conc
entr
atio
n
1 2 3 4
Soil depth (1= 0-5cm; 2= 5-10cm; 3= 10-15cm)
123456789
1011
1213141516171819
20
Ni C
once
ntra
tion
1 2 3 4
Soil depth (1= 0-5cm; 2= 5-10cm; 3= 10-15cm)
1
2
3
4
Cd
con c
e ntr
atio
n
Distribution of Cd, Mn, Zn and Ni concentrations (µg/g) within the soil profile.Figure 3 :
Globa
lJo
u rna
lof
Scienc
eFr
ontier
Resea
rch
V
olum
eXII
Issu
e er
sion
IV
I
69
Jan u
ary
2012
B)
)
© 2012 Global Journals Inc. (US)
Environmental Pollution Induced By an Aluminium Smelting Plant in Nigeria
1 2 3 4
Soil depth (1= 0-5cm; 2= 5-10cm; 3= 10-15cm)
1.5E3
1.6E3
1.7E3
1.8E3
1.9E3
2E3
2.1E3
2.2E3
2.3E3
Fe
Con
cent
ratio
n
1 2 3 4
Soil depth (1= 0-5cm; 2= 5-10cm; 3= 10-15cm)
102030405060708090
100110
120130140150160170180190
200
Pb
Con
cent
ratio
n
1 2 3 4
Soil depth (1= 0-5cm; 2= 5-10cm; 3= 10-15 cm)
1E4
2E4
3E4
Al C
once
ntra
tion
1 2 3 4
Soil depth (1= 0-5cm; 2= 5-10 cm;; 3= 10-15cm)
1
2
3
4
5
6
7
8
Co
Con
cent
ratio
n
Figure 4 : Distribution of Fe, Pb, Al and Co concentrations (µg/g) within the soil profile.
Globa
lJo
urna
lof
Scienc
eFr
ontier
Resea
rch
V
olum
eXII
Issu
e er
sion
IV
I
70
Janu
ary
2012
B)
)
© 2012 Global Journals Inc. (US)
Environmental Pollution Induced By an Aluminium Smelting Plant in Nigeria
1 2 3 4 5 6 7 8 9 10 11 12 13
Euclidean distance
-2E4
-1E4
0
Sim
ilarit
y
CH
( 10-
15cm
CH
(0-5
cm)
CH
(5-1
0cm
)
PR(5
-10c
m)
JC(0
-5cm
)
JC(5
-10c
m)
JC(1
0-15
cm)
PR(1
0-15
cm
PR(0
-5cm
)
J(0-
5cm
)
J(5-
10cm
)
J(10
-15c
m)
A
b1
B
b2
Figure 5 : Dendogram showing clustering of sampling on soil from various locations (Pot room=PR; Jetty= J; Cast House= CH, Jaja Creek= JC).
1 2 3 4 5 6 7
Euclidean distance
-1.9E3
-1.8E3
-1.7E3
-1.6E3
-1.5E3
-1.4E3
-1.3E3
-1.2E3
-1.1E3
-1E3
-900
-800
-700
-600
-500
-400
-300
-200
-100
0
Sim
ilarit
y
CL
BL PL BLC
CLC
PLC
D
C
Figure 6 : Dendogram showing classification of metals concentrations in plants (Cassava leave= CL; Bitter leave=BL; Paw-paw=PL) from sampling sites and control site (Cassava leave= CLC; Bitter leave=BLC; Paw-
paw=PLC).
Globa
lJo
u rna
lof
Scienc
eFr
ontier
Resea
rch
V
olum
eXII
Issu
e er
sion
IV
I
71
Jan u
ary
2012
B)
)
© 2012 Global Journals Inc. (US)

This page is intentionally left blank
Globa
lJo
urna
lof
Scienc
eFr
ontier
Resea
rch
V
olum
eXII
Issu
e er
sion
IV
I
72
Janu
ary
2012
B)
)
Environmental Pollution Induced By an Aluminium Smelting Plant in Nigeria
© 2012 Global Journals Inc. (US)