Embed Size (px)
Citation preview
Hari P. N. NagarajanSchool of Mechanical, Industrial,
and Manufacturing Engineering,
Oregon State University,
Corvallis, OR 97331
e-mail: [email protected]
Harsha A. MalsheSchool of Mechanical, Industrial,
and Manufacturing Engineering,
Oregon State University,
Corvallis, OR 97331
e-mail: [email protected]
Karl R. Haapala1
School of Mechanical, Industrial, and
Manufacturing Engineering,
Oregon State University,
Corvallis, OR 97331
e-mail: [email protected]
Yayue PanDepartment of Mechanical
and Industrial Engineering,
University of Illinois at Chicago,
2039 Engineering Research Facility,
Chicago, IL 60607
e-mail: [email protected]
Environmental PerformanceEvaluation of a Fast Mask ImageProjection StereolithographyProcess Through Time andEnergy ModelingThe emergence of additive manufacturing (AM) has potential for dramatic changes inlabor productivity and economic welfare. With the growth of AM, understanding of thesustainability performance of relevant technologies is required. Toward that goal, anenvironmental impact assessment (EIA) approach is undertaken to evaluate an AM pro-cess. A novel fast mask image projection stereolithography (MIP-SL) process is investi-gated for the production of six functional test parts. The materials, energy, and wastesare documented for parts fabricated using this process. The EIA is completed for humanhealth, ecosystem diversity, and resource costs using the ReCiPe 2008 impact assessmentmethod. It is noted that process energy, in the form of electricity, is the key contributorfor all three damage types. The results are used to depict the underlying relationshipbetween energy consumed and the environmental impact of the process. Thus, to facilitateprediction of process energy utilization, a mathematical model relating shape complexityand dimensional size of the part with respect to part build time and washing time is devel-oped. The effectiveness of this model is validated using data from real-time processenergy monitoring. This work quantifies the elemental influence of design features on AMprocess energy consumption and environmental impacts. While focused on the environ-mental performance of the fast MIP-SL process, the developed approach can be extendedto evaluate other AM processes and can encompass a triple bottom line analysisapproach for sustainable design by predicting environmental, economic, and social per-formance of products. [DOI: 10.1115/1.4033756]
1 Introduction
Businesses and consumers are looking for sustainable technolo-gies as they make purchasing decisions today. A sustainable tech-nology can be thought of as one that operates in a manner that iseconomically viable, environmentally benign, and beneficial tosociety. In recent years, many advantages of AM (also known as3D printing, solid freeform fabrication, and rapid manufacturing)over traditional subtractive and formative manufacturing proc-esses have been discussed at length. Subtractive manufacturingprocesses remove material from billets or stock material, andformative processes require specialized materials, labor, and man-ufacturing techniques to deform and shape material [1,2]. Addi-tive processes assemble material layer-by-layer from digitalinputs of computer-aided design (CAD) models to produce finalor net-shape parts [3]. The ability to produce customizable andfunctional parts on demand, the elimination of tooling, and theexpansion of the product design space portend mainstream AM toaid in economic and social development [4]. Progress madethrough research has enabled the growth of new and innovativetechniques and functionally viable products, framing layer-by-layer manufacturing processes as feasible alternatives to subtrac-tive and formative techniques [5].
Given that AM enables the production of geometrically com-plex parts from a wide range of materials, a tremendous advantageover traditional processes can be found in material utilization,which is nearly one-to-one [3]. In fact, many benefits of
sustainability can be realized through AM due to the optimizationof part design, which can lead to high-performance functionalparts with minimal mass [6,7]. The fabrication of microfluidicheat exchangers and other microdevices using AM can signifi-cantly reduce material use, while also increasing the functionalproductivity of the products [8]. However, in recent years, severalstudies have been conducted on the environmental impacts ofAM, and their findings have been mixed [4,5,9]. While the advan-tages provided by a reduction in material consumption, tooling,and harmful chemicals used in machining are well known, thebenefits have been tempered by findings that additive processestend to be energy inefficient and contain hidden wastes [8]. Inreality, more efforts are required to fully understand the breadthof sustainability factors and improve the efficiency of additivetechniques [5,10–12].
The investigation herein reviews the complementary roles ofsustainability and AM. The synergy of sustainability and AM, therole of each in design and their benefits for society, various indica-tors and factors (e.g., energy consumption), and models for sus-tainability assessment of AM are considered. This review isfollowed by an environmental assessment of a stereolithography(SL) process, called fast MIP-SL, for production of parts in amore efficient manner than traditional SL processes. The studyreviews the motivations and methods, presents an EIA for the pro-duction of several products, and discusses the results of the assess-ment. Furthermore, modeling of process energy consumed basedon design parameters (shape complexity and dimensional size),part build time, and washing time within the process is presented.The work reflects the interrelationship between process energyconsumed and environmental impact, and the model developed isvalidated using data from real-time process energy monitoring.
1Corresponding author.Manuscript received January 15, 2016; final manuscript received May 28, 2016;
published online August 3, 2016. Editor: Y. Lawrence Yao.
Journal of Manufacturing Science and Engineering OCTOBER 2016, Vol. 138 / 101004-1Copyright VC 2016 by ASME
Downloaded From: http://manufacturingscience.asmedigitalcollection.asme.org/ on 11/05/2016 Terms of Use: http://www.asme.org/about-asme/terms-of-use
Finally, challenges and future work toward sustainable AM arediscussed.
2 Background
2.1 Sustainable Manufacturing. Sustainability is a variedconception in today’s world and has been largely motivated as aresult of a series of environmental incidents and disasters, as wellas fears from chemical contamination and resource depletion[1,13,14]. According to the United Nations Brundtland Commis-sion Report [15], sustainable development is “development thatmeets the needs of the present without compromising the abilityof the future generations to meet their needs.” It has been sug-gested that sustainable development is a function of three majordimensions, namely, economic, social, and environmental [16].Further, sustainable manufacturing can be interpreted in the engi-neering context [17], which requires the “design of human andindustrial systems to ensure that humankind’s use of naturalresources and cycles does not lead to diminished quality of lifedue to either losses in future economic opportunities or to adverseimpacts on social conditions, human health, and the environ-ment.” Considering manufacturing systems as a business function,the U.S. Department of Commerce [18] defined sustainablemanufacturing as “the creation of manufactured products usingprocesses that are non-polluting, conserve energy and naturalresources, and are economically sound and safe for employees,communities, and consumers.” While these and other definitionshave been proposed for sustainable manufacturing (e.g., by Haa-pala et al. [1] and Sutherland and Gunter [14]), they espouse thefundamental tenets of economic, environmental, and socialresponsibility, as mentioned above for sustainable development.
Sustainability as a systems approach requires a balance betweenresource consumption and waste generation at a rate at which theenvironment can assimilate and reproduce nutrients and resources[19]. For a manufacturing system to have continuous developmentand also constitute sustainability, it should be considered a systemwhere material and energy flows are in a closed loop [1]. Thus,engineering researchers have a duty to provide advancements inmanufacturing processes, equipment, and systems, and to reducematerial consumption, energy use, waste production, and environ-mental impacts with a focus on simultaneous product and processdesign. Herein, this perspective is presented through the case of anew AM approach by reviewing its sustainability performancefrom cradle to gate (i.e., material extraction, material processing,and part production), in terms of environmental performance andenergy consumption.
2.2 Benefits of AM Systems. As defined by ASTM Interna-tional [20], AM is a process of making objects from three-dimensional solid model data by joining materials, usually in alayer-by-layer fashion. While the most popular applications inAM still involve rapid prototyping for testing the form, fit, andfunction of a design, the technology is growing as a reliablemethod to design and manufacture functional products of value[5,21]. A key aspect of AM and its future success is the ability ofthe technology to quickly produce parts at high volumes and pro-duce components customized to application- or customer-specificneeds. The layer-based process allows for the design of almostany geometry, a drastic expansion of the previously constraineddesign space.
As introduced above, the benefits that make AM advantageouscompared to traditional subtractive and formative processes arecompatible with the principles of environmental responsibility,economic growth, and social prosperity. These benefits includeelimination of tooling, the ability to manufacture complex geome-tries, optimized product design, increase product functionality,and the selective placement of material only where necessary,which contribute to a reduction in waste and an increase in pro-cess efficiency [6]. It has been shown that the ability to update,
repair, and remanufacture tooling presents opportunities for sig-nificant reductions in energy consumption, emissions, and costs[2]. The optimal design of products can be exploited to increaseproduct performance and add value through embedded functional-ity. Furthermore, benefits to the supply chain can be realizedthrough the displacement of inefficient and detrimental productionprocesses, improvement of supply chain flexibility, elimination ofwork-in-process and stock obsolescence, compression of the sup-ply chain, manufacturing closer to the distribution location, andimplementation of on-demand (just-in-time) manufacturing[6,22]. AM, therefore, has the potential to directly and indirectlyimpact the life cycle of products by increasing affordability, lon-gevity, and likability of products and to reduce the burden placedon the environment by manufacturing processes [4,23,24].
One of the technical barriers to the adoption of AM for finishedproduct production is incomplete integration of homogenousdesign with heterogeneous CAD and closed-loop AM [5,7]. Thisintegration would promote social and environmental responsibil-ity by enhancing the desirability of designed products that areunlimited by the traditional materials selection and geometric def-inition approach. Thus, sustainable design and manufacturingprinciples are applied herein to elucidate the environmental per-formance of the newly developed fast MIP-SL process through alife-cycle impact assessment (LCIA) approach.
Diegel et al. [25] described sustainable design as “design whichaims to achieve triple-bottom line ideals by striving to produceproducts that minimize their detriment to the environment while,at the same time, achieving acceptable economic benefits to thecompany and, wherever possible, having a positive impact onsociety.” As highlighted above, AM presents numerous opportuni-ties that have the potential to benefit the environmentally respon-sible design of products. Many products are not manufactured totheir optimal geometry and utilize extraneous materials requiredby casting/molding, forming, and machining processes [2]. Mate-rial use can be reduced while maintaining functional performancethrough the optimization of product design to lattice or honey-comb structures—which are only possible through AM processes[5,6]. Zhang et al. [26] proposed a design optimization strategyfor variable density hexagonal cellular structures. The researchrelated cellular structures with continuous micromechanics mod-els and achieves efficiency through continuous topology optimiza-tion strategy. In addition to reduced material use, these lighterweight products can reduce carbon emissions over a product’s lifecycle by reducing the energy needed to transport and convey theproduct. Thus, the optimal design of products, which is usuallyconstrained by traditional manufacturing techniques, can beexploited to increase product performance and add value throughembedded functionality.
Research in sustainable product design has usually focused onlowering the environmental impacts of material, resource, andenergy use, while it often ignores understanding “design quality”as a method to maximize product longevity [24,25,27]. The trade-offs between optimal design and manufacturability of a product,and the tradeoffs between custom fit and characteristics of large-scale enterprise focused on process and cost efficiency can nega-tively impact design quality and, consequently, longevity. Diegelet al. argued that AM has the potential to address both of thesefactors and is, therefore, an effective tool to enable sustainableproduct design [25]. Since EIA requires broad, comprehensiveanalysis, the environmental performance of various designs isexplored in Sec. 2.3 by examining a set of products with differentgeometries and shape complexities, including simple 2.5-dimen-sional, shell, and multiscale structures with fine features.
2.3 Environmental Performance Evaluation of AMSystems. Despite the demonstrated success of AM, EIA is a chal-lenging but necessary task [28]. In particular, the joint efforts ofdesign and manufacturing engineers with environmental scientistsare essential in understanding the fundamental environmental
101004-2 / Vol. 138, OCTOBER 2016 Transactions of the ASME
Downloaded From: http://manufacturingscience.asmedigitalcollection.asme.org/ on 11/05/2016 Terms of Use: http://www.asme.org/about-asme/terms-of-use
impacts of newer technologies and materials. Evaluation of theextent of the impact of these processes and their resulting productsis required to define regulations and the spatial distribution thatwill enable the control and prevention of the potential harm, alongwith estimates of the cost required to deal with related issues.
EIA of AM is limited in literature. One study, conducted byLuo et al. [11], proposed a method for evaluating the environmen-tal performance by dividing the AM process into individual ele-ments (i.e., material preparation, energy consumption, materialtoxicity, and waste disposal). Each element was considered withinthe various life stages to cope with process complexity [11]. Theirmethod was demonstrated for an SL process with focus on theenergy consumption rate (ECR), which is the amount of energyconsumed per unit mass of material used. The environmentalimpact was calculated as the ECR multiplied by an electricity con-sumption factor (0.57 mPts/kWh), and comparisons were madefor three different equipment models used for the SL process [29].Even though the underpinning method is life-cycle assessment(LCA), analysis fails to account for potential toxicological healthand environmental impacts that can occur from handling, use, anddisposal of photo resin materials. This is simply because the toxic-ity and environmental impacts of many AM materials and chemi-cal solvents used for their removal have not been identified to date[28]. The available safety data sheets are limited to older genera-tion, epoxy resin materials. The majority of these data recognizethat severe eye and skin irritation and possible allergic skin reac-tions might occur as a result of handling or inhaling vapor fromthose materials [28].
In addition to photopolymer resins, information about thechemical solvents used for the removal of excess resin on theproducts is unknown. Data about environmental mobility (air,water, and soil) are unavailable [30]. Similarly, data on humantoxicity are limited [28]. Another important issue that needs to beaddressed relates to the impacts and consequences of energy con-sumption of these processes, as discussed in Sec. 2.3.1.
2.3.1 Energy Consumption in AM. Energy generation andindustrial activity contribute significantly to the overall emissionof greenhouse gases, which are thought to be the key driver ofglobal warming [12]. The reduction of energy consumption inmanufacturing is vital to limiting the overall emission of green-house gases. AM allows the production of multiple components ina parallel manner, without the need for tooling [31,32]. Thesingle-step nature of AM provides transparency to the energy uti-lized in the process. However, AM has several drawbacks in termsof product quality, processing speed, and cost [28,31]. From theperspective of energy consumption, AM processes are usually notas efficient as conventional manufacturing processes [33]. Equip-ment often has peripheral devices; thus, basic power consumptionand processing time are the two main considerations in energyconsumption calculations [28].
AM processes involve the construction of a part that may con-sist of thousands of layers, and each may take several minutes tocomplete. Thus, production may require significantly more timethan conventional manufacturing processes. AM requires a signifi-cant amount of energy; thus, energy consumed per volume of ma-terial is high [34]. The Advanced Manufacturing Office of theU.S. Department of Energy, however, has suggested that AMsaves energy by eliminating distributed manufacturing processesand material waste [35]. Since energy savings are product-specificand vary extensively, it is not possible to map the energy utiliza-tion of the entire AM sector, and this conclusion cannot begeneralized [36].
Previous studies suggested that there may be an increase inECR as productivity increases [11,12,37,38]. In SL processes, thiseffect is related to the solidification rate of the raw materials [19].It is seen that AM provides an advantage for large build volumes,as well as faster build rates for products having a small number ofparts [39]. However, AM processes are inefficient compared toconventional processes, and therefore, the optimization of energy
consumption in AM is essential in order to reduce the environ-mental impact [8]. Translating process parameter behavior into aprocess model can reduce variability in the process and help con-trol energy consumption. To achieve that goal, mapping the inter-relationships of process energy consumption with environmentalperformance metrics, e.g., through energy modeling, is required.As described in Section 2.3.2, environmental modeling andimpact assessment can provide an indication of the broader ramifi-cations of materials and energy use.
2.3.2 Environmental Modeling of AM. Until recently, littleeffort has been invested in the development of environmentalmodels representing the life cycle of additively manufacturedproducts. In the 2009 Roadmap for Additive Manufacturing,Bourell et al. [5] stated that achieving important AM sustainabilitygoals will require a total life-cycle analysis and a comprehensivesustainability evaluation of each AM process. This includes analy-sis of four life-cycle stages: premanufacturing, manufacturing,use, and postuse. It is also imperative to ensure the developmentof design for sustainable additive manufacturing (DFSAM) [10].As defined by Rosen [40], DFAM is the “synthesis of shapes,sizes, geometric mesostructures, and material compositions andmicrostructures to best utilize manufacturing process capabilitiesto achieve desired performance and other life-cycle objectives.”DFSAM was developed in the context of sustainability [10]. Itincludes both DFAM and EIA in the development of products andprocesses. This merging is critical, as innovative product designand manufacturing activities in the coming century will requirethe integration of life-cycle data and sustainable design principlesfor the improvement of products and processes [5]. This integra-tion will be enabled through material, process, and system model-ing approaches.
In the past decade, models have begun to emerge for assess-ment, prediction, and optimization of environmental impacts andefficiency of AM processes. For instance, Le Bourhis et al. [10]proposed a new LCA-based methodology to evaluate the environ-mental impact of a part from its CAD model for a direct metaldeposition process. The process model is based on electricity,fluid, and material consumption, unlike previous energy-onlyassessments [4,11,34,38]. Through predictive modeling of processinputs, the work aims to minimize consumption of all materialand energy fluxes during manufacturing by integrating the modelinto design activities [41]. The process model enables environ-mental evaluation of different manufacturing strategies for thesame part, based on the CAD model.
Verma and Rai [42] proposed another modeling approach basedon multistep optimization to enable material and energy efficiencyof AM technology. The approach aims to minimize material wasteand energy consumption for finished parts as well as on a layer-by-layer basis. A process model was formulated for selective lasersintering, and it was claimed to be easily extendable to other AMprocesses. The proposed approach is generic and does not appearto require part geometry data, e.g., complexity, curvature, or fea-ture identification. Model development and experimental analysisdemonstrated the ability of the proposed optimization techniquesto define manufacturing process plans and compete with currentlayer-by-layer slicing approaches.
Faludi et al. [9] used LCA to conduct a comprehensive compar-ison of subtractive and AM processes exploring the types of eco-logical impacts and their sources for the two manufacturingapproaches. The study compared fused deposition modeling(FDM), inkjet printing, and computer numerically controlled(CNC) machining of polymeric materials. In order to conduct afair comparison, part production was modeled on a part-per-yearbasis, which was then followed by a calculation of ecologicalimpacts. The comprehensive cradle-to-grave study found that itcannot be unconditionally stated that AM technology has an envi-ronmental impact advantage over subtractive processes, specifi-cally in terms of material waste or energy consumption. Therelative impact of AM processes depends primarily on machine
Journal of Manufacturing Science and Engineering OCTOBER 2016, Vol. 138 / 101004-3
Downloaded From: http://manufacturingscience.asmedigitalcollection.asme.org/ on 11/05/2016 Terms of Use: http://www.asme.org/about-asme/terms-of-use
utilization; therefore, the best strategy for enhancing environmen-tal performance is to have the fewest number of machines, eachrunning the most jobs possible [9].
In spite of these efforts, a more comprehensive understandinghas not emerged to assist designers from a DFSAM perspectiveduring early phases of design. In particular, design decision mak-ing greatly influences the AM product cost, performance, andenvironmental impact [7,43]. Hence, fundamental relationshipsthat relate design attributes and AM process parameters to productenvironmental performance would greatly facilitate sustainabledesign. Sec. 3 explores this direction further by focusing on theenvironmental performance of a newly developed process, termedfast MIP-SL.
3 EIA of a Novel MIP-SL Process
As iterated above, the rapid pace of advancements in AM tech-nologies necessitates EIA to ensure their responsible develop-ment. Given the potential of these technologies to enhanceenvironmentally responsible manufacturing and economic devel-opment across the world, engineering research should investigatethe relative environmental impacts of these technologies. Thus,this study aims to conduct an EIA of the novel fast MIP-SL pro-cess presented in Sec. 3.1 using an LCIA approach.
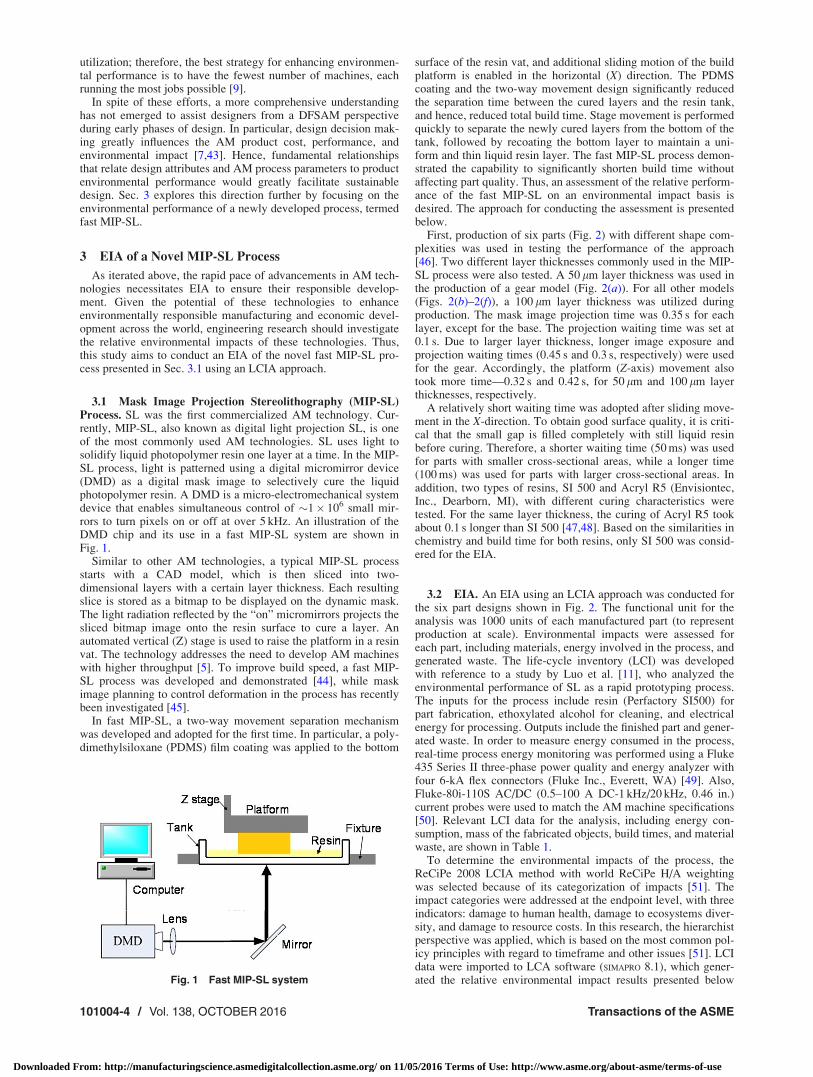
3.1 Mask Image Projection Stereolithography (MIP-SL)Process. SL was the first commercialized AM technology. Cur-rently, MIP-SL, also known as digital light projection SL, is oneof the most commonly used AM technologies. SL uses light tosolidify liquid photopolymer resin one layer at a time. In the MIP-SL process, light is patterned using a digital micromirror device(DMD) as a digital mask image to selectively cure the liquidphotopolymer resin. A DMD is a micro-electromechanical systemdevice that enables simultaneous control of �1� 106 small mir-rors to turn pixels on or off at over 5 kHz. An illustration of theDMD chip and its use in a fast MIP-SL system are shown inFig. 1.
Similar to other AM technologies, a typical MIP-SL processstarts with a CAD model, which is then sliced into two-dimensional layers with a certain layer thickness. Each resultingslice is stored as a bitmap to be displayed on the dynamic mask.The light radiation reflected by the “on” micromirrors projects thesliced bitmap image onto the resin surface to cure a layer. Anautomated vertical (Z) stage is used to raise the platform in a resinvat. The technology addresses the need to develop AM machineswith higher throughput [5]. To improve build speed, a fast MIP-SL process was developed and demonstrated [44], while maskimage planning to control deformation in the process has recentlybeen investigated [45].
In fast MIP-SL, a two-way movement separation mechanismwas developed and adopted for the first time. In particular, a poly-dimethylsiloxane (PDMS) film coating was applied to the bottom
surface of the resin vat, and additional sliding motion of the buildplatform is enabled in the horizontal (X) direction. The PDMScoating and the two-way movement design significantly reducedthe separation time between the cured layers and the resin tank,and hence, reduced total build time. Stage movement is performedquickly to separate the newly cured layers from the bottom of thetank, followed by recoating the bottom layer to maintain a uni-form and thin liquid resin layer. The fast MIP-SL process demon-strated the capability to significantly shorten build time withoutaffecting part quality. Thus, an assessment of the relative perform-ance of the fast MIP-SL on an environmental impact basis isdesired. The approach for conducting the assessment is presentedbelow.
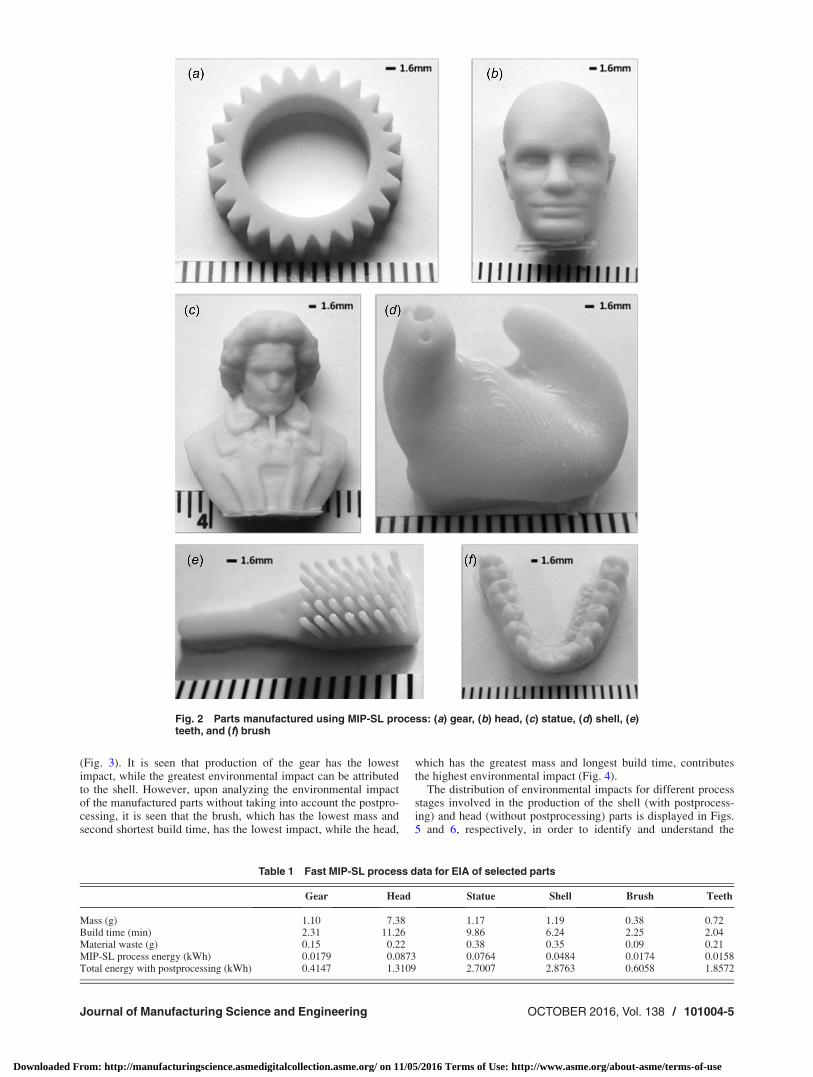
First, production of six parts (Fig. 2) with different shape com-plexities was used in testing the performance of the approach[46]. Two different layer thicknesses commonly used in the MIP-SL process were also tested. A 50 lm layer thickness was used inthe production of a gear model (Fig. 2(a)). For all other models(Figs. 2(b)–2(f)), a 100 lm layer thickness was utilized duringproduction. The mask image projection time was 0.35 s for eachlayer, except for the base. The projection waiting time was set at0.1 s. Due to larger layer thickness, longer image exposure andprojection waiting times (0.45 s and 0.3 s, respectively) were usedfor the gear. Accordingly, the platform (Z-axis) movement alsotook more time—0.32 s and 0.42 s, for 50 lm and 100 lm layerthicknesses, respectively.
A relatively short waiting time was adopted after sliding move-ment in the X-direction. To obtain good surface quality, it is criti-cal that the small gap is filled completely with still liquid resinbefore curing. Therefore, a shorter waiting time (50 ms) was usedfor parts with smaller cross-sectional areas, while a longer time(100 ms) was used for parts with larger cross-sectional areas. Inaddition, two types of resins, SI 500 and Acryl R5 (Envisiontec,Inc., Dearborn, MI), with different curing characteristics weretested. For the same layer thickness, the curing of Acryl R5 tookabout 0.1 s longer than SI 500 [47,48]. Based on the similarities inchemistry and build time for both resins, only SI 500 was consid-ered for the EIA.
3.2 EIA. An EIA using an LCIA approach was conducted forthe six part designs shown in Fig. 2. The functional unit for theanalysis was 1000 units of each manufactured part (to representproduction at scale). Environmental impacts were assessed foreach part, including materials, energy involved in the process, andgenerated waste. The life-cycle inventory (LCI) was developedwith reference to a study by Luo et al. [11], who analyzed theenvironmental performance of SL as a rapid prototyping process.The inputs for the process include resin (Perfactory SI500) forpart fabrication, ethoxylated alcohol for cleaning, and electricalenergy for processing. Outputs include the finished part and gener-ated waste. In order to measure energy consumed in the process,real-time process energy monitoring was performed using a Fluke435 Series II three-phase power quality and energy analyzer withfour 6-kA flex connectors (Fluke Inc., Everett, WA) [49]. Also,Fluke-80i-110S AC/DC (0.5–100 A DC-1 kHz/20 kHz, 0.46 in.)current probes were used to match the AM machine specifications[50]. Relevant LCI data for the analysis, including energy con-sumption, mass of the fabricated objects, build times, and materialwaste, are shown in Table 1.
To determine the environmental impacts of the process, theReCiPe 2008 LCIA method with world ReCiPe H/A weightingwas selected because of its categorization of impacts [51]. Theimpact categories were addressed at the endpoint level, with threeindicators: damage to human health, damage to ecosystems diver-sity, and damage to resource costs. In this research, the hierarchistperspective was applied, which is based on the most common pol-icy principles with regard to timeframe and other issues [51]. LCIdata were imported to LCA software (SIMAPRO 8.1), which gener-ated the relative environmental impact results presented belowFig. 1 Fast MIP-SL system
101004-4 / Vol. 138, OCTOBER 2016 Transactions of the ASME
Downloaded From: http://manufacturingscience.asmedigitalcollection.asme.org/ on 11/05/2016 Terms of Use: http://www.asme.org/about-asme/terms-of-use
(Fig. 3). It is seen that production of the gear has the lowestimpact, while the greatest environmental impact can be attributedto the shell. However, upon analyzing the environmental impactof the manufactured parts without taking into account the postpro-cessing, it is seen that the brush, which has the lowest mass andsecond shortest build time, has the lowest impact, while the head,
which has the greatest mass and longest build time, contributesthe highest environmental impact (Fig. 4).
The distribution of environmental impacts for different processstages involved in the production of the shell (with postprocess-ing) and head (without postprocessing) parts is displayed in Figs.5 and 6, respectively, in order to identify and understand the
Fig. 2 Parts manufactured using MIP-SL process: (a) gear, (b) head, (c) statue, (d) shell, (e)teeth, and (f) brush
Table 1 Fast MIP-SL process data for EIA of selected parts
Gear Head Statue Shell Brush Teeth
Mass (g) 1.10 7.38 1.17 1.19 0.38 0.72Build time (min) 2.31 11.26 9.86 6.24 2.25 2.04Material waste (g) 0.15 0.22 0.38 0.35 0.09 0.21MIP-SL process energy (kWh) 0.0179 0.0873 0.0764 0.0484 0.0174 0.0158Total energy with postprocessing (kWh) 0.4147 1.3109 2.7007 2.8763 0.6058 1.8572
Journal of Manufacturing Science and Engineering OCTOBER 2016, Vol. 138 / 101004-5
Downloaded From: http://manufacturingscience.asmedigitalcollection.asme.org/ on 11/05/2016 Terms of Use: http://www.asme.org/about-asme/terms-of-use
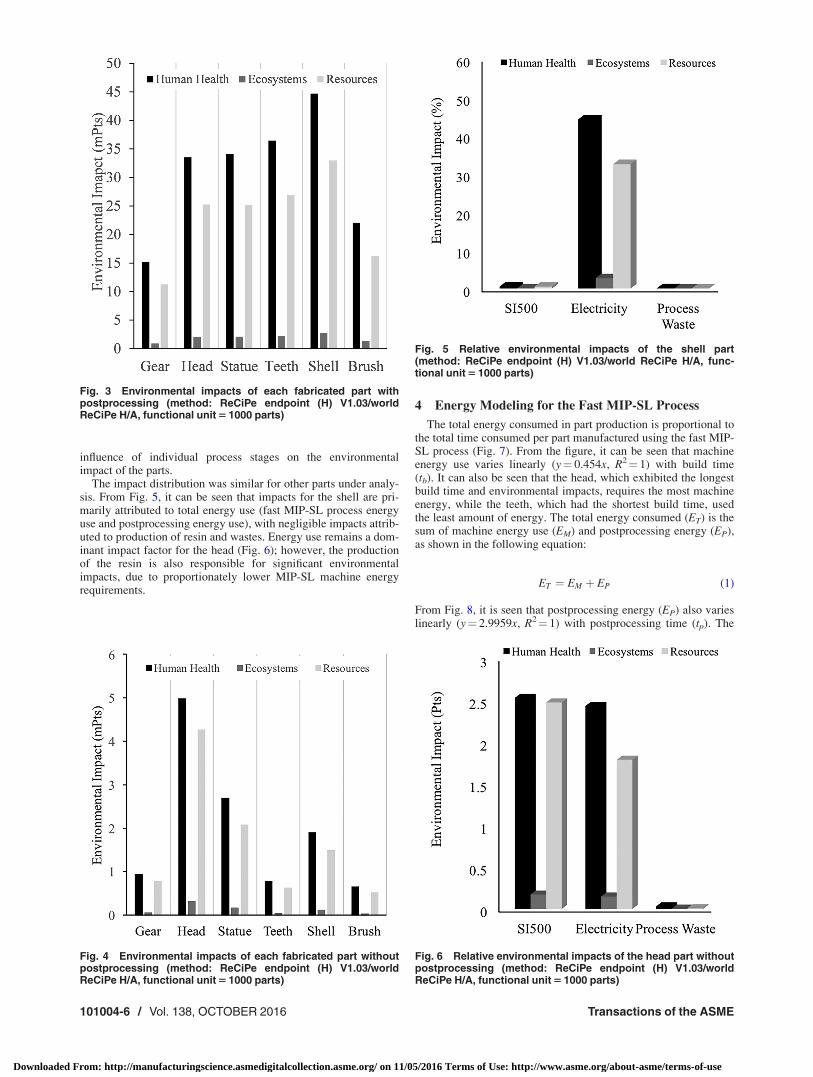
influence of individual process stages on the environmentalimpact of the parts.
The impact distribution was similar for other parts under analy-sis. From Fig. 5, it can be seen that impacts for the shell are pri-marily attributed to total energy use (fast MIP-SL process energyuse and postprocessing energy use), with negligible impacts attrib-uted to production of resin and wastes. Energy use remains a dom-inant impact factor for the head (Fig. 6); however, the productionof the resin is also responsible for significant environmentalimpacts, due to proportionately lower MIP-SL machine energyrequirements.
4 Energy Modeling for the Fast MIP-SL Process
The total energy consumed in part production is proportional tothe total time consumed per part manufactured using the fast MIP-SL process (Fig. 7). From the figure, it can be seen that machineenergy use varies linearly (y¼ 0.454x, R2¼ 1) with build time(tb). It can also be seen that the head, which exhibited the longestbuild time and environmental impacts, requires the most machineenergy, while the teeth, which had the shortest build time, usedthe least amount of energy. The total energy consumed (ET) is thesum of machine energy use (EM) and postprocessing energy (EP),as shown in the following equation:
ET ¼ EM þ EP (1)
From Fig. 8, it is seen that postprocessing energy (EP) also varieslinearly (y¼ 2.9959x, R2¼ 1) with postprocessing time (tp). The
Fig. 3 Environmental impacts of each fabricated part withpostprocessing (method: ReCiPe endpoint (H) V1.03/worldReCiPe H/A, functional unit 5 1000 parts)
Fig. 4 Environmental impacts of each fabricated part withoutpostprocessing (method: ReCiPe endpoint (H) V1.03/worldReCiPe H/A, functional unit 5 1000 parts)
Fig. 5 Relative environmental impacts of the shell part(method: ReCiPe endpoint (H) V1.03/world ReCiPe H/A, func-tional unit 5 1000 parts)
Fig. 6 Relative environmental impacts of the head part withoutpostprocessing (method: ReCiPe endpoint (H) V1.03/worldReCiPe H/A, functional unit 5 1000 parts)
101004-6 / Vol. 138, OCTOBER 2016 Transactions of the ASME
Downloaded From: http://manufacturingscience.asmedigitalcollection.asme.org/ on 11/05/2016 Terms of Use: http://www.asme.org/about-asme/terms-of-use
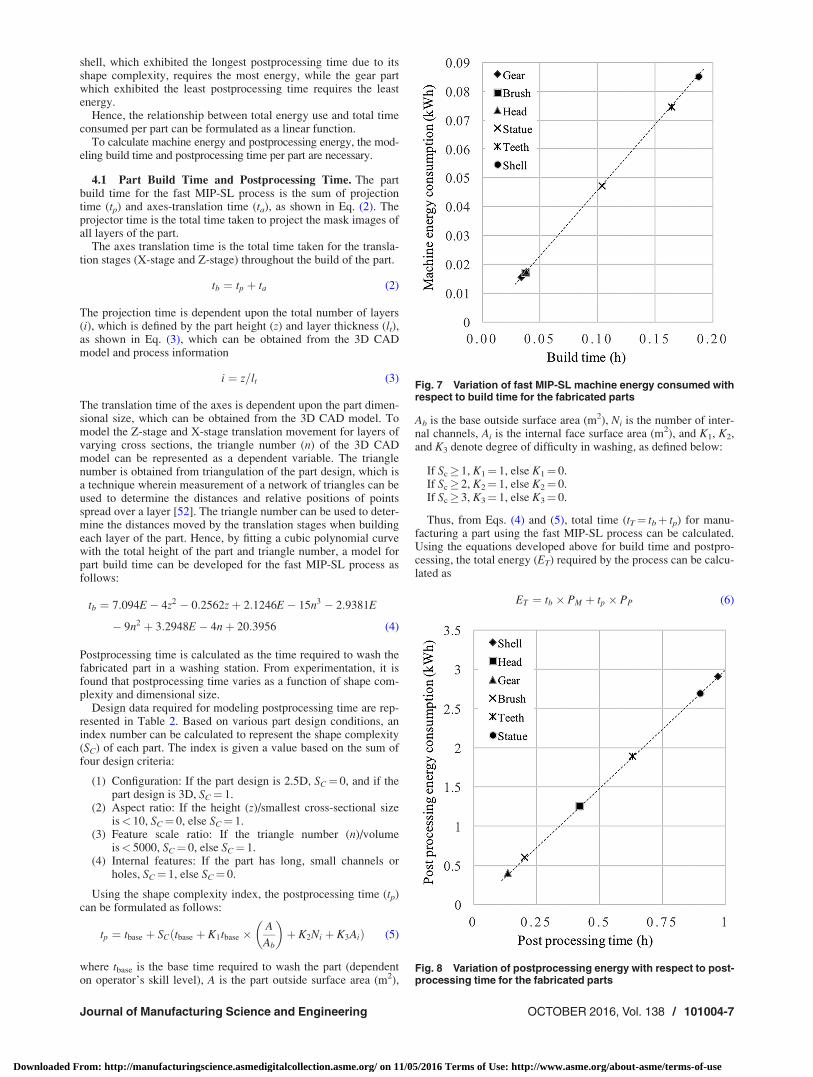
shell, which exhibited the longest postprocessing time due to itsshape complexity, requires the most energy, while the gear partwhich exhibited the least postprocessing time requires the leastenergy.
Hence, the relationship between total energy use and total timeconsumed per part can be formulated as a linear function.
To calculate machine energy and postprocessing energy, the mod-eling build time and postprocessing time per part are necessary.
4.1 Part Build Time and Postprocessing Time. The partbuild time for the fast MIP-SL process is the sum of projectiontime (tp) and axes-translation time (ta), as shown in Eq. (2). Theprojector time is the total time taken to project the mask images ofall layers of the part.
The axes translation time is the total time taken for the transla-tion stages (X-stage and Z-stage) throughout the build of the part.
tb ¼ tp þ ta (2)
The projection time is dependent upon the total number of layers(i), which is defined by the part height (z) and layer thickness (lt),as shown in Eq. (3), which can be obtained from the 3D CADmodel and process information
i ¼ z=lt (3)
The translation time of the axes is dependent upon the part dimen-sional size, which can be obtained from the 3D CAD model. Tomodel the Z-stage and X-stage translation movement for layers ofvarying cross sections, the triangle number (n) of the 3D CADmodel can be represented as a dependent variable. The trianglenumber is obtained from triangulation of the part design, which isa technique wherein measurement of a network of triangles can beused to determine the distances and relative positions of pointsspread over a layer [52]. The triangle number can be used to deter-mine the distances moved by the translation stages when buildingeach layer of the part. Hence, by fitting a cubic polynomial curvewith the total height of the part and triangle number, a model forpart build time can be developed for the fast MIP-SL process asfollows:
tb ¼ 7:094E� 4z2 � 0:2562zþ 2:1246E� 15n3 � 2:9381E
� 9n2 þ 3:2948E� 4nþ 20:3956 (4)
Postprocessing time is calculated as the time required to wash thefabricated part in a washing station. From experimentation, it isfound that postprocessing time varies as a function of shape com-plexity and dimensional size.
Design data required for modeling postprocessing time are rep-resented in Table 2. Based on various part design conditions, anindex number can be calculated to represent the shape complexity(SC) of each part. The index is given a value based on the sum offour design criteria:
(1) Configuration: If the part design is 2.5D, SC¼ 0, and if thepart design is 3D, SC¼ 1.
(2) Aspect ratio: If the height (z)/smallest cross-sectional sizeis< 10, SC¼ 0, else SC¼ 1.
(3) Feature scale ratio: If the triangle number (n)/volumeis< 5000, SC¼ 0, else SC¼ 1.
(4) Internal features: If the part has long, small channels orholes, SC¼ 1, else SC¼ 0.
Using the shape complexity index, the postprocessing time (tp)can be formulated as follows:
tp ¼ tbase þ SCðtbase þ K1tbase �A
Ab
� �þ K2Ni þ K3AiÞ (5)
where tbase is the base time required to wash the part (dependenton operator’s skill level), A is the part outside surface area (m2),
Ab is the base outside surface area (m2), Ni is the number of inter-nal channels, Ai is the internal face surface area (m2), and K1, K2,and K3 denote degree of difficulty in washing, as defined below:
If Sc� 1, K1¼ 1, else K1¼ 0.If Sc� 2, K2¼ 1, else K2¼ 0.If Sc� 3, K3¼ 1, else K3¼ 0.
Thus, from Eqs. (4) and (5), total time (tT¼ tbþ tp) for manu-facturing a part using the fast MIP-SL process can be calculated.Using the equations developed above for build time and postpro-cessing, the total energy (ET) required by the process can be calcu-lated as
ET ¼ tb � PM þ tp � PP (6)
Fig. 7 Variation of fast MIP-SL machine energy consumed withrespect to build time for the fabricated parts
Fig. 8 Variation of postprocessing energy with respect to post-processing time for the fabricated parts
Journal of Manufacturing Science and Engineering OCTOBER 2016, Vol. 138 / 101004-7
Downloaded From: http://manufacturingscience.asmedigitalcollection.asme.org/ on 11/05/2016 Terms of Use: http://www.asme.org/about-asme/terms-of-use
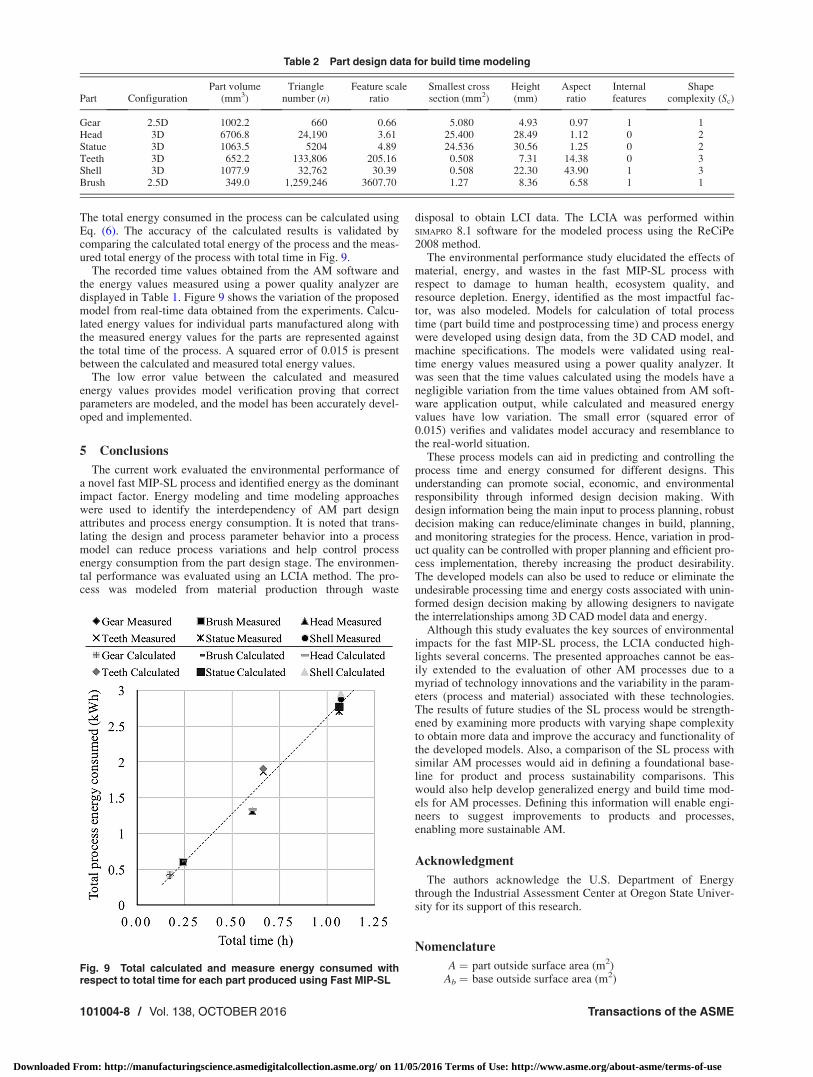
The total energy consumed in the process can be calculated usingEq. (6). The accuracy of the calculated results is validated bycomparing the calculated total energy of the process and the meas-ured total energy of the process with total time in Fig. 9.
The recorded time values obtained from the AM software andthe energy values measured using a power quality analyzer aredisplayed in Table 1. Figure 9 shows the variation of the proposedmodel from real-time data obtained from the experiments. Calcu-lated energy values for individual parts manufactured along withthe measured energy values for the parts are represented againstthe total time of the process. A squared error of 0.015 is presentbetween the calculated and measured total energy values.
The low error value between the calculated and measuredenergy values provides model verification proving that correctparameters are modeled, and the model has been accurately devel-oped and implemented.
5 Conclusions
The current work evaluated the environmental performance ofa novel fast MIP-SL process and identified energy as the dominantimpact factor. Energy modeling and time modeling approacheswere used to identify the interdependency of AM part designattributes and process energy consumption. It is noted that trans-lating the design and process parameter behavior into a processmodel can reduce process variations and help control processenergy consumption from the part design stage. The environmen-tal performance was evaluated using an LCIA method. The pro-cess was modeled from material production through waste
disposal to obtain LCI data. The LCIA was performed withinSIMAPRO 8.1 software for the modeled process using the ReCiPe2008 method.
The environmental performance study elucidated the effects ofmaterial, energy, and wastes in the fast MIP-SL process withrespect to damage to human health, ecosystem quality, andresource depletion. Energy, identified as the most impactful fac-tor, was also modeled. Models for calculation of total processtime (part build time and postprocessing time) and process energywere developed using design data, from the 3D CAD model, andmachine specifications. The models were validated using real-time energy values measured using a power quality analyzer. Itwas seen that the time values calculated using the models have anegligible variation from the time values obtained from AM soft-ware application output, while calculated and measured energyvalues have low variation. The small error (squared error of0.015) verifies and validates model accuracy and resemblance tothe real-world situation.
These process models can aid in predicting and controlling theprocess time and energy consumed for different designs. Thisunderstanding can promote social, economic, and environmentalresponsibility through informed design decision making. Withdesign information being the main input to process planning, robustdecision making can reduce/eliminate changes in build, planning,and monitoring strategies for the process. Hence, variation in prod-uct quality can be controlled with proper planning and efficient pro-cess implementation, thereby increasing the product desirability.The developed models can also be used to reduce or eliminate theundesirable processing time and energy costs associated with unin-formed design decision making by allowing designers to navigatethe interrelationships among 3D CAD model data and energy.
Although this study evaluates the key sources of environmentalimpacts for the fast MIP-SL process, the LCIA conducted high-lights several concerns. The presented approaches cannot be eas-ily extended to the evaluation of other AM processes due to amyriad of technology innovations and the variability in the param-eters (process and material) associated with these technologies.The results of future studies of the SL process would be strength-ened by examining more products with varying shape complexityto obtain more data and improve the accuracy and functionality ofthe developed models. Also, a comparison of the SL process withsimilar AM processes would aid in defining a foundational base-line for product and process sustainability comparisons. Thiswould also help develop generalized energy and build time mod-els for AM processes. Defining this information will enable engi-neers to suggest improvements to products and processes,enabling more sustainable AM.
Acknowledgment
The authors acknowledge the U.S. Department of Energythrough the Industrial Assessment Center at Oregon State Univer-sity for its support of this research.
Nomenclature
A ¼ part outside surface area (m2)Ab ¼ base outside surface area (m2)
Table 2 Part design data for build time modeling
Part ConfigurationPart volume
(mm3)Triangle
number (n)Feature scale
ratioSmallest crosssection (mm2)
Height(mm)
Aspectratio
Internalfeatures
Shapecomplexity (Sc)
Gear 2.5D 1002.2 660 0.66 5.080 4.93 0.97 1 1Head 3D 6706.8 24,190 3.61 25.400 28.49 1.12 0 2Statue 3D 1063.5 5204 4.89 24.536 30.56 1.25 0 2Teeth 3D 652.2 133,806 205.16 0.508 7.31 14.38 0 3Shell 3D 1077.9 32,762 30.39 0.508 22.30 43.90 1 3Brush 2.5D 349.0 1,259,246 3607.70 1.27 8.36 6.58 1 1
Fig. 9 Total calculated and measure energy consumed withrespect to total time for each part produced using Fast MIP-SL
101004-8 / Vol. 138, OCTOBER 2016 Transactions of the ASME
Downloaded From: http://manufacturingscience.asmedigitalcollection.asme.org/ on 11/05/2016 Terms of Use: http://www.asme.org/about-asme/terms-of-use
Ai ¼ internal face surface area (m2)AM ¼ additive manufacturing
ASTM ¼ American Society for Testing and MaterialsCAD ¼ computer-aided designCNC ¼ computer numerical control
DFAM ¼ design for additive manufacturingDFSAM ¼ design for sustainable additive manufacturing
DMD ¼ digital micromirror deviceEM ¼ machine energy (kWh)EP ¼ postprocessing energy (kWh)ET ¼ total process energy (kWh)
ECR ¼ energy consumption rateEIA ¼ environmental impact assessment
FDM ¼ fusion deposition modelingi ¼ total number of layerslt ¼ layer thickness (mm)
LCA ¼ life-cycle analysisLCI ¼ life-cycle inventory
LCIA ¼ life-cycle impact assessmentMIP-SL ¼ mask image projection stereolithography
MSDS ¼ material safety data sheetn ¼ triangle number
Ni ¼ number of internal channelsPM ¼ rated power of MIP-SL machinePP ¼ rated power of postprocessing setup
PDMS ¼ polydimethylsiloxaneSC ¼ shape complexity
SETAC ¼ Society of Environmental Toxicology and ChemistrySL ¼ stereolithography
STL ¼ surface tessellation fileta ¼ axes translation time (s)tb ¼ part build time (s)
tbase ¼ base time for washing the part (s)tp ¼ projector time (s)
tpp ¼ postprocessing time (s)z ¼ height of the part (mm)
References[1] Haapala, K. R., Zhao, F., Camelio, J., Sutherland, J. W., Skerlos, S. J., Dorn-
feld, D. A., Jawahir, I. S., Clarens, A. F., and Rickli, J. L., 2013, “A Review ofEngineering Research in Sustainable Manufacturing,” ASME J. Manuf. Sci.Eng., 135(4), p. 041013.
[2] Morrow, W. R., Qi, H., Kim, I., Mazumder, J., and Skerlos, S. J., 2007,“Environmental Aspects of Laser-based and Conventional Tool and Die Man-ufacturing,” J. Cleaner Prod., 15(10), pp. 932–943.
[3] Gibson, I., Rosen, D. W., and Stucker, B., 2010, Additive Manufacturing Tech-nologies, Springer, Boston, MA.
[4] Sreenivasan, R., Goel, A., and Bourell, D. L., 2010, “Sustainability Issues inLaser-Based Additive Manufacturing,” Phys. Procedia, 5(Pt. A), pp. 81–90.
[5] Bourell, D. L., Leu, M. C., and Rosen, D. W., 2009, “Roadmap for AdditiveManufacturing: Identifying the Future of Freeform Processing,” AdvancedManufacturing Center, Laboratory for Freeform Fabrication, The University ofTexas at Austin.
[6] Reeves, P., 2012, “Additive Manufacturing and Sustainable Production for the21st Century,” Econolyst: The 3D Printing & Additive Manufacturing People,White Paper.
[7] Huang, Y., Leu, M. C., Mazumder, J., and Donmez, A., 2015, “Additive Manu-facturing: Current State, Future Potential, Gaps and Needs, and Recommen-dations,” ASME J. Manuf. Sci. Eng., 137(1), p. 014001.
[8] Rua, Y., Muren, R., and Reckinger, S., 2015, “Limitations of AdditiveManufacturing on Microfluidic Heat Exchanger Components,” ASME J.Manuf. Sci. Eng., 137(3), p. 034504.
[9] Faludi, J., Bayley, C., Bhogal, S., and Iribarne, M., 2015, “Comparing Environ-mental Impacts of Additive Manufacturing versus Traditional Machining ViaLife-Cycle Assessment,” Rapid Prototyping J., 21(1), pp. 14–33.
[10] Le Bourhis, F., Kerbrat, O., Dembinski, L., Hascoet, J.-Y., and Mognol, P.,2014, “Predictive Model for Environmental Assessment in Additive Manufac-turing Process,” Procedia CIRP, 15, pp. 26–31.
[11] Luo, Y., Ji, Z., Leu, M. C., and Caudill, R., 1999, “Environmental PerformanceAnalysis of Solid Freedom Fabrication Processes,” IEEE International Sympo-sium on Electronics and the Environment, ISEE-1999, pp. 1–6.
[12] Baumers, M., Tuck, C., Wildman, R., Ashcroft, I., and Hague, R., 2011,“Energy Inputs to Additive Manufacturing: Does Capacity Utilization Matter?,”Solid Freeform Fabrication Symposium, University of Texas, Austin, TX,pp. 30–40.
[13] Carson, R. L., Lear, L. J., and Wilson, E. O., 2002, Silent Spring, HoughtonMifflin, Boston, MA.
[14] Sutherland, J. W., and Gunter, K. L., 2001, “Chapter 13. Environmental Attrib-utes of Manufacturing Processes,” Handbook of Environmentally ConsciousManufacturing, 1st, ed., C. N. Madu, ed., Kluwer Academic Publishers, Boston,MA, pp. 293–316.
[15] Brundtland, G. H., 1987, Our Common Future, World Commission on Environ-ment and Development (WCED), Oxford University Press, New York.
[16] United Nations General Assembly Resolation 60/1, “2005 World Summit Out-come,” A/RES/60/1 (October 24, 2005), Last accessed June 17, 2016, undocs.org/A/RES/60/1.
[17] Mihelcic, J. R., Crittenden, J. C., Small, M. J., Shonnard, D. R., Hokanson, D.R., Zhang, Q., Chen, H., Sorby, S. A., James, V. U., Sutherland, J. W., andSchnoor, J. L., 2003, “Sustainability Science and Engineering: The Emer-gence of a New Metadiscipline,” Environ. Sci. Technol., 37(23), pp.5314–5324.
[18] U.S. Department of Commerce, “Promoting Competitiveness: Partnerships andProgress of the Office of Manufacturing and Services.” International TradeAdministration, Washington, DC, November 2008.
[19] Huesemann, M. H., 2003, “The Limits of Technological Solutions to Sustain-able Development,” Clean Technol. Environ. Policy, 5(1), pp. 21–34.
[20] F42 Committee, 2012, “Standard Terminology for Additive ManufacturingTechnologies,” ASTM International, West Conshohocken, PA, No. F2792–12a.
[21] Wong, V., and Hernandez, A., 2012, “A Review of Additive Manufacturing,”ISRN Mech. Eng., 2012, p. e208760.
[22] Geraedts, J., Doubrovski, E., Verlinden, J., and Stellingwerff, M., 2012, “ThreeViews on Additive Manufacturing: Business, Research and Education,” 9thInternational Symposium on Tools and Methods of Competitive Engineering,Karlsruhe, Germany, May 7–11, I. Horv�ath, A. Albers, M. Behrendt, andZ. Rus�ak, eds., Delft University of Technology, Delft, The Netherlands, pp.1–15.
[23] Huang, S. H., Liu, P., Mokasdar, A., and Hou, L., 2013, “Additive Manufactur-ing and Its Societal Impact: A Literature Review,” Int. J. Adv. Manuf. Technol.,67(5), pp. 1191–1203.
[24] van Nes, N., and Cramer, J., 2005, “Influencing Product Lifetime ThroughProduct Design,” Bus. Strategy Environ., 14(5), pp. 286–299.
[25] Diegel, O., Singamneni, S., Reay, S., and Withell, A., 2010, “Tools for Sustain-able Product Design: Additive Manufacturing,” J. Sustainable Dev., 3(3),pp. 68–75.
[26] Zhang, P., Toman, J., Yu, Y., Biyikli, E., Kirca, M., Chmielus, M., and To, A.C., 2015, “Efficient Design-Optimization of Variable-Density Hexagonal Cellu-lar Structure by Additive Manufacturing: Theory and Validation,” ASME J.Manuf. Sci. Eng., 137(2), p. 021004.
[27] Vincent, J., 2006, “Emotional Attachment and Mobile Phones,” Knowl. Tech-nol. Policy, 19(1), pp. 39–44.
[28] Drizo, A., and Pegna, J., 2006, “Environmental Impacts of Rapid Proto-typing: An Overview of Research to Date,” Rapid Prototyping J., 12(2),pp. 64–71.
[29] PR�e Sustainability, 1995, “The Eco-indicator 95,” PR�e Consultants, Amers-foort, The Netherlands, NOH 9523.
[30] Beltoft, V., and Nielson, E., 2003, “Evaluation of Health Hazards by Exposureto Propylene Carbonate and Estimation of a Limit Value in Air,” Safety andHeath Topics: NIOSH/OSHA/DOE Health Guidelines, The National Institutefor Occupational Safety and Health, Atlanta, GA.
[31] Ruffo, M., Tuck, C., and Hague, R., 2006, “Cost Estimation for RapidManufacturing—Laser Sintering Production for Low to Medium Volumes,”Proc. Inst. Mech. Eng., Part B, 220(9), pp. 1417–1427.
[32] Hague, R., Mansour, S., and Saleh, N., 2004, “Material and Design Consid-erations for Rapid Manufacturing,” Int. J. Prod. Res., 42(22), pp.4691–4708.
[33] Kellens, K., Dewulf, W., Deprez, W., Yasa, E., and Duflou, J., 2010,“Environmental Analysis of SLM and SLS Manufacturing Processes,”LCE2010 Conference, Hefei, China, pp. 423–428.
[34] Baumers, M., Tuck, C., Hague, R., Ashcroft, I., and Wildman, R., 2010, “AComparative Study of Metallic Additive Manufacturing Power Consumption,”Solid Freeform Fabrication Symposium, University of Texas, Austin, TX, pp.278–288.
[35] Wohlers, T., and Caffrey, T., 2013, “Additive Manufacturing: Going Main-stream,” Manuf. Eng., 151(6), pp. 67–73.
[36] McNulty, C. M., Arnas, N., and Campbell, T. A., 2012, “DH-073: Toward thePrinted World: Additive Manufacturing and Implications for NationalSecurity,” DTIC Document, Defense Technical Information Center, Ft. Belvoir,VA.
[37] Meteyer, S., Xu, X., Perry, N., and Zhao, Y. F., 2014, “Energy and MaterialFlow Analysis of Binder-Jetting Additive Manufacturing Processes,” ProcediaCIRP, 15, pp. 19–25.
[38] Kellens, K., Yasa, E., Renaldi, R., Dewulf, W., Kruth, J.-P., and Duflou, J.,2011, “Energy and Resource Efficiency of SLS/SLM Processes,” Solid Free-form Fabrication Symposium, University of Texas, Austin, TX, pp. 1–16.
[39] Lindemann, C., Jahnke, U., Moi, M., and Koch, R., 2013, “Impact and Influ-ence Factors of Additive Manufacturing on Product Lifecycle Costs,” SolidFreeform Fabrication Symposium, University of Texas, Austin, TX, pp.998–1009.
[40] Rosen, D. W., 2007, “Computer-Aided Design for Additive Manufacturing ofCellular Structures,” Comput. Aided Des. Appl., 4(5), pp. 585–594.
[41] Le Bourhis, F., Kerbrat, O., Hascoet, J.-Y., and Mognol, P., 2013,“Sustainable Manufacturing: Evaluation and Modeling of EnvironmentalImpacts in Additive Manufacturing,” Int. J. Adv. Manuf. Technol., 69(9–12),pp. 1927–1939.
Journal of Manufacturing Science and Engineering OCTOBER 2016, Vol. 138 / 101004-9
Downloaded From: http://manufacturingscience.asmedigitalcollection.asme.org/ on 11/05/2016 Terms of Use: http://www.asme.org/about-asme/terms-of-use

[42] Verma, A., and Rai, R., 2013, “Energy Efficient Modeling and Optimization ofAdditive Manufacturing Processes,” Solid Freeform Fabrication Symposium,Austin, TX, pp. 231–241.
[43] Beyer, C., 2014, “Strategic Implications of Current Trends in Additive Man-ufacturing,” ASME J. Manuf. Sci. Eng., 136(6), p. 064701.
[44] Pan, Y., Zhou, C., and Chen, Y., 2012, “Rapid Manufacturing in Minutes: TheDevelopment of a Mask Projection Stereolithography Process for High-SpeedFabrication,” ASME Paper No. MSEC2012-7232.
[45] Xu, K., and Chen, Y., 2015, “Mask Image Planning for Deformation Control inProjection-Based Stereolithography Process,” ASME J. Manuf. Sci. Eng.,137(3), p. 031014.
[46] Hasan, S., and Rennie, A. E. W., 2008, “The Application of Rapid Manufactur-ing Technologies in the Spare Parts Industry,” 19th Annual International SolidFreeform Fabrication (SFF) Symposium, Austin, TX, Aug. 4–8, pp. 584–590.
[47] Envisiontec, 2012, “Material Safety Data Sheet (MSDS): Photopolymer R05,”Envisiontec, Dearborn, MI.
[48] Envisiontec, 2010, “Material Safety Data Sheet (MSDS): Photopolymer Indus-trial Shell SI 300, SI 500,” Envisiontec, Dearborn, MI.
[49] Fluke Corporation, “Fluke 430 Series II Three-Phase Power Qualityand Energy Analyzers Technical Data Sheet,” Fluke Corporation, Everett,WA.
[50] Fluke Corporation, “Fluke 80i-110s AC/DC Current Probe Technical DataSheet,” Fluke Corporation, Everett, WA.
[51] Goedkoop, M., Heijungs, R., Huijbregts, M., Schryver, A. D., Struijs, J., andZelm, R., 2009, “ReCiPe 2008,” PR�e Consultants, Amersfoort, TheNetherlands.
[52] de Berg, M., van Kreveld, M., Overmars, M., and Schwarzkopf, O. C., 2000,Computational Geometry, Springer, Heidelberg, Germany.
101004-10 / Vol. 138, OCTOBER 2016 Transactions of the ASME
Downloaded From: http://manufacturingscience.asmedigitalcollection.asme.org/ on 11/05/2016 Terms of Use: http://www.asme.org/about-asme/terms-of-use