Embed Size (px)
Citation preview
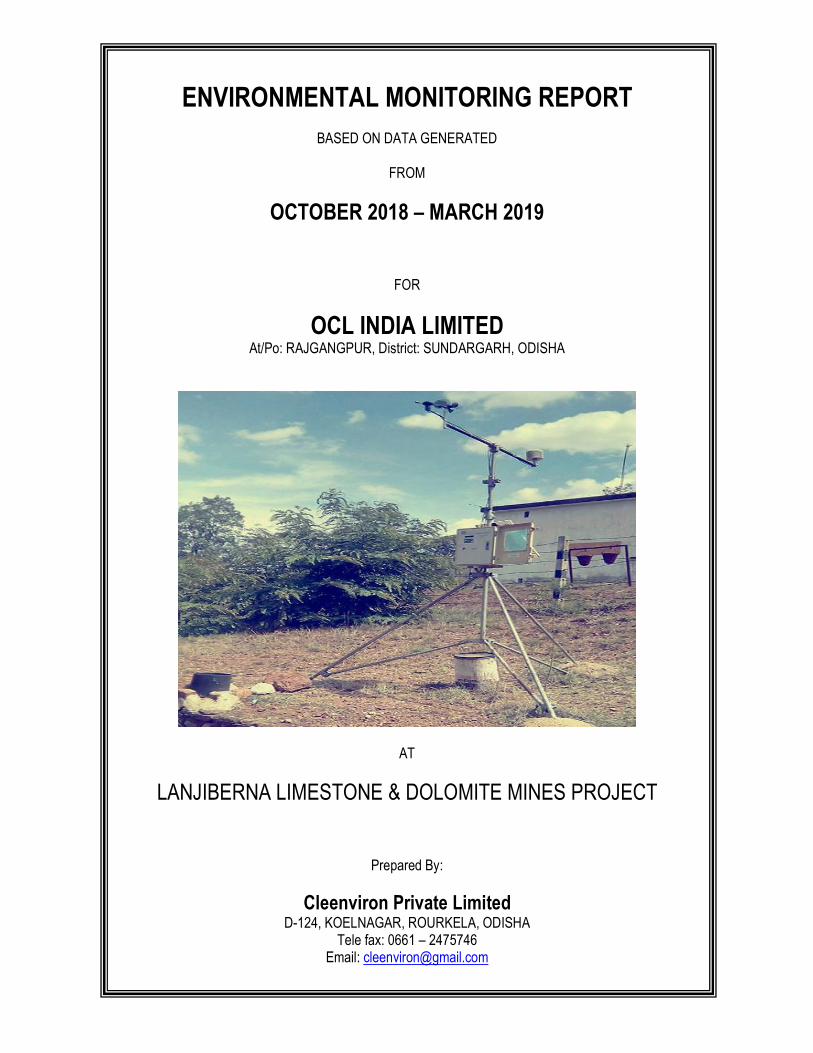
ENVIRONMENTAL MONITORING REPORT
BASED ON DATA GENERATED
FROM
OCTOBER 2018 – MARCH 2019
FOR
OCL INDIA LIMITED At/Po: RAJGANGPUR, District: SUNDARGARH, ODISHA
AT
LANJIBERNA LIMESTONE & DOLOMITE MINES PROJECT
Prepared By:
Cleenviron Private Limited D-124, KOELNAGAR, ROURKELA, ODISHA
Tele fax: 0661 – 2475746 Email: [email protected]
2
TABLE OF CONTENTS
Chapter No Name of Chapter Page No
1 INTRODUCTION 5
2 PRESENT STATUS OF THE PROJECT 5
3 ASPECTS CONSIDERED FOR ENVIRONMENTAL MONITORING 8
4 SAMPLING LOCATIONS 10
5 METHODOLOGY OF SAMPLING & ANALYTICAL PROCEDURES 13
6 DATA ANALYSIS 14
7 CONCLUSION 40
3
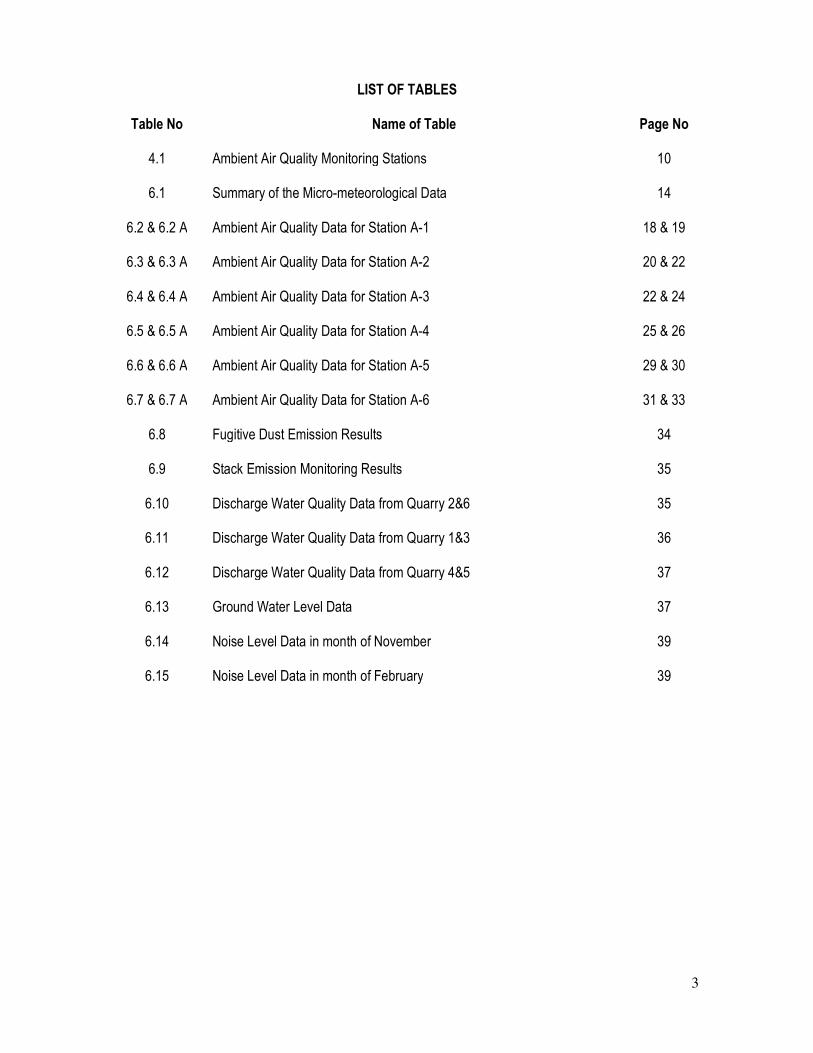
LIST OF TABLES
Table No Name of Table Page No
4.1 Ambient Air Quality Monitoring Stations 10
6.1 Summary of the Micro-meteorological Data 14
6.2 & 6.2 A Ambient Air Quality Data for Station A-1 18 & 19
6.3 & 6.3 A Ambient Air Quality Data for Station A-2 20 & 22
6.4 & 6.4 A Ambient Air Quality Data for Station A-3 22 & 24
6.5 & 6.5 A Ambient Air Quality Data for Station A-4 25 & 26
6.6 & 6.6 A Ambient Air Quality Data for Station A-5 29 & 30
6.7 & 6.7 A Ambient Air Quality Data for Station A-6 31 & 33
6.8 Fugitive Dust Emission Results 34
6.9 Stack Emission Monitoring Results 35
6.10 Discharge Water Quality Data from Quarry 2&6 35
6.11 Discharge Water Quality Data from Quarry 1&3 36
6.12 Discharge Water Quality Data from Quarry 4&5 37
6.13 Ground Water Level Data 37
6.14 Noise Level Data in month of November 39
6.15 Noise Level Data in month of February 39
4
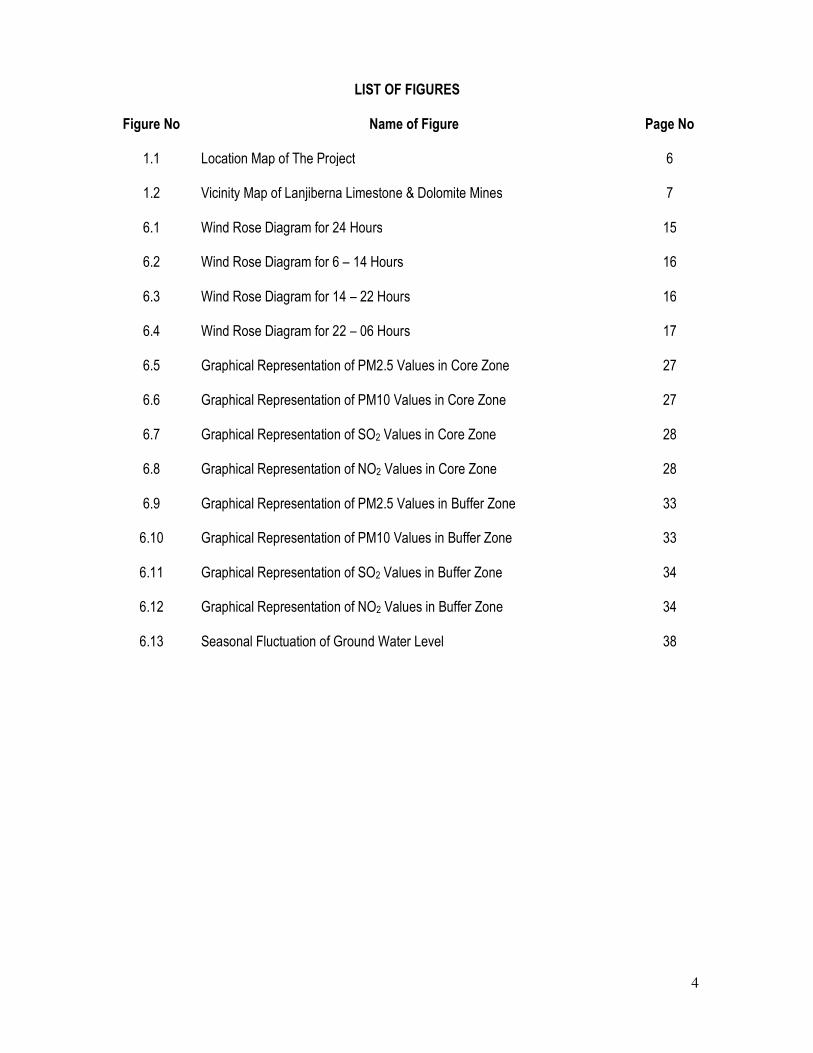
LIST OF FIGURES
Figure No Name of Figure Page No
1.1 Location Map of The Project 6
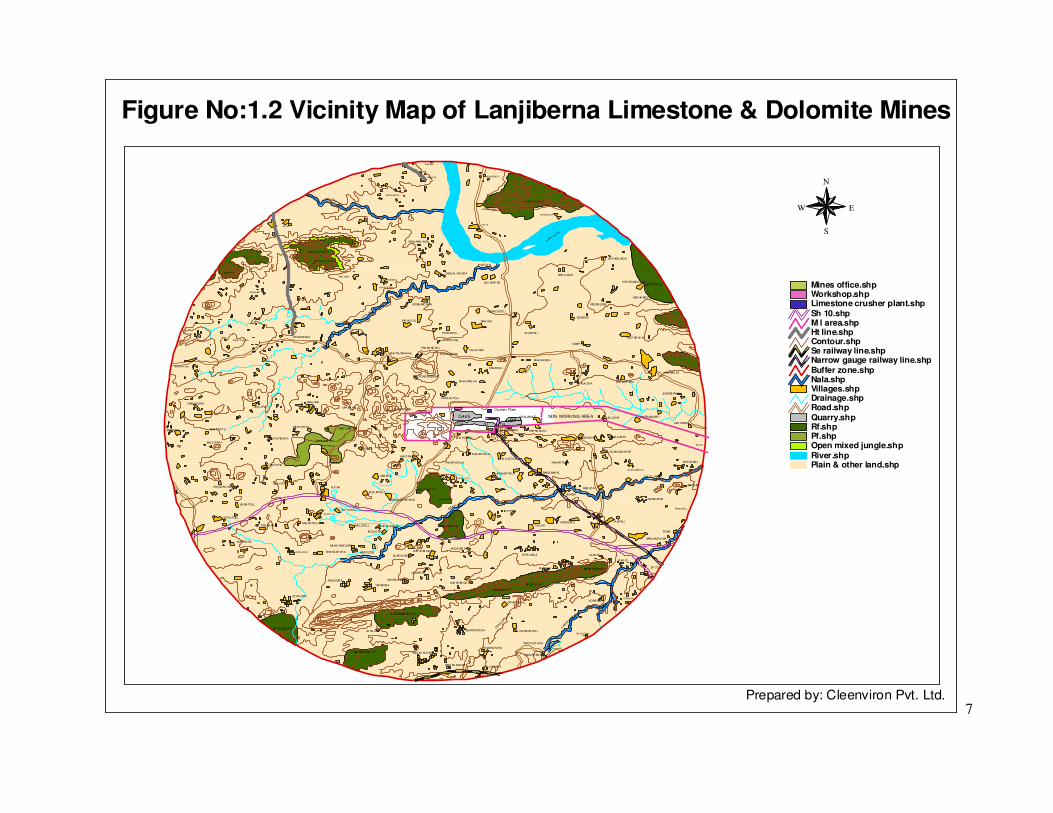
1.2 Vicinity Map of Lanjiberna Limestone & Dolomite Mines 7
6.1 Wind Rose Diagram for 24 Hours 15
6.2 Wind Rose Diagram for 6 – 14 Hours 16
6.3 Wind Rose Diagram for 14 – 22 Hours 16
6.4 Wind Rose Diagram for 22 – 06 Hours 17
6.5 Graphical Representation of PM2.5 Values in Core Zone 27
6.6 Graphical Representation of PM10 Values in Core Zone 27
6.7 Graphical Representation of SO2 Values in Core Zone 28
6.8 Graphical Representation of NO2 Values in Core Zone 28
6.9 Graphical Representation of PM2.5 Values in Buffer Zone 33
6.10 Graphical Representation of PM10 Values in Buffer Zone 33
6.11 Graphical Representation of SO2 Values in Buffer Zone 34
6.12 Graphical Representation of NO2 Values in Buffer Zone 34
6.13 Seasonal Fluctuation of Ground Water Level 38
5
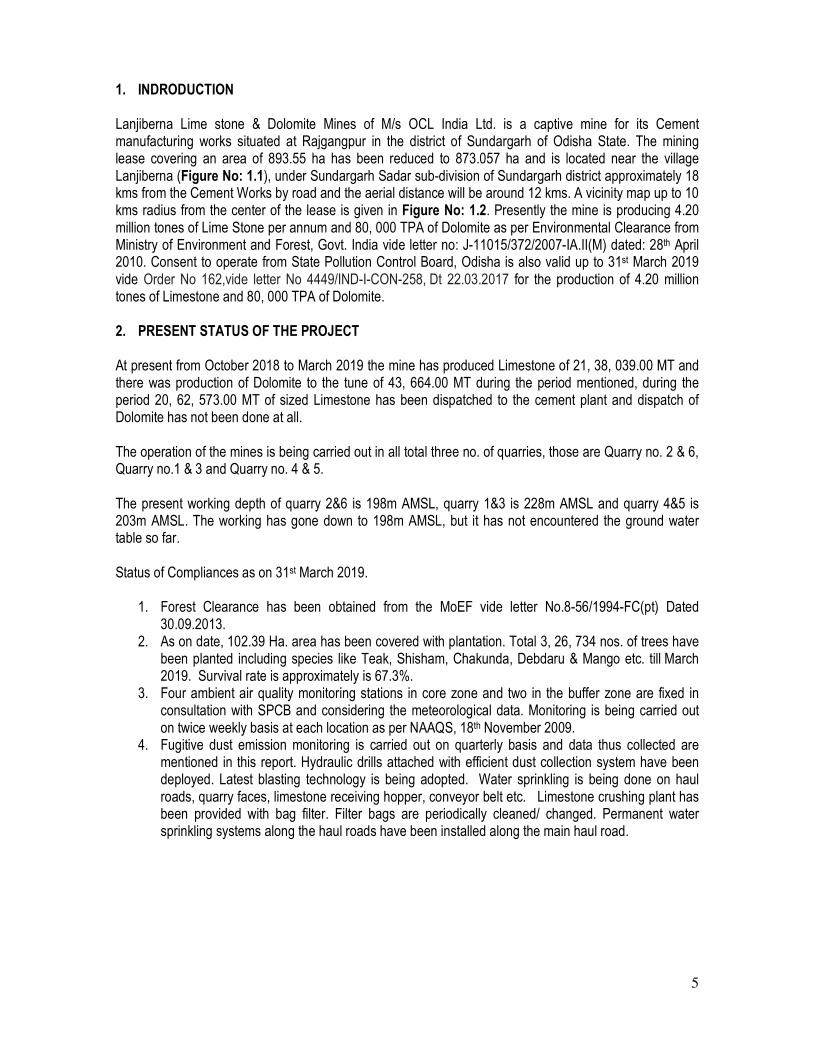
1. INDRODUCTION Lanjiberna Lime stone & Dolomite Mines of M/s OCL India Ltd. is a captive mine for its Cement manufacturing works situated at Rajgangpur in the district of Sundargarh of Odisha State. The mining lease covering an area of 893.55 ha has been reduced to 873.057 ha and is located near the village Lanjiberna (Figure No: 1.1), under Sundargarh Sadar sub-division of Sundargarh district approximately 18 kms from the Cement Works by road and the aerial distance will be around 12 kms. A vicinity map up to 10 kms radius from the center of the lease is given in Figure No: 1.2. Presently the mine is producing 4.20 million tones of Lime Stone per annum and 80, 000 TPA of Dolomite as per Environmental Clearance from Ministry of Environment and Forest, Govt. India vide letter no: J-11015/372/2007-IA.II(M) dated: 28th April 2010. Consent to operate from State Pollution Control Board, Odisha is also valid up to 31st March 2019 vide Order No 162,vide letter No 4449/IND-I-CON-258, Dt 22.03.2017 for the production of 4.20 million tones of Limestone and 80, 000 TPA of Dolomite. 2. PRESENT STATUS OF THE PROJECT At present from October 2018 to March 2019 the mine has produced Limestone of 21, 38, 039.00 MT and there was production of Dolomite to the tune of 43, 664.00 MT during the period mentioned, during the period 20, 62, 573.00 MT of sized Limestone has been dispatched to the cement plant and dispatch of Dolomite has not been done at all. The operation of the mines is being carried out in all total three no. of quarries, those are Quarry no. 2 & 6, Quarry no.1 & 3 and Quarry no. 4 & 5. The present working depth of quarry 2&6 is 198m AMSL, quarry 1&3 is 228m AMSL and quarry 4&5 is 203m AMSL. The working has gone down to 198m AMSL, but it has not encountered the ground water table so far. Status of Compliances as on 31st March 2019.
1. Forest Clearance has been obtained from the MoEF vide letter No.8-56/1994-FC(pt) Dated 30.09.2013.
2. As on date, 102.39 Ha. area has been covered with plantation. Total 3, 26, 734 nos. of trees have been planted including species like Teak, Shisham, Chakunda, Debdaru & Mango etc. till March 2019. Survival rate is approximately is 67.3%.
3. Four ambient air quality monitoring stations in core zone and two in the buffer zone are fixed in consultation with SPCB and considering the meteorological data. Monitoring is being carried out on twice weekly basis at each location as per NAAQS, 18th November 2009.
4. Fugitive dust emission monitoring is carried out on quarterly basis and data thus collected are mentioned in this report. Hydraulic drills attached with efficient dust collection system have been deployed. Latest blasting technology is being adopted. Water sprinkling is being done on haul roads, quarry faces, limestone receiving hopper, conveyor belt etc. Limestone crushing plant has been provided with bag filter. Filter bags are periodically cleaned/ changed. Permanent water sprinkling systems along the haul roads have been installed along the main haul road.
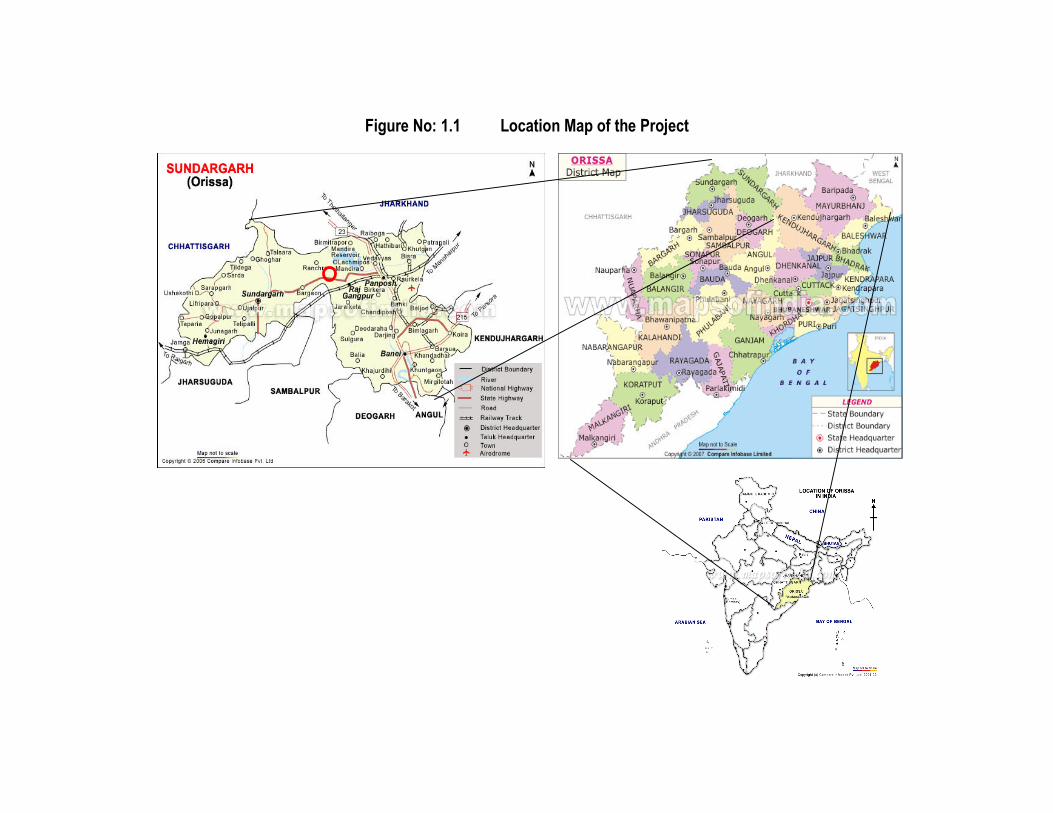
Figure No: 1.1 Location Map of the Project
7
JU RA JAM
MUNDALA SA R F RAIK AK ACHAR
RAIK AK ACHARKHILJRIPARA
CHAMRA PA RA
GA RIOMUNDA
FAKA RP AR A
RANTHUP ARA
CH ANDOTOLI
LUHURABE RNI R F
BHAJUDUMA
FA
KI IAO
AR
A N
VORA NALPORNNGN
LIP LOL
LA MLOI
LA MLOI
MA HA BI PA HA L
GUDIA LI R F
GURJA N
SONGORJALL
TUNMURA RF
GE
NU
J ARIA
N
KUK URBHUK A
TETE LKELA
KHORIDE PA
GUMAR D
KANSB AHA L
TURMUR A
ATOMIORA
SLYA LJOR
JA MPALI
SAMLAIMUNDA
PODA
KUNMUROTALDIH
JHORBERO
KHA TANG R F
NA KH JOR
KHATANG R F
KHA TANG R F
GUNDU NGO
KUK URBHUK A
KULUPA RA
TEN GHARA
PURNAPANI BHA NGAP ARA NAK H JOR
MA HA TWA OARA
KAS NOTOLL
CHUNITOLL
MA LUTOLL
TAUTATOLL
BOULDERS
MA NGOBURA
GOTIA TOLL
JINDA TOLL
KANDOMUNDAGINJATOLL
KUT RA
KUS UMTOLL
DHANGA RDHUKA
UAB ERA
KHA TANG
LAKHATOLA
PANDR ATOLA
JA NGARTOLA
PALK ATOLA
KUS HINTOLA
RAMA BAH AL
TEMKATOL L
BAIP UR
GA RB HONA
PAH ARTOLA
JA MDIH
BAB UDIH
NAK TI JAR
KES RA MA L
DUNDKABAHA R
DUNDKAB AHAR
PAROD
JA LUDIHI
JA LUDIHI
SARGIPA
KHE RA MUTALA NJIB ERNA
CH ALIAMA TI
LIB ER AMOPORDO LE
TIKILPA RA
BALS IPARA
BHOGRA BHA TTITA LI
KIRINGSIRA
LA PURB ERA
MA KH ATOLL
DAHIJIRA P F
DAHIJIRA B R
DAHIJIRA
DAHIJIRA
UPA BA HALCHARBANDA
IRIBORO
PATRAS TOLI
DHAURAD HA
POHORGOKA R
TANATOLI
BIHA BA NDH
KUK UR ABANGOP ARA
CHORAGMAR I
KES TAMAL
KADAMD IHI
JHARBE RNA
KULE NB AH AL
DAMP AS
GY ANPALI
DOMPOS
KENDA LMAL
KAS HA MOL
JA PTOTOLLKUK URAMUND A
HAT HIMUND A
BHE LUIDIH
LOC HMIP OS
JHARTA N
RAIK ANI
KUMHOSTOLI
CHHA TION
PHA RS AKA NI
PATRATOLL
SOHONTOLL
PHA RS OK AN I
KHA TKURB AHAL
URAIMUNDA
JHAR
IA NA LA
LAKRO BERNA
RAIBEHAL
AMG OBHA
KAHAPANI
OPE N MIXED JUNGL E
BANGL ARAHAR R F
EL GA
TAMB U NA LA
ARUPISA
SAMLAIMUNDA
SAMLAL MUNDA
SONB ARCHHA
PATIA TOLI
KANGOBIRA
JHANDAPAHAR R F
DAL KI
JHANA APAHAR
MUNGDUO R
TARKERA
BIJADIHI
KAHJAP ATHAL
JIMPANI
GHANTCHNAPA
PAGNIABAHA
LA TALA GA R F
LAMIT R F
SAN
KHA R
IVER
BHUYA NTOLI
Crushe r Plant
Q-4&5Q-6
Q-2Q-1Q-3
NON WORKING AREA
Plain & other land.shpRiver.shp
Open mixed jungle.shpPf.shpRf.shpQuarry.shp
Road.shpDrainage.shpVillages.shpNala.shpBuffer zone.shp
Narrow gauge railway line.shpSe railway line.shpContour.shpHt line.shpM l area.shpSh 10.shp
Limestone crusher plant.shpWorkshop.shpMines office.shp
N
EW
S
Figure No:1.2 Vicinity Map of Lanjiberna Limestone & Dolomite Mines
Prepared by: Cleenviron Pvt. Ltd.
5. To control noise levels below 85 dB(A), latest blasting technology is being adopted. Drill bits are being timely sharpened. Preventive maintenance of diesel driven quarry equipment is being done as per OEM’s recommendations. Workers engaged in blasting & drilling operations and in operating HEMM have been provided with ear plugs/ muffs.
6. Wastewater from garage and workshop are carried to oil separation system (oil & grease trap) and the water is recycled. There is no discharge from the workshop. Water discharged from the quarry pits passes through long drainage and discharge to settling tanks. Thereafter, the water is allowed to discharge to the nearby agricultural land for ultimate usage by the tenants for cultivation purpose as per advice of District Administration. The quality of water is regularly monitored from approved laboratories and is found well within the prescribed norms. The discharge water from quarry pits is monitored on quarterly basis and the data collected is mentioned in this report.
7. Environmental management Cell has been set up and functioning. 3. ASPECTS CONSIDERED FOR ENVIRONMENTAL MONITORING This report is based on the monitoring results generated from October 2018 to March 2019 covering post-monsoon and winter seasons of the year. Micro-meteorological monitoring was carried out on continuous basis and Ambient Air monitoring was carried out on twice weekly basis at each location and Stack Emission from Limestone Crusher Plant was carried out on monthly once basis. However other aspects like, Water quality, Fugitive Dust Emission monitoring and Noise level studies are carried out on quarterly basis, i.e. during November and February months of the year. Environmental Monitoring data were generated at Lanjiberna Limestone & Dolomite Mines and its buffer zone covering the following aspects in detail.
i. Micro-meteorological Study ii. Ambient Air Quality Study iii. Fugitive Dust Emission Study iv. Stack Emission Monitoring from Crusher Plant v. Quarry Discharge Water Quality Study vi. Ground Water Level Study vii. Noise Level Study viii. Effluent Water Quality Study
Monitoring of environmental parameters for collection of data involves field work, which is described below:
3.1 Micro-meteorological Study For collection of micro-meteorological data like Temperature, Relative Humidity, Wind Speed, Wind Direction, & Rainfall, a weather monitoring station is fixed on the Magazine Hill Top of Lanjiberna Limestone and Dolomite Mines of M/s OCL India Ltd. Hourly data is being recorded continuously by putting up windows compatible data logging facility instrument, Make: Virtual Electronics Company, Roorkee. 3.2 Ambient Air Monitoring To assess ambient air quality, total 6 (six) monitoring stations are fixed including 4 (four) in the Core zone and 2(two) in the buffer zone. The monitoring locations are fixed according to the micro-meteorological data and in consultation with State Pollution Control Board. The monitoring was carried out for parameters like PM2.5, PM10, SO2, NOx & CO and monitoring was carried out on twice weekly from each location. For collection of samples Respirable Dust sampler with PM2.5 attachment was placed at each location, sampling and analytical techniques are followed as per the standard method of ambient air sampling and analysis. The other parameters like NH3, O3, As, Ni, Pb, Benzene & Benzo(a)pyrene are monitored once in six months from all the six AAQ monitoring stations.
9
3.3 Fugitive Dust Emission Monitoring To find out the quantity of fugitive dust emission from the mining operation, two main dust generating locations are identified and those are within the quarry during operation of Excavators and Drill machines. The second location was set up on the haulage road of the mines leading to Crusher Plant. For collection of samples two high volume samplers are used and 8 hourly samples are collected for Particulate Matter only. Fugitive monitoring was carried out on quarterly basis, during month of November for post-monsoon and February for winter season. 3.4 Stack Emission Monitoring from Crusher Plant The crusher plant of Lanjiberna Limestone and Dolomite mines is equipped with a Dust Extraction and Bag House Filter system to control the emission of dust particles during crushing operation of Limestone lumps in to required size. To assess the emission level of Particulate Matter from the stack of bag filter system, monitoring of Stack emission levels was scheduled on monthly once basis. Particulate Matter emission was monitored following the BIS methods for Stack monitoring. 3.5 Quarry Discharge Water Quality Study Total three locations were fixed for sampling of the quarry discharge water from three different quarries operating. The sampling and analysis of quarry discharge water were carried out on monthly basis. The parameters analyzed are as per the Schedule – IV of EPA, G.S.R.422(E), 1993. Few parameters like pH, Temperature and DO are recorded at the site. For other parameters the samples were fixed and preserved as per the standard methods of sampling by APHA 23rd Edition. 3.6 Ground Water Level Study To assess the ground water availability and fluctuation, a net work of 5(Five) existing dug wells are fixed, from where the ground water quality study were carried out during the month of May and one extra location was considered in the village Katang for ground water level measurement. To measure the ground water level piezometers are fixed at each dug wells and the variation of ground water level are being studied on quarterly basis during the months of November for post-monsoon season and February for winter season.
3.7 Noise Level Study Noise monitoring were carried out at 4(four) different locations within the Core zone once in three months period during November and February months. The measurements were collected by Sound Level Meter, make: Envirotech Instruments Pvt. Ltd., New Delhi, in dB(A) at a height of 1.5 meter, above ground level and away from the sound reflecting sources like walls and buildings etc. 3.8 Effluent Water Quality The waste water from Workshop/Garage of the Lanjiberna Limestone & Dolomite mines is directed to an Oil Separation Tank and after removal of Oil & TSS it is reused in HEMM washing. The outlet water from the Oil & Grease Separation tank was sampled and analysed for 5 (Five) parameters on quarterly basis during the months of November and February.
10
4. SAMPLING LOCATIONS 4.1 Micro-Meteorological Study One meteorological station was set up on the Magazine Hill Top of the Lanjiberna Limestone & Dolomite Mines to monitor wind speed, wind direction, temperature, relative humidity and rainfall on hourly basis by data logging technique. 4.2 Ambient Air Quality Monitoring Four ambient air quality monitoring stations are fixed within the core zone and two stations are fixed in the buffer zone. General precautions were taken to position the Respirable Dust Samplers at all the locations. The descriptions of the Ambient Air Monitoring Stations are as follows:
A-1 Near Quarry No – 2 Site Office: The sampling station is located within the core zone and the station was selected to assess the present level of pollution due to excavation, drilling works being carried out in the quarry no 2&6 and also the movement of crushed limestone from the crusher plant to the Cement Works at Rajgangpur, by belt conveyors systems. A-2 Limestone Crusher Plant Area: This location is around the Crusher plant area of the Mines within the core zone. This was selected to assess the air quality in and around the crusher plant and the level of pollution due to crushing, screening and transfer of Limestone to conveyor belts. A-3 Stone Crusher Plant The location was selected within the core zone and to assess the pollution load generated from the mini crusher plants situated near the northern boundary of the lease and near Quarry no 4&5.
A-4 Magazine Hill Top The location was selected within the core zone and to assess the effect of mining as well as crushing operations of the mine on the background air quality and sensitive receptors on the hill top which is at a higher elevation from the ground. A-5 Village Katang This location is situated in the buffer zone of the mine and selection of this location was done as to assess the effect of the mining operation on the local receptors, as this village is falling in the predominant wind direction towards south-west of the lease area. A-6 Village Bihabandh This location is situated in the buffer zone of the mine and selection of this location was done as to assess the effect of the mining operation on the local receptors, as this village is falling in the predominant wind direction towards north-east of the lease area.
The distances and directions of the Ambient Air Quality monitoring locations are summarized in Table No 4.1
Table No 4.1: Ambient Air Quality Monitoring Stations
Sl No Name of Location Zone Distance Direction
1 Quarry No-2 Site Office Core - -
2 Crusher Plant Area Core - -
3 Mini Crusher Plant Core - -
4 Magazine Hill Top Core - -
11
Sl No Name of Location Zone Distance Direction
5 Village Katang Buffer 1 km from ML Area SW
6 Village Bihabandh Buffer 2 km from ML Area NE
4.3 Fugitive Dust Emission Study Locations: Two fugitive dust emission monitoring locations are established inside the core zone, to find out the amount of dust being generated from the source during the excavation, drilling & hauling of Limestone to crusher plant. The descriptions of fugitive emission monitoring locations are as follows:
F-1 Downwind of Excavator/ Drill Machine within the Quarry This location was fixed within an operating quarry and while operation of mining equipments are on. Towards the down wind direction of any excavator or drill machine within a distance of 500 m, one high volume sampler was set for 8 hour operation and the parameter monitored is SPM general precautions are obeyed while collection of samples. F-2 Haulage Road Leading to Crusher Plant This location was fixed to evaluate the amount of pollution load on the ambient air due to moving of heavy earth moving equipments like 35T & 50T Dumpers on the haulage road which leads to the Limestone Crusher Plant. The samplers are being operated for continuous of 8 hours by the side of the haulage road and parameter like SPM was measured. 4.4 Stack Emission Monitoring: The stack of the bag filter unit installed at the limestone crusher plant was monitored for Particulate Matter emission from the same during the crushing of Limestone lumps in to different sizes. There is a platform made at a height around 25m from the ground at the stack and sample has been collected on monthly basis to evaluate the performance of the bag filters and emission level from the stack.
4.5 Quarry Discharge Water: In order to assess the present quality of water, which is being discharged on to the land after pumping out from the quarry. Three sampling locations were set at the discharge points of the pumped out water. The samples were being collected from each discharge point every month. The descriptions of the locations are given below: SW-1 Quarry 2&6 Discharge Water The water collected inside the quarry no-2&6 is pumped out continuously and is stored in a RCC tank before allowing it to flow out of the ML area by a guided channel towards the northern side of the lease and the water is used by the near by villagers for irrigation purpose. The sample were collected from the out let of the RCC tank and analyzed for 27 parameters as per the Schedule – VI of EPA, G.S.R.422(E) 1993 for any contaminants in it. SW-2 Quarry 1&3 Discharge Water The water collected inside the quarry no-1&3 is pumped out continuously and is stored in a RCC tank before allowing it to flow out of the ML area by a guided channel towards the southern side of the lease and the water is used by the near by villagers for irrigation purpose. The sample were collected from the out let of the RCC tank and analyzed for 27 parameters as per the Schedule – VI of EPA, G.S.R.422(E) 1993 for any contaminants in it. SW-3 Quarry 4&5 Discharge Water The water collected inside the quarry no-4&5 is pumped out continuously and is stored in a RCC tank before allowing it to flow out of the ML area by a guided channel towards the north-eastern side of the lease and the water is used by the near by villagers for irrigation purpose. The sample were collected from
12
the out let of the RCC tank and analyzed for 27 parameters as per the Schedule – VI of EPA, G.S.R.422(E) 1993 for any contaminants in it. 4.6 Ground Water Level: Ground water levels were measured during month of November and February to know the amount of seasonal fluctuation and availability of ground water during post-monsoon and winter seasons of the area. The details of the water level measurement locations are described below:
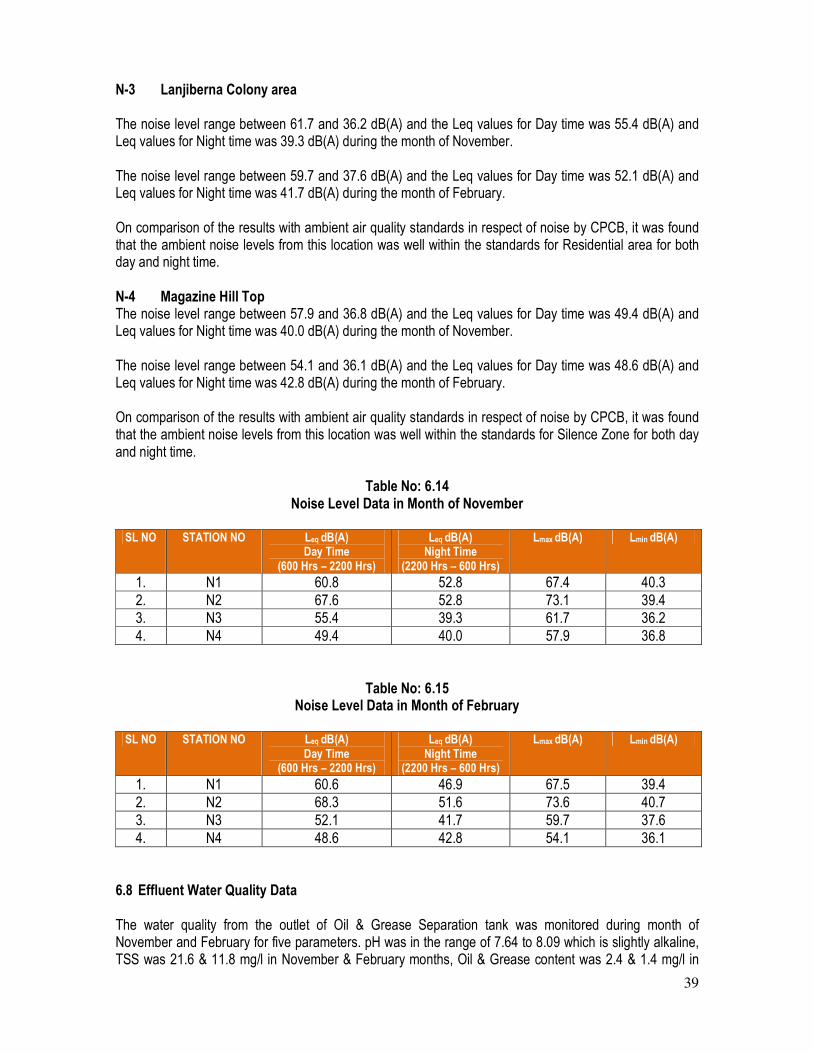
GW-1 Village Kheramuta Dug Well The water level was measured from the dug well of Kheramuta village for water availability as the villagers are using the dug well water for their domestic purpose. GW-2 Lanjiberna Colony Dug Well The water level was measured from the dug well of Lanjiberna Colony for water availability as the workers are using the dug well water for their domestic purpose. GW-3 Village Dhauradah Dug Well The water level was measured from the dug well of Dhauradah village for water availability as the villagers are using the dug well water for their domestic purpose. GW-4 Lanjiberna Mines Workshop Dug Well The water level was measured from the dug well of Lanjiberna Mines Workshop for water availability as the dug well is being used for domestic purpose. GW-5 Village Lanjiberna Dug Well The water level was measured from the dug well of Lanjiberna village for water availability as the villagers are using the dug well water for their domestic purpose. GW-6 Village Katang Dug Well The water level was measured from the dug well of Katang village for water availability as the villagers are using the dug well water for their domestic purpose. 4.7 Noise Level Monitoring Noise levels were measured at 4(four) different locations within the core zone only to assess the impact of the mining operation on the ambient noise level. A brief description of the monitoring location is given below: N-1 Quarry Area during Operation of HEMM This station was selected to assess the ambient noise level due to the operation of HEMM within the quarry area during ongoing mining works. The monitoring was carried out inside the quarry and at distance of 100 m from the operating machines. N-2 Limestone Crusher Plant area This station was selected to assess the ambient noise level due to the operation of Crusher Plant and crushing and screening operation of Limestone lumps. The monitoring was carried out at a distance of 100m from the Crusher building. N-3 Lanjiberna Colony Area This station was selected to assess the ambient noise level due to the mining activities and transportation of limestone to the Cement Plant by Railway wagons. The monitoring was carried out near the Lanjiberna Colony.
13
N-4 Magazine Hill Top This station was selected to assess the ambient noise level due to the mining activities and crushing of limestone and its impact on the background and sensitive receptors. The monitoring was carried out on the Magazine Hill top near the security search light post. 4.8 Effluent Water Quality Sampling Station The wash water of HEMM in workshop is directed to an Oil & Grease separation tank inside the garage premises and the treated water is reused in the washing process. The sample from the outlet of the Tank is collected on quarterly basis for analysis of 5 parameters and to find out the efficiency of the Oil & Grease separation process. 5. METHODOLOGY OF SAMPLING & ANALYTICAL PROCEDURES 5.1 Meteorological Study For recording various meteorological parameters like, Temperature, RH, Wind Speed, Wind Direction & Rainfall, a weather monitoring station, Make: Virtual Electronics Company, Roorkee was installed at the site. The instrument is equipped with windows based data logging software to store each data on hourly basis, which can be further down loaded to a PC and data can be interpreted as per the requirement of the report. 5.2 Ambient Air Monitoring Air quality samples were monitored for all parameters as per NAAQS. For sampling and analysis, methods prescribed by CPCB were followed and Respirable Dust Samplers (RDS) APM 460BL – 411TE, Make: Envirotech Instruments Pvt. Ltd. were used and for PM2.5 sampling AAS 190 attachment for fine particulate sampling along with RDS was used where ever necessary at the site. 5.3 Fugitive Dust Emission Monitoring Fugitive dust samples were monitored for parameter like, SPM only. For sampling and analysis ambient air monitoring methods prescribed by CPCB were followed and High Volume Samplers (HVS) APM 415, Make: Envirotech Instruments Pvt. Ltd. were used at the site. 8 hours continuous samplings were carried out once in three months at each location. 5.4 Stack Monitoring Stack monitoring were carried out once in every month from the bag filter outlet stack of the Limestone Crusher plant and the CPCB standard for monitoring of Stack emission was followed for collecting the sample and the concentration of Particulate Matter were calculated by following the standard methods of CPCB. For collection of sample Ecotech Instruments make Stack sampler Model: ESS -100 was used at the site. 5.5 Water Quality Sampling As per the standard practice, one sample from each station was collected once, during the month of August and November. Grab water samples were collected in plastic container by standard sampling technique. Necessary precautions were taken for sample preservation. The parameters like pH, Temp., Conductivity and DO were measured at the site by using portable water analysis kit from WTW, Germany. All other parameters were analysed as per the standard methods for Water and Waste Water analysis by APHA.
14
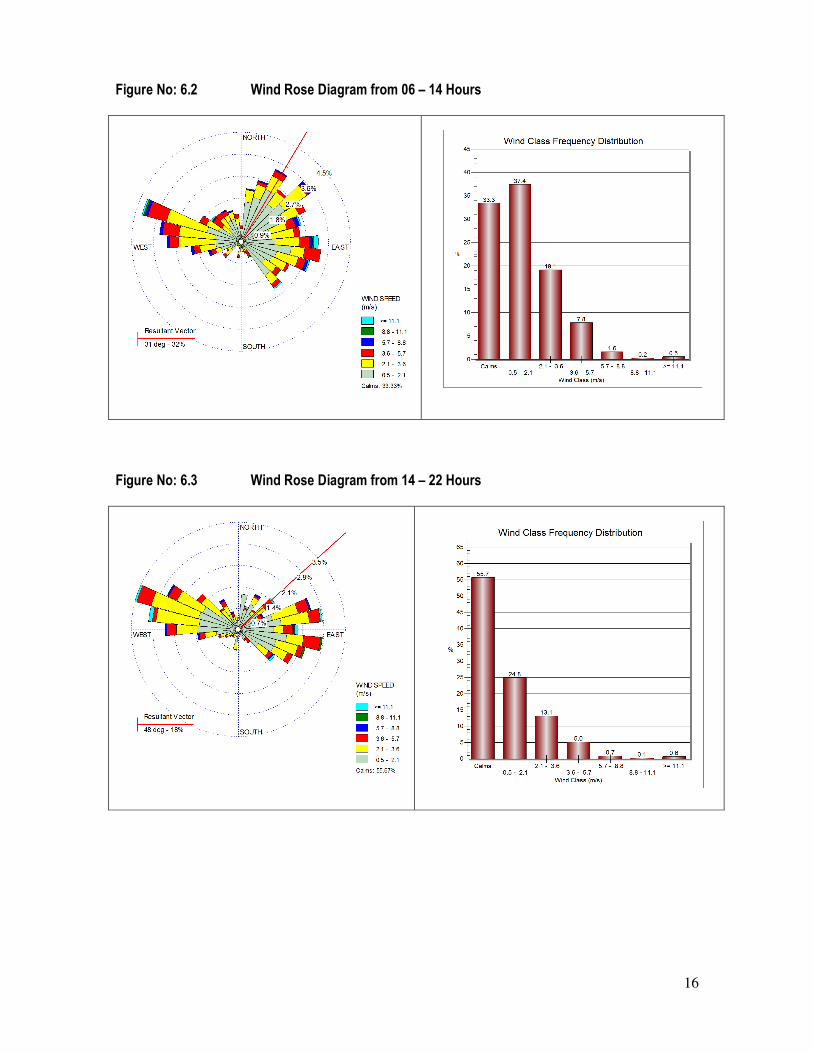
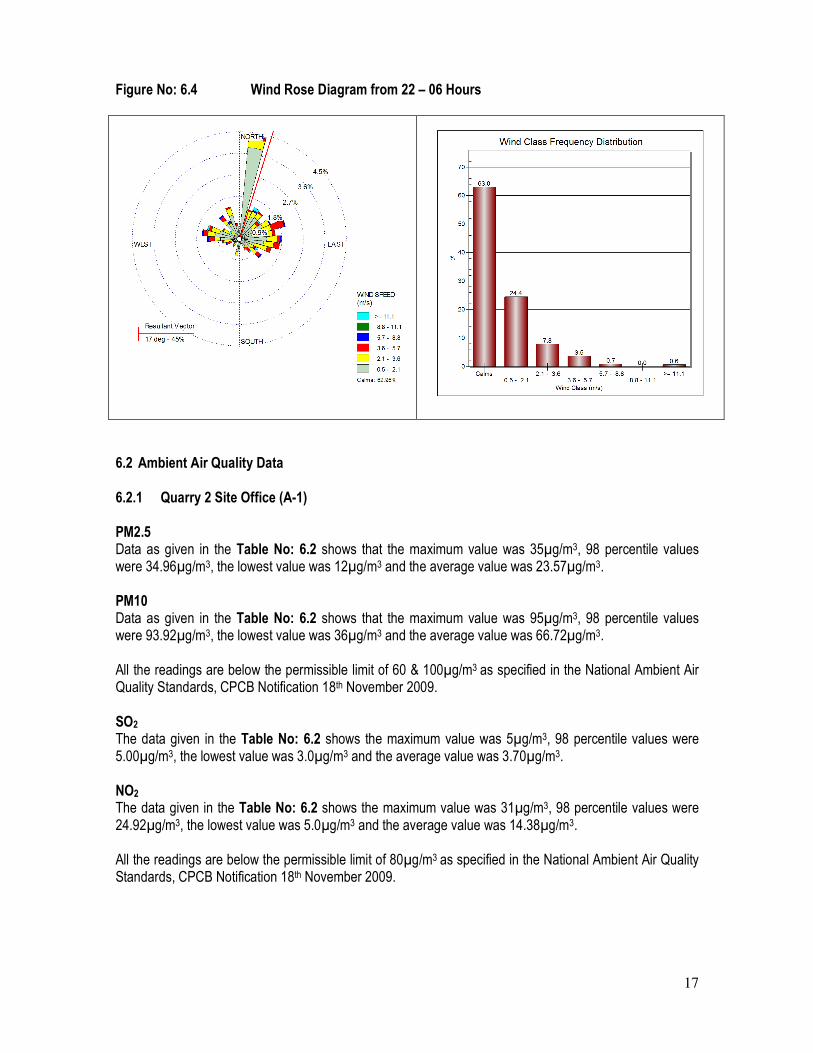
5.6 Noise Level Monitoring Ambient Noise level monitoring was carried out with an integrating Sound Level Meter, Model: SLM 100, Make: Envirotech Instruments Pvt. Ltd. in dB(A). The measurements were collected at a height of 1.5m from the ground level and away from any sound reflecting sources like walls and buildings etc. The Ambient Noise monitoring was carried out on continuous basis by the data logging system of the instrument and data are logged on at every minute for 24 hours. The Sound Pressure Level were measured and Lmin, Lmax & Leq Day Time and Leq Night Time were calculated and interpreted for data analysis. 6. DATA ANALYSIS 6.1 Micro-meteorological Study: 6.1.1 Wind Speed & Wind Direction During the entire period from 1st October to 31st March all total 4360 no. of data are recorded by the instrument and after interpretation of the collected data it was found that Calm condition prevailed over 51.08%, while considering the 24 hourly data. 33.33% calm condition prevailed from morning 6 hrs to 14hrs for the entire study period, 55.67% calm condition prevailed from 14hrs to 22hrs and 62.96% calm condition prevailed from 22hrs to 06hrs. The predominant wind directions were from NE with average wind speed 1.23 m/sec. The wind rose diagrams for the entire study period are depicted on the Figure No: 6.1, 6.2, 6.3 & 6.4. 6.1.2 Temperature The maximum & minimum temperature during the entire study period were divided in to three parts as the study period was covering post-monsoon, winter seasons and early summer season also. The Minimum temperature during the post-monsoon season was found to be 13.07oC and the Maximum temperature was found to be 34.87oC up to the end of 30th November.
The minimum and maximum temperature during the winter season i.e. from December to February was found to be 8.55oC and 34.41oC. During the month of March the minimum and maximum temperature was found to be 16.47oC and 39.18oC. Table No 6.1 shows a summary of micro-meteorological data collected for the entire period.
6.1.3 Rainfall The total rain fall from 1st October to 31st March was observed to be 658.7 mm. during the study period. A month wise rainfall data recorded at the site is depicted in Table No 6.1.
Table No: 6.1
A Summary of the Micro-meteorological Data Project Site : Lanjiberna Limestone & Dolomite Mines Location : Magazine Hill Top
Sl No Parameters From October’ 18 – March’ 19
1 Predominant Wind Direction From NE
2 Calm Condition % 51.08
3 Average Wind Speed m/sec 1.23
4 Temperature oC Post-monsoon Season Minimum
13.07
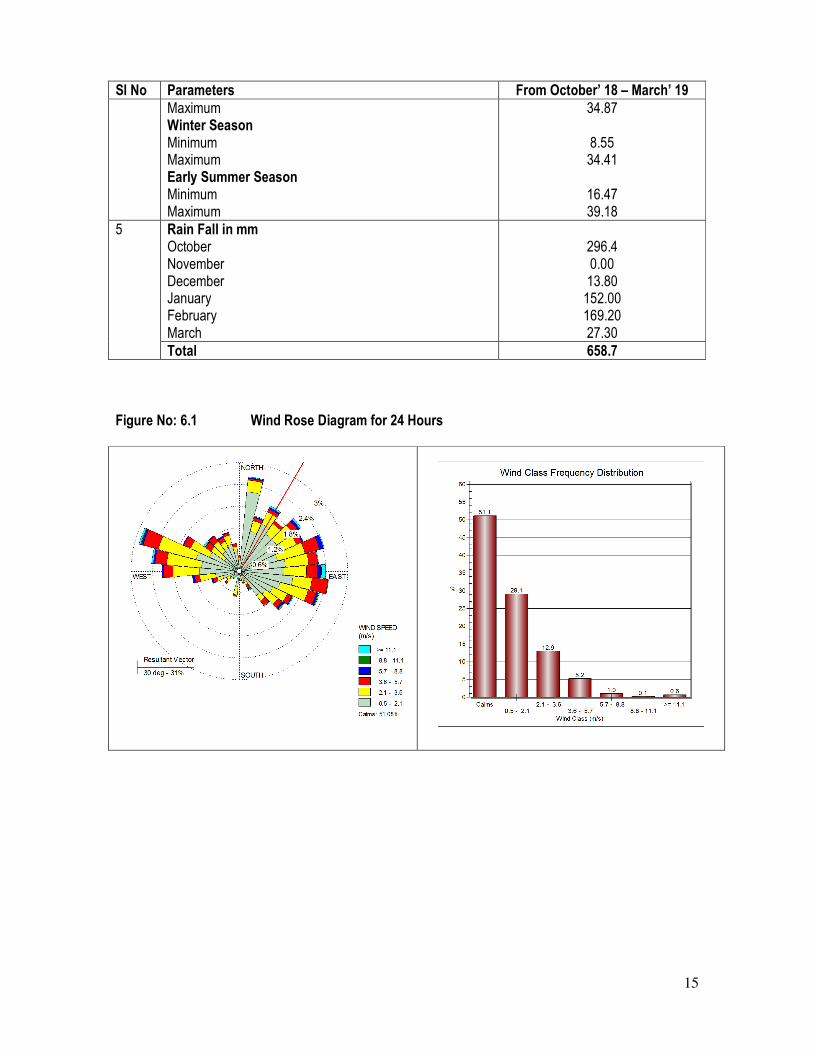
15
Sl No Parameters From October’ 18 – March’ 19
Maximum Winter Season Minimum Maximum Early Summer Season Minimum Maximum
34.87
8.55 34.41
16.47 39.18
5 Rain Fall in mm October November December January February March
296.4 0.00 13.80 152.00 169.20 27.30
Total 658.7
Figure No: 6.1 Wind Rose Diagram for 24 Hours
16
Figure No: 6.2 Wind Rose Diagram from 06 – 14 Hours
Figure No: 6.3 Wind Rose Diagram from 14 – 22 Hours
17
Figure No: 6.4 Wind Rose Diagram from 22 – 06 Hours
6.2 Ambient Air Quality Data 6.2.1 Quarry 2 Site Office (A-1)
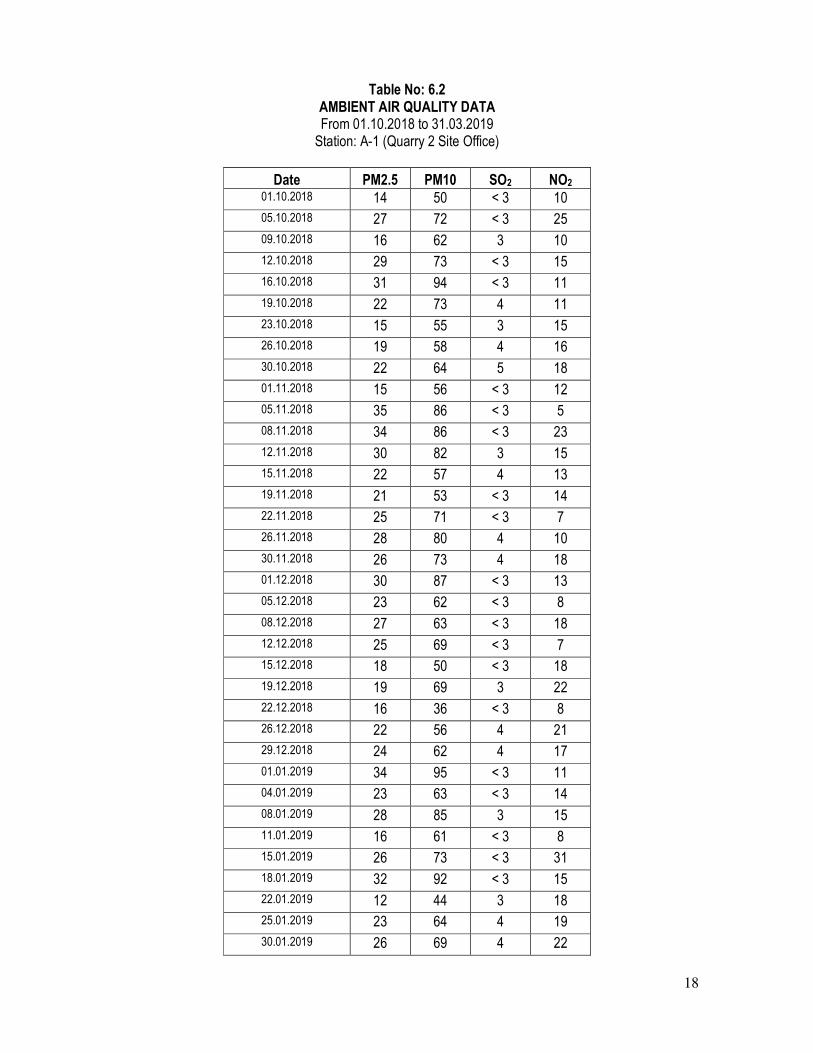
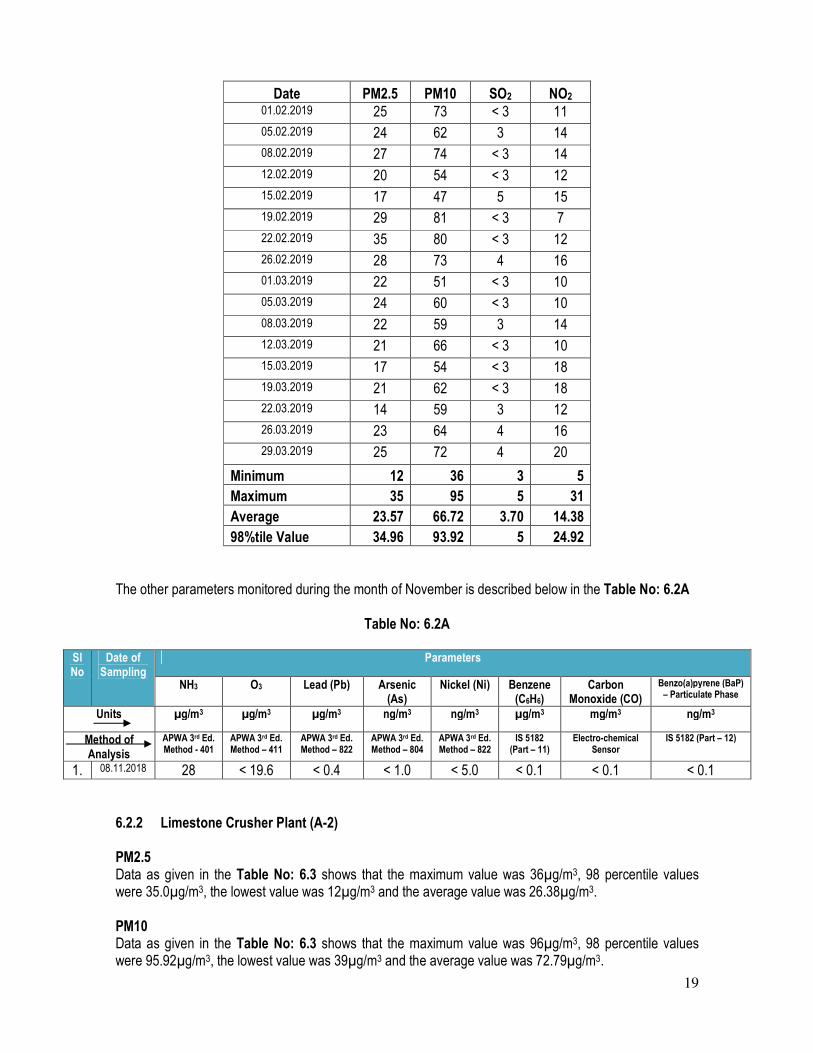
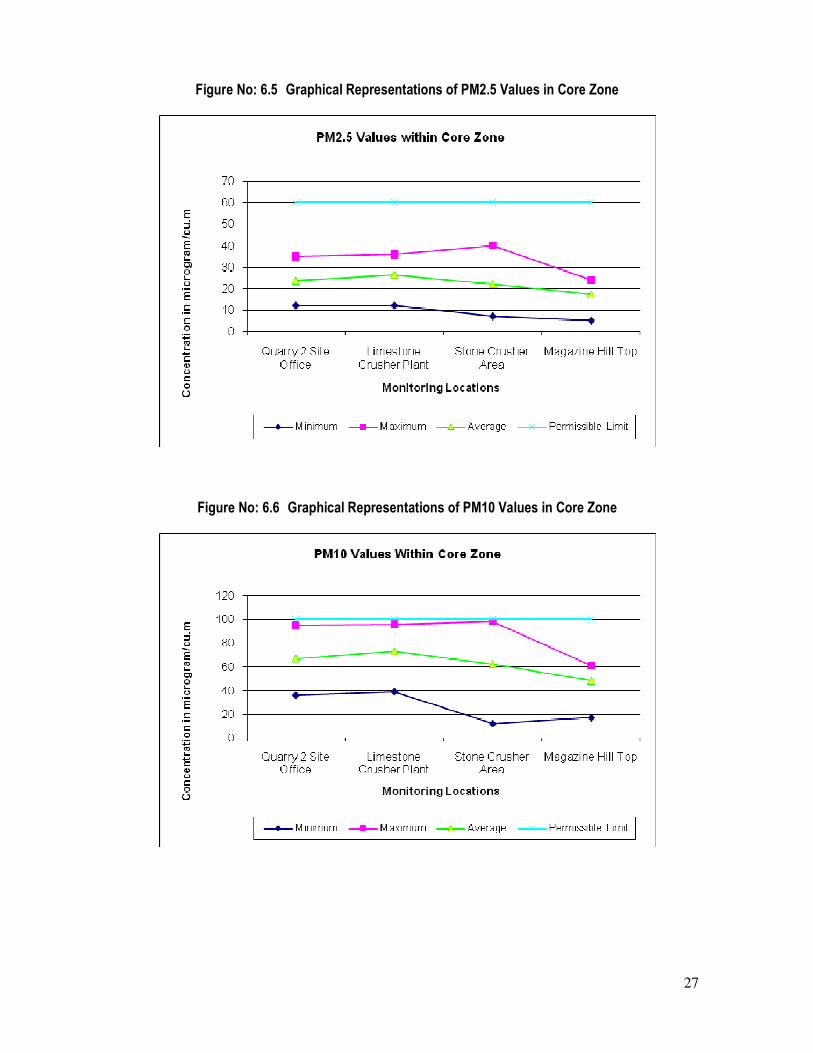
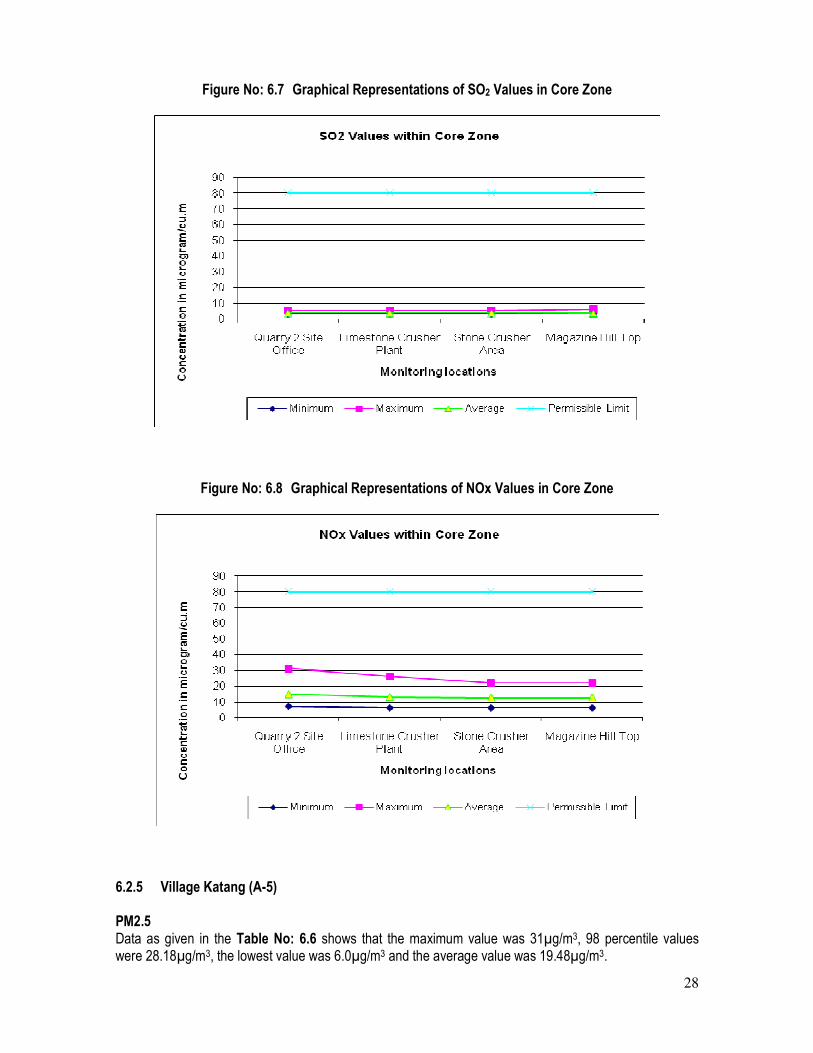
PM2.5 Data as given in the Table No: 6.2 shows that the maximum value was 35µg/m3, 98 percentile values were 34.96µg/m3, the lowest value was 12µg/m3 and the average value was 23.57µg/m3. PM10 Data as given in the Table No: 6.2 shows that the maximum value was 95µg/m3, 98 percentile values were 93.92µg/m3, the lowest value was 36µg/m3 and the average value was 66.72µg/m3. All the readings are below the permissible limit of 60 & 100µg/m3 as specified in the National Ambient Air Quality Standards, CPCB Notification 18th November 2009. SO2
The data given in the Table No: 6.2 shows the maximum value was 5µg/m3, 98 percentile values were 5.00µg/m3, the lowest value was 3.0µg/m3 and the average value was 3.70µg/m3. NO2 The data given in the Table No: 6.2 shows the maximum value was 31µg/m3, 98 percentile values were 24.92µg/m3, the lowest value was 5.0µg/m3 and the average value was 14.38µg/m3. All the readings are below the permissible limit of 80µg/m3 as specified in the National Ambient Air Quality Standards, CPCB Notification 18th November 2009.
18
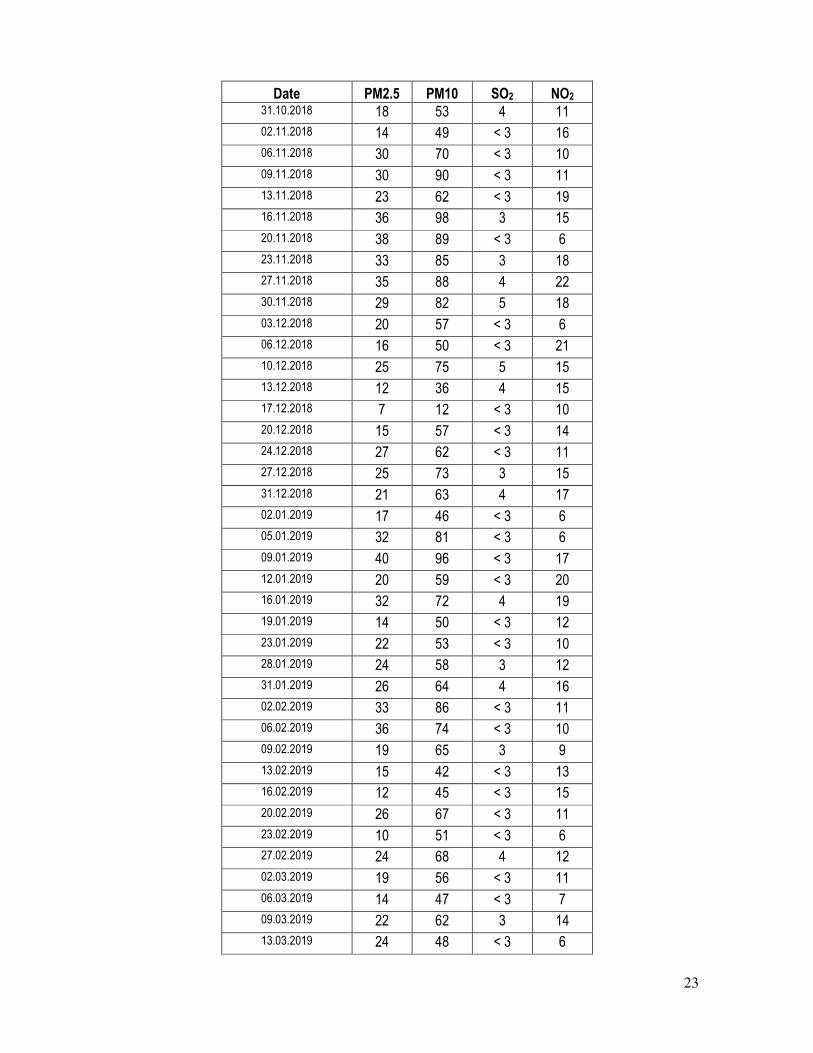
Table No: 6.2 AMBIENT AIR QUALITY DATA From 01.10.2018 to 31.03.2019 Station: A-1 (Quarry 2 Site Office)
Date PM2.5 PM10 SO2 NO2 01.10.2018 14 50 < 3 10
05.10.2018 27 72 < 3 25
09.10.2018 16 62 3 10
12.10.2018 29 73 < 3 15
16.10.2018 31 94 < 3 11
19.10.2018 22 73 4 11
23.10.2018 15 55 3 15
26.10.2018 19 58 4 16
30.10.2018 22 64 5 18
01.11.2018 15 56 < 3 12
05.11.2018 35 86 < 3 5
08.11.2018 34 86 < 3 23
12.11.2018 30 82 3 15
15.11.2018 22 57 4 13
19.11.2018 21 53 < 3 14
22.11.2018 25 71 < 3 7
26.11.2018 28 80 4 10
30.11.2018 26 73 4 18
01.12.2018 30 87 < 3 13
05.12.2018 23 62 < 3 8
08.12.2018 27 63 < 3 18
12.12.2018 25 69 < 3 7
15.12.2018 18 50 < 3 18
19.12.2018 19 69 3 22
22.12.2018 16 36 < 3 8
26.12.2018 22 56 4 21
29.12.2018 24 62 4 17
01.01.2019 34 95 < 3 11
04.01.2019 23 63 < 3 14
08.01.2019 28 85 3 15
11.01.2019 16 61 < 3 8
15.01.2019 26 73 < 3 31
18.01.2019 32 92 < 3 15
22.01.2019 12 44 3 18
25.01.2019 23 64 4 19
30.01.2019 26 69 4 22
19
Date PM2.5 PM10 SO2 NO2 01.02.2019 25 73 < 3 11
05.02.2019 24 62 3 14
08.02.2019 27 74 < 3 14
12.02.2019 20 54 < 3 12
15.02.2019 17 47 5 15
19.02.2019 29 81 < 3 7
22.02.2019 35 80 < 3 12
26.02.2019 28 73 4 16
01.03.2019 22 51 < 3 10
05.03.2019 24 60 < 3 10
08.03.2019 22 59 3 14
12.03.2019 21 66 < 3 10
15.03.2019 17 54 < 3 18
19.03.2019 21 62 < 3 18
22.03.2019 14 59 3 12
26.03.2019 23 64 4 16
29.03.2019 25 72 4 20
Minimum 12 36 3 5
Maximum 35 95 5 31
Average 23.57 66.72 3.70 14.38
98%tile Value 34.96 93.92 5 24.92
The other parameters monitored during the month of November is described below in the Table No: 6.2A
Table No: 6.2A
Sl No
Date of Sampling
Parameters
NH3 O3 Lead (Pb) Arsenic (As)
Nickel (Ni) Benzene (C6H6)
Carbon Monoxide (CO)
Benzo(a)pyrene (BaP) – Particulate Phase
Units µg/m3 µg/m3 µg/m3 ng/m3 ng/m3 µg/m3 mg/m3 ng/m3
Method of Analysis
APWA 3rd Ed. Method - 401
APWA 3rd Ed. Method – 411
APWA 3rd Ed. Method – 822
APWA 3rd Ed. Method – 804
APWA 3rd Ed. Method – 822
IS 5182 (Part – 11)
Electro-chemical Sensor
IS 5182 (Part – 12)
1. 08.11.2018 28 < 19.6 < 0.4 < 1.0 < 5.0 < 0.1 < 0.1 < 0.1
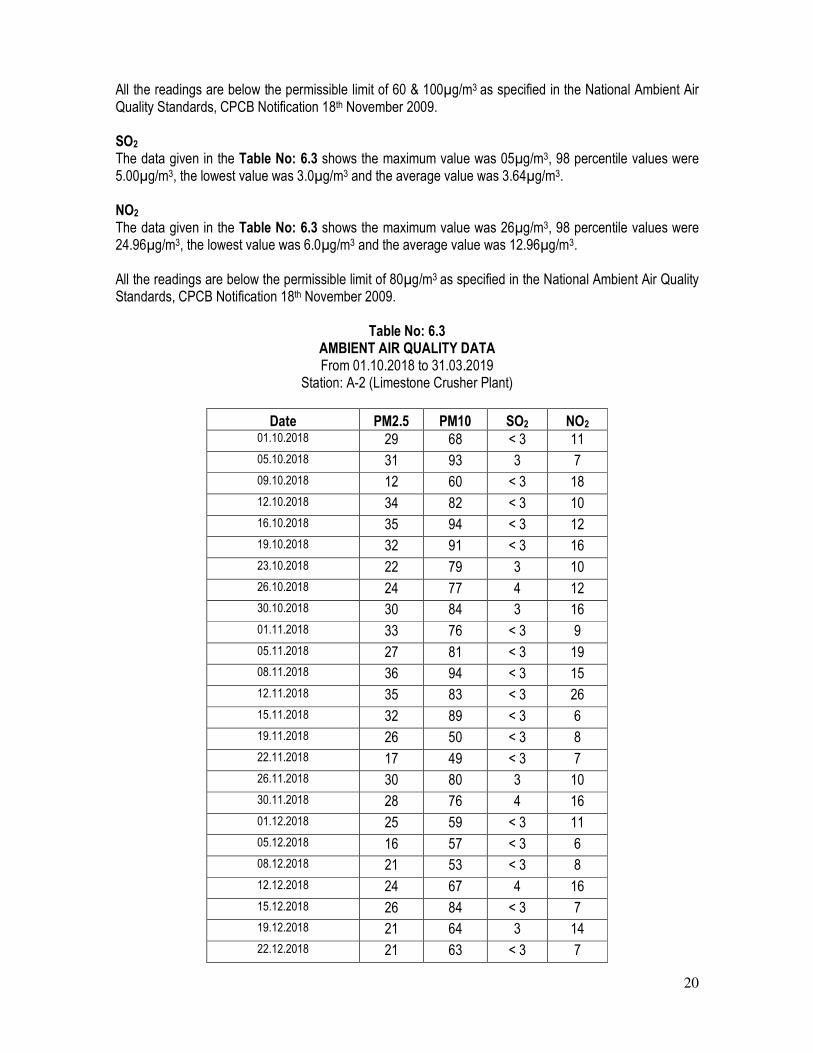
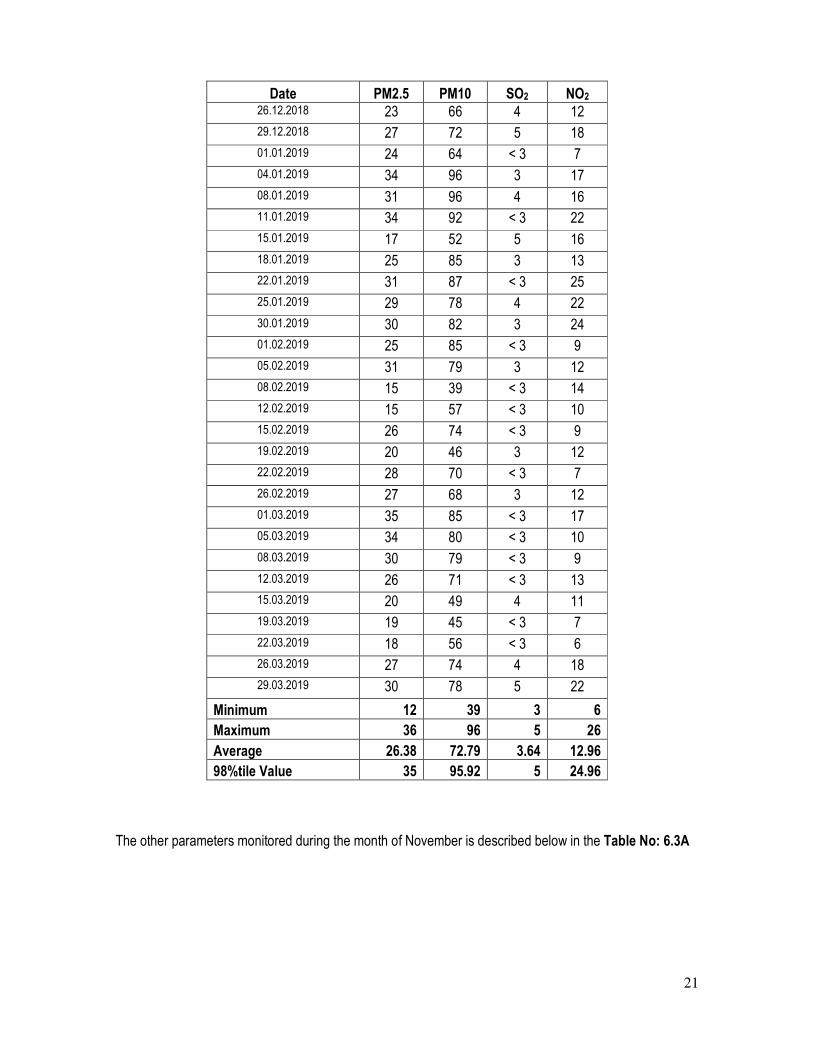
6.2.2 Limestone Crusher Plant (A-2) PM2.5 Data as given in the Table No: 6.3 shows that the maximum value was 36µg/m3, 98 percentile values were 35.0µg/m3, the lowest value was 12µg/m3 and the average value was 26.38µg/m3. PM10 Data as given in the Table No: 6.3 shows that the maximum value was 96µg/m3, 98 percentile values were 95.92µg/m3, the lowest value was 39µg/m3 and the average value was 72.79µg/m3.
20
All the readings are below the permissible limit of 60 & 100µg/m3 as specified in the National Ambient Air Quality Standards, CPCB Notification 18th November 2009. SO2
The data given in the Table No: 6.3 shows the maximum value was 05µg/m3, 98 percentile values were 5.00µg/m3, the lowest value was 3.0µg/m3 and the average value was 3.64µg/m3.
NO2 The data given in the Table No: 6.3 shows the maximum value was 26µg/m3, 98 percentile values were 24.96µg/m3, the lowest value was 6.0µg/m3 and the average value was 12.96µg/m3.
All the readings are below the permissible limit of 80µg/m3 as specified in the National Ambient Air Quality Standards, CPCB Notification 18th November 2009.
Table No: 6.3 AMBIENT AIR QUALITY DATA From 01.10.2018 to 31.03.2019
Station: A-2 (Limestone Crusher Plant)
Date PM2.5 PM10 SO2 NO2 01.10.2018 29 68 < 3 11
05.10.2018 31 93 3 7
09.10.2018 12 60 < 3 18
12.10.2018 34 82 < 3 10
16.10.2018 35 94 < 3 12
19.10.2018 32 91 < 3 16
23.10.2018 22 79 3 10
26.10.2018 24 77 4 12
30.10.2018 30 84 3 16
01.11.2018 33 76 < 3 9
05.11.2018 27 81 < 3 19
08.11.2018 36 94 < 3 15
12.11.2018 35 83 < 3 26
15.11.2018 32 89 < 3 6
19.11.2018 26 50 < 3 8
22.11.2018 17 49 < 3 7
26.11.2018 30 80 3 10
30.11.2018 28 76 4 16
01.12.2018 25 59 < 3 11
05.12.2018 16 57 < 3 6
08.12.2018 21 53 < 3 8
12.12.2018 24 67 4 16
15.12.2018 26 84 < 3 7
19.12.2018 21 64 3 14
22.12.2018 21 63 < 3 7
21
Date PM2.5 PM10 SO2 NO2 26.12.2018 23 66 4 12
29.12.2018 27 72 5 18
01.01.2019 24 64 < 3 7
04.01.2019 34 96 3 17
08.01.2019 31 96 4 16
11.01.2019 34 92 < 3 22
15.01.2019 17 52 5 16
18.01.2019 25 85 3 13
22.01.2019 31 87 < 3 25
25.01.2019 29 78 4 22
30.01.2019 30 82 3 24
01.02.2019 25 85 < 3 9
05.02.2019 31 79 3 12
08.02.2019 15 39 < 3 14
12.02.2019 15 57 < 3 10
15.02.2019 26 74 < 3 9
19.02.2019 20 46 3 12
22.02.2019 28 70 < 3 7
26.02.2019 27 68 3 12
01.03.2019 35 85 < 3 17
05.03.2019 34 80 < 3 10
08.03.2019 30 79 < 3 9
12.03.2019 26 71 < 3 13
15.03.2019 20 49 4 11
19.03.2019 19 45 < 3 7
22.03.2019 18 56 < 3 6
26.03.2019 27 74 4 18
29.03.2019 30 78 5 22
Minimum 12 39 3 6
Maximum 36 96 5 26
Average 26.38 72.79 3.64 12.96
98%tile Value 35 95.92 5 24.96
The other parameters monitored during the month of November is described below in the Table No: 6.3A
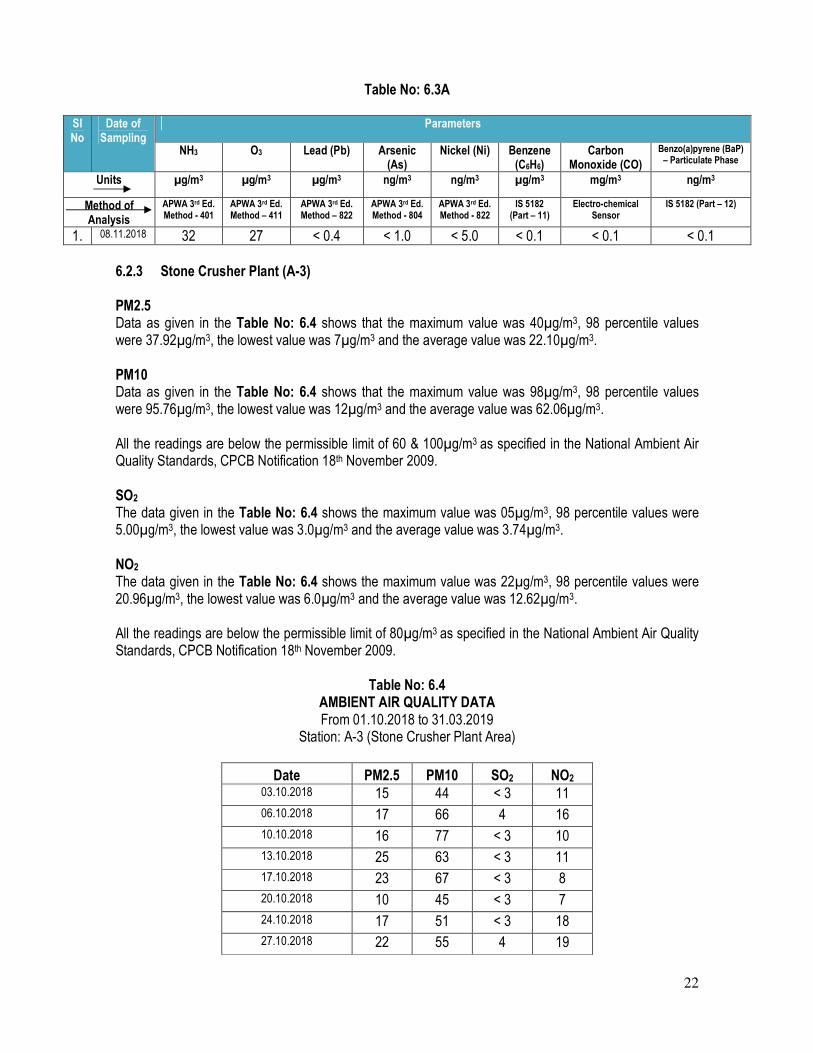
22
Table No: 6.3A
Sl No
Date of Sampling
Parameters
NH3 O3 Lead (Pb) Arsenic (As)
Nickel (Ni) Benzene (C6H6)
Carbon Monoxide (CO)
Benzo(a)pyrene (BaP) – Particulate Phase
Units µg/m3 µg/m3 µg/m3 ng/m3 ng/m3 µg/m3 mg/m3 ng/m3
Method of Analysis
APWA 3rd Ed. Method - 401
APWA 3rd Ed. Method – 411
APWA 3rd Ed. Method – 822
APWA 3rd Ed. Method - 804
APWA 3rd Ed. Method - 822
IS 5182 (Part – 11)
Electro-chemical Sensor
IS 5182 (Part – 12)
1. 08.11.2018 32 27 < 0.4 < 1.0 < 5.0 < 0.1 < 0.1 < 0.1
6.2.3 Stone Crusher Plant (A-3)
PM2.5 Data as given in the Table No: 6.4 shows that the maximum value was 40µg/m3, 98 percentile values were 37.92µg/m3, the lowest value was 7µg/m3 and the average value was 22.10µg/m3. PM10 Data as given in the Table No: 6.4 shows that the maximum value was 98µg/m3, 98 percentile values were 95.76µg/m3, the lowest value was 12µg/m3 and the average value was 62.06µg/m3.
All the readings are below the permissible limit of 60 & 100µg/m3 as specified in the National Ambient Air Quality Standards, CPCB Notification 18th November 2009.
SO2
The data given in the Table No: 6.4 shows the maximum value was 05µg/m3, 98 percentile values were 5.00µg/m3, the lowest value was 3.0µg/m3 and the average value was 3.74µg/m3. NO2 The data given in the Table No: 6.4 shows the maximum value was 22µg/m3, 98 percentile values were 20.96µg/m3, the lowest value was 6.0µg/m3 and the average value was 12.62µg/m3.
All the readings are below the permissible limit of 80µg/m3 as specified in the National Ambient Air Quality Standards, CPCB Notification 18th November 2009.
Table No: 6.4 AMBIENT AIR QUALITY DATA From 01.10.2018 to 31.03.2019
Station: A-3 (Stone Crusher Plant Area)
Date PM2.5 PM10 SO2 NO2 03.10.2018 15 44 < 3 11
06.10.2018 17 66 4 16
10.10.2018 16 77 < 3 10
13.10.2018 25 63 < 3 11
17.10.2018 23 67 < 3 8
20.10.2018 10 45 < 3 7
24.10.2018 17 51 < 3 18
27.10.2018 22 55 4 19
23
Date PM2.5 PM10 SO2 NO2 31.10.2018 18 53 4 11
02.11.2018 14 49 < 3 16
06.11.2018 30 70 < 3 10
09.11.2018 30 90 < 3 11
13.11.2018 23 62 < 3 19
16.11.2018 36 98 3 15
20.11.2018 38 89 < 3 6
23.11.2018 33 85 3 18
27.11.2018 35 88 4 22
30.11.2018 29 82 5 18
03.12.2018 20 57 < 3 6
06.12.2018 16 50 < 3 21
10.12.2018 25 75 5 15
13.12.2018 12 36 4 15
17.12.2018 7 12 < 3 10
20.12.2018 15 57 < 3 14
24.12.2018 27 62 < 3 11
27.12.2018 25 73 3 15
31.12.2018 21 63 4 17
02.01.2019 17 46 < 3 6
05.01.2019 32 81 < 3 6
09.01.2019 40 96 < 3 17
12.01.2019 20 59 < 3 20
16.01.2019 32 72 4 19
19.01.2019 14 50 < 3 12
23.01.2019 22 53 < 3 10
28.01.2019 24 58 3 12
31.01.2019 26 64 4 16
02.02.2019 33 86 < 3 11
06.02.2019 36 74 < 3 10
09.02.2019 19 65 3 9
13.02.2019 15 42 < 3 13
16.02.2019 12 45 < 3 15
20.02.2019 26 67 < 3 11
23.02.2019 10 51 < 3 6
27.02.2019 24 68 4 12
02.03.2019 19 56 < 3 11
06.03.2019 14 47 < 3 7
09.03.2019 22 62 3 14
13.03.2019 24 48 < 3 6
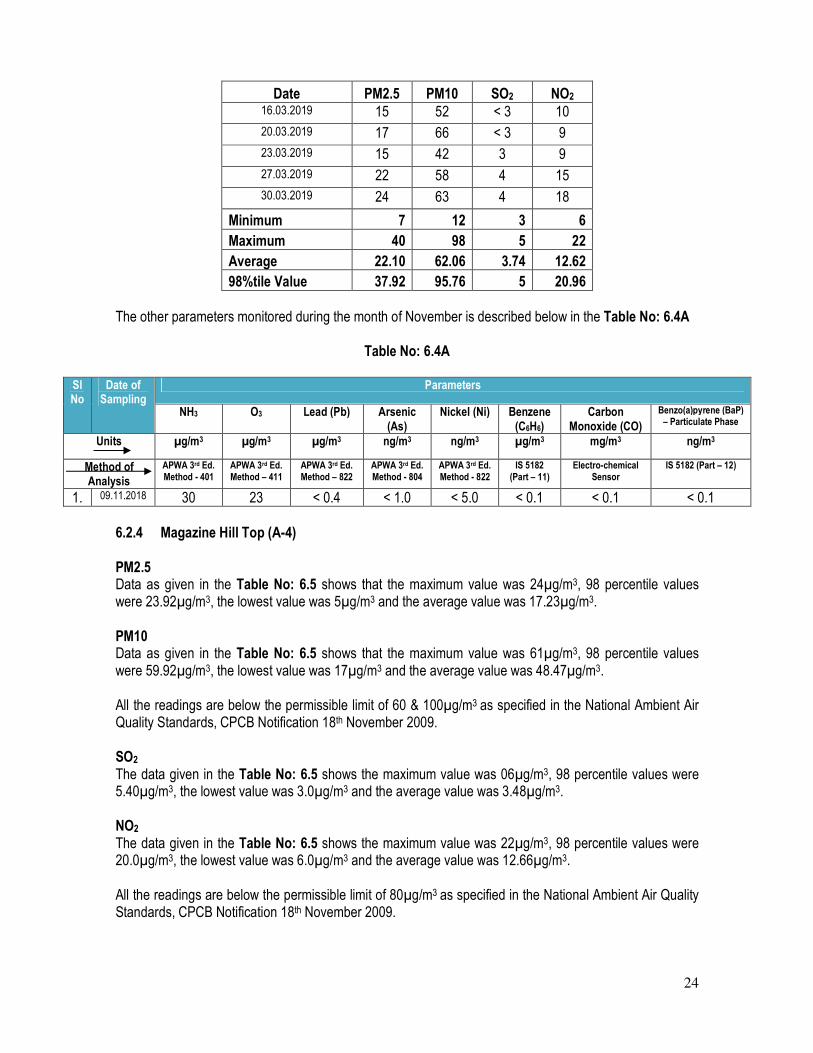
24
Date PM2.5 PM10 SO2 NO2 16.03.2019 15 52 < 3 10
20.03.2019 17 66 < 3 9
23.03.2019 15 42 3 9
27.03.2019 22 58 4 15
30.03.2019 24 63 4 18
Minimum 7 12 3 6
Maximum 40 98 5 22
Average 22.10 62.06 3.74 12.62
98%tile Value 37.92 95.76 5 20.96
The other parameters monitored during the month of November is described below in the Table No: 6.4A
Table No: 6.4A
Sl No
Date of Sampling
Parameters
NH3 O3 Lead (Pb) Arsenic (As)
Nickel (Ni) Benzene (C6H6)
Carbon Monoxide (CO)
Benzo(a)pyrene (BaP) – Particulate Phase
Units µg/m3 µg/m3 µg/m3 ng/m3 ng/m3 µg/m3 mg/m3 ng/m3
Method of Analysis
APWA 3rd Ed. Method - 401
APWA 3rd Ed. Method – 411
APWA 3rd Ed. Method – 822
APWA 3rd Ed. Method - 804
APWA 3rd Ed. Method - 822
IS 5182 (Part – 11)
Electro-chemical Sensor
IS 5182 (Part – 12)
1. 09.11.2018 30 23 < 0.4 < 1.0 < 5.0 < 0.1 < 0.1 < 0.1
6.2.4 Magazine Hill Top (A-4) PM2.5 Data as given in the Table No: 6.5 shows that the maximum value was 24µg/m3, 98 percentile values were 23.92µg/m3, the lowest value was 5µg/m3 and the average value was 17.23µg/m3. PM10 Data as given in the Table No: 6.5 shows that the maximum value was 61µg/m3, 98 percentile values were 59.92µg/m3, the lowest value was 17µg/m3 and the average value was 48.47µg/m3. All the readings are below the permissible limit of 60 & 100µg/m3 as specified in the National Ambient Air Quality Standards, CPCB Notification 18th November 2009. SO2
The data given in the Table No: 6.5 shows the maximum value was 06µg/m3, 98 percentile values were 5.40µg/m3, the lowest value was 3.0µg/m3 and the average value was 3.48µg/m3. NO2 The data given in the Table No: 6.5 shows the maximum value was 22µg/m3, 98 percentile values were 20.0µg/m3, the lowest value was 6.0µg/m3 and the average value was 12.66µg/m3. All the readings are below the permissible limit of 80µg/m3 as specified in the National Ambient Air Quality Standards, CPCB Notification 18th November 2009.
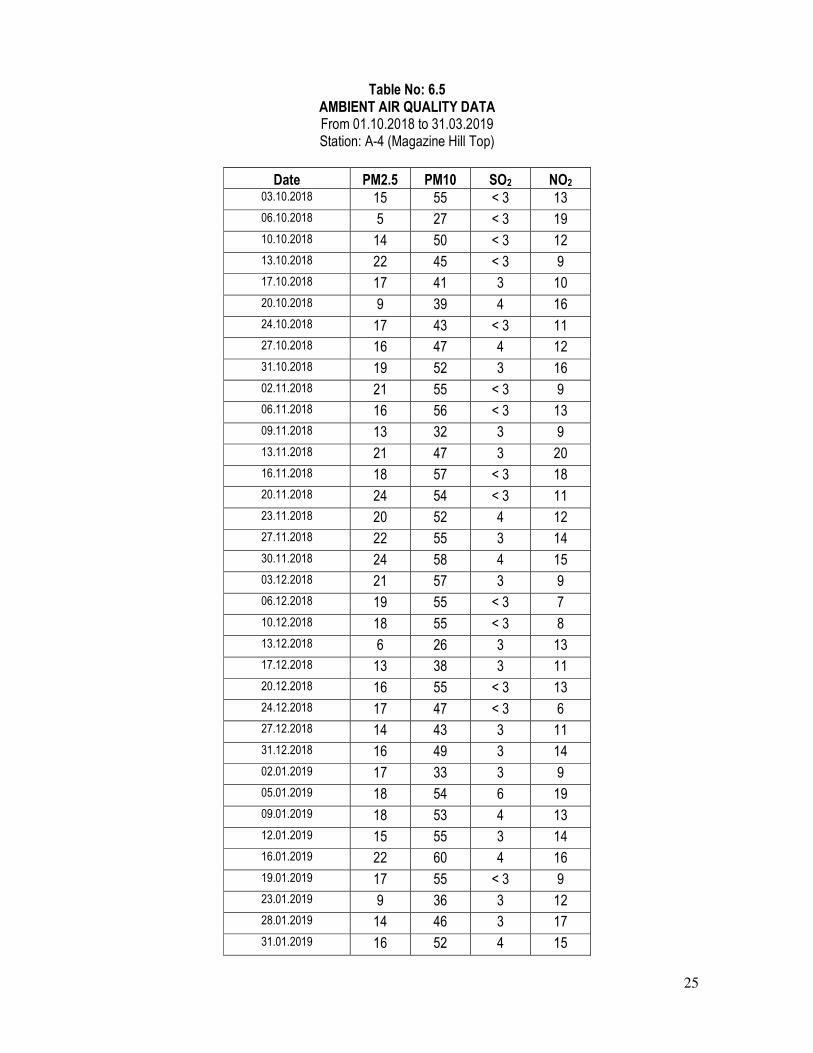
25
Table No: 6.5 AMBIENT AIR QUALITY DATA From 01.10.2018 to 31.03.2019 Station: A-4 (Magazine Hill Top)
Date PM2.5 PM10 SO2 NO2 03.10.2018 15 55 < 3 13
06.10.2018 5 27 < 3 19
10.10.2018 14 50 < 3 12
13.10.2018 22 45 < 3 9
17.10.2018 17 41 3 10
20.10.2018 9 39 4 16
24.10.2018 17 43 < 3 11
27.10.2018 16 47 4 12
31.10.2018 19 52 3 16
02.11.2018 21 55 < 3 9
06.11.2018 16 56 < 3 13
09.11.2018 13 32 3 9
13.11.2018 21 47 3 20
16.11.2018 18 57 < 3 18
20.11.2018 24 54 < 3 11
23.11.2018 20 52 4 12
27.11.2018 22 55 3 14
30.11.2018 24 58 4 15
03.12.2018 21 57 3 9
06.12.2018 19 55 < 3 7
10.12.2018 18 55 < 3 8
13.12.2018 6 26 3 13
17.12.2018 13 38 3 11
20.12.2018 16 55 < 3 13
24.12.2018 17 47 < 3 6
27.12.2018 14 43 3 11
31.12.2018 16 49 3 14
02.01.2019 17 33 3 9
05.01.2019 18 54 6 19
09.01.2019 18 53 4 13
12.01.2019 15 55 3 14
16.01.2019 22 60 4 16
19.01.2019 17 55 < 3 9
23.01.2019 9 36 3 12
28.01.2019 14 46 3 17
31.01.2019 16 52 4 15
26
Date PM2.5 PM10 SO2 NO2 02.02.2019 21 54 3 8
06.02.2019 12 45 < 3 9
09.02.2019 15 35 < 3 7
13.02.2019 21 46 4 18
16.02.2019 17 42 5 18
20.02.2019 22 57 3 14
23.02.2019 21 55 3 11
27.02.2019 20 52 3 10
02.03.2019 18 49 < 3 11
06.03.2019 20 53 < 3 10
09.03.2019 8 17 < 3 9
13.03.2019 17 55 4 14
16.03.2019 21 52 < 3 10
20.03.2019 18 61 < 3 22
23.03.2019 20 52 < 3 7
27.03.2019 21 54 3 18
30.03.2019 22 56 4 20
Minimum 5 17 3 6
Maximum 24 61 6 22
Average 17.23 48.47 3.48 12.66
98%tile Value 23.92 59.92 5.4 20
The other parameters monitored during the month of November is described below in the Table No: 6.5A
Table No: 6.5A
Sl No
Date of Sampling
Parameters
NH3 O3 Lead (Pb) Arsenic (As)
Nickel (Ni) Benzene (C6H6)
Carbon Monoxide (CO)
Benzo(a)pyrene (BaP) – Particulate Phase
Units µg/m3 µg/m3 µg/m3 ng/m3 ng/m3 µg/m3 mg/m3 ng/m3
Method of Analysis
APWA 3rd Ed. Method - 401
APWA 3rd Ed. Method – 411
APWA 3rd Ed. Method – 822
APWA 3rd Ed. Method - 804
APWA 3rd Ed. Method - 822
IS 5182 (Part – 11)
Electro-chemical Sensor
IS 5182 (Part – 12)
1. 16.11.2018 < 20 < 19.6 < 0.4 < 1.0 < 5.0 < 0.1 < 0.1 < 0.1
27
Figure No: 6.5 Graphical Representations of PM2.5 Values in Core Zone
Figure No: 6.6 Graphical Representations of PM10 Values in Core Zone
28
Figure No: 6.7 Graphical Representations of SO2 Values in Core Zone
Figure No: 6.8 Graphical Representations of NOx Values in Core Zone
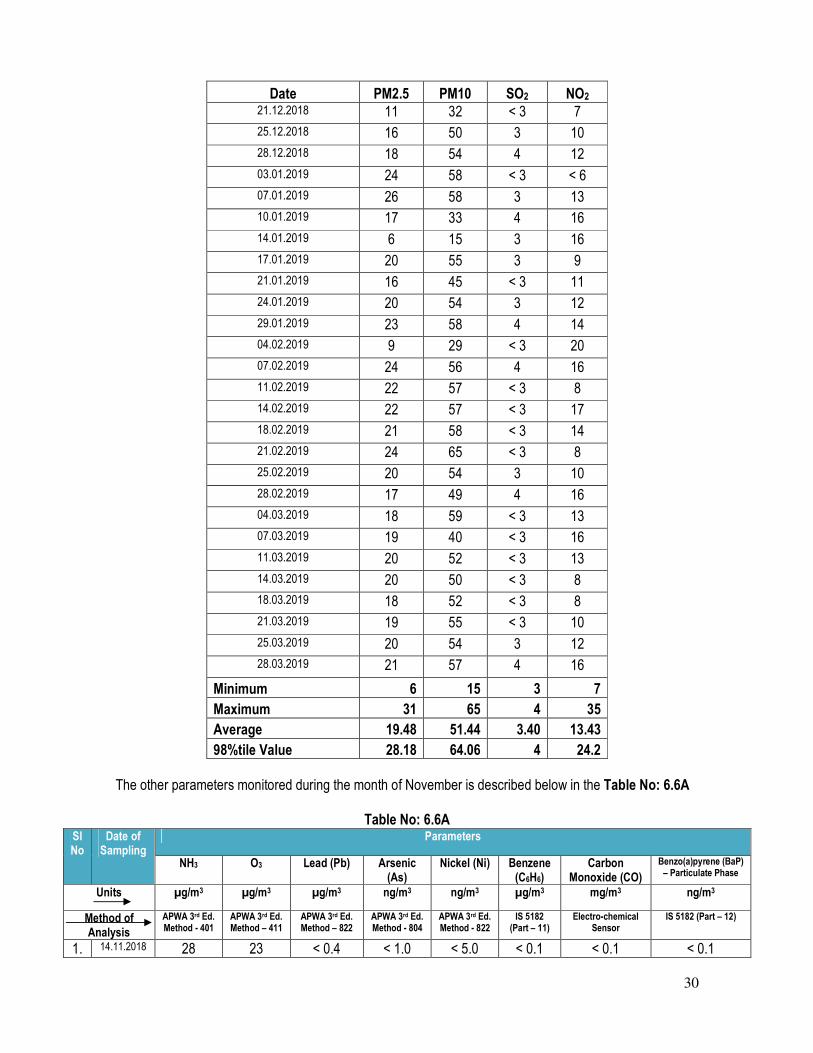
6.2.5 Village Katang (A-5) PM2.5 Data as given in the Table No: 6.6 shows that the maximum value was 31µg/m3, 98 percentile values were 28.18µg/m3, the lowest value was 6.0µg/m3 and the average value was 19.48µg/m3.
29
PM10 Data as given in the Table No: 6.6 shows that the maximum value was 65µg/m3, 98 percentile values were 64.06µg/m3, the lowest value was 15µg/m3 and the average value was 51.44µg/m3. All the readings are below the permissible limit of 60 & 100µg/m3 as specified in the National Ambient Air Quality Standards, CPCB Notification 18th November 2009. SO2
The data given in the Table No: 6.6 shows the maximum value was 04µg/m3, 98 percentile values were 4.00µg/m3, the lowest value was 3.0µg/m3 and the average value was 3.40µg/m3. NO2 The data given in the Table No: 6.6 shows the maximum value was 35µg/m3, 98 percentile values were 24.20µg/m3, the lowest value was 7.0µg/m3 and the average value was 13.43µg/m3. All the readings are below the permissible limit of 80µg/m3 as specified in the National Ambient Air Quality Standards, CPCB Notification 18th November 2009.
Table No: 6.6
AMBIENT AIR QUALITY DATA From 01.10.2018 to 31.03.2019 Station: A-5 (Village Katang)
Date PM2.5 PM10 SO2 NO2 04.10.2018 12 29 < 3 < 6
08.10.2018 16 43 < 3 7
11.10.2018 18 44 4 12
15.10.2018 15 51 3 19
18.10.2018 25 62 < 3 7
22.10.2018 21 54 < 3 15
25.10.2018 20 50 3 12
29.10.2018 22 52 4 16
03.11.2018 20 49 3 14
07.11.2018 21 55 < 3 14
10.11.2018 16 55 4 16
14.11.2018 23 59 3 35
17.11.2018 28 59 3 18
21.11.2018 19 55 3 14
24.11.2018 31 60 3 9
28.11.2018 23 55 4 12
04.12.2018 23 64 < 3 23
07.12.2018 17 57 < 3 9
11.12.2018 19 54 < 3 22
14.12.2018 16 57 3 12
18.12.2018 19 49 < 3 7
30
Date PM2.5 PM10 SO2 NO2 21.12.2018 11 32 < 3 7
25.12.2018 16 50 3 10
28.12.2018 18 54 4 12
03.01.2019 24 58 < 3 < 6
07.01.2019 26 58 3 13
10.01.2019 17 33 4 16
14.01.2019 6 15 3 16
17.01.2019 20 55 3 9
21.01.2019 16 45 < 3 11
24.01.2019 20 54 3 12
29.01.2019 23 58 4 14
04.02.2019 9 29 < 3 20
07.02.2019 24 56 4 16
11.02.2019 22 57 < 3 8
14.02.2019 22 57 < 3 17
18.02.2019 21 58 < 3 14
21.02.2019 24 65 < 3 8
25.02.2019 20 54 3 10
28.02.2019 17 49 4 16
04.03.2019 18 59 < 3 13
07.03.2019 19 40 < 3 16
11.03.2019 20 52 < 3 13
14.03.2019 20 50 < 3 8
18.03.2019 18 52 < 3 8
21.03.2019 19 55 < 3 10
25.03.2019 20 54 3 12
28.03.2019 21 57 4 16
Minimum 6 15 3 7
Maximum 31 65 4 35
Average 19.48 51.44 3.40 13.43
98%tile Value 28.18 64.06 4 24.2
The other parameters monitored during the month of November is described below in the Table No: 6.6A
Table No: 6.6A Sl No
Date of Sampling
Parameters
NH3 O3 Lead (Pb) Arsenic (As)
Nickel (Ni) Benzene (C6H6)
Carbon Monoxide (CO)
Benzo(a)pyrene (BaP) – Particulate Phase
Units µg/m3 µg/m3 µg/m3 ng/m3 ng/m3 µg/m3 mg/m3 ng/m3
Method of Analysis
APWA 3rd Ed. Method - 401
APWA 3rd Ed. Method – 411
APWA 3rd Ed. Method – 822
APWA 3rd Ed. Method - 804
APWA 3rd Ed. Method - 822
IS 5182 (Part – 11)
Electro-chemical Sensor
IS 5182 (Part – 12)
1. 14.11.2018 28 23 < 0.4 < 1.0 < 5.0 < 0.1 < 0.1 < 0.1
31
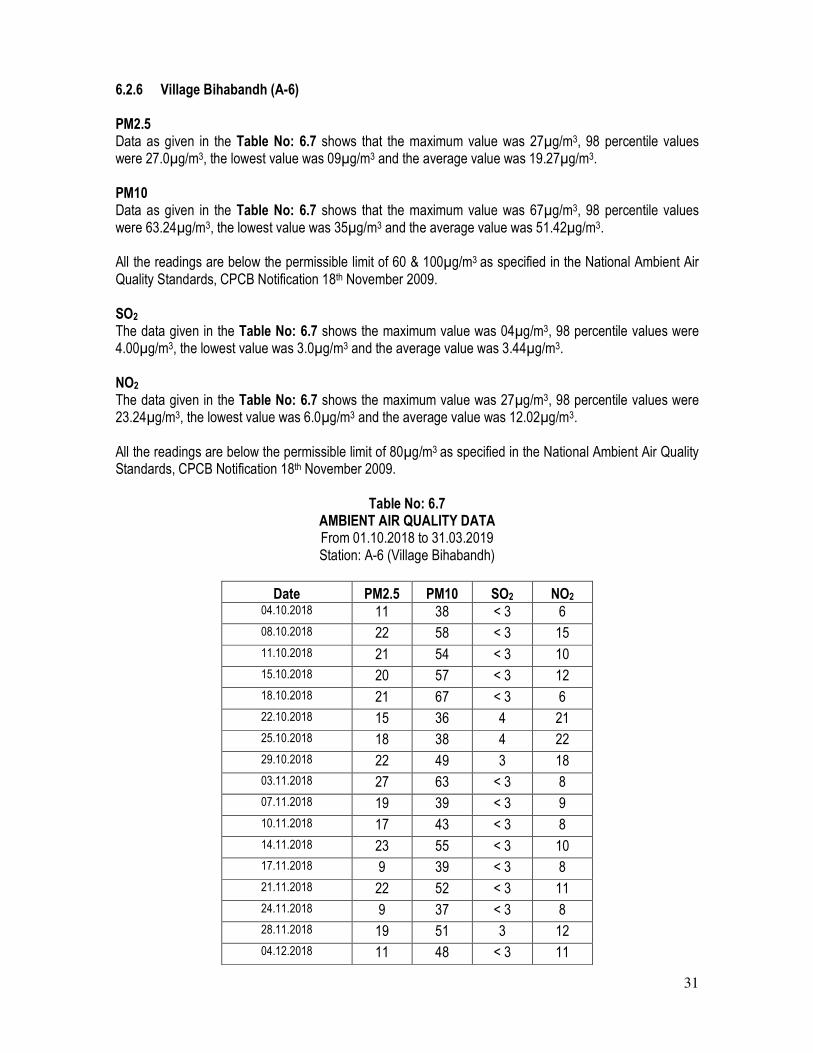
6.2.6 Village Bihabandh (A-6) PM2.5 Data as given in the Table No: 6.7 shows that the maximum value was 27µg/m3, 98 percentile values were 27.0µg/m3, the lowest value was 09µg/m3 and the average value was 19.27µg/m3. PM10 Data as given in the Table No: 6.7 shows that the maximum value was 67µg/m3, 98 percentile values were 63.24µg/m3, the lowest value was 35µg/m3 and the average value was 51.42µg/m3. All the readings are below the permissible limit of 60 & 100µg/m3 as specified in the National Ambient Air Quality Standards, CPCB Notification 18th November 2009. SO2
The data given in the Table No: 6.7 shows the maximum value was 04µg/m3, 98 percentile values were 4.00µg/m3, the lowest value was 3.0µg/m3 and the average value was 3.44µg/m3. NO2 The data given in the Table No: 6.7 shows the maximum value was 27µg/m3, 98 percentile values were 23.24µg/m3, the lowest value was 6.0µg/m3 and the average value was 12.02µg/m3. All the readings are below the permissible limit of 80µg/m3 as specified in the National Ambient Air Quality Standards, CPCB Notification 18th November 2009.
Table No: 6.7 AMBIENT AIR QUALITY DATA From 01.10.2018 to 31.03.2019 Station: A-6 (Village Bihabandh)
Date PM2.5 PM10 SO2 NO2 04.10.2018 11 38 < 3 6
08.10.2018 22 58 < 3 15
11.10.2018 21 54 < 3 10
15.10.2018 20 57 < 3 12
18.10.2018 21 67 < 3 6
22.10.2018 15 36 4 21
25.10.2018 18 38 4 22
29.10.2018 22 49 3 18
03.11.2018 27 63 < 3 8
07.11.2018 19 39 < 3 9
10.11.2018 17 43 < 3 8
14.11.2018 23 55 < 3 10
17.11.2018 9 39 < 3 8
21.11.2018 22 52 < 3 11
24.11.2018 9 37 < 3 8
28.11.2018 19 51 3 12
04.12.2018 11 48 < 3 11
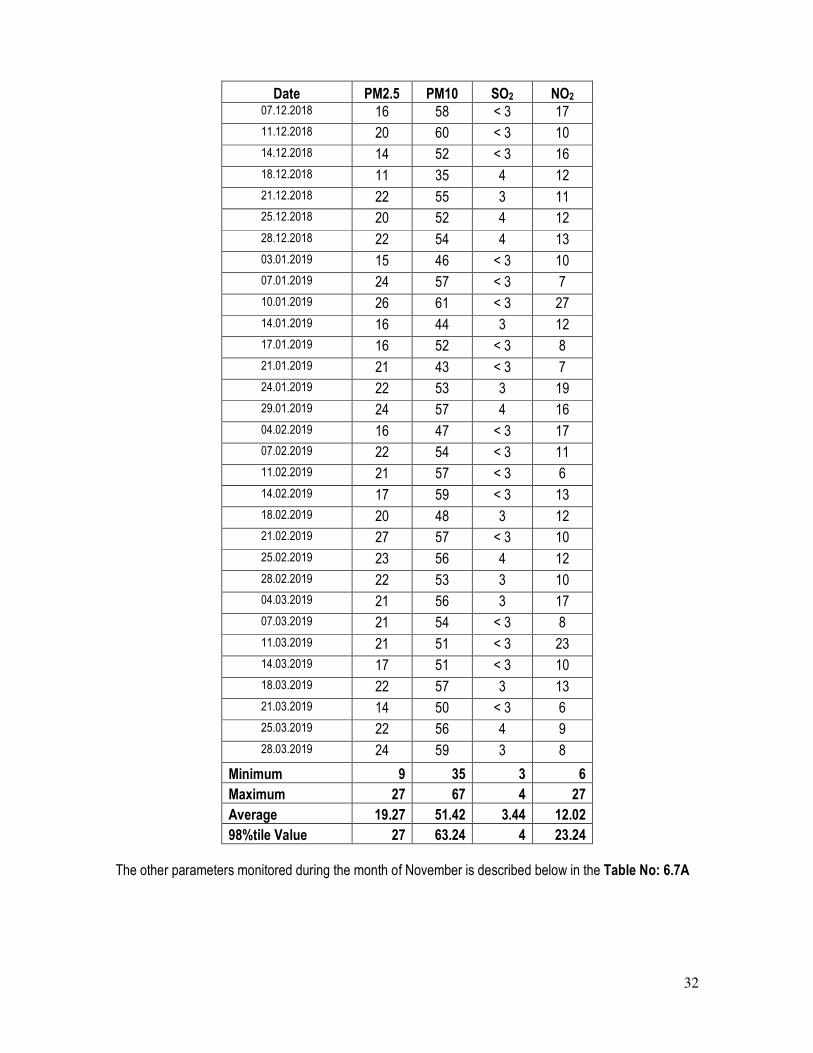
32
Date PM2.5 PM10 SO2 NO2 07.12.2018 16 58 < 3 17
11.12.2018 20 60 < 3 10
14.12.2018 14 52 < 3 16
18.12.2018 11 35 4 12
21.12.2018 22 55 3 11
25.12.2018 20 52 4 12
28.12.2018 22 54 4 13
03.01.2019 15 46 < 3 10
07.01.2019 24 57 < 3 7
10.01.2019 26 61 < 3 27
14.01.2019 16 44 3 12
17.01.2019 16 52 < 3 8
21.01.2019 21 43 < 3 7
24.01.2019 22 53 3 19
29.01.2019 24 57 4 16
04.02.2019 16 47 < 3 17
07.02.2019 22 54 < 3 11
11.02.2019 21 57 < 3 6
14.02.2019 17 59 < 3 13
18.02.2019 20 48 3 12
21.02.2019 27 57 < 3 10
25.02.2019 23 56 4 12
28.02.2019 22 53 3 10
04.03.2019 21 56 3 17
07.03.2019 21 54 < 3 8
11.03.2019 21 51 < 3 23
14.03.2019 17 51 < 3 10
18.03.2019 22 57 3 13
21.03.2019 14 50 < 3 6
25.03.2019 22 56 4 9
28.03.2019 24 59 3 8
Minimum 9 35 3 6
Maximum 27 67 4 27
Average 19.27 51.42 3.44 12.02
98%tile Value 27 63.24 4 23.24
The other parameters monitored during the month of November is described below in the Table No: 6.7A
33
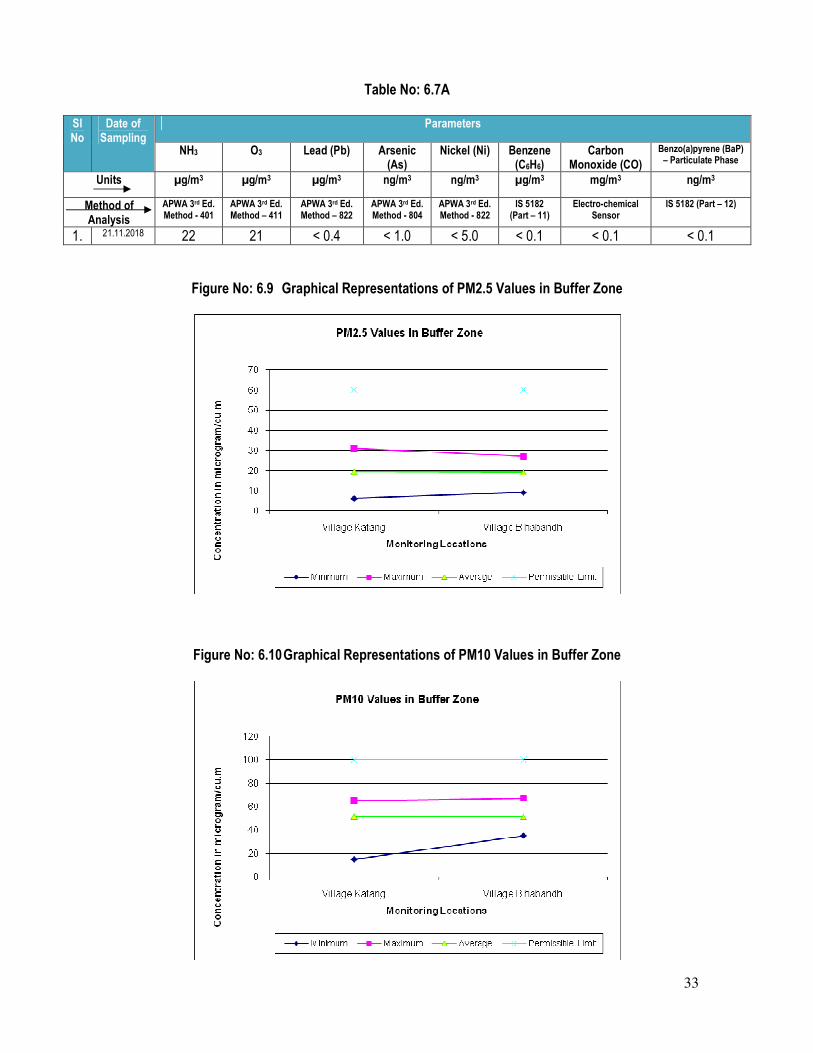
Table No: 6.7A
Sl No
Date of Sampling
Parameters
NH3 O3 Lead (Pb) Arsenic (As)
Nickel (Ni) Benzene (C6H6)
Carbon Monoxide (CO)
Benzo(a)pyrene (BaP) – Particulate Phase
Units µg/m3 µg/m3 µg/m3 ng/m3 ng/m3 µg/m3 mg/m3 ng/m3
Method of Analysis
APWA 3rd Ed. Method - 401
APWA 3rd Ed. Method – 411
APWA 3rd Ed. Method – 822
APWA 3rd Ed. Method - 804
APWA 3rd Ed. Method - 822
IS 5182 (Part – 11)
Electro-chemical Sensor
IS 5182 (Part – 12)
1. 21.11.2018 22 21 < 0.4 < 1.0 < 5.0 < 0.1 < 0.1 < 0.1
Figure No: 6.9 Graphical Representations of PM2.5 Values in Buffer Zone
Figure No: 6.10 Graphical Representations of PM10 Values in Buffer Zone
34
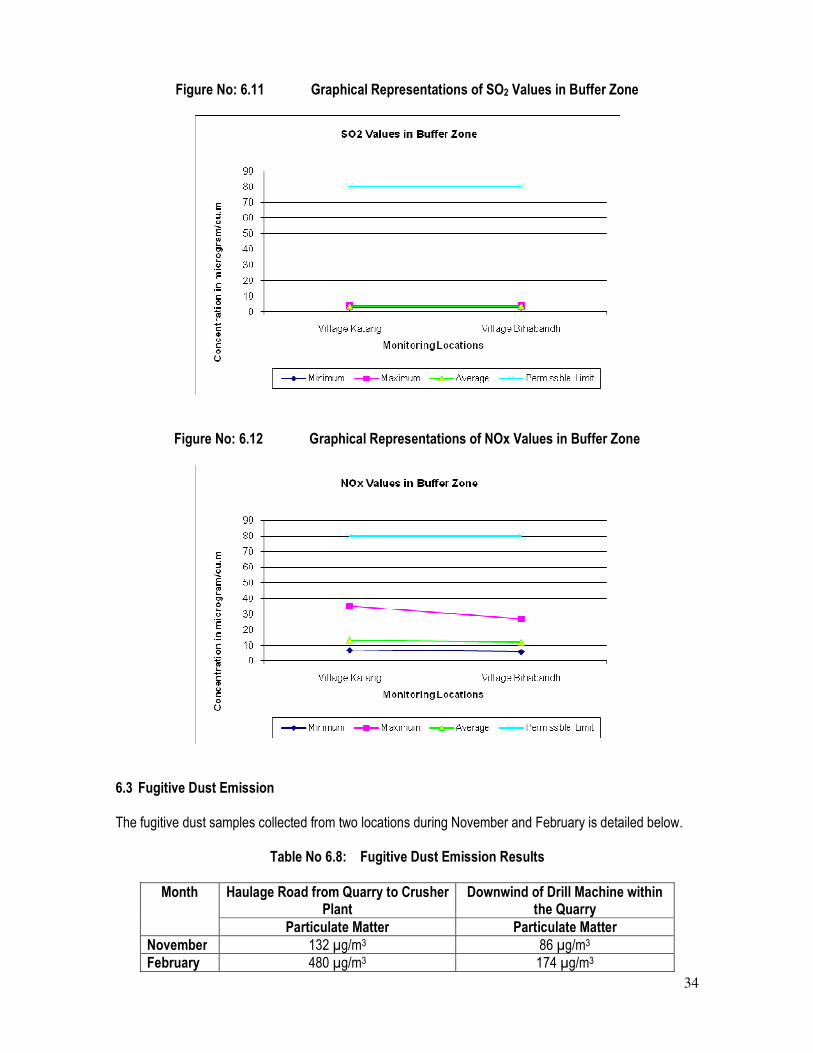
Figure No: 6.11 Graphical Representations of SO2 Values in Buffer Zone
Figure No: 6.12 Graphical Representations of NOx Values in Buffer Zone
6.3 Fugitive Dust Emission The fugitive dust samples collected from two locations during November and February is detailed below.
Table No 6.8: Fugitive Dust Emission Results
Month Haulage Road from Quarry to Crusher Plant
Downwind of Drill Machine within the Quarry
Particulate Matter Particulate Matter
November 132 µg/m3 86 µg/m3
February 480 µg/m3 174 µg/m3
35
In the month of February the results are higher than the results for the month of November. 6.4 Stack Emission Monitoring
The monthly monitoring results of stack emission from the Limestone Crusher Plant Bag filter outlet given below shows that all the results from October to March are within the prescribed limits (150 mg/Nm3) of State Pollution Control Board. The detail results are as follows:
Table No 6.9: Stack Emission Monitoring Results
Sl No Month Particulate Matter Concentration in mg/Nm3
1 October 21
2 November 132
3 December 67
4 January 12
5 February 72
6 March 61
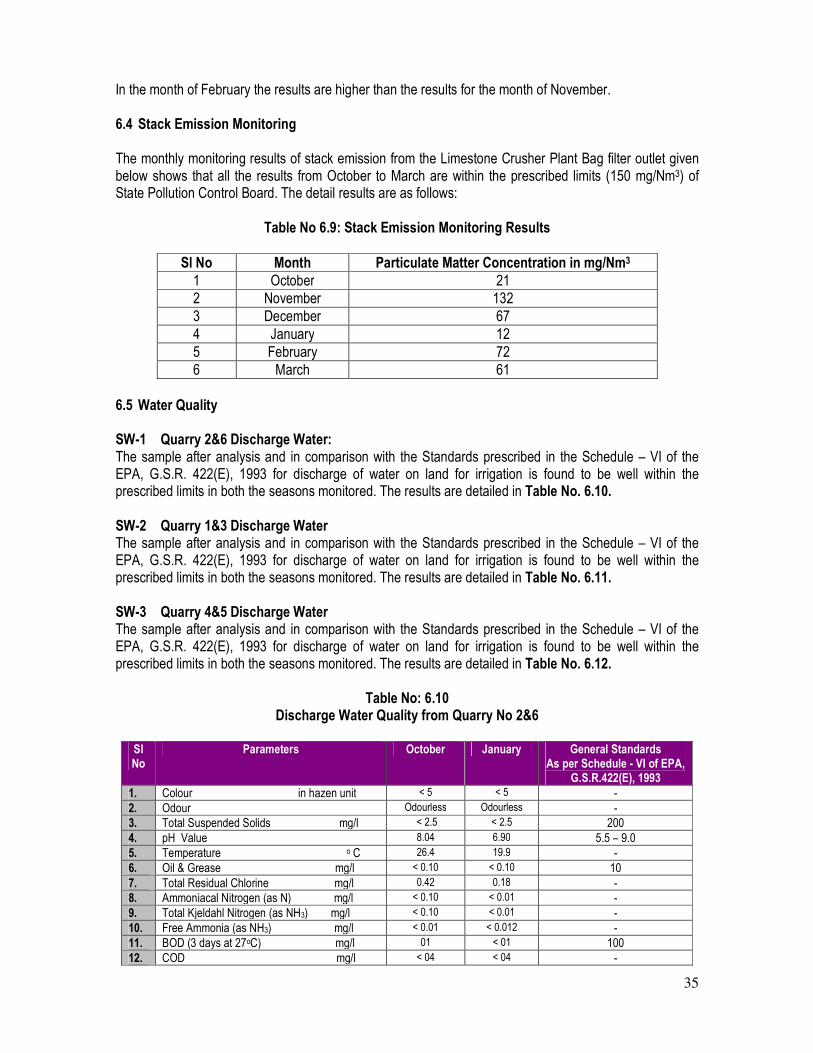
6.5 Water Quality SW-1 Quarry 2&6 Discharge Water: The sample after analysis and in comparison with the Standards prescribed in the Schedule – VI of the EPA, G.S.R. 422(E), 1993 for discharge of water on land for irrigation is found to be well within the prescribed limits in both the seasons monitored. The results are detailed in Table No. 6.10. SW-2 Quarry 1&3 Discharge Water The sample after analysis and in comparison with the Standards prescribed in the Schedule – VI of the EPA, G.S.R. 422(E), 1993 for discharge of water on land for irrigation is found to be well within the prescribed limits in both the seasons monitored. The results are detailed in Table No. 6.11. SW-3 Quarry 4&5 Discharge Water The sample after analysis and in comparison with the Standards prescribed in the Schedule – VI of the EPA, G.S.R. 422(E), 1993 for discharge of water on land for irrigation is found to be well within the prescribed limits in both the seasons monitored. The results are detailed in Table No. 6.12.
Table No: 6.10
Discharge Water Quality from Quarry No 2&6
Sl No
Parameters October January General Standards As per Schedule - VI of EPA,
G.S.R.422(E), 1993
1. Colour in hazen unit < 5 < 5 -
2. Odour Odourless Odourless -
3. Total Suspended Solids mg/l < 2.5 < 2.5 200
4. pH Value 8.04 6.90 5.5 – 9.0
5. Temperature o C 26.4 19.9 -
6. Oil & Grease mg/l < 0.10 < 0.10 10
7. Total Residual Chlorine mg/l 0.42 0.18 -
8. Ammoniacal Nitrogen (as N) mg/l < 0.10 < 0.01 -
9. Total Kjeldahl Nitrogen (as NH3) mg/l < 0.10 < 0.01 -
10. Free Ammonia (as NH3) mg/l < 0.01 < 0.012 -
11. BOD (3 days at 27oC) mg/l 01 < 01 100
12. COD mg/l < 04 < 04 -
36
Sl No
Parameters October January General Standards As per Schedule - VI of EPA,
G.S.R.422(E), 1993
13. Lead (as Pb) mg/l < 0.10 < 0.10 -
14. Cadmium (as Cd) mg/l < 0.05 < 0.05 -
15. Hex. Chromium (as Cr+6) mg/l < 0.01 < 0.01 -
16. Total Chromium (as Cr) mg/l < 0.10 < 0.10 -
17. Copper (as Cu) mg/l < 0.10 < 0.10 -
18. Zinc (as Zn) mg/l < 0.02 < 0.02 -
19. Nickel (as Ni) mg/l < 0.25 < 0.25 -
20. Cyanide (as CN) mg/l < 0.002 < 0.002 0.2
21. Fluoride (as F) mg/l 0.4696 0.5432 -
22. Dissolved Phosphate (as P) mg/l < 0.10 < 0.10 -
23. Sulphide (as S) mg/l < 0.02 < 0.02 -
24. Phenolic Compounds (as C6H5OH) mg/l < 0.10 < 0.10 -
25. Manganese (as Mn) mg/l < 0.05 < 0.05 -
26. Iron (as Fe) mg/l < 0.01 0.06 -
27. Nitrate Nitrogen mg/l 0.94 < 0.50 -
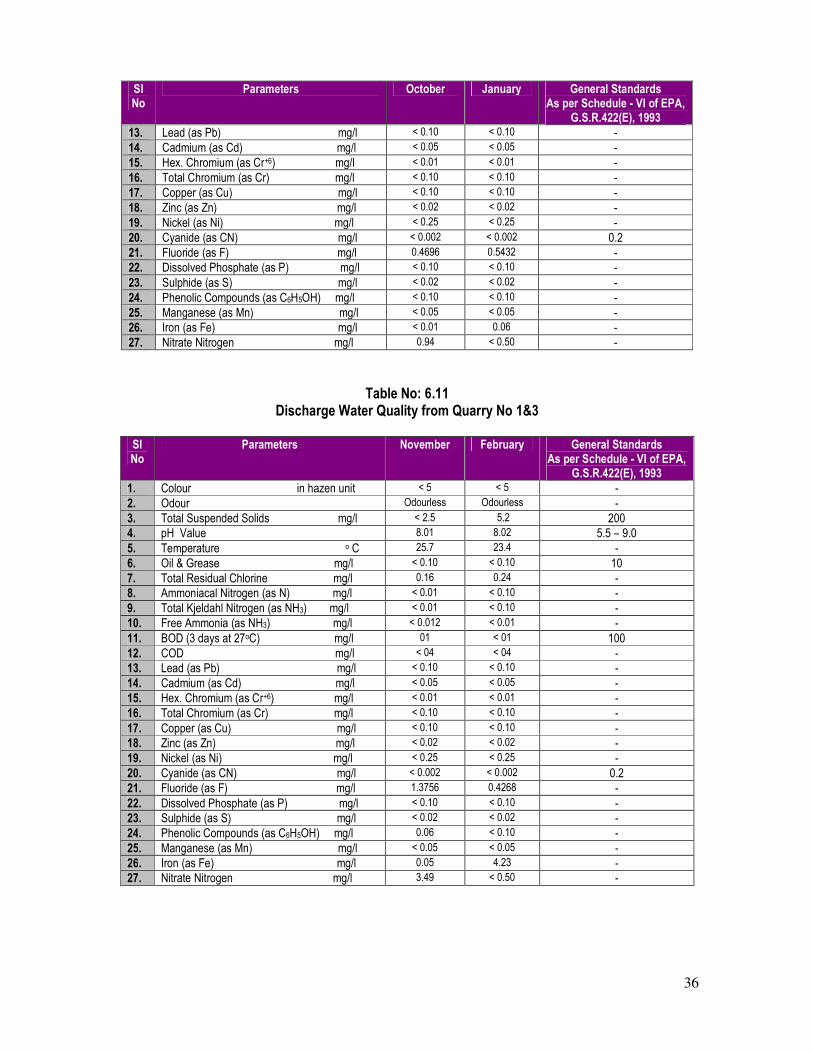
Table No: 6.11 Discharge Water Quality from Quarry No 1&3
Sl No
Parameters November February General Standards As per Schedule - VI of EPA,
G.S.R.422(E), 1993
1. Colour in hazen unit < 5 < 5 -
2. Odour Odourless Odourless -
3. Total Suspended Solids mg/l < 2.5 5.2 200
4. pH Value 8.01 8.02 5.5 – 9.0
5. Temperature o C 25.7 23.4 -
6. Oil & Grease mg/l < 0.10 < 0.10 10
7. Total Residual Chlorine mg/l 0.16 0.24 -
8. Ammoniacal Nitrogen (as N) mg/l < 0.01 < 0.10 -
9. Total Kjeldahl Nitrogen (as NH3) mg/l < 0.01 < 0.10 -
10. Free Ammonia (as NH3) mg/l < 0.012 < 0.01 -
11. BOD (3 days at 27oC) mg/l 01 < 01 100
12. COD mg/l < 04 < 04 -
13. Lead (as Pb) mg/l < 0.10 < 0.10 -
14. Cadmium (as Cd) mg/l < 0.05 < 0.05 -
15. Hex. Chromium (as Cr+6) mg/l < 0.01 < 0.01 -
16. Total Chromium (as Cr) mg/l < 0.10 < 0.10 -
17. Copper (as Cu) mg/l < 0.10 < 0.10 -
18. Zinc (as Zn) mg/l < 0.02 < 0.02 -
19. Nickel (as Ni) mg/l < 0.25 < 0.25 -
20. Cyanide (as CN) mg/l < 0.002 < 0.002 0.2
21. Fluoride (as F) mg/l 1.3756 0.4268 -
22. Dissolved Phosphate (as P) mg/l < 0.10 < 0.10 -
23. Sulphide (as S) mg/l < 0.02 < 0.02 -
24. Phenolic Compounds (as C6H5OH) mg/l 0.06 < 0.10 -
25. Manganese (as Mn) mg/l < 0.05 < 0.05 -
26. Iron (as Fe) mg/l 0.05 4.23 -
27. Nitrate Nitrogen mg/l 3.49 < 0.50 -
37
Table No: 6.12 Discharge Water Quality from Quarry No 4&5
Sl No
Parameters December March General Standards As per Schedule - VI of EPA,
G.S.R.422(E), 1993
1. Colour in hazen unit < 5 < 5 -
2. Odour Odourless Odourless -
3. Total Suspended Solids mg/l < 2.5 < 2.5 200
4. pH Value 7.93 6.72 5.5 – 9.0
5. Temperature o C 19.5 27.7 -
6. Oil & Grease mg/l < 0.10 < 0.10 10
7. Total Residual Chlorine mg/l 0.17 0.20 -
8. Ammoniacal Nitrogen (as N) mg/l < 0.01 < 0.10 -
9. Total Kjeldahl Nitrogen (as NH3) mg/l < 0.01 < 0.10 -
10. Free Ammonia (as NH3) mg/l < 0.012 < 0.01 -
11. BOD (3 days at 27oC) mg/l 01 < 01 100
12. COD mg/l < 4 < 04 -
15. Lead (as Pb) mg/l < 0.10 < 0.10 -
16. Cadmium (as Cd) mg/l < 0.05 < 0.05 -
17. Hex. Chromium (as Cr+6) mg/l < 0.01 < 0.01 -
18. Total Chromium (as Cr) mg/l < 0.10 < 0.10 -
19. Copper (as Cu) mg/l < 0.10 < 0.10 -
20. Zinc (as Zn) mg/l < 0.02 < 0.02 -
22. Nickel (as Ni) mg/l < 0.25 < 0.25 -
23. Cyanide (as CN) mg/l < 0.002 < 0.002 0.2
24. Fluoride (as F) mg/l 0.7432 0.4010 -
25. Dissolved Phosphate (as P) mg/l < 0.10 < 0.10 -
26. Sulphide (as S) mg/l < 0.02 < 0.02 -
27. Phenolic Compounds (as C6H5OH) mg/l < 0.025 < 0.10 -
28. Manganese (as Mn) mg/l < 0.05 < 0.05 -
29. Iron (as Fe) mg/l 0.05 0.08 -
31. Nitrate Nitrogen mg/l < 0.50 < 0.50 -
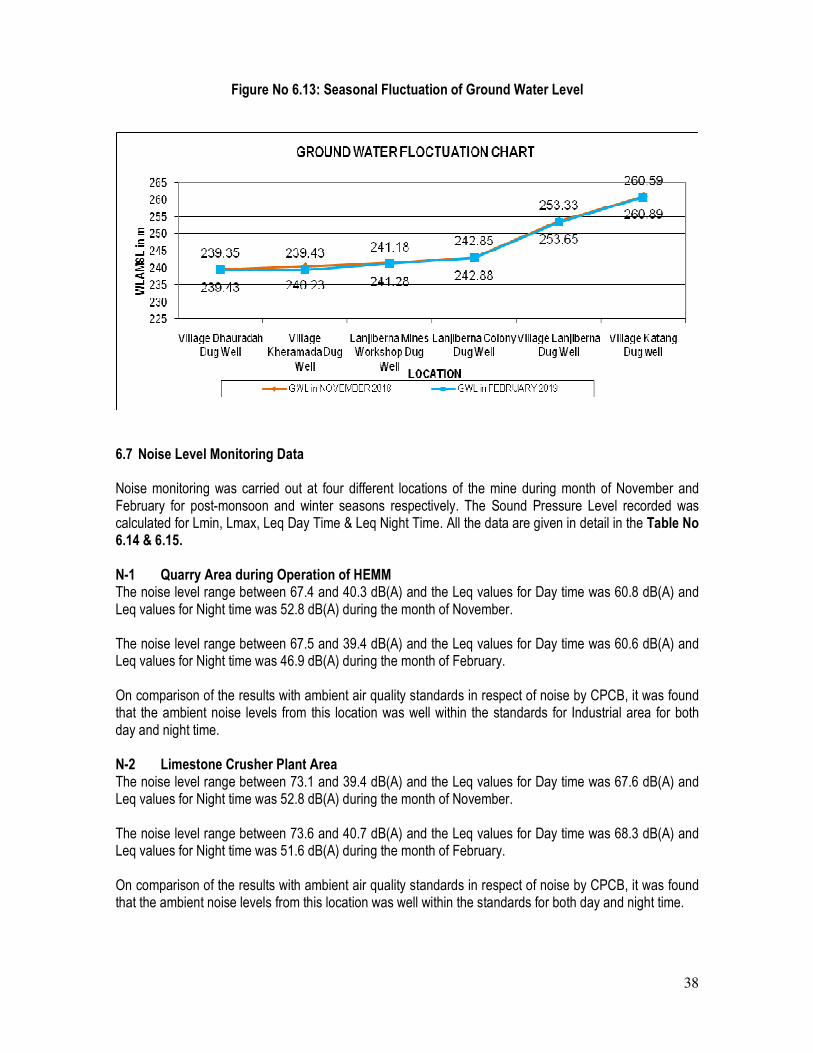
6.6 Ground Water Level Data The ground water level measured from the existing dug wells mentioned above are found to be varying significantly at all the locations, during the month of November the water level was found to be higher, which has decreased slightly during the month of February due to start of Dry summer months. The detail data is given below in the Table No 6.13, with a graphical representation of the fluctuation in Figure No: 6.13.
Table No 6.13: Ground Water Level Data
Sl No
Location Ground Level in m AMSL
Ground Water Level in m AMSL
Height of Water Column in m
November February November February
1 Village Kheramada Dug Well
243.23 240.23 239.43 5.01 4.21
2 Lanjiberna Colony Dug Well 247.83 242.88 242.85 6.45 6.42
3 Village Dhauradah Dug Well 242.34 239.43 239.35 5.58 5.50
4 Lanjiberna Mines Workshop Dug Well
245.03 241.28 241.18 2.39 2.29
5 Village Lanjiberna Dug Well 255.14 253.65 253.33 3.51 3.19
6 Village Katang Dug well 264.89 260.89 260.59 3.95 3.65
38
Figure No 6.13: Seasonal Fluctuation of Ground Water Level
6.7 Noise Level Monitoring Data Noise monitoring was carried out at four different locations of the mine during month of November and February for post-monsoon and winter seasons respectively. The Sound Pressure Level recorded was calculated for Lmin, Lmax, Leq Day Time & Leq Night Time. All the data are given in detail in the Table No 6.14 & 6.15. N-1 Quarry Area during Operation of HEMM The noise level range between 67.4 and 40.3 dB(A) and the Leq values for Day time was 60.8 dB(A) and Leq values for Night time was 52.8 dB(A) during the month of November. The noise level range between 67.5 and 39.4 dB(A) and the Leq values for Day time was 60.6 dB(A) and Leq values for Night time was 46.9 dB(A) during the month of February. On comparison of the results with ambient air quality standards in respect of noise by CPCB, it was found that the ambient noise levels from this location was well within the standards for Industrial area for both day and night time. N-2 Limestone Crusher Plant Area The noise level range between 73.1 and 39.4 dB(A) and the Leq values for Day time was 67.6 dB(A) and Leq values for Night time was 52.8 dB(A) during the month of November.
The noise level range between 73.6 and 40.7 dB(A) and the Leq values for Day time was 68.3 dB(A) and Leq values for Night time was 51.6 dB(A) during the month of February. On comparison of the results with ambient air quality standards in respect of noise by CPCB, it was found that the ambient noise levels from this location was well within the standards for both day and night time.
39
N-3 Lanjiberna Colony area The noise level range between 61.7 and 36.2 dB(A) and the Leq values for Day time was 55.4 dB(A) and Leq values for Night time was 39.3 dB(A) during the month of November. The noise level range between 59.7 and 37.6 dB(A) and the Leq values for Day time was 52.1 dB(A) and Leq values for Night time was 41.7 dB(A) during the month of February.
On comparison of the results with ambient air quality standards in respect of noise by CPCB, it was found that the ambient noise levels from this location was well within the standards for Residential area for both day and night time. N-4 Magazine Hill Top The noise level range between 57.9 and 36.8 dB(A) and the Leq values for Day time was 49.4 dB(A) and Leq values for Night time was 40.0 dB(A) during the month of November.
The noise level range between 54.1 and 36.1 dB(A) and the Leq values for Day time was 48.6 dB(A) and Leq values for Night time was 42.8 dB(A) during the month of February.
On comparison of the results with ambient air quality standards in respect of noise by CPCB, it was found that the ambient noise levels from this location was well within the standards for Silence Zone for both day and night time.
Table No: 6.14
Noise Level Data in Month of November
SL NO STATION NO Leq dB(A) Day Time
(600 Hrs – 2200 Hrs)
Leq dB(A) Night Time
(2200 Hrs – 600 Hrs)
Lmax dB(A) Lmin dB(A)
1. N1 60.8 52.8 67.4 40.3
2. N2 67.6 52.8 73.1 39.4
3. N3 55.4 39.3 61.7 36.2
4. N4 49.4 40.0 57.9 36.8
Table No: 6.15 Noise Level Data in Month of February
SL NO STATION NO Leq dB(A)
Day Time (600 Hrs – 2200 Hrs)
Leq dB(A) Night Time
(2200 Hrs – 600 Hrs)
Lmax dB(A) Lmin dB(A)
1. N1 60.6 46.9 67.5 39.4
2. N2 68.3 51.6 73.6 40.7
3. N3 52.1 41.7 59.7 37.6
4. N4 48.6 42.8 54.1 36.1
6.8 Effluent Water Quality Data The water quality from the outlet of Oil & Grease Separation tank was monitored during month of November and February for five parameters. pH was in the range of 7.64 to 8.09 which is slightly alkaline, TSS was 21.6 & 11.8 mg/l in November & February months, Oil & Grease content was 2.4 & 1.4 mg/l in
40
November and February months, Iron was < 0.01 mg/l in both the months and Nickel was < 0.25 mg/l in both the months. All the results are found to be well within the prescribed standards of State Pollution Control Board. 7. CONCLUSION 7.1 Ambient Air Quality It is concluded from the above study that the overall ambient air quality of the Lanjiberna Limestone & Dolomite mines of OCL India Ltd. is good and the action taken by the mines authority were quite satisfactory. 7.2 Fugitive Dust Emission The results of fugitive dust emission monitoring shows that the mining authority has taken up highly effective sprinkling systems inside the mines to control the emission of dust from the drilling, excavation and hauling operations. 7.3 Stack Emission Monitoring The stack emission monitoring results of all the six months shows that the bag filter installed in the limestone crusher plant is very much effective and results are all within the prescribed standards by the State Pollution Control Board, Odisha. 7.4 Water Quality The discharge water quality of all the quarries are found to be well within the prescribed standards as per EPA, G.S.R.422(E), 1993. 7.5 Ground Water Level There is no problem in the availability of ground water in the area and all the locations have adequate water. The ground water level is found to be slightly decreasing in the month of February due to start of dry summer months. 7.6 Noise level Noise monitoring results show that noise levels are well within the limits at all the stations, and there is no problem in the area due noise from the mining activity. 7.7 Effluent Water Quality The treatment facility available for Oil &Grease separation in the workshop waste water of the mines is found to be good and the system is operating quite well.
***


![[XLS]sundergarh.nic.insundergarh.nic.in/DPC SS/SS DRAFT LIST OF SUNDARGARH EDU... · Web viewJULI RANI NAIK KAILASH CH. PATEL 03.06.1977 AT-PRADHANPAT PO- MAHULPALI DIST- SUNDARGARH](https://img.pdfslide.us/doc/110x75/5aab641f7f8b9a2b4c8bfb0b/xls-ssss-draft-list-of-sundargarh-eduweb-viewjuli-rani-naik-kailash-ch-patel.jpg)