Embed Size (px)
Citation preview
Environmental Management in the Petroleum IndustrySustainability, Global frameworks and
Management tools
Piotr Tomasz Winther
Safety, Health and Environment
Supervisor: Annik Magerholm Fet, IØT
Department of Industrial Economics and Technology Management
Submission date: June 2013
Norwegian University of Science and Technology

Environmental Management in the
Petroleum Industry
Sustainability, global frameworks and
management tools
Piotr Tomasz Winther
Master Thesis
Norwegian University of Science and Technology
Trondheim, June 11th 2013
2
Preface
This thesis has been prepared at the Department of Industrial Economics and
Technology Management at the Norwegian University of Science and Technology
(NTNU). The thesis is written in the Master of Health, Safety and Environment
degree.
The idea for this thesis came about as a result of my summer internship with
Statoil in the summer of 2012. During my time with the company I was given a
task of gathering statistical data on accidental spills on the Norwegian
continental shelf and to determine in which areas of the drilling process they
occurred. In order to learn more about the underlying causes of the accidental
spills and its consequences, the idea of writing this report evolved.
I would like to thank my supervisor Annik Magerholm Fet at NTNU for valuable
advice and guidance during this project. Thank you for the motivation and
support throughout the process.
Stjørdal, June 11th 2013
Piotr Tomasz Winther
3
Abstract
The oil companies have traditionally provided the need for fossil fuels through
the supply of oil and natural gas. Oil production is regarded a polluting industry
and with its relatively large environmental footprint it also produces large
amounts of waste that is deposited to the sea, land and water.
As the known natural resources are becoming exhausted, discoveries of new
resources are required to fill the growing global need for energy. This is forcing
the oil industry to constantly stretch existing reserves and develop new
technology to get to the new oil and gas. This is seen through shallow wells
drilled on land to deeper wells, the move from land to offshore, from shallow
water to deep water, from normal pressures and temperatures to high
temperatures and pressures; and lately into shale fracturing technologies.
In order to supply the global market with oil and gas, the oil companies have to
explore and discover new reserves. As known reserves are depleted, the new
reserves get increasingly more challenging to produce. In this way the oil
industry is constantly operating on the edge of available technology. Operating in
this area of technology, an inherent risk of failures is increased. This can be seen
through the many major accidents and disasters in the petroleum industry.
In this project the main focus is on the activities and processes involved in the
drilling and production of oil and gas. Risks and accidents involved with the
transportation of oil are mentioned, as it is a major contributor to the total risk
of the industry. Governing laws and regulations, national and international,
which are meant to control the petroleum industry, are examined. Tools used to
measure and compare the various company performances, such as Key
Performance Indicators and Benchmarking are also mentioned. A comparison of
environmental governance and management between Norway and Uganda is
made in order to show the differences between industrial and developing
countries of succeeding in such governance.
4
Environmental Impact Assessment tools are presented and methods used in
assessing and managing environmental impacts are discussed. Methods of
reducing the effect of unwanted impacts are also identified.
Life cycle perspectives as an integral part of projects are presented and
highlighted through examples.
The main future challenges for the petroleum industry are company culture, risk
management and contingency planning.
5
Table of Contents
Preface ................................................................................................................... 2
Abstract ................................................................................................................ 3
Table of Contents ................................................................................................ 5
1.0 Introduction .................................................................................................. 7
1.1 Purpose and goal .......................................................................................... 9
1.2 The organisation of this report ................................................................. 10
1.3. Theory ......................................................................................................... 10
1.4 Methods ....................................................................................................... 10
2.0 The petroleum industry – an environmental overview .......................... 12 2.1 Petroleum activity accidents ............................................................................................................... 15 2.2 Into the deep water ................................................................................................................................. 16 2.2.1 Transportation ...................................................................................................................................... 17 2.2.2 Pipeline crossing land ......................................................................................................................... 18
2.3 Operational Spills & Emissions ........................................................................................................... 19 2.3.1 Flaring gas .............................................................................................................................................. 19 2.3.2 Flaring oil ................................................................................................................................................ 20 2.3.3 Produced water ..................................................................................................................................... 20 2.3.4 Restoration .............................................................................................................................................. 21 2.3.5 Control of the oil industry ................................................................................................................. 22
3.0 Environmental governance of the petroleum industry .......................... 23 3.1 Legislation and framework of Environmental Impact Assessment (EIA) ....................... 23 3.2 The Rio Declaration on Environment and Development ........................................................ 23 3.3 National laws and regulations ............................................................................................................ 24 3.4 Control mechanisms ............................................................................................................................... 25 3.4.1 Thematic versus functional regulations ..................................................................................... 25
3.4 International Territories and National state borders .............................................................. 26 3. 5 The Framework Legislation ................................................................................................................ 29 3.6 The Subordinate Regulations .............................................................................................................. 30 3.6.1 The Managing regulations ............................................................................................................... 30 3.6.2 The Facility regulations ..................................................................................................................... 31 3.6.3 The Activity regulations .................................................................................................................... 31 3.6.4 Technical and operational regulations ...................................................................................... 32
3.7 Involvement of Stakeholders .............................................................................................................. 32 3.8 Government departments roles and responsibilities ............................................................... 33 3.8.1 Regulatory Principles ......................................................................................................................... 34 3.8.2 Natural Environment ......................................................................................................................... 34
3.9 Governance toolbox ................................................................................................................................. 35 3.9.1 Company comparisons ....................................................................................................................... 35 3.9.2 Key Performance Indicators ............................................................................................................ 35 3.9.3 Benchmarking ....................................................................................................................................... 36 3.9.4 Company follow up .............................................................................................................................. 37 3.9.5 Low validity of impact assessments ............................................................................................. 40 3.9.6 Organizational and managerial deficits .................................................................................... 40
3.10 Normal operation related waste ..................................................................................................... 43 3.10.1 Production related waste ............................................................................................................... 43 3.10.2 Drilling related waste ...................................................................................................................... 44
6
4.0 Environmental Impact Assessment .......................................................... 45 4.1 Environmental Impact Statement ..................................................................................................... 48 Part 1: Methods and key issues .................................................................................................................. 48 Part 2: Background to the proposed project ....................................................................................... 48 Part 3: Environmental impact assessment – topic areas ............................................................... 49
4.2 Cumulative Impact Assessment ......................................................................................................... 49 4.3 Additive & Synergistic Cumulative Impacts .................................................................................. 50 4.4 Social Impact Assessment ..................................................................................................................... 52 4.4.1 Fisheries .................................................................................................................................................... 53 4.4.2 Fish farming ............................................................................................................................................ 53 4.4.3 Recreation and tourism ..................................................................................................................... 53
5.0 Comparative analysis of petroleum governance between Uganda and Norway ............................................................................................................................ 54 5.1 Petroleum industry governance in Uganda .................................................................................. 54 5.1.1 Environmental policy ......................................................................................................................... 55
5.2 Further comparisons and analysis .................................................................................................... 57 5.2.1 Functional laws and regulations ................................................................................................... 58 5.2.2 Interdepartmental cooperation ..................................................................................................... 59 5.2.3 Consequence evaluation .................................................................................................................... 59 5.2.4 Risk evaluation ...................................................................................................................................... 59 5.2.5 Environmental baseline ..................................................................................................................... 60
5.3 Summary of further comparisons ..................................................................................................... 60 5.3.1 Corruption ............................................................................................................................................... 60
5.4 Conclusion of the comparative analysis ......................................................................................... 61
6. Petroleum activities in a Life Cycle Perspective ................................................. 63 6.1 Decommissioning ..................................................................................................................................... 64 6.1 Sub Activities and Life Cycle Assessments .................................................................................... 66 6.1.1 Drilling Fluid Management .............................................................................................................. 66 6.1.2 Revised contract strategies .............................................................................................................. 69
7. Summary and Discussion ............................................................................. 70
8. Conclusion and Further Challenges ............................................................ 71
9. References ..................................................................................................... 73
10. Attachments ................................................................................................ 79 Attachment 1: List of major accidents since 1955 (Westergaard 1987) ................................. 79 Attachment 2: Key Performance Indicators (KPI) ............................................................................. 83 2.1. Health Statistics ....................................................................................................................................... 83 2.2 Safety Statistics ......................................................................................................................................... 84 2.3 Environmental Statistics ...................................................................................................................... 85 2.4. Abbreviations ............................................................................................................................................ 86
Attachment 03. Uganda’s petroleum provinces ................................................................................. 87 Attachment 04: Change from inspection focus to management systems ................................ 88 Attachment 05: Laws and regulations structure ................................................................................ 89 Attachment 06: The Norwegian Petroleum Directorate coordinating role ............................ 90 Attachment 07: Law and Regulations Pyramid .................................................................................. 91
7
1.0 Introduction
With the growing global population and increased use of energy consuming
technology, the world’s need for resources such as food, minerals and energy is
steadily increasing. Impacts from exploiting these resources are increasingly
threatening the global environment. Global warming, pollution of water, land
and sea, and the destruction of the habitats supporting the livelihood of large
populations are major issues today. With the emerging economies, developing
countries have steadily increased the demand for resources including energy and
fossil fuels.
This hunt for oil and gas has led to many disasters causing loss of many lives and
major pollutions of the environment. These arise from two main sources:
• Lack of clean production from both drilling and processing
• Accidents causing spills to the environment
With regard to accidents, the oil industry seems to neglect the fact that they
happen. Theories surrounding such events have been developed by Nassim
Taleb and are known as “Black Swans” (Eccleston 2011). According to Eccleston
(2011, p.18) Black Swan theory was developed to explain: 1) “potentially rare but
catastrophic, and difficult to predict events that lie beyond normal expectations”
and 2) “the psychological biases that tend to blind people to the possibility of such
uncertain events.” Black Swan events are normally related to all major scientific
discoveries, historical events and artistic accomplishments, but in recent times
have been associated with catastrophic environmental impacts that have been
indeed difficult to predict. An example of such an event was the Deepwater
Horizon drilling rig blowout in the Gulf of Mexico. When looking back at the
incident one could say that environmental systems put in place should have
given managers the tools and ability to uncovered faults that led to the disaster.
In reality it did not, as this was a classic Black Swan event. The catastrophe was
extremely rare and predicting it could not be done with any degree of certainty.
Environmental managers could play an important role as they are often perfectly
positioned to see warning signs and could perform analysis of different scenarios
8
that could have the potential to cause environmental impacts. By furthering the
development of effective plans and mitigation methods from merely overseeing
more routine or mundane environmental issues normally set by standard
environmental laws and regulation, environmental manager could also prevent
hard to predict Black Swan events.
To a large extent natural disasters marked the beginning of the modern
environmental movement which led to stricter laws and regulations and, in
effect, litigation. An idealistic breed of lawyers helped to lead the environmental
movement while corporations in their defence hired lawyers to help address
regulatory compliance and liability issues. The corporate lawyers often view
compliance and regulatory issues in terms of promoting the interest of the
company that hired them. The result of this is corporations who claim to
promote sustainable development but in reality hire a huge number of lawyers
to protect their own interests. Training classes for Health Safety and
Environmental specialists teach them how to think like lawyers and at the
workplace; emails and memos are being sent out to caution employees about the
remote possibility of being “discovered” as part of a lawsuit. This may also have
negative implications. Furthermore, a fear of repercussion may cause managers
to take the position of “remaining silent” which in turn minimises important
communications of potential risks in projects (Eccleston 2011).
Opinions and viewpoints within areas of sustainability can vary widely. This
makes it possible for organisational ethics to be interpreted within the narrow
confines of existing regulations. This is often seen in dazzling marketing terms
and commitments such as “zero harm to the environment” that is often put forth
in the core principals of corporations. It is difficult to see how these core
principals are integrated into the strategy and daily activity of the organisation.
As previously mentioned, many idealistic lawyers helped lead the initiation of
the modern environmental movement. Nevertheless, many lawyers specialise in
circumventing HSE quality and security; and at the same time counsel
organisational managers on how the protect their own interests with total
disregards for the environment.
9
However, there is another possibility available to government and organisation
of reducing risks. This approach can optimize decision-‐making while avoiding
many of the paradoxical legal dilemmas described above. This avenue involves
preparing scientifically based assessments which objectively evaluate decision
making potential impacts, risks, and reasonable alternatives to what may be a
standard or traditional course of action. High quality assessments can provide
decision makers on different levels an effective and powerful tool for balancing
impacts and risks against the traditional factors such as cost and schedules.
1.1 Purpose and goal
The main goal of this thesis is to evaluate the environmental management of the
petroleum industry by examining sustainability, global frameworks and
management tools.
This paper will contribute with the following:
1. Give an overview of the evolution history of the petroleum industry with a
sustainability perspective.
2. Give an overview of laws and regulations, the governance roles and
responsibilities, the use of consents, audits, deviations and sanctions
3. Give a general background of impact assessment and identify tools and
methods in assessing environmental and social impacts.
4. Perform a comparative analysis of environmental management and
governance of petroleum industry between countries
5. Give an overview of exploration drilling and the environmental governance of
the upstream activities
10
6. Discuss the impacts of oil exploration and production in a life cycle perspective
based upon case exemplification.
1.2 The organisation of this report
This thesis is organised into 6 main parts. The thesis begins with the history of
the petroleum industry from a sustainability perspective. The intentions of the
laws and regulations are presented and compared with industry performances
and accident investigation reports. Tools and methods applied in environmental
assessments are described before a comparison between Norway and
developing countries is performed. At the end a discussion of further challenges
and conclusion is made.
1.3. Theory
To be able to assess the quality and relevance of the Petroleum Industry
Environmental Management, the framework for the EMS system like EIA, must
be established. EIA theories together with governing laws and regulations are
described and used as basis for the study.
1.4 Methods
This following will present approaches and methods used in this thesis, their
weaknesses and strengths and how they are used in the attempt to answer the
main goals of the paper. According to Bryman (2008) qualitative research is a
strategy within collection and analysis of data that emphasises on words rather
than quantification. On the other end, Bryman (2008) states that in quantitative
research; reliability and validity are important criteria when establishing and
assessing the quality of research. The reliability of research is determined by
how consistent results are over time and how accurate a representation of a
given population is for the study at hand. A reliable study will give the researcher
the opportunity to draw conclusions, formulate theories, or generalize from the
11
results of the research. Further, the validity of research as said by Mason (1996,
p. 24) is whether “you are observing, identifying, or measuring what you say you
are”. It is not possible to have valid research, without having fulfilled the criteria
of reliability. For the purpose of this paper qualitative research methods will be
used.
In the beginning of a project it is crucial to get an overview of earlier work on the
topic. A literature review was performed to assess existing information as well as
determining what issues that could be brought up for further discussion. For this
paper the literature review served several purposes; it put background
information into context, and served to obtain a current status of the topic.
In order to find reliable and valid information purposive sampling was used.
According to Bryman (2008) purposive sampling is strategic sampling which
attempts to get a sound correspondence between research question and the
sampling of information. Therefore, the sampling of information was based on
specific qualifications central to the thesis that in the end helps in answering the
research questions.
The main sources of information in this thesis were reports, official websites
related to the petroleum industry, sustainability reports of oil companies,
academic journals, and personal communication with professionals within the
petroleum industry and government. Furthermore, reports and drilling consent
applications from oil companies operating on the Norwegian continental shelf
(NCS) were obtained and scrutinized for relevant information related to the
topic.
12
2.0 The petroleum industry – an environmental overview
The following chapter will describe the history of the petroleum industry from
an environmental perspective. The development from the first production of oil
through the development of rotary drilling and the oil industry’s move offshore
is discussed. Furthermore, the intricate challenges related to deep water drilling
and developments are reviewed. Examples of major environmental disasters
caused by oil wells blowing out and wrecked oil carriers are listed. It may be
argued that some major incidents are missing, but the objective is to
demonstrate how often the impossible, which are often said “cannot happen”,
actually do happen. Various types of operational related spills are included;
these being a large contributor to the total spill to the environment and must not
be forgotten. A brief background and history of government control, sanctions
and environmental laws are also included in this historical overview.
“The deterioration of the environment is in large measure the result of our inability
to keep pace with progress. We have become victims of our own technological
genius.”
President Richard Nixon
(The American Residency Project 2013)
Oil wells drilling history is old, some 2500 years ago, in China, wells were drilled
with percussion type chisel bits attached to bamboo poles. These wells could
reach depths of 240 m. These days the oil was not the objective of the wells, but
the salt. The oil was a waste product, which was burned off in the salt
evaporation process. Petroleum products were reported used on streets of
Baghdad, which were paved with tar. Kerosene lamps were another application
of petroleum as well as the basis in flammable products for different military
purposes (OSC 2013b).
In the 13th century Marco Polo described oil fields with around Baku in
Azerbaijan. He described shallow pits were dug to allow the oil to seep into and
13
being collected. These pits were hand dug and could be up to 35 meters deep.
Some 4,000 metric tons of oil were reported produced from such pits in 1830.
The industrial revolution triggered the use of oil and boosted the need for oil and
our civilizations dependency on petroleum products was stared. The easy oil
from hand-‐dug holes was soon exhausted and new technologies to produce oil
from the underground had to be developed. Today’s drilling technology by the
use of a derrick was invented in the 1850’s by Colonel Drake. Technologies
including drilling with a hollow pipe and the use of casing to protect the hole
from caving in were introduced. These technologies are similar to today’s rotary
drilling technology. The use of drilling with hollow pipe and securing the wells
from caving in with casings allowed the wells to be drilled deeper, down to
several hundred meters, and oil under pressure was discovered. When these
over pressured oil reservoirs were drilled into, the oil blew out and spilled over
the surrounding land, ending up in ponds where it was collected (OSC 2013b).
In the beginning the pollution this caused was not paid much attention to, the oil
was delivered, no one asked how. This could not continue and it was soon
realized that this was not a sustainable way of drilling for oil. The use of
weighted drilling mud was introduced and later well control equipment capable
of closing in flowing wells were developed (OSC 2013b). The hunt for oil
resources put the oil industry offshore drilling at Baku at Bibi-‐Eibat field in 1846
which was 50 years before offshore drilling for oil began off the coast of
Summerfield, south of Santa Barbara in California. Wooden piers were built
reaching some 450 meters out from the beach. The drilling techniques used on
land were used with the exception of steel pipes which were pounded into the
seabed from the pier. In 1902 the production stopped and the wells were
abandoned. In these days the environmental impact was not an issue and the
project left behind ugly beaches polluted by oil and old remains from piers and
derricks sticking out into the sea.
Mobile offshore drilling units were introduced by the use of barges. Small mobile
barges were towed into the shallow waters were they were ballasted with water
resting on the shallow sea bed. The first real step to conquer the sea has been
made. Jack up drilling rigs technology was the barge was modified so it could be
14
jacked up on legs standing on the sea bed. The jack up drilling rigs could be used
on water depths up to 120 meters offering the drilling technology used to
explore the North Sea oil province in the 1960’s. Steel jacket structures were
built as foundations for the decks where the production facilities were installed
(OSC 2013b). The steel structures were followed by concrete platforms installed
on the sea bed developing the North Sea giant fields such as the Statfjord, Brent
and Troll.
As the shallow waters were being produced, deeper water exploration was
required. Drill ships and semi-‐submersible drilling rigs technologies were
developed. Instead of production installations standing on the sea bed, subsea
production technology was developed and the Deep Water becomes the new
frontier. The deep water discoveries made in the 1980s were developed into
subsea producing fields in 1990s. Deep water production increased and by the
end of the decade, production from deep water surpassed that in shallow water
for the first time (OSC 2013b).
As the move to deep water was not a gradual process; the technology and lessons
learned could not be fed into new developments. This itself was a major risk
element, as the industry moved faster than the technological development.
Since the year 2000 deep water production capacity has more than tripled. Ten
years ago, 1.5 million barrels per day were produced in water depths over 700m.
Nine years later the production from depth below 700 m had risen to over 5
million barrels per day (IHS-‐CERA 2013 & OSC 2013b).
Discoveries in deep waters also comprised a significant portion of new finds. In
2008 total oil and gas discovered in deep water globally exceeded the volume
found onshore and in shallow water combined. The world increasing demand of
energy is increasingly depending on deep water oil and gas (OSC 2013b).
The “easy oil” is depleted and we cannot expect any significant discovery of such
oil any more. Tight gas reservoirs, shale gas, shale oil and oil sands have become
new terms of the petroleum industry. These discoveries and the development of
the tight reservoirs and shale fracturing technologies are giving land drilling
15
operations a new spring. At the same time the development of deep water
reservoirs are on-‐going, and the move into even more challenging and sensitive
areas are growing; Russian oil and gas companies are reviewing plans to develop
areas in the Arctic, while Norway and Canada are assessing similar projects. This
is giving new environmental challenges that the industry needs to address and
solve (OSC 2013b).
2.1 Petroleum activity accidents
When the ancient Chinese drilled the first wells, the objective was to extract the
salt from the produced brine. The oil associated with the brines were regarded a
pollutant and was burned off. The industry soon faced the environmental
problems with oil polluting the land or rivers where ever it spilled into. Both
from drilling where blowouts of from pressurized oil reservoirs or spills or leaks
from transporting or storing oil became an increasing concern.
The move offshore and into deep waters also had its price; frequent accidents
became reminders of the risks related to the petroleum activity (OSC 2013b).
The following is a list of major accidents and spills. The purpose of providing this
information is to document that such major accidents are reoccurring within the
petroleum industry. In Attachment 1, a more comprehensive list of accidents can
be found. This list enhances the statement that “Black Swan” incidents do happen
(OSC 2013b, pp. 2-‐6):
• In 1969 a blowout at the Santa Barbara Channel had resulted in an 800-‐
square-‐mile slick of oil hitting some 50 km of Southern California beaches
and impacted the wild life. The blowout lasted 11 days and ultimately
released approximately 80,000 barrels of oil.
• In 1979 the Ixtoc I blowout off Mexico’s Bay of Campeche took nine
months to cap and released an estimated 3.5 million barrels of oil.
16
• In 1988, offshore drilling suffered another major calamity, this time in the
North Sea. The North Sea Piper Alpha platform, exploded as a result of a
fire and a consequent gas leak leading to the death of 167 workers. It was
the deadliest accident in oil history.
• A fire at the Kab 121 oil platform belonging to the Mexican state-‐owned
oil company Pemex, in the Gulf of Mexico in late 2007, led to the death of
22 workers. Around 5,000 barrels of oil leaked into the sea.
• The Hasbah blowout in the Persian Gulf killed 19 workers when the
exploration well blew out in 1980.
• In 2010 the Macondo well blew out killing 9 workers and spilling some 5
million barrels of oil into the Gulf of Mexico.
• In November 2012, a well containing H2S blew out in Kuwait. The release
of the toxic gas reached Kuwait city and the well had to be put on fire.
2.2 Into the deep water
The petroleum industry soon recognised that deep-‐water conditions had special
challenges and a greater need for critical equipment such as blowout preventer
(BOP). Under water equipment such as Remote Operated Vehicles (ROV´s) are
also important when working the deep seas with regards to maintenance and
risk reduction measures.
Up until the BP Deep water Horizon accident, little attention was devoted to
containment of a blown out well in the deep water, largely because its
occurrence was considered so unlikely it could not happen; a “black swan” type
accident. Perhaps the greatest risk factor is the very feature that the deep-‐water
boom is so immensely large in the first place (OSC 2013).
17
2.2.1 Transportation
The produced oil and gas is transported from the producing wells to processing
facilities, either on offshore installation or at the fields on land, where the oil, gas
and water phases are separated for further transportation. This may be over
land to tank farms at shore and from the oil tankers to their final destination in
oil consuming countries. This transportation is a risk on all the transport
elements. Below is a list of major accident related to crude oil carriers wrecking
at sea (OSC2013a):
• 1967, Torrey Canyon
The American tanker Torrey Canyon split in two in March 1967 on the
Seven Stones Reef off Land's End in the UK, spilling 120,000 tons of crude
oil towards the beaches of southwest England. Around 80 km of French
and 200 km of Cornish coast were contaminated. Around 15,000 sea birds
were killed. An inquiry found the captain was to blame after he took a
short cut to save time in getting to the ship's destination in Milford Haven,
Wales.
• 1978, Amoco Cadiz
The fully laden 233,000-‐ton Liberian supertanker Amoco Cadiz sank into
the Atlantic Ocean near Portsall, in Brittany in March 1978 after running
aground on Portsall Rocks. A full polution alert was ordered and 44
crewmen were evacuated by the French navy. The ship's entire cargo of
1.6 million barrels was released into the sea. At the time it was the largest
oil spill in history; it is now ranked as the fifth largest.
• 1996, The Sea Empress
The Sea Empress was a single-‐hull oil tanker that ran aground off the
Pembrokeshire coast of Wales in February 1996. An estimated 73,000
tons out of the ship's 130,000 ton cargo of North Sea crude oil spilled into
the sea. Around 200 km of coastline were covered in crude oil.
18
• 1989, Exxon Valdez
On March 24, 1989, the tanker Exxon Valdez, en route from Valdez, Alaska
to Los Angeles, California, ran aground on Bligh Reef in Prince William
Sound, Alaska. The vessel was traveling outside normal shipping lanes in
an attempt to avoid ice. Within 6 hours of the grounding, the Exxon
Valdez spilled approximately 10.9 million gallons of its 53 million gallon
cargo of Prudhoe Bay crude oil. Eight of the eleven tanks on board were
damaged. The oil would eventually impact over 1800 km of non-‐
continuous coastline in Alaska, making the Exxon Valdez the largest oil
spill to date in U.S. waters. Many of the visible damages from oil spills
over the years came from tanker accidents, most notably the collision of
the Exxon Valdez that led to between 260,000 and 750,000 barrels of oil
leaking out and wreaking havoc on Alaska’s coastline.
• 2002, The Prestige
The Prestige tanker started leaking fuel off the coast of Galicia, Spain,
when it encountered a violent storm about 250 km off Spain's Atlantic
coast. During several days, it was pulled far from the shore, but the
crippled tanker carrying more than 67,000 tons of oil split in half off the
northwest coast of Spain on Tuesday, becoming one of the worst
environmental disasters in Spanish history.
2.2.2 Pipeline crossing land
Pipelines are less prudent to disasters like ships wrecking at sea, but they need
to be included. Environmental and social disasters have been the consequence of
poorly managed pipelines (OSC2013a):
• 2006, Prudhoe Bay
The opening of drilling in Prudhoe Bay Alaska and subsequent rapid
construction of a 1000 km pipeline through permafrost; oil began
reaching Valdez in the summer of 1977, and the pipeline was delivering
well over a million barrels a day by the following year. At the Prudhoe
Bay oil spill in 2006, 1000m3 were spilled over 8,000 m2 of permafrost
19
making it the largest oil spill on Alaska's North Slope to date. The oil had
not just left behind a polluted ground, but the leak, and the subsequent
discovery that 10 km of pipeline was badly corroded and needed to be
replaced. This led to the shutdown of much of Prudhoe Bay oil Field and
the loss of hundreds of millions of dollars.
• 1976 & 1996, The Niger delta An estimated 2 million barrels of oil were spilled into the Niger Delta 1976 and
1996 says Nigerian government. These are spills from numerous incidents at
the plants or at the oil pipelines. A UN report states that there have been a total
of 3 million barrels of oil. The World Bank states the true quantity of petroleum
spilled into the environment could be as much as ten times the officially claimed
amount. 70% of these spills occurred off-‐shore, a quarter was in swamps and
6% spilled on land. Some spills are caused by sabotage and thieves, however
most are due to poor maintenance by oil companies. The devastation that oil
pollution has wrought in the Niger Delta is indisputable. GlobalPost's
correspondent Heather Murdock has described what she saw there(Global Post
2012):
"Oil floats on the delta’s waterways, killing and contaminating the plants
and animals in one of Africa’s most bio-‐diverse regions. Along the banks of
the creeks, muddy fishing villages are slick with oil that washes ashore.
Villagers say they drink and bathe in the oily waters and as a result,
children are dying of diseases."
2.3 Operational Spills & Emissions
Blowouts and catastrophes with large releases of oil and gas are well known
through the news. At the same time massive releases of Green House Gas (GHG)
and chemicals are released as a part of the operational processes, drilling,
construction or processing and refining.
2.3.1 Flaring gas
Lack of infrastructure in many of the oil producing areas, the associated gas
cannot be utilized but being flared off as it is separated from the oil. Each year
20
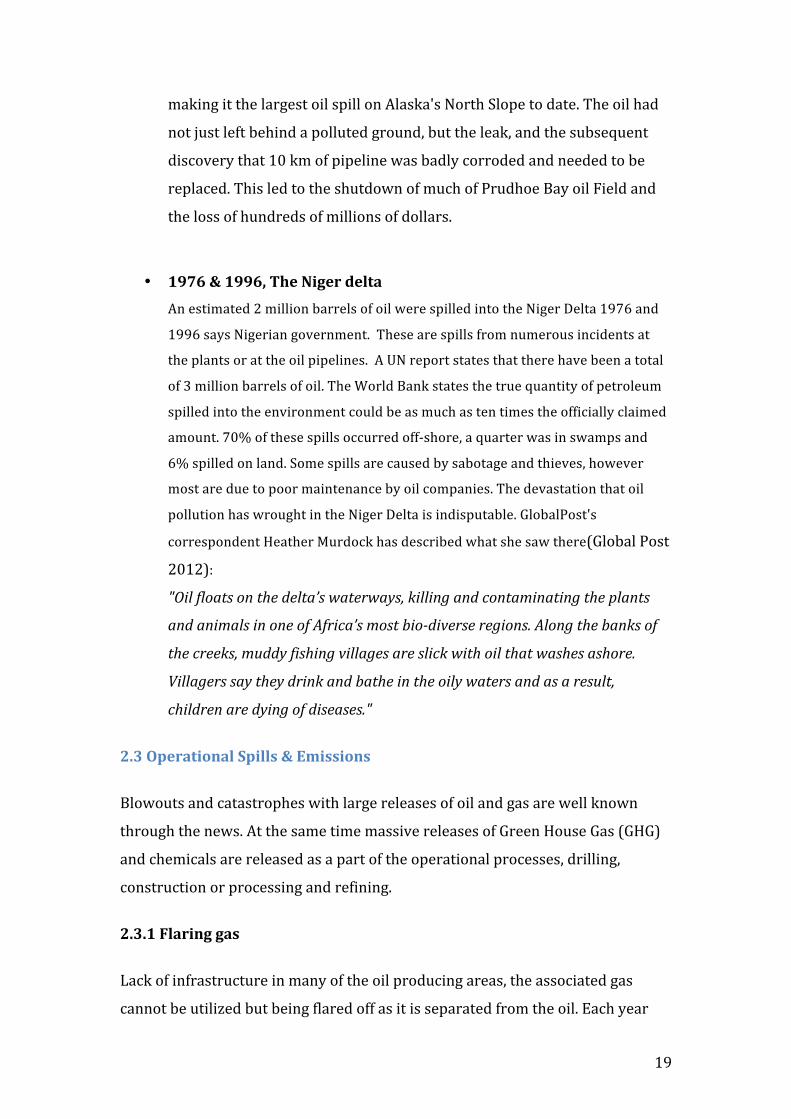
150 billion, 109, cubic meter gas is flared worldwide, contributing to 400 million,
106, ton CO2. This is a higher CO2 emission than the entire Australia. Figure 1
below shows gas flaring on an offshore oil rig.
Figure 1: Gas Flaring (NPD 2013)
2.3.2 Flaring oil
Each day hundreds of thousand barrels of oil are flared off as a part of the
refining process. Old technology refineries are using the flaring as the method to
cope with peak raw oil input to the refineries. Instead of controlling the oil input
or making facilities for handling the excess oil it is burned casing enormous GHG
emissions and polluting the area surrounding the refinery.
2.3.3 Produced water
Associated water with oil and gas production is separated from the oil and
cleaned to a minimum remain, typically around 40 ppm. Multiplying this value
with the world yearly production shows each year 1 million barrels of oil is
routinely disposed into the environment. From the Norwegian petroleum
activity the produced water is counting for 87% of the spill from the petroleum
activity.
21
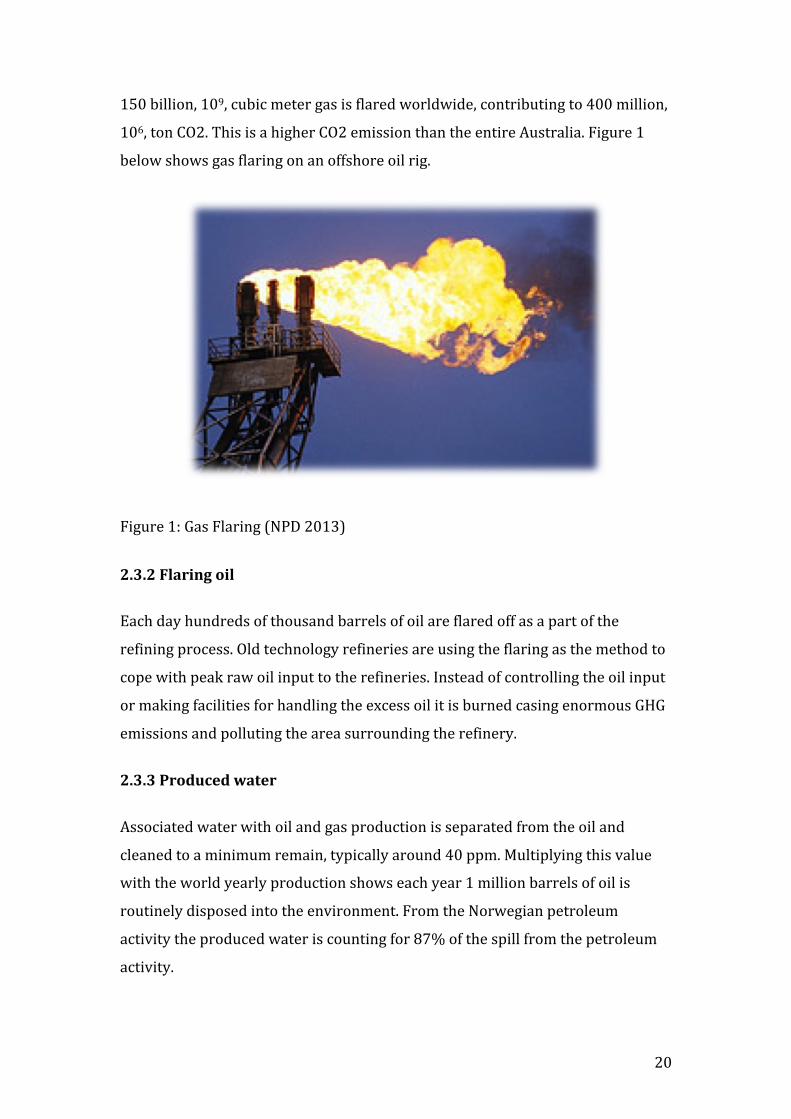
Figure 2 below, illustrates releases from the petroleum industry from produced
water, accidental releases and ballast and damage.
Figure 2: Releases from the petroleum activities per activity, 2010 (NPD 2013).
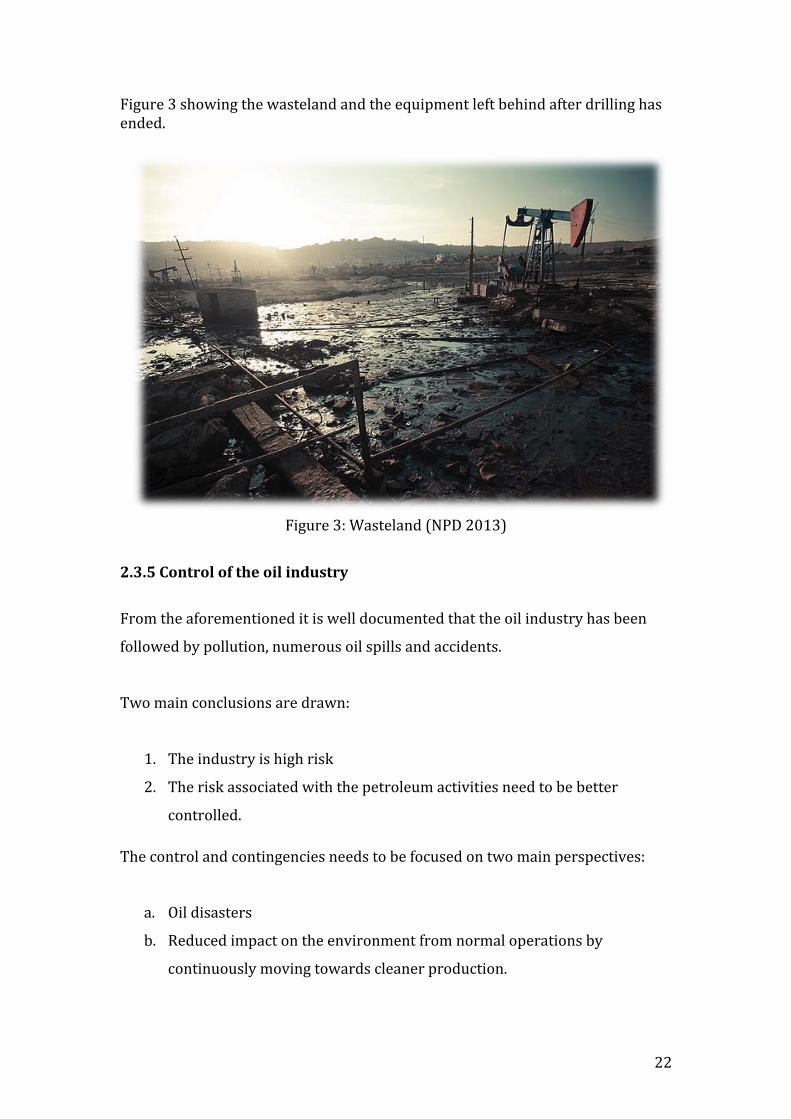
2.3.4 Restoration
After the oil production is stopped and the field is produced, the wells are
plugged and abandoned and the installations are removed. Most nations with
activities on their continental shelf have this in place. The oil companies have to
set off funds for these purposes when the field life comes to an end.
On land and on old developments this is often not the case. Old oil fields have
often been left without any restoration plan or activity in place at all. Even the
equipment, rigs and the oil pumps are left behind, let alone vast areas of polluted
land. The land is left as a wasteland where the water and soil is poisoned from oil
and chemicals used in the process of drilling and produce the reservoir. Nothing
can grow and it is not possible to use the land without large green land
restoration projects (NPD 2013).
87%
7.30% 5.70%
Produced Water
Accidental releases
Ballast and Drainage
22
Figure 3 showing the wasteland and the equipment left behind after drilling has ended.
Figure 3: Wasteland (NPD 2013)
2.3.5 Control of the oil industry
From the aforementioned it is well documented that the oil industry has been
followed by pollution, numerous oil spills and accidents.
Two main conclusions are drawn:
1. The industry is high risk
2. The risk associated with the petroleum activities need to be better
controlled.
The control and contingencies needs to be focused on two main perspectives:
a. Oil disasters
b. Reduced impact on the environment from normal operations by
continuously moving towards cleaner production.
23
3.0 Environmental governance of the petroleum industry
Over the last decades an improved understanding of the global environment and
the ecosystems has developed. Out from the universities comes a new breed of
engineers; the Health Safety and Environmental (HSE) engineers. They are
specialists in fields such as natural science, ecosystems, risk, safety and
environmental impact assessments. Mitigation methods as well as
environmental management are becoming scientific foundations.
3.1 Legislation and framework of Environmental Impact Assessment (EIA)
In its early day, Environmental Impact Assessment (EIA) was used as part of a
rational decision making process and it largely involved a technical evaluation
that would lead to objective decision making. EIA was made legislation in the
United States in the National Environmental Policy Act (NEPA) 1969 and has
since evolved as it has been used increasingly in many countries around the
world. International work on the environment has been led by the United
Nations Environment Programme (UNEP), since its inception in 1973. UNEP has
led and encouraged partnerships between companies and governments through
the use of Multilateral Environmental Agreements (MEA’s) that have addressed
issues such as species loss and the need for conservation at a global and regional
level. UNEP has created much of the international environmental law in use
today (United Nations Global Compact 2013).
3.2 The Rio Declaration on Environment and Development
The Rio Declaration on Environment and Development, often shortened to Rio
Declaration, was a short document produced at the 1992 United Nations
"Conference on Environment and Development" (UNCED), informally known as
the Earth Summit. The Rio Declaration consisted of 27 principles intended to
guide future sustainable development around the worlds. Some of the principles
contained in the Rio Declaration may be regarded as third generation rights by
European law scholars. It defines the rights of the people to be involved in the
development of their economies, and the responsibilities of human beings to
24
safeguard the common environment. The declaration builds upon the basic ideas
concerning the attitudes of individuals and nations towards the environment and
development, first identified at the United Nations Conference on the Human
Environment held in 1972.
The Rio Declaration states that long term economic progress is only ensured if it
is linked with the protection of the environment. If this is to be achieved, then
nations must establish a new global partnership involving governments, their
people and the key sectors of society. Together human society must assemble
international agreements that protect the global environment with responsible
development (Sustainable Development 2013)
Within the area of EIA, principle 5 and 17 from the Rio Declaration are seen as
the most relevant:
• “Principle 4 of the Rio Declaration, stated “In order to achieve sustainable
development, environmental protection shall constitute an integral part of
the development process and cannot be considered in isolation from it.”
• “Principle 17 stated “Environmental impact assessment, as a national
instrument, shall be undertaken for proposed activities that are likely to
have significant adverse impacts on the environment and are subject to a
decision of a competent national authority. “
(United Nations General Assembly 2013)
3.3 National laws and regulations
The assessment of environmental impacts was first used in the 1960 and was
part of a rational decision making process and involved technical evaluation of
environmental impacts, which lead to a more objective decision making.
The origin of the Environmental Impact Assessment system began with the
enactment of the National Environmental Policy Act (NEPA) in the United States
of America in 1969. Other countries soon followed, although legislation was
passed a few years after the United States (Jay et al. 2007).
25
The Canadian Environmental Assessment Act (CEAA) came into force in 1995
while legislative amendments were introduced in 2001 and came into force in
2003. The Chinese State Environmental Protection Administration (SEPA) used
its legislation to halt 30 projects in 2004, including three hydro-‐ power plants
under the Three Gorges Project Company. In Europe, The European Directive
(85/337/EEC) on Environmental Impact Assessments (known as the EIA
Directive) was first introduced in 1985 and was amended in 1997. The directive
was amended again in 2003, following EU signature of the 1998 Aarhus
Convention. In 2001, the issue was enlarged to the assessment of plans and
programmes by the so-‐called Strategic Environmental Assessment (SEA) Directive
(2001/42/EC), which is now in force (Jay et.al 2007).
3.4 Control mechanisms
The control of the oil industry starts with government law and regulations
combined with sanctions, aimed to reduce the risk of accidents or negative
impacts the oil industry could have on the environment, and the society.
3.4.1 Thematic versus functional regulations
The first petroleum laws and regulations were thematic type laws and
regulations. These were aimed at the oil companies and were specific to how the
installation and activities were to be carried out. These had their weaknesses,
both technologically, as they were specific, and legally as the regulations
specified the solutions. This was not the intention of the regulations and they
developed into functional requirements aimed not only at the oil company but at
all the main participants in the petroleum activity. The laws specified certain
requirements so that the activities were to be designed and performed with no
harm to personnel, minimise impact to the environment and include processes
for continuous improvement. In this way the industry had to prove to the
government on how they were meeting the intentions and requirements in the
laws and regulations (Norwegian Petroleum Directorate 2010a).
The functional regulations are process oriented; where the processes ensure that
the intentions of the law and regulations are in place. It is the company, or the
26
licensee holders’ responsibility, to describe how activities are carried out.
Today’s modern type regulations are recognized by the following principals:
1. Functional regulations
2. Coordination between other government bodies, like health,
environment, transport.
3. Use of consequence evaluations
4. Risk evaluation, activities are risk based and risk managed.
5. Contingency planning
(Norwegian Petroleum Directorate 2010a)
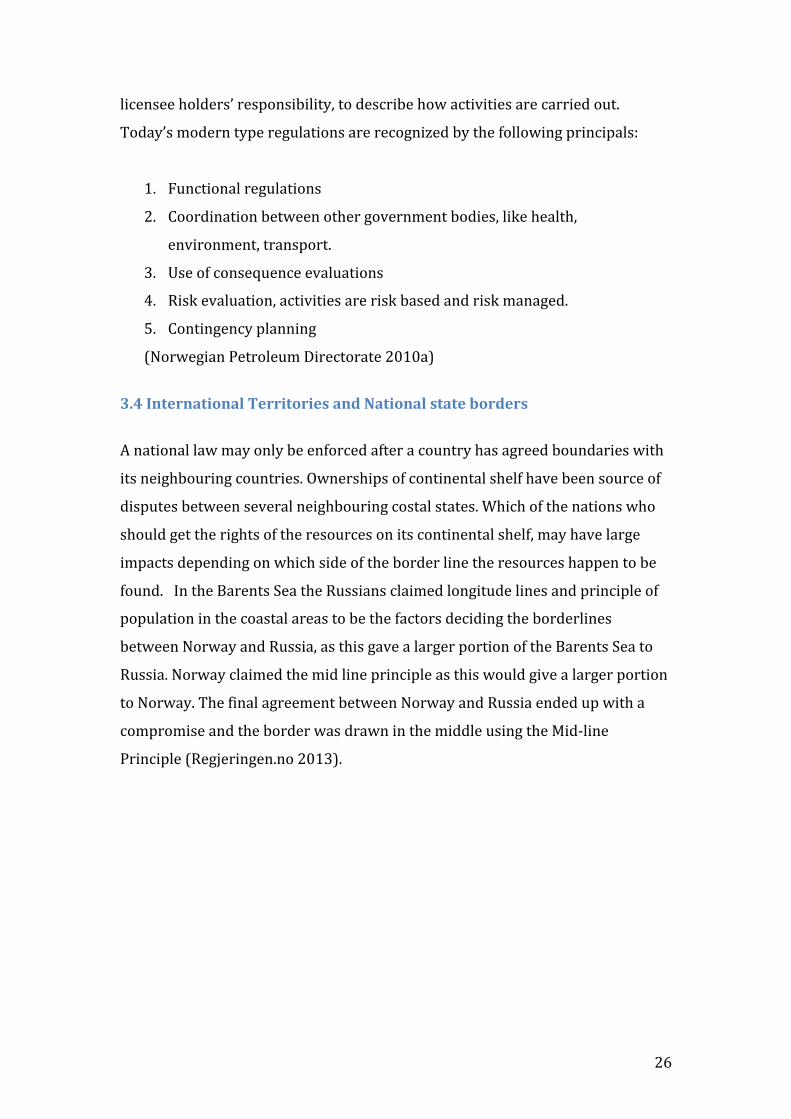
3.4 International Territories and National state borders
A national law may only be enforced after a country has agreed boundaries with
its neighbouring countries. Ownerships of continental shelf have been source of
disputes between several neighbouring costal states. Which of the nations who
should get the rights of the resources on its continental shelf, may have large
impacts depending on which side of the border line the resources happen to be
found. In the Barents Sea the Russians claimed longitude lines and principle of
population in the coastal areas to be the factors deciding the borderlines
between Norway and Russia, as this gave a larger portion of the Barents Sea to
Russia. Norway claimed the mid line principle as this would give a larger portion
to Norway. The final agreement between Norway and Russia ended up with a
compromise and the border was drawn in the middle using the Mid-‐line
Principle (Regjeringen.no 2013).
27
Figure 4 below shows the compromised line in which Norway and Russia agreed
upon on the 15th of September 2010 (Regjeringen.no 2013):
Figure 4: Barents Sea Borderline between Russia and Norway (BBC News 2013)
Once the borderline disputes have been resolved and the neighbouring states
have got sovereignty of their offshore territories, the individual nation makes
laws regulating the exploration and productions of the resources on the
continental shelf. This is done by making a law, a petroleum law. The objective of
such a law is firstly to secure the rights of the national state on its continental
shelf and secondly to enforce its own national laws. National states law regulates
who have the right of the minerals, such as hydrocarbon accumulations, in the
ground of the states’ territory. This may be the individual landowner, the county
or states, of the nation. Hydrocarbons found on land may have private
ownership, as federal government may own deposits offshore. These regulations
have evolved from thematic regulations to today’s more modern functional
regulations (Norwegian Petroleum Directorate 2010a). The thematic regulations
were product, technical and inspection oriented. These are specific and detail
how things should be done. The advantage of the thematic regulations is that
they are specific and easy to control. One important disadvantage is that the
28
responsibility; by applying thematic regulations the responsibility could end up
as a grey zone between the petroleum company and the government as long as
the company is following the instructions given in the regulation (Nerheim
1998). Functional type regulations do not have this problem. Here, the company
is required to demonstrate that its own activities and processes are following the
intentions of the laws and regulations. The functional regulations are more
difficult to monitor and control, thereby requiring skilled government
representatives (The Ministry of Petroleum and Energy 2010).
The national governments empower departments, for example the Norwegian
Petroleum Directorate, to ensure the laws regulations are adhered to. The
departments, with references to the law, makes regulations to detail the
country’s control activities related to the exploration and extraction of the
resources. An example of this is found in the Norwegian Petroleum Law and
regulations. Here, the regulation related to the petroleum activities is organized
in the main regulation related to health, safety and environment on the
Norwegian shelf, the framework regulation (Figure 5 below).
Based upon this, there are sub regulations such as the installation regulation, the
activity regulation, the management regulation and the reporting regulations
(The Ministry of Petroleum and Energy 2010).
29
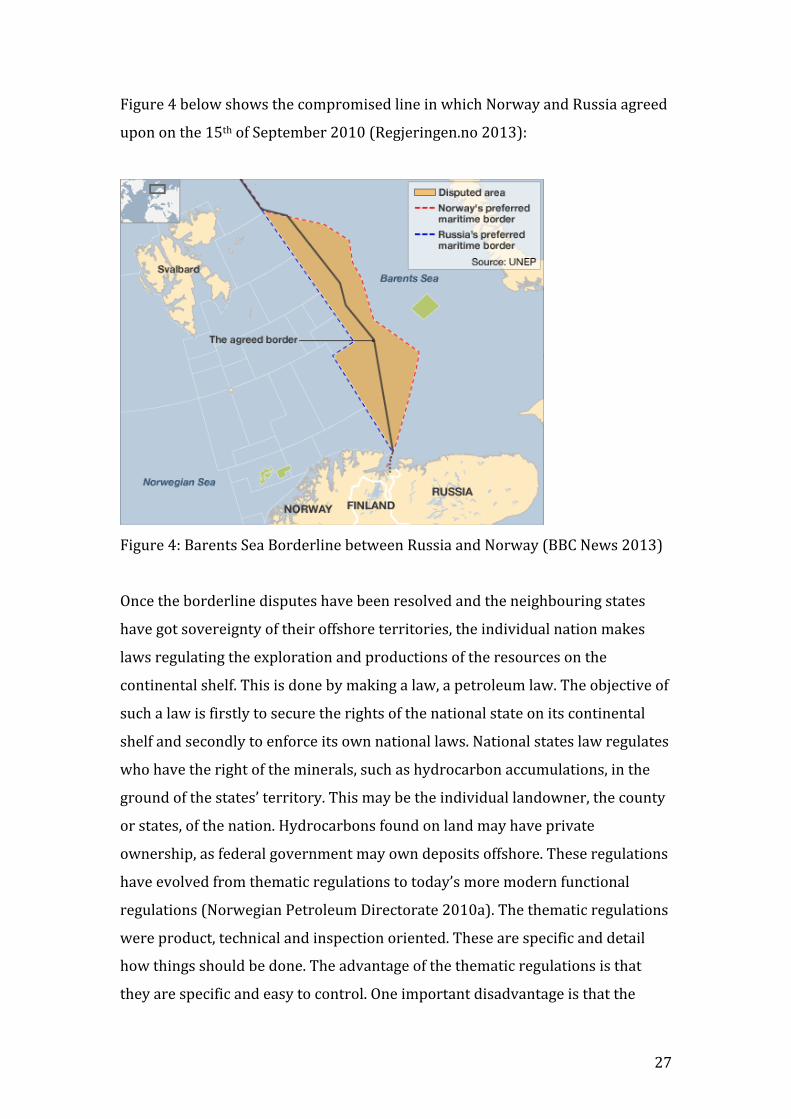
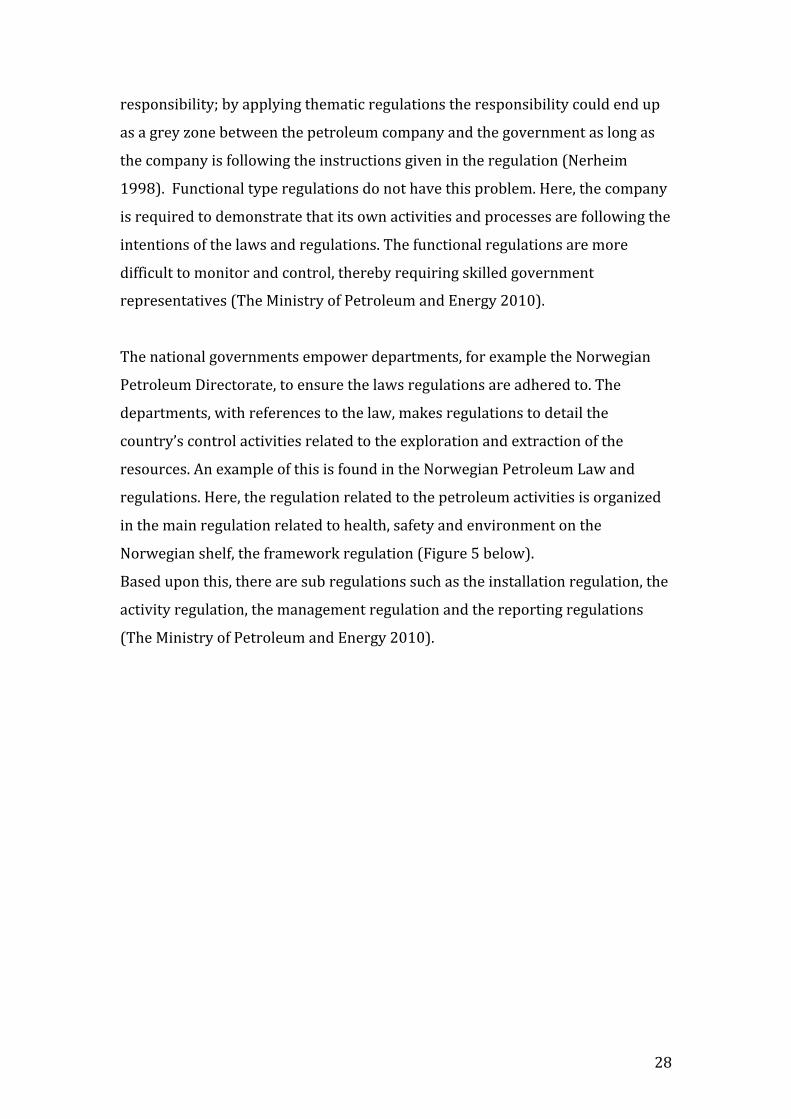
Figure 5 below shows the current steering regulations of the petroleum activities in:
Figure 5: Steering regulations pyramid in Norway
3. 5 The Framework Legislation
This legislation is the bridging document between the Petroleum law and the sub
ordinate regulations. It defines Health, Safety and Environment requirements
and contains requirement for (Norwegian Petroleum Directorate 2010a &
Norwegian Petroleum Directorate 2010b):
• Organization
• Safety and safety as a culture
• Continuous improvement
• Principals for risk minimization
• ”Better to be safe than sorry” principals
30
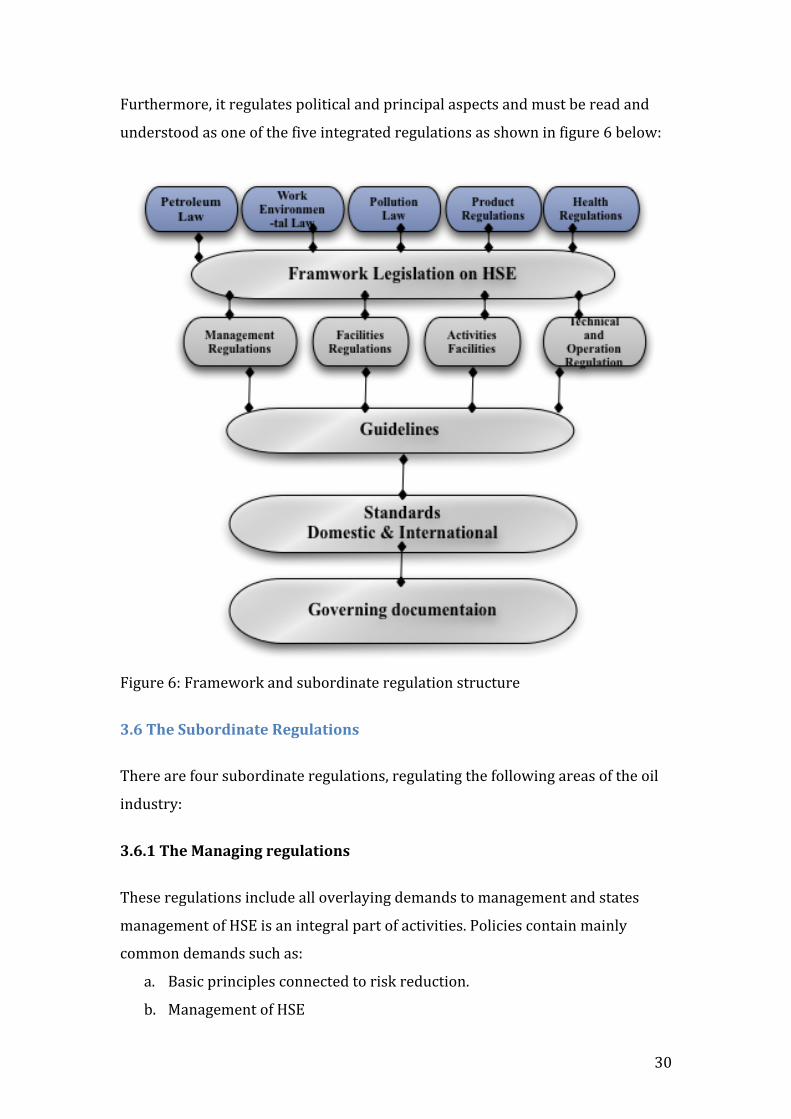
Furthermore, it regulates political and principal aspects and must be read and
understood as one of the five integrated regulations as shown in figure 6 below:
Figure 6: Framework and subordinate regulation structure
3.6 The Subordinate Regulations
There are four subordinate regulations, regulating the following areas of the oil
industry:
3.6.1 The Managing regulations
These regulations include all overlaying demands to management and states
management of HSE is an integral part of activities. Policies contain mainly
common demands such as:
a. Basic principles connected to risk reduction.
b. Management of HSE
31
c. Resources and processes
d. Analysis
e. Measuring, monitoring and improvement
3.6.2 The Facility regulations
These regulations demands on how facilities are constructed and equipped:
a. The general policies regulate:
i. Construction of appliances
ii. Main safety functions and general safety functions
b. Sweeping policies regulate:
i. Common requirements for cargo, materials etc.
ii. the planning of work areas
iii. Physical barriers
iv. Readiness
c. Particular additional policies regulate
i. Drilling and well systems
ii. Housing/living quarters
iii. Maritime facilities.
3.6.3 The Activity regulations
The activity regulations put forward requirements to planning and execution of
activities, monitoring and control. It sets requirement for operational procedures
for all activities. Other topics included in the activity regulations are:
d. Maintenance
e. HSE issues
f. Environmental monitoring of the use, emission and oil spills
g. Communication, drill and well activities, marine operations,
electrical facilities, lifting operations and submarine operations
32
3.6.4 Technical and operational regulations
These regulations govern documents and information that is to be sent
authorities or be available. It also covers Applications in conjunction with
consents for petroleum activities mentioned in the regulations.
As seen from the regulations the law is forcing companies to report findings in
their own activities. These reports include their own inspections, risk analyses,
near miss accidents and actual accidents occurred. Failing to do these reports
could lead to legal prosecutions, where the company and even individuals could
be prosecuted (Norwegian Petroleum Directorate 2010a & Norwegian
Petroleum Directorate 2010b).
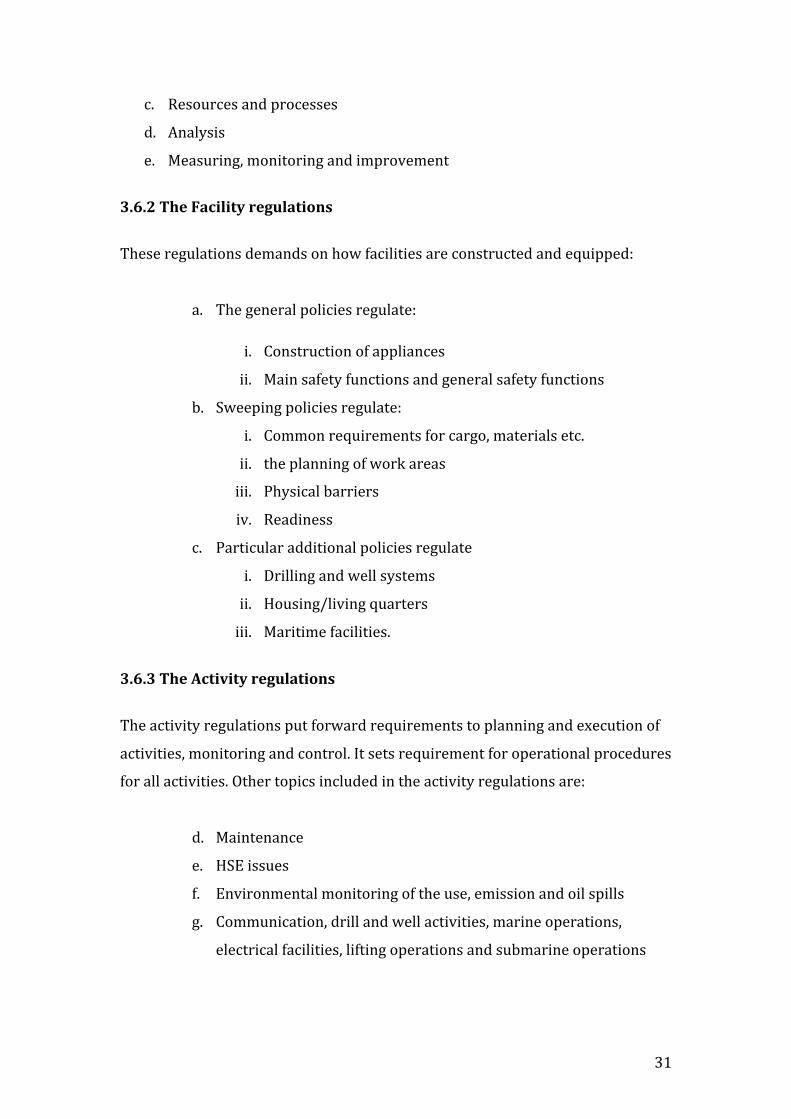
3.7 Involvement of Stakeholders
In Norway the petroleum directorate is governing the petroleum activity. The oil
companies liaise with the Norwegian authorities through the petroleum
directorate. As the expertise is found in different departments the Petroleum
Safety authority is liaising this task as indicated figure 7 below. Here we see that
several environmental matters are liaised with the state climate and pollution
agency. The petroleum activity related applications for consent is sent to PSA,
which is forwarding the applications to the relevant authority departments for
hearings. Based on these hearings the process towards the petroleum companies
proceeds.
33
The process of coordination, cooperation and technical advise related to the PSA
role is show in figure 7 below:
Figure 7: PSA coordinating role
3.8 Government departments roles and responsibilities
The government has given the Petroleum Safety Authority (PSA) the following
duties:
• Ensure that the petroleum activity and activities relating to it are
supervised in a unified manner.
• Provide information and advice to the players in the industry, establish
appropriate collaborative relationships with other HSE regulators
nationally and internationally, and contribute actively to a transfer of
knowledge from the HSE area to society in general.
34
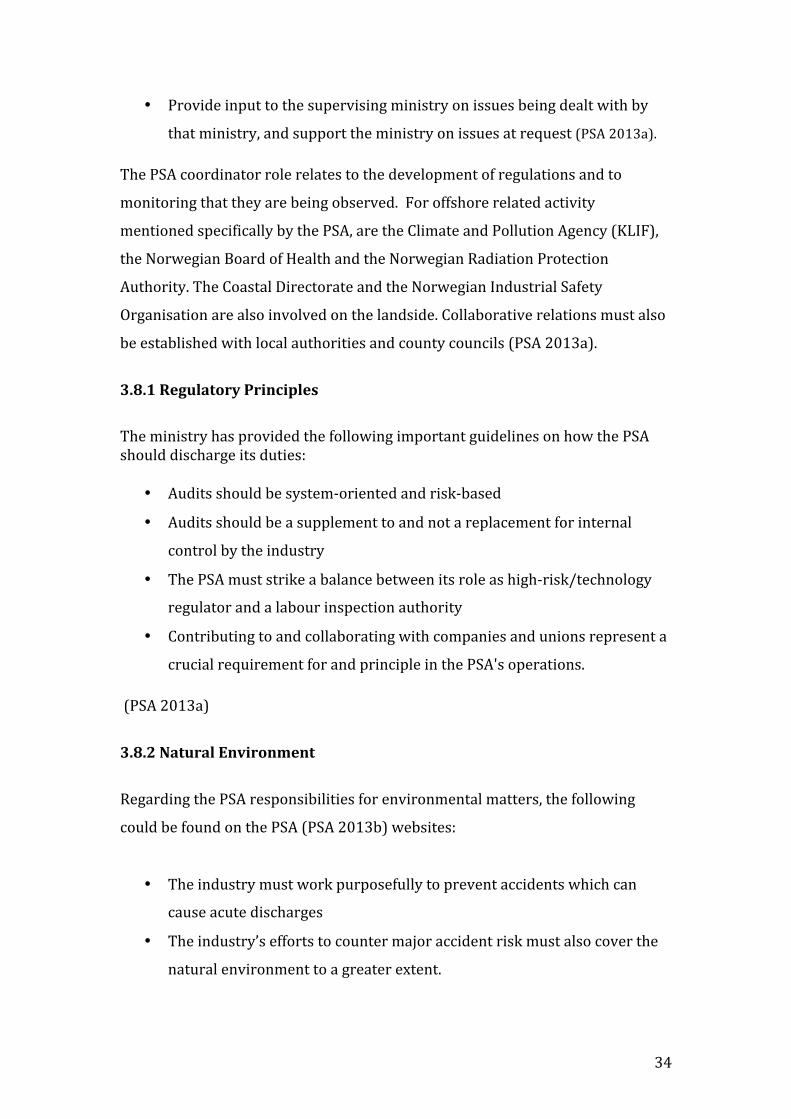
• Provide input to the supervising ministry on issues being dealt with by
that ministry, and support the ministry on issues at request (PSA 2013a).
The PSA coordinator role relates to the development of regulations and to
monitoring that they are being observed. For offshore related activity
mentioned specifically by the PSA, are the Climate and Pollution Agency (KLIF),
the Norwegian Board of Health and the Norwegian Radiation Protection
Authority. The Coastal Directorate and the Norwegian Industrial Safety
Organisation are also involved on the landside. Collaborative relations must also
be established with local authorities and county councils (PSA 2013a).
3.8.1 Regulatory Principles
The ministry has provided the following important guidelines on how the PSA should discharge its duties:
• Audits should be system-‐oriented and risk-‐based
• Audits should be a supplement to and not a replacement for internal
control by the industry
• The PSA must strike a balance between its role as high-‐risk/technology
regulator and a labour inspection authority
• Contributing to and collaborating with companies and unions represent a
crucial requirement for and principle in the PSA's operations.
(PSA 2013a)
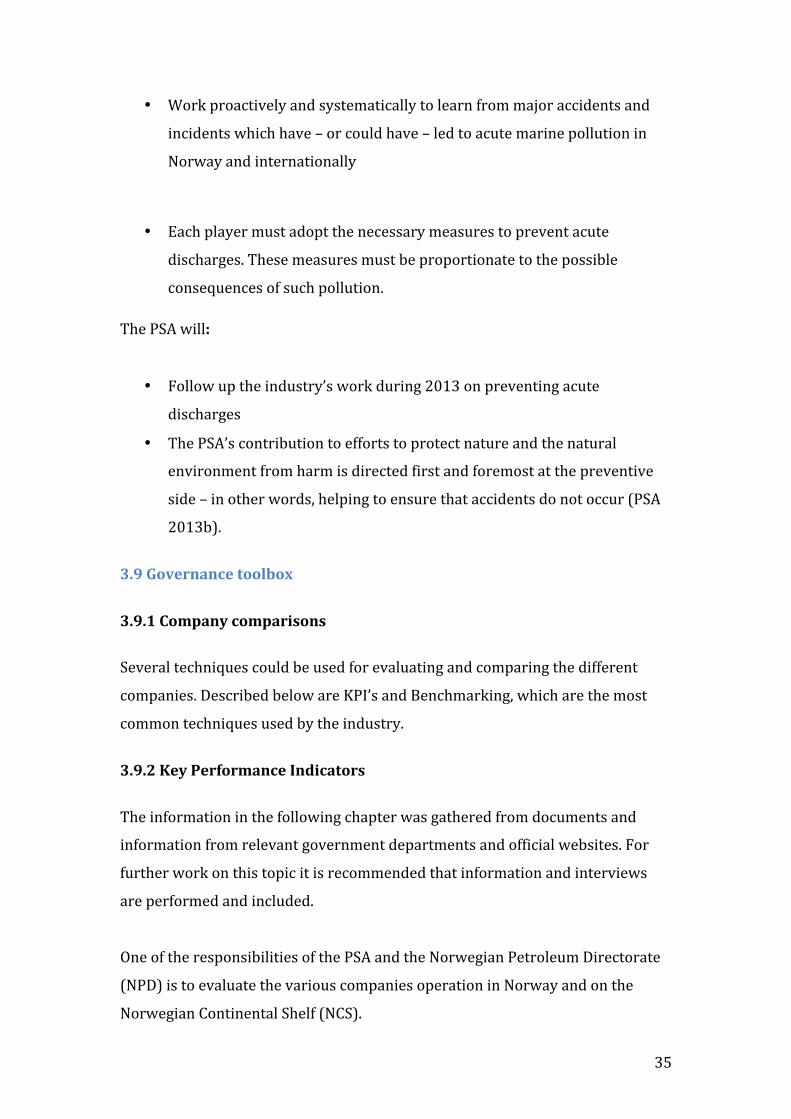
3.8.2 Natural Environment
Regarding the PSA responsibilities for environmental matters, the following
could be found on the PSA (PSA 2013b) websites:
• The industry must work purposefully to prevent accidents which can
cause acute discharges
• The industry’s efforts to counter major accident risk must also cover the
natural environment to a greater extent.
35
• Work proactively and systematically to learn from major accidents and
incidents which have – or could have – led to acute marine pollution in
Norway and internationally
• Each player must adopt the necessary measures to prevent acute
discharges. These measures must be proportionate to the possible
consequences of such pollution.
The PSA will:
• Follow up the industry’s work during 2013 on preventing acute
discharges
• The PSA’s contribution to efforts to protect nature and the natural
environment from harm is directed first and foremost at the preventive
side – in other words, helping to ensure that accidents do not occur (PSA
2013b).
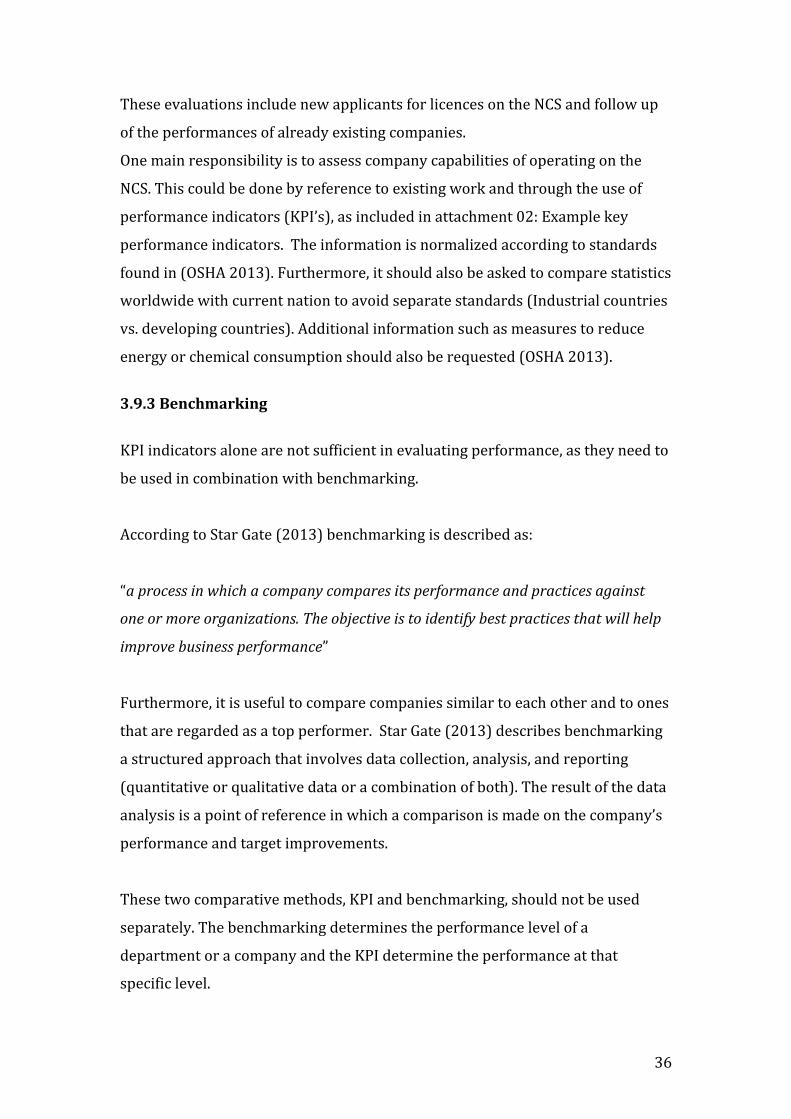
3.9 Governance toolbox
3.9.1 Company comparisons
Several techniques could be used for evaluating and comparing the different
companies. Described below are KPI’s and Benchmarking, which are the most
common techniques used by the industry.
3.9.2 Key Performance Indicators
The information in the following chapter was gathered from documents and
information from relevant government departments and official websites. For
further work on this topic it is recommended that information and interviews
are performed and included.
One of the responsibilities of the PSA and the Norwegian Petroleum Directorate
(NPD) is to evaluate the various companies operation in Norway and on the
Norwegian Continental Shelf (NCS).
36
These evaluations include new applicants for licences on the NCS and follow up
of the performances of already existing companies.
One main responsibility is to assess company capabilities of operating on the
NCS. This could be done by reference to existing work and through the use of
performance indicators (KPI’s), as included in attachment 02: Example key
performance indicators. The information is normalized according to standards
found in (OSHA 2013). Furthermore, it should also be asked to compare statistics
worldwide with current nation to avoid separate standards (Industrial countries
vs. developing countries). Additional information such as measures to reduce
energy or chemical consumption should also be requested (OSHA 2013).
3.9.3 Benchmarking
KPI indicators alone are not sufficient in evaluating performance, as they need to
be used in combination with benchmarking.
According to Star Gate (2013) benchmarking is described as:
“a process in which a company compares its performance and practices against
one or more organizations. The objective is to identify best practices that will help
improve business performance”
Furthermore, it is useful to compare companies similar to each other and to ones
that are regarded as a top performer. Star Gate (2013) describes benchmarking
a structured approach that involves data collection, analysis, and reporting
(quantitative or qualitative data or a combination of both). The result of the data
analysis is a point of reference in which a comparison is made on the company’s
performance and target improvements.
These two comparative methods, KPI and benchmarking, should not be used
separately. The benchmarking determines the performance level of a
department or a company and the KPI determine the performance at that
specific level.
37
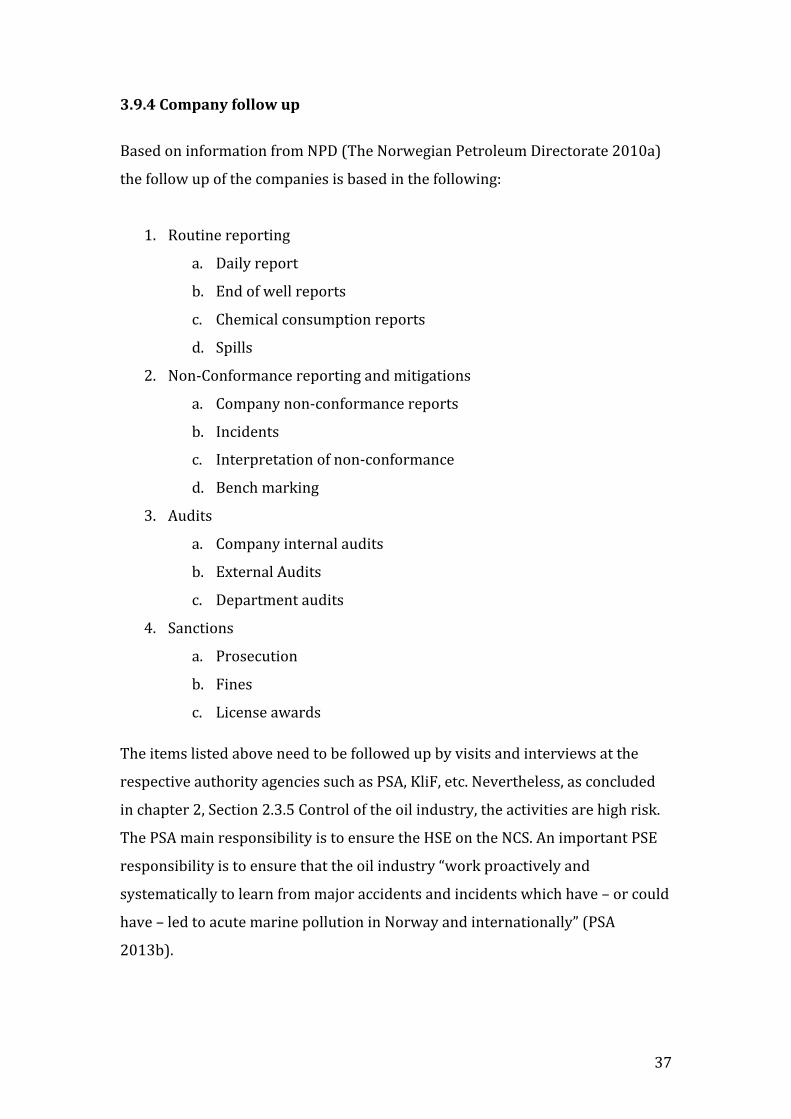
3.9.4 Company follow up
Based on information from NPD (The Norwegian Petroleum Directorate 2010a)
the follow up of the companies is based in the following:
1. Routine reporting
a. Daily report
b. End of well reports
c. Chemical consumption reports
d. Spills
2. Non-‐Conformance reporting and mitigations
a. Company non-‐conformance reports
b. Incidents
c. Interpretation of non-‐conformance
d. Bench marking
3. Audits
a. Company internal audits
b. External Audits
c. Department audits
4. Sanctions
a. Prosecution
b. Fines
c. License awards
The items listed above need to be followed up by visits and interviews at the
respective authority agencies such as PSA, KliF, etc. Nevertheless, as concluded
in chapter 2, Section 2.3.5 Control of the oil industry, the activities are high risk.
The PSA main responsibility is to ensure the HSE on the NCS. An important PSE
responsibility is to ensure that the oil industry “work proactively and
systematically to learn from major accidents and incidents which have – or could
have – led to acute marine pollution in Norway and internationally” (PSA
2013b).
38
One of the concluding recommendations in the final investigation report after
Macondo states:
“Recommendation 2 – Develop and maintain industrial and governmental
institutions responsible for future development, validation, advancement, and
implementation of Risk Assessment and Management (RAM) technology including
definition of RAM goals and objectives for exploration and production of high
hazard environment hydrocarbon resources”
(Deepwater Horizon Study Group 2013, p.13)
In order to test the reliability and validity of these statements, consent
applications for drilling activities from 3 different operators on the NCS (Statoil
2012, Wintershall 2011 and Centrica Energy 2011) were analyzed. For
comparative purposes, all applications used were for the same geographic area,
Haltenbanken, on the NCS, and they were all post the Macondo blowout.
Probability and consequence data for a blowout was gathered.
39
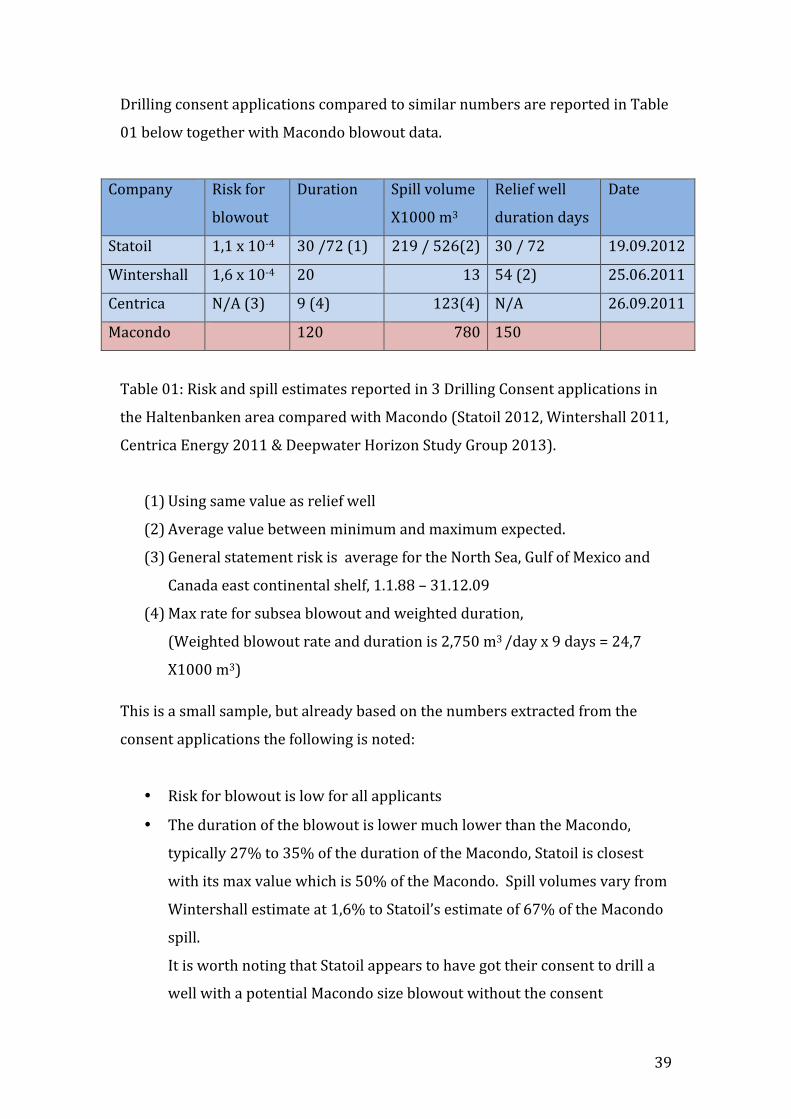
Drilling consent applications compared to similar numbers are reported in Table
01 below together with Macondo blowout data.
Company Risk for
blowout
Duration Spill volume
X1000 m3
Relief well
duration days
Date
Statoil 1,1 x 10-‐4 30 /72 (1) 219 / 526(2) 30 / 72 19.09.2012
Wintershall 1,6 x 10-‐4 20 13 54 (2) 25.06.2011
Centrica N/A (3) 9 (4) 123(4) N/A 26.09.2011
Macondo 120 780 150
Table 01: Risk and spill estimates reported in 3 Drilling Consent applications in
the Haltenbanken area compared with Macondo (Statoil 2012, Wintershall 2011,
Centrica Energy 2011 & Deepwater Horizon Study Group 2013).
(1) Using same value as relief well
(2) Average value between minimum and maximum expected.
(3) General statement risk is average for the North Sea, Gulf of Mexico and
Canada east continental shelf, 1.1.88 – 31.12.09
(4) Max rate for subsea blowout and weighted duration,
(Weighted blowout rate and duration is 2,750 m3 /day x 9 days = 24,7
X1000 m3)
This is a small sample, but already based on the numbers extracted from the
consent applications the following is noted:
• Risk for blowout is low for all applicants
• The duration of the blowout is lower much lower than the Macondo,
typically 27% to 35% of the duration of the Macondo, Statoil is closest
with its max value which is 50% of the Macondo. Spill volumes vary from
Wintershall estimate at 1,6% to Statoil’s estimate of 67% of the Macondo
spill.
It is worth noting that Statoil appears to have got their consent to drill a
well with a potential Macondo size blowout without the consent
40
application mentioning the high risks or special contingencies. It is at the
same time noted that Wintershall´s estimate for a blowout in the same
geographical area is only 1,6% of Macondo or 3,8% of the Statoil
estimates.
• The time estimated to drill the relief well is varying between 20% to 50%
of the time it took to drill the Macondo relief well. The high and the low
time of the relief well drilling are both Statoil estimates.
(Statoil 2012, Wintershall 2011, Centrica Energy 2011)
These estimates cannot be verified in this report, but the numbers could indicate
the intentions of the PSA regulations are not met. This does not harmonize with
e.g. the (PSA 2013a) requirement that:
“Each player needs to have the necessary overview of and control over the most
important factors contributing to the risk of acute discharges in their
operations” or the PSA duty to “Ensure that the petroleum activity and
activities relating to it are supervised in a unified manner.”
3.9.5 Low validity of impact assessments
This also leads to another concern regarding the input parameters to the
blowout impact models may be too low. The validity of the impact on the coast
and environment may be underestimated, and as a consequence necessary
contingencies may not be put in place.
3.9.6 Organizational and managerial deficits
In the Macondo investigation, as described in the Deepwater Horizon Study
Group (2013), two important findings were that the operating teams did not
possess a functional safety culture, and secondly the organization was unable to
manage risk.
41
3.9.7 Lower Reliability Organisations
The terms Lower Reliability Organizations (LRO) and Higher Reliability
Organizations (HRO) were used in the aforementioned report. An LRO is
characterized by a focus on success rather than failure, and production rather
than protection. This company culture was recognised as one of the major
contributors leading to the blowout. The Deepwater Horizon Study Group (2013,
p. 81) states the following:
“In-‐place processes propagate inertial blind spots, thereby enabling risks and
failures to accumulate and produce catastrophic outcomes In LROs, expensive and
“inefficient” learning and diversity in problem solving are not welcomed.
Information, particularly bad or useless information, is not actively sought, failures
are not taken as learning lessons, and new ideas or divergent views are
discouraged. Communications are regarded as wasteful and hence the sharing of
information and interpretations between individuals is stymied. In LROs the
“failure-‐to-‐fail” is treated as success, which, in turn, breeds overconfidence and
fantasy.”
The above statement describes a potential minefield for the petroleum industry,
or any activity that deals with risks. Treating “failure-‐to-‐fail” as a success could
easily create a company culture of underreporting or neglecting hazards or
hazardous conditions above a certain risk potential. Management end up
attributing success to themselves based on “only positive reporting” causing the
organization to drift into complacency, inattention, and habituated routines. In
such cultures, the possibilities to learn from high potential incidents are
removed (Weick, Sutcliffe, & Obstfeld 1999, Deepwater Horizon Study Group
2013).
Further, the report discusses re-‐active cultures. It is only after disasters that the
investigations are brought into place and measures to prevent re-‐occurrence are
found. Very infrequently occurring disasters give little or no effective feedback to
help indicate how protection can be improved or to demonstrate why it is
needed. Furthermore, as the probabilities of catastrophic accidents are low, they
42
may be rationalized by fearless risk-‐prone management in LRO’s focusing on the
bottom line rather than on the big picture (Weick & Sutcliffe 2001, Deepwater
Horizon Study Group 2013).
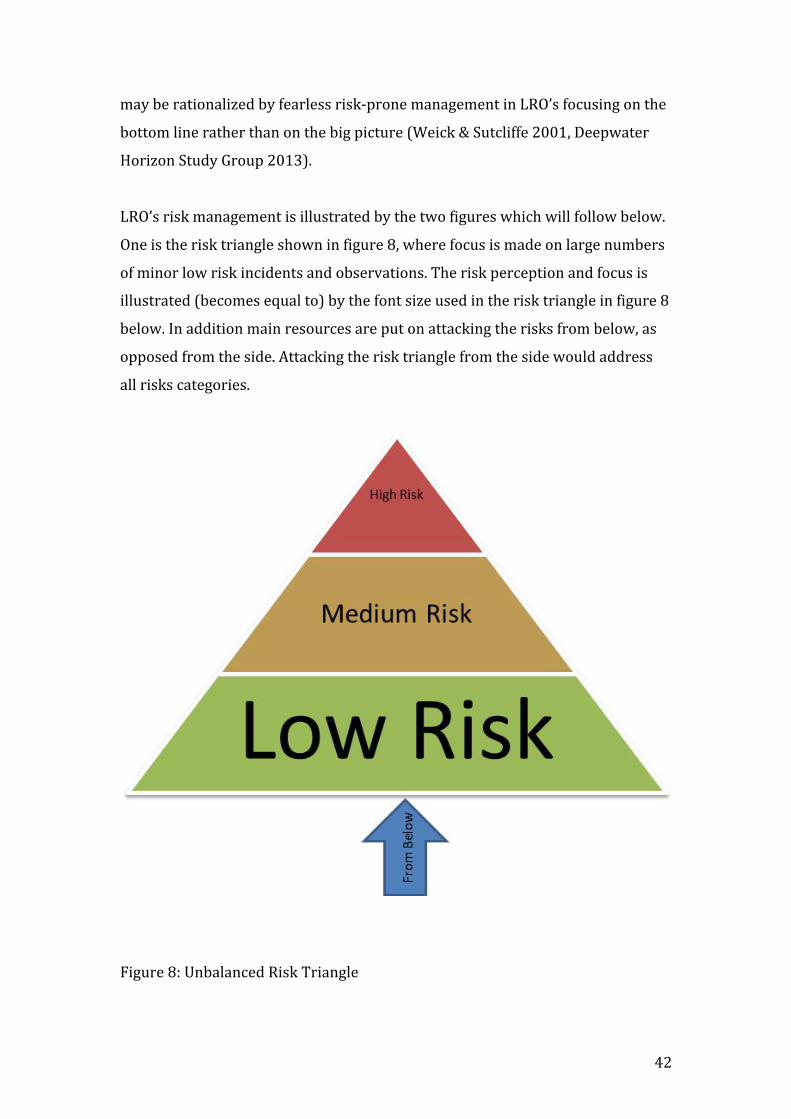
LRO’s risk management is illustrated by the two figures which will follow below.
One is the risk triangle shown in figure 8, where focus is made on large numbers
of minor low risk incidents and observations. The risk perception and focus is
illustrated (becomes equal to) by the font size used in the risk triangle in figure 8
below. In addition main resources are put on attacking the risks from below, as
opposed from the side. Attacking the risk triangle from the side would address
all risks categories.
Figure 8: Unbalanced Risk Triangle
43
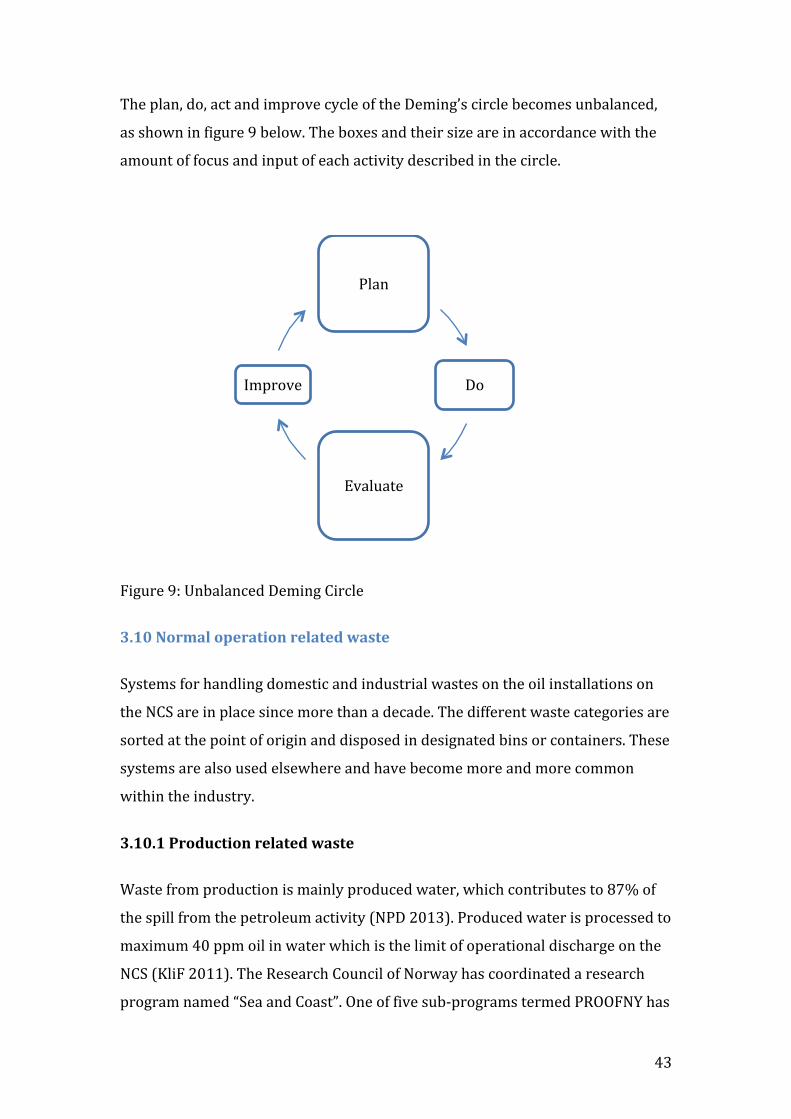
The plan, do, act and improve cycle of the Deming’s circle becomes unbalanced,
as shown in figure 9 below. The boxes and their size are in accordance with the
amount of focus and input of each activity described in the circle.
Figure 9: Unbalanced Deming Circle
3.10 Normal operation related waste
Systems for handling domestic and industrial wastes on the oil installations on
the NCS are in place since more than a decade. The different waste categories are
sorted at the point of origin and disposed in designated bins or containers. These
systems are also used elsewhere and have become more and more common
within the industry.
3.10.1 Production related waste
Waste from production is mainly produced water, which contributes to 87% of
the spill from the petroleum activity (NPD 2013). Produced water is processed to
maximum 40 ppm oil in water which is the limit of operational discharge on the
NCS (KliF 2011). The Research Council of Norway has coordinated a research
program named “Sea and Coast”. One of five sub-‐programs termed PROOFNY has
Plan
Do
Evaluate
Improve
44
the objective of: “acquiring increased knowledge on possible long-‐term effects of
discharges from petroleum activities” (KliF 2011). Results from studies by the
PROOFNY group, show that effects from produced water on biomarkers are local.
Produced water is quickly diluted down to concentrations below the limit for
known biological effects (NPD 2013). The same studies also reveal only small
differences in arctic and temperate marine organisms with regards to sensitivity
to oil related pollution. The PROOFNY studies in KliF (2011) state that bacterial
degradation takes place all the way down to the freezing point, although the
process is slowing down with reduced temperature. Although these low effects
on the environment from disposal of produced water are documented the
produced water is re-‐injected into the reservoir where possible (KliF 2011).
3.10.2 Drilling related waste
The main discharges from drilling activities come from drilled cuttings. Effects
on the seabed fauna have been observed as far out as 3 to 4 km from the
discharge point, due to discharge of cuttings drilled with oil based drilling fluids.
After this type of discharge was stopped in 1993, the impacted area has been
reduced to 500 meters from the facilities. In the case of water based fluids this
distance is further reduced. The conclusion of the PROOFNY report is that the
effects of operational-‐ and drilling waste discharges are moderate, and they do
not occur more than one kilometre from the discharge points (KliF 2011).
45
4.0 Environmental Impact Assessment
Over the past three decades the growth of environmental awareness and interest
has grown immensely. The issues surrounding sustainability and the better
management of development in harmony with the environment has become of
outmost importance on a national and international scale. Associated with this
growth of interest has been the introduction of new legislations, emanating from
national to international source, such as the European Commission, that seeks to
influence the relationship development and the environment. Environmental
impact assessment (EIA) is an important example. Legislation surrounding EIA
was introduced in the USA over 35 years ago and the European Community
directive in 1985 accelerated its application in EU member states and has since
been a major growth area for planning and practice. An example is of its
introduction to the UK in 1988 the number of anticipated impact assessments
(or impact statements which they are named once the assessment process is
completed) escalated from 20 to 600 environmental impact statements per year;
and the scope continues to grow today.
According to Glasson, Therivel and Chadwick (2005, p. 4) EIA is in essence; a
“systematic process that examines the environmental consequence of development
actions, in advance.” The emphasis, which sets in apart from other mechanisms
for environmental protection, is the notion of prevention. Although planners
have traditionally assessed impacts of development on the environment, they
have not done so in a systematic, holistic, and multidisciplinary way required by
the EIA process.
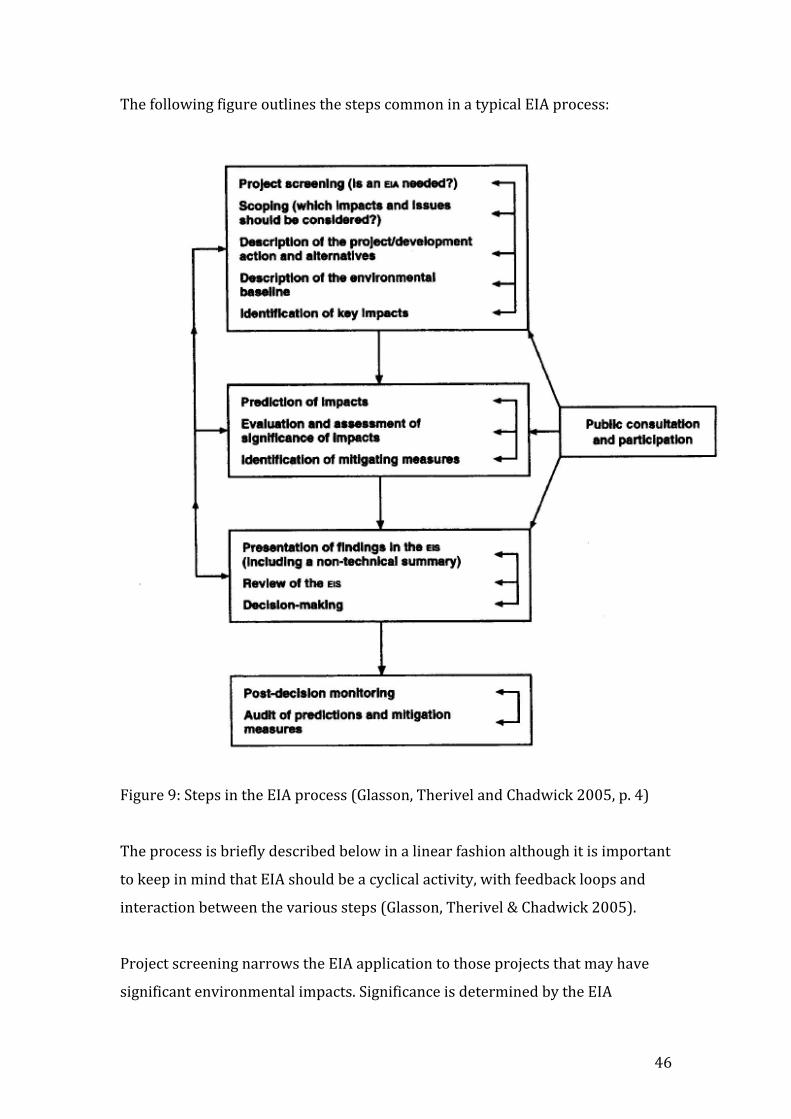
46
The following figure outlines the steps common in a typical EIA process:
Figure 9: Steps in the EIA process (Glasson, Therivel and Chadwick 2005, p. 4)
The process is briefly described below in a linear fashion although it is important
to keep in mind that EIA should be a cyclical activity, with feedback loops and
interaction between the various steps (Glasson, Therivel & Chadwick 2005).
Project screening narrows the EIA application to those projects that may have
significant environmental impacts. Significance is determined by the EIA
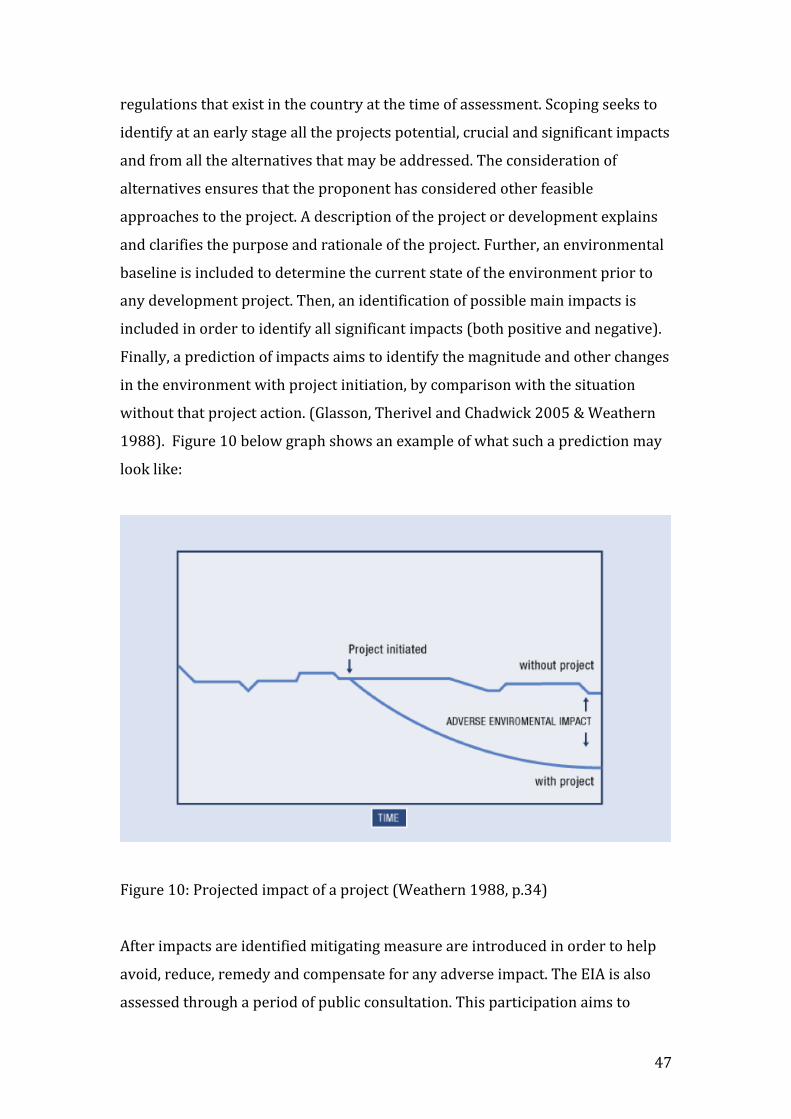
47
regulations that exist in the country at the time of assessment. Scoping seeks to
identify at an early stage all the projects potential, crucial and significant impacts
and from all the alternatives that may be addressed. The consideration of
alternatives ensures that the proponent has considered other feasible
approaches to the project. A description of the project or development explains
and clarifies the purpose and rationale of the project. Further, an environmental
baseline is included to determine the current state of the environment prior to
any development project. Then, an identification of possible main impacts is
included in order to identify all significant impacts (both positive and negative).
Finally, a prediction of impacts aims to identify the magnitude and other changes
in the environment with project initiation, by comparison with the situation
without that project action. (Glasson, Therivel and Chadwick 2005 & Weathern
1988). Figure 10 below graph shows an example of what such a prediction may
look like:
Figure 10: Projected impact of a project (Weathern 1988, p.34)
After impacts are identified mitigating measure are introduced in order to help
avoid, reduce, remedy and compensate for any adverse impact. The EIA is also
assessed through a period of public consultation. This participation aims to
48
ensure the quality, comprehensiveness and effectiveness of the EIA and that the
public opinions are taken into adequately considered in the decision making
process. The decision making of the project involves considerations of the
project by relevant authority. Once (if) the project is initiated, post decision
auditing and monitoring deals with comparing actual to predicted outcomes and
can be used as quality assurance. It is considered a vital step in the EIA learning
process (Weathern 1988 & Glasson, Therivel and Chadwick 2005).
4.1 Environmental Impact Statement
The environmental impact statement (EIS) documents the information and
estimates the impacts derived from various steps in the process. Prevention is
said to be better than cure and an EIS revealing many significant and
unavoidable impacts would provide with enough information that could
contribute to the abandonment or the modification of a proposed development
action. The following is the most common contents of an EIS following an EIA
(Glasson, Therivel & Chadwick 2005, p. 6):
A Non-‐technical summary is an important part of the documentation as an EIA
can be complex with much technical language and terms. A non-‐technical
summary aims to help improve communication with various parties involved
and reflects on the potential complexity of the project in a non-‐technical,
understandable way.
Followed by the non-‐technical summary are 3 main parts:
Part 1: Methods and key issues
1. Methods statement
2. Summary of key issues
Part 2: Background to the proposed project
3. Preliminary Studies
4. Site description, baseline conditions
49
5. Description of proposed development
6. Construction activities
Part 3: Environmental impact assessment – topic areas
7. Land use, landscape and visual quality
8. Geology, topography and soils
9. Hydrology and water quality
10. Air quality and water quality
11. Ecology
12. Noise
13. Transport
14. Socio-‐economic impact
15. Interrelationships between effects
EIA (and EIS) practices vary from country to country, study to study, thus the
best practice is constantly evolving. Glasson, Therivel & Chadwick (2005) puts
forth a UN study that advocates changes in the process and documentation. The
UN study enhances the importance of giving greater emphasis to the socio-‐
economic elements, public participation and to the monitoring phase of the
project.
4.2 Cumulative Impact Assessment
Under the best circumstances EIA can be a complex and challenging task,
Experience indicates that the scope and quality varies widely throughout a
country (such as in the USA) and internationally. In recent times the United
States council on Environmental Quality has according to Eccleston (2011)
indicated that there is increasing evidence that the most destructive
environmental adverse effect comes not only from direct and indirect effects of a
given action, but instead from a combination of individual minor effects of
numerous actions over time. This has seen the emerging tool of having an
cumulative impact analysis (CIA) and has also been integrated into the National
Environmental Policy Act (NEPA) in the USA (Eccleston 2011). Eccleston (2011,
50
p. 3) defines CIA as: “the changes to the environment caused by an action in
combination with other past, present and reasonably foreseeable human activity.”
Although there are many definitions used, the concept of CIA derives from
observation that an impact of a particular project on an environmental resource
may be considered insignificant when assessed in isolation; yet the combined
impact may be quite significant when seen in context with other past, present or
foreseeable future activities (Eccleston 2011).
4.3 Additive & Synergistic Cumulative Impacts
Eccleston (2011) puts forth two types of cumulative impacts:
The first type; additive impacts occur when the level of combined effects is equal
to the sum of individual effects.
Examples are:
• Multiple air emission sources affecting regional air quality
• Multiple point and non-‐point discharges to watershed
• Multiple water withdrawals from a river basing or aquifer
• Multiple losses of forest cover in a landscape
The second type of cumulative impact is synergistic impact, which opposed to
additive impacts are effects of impacts is greater than expected result.
Synergistic effects are usually much more complex and difficult to assess than
additive impacts and are often not expressed quantitatively (or cannot be). They
are often the result of interaction between two or more activities that result in
combined effects that are greater than the sum of the individual project effects
(Eccleston 2011). An example could be the release of two different chemicals to
sea may cause an interactive effect between the two chemicals, which would be
greater than the individual effect of the same case would be.
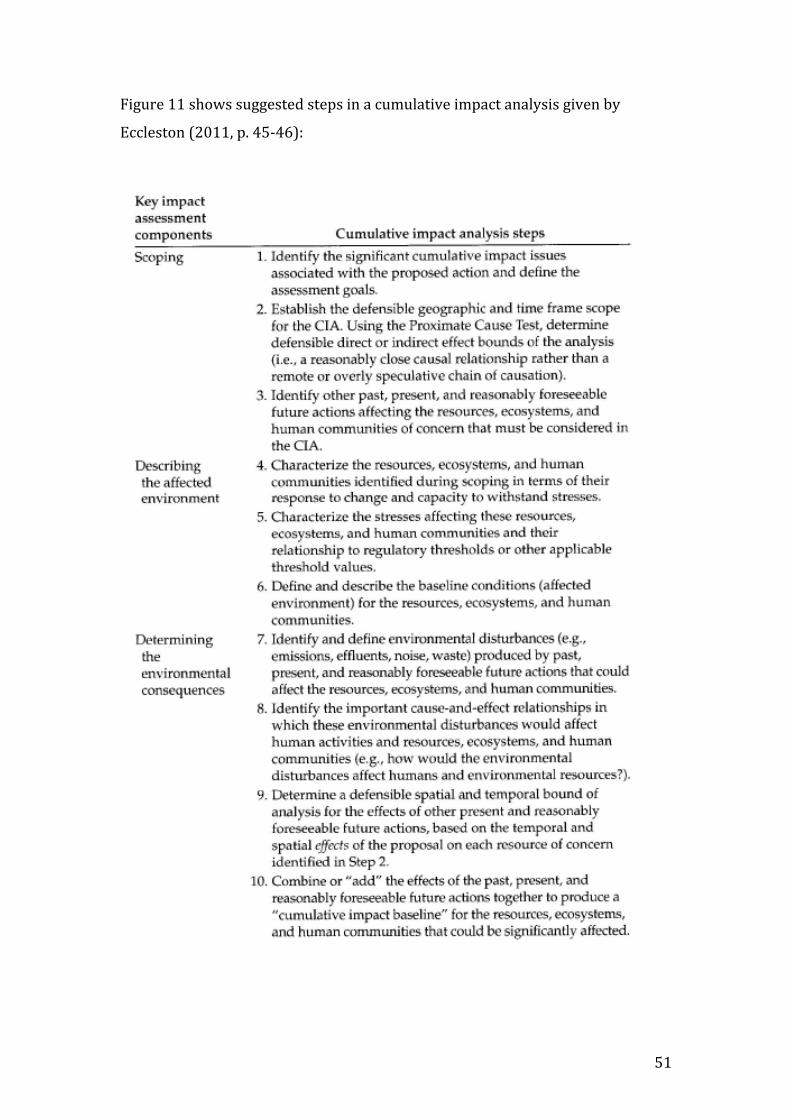
51
Figure 11 shows suggested steps in a cumulative impact analysis given by
Eccleston (2011, p. 45-‐46):
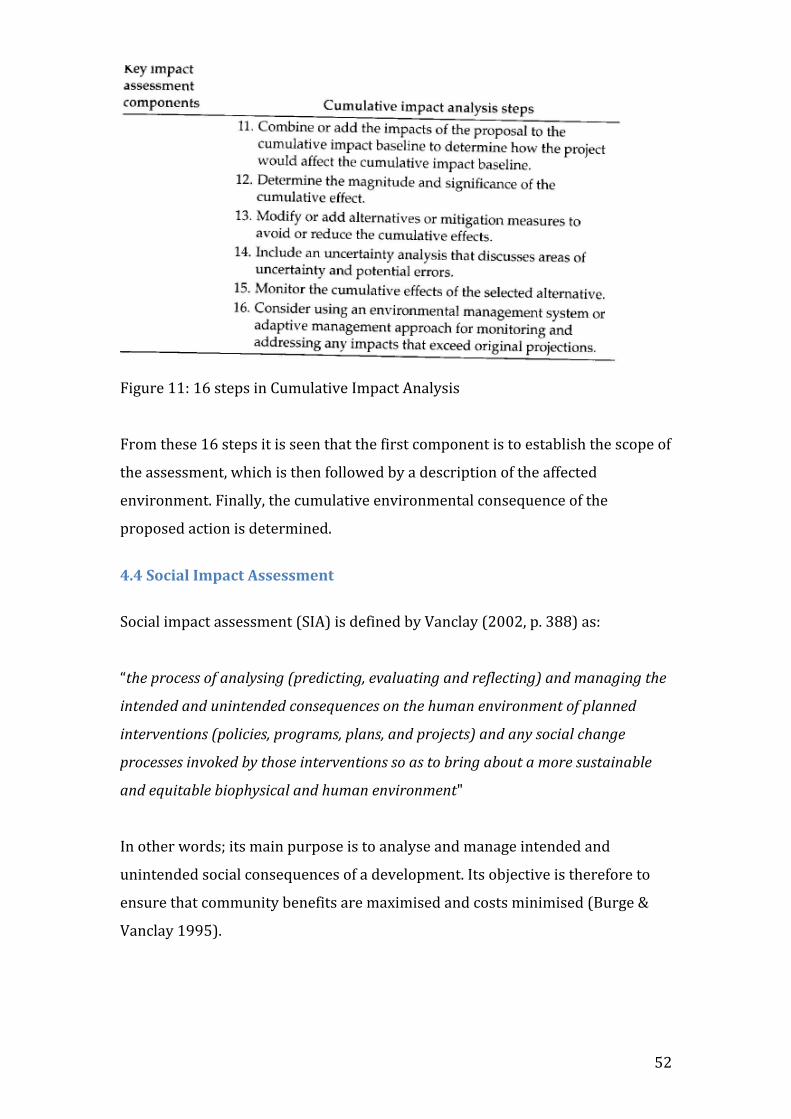
52
Figure 11: 16 steps in Cumulative Impact Analysis
From these 16 steps it is seen that the first component is to establish the scope of
the assessment, which is then followed by a description of the affected
environment. Finally, the cumulative environmental consequence of the
proposed action is determined.
4.4 Social Impact Assessment
Social impact assessment (SIA) is defined by Vanclay (2002, p. 388) as:
“the process of analysing (predicting, evaluating and reflecting) and managing the
intended and unintended consequences on the human environment of planned
interventions (policies, programs, plans, and projects) and any social change
processes invoked by those interventions so as to bring about a more sustainable
and equitable biophysical and human environment"
In other words; its main purpose is to analyse and manage intended and
unintended social consequences of a development. Its objective is therefore to
ensure that community benefits are maximised and costs minimised (Burge &
Vanclay 1995).
53
With regard to the NCS, the social impact and effects of the petroleum activities
are twofold. The petroleum activity is creating employment and is boosting
activity along the coast. Traditionally the coast is an area with a low number of
jobs, thus increased employment and activity is welcomed with its many positive
effects. However, the negative effects are related to the fear of pollution and the
possible environmental effects should a major blowout or similar accidental spill
occur. The defined consequence of this is the oil slick hitting the coast and
polluting the beaches. Beach and beach ecosystem habitats will be impacted by
the oil spill.
Social impact as a result of the presence of petroleum industry and possible
environmental accidents could be related to 3 categories:
4.4.1 Fisheries
Fisheries off the coast will be impacted as long as the oil is present on the sea,
this will cause loss of income for the fisheries in question.
4.4.2 Fish farming
One of the main incomes for the coastal population of Norway is fish farming.
This industry is scattered all along the coast and is likely to be impacted by an oil
slick. Even if the effects may be mitigated, by moving the facilities, it is likely the
public will refrain from buying the products fearing it may be polluted. This was
seen in the case of the Macondo oil reaching similar fish farms of the Gulf coast.
4.4.3 Recreation and tourism
The coast is important for recreation and tourism. This will suffer in areas where
the oil has hit the beach. Recreational areas will be lost for a long time, and
tourists are most likely to choose other destinations.
Impacts expected are increased unemployment on the cost. Social effects and
consequences of unemployment are documented elsewhere and will not be
further discussed in this thesis.
54
5.0 Comparative analysis of petroleum governance between Uganda and
Norway
The following chapter is an analysis of the management and governance
approaches to petroleum activities of Norway and Uganda. One of the countries
is rich and industrialised, with a relative long experience with petroleum
activities. The other is an underdeveloped country with little experience in
petroleum activities. The analyses will look at the petroleum laws, belonging
regulations and how the activities are monitored. It will also examine how the
laws and regulations are enforced. The different countries approach to the
petroleum activity is compared and a gap analyses is made before it is suggested
how this gap could be closed.
5.1 Petroleum industry governance in Uganda
With possibly the largest onshore oil discovery in sub-‐Saharan Africa, the
Ugandan government is now facing similar political governance issues as
Norway did in the 1960. The government of Uganda have, and are today, still
putting in place legislation and resource management approaches to govern its
newly found resource (The Times 2010).
“The national oil and gas policy” for Uganda is outlining the strategy for the
petroleum development in Uganda. This policy has been put in place by use of
consultancy services as well as cooperation with other government institutions
like cultural and civil societies (Ministry of Energy and Mineral Development
2008). In attachment 3, Uganda’s petroleum provinces are shown in a map and
the map also depicts several “unlicensed” fields.
One of the consultants used in the national oil and gas policy document is Farouk
al Kasim, a former director at the Norwegian Petroleum Directorate, being one of
the architects of the modern Norwegian Petroleum regulations. Reading the
Ministry of Energy and Mineral Development (2008, p. ix.) for Uganda many
similarities are seen, like in the objectives of the policies which are:
55
1. To ensure efficiency in licensing areas with the potential for oil and gas
production in the country.
2. To establish and efficiently manage the country’s oil and gas resource
potential.
3. To efficiently produce the country’s oil and gas resources.
4. To promote valuable utilization of the country’s oil and gas resources.
5. To promote the development of suitable transport solutions which give
good value to the country’s oil and gas resources.
6. To ensure collection of the right revenues and use them to create lasting
value for the entire nation.
7. To ensure optimum national participation in oil and gas activities.
8. To support the development and maintenance of national skills and
expertise.
9. To ensure that oil and gas activities are undertaken in a manner that
conserves the environment and biodiversity.
10. To ensure mutually beneficial relationships between all stakeholders in
the development of a desirable oil and gas sub sector for the country.
5.1.1 Environmental policy
Objective 9 is describing how the environmental resource, pollution or hazard
strategies and actions are addressed (Ministry of Energy and Mineral
Development, p. 28).
Strategies:
1. Ensure availability of the necessary institutional and regulatory
framework to address environment and biodiversity issues relevant to oil
and gas activities.
2. Ensure presence of the necessary capacity and facilities to monitor the
impact of oil and gas activities on the environment and biodiversity.
3. Require oil companies and their contractors/subcontractors to use self-‐
regulation and best practices in ensuring environmental protection and
biodiversity conservation.
56
4. Require oil companies and any other operators to make the necessary
efforts to return all sites on which oil and gas activities are undertaken to
their original condition as an environmental obligation.
Actions:
1. Upgrade the relevant Environment and Biodiversity legislation to address
oil and gas activities.
2. Strengthen the institutions with a mandate to manage the impact of oil
and gas activities on the environment and biodiversity.
3. Develop physical master plans; environmental sensitivity maps and oil
spill contingency plans for the oil and gas producing region and any
transport corridors.
These are modern type requirements similar to the Norwegian Petroleum laws
and regulations. The main principals found in the Norwegian laws and
regulations are found and are listed below:
1. Functional
2. Coordination between other government bodies, like health,
environment, transport.
3. Use of consequence evaluations
4. Risk evaluation, activities are risk based and risk managed.
5. Contingency planning
(Norwegian Petroleum Directorate 2010a)
The activities are founded on, like in Norway, the principles of sustainability.
Technology and processes should be put in place; these should be continuously
maintained and improved. Risk should be managed by best available technology,
and risk should be held “as low as reasonably possible”(ALARP)(Norwegian
Petroleum Directorate 2010a).
57
Although the actual petroleum laws and regulations are not formally written yet
they can be easily extracted from the policy document. Through cooperation,
other countries’ laws and regulations could be used and necessary local
adaptions included in the Ugandan system.
Petroleum development plans, based on modern principles, are put in place by
the action points listed in the national oil and gas development policy (Ministry
of Energy and Mineral Development 2008, p. 23):
1. Put in place appropriate petroleum legislation.
2. Acquire and prepare data for licensing.
3. Carry out promotional efforts.
4. Prepare procedures and criteria for competitive licensing.
5. Undertake open and transparent licensing rounds.
5.2 Further comparisons and analysis
Comparing the two countries law and regulations discloses similarities and
differences. As described in the paper the structure of the laws and regulations
are based on the same principles and as mentioned previously they even have
input from the same person, namely the former director at the Norwegian
Petroleum Directorate, Farouk al Kasim.
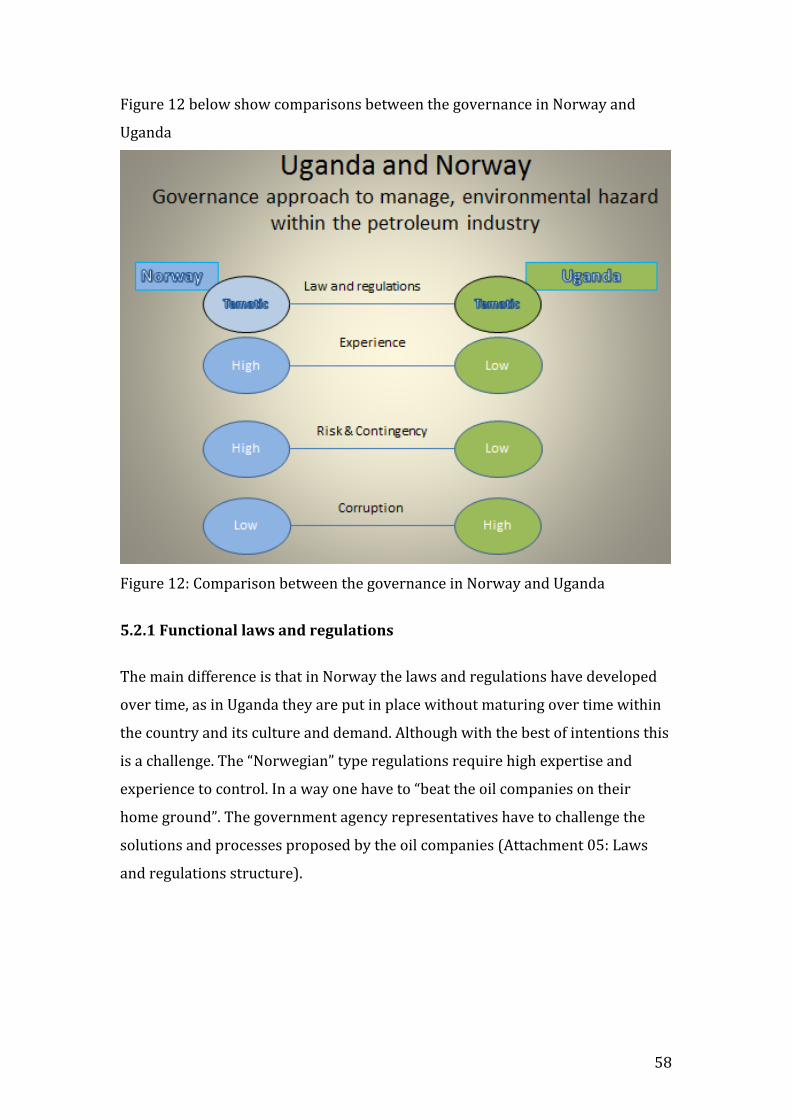
58
Figure 12 below show comparisons between the governance in Norway and
Uganda
Figure 12: Comparison between the governance in Norway and Uganda
5.2.1 Functional laws and regulations
The main difference is that in Norway the laws and regulations have developed
over time, as in Uganda they are put in place without maturing over time within
the country and its culture and demand. Although with the best of intentions this
is a challenge. The “Norwegian” type regulations require high expertise and
experience to control. In a way one have to “beat the oil companies on their
home ground”. The government agency representatives have to challenge the
solutions and processes proposed by the oil companies (Attachment 05: Laws
and regulations structure).
59
5.2.2 Interdepartmental cooperation
Norway has a long tradition of coordinating activities within and between
different government department and institutions. As an example, the petroleum
directorate are delegating the environmental issues related to a company
application to the directorate of environment. In Uganda this interdepartmental
cooperation has not the long tradition as in Norway, and both cross
understanding and timely respond to such requests are required.
(Attachment 6: The Norwegian Petroleum Directorate coordinating role)
5.2.3 Consequence evaluation
Implications, positive and negative, the activity has for a country is a part of the
petroleum development policy. The question on how these consequences are
interpreted is more difficult to answer. Compared to Norway, which is one
unified country, Uganda is a tribal nation. In such countries, the experience is
often that the persons involved are looking at the consequences for their area
and tribe rather than including the country as a whole. Nigeria is a tragic
example of this, as parts of the country are benefiting from the petroleum
activities’ revenue and other parts are suffering to an extent that the country is
on the brink of civil war. Law and order has ceased to exist (Okuonzi 2004).
For the purpose of providing an example one could claim that in third world
countries the culture surrounding personal safety is very from ours. Our culture
is to put the safety belt on when driving the car as a reflex, whilst in countries in
the third world cars do not even have safety belts. Another example relate to
waste management, whereas in third world countries waste collection probably
only exists at a primitive stage, and everything goes in the same bin and ends up
in the same pile.
5.2.4 Risk evaluation
In Norway, activities are risk based which means they are controlled in a manner
that is reducing risk. Technology and skill are key elements in this process. Both
factors are present in Norway while Uganda is in a different stage. The people of
Uganda have not gone through the evolvement of our risk management, their
60
concerns are ruled by the poverty of the country, and they cannot afford the
extra cost related to safety end pollution control.
In order to cope with major disasters contingency planning is necessary. This
involves cooperation between the companies and the country’s infrastructure.
This may be in relation to major accidents requiring evacuation and
hospitalisation of personnel. It could also be environmental disasters such as
blowouts. This is present in Norway, but Uganda does not yet have these
resources.
5.2.5 Environmental baseline
In order to assess environmental degradation due to petroleum activities and
ensure sustainable development, an environmental baseline of the current state
of environment is essential in Uganda. Sampling environmentally threatened
fauna, flora and ecosystems creates this baseline and ensures protection of the
environment. The results and data collected prior to activities will be part of the
impact assessment and monitoring throughout Uganda’s oil development in
order to sustain its goals of a prosperous future.
5.3 Summary of further comparisons
From the above comparisons it is seen that Uganda is lacking the necessary
resources to fully govern the principals outlined in the Norwegian regulations.
Adaptions have to be made and in a start-‐up phase only the highest priority
actions should be prioritized. The “80 – 20 Rule” from the Norwegian Petroleum
Directive (2010) could be found effective; 80% of the required actions could be
achieved with 20% of the resources. The last 20% of the activities, requiring
80% of the resources could be a part of the improvement plan.
5.3.1 Corruption
The biggest obstacle is not yet mentioned. Uganda is ranked as one of the most
corrupt countries in the world ranked as number 130 on Forbes’ corruption
ranking (Forbes 2010).
61
Nigeria, another major African oil producing country, is on the same ranking as
Uganda. It has been shown that the result of Nigeria’s petroleum industry lead to
the ecological collapse of the Niger delta, agriculture is no longer possible, and
fisheries are no longer possible for the same reason.
Without solving the corruption problem, there is little chance of Uganda
achieving much of its national oil and gas policy. This is outside the scope of this
paper and is only recognised as the single biggest obstacle for Uganda’s future as
a modern country in general and as petroleum producer specifically (Okuonzi
2004).
5.4 Conclusion of the comparative analysis
A comparison of the governance approach to manage the petroleum resources in
Norway and Uganda has been made. The basis of the comparison is the
Norwegian petroleum law and regulations and Uganda’s national oil and gas
policy. Although the approach and the use of modern laws and regulations that
exist in both countries are the same, large differences have been found. The
culture and stage of development of the two countries is very different and
copying one principle of law and regulations from one country to another is not
necessarily successful. A large degree of local adaption, training of own
personnel and elimination of corruptions are key elements, which have to be
resolved. Cooperation between countries, by sharing experiences is positive and
an essential activity assisting countries comparable to Uganda to achieve its
goals of a sustainable and a prosperous future.
It is important to mention that the findings regarding Uganda are expected to be
valid for most developing countries. The environmental challenges will be more
complex in developing than in industrialized countries where the availability of
local expertise and strong local governance exist. The positive results seen on the
NCS regarding waste management and operational spills are not necessarily
transferred to developing countries. The effect of weaker governance could be
that old obsolete equipment is exported for use in developing countries. The
effects of old equipment is shown earlier in this report.

62
The industry dual standard, one good standard in the industrial world and a
poor standard in the developing world, is possibly the main obstacle in the
protection of the environment in developing countries.
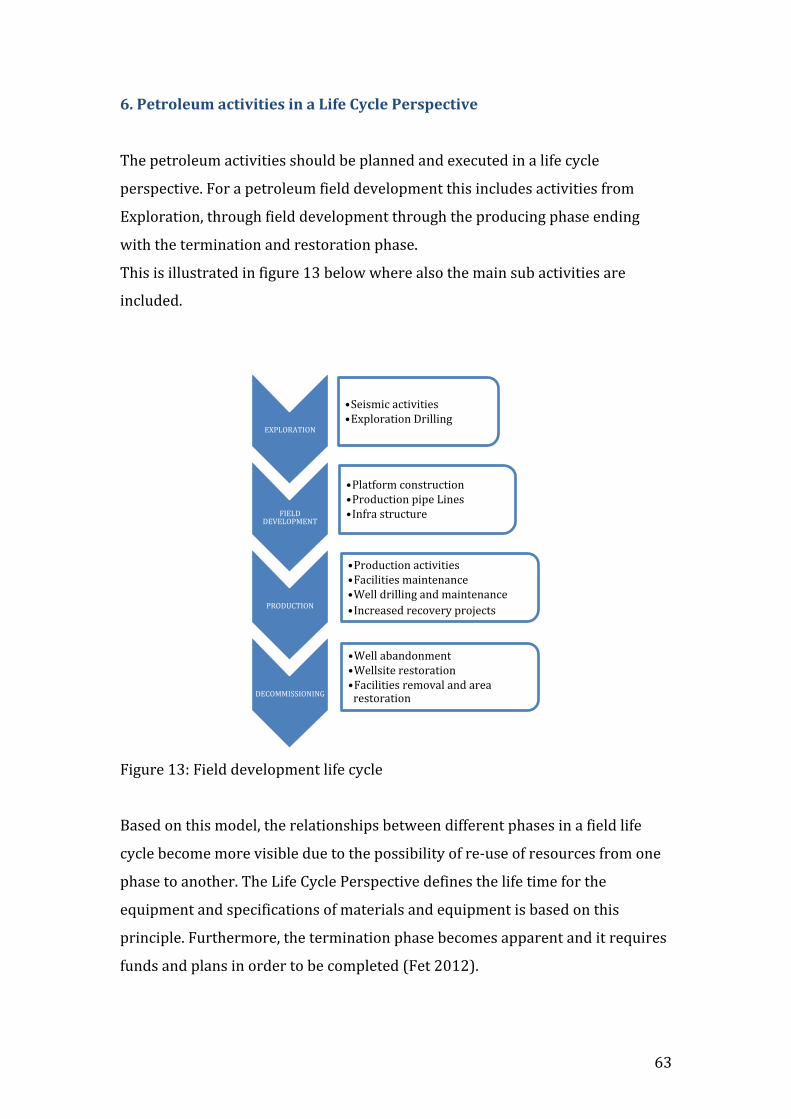
63
6. Petroleum activities in a Life Cycle Perspective
The petroleum activities should be planned and executed in a life cycle
perspective. For a petroleum field development this includes activities from
Exploration, through field development through the producing phase ending
with the termination and restoration phase.
This is illustrated in figure 13 below where also the main sub activities are
included.
Figure 13: Field development life cycle
Based on this model, the relationships between different phases in a field life
cycle become more visible due to the possibility of re-‐use of resources from one
phase to another. The Life Cycle Perspective defines the life time for the
equipment and specifications of materials and equipment is based on this
principle. Furthermore, the termination phase becomes apparent and it requires
funds and plans in order to be completed (Fet 2012).
EXPLORATION
• Seismic activities • Exploration Drilling
FIELD DEVELOPMENT
• Platform construction • Production pipe Lines • Infra structure
PRODUCTION
• Production activities • Facilities maintenance • Well drilling and maintenance • Increased recovery projects
DECOMMISSIONING
• Well abandonment • Wellsite restoration • Facilities removal and area restoration
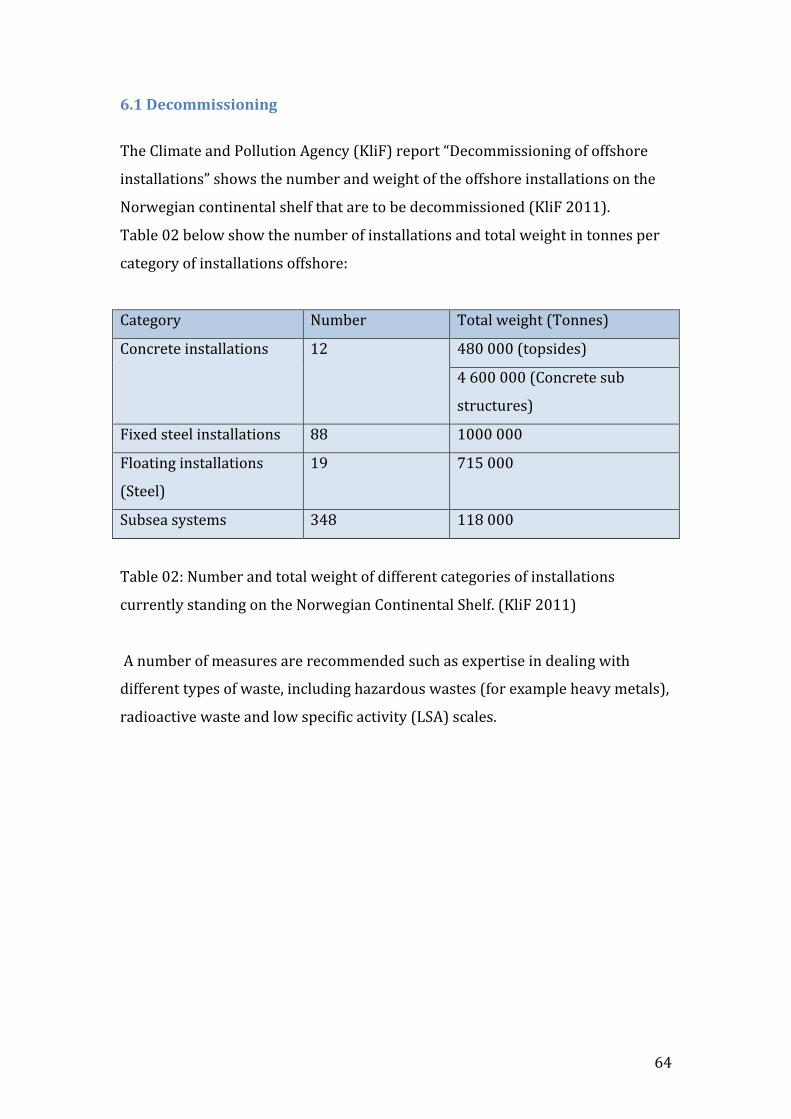
64
6.1 Decommissioning
The Climate and Pollution Agency (KliF) report “Decommissioning of offshore
installations” shows the number and weight of the offshore installations on the
Norwegian continental shelf that are to be decommissioned (KliF 2011).
Table 02 below show the number of installations and total weight in tonnes per
category of installations offshore:
Category Number Total weight (Tonnes)
Concrete installations 12 480 000 (topsides)
4 600 000 (Concrete sub
structures)
Fixed steel installations 88 1000 000
Floating installations
(Steel)
19 715 000
Subsea systems 348 118 000
Table 02: Number and total weight of different categories of installations
currently standing on the Norwegian Continental Shelf. (KliF 2011)
A number of measures are recommended such as expertise in dealing with
different types of waste, including hazardous wastes (for example heavy metals),
radioactive waste and low specific activity (LSA) scales.
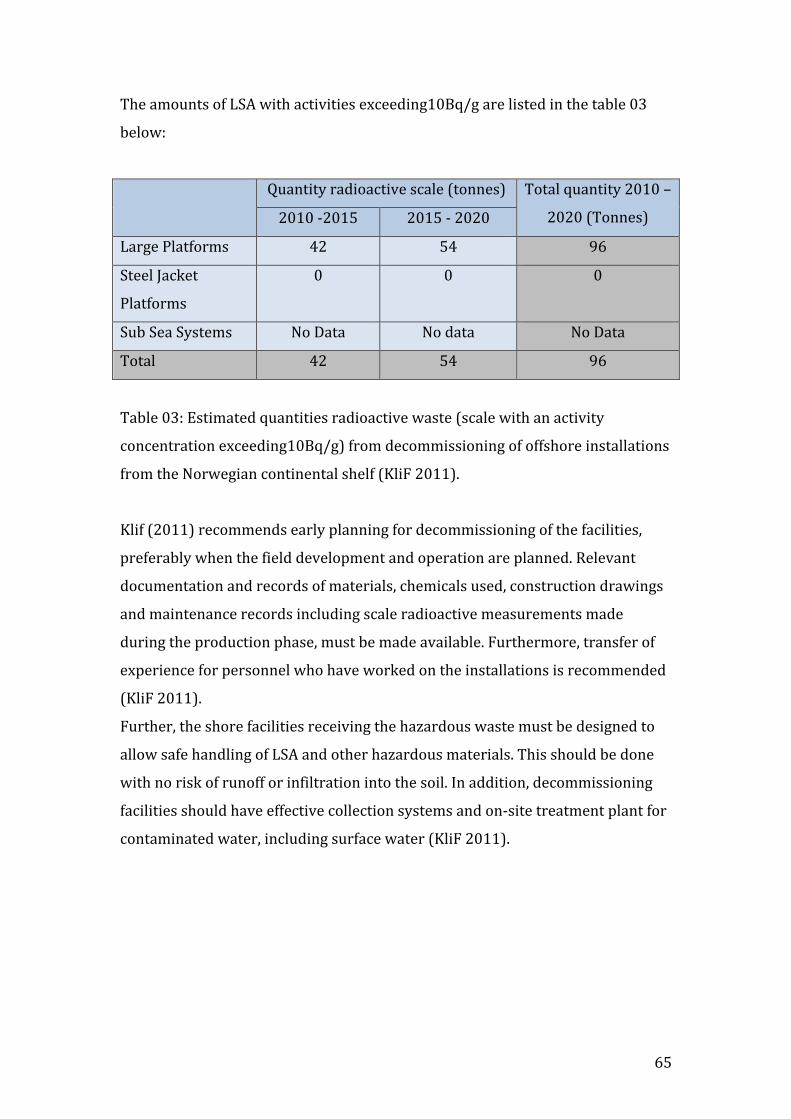
65
The amounts of LSA with activities exceeding10Bq/g are listed in the table 03
below:
Quantity radioactive scale (tonnes) Total quantity 2010 –
2020 (Tonnes) 2010 -‐2015 2015 -‐ 2020
Large Platforms 42 54 96
Steel Jacket
Platforms
0 0 0
Sub Sea Systems No Data No data No Data
Total 42 54 96
Table 03: Estimated quantities radioactive waste (scale with an activity
concentration exceeding10Bq/g) from decommissioning of offshore installations
from the Norwegian continental shelf (KliF 2011).
Klif (2011) recommends early planning for decommissioning of the facilities,
preferably when the field development and operation are planned. Relevant
documentation and records of materials, chemicals used, construction drawings
and maintenance records including scale radioactive measurements made
during the production phase, must be made available. Furthermore, transfer of
experience for personnel who have worked on the installations is recommended
(KliF 2011).
Further, the shore facilities receiving the hazardous waste must be designed to
allow safe handling of LSA and other hazardous materials. This should be done
with no risk of runoff or infiltration into the soil. In addition, decommissioning
facilities should have effective collection systems and on-‐site treatment plant for
contaminated water, including surface water (KliF 2011).
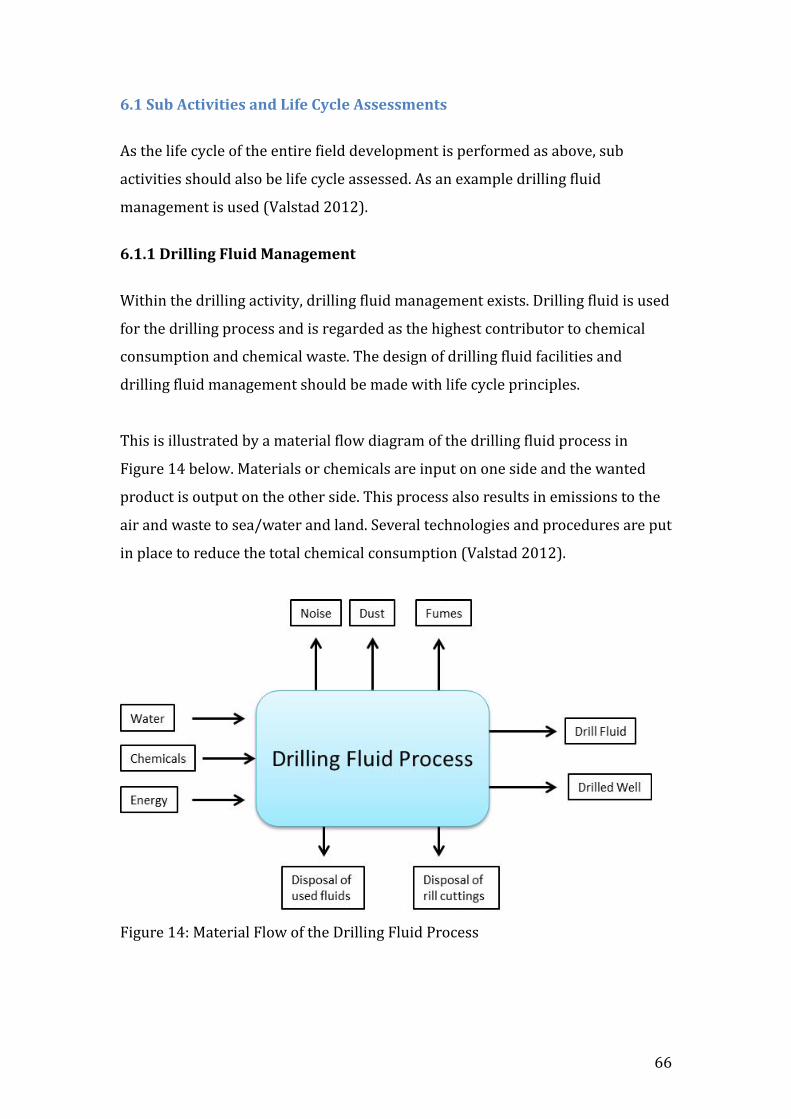
66
6.1 Sub Activities and Life Cycle Assessments
As the life cycle of the entire field development is performed as above, sub
activities should also be life cycle assessed. As an example drilling fluid
management is used (Valstad 2012).
6.1.1 Drilling Fluid Management
Within the drilling activity, drilling fluid management exists. Drilling fluid is used
for the drilling process and is regarded as the highest contributor to chemical
consumption and chemical waste. The design of drilling fluid facilities and
drilling fluid management should be made with life cycle principles.
This is illustrated by a material flow diagram of the drilling fluid process in
Figure 14 below. Materials or chemicals are input on one side and the wanted
product is output on the other side. This process also results in emissions to the
air and waste to sea/water and land. Several technologies and procedures are put
in place to reduce the total chemical consumption (Valstad 2012).
Figure 14: Material Flow of the Drilling Fluid Process
67
When designing the drilling fluid system with a life cycle perspective, the
following considerations are made based on the material flow of the drilling fluid
process in figure 14.
1. Input: to the Drilling Fluid process.
Drilling fluid is built by adding chemicals to a base fluid. For water based
drilling fluid water is the base fluid, for oil-‐based fluid various types of oils
are used. Several technologies of blending chemicals into the base fluid
exist, from cheap solution through so-‐called mixing hoppers through
chemical shearing hoppers through sharing systems allowing the
chemicals to be sheared into the base fluid.
Improved shearing effects reduce the amount of chemicals required to
obtain certain parameters. Investing in more costly chemical mixing
equipment will reduce the cost and reduce the total amount of chemicals
used for the same volume of fluid. From a life cycle perspective, the
investment in more expensive technology becomes the most cost effective
solution.
2. Output: Emissions to the air
• Dust
The mixing of chemicals produces dust in to the air resulting in
spill, waste of chemicals; and the dust is potentially harmful to the
personnel involved in the process. Life cycle assessments justify
reduction of the dust from chemical by investing in technology.
• Fumes
In the case of oil base fluids, fumes from evaporation may create a
health hazard
• Noise
The drilling fluid cleaning system, the shale shakers produce noise.
This is harmful to the personnel. It could also have an effect in case
the activity is in populated area or in a area with wild life.
Technology is available with equipment with less noise and
constructions for enclosing the shakers.
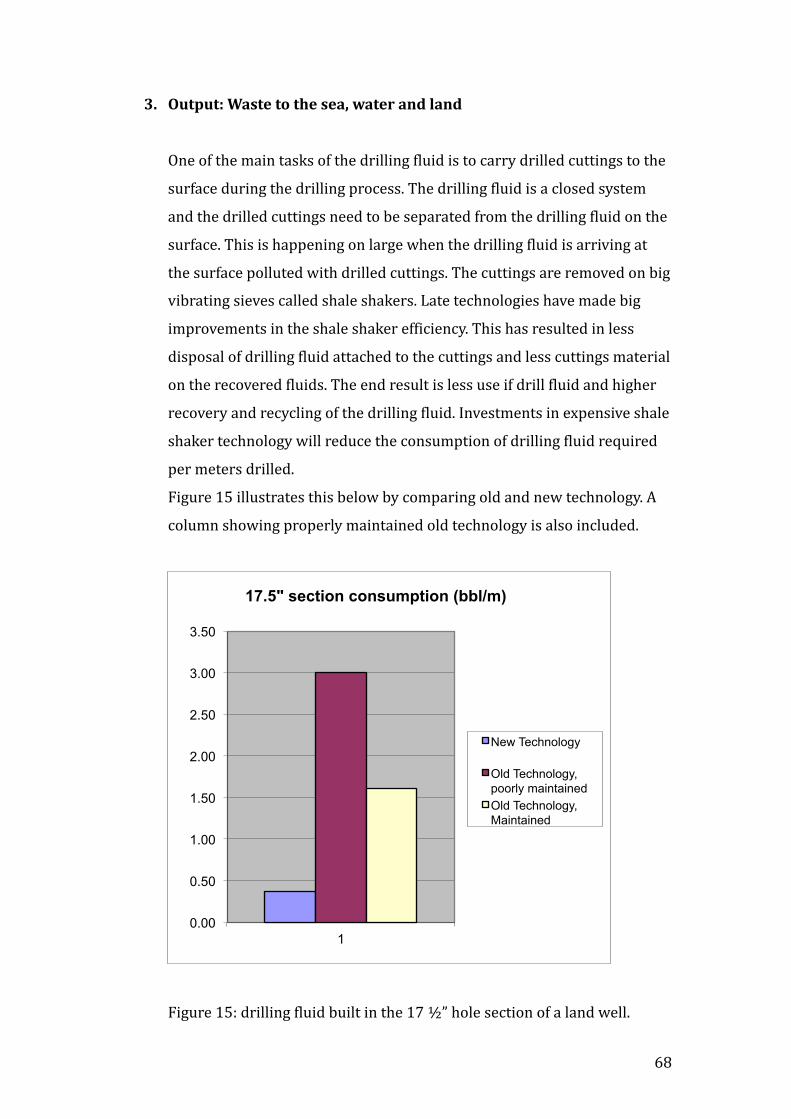
68
3. Output: Waste to the sea, water and land
One of the main tasks of the drilling fluid is to carry drilled cuttings to the
surface during the drilling process. The drilling fluid is a closed system
and the drilled cuttings need to be separated from the drilling fluid on the
surface. This is happening on large when the drilling fluid is arriving at
the surface polluted with drilled cuttings. The cuttings are removed on big
vibrating sieves called shale shakers. Late technologies have made big
improvements in the shale shaker efficiency. This has resulted in less
disposal of drilling fluid attached to the cuttings and less cuttings material
on the recovered fluids. The end result is less use if drill fluid and higher
recovery and recycling of the drilling fluid. Investments in expensive shale
shaker technology will reduce the consumption of drilling fluid required
per meters drilled.
Figure 15 illustrates this below by comparing old and new technology. A
column showing properly maintained old technology is also included.
Figure 15: drilling fluid built in the 17 ½” hole section of a land well.
0.00
0.50
1.00
1.50
2.00
2.50
3.00
3.50
1
17.5" section consumption (bbl/m)
New Technology
Old Technology, poorly maintained Old Technology, Maintained
69
It is seen from the graph that the fluid consumption for the 17 ½” section is less
than the theoretical volume of the drilled hole. This is a result of the re-‐use of the
drilling fluid from the previous section. The new technology processes a cleaner
mud out of the shale shakers, which allows the mud from the previous sections
to be re-‐used in the next section.
6.1.2 Revised contract strategies
This improved technology enabling the re-‐use of drilling fluids opens for new
contract strategies. The drilling fluid companies have traditionally been paid for
the chemicals used in making new drilling fluids, which is in contradiction to the
principles of life cycle assessment and sustainable operations. The contract must
be moved from chemical payments to compensations for re-‐use and recycling of
the drilling fluids (Valstad 2012).
70
7. Summary and Discussion
This thesis has examined the petroleum industry from an environmental
perspective. This was done from a historical view up till present time. The
control mechanisms of the oil companies exist through laws, regulation and in
the companies internal management systems. The authorities governing
mechanisms and the aforementioned oil company control mechanisms were
established through a literature review and subsequently analysed.
Norwegian petroleum laws and regulations were used as examples and
compared with a developing country. For future studies, it is recommended to
include interviews with relevant government bodies in which the bureaucrats’
roles, responsibilities and work methods such as the “governing toolbox” are
examined. This will increase the reliability of the statements in this thesis, which
are mostly based on a qualitative approach. Nevertheless, the literature review
and information gathered through the qualitative research revealed modern and
comprehensive regulations. The regulations were found to put high demands on
both the companies and the governing authorities. The main goals of the thesis:
“to evaluate the environmental management of the petroleum industry by
examining sustainability, global frameworks and management tools”, are met. The
consent applications showed environmental awareness and contingency plans,
but the inconsistency between the applications opens for further analysis.
Likewise, the Macondo well blowout investigation examined in this thesis,
contained findings and conclusions that should be tested on the operators on the
Norwegian Continental Shelf.
71
8. Conclusion and Further Challenges
This research has aimed at providing an overview of the state of the
environmental management of the petroleum industry. From a historical
perspective large improvement in the environmental management was found.
Petroleum activity on the NCS seems to have minimal impact on the
environment, and continuous improvement processes have reduced the
consumption of chemicals, their toxicity and the amounts of waste. Increased
recycling have been demonstrating, documenting the petroleum is developing
into direction towards sustainability. Good control on waste handling and day-‐
to-‐day pollution control was demonstrated. Life Cycle Assessments are observed,
but does not seem to be fully incorporated in the company policies, e.g.
decommissioning requirements have not been seen in the field development
planning phase.
Modern functional regulations are in place, but it was noted that the intentions
in the regulations were not always met. More specifically, the requirements to
risk assessment, HSE culture and contingency planning seem to have
shortcomings. The search into company consent applications revealed little
learning from the Macondo blowout. Both company and governance
shortcomings become visible through the review of blowout risk assessments,
which appeared to be vague and inconsistent. Recommendations from the “Final
Report on the Investigation of the Macondo Well Blowout” are not visible in the
subsequent consent applications investigated in this thesis.
Furthermore, the report pointed at a poor company culture as being one of the
major contributing factors leading to disasters. A lower reliability type
organization focusing on production rather than protection existed within the
company contributing to an organization unable to manage risk. With this
perspective in mind, the inevitable question appears: Is this description
representative for the companies operating on the NCS?

72
The main finding, conclusion and recommendation of this thesis would be to
audit all companies on the NCS for this type of company culture. In this way one
could do away with lower reliability organisations and replace them with higher
reliability organisations. This type of organisations and culture must form the
backbone of any company in order to meet future challenges of sustainable
activities.
73
9. References
AllAfrica.com 2010, “Uganda: Norway Should Be a Model for Our Oil
Management”, Available online:
http://allafrica.com/stories/201009150497.html Accessed October 15 2010
BBC News 2013, Russia and Norway sign maritime border agreement, Available
online, Available online: http://www.bbc.co.uk/news/business-‐11316430
Accessed 12 march 2013
Bryman, A., 2008, Social research methods, Oxford University press Oxford.
Burdge, R. & Vanclay, F., 1995,”Social impact assessment’, Environmental and
Social Impact Assessment, vol. 4. pp. 31-‐65.
Centrica Energy 2011, PL477: Søknad om tillatelse til virksomhet etter
forurensningsloven ved boring av letebrønn 6506/11-‐9 S Cooper, Available
online: http://www.ptil.no/
Deepwater Horizon Study Group 2013, “Final Report on the Investigation of the
Macondo Well Blowout”, Available Online:
http://ccrm.berkeley.edu/pdfs_papers/bea_pdfs/dhsgfinalreport-‐march2011-‐
tag.pdf Accessed 2 June 2013
Eccleston, C.H. 2011, Environmental Impact Assessment – a Guide to best
professional practice, CRC Press.
Fet, A.M. 2012, Lecture on EMS, systems engineering, stakeholders and supply
chain Management, TIØ 5215, Global Governance and Green Supply Chain
Management
74
Forbes 2010, Corruption Ranking, Accessed 20 September 2010,
http://www.transparency.org/policy_research/surveys_indices/cpi/2009/cpi_2
009_table
Glasson, J., Therivel, R. & Chadwick, A. 2005, Introduction to Environmental
Impact Assessment, 3rd Edition, Routledge, London.
Global Post 2012, “Nigeria oil spills drench and sicken delta communtites”,
Available online:
http://www.globalpost.com/dispatch/news/regions/africa/nigeria/120624/ni
geria-‐oil-‐pollution-‐sickens-‐communities 23October 2012
IHS-‐CERA 2013, Energy and power, Available online:
http://www.ihs.com/products/cera/index.aspx Accessed 21 March 2013
Jay, S., Jones, C., Slinn, P., Wood, C., 2007, Environmental Impact Assessment:
Retrospect and Prospect. Environmental Impact Assessment Review, vol. 27,pp.
287-‐300
KLIF 2011, Report: Decommissioning of offshore installations, Oslo, February
2011.
Mason, J., 1996, Qualitative research, London, Sage.
Ministry of Petroleum and Energy, “Laws & Rules – Framework”, Available online:
http://www.regjeringen.no/en/dep/oed/Documents-‐and-‐publications/Laws-‐
and-‐rules-‐2/Rules/2007/framework.html?id=455506 Accessed 19 September
2010
Ministry of Energy and Mineral Development 2008, “National oil and gas policy
for Uganda 2008”, Available online:
http://conserveuganda.files.wordpress.com/.../national-‐oil-‐and-‐gas-‐policy-‐
for-‐uganda.pdf accessed 16 September 2010
75
Ministry of Finance Planning and Economic Development. 2010, “Oil & Gas
Provinces” Available online:
http://www.finance.go.ug/maplib./ConfirmAd?AdId=238169854&Guid=12be1a
86-‐dd40-‐a20b-‐2720-‐1f8cfffecf96&mpname=LocClass”, Accessed 20 September
2010
Ministry of Finance 2010, “The Government Pension fund”, Available online:
http://www.regjeringen.no/en/dep/fin/tema/statens_pensjonsfond/Om-‐
forvaltningen-‐av-‐Statens-‐pensjonsfond-‐i-‐2009.html?id=599698 Accessed 16
September 2010,
Nerheim, G., 1998, Olje-‐Norge:historie og fremtid, Cappelens Forlag.
Norwegian Petroleum Directorate 2010a, “Regulations”, Available online:,
http://www.npd.no/en/Regulations/ Accessed 15 September 2010
Norwegian Petroleum Directorate 2010b, “Petroleum Activities Act”, Available
online: http://www.npd.no/en/Regulations/Acts/Petroleum-‐activities-‐act/
Accessed 19 September 2010
NPD 2013, “Oljedirektoratet“, Available online:
http://npd.no/no/Publikasjoner/ Accessed 23 April 2013
Okuonzi, S.A. 2004, "Dying for economic growth? Evidence of a flawed economic
policy in Uganda", The Lancet, vol. 364, no. 9445, pp. 1632-‐1637.
OSC 2013a, “National Commission on the BP Deepwater Horizon Oil Spill and
Offshore Drilling”, Available online: http://www.oilspillcommission.gov/final-‐
report Accessed 21 March 2013
OSC 2013b, “A brief history of offshore drilling”, Available online:
http://www.oilspillcommission.gov/document/brief-‐history-‐offshore-‐oil-‐
drilling Accessed 21 March 2013
76
OSHA 2013, “Forms for Recording Work-‐Related Injuries and Illnesses”,
Available online: https://www.osha.gov/recordkeeping/new-‐osha300form1-‐1-‐
04.pdf Accessed 19 May 2013
PSA 2013, Roles and responsibilities, Available online: http://www.ptil.no/role-‐
and-‐area-‐of-‐responsibility/category165.html Accessed 20 April 2013
Regjeringen.no 2013, “Utenriksdepartementet”,
http://www.regjeringen.no/nb/dep/ud/aktuelt/nyheter/2011/delelinje-‐
avtalen-‐trer-‐i-‐kraft.html?id=651349 Accessed 2 May 2013
Stage Gate 2013, “Benchmarking”, Available online
http://www.stagegatebenchmarking.com/benchmarking.php Accessed 3 May
2013
Statoil 2012, PL386: Søknad til samtykke til leteboring med West Alpha
6610/10-‐1 Lovund PL386, Available online: http://www.ptil.no/
Sustainable Development 2013, The Rio Declaration on the Environment,
Available Online: http://www.sustainable
environment.org.uk/Action/Rio_Declaration.php Accessed 20/02/2013
The American Residency Project 2013, “221 -‐ Statement Announcing the
Creation of the Environmental Quality Council and the Citizens' Advisory
Committee on Environmental Quality”, Available online:
http://www.presidency.ucsb.edu/ws/?pid=2077 Accessed 20 January 2013
The Times 2010, “Fresh Uganda oil find ‘Africa’s biggest’”, Available online:
http://business.timesonline.co.uk/tol/business/industry_sectors/natural_resou
rces/article5512531.ece Accessed 15 Septermber 2010,
77
United Nations General Assembly 2013, Report of the United Nations conference
on environment and development, Available Online:
http://www.un.org/documents/ga/conf151/aconf15126-‐1annex1.htm
Accessed 12/10/2012
United Nations Global Compact 2013, Environment, Available online:
http://www.unglobalcompact.org/AboutTheGC/TheTenPrinciples/environment
.html Accessed 13/02/2013
United States National Commission 2012, National Commission on the BP
Deepwater Horizon Oil Spill and Offshore Drilling: A brief history of offshore oil
drilling, Books LLC, Reference Series
Valstad, Ø., 2012, Personal Communication, April 22 & June 12, 2012.
Vanclay, F., 2002, “Social Impact Assessment” in Munn, T. (ed.) Encyclopedia of
Global Environmental Change, vol 4, Chichester: Wiley, 387-‐393.
Wathern, P., 1988, Environmental impact assessment: Theory and practice, Unwin
Hyman, London.
Weick, K, E. & Sutcliffe, K.M,. 2001, Managing the Unexpected, Jossey-‐Bass, San
Francisco, CA
Weick, K. E., Sutcliffe, K.M. and Obstfeld, D., 1999, Organizing for High Reliability:
Processes of Collective Mindfulness, Research in Organizational Behavior, Staw
and Sutton (Eds.), Research in Organizational Behavior, JAI Press, vol. 21,
Greenwich, CT
Westergaard, R., 1987, All About Blowout', Norwegian Oil Review, no. 6, pp. 12.

78
Wintersall 2011, PL 5758 BS: Søknad om tillatelse til virksomhet etter
forurensningsloven for 6407/1-‐5S Maria apraisal (PL PL 5758 BS), Available
online: http://www.ptil.no/ Accessed 13 April 2013
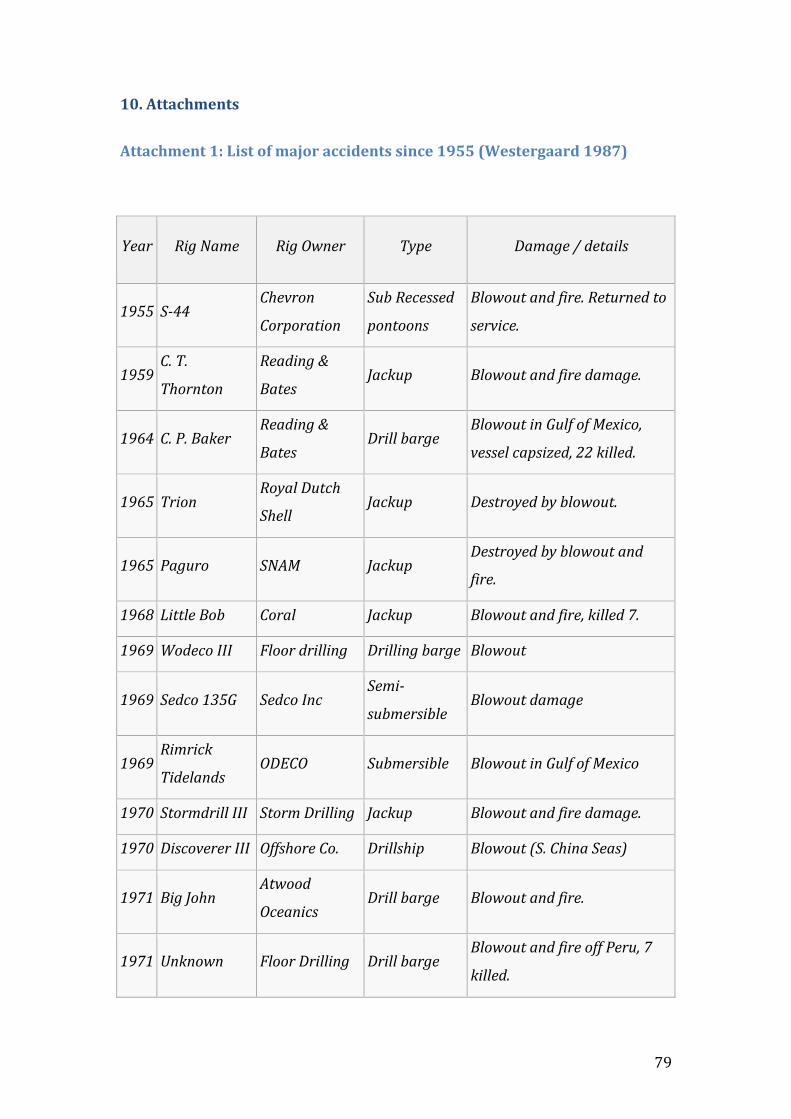
79
10. Attachments
Attachment 1: List of major accidents since 1955 (Westergaard 1987)
Year Rig Name Rig Owner Type Damage / details
1955 S-‐44 Chevron
Corporation
Sub Recessed
pontoons
Blowout and fire. Returned to
service.
1959 C. T.
Thornton
Reading &
Bates Jackup Blowout and fire damage.
1964 C. P. Baker Reading &
Bates Drill barge
Blowout in Gulf of Mexico,
vessel capsized, 22 killed.
1965 Trion Royal Dutch
Shell
Jackup Destroyed by blowout.
1965 Paguro SNAM Jackup Destroyed by blowout and
fire.
1968 Little Bob Coral Jackup Blowout and fire, killed 7.
1969 Wodeco III Floor drilling Drilling barge Blowout
1969 Sedco 135G Sedco Inc Semi-‐
submersible Blowout damage
1969 Rimrick
Tidelands ODECO Submersible Blowout in Gulf of Mexico
1970 Stormdrill III Storm Drilling Jackup Blowout and fire damage.
1970 Discoverer III Offshore Co. Drillship Blowout (S. China Seas)
1971 Big John Atwood
Oceanics Drill barge Blowout and fire.
1971 Unknown Floor Drilling Drill barge Blowout and fire off Peru, 7
killed.
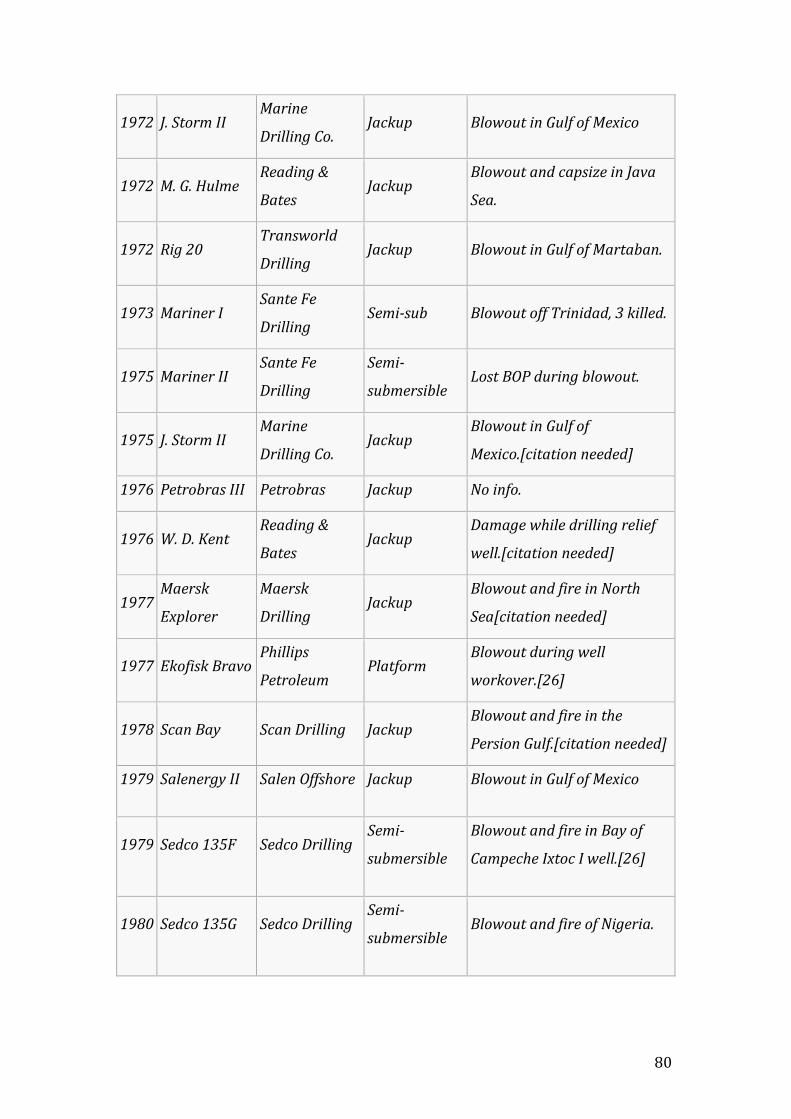
80
1972 J. Storm II Marine
Drilling Co. Jackup Blowout in Gulf of Mexico
1972 M. G. Hulme Reading &
Bates Jackup
Blowout and capsize in Java
Sea.
1972 Rig 20 Transworld
Drilling Jackup Blowout in Gulf of Martaban.
1973 Mariner I Sante Fe
Drilling Semi-‐sub Blowout off Trinidad, 3 killed.
1975 Mariner II Sante Fe
Drilling
Semi-‐
submersible Lost BOP during blowout.
1975 J. Storm II Marine
Drilling Co. Jackup
Blowout in Gulf of
Mexico.[citation needed]
1976 Petrobras III Petrobras Jackup No info.
1976 W. D. Kent Reading &
Bates Jackup
Damage while drilling relief
well.[citation needed]
1977 Maersk
Explorer
Maersk
Drilling
Jackup Blowout and fire in North
Sea[citation needed]
1977 Ekofisk Bravo
Phillips
Petroleum
Platform Blowout during well
workover.[26]
1978 Scan Bay Scan Drilling Jackup Blowout and fire in the
Persion Gulf.[citation needed]
1979 Salenergy II Salen Offshore Jackup Blowout in Gulf of Mexico
1979 Sedco 135F Sedco Drilling Semi-‐
submersible
Blowout and fire in Bay of
Campeche Ixtoc I well.[26]
1980 Sedco 135G Sedco Drilling Semi-‐
submersible Blowout and fire of Nigeria.
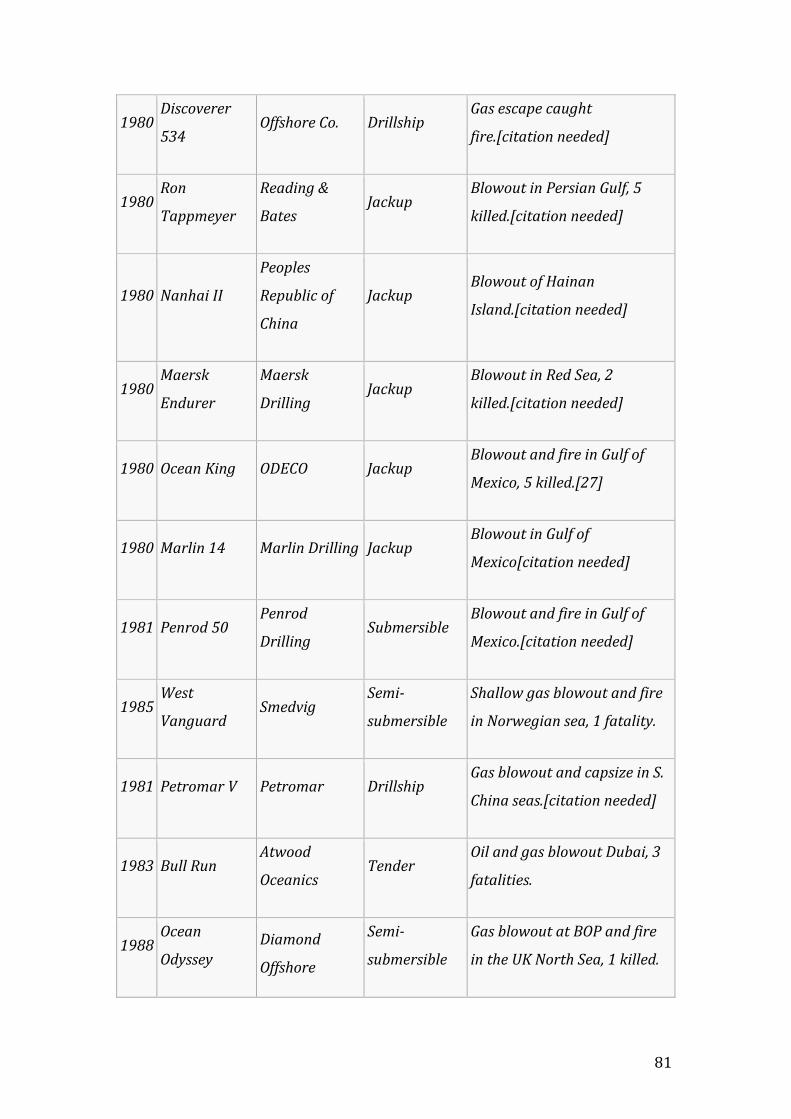
81
1980 Discoverer
534 Offshore Co. Drillship
Gas escape caught
fire.[citation needed]
1980 Ron
Tappmeyer
Reading &
Bates Jackup
Blowout in Persian Gulf, 5
killed.[citation needed]
1980 Nanhai II
Peoples
Republic of
China
Jackup Blowout of Hainan
Island.[citation needed]
1980 Maersk
Endurer
Maersk
Drilling Jackup
Blowout in Red Sea, 2
killed.[citation needed]
1980 Ocean King ODECO Jackup Blowout and fire in Gulf of
Mexico, 5 killed.[27]
1980 Marlin 14 Marlin Drilling Jackup Blowout in Gulf of
Mexico[citation needed]
1981 Penrod 50 Penrod
Drilling Submersible
Blowout and fire in Gulf of
Mexico.[citation needed]
1985 West
Vanguard Smedvig
Semi-‐
submersible
Shallow gas blowout and fire
in Norwegian sea, 1 fatality.
1981 Petromar V Petromar Drillship Gas blowout and capsize in S.
China seas.[citation needed]
1983 Bull Run Atwood
Oceanics Tender
Oil and gas blowout Dubai, 3
fatalities.
1988 Ocean
Odyssey
Diamond
Offshore
Semi-‐
submersible
Gas blowout at BOP and fire
in the UK North Sea, 1 killed.
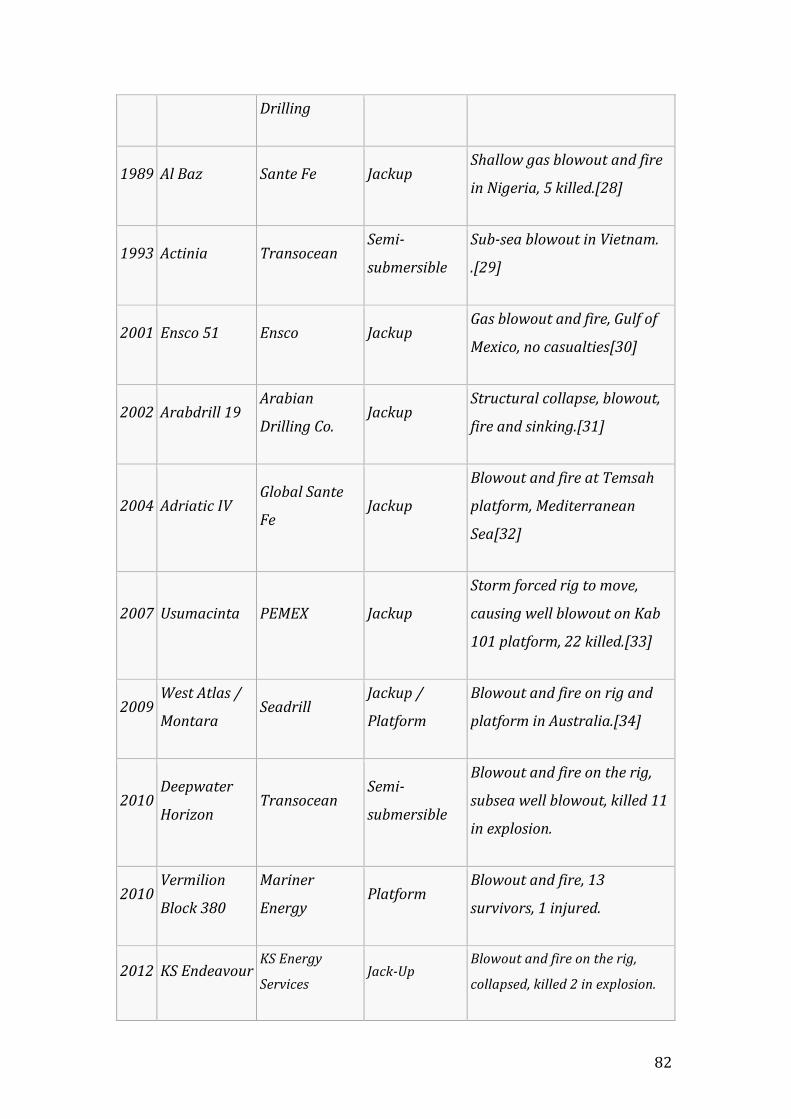
82
Drilling
1989 Al Baz Sante Fe Jackup Shallow gas blowout and fire
in Nigeria, 5 killed.[28]
1993 Actinia Transocean Semi-‐
submersible
Sub-‐sea blowout in Vietnam.
.[29]
2001 Ensco 51 Ensco Jackup Gas blowout and fire, Gulf of
Mexico, no casualties[30]
2002 Arabdrill 19 Arabian
Drilling Co. Jackup
Structural collapse, blowout,
fire and sinking.[31]
2004 Adriatic IV Global Sante
Fe Jackup
Blowout and fire at Temsah
platform, Mediterranean
Sea[32]
2007 Usumacinta PEMEX Jackup
Storm forced rig to move,
causing well blowout on Kab
101 platform, 22 killed.[33]
2009 West Atlas /
Montara
Seadrill
Jackup /
Platform
Blowout and fire on rig and
platform in Australia.[34]
2010 Deepwater
Horizon
Transocean
Semi-‐
submersible
Blowout and fire on the rig,
subsea well blowout, killed 11
in explosion.
2010 Vermilion
Block 380
Mariner
Energy
Platform Blowout and fire, 13
survivors, 1 injured.
2012 KS Endeavour
KS Energy
Services
Jack-‐Up Blowout and fire on the rig,
collapsed, killed 2 in explosion.
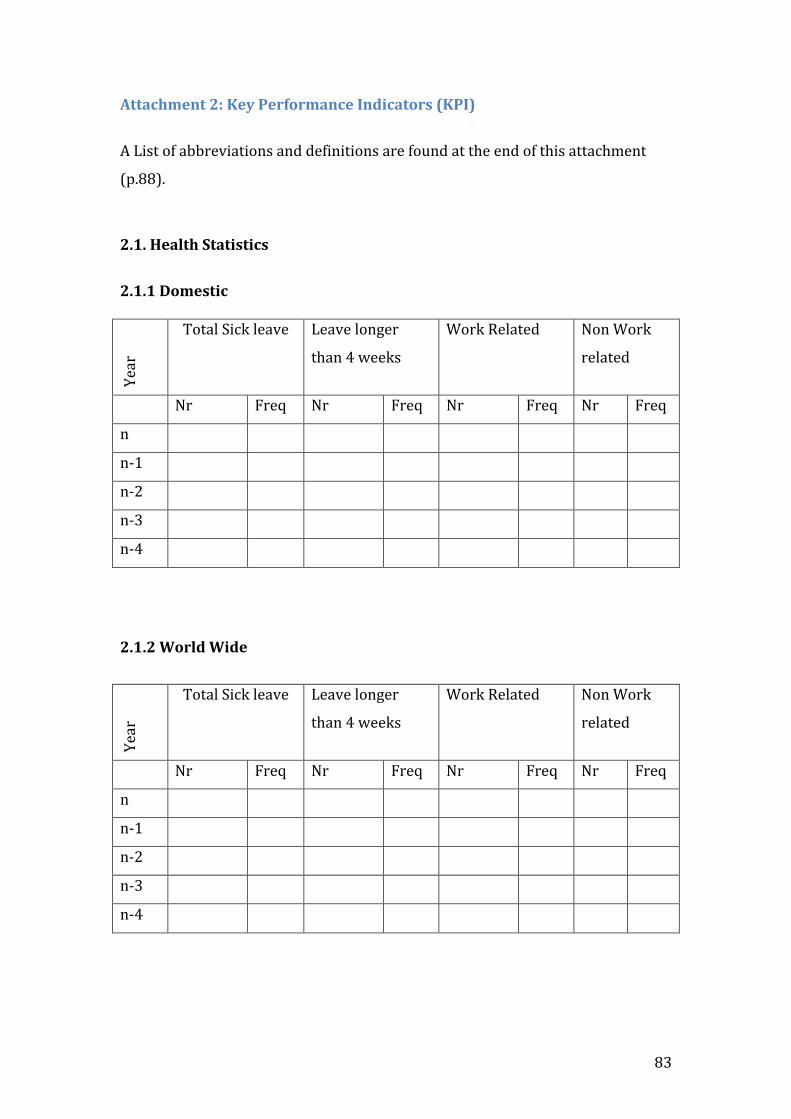
83
Attachment 2: Key Performance Indicators (KPI)
A List of abbreviations and definitions are found at the end of this attachment
(p.88).
2.1. Health Statistics
2.1.1 Domestic
Year
Total Sick leave Leave longer
than 4 weeks
Work Related Non Work
related
Nr Freq Nr Freq Nr Freq Nr Freq
n
n-‐1
n-‐2
n-‐3
n-‐4
2.1.2 World Wide
Year
Total Sick leave Leave longer
than 4 weeks
Work Related Non Work
related
Nr Freq Nr Freq Nr Freq Nr Freq
n
n-‐1
n-‐2
n-‐3
n-‐4

84
2.2 Safety Statistics
2.2.1 Domestic
Year
Fatality
LTA
Alt. Work
Medical
Treatment
First Aid Case
Car Accident
No fr No fr No fr No fr No fr No fr
n
n-‐1
n-‐2
n-‐3
n-‐4
2.2.2 World Wide
Year
Fatality
LTA
Alt. Work
Medical
Treatment
First Aid Case
Car Accident
No fr No fr No fr No fr No fr No fr
n
n-‐1
n-‐2
n-‐3
n-‐4
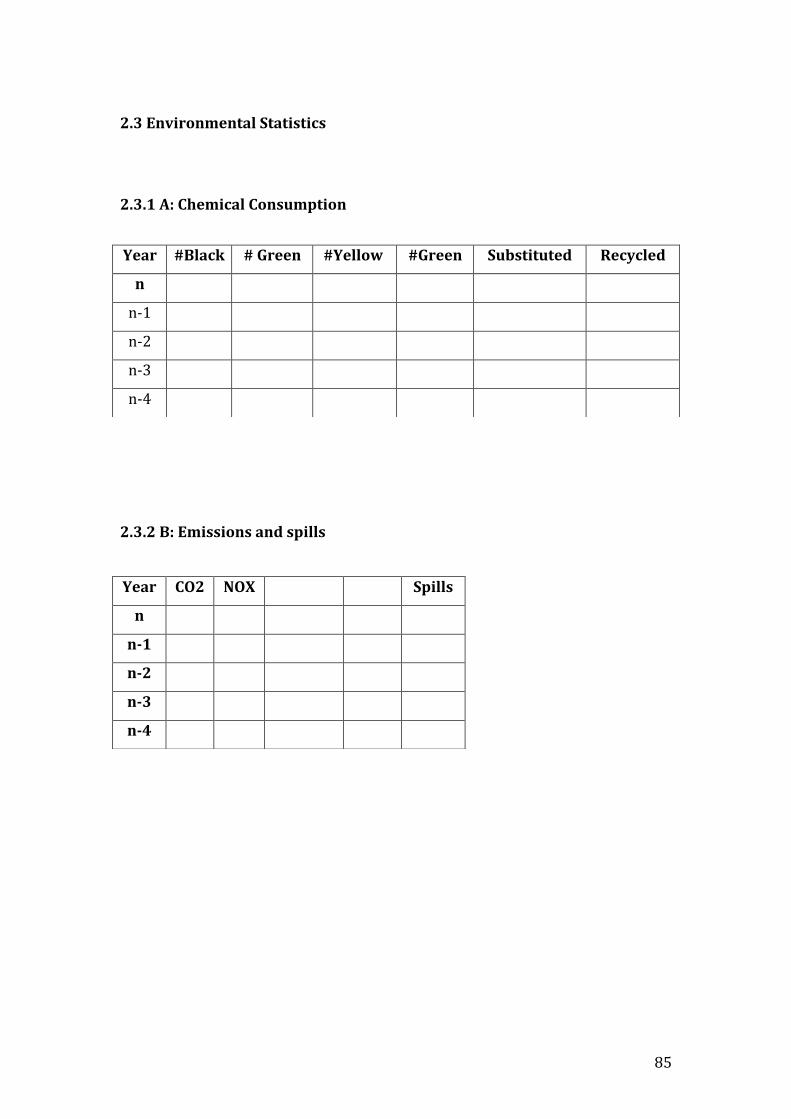
85
2.3 Environmental Statistics
2.3.1 A: Chemical Consumption
2.3.2 B: Emissions and spills
Year #Black # Green #Yellow #Green Substituted Recycled
n
n-‐1
n-‐2
n-‐3
n-‐4
Year CO2 NOX Spills
n
n-‐1
n-‐2
n-‐3
n-‐4
86
2.4. Abbreviations
>4weeks = Long term sick leave
Fr = Frequency; Normalised over 200,000 / 1,000,000 Manhours or Kilometres
(for Vehicle Accidents).
LTA – Lost Time Accident
Alt. Work – Alternative Work
MTC – Medical Treatment Case
Spills – Spill of material >1Bbl, causing impact on the environment (Chemical /
Oil / Mud etc.)
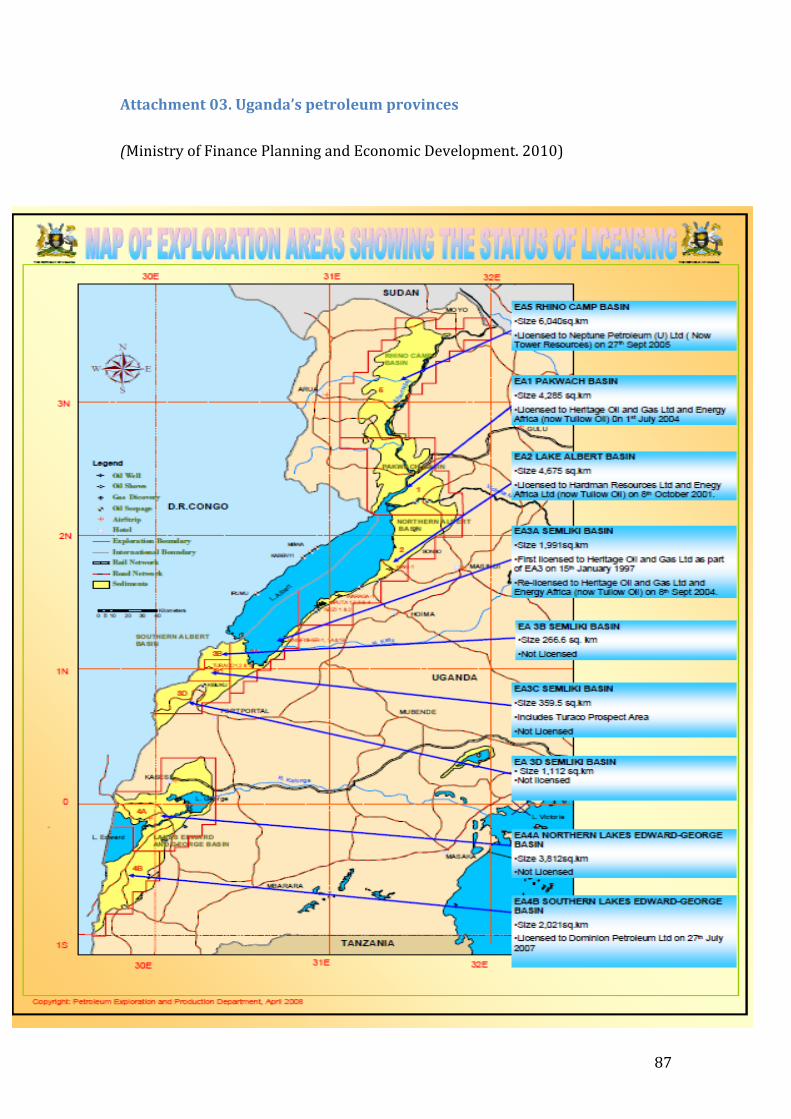
87
Attachment 03. Uganda’s petroleum provinces
(Ministry of Finance Planning and Economic Development. 2010)
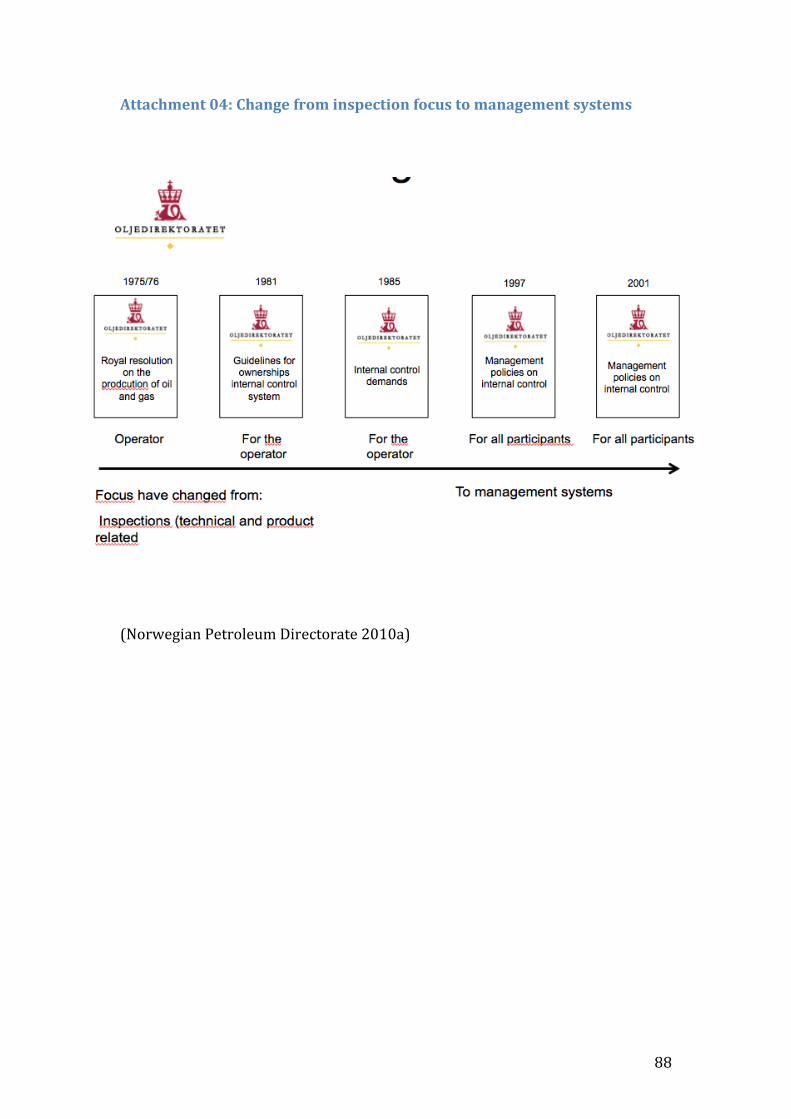
88
Attachment 04: Change from inspection focus to management systems
(Norwegian Petroleum Directorate 2010a)
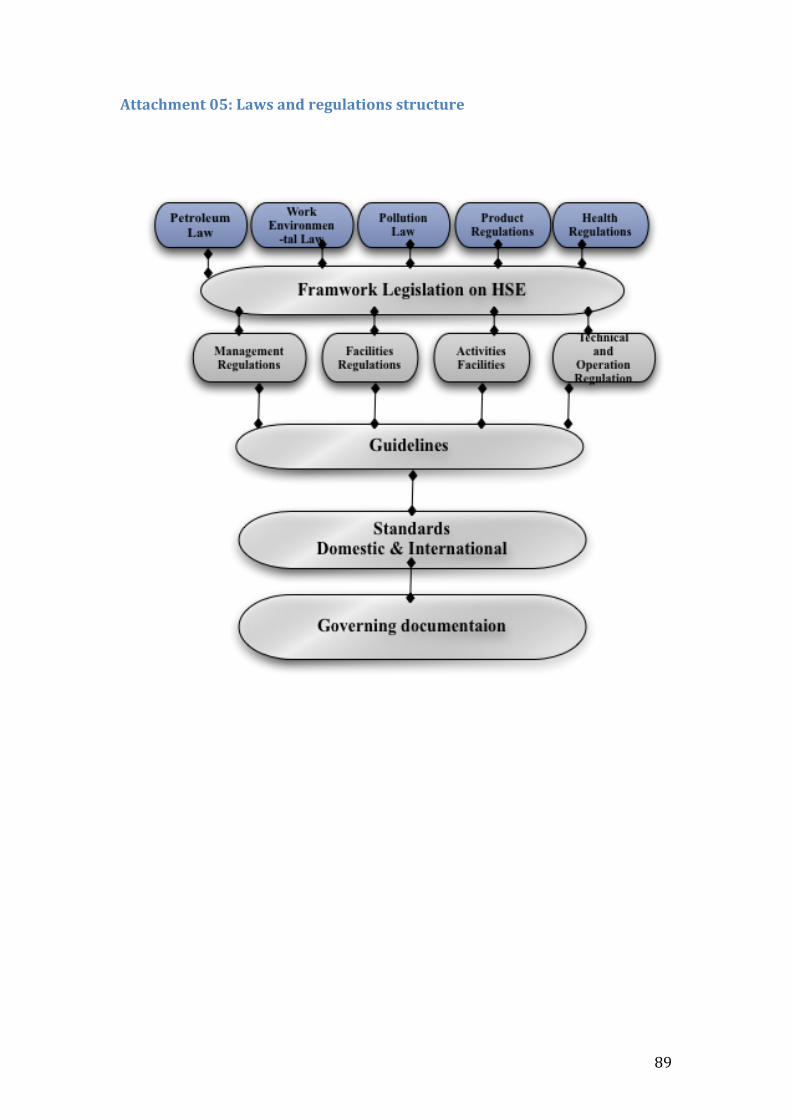
89
Attachment 05: Laws and regulations structure
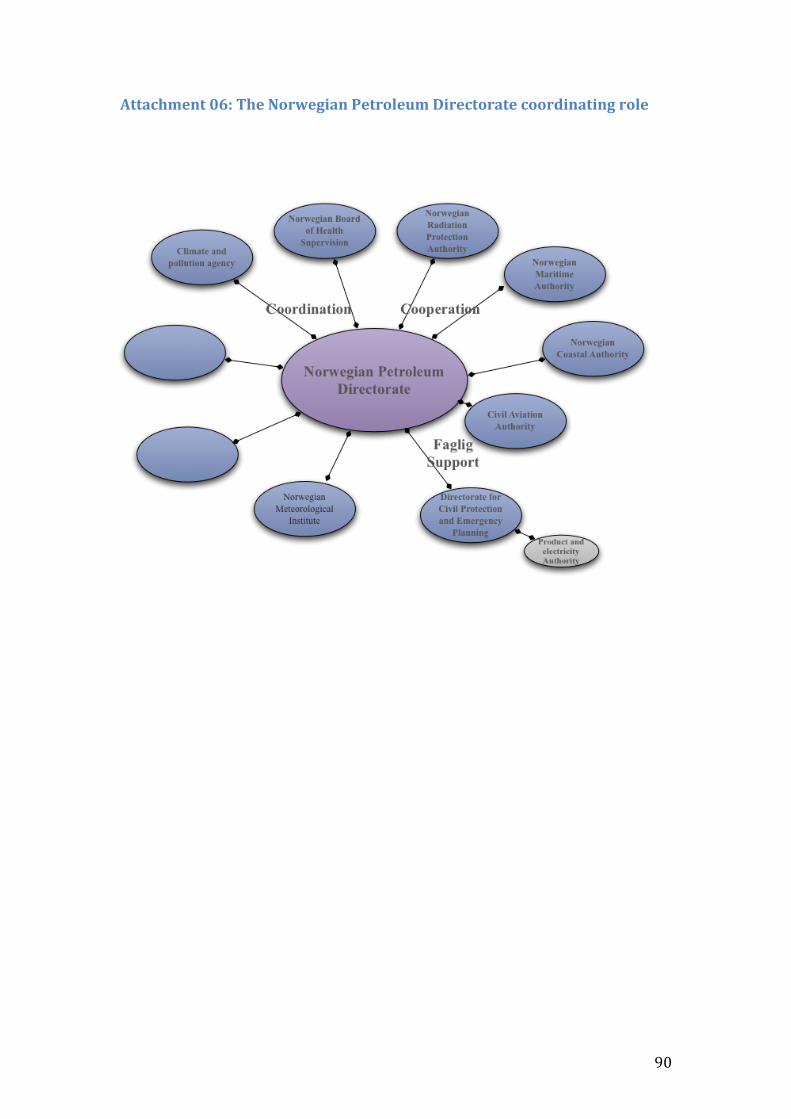
90
Attachment 06: The Norwegian Petroleum Directorate coordinating role
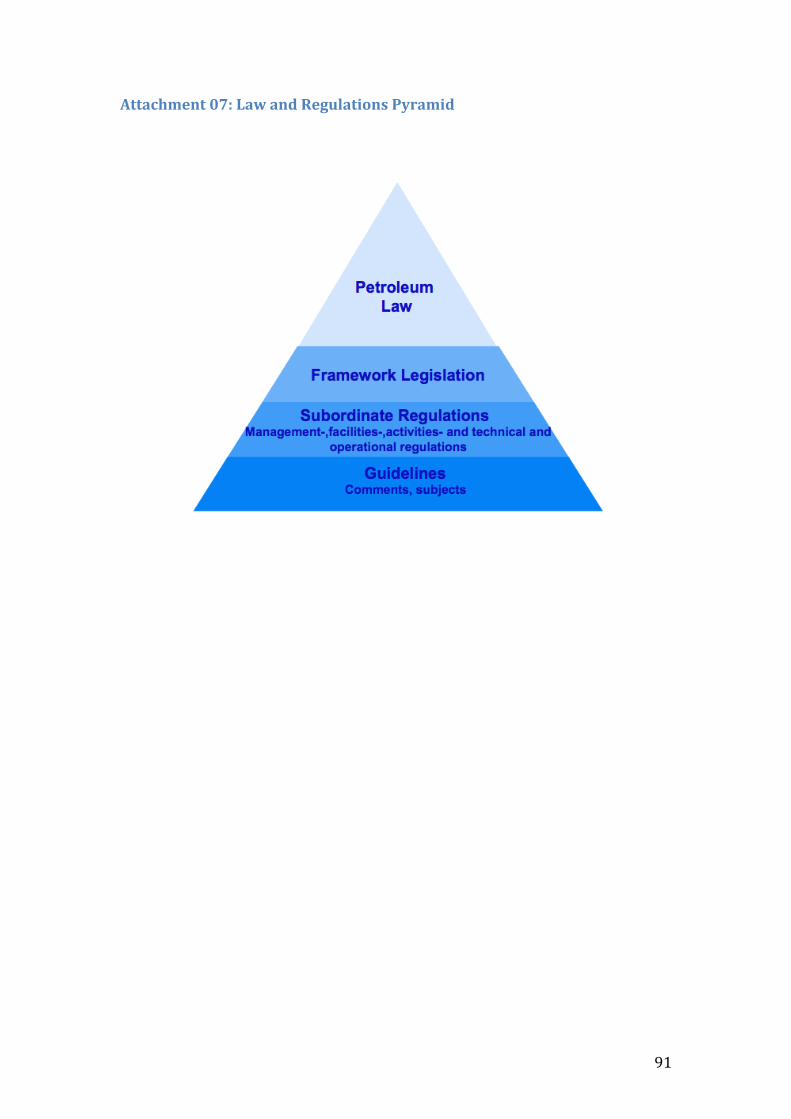
91
Attachment 07: Law and Regulations Pyramid