Embed Size (px)
Citation preview
Environmental Impacts of Food Production and Consumption A research report completed for the Department for Environment, Food and Rural Affairs by Manchester Business School

Environmental Impacts of Food Production and Consumption
Final Report to the Department for Environment Food and Rural Affairs Suggested citation for this report: Foster, C., Green, K., Bleda, M., Dewick, P., Evans, B., Flynn A., Mylan, J. (2006). Environmental Impacts of Food Production and Consumption: A report to the Department for Environment, Food and Rural Affairs. Manchester Business School. Defra, London. Project Director: Ken Green Manchester Business Project Manager: Chris Foster, Manchester Business School Research team: Barry Evans, Andrew Flynn, University of Cardiff Mercedes Bleda, Paul Dewick, Jo Mylan and Sally Randles, Manchester Business School Contact details: Manchester Business School, Booth Street West, Manchester M15 6PB e-mail: [email protected]; [email protected] This report draws on data presented in published papers and reports. Tables and diagrams drawn directly from those sources are acknowledged. Other tables/diagrams have been prepared specially for this report and are therefore the property of the authors and DEFRA.
2
TABLE OF CONTENTS
Glossary...................................................................................................................6
Executive Summary ..............................................................................................10
Part 1: Introduction ...............................................................................................17 Aims & Objectives ........................................................................................................................... 17 Method ............................................................................................................................................ 18
Part 2: The environmental impact of food products ..........................................26 Basic carbohydrate foods................................................................................................................ 29 Summary ........................................................................................................................................ 29 Fruit & vegetables ........................................................................................................................... 44 Summary ........................................................................................................................................ 44 Dairy products ................................................................................................................................. 60 Summary ........................................................................................................................................ 60 Meat products ................................................................................................................................. 82 Summary ........................................................................................................................................ 82 Fish and other basic protein foods.................................................................................................. 99 Summary ........................................................................................................................................ 99 Drinks (alcoholic and non-alcoholic) ............................................................................................. 110 Summary ...................................................................................................................................... 110 Mixed products, snacks and other items....................................................................................... 126 Summary ...................................................................................................................................... 126
Part 3: Conclusions and recommendations .....................................................136
Annex 1: Trolley selection..................................................................................147
Annex 2: Life Cycle Assessment and food .......................................................157 Introduction to LCA....................................................................................................................... 157 Elements of LCA........................................................................................................................... 158 LCA results ................................................................................................................................... 161 Food product systems .................................................................................................................. 162 Applying LCA to food products..................................................................................................... 165
Annex 3: The environmental impacts of food in the home..............................171 Transport to the home .................................................................................................................. 171 Storage ......................................................................................................................................... 172 Preparation ................................................................................................................................... 174 Wastage ....................................................................................................................................... 176
Annex 4: CML normalisation factors for Western Europe...............................178
References...........................................................................................................179
3

List of Tables
Table 1: Summary of main findings by food type................................................................................ 12 Table 2: Products investigated............................................................................................................ 22 Table 3: Comparison of a major multiple’s – top 150 ‘Stock-Keeping Units’ (SKUs) with products
included in this project ................................................................................................................. 23 Table 4: Environmental impacts of potato production per kg.............................................................. 36 Table 5: Breakdown of energy use in main crop potato production ................................................... 37 Table 6: Primary energy requirements for different stages of the life cycle for domestically-produced and
imported apples ........................................................................................................................... 47 Table 7: Land needed to grow 1 t of tomato types, m2 ....................................................................... 53 Table 8: Primary energy demand for different milk production methods ............................................ 67 Table 9: Averaged environmental burdens from organic and conventional milk production .............. 68 Table 10: Resource use in multi-product dairies................................................................................. 77 Table 11: Energy consumption for dairy products .............................................................................. 80 Table 12: Environmental impacts of sheep meat production, per kg.................................................. 87 Table 13: Environmental impacts of pig meat production, per kg....................................................... 88 Table 14: Averaged environmental impacts from poultry production.................................................. 93 Table 15: Inputs to and outputs from UK broiler-raising for one year................................................. 94 Table 16: Breakdown of feeds fed to chickens, ktonne per annum.................................................... 95 Table 17: Broiler processing industry: one year’s inputs and outputs ................................................ 96 Table 18: Total energy and mass flows for UK chicken industry........................................................ 98 Table 19: Environmental impacts associated with egg production................................................... 107 Table 20: Environmental burdens associated with chicken meat and eggs ..................................... 108 Table 21: Environmental burdens for production of selected grain crops ........................................ 113 Table 22: Variations in ingredient sources for frozen lasagne.......................................................... 134 Table 23: Summary of main findings by food type............................................................................ 139
Annexes Table A 1: Food items and classification – preliminary selection ..................................................... 152 Table A 2: Energy use for cooking various foods ............................................................................. 174
4
List of Figures
Figure 1: Product systems and the environment ................................................................................ 24 Figure 2: Eutrophication impacts in the life cycle of bread ................................................................. 31 Figure 3: Global warming impacts in the life cycle of bread ............................................................... 32 Figure 4: Acidification impacts in the life cycle of bread ..................................................................... 33 Figure 5: Total energy use in the life cycle of bread ........................................................................... 33 Figure 6: Photo-oxidant formation in the life cycle of bread................................................................ 34 Figure 7: Energy demand around the life cycle of the potato ............................................................. 37 Figure 8: Energy demand for storage and cooling in the life cycle of the potato................................ 38 Figure 9: Climate change impact around the life cycle of the potato.................................................. 38 Figure 10: Photochemical ozone creation potential (organic potatoes).............................................. 39 Figure 11: Acidification potential (organic potatoes)........................................................................... 39 Figure 12: Energy use in the life cycle of spaghetti ............................................................................ 42 Figure 13: Energy use in the life cycle of fresh pasta ......................................................................... 42 Figure 14: Global warming potentials, carrots in different formats ..................................................... 49 Figure 15: Life cycle environmental impacts of carrots in different formats........................................ 51 Figure 16: Flowchart of tomato ketchup life cycle............................................................................... 56 Figure 17: Greenhouse gas impacts (tomato ketchup)....................................................................... 57 Figure 18: Energy inputs in the life cycle of tomato ketchup .............................................................. 58 Figure 19: Energy consumption across the conventional milk production and consumption system. 62 Figure 20: Energy consumption across the yoghurt production and consumption system ................ 72 Figure 21: Primary energy consumption across the cheese production and consumption system.... 75 Figure 22: Energy consumption across the ice cream production and consumption system............. 78 Figure 23: Energy consumption across the butter production and consumption system ................... 81 Figure 24: Primary energy used around the life cycle of beef ............................................................ 84 Figure 25: Global warming impacts in the life cycle of pork................................................................ 90 Figure 26: Global warming impacts in the life cycle of pork................................................................ 91 Figure 27: Total energy use in the life cycle of pork ........................................................................... 91 Figure 28: Global warming impact of chicken meat at different points in the life cycle ...................... 98 Figure 29: Primary energy use around the life cycle of fish fingers .................................................. 100 Figure 30: Climate change impact around the life cycle of fish fingers ............................................ 101 Figure 31: Delivered energy in each life cycle phase of a frozen cod fillet....................................... 101 Figure 32: Primary energy use around the life cycle of fish fingers, high household energy use .... 102 Figure 33: Climate change impact around the life cycle of fish fingers, high household energy use102 Figure 34: Primary energy use around the life cycle of fresh/chilled salmon ................................... 106 Figure 35: Contribution of beer production subsystems to climate change potential ....................... 112 Figure 36: Environmental indicators across a range of plant oils ..................................................... 128 Figure 37: Energy consumption across the standard 80% margarine production and consumption
system........................................................................................................................................ 130 Figure 38: Energy consumption across the low fat 38% margarine production and consumption system
................................................................................................................................................... 130Figure 39: Eutrophication across fat production and consumption systems .................................... 131
Annexes Figure A 1: A unit process with associated flows.............................................................................. 160 Figure A 2: Route to market for a simple low-process food product (e.g. new potato)..................... 163 Figure A 3: Route to market for a simple medium-processed food product (e.g. bread) ................. 163 Figure A 4: Route to market for a complex, highly-processed food product (e.g. ready meal) ........ 163 Figure A 5: Product system for vegetable purchases ....................................................................... 168 Figure A 6: Product system for meat purchases............................................................................... 169
5

Glossary
Abiotic resource depletion
Abiotic resource depletion is the depletion of non-renewable resources such as oil, coal and metals due to their extraction and consumption.
BAT reference documents (BREFs)
BREFs are designed to demonstrate best available techniques (BAT) for each sector covered by IPPC. It should be noted that where UK Technical Guidance exists for a sector, this should be used as the main reference document for demonstration of BAT, with the BREF providing supplementary information where appropriate. The reference documents are produced following a set BREF outline and guide as agreed with DG Environment and the IEF which gives important foundations for the understanding of best available techniques reference documents (BREFs).
Biodiversity
Biodiversity is the variety of life: the different plants, animals and micro-organisms, their genes and the ecosystems of which they are a part.
Biomass
Plant-derived material, which can be converted to fuels, chemicals, materials and power, so as to reduce dependence on oil. Biomass is one of our most important energy resources.
Cumulative Energy Requirements Analysis (CERA)
CERA is used to quantify the primary energy requirement for products and services in a life-cycle perspective. It was developed to consider the upstream energy flows when optimizing production processes. The cumulative energy requirement indicates a basic environmental pressure associated with the use of energy. Similar to material intensity the energy intensity can not be used to quantify specific environmental pressures (e.g. ozone depletion) rather than a generic pressure. The primary energy requirements are measured in Joules and aggregated into one number. Interpreting lower values as being associated with less environmental burden is only justified if the relative share of the energy carriers will not be changed towards more hazardous ones. CERA can be used to: quantify the energy intensity of products, services and national economies; analyse options for energy savings in industry; provide energy input coefficients for base materials to support engineering and design of products.
DEFRA Department for Environment, Food and Rural Affairs EA Environment Agency
6
Eco-indicator 99
The Eco-indicator 99 is a "damage oriented" impact assessment method for LCA, with many conceptual breakthroughs. The method is also the basis for the calculation of eco-indicator scores for materials and processes. Features of the impact assessment method: A completely "top-down" impact assessment method with clearly detailed steps such as Fate Exposure Effect Damage analysis Resource depletion, land use and radiation are included Uncertainties calculated for the majority of damage factors Normalization and default weighting data are given
Three different "perspectives" are available, allowing different assumptions on time horizon, manageability etc. Only three damage categories (endpoints) are to be weighted. This allows for easy stakeholder involvement with the help of the weighting triangle. The methodology is highly compatible with ISO 14042 requirements. (PRé Consultants bv • Plotterweg 12 • 3821 BB Amersfoort • The Netherlands)
Ecopoints
Ecopoints is a unit-less measure of the overall environmental impact of a particular product or process. One example of its application is in the Building Research Establishment’s own Life Cycle Impact Assessment method. In this, the annual environmental impact caused by a typical UK citizen creates 100 Ecopoints. More Ecopoints indicate higher environmental impact. The environmental impacts considered are: Climate change, Fossil fuel depletion, Ozone depletion, Freight transport, Human toxicity to air, Human toxicity to water, Waste disposal, Water extraction, Acid deposition, Ecotoxicity, Eutrophication, Summer smog, Minerals extraction.
Ecotoxicity One environmental theme in Life Cycle Impact Assessment which indicates the impact of substances released from the product system which cause direct harm to flora and fauna. In the method developed by the Centre for Environmental Sciences, Leiden University, it is expressed in units of kg 1,4, dicholorobenzene equivalents. Freshwater, marine and terrestrial ecotoxicity are sometimes calculated separately.
7
EIPRO
Environmental Impact of PROducts “The largest ever analysis of environmental impacts of different product groupings across the European economy” The EIPRO study was heralded in the press release announcing its publication as “a key foundation stone for the European Union's integrated product policy (IPP)”.
Eutrophication
Eutrophication is a process whereby water bodies, such as lakes, estuaries, or slow-moving streams receive excess nutrients that stimulate excessive plant growth (algae, periphyton attached algae, and nuisance plants weeds). This enhanced plant growth, often called an algal bloom, reduces dissolved oxygen in the water when dead plant material decomposes and can cause other organisms to die. Nutrients can come from many sources, such as fertilizers applied to agricultural fields, golf courses, and suburban lawns; deposition of nitrogen from the atmosphere; erosion of soil containing nutrients; and sewage treatment plant discharges. Water with a low concentration of dissolved oxygen is called hypoxic.
IPPC
Integrated Pollution Prevention and Control To prevent or minimise emissions to air, water and soil, as well as waste, from industrial and agricultural installations in the Community, with a view to supporting sustainability.
IPPC Directive
The EU has a set of common rules on permitting for industrial installations. These rules are set out in the so-called IPPC Directive of 1996. All installations covered by Annex I of the Directive are required to obtain an authorisation (permit) from the authorities in the EU countries. Unless they have a permit, they are not allowed to operate. The permits must be based on the concept of Best Available Techniques (or BAT), which is defined in Article 2 of the Directive. In many cases BAT means quite radical environmental improvements and sometimes it will be very costly for companies to adapt their plants to BAT. To impose new and considerably tougher BAT rules on all existing installations in the European Union could jeopardise many European jobs, and therefore the Directive grants these installations an eleven year long transition period counting from the day that the Directive entered into force.
Rebound Effect
A Rebound Effect (also called a Takeback Effect or Offsetting Behaviour) refers to increased consumption that results from actions that increase efficiency and reduce consumer costs (Musters, 1995; Alexander, 1997; Herring, 1998). For example, a home insulation program that reduces heat losses by 50% does not usually result in a full 50% reduction in energy consumption, because residents of insulated homes find that they can afford to keep their homes warmer. As a result, they reinvest a portion of potential energy savings on comfort. The difference between the 50% potential energy savings and the actual savings is the Rebound Effect. Transportation rebound effects include generated traffic that results from urban roadway capacity expansion, induced vehicle mileage
8

that results from increased fuel efficiency, and increased risk taking that occurs when drivers feel safer. These rebound effects often change the nature of benefits from congestion reduction, fuel efficiency, and traffic safety programs. It is important to consider these impacts in transportation project evaluation.
SCP
DEFRA’s “Sustainable Consumption and Production” Programme. The current project, reported here, is SCP research into the impacts of food production and consumption. DEFRA state that the principal purpose of this work is to enable DEFRA policy makers to have a more sophisticated, evidence-based conversation with the food industry on the environmental impacts of food products.
UNEP United Nations Environmental Programme Promotes environmental understanding, and increases public knowledge about environmental factors and problems of future generations.
9

Executive Summary
1. The overall context of the research project reported here has been to inform government policy development to reduce the environmental impacts of food consumed in the UK, within the context of the forthcoming Food Industry Sustainability Strategy, the Sustainable Food and Farming Strategy and DEFRA’s overall commitment to Sustainable Consumption and Production (SCP). In addition the project sought to provide the basis for development of information on more sustainable food choices, information that is also likely to be relevant to the food industry and public procurers.
2. The specific objectives of the project have been to determine what evidence is available relating to the environmental impacts that occur in the life cycles of a range of food products. The range includes both fresh and processed goods, organic and conventionally grown produce, locally-sourced and globally-sourced foods and takes account of different sources of nutrition. In addition, we have been seeking evidence on whether it is possible to identify the extent to which certain patterns of production, sourcing and distribution have a greater or lesser impact on the environment.
3. The methodological approach we have adopted is a “sampling” (or bottom-up) one, selecting a small number of products to represent overall food consumption. The sample we have taken is a “trolley” of food types representative of the foods on a list of 150 highest-selling items provided to us by one large retailer.
4. The review of evidence has focused on studies that use the technique of environmental Life Cycle Assessment (LCA) or closely related approaches. LCA studies the environmental impacts arising from the production, use and disposal of products, linking these to flows of substances between this “system” and the environment. LCA provides a mechanism for investigating and evaluating such impacts all the way from the extraction of basic materials from nature, through material and component production, assembly, distribution, product use and end-of-life management (which may be disposal, reuse, recycling or recovery). LCA considers impacts on all environmental media – air, water and land. In addition to LCA studies, the report draws on the results
of the “top-down” analysis of the environmental impacts of consumption by product contained in the recent EIPRO project; specific data about a number of food processing activities in the UK drawn from applications for Pollution Prevention and Control permits from larger food processors in Yorkshire and the North East of England.
5. In Part 2 of the Report, we analyse in detail the evidence available for environmental impacts that arise from the life cycles of these commonly-consumed food products: Basic carbohydrate foods, Fruit & vegetables, Dairy products, Meat products, Fish and other basic protein foods, Drinks (alcoholic and non-alcoholic), Mixed products, snacks and other items. For each food type, we review the evidence on individual foods (e.g. for Dairy products, we review evidence on milk, butter, yogurt and ice-cream) and summarise the main points of the evidence.
6. An Overall Summary of the main points emerging from the evidence about these foods is presented in Table 1 on the following pages.
11
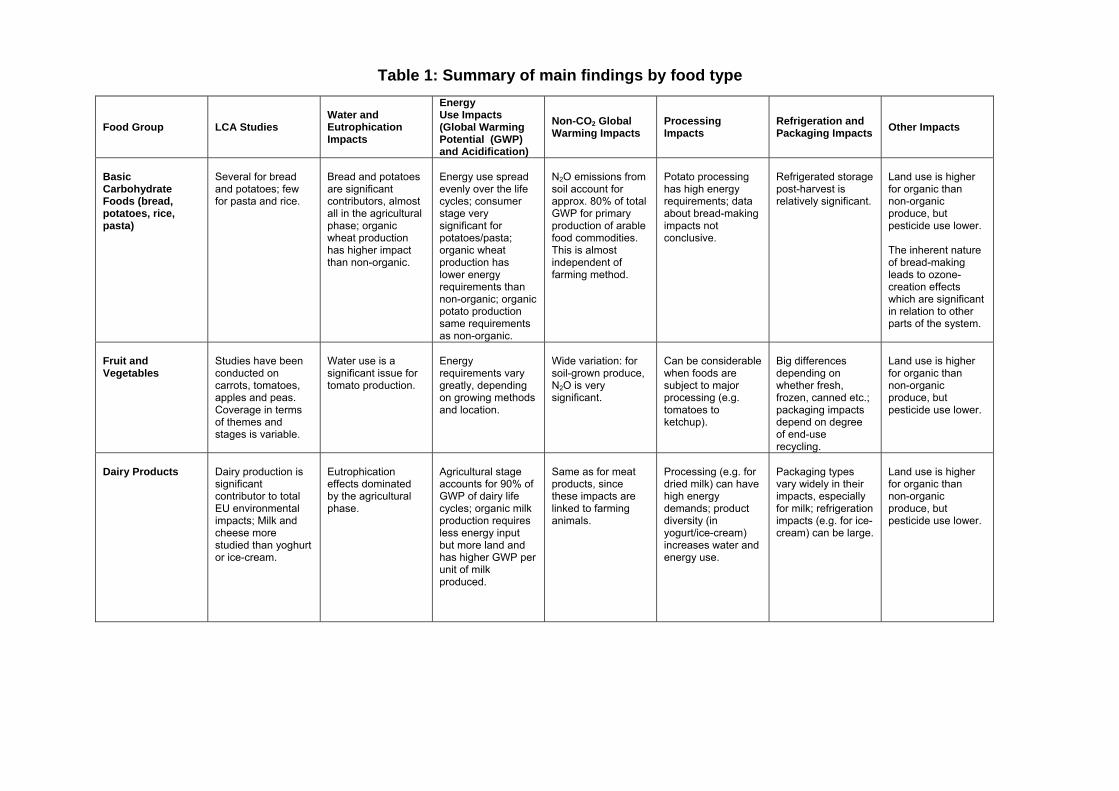
Table 1: Summary of main findings by food type
Food Group LCA StudiesWater and Eutrophication Impacts
Energy Use Impacts (Global Warming Potential (GWP) and Acidification)
Non-CO2 Global Warming Impacts
Processing Impacts
Refrigeration and Packaging Impacts Other Impacts
Basic Carbohydrate Foods (bread, potatoes, rice, pasta)
Several for bread and potatoes; few for pasta and rice.
Bread and potatoes are significant contributors, almost all in the agricultural phase; organic wheat production has higher impact than non-organic.
Energy use spread evenly over the life cycles; consumer stage very significant for potatoes/pasta; organic wheat production has lower energy requirements than non-organic; organic potato production same requirements as non-organic.
N2O emissions from soil account for approx. 80% of total GWP for primary production of arable food commodities. This is almost independent of farming method.
Potato processing has high energy requirements; data about bread-making impacts not conclusive.
Refrigerated storage post-harvest is relatively significant.
Land use is higher for organic than non-organic produce, but pesticide use lower. The inherent nature of bread-making leads to ozone-creation effects which are significant in relation to other parts of the system.
Fruit and Vegetables
Studies have been conducted on carrots, tomatoes, apples and peas. Coverage in terms of themes and stages is variable.
Water use is a significant issue for tomato production.
Energy requirements vary greatly, depending on growing methods and location.
Wide variation: for soil-grown produce, N2O is very significant.
Can be considerable when foods are subject to major processing (e.g. tomatoes to ketchup).
Big differences depending on whether fresh, frozen, canned etc.; packaging impacts depend on degree of end-use recycling.
Land use is higher for organic than non-organic produce, but pesticide use lower.
Dairy Products
Dairy production is significant contributor to total EU environmental impacts; Milk and cheese more studied than yoghurt or ice-cream.
Eutrophication effects dominated by the agricultural phase.
Agricultural stage accounts for 90% of GWP of dairy life cycles; organic milk production requires less energy input but more land and has higher GWP per unit of milk produced.
Same as for meat products, since these impacts are linked to farming animals.
Processing (e.g. for dried milk) can have high energy demands; product diversity (in yogurt/ice-cream) increases water and energy use.
Packaging types vary widely in their impacts, especially for milk; refrigeration impacts (e.g. for ice-cream) can be large.
Land use is higher for organic than non-organic produce, but pesticide use lower.

13
Table 1 continued
Food Group LCA Studies Water and Eutrophication Impacts
Energy Use Impacts (Global Warming Potential (GWP) and Acidification)
Non-CO2 Global Warming Impacts
Processing Impacts
Refrigeration and Packaging Impacts Other Impacts
Meat Products (beef, lamb, pork, poultry)
Relative to other foods, there are considerable data available on the agricultural stage but few on the whole life cycle.
High energy inputs for all meats – beef highest, then sheep meat, pork and poultry; production of feeds is the largest contributor to these inputs; organic production inputs lower for beef/sheep/pork, but higher for poultry.
Animal methane emissions and N2O emissions from soil used for feed or forage production and more significant than energy inputs for total GWP: little difference in these between farming methods.
For chicken, energy and water impacts from processing as significant as impacts in chicken-rearing.
Additional impacts associated with frozen meat (significant for chicken, few data for others). Little evidence about processing significance in more highly-processed products.
Land use is higher for organic than non-organic produce, but pesticide use lower.
Fish and other basic protein foods (eggs, legumes)
Some studies on fish production and processing; no coverage in LCA of impacts on stocks or marine ecosystems.
Fishing is the dominant source of GWP in the life cycle, due to fuel usage; but there are different impacts from different fishing methods.
Energy use across life cycle of processed frozen fish reveals importance of consumers’ role.
Legumes are a more energy-efficient way of providing edible protein than red meat.
Drinks (alcoholic and non-alcoholic)
Few LCA studies, with conflicting results.
Water use an (obviously) important impact.
Production phase of many drinks (esp. beer) has GWP equal to that of barley and hop growing; bottled water associated with higher GWP than tap water.
Energy used in refrigeration (esp. for drinks storage in the hospitality sector) may be an important impact.
Mixed Products and Snacks
There are very few studies of ‘mixed’ or highly-processed foods (e.g. ready-to-cook pizzas).
Overall, our review of the evidence has made it clear that environmental impacts arising across the entire life-cycle (including consumer activities and waste disposal) have been studied in detail for very few basic foods and even fewer processed foods. The bulk of the research that has been carried out has focused on primary production, sometimes extended to cover processing. There are few studies taking account of the specific food system within the UK.
7. There are numerous studies of food impacts from other individual European countries, especially from Scandinavian ones, and it is possible to draw conclusions from them that are reasonably applicable to the UK situation. However, it is necessary to be cautious given that the systems of food production and consumption have strong national specificities.
8. There are some considerable inconsistencies in the data that we have found, from whatever country. For example, few studies cover the entire ‘farm to fork’ life cycle; there is a strong leaning to the ‘farm’ end, with a preponderance of analyses of the environmental impacts of agricultural production, ending at the farm gate. In addition, there is limited consistency regarding the actual impacts that are measured. Almost all studies cover energy use and, explicitly or implicitly therefore, CO2 emissions: most cover non-CO2 greenhouse gas emissions as well. Many studies cover eutrophication effects but impacts on water resources are seldom included despite the fact that food production and processing accounts for the majority of water use globally.
9. Despite all the deficiencies in the data and the qualifications that are needed in applying it to specific foods and food types in the UK, some general conclusions emerge:
◦ ‘Organic’ vs. ‘conventionally-grown’ foods: There is no doubt that, for many foods, the environmental impacts of organic agriculture are lower than for the equivalent conventionally-grown food. This would be especially the case if those impacts not well handled by LCA methods (e.g. biodiversity or landscape aesthetics) were to be taken into consideration. However, it is not true for all foods and appears seldom to be true for all classes of environmental impact. There is insufficient evidence available to state that organic agriculture overall would have less of an environmental impact than conventional agriculture. In particular, from the data we have
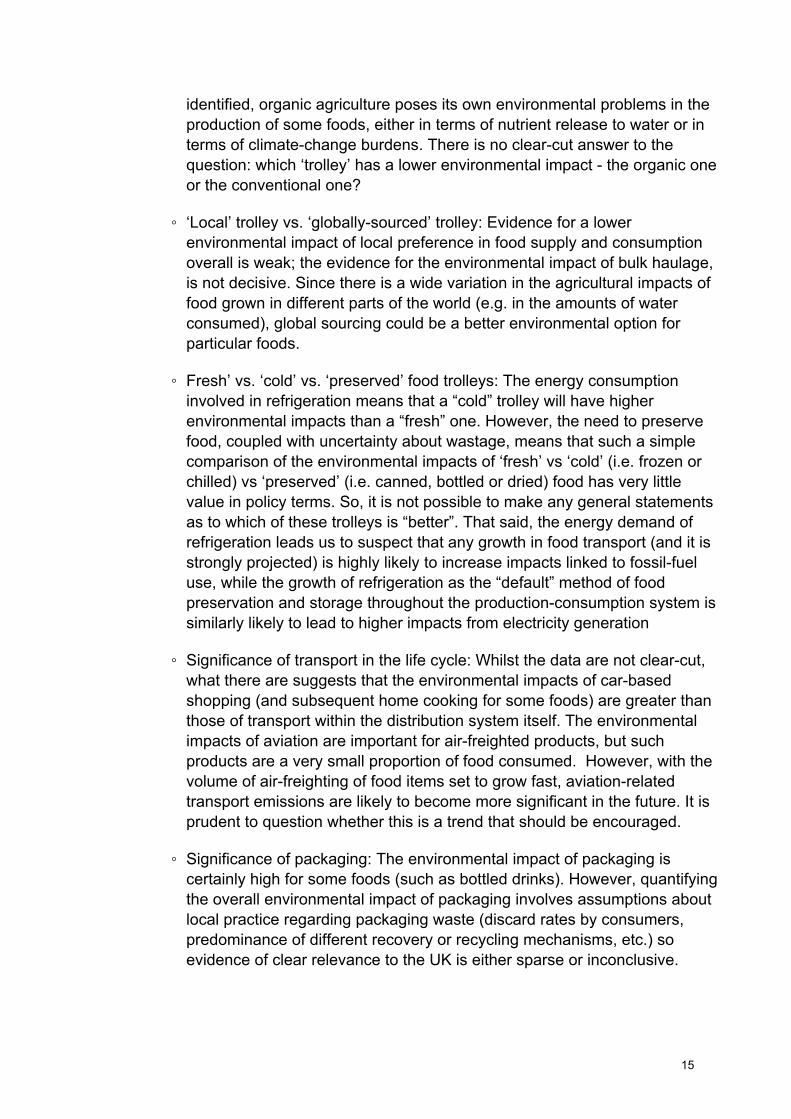
identified, organic agriculture poses its own environmental problems in the production of some foods, either in terms of nutrient release to water or in terms of climate-change burdens. There is no clear-cut answer to the question: which ‘trolley’ has a lower environmental impact - the organic one or the conventional one?
◦ ‘Local’ trolley vs. ‘globally-sourced’ trolley: Evidence for a lower environmental impact of local preference in food supply and consumption overall is weak; the evidence for the environmental impact of bulk haulage, is not decisive. Since there is a wide variation in the agricultural impacts of food grown in different parts of the world (e.g. in the amounts of water consumed), global sourcing could be a better environmental option for particular foods.
◦ Fresh’ vs. ‘cold’ vs. ‘preserved’ food trolleys: The energy consumption involved in refrigeration means that a “cold” trolley will have higher environmental impacts than a “fresh” one. However, the need to preserve food, coupled with uncertainty about wastage, means that such a simple comparison of the environmental impacts of ‘fresh’ vs ‘cold’ (i.e. frozen or chilled) vs ‘preserved’ (i.e. canned, bottled or dried) food has very little value in policy terms. So, it is not possible to make any general statements as to which of these trolleys is “better”. That said, the energy demand of refrigeration leads us to suspect that any growth in food transport (and it is strongly projected) is highly likely to increase impacts linked to fossil-fuel use, while the growth of refrigeration as the “default” method of food preservation and storage throughout the production-consumption system is similarly likely to lead to higher impacts from electricity generation
◦ Significance of transport in the life cycle: Whilst the data are not clear-cut, what there are suggests that the environmental impacts of car-based shopping (and subsequent home cooking for some foods) are greater than those of transport within the distribution system itself. The environmental impacts of aviation are important for air-freighted products, but such products are a very small proportion of food consumed. However, with the volume of air-freighting of food items set to grow fast, aviation-related transport emissions are likely to become more significant in the future. It is prudent to question whether this is a trend that should be encouraged.
◦ Significance of packaging: The environmental impact of packaging is certainly high for some foods (such as bottled drinks). However, quantifying the overall environmental impact of packaging involves assumptions about local practice regarding packaging waste (discard rates by consumers, predominance of different recovery or recycling mechanisms, etc.) so evidence of clear relevance to the UK is either sparse or inconclusive.
15

10. To fill the gaps we suggest a programme of further work after consultation with food lifecycle stakeholders. Possible projects to provide more substantial evidence would include:
◦ Further LCA studies of food products
◦ Comparative studies of the environmental impacts of food production in different countries
◦ A UK-oriented version of the “Swedish meatballs” study
◦ The study of the environmental impacts of the foodservice sector
◦ Studies of the actual behaviour of consumers with respect to different food products
◦ A review of data contained in IPPC permit applications from food sector installations
◦ Further study of the environmental impacts of different food logistics systems
◦ Future trends analysed through scenario studies
16
Part 1: Introduction
Aims & Objectives
This Report records the results of a research project whose aims have been:
• To inform government policy development to reduce the environmental impacts of food consumed in the UK, within the context of the forthcoming Food Industry Sustainability Strategy, the Sustainable Food and Farming Strategy and DEFRA’s overall commitment to Sustainable Consumption and Production (SCP).
• To provide the basis for development of information on more sustainable food choices. The information is also likely to be relevant to the food industry and public procurers.
Its specific objectives have been:
• To determine what evidence is available relating to the environmental impacts that occur in the life cycle of a product or product type, including consideration of fresh and processed goods, organic and conventionally grown produce, local and globally-sourced foods and comparing different sources of nutrition.
• To determine whether it is possible to identify the extent to which certain patterns of production, sourcing and distribution have a greater or lesser impact on the environment.
• To outline what level of environmental impact existing trends in food supply and consumption are likely to have in the future and to consider the extent to which lifestyle changes, which may be occurring for other reasons, may affect the environmental impacts of food consumption.
Almost all the Report deals with the first two objectives. Whilst there is some speculative literature concerning trends in food supply/consumption and life-style changes, there is insufficient to make little more than suggestions of the issues such trends and changes might suggest. We make further reference to this in the Conclusion to the Report.
17
Method
The justification for the selection of a methodological approach for this project is discussed in detail in the Interim Report.1 In short, we have adopted a “sampling” (or bottom-up) approach for this preliminary evaluation of the environmental impacts of food consumption in the UK, selecting a small number of products to represent overall food consumption. We chose this approach for a number of reasons, including:
• Recognition that there is little previous work available for review that reflects the application of hybrid or I-O LCA to the UK food sector2.
• The fact that products, rather than countries or regions, are intended to be the focus of the work.
• The sampling approach affords an opportunity to pull together a body of work about the environmental impact of food items that are known to have been the subject of some previous assessment.
• The sampling approach also reflects the mechanism used to track changing consumer prices (one element of the economic dimension of sustainability) over time.
Once a research method involving some kind of sample was chosen, a means of selecting the sample was needed. In this case the sample is a basket of goods (referred to as “the trolley”, to reflect the current technologies of supermarket shopping): the selection of the trolley contents is described in more detail in Annex 1.
Evaluating the environmental impact of entire food production-consumption systems is a relatively recent research activity, so the selection of food items for this trolley, and the analysis presented in Part 2 of this report, has perforce been shaped by practical considerations as much as by the needs of academic rigour.
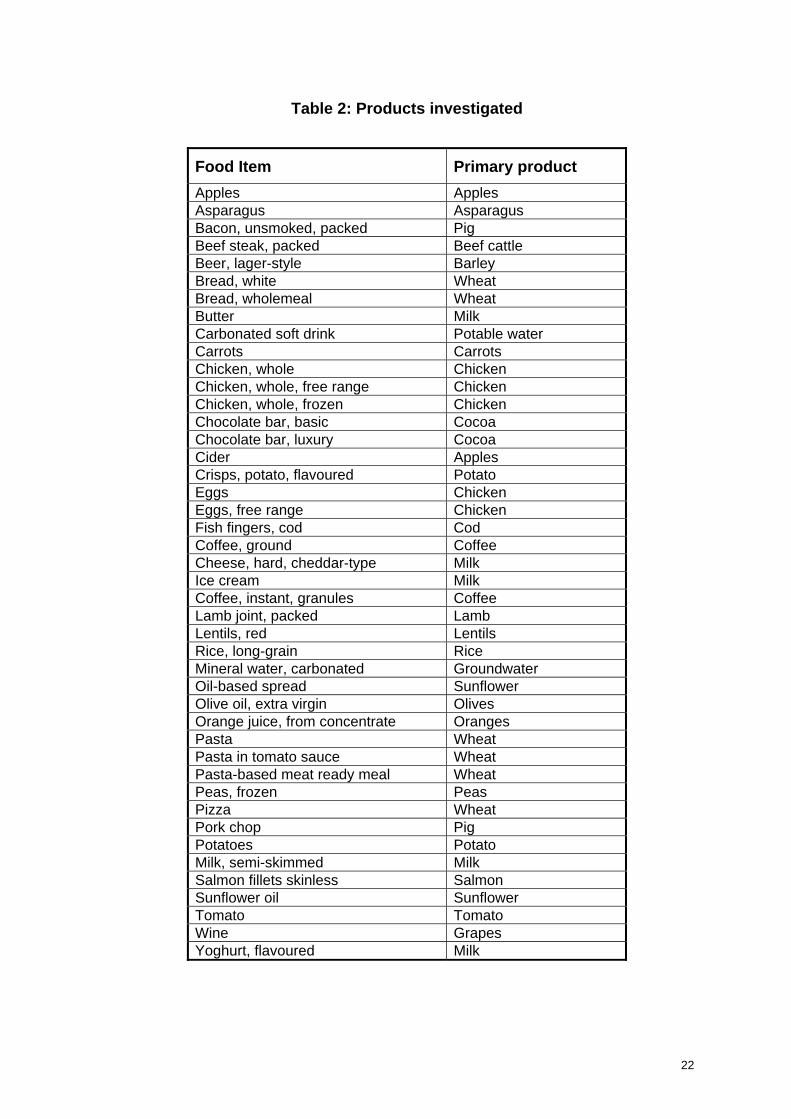
The products selected for further investigation are listed in Table 2 (p22). As Table 3 (p23) indicates, the items on this list are representative of the foods on a list of 150
1 C. Foster et al., SCP Evidence Base: Impacts of Food Production and Consumption, Interim Report, DEFRA, January 2006 2 Such studies have been carried out for other European countries, and for Europe as a whole in the EIPRO study which is part of the European Commission’s Integrated Product Policy (IPP) research programme. Several national studies as well as the EU-wide work are described in Tukker et al 2005. A study that took this approach to the analysis of the UK’s greenhouse gas emissions was published during the compilation of this report (Carbon Trust 2006)
18

highest-selling items provided to us by one retailer - with the exception of some items included in the “trolley” for this project for particular reasons.
This review has focused on evidence in the form of studies that use the technique of environmental Life Cycle Assessment (LCA) or closely related approaches. LCA is not the only method available for assessing the environmental impacts associated with production-consumption systems. Ecological footprinting (for example the work of Collins, Flynn & Netherwood (2005) on food consumption in Cardiff) and the financial valuation of environmental externalities exemplified by the “ExternE” study of energy systems, and in the context of food by the work of Pretty et al (2005) are two other approaches. Although we have drawn on such work to a limited extent, an extensive review of research using these methods was beyond the agreed scope of this project.
Figure 1. Product systems and the environment Source: Chris Foster
LCA studies the environmental impacts arising from the production, use and disposal of products, linking these to flows of substances between this “system” and the environment (see Figure 1). However, applying LCA to food production-consumption systems is not entirely straightforward. The focus on quantifiable flows as the source of environmental impacts makes modelling easier for some impacts than others. The most widely-used Impact Assessment methods in LCA cover: climate change arising from greenhouse gas emissions, acidification from acid gas emissions, eutrophication as a result of nutrifying emissions (such as nitrate, ammoniacal nitrogen and phosphates), the effect on low-level air quality of the release of ozone precursors, the effect on stratospheric ozone of the release of ozone-depleting substances, and abiotic and biotic
19
resource depletion. Methods exist to assess toxic releases from systems in terms of both aquatic and terrestrial ecotoxicity, and human toxicity; however, for a variety of reasons, these are less widely applied and the results of them seldom quoted in academic studies. Assessment methods are under development - within the scope of the UNEP-SETAC Life Cycle Initiative - for the evaluation of environmental impacts associated with water consumption and land use impacts, but no method for either is in widespread use. (The challenges that arise for the LCA method are discussed in more depth in Annex 2.) It is important to point out to the reader that LCA methods do not normally assess some well-recognised environmental effects of primary food production activities. In particular, biodiversity and the effects of different agricultural practices on the landscape are not addressed, and water use (particularly its local impact) is dealt with rather simplistically when it is included at all. Though some work is underway to address some of these aspects, we would suggest that their absence does not make LCA inapplicable to food products, but it does reinforce the notion that LCA is not (as no other decision-support tool is either) the only assessment method needed to fully evaluate the environmental impacts of food production and consumption.
The food-by-food review that follows in Part 2 of this report draws on a number of sources including: LCA studies of individual food items; the results of the “top-down” analysis of the environmental impacts of consumption by product contained in the recent EIPRO project; specific data about a number of food processing activities in the UK drawn from applications for Pollution Prevention and Control permits from larger food processors in Yorkshire and the North East of England. The quantification of the environmental impacts of consumer activities (shopping, food preparation and cooking, dishwashing, wastage) is particularly difficult at a product-specific level: not only is there a paucity of research, but there are real methodological challenges (for example: is the environmental impact associated with bringing 1kg of pasta home from the supermarket in a car as part of 10kg of shopping, 10% of the total fuel and emissions associated with the journey, or 100% of that total since the fuels used and associated emissions will be roughly the same whether the car has 1kg or 30kg of shopping in it?). Researchers who have investigated the environmental impacts associated with consumer activities (Pretty et al., Carlsson-Kanyama and Boström-Carlsson, Sonesson et al.) find them to be of considerable significance. We have therefore drawn on these sources to make some estimates of consumer-stage impacts for individual foods (see Annex 3 p171) for further details). The potential for further work in this area is discussed in Part 3 (p136). Packaging systems have been studied extensively using LCA techniques, sometimes in studies encompassing parallel economic assessments. The Danish Environmental Protection Agency’s “Miljøprojekt 399” in 1997-8 (Ekvall et al, 1998), a life-cycle based cost-benefit analysis of various packaging management options (RDC Environment /
20
PIRA, 2003) and work done on reuse systems in EC study contract B4-3040/98/000180/MAR/E3 (Golding, n.d) are all of particular relevance to food packaging
LCA provides a mechanism for investigating and evaluating such impacts all the way from the extraction of basic materials from nature, through material and component production, assembly, distribution, product use and end-of-life management (which may be disposal, reuse, recycling or recovery). LCA considers impacts on all environmental media – air, water and land. This “holistic, system-wide” view is one of the principal benefits of LCA.
21
22
Table 2: Products investigated
Food Item Primary product Apples Apples Asparagus Asparagus Bacon, unsmoked, packed Pig Beef steak, packed Beef cattle Beer, lager-style Barley Bread, white Wheat Bread, wholemeal Wheat Butter Milk Carbonated soft drink Potable water Carrots Carrots Chicken, whole Chicken Chicken, whole, free range Chicken Chicken, whole, frozen Chicken Chocolate bar, basic Cocoa Chocolate bar, luxury Cocoa Cider Apples Crisps, potato, flavoured Potato Eggs Chicken Eggs, free range Chicken Fish fingers, cod Cod Coffee, ground Coffee Cheese, hard, cheddar-type Milk Ice cream Milk Coffee, instant, granules Coffee Lamb joint, packed Lamb Lentils, red Lentils Rice, long-grain Rice Mineral water, carbonated Groundwater Oil-based spread Sunflower Olive oil, extra virgin Olives Orange juice, from concentrate Oranges Pasta Wheat Pasta in tomato sauce Wheat Pasta-based meat ready meal Wheat Peas, frozen Peas Pizza Wheat Pork chop Pig Potatoes Potato Milk, semi-skimmed Milk Salmon fillets skinless Salmon Sunflower oil Sunflower Tomato Tomato Wine Grapes Yoghurt, flavoured Milk

23
Table 3: Comparison of a major multiple’s – top 150 ‘Stock-Keeping Units’ (SKUs) with products included in this project
Major Retailer Top 150 lines
Category Number SKUs %
Products Considered in this Project
Meat 35 24%
Beef Lamb Pork Chicken – conventional, free range, frozen
Fruit 24 16% Apples
Vegetables 15 10%
Potatoes Chips Carrots Peas (frozen)
Produce 14 9% Tomatoes Tomato Ketchup
Milk 11 7% Milk
Dairy 10 7%
Butter Cheese Yoghurt Ice Cream
Bread 9 6% Bread
Miscellaneous 7 5%
Olive oil Sunflower oil Oil-based spread Pizza Lentils Pasta-based processed food
Eggs 6 4% Eggs
Fish 5 3% Cod fish fingers Salmon fillets
Juice 5 3% Orange juice
Confectionery 3 2% Chocolate bars
Drinks Non Alcoholic Alcoholic
3 -
2% -
Carbonated soft drink Mineral water Coffee Beer Wine
Cereal 2 1% Pasta Rice
Snacks 1 1%
TOTAL 150 100% 35 Products
However, applying LCA to food production-consumption systems is not entirely straightforward. The focus on quantifiable flows as the source of environmental impacts makes modelling easier for some impacts than others. The most widely-used Impact Assessment methods in LCA cover: climate change arising from greenhouse gas emissions, acidification from acid gas emissions, eutrophication as a result of nutrifying emissions (such as nitrate, ammoniacal nitrogen and phosphates), the effect on low-level air quality of the release of ozone precursors, the effect on stratospheric ozone of the release of ozone-depleting substances, and abiotic and biotic resource depletion. Methods exist to assess toxic releases from systems in terms of both aquatic and terrestrial ecotoxicity, and human toxicity; however, for a variety of reasons, these are less widely applied and the results of them seldom quoted in academic studies. Assessment methods are under development - within the scope of the UNEP-SETAC Life Cycle Initiative - for the evaluation of environmental impacts associated with water consumption and land use impacts, but no method for either is in widespread use. (The challenges that arise for the LCA method are discussed in more depth in Annex 2.) It is important to point out to the reader that LCA methods do not normally assess some well-recognised environmental effects of primary food production activities. In particular, biodiversity and the effects of different agricultural practices on the landscape are not addressed, and water use (particularly its local impact) is dealt with rather simplistically when it is included at all. Though some work is underway to address some of these aspects, we would suggest that their absence does not make LCA inapplicable to food products, but it does reinforce the notion that LCA is not (as no other decision-support tool is either) the only assessment method needed to fully evaluate the environmental impacts of food production and consumption.
The food-by-food review that follows in Part 2 of this report draws on a number of sources including: LCA studies of individual food items; the results of the “top-down” analysis of the environmental impacts of consumption by product contained in the recent EIPRO project; specific data about a number of food processing activities in the UK drawn from applications for Pollution Prevention and Control permits from larger food processors in Yorkshire and the North East of England. The quantification of the environmental impacts of consumer activities (shopping, food preparation and cooking, dishwashing, wastage) is particularly difficult at a product-specific level: not only is there a paucity of research, but there are real methodological challenges (for example: is the environmental impact associated with bringing 1kg of pasta home from the supermarket in a car as part of 10kg of shopping, 10% of the total fuel and emissions associated with the journey, or 100% of that total since the fuels used and associated emissions will be roughly the same whether the car has 1kg or 30kg of shopping in it?). Researchers who have investigated the environmental impacts associated with consumer activities (Pretty
24
et al., Carlsson-Kanyama and Boström-Carlsson, Sonesson et al.) find them to be of considerable significance. We have therefore drawn on these sources to make some estimates of consumer-stage impacts for individual foods (see Annex 3 p171) for further details). The potential for further work in this area is discussed in Part 3 (p136). Packaging systems have been studied extensively using LCA techniques, sometimes in studies encompassing parallel economic assessments. The Danish Environmental Protection Agency’s “Miljøprojekt 399” in 1997-8 (Ekvall et al, 1998), a life-cycle based cost-benefit analysis of various packaging management options (RDC Environment / PIRA, 2003) and work done on reuse systems in EC study contract B4-3040/98/000180/MAR/E3 (Golding, n.d) are all of particular relevance to food packaging
25

Part 2: The environmental impact of food products
There is general agreement that the production, processing, transport and consumption of food accounts for a significant portion of the environmental burden imposed by any Western European country.
According to the analysis of environmental impact by final consumption category carried out for the EIPRO project (Tukker et al., 2005), consumption and production of food, drink tobacco (and drugs) in the European Union (EU) account for:
31% of Europe’s global warming & acidification impacts
60% of its eutrophication3 impacts
27% of its photochemical ozone creation potential4
22% of its abiotic resource depletion
and
19% of its total expenditure
In this section of the Report, we look at the environmental impacts that arise from the life cycles of the commonly-consumed food products listed in Table 1 (p12). The data underlying this discussion, and the sources from which they were drawn, have been provided to DEFRA in electronic form. This section brings the foods from Table 1 together in groups that echo the classification used in the early stages of the project:
Basic carbohydrate foods
Other fruit & vegetables
Dairy products
Meat products
Fish and other basic protein foods
Drinks (alcoholic and non-alcoholic)
Mixed products and snacks
3 Eutrophication is the process of nutrient enrichment in the water environment. See glossary for further information 4 Photochemical ozone creation potential is a measure of emissions from a system of substances that contribute to the formation of low-level atmospheric ozone and hence to poor air quality
26
The results of the EIPRO project cast some light on the relative significance of some of these groups. These suggest that
Meat, poultry and related products account for some 12% of global warming potential across the EU, 24% of eutrophication potential and 10% of photochemical ozone creation potential
Milk and dairy products account for around 5% of global warming potential, 10% of eutrophication potential and 4% of photochemical ozone creation potential
Cereal, bread, flour and related products account for a little over 1% of both the EU’s global warming potential and photochemical ozone creation potential, and approximately 9% of its eutrophication potential
Fruit and vegetables (including frozen ones) account for approximately 2% each of the EU’s total global warming potential, eutrophication potential and photochemical ozone creation potential.
The EIPRO analysis does not provide much detail about exactly which activities in the life cycle give rise to these impacts. Life cycle assessments of single food products should however be able to provide this more detailed insight. The remainder of this section reviews the evidence provided by such studies. (Note that EIPRO does not associate the environmental impacts of operating domestic storage and cooking equipment with food products, but rather with the “white goods” themselves.)
Our literature survey has made it clear that environmental impacts arising across the entire life cycle (including consumer activities and waste disposal) have been studied in detail for very few basic foods and even fewer processed foods. The bulk of the research that has been carried out has focused on primary production, sometimes extended to cover processing. Therefore in several cases, to try to put the earlier parts of the chain in context, we have estimated environmental impacts arising from retailer and consumer activities and we present a synthesised view of the entire system. The assumptions underlying this endeavour are set out in Annex 3 (p171).
One consistent body of LCA work on food products is Swedish. While we have drawn on this work, readers should note that the fuel mix for Swedish electricity generation is significantly different from that used in the UK. According to Sonesson & Davis (2005), 94% of Swedish baseload electricity is derived from hydro and nuclear power stations. The effect of this is to make the environmental impact of electricity-intensive processes
27
(such as refrigeration) much less, as measured by the impact categories commonly used in LCA, in Sweden than they would be in the UK.
Meat, dairy and poultry products (or directly-connected activities) are among the 10 most significant contributors to the ecotoxicity impact category in the EIPRO analysis. However, in the course of the literature review, it was found that the presentation of results and discussion in most published reports of Life Cycle Assessments for food products focuses on energy consumption around the life cycle, the climate change implications of food production and consumption, and/or eutrophication impacts. The discussion in this review report can only reflect the background literature. Therefore the limited coverage here of other environmental impacts should not be taken as diminishing their importance, but rather indicative of the lack of data that are available to illuminate any links between individual impacts and particular products or groups of products.
The results of LCA studies are often reported in terms of equivalent quantities of reference substances, one for each of the different impacts covered (CO2 for climate change impacts, SO2 for acidification, ethene (C2H4) for Photochemical Ozone Creation Potential, etc.). To allow some benchmarking of the impacts calculated, normalization using total impacts for Western Europe or for an average European citizen can be used. The Normalisation Factors for Western Europe calculated by the Centre for Environmental Sciences at Leiden University (CML), where much development work on LCA has been conducted, are given in Annex 4 (p178).
28
Basic carbohydrate foods
Summary
• Although bread, potatoes, rice and pasta can be grouped together on the basis of their nutritional function, the activities that comprise their respective life cycles are very different.
• The environmental impacts associated with the production and consumption of bread and potatoes have each been the subject of several reported LCA studies. Pasta products have been less studied, while no such studies were identified for rice.
• According to the EIPRO results, bread and related products are most significant (environmentally) in terms of eutrophication, for which they contribute 3.3% of total impacts (9th largest single contribution). Potato products (as “potato chips and similar snacks”) are also identified as significant contributors to that theme by the EIPRO modelling.
• For both bread and potatoes, it is the agricultural stage of the life cycle that contributes most to eutrophication. For bread wheat, organic production is associated with much higher eutrophication impacts than conventional production, while for potatoes there is little difference between organic and conventional production for this impact category.
• Energy use is spread more evenly than eutrophication impacts around the life cycles for bread, potatoes and pasta. For potatoes and pasta, consumer actions (travelling to and from the shops by car, cooking) are significant in determining the total energy requirement around the whole life cycle and hence the scale of environmental impacts such as global warming potential and acidification.
• Organic wheat production has significantly lower energy requirements than conventional production but requires more land to produce the same amount of grain. Organic potato production, on the other hand, has very similar energy requirements to conventional production; cooling and storage5 account for around
5 Clearly cooling and storage are not strictly agricultural activities, but we have adopted the original researchers’ assignment of activities to different stages of the life cycle.
29

40% of primary energy in potato production, whether the crop is organic or non-organic.
• Bread-making is an example of a food transformation process which involves emissions that are significant for one environmental theme (in this case photochemical ozone creation potential from ethanol production).
• Limited data on the processing of potatoes into chips and flake suggests that the energy requirements of this may well be highly significant relative to the energy requirements of other activities in the potato life cycle. Data relating to potato processing illustrate the particularly high-energy inputs needed to dry many foodstuffs because of their high water content.
• Available data about the energy intensity of the bread-baking process is deemed to be of low relevance to the UK now, because of differences in the technologies used in different countries and the age of the UK–specific data.
Bread
Bread is consumed in the UK by 96% of the population on a frequent basis. Less than 1% is imported and only 2% exported (Lang, 2005; DEFRA, 2006). UK bread production covers large-scale plant-bakeries, in-store bakeries and craft bakeries. Plant-manufactured products account for around three-quarters of all bakery products sold in the UK (12 companies operating 59 plant bakeries produce around 80% of UK bread). The biggest three bakers (Allied, British Bakeries and Warburtons) account for 50% of plant bread market by value. In-store bakeries make the majority of the remainder, with less than 5% from craft bakeries (Federation of Bakers, 2005).
No complete life cycle analysis of bread for the UK has been found in the literature. A study by the Silsoe Research Institute (Williams et al 2006) commissioned by DEFRA has developed a life cycle analysis of alternative methods of production of several agricultural commodities in the UK that includes bread wheat. Audsley et al. (1997) have provided an analysis of different wheat production systems including a high input system under UK conditions. Complete life cycle analyses of bread products have been carried out in Sweden (Andersson and Ohlsson, 1999), Germany (Braschkat et al., 2003) and Denmark (LCA food database, 2000). All the studies identify the primary production (cultivation of wheat) and the transportation stages of the bread system as
30
being highly significant for most of the impact categories, and the processing stage (baking) particularly significant for photo-oxidant formation and energy use.
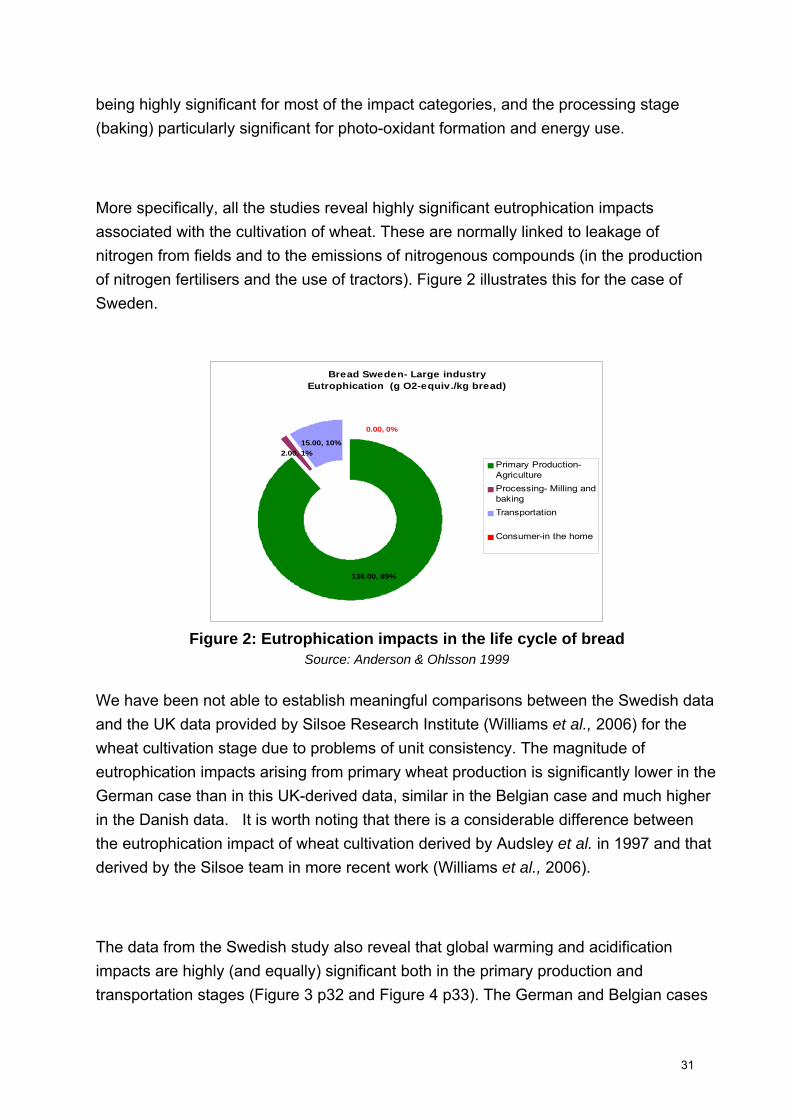
More specifically, all the studies reveal highly significant eutrophication impacts associated with the cultivation of wheat. These are normally linked to leakage of nitrogen from fields and to the emissions of nitrogenous compounds (in the production of nitrogen fertilisers and the use of tractors). Figure 2 illustrates this for the case of Sweden.
Bread Sweden- Large industryEutrophication (g O2-equiv./kg bread)
138.00, 89%
2.00, 1%15.00, 10%
0.00, 0%
Primary Production-AgricultureProcessing- Milling andbaking Transportation
Consumer-in the home
Figure 2: Eutrophication impacts in the life cycle of bread
Source: Anderson & Ohlsson 1999
We have been not able to establish meaningful comparisons between the Swedish data and the UK data provided by Silsoe Research Institute (Williams et al., 2006) for the wheat cultivation stage due to problems of unit consistency. The magnitude of eutrophication impacts arising from primary wheat production is significantly lower in the German case than in this UK-derived data, similar in the Belgian case and much higher in the Danish data. It is worth noting that there is a considerable difference between the eutrophication impact of wheat cultivation derived by Audsley et al. in 1997 and that derived by the Silsoe team in more recent work (Williams et al., 2006).
The data from the Swedish study also reveal that global warming and acidification impacts are highly (and equally) significant both in the primary production and transportation stages (Figure 3 p32 and Figure 4 p33). The German and Belgian cases
31
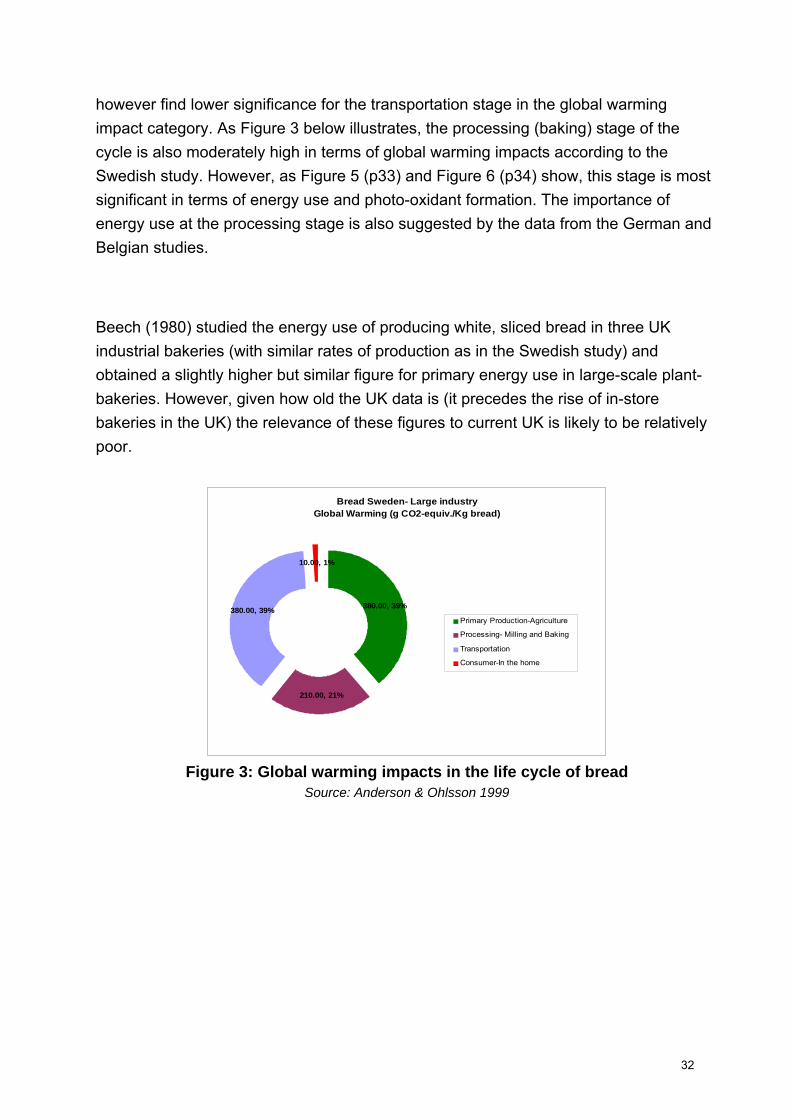
however find lower significance for the transportation stage in the global warming impact category. As Figure 3 below illustrates, the processing (baking) stage of the cycle is also moderately high in terms of global warming impacts according to the Swedish study. However, as Figure 5 (p33) and Figure 6 (p34) show, this stage is most significant in terms of energy use and photo-oxidant formation. The importance of energy use at the processing stage is also suggested by the data from the German and Belgian studies.
Beech (1980) studied the energy use of producing white, sliced bread in three UK industrial bakeries (with similar rates of production as in the Swedish study) and obtained a slightly higher but similar figure for primary energy use in large-scale plant-bakeries. However, given how old the UK data is (it precedes the rise of in-store bakeries in the UK) the relevance of these figures to current UK is likely to be relatively poor.
Bread Sweden- Large industryGlobal Warming (g CO2-equiv./Kg bread)
380.00, 39%
210.00, 21%
380.00, 39%
10.00, 1%
Primary Production-Agriculture
Processing- Milling and Baking
Transportation
Consumer-In the home
Figure 3: Global warming impacts in the life cycle of bread
Source: Anderson & Ohlsson 1999
32

Bread Sweden- Large industryAcidification (g SO2-equiv./kg bread)
2.176, 46%
0.320, 7%
2.240, 46%
0.032, 1%
Primary Production-Agriculture
Processing- Milling and baking
Transportation
Consumer-in the home
Figure 4: Acidification impacts in the life cycle of bread
Source: Anderson & Ohlsson 1999
The other key parameter at the baking stage is the amount of ethanol released, which affects low-level air quality through photo-oxidant formation (see Figure 5). According to the Swedish study, approximately 9g ethanol per kg of white bread is formed by fermentation and the amount released is 2-4g per kg of bread. This is however, an inherent aspect of bread-making. The only other study providing data on photo-oxidant formation impacts is from Belgium; those data reveal a much lower contribution of this impact category in the baking stage.
Bread Sweden- Large industryTotal Energy use (MJ /kg bread)
3.90, 33%
3.50, 30%
2.00, 17% 2.30, 20%
0.00, 0%
Primary Production-AgriculturePrimary Processing-MillingFurther Processing-BakingTransportationConsumer-in the home
Figure 5: Total energy use in the life cycle of bread
Source: Anderson & Ohlsson 1999
33

Bread Sweden- Large industryPhoto-oxidant formation (g ethene-equiv./Kg bread)
0.09, 5%
0.91, 54%
0.70, 41%
0.00, 0%
Primary Production-Agriculture
Processing- Milling and baking
Transportation
Consumer-in the home
Figure 6: Photo-oxidant formation in the life cycle of bread
Source: Anderson & Ohlsson 1999 Implications of alternative forms (organic)
The conventional and organic chains are not clearly distinct: many mills, bakeries and retailers work with both organic and conventional products. There is a stronger distinction between industrial and artisanal production chains than there is between conventional and organic ones.
The main difference between organic and conventional bread is in the techniques used for wheat production. Audsley et al. (1997) report significantly lower primary energy requirements for organic production compared to intensive cultivation (2833MJ/tonne 12% grain vs. 3265MJ/tonne) as well as higher land requirements (0.25ha per tonne vs. 0.125ha per tonne). This work, which compared primary production in different European countries, also suggests that eutrophication impacts are likely to be higher from the organic system (lower total emissions of nitrogen oxides and phosphates are more than offset by higher ammonia losses). More recent work by the Silsoe Research Institute (Williams et al., 2006), comparing organic and conventional production of bread wheat in the UK bears this out: eutrophication impacts are 3 times higher from organic production of 1kg of bread wheat than they are from conventional production and more than 3 times as much land is required. UK organic production is significantly lower than conventional in terms of energy inputs, however: 1.7MJ/kg compared to 2.5MJ/kg. Not only is the energy burden less for organic production, the analysis of Williams et al. finds it to be associated with different activities. In the case of conventional production, 53% of the primary energy inputs to the system are associated with fertiliser production,
34

8% with pesticide production, 5% with cooling and storage, and the rest with the use of powered machines in field activities. In the case of organic production on the other hand, fertiliser manufacture accounts for only 9% of primary energy inputs and there is, of course, no pesticide production, so energy for machine operations account for the great majority of the (lower) total primary energy inputs.
Potatoes
Potatoes are said to be “the most important single product within the fruit and vegetables sector in the UK food market” (Flynn et al., 2004). UK production was around 6 million tonnes in 2004, according to British Potato Council statistics (British Potato Council 2006). This represents the majority of UK consumption, although Flynn et al. (2004) estimated that imports account for perhaps 20% of total consumption and that around 2 million tonnes of potatoes are processed within the UK food industry each year. The number of producers has fallen continually over the past 40 years while production volume has remained fairly constant and yields per hectare have approximately doubled (British Potato Council, 2006). Despite the reduction in numbers of producers, they still number more than 3000: the packing and processing parts of the sector are much more concentrated, comprising a few hundred packers and around 50 processors, according to Flynn et al.
Williams et al. (2006) have considered the environmental impacts of potato production, while Mattsson and Wallen (2003) have assessed environmental impacts across the complete life cycle for organic potatoes. Potatoes are covered by the Danish LCA Food database, although data from that is not directly comparable with that from other sources because of the underlying methodology. Surrey University is currently engaged in LCA work that encompasses potato production in different locations but from which results are not yet available (Mila i Canals, pers. comm.).
Williams et al. (2006) summarise the environmental impacts associated with the production of 1kg of potatoes in the UK as those shown in Table 4. These data represent the current mix of varieties grown, and in the light of the importance of domestically-produced potatoes in the UK consumption mix, can be taken to be strongly representative of this.
35
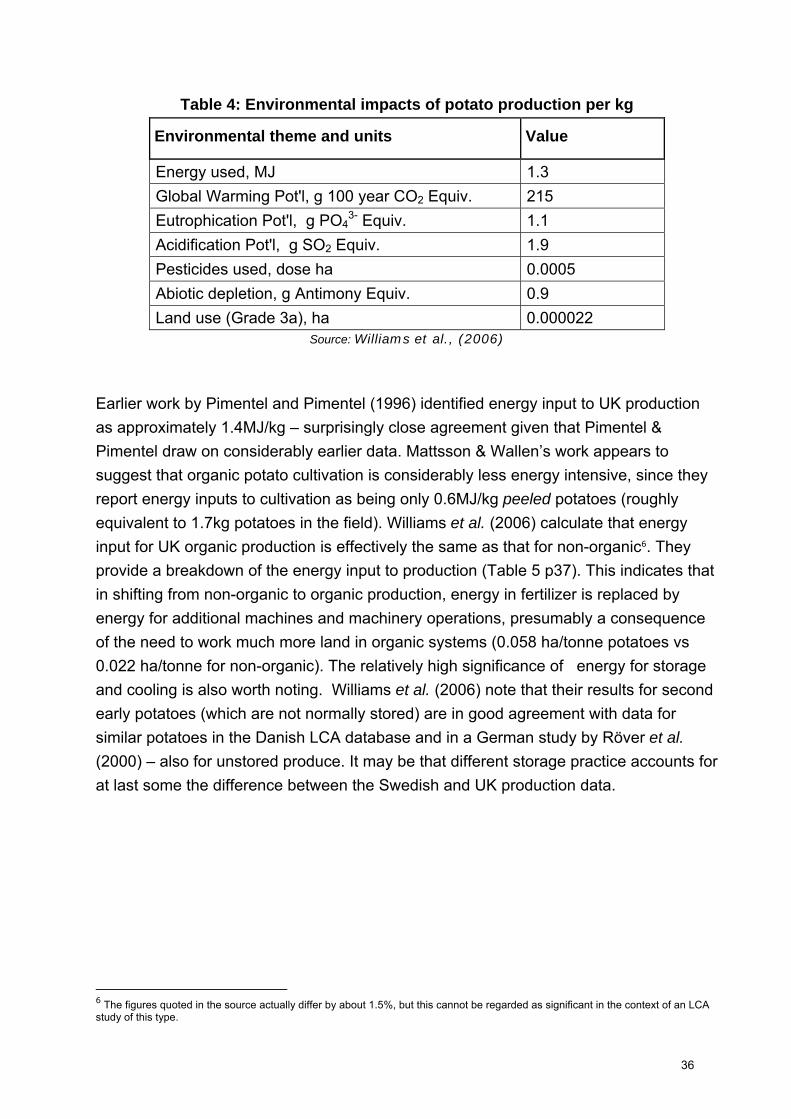
Table 4: Environmental impacts of potato production per kg
Environmental theme and units Value
Energy used, MJ 1.3 Global Warming Pot'l, g 100 year CO2 Equiv. 215 Eutrophication Pot'l, g PO4
3- Equiv. 1.1 Acidification Pot'l, g SO2 Equiv. 1.9 Pesticides used, dose ha 0.0005 Abiotic depletion, g Antimony Equiv. 0.9 Land use (Grade 3a), ha 0.000022
Source: Williams et al., (2006)
Earlier work by Pimentel and Pimentel (1996) identified energy input to UK production as approximately 1.4MJ/kg – surprisingly close agreement given that Pimentel & Pimentel draw on considerably earlier data. Mattsson & Wallen’s work appears to suggest that organic potato cultivation is considerably less energy intensive, since they report energy inputs to cultivation as being only 0.6MJ/kg peeled potatoes (roughly equivalent to 1.7kg potatoes in the field). Williams et al. (2006) calculate that energy input for UK organic production is effectively the same as that for non-organic6. They provide a breakdown of the energy input to production (Table 5 p37). This indicates that in shifting from non-organic to organic production, energy in fertilizer is replaced by energy for additional machines and machinery operations, presumably a consequence of the need to work much more land in organic systems (0.058 ha/tonne potatoes vs 0.022 ha/tonne for non-organic). The relatively high significance of energy for storage and cooling is also worth noting. Williams et al. (2006) note that their results for second early potatoes (which are not normally stored) are in good agreement with data for similar potatoes in the Danish LCA database and in a German study by Röver et al. (2000) – also for unstored produce. It may be that different storage practice accounts for at last some the difference between the Swedish and UK production data.
6 The figures quoted in the source actually differ by about 1.5%, but this cannot be regarded as significant in the context of an LCA study of this type.
36
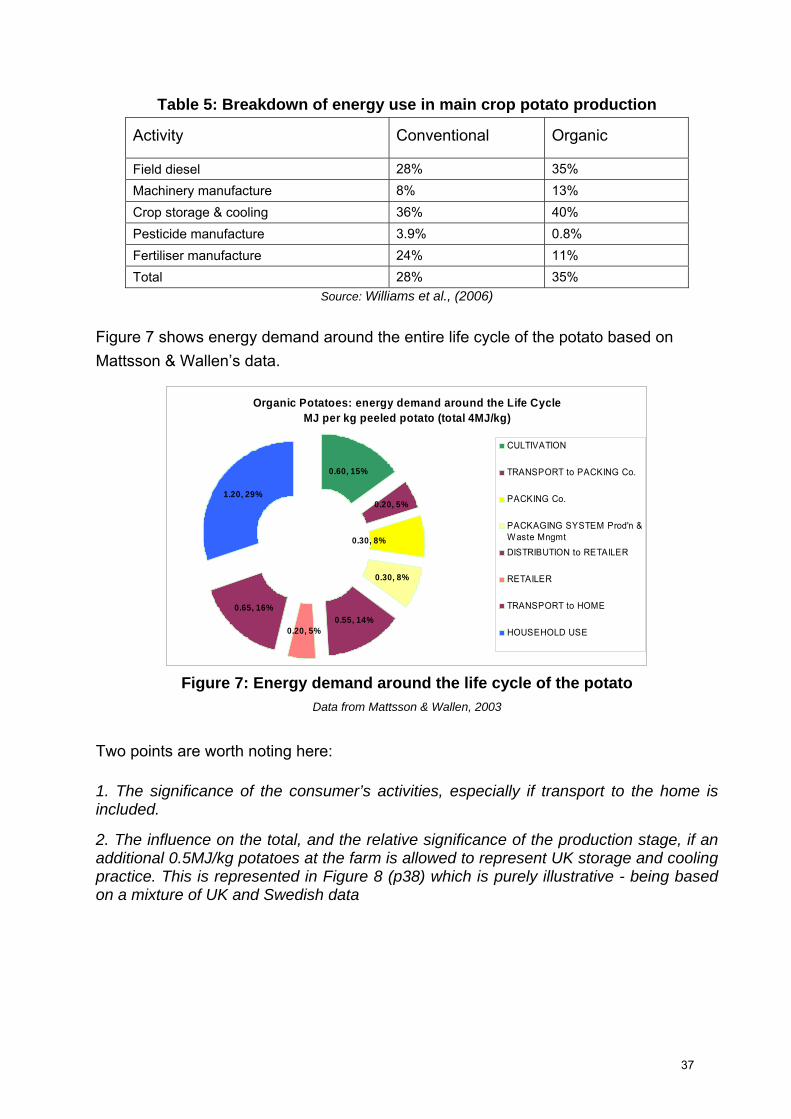
Table 5: Breakdown of energy use in main crop potato production
Activity Conventional Organic
Field diesel 28% 35% Machinery manufacture 8% 13% Crop storage & cooling 36% 40% Pesticide manufacture 3.9% 0.8% Fertiliser manufacture 24% 11% Total 28% 35%
Source: Williams et al., (2006)
Figure 7 shows energy demand around the entire life cycle of the potato based on Mattsson & Wallen’s data.
Organic Potatoes: energy demand around the Life CycleMJ per kg peeled potato (total 4MJ/kg)
0.30, 8%
0.55, 14%0.20, 5%
0.65, 16%
1.20, 29%0.20, 5%
0.30, 8%
0.60, 15%
CULTIVATION
TRANSPORT to PACKING Co.
PACKING Co.
PACKAGING SYSTEM Prod'n &Waste MngmtDISTRIBUTION to RETAILER
RETAILER
TRANSPORT to HOME
HOUSEHOLD USE
Figure 7: Energy demand around the life cycle of the potato
Data from Mattsson & Wallen, 2003
Two points are worth noting here:
1. The significance of the consumer’s activities, especially if transport to the home is included.
2. The influence on the total, and the relative significance of the production stage, if an additional 0.5MJ/kg potatoes at the farm is allowed to represent UK storage and cooling practice. This is represented in Figure 8 (p38) which is purely illustrative - being based on a mixture of UK and Swedish data
37

Potatoes: energy demand around the life cycle, UK storage & cooling
MJ per kg peeled potato (total 4.5MJ/kg)
0.3, 7%
0.3, 7%
0.55, 12%0.2, 4%
0.65, 14%
0.6, 13%
1.2, 28%
0.2, 4%
0.5, 11%
CULTIVATION
STORAGE & COOLING
TRANSPORT to PACKING Co.
PACKING Co.
PACKAGING SYSTEM Prod'n &Waste MngmtDISTRIBUTION to RETAILER
RETAILER
TRANSPORT to HOME
HOUSEHOLD USE
Figure 8: Energy demand for storage and cooling in the life cycle of the potato Data ex Mattson & Wallen 2003; Williams et al. 2006
Mattsson & Wallen’s analysis suggests that the consumer’s activities are important in terms of the global warming potential of the potato life cycle, as the distribution of energy inputs would suggest (Figure 9).
Organic Potatoes: Climate Change Impacts around the Life Cycleg. CO2 eq. per kg peeled potato. Total value 304g CO2
30, 9%
50, 15%
4, 1%60, 19%
100, 31%
55, 16%
-15, 4%
5, 1%
15, 4%
CULTIVATION
TRANSPORT to PACKING Co.
PACKING Co.
PACKAGING SYSTEM Prod'n &Waste MngmtDISTRIBUTION to RETAILER
RETAILER
TRANSPORT to HOME
HOUSEHOLD USE
HOUSEHOLD DISTRICT HEATING
Figure 9: Climate change impact around the life cycle of the potato
Data ex Mattsson & Wallen 2003
38
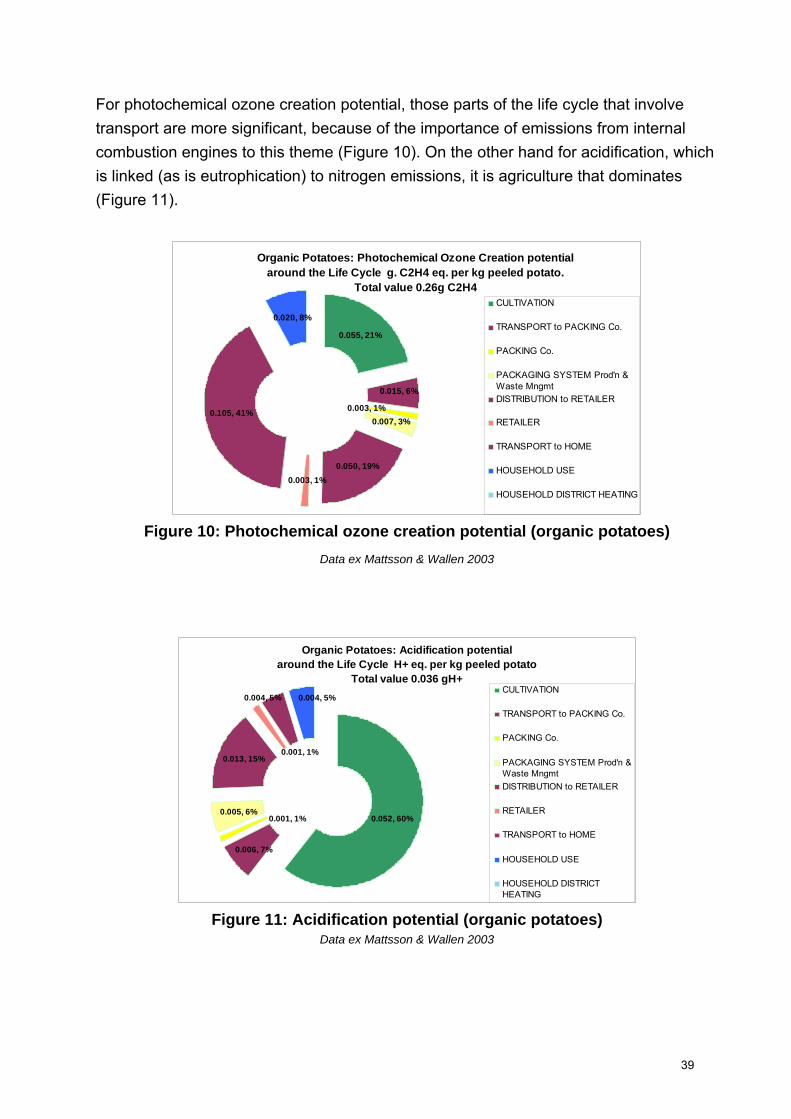
For photochemical ozone creation potential, those parts of the life cycle that involve transport are more significant, because of the importance of emissions from internal combustion engines to this theme (Figure 10). On the other hand for acidification, which is linked (as is eutrophication) to nitrogen emissions, it is agriculture that dominates (Figure 11).
Organic Potatoes: Photochemical Ozone Creation potential around the Life Cycle g. C2H4 eq. per kg peeled potato.
Total value 0.26g C2H4
0.007, 3%
0.050, 19%0.003, 1%
0.105, 41%
0.020, 8%
0.015, 6%
0.003, 1%
0.055, 21%
CULTIVATION
TRANSPORT to PACKING Co.
PACKING Co.
PACKAGING SYSTEM Prod'n &Waste MngmtDISTRIBUTION to RETAILER
RETAILER
TRANSPORT to HOME
HOUSEHOLD USE
HOUSEHOLD DISTRICT HEATING
Figure 10: Photochemical ozone creation potential (organic potatoes)
Data ex Mattsson & Wallen 2003
Organic Potatoes: Acidification potential around the Life Cycle H+ eq. per kg peeled potato
Total value 0.036 gH+
0.005, 6%
0.013, 15%
0.004, 5% 0.004, 5%
0.001, 1%
0.052, 60%0.001, 1%
0.006, 7%
CULTIVATION
TRANSPORT to PACKING Co.
PACKING Co.
PACKAGING SYSTEM Prod'n &Waste MngmtDISTRIBUTION to RETAILER
RETAILER
TRANSPORT to HOME
HOUSEHOLD USE
HOUSEHOLD DISTRICTHEATING
Figure 11: Acidification potential (organic potatoes)
Data ex Mattsson & Wallen 2003
39
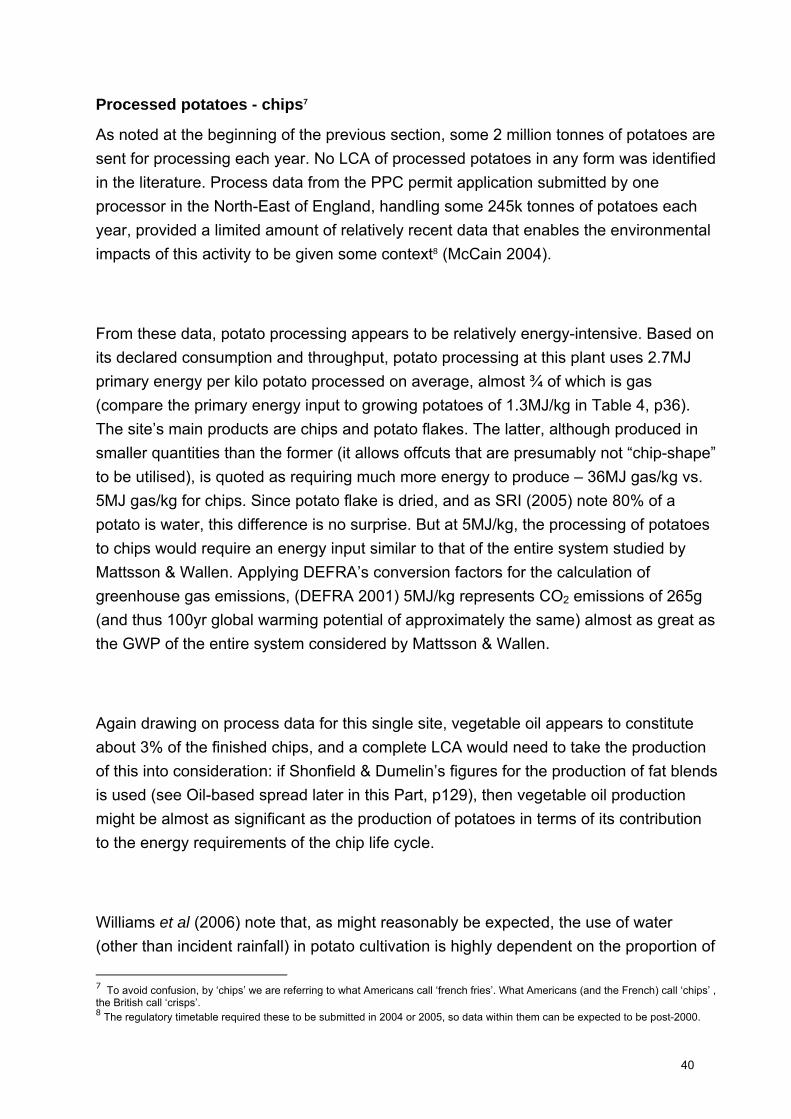
Processed potatoes - chips7
As noted at the beginning of the previous section, some 2 million tonnes of potatoes are sent for processing each year. No LCA of processed potatoes in any form was identified in the literature. Process data from the PPC permit application submitted by one processor in the North-East of England, handling some 245k tonnes of potatoes each year, provided a limited amount of relatively recent data that enables the environmental impacts of this activity to be given some context8 (McCain 2004).
From these data, potato processing appears to be relatively energy-intensive. Based on its declared consumption and throughput, potato processing at this plant uses 2.7MJ primary energy per kilo potato processed on average, almost ¾ of which is gas (compare the primary energy input to growing potatoes of 1.3MJ/kg in Table 4, p36). The site’s main products are chips and potato flakes. The latter, although produced in smaller quantities than the former (it allows offcuts that are presumably not “chip-shape” to be utilised), is quoted as requiring much more energy to produce – 36MJ gas/kg vs. 5MJ gas/kg for chips. Since potato flake is dried, and as SRI (2005) note 80% of a potato is water, this difference is no surprise. But at 5MJ/kg, the processing of potatoes to chips would require an energy input similar to that of the entire system studied by Mattsson & Wallen. Applying DEFRA’s conversion factors for the calculation of greenhouse gas emissions, (DEFRA 2001) 5MJ/kg represents CO2 emissions of 265g (and thus 100yr global warming potential of approximately the same) almost as great as the GWP of the entire system considered by Mattsson & Wallen.
Again drawing on process data for this single site, vegetable oil appears to constitute about 3% of the finished chips, and a complete LCA would need to take the production of this into consideration: if Shonfield & Dumelin’s figures for the production of fat blends is used (see Oil-based spread later in this Part, p129), then vegetable oil production might be almost as significant as the production of potatoes in terms of its contribution to the energy requirements of the chip life cycle.
Williams et al (2006) note that, as might reasonably be expected, the use of water (other than incident rainfall) in potato cultivation is highly dependent on the proportion of
7 To avoid confusion, by ‘chips’ we are referring to what Americans call ‘french fries’. What Americans (and the French) call ‘chips’ , the British call ‘crisps’. 8 The regulatory timetable required these to be submitted in 2004 or 2005, so data within them can be expected to be post-2000.
40

cultivation that is irrigated, and that this proportion is currently about 50%, making water consumption for potato production around 500 litre per kg. McCain’s data quotes water use in the processing facility at a little above 10 litre per kg product.
The environmental consequences of waterborne emissions from food processing activities are somewhat different from those from agricultural activities. In the latter case there is direct release of materials that contribute directly to eutrophication and/or are ecotoxicological; many food processors on the other hand, including the McCain potato processing one, release effluent whose main constituents are Chemical Oxygen Demand (COD) and oil into the sewerage system. The substances involved have less direct impact in terms of the themes covered by LCAs (for instance, one gram of COD has a eutrophication potential that is 2% of that of one gram of phosphate ion) and sewage treatment reduces the amounts ultimately released to the environment. There is, of course, an environmental cost associated with that treatment, which is most visible in terms of energy use at sewage treatment plants.
The Shopping Trolley compiled in the first stage of this project also included potato crisps. No literature coverage of the environmental impacts associated with this product has been identified, and the dispersed nature of the “database” represented by food processing industry PPC permit applications has inhibited a search for recent data at the process level.
Pasta and Rice
Preliminary work in this project identified that it would be valuable to understand the environmental impacts of pasta and rice also. In our wide literature survey we have identified no literature using LCA approaches to analyse all the environmental impacts associated with these foods specifically (or for instance differentiating between the impacts of growing bread wheat and the “durum” wheat used to make pasta). Carlsson-Kanyama and Boström-Carlsson (2001) briefly discuss pasta in a comparative study of the energy requirements of the different life cycle stages of several foods, the main focus of which is cooking. They consider both “normal” spaghetti and fresh egg pasta cooked in different ways and (for the spaghetti) for production in Sweden and in Italy. The total energy requirements for the fresh pasta are higher, covering a range of 26 to 30MJ/kg, than those of the spaghetti (17-23 MJ/kg). In both cases cooking is significant,
41

but in the case of the spaghetti, which requires much longer cooking, this accounts for around half of the total energy requirement. The addition of eggs to the ingredient mix was found to significantly increase the energy requirement for raw material production (see Figure 12 and Figure 13).
Figure 12: Energy use in the life cycle of spaghetti
“Energy use during the life cycle of one portion of spaghetti. In MJ per 70g portion according to cooking mode and origin. Example a was made in Sweden and cooked on a hotplate as part of 4 portions, example b was made in Italy and cooked on a hotplate as part of 4 portions, example c was made in Sweden and cooked as a single portion and example d was made in Italy and cooked as a single portion.” Source: Carlsson-Kanyama and Boström-Carlsson (2001).
Figure 13: Energy use in the life cycle of fresh pasta “Energy use during the life cycle of one 70g portion of fresh pasta. In MJ per portion according to cooking mode. Example a was cooked on a hotplate as part of 4 portions and example b was cooked on a hotplate as a single portion.” Source: Carlsson-Kanyama and Boström-Carlsson (2001).
Carlsson-Kanyama (1998) also provides some figures for energy use and climate change impacts associated with the life cycle of rice consumed in Sweden. In a
42
comparative analysis with several other basic foods, she quotes primary energy inputs around the rice life cycle as being 9.8 MJ.kg (compared to 1.8MJ/kg for potatoes and 42MJ/kg for tomatoes), and Global Warming Potential (using the IPCC’s 20-year factors) as being 6400g. equivalents CO2 per kg (compare to 170g. eq. CO2 for potatoes quoted in the same reference, and to the 304g.eq CO2 for the entire life cycle given by Mattsson & Wallen (2003). The very high GWP is, according to Carlsson-Kanyama (1998), the result of methane emissions from irrigated rice fields: agriculture accounts for more than 80% of the total impact. She stresses, however, that methane emissions from rice cultivation have been calculated for this analysis and have strong uncertainties associated with them. No analysis has been identified that discusses other environmental impacts of rice cultivation in the context of life cycle analysis.
43
Fruit & vegetables
Summary
• The EIPRO analysis only places “vegetables” (as distinct from “frozen fruits, fruit juices, and vegetables”) among the top 35 final consumption categories contributing to a single environmental theme for global warming, for which it is associated with around 0.7% of the EU’s total impacts. Frozen fruits, fruit juices and vegetables occur in the “top 35” for all of the themes covered by that analysis, but in no case for more than 1% of total EU impacts9.
• Carrots, tomatoes, apples and peas have all been the subject of research using LCA techniques to investigate the environmental impacts of production and consumption. Only for carrots have several environmental themes been investigated for the entire life cycle.
• Data for fresh carrots reinforce the relative importance, already noted for potatoes, of the consumer’s actions in determining total life cycle environmental impacts.
• Research into the environmental impacts associated with delivery of carrots to the consumer in different formats highlights the additional energy demands that freezing and frozen storage introduce into the system.
• Evidence from a single study on the life cycle of tomato ketchup also hints at a much more significant contribution that processing may make to total life cycle impacts for more complex, more highly-processed food items than it does for more basic foods.
• Evidence about the environmental impacts of carrots also highlights the significant contribution from some forms of packaging (in this case cans) to the environmental impacts associated with certain foods when there is no recovery or recycling taking place.
• Evidence about the environmental impacts of apple production emphasises their dependence on location and agricultural practice. It also reinforces evidence from
9 The environmental themes covered by EIPRO are: abiotic resource depletion, global warming, ozone layer depletion, human toxicity, ecotoxicity, acidification, photochemical oxidation and eutrophication. See the Glossary for an explanation of these terms.
44
work on arable crops that the production of agricultural machinery can represent a significant fraction of the environmental burdens of agriculture.
• Recent research into apple cultivation suggests that organic farming practices can be associated with lower environmentally-significant nitrogenous losses from soils.
• Available evidence about the environmental impact of tomato production and the consumption of unprocessed tomatoes relates mainly to the production stage and to energy demand in particular.
• The energy requirements of tomato production vary very significantly according to production method and the variety grown. Forced heating increases the energy requirement per kg tomatoes by at least an order of magnitude. Where forced heating is used, it appears to be the main source of energy-related environmental impacts in the whole life cycle.
• Tomato production requires significant water inputs (40-50l per kg by one estimate). The environmental significance of these is clearly location-dependent, but is likely to be greater in places where tomatoes can be grown without recourse to forced heating.
Apples
In 2004, the UK produced 192k tonnes of apples, and imported 525k tonnes (Fresh Produce Consortium, 2005). Any analysis of the environmental impacts of apple production-consumption systems consumed in the UK ought therefore to consider the impacts of production, transport and storage – since apples are commonly stored in refrigerated conditions to slow down post-harvest changes in their qualities.
Apple production in New Zealand has been investigated by Mila i Canals, Burnip and Cowell (2006). This study highlights the variability in environmental impacts arising from different farm practices – even in the same part of one country. So non-renewable energy consumption ranges from 0.4MJ per kg for apples grown in a commercial orchard to over 0.7MJ/kg in a “demonstration orchard” in the same part of New Zealand. Mila i Canals et al. (2006) point out that fertiliser use and water use varied enormously
45
between the orchards studied. It is notable that energy inputs per unit of production are in fact lower for the commercial orchards studied than for the demonstration orchards.
Climate change impacts associated with the different orchards diverge even more strongly than non-renewable energy consumption, varying from 40g to >100g eq. CO2 per kg. This is a result of differing fertiliser application rates and hence different direct emissions of greenhouse gases, notably N2O.
The manner in which any switch to organic agriculture affects nitrogen release from soils (to water as nitrate – NO3
- - or ammoniacal N, and to the atmosphere as nitrous oxide - N2O - a greenhouse gas) is an important issue that emerges in relation to a number of foods. Nitrogenous releases in apple orchards cultivated under conventional and organic conditions are the subject of a recently-reported study by Kramer et al. (2006), which finds that organic practices can achieve the same level of N input as conventional practices at lower nitrate leaching rates and similar nitrous oxide emission rates. These results are on an area basis and are not related to actual output: differing yields from conventional and organic practice also influence emissions per kilogram of food produced, which is the basis of the LCA studies generally discussed in this report.
Mila i Canals et al. (2006) found relatively high significance for pesticides and also find that the production of agricultural machinery is not insignificant in terms of its contribution to the total environmental impacts of the system, accounting for around 10% of them. Audsley et al. (1997) reached similar conclusions for arable farming systems. This is a contrast to the common finding for industrial production systems that capital goods production makes an insignificant contribution to the environmental impacts associated with the overall product life cycle.
Sonesson and Davis (2005) in their “Environmental Systems Analysis of Meals” use data from previous SIK work for the environmental impacts of apple production, quoting the delivered energy required for apple growing as 0.9MJ/kg10 and a contribution to eutrophication of 9g O2 eq per kg. Although Sonesson and Davis follow the meal
10 Note that a global warming impact of 0 is associated with this in the source, which suggests it may only be associated with electricity use (Swedish baseload electricity generation is reported to be almost 100% hydro- and nuclear powered)
46

throughout its life cycle, no other results specific to apples can be extracted from the report of their work.
Table 6: Primary energy requirements for different stages of the life cycle for domestically-produced and imported apples
Local fruit (Germany) Imported fruit (ex New Zealand)
Life cycle stage Primary energy requirement
MJ/ kg apples
Life cycle stage Primary energy requirement
MJ/ kg apples
Cultivation 2.8 Cultivation 2.1
Transfer to packer and cooling 0.16 Transfer to packer
and cooling 0.23
Packaging 0.65 Packaging 0.65
Storage 0.81 Long-distance transport 2.8
Transport in Germany 0.33 Transport in
Germany 0.54
Consumer shopping 1.2 Consumer shopping 1.2
Source: Blanke & Burdick 2005, Table 2. Data consolidated and rounded to 2sig fig.
Burdick and Blanke, in a study that seeks to compare the environmental impacts of local and distant production draw on a number of sources to calculate energy requirements from production to the consumer for both German-grown and New Zealand-grown fruit consumed in Germany. They suggest that the imported fruit system may have a total energy requirement some 50% higher than the locally-grown version. However, this work draws on data for energy use in fruit production that is rather old (published in 1979), and assumes that the energy demands of cultivation are the same in New Zealand and Germany – an assumption that is difficult to justify on the basis of recent research into the environmental impacts of agricultural production, including that of Mila i Canals, Cowell and Burdip mentioned above. Also, although this work makes an allowance for higher yields in New Zealand, it appears to take no account of potentially different loss rates post-harvest. A similar study comparing the energy requirements of local, small-scale apple juice production and distribution with orange juice made from imported concentrate produced at a larger scale in Brazil found that the energy economies associated with large-scale processing and shipment outweighed the additional burdens imposed by extra distance (Schlich and Fleissner 2003). A recent study comparing local and mainstream food distribution systems in Flanders also found the mainstream system to have lower energy requirements (Van Hauwermeiren, Coene,
47
Engelen and Mathijs, unpublished). The energy requirements allocated to different parts of the chain by Blanke & Burdick are shown in Table 6, above.
Carrots
The UK produced 1.3 million tonnes of root vegetables and onions in 2004 (FPC, 2005) Carrots have been the focus of a recent study by the consultancy TNO (Ligthart, Ansems & Jetten 2005) aimed at gaining “a more detailed insight into sustainability performance of a vegetable processed, packed and consumed in various ways”. It examines the life cycle impacts of carrots sold in a number of forms: two kinds of Fresh (bunched in plastic bags, peeled in plastic bags), two kinds of Frozen (in plastic bags, in cartons) and three kinds of Preserved (in steel cans, in food pouches and in Tetra “recart”, a laminated carton).
The study covers production and processing of the carrots themselves in open fields, production of packaging and packaging materials, transport at all points in the chain, storage at the point of sale and in the home, preparation and the treatment /disposal of wastes throughout the system. It draws data largely from literature sources. The environmental themes covered include global warming potential, measures of human and ecological toxicity, and photochemical ozone creation potential but do not include eutrophication. The data on primary production are drawn from several sources relating to Western Europe and are not of such high quality or consistency as that available for potatoes.
The results cover a number of combinations of processing, packaging and waste disposal options. Some of the key findings are:
For fresh carrots transport, particularly consumer transport of shopping to the home, is the main contributor to all of the environmental impacts considered. As a result, peeled carrots have a lower total impact than bunched carrots, because there is less weight to move for the required final serving. Peeled carrots have the lowest total impact of all the variants covered, as illustrated for global warming impact in Figure 14, below:
48

Global Warming Potential, whole system, carrots in various formats (kg CO2 equiv per 600g serving)
0.00
0.20
0.40
0.60
0.80
1.00
1.20
1.40
Freshbunched
Freshpeeled
Frozenbag
Frozencarton
food can(l'fill)
pouch laminatecarton
Figure 14: Global warming potentials, carrots in different formats Data from Ligthart, Ansems & Jetten 2005
For frozen carrots, storage in distribution, retail and in the home are the main contributing stages.
For the preserved forms,
• packaging is the main impact creator for canned produce, although this impact is mitigated by recycling.
• transport and packaging are the main contributors to overall impacts for product sold in a pouch.
• transport and packaging are main contributors to total impacts for product sold in laminated cartons.
Figure 15 (p51) show how global warming and photochemical ozone creation potential impacts are spread over the different non-transport stages of the life cycle for carrots in different formats, constructed using data reported by TNO (data on transport impacts is not included in TNO’s report in a format that permits its inclusion). These reinforce the significance of food preparation in basic vegetable systems (cf. potatoes), and highlight
49
the contribution that freezing makes to the overall impacts of these foods when they are distributed in frozen form.
A number of other researchers have considered the energy demands of carrots and associated global warming impacts. None is reported in the detailed format of the TNO work, the results of which have been used to generate Figures 15. Carlsson-Kanyama (1997, 1998) calculated energy inputs to carrot production-consumption systems of 2.1MJ/kg, within the range of values identified by TNO. In a study focused on the different energy requirements of different methods of preserving foods, Ritchie (2005) found that freezing had the greatest system-wide requirement of the techniques considered, while refrigerated preservation of fresh foods and canning had similar energy requirements to each other, some 30-50% lower than those of the frozen food types studied.
50
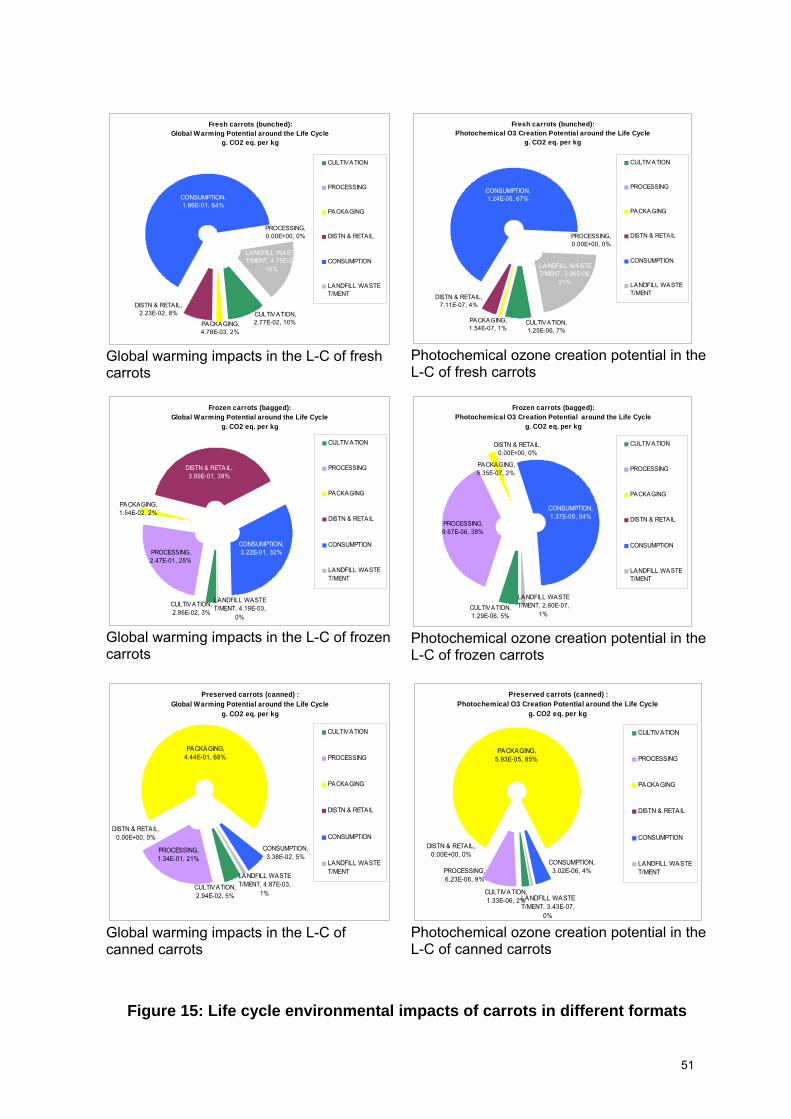
Fresh carrots (bunched):
Global Warming Potential around the Life Cycleg. CO2 eq. per kg
PROCESSING, 0.00E+00, 0%
PACKAGING, 4.78E-03, 2%
CULTIVATION, 2.77E-02, 10%
DISTN & RETAIL, 2.23E-02, 8%
CONSUMPTION, 1.86E-01, 64%
LANDFILL WASTE T/MENT, 4.75E-02,
16%
CULTIVATION
PROCESSING
PACKAGING
DISTN & RETAIL
CONSUMPTION
LANDFILL WASTET/MENT
Global warming impacts in the L-C of fresh carrots
Fresh carrots (bunched): Photochemical O3 Creation Potential around the Life Cycle
g. CO2 eq. per kg
PROCESSING, 0.00E+00, 0%
PACKAGING, 1.54E-07, 1%
CULTIVATION, 1.25E-06, 7%
DISTN & RETAIL, 7.11E-07, 4%
CONSUMPTION, 1.24E-05, 67%
LANDFILL WASTE T/MENT, 3.96E-06,
21%
CULTIVATION
PROCESSING
PACKAGING
DISTN & RETAIL
CONSUMPTION
LANDFILL WASTET/MENT
Photochemical ozone creation potential in the L-C of fresh carrots
Frozen carrots (bagged): Global Warming Potential around the Life Cycle
g. CO2 eq. per kg
PROCESSING, 2.47E-01, 25%
PACKAGING, 1.54E-02, 2%
CULTIVATION, 2.86E-02, 3%
DISTN & RETAIL, 3.89E-01, 38%
CONSUMPTION, 3.22E-01, 32%
LANDFILL WASTE T/MENT, 4.19E-03,
0%
CULTIVATION
PROCESSING
PACKAGING
DISTN & RETAIL
CONSUMPTION
LANDFILL WASTET/MENT
Global warming impacts in the L-C of frozen carrots
Frozen carrots (bagged): Photochemical O3 Creation Potential around the Life Cycle
g. CO2 eq. per kg
LANDFILL WASTE T/MENT, 2.60E-07,
1%
CONSUMPTION, 1.37E-05, 54%
DISTN & RETAIL, 0.00E+00, 0%
CULTIVATION, 1.29E-06, 5%
PACKAGING, 5.35E-07, 2%
PROCESSING, 9.67E-06, 38%
CULTIVATION
PROCESSING
PACKAGING
DISTN & RETAIL
CONSUMPTION
LANDFILL WASTET/MENT
Photochemical ozone creation potential in the L-C of frozen carrots
Preserved carrots (canned) : Global Warming Potential around the Life Cycle
g. CO2 eq. per kg
LANDFILL WASTE T/MENT, 4.87E-03,
1%
CONSUMPTION, 3.38E-02, 5%
DISTN & RETAIL, 0.00E+00, 0%
CULTIVATION, 2.94E-02, 5%
PACKAGING, 4.44E-01, 68%
PROCESSING, 1.34E-01, 21%
CULTIVATION
PROCESSING
PACKAGING
DISTN & RETAIL
CONSUMPTION
LANDFILL WASTET/MENT
Global warming impacts in the L-C of canned carrots
Preserved carrots (canned) : Photochemical O3 Creation Potential around the Life Cycle
g. CO2 eq. per kg
PROCESSING, 6.23E-06, 9%
PACKAGING, 5.93E-05, 85%
CULTIVATION, 1.33E-06, 2%
DISTN & RETAIL, 0.00E+00, 0%
CONSUMPTION, 3.02E-06, 4%
LANDFILL WASTE T/MENT, 3.43E-07,
0%
CULTIVATION
PROCESSING
PACKAGING
DISTN & RETAIL
CONSUMPTION
LANDFILL WASTET/MENT
Photochemical ozone creation potential in the L-C of canned carrots
Figure 15: Life cycle environmental impacts of carrots in different formats
51
Tomatoes
Figures presented by the Fresh Produce Consortium (FPC, 2005) suggest that tomato consumption (as measured by the sum of imports and domestic production) by food processors and consumers combined has risen in the UK over the past decade, from around 320 ktonne in 1995 to 470 ktonne in 2004. During that time, domestic production has shrunk from around one-third of the total to less than one-fifth.
The energy input to tomato production has received more research attention than any other aspect of the tomato’s life cycle from an environmental perspective. Stanhill (1980) analysed the non-solar energy requirements of various tomato production regimes, including the energy associated with protective structures (polytunnels, greenhouses, etc.) in the analysis. The calculated energy demand varied from 1.5MJ/kg for open-field cultivation in California to almost one hundred times this, 137MJ/kg for greenhouse cultivation in South East England. It is notable that, for the greenhouse-based systems, although both production of the aluminium parts of the greenhouse and production of the glass are significant, the former accounts for a higher proportion of energy inputs than the latter. Unheated systems, whether open-field or covered, all have energy requirements below 5MJ/kg in this analysis, so heating can be seen to increase the environmental burdens very considerably.
The Silsoe Research Institute (Williams et al., 2006) identifies energy inputs to current production in England as being approximately 125MJ/kg. SRI also identifies heating as being the dominant source of environmental burdens, despite the mitigating effects of the application of CHP and heat recovery. SRI note that both the energy requirement per kg produced and the land required to produce a tonne of tomatoes are both strongly dependent on the variety grown. The different land requirements for different varieties (organic and non-organic) are shown in Table 7 (p53), drawn from Williams et al. (2006). The fact that organic production gives yields that are around 75% of the levels achieved in non-organic production leads to higher land requirements for organic production of all varieties, illustrated in Table 6 for the case of specialist vine tomatoes, which are the lowest-yielding whichever approach to cultivation is chosen.
52

Table 7: Land needed to grow 1 t of tomato types, m2
Product Area required (m2 per tonne)
Classic loose 19 Specialist loose 38 Classic vine 45 Specialist vine 92 Specialist vine organic 122
Source: Williams et al., 2006.
Organic tomato production requires more non-renewable energy inputs as well as more land according to SRI’s calculations for different tomato-growing scenarios, which indicate that the energy demand for 100% organic production would be approximately 1.9 times that of 100% conventional production. Organic tomatoes are also produced using soil as the growing medium, whereas conventional tomato production is carried out using rock mineral wool as the substrate: the environmental consequences of this difference appear to be relatively small.
With fuel consumption dominating the energy requirements of the tomato production systems, the relative quantities of greenhouse gas emissions associated with different varieties and production methods follow the same pattern as the non-renewable energy demands described above. SRI quote 9.4kg CO2 equivalent per kg for current UK produced tomatoes at the “farm gate”, while Carlsson-Kanyama (1998) quotes 3.3kg CO2 equivalent per kg11 for emissions from a more extended system based on tomatoes produced in open fields in Israel. Carlsson-Kanyama’s calculation includes storage and transport to Sweden: however, the last item accounts for only 4% of the total greenhouse gas emissions, over 85% of which are associated with farming operations. Energy demand for this system is approximately 40MJ/kg. SRI’s work highlights the reduction in primary energy demand that more extensive use of Combined Heat and Power (CHP) plant in UK tomato production could bring (a reduction of over 60%), but also shows the less dramatic effect on Global Warming Potential associated with making this switch – a reduction of around 30%. In the light of these figures and the apparent significance of non-solar heating, the results of Anton et al. (2005), reporting an LCA of greenhouse production of tomatoes in unheated greenhouses in Southern Europe are worth noting. In the absence of fossil-fuelled heating and non-CO2 greenhouse gas emissions, their conclusion that the contribution of the greenhouse structure to the overall impacts is very significant is to be expected. The total GWP
11 The latter is based on a 20-year perspective, whereas the former on a 100-year perspective. The influence of that difference in impact assessment is small.
53
reported, at 81g CO2 per kg tomatoes, is around one hundred times less than that reported by Williams et al. (2006) for UK production – but it is also far less than the production-related GWP impacts reported by Carlsson-Kanyama (1998). Neither of these sources provides sufficient detail about the information underlying the calculations (yields, systems boundaries, etc.) to enable us to comment on which seems more trustworthy.
Williams et al.’s (2006) analysis also indicates that extensive use of CHP in UK tomato production would reduce very considerably the eutrophication and acidification impacts associated with tomato production. This is a result of the switch in fuels used for energy generation, and particularly the displacement of the “normal” fuel mix used for energy generation in the UK when CHP utilisation reaches the point at which electricity is exported to the grid. Other impacts receive less attention in the literature, although SRI’s work covers a range of environmental impacts including eutrophication, pesticide use and water use. In Williams et al. (2006), SRI identifies the eutrophication impact of tomato cultivation as 1.5gPO4
3- equivalent/kg tomatoes for current UK production, and 3.8gPO4
3- equivalent/kg tomatoes for an all-organic scenario based on the same mix of varieties. Pesticide use is lower in the organic scenario, despite the efficient use of pesticides and bio-control methods used in conventional tomato-growing. (Harvey et al., 2004).
Water use in tomato production appears to be one of the most significant aspects of the system. SRI note that the water required to produce 1kg of tomatoes is around 40l for current UK production and around 50l per kg for organic produce, but it is understood that different irrigation practices can change the water requirement very considerably (Shonfield, pers.comm). The environmental significance of water consumption is localised and varies according to a number of factors, not least of which is the status of water resources in the place where the water is used. There is no standard approach to evaluating these impacts in Life Cycle Assessment, and they receive limited attention in such studies. It seems that, in the case of tomatoes and other produce grown under similar conditions (for example courgettes, capsicums, etc.) they deserve much more attention. Much production of these vegetables takes place in locations where high levels of direct solar energy are available (Israel, Southern Spain, California, etc.) so that the need for human-generated energy inputs is less, but these are places associated with water resource challenges that horticultural production for the benefit of consumers in Northern Europe might well exacerbate.
54
Tomato ketchup
Tomato ketchup is one of the few processed foods to have been the subject of a Life Cycle Assessment study. This work, again Swedish in origin, considers the system shown in Figure 16 (p56). Its results are noted here as they provide some indication of the relative significance of life cycle stages other than production, and - unusually – encompass some empirical evidence about wastage by consumers. It is important to bear in mind that the original authors suggested that there are relatively large uncertainties associated with their results, and that the study omitted the production of capital goods for the agricultural stage – an omission that may well be significant in the light of other work reviewed in this project.
Andersson et al. (1998) calculate environmental impacts on the basis of actual ketchup consumed. Their study involved practical evaluation of wastage from a sample of consumers’ empty containers delivered to the waste handling facility: they found that wastage at this stage varied widely, from around 0.5% to over 25%. Other notable conclusions of the study are that both processing and packaging make contributions to the system’s global warming impacts that are around three times as great as the contribution from agricultural production.
55
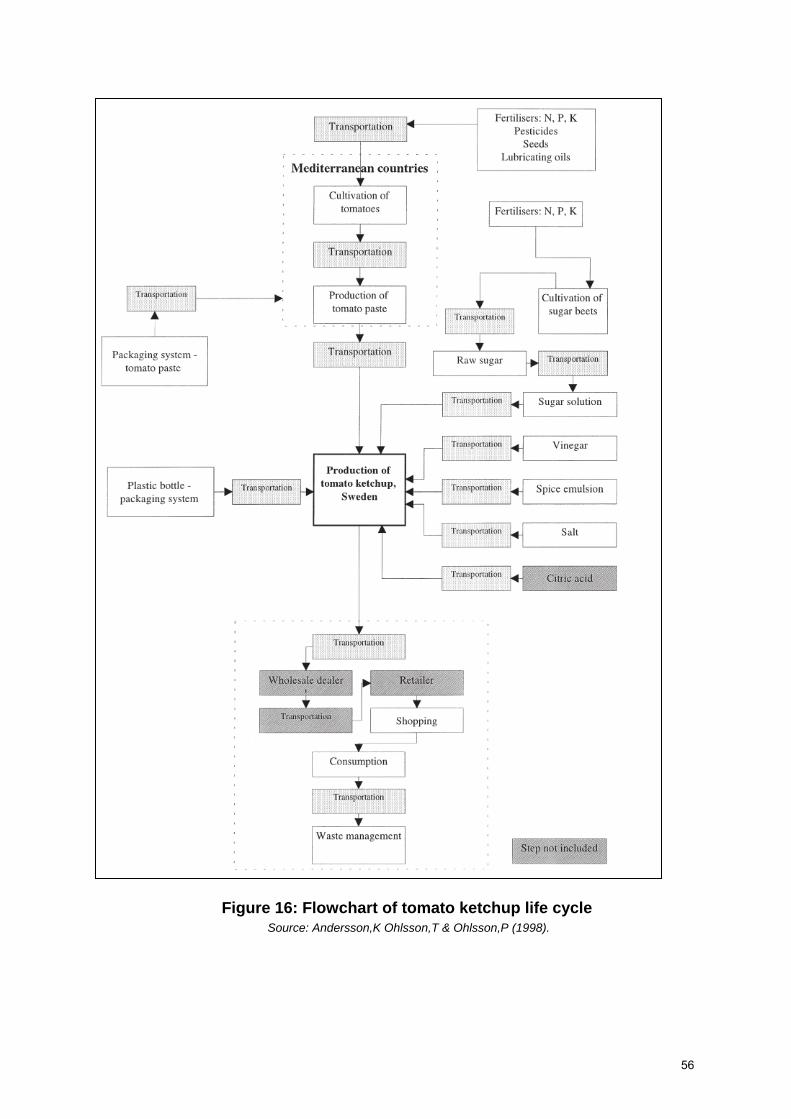
Figure 16: Flowchart of tomato ketchup life cycle Source: Andersson,K Ohlsson,T & Ohlsson,P (1998).
56

Figure 17 (below) shows approximate greenhouse gas impacts for different stages of the life cycle12 drawn from Andersson et al.
Tomato ketchup: Global Warming Potential around the Life Cycle
g equiv CO2 per kg . Total value 1345gCO2
Food Processing, 440, 32%
Packaging 1 – Tomato paste,
240, 18%
Agriculture, 155, 12%
Packaging 2 – Tomato Ketchup,
280, 21%
Transport, 95, 7%
Shopping, 135, 10%
Agriculture
Food Processing
Packaging 1 – Tomatopaste
Packaging 2 – TomatoKetchup
Transport
Shopping
Figure 17: Greenhouse gas impacts (tomato ketchup)
Data source: Andersson,K Ohlsson,T & Ohlsson,P (1998)
Agricultural production, encompassing both sugar beet and tomato cultivation is the dominant source of eutrophication impacts in this system, accounting for around 2/3 of the total.
12 The original includes impacts associated with domestic storage in a refrigerator. These have been omitted here since they are derived from Swedish electricity production data.
57
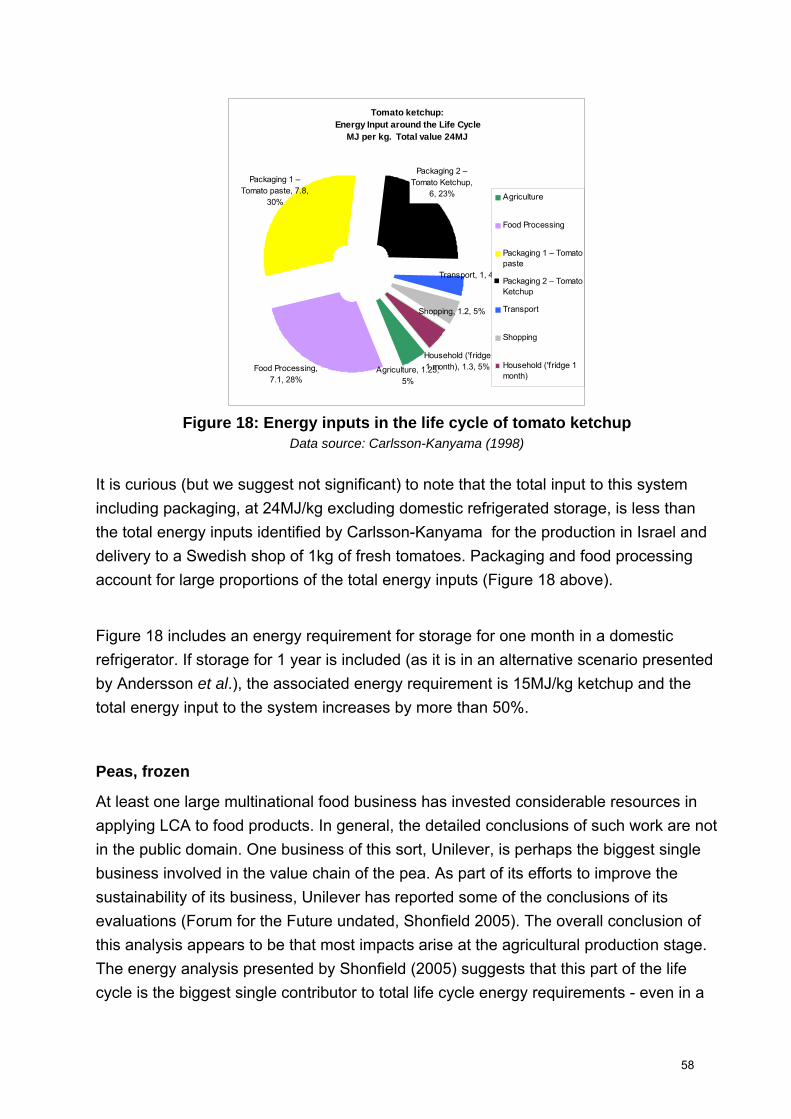
Tomato ketchup: Energy Input around the Life Cycle
MJ per kg. Total value 24MJ
Household ('fridge 1 month), 1.3, 5%
Shopping, 1.2, 5%
Transport, 1, 4%
Packaging 2 – Tomato Ketchup,
6, 23%
Agriculture, 1.25, 5%
Packaging 1 – Tomato paste, 7.8,
30%
Food Processing, 7.1, 28%
Agriculture
Food Processing
Packaging 1 – Tomatopaste
Packaging 2 – TomatoKetchup
Transport
Shopping
Household ('fridge 1month)
Figure 18: Energy inputs in the life cycle of tomato ketchup
Data source: Carlsson-Kanyama (1998)
It is curious (but we suggest not significant) to note that the total input to this system including packaging, at 24MJ/kg excluding domestic refrigerated storage, is less than the total energy inputs identified by Carlsson-Kanyama for the production in Israel and delivery to a Swedish shop of 1kg of fresh tomatoes. Packaging and food processing account for large proportions of the total energy inputs (Figure 18 above).
Figure 18 includes an energy requirement for storage for one month in a domestic refrigerator. If storage for 1 year is included (as it is in an alternative scenario presented by Andersson et al.), the associated energy requirement is 15MJ/kg ketchup and the total energy input to the system increases by more than 50%.
Peas, frozen
At least one large multinational food business has invested considerable resources in applying LCA to food products. In general, the detailed conclusions of such work are not in the public domain. One business of this sort, Unilever, is perhaps the biggest single business involved in the value chain of the pea. As part of its efforts to improve the sustainability of its business, Unilever has reported some of the conclusions of its evaluations (Forum for the Future undated, Shonfield 2005). The overall conclusion of this analysis appears to be that most impacts arise at the agricultural production stage. The energy analysis presented by Shonfield (2005) suggests that this part of the life cycle is the biggest single contributor to total life cycle energy requirements - even in a
58
scenario with long storage in the supply chain and by the consumer. As for the other vegetables discussed here, transport of food by the consumer and food preparation are also significant in the energy analysis. While we have limited details of the basis for Unilever’s analysis, comparison with recent reporting about carrots (see previous section) suggests that agriculture is rather more significant in the life cycle of the frozen pea than it is in the life cycle of the carrot.
Preliminary work in this project included asparagus within the list of foods to be considered, as an example of a vegetable that is highly likely to have been imported by airfreight at certain times of the year. We identified no literature using LCA approaches to analyse the environmental impacts associated with this food. However, Jungbluth (2000) identified that the impacts of emissions from aircraft (global warming potential, acidification) are of very great significance in the overall life cycles of products transported by air, and that view is supported by other researchers (Garnett, pers. comm., Sim, pers. comm.).
59

Dairy products
Summary
• The EIPRO analysis suggests that milk and other dairy products account for around 5% of global warming potential, 10% of eutrophication potential and 4% of photochemical ozone creation potential across the EU. Fluid milk is one of the “top 10” contributors to total impacts for all of the environmental themes considered except ozone depletion.
• Milk and cheese have been studied closely using LCA techniques; yoghurt and ice cream are less studied. Most studies that look beyond the farm gate focus on primary energy use or the associated global warming impacts under local conditions.
• Life cycle eutrophication impacts for all dairy products are dominated by contributions from dairy farming: in the case of fluid milk, farming accounts for over 95% of these.
• Because of the strong global warming potentials of methane and nitrous oxide, agricultural production tends to make the largest contribution to life cycle global warming impact for dairy products: one study finds that even for ice cream, a relatively highly-processed product, agricultural production accounts for over 90% of total life cycle GWP.
• Organic milk production appears to require less energy input but much more land than conventional production. While eliminating pesticide use, it also gives rise to higher emissions of greenhouse gases, acid gases and eutrophying substances per unit of milk produced.
• While life cycle global warming potential is strongly dominated by agricultural production for fluid milk and cheese, energy inputs are also most significant at the agricultural stage for these products. The high energy demands of drying milk to produce milk powder may make processing much more significant (in energy and possibly GWP terms) for dairy products that have high milk powder content.
• Packaging selection can have a strong influence on total life cycle energy inputs for some dairy products, notably milk and yoghurt. The energy demands associated with manufacture of different forms of milk packaging differ by a factor
60
of 8. At its greatest (for single-trip glass bottles) energy input to packaging production can be as large as energy inputs to primary milk production.
• Product diversification in food processing tends to increase water and energy consumption because of the need to clean between shorter product runs. One study of the yoghurt industry suggested that significant savings in raw milk and utilities can be achieved by optimal scheduling.
• The limited evidence about the environmental impacts associated with ice cream indicates that both milk production and the production of other ingredients make significant contributions to the total. Energy inputs to produce 1kg of ice cream appear to be little larger than those to produce 1 litre liquid milk.
• It is possible that energy consumption for domestic frozen storage is the largest single energy requirement in the life cycle of ice cream. This conclusion obviously depends on the length of time for which the product is kept13, and we note that data on consumers’ behaviour in this respect are very scarce.
• The very limited evidence that exists about food wastage patterns by consumers suggests that relatively high proportions of dairy products are wasted in the home. It seems reasonable to speculate that this is a consequence of their relatively perishable nature.
Milk
Retailers sell over 75% of milk bought in the UK (DEFRA, 2001), and milk is among the 5% of goods that are delivered direct from processors to retailers without going first to a Retailer Distribution Centre or other intermediary (IGD, 2003).
Results of the input-output based assessment of environmental impacts carried out in the EIPRO project (so far published in draft form) suggest that milk’s contribution to eutrophication is particularly significant, representing almost 5% of all eutrophication impacts (Tukker et al. 2005). There are a number of milk LCA studies that present results across the production and consumption (P&C) system for different countries 13 A very short discussion of issues relating to the allocation of energy used to run domestic appliances such as freezers to the items in them can be found in Annex 3.
61
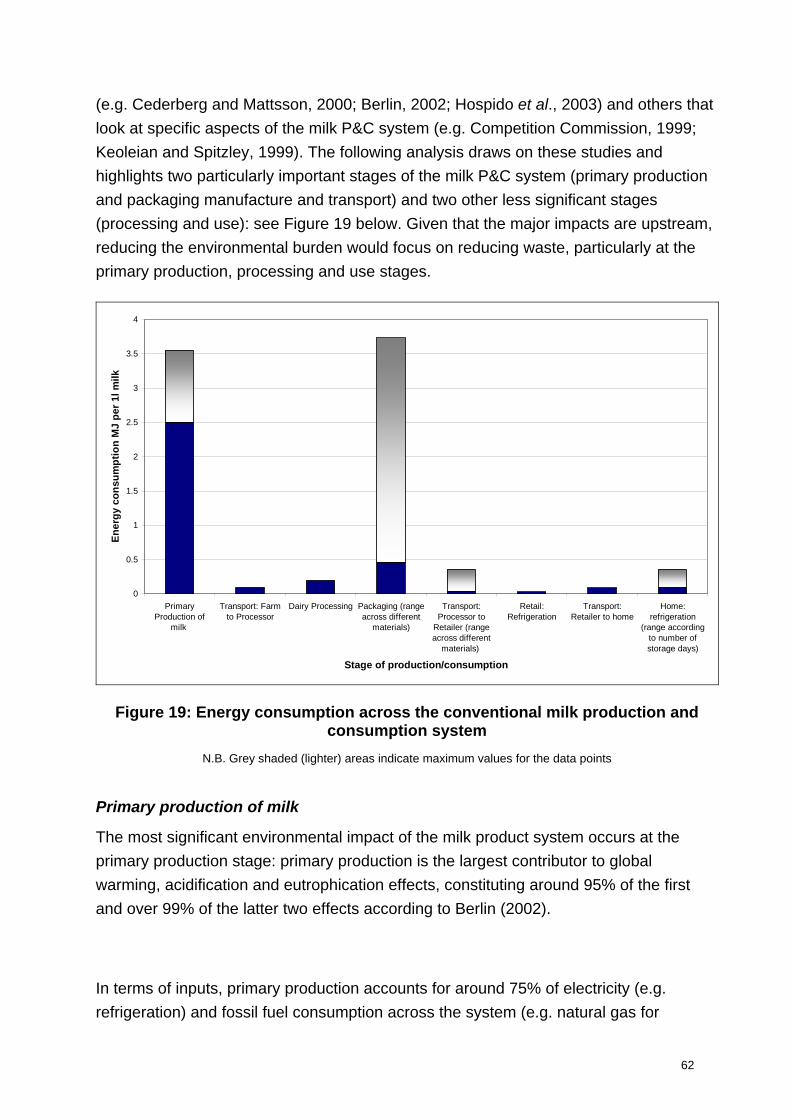
62
(e.g. Cederberg and Mattsson, 2000; Berlin, 2002; Hospido et al., 2003) and others that look at specific aspects of the milk P&C system (e.g. Competition Commission, 1999; Keoleian and Spitzley, 1999). The following analysis draws on these studies and highlights two particularly important stages of the milk P&C system (primary production and packaging manufacture and transport) and two other less significant stages (processing and use): see Figure 19 below. Given that the major impacts are upstream, reducing the environmental burden would focus on reducing waste, particularly at the primary production, processing and use stages.
0
0.5
1
1.5
2
2.5
3
3.5
4
PrimaryProduction of
milk
Transport: Farmto Processor
Dairy Processing Packaging (rangeacross different
materials)
Transport:Processor to
Retailer (rangeacross different
materials)
Retail:Refrigeration
Transport:Retailer to home
Home:refrigeration
(range accordingto number ofstorage days)
Stage of production/consumption
Ener
gy c
onsu
mpt
ion
MJ
per 1
l milk
Figure 19: Energy consumption across the conventional milk production and consumption system
N.B. Grey shaded (lighter) areas indicate maximum values for the data points
Primary production of milk
The most significant environmental impact of the milk product system occurs at the primary production stage: primary production is the largest contributor to global warming, acidification and eutrophication effects, constituting around 95% of the first and over 99% of the latter two effects according to Berlin (2002).
In terms of inputs, primary production accounts for around 75% of electricity (e.g. refrigeration) and fossil fuel consumption across the system (e.g. natural gas for

tractors and other agricultural equipment): total energy use on conventional farms accounts for approximately 3.5MJ per litre14 (energy corrected) milk, total water use is approx 0.3g per litre milk (Cederberg and Mattsson, 2000; Berlin, 2002). For UK production, Williams et al. (2006) quote primary energy use for milk to the farm gate as 2.5MJ/l. In terms of outputs, the generation of solid manure and manure slurries and the use of chemical fertilisers and pesticides pollute surface water and ground water (UNEP, 2000): the global warming contribution of primary production has been measured between 800g and 1400g CO2 equivalent per kg ECM (energy corrected milk), acidification impacts as between 16 and 18 g equivalent SO2 per litre, and eutrophication potential of between 2.120g and 2.75g O2 equivalent per kg ECM for Swedish production and 6.4 g equivalent PO4
3- for UK production (Berlin, 2002; Cederberg and Mattsson, 2000; Williams et al., 2006).
It is very important to note that there is NO correlation between the relative importance of energy use and of global warming potential at different stages of the life cycle of milk and other dairy products (or indeed for most food products). 3.6MJ primary energy is equivalent to 1 kWh: the UK Government’s Greenhouse Gas Reporting Guidelines (DEFRA 2005) indicate that, if delivered as mains gas this is equivalent to 190 g CO2, if delivered as diesel 250g CO2 and if delivered as electricity (in which case it would arrive as 0.7MJ useable electricity) it is equivalent to 170 g CO2. The additional contributions from methane (CH4) and nitrous oxide (N2O) take the GWP associated with agricultural production of milk to between 3.5 and 9 times (depending on the fuel used and milk production method) the GWP associated with the 3.6MJ energy use shown in Figure 19 (p62). Were the data available to generate it, an equivalent chart to Figure 19 based on GWP rather than energy input would therefore be dominated by the primary production stage.
Much of the LCA input and output data is from recent Scandinavian studies, many conducted by the Swedish Institute for Food and Biotechnology in the late 1990s. The evidence is drawn from a small number of dairy farm case studies. Efficiency data for dairy farms show increasing returns to scale (to a minimum efficient technical scale) and evidence suggests that, when controlling for herd size, the yield of UK cows is lower than in Scandinavian or Spain (Competition Commission, 1999; Hospido et al., 2003; Cederberg and Mattsson, 2000). Given that there is no significant importing of liquid
14 The original figure is 3.55 MJ per kg energy corrected milk: we have assumed a specific gravity of 1000kgm to make an approximate conversion to litres.
-3
63
milk to the UK (Panorama of European Business, 2003), caution should be exercised when considering the relevance of this data for UK farms. However, as Williams et al. (2006, p81-82) themselves note; agreement between the Swedish and UK-specific work is close.
Packaging materials for milk
The type of primary packaging for milk used can increase - by over seven times - the energy consumption associated with milk’s manufacture, processing and transport (Keoleian and Spitzley, 1999). Swiss data used by Keoleian and Spitzley (1999) suggest that the energy consumption of milk packaging at the manufacturing stage varies between 0.4623 MJ per litre of milk for linear low-density polyethylene flexible pouches and 3.7328 MJ per litre of milk for glass bottles. Most dairies are located close to urban areas and milk is transported directly from the dairy to the retailer (Competition Commission, 1999; IGD, 2003), so packaging choice (i.e. the type of packaging and the number of units transported per ‘trip’) affects significantly the transport stage between the milk processors and the retailers. Keoleian and Spitzley (1999) estimate that the proportion of impacts at the transport of milk stage (as a proportion of the total packaging manufacture and transport impact) varies between 2% and 21% of total energy consumption of milk delivered for paperboard gable top cartons and polycarbonate refillable bottles respectively. In addition to energy consumption impacts, the type of packaging has important implications for plastics have a significant effect on acidification, photochemical oxidants and waste management (Sonesson and Berlin, 2002).
Transport (dairy farms to processors)
UK Milk Purchasers buy milk from the dairy farms and sell it to processors. There are 130 Milk Purchasers in the UK but the industry is dominated by three large firms (London Economics, 2003; KPMG, 2003).15 Bulk milk tankers transport milk either direct from the farm to the dairy or via a ‘transhipment depot’ at the rate of 120 litres per vehicle kilometre (Competition Commission, 1999).16 Tankers are not refrigerated but are insulated and the Milk Purchasers guarantee delivery at less than 6 degrees centigrade (ibid.).
15 First Milk, Dairy Farmers of Britain and Milk Link (London Economics, 2003). 16 Direct farm-to-processor tankers are typically 26 tonnes (approx. 17000 litres milk) and on average have to collect from 15 farms before the tanker is full; trans-shipment tankers are larger, holding 38 tonnes (approx. 25000 litres milk) (Competition Commission, 1999).
64
Given the constant weight of milk and assuming similar transport modes, the environmental impact of transport from the farm to the dairy depends on the location of producer and processor and on the operating parameters of vehicles17. Milk production in the UK is concentrated in Shropshire, Cheshire, Lancashire and the West Country (DEFRA, 2001) and most milk is processed by dairies located near urban areas (Competition Commission, 1999). From transport data in Competition Commission 1999 average energy consumption at this stage can be calculated as c. 96MJ/1000 litre milk, which corresponds - since this is in the form of diesel fuel – to approx. 7g direct CO2 emissions per litre of milk (i.e. 2 orders of magnitude less than the GWP associated with primary production).
Dairy processing
After primary production and the production of packaging materials, the processing of milk at dairies is the most intensive part of the liquid milk life cycle in terms of energy use. As with primary production, the efficiency of this stage depends largely on the size of processing operations, with considerable economies of scale (Keoleian and Spitzley, 1999; Sonesson and Berlin, 2002).18 The main environmental impacts associated with dairy processing are the high consumption of water, the discharge of effluent with high organic loads and the consumption of energy: total energy consumption in processing is 0.2MJ/kg milk produced, total fuel consumption (an input to the boiler) is 0.46MJ/kg milk produced and total water consumption is between 1.3-2.5 litres water/kg milk (UNEP, 2000).
Much of the available data about this is European (Scandinavian in particular) and is based on dairy processor case studies undertaken at the beginning of the 1990s. When considering the relevance of the data for the UK, one must consider the potential for improvements in both the energy and water efficiencies as a result of regulatory change (e.g. CCA, IPCC, packaging regulations), technological change (e.g. particularly in the use of IT and new cleaning systems) and industrial structure change (i.e. increased concentration amongst milk processors and retailers) that may have taken place in the past 5-10 years.
17 Since we know how much milk is produced (14.2bn litres in 2004), the size and proportionate use of tankers (operating at optimum capacity) and the litres transported per vehicle kilometre; with data on the fuel consumption of tankers and global warming coefficients we could calculate the fuel consumption and associated environmental impact of the average farm to processor journey (notwithstanding improvements in vehicle efficiency). 18 Hence, dairy processing has become increasingly a concentrated sub-sector of the dairy industry where, in 2000, the five largest dairy firms accounted for around 60% of milk processed: Dairy Crest, Express Dairies, Glanbia, Arla and Wiseman (London Economics, 2003; KPMG, 2003).
65
Retail
Milk is stored at retailers’ premises in cold storage rooms and in refrigerated display units. While we have no data about milk throughput in the average supermarket, we know that milk is one of the top selling items in the supermarkets and can safely assume that throughput is high.
There is no published research that seeks to allocate part of retail energy consumption to milk. Carlsson-Kanyama and Faist (2000) quote electricity consumption of retail refrigerated displays at 0.12MJ/litre net volume/day, and that of “cool rooms” at 0.0025MJ/litre/day. If the average storage time for milk in a retailer’s refrigerated display was 6 hours and in a cool room 12 hours, energy consumption for storage of 1000 litres milk at the retailer would be around 30MJ of delivered electricity – somewhat less than the energy consumed for transport from the farm to the processor but equivalent to 78MJ primary energy.
In the home
There appears to be no published information concerning average storage times for milk in the home or the proportion of milk wasted by consumers. Storage times are clearly limited by the perishable nature of the product, which suggests that there is considerable potential for loss through spoilage – a hypothesis supported by the results of another recent Swedish study (Sonesson, Anteson, Davis & Sjödén, 2005). Electricity consumption for domestic refrigeration may fall within a considerable range, from theoretical values for new efficient appliances of 0.005MJ/litre net capacity /day up to 0.035MJ/litre/day for working devices filled to 50% of capacity (Carlsson-Kanyama & Faist (2000)). If milk is stored for 2 days in the home on average (again, this is a purely hypothetical figure), then storage in the home would represent electricity consumption of 0.07MJ delivered electricity/litre milk, rather more than storage at retailers’ premises – but of the same order of magnitude.
Implications of alternative forms (organic, low fat, soya)
The implications of consuming organic milk vis-à-vis conventional milk are only significant at the primary production stage. Organic milk production is less energy intensive than conventional production (Table 8 below).
66

Table 8: Primary energy demand for different milk production methods
Data Source Primary energy per litre milk at farm gate (MJ/l)
Conventional Organic UK (Williams et al. 2006) 2.5 1.6 Sweden (Cederberg & Mattsson, 2000) 3.6 2.5
Cederberg and Mattsson (2000) point to the higher use of fertilisers in conventional production and the employment of different feeding strategies as the cause of the difference in primary energy input. For calculated environmental impacts, the differences between organic and conventional milk production are much less marked, however. Cederberg and Mattsson, (2000) found that organic milk has lower global warming potential (13.6% less CO2 equivalent per tonne ECM) and lower acidification potential (12% less SO2 equivalent per tonne) than conventional production, but the differences are less pronounced than the differences in primary energy input. On the other hand, because of the type of feed used they found that organic production contributes more than conventional to eutrophication (9% more O2 equivalent per tonne ECM associated with higher nitrate leaching19), while photo-oxidant formation is higher for organic production than for conventional because of the less productive use of tractor diesel (i.e. the lower yield per unit area). Finally, it is estimated that organic production requires 80% more land to produce a unit of milk than does conventional farming.
Williams et al. (2006) find that all of these impacts are higher for organically-produced milk than they are for the conventional product (Table 9 p68). Pesticide use is completely eliminated, on the other hand, and other approaches to studying the environmental impacts of farming seem to indicate that this has beneficial effects for biodiversity in farmland (see for example Haas et al., 2001).
Outside the primary production stage, dis-economies of scale in dairy farm to processor transport are likely to impact on the efficiency of organic transport from farm to dairy (although this is more a function of farm size than of the production system, and it could be argued that the preceding analysis takes sufficient account of the consequences of spreading production more thinly). Notwithstanding a preference for recyclable
19 Notwithstanding the greater nitrate leaching, Cederberg and Mattsson (2000) argue that it is difficult to estimate whether organic or conventional farming is more damaging in terms of eutrophication.
67
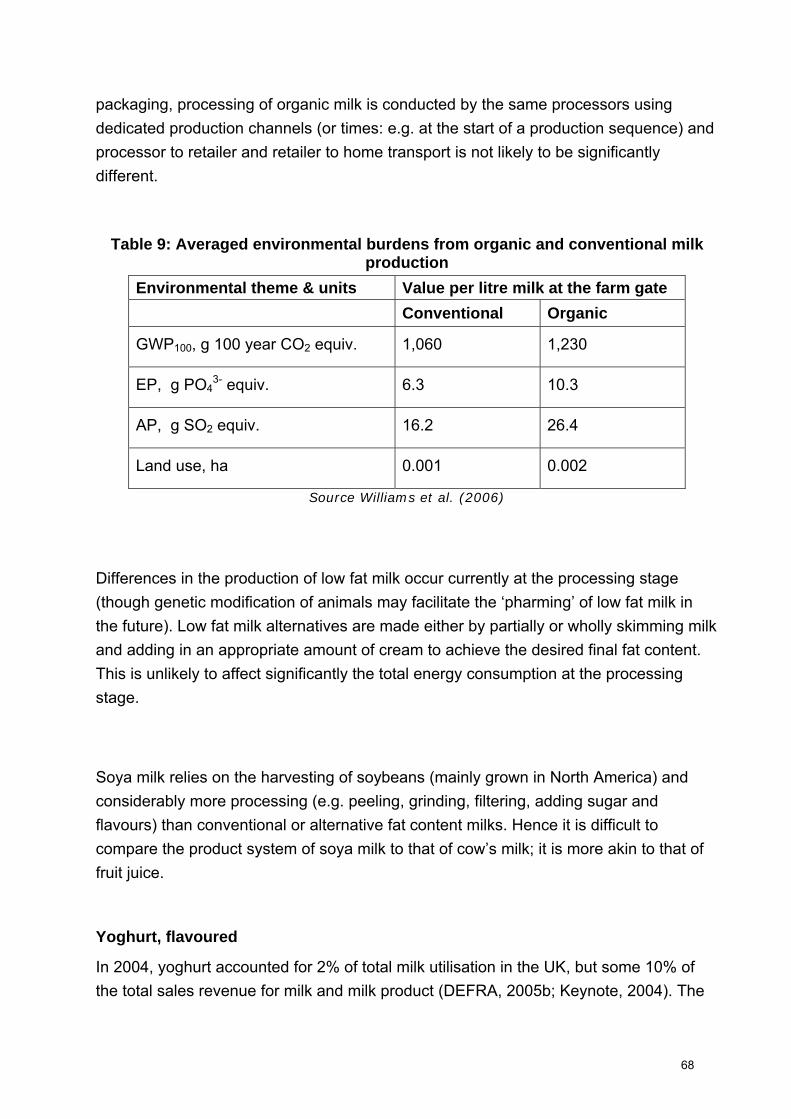
packaging, processing of organic milk is conducted by the same processors using dedicated production channels (or times: e.g. at the start of a production sequence) and processor to retailer and retailer to home transport is not likely to be significantly different.
Table 9: Averaged environmental burdens from organic and conventional milk production
Environmental theme & units Value per litre milk at the farm gate Conventional Organic
GWP100, g 100 year CO2 equiv. 1,060 1,230
EP, g PO43- equiv. 6.3 10.3
AP, g SO2 equiv. 16.2 26.4
Land use, ha 0.001 0.002
Source Williams et al. (2006)
Differences in the production of low fat milk occur currently at the processing stage (though genetic modification of animals may facilitate the ‘pharming’ of low fat milk in the future). Low fat milk alternatives are made either by partially or wholly skimming milk and adding in an appropriate amount of cream to achieve the desired final fat content. This is unlikely to affect significantly the total energy consumption at the processing stage.
Soya milk relies on the harvesting of soybeans (mainly grown in North America) and considerably more processing (e.g. peeling, grinding, filtering, adding sugar and flavours) than conventional or alternative fat content milks. Hence it is difficult to compare the product system of soya milk to that of cow’s milk; it is more akin to that of fruit juice.
Yoghurt, flavoured
In 2004, yoghurt accounted for 2% of total milk utilisation in the UK, but some 10% of the total sales revenue for milk and milk product (DEFRA, 2005b; Keynote, 2004). The
68
significance of yoghurt is perhaps better understood in terms of revenue and growth figures than in terms of the proportion of milk it uses. Yoghurt sales were worth £736m in 2002, slightly over 50% of the total short life dairy products (SLDP) market in the UK (Muller, 2003). Growth in the yoghurt market accounted for nearly 60% of all SLDP market growth between 1989 and 2002.
Milk is the principal ingredient of yoghurt and the discussion of the impacts of production of milk and its transport to the dairy are relevant. Three aspects of the system appear to give rise to most of the impacts: the production of milk, the production of (primary and secondary) materials and the processing of yoghurt. Three further aspects are of lesser importance, but not insignificant: the manufacture of the yoghurt packaging, the consumption and disposal of yoghurt in the home and the transport of yoghurt from the manufacturer to the retailer.
Although there are no complete LCA studies of yoghurt, there are studies that have looked at specific stages of the life cycle. The upstream milk production stage has received much attention, particularly from Scandinavian sources but also from UK sources. The life cycle of yoghurt packaging has been the emphasis of one US study and there are many qualitative studies describing resource efficiency gains in this sector. Data on yoghurt processing are less available; absolute and relative data have been drawn from a number of sources, and energy and water consumption calculations have been made using these.
The impacts of primary milk production are described under ‘Milk’. Studies report that approximately the same amount of raw milk is used to produce a unit of milk for sale as to produce a unit of yoghurt (Tamine and Robertson, 1999; Feitz et al., 2005) and so we assume that the data are applicable here also.20
Keoleian et al. (2004) provide energy consumption data on materials used for yoghurt pot production in the US.21 They conclude that the desired format of the yoghurt pots
20 The main ingredient in yoghurt is cow’s milk. Depending on the fat content of the yoghurt, skimmed milk (or skimmed milk powder) and full cream milk (or cream) are added in the desired proportion to make the yoghurt milk (e.g. 3591l of full cream milk + 6409l of skimmed milk = 1000l of yoghurt milk) (Tamine and Robertson, 1999, p. 18-19). 21 Much of the data is drawn from European studies and is likely to be relevant for a UK study.
69
and the type of plastic used are the most important factors determining the energy consumption in the materials production stage of the system. Energy consumption for raw material extraction and material production nearly doubles across different types of pot size and format (see the range in Figure 20 on p72). Keoleian et al. (2004) also argue that the energy consumption associated with the production of secondary packaging is significant.22 They account for this in the distribution between the manufacturer and retailer stage, where it accounts for 55% of total energy consumption.
Trends in consumption and production over the last twenty years have affected the energy consumption associated with yoghurt materials. On the one hand, consumer trends for increased product diversification and the production of more, different small pots have contributed to increased use of packaging (Berlin et al., 2005; Dewick et al., 2006). One the other hand, large resource efficiencies have been achieved by absolute reductions in the amount of packaging materials used (e.g. between 1970 and 1990 the average weight of plastic yoghurt pots fell from 11.8g to 5g: British Plastics Foundation).
Long-term trends in the yoghurt industry have seen increased output and product differentiation (Dewick et al., 2006). Despite efficiencies associated with centralised production, the adoption of new technologies and adherence to more stringent environmental regulations, yoghurt production remains energy and water intensive. Energy is used primarily for pasteurisation (heating), homogenisation and cooling.23 Water is used in yoghurt production for processing (heating, cooling, recombining powders) and cleaning. Given that the cooling process is longer than the heating process, more capacity is required for cooling (40000 litre/hr water are needed to cool 8000 litre/hr yoghurt according to Tamine and Robertson, 1999, p.185). Water used for cleaning contains a higher proportion of pollutants (milk base, dilute yoghurt, bulk starter culture, dilute fruit, dilute stabilising compounds and detergent) than wastewater from the production process. The amount of wastewater depends on the volume of yoghurt produced and on water management practices.24 In a study of 19 Australian dairy plants, Feitz et al. (2005) present relative data for resource (raw milk, fuel, water, electricity) use in the production of market milk vis-à-vis yoghurt (see Table 10 p77). 22 In a DEFRA (2005a) life cycle assessment consultancy study of the secondary packaging of yoghurt pots, polyvinyl chloride and polystyrene collation trays (used for holding yoghurt pots) have total primary energy consumption of 1.16 MJ and 1.46MJ per tray respectively (around two thirds of which is fuel energy for both products). 23 A continuous plant with a capacity of 4000l yoghurt per hour requires between 325 and 840kg/hr steam and between 4000 and 9200l/hr water (Tamine and Robertson, 1999, p.170). 24 There is no recent widely available data on the water to milk ratio for the production of yoghurt: IDF (1981) report that food grade water (that used in the product) was 0.5-1.0 litres per litre of milk, boiler water was 0.2-0.35 litres per litre of milk and cooling water was 2.0-4.0 litres per litre of milk.
70

Yoghurt uses approximately the same amount of raw milk and fuel but uses twice as much water and six times as much electricity (Feitz et al. 2005). The amount of electricity required for the production of milk is 0.2MJ per kg/milk; from this, we can estimate that 1.2MJ per kg/yoghurt is required. Given the consistency with UNEP (2000) data, we assume also that the fuel input into 1kg of yoghurt is 0.46MJ.
Energy and water consumption, milk waste and packaging in yoghurt plants are influenced to a great degree by product sequencing, since management of product changeovers strongly influences the amount of cleaning required. Berlin (2004) shows that through optimal production schedules milk waste can be reduced from 4% of total production impact to around 2%: in the plant studied, this was equivalent to 5882 kg of milk per week (the weekly production of 36 cows). Optimal scheduling also reduces consumption (and the associated production and transport (to the dairy) of alkaline/ acidic cleaning products (2.5kg per cleaning cycle and 1.2kg per cleaning cycle respectively), water (estimated at 1000l per cleaning cycle) and energy (mainly to heat the water at 110 kWh per cleaning cycle). Reducing waste through optimal sequencing and consumers’ best practice exceeded the gains to be made through energy efficiency and transport (Berlin, 2005).
In the home it is advised that yoghurt is stored by the consumer at below 10ºC; this helps to slow down the biological and biochemical reactions taking place in the yoghurt, allowing it to survive for three weeks after production. Assuming that yoghurts are kept between one and seven days and given average yoghurt pot sizes (125ml), we can calculate the energy consumption associated with refrigeration. We assume that the largest refrigeration impact occurs at the household stage. The trend of product diversification in yoghurt production may have facilitated increased consumer choice but may also have increased wastage in the home because consumers do not use yoghurts in time (Berlin, 2005). In addition, the greater number of small pots inevitably leads to greater waste in pots of yoghurt that are consumed (ibid.). According to Polystyrene Australia, yoghurt pots are the most disposed polystyrene product in domestic garbage (by volume). It is currently not possible to recycle the majority of yoghurt pots because they are made up of different plastics of differing quality, which need to be recycled separately (http://www.recyclenow.com/at_home/yogurt_pots.html).
71

Keoleian et al. (2004) argue that energy consumption at the materials manufacturing stage (i.e. fabrication of the primary packaging e.g. injection moulding of the cups and lids) is influenced significantly by the type and form of packaging. Figure 20 (below) shows that energy consumption more than doubles for particular types and sizes of yoghurt pot25. At the manufacturing stage there has been improvements in the efficiency of materials manufacture, particularly in the use of variable frequency drives on large pumps and extruders to reduce energy and increased line size (or reduced line pressure) to increase product flow without an increase in energy (EPIC, 2001).
Energy consumption across the yoghurt production and consumption system
0
1
2
3
4
5
6
7
8
9
10
PrimaryProduction of
milk
Transport Milk:Farm to Yoghurt
Man
Primaryproduction of
packagingmaterials
TransportMaterial - MatProdn to Mat
Manu
Materialmanufacturing
TransportPackaging:
Materials manufto yog manu
YoghurtProcessing
TransportYoghurt:
Processor toRetailer
Retail(refrigeration)
TransportYoghurt:
Retailer tohome
Home(refrigeration)
Stage of production/consumption
Ener
gy c
onsu
mpt
ion
MJ
per 1
l milk
/yog
hurt
Figure 20: Energy consumption across the yoghurt production and consumption
system
Most yoghurt is packaged in standardised plastic cups and with secondary and tertiary packaging. In this form yoghurt can be transported efficiently in refrigerated lorries (<10ºC) (or insulated lorries in the winter months, Tamine and Robertson, 1999). This stage is associated with high energy consumption because yoghurt travels further between the producer and retailer than any other stage and because of the additional packaging increasing the weight.
25 As noted on p.65, use of primary energy input data in Fig. 20 leads to primary production being of less relative significance than it is in terms of Global Warming Potential – the environmental consequence of energy use of most current concern.
72
Implications of alternative forms (organic, pro-biotic, low fat, soya)
Within the yoghurt market, ‘healthy yoghurts’ are the largest and fastest growing constituent of the yoghurt market, accounting for over 40% of total yoghurt sales in 2002. Healthy yoghurts include diet brands, which hold the largest market share, organic, soya, bio and pro-biotic yoghurts (Muller, 2003). The bio market more than doubled between 1995 and 1999 to £89m (1/4 of the market) although the potential for further growth is questioned (ibid.). The low fat sector has grown faster than the market as a whole.
Although there are no independent data on organic yoghurt production, one can assume that the differential effects will occur mainly at the primary milk production stage (see the section on Milk) and the yoghurt processing stage. At the yoghurt processing stage, it is likely that the increased production of organic yoghurts will increase production runs and require additional cleaning; with all that implies for increased resource use (water, energy) and waste (milk).
To manufacture low fat yoghurt, the fat in the milk base is substituted for fat substitutes (materials with the same functional properties but without the calories). This may have effects on the environmental impact of the yoghurt production and consumption system, since it may lead to more milk being “deconstructed” into its constituent parts, dried and reconstituted – a process which inevitably involves energy inputs, water consumption and some losses. It is not possible to quantify these effects on the basis of evidence in the literature, however. This trend also has knock-on effects in terms of a surplus of cream, the effects of which are considered in Dewick et al. (2006).
Pro-biotic yoghurts include different cultures but, with the exception of further increasing product differentiation, have no significant effect on the environmental impact across the production and consumption system.
Notwithstanding the production of soy-milk (noted in the Milk analysis), the production of soy-milk yoghurt requires different fermentation and processing techniques. The ‘unacceptable’ (Tamine and Robertson, p.368) taste and colour can be overcome with
73
alternative additives (e.g. glucose, fructose, sucrose), although these are said not to impact significantly on the system.
Cheese
In the UK, most cheese consumption is of the ‘natural, hard, cheddar or cheddar type’; according to London Economics (2003), 37% of households buy this type of cheese, which makes it the second most popular dairy good after milk, 80-85% of sales in the UK cheese market are cheddar (KPMG, 2003).26 Cheese accounts for 23% of milk utilisation in the UK and is an important product in the dairy portfolio. Milk is the principal ingredient of cheese and the notes to the Milk analysis are relevant here. There has been one in-depth LCA of cheese (Berlin, 2002) and a number of other studies that have looked at cheese in addition to other products: the data in these studies are less comprehensive and less detail is available on the construction of the data set. Far and away the biggest impact of the cheese production and consumption system is at the primary (milk) production stage which accounts for the majority of energy consumption, global warming potential and eutrophication effects. The materials production stage and cheese processing stage are also important and are more resource intensive than for milk (see ‘Milk’). However, the stages of cheese packaging production – mainly because of the type of plastic – and cheese processing – mainly because of less product differentiation – are less resource intensive than for yoghurt (see ‘Yoghurt’).
Berlin (2002) provides a LCA of 1kg, plastic wrapped, Hushallsost cheese (26% fat), made by Arla Food in Sweden. The LCA impact at each stage includes the production/processing and its transport to the next stage: a summary of her study with respect primary energy consumption is shown in Figure 21 (below).
26 To put this popularity into context, the second most popular cheese is ‘natural, soft cheese (other than cottage cheese)’, which is regularly purchased by 7.6% of UK households (London Economics, 2003).
74

0
5000
10000
15000
20000
25000
30000
35000
40000
Primary Production of milk Primary production ofpackaging materials
Cheese Processing Retail (refrigeration) Home (refrigeration)
Stage of production/consumption
Ener
gy c
onsu
mpt
ion
kJ p
er 1
kg c
hees
e
Figure 21: Primary energy consumption across the cheese production and
consumption system
Primary production of milk
The largest input into cheese is milk, 10.1kg milk per 1kg cheese in Berlin’s study, a typical ratio for cheddar-type cheese also. Berlin (2002) shows that across the cheese production and consumption system, primary production contributed 94% to global warming, 99% to acidification and 99% to eutrophication. Assuming UK primary energy conversion rates, primary production accounts for 69% of primary energy consumption. There may be some question marks over the relevance of these figures for the UK. Berlin calculates that the GWP of cheese is 8.8kg CO2 equivalent per kg cheese; 8.3kg of which stem from the primary production stage. This translates as 0.83kg CO2 equivalent per kg milk, which as the Milk analysis has shown is at the bottom of the range of milk primary production GWP estimates (see ‘Milk’). This may explain partly the relatively low GWP across the cheese life cycle in Berlin’s study. Two other studies, for instance, Nissinen (2005) and California Energy Commission (2005), calculate far higher life cycle GWP for Finland and California (13kg and 26kg CO2 equivalent per 1kg cheese respectively). Garnett (2006) speculates that because the case study considers domestic production and consumption, Berlin’s study may under-estimate the GWP – this is likely to be the case for the UK, where indigenous production makes up 63% of the market (DEFRA, 2001). Perhaps more significant, the Swedish data is based on a fuel mix for electricity generation markedly different from that prevailing in the UK: Berlin (2002) acknowledges that the vast majority of Swedish electricity is generated by hydro-
75
power (46.8%) and nuclear power (46.55%); across Europe in 1994 the chief generators of electricity were coal (35.5%), nuclear (18%), lignite (15.5%), fuel oil (10.7%) and natural gas (11.2%) – hydropower (including wind and geo-thermal contributed only 6.8%).
Production of packaging materials
The impact of packaging production and transport is lower than for milk or yoghurt. The cheese in Berlin’s study was wrapped in low-density polyethylene (LDPE) and polyamide (PA); the secondary packaging was made of cardboard. As shown in the study of milk packaging by Keoleian and Spitzley (1999), LDPE is the least energy intensive material, which contributes significantly to the lower impact of cheese packaging production and transport vis-à-vis milk and yoghurt.
Cheese processing
The cheese production stage is more energy intensive than equivalent milk stage, accounting for 17% of energy consumption (over 9MJ primary energy per kg cheese). This is not inconsistent with energy use in UK dairies, where 9% of Whitby Creamery’s energy use is electricity for manufacturing. According to Feitz et al. (2005), the production of cheese (vis-à-vis market milk) requires more than four times as much raw milk, more than nine times as much water and wastewater, more than four times as much electricity and three times as much fuel. Feitz et al’s electricity figures are similar to those reported by UNEP (2000), in which cheese production uses 0.76 MJ electricity per kg cheese compared to 0.2 MJ electricity per kg milk for milk production. UNEP (2000) estimate that 4.34 MJ fuel per kg cheese, which is nearly ten times as much. This range of estimates is reflected in Figure 21 (p75); it is considered likely that the bottom end of the range is more accurate given the age of the data upon which the UNEP (2000) study draws27. Nevertheless, this is less resource intensive than for the production of yoghurt (see Table 10 below, which also highlights the relative energy intensity of drying milk to produce milk powder). The potential gains offered by scheduling in the production of yoghurt are not a source of increased efficiency in the cheese industry because there is far less product diversification.
27 The inclusion or exclusion of whey processing will also strongly affect the reported energy-intensity of cheese production, since whey processing typically involves drying a material which contains 5-10% solids.
76
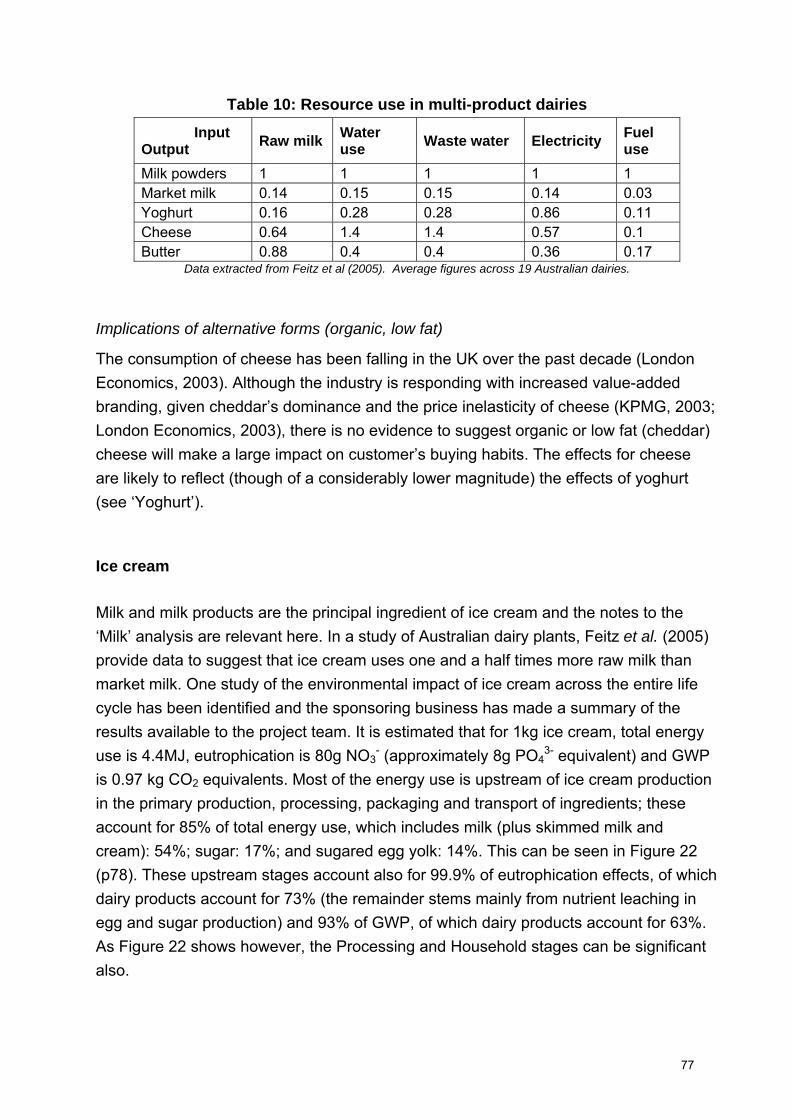
Table 10: Resource use in multi-product dairies Input Output Raw milk Water
use Waste water Electricity Fuel use
Milk powders 1 1 1 1 1 Market milk 0.14 0.15 0.15 0.14 0.03 Yoghurt 0.16 0.28 0.28 0.86 0.11 Cheese 0.64 1.4 1.4 0.57 0.1 Butter 0.88 0.4 0.4 0.36 0.17
Data extracted from Feitz et al (2005). Average figures across 19 Australian dairies.
Implications of alternative forms (organic, low fat)
The consumption of cheese has been falling in the UK over the past decade (London Economics, 2003). Although the industry is responding with increased value-added branding, given cheddar’s dominance and the price inelasticity of cheese (KPMG, 2003; London Economics, 2003), there is no evidence to suggest organic or low fat (cheddar) cheese will make a large impact on customer’s buying habits. The effects for cheese are likely to reflect (though of a considerably lower magnitude) the effects of yoghurt (see ‘Yoghurt’).
Ice cream
Milk and milk products are the principal ingredient of ice cream and the notes to the ‘Milk’ analysis are relevant here. In a study of Australian dairy plants, Feitz et al. (2005) provide data to suggest that ice cream uses one and a half times more raw milk than market milk. One study of the environmental impact of ice cream across the entire life cycle has been identified and the sponsoring business has made a summary of the results available to the project team. It is estimated that for 1kg ice cream, total energy use is 4.4MJ, eutrophication is 80g NO3
- (approximately 8g PO43- equivalent) and GWP
is 0.97 kg CO2 equivalents. Most of the energy use is upstream of ice cream production in the primary production, processing, packaging and transport of ingredients; these account for 85% of total energy use, which includes milk (plus skimmed milk and cream): 54%; sugar: 17%; and sugared egg yolk: 14%. This can be seen in Figure 22 (p78). These upstream stages account also for 99.9% of eutrophication effects, of which dairy products account for 73% (the remainder stems mainly from nutrient leaching in egg and sugar production) and 93% of GWP, of which dairy products account for 63%. As Figure 22 shows however, the Processing and Household stages can be significant also.
77
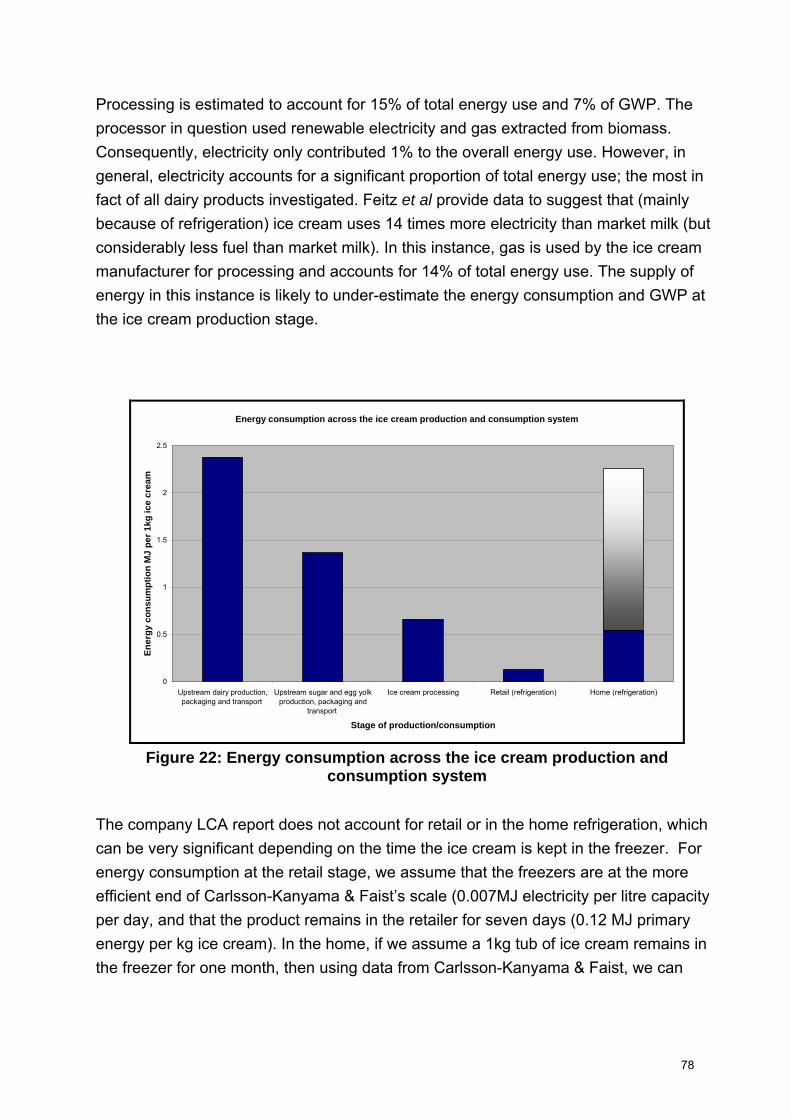
Processing is estimated to account for 15% of total energy use and 7% of GWP. The processor in question used renewable electricity and gas extracted from biomass. Consequently, electricity only contributed 1% to the overall energy use. However, in general, electricity accounts for a significant proportion of total energy use; the most in fact of all dairy products investigated. Feitz et al provide data to suggest that (mainly because of refrigeration) ice cream uses 14 times more electricity than market milk (but considerably less fuel than market milk). In this instance, gas is used by the ice cream manufacturer for processing and accounts for 14% of total energy use. The supply of energy in this instance is likely to under-estimate the energy consumption and GWP at the ice cream production stage.
Energy consumption across the ice cream production and consumption system
0
0.5
1
1.5
2
2.5
Upstream dairy production,packaging and transport
Upstream sugar and egg yolkproduction, packaging and
transport
Ice cream processing Retail (refrigeration) Home (refrigeration)
Stage of production/consumption
Ener
gy c
onsu
mpt
ion
MJ
per 1
kg ic
e cr
eam
Figure 22: Energy consumption across the ice cream production and
consumption system The company LCA report does not account for retail or in the home refrigeration, which can be very significant depending on the time the ice cream is kept in the freezer. For energy consumption at the retail stage, we assume that the freezers are at the more efficient end of Carlsson-Kanyama & Faist’s scale (0.007MJ electricity per litre capacity per day, and that the product remains in the retailer for seven days (0.12 MJ primary energy per kg ice cream). In the home, if we assume a 1kg tub of ice cream remains in the freezer for one month, then using data from Carlsson-Kanyama & Faist, we can
78

calculate that primary energy consumption will range between 0.5MJ and 2.2 MJ per kg ice cream depending on the age/efficiency of the domestic freezer.
There is no available specific information on organic or low fat ice cream; however, the differences are likely to be significant only at the milk production stage (see ‘Milk’).
Butter
There appears to be no publicly available LCA of butter. However, there are studies from which we can construct an idea of the environmental impacts associated with butter production and consumption. In considering these, it is important to remember that butter is to some extent a by-product in some milk processing, for example in some cheese production, where it is a means of turning surplus fat into saleable product. Butter is very much a commodity of UK dairying: only 2% of raw milk is used to manufacture butter and production is flexible, reacting to supply and demand fluctuations for market milk (DEFRA, 2001). The main difference between milk and yoghurt, on the one hand, and cheese and butter on the other, is the proportion of imported final products. The UK imports virtually no milk from overseas and very little yoghurt. However, the UK is 64% and 63% self-sufficient in butter and cheese respectively (DEFRA, 2001); much of the overseas butter comes from New Zealand and Denmark (London Economics, 2003). Therefore, the analysis refers to the domestic production and consumption of butter. The primary production of milk, butter processing and refrigeration are stages of the production and consumption system with important environmental implications.
Milk is the main component of butter and the notes on milk are relevant here also. Assuming that butter requires six times as much raw milk to produce butter as market milk (see Feitz et al., undated), the primary production of milk is the most energy intensive part of the production and consumption system, ranging between 17.8 and 21.3MJ per kg butter. The impact at this stage may be higher if we assume that:
1. Berlin’s figures for milk use in cheese production are correct; and
2. Feitz et al.’s relative data for butter using more milk than cheese are correct. Nevertheless, Figure 23 (p81) shows the energy consumption impacts are mainly at the primary production end of the production and consumption system. The same can be said for eutrophication and acidification (see ‘Cheese’).
79
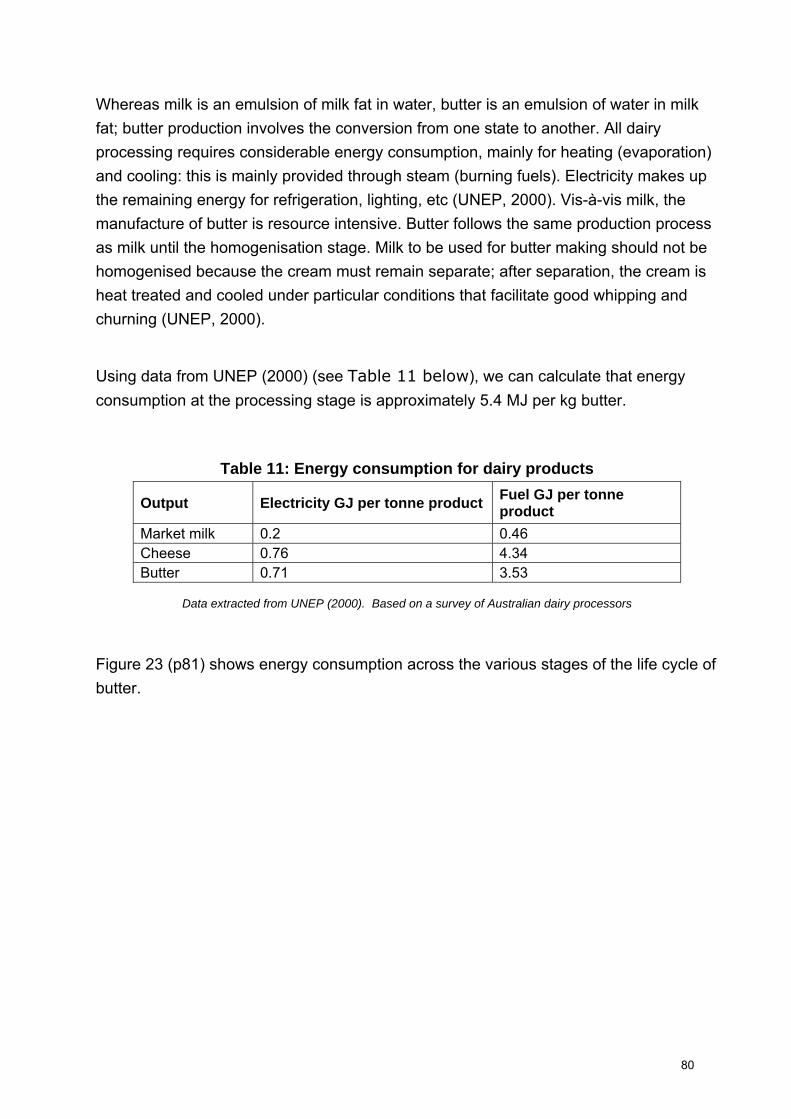
Whereas milk is an emulsion of milk fat in water, butter is an emulsion of water in milk fat; butter production involves the conversion from one state to another. All dairy processing requires considerable energy consumption, mainly for heating (evaporation) and cooling: this is mainly provided through steam (burning fuels). Electricity makes up the remaining energy for refrigeration, lighting, etc (UNEP, 2000). Vis-à-vis milk, the manufacture of butter is resource intensive. Butter follows the same production process as milk until the homogenisation stage. Milk to be used for butter making should not be homogenised because the cream must remain separate; after separation, the cream is heat treated and cooled under particular conditions that facilitate good whipping and churning (UNEP, 2000).
Using data from UNEP (2000) (see Table 11 below), we can calculate that energy consumption at the processing stage is approximately 5.4 MJ per kg butter.
Table 11: Energy consumption for dairy products
Output Electricity GJ per tonne product Fuel GJ per tonne product
Market milk 0.2 0.46 Cheese 0.76 4.34 Butter 0.71 3.53
Data extracted from UNEP (2000). Based on a survey of Australian dairy processors
Figure 23 (p81) shows energy consumption across the various stages of the life cycle of butter.
80
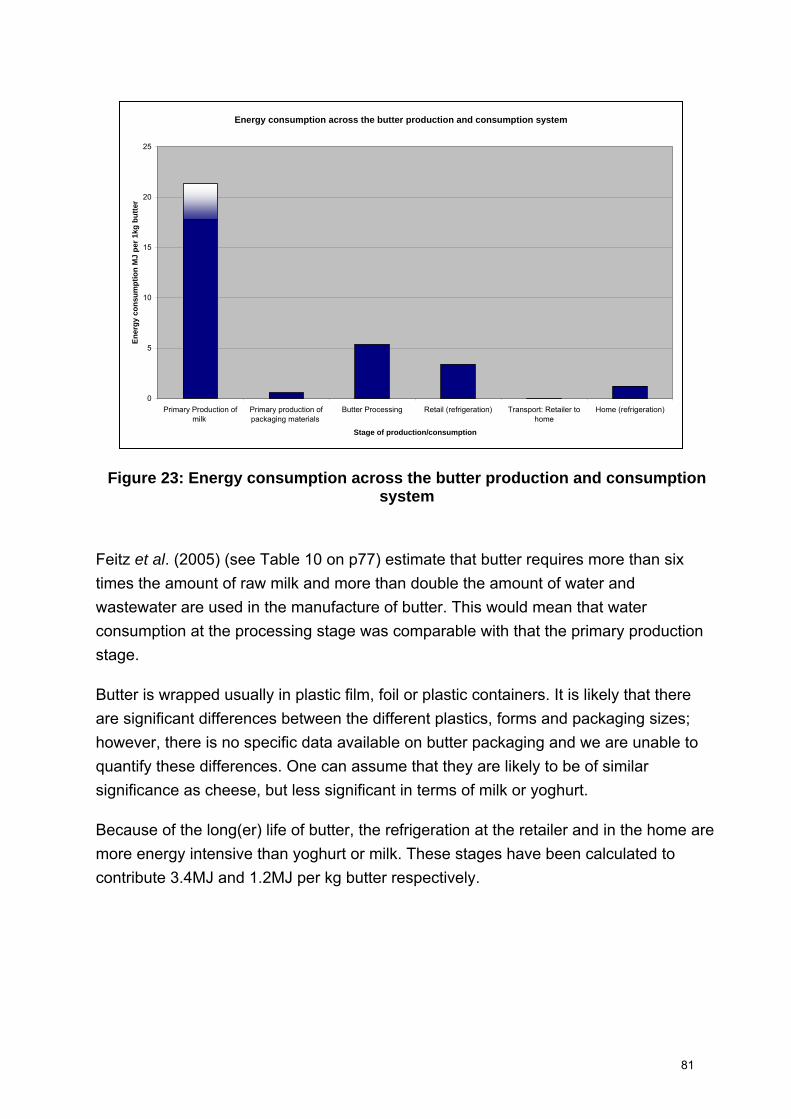
Energy consumption across the butter production and consumption system
0
5
10
15
20
25
Primary Production ofmilk
Primary production ofpackaging materials
Butter Processing Retail (refrigeration) Transport: Retailer tohome
Home (refrigeration)
Stage of production/consumption
Ener
gy c
onsu
mpt
ion
MJ
per 1
kg b
utte
r
Figure 23: Energy consumption across the butter production and consumption system
Feitz et al. (2005) (see Table 10 on p77) estimate that butter requires more than six times the amount of raw milk and more than double the amount of water and wastewater are used in the manufacture of butter. This would mean that water consumption at the processing stage was comparable with that the primary production stage.
Butter is wrapped usually in plastic film, foil or plastic containers. It is likely that there are significant differences between the different plastics, forms and packaging sizes; however, there is no specific data available on butter packaging and we are unable to quantify these differences. One can assume that they are likely to be of similar significance as cheese, but less significant in terms of milk or yoghurt.
Because of the long(er) life of butter, the refrigeration at the retailer and in the home are more energy intensive than yoghurt or milk. These stages have been calculated to contribute 3.4MJ and 1.2MJ per kg butter respectively.
81
Meat products
Summary
• The EIPRO analysis places meat production and processing among the top 5 contributors to all the environmental themes it considers. As for other food-related consumption categories, meat production and processing is most significant in terms of eutrophication, for which EIPRO estimates that it contributes around 11% to total EU-wide impacts.
• Poultry production and processing is covered separately from meat in the EIPRO analysis but is almost as significant, accounting for 7% of the total eutrophication impacts in the EU.
• Studies of meat products using LCA techniques seldom extend beyond the meat production (i.e. agricultural) stage. Those that do cover more of the life cycle, including estimates made in this project, indicate that agricultural production is the main source of impacts in the life cycles of meat products.
• Many researchers note the relatively high energy intensity of meat production on a per kg basis28. A recent investigation of UK production practices calculated that the energy required to produce 1kg of beef is 28MJ, that for 1kg sheep meat it is 23MJ, for 1kg pork 17MJ and for 1kg poultry meat 12MJ. Since a significant amount of meat used by food processors is not produced in the UK, these data are not relevant to all UK consumption.
• The production of feedstuffs makes the largest contribution to these energy requirements. Organic production is associated with lower energy demands for beef, sheep and pig meat, but higher energy requirements for poultry meat.
• Direct emissions of methane from the enteric processes of ruminant animals, and nitrous oxide emissions from soil processes are much more significant than energy use as a source of greenhouse gases in meat production systems: as a result organic meat does not necessarily have lower Global Warming Potential than non-organic. For sheep meat and pig meat, organic production gives rise to lower overall greenhouse gas emissions across the production system, while for beef
28 Note that weight-for-weight comparison is not necessarily a comparison based on functionality!
82

and poultry, it gives rise to higher emissions in this category. Only for sheep meat is the difference greater than about 30%.
• Those studies that cover the slaughtering of animals have found the environmental impacts associated with this to be of much less significance than those linked to agriculture. Coarse calculations made for this project suggest that consumers’ activities may well be more significant.
• For chicken, the processing stage of the life cycle is as significant as “conventional” agricultural production in terms of energy requirements and appears to be more water intensive.
• Comparison of global warming impacts associated with fresh and frozen chicken through the life cycle up to the retailer, highlights the additional burdens associated with freezing and frozen storage already noted for vegetables.
Beef
A market analysis conducted by Mintel indicated that 301,000 tonnes of beef were sold in the UK in 2004, accounting for 51% of the red meat market. Beef sales have experienced an increase of 4.5% since 2002, a trend that is predicted to continue, with a forecast growth of 3% in the period 2004-2009. This is in contrast to all other red meat sales that are to fall (Mintel, 2005).
No study of the entire life cycle of beef has been found in the literature. However, several studies have been conducted examining the impact of primary production of beef (to the farm-gate), including a study conducted by the Silsoe Research Institute (Williams et al 2006) which presents some data on the environmental impact of the primary production beef in the UK; an LCA of the environmental impacts of beef fattening in Japan (Ogino et al. 2004) and a study of greenhouse gas emissions associated with different methods of beef rearing in Ireland (Casey and Holden, 2006). None of these differentiates between different cuts of meat.
83
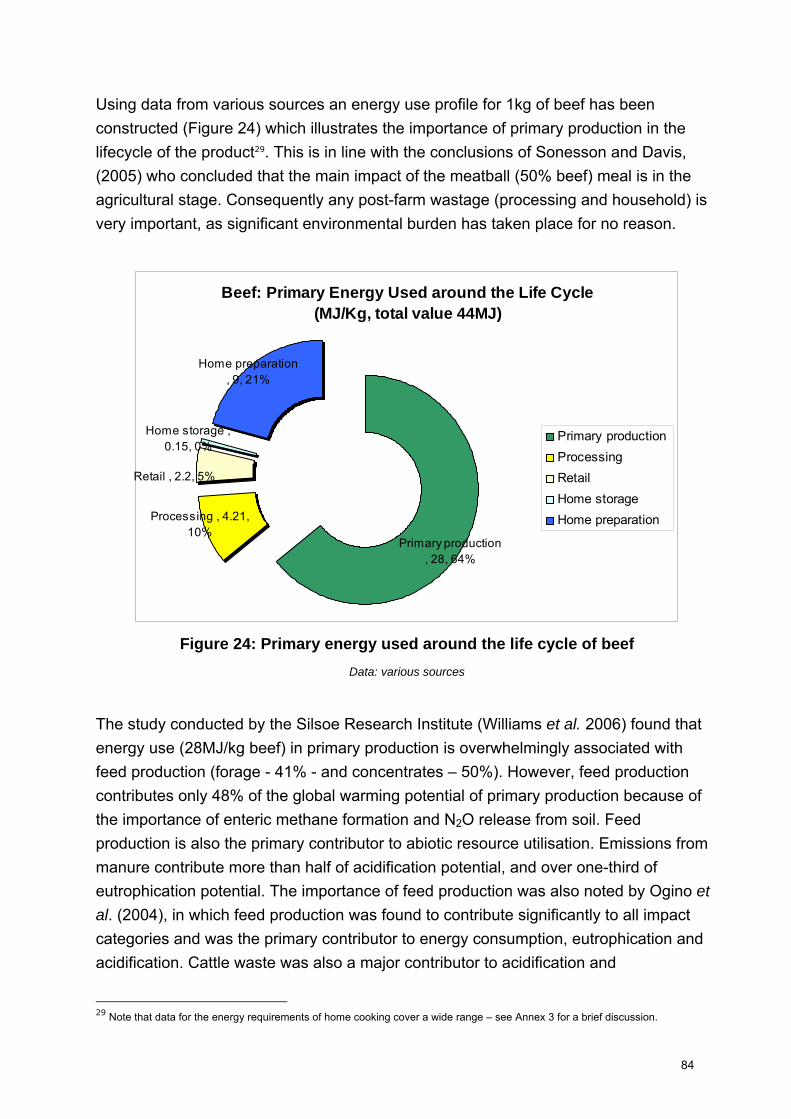
Using data from various sources an energy use profile for 1kg of beef has been constructed (Figure 24) which illustrates the importance of primary production in the lifecycle of the product29. This is in line with the conclusions of Sonesson and Davis, (2005) who concluded that the main impact of the meatball (50% beef) meal is in the agricultural stage. Consequently any post-farm wastage (processing and household) is very important, as significant environmental burden has taken place for no reason.
Beef: Primary Energy Used around the Life Cycle (MJ/Kg, total value 44MJ)
Primary production , 28, 64%
Processing , 4.21, 10%
Retail , 2.2, 5%
Home preparation , 9, 21%
Home storage , 0.15, 0%
Primary production Processing Retail Home storage Home preparation
Figure 24: Primary energy used around the life cycle of beef
Data: various sources
The study conducted by the Silsoe Research Institute (Williams et al. 2006) found that energy use (28MJ/kg beef) in primary production is overwhelmingly associated with feed production (forage - 41% - and concentrates – 50%). However, feed production contributes only 48% of the global warming potential of primary production because of the importance of enteric methane formation and N2O release from soil. Feed production is also the primary contributor to abiotic resource utilisation. Emissions from manure contribute more than half of acidification potential, and over one-third of eutrophication potential. The importance of feed production was also noted by Ogino et al. (2004), in which feed production was found to contribute significantly to all impact categories and was the primary contributor to energy consumption, eutrophication and acidification. Cattle waste was also a major contributor to acidification and
29 Note that data for the energy requirements of home cooking cover a wide range – see Annex 3 for a brief discussion.
84
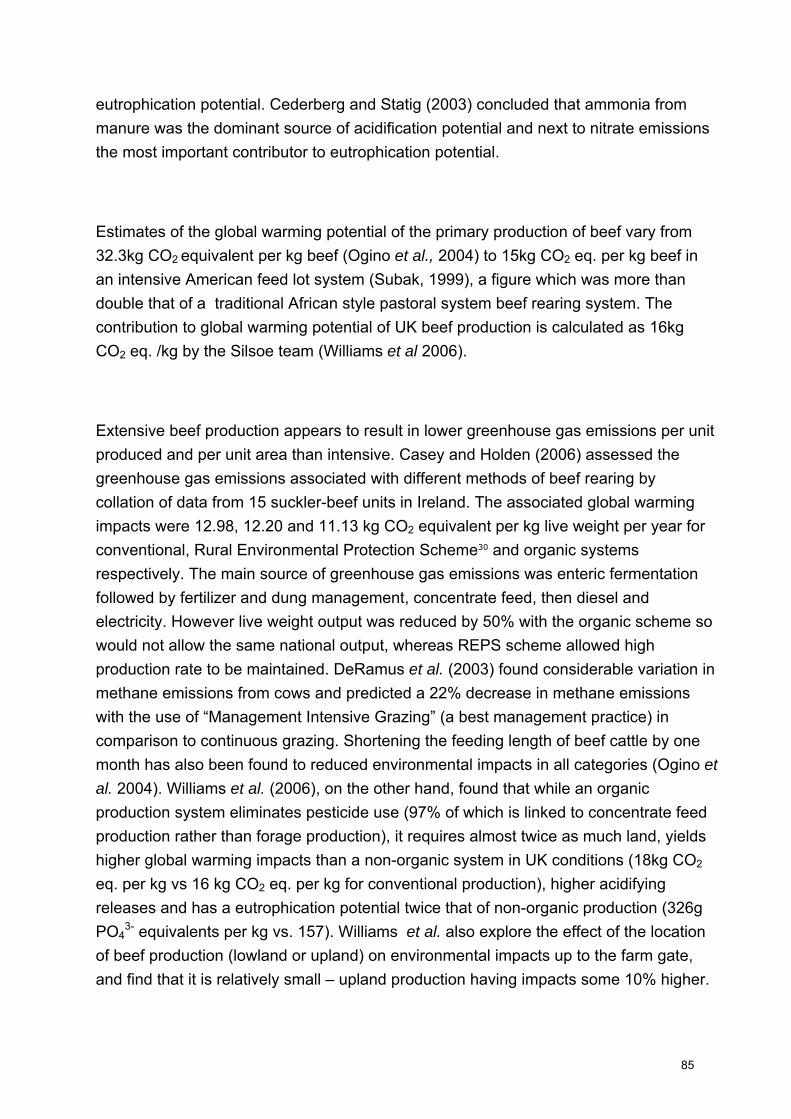
eutrophication potential. Cederberg and Statig (2003) concluded that ammonia from manure was the dominant source of acidification potential and next to nitrate emissions the most important contributor to eutrophication potential.
Estimates of the global warming potential of the primary production of beef vary from 32.3kg CO2 equivalent per kg beef (Ogino et al., 2004) to 15kg CO2 eq. per kg beef in an intensive American feed lot system (Subak, 1999), a figure which was more than double that of a traditional African style pastoral system beef rearing system. The contribution to global warming potential of UK beef production is calculated as 16kg CO2 eq. /kg by the Silsoe team (Williams et al 2006).
Extensive beef production appears to result in lower greenhouse gas emissions per unit produced and per unit area than intensive. Casey and Holden (2006) assessed the greenhouse gas emissions associated with different methods of beef rearing by collation of data from 15 suckler-beef units in Ireland. The associated global warming impacts were 12.98, 12.20 and 11.13 kg CO2 equivalent per kg live weight per year for conventional, Rural Environmental Protection Scheme30 and organic systems respectively. The main source of greenhouse gas emissions was enteric fermentation followed by fertilizer and dung management, concentrate feed, then diesel and electricity. However live weight output was reduced by 50% with the organic scheme so would not allow the same national output, whereas REPS scheme allowed high production rate to be maintained. DeRamus et al. (2003) found considerable variation in methane emissions from cows and predicted a 22% decrease in methane emissions with the use of “Management Intensive Grazing” (a best management practice) in comparison to continuous grazing. Shortening the feeding length of beef cattle by one month has also been found to reduced environmental impacts in all categories (Ogino et al. 2004). Williams et al. (2006), on the other hand, found that while an organic production system eliminates pesticide use (97% of which is linked to concentrate feed production rather than forage production), it requires almost twice as much land, yields higher global warming impacts than a non-organic system in UK conditions (18kg CO2 eq. per kg vs 16 kg CO2 eq. per kg for conventional production), higher acidifying releases and has a eutrophication potential twice that of non-organic production (326g PO4
3- equivalents per kg vs. 157). Williams et al. also explore the effect of the location of beef production (lowland or upland) on environmental impacts up to the farm gate, and find that it is relatively small – upland production having impacts some 10% higher.
85
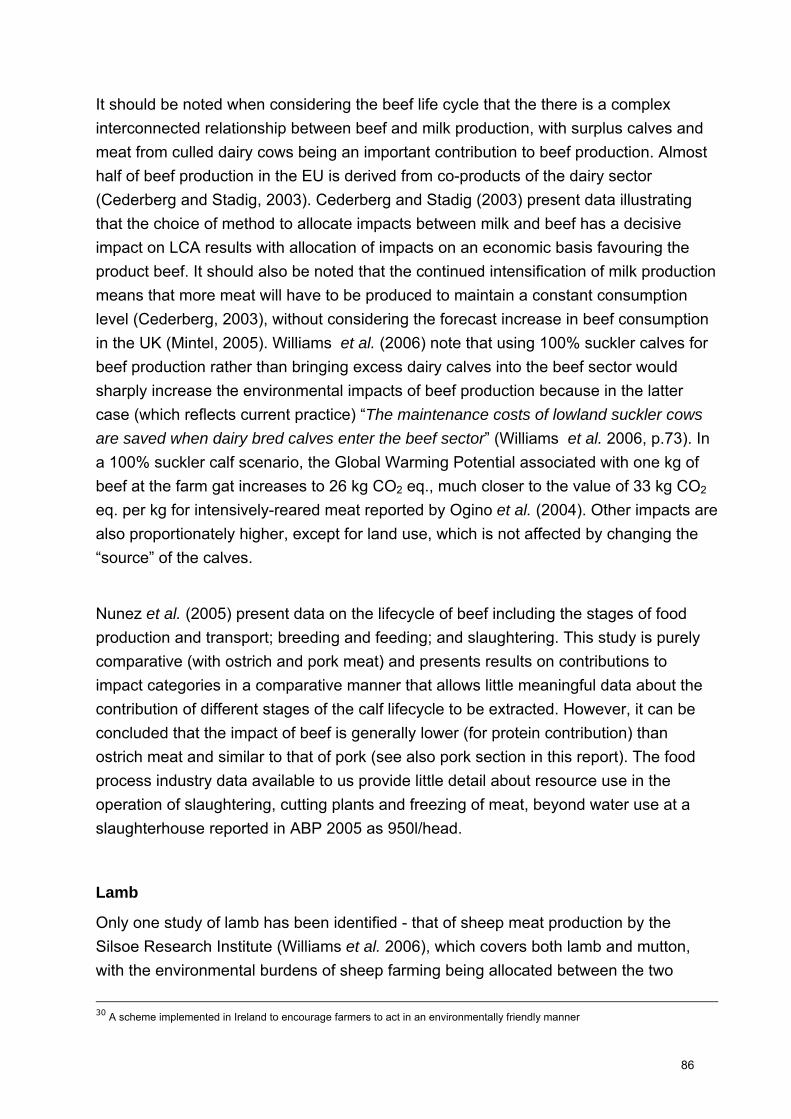
It should be noted when considering the beef life cycle that the there is a complex interconnected relationship between beef and milk production, with surplus calves and meat from culled dairy cows being an important contribution to beef production. Almost half of beef production in the EU is derived from co-products of the dairy sector (Cederberg and Stadig, 2003). Cederberg and Stadig (2003) present data illustrating that the choice of method to allocate impacts between milk and beef has a decisive impact on LCA results with allocation of impacts on an economic basis favouring the product beef. It should also be noted that the continued intensification of milk production means that more meat will have to be produced to maintain a constant consumption level (Cederberg, 2003), without considering the forecast increase in beef consumption in the UK (Mintel, 2005). Williams et al. (2006) note that using 100% suckler calves for beef production rather than bringing excess dairy calves into the beef sector would sharply increase the environmental impacts of beef production because in the latter case (which reflects current practice) “The maintenance costs of lowland suckler cows are saved when dairy bred calves enter the beef sector” (Williams et al. 2006, p.73). In a 100% suckler calf scenario, the Global Warming Potential associated with one kg of beef at the farm gat increases to 26 kg CO2 eq., much closer to the value of 33 kg CO2 eq. per kg for intensively-reared meat reported by Ogino et al. (2004). Other impacts are also proportionately higher, except for land use, which is not affected by changing the “source” of the calves.
Nunez et al. (2005) present data on the lifecycle of beef including the stages of food production and transport; breeding and feeding; and slaughtering. This study is purely comparative (with ostrich and pork meat) and presents results on contributions to impact categories in a comparative manner that allows little meaningful data about the contribution of different stages of the calf lifecycle to be extracted. However, it can be concluded that the impact of beef is generally lower (for protein contribution) than ostrich meat and similar to that of pork (see also pork section in this report). The food process industry data available to us provide little detail about resource use in the operation of slaughtering, cutting plants and freezing of meat, beyond water use at a slaughterhouse reported in ABP 2005 as 950l/head.
Lamb
Only one study of lamb has been identified - that of sheep meat production by the Silsoe Research Institute (Williams et al. 2006), which covers both lamb and mutton, with the environmental burdens of sheep farming being allocated between the two
30 A scheme implemented in Ireland to encourage farmers to act in an environmentally friendly manner
86
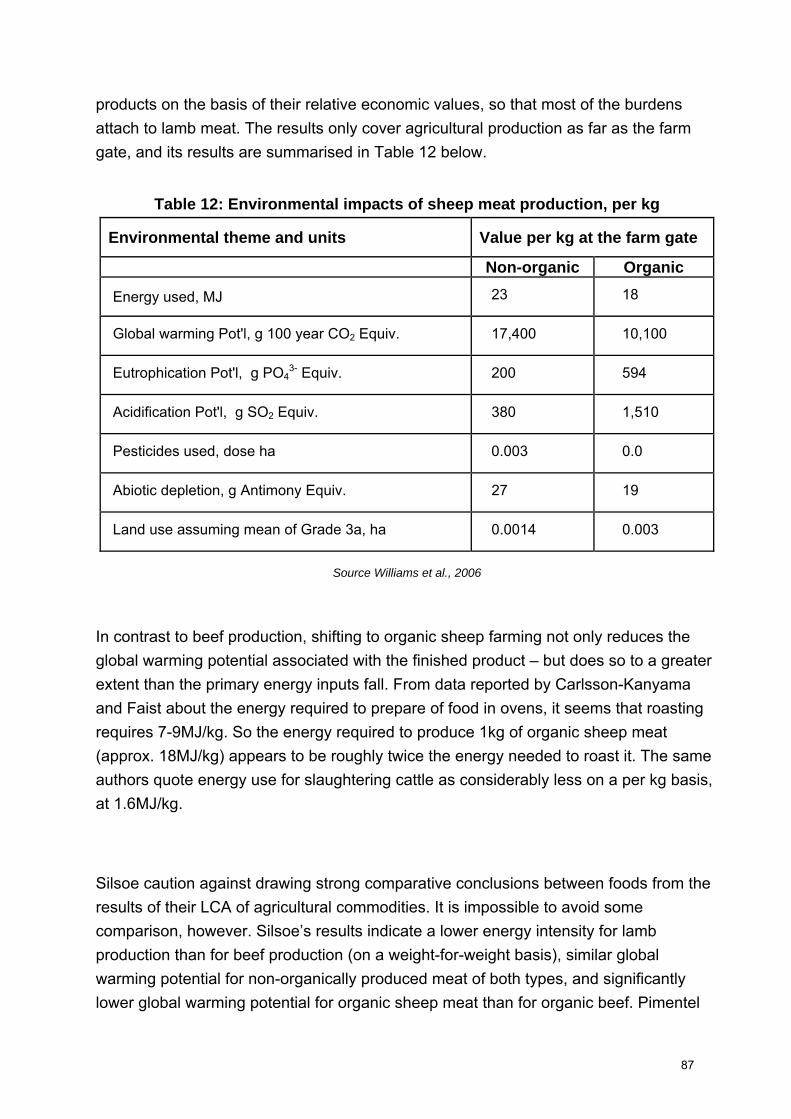
products on the basis of their relative economic values, so that most of the burdens attach to lamb meat. The results only cover agricultural production as far as the farm gate, and its results are summarised in Table 12 below.
Table 12: Environmental impacts of sheep meat production, per kg
Environmental theme and units Value per kg at the farm gate
Non-organic Organic
Energy used, MJ 23 18
Global warming Pot'l, g 100 year CO2 Equiv. 17,400 10,100
Eutrophication Pot'l, g PO43- Equiv. 200 594
Acidification Pot'l, g SO2 Equiv. 380 1,510
Pesticides used, dose ha 0.003 0.0
Abiotic depletion, g Antimony Equiv. 27 19
Land use assuming mean of Grade 3a, ha 0.0014 0.003
Source Williams et al., 2006
In contrast to beef production, shifting to organic sheep farming not only reduces the global warming potential associated with the finished product – but does so to a greater extent than the primary energy inputs fall. From data reported by Carlsson-Kanyama and Faist about the energy required to prepare of food in ovens, it seems that roasting requires 7-9MJ/kg. So the energy required to produce 1kg of organic sheep meat (approx. 18MJ/kg) appears to be roughly twice the energy needed to roast it. The same authors quote energy use for slaughtering cattle as considerably less on a per kg basis, at 1.6MJ/kg.
Silsoe caution against drawing strong comparative conclusions between foods from the results of their LCA of agricultural commodities. It is impossible to avoid some comparison, however. Silsoe’s results indicate a lower energy intensity for lamb production than for beef production (on a weight-for-weight basis), similar global warming potential for non-organically produced meat of both types, and significantly lower global warming potential for organic sheep meat than for organic beef. Pimentel
87
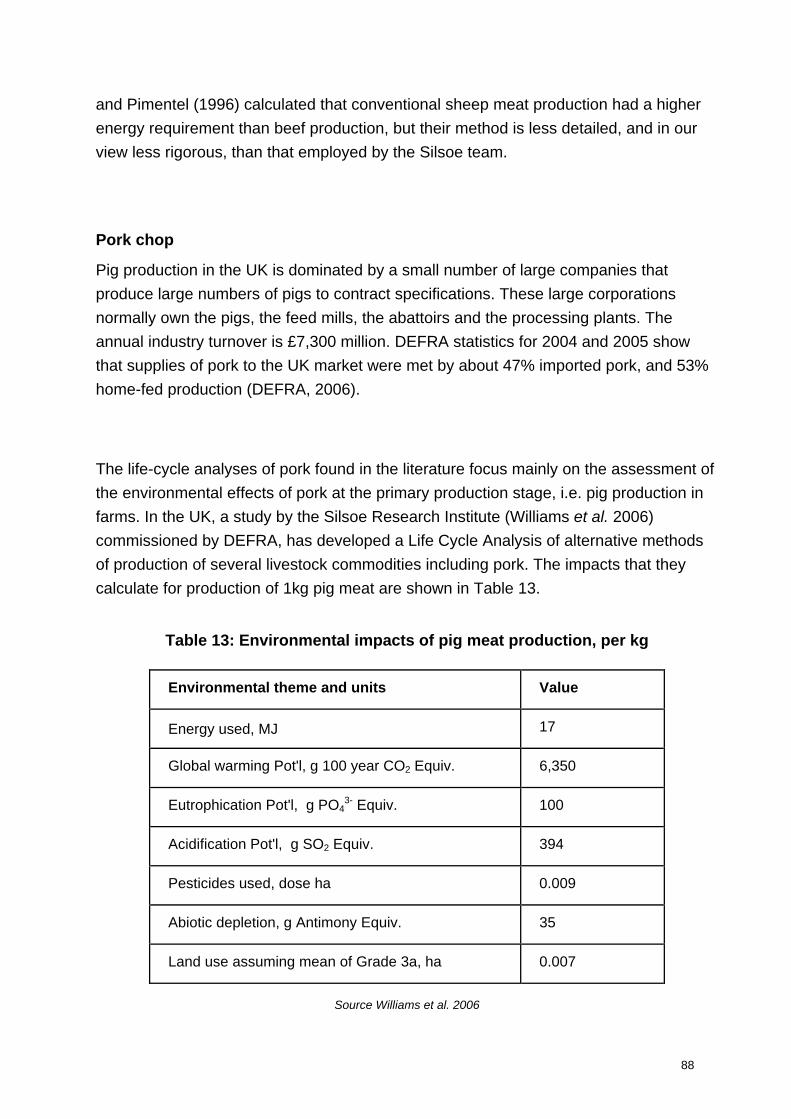
88
and Pimentel (1996) calculated that conventional sheep meat production had a higher energy requirement than beef production, but their method is less detailed, and in our view less rigorous, than that employed by the Silsoe team.
Pork chop
Pig production in the UK is dominated by a small number of large companies that produce large numbers of pigs to contract specifications. These large corporations normally own the pigs, the feed mills, the abattoirs and the processing plants. The annual industry turnover is £7,300 million. DEFRA statistics for 2004 and 2005 show that supplies of pork to the UK market were met by about 47% imported pork, and 53% home-fed production (DEFRA, 2006).
The life-cycle analyses of pork found in the literature focus mainly on the assessment of the environmental effects of pork at the primary production stage, i.e. pig production in farms. In the UK, a study by the Silsoe Research Institute (Williams et al. 2006) commissioned by DEFRA, has developed a Life Cycle Analysis of alternative methods of production of several livestock commodities including pork. The impacts that they calculate for production of 1kg pig meat are shown in Table 13.
Table 13: Environmental impacts of pig meat production, per kg
Environmental theme and units Value
Energy used, MJ 17
Global warming Pot'l, g 100 year CO2 Equiv. 6,350
Eutrophication Pot'l, g PO43- Equiv. 100
Acidification Pot'l, g SO2 Equiv. 394
Pesticides used, dose ha 0.009
Abiotic depletion, g Antimony Equiv. 35
Land use assuming mean of Grade 3a, ha 0.007
Source Williams et al. 2006
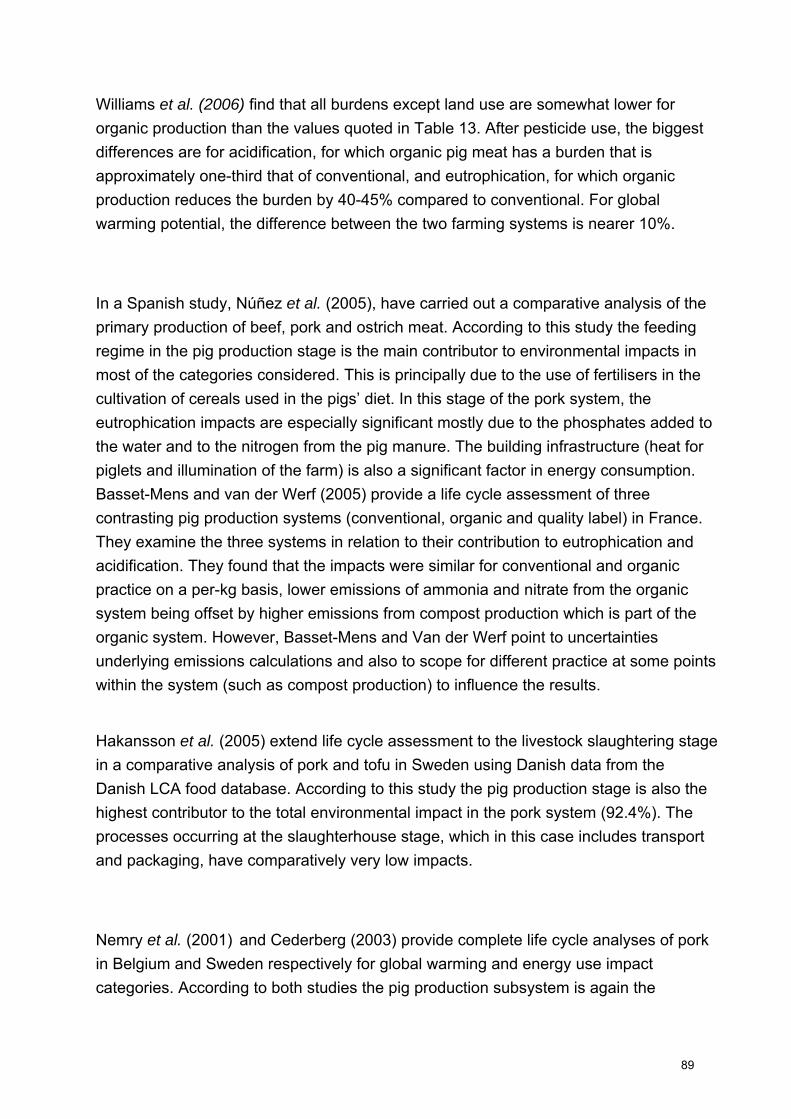
Williams et al. (2006) find that all burdens except land use are somewhat lower for organic production than the values quoted in Table 13. After pesticide use, the biggest differences are for acidification, for which organic pig meat has a burden that is approximately one-third that of conventional, and eutrophication, for which organic production reduces the burden by 40-45% compared to conventional. For global warming potential, the difference between the two farming systems is nearer 10%.
In a Spanish study, Núñez et al. (2005), have carried out a comparative analysis of the primary production of beef, pork and ostrich meat. According to this study the feeding regime in the pig production stage is the main contributor to environmental impacts in most of the categories considered. This is principally due to the use of fertilisers in the cultivation of cereals used in the pigs’ diet. In this stage of the pork system, the eutrophication impacts are especially significant mostly due to the phosphates added to the water and to the nitrogen from the pig manure. The building infrastructure (heat for piglets and illumination of the farm) is also a significant factor in energy consumption. Basset-Mens and van der Werf (2005) provide a life cycle assessment of three contrasting pig production systems (conventional, organic and quality label) in France. They examine the three systems in relation to their contribution to eutrophication and acidification. They found that the impacts were similar for conventional and organic practice on a per-kg basis, lower emissions of ammonia and nitrate from the organic system being offset by higher emissions from compost production which is part of the organic system. However, Basset-Mens and Van der Werf point to uncertainties underlying emissions calculations and also to scope for different practice at some points within the system (such as compost production) to influence the results.
Hakansson et al. (2005) extend life cycle assessment to the livestock slaughtering stage in a comparative analysis of pork and tofu in Sweden using Danish data from the Danish LCA food database. According to this study the pig production stage is also the highest contributor to the total environmental impact in the pork system (92.4%). The processes occurring at the slaughterhouse stage, which in this case includes transport and packaging, have comparatively very low impacts.
Nemry et al. (2001) and Cederberg (2003) provide complete life cycle analyses of pork in Belgium and Sweden respectively for global warming and energy use impact categories. According to both studies the pig production subsystem is again the
89
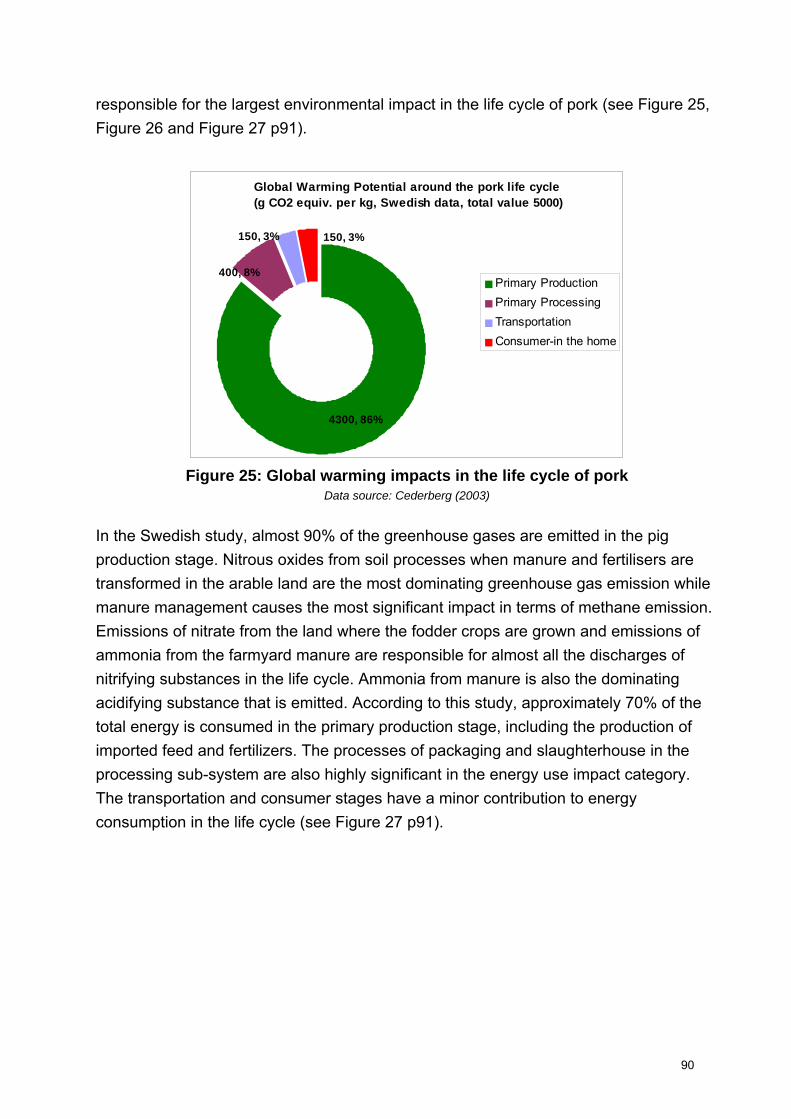
responsible for the largest environmental impact in the life cycle of pork (see Figure 25, Figure 26 and Figure 27 p91).
Global Warming Potential around the pork life cycle (g CO2 equiv. per kg, Swedish data, total value 5000)
4300, 86%
400, 8%
150, 3% 150, 3%
Primary ProductionPrimary ProcessingTransportationConsumer-in the home
Figure 25: Global warming impacts in the life cycle of pork
Data source: Cederberg (2003)
In the Swedish study, almost 90% of the greenhouse gases are emitted in the pig production stage. Nitrous oxides from soil processes when manure and fertilisers are transformed in the arable land are the most dominating greenhouse gas emission while manure management causes the most significant impact in terms of methane emission. Emissions of nitrate from the land where the fodder crops are grown and emissions of ammonia from the farmyard manure are responsible for almost all the discharges of nitrifying substances in the life cycle. Ammonia from manure is also the dominating acidifying substance that is emitted. According to this study, approximately 70% of the total energy is consumed in the primary production stage, including the production of imported feed and fertilizers. The processes of packaging and slaughterhouse in the processing sub-system are also highly significant in the energy use impact category. The transportation and consumer stages have a minor contribution to energy consumption in the life cycle (see Figure 27 p91).
90
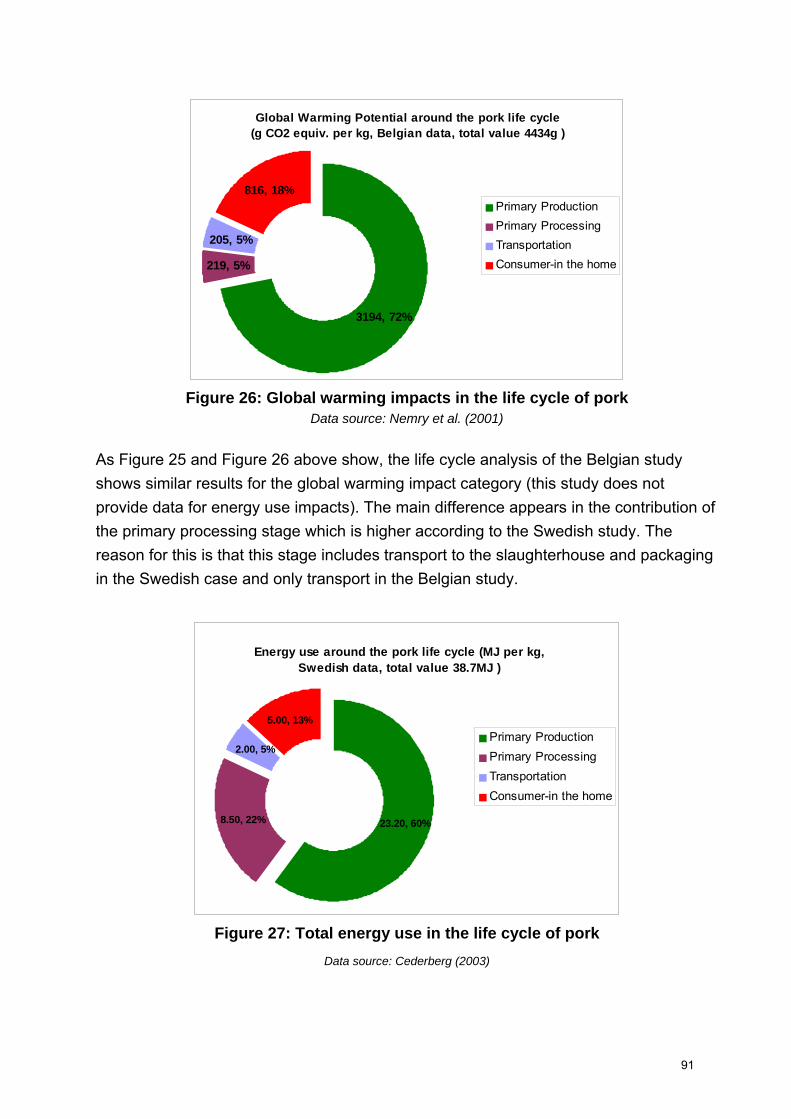
Global Warming Potential around the pork life cycle (g CO2 equiv. per kg, Belgian data, total value 4434g )
3194, 72%
219, 5%
205, 5%
816, 18%Primary ProductionPrimary ProcessingTransportationConsumer-in the home
Figure 26: Global warming impacts in the life cycle of pork
Data source: Nemry et al. (2001)
As Figure 25 and Figure 26 above show, the life cycle analysis of the Belgian study shows similar results for the global warming impact category (this study does not provide data for energy use impacts). The main difference appears in the contribution of the primary processing stage which is higher according to the Swedish study. The reason for this is that this stage includes transport to the slaughterhouse and packaging in the Swedish case and only transport in the Belgian study.
Energy use around the pork life cycle (MJ per kg, Swedish data, total value 38.7MJ )
23.20, 60%8.50, 22%
2.00, 5%
5.00, 13%Primary ProductionPrimary ProcessingTransportationConsumer-in the home
Figure 27: Total energy use in the life cycle of pork
Data source: Cederberg (2003)
91
Care needs to be taken in comparing figures across these different studies because of differences in the functional unit used. Cederberg (2003), for instance, uses 1 kg of boneless pig meat for this frame of reference, whereas Hakansson et al. (2005) adopt 20g protein found in 100g pork, as the functional unit to generate data on the Danish Food LCA database. The values for GWP per kg are of a similar order of magnitude for all the studies, but the effect of functional Unit choice on the outcomes at a finer level is not clear.
Bacon
A lack of data on the environmental impacts of meat processing prevents us from presenting a detailed discussion of bacon here, as originally envisaged at the end of the preliminary stages of this project. However, the discussion of other meat products suggests that primary production would be the most significant part of the life cycle. Clearly the use of brine in bacon production has water resource and effluent management implications.
Chicken, whole – conventional, free range & frozen
Studies of chicken using an LCA approach are few in number. As for most other foods, those that have been undertaken only cover parts of the entire consumption-production system. As Williams et al (2006, p50) have noted in relation to just one feature “commercial feed producers maintain a high degree of confidentiality over actual ingredient mixes.” That commercial sensitivity appears to pervade the rest of the chain and to be accentuated by:
a high degree of integration, which echoes that in pig meat production. Firms exercise control of the chicken meat supply chain from rearing through to slaughtering and processing and with such a high degree of control there are few entrance points to the industry; and
high levels of concentration: the UK chicken meat industry is dominated by a very small number of firms and so gaining access to data relies on a limited number of sources.
Much of the best information available in the literature relates to primary production, but as for other foods the different forms of measurement, and the different formats in which information is presented, are barriers to the synthesis of results.
Pimentel and Pimentel (1996, p79) report that 2kg of (dry) feed will convert into 1kg of live weight based on 1980 data. Williams et al. (2006), meanwhile, state that
92
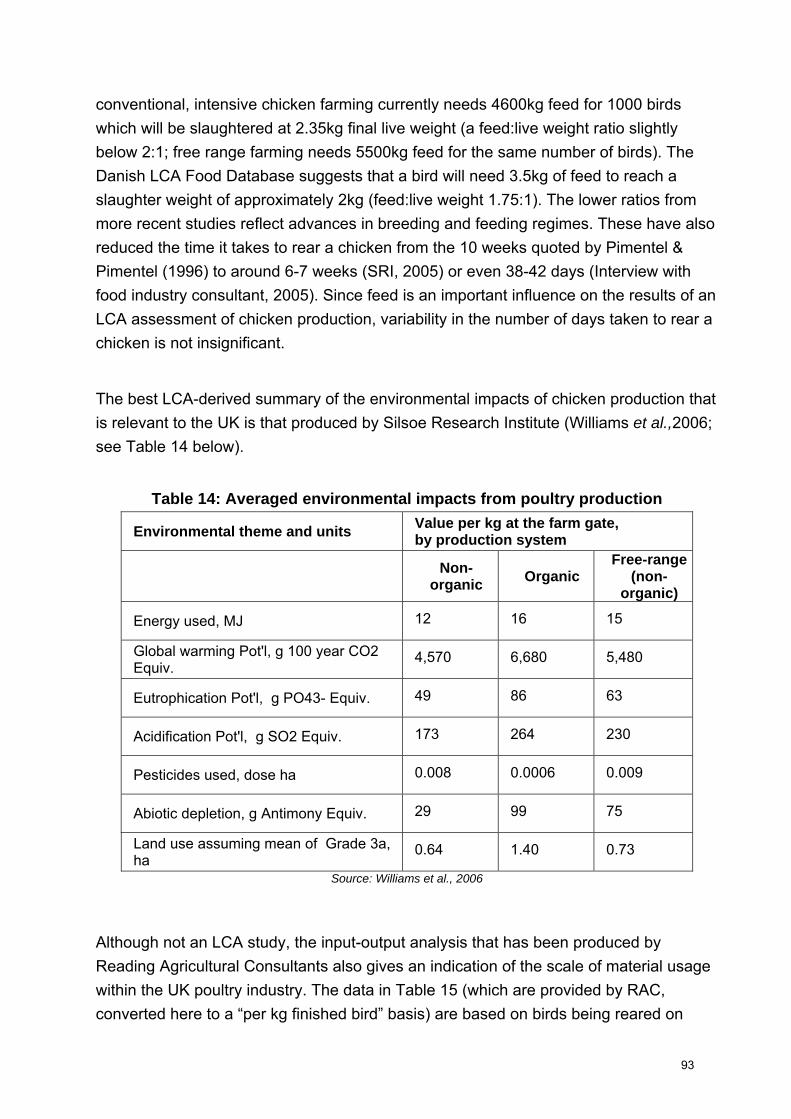
conventional, intensive chicken farming currently needs 4600kg feed for 1000 birds which will be slaughtered at 2.35kg final live weight (a feed:live weight ratio slightly below 2:1; free range farming needs 5500kg feed for the same number of birds). The Danish LCA Food Database suggests that a bird will need 3.5kg of feed to reach a slaughter weight of approximately 2kg (feed:live weight 1.75:1). The lower ratios from more recent studies reflect advances in breeding and feeding regimes. These have also reduced the time it takes to rear a chicken from the 10 weeks quoted by Pimentel & Pimentel (1996) to around 6-7 weeks (SRI, 2005) or even 38-42 days (Interview with food industry consultant, 2005). Since feed is an important influence on the results of an LCA assessment of chicken production, variability in the number of days taken to rear a chicken is not insignificant.
The best LCA-derived summary of the environmental impacts of chicken production that is relevant to the UK is that produced by Silsoe Research Institute (Williams et al.,2006; see Table 14 below).
Table 14: Averaged environmental impacts from poultry production
Environmental theme and units Value per kg at the farm gate, by production system
Non-organic Organic
Free-range (non-
organic)
Energy used, MJ 12 16 15
Global warming Pot'l, g 100 year CO2 Equiv.
4,570 6,680 5,480
Eutrophication Pot'l, g PO43- Equiv. 49 86 63
Acidification Pot'l, g SO2 Equiv. 173 264 230
Pesticides used, dose ha 0.008 0.0006 0.009
Abiotic depletion, g Antimony Equiv. 29 99 75
Land use assuming mean of Grade 3a, ha
0.64 1.40 0.73
Source: Williams et al., 2006
Although not an LCA study, the input-output analysis that has been produced by Reading Agricultural Consultants also gives an indication of the scale of material usage within the UK poultry industry. The data in Table 15 (which are provided by RAC, converted here to a “per kg finished bird” basis) are based on birds being reared on
93

beds of chopped straw, wood shavings or waste paper for an average of 40 days and reaching a weight of 2.2kg.
Table 15: Inputs to and outputs from UK broiler-raising for one year
Inputs Outputs
Chicks placed 0.02 kg Finished birds 1 kg Feed 1.29 kg Litter 0.48 kg Bedding 0.11 kg Packaging 0.003 kg Water 2.9 l Dirty water 0.17 l Dead birds 0.02 kg Waste heat 6.7MJ Energy31 1.5MJ Evaporative losses 0.1 l Chemicals 0.0003 l Nitrogen emissions 0.006 kg Packaging 0.003 kg Fugitive emissions unquantified
Source: RAC Environment Ltd, undated, p.39. Data adjusted to a 1kg live bird basis
Feed
Data on the Danish poultry industry provide further detail on the weight and energy use involved in rearing chickens. This shows that for each 1kg of chicken leaving the farm in Denmark key inputs will include feed, principally soy (0.514kg) which will have been imported and wheat (1.44kg) that will be sourced domestically; and electricity amounting to 2.28MJ.
In their mass balance study of the UK poultry industry, Reading Agricultural Consultants provide details of the inputs and outputs associated with poultry feed. Feed consists principally of cereals, soya and oilseeds or pulses and together these constitute about 89% of feed. Remaining inputs will be additional proteins and oils.
In background information to their LCA study, UK-focused, SRI (2005) have distinguished further the different constituents of feed, suggesting that wheat is the biggest constituent by far (see Table 16 p95).
31 Direct, not including inputs to feed production etc.
94
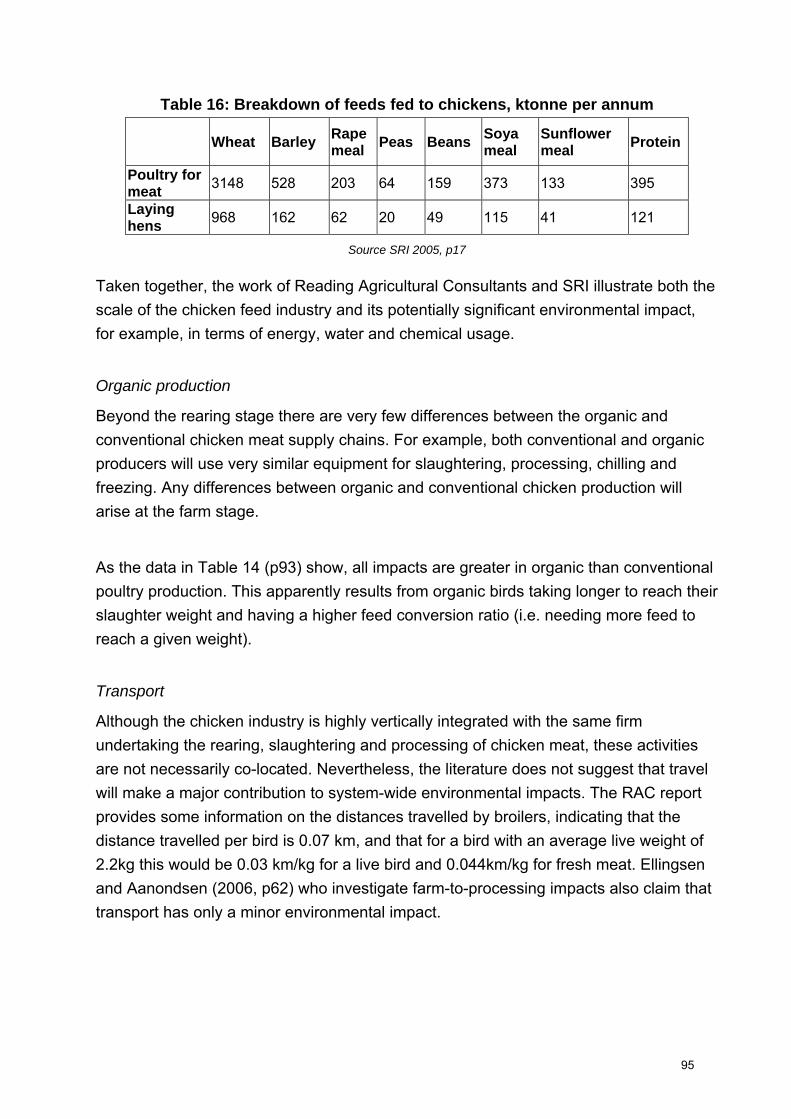
Table 16: Breakdown of feeds fed to chickens, ktonne per annum
Wheat Barley Rape meal Peas Beans Soya
meal Sunflower meal Protein
Poultry for meat 3148 528 203 64 159 373 133 395
Laying hens 968 162 62 20 49 115 41 121
Source SRI 2005, p17
Taken together, the work of Reading Agricultural Consultants and SRI illustrate both the scale of the chicken feed industry and its potentially significant environmental impact, for example, in terms of energy, water and chemical usage.
Organic production
Beyond the rearing stage there are very few differences between the organic and conventional chicken meat supply chains. For example, both conventional and organic producers will use very similar equipment for slaughtering, processing, chilling and freezing. Any differences between organic and conventional chicken production will arise at the farm stage.
As the data in Table 14 (p93) show, all impacts are greater in organic than conventional poultry production. This apparently results from organic birds taking longer to reach their slaughter weight and having a higher feed conversion ratio (i.e. needing more feed to reach a given weight).
Transport
Although the chicken industry is highly vertically integrated with the same firm undertaking the rearing, slaughtering and processing of chicken meat, these activities are not necessarily co-located. Nevertheless, the literature does not suggest that travel will make a major contribution to system-wide environmental impacts. The RAC report provides some information on the distances travelled by broilers, indicating that the distance travelled per bird is 0.07 km, and that for a bird with an average live weight of 2.2kg this would be 0.03 km/kg for a live bird and 0.044km/kg for fresh meat. Ellingsen and Aanondsen (2006, p62) who investigate farm-to-processing impacts also claim that transport has only a minor environmental impact.
95

Processing
Processing chicken is a highly efficient process with only limited waste arising. For example, data from the Danish LCA Food database indicates that to produce 1kg of chicken after slaughter will need 1.37kg of chicken from the farm, 9 litres of water and 0.7MJ electricity at the slaughterhouse.
An indication of the scale of the material inputs and outputs in the processing of chicken meat in the UK is provided by RAC who provide data for the country’s broiler industry for one year (Table 17).
Table 17: Broiler processing industry: one year’s inputs and outputs
Inputs Outputs
Live birds 1 kg Carcasses 0.64 kg Water 7.9l Dirty water 4.2 l Dry wastes 0.013 kg Meat wastes 0.08 kg Feathers 0.13 kg Blood 0.18 l Energy 1.6MJ32 Animal by-products 0.26 kg Chemicals 0.009l Fugitive emissions unquantified
Source:RAC Environment Ltd. undated, p.42; data adjusted to a 1kg live bird basis (i.e. as Table 15 p94)
Ellingsen and Aanondsen (2006) argued, based on their LCA analysis, that the most significant environmental impacts were on the farm. A comparison of the RAC input-output data for rearing and processing suggests that, for the UK, the situation is not quite so clear cut – particularly if water use is taken into account (3 times as great per kg finished bird at the processing stage as in the chicken-farming stage). For energy use the two stages are somewhat similar on the per-kg live bird basis that we have used to normalise RAC’s data. The nature of the fuel mix for power generation applying in both the Norwegian and the Danish cases means that impacts calculated in LCA for electricity-using activities are lower than they would be from the same activities using the same energy in the UK.
32 The source quotes energy input in “kW” but this is assumed to be a misprint for “kWh”.
96
Fresh or frozen?
The impact assessment results in the Danish LCA Food Database reveal that in terms of its environmental impact there is only a very marginal difference for a fresh chicken between its leaving the slaughterhouse and leaving the supermarket. Even under the Danish electricity production scenario, much more significant differences arise - for global warming at least (Figure 28 p98) - when comparing fresh with frozen chicken and when comparing frozen chicken leaving the slaughterhouse and supermarket, so illustrating the importance of energy use in frozen foods.
Post-processing
There are very few data available on the impacts of chicken consumption. One of the rare attempts to provide a system-wide view of the UK chicken industry is that contained in BNF07 Energy Model Assumptions and Scenarios, Revision date 26/06/2003. The Briefing Note was produced as part of DEFRA’s Market Transformation Programme and its focus was on energy usage (so has a narrower perspective than an LCA approach).
The Briefing Note provides a model that depicts energy and mass flows through the chicken supply chain. The model first identifies the flow of materials through key stages (and data are derived from retail/market data, though their source is not specified in the text) and then assigns a figure for energy per tonne required to shift the chicken from one stage of the supply chain to another. The resulting summary is shown in Table 18 (p98): data have been drawn from a variety of unspecified sources, so their robustness must be regarded as questionable. The Note itself points out that the energy model has been checked for sensitivity and “in particular the % split between household and catering has analysed which shows a maximum error margin of +/- 12%”.
Despite caveats about the quality of the data and its exclusive focus on energy use, the figures do provide useful pointers. They confirm that:
the transport of birds for slaughter is a minor issue.
together feed and rearing (agriculture in the table above) use more energy than the processing industry.
The narrower energy preoccupation of the study also highlights the very large environmental impacts that arise in the life cycle after processing. Wholesale, transport, retailing, households and catering all emerge as significant users of energy.
97

Global warming impact of chicken meat at different points in the life-cycle
2800
2900
3000
3100
3200
3300
3400
3500
3600
3700
Ex-slaughterhouse Ex retail
g C
O2
eg
uiv
pe
r k
g
Fresh chicken
Frozen chicken
Figure 28: Global warming impact of chicken meat at different points in the life cycle
Table 18: Total energy and mass flows for UK chicken industry
Category Weight (tonnes) Energy (MWhe)
Catering 904,405 5,077,330
Household 480,595 2,494,057
Retail 528, 655 2,751,118
Pre-consumer transport (from factory gate) 1,433,060 2,347,526
Wholesale/RDC 1,461,060 2,347,526
Process and packaging (exc imports) 2,077,237 (live birds) 1,736,816
Transport live birds to slaughter 2,077,237 623,171
Agriculture 2,077,237 2,825,042
Agricultural supplies (feed) 3,946,750 1,776,038 Source BNF07 Energy Model Assumptions and Scenarios, Market Transformation Programme
98
Fish and other basic protein foods
Summary
• The foods in this group do not appear among the most significant items in the EIPRO analysis. This is probably due to the lower production and consumption volumes of these foods rather than due to inherently lower environmental impacts associated with their life cycles. (For example, weekly per capita fish consumption in the UK is 200g per person or less, compared to at least 1kg of meat.)
• There are some studies applying LCA techniques to fish production and processing. These conclude that fish production (whether fishery or farming) is the most significant source of environmental impacts. But, it must be recognised that conventional LCA does not cover some critical environmental impacts of fisheries and fish farming, notably their impacts on stocks and marine ecosystems.
• From estimated data for the whole life cycle of a common processed fish product (cod fish fingers) we can conclude that fishing itself is the by far the dominant source of global warming impact in that cycle, as a result of the fuel used. The energy demands of different fishing techniques differ considerably so changes in fishing method can affect this conclusion.
• Estimates made of energy use across the life cycle of the fish finger and data relating to frozen peas provide further illustrations of the potentially high significance of consumers’ actions in determining the whole-life impact of foods.
• The limited data relating to production and processing of leguminous proteins support the hypothesis that such legumes are a more energy-efficient way of providing edible protein than red meat.
Fish fingers (cod)
A market analysis for 1999, by the Norwegian company Lozowick, estimated that cod fish fingers sold through retail outlets represented around 10% of all cod consumption in the UK. Approximately 90% of all cod eaten in the UK is imported in frozen form, most of this already filleted: Iceland, Russia and Norway are major sources.
99
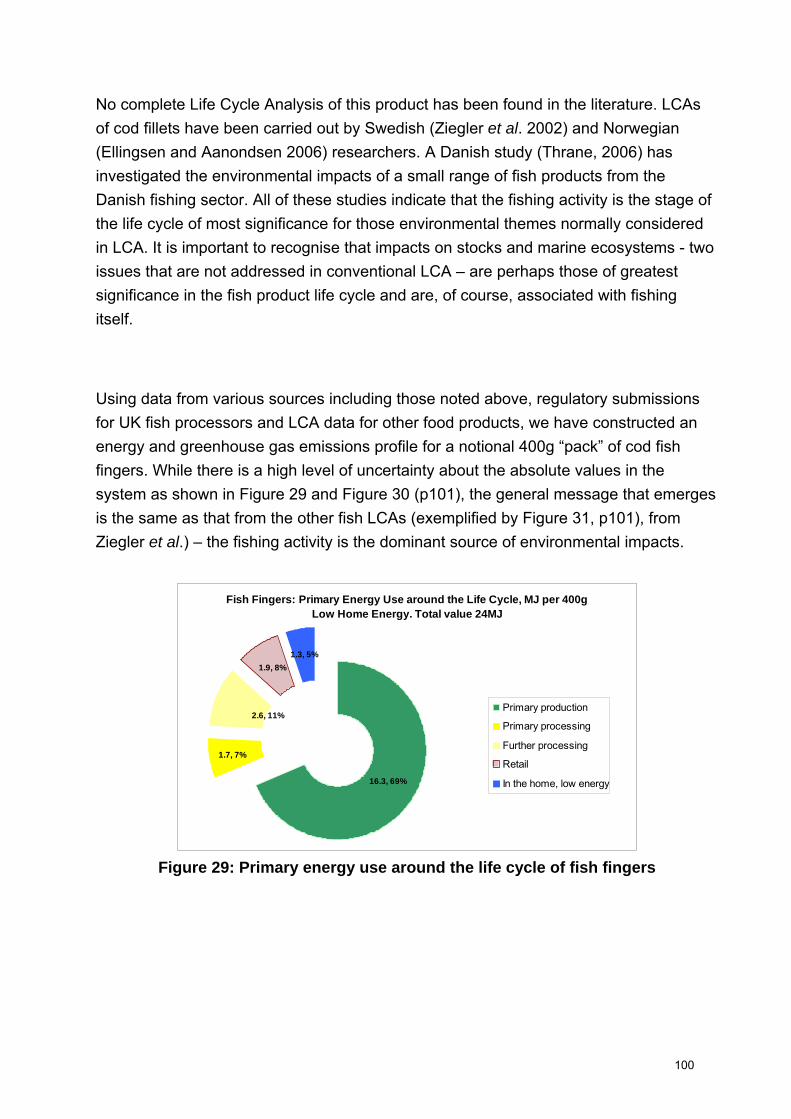
No complete Life Cycle Analysis of this product has been found in the literature. LCAs of cod fillets have been carried out by Swedish (Ziegler et al. 2002) and Norwegian (Ellingsen and Aanondsen 2006) researchers. A Danish study (Thrane, 2006) has investigated the environmental impacts of a small range of fish products from the Danish fishing sector. All of these studies indicate that the fishing activity is the stage of the life cycle of most significance for those environmental themes normally considered in LCA. It is important to recognise that impacts on stocks and marine ecosystems - two issues that are not addressed in conventional LCA – are perhaps those of greatest significance in the fish product life cycle and are, of course, associated with fishing itself.
Using data from various sources including those noted above, regulatory submissions for UK fish processors and LCA data for other food products, we have constructed an energy and greenhouse gas emissions profile for a notional 400g “pack” of cod fish fingers. While there is a high level of uncertainty about the absolute values in the system as shown in Figure 29 and Figure 30 (p101), the general message that emerges is the same as that from the other fish LCAs (exemplified by Figure 31, p101), from Ziegler et al.) – the fishing activity is the dominant source of environmental impacts.
Fish Fingers: Primary Energy Use around the Life Cycle, MJ per 400gLow Home Energy. Total value 24MJ
1.9, 8%1.3, 5%
1.7, 7%
2.6, 11%
16.3, 69%
Primary production
Primary processing
Further processing
Retail
In the home, low energy
Figure 29: Primary energy use around the life cycle of fish fingers
100

Fish Fingers: Climate Change Impact around the Life Cycle,g CO2 equiv per 400g. Low Home Energy Total value 1585g CO2
86.4, 5%86.4, 5%
92.0, 6%
124.0, 8%
1196.0, 76%
Primary production
Primary processing
Further processing
Retail
In the home, low energy
Figure 30: Climate change impact around the life cycle of fish fingers
This conclusion is largely a consequence of the energy intensity of fishing. All of the LCA studies note that the energy demands of different fishing methods differ widely. Thrane (2006) suggests that there is a 15-fold difference between the most energy-efficient fishing method used in the Danish fishery (purse seining), and the least (beam trawling). Some fishing techniques, notably trawling in pursuit of bottom-dwelling fish, have considerable impact on the seabed. Ziegler and Ellingsen provide estimates of the area of seabed trawled to produce a unit of fish fillets: these are in the range 1-2km2 per kg fillet.
Figure 31: Delivered energy in each life cycle phase of a frozen cod fillet Source: Ziegler et al. 2002
101

102
It is also important to recognise that there is considerable potential for differences in the amount of energy associated with the domestic “end” of this system. Figure 29 (p100) and Figure 30 (p101) are based on data from the lower end of the ranges quoted in literature for frozen storage and preparation – in this case reflecting the use of the microwave. If we take higher figures for storage and assume that the fish fingers are fried, the consumer’s contribution to the energy and global warming impact of the system become much more significant (Figure 32 and Figure 33 below)
Fish Fingers: Primary Energy Use around the Life Cycle, MJ per 400g High Home Energy. Total value 33MJ
1.9, 6%
10.6, 32%
16.3, 49%
2.6, 8%
1.7, 5%
Primary production
Primary processing
Further processing
Retail
In the home, highenergy
Figure 32: Primary energy use around the life cycle of fish fingers, high household energy use
Fish Fingers: Climate Change Impact around the Life Cycle, g CO2 equiv per 400g. High Home Energy Total value 1813g CO2
86.4, 5%
314.8, 17%
1196.0, 66%
124.0, 7%
92.0, 5%
Primary production
Primary processing
Further processing
Retail
In the home, highenergy
Figure 33: Climate change impact around the life cycle of fish fingers, high household energy use
Unlike agricultural (and indeed some aquacultural) food production techniques, fishing does not impose any burden on fresh water resources. We have found no meaningful data about product-related water use at the consumer end of the system, so a life-cycle profile of water use for this product cannot be constructed. This is not to say that there are no impacts on the water environment associated with producing, selling and consuming fish fingers. Water use in fish filleting is said to range from 5-11 litres per kg fish input (UNEP 2000), while secondary fish processing to produce coated products may use 3-4 litre/kg product.
Salmon fillets
Salmon consumption draws almost entirely on farmed fish. UK final consumption is around 40k tonnes (1999) of product, which equates to approximately 80k tonnes live fish. This represents approximately 75% of UK production. On the basis of previous work (Foster, unpublished) it seems that most UK demand is met from UK production, although there is considerable price competition among producers. Norway and Chile are the largest producing countries.
Five environmental impacts associated with the production of farmed fish are generally identified as being of concern33: feed supplies, wastes, chemical releases, landscape and effects on biodiversity.
Feed Supplies: Carnivorous fish are fed on compound feed, of which fishmeal and fish-oil are both significant ingredients. Although some fishmeal and fish-oil are produced from the fish processing industry’s waste material, the majority of both materials is derived from wild fish caught specifically for industrial processing. It is reported that between 3 and 5 kg of wild fish are needed for each kilogram of farmed fish produced34.
Solid waste discharges: Marine cage farms keep a large number of fish in a small volume of water. Both faeces and uneaten feed fall from the cage to the seabed. The degradation of this solid material releases nutrients and causes oxygen depletion that
33 These are reviewed in more depth in Black, K. 2001, SECRU 2002 and RCEP2004 34 Naylor 2000 produced the higher estimate for all carnivorous finfish (at that time essentially salmon and trout), while the lower estimate has been made more recently, for salmon alone, by the University of Stirling 2003.
103
leads to “anoxic” areas on the sea floor where there is no life. Rotation of cages between different sites may allow recovery of the seabed.
Chemical and pharmaceutical releases: A range of chemicals and pharmaceuticals is used in fish farms to control disease and parasites, and to protect the cage structures themselves. Organo-tin anti-foulants have been replaced with copper-based products, but inevitably copper is released into the environment, and increased concentrations are observed in the sediments beneath cages35. Antibiotic use is apparently falling in aquaculture in developed countries, and discharges of these chemicals are reported to be of less environmental significance than releases of the various pesticides used to control lice and other parasites36.
Landscape impacts: Fish farming changes the aquatic landscape, introducing structures – in the case of salmon, sea cages for fish and freshwater cages for juveniles – into what were often relatively unoccupied spaces. While the impact of landscape change is debatable, this demand for space is highly relevant to the contribution that aquaculture can make to a sustainable fish consumption and production system. For example, it was suggested in 200037 that little scope remains for the development of additional lake-based smolt production in Scotland38 because few, if any, suitable sites are available.
Escapes and interactions with other fauna: Escaped fish represent the main mechanism by which aquaculture impacts on wild populations of fish and the aquatic environment beyond the immediate vicinity of farms. The possibilities are:
• Fish escape and compete with indigenous populations for resources (food, breeding sites, etc.)
• Non-native fish escape and bring an entirely new pressure into an ecosystem, changing its balance39.
35 Scottish Environmental protection Agency study from 1996/7 reported in RCEP 2004.
36 RCEP 2004 notes, for example, that antimicrobial compund use in 2002 was around 1 tonne in UK aquaculture and around 400 tonnes in livestock
production. On the other hand, SECRU 2002 contains the following quote concerning cypremethrin, one of the substances used to treat sea lice: “a recent
study concluded that even a single cage application of cypermethrin has the potential to create a plume of up to 1 km2 that may retain its toxicity for
several hours”.
37 In submissions to the Competition Commission 2000
38 Smolt are salmon that have reached the point in their life cycle at which they are ready to move from fresh water to sea water.
39 University of Stirling, 2003 quotes grass carp escaped from farms in the Mediterranean as one, rare example of this.
104
• Fish escape and interbreed with indigenous populations, changing the genetic makeup of the native population
• Escaped fish, or proximity, transfer disease or parasites to wild populations
The exact effect on wild populations is clearly uncertain and may well vary from place to place. As an indication of the current scale of loss from farms, 400 thousand salmon are reported to have escaped Scottish farms in 2000, while 613 thousand salmon and trout are believed to have escaped from Norwegian farms in 200240.
Predators (sea birds, squid, marine mammals) pose a problem for fish farms because they take the fish, while fish farmers’ attempts to defend their stock in turn pose a threat to the predators – particularly if the farmers resort to shooting or trapping predators should less damaging methods, such as acoustic deterrent devices, fail.
Of these five types of impact, only the first three would be captured within conventional life cycle assessment studies. One LCA has been identified in the literature review, a comparative study covering chicken, salmon and cod fillets reflecting Norwegian conditions (Ellingsen & Aanondsen 2006).
One notable finding of this study is that releases of copper from anti-foulant products to the environment associated with production of a 200g farmed salmon fillet are around 0.2g, a level roughly 10 times greater than that associated with the production of a 200g cod fillet from wild fish.
Unlike other impacts, energy impacts arise around the entire life cycle. The energy associated with different life cycle stages of a fresh/chilled salmon fillet is shown in Figure 34 below, which is based on data drawn from Ellingsen & Aanondsen and our own calculations. Energy use in primary production is mainly linked to fishing for industrial fish and the production of fish meal, fish oil and compound feed rather than the operation of fish farms.
40 University of Stirling, 2003, quoting Intrafish. The Scottish figure is also quoted in SECRU 2002.
105
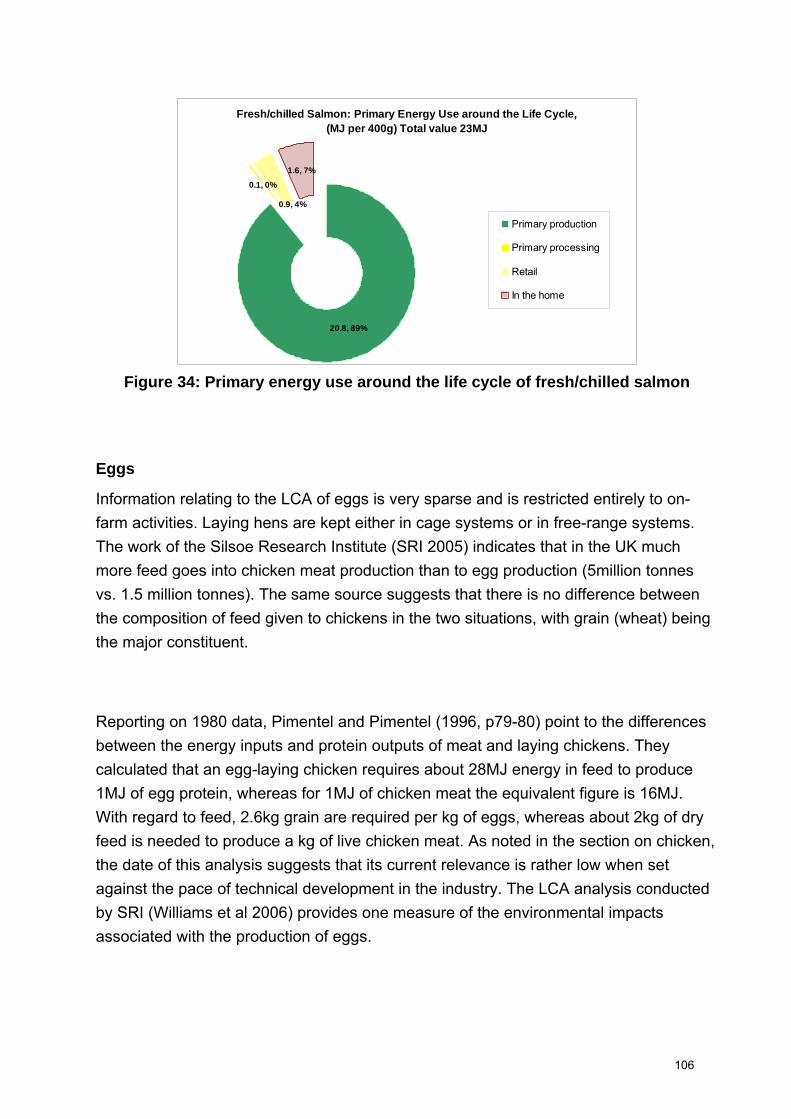
Fresh/chilled Salmon: Primary Energy Use around the Life Cycle,(MJ per 400g) Total value 23MJ
1.6, 7%
0.1, 0%
0.9, 4%
20.8, 89%
Primary production
Primary processing
Retail
In the home
Figure 34: Primary energy use around the life cycle of fresh/chilled salmon
Eggs
Information relating to the LCA of eggs is very sparse and is restricted entirely to on-farm activities. Laying hens are kept either in cage systems or in free-range systems. The work of the Silsoe Research Institute (SRI 2005) indicates that in the UK much more feed goes into chicken meat production than to egg production (5million tonnes vs. 1.5 million tonnes). The same source suggests that there is no difference between the composition of feed given to chickens in the two situations, with grain (wheat) being the major constituent.
Reporting on 1980 data, Pimentel and Pimentel (1996, p79-80) point to the differences between the energy inputs and protein outputs of meat and laying chickens. They calculated that an egg-laying chicken requires about 28MJ energy in feed to produce 1MJ of egg protein, whereas for 1MJ of chicken meat the equivalent figure is 16MJ. With regard to feed, 2.6kg grain are required per kg of eggs, whereas about 2kg of dry feed is needed to produce a kg of live chicken meat. As noted in the section on chicken, the date of this analysis suggests that its current relevance is rather low when set against the pace of technical development in the industry. The LCA analysis conducted by SRI (Williams et al 2006) provides one measure of the environmental impacts associated with the production of eggs.
106
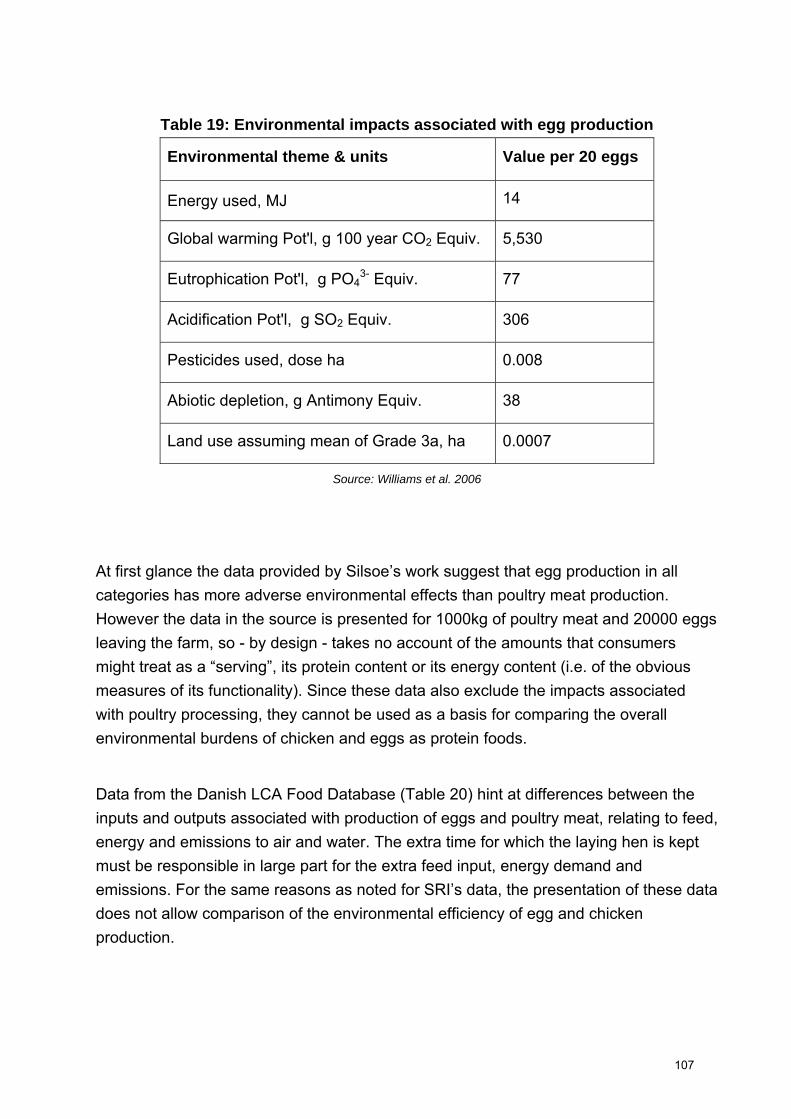
Table 19: Environmental impacts associated with egg production
Environmental theme & units Value per 20 eggs
Energy used, MJ 14
Global warming Pot'l, g 100 year CO2 Equiv. 5,530
Eutrophication Pot'l, g PO43- Equiv. 77
Acidification Pot'l, g SO2 Equiv. 306
Pesticides used, dose ha 0.008
Abiotic depletion, g Antimony Equiv. 38
Land use assuming mean of Grade 3a, ha 0.0007
Source: Williams et al. 2006
At first glance the data provided by Silsoe’s work suggest that egg production in all categories has more adverse environmental effects than poultry meat production. However the data in the source is presented for 1000kg of poultry meat and 20000 eggs leaving the farm, so - by design - takes no account of the amounts that consumers might treat as a “serving”, its protein content or its energy content (i.e. of the obvious measures of its functionality). Since these data also exclude the impacts associated with poultry processing, they cannot be used as a basis for comparing the overall environmental burdens of chicken and eggs as protein foods.
Data from the Danish LCA Food Database (Table 20) hint at differences between the inputs and outputs associated with production of eggs and poultry meat, relating to feed, energy and emissions to air and water. The extra time for which the laying hen is kept must be responsible in large part for the extra feed input, energy demand and emissions. For the same reasons as noted for SRI’s data, the presentation of these data does not allow comparison of the environmental efficiency of egg and chicken production.
107
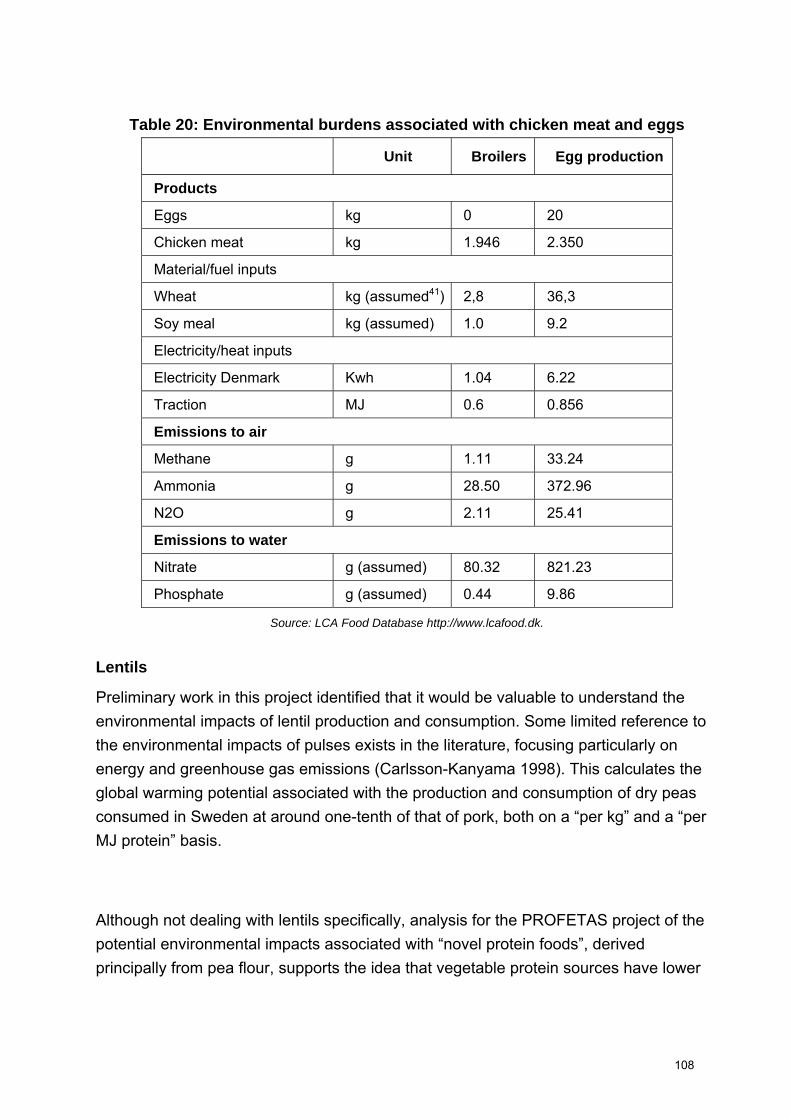
Table 20: Environmental burdens associated with chicken meat and eggs
Unit Broilers Egg production
Products
Eggs kg 0 20
Chicken meat kg 1.946 2.350
Material/fuel inputs
Wheat kg (assumed41) 2,8 36,3
Soy meal kg (assumed) 1.0 9.2
Electricity/heat inputs
Electricity Denmark Kwh 1.04 6.22
Traction MJ 0.6 0.856
Emissions to air
Methane g 1.11 33.24
Ammonia g 28.50 372.96
N2O g 2.11 25.41
Emissions to water
Nitrate g (assumed) 80.32 821.23
Phosphate g (assumed) 0.44 9.86
Source: LCA Food Database http://www.lcafood.dk.
Lentils
Preliminary work in this project identified that it would be valuable to understand the environmental impacts of lentil production and consumption. Some limited reference to the environmental impacts of pulses exists in the literature, focusing particularly on energy and greenhouse gas emissions (Carlsson-Kanyama 1998). This calculates the global warming potential associated with the production and consumption of dry peas consumed in Sweden at around one-tenth of that of pork, both on a “per kg” and a “per MJ protein” basis.
Although not dealing with lentils specifically, analysis for the PROFETAS project of the potential environmental impacts associated with “novel protein foods”, derived principally from pea flour, supports the idea that vegetable protein sources have lower
108
environmental impacts than animal protein sources when assessed on the basis of a similar amount of protein consumed (Aiking, de Boer & Vereijken 2006). The PROFETAS analysis found that environmental impacts of protein consumption would be significantly lower for all themes considered, including land use, water use, eutrophication and pesticide use as well as global warming and acidification, if the protein was in the form of these novel protein foods than if it was in the form of pork. It appears that lentils purchased for human consumption in the UK are predominantly grown outside Western Europe. With a very few exceptions, LCA studies of the environmental impacts of production of foods that are not important to European agriculture are notable by their absence.
41 These units are not explicitly stated in the source, but the units noted here are assumed from the structure of the source data table.
109
Drinks (alcoholic and non-alcoholic)
Summary
• The EIPRO analysis suggests that the environmental significance of the production and consumption of drinks is not quite as high as that of food. Of the categories of drink covered by that analysis, bottled and canned soft drinks are most significant, contributing (in the EIPRO model) around 1% of the EU’s total impacts for several themes.
• LCAs have been carried out for a few beverages, but the evidence that they provide is somewhat unclear.
• Beer is one of the better-studied products in this group: however different studies reach different conclusions due to different assumptions and boundary choices. Packaging can be highly significant as a source of environmental impacts if glass bottles are used, whilst beer production appears to be at least as significant as barley-growing and hop-growing in terms of global warming potential.
• Evidence from studies of energy consumption in the “hospitality” sector provide a further indication of the significance of energy consumption for refrigeration purposes in the entire food system. There is insufficient evidence to set this properly into a product life cycle context.
• Water use is clearly a significant (if essential) aspect of the production cycle of many drinks. Brewing uses 4 litres of water per litre beer; soft drink bottling uses 2-4 litres while processing sugar (a key ingredient) uses over 1 litre per kg sugar; the “wet” method of extracting coffee beans from berries can use up to 15 litre of water per kg beans.
• Estimates based on pertinent data support the hypothesis that bottled water has much higher energy demand and is associated with higher global warming impacts than tap water.
• Evidence on coffee hints at the considerable scope that may well exist to deliver environmental benefits by encouraging better practices in agriculture and processing outside the UK.
110
Beer
UK beer production and consumption
Average consumption of beer in the UK is 102 litre/person/annum42. Consumption of lager overtook that of ales and stouts in the early 1990s, and lager accounted for 60% of beer sales in 1997 (Vaughan, 1999). In 1998, the UK produced 58 million hl of beer, but remained a net importer43 (Vaughan, 1999). In 1998 four brewers44 accounted for 83% of the beer production in the UK, whereas in 1989 six brewers controlled 80% of the UK beer market. Consolidation of large brewers has been coupled with a decline in beer production by regional brewers and a modest increase in production by microbreweries45. There are 24 large, 70 medium to small and 500 microbreweries in the UK according to Vaughan (1999), who also assets that energy use in UK breweries accounts for approximately 825,000 tonnes of CO2 emissions and 35 million m3 of water per annum.
The basic ingredients of beer are malted barley (approximately 95.5% solid ingredients w/w), hops (approximately 0.5% w/w), yeast and water. Other ingredients can include maize, sugar and other additives.
In a lifecycle analysis of a Spanish beer conducted by Hospido et al. (2005), production and transport of raw materials used in beer production was found to contribute over one third of the total global environmental impact of the beer production lifecycle46 - see Figure 35 (p112).
The most significant environmental impact of the agricultural subsystem is eutrophication (Hospido et al., 2005; Talve, 1999). This is linked to releases of nitrogen, and to a lesser extent phosphorous, from production and use of fertilisers. Hospido et al. (2005) found that raw material production and transport accounted for 53% of the eutrophication potential of the entire beer life cycle (Hospido et al., 2005)
42 This includes draft as well as packaged beers. 43 In 1998 the UK exported 3.7 million and imported 5.6 million hectolitres of beer (Vaughan, 1999) 44 Bass, Carlsberg-Tetley, Scottish Courage, and Whitbread. 45 A microbrewery is defined as a brewery producing 1000-5000 barrels of beer per year.. 46 In this analysis the malting of barley was included in the category of raw material production. The magnitude of the global environmental impact of the raw material sub-system was matched only by the subsystem accounting for production and transport of packaging materials (Hospido et al, 2005).
111
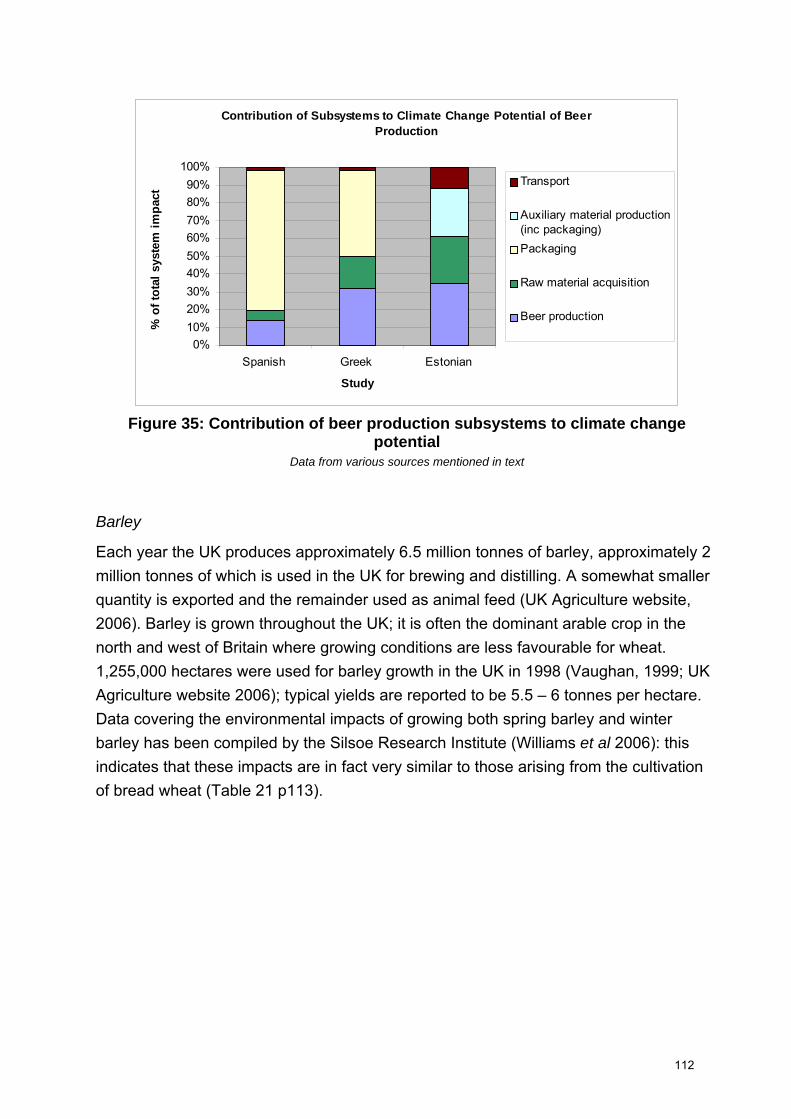
Contribution of Subsystems to Climate Change Potential of Beer Production
0%10%20%30%40%50%60%70%80%90%
100%
Spanish Greek Estonian
Study
% o
f tot
al s
yste
m im
pact
Transport
Auxiliary material production(inc packaging)Packaging
Raw material acquisition
Beer production
Figure 35: Contribution of beer production subsystems to climate change
potential Data from various sources mentioned in text
Barley
Each year the UK produces approximately 6.5 million tonnes of barley, approximately 2 million tonnes of which is used in the UK for brewing and distilling. A somewhat smaller quantity is exported and the remainder used as animal feed (UK Agriculture website, 2006). Barley is grown throughout the UK; it is often the dominant arable crop in the north and west of Britain where growing conditions are less favourable for wheat. 1,255,000 hectares were used for barley growth in the UK in 1998 (Vaughan, 1999; UK Agriculture website 2006); typical yields are reported to be 5.5 – 6 tonnes per hectare. Data covering the environmental impacts of growing both spring barley and winter barley has been compiled by the Silsoe Research Institute (Williams et al 2006): this indicates that these impacts are in fact very similar to those arising from the cultivation of bread wheat (Table 21 p113).
112
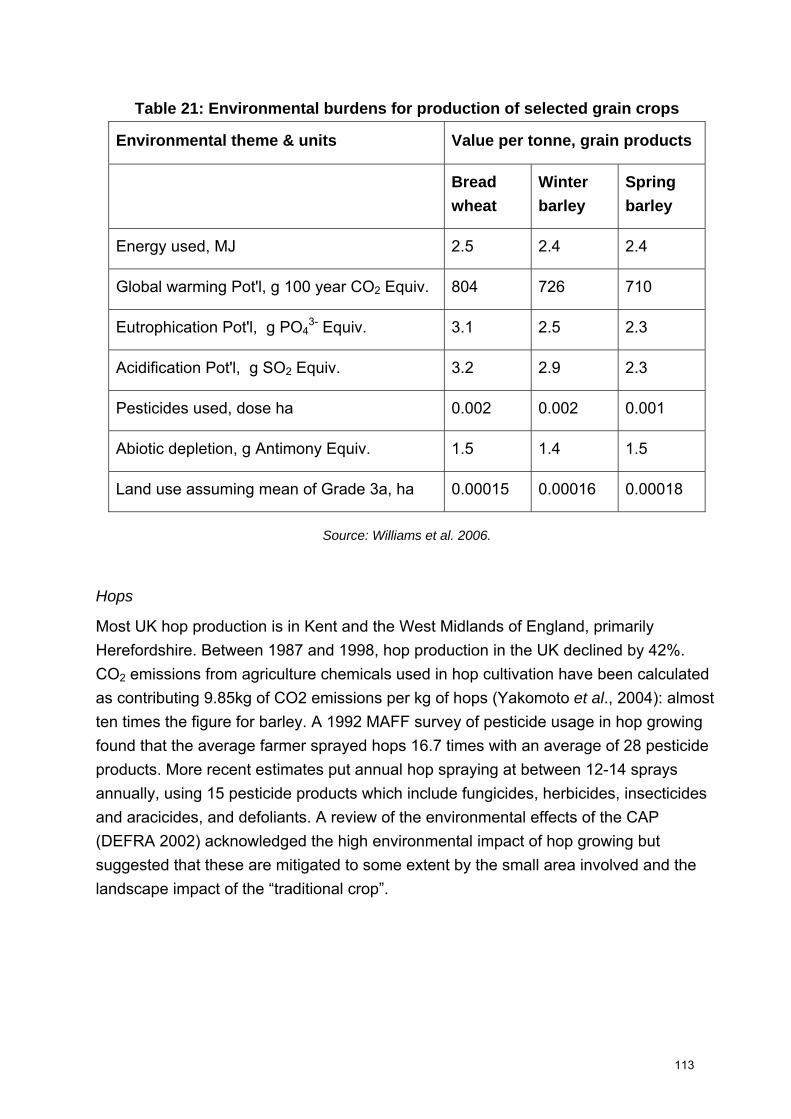
Table 21: Environmental burdens for production of selected grain crops
Environmental theme & units Value per tonne, grain products
Bread wheat
Winter barley
Spring barley
Energy used, MJ 2.5 2.4 2.4
Global warming Pot'l, g 100 year CO2 Equiv. 804 726 710
Eutrophication Pot'l, g PO43- Equiv. 3.1 2.5 2.3
Acidification Pot'l, g SO2 Equiv. 3.2 2.9 2.3
Pesticides used, dose ha 0.002 0.002 0.001
Abiotic depletion, g Antimony Equiv. 1.5 1.4 1.5
Land use assuming mean of Grade 3a, ha 0.00015 0.00016 0.00018
Source: Williams et al. 2006.
Hops
Most UK hop production is in Kent and the West Midlands of England, primarily Herefordshire. Between 1987 and 1998, hop production in the UK declined by 42%. CO2 emissions from agriculture chemicals used in hop cultivation have been calculated as contributing 9.85kg of CO2 emissions per kg of hops (Yakomoto et al., 2004): almost ten times the figure for barley. A 1992 MAFF survey of pesticide usage in hop growing found that the average farmer sprayed hops 16.7 times with an average of 28 pesticide products. More recent estimates put annual hop spraying at between 12-14 sprays annually, using 15 pesticide products which include fungicides, herbicides, insecticides and aracicides, and defoliants. A review of the environmental effects of the CAP (DEFRA 2002) acknowledged the high environmental impact of hop growing but suggested that these are mitigated to some extent by the small area involved and the landscape impact of the “traditional crop”.
113

Transport of raw materials to brewery
An example, presented in a report on beer production and consumption by Sustain, compares food miles of one beer brewed locally using locally sourced ingredients which entailed 600 beer miles and one brewed in Germany using internationally sourced ingredients which entailed 24,000 miles (Vaughan, 1999). As the beer industry continues to consolidate the number of ‘beer miles’ is likely to increase.
Koroneos et al. (2005) calculated the fuel consumption and emissions factors for transport of raw materials to a brewery in Greece based on the vehicle type and average speed. All materials were transported by heavy-duty vehicles that ran on diesel. Some materials were produced in Greece but others had to be imported from Western European countries. The energy use of this system was 3.1% of the life cycle. This was significantly less than bottle production (85%), half that of beer production (6.1%) and similar to transport associated with product distribution (3.9%). Raw material acquisition contributed 9% of nitrification potential and 6% to the global warming potential (Koroneos et al. 2005). The impact of transport of raw materials depends heavily on the distances travelled.
The brewing process
The precise method of beer production varies between beers, but all includes the following three stages:
1) malting of barley which may be done at the brewery or at another site
2) mashing of the malt to produce an aqueous extract of barley malt (wort)
3) fermentation using yeast to convert nutrients in wort to ethanol and carbon dioxide.
The process of beer production (brewing) has been found to account for only a small proportion of the environmental impact of the life cycle of beer (Hospido et al., 2005). The environmental report of Scottish Courage, the largest brewery in the UK, identifies the main environmental issues associated with the brewing process as CO2 release from energy consumption, water consumption and effluent discharge (ENDS, 2005).
Energy consumption during primary processing is identified as the most important environmental impact of operations within the brewery, contributing 30% of the global warming potential of the lifecycle (Hospido et al. 2005). Koroneos et al. report that the
114
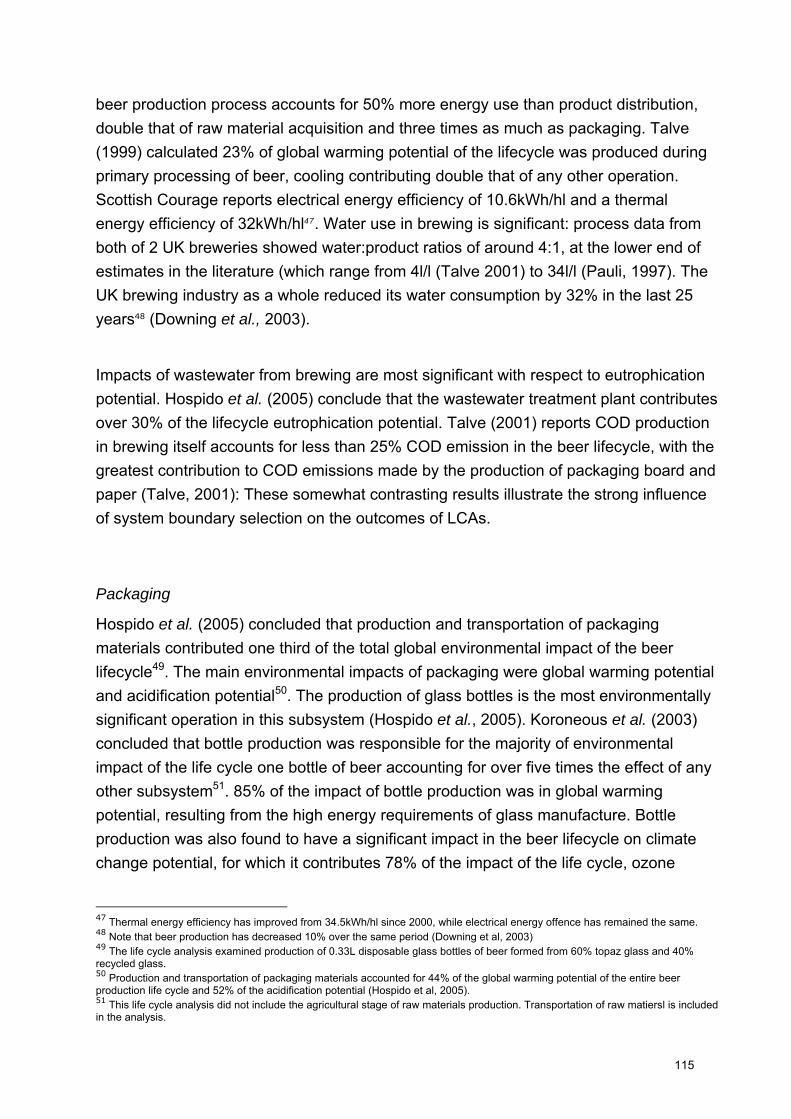
beer production process accounts for 50% more energy use than product distribution, double that of raw material acquisition and three times as much as packaging. Talve (1999) calculated 23% of global warming potential of the lifecycle was produced during primary processing of beer, cooling contributing double that of any other operation. Scottish Courage reports electrical energy efficiency of 10.6kWh/hl and a thermal energy efficiency of 32kWh/hl47. Water use in brewing is significant: process data from both of 2 UK breweries showed water:product ratios of around 4:1, at the lower end of estimates in the literature (which range from 4l/l (Talve 2001) to 34l/l (Pauli, 1997). The UK brewing industry as a whole reduced its water consumption by 32% in the last 25 years48 (Downing et al., 2003).
Impacts of wastewater from brewing are most significant with respect to eutrophication potential. Hospido et al. (2005) conclude that the wastewater treatment plant contributes over 30% of the lifecycle eutrophication potential. Talve (2001) reports COD production in brewing itself accounts for less than 25% COD emission in the beer lifecycle, with the greatest contribution to COD emissions made by the production of packaging board and paper (Talve, 2001): These somewhat contrasting results illustrate the strong influence of system boundary selection on the outcomes of LCAs.
Packaging
Hospido et al. (2005) concluded that production and transportation of packaging materials contributed one third of the total global environmental impact of the beer lifecycle49. The main environmental impacts of packaging were global warming potential and acidification potential50. The production of glass bottles is the most environmentally significant operation in this subsystem (Hospido et al., 2005). Koroneous et al. (2003) concluded that bottle production was responsible for the majority of environmental impact of the life cycle one bottle of beer accounting for over five times the effect of any other subsystem51. 85% of the impact of bottle production was in global warming potential, resulting from the high energy requirements of glass manufacture. Bottle production was also found to have a significant impact in the beer lifecycle on climate change potential, for which it contributes 78% of the impact of the life cycle, ozone
47 Thermal energy efficiency has improved from 34.5kWh/hl since 2000, while electrical energy offence has remained the same. 48 Note that beer production has decreased 10% over the same period (Downing et al, 2003) 49 The life cycle analysis examined production of 0.33L disposable glass bottles of beer formed from 60% topaz glass and 40% recycled glass. 50 Production and transportation of packaging materials accounted for 44% of the global warming potential of the entire beer production life cycle and 52% of the acidification potential (Hospido et al, 2005). 51 This life cycle analysis did not include the agricultural stage of raw materials production. Transportation of raw matiersl is included in the analysis.
115
depletion (91%); eutrophication potential (52%); acidification (90%); human toxicity (91%) and earth toxicity (94%).
The Danish Environmental Protection Agency (1998) published a comprehensive report comparing the environmental impacts of the lifecycles of different packaging systems for 33cl of beer which included refillable glass bottles, disposable glass bottles, aluminium cans and steel cans. The assessment concludes that reusable glass bottle packaging systems are the most environmentally favourable system52. It must be noted that large uncertainties surround all calculations, particularly associated with the energy source used. The use of either fossil or non-fossil fuel based energy production has a significant effect on environmental impacts which can alter the relative rankings of the environmental impact of each system. The favourable environmental impact of re-usable glass bottle is also supported by work of the German Environment Authority which concludes that for carbonated drinks a returnable glass bottle system is more favourable than disposable glass bottles, aluminium or tin-plated cans (Plinke et al., 2000). It must be noted that the environmental advantage of returnable over non-returnable drink packaging is disputed; as with all re-usable packaging systems, their relative environmental performance vis-à-vis single trip systems depends critically on the number of round trips each container makes in the re-use system and the fate of waste in the single trip system.
Distribution
Figures collected by the Market Transformation Programme and reported by Garnett (2006) suggest that ice machines, service cabinets and cellar coolers in the UK’s pubs and off-licences consume some 7.5TJ of electricity per year, which would be responsible for around 900,000 tonnes of CO2 emissions from electricity generation with the current UK fuel mix. While this equipment is used to cool other products besides beer, it is notable that these emissions are of a similar scale to those calculated by Vaughan (1999) for all UK breweries and quoted at the beginning of this section. Were this divided up between just the 60 million hectolitres of beer consumed in the UK the resulting GWP burden per litre of beer would be 150g CO2 equivalent. Even recognising that other products – notably carbonated drinks - share these storage facilities this seems a somewhat high value in the light of the 5.6g CO2 equivalent per litre of associated with brewing by Koroneos et al. (2005). Further consideration of the coverage of these data would therefore be needed before their use in the context of a product-specific assessment.
116
Carbonated soft drinks and sugar
A market analysis conducted by Mintel estimated that 6,251 million litres of carbonated soft drinks were sold in the UK in 2004, representing half of all soft drink sales. Coca-Cola Enterprises dominates the UK carbonated drinks market (60% volume sales), followed by Britvic Soft Drinks.
The results of the EIPRO project suggest that the soft drink chain is environmentally significant: the sector-based modelling in that study allocates to “bottled and canned soft drinks” 0.9% of Europe’s total global warming impacts, 1.2% of its photochemical ozone creation potential (a measure of emissions that contribute to the formation of low-level photochemical smog), 0.8% of its eutrophying emissions and 0.9% of the continent’s acidifying emissions. No life cycle analysis of a carbonated soft drink has been found in the literature. Some information about the soft drinks production process exists in the form of process data from UK manufacturing plants of Britvic in Leeds and Cott Bondigate. These sources offer some useful data on energy and water use as well waste production. Figures quoted for energy use vary from a maximum of 1.15MJ/litre product to 0.47MJ/litre. Water use varies from 4-2.5 litre per litre of drink. Solid waste produced, which includes cardboard, plastic, and aluminium is quoted as 7.73g/litre and 4.6g/litre. Liquid waste - in the form of aqueous effluent - is an important waste stream with figures for chemical oxygen demand (COD) content varying significantly between 3.6g/litre and 0.83g/litre.
One of the most important ingredients in soft drinks in sugar, quoted as the second largest ingredient after water in most soft drinks sold (carbonates with added sugar account for 59% of the volume sold). An ecological footprinting study of cider (of which sugar is also an important ingredient) carried out in the late 1990s concluded that the sugars were the most environmentally-significant component (Heathcote, pers. comm). The environmental impacts of primary production and processing of sugar are discussed below: it should be remembered that other forms of sugar, such as corn syrup, are available and their production may have somewhat different environmental implications. We have no information about the relative amounts of different sugars used in soft drinks. The other environmentally important aspect of soft drink production is associated with packaging, which is also discussed below.
52 It must be noted that the assessment is based on existing Danish infrastructure which may not be present in the UK.
117
Sugar production and consumption in the UK
Sixty percent of the sugar consumed in the UK is from home-grown sugar beet, 9 million tonnes of which are processed in the UK each year in 6 British Sugar refineries. Approximately 500 lorry loads per day of raw beet are delivered during the refining season (British Sugar website), and approximately 2.5 million tonnes of sugar is produced in the UK per annum. Around 2.25 million tonnes of this is consumed and the remainder is exported. The remaining 40% of sugar used in the UK is from imported sugar cane, the majority of which is refined at Tate and Lyle’s Silvertown plant in East London (EFRAC, 2004). 75% of sugar used in the UK is used in the manufacture of sweet foods and soft drinks (Mintel, 2005).
Primary production of sugar beet
Sugar beet cultivation in the UK is located mainly in East Anglia and the West Midlands. There are 7000 growers, producing 9 million tonnes of beet on 150,000 hectares of land. The environmental impact of sugar beet agriculture is mainly to do with of biodiversity, soil erosion and effects associated with the use of agrochemicals (DEFRA, 2002). The use of nitrogen fertilisers has declined by about 30% over the last 20 years to 100-105kg/ha in 2000. Pesticides use on sugar beet crop in the UK has also reduced to just over 5kg/ha in 1998 (DEFRA, 2002). 350,000 tonnes of soil are lost annually in sugar beet agriculture, most of which is removed during harvesting. Sugar beet is normally not irrigated in the UK, with less than 5% normally receiving irrigation during dryer periods. Sugar beet plays an important role as a break crop in arable rotations dominated by winter what and barley, and as an integrated weed and pest management for arable crops. It is also an important source of food and habitat for several species of farmland birds (DEFRA, 2002).
Primary production of sugar cane
Renouf (2006) reports an analysis of the environmental impact of sugar cane growing in Queensland, Australia. The study indicates that very large differences exist between low-impact and high-impact sugar cane production practices with regard to energy use, water use (a twenty-fold variance) and eutrophication (a one hundred–fold variance).
The average energy use was 0.42 MJ/kg, but varied between 0.14-1.39 MJ/kg. The greatest energy requirements were fertiliser production (on average 0.161MJ/kg), on-farm fuel use (0.12 MJ/kg) and water pumping (0.10 MJ/kg). Irrigation dominated water use which was on average 65.6L/kg but ranged from 487-3.8 L/kg cane. The quantity of water pumped for irrigation has a very large influence on energy consumption.
118
Greenhouse gas emissions are dominated by the release of nitrous oxide (N2O) from denitrification processes taking place in fields: rates of nitrogen fertilizer application are a key determinant of N2O releases in this case. Fertilizer application is also the primary source of eutrophication potential which is on average 0.45 PO4
3- (eq) g/kg cane but ranges from 1.43-0.07g/kg. All the other emissions (with the exception of cane burning) are associated with the combustion of fossil fuels.
Sugar processing
Vaccari et al. (2005) present an overview of the environmental problems associated with sugar beet processing and some possible solutions. The primary environmental impacts are considered to be energy and water consumption, the use of large quantities of lime and the production of large amounts of pulp and lime sludge. Energy use is quoted as being in the region of 0.7MJ/kg. Water consumption is highly variable with quantities of 0.25-0.45 L/kg beet considered normal in older factories.
World Bank guidelines for effluent standards from sugar factories are 0.15-0.25g/l COD and 50g/l suspended solids. Ramjeawon (2000) examined the pollutant loads of selected Mauritian sugar cane refining factories and noted that BOD loading was relatively consistent between 0.51-0.69 g/kg cane. The COD and suspended solids varied significantly between 0.74-2.79 and 0.23-2.2 g/kg respectively. The main source of organic pollution was the cooling waters and floor wash which contains a high concentration of dissolved sugar from plant spillages and accounted for 70% or the organic load despite constituting only 12% of wastewater volume. The most polluting discharges occurred during weekend and end of season wash-downs when biological oxygen demand (BOD) reached as high as 20,000mg/l. It must be noted that there is a relatively low level of wastewater treatment in the majority of plants examined in this study.
The amounts of lime used in the sugar purification process are considered to present an important ecological problem (Vaccari et al., 2005). The lime, which must be good quality to avoid processing problems, is obtained from mining and may be transported large distances. The sludge produced by the calco-carbonic sugar purification process at British Sugar plants is sold as a soil-improving agent under the brand LimeX. The vegetable waste from the sugar beet is combined with molasses (liquid waste from sugar processing) and sold as animal feed. This is said to eliminate problems associated with disposal of wastes from the refining process (British Sugar Website, 2006).
119
Soft drink packaging
66% of UK carbonate sales are in PET bottles, followed by aluminium cans which have a significant (20%) but declining share of the market. The remainder of soft drinks are sold as draught (11% and increasing) and in glass bottles (3% and declining).
The Danish Environment Agency has conducted in-depth analyses of different soft drink packaging systems. The studies use data representative of Danish infrastructure and usage rates to arrive at conclusions associated with the impacts of different packaging types including re-use systems. The German Environment Agency has also conducted a similar, but less detailed study. Both studies conclude that re-use systems are distinctly more environmentally favourable than disposable packaging. As noted in the discussion of Beer (p111), these results are not undisputed (see information-zentrum-Weiβblech e.v., undated, for a summary of criticisms). The results of the Danish study indicate that energy use for production of PET bottles is approximately one order of magnitude lower than that for production of aluminium cans (0.182MJ/L compared to 1.087MJ/L) (it must be noted that the figures quoted are based on a functional unit of production and distribution of 1000L in 150cl PET bottles and in 33cl Al cans). Waste production is four times greater for aluminium cans (81.1kg/1000L) than PET bottles (19.9kg/1000L). Eutrophication potential is similar for two systems (1.5g and 1.72g NO3
-
eq for PET /Al can respectively) as is BOD (28.4g/24.5g PET /Al can respectively) COD is higher for Aluminium cans at 342g compared to 154g. However, the acidification potential is significantly higher for PET at 4.27kg SO2
-(eq) compared to aluminium cans at 1.73g SO2
- (eq).
Mineral water
Consumption of bottled water in the UK
Bottled water volume sales increased by 46% between 2000 and 2004 and stood at 1,719 million litres in 200453. Future growth of around 9% per annum is predicted. Natural mineral water accounts for 56% of all bottled water consumption, while spring/table water take over a quarter share (Mintel, 2005).
Danone is the leading supplier of bottled water to the UK market, its Volvic and Evian brands ranking first and second with 15.6% and 13.5% of the UK market share respectively (Mintel 2005). Highland Spring, whose plant is in Blackford, Perthshire, is the leading British producer of natural mineral water in the UK, with 6.4% of the market,
53 Includes sparkling, still and flavoured via all off trade outlets.
120

and exports to over 50 countries worldwide. Buxton, owned by Nestle, holds 4% of the market. Princes is the UK’s second-largest producer of mineral water, with sources at Eden Valley in Cumbria and Church Stretton in Shropshire. These sites produced over 190 million litres of water in 2003. Own brand waters account for 46.7% of the market. Greencore is the largest producer of own-brand waters. Their Hazlewood Mineral Water plant produces over 120 million liters a year mineral water from the Campsie Springs in the Campsie Fells.
Transport
The main environmental impacts of bottled water are associated with transport and packaging. Transport produces atmospheric pollutants and contributes to climate change. Bottled water companies serving the UK market produce an estimated 33,200 tonnes of CO2 emissions per annum (Richards, 2006). Imported water, which makes up around a third of the UK market accounts for a considerable amount of this. This proportion of water imported appears to be slightly above the world average. The Earth Policy Institute concluded that of the 154 billion litres of bottled water consumed globally each year around a quarter is imported (Arnold, 2006). The water industry disputes this, claiming the figure is nearer 3% (Richards, 2006).
Volvic, providing about one-sixth of bottled water in the UK comes from the Auvergne region of southeast France. Water travels around 1000km and produces around 9,000 tonnes of CO2 per annum in the process (Richards, 2006). Evian transports its water around 930km from Lake Geneva, producing 14,000 tonnes CO2. British suppliers travel shorter distances and are consequently less environmentally costly. Highland Spring whose plant is in Blackford, Perthshire, produces 5,500 tonnes per year (Richards, 2006).
The impact of transport depends on several factors: the mode of transport, the type, age and condition of vehicles, the distance travelled and the driving mode of motor vehicles (urban, rural or highways) (Ekvall, 1998). These factors affect the impact of transport on both atmospheric pollution and climate change.
121

Packaging
Packaging is the other significant aspect of bottled water with an environmental impact. 81% of bottled water sold in the in the UK is plastic. The remainder is glass, the majority of which sold via the on-trade (Mintel, 2005). Most plastic water bottles are made of PET with a minority made from PVC. It is estimated that 27 million tonnes of plastic are used to bottle water each year worldwide (Arnold, 2006). Bottled water comes in several different sizes and formats. In Europe, regulation of natural mineral water limit bottle volumes to a maximum of 8 litres – among other reasons to ensure the best possible sanitary environment (Ferrier, 2002). In the UK, large multi-packs accounted for 42% of sales volume via supermarkets in 2004, up from 38% in 2002. Small multi-packs (250ml-500ml) accounted for 14% (Mintel, 2005).
Refillable PET bottles are known to have a have a much lower environmental impact than disposable bottles including global warming, acidification, photochemical ozone formation and eutrophication potential (Ekvall, 1998). However, refillable bottles are currently not used in the industry. Evian say that they do not envisage the use of returnable packaging, which they estimate would double transport needs, increasing emissions of CO2, NOx and SOx (Ferrier, 2001). This view is considered representative of the industry as a whole.
The major environmental impacts associated with production of disposable PET bottles are global warming potential from energy use and photochemical ozone formation. The production of PET resin is slightly more important than bottle production with regard to global warming potential but contributes 100% or photochemical ozone production potential (Ekvall et al., 1998).
Ekvall et al. (1998) report that the production of 150cl PET bottles uses 0.182MJ/L based on production and distribution of 1000L of PET bottles. This is less energy intensive/volume than smaller bottles. Energy use also provides a useful, if coarse, indicator of the environmental impact of the transport of bottled water. For example, the UK’s leading brand (Volvic) is transported about 1000km by road, which requires approximately 0.6MJ/L, on the basis of fully-loaded articulated trucks operating at typical fuel consumption levels. When the energy required for bottling and transport is considered (0.78MJ/L) in comparison to the energy required to deliver UK tap water
122
which is on average 0.0024MJ/L (Severn Trent Water, 2006) it becomes obvious that the energy use associated with bottled water is orders of magnitude greater than tap water and almost certainly far more environmentally damaging.
Coffee
There is some discussion of the environmental impacts associated with the life cycle of coffee in the literature. It is clear from these that the way in which the coffee plant is grown, the method of processing chosen and the way in which the coffee is prepared by the consumer are all of environmental significance. None of the studies identified covers all of these variables together, but they do allow some general observations to be made. There is no consideration in the literature of the relative environmental significance of the production of instant coffee – perhaps a reflection of the fact that the relevant literature is Italian, Danish and Brazilian, rather than British.
Salomone (2003) considers the entire life cycle of a 1kg pack of ground coffee, converted to green coffee using the “dry” method (see below) and processed (roast & ground) in Sicily. Although Salomone’s data for coffee cultivation are not highly detailed, she identifies cultivation and preparation by the consumer as the most significant stages of the life cycle. In her base-case, converting 1kg of ground coffee into the finished drink is associated with CO2 releases of some 70kg. Salomone points out, however, that assumptions about the type of energy carrier used to power the coffee-maker have a strong effect on this result.
Pelupessy (2005) highlights the different environmental impacts of different methods of coffee cultivation. These range from the traditional method which is “an integrated agro-forestry system”, uses little by way of agrochemicals, has a low plant density of 1000-3000 per hectare and yields 190-300kg per hectare of coffee to the sun-grown approach which has plant densities above 5000 per hectare, involves high use of agrochemicals and provides yields above 1300kg per hectare. Pelupessy also notes that some of the environmental consequences of the choice between these approaches relate to issues such as erosion control which receive little if any attention in LCA studies.
Pelupessy also notes that the choice between the traditional “dry” method of transforming coffee berries into green coffee (the internationally trade commodity) and the “wet” method have has a strong influence on the environmental impacts of coffee production. The dry method simply involves sun-drying or heat-drying the berries, while
123
the wet method uses water to remove the pulp from the bean within 24 hours of harvesting. The latter offers better quality control but may consume up to 67 litres water per kg coffee and generates large volumes of effluent: the bean constitutes somewhat less than 20% of the berry, with the remainder being waste (although Coltro et al. imply that some or all of this can be used as fertiliser).
Coltro et al. (2006) have conducted a much more detailed study of the inputs to and outputs from green coffee production in Brazil as the first step towards determining eco-labelling criteria. Their data show that these inputs and outputs vary greatly (as do agricultural practices and prevailing conditions in the places where coffee is grown), with energy inputs for production of 1kg of green coffee ranging from a minimum of 3.8MJ to a maximum of 66.5MJ, water inputs ranging from 70 millilitres to 60 litres per kg green coffee and total fertiliser use from 10 grams to 3.5 kilograms per kg. Yields also vary widely, with the land needed to produce 1000kg of green coffee ranging from 0.01 ha to 3ha. Since Coltro et al. find that even among those using the “wet” method for extracting beans waste water generation ranges from 2.6 litres per kg to over 15 litres per kg, convergence around best practice might well deliver considerable benefits.
Orange juice
No detailed analysis of the overall environmental impacts of orange juice in any form has been found in the literature Schlich and Fleissner (2003) consider the relative energy requirements of orange juice produced on a large scale in Brazil and shipped to Europe in a comparison with apple juice made on a small scale in Europe, and find that the “ecologies of scale” outweigh the penalties of distance. Their approach, however, has been challenged (Jungbluth & Demmeler, 2004) and is of course a comparison between different food items.
Wine
The environmental impact of wine production has been the subject of some study. One LCA covering viticulture, vinification and bottling is reported by Notarnicola and Tassielli (2005). While providing little indication of the absolute values of the impacts (or potential impacts) of the wine system, this finds that agricultural activities and the production of glass bottles are the most environmentally-significant stages of the life cycle. The agricultural stage is particularly significant for eutrophication and toxicity (linked to the use – and loss - of fertilisers and pesticides respectively), while the production of bottles is most significant for primary energy consumption and global warming potential.
124
Vinification itself only makes a significant contribution to the environmental theme of photochemical ozone creation potential, a contribution which stems from the emissions of volatile organic compounds which inevitably accompany winemaking.
Notarnicola and Tassielli note that organic viticulture does not necessarily offer a “quick fix” for reduction of the impacts associated with fertiliser and pesticide use. Organic vineyards are apparently very much lower-yielding than “conventional” ones (yields are on average 40% lower), while the permitted fertilisers and pesticides are not entirely free of environmental impacts in use or in production. We have not found a quantitative comparison of the two systems in the course of this research, however.
125
Mixed products, snacks and other items
Summary
• Although the EIPRO analysis suggests that processed food groups such as “edible oils” or “potato chips and similar snacks” are significant contributors to the environmental impacts of Europe, there is limited evidence about the relative importance of different parts of their life cycles.
For edible oils, primary production is the key part of the life cycle in environmental terms.
• Data relating to UK primary food production is only partially relevant to understanding the environmental impacts of processed food items produced in the UK, which draw on geographically diverse sources
• Evidence from the few LCA studies of basic foods that extend beyond the farm gate suggests that processing and refrigeration may make significant contributions to the total life-cycle impacts of food products that involve several stages of processing.
• One Swedish study has sought to compare home-prepared with industrially-prepared meals, and found little difference in environmental terms between them. However, the conclusions of this work cannot readily be taken to apply to the UK for two reasons:
◦ Evidence about more basic foods indicates that freeze-thaw cycles introduce significant energy demands into food product life cycles. These are linked to significantly higher environmental impacts in the UK than they are in Sweden because of differences between the fuels used for electricity generation in the two countries.
◦ The conclusions are highly dependent on utilisation at each point in the chain. There is too little evidence about utilisation of foodstuffs in UK industry and households for any statement to be made about the equivalence of data on this aspect between the two countries.
126
Chocolate bars
No analysis of the overall environmental impacts of chocolate bars has been found in the literature. Cocoa, sugar and other vegetable fats are key ingredients. Resources were not available within the project to attempt to construct an evaluation on the basis of the data available for these basic items – which are in any case limited. Some discussion of the environmental impacts of sugar production and processing, which are better reported, is included here under the heading of “Soft Drinks”.
Cocoa is grown in Central and South America, the west coast of Africa and more recently in South East Asia. Eight countries - Ivory Coast, Ghana, Indonesia, Nigeria, Brazil, Cameroon, Ecuador and Malaysia - supply 88% of world output. Over 40% of the world's supply comes from Ivory Coast, where cocoa is grown mainly on over 600,000 small, family-owned farms. Small holders grow some 70% of cocoa, and most cocoa farms occupy between one and three hectares.
Cocoa farming provides a relatively low income, which may at least partially account for the fact that the farms operate under low intensity conditions, so that much cocoa is grown more or less organically. Cocoa trees are often planted in the shade of other trees such as banana or coconut, and cocoa is said to leave the smallest mark of all tropical cash crops. Problems identified in the limited literature that covers the environmental impacts of cocoa farming (as distinct from the social issues that arise in the coca chain) are: biodiversity decline, soil fertility decline and soil erosion. Some cocoa is apparently grown in thinning forest which is less environmentally damaging but more labour intensive.
Olive oil
Given the raw ingredient used in the manufacture of olive oil, the ‘oil spreads’ discussion is relevant here. Shonfield and Dumelin (in press) present evidence to suggest that the environmental impacts of oil-based products are associated with the primary production of the raw ingredients. The authors note that olive oil has a high environmental impact at the agriculture and oil extraction/refining stages. Compared to alternative oils (such as coconut and palm oil) it requires significantly more pesticides and fertilisers and more mechanical operations at the agriculture and extraction stages: see Figure 36 below.
127
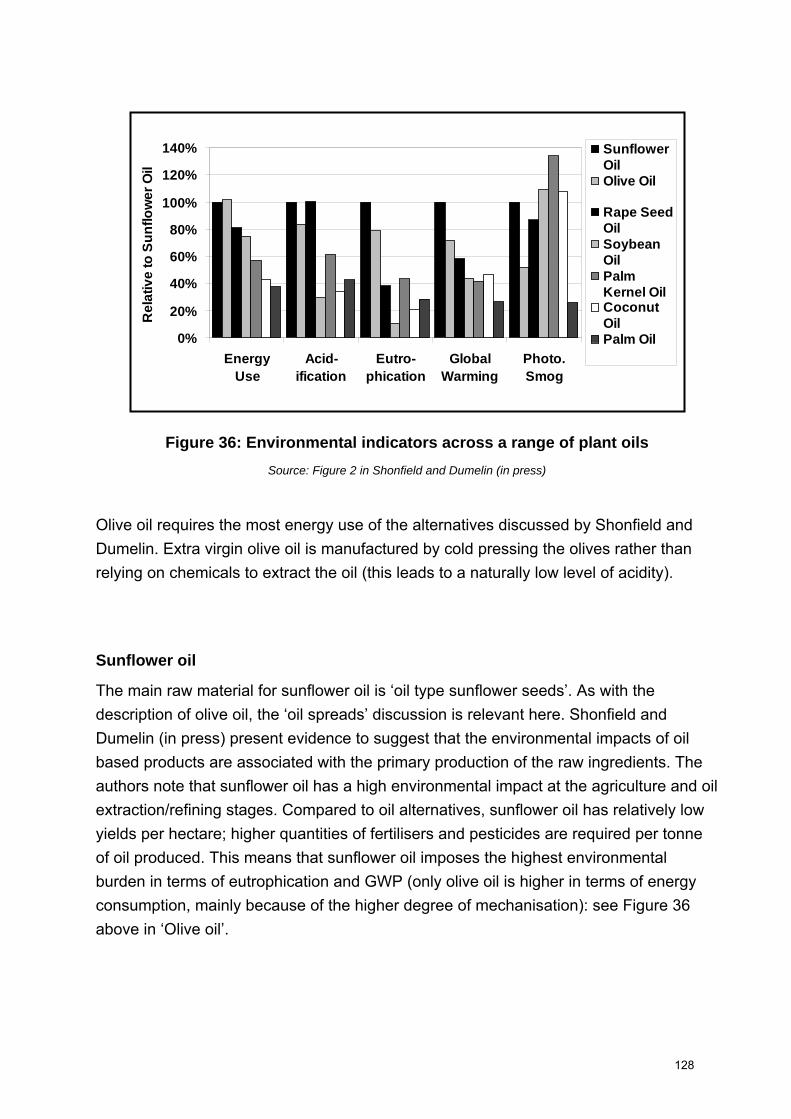
0%
20%
40%
60%
80%
100%
120%
140%
EnergyUse
Acid-ification
Eutro-phication
GlobalWarming
Photo.Smog
Rel
ativ
e to
Sun
flow
er O
ilSunflowerOilOlive Oil
Rape SeedOilSoybeanOilPalmKernel OilCoconutOilPalm Oil
Figure 36: Environmental indicators across a range of plant oils
Source: Figure 2 in Shonfield and Dumelin (in press)
Olive oil requires the most energy use of the alternatives discussed by Shonfield and Dumelin. Extra virgin olive oil is manufactured by cold pressing the olives rather than relying on chemicals to extract the oil (this leads to a naturally low level of acidity).
Sunflower oil
The main raw material for sunflower oil is ‘oil type sunflower seeds’. As with the description of olive oil, the ‘oil spreads’ discussion is relevant here. Shonfield and Dumelin (in press) present evidence to suggest that the environmental impacts of oil based products are associated with the primary production of the raw ingredients. The authors note that sunflower oil has a high environmental impact at the agriculture and oil extraction/refining stages. Compared to oil alternatives, sunflower oil has relatively low yields per hectare; higher quantities of fertilisers and pesticides are required per tonne of oil produced. This means that sunflower oil imposes the highest environmental burden in terms of eutrophication and GWP (only olive oil is higher in terms of energy consumption, mainly because of the higher degree of mechanisation): see Figure 36 above in ‘Olive oil’.
128
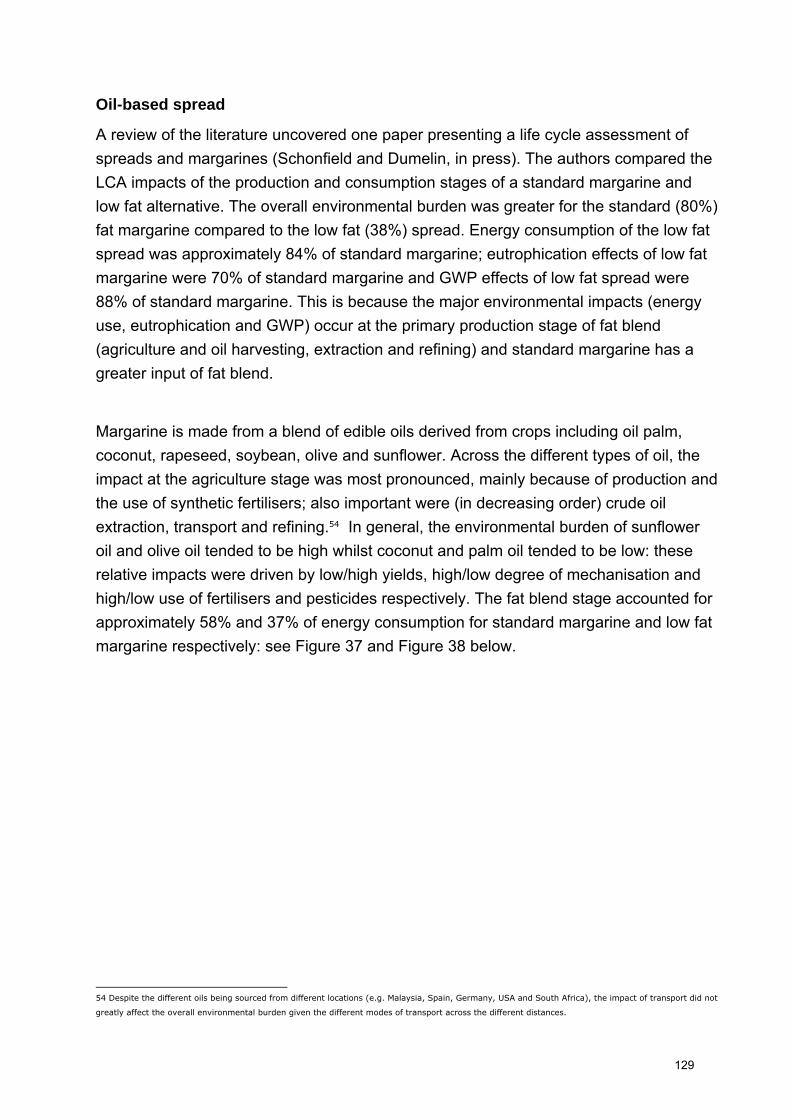
Oil-based spread
A review of the literature uncovered one paper presenting a life cycle assessment of spreads and margarines (Schonfield and Dumelin, in press). The authors compared the LCA impacts of the production and consumption stages of a standard margarine and low fat alternative. The overall environmental burden was greater for the standard (80%) fat margarine compared to the low fat (38%) spread. Energy consumption of the low fat spread was approximately 84% of standard margarine; eutrophication effects of low fat margarine were 70% of standard margarine and GWP effects of low fat spread were 88% of standard margarine. This is because the major environmental impacts (energy use, eutrophication and GWP) occur at the primary production stage of fat blend (agriculture and oil harvesting, extraction and refining) and standard margarine has a greater input of fat blend.
Margarine is made from a blend of edible oils derived from crops including oil palm, coconut, rapeseed, soybean, olive and sunflower. Across the different types of oil, the impact at the agriculture stage was most pronounced, mainly because of production and the use of synthetic fertilisers; also important were (in decreasing order) crude oil extraction, transport and refining.54 In general, the environmental burden of sunflower oil and olive oil tended to be high whilst coconut and palm oil tended to be low: these relative impacts were driven by low/high yields, high/low degree of mechanisation and high/low use of fertilisers and pesticides respectively. The fat blend stage accounted for approximately 58% and 37% of energy consumption for standard margarine and low fat margarine respectively: see Figure 37 and Figure 38 below.
54 Despite the different oils being sourced from different locations (e.g. Malaysia, Spain, Germany, USA and South Africa), the impact of transport did not
greatly affect the overall environmental burden given the different modes of transport across the different distances.
129
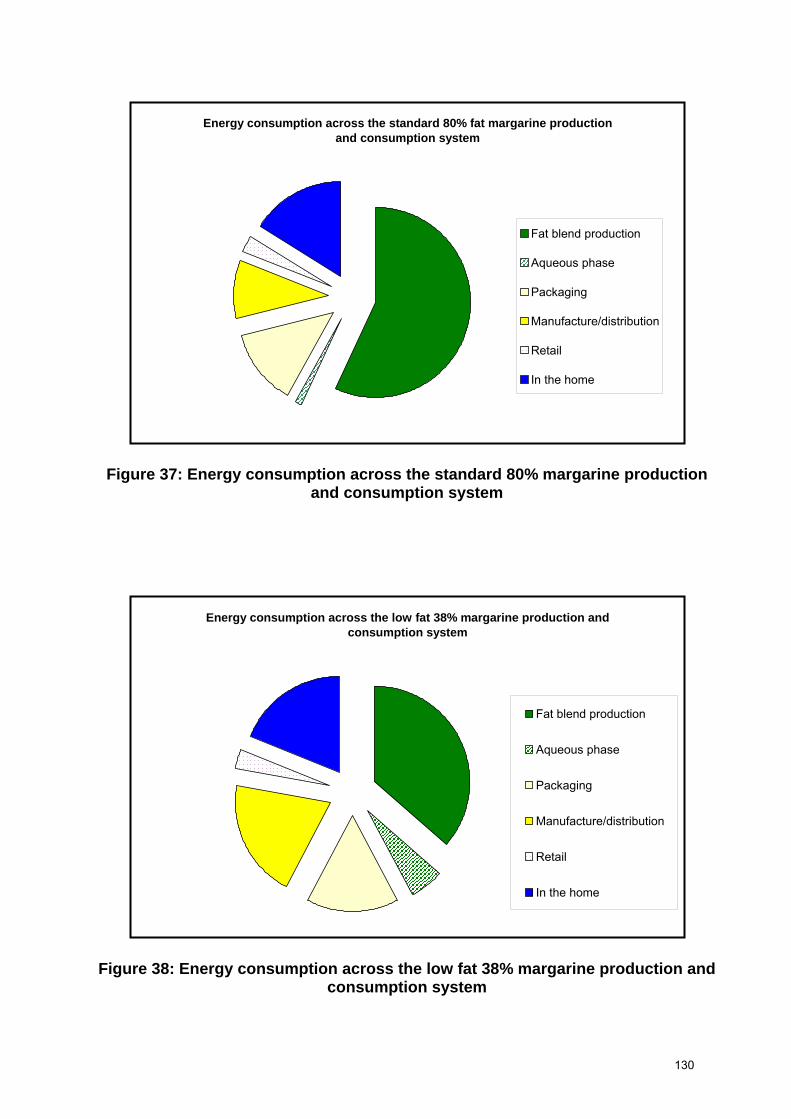
Energy consumption across the standard 80% fat margarine production and consumption system
Fat blend production
Aqueous phase
Packaging
Manufacture/distribution
Retail
In the home
Figure 37: Energy consumption across the standard 80% margarine production
and consumption system
Energy consumption across the low fat 38% margarine production and consumption system
Fat blend production
Aqueous phase
Packaging
Manufacture/distribution
Retail
In the home
Figure 38: Energy consumption across the low fat 38% margarine production and
consumption system
130
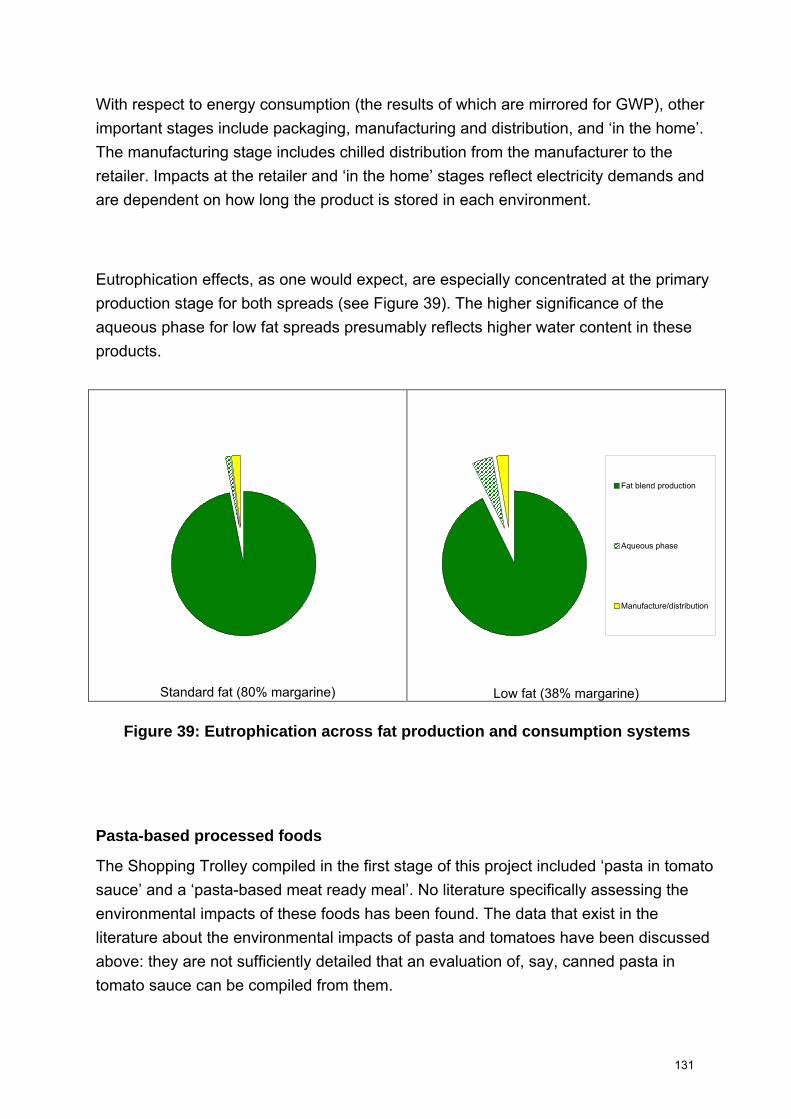
With respect to energy consumption (the results of which are mirrored for GWP), other important stages include packaging, manufacturing and distribution, and ‘in the home’. The manufacturing stage includes chilled distribution from the manufacturer to the retailer. Impacts at the retailer and ‘in the home’ stages reflect electricity demands and are dependent on how long the product is stored in each environment.
Eutrophication effects, as one would expect, are especially concentrated at the primary production stage for both spreads (see Figure 39). The higher significance of the aqueous phase for low fat spreads presumably reflects higher water content in these products.
Standard fat (80% margarine)
Low fat (38% margarine)
Fat blend production
Aqueous phase
Manufacture/distribution
Figure 39: Eutrophication across fat production and consumption systems
Pasta-based processed foods
The Shopping Trolley compiled in the first stage of this project included ‘pasta in tomato sauce’ and a ‘pasta-based meat ready meal’. No literature specifically assessing the environmental impacts of these foods has been found. The data that exist in the literature about the environmental impacts of pasta and tomatoes have been discussed above: they are not sufficiently detailed that an evaluation of, say, canned pasta in tomato sauce can be compiled from them.
131
Sonesson and colleagues at the Swedish Institute of Food and Biotechnology have carried out an investigation of the environmental impacts of three meals in different formats: one made in the home from raw ingredients; one finished in the home from semi-prepared components, and one as a ready-meal heated up at home (Sonesson and Davis 2005; Sonesson, Mattsson, Nybrant & Ohlsson 2005). The meals studied are a meatball, carrot, potato and bread meal, a meal of chicken fillet with roast potatoes, carrots, lettuce, sauce and bread, and a meal of re-heated chicken and potato hash, again with carrots, lettuce, sauce and bread. This study is a rare example of an investigation using LCA techniques that seeks to follow a complex food product through the entire production-consumption system.
The report of the study (Sonesson and Davis 2005) points out that energy production is modelled to reflect the Swedish situation and that “Current Swedish electricity base load does, in effect, not produce any emissions contributing to the environmental effect categories considered in this study, since it is mainly produced by hydro- and nuclear power” (Sonesson & Davis 2005, p.157). The effect of this is that environmental impacts at the primary production end of the system (which are more closely driven by direct emissions from plants, animals and farm activities) show up as more significant than they would in a system where electricity base load was generated from fossil fuels. In particular, freezing, which is an energy-intensive activity driven almost entirely by electrically-powered compressors and pumps, will have almost no environmental impact. As a result it is difficult to read across the results for individual meals to the UK situation.
One of the main conclusions of the (so-called) ‘meatball study’ is that utilisation at all points in the chain is a critical parameter when considering the question of whether meal preparation at home has greater or lesser environmental impacts than production and subsequent consumption of ready meals. Since our review of other food products has found that environmental impacts arising in the course of primary production are significant in nearly all cases, this conclusion will apply to almost all food processing: the more of the basic food we utilise, the less we have to grow to throw away.
However, there is certainly not enough evidence available to us to state whether utilisation is better in the chain of industrial food preparation or in home cooking in the UK. At the consumer end of the system, Sonesson and Davis (2005) draw on
132
observation of Swedish households, but WRAP is only now embarking on research to understand household food waste generation in the UK – and human behaviour may well be considerably different in the two countries.
Further up the chain, it is clear that processing food on an industrial scale does open up opportunities to maximise utilisation (for example making potato flake from the trimmings that arise when potatoes are cut into chips) and to valorise wastes (e.g. taking the skin and bones from fish filleting facilities to fishmeal factories, as happens in the Grimsby area). But observation of food processing facilities demonstrates that some loss is inevitable. In the ’meatballs study’ by Sonesson and Davis, the ready-meal chain has 3 processing stages compared to one in the home-made chain, so there are 3 times as many opportunities for wastage, and presumably 3 times as many pack-unpack cycles (there may also be 3 times as many freeze-thaw cycles). Information about waste volumes contained in PPC permit applications for a number of companies making prepared food products (ready meals, pizzas, pies, filled Yorkshire puddings, etc.) suggests that total waste:product ratios in the range 1:10 to 1:5 are not uncommon. The same data sources indicate that electricity can account for up to 70% of energy use in the production of frozen assembled food products, reinforcing the message that the results (as opposed to the conclusions) of the Swedish meals study are of limited relevance to the UK situation.
Similar trade-offs appear likely in the field of water utilisation. Obviously, consumers who eat complete ready meals directly from the tray in which they are normally contained drastically reduce the amount of dishes they have to wash. Data in Sonesson and Davis (2005) suggests that washing the dishes for a meal prepared at home for four people consumes about 10 litres of water for a little more than 2kg of finished food “product” (i.e. approx 5 litre/kg product). But food processors also need to clean equipment: a review of a small number of PPC permit applications from sites making prepared food products shows that water discharge volumes (a better indicator of water used for cleaning than water consumption, since many processes involve the addition of water to product) vary considerably, but 2-4 litre per kg product does not seem untypical for those making frozen finished meals of different kinds55. Given the likelihood that the production of prepared meals involves more than one processing stage, this evidence is not sufficient to confirm or refute the notion that industrial processing of food is more
55 It has been observed that there can be significant differences between the water needs of plants producing frozen foods and those producing chilled foods, where production runs tend to be shorter because of the shorter shelf-life of products.
133
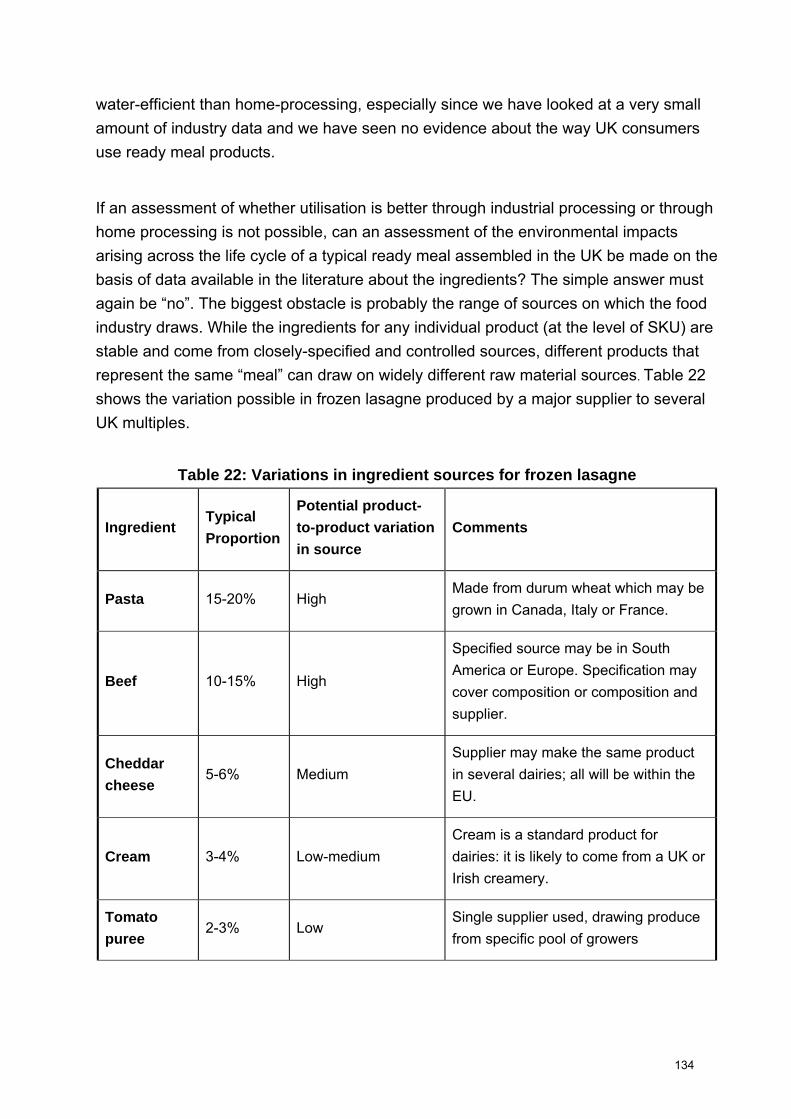
water-efficient than home-processing, especially since we have looked at a very small amount of industry data and we have seen no evidence about the way UK consumers use ready meal products.
If an assessment of whether utilisation is better through industrial processing or through home processing is not possible, can an assessment of the environmental impacts arising across the life cycle of a typical ready meal assembled in the UK be made on the basis of data available in the literature about the ingredients? The simple answer must again be “no”. The biggest obstacle is probably the range of sources on which the food industry draws. While the ingredients for any individual product (at the level of SKU) are stable and come from closely-specified and controlled sources, different products that represent the same “meal” can draw on widely different raw material sources. Table 22
shows the variation possible in frozen lasagne produced by a major supplier to several UK multiples.
Table 22: Variations in ingredient sources for frozen lasagne
Ingredient Typical Proportion
Potential product-to-product variation in source
Comments
Pasta 15-20% High Made from durum wheat which may be grown in Canada, Italy or France.
Beef 10-15% High
Specified source may be in South America or Europe. Specification may cover composition or composition and supplier.
Cheddar cheese
5-6% Medium Supplier may make the same product in several dairies; all will be within the EU.
Cream 3-4% Low-medium Cream is a standard product for dairies: it is likely to come from a UK or Irish creamery.
Tomato puree
2-3% Low Single supplier used, drawing produce from specific pool of growers
134
It would seem then that analysis of an “average” over all the variants possible would be of little value. In addition, if the impacts of agricultural production vary with location to the extent suggested by several experts and by the available evidence for more basic foods (e.g. tomatoes), then using data relating to production in one place as a proxy for data on all production could also produce misleading results.
Pizza
While basic items still dominate the UK food shopping basket, the growth in sales of finished meals and ready-to-eat foods made desirable the inclusion of several such items in the “Shopping Trolley” considered by this project. No literature assessing the environmental impacts of pizza - whether on a generic or a single-case basis - has been identified. A study of resource flows in the food and drink sector in the UK noted that “Pizza production…involves inputs from several classes of food processing as well as the reuse of some waste in the agricultural sector”, and went on to note that, in a study of that kind, “it would be impractical to map out such complex flows for every process and product encountered in the food processing industry” (C-Tech Innovation Ltd, 2004, p.7). While the work of Sonesson and Davis (see pasta-based ready meals section) suggests that the analytical challenges involved are not insurmountable at the single-product level, there is clearly a need for careful design of any study to enable meaningful results to be obtained.
135
Part 3: Conclusions and recommendations
The main objective of the research reported here was to determine what evidence is available relating to the environmental impacts that occur in the life cycles of a range of food products or product types. The range was to include both fresh and processed goods, organic and conventionally grown produce, locally-sourced and globally-sourced foods and take account of different sources of nutrition.
In addition, we were seeking evidence on whether it is possible to identify the extent to which certain patterns of production, sourcing and distribution have a greater or lesser impact on the environment. In so far as it was possible, we were also to seek information on what changes in environmental impacts current trends in food supply and consumption are likely to have in the future and to consider the extent to which lifestyle changes, which may be occurring for other reasons, may affect the environmental impacts of food consumption. Part 2 of the report has presented the available data on the environmental impact of a number of foods and food types; for each one we have provided a summary of the evidence that is available on the environmental impacts.
In Part 3, we draw on these summaries to give some overall conclusions to be drawn from the evidence on different foods. In addition, we give some suggestions for further work that needs to be done to provide more solid evidence for policy action.
Environmental impact of food production and consumption: the quality of the available data
The data on environmental impacts of the supply and consumption of the range of common foods consumed in the UK that have been presented in Part 2, and from which we could draw policy-relevant evidence are patchy, to say the least.
136
A major problem is that there are few data of UK ‘origin’ focusing on the specifics of the UK production/import, processing, distribution and final consumption of the range of foods we identified for study. We have not found any one single, publicly-reported LCA study covering the entire life-cycle for a food product as a UK consumer would buy it. It is true that there are numerous studies of food impacts from other individual European countries, especially from Scandinavian ones, and it is possible to draw conclusions from them that are reasonably applicable to the UK situation. However, it is necessary to be cautious, given that the systems of food production and consumption have strong national specificities. For example, the relevance of Scandinavian studies with regard to energy impacts is restricted because of the different environmental impacts of the different mixes of power generation technologies between, for example, Sweden and the UK. Thus, the big issue is what interpretations can be made from an individual study based on only one food type in one country, both for the country studied and for other countries.
There are some considerable inconsistencies in the data that we have found, from whatever country. For example, few studies cover the entire ‘farm to fork’ life cycle; there is a strong leaning to the ‘farm’ end, with a preponderance of analyses of the environmental impacts of agricultural production, ending at the farm gate. In addition, there is limited consistency regarding the actual impacts that are measured. Almost all studies cover energy use and, explicitly or implicitly therefore, CO2 emissions: most cover non-CO2 greenhouse gas emissions as well. Many studies cover eutrophication effects (though not always in compatible units). Impacts on water resources are seldom included despite the fact that food production and processing accounts for the majority of water use globally. However broad the coverage, there are problems in making comparisons: the units of measurement are not always comparable, and neither are the modes of presentation of the data. Results are often presented in short papers, with insufficient clarity regarding the measurements made, judgements made and quality of the synthesis of those measurements and judgements. In addition, it is sometimes hard to identify the original sources of the data employed in some LCA reports. Also, as we have pointed out in Part 1 and the Technical Appendix on the LCA method, there are some impacts, such as on biodiversity and the implications of land-use that are not treated at all.
137
In short, it is necessary to be cautious in interpretations of the data available on environmental impacts, both regarding the quality of the data themselves in the absolute sense and in their comparative uses. To make credible comparisons, we need to be sure how we can ‘UK-ise’ the data derived from other country studies (e.g. we need to be able to extract the Swedish-specific District Heating element of energy consumption from Swedish data to make them applicable to the UK.). It is necessary therefore to have some ‘inside’ knowledge of the specific details of any country’s food supply and consumption system as it applies to the food being studied in order to draw UK-relevant conclusions. Unfortunately, such information is rarely available. In the light of the very limited coverage of studies that extend beyond the farm gate, we would emphasise that, for the processing, distribution and final consumer phases, the body of LCA evidence represents quantified evaluations of certain ‘sample’ production-consumption systems. The evidence is not a numerical description of the environmental consequences of “average” production and consumption for a set of foods.
Environmental impact of food production and consumption: some general conclusions from the available data
Despite all the deficiencies in the data and the qualifications that are needed in applying it to specific foods and food types in the UK, some general conclusions emerge from a comparative look at the data for the individual food types. The Summaries at the beginning of the presentation of the data for each food type in Part 3 contain these conclusions for individual foods and should be taken as conclusions regarding the evidence available for each of the foods or food types described. Table 23, on the following pages is an Overall Summary of the main points emerging from the evidence about these foods as presented in the individual food type summaries. These summaries are the basis for the comments below, which relate to questions raised by DEFRA at the beginning of the project.
138
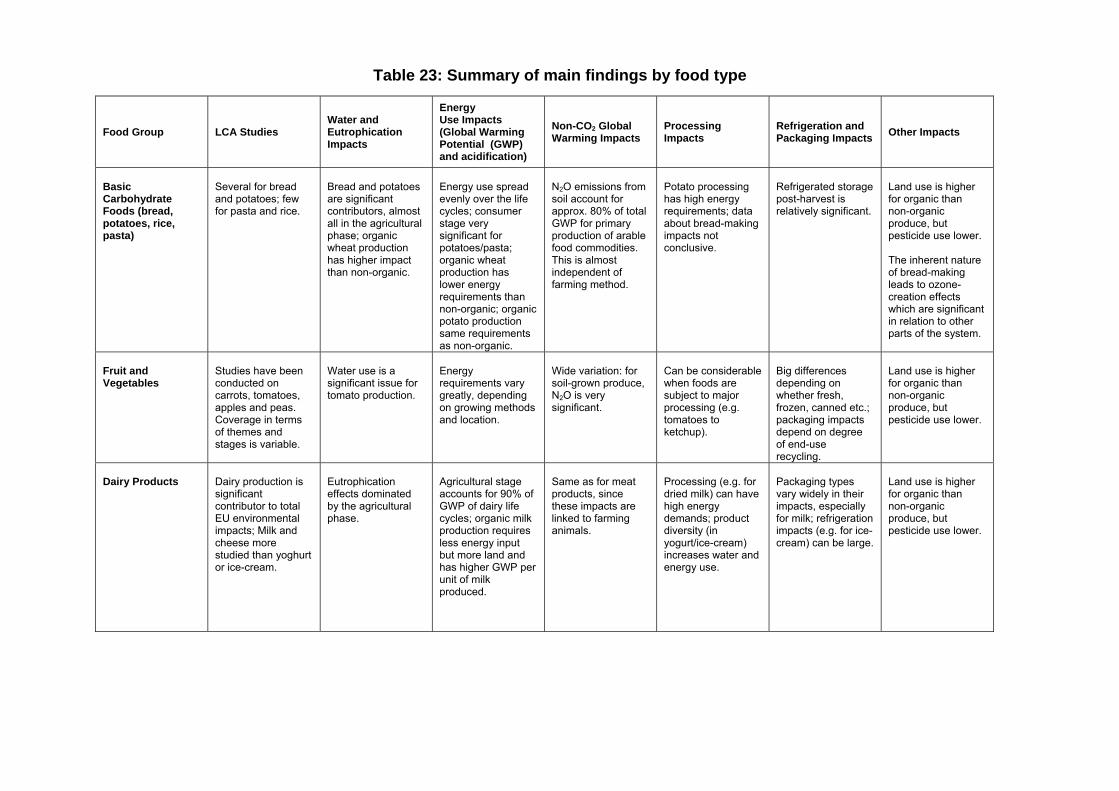
Table 23: Summary of main findings by food type
Food Group LCA Studies Water and Eutrophication Impacts
Energy Use Impacts (Global Warming Potential (GWP) and acidification)
Non-CO2 Global Warming Impacts
Processing Impacts
Refrigeration and Packaging Impacts Other Impacts
Basic Carbohydrate Foods (bread, potatoes, rice, pasta)
Several for bread and potatoes; few for pasta and rice.
Bread and potatoes are significant contributors, almost all in the agricultural phase; organic wheat production has higher impact than non-organic.
Energy use spread evenly over the life cycles; consumer stage very significant for potatoes/pasta; organic wheat production has lower energy requirements than non-organic; organic potato production same requirements as non-organic.
N2O emissions from soil account for approx. 80% of total GWP for primary production of arable food commodities. This is almost independent of farming method.
Potato processing has high energy requirements; data about bread-making impacts not conclusive.
Refrigerated storage post-harvest is relatively significant.
Land use is higher for organic than non-organic produce, but pesticide use lower. The inherent nature of bread-making leads to ozone-creation effects which are significant in relation to other parts of the system.
Fruit and Vegetables
Studies have been conducted on carrots, tomatoes, apples and peas. Coverage in terms of themes and stages is variable.
Water use is a significant issue for tomato production.
Energy requirements vary greatly, depending on growing methods and location.
Wide variation: for soil-grown produce, N2O is very significant.
Can be considerable when foods are subject to major processing (e.g. tomatoes to ketchup).
Big differences depending on whether fresh, frozen, canned etc.; packaging impacts depend on degree of end-use recycling.
Land use is higher for organic than non-organic produce, but pesticide use lower.
Dairy Products
Dairy production is significant contributor to total EU environmental impacts; Milk and cheese more studied than yoghurt or ice-cream.
Eutrophication effects dominated by the agricultural phase.
Agricultural stage accounts for 90% of GWP of dairy life cycles; organic milk production requires less energy input but more land and has higher GWP per unit of milk produced.
Same as for meat products, since these impacts are linked to farming animals.
Processing (e.g. for dried milk) can have high energy demands; product diversity (in yogurt/ice-cream) increases water and energy use.
Packaging types vary widely in their impacts, especially for milk; refrigeration impacts (e.g. for ice-cream) can be large.
Land use is higher for organic than non-organic produce, but pesticide use lower.
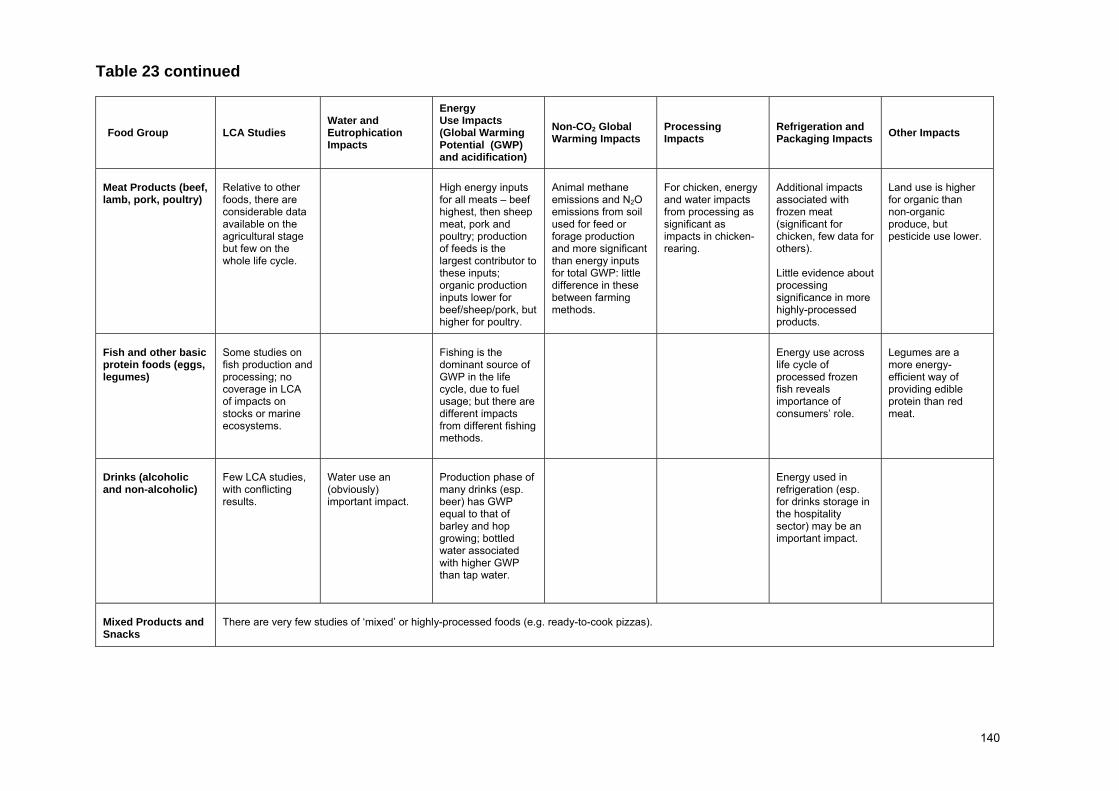
140
Table 23 continued
Food Group LCA Studies Water and Eutrophication Impacts
Energy Use Impacts (Global Warming Potential (GWP) and acidification)
Non-CO2 Global Warming Impacts
Processing Impacts
Refrigeration and Packaging Impacts Other Impacts
Meat Products (beef, lamb, pork, poultry)
Relative to other foods, there are considerable data available on the agricultural stage but few on the whole life cycle.
High energy inputs for all meats – beef highest, then sheep meat, pork and poultry; production of feeds is the largest contributor to these inputs; organic production inputs lower for beef/sheep/pork, but higher for poultry.
Animal methane emissions and N2O emissions from soil used for feed or forage production and more significant than energy inputs for total GWP: little difference in these between farming methods.
For chicken, energy and water impacts from processing as significant as impacts in chicken-rearing.
Additional impacts associated with frozen meat (significant for chicken, few data for others). Little evidence about processing significance in more highly-processed products.
Land use is higher for organic than non-organic produce, but pesticide use lower.
Fish and other basic protein foods (eggs, legumes)
Some studies on fish production and processing; no coverage in LCA of impacts on stocks or marine ecosystems.
Fishing is the dominant source of GWP in the life cycle, due to fuel usage; but there are different impacts from different fishing methods.
Energy use across life cycle of processed frozen fish reveals importance of consumers’ role.
Legumes are a more energy-efficient way of providing edible protein than red meat.
Drinks (alcoholic and non-alcoholic)
Few LCA studies, with conflicting results.
Water use an (obviously) important impact.
Production phase of many drinks (esp. beer) has GWP equal to that of barley and hop growing; bottled water associated with higher GWP than tap water.
Energy used in refrigeration (esp. for drinks storage in the hospitality sector) may be an important impact.
Mixed Products and Snacks
There are very few studies of ‘mixed’ or highly-processed foods (e.g. ready-to-cook pizzas).

1. ‘Organic’ vs. ‘Conventionally-grown’ foods: There is no doubt that, for many foods, the environmental impacts of organic agriculture are lower than for the equivalent conventionally-grown food. This would be especially the case if those impacts not well handled by LCA methods (e.g. biodiversity or landscape aesthetics) were to be taken into consideration. However, it is not true for all foods and appears seldom to be true for all classes of environmental impact. There is certainly insufficient evidence available to state that organic agriculture overall would have less of an environmental impact than conventional agriculture. In particular, from the data we have identified, organic agriculture poses its own environmental problems in the production of some foods, either in terms of nutrient release to water or in terms of climate-change burdens
In addition, the land-use requirements of organic agricultural techniques, were they to be widely applied, can be seen as a major environmental issue. If nutrient release, climate change impacts and land-use are problem impacts for organic foods, then simply shifting to an organic trolley would magnify these problems, even if it reduces conventional impacts of pesticides and packaging. Thus, there is no clear-cut answer to the question: which ‘trolley’ has a lower environmental impact - the organic one or the conventional one? What we might rather say is that, for organic agriculture to offer an approach to food production that is better than conventional agriculture, yields need to rise and methods need to be developed (or if they exist, adopted) that reduce releases of nitrogen compounds, particularly to the water environment.
2. ‘Local’ trolley vs. ‘globally-sourced’ trolley: Our conclusions on this comparison have to be as cautious as with the organic vs. conventional one. Evidence for a lower environmental impact of local preference in food supply and consumption when all food types are taken into consideration is weak. While sourcing food from a neighbouring farm in individual cases might reduce some transport-related impacts, at the level of an entire population shopping for food the environmental impact of bulk haulage, including in international trade whether within Europe or in sea-borne trade, is not decisive. Indeed, for some foods, the ‘food mile’ issue can be construed as being more to do with what the final consumer does in collecting the food by car from the supermarket or farmers’ market as it is to do with its transport to the retail location in the first place. Since there is a wide variation in the agricultural impacts of food grown in different parts of the world (for example, as in the case with tomatoes, in the amounts of water
141
consumed), global sourcing could actually be a better environmental option for particular foods.
So, whilst there are no grounds from the available data to argue ‘local good – global bad’ as a general statement, this could be true for certain foods, as could the reverse. This prompts us to suggest that supermarkets and food processors could make environmental improvements by being more discriminating about the locations from which they source their goods by taking account of some environmental impacts in their purchasing systems.
3. ‘Fresh’ vs. ‘cold’ vs. ‘preserved’ food trolleys: The energy consumption involved in refrigeration, whether for stationary cold storage or long-distance haulage, means that on a simple comparison that takes no account of different wastage levels that might arise in the two cases, a “cold” trolley will have higher environmental impacts than a “fresh” one (and it is important here to distinguish “fresh” from “chilled”).. The need to preserve food, coupled with uncertainty about wastage, means that such a simple comparison of the environmental impacts of ‘fresh’ vs ‘cold’ (i.e. frozen or chilled) vs ‘preserved’ (i.e. canned, bottled or dried) food has very little value in policy terms. So, for similar reasons to those rehearsed for the organic/conventional and local/global trolleys, it is not possible to make any general statements as to which of these is “better”. That said, the energy demand of refrigeration leads us to suspect that any growth in food transport (and it is strongly projected) is highly likely to increase impacts linked to fossil-fuel use, while the growth of refrigeration as the “default” method of food preservation and storage throughout the production-consumption system is similarly likely to lead to higher impacts from electricity generation
4. Significance of Transport in the life cycle: It is of course obvious that the environmental impacts of transport, involved in every stage of the lifecycle of every food (even ‘local’ ones), are significant. By ‘every stage’, we need to include the final one – namely the movement of food from the final retailing outlet to consumers’ homes. Whilst the data are not at all clear-cut, what there are suggests that – viewed from a “single-product” perspective – the environmental
142
impacts of car-based shopping (and subsequent home cooking for some foods) are greater than those of transport within the distribution system itself56.
Whilst there is no doubt that the environmental impacts of aviation are important for air-freighted products, such products are currently a very small proportion of food consumed. Currently, the contents of the ‘average’ trolley in the ‘average’ supermarket are more mundane than some might think; for example, data from one large supermarket chain shows that in its ‘top 150’ sold items, there are no air-freighted vegetables listed. However, with the volume of air freighting of food items set to grow fast, aviation-related transport emissions are likely to become more significant in the future. It is prudent to question whether this is a trend that should be encouraged.
5. Significance of Packaging: The environmental impact of packaging is certainly high for some foods (such as bottled drinks). Clearly, the higher the weight of packaging as a proportion of the weight of the packed product, the higher the relative significance of the packaging in the overall environmental impacts associated with that food. However, quantifying the overall environmental impact of packaging involves assumptions about local practice regarding packaging waste (discard rates by consumers, predominance of different recovery or recycling mechanisms, etc.) so evidence of clear relevance to the UK is either sparse or inconclusive (e.g. for chicken). This context sensitivity, along with the different functionality delivered by different forms of food packaging (for example in terms of different shelf lives) can explain the divergent conclusions of LCA and similar studies concerned with packaging. Local practice also bears heavily on attempts to quantify the environmental benefits (if any) associated with reusable packaging (returnable glass bottles), since these are strongly dependent on the number of trips round the system that an average container makes. In a country, such as the UK, with almost no reuse packaging systems in place, this is difficult to assess.
Further work to be done
It should be clear from the results of the project that, whilst there is some evidence on the environmental impacts of the production, distribution and 56 But note the comments on p16 and in Annex 3 about the difficulties of modelling impacts at the consumer level.
143
consumption of foods that can begin to inform policy, there are many gaps. The gaps are in the range of foods for which data have been collected, the parts of the life cycles that have been examined, the types of environmental impacts that have been measured and the countries on which the analysis has focused.
We suggest therefore that some programme of work to ‘fill the gaps’ is needed. What work should be done depends on what foods and what environmental issues are considered important. Consultation with food lifecycle stakeholders (an extensive number of organisations and interest groups) would be essential before deciding on that programme of work. We suggest here some possible projects that might help to plug the gaps in the evidence as it exists:
1) Further LCA studies of finished food products: To realise value from these, there is a strong need for central co-ordination so that different studies adopt compatible methodological approaches (for instance in terms of system boundaries and the approach taken to quantifying the environmental burdens of consumer activities), and so that studies are designed to answer clear questions. It would certainly not be cost-effective to conduct an LCA study on every food product. As examples, LCA studies of some relatively simple but heavily-processed foods could shed further light on the relative importance of certain processing steps; fresh vs. frozen comparisons for single foods could be useful if the functional unit were chosen to represent supply of the food in question for an appropriate period (perhaps a whole year), so that wastage and preservation were considered within the study. Incorporation of water and land-use impacts would also be well worthwhile in any LCAs commissioned, although a pragmatic approach to these might require some deviation from a conventional LCA approach.
2) Comparative studies of the environmental impacts of food production in different countries: These would inform the debate about whether some countries or regions have an ‘ecological comparative advantage’ in terms of the production of certain foods, and shed light on the environmental trade-offs that result from shifting production in a globalised food industry. Such work will also be necessary if the environmental impact of many processed foods consumed in the UK is to be studied using LCA techniques.
144

3) A UK-oriented version of the “Swedish meatballs study: If such a study were to be undertaken, the inclusion of a meal delivered through the food service chain would be worthwhile. It seems, however, that a considerable amount of primary data collection would be needed to deliver credible results from a comparative study of, say, lasagne prepared from scratch at home, lasagne made from pasta and bottled sauces, lasagne as a ready meal and lasagne as a pub meal. To avoid vague conclusions, the specification of such a study would need to identify particular issues and questions for coverage, such as the importance of different practices in home preparation (different equipment, different storage times, etc.) or the effect on outcomes of different wastage levels.
4) The study of the environmental impacts of the foodservice sector: While food service was excluded from our remit, we have nevertheless noticed that the environmental impact of this part of this rapidly growing industry, appears to be little studied. Since the limited information that does appear to exist suggests that some aspects of food service (for example refrigeration and the continuous operation of cooking equipment in take-away outlets) may be associated with significant environmental impacts, it merits further investigation.
5) Studies of the actual behaviour of consumers with respect to different food products: We have in mind studies of such things as the wastage issue across the cycle or the attention paid to food packet instructions and their consequences. It would ultimately be desirable to link such work to that on the environmental impacts of products to understand the environmental consequences of social trends in food consumption. Such an exercise has recently been attempted by researchers in Germany, although the brief report of its results seen recently is rather inconclusive. (Shultz and Stieβ 2006)
6) A review of data contained in IPPC permit applications from food sector installations: This could be undertaken to establish a current picture of the range of environmental performance in different parts of the UK food industry.
145

7) Further study of the environmental impacts of different food logistics systems: Conventional single-product LCA may not be the best method for further exploration of this area: the need for extensive allocation of the total burdens of multi-purpose journeys makes the extension of the conclusions of such studies to policy-making highly problematic. Getting the scale of modelling exercises right would be important to obtaining useable results from further work. On the one hand, it is necessary to work at a scale greater than that of a single consumer sourcing a small number of products for a small part of the year. If that consumer can obtain them from a farm 2km away from his/her house, it may be obvious that the burden of local food transport will be lower for those products and for that consumer at that time than the burden of delivering them through a global food transport system. However this observation tells us nothing about any change in the continuing environmental burden of delivering food to that part of the population who have no farm selling its own produce within 20km of their homes. On the other hand, the environmental impact of product transport varies strongly with the quantity carried in each vehicle (an articulated truck is said to use 70% as much fuel running empty or carrying 1 tonne as it does running full with a payload of perhaps 25 tonnes) as well as the types of vehicle used, the fuel used and – notably for refrigerated goods – the time duration of journeys; so, any comparative assessment needs to incorporate detailed information about these aspects as well as about the distances travelled at each stage of the chain.
8) Future trends analysed through scenario studies: Given the complexity and diversity of the food industry, any work programme needs to take into account the highly inter-connected nature of these systems. Broader-based scenario work, based on the already existing DEFRA scenarios developed during the Horizon Scanning projects could be used to frame food-specific work. Elaboration of these scenarios with a specific focus on the different trends in demography, economic structure and thus food choices they might imply could lead to an evaluation of their different impacts on the environment, the economy and society.
146

Annex 1: Trolley selection
Our approach to selecting a “trolley” of products as a sample on which to base this review of evidence has been pragmatic. The approach had two stages. The first was a ‘coarse’ selection, to produce a “long list” of products from the thousands of items available in UK supermarkets. The second stage adopted a more structured approach to produce a list of one hundred or so commonly consumed items encompassing a variety of foods, processing types and production locations.
One issue that arises is how to describe a “food product” for the purposes of exploring the environmental impacts of UK food consumption. The environmental impacts associated with the production and consumption of a food product will be linked to its composition, the origin of ingredients and the method by which they were produced. Transportation modes used throughout the system contribute to its impacts, while the form of packaging and the pack size are also relevant. Therefore a relatively detailed description of food product is needed if the description is to allow the environmental impacts to be identified. Some of the descriptions used in the Food and Expenditure Survey, such as “meat pies” appear not to be sufficiently specific – the environmental “profile” of a meat pie made with mutton might be very different from that of one made with pork or beef.
For the preliminary selection, food products were identified by the designation given by retailers – the name of the “Stock Keeping Unit” (SKU). The selection drew only on goods available from supermarkets and was confined to items that can be purchased anywhere in the UK (so there are no regionally specific foods in the sample (e.g. Welsh lamb)). However, the commercial branding incorporated into the nomenclature of SKUs is of little relevance to this study (not least because the available data do not relate to branded products), so in the more detailed selection of products for the trolley more generic names have been used. Pack size and packaging type specifications have been retained in the second stage of selection. Coverage of relevant issues was ensured by
147
associating products from a large retailer’s online offering with particular consumer types (or stakeholders) at whom they might be considered to be “targeted” (such as middle income families, vegetarians, and so on). The National Statistics data set “UK Purchased quantities of household food & drink 1974 to 2003-04” was used in parallel with lists of currently-popular items published by “The Grocer” magazine to ensure that items included were those more commonly purchased. The stakeholder-based approach is limited to some degree in that some types of consumer (particularly but not only those from non-UK ethnic and non-Christian backgrounds) probably purchase a significantly lower proportion of their total food requirements from supermarkets than do others: however, since the remit of this project is to focus on food likely to be purchased in supermarkets, this limitation is not expected to influence its outcomes.
The second stage of the product selection process involved taking those items identified in the first stage and associating them with a list of 150 top-selling items provided by one large retailer: those not on both lists were excluded from further consideration, except for certain items, like lentils, which offer an alternative source of a particular nutrient with potentially very different environmental significance. Items were then assigned non-brand names that appear to correlate with the naming of products referred to in literature about environmental impacts: this gave a list of 100 or so products. The products selected are included in Table A 1 (p6) at the end of this Annex. Those products shown in bold type are those for which some (not necessarily complete) data relating to environmental impacts are believed to be available on the basis of research carried out so far. These products have been classified according to a number of characteristics relevant to achieving a mix representative of current consumption and environmental issues that are the subject of debate and/or having the potential to change as consumption changes with time. The characteristics are listed below.
• “Pack size” was retained to give some scale to the analysis. “Packaging type” is included as this has a bearing on the environmental impact of food items. (Note that this refers to consumer packaging rather than transit packaging or display packaging.)
148

• Food items are characterised in a 2-tier process, firstly by “food class”, subsequently sub-divided in terms of “Food type”. Both of these mix together different ways of classifying the selected foods. “Food Class” defines foods in terms drawn from a nutritional classification (for example, carbohydrate, fat and protein) for foods that fall into one of these categories in a straightforward way. For some of the selected foods that have a number of constituent elements, such as vegetable soup, the nutritional type is not obvious: for convenience, we have used labels such as ‘mixed’ (for milk, which contains minerals, fat and protein) and ‘snacks’ for items like biscuits or sweets for which the nutritional type is not obviously relevant to the decision to buy. An alternative approach, perhaps more scientifically rigorous, would be to ensure consistency and to re-label all foods in a nutritionally consistent manner. However, we suggest that the value of such an exercise would be limited since firstly, the study is into the environmental sustainability of foods and not simply their nutritional value and secondly, a nutritional perspective would inhibit a more intuitive classification of foods that has a wider resonance.
• “Food type” is a sub-classification of foods which uses distinctions of practical relevance to this project and/or to consumers to provide finer detail. These categories reflect, to some extent, the way in which food products would be grouped on a supermarket shelves.
• “Complexity” is an indicator driven principally by the number of stages that exist between the point of production and the consumer: packed produce is, for example, one “degree” more complex than its loose equivalent. There is clearly scope for refinement of this classification to take into account the relative complexity of individual stages of the food chain; for example, it would be possible to differentiate between a form of primary production that involved limited inputs and little control of growing conditions and one that involved highly controlled growing conditions. Given the nature and timescale of this project, this avenue has not been pursued – although it may be of relevance to future work, for example on exemplar foods for closer study.
• “Convenience” refers to whether the product is designed as one that is convenient for the consumer in the sense that in the assembly or
149
processing of the product activities that would formerly have been undertaken within the home are now undertaken earlier in the supply chain. For example, frozen chips are recorded as a convenient food since the selection, peeling and chopping of the potatoes has already been undertaken. (Allocation of a food item to the category of “convenience” is clearly somewhat judgmental, since an apple – which can be eaten without any preparation by the consumer - might be considered a convenience food by some, but has not been included in this case).
• “Relative price” is a means of ensuring that the sample includes more and less expensive versions of the same item. Products receive a low, medium or high score based on their cost relative to comparable goods.
One of the goals of this study has been to identify evidence that can help policy-makers understand the environmental consequences of changing patterns of food consumption. Therefore, rather than have a set number of organic or low-fat items in the trolley to accurately reflect the current purchasing pattern, alternatives have been identified which might be taken up by consumers to a greater or lesser extent as preferences shift (the influences of fashion and income on food consumption, and the implications of this for this kind of sampling exercise are discussed below).
Drawing on these alternatives would allow different “trolleys” to be assembled to reflect shifts from this pattern – the “healthy” trolley; the “organic” trolley and so on. Whether such trolleys were developed in the future would depend on the analytical perspective sought: they are not proposed as part of any rolling measurement of the environmental impact of “average” shopping, but they could be very useful if one was seeking an understanding of the environmental implications of trends in food “fashion”. Calculating an overall price for each alternative trolley would also give some indication of the cost implications of these trends for consumers – one aspect of economic sustainability. While potentially useful, especially in the light of the relatively limited set of foods for which detailed data concerning environmental impact exist, this would represent a relatively unsophisticated approach to analysing the potential for lifestyle change to affect the environment through changes in food consumption and production patterns.
150
Looking at food consumption information in more detail shows how lifestyle and food choices are interlinked in ways that are much more complex than the price-based differentiation of basic and luxury ranges (something that marketeers know well, and which they utilise).
Consider the variation in consumption of just one item: chocolate. We find, from the National Diet and Nutrition Survey 2002 (Henderson, Gregory and Swan 2002), that weekly consumption levels of chocolate reduce significantly with age, are much higher among men, and are much higher among those receiving certain State benefits. So the diet of young men (171g chocolate per 7 days, 108g sugar per 7 days), or young men on benefits (159g chocolate per seven days, 206g sugar per 7 days) contains much greater quantities of chocolate and sugar than do the diets of other groups (cf. older women 94g chocolate per 7 days, or older women not on benefits 104g per 7 days). This difference between the consumption patterns of young and old, men and women, poor and affluent appears unlikely to be a reflection of price alone, but more likely a reflection of different tastes, consumption practices, and lifestyles in the different groups. If the potential for lifestyle change (whether as a result of changing economic circumstance, ageing or choice) to influence the environmental impacts of food purchases in the UK is a field of interest for future work, further analysis of this sort could provide a valuable starting point.
151

Table A 1: Food items and classification – preliminary selection
FOOD ITEMS PACK SIZE &
TYPE CLASSIFICATION ALTERNATIVES
Approx. pack size
Pack type (best estimate)
Food class Food type Complexity 1 = most basic, 5 = most complex
Temperature Convenience(Y/N)
Relative price (Low, Medium, High)
Organic variant available? (Y, N)
Healthy Variant is: (Low-Fat, Low-Salt, Low-Sugar Not Applicable)
Ale 500ml Glass bottle Alcoholic drink Beer 3 Ambient N M Y NAApple, NZ loose Fruit Native 1 Ambient N L Y NAApple, UK 1kg PE bag Fruit Native 2 Ambient N L Y NAAsparagus, imported 400g Vegetable Exotic 2 Ambient N H Avocado, imported 2 pack Vegetable Exotic 2 Ambient N H Y NABaby new potatoes 500g Vegetable Native 2 Ambient N H Baked beans 400g can Protein Pulses 3 Ambient Y L Banana loose Fruit Med/tropical 2 Ambient N M Y NABasmati rice 1kg Plastic film Carbohydrate Rice 1 Ambient N M NA
Beef steak, packed 500g Plastic, modified atmosphere
Protein Meat 2 Chilled N H Y
Biscuit, chocolate coated Snacks Cakes,
biscuits 4 Ambient Y M
Biscuit, uncoated 300g Snacks Cakes, biscuits 3 Ambient Y M
Broccoli loose Vegetable Native 1 Ambient N M Y NABulgur wheat 500g Plastic film Carbohydrate Cereal 1 Ambient N M NA Butter 250g Fat Spread 2 Ambient N M Y NACabbage unit loose Vegetable Native 1 Ambient N L Carrots loose Vegetable Native Ambient N L
Cheese-filled pasta Plastic, modified atmosphere
Carbohydrate Pasta 4 Ambient Y H
Chicken breast, skinless, boned 4 pack
Plastic, modified atmosphere
Protein Poultry 3 Chilled Y M Y NA
152
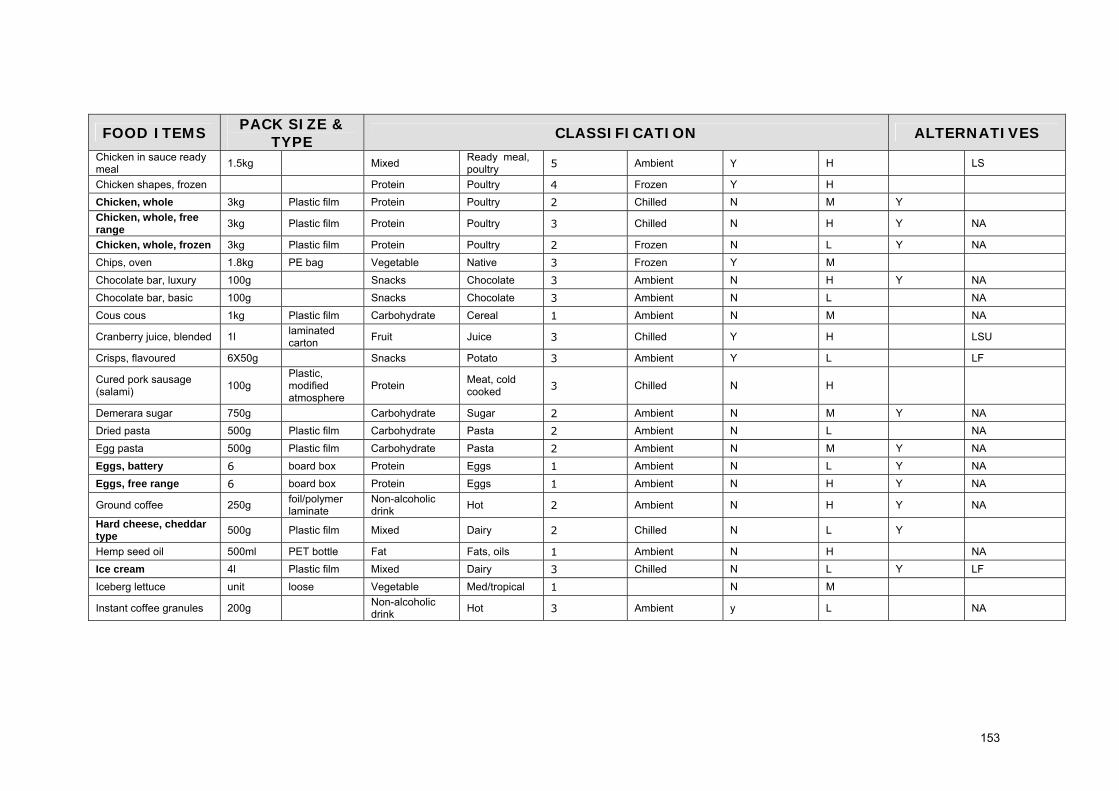
FOOD ITEMS PACK SIZE &
TYPE CLASSIFICATION ALTERNATIVES
Chicken in sauce ready meal 1.5kg Mixed Ready meal,
poultry 5 Ambient Y H LS
Chicken shapes, frozen Protein Poultry 4 Frozen Y H Chicken, whole 3kg Plastic film Protein Poultry 2 Chilled N M YChicken, whole, free range 3kg Plastic film Protein Poultry 3 Chilled N H Y NA
Chicken, whole, frozen 3kg Plastic film Protein Poultry 2 Frozen N L Y NAChips, oven 1.8kg PE bag Vegetable Native 3 Frozen Y M Chocolate bar, luxury 100g Snacks Chocolate 3 Ambient N H Y NAChocolate bar, basic 100g Snacks Chocolate 3 Ambient N L NA Cous cous 1kg Plastic film Carbohydrate Cereal 1 Ambient N M NA
Cranberry juice, blended 1l laminated carton Fruit Juice 3 Chilled Y H LSU
Crisps, flavoured 6X50g Snacks Potato 3 Ambient Y L LF
Cured pork sausage (salami) 100g
Plastic, modified atmosphere
Protein Meat, cold cooked 3 Chilled N H
Demerara sugar 750g Carbohydrate Sugar 2 Ambient N M Y NADried pasta 500g Plastic film Carbohydrate Pasta 2 Ambient N L NA Egg pasta 500g Plastic film Carbohydrate Pasta 2 Ambient N M Y NAEggs, battery 6 board box Protein Eggs 1 Ambient N L Y NAEggs, free range 6 board box Protein Eggs 1 Ambient N H Y NA
Ground coffee 250g foil/polymer laminate
Non-alcoholic drink Hot 2 Ambient N H Y NA
Hard cheese, cheddar type 500g Plastic film Mixed Dairy 2 Chilled N L Y
Hemp seed oil 500ml PET bottle Fat Fats, oils 1 Ambient N H NA Ice cream 4l Plastic film Mixed Dairy 3 Chilled N L Y LFIceberg lettuce unit loose Vegetable Med/tropical 1 N M
Instant coffee granules 200g Non-alcoholic drink Hot 3 Ambient y L NA
153
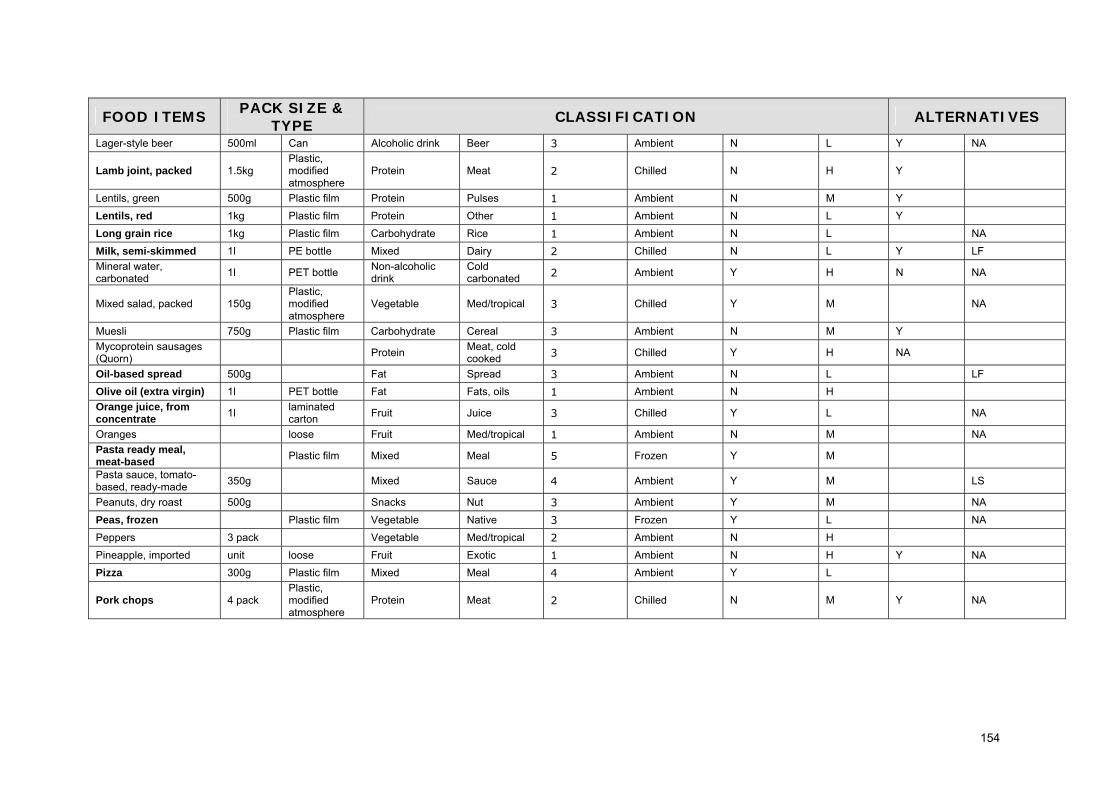
FOOD ITEMS PACK SIZE &
TYPE CLASSIFICATION ALTERNATIVES
Lager-style beer 500ml Can Alcoholic drink Beer 3 Ambient N L Y NA
Lamb joint, packed 1.5kg Plastic, modified atmosphere
Protein Meat 2 Chilled N H Y
Lentils, green 500g Plastic film Protein Pulses 1 Ambient N M YLentils, red 1kg Plastic film Protein Other 1 Ambient N L YLong grain rice 1kg Plastic film Carbohydrate Rice 1 Ambient N L NA Milk, semi-skimmed 1l PE bottle Mixed Dairy 2 Chilled N L Y LFMineral water, carbonated 1l PET bottle Non-alcoholic
drink Cold carbonated 2 Ambient Y H N NA
Mixed salad, packed 150g Plastic, modified atmosphere
Vegetable Med/tropical 3 Chilled Y M NA
Muesli 750g Plastic film Carbohydrate Cereal 3 Ambient N M Y Mycoprotein sausages (Quorn) Protein Meat, cold
cooked 3 Chilled Y H NA
Oil-based spread 500g Fat Spread 3 Ambient N L LF Olive oil (extra virgin) 1l PET bottle Fat Fats, oils 1 Ambient N H Orange juice, from concentrate 1l laminated
carton Fruit Juice 3 Chilled Y L NA
Oranges loose Fruit Med/tropical 1 Ambient N M NA Pasta ready meal, meat-based Plastic film Mixed Meal 5 Frozen Y M
Pasta sauce, tomato-based, ready-made 350g Mixed Sauce 4 Ambient Y M LS
Peanuts, dry roast 500g Snacks Nut 3 Ambient Y M NA Peas, frozen Plastic film Vegetable Native 3 Frozen Y L NA Peppers 3 pack Vegetable Med/tropical 2 Ambient N H Pineapple, imported unit loose Fruit Exotic 1 Ambient N H Y NAPizza 300g Plastic film Mixed Meal 4 Ambient Y L
Pork chops 4 pack Plastic, modified atmosphere
Protein Meat 2 Chilled N M Y NA
154
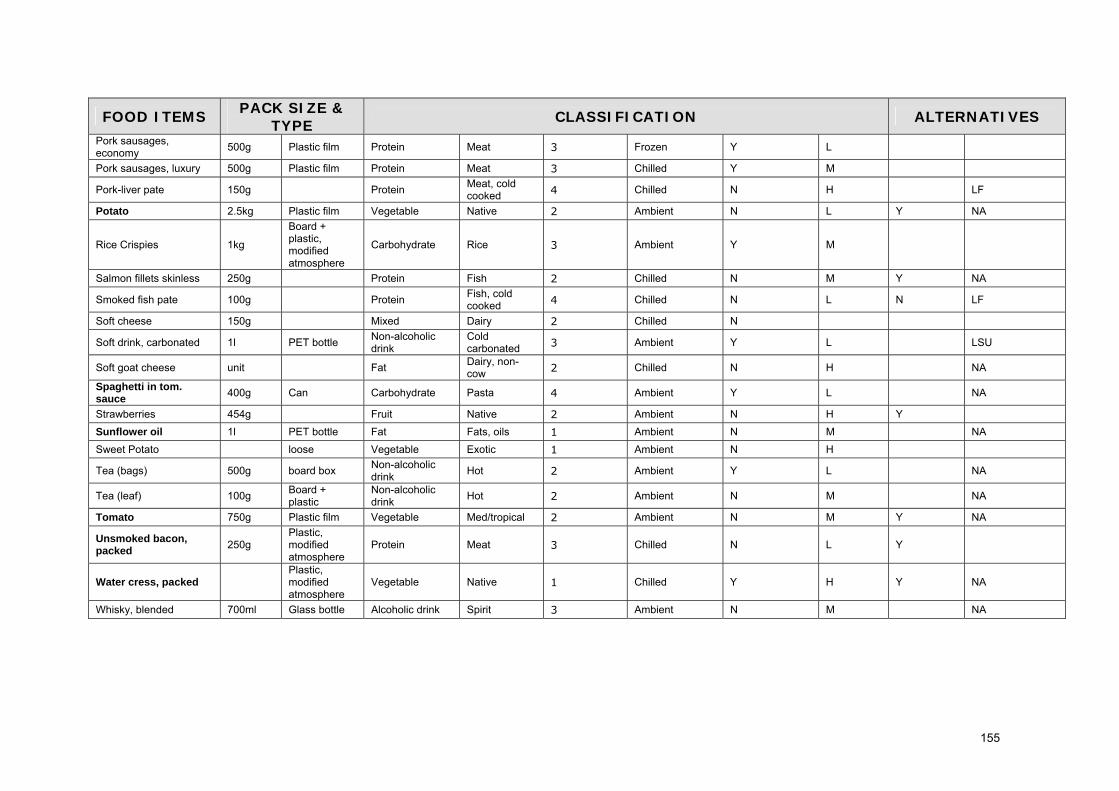
FOOD ITEMS PACK SIZE &
TYPE CLASSIFICATION ALTERNATIVES
Pork sausages, economy 500g Plastic film Protein Meat 3 Frozen Y L
Pork sausages, luxury 500g Plastic film Protein Meat 3 Chilled Y M
Pork-liver pate 150g Protein Meat, cold cooked 4 Chilled N H LF
Potato 2.5kg Plastic film Vegetable Native 2 Ambient N L Y NA
Rice Crispies 1kg
Board + plastic, modified atmosphere
Carbohydrate Rice 3 Ambient Y M
Salmon fillets skinless 250g Protein Fish 2 Chilled N M Y NA
Smoked fish pate 100g Protein Fish, cold cooked 4 Chilled N L N LF
Soft cheese 150g Mixed Dairy 2 Chilled N
Soft drink, carbonated 1l PET bottle Non-alcoholic drink
Cold carbonated 3 Ambient Y L LSU
Soft goat cheese unit Fat Dairy, non-cow 2 Chilled N H NA
Spaghetti in tom. sauce 400g Can Carbohydrate Pasta 4 Ambient Y L NA
Strawberries 454g Fruit Native 2 Ambient N H YSunflower oil 1l PET bottle Fat Fats, oils 1 Ambient N M NA Sweet Potato loose Vegetable Exotic 1 Ambient N H
Tea (bags) 500g board box Non-alcoholic drink Hot 2 Ambient Y L NA
Tea (leaf) 100g Board + plastic
Non-alcoholic drink Hot 2 Ambient N M NA
Tomato 750g Plastic film Vegetable Med/tropical 2 Ambient N M Y NA
Unsmoked bacon, packed 250g
Plastic, modified atmosphere
Protein Meat 3 Chilled N L Y
Water cress, packed Plastic, modified atmosphere
Vegetable Native 1 Chilled Y H Y NA
Whisky, blended 700ml Glass bottle Alcoholic drink Spirit 3 Ambient N M NA
155
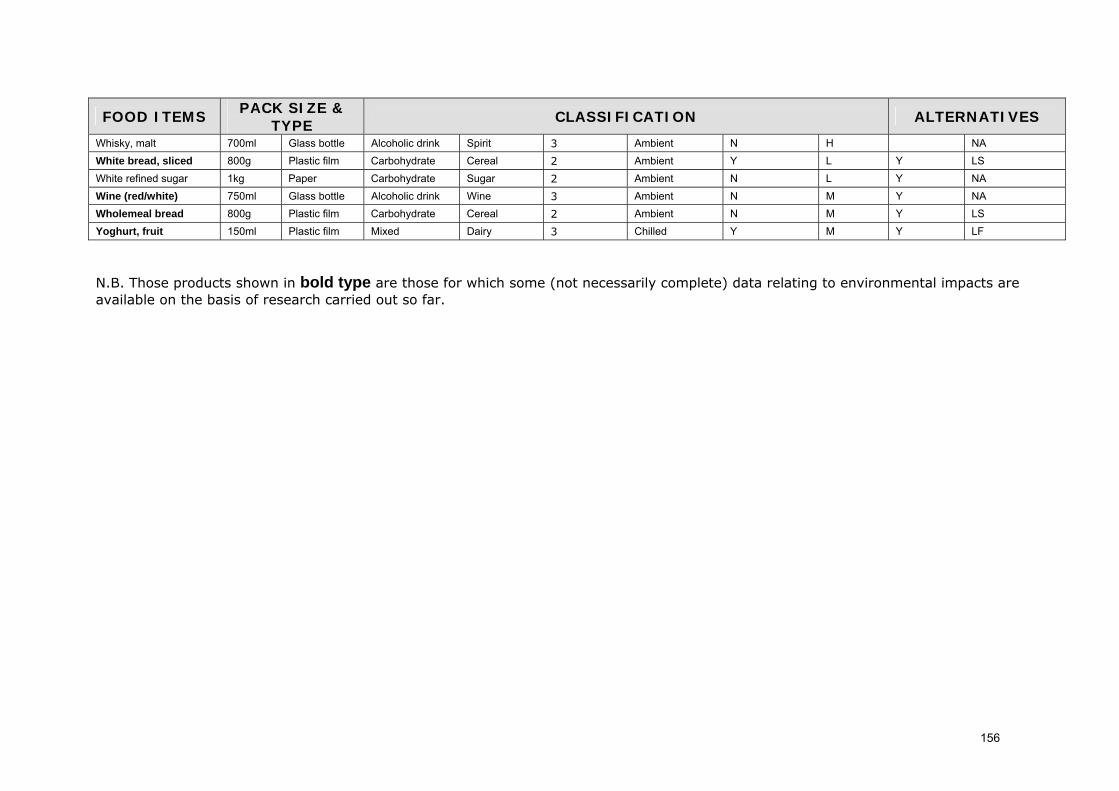
FOOD ITEMS PACK SIZE &
TYPE CLASSIFICATION ALTERNATIVES
Whisky, malt 700ml Glass bottle Alcoholic drink Spirit 3 Ambient N H NA White bread, sliced 800g Plastic film Carbohydrate Cereal 2 Ambient Y L Y LSWhite refined sugar 1kg Paper Carbohydrate Sugar 2 Ambient N L Y NAWine (red/white) 750ml Glass bottle Alcoholic drink Wine 3 Ambient N M Y NAWholemeal bread 800g Plastic film Carbohydrate Cereal 2 Ambient N M Y LSYoghurt, fruit 150ml Plastic film Mixed Dairy 3 Chilled Y M Y LF
N.B. Those products shown in bold type are those for which some (not necessarily complete) data relating to environmental impacts are available on the basis of research carried out so far.
156
Annex 2: Life Cycle Assessment and food
The first part of this Annex introduces the LCA method and describes the three main elements of LCA studies. The second part discusses the complexity of the food product system and considers how certain properties of food systems affect the application of LCA to food products.
Introduction to LCA
LCA studies the environmental impacts arising from the production, use and disposal of products. LCA provides a mechanism for investigating and evaluating such impacts all the way from the extraction of basic materials from nature, through material and component production, assembly, distribution, product use and end-of-life management (which may be disposal, reuse, recycling or recovery). LCA considers impacts on all environmental media – air, water and land. This “holistic, system-wide” view is one of the principal benefits of LCA. The results of LCA studies are used to inform environmental purchasing decisions, product design, process selection and policy making.
The LCA process has become standardised. The ISO 14040 series contains the main standards applicable to LCA. These standards provide ground rules for conducting LCAs and define the terminology to be used. ISO 14040 (1997) defines Life Cycle Assessment as:
“A technique for assessing the environmental aspects and potential impacts associated with a product, by
- compiling an inventory of relevant inputs and outputs of a product system
- evaluating the potential environmental impacts associated with those inputs and outputs
- interpreting the results of the inventory analysis and impact assessment phases in relation to the objectives of the study.
157
LCA studies the environmental aspects and potential impacts throughout a product’s life (i.e. cradle-to-grave) from raw material acquisition through production, use and disposal. The general categories of environmental impacts needing consideration include resource use, human health and ecological consequences.”
The “product system” is the chain of activities linking raw material extraction and/or production with processing, use and disposal. LCA considers the environmental impact of such systems in terms of the environmental consequences of flows (principally flows of substances) between such systems and the environment.
Elements of LCA
The ISO14040 definition also describes three of the four main elements of an LCA study, which are:
• Goal definition and scoping
• Life Cycle Inventory development (compiling the inventory of relevant inputs and outputs)
• Life Cycle Impact Assessment (evaluating the potential impacts associated with the inputs and outputs identified in the life cycle inventory).
• Improvement analysis (interpreting the results in relation to the objectives)
Goal definition and scoping involves not only setting overall objectives for the LCA, but also describing the system(s) that is (are) to be studied and establishing the “functional unit” that is the basis for the assessment.
The idea of a functional unit is central to LCA, which is often used to compare two or more ways of providing a certain functionality, or utility, to an end-user. The functional unit provides a measure of this utility. Thus for an LCA of decorative wall coverings, the functional unit might be “the quantity of material
158
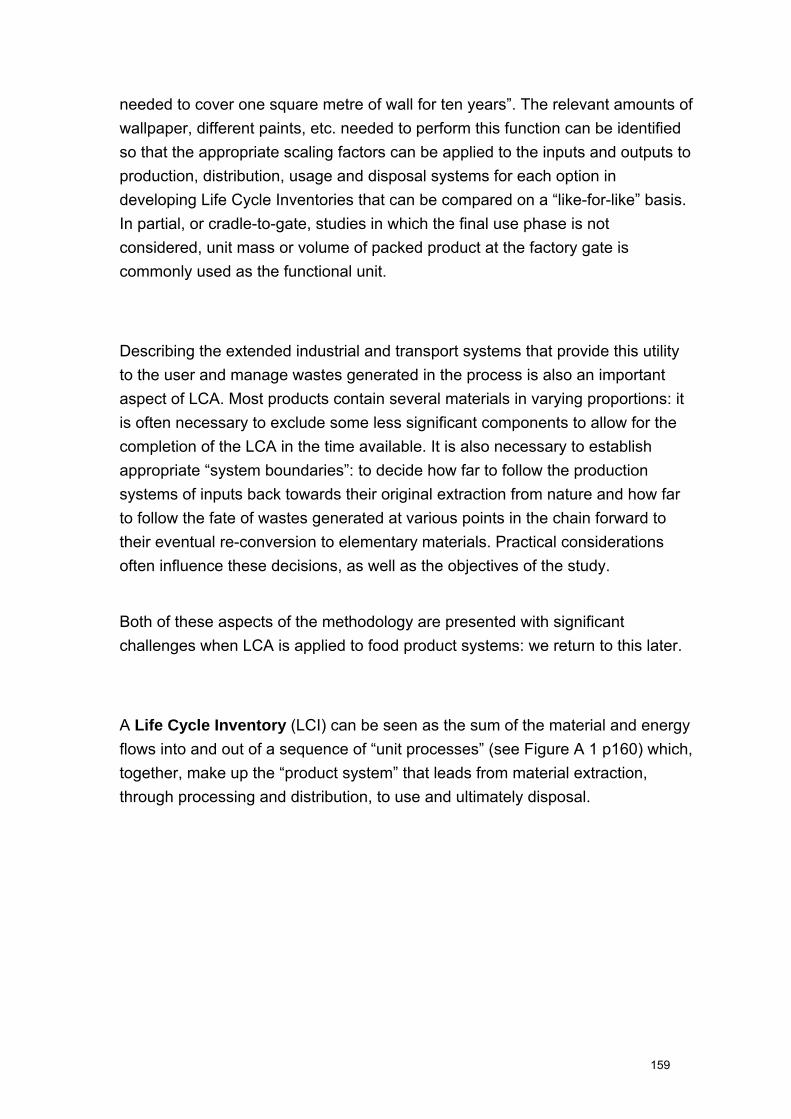
needed to cover one square metre of wall for ten years”. The relevant amounts of wallpaper, different paints, etc. needed to perform this function can be identified so that the appropriate scaling factors can be applied to the inputs and outputs to production, distribution, usage and disposal systems for each option in developing Life Cycle Inventories that can be compared on a “like-for-like” basis. In partial, or cradle-to-gate, studies in which the final use phase is not considered, unit mass or volume of packed product at the factory gate is commonly used as the functional unit.
Describing the extended industrial and transport systems that provide this utility to the user and manage wastes generated in the process is also an important aspect of LCA. Most products contain several materials in varying proportions: it is often necessary to exclude some less significant components to allow for the completion of the LCA in the time available. It is also necessary to establish appropriate “system boundaries”: to decide how far to follow the production systems of inputs back towards their original extraction from nature and how far to follow the fate of wastes generated at various points in the chain forward to their eventual re-conversion to elementary materials. Practical considerations often influence these decisions, as well as the objectives of the study.
Both of these aspects of the methodology are presented with significant challenges when LCA is applied to food product systems: we return to this later.
A Life Cycle Inventory (LCI) can be seen as the sum of the material and energy flows into and out of a sequence of “unit processes” (see Figure A 1 p160) which, together, make up the “product system” that leads from material extraction, through processing and distribution, to use and ultimately disposal.
159
Unit Process
“deliveredfuel”
“deliveredelectricity”
rawmaterials
Emisssionto air
Emisssionto water
Solidwaste
product
Internal scraprecovery
Figure A 1: A unit process with associated flows
Many unit processes do not produce single products (for example a field of wheat produces grain and straw, while a sheep farm produces lamb and wool). In addition, the smallest-scale data available often cover an entire factory which encompasses several activities that might be considered to be individual unit processes in their own right (for example, a factory producing ready meals might well have pasta-making integrated with meal assembly, although pasta making can be seen as a “unit process” in its own right). Thus in practice LCA often requires flows to be allocated between different products of a unit process or between several unit processes within a site. The basis on which this allocation is carried out is the cause of some debate among LCA practitioners.
For quantitative studies, Life Cycle Inventory (LCI) development is normally carried out using an LCA-specific software tool. Such tools commonly allow the use of data gathered specifically for the study in combination with more generic data from external sources such as the Eco-Profiles published by Plastics Europe for common polymers, the European Database for Corrugated Board Life Cycle Studies and the Swiss “ecoinvent” databases.
A number of methods have been developed for carrying out the third element of LCA, Life Cycle Impact Assessment or LCIA. The first element of any impact assessment in LCA is to match each flow against the environmental theme (or
160
themes) to which it is relevant – CO2 against climate change or SO2 against acid deposition, for example. This is known as characterisation. Scaling factors are applied to each substance to relate it to a reference substance: thus the Global Warming Potentials developed by the Intergovernmental Panel on Climate Change (IPCC) are used to relate all emissions of Greenhouse Gases to emissions of carbon dioxide (CO2). The impact of the studied system for each theme can be expressed in the resulting values – so Climate Change impacts can be expressed in gram equivalents of CO2, or acidification impacts as gram equivalents of hydrogen ion (H+).
Other LCIA methods seek to translate emissions of reference substances from the product system into final effects on ecosystems or human health: for example the Eco-indicator ’99 method follows the causal chain of environmental damage arising from acid gas releases to provide results in terms of species loss per unit area per unit time (Goedkoop & Spriensma 2000), while others assess released substances against regulatory thresholds. It is recognised that the further such chains are followed, the more assumptions underlie the impact assessment method and results obtained from its application. Some LCIA methods use weighting factors to bring together impacts arising under different environmental themes into single indicators. The use of weighting methods is discouraged in ISO standards on LCA since there is no scientific basis on which such weighting can be carried out – a difficulty which also besets ecological footprinting and other indicators.
LCA results
LCAs thus generate two sets of results: the results of the Life Cycle Inventory (LCI) and the results of any subsequent Life Cycle Impact Assessment (LCIA). Practitioners often draw on both in reporting LCA studies. If resources are available, practitioners may apply more than one LCIA method to the inventory obtained in an LCA to allow comparison of the conclusions reached on the basis of different sets of assumptions about the environmental consequences of particular flows. Some LCIA methods produce results with units, while some produce results that have no dimensions (being perhaps ratios) and these may be quoted in terms of “points” or “eco-points”. Overall energy inputs to the system that is the focus of the study are sometimes additionally provided in reports of
161
LCA studies as “primary energy use”. A review of evidence, such as this work, is therefore inevitably forced to draw on results presented in a number of slightly different formats.
Food product systems
Food products are of course highly diverse – not just in appearance, taste and nutritional composition, but also in terms of the extent to which their production involves human transformation of original plant or animal material and in terms of the number of ingredients present. The products available to consumers cover the entire spectrum from unwashed produce sold at the point of production to entire meals assembled from a dozen or more ingredients that may have travelled around the world in their journey through the production chain, and which may themselves be complex products. Figure A 2, Figure A 3 and Figure A 4 (p163) are simplified representations of the routes which foodstuffs follow from primary production to the consumer for three cases which can be drawn from this spectrum.
Any evaluation of the environmental impacts associated with food consumption needs to take into account these different routes. Each introduction of an additional processing step has environmental consequences: energy consumption, water use, cleaning chemical production and consumption, the use of intermediate packaging, possibly extra transport. But additional processing brings potential benefits too, such as scale economies or the chance to extract useable by-products in worthwhile quantities. With its focus on the “product system”, LCA offers an analytical perspective that should enable possible trade-offs between these benefits and additional impacts to be assessed.
162
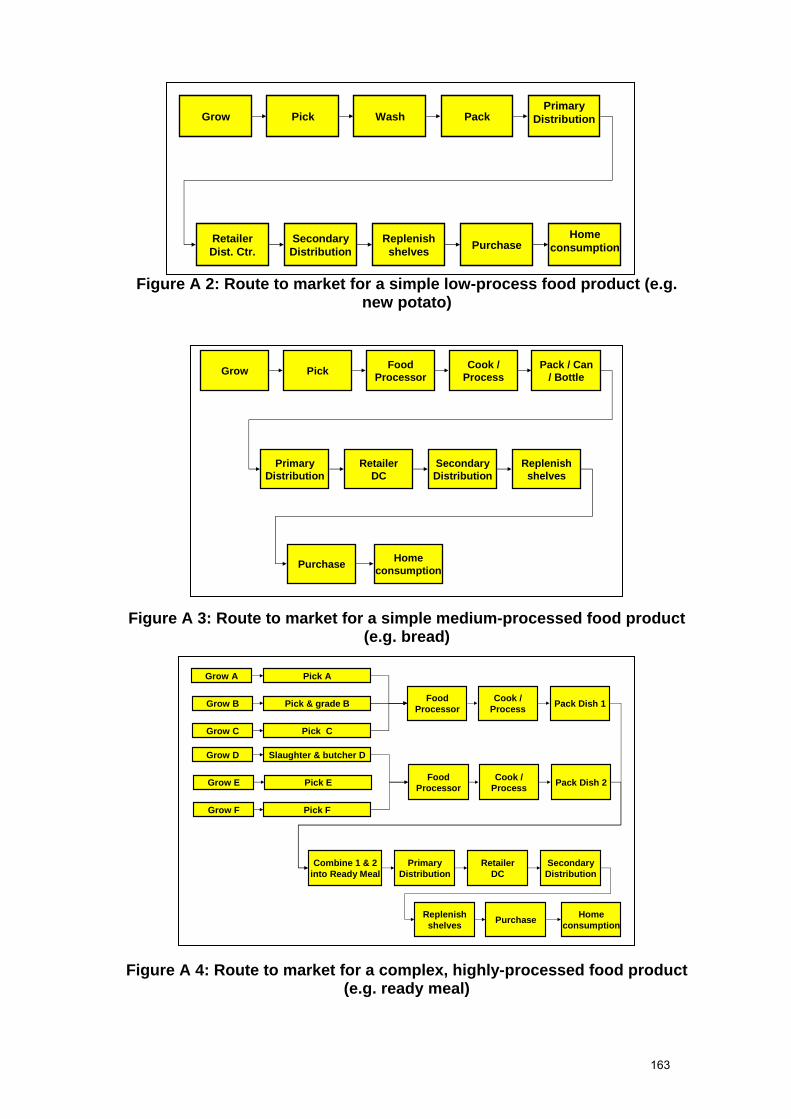
Figure A 2: Route to market for a simple low-process food product (e.g. new potato)
PrimaryDistributionGrow Pick Wash Pack
Homeconsumption
RetailerDist. Ctr.
SecondaryDistribution
Replenishshelves Purchase
Pack / Can/ BottleGrow Pick Food
ProcessorCook /
Process
Purchase
PrimaryDistribution
RetailerDC
SecondaryDistribution
Replenishshelves
Homeconsumption
Figure A 3: Route to market for a simple medium-processed food product (e.g. bread)
Pack Dish 1
Grow A Pick A
FoodProcessor
Cook /Process
Purchase
PrimaryDistribution
RetailerDC
SecondaryDistribution
Replenishshelves
Homeconsumption
Grow B Pick & grade B
Grow C Pick C
Pack Dish 2
Grow D Slaughter & butcher D
Cook /ProcessGrow E Pick E
Grow F Pick F
Combine 1 & 2into Ready Meal
FoodProcessor
Figure A 4: Route to market for a complex, highly-processed food product (e.g. ready meal)
163

Food Supply Chains The core idea behind the metaphor of a food chain is to link together farm production and household consumption and the stages in between. In this sense the food chain is directly analogous to the product system of LCA. Analysis of the food chain involves taking a particular food, identifying the inputs used in its growing, the farm production process, methods of processing or manufacture, systems of distribution and storage and retailing and consumption. Just as the object of an LCA study is the entire product system, so food chain studies take the chain as a whole as the object of analysis (the so-called “plough-to-plate” perspective), focusing in particular on the relationships between key actors, rather than individual sectors or actors (e.g. food retailers or farmers). In recent years, some academics have sought to challenge the utility of the notion of a chain. Critics have pointed out that a chain may be too linear and too mechanistic to cope with the complexity of the current food system in which materials may undergo multiple transformations and meanings and, perhaps, re-join a food chain at different points. Circuits, in contrast, it is argued, have no beginning and no end and so analysts should recognised that points of entry to a system will be constructed (rather than defined by the metaphor). So, whereas for a chain the focus may be on the number of stages – its length – for those who adopt a circuit the focus might be on flows of knowledge. Nevertheless, the notion of a food chain retains considerable currency. Amongst policy makers and proponents of alternative food systems in particular there is a desire to bring together producers and consumers. There are two key assumptions in many of the policy contributions to current food debates in Britain. The first is that amongst the key actors in the chain there is insufficient information about the constraints that they each face. If they had a fuller understanding of the market and competitive conditions under which they operated, then individual chains, and the UK food system as a whole, would operate in a more efficient and competitive manner. The assumption is that by sharing knowledge and experience the chain will gain mutual benefit rather than seeking competitive advantage through confrontation. The second assumption is that producers and consumers have become estranged from one another and need to be ‘re-connected’ to ensure trust in the safety of food. Key industry policy initiatives, such as that of the Food Chain Centre, have, therefore, focussed on the twin imperatives of making the food chain responsive to consumer needs and more efficient. For the Food Chain Centre, the objective is to bring together different, often competitive elements, along the chain to identify surpluses and remove waste. By removing waste the chain as a whole will be more efficient and more clearly address consumer needs. Waste is conceptualised as arising from defects in production, deficiencies in information flows along the chain and unnecessary activities. The emphasis is on ensuring that production addresses consumer demands from the outset and that materials are subsequently moved along the chain more quickly. Two themes emerge from this viewpoint: the first is a rather narrow vision of waste, one that largely ignores the environmental consequences of waste. Linked to this, a number of other concerns that have come to be associated with the food supply chain are downplayed, such as animal welfare concerns, the wider environmental impacts of the food chain (e.g. food miles or the use of inputs in the production process) or the social consequences of the food system that respond to fears raised by the fair trade movement. The second emergent theme is the importance of sophisticated forecasts as expressions of demand and determinants of activity in the food system. Food production cannot be organised in response to actual consumer demand (i.e. on the basis of orders received) and modern retailers do not use the mechanism of continually flexible pricing employed by market traders as a mechanism for matching demand to available supply. The “demand” that is signalled to food suppliers is therefore inevitably a calculated quantity with several components – a forecast – and steps (i.e. marketing measures) can be taken to influence actual demand so that it comes to match the forecast as closely as possible. This and the switch from supply through various tiers of wholesale market to more integrated supply chains with contract or quasi-contractual arrangements between parties are both example of what might be termed the “privatisation” of demand and supply information in the food sector - a process that appears to be taking place as the industry changes to a structure more akin to those long present in other sectors producing assembled goods.
164
Before trying to draw conclusions about the environmental impacts of UK food consumption on the basis of evidence that appears to exist largely in the form of LCA results, some aspects of food product systems - and their implications for the application of LCA to such systems - must be highlighted.
Applying LCA to food products The functionality of food products
The role of the functional unit in LCA has been discussed above. Unit mass can be a satisfactory functional unit for LCA studies of food products, for example if a straightforward exploration of the biggest environmental impacts in a system is required. Some refinement of this functional unit by allowing for the concentration of key nutrients (for example protein content in wheat) can enable allowance to be made for the differences in output of different primary production techniques and facilitate comparison at that level.
It is necessary to recognise that food delivers a variety of functions to the consumer beyond simple nutrition, and that there is some choice to be made concerning the appropriate functional unit for studies that involve comparison of foods at the point of consumption. Carrots, the subject of a recent study by the Dutch research organisation TNO for the European Association of Producers of Steel for Packaging (Ligthurt, Ansens and Jetten 2005) provide an example. The functional unit for this study, which compares carrots delivered in different forms pf package, is “600g carrots prepared and consumed at home”. It might be argued that some forms of processing affect the nutritional content of carrots, and so a nutritionally-corrected functional unit (for example “the mass of carrots needed to deliver x amount of vitamin A”) should be used in this case, since the “function” of carrots is largely nutritional. But it seems more likely that consumers actually buy carrots on the basis of requiring a certain quantity than that they buy different amounts in different packaging types because they allow for the effect of processing on vitamin content - so use of a mass-based functional unit can be justified . Whether consumers of carrots in less-nutritious forms make up for any shortfall in nutrients, and if so how they do so, raises questions akin to those that exist around possible “rebound effects” on general consumption that may result from the spending of money saved through reductions in household energy consumption. Such questions might be explored through studies of the
165
environmental consequences of different diets – but such studies would depend on the existence of single product data provided on a mass basis, since that is the normal way in which food intake is measured in consumption studies (e.g. the National Diet and Nutrition Survey of Henderson, Gregory and Swan 2002).
There would appear to be scope, in some studies of food systems, for use of functional units that are defined with reference to a point in time (for example, 1kg of apples available in a UK retailer in January). Since storage (whether in industrial-scale or domestic facilities) can be a significant component of the product system for fruits (away from their harvest season) or frozen vegetables, and is expected to vary with time, some evidence about the extent and magnitude of this temporal variation would be useful to inform the debate about the relative environmental impacts of fresh seasonal vs. frozen vs. preserved vs. imported products. Little, if anything, of this nature appears to have been published in relation to food products, although Ciroth and Holzinger have investigated the distribution of environmental impact over time for long-lived manufactured goods (Ciroth & Hölzinger 2002).
Multi-product activities
It was noted in Section 3.1 that LCA, in carving out systems that are defined around single products from the web of activities that is modern industrial society, allocates flows into and out of multi-product activities between the individual products of those activities. While there are established principles on which this can be done, it is an artificial modelling exercise. We cannot (yet at least) have lamb without wool, or wheat grain without straw, and yet allocation associates a “share” of the environmental burdens of the farming activity to each of its products, as if it could be produced in isolation.
For the purposes of building models to assist understanding this is a justifiable - even unavoidable – process. It is worth noting that food product systems include multi-product activities throughout - from the farm, through primary processing (for example the operation of a pig slaughterhouse generates much more than just pork chops, and vegetable freezing plant process a variety of crops during a year), secondary processing (sandwich producers, for example, produce many varieties), distribution (mixed product loads are the norm for transport to retail
166
outlets) and of course in retailing. Choices made about how flows should be allocated can influence strongly the outcomes of LCA studies: this issue is explored, for the case of an arable farm producing wheat and straw, in Audsley et al (1997), where methodological challenges associated with the interlinking of primary production activities are also discussed.
Simplifying factors
If the profusion of multi-product activities poses a challenge for those seeking to model the environmental impacts of food products, then the proliferation of individual products may appear to present an insuperable barrier. On closer consideration it becomes clear that some simplification of the task is possible. The entire food industry depends on the production of relatively few primary foodstuffs which are manipulated to produce the multiplicity of food products presented to the consumer in a typical supermarket. So, once the environmental impacts associated with the production of milk (or at least the production of milk in a certain region) are established, the environmental impacts associated with raw material production for yoghurt, cheese and (to a lesser extent) ice-cream are largely established too.
Furthermore, it appears that there are considerable similarities between the production conditions used for groups of primary foodstuffs, for example courgettes and capsicums are grown in similar greenhouse conditions. There may therefore be close similarities between the nature and scale of environmental impacts associated with their production, although yield differences and different requirements in terms of nutrient and/or inputs would surely cause some segregation. If such similarities can be identified, then there is the possibility of exploring the trade-offs noted at the beginning of this section, and others around which there is ongoing debate, by means of close study of exemplar foods from a range of categories defined in an appropriate way. Discussions with several individuals involved in the application of LCA to food products, in retailers, food processors, consultancies and academic institutions suggests that this approach can indeed bear fruit.
Jungbluth, Tietje and Sholz (2000) suggested that assessment of the environmental impacts of food products using LCA can be simplified into a
167
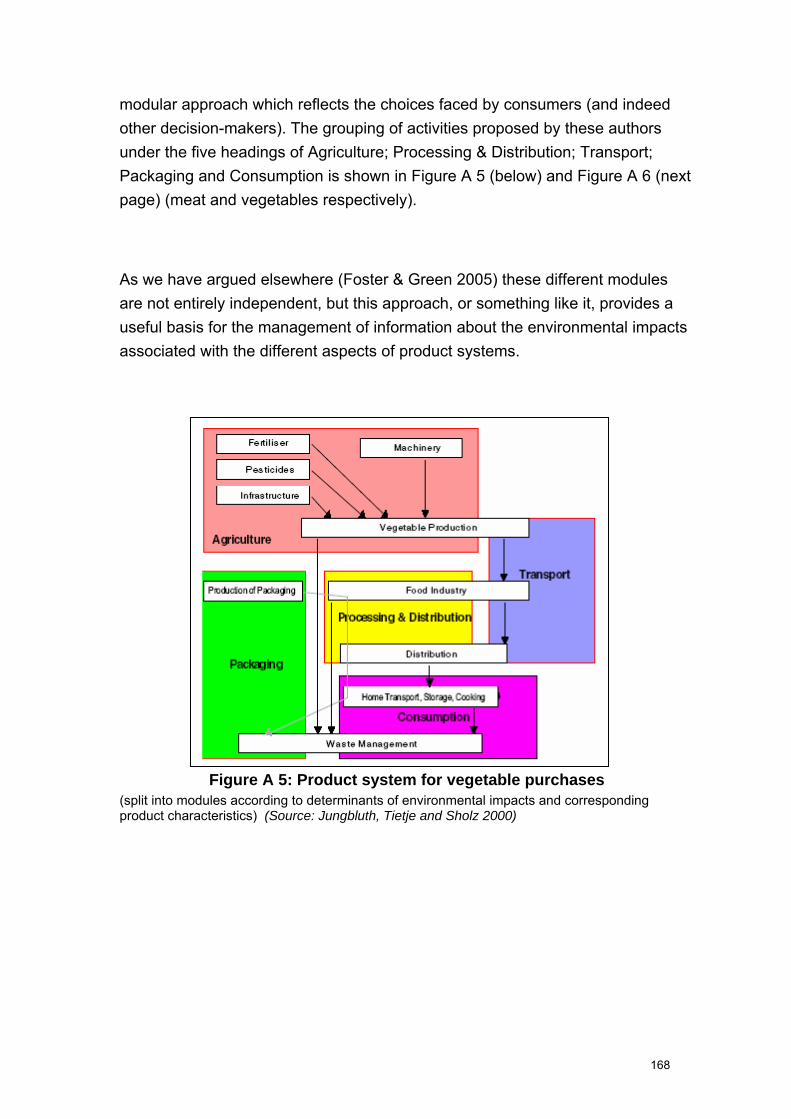
modular approach which reflects the choices faced by consumers (and indeed other decision-makers). The grouping of activities proposed by these authors under the five headings of Agriculture; Processing & Distribution; Transport; Packaging and Consumption is shown in Figure A 5 (below) and Figure A 6 (next page) (meat and vegetables respectively).
As we have argued elsewhere (Foster & Green 2005) these different modules are not entirely independent, but this approach, or something like it, provides a useful basis for the management of information about the environmental impacts associated with the different aspects of product systems.
Figure A 5: Product system for vegetable purchases (split into modules according to determinants of environmental impacts and corresponding product characteristics) (Source: Jungbluth, Tietje and Sholz 2000)
168
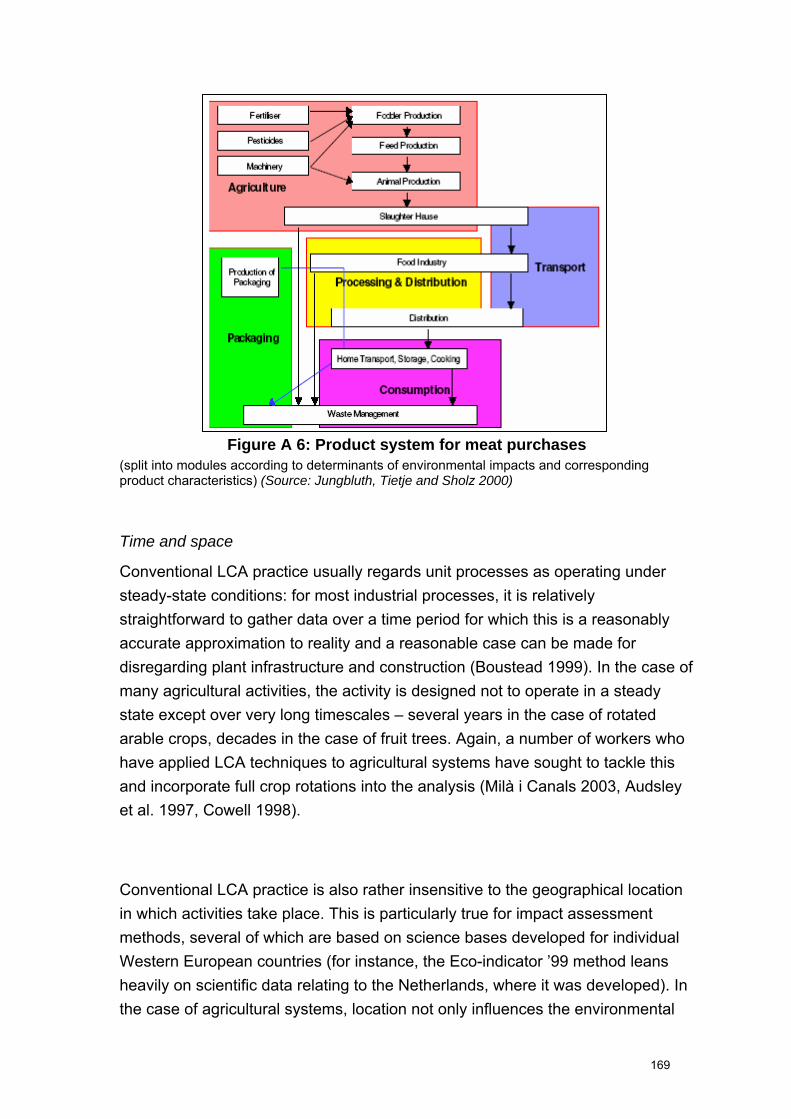
Figure A 6: Product system for meat purchases (split into modules according to determinants of environmental impacts and corresponding product characteristics) (Source: Jungbluth, Tietje and Sholz 2000)
Time and space
Conventional LCA practice usually regards unit processes as operating under steady-state conditions: for most industrial processes, it is relatively straightforward to gather data over a time period for which this is a reasonably accurate approximation to reality and a reasonable case can be made for disregarding plant infrastructure and construction (Boustead 1999). In the case of many agricultural activities, the activity is designed not to operate in a steady state except over very long timescales – several years in the case of rotated arable crops, decades in the case of fruit trees. Again, a number of workers who have applied LCA techniques to agricultural systems have sought to tackle this and incorporate full crop rotations into the analysis (Milà i Canals 2003, Audsley et al. 1997, Cowell 1998).
Conventional LCA practice is also rather insensitive to the geographical location in which activities take place. This is particularly true for impact assessment methods, several of which are based on science bases developed for individual Western European countries (for instance, the Eco-indicator ’99 method leans heavily on scientific data relating to the Netherlands, where it was developed). In the case of agricultural systems, location not only influences the environmental
169

significance of certain flows, it can strongly influence the inventory of flows associated with the agricultural activity in the first place, since soil type, climatic conditions and other local factors affect the behaviour of plants and animals. On the one hand, this location-dependency of environmental impact means that care must be exercised when drawing general lessons from specific evidence developed from production in one place. On the other, as an LCA expert in one company pointed out, once the variation of impacts between producing locations is understood and their relative significance in terms of the whole product-system established, a sound basis for decision-making about the environmental consequences of changing sources is in place.
Extended impact assessment
Finally in this short discussion of the application of LCA to food product systems, it is worth noting that LCA does not normally assess some well-recognised environmental effects of primary food production activities. Biodiversity and the effects of different agricultural practices on the landscape are not addressed, and water use (particularly its local impact) is dealt with rather simplistically when it is included at all. Mila i Canals (2003) notes some work that is underway to address some of these aspects; we would suggest that their absence does not make LCA inapplicable to food products, but it does reinforce the notion that LCA is not (as no other decision-support tool is either) the only assessment method needed to fully evaluate the environmental impacts of food production and consumption.
170

Annex 3: The environmental impacts of food in the home
There appears to be very little product-specific data available in the literature about the environmental impacts of food products post-retailing. Many published LCAs cover production only or just for production and processing. The scope of this project required consideration of impacts that arise in processing, distribution, retailing, and in the course of consumers’ handling of food products. Tackling all of these in LCA terms requires some allocation of the environmental burdens of multi-product activities. Although doubt can be cast on the validity of allocating a portion of the energy of running a domestic freezer, say, to any individual product in it (on the basis that the decision to consume the energy is more closely linked to – and influenced by – the decision to purchase the freezer than it is to food purchase decisions), following this path does permit this part of the life cycle to be placed in context. The following paragraphs outline the approach use to estimate product-specific impacts post-retailing. This is somewhat approximate and has been developed from the limited information that is available about the last stages of food product life cycles:
Transport to the home
Our analysis of this is limited to the consequences of air emissions (the congestion associated with large vehicles being driven to the supermarket to collect small amounts of food is considered as a social issue and therefore beyond the scope of this work).
Pretty et al. (2005) drew on UK Government statistics to estimate that food shopping for a household involved about 8km of car travel per household per week in two trips (as well as some bus travel, some walking and cycling, which we ignore). Now, the food and expenditure survey suggests that food consumption is around 12kg per person per week and Pretty et al. also note that the average household contains 2.32 people. So we can say that this 8km car travel involves the transport of 12x2.32 = 28kg food.
171
Given this, what is a reasonable estimate of the environmental impact of shifting 1kg of food?
We can take the environmental impact of driving a car 8/28 km (which would be 57g CO2 and ~0.3gm NOx for petrol cars). This of course implies that someone driving to the shops for 1l milk would cause less impact than someone going for 5l, which of course is false, since travelling 8km in a car has the same environmental impact whether it is carrying a 1kg payload or a 25kg one (assuming it’s the same journey). The alternative, to say that the impact of transport to the home for any unit is that of driving 4km (i.e. 0.8kgCO2 for petrol cars and 4 not 8 because the 8 is made up of two trips), is equally problematic since adding up all the impacts for all the food in the UK would then “reveal” that the total impact of transporting food home from the shops would be a very large and “unrealistic” number. We have adopted the first of these two approaches as best fitting the overall approach to data underlying this project, while recognising that any mechanism used to calculate the environmental impact of shopping for a single food item, or even food overall, as a discrete activity faces challenges in splitting this out from other linked activities.
Note that 57g CO2 is the emitted quantity associated with 0.025l petrol on the basis of greenhouse gas conversion factors provided by DEFRA in its Guidelines for Conmapy Reporting on Greenhouse Gas Emissions (DEFRA 2001). The energy content of this is approximately 0.85MJ, using energy content and density data given in the Digest of UK Energy Statistics (2005).
Storage
The environmental consequences of this are linked to wastage and energy consumption. Wastage is set aside and handled as a single theme, since the data doesn’t support a finer-grained treatment (see below). This leaves the environmental consequences of energy consumption. Once a decision has been taken to associate this with the food items rather than the domestic equipment itself (again an appropriate decision in the context of this project, but effectively a modelling choice), these depend on the time the product is stored for, and the type of storage.
172

There seems to be no information about average storage times for different products apart from what can be deduced by the application of common sense – for example that milk is seldom kept in a ‘fridge for more than 4 or 5 days.
Some information is available about the energy requirements of different types of storage:
Ambient storage has no energy requirement (although Pimentel & Pimentel (1996) allow for climate control of rooms in their discussion of the US, this is not considered relevant to the UK).
For refrigerated storage, Carlsson-Kanyama & Faist (2000) quote a range of values from a theoretical 0.0049MJ electricity/l capacity/day for best-in-class devices to 0.034MJ electricity/l capacity/ day for a ‘fridge of which the space is only 50% used (0.019MJ/l/day is quoted as an “average” value). Note that there is almost an order of magnitude difference between these values: the highest value is perhaps the most realistic, once one allows for the reality of old ‘fridges, half-empty ‘fridges, ‘fridges crammed under worktops so that they have to work twice as hard as they’re supposed to, and so on.
For frozen storage, Carlsson-Kanyama & Faist (2000) quote a range of values from 0.007 MJ electricity/l capacity /day to 0.029MJ electricity/ l capacity / day for a 10-year old average freezer. The last of these makes no allowance for partial utilisation, but is used as the “worst-case” quoted value – even though it is lower than the ‘fridge energy consumption.
Applying some common-sense assumptions about storage time (e.g. dairy products max. 5 days, frozen products 3 months, etc.), it is possible to use these to arrive at an amount of electricity needed to store a particular product for a particular time. While this is an artificial value (because it is impossible to run 1% of a refrigerator when there is only one pot of yoghurt in it) it has been used here. Once electricity use is estimated, it is possible to derive figures for relevant environmental impacts using the following conversion factors:
1MJ UK electricity ≡ 2.6MJ primary energy (Environment Agency)
1MJ UK electricity is associated with emissions of 120g CO2 (DEFRA GHG reporting guidelines 2001), 0.3g NOx and 0.5g SO2 (these two from National Air Emissions Inventory/DUKES 2005). 1g NOx is worth 0.7 g. equiv SO2 in terms of
173
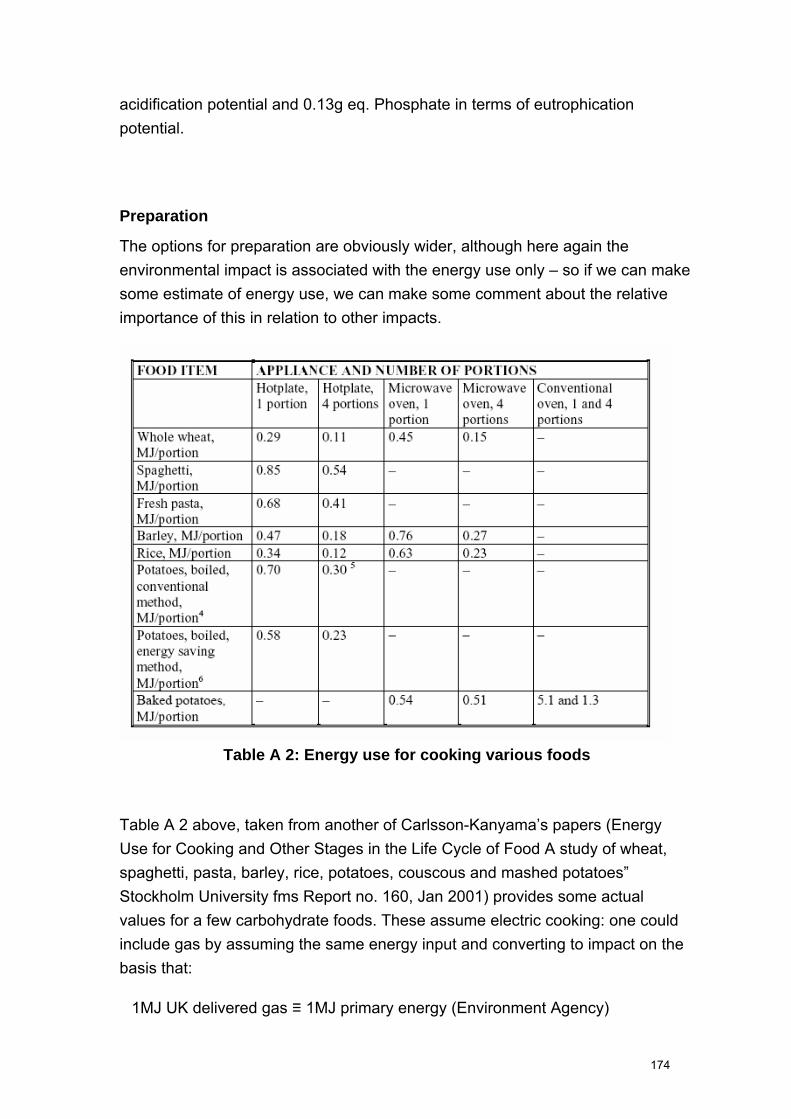
acidification potential and 0.13g eq. Phosphate in terms of eutrophication potential.
Preparation
The options for preparation are obviously wider, although here again the environmental impact is associated with the energy use only – so if we can make some estimate of energy use, we can make some comment about the relative importance of this in relation to other impacts.
Table A 2: Energy use for cooking various foods
Table A 2 above, taken from another of Carlsson-Kanyama’s papers (Energy Use for Cooking and Other Stages in the Life Cycle of Food A study of wheat, spaghetti, pasta, barley, rice, potatoes, couscous and mashed potatoes” Stockholm University fms Report no. 160, Jan 2001) provides some actual values for a few carbohydrate foods. These assume electric cooking: one could include gas by assuming the same energy input and converting to impact on the basis that:
1MJ UK delivered gas ≡ 1MJ primary energy (Environment Agency)
174
1MJ UK gas burnt is associated with emissions of 53g CO2 (DEFRA, 2001).
Note that Carlsson-Kanyama finds that energy use in cooking is approximately half of the total energy input to the life-cycle of spaghetti even in the case where it is cooked in a microwave (most efficient option). In the carrots study recently carried out by TNO (Ligthart, Ansems & Jetten 2005), “consumption” (storage and preparation) accounts for around 20% of the total global warming impacts for fresh and frozen products at ~0.2 kgCO2 equiv. per kg served carrots for the fresh product and ~0.5 kgCO2 equiv. per kg served carrots for the frozen version - the difference being mostly attributable to storage, of course.
Carlsson-Kanyama & Faist quote some figures (all based on electricity) for other modes of cooking other foods in their review of energy consumption in food systems, for example:
Roasting a frozen chicken in an oven – 8.5MJ per kg.
Microwaving a cauliflower – 0.8MJ/kg
Frying frozen chips – 7.7MJ/kg
Boiling pre-soaked beans – 5.5MJ/kg
Re-heating carrot puree on the cooker – 1.6 MJ/kg
Re-heating carrot puree in the microwave – 0.34MJ/kg
Sonesson et al. seem to have used a value of about 1.25MJ/kg for the re-heating of a ready meal in the famous meatball study (Sonesson & Davis 2005, Environmental Systems Analysis of Meals, SIK Rapport nr 735 2005, SIK)
For the purpose of developing arguments and providing context, I suggest that where a food would normally be cooked (not always obvious) we do the following:
If possible, use a value for the energy use appropriate to the specific food
175
Where there isn’t one, use a figure for energy consumption appropriate to a common cooking method for the food from this list:
Microwaving: 0.8MJ electricity/kg (use this for items that will obviously be re-heated)
Roasting: 9MJ/kg (gas or electricity).
Boiling: 3.5MJ/kg (gas or electricity). This is the per kg value from Table 1 for a single portion – portion size is 200g for potatoes. Practical experience suggests that potatoes have a moderate cooking time for things that are boiled, compared to re-heating frozen vegetables (short) and boiling beans (which takes longer, say 45minutes).
Frying: 7.5MJ/kg (gas or electricity).
Wastage
Data from a survey in Wales on the composition of domestic waste indicates that it is 25% food waste and 35% organic material (National Assembly for Wales (NAW)/AEAT Technology 2003). Pretty et al. (2005) draw on other sources (DEFRA and Strategy Unit) that state that the organic fraction of domestic waste is 3.3kg per week on average, while OU survey data from 2004 (Jones, Nesaratnam & Porteous, 2005) has putrescible food waste at 12.5%. But sticking with 25%, if 25/35 of the organic fraction of domestic waste is food, each household discards around 2.5kg food waste per week, which is somewhat less than 10% of what it apparently brought home from the shops.
It is uncertain whether or not the 28kg includes packaging. All packaging becomes waste in the home, of course, and Pretty et al quote each household discarding 4kg per week food packaging. If we allowed for that, then actual food wastage would be more like 2.5/24 – say 10% in round numbers.
There seems to be no more detailed information available relating to how people waste food in the UK. It would be desirable to distinguish between what we might term losses (inedible bits – bones, fish heads, potato peelings, etc.) and what we
176
could think of as true wastes (edible food not used), and to know whether people are more wasteful of some types of food than they are of others – as Sonesson, Anteson, Davis & Sjoden’s work indicates Swede are, and as common sense would suggest. While using a global average of 10% for wastage represents a practically viable approach, it must be recognised that for some items (whole fish, whole chickens) loss as defined it here will be greater than this figure (about 50% for fish, for example).
To follow food waste to its eventual environmental impact, we might simplify the latter by expressing it in terms of methane generation. Now landfills generated 487000tonnes of CH4 in 2001 (NAEI). In that year 22.4 million tonnes of municipal waste were put into them (DEFRA Waste Management Surveys), of which 87% was domestic. If we assume (simplifying somewhat and ignoring paper) that the organic fraction is 35% and that it gave rise to all the methane then, on average, landfills emitted about 20g of CH4 (for which the Global Warming Potential is 21 gCO2 equiv per g) per kg organic waste (including food waste) put into them. Or in other words, every kg of food waste entering a landfill gives rise to greenhouse gases equivalent to 420g CO2.
177
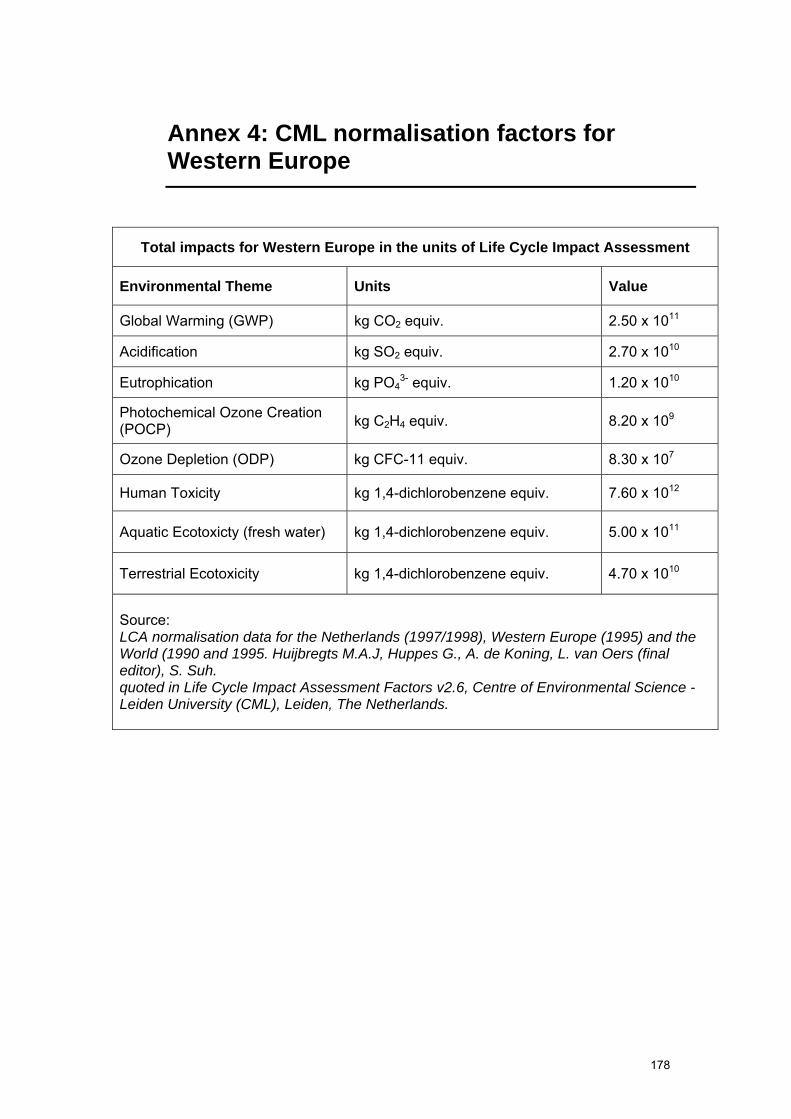
Annex 4: CML normalisation factors for Western Europe
Total impacts for Western Europe in the units of Life Cycle Impact Assessment
Environmental Theme Units Value
Global Warming (GWP) kg CO2 equiv. 2.50 x 10¹¹
Acidification kg SO2 equiv. 2.70 x 10¹⁰
Eutrophication kg PO43- equiv. 1.20 x 10¹⁰
Photochemical Ozone Creation (POCP) kg C2H4 equiv. 8.20 x 10⁹
Ozone Depletion (ODP) kg CFC-11 equiv. 8.30 x 10⁷
Human Toxicity kg 1,4-dichlorobenzene equiv. 7.60 x 10¹²
Aquatic Ecotoxicty (fresh water) kg 1,4-dichlorobenzene equiv. 5.00 x 10¹¹
Terrestrial Ecotoxicity kg 1,4-dichlorobenzene equiv. 4.70 x 10¹⁰
Source: LCA normalisation data for the Netherlands (1997/1998), Western Europe (1995) and the World (1990 and 1995. Huijbregts M.A.J, Huppes G., A. de Koning, L. van Oers (final editor), S. Suh. quoted in Life Cycle Impact Assessment Factors v2.6, Centre of Environmental Science - Leiden University (CML), Leiden, The Netherlands.
178
References
Note. The list below contains the references mentioned in the text. A database has been provided separately to DEFRA which provides a more complete catalogue of data sources, arranged by food.
Part 1 Carbon Trust 2006. “The Carbon Emissions Generated in all that we Consume”. January 2006. Available at: http://www.carbontrust.co.uk/Publications/CTC603.pdf.
Carlsson-Kanyama and Boström-Carlsson 2001. Energy Use for Cooking and Other Stages in the Life Cycle of Food A study of wheat, spaghetti, pasta, barley, rice, potatoes, couscous and mashed potatoes” Stockholm University fms Report no. 160, Jan 2001
Collins, Flynn & Netherwood (2005). “Reducing Cardiff’s Ecological Footprint. A Resource Accounting Tool for Sustainable Consumption” Andrea Collins, Andrew Flynn, Alan Netherwood. WWF Cymru.
T. Ekvall, L.Person, A.Ryberg, J.Widheden, N.Frees, P.Nielsen, B.Weidema Pedersen, M.Wesnaes. “Life Cycle Assessment of Packaging Systems for Beer and Soft Drinks. Main Report” Danish Environmental Protection Agency 1998.
ExternE “Externalities of Energy” vols 1-10 European Commission, 1998.
A. Golding, n.d. “Reuse of Primary Packaging Final Report. Part I - Main Report”. Abfalleratung, Müllvermeidung & Recycling.
Pretty et al. 2005. Farm costs and food miles: An assessment of the full cost of the UK weekly food basket. J.N. Pretty, A.S. Ball, T. Lang, J.I.L. Morison. Food Policy 30 (2005) 1–19
RDC Environment /PIRA 2003. “Evaluation of costs and benefits for the achievement of reuse and recycling targets for the different packaging materials in the frame of the packaging and packaging waste directive 94/62/EC”. RDC Environment / PIRA, March 2003
179
Sonesson et al.2005. Ulf Sonesson, Frida Anteson, Jennifer Davis and Per-Olow Sjödén. Home Transport and Wastage: Environmentally Relevant Household Activities in the Life Cycle of Food. Ambio Vol. 34, No. 4–5, June 2005
Tukker et al, 2005. “Environmental Impact Of Products (EIPRO). Analysis of the life cycle environmental impacts related to the total final consumption of the EU25”: Draft Report. Arnold Tukker, Gjalt Huppes, Jerome Guinée, Reinout Heijungs, Arjan de Koning, Lauran van Oers, Sangwon Suh, Theo Geerken, Mirja Van Holderbeke, Bart Jansen, Per Nielsen. IPTS/ESTO April 2005
Part 2
Sonesson & Davis (2005). Environmental Systems Analysis of Meals - Model Description and Data Used for Two Different Meals. Ulf Sonnsesson and Jennifer Davis. SIK-rapport Nr. 735 2005.
Bread
Andersson, K. and Ohlsson, T. (1999) Life Cycle Assessment of Bread Produced on. Different Scales. International Journal of LCA, 4 (1): pp. 25-40.
Audsley et al. 1997. “Harmonisation of Environmental Life Cycle Assessment for Agriculture” Final Report, Concerted Action AIR3-CT94-2028. Eric Audsley, Sebastian Alber, Roland Clift, Sarah Cowell, Pierre Crettaz Gérard Gaillard Judith Hausheer, Olivier Jolliett, Rene Kleijn, Bente Mortensen, David Pearce, Etienne Roger, Hélène Teulon, Bo Weidema, Henk van Zeijts
Beech, G.A. (1980): Energy Use in Bread Baking. J. Sci. Food Agric. 31, 289-298.
Braschkat, J. Patyk, A. Quirin and Reinhardt, G.A. (2003) ‘Life cycle assessment of bread production - a comparison of eight different scenarios’. Proceedings from the 4th International Conference Life Cycle Assessment in the Agri-food sector. October 6-8, 2003, Bygholm, Denmark.
Competition Commission (1998) Tomkins Plc and Kerry Group Plc: A report on the merger situation. Competition Commission report.
180
DEFRA (2006) Wheat milled and flour production. DEFRA Economics and Statistics. http://statistics.defra.gov.uk/esg/index.
Driffield Flour Mill (2004) PPC permit application.
Federation of Bakers (2005) ‘The British Bread and Bakery Snacks Market’. The Federation of Bakers, Factsheet n 3, October 2005.
Lang, T. (2005) ‘Ethical Traceability and the UK wheat-flour-bread chain’, Agri-Food Network Seminar on Ethical Consumption, October 2005.
Selby Flour Mill (2004) PPC permit application
Williams, A.G., Audsley, E. and Sandars, D.L. (2006) Determining the environmental burdens and resource use in the production of agricultural and horticultural commodities. Main Report. Defra Research Project IS0205. Bedford: Cranfield University and Defra. Available on www.silsoe.cranfield.ac.uk, and www.defra.gov.uk
Potatoes
British Potato Council 2006. http://www.potato.org.uk.
Carlsson-Kanyama and Boström-Carlsson 2001. Energy Use for Cooking and Other Stages in the Life Cycle of Food A study of wheat, spaghetti, pasta, barley, rice, potatoes, couscous and mashed potatoes” Stockholm University fms Report no. 160, Jan 2001
DEFRA 2001. Guielines for Company Reporting on Greenhouse Gas Emissions: Revised Guidelines. DEFRA, UK
Flynn, Yakovleva, Green & Marsden 2004. Supply Chains, Innovation and Sustainability. Paper presented at the “Theorising sustainability: connecting economy, environment and society?” Association of American Geographers Annual Meeting, 14-19 March 2004, Philadelphia
LCA Food database Denmark (2003 or later) www.lcafood.dk
McCain 2004. Application for a Permit under the Pollution Prevention and Control Regulations 2000. McCain, Scarborough
181
Mattsson, B. Wallen, E. 2003 “Environmental LCA of Organic Potatoes" ISHS Acta Horticulturae 619 - 26th International Horticultural Congress
Mila i Canals, pers. comm.. Llorenç Mila I Canals, University of Surrey, Jan 2006
Pimental,D Pimental,M 1996 “Food, Energy and Society”. University Press of Colorado
Williams, A.G., Audsley, E. and Sandars, D.L. (2006) Determining the environmental burdens and resource use in the production of agricultural and horticultural commodities. Main Report. Defra Research Project IS0205. Bedford: Cranfield University and Defra. Available on www.silsoe.cranfield.ac.uk, and www.defra.gov.uk
Pasta, Rice
Carlsson-Kanyama, A. 1998. “Climate change and dietary choices — how can emissions of greenhouse gases from food consumption be reduced?” Food Policy 23, No. 3/4, pp. 277–293, 1998.
Carlsson-Kanyama and Boström-Carlsson 2001. Energy Use for Cooking and Other Stages in the Life Cycle of Food A study of wheat, spaghetti, pasta, barley, rice, potatoes, couscous and mashed potatoes” Stockholm University fms Report no. 160, Jan 2001
Apples
Audsley et al. 1997. “Harmonisation of Environmental Life Cycle Assessment for Agriculture” Final Report, Concerted Action AIR3-CT94-2028. Eric Audsley, Sebastian Alber, Roland Clift, Sarah Cowell, Pierre Crettaz Gérard Gaillard Judith Hausheer, Olivier Jolliett, Rene Kleijn, Bente Mortensen, David Pearce, Etienne Roger, Hélène Teulon, Bo Weidema, Henk van Zeijts
Blanke, M.M and Burdick, B. 2005. Food (miles) for Thought: Energy Balance for Locally-grown versus Imported Apple Fruit. Environmental Science & Pollution Research 12 (3) 125–127 (2005)
Fresh Produce Consortium 2005. Presentation to the Food Climate Research Network Fruit & Vegetable Seminar, Manchester, December 2005
182

Kramer, S. B., Reganold, J. P., Glover, J D., Bohannan, B. J. M. and Mooney, H. A. (2006). Reduced nitrate leaching and enhanced denitrifier activity and efficiency in organically fertilized soils. PNAS vol. 103, 12, pp4522-4527.
Mila i Canals, L., Burnip, G.M., Cowell S.J. Evaluation of the environmental impacts of apple production using Life Cycle Assessment (LCA): Case study in New Zealand. Agriculture Ecosystems and Environment, in press
Schlich and Fleissner (2003). “Comparison of Regional Energy Turnover with Global Food”. Elmar H. Schlich & Ulla Fleissner. Gate to EHS/Global Food/LCA Case Studies, June 2003 p 1-6. Available at http://dx.doi.org/10.1065/ehs2003.06.009>
Van Hauwermeiren, Coene, Engelen and Mathijs, unpublished. Energy life cycle inputs in food systems: a comparison of local versus mainstream cases
Carrots
Annika Carlsson 1997 “Greenhouse Gas emissions in the Life Cycle of Carrots and Tomatoes”. IMES/EESS report no 24 March 1997 Lund University Sweden
Annika Carlsson-Kanyama “Climate change and dietary choices – how can emissions of greenhouse gases from food consumption be reduced?” Food Policy 1998 Vol 23 (3/4) pp 277 – 293
FPC 2005. Fresh Produce Consortium Presentation to Food Climate Research Network Fruit & Vegetable Seminar Manchester, December 2005
Ligthart TN, Ansems AMM & Jetten J 2005 “Eco-efficiency and nutritional aspects of different product/packaging systems; an integrated approach towards sustainability”. TNO Report R2005/101.April 2005
Tomatoes
Andersson,K Ohlsson,T & Ohlsson,P (1998) “Screening LCA of tomato ketchup”. Journal of Cleaner Production 6 pp 277 – 288.
A. Anton, J.I. Montero, P. Muñoz and F. Castells. “Identification of the Main Factors Affecting the Environmental Impact of Passive Greenhouses.
183
International Journal of Agricultural Resources Governance and Ecology, 4, 2, pp102-112 (2005).
Carlsson, A 1997 Food, “Greenhouse Gas Emissions in the Life Cycle of Carrots and Tomatoes” IMES/EESS report 24 March 1997 Lund University Sweden
Carlsson-Kanyama, A 1998 “Climate change and dietary choices - how can emissions of greenhouse gases from food consumption be reduced?” Food Policy 23 (3/4) pp 277 – 293.
Fresh Produce Consortium 2005. Presentation to the Food Climate Research Network Fruit & Vegetable Seminar, Manchester, December 2005.
D.Pimentel & M.Pimentel 1996 “Food, Energy and Society“ pp137 - 138 University Press of Colorado
Harvey, M., Quilley, S. and Beynon, H., 2004, Exploring the tomato: transformations of nature, society and economy, Cheltenham: Edward Elgar
Shonfield, pers comm. P.Shonfield, Unilever NV, December 2005
Stanhill G 1980 “The energy cost of protected cropping: a comparison of six systems of tomato production” J of Agricultural Engineering Research Vol 25 pp 145 – 154
Williams, A.G., Audsley, E. and Sandars, D.L. (2006) Determining the environmental burdens and resource use in the production of agricultural and horticultural commodities. Main Report. Defra Research Project IS0205. Bedford: Cranfield University and Defra. Available on www.silsoe.cranfield.ac.uk, and www.defra.gov.uk
Peas
Forum for the Future/ Birds Eye/ Unilever, In pursuit of the sustainable Pea, London: Forum for the Future, n.d.
Garnett, pers comm. Garnett, T. University of Surrey, December 2005
Jungbluth, 2000. Jungbluth Tietje & Scholz 2000. “Food Purchases: Impacts from the Consumers' Point of View Investigated with a Modular LCA”. Niels Jungbluth, Olaf Tietje, Roland W. Scholz. Int. J. LCA 5 (3) 134 – 142 (2000)
184
Shonfield (2005) “Energy Consumption Across the Frozen Pea Supply Chain” Presentation to the Food Climate Research Network Fruit & Vegetable Seminar, Manchester, December 2005.
Sim, pers. comm. Sim, S. Mark & Spencer plc, December 2005
Milk
Berlin, J., (2002), Environmental LCA of Swedish Hard Cheese, International Dairy Journal, 12, pp.939-953
Cederberg, C. and Mattsson, B., (2000), Life cycle assessment of milk production – a comparison of conventional and organic farming, Journal of Cleaner Production, 8, pp.49-60
Competition Commission, (1999), Milk: A report on the supply in Great Britain of raw cows' milk, available at:
http://www.competition-commission.org.uk/rep_pub/reports/1999/429milk.htm#full, last accessed 04/01/06
Department of Food and Rural Affairs (DEFRA), (2001), Milk Task Force Report, available at www.defra.gov.uk/farm/mtfreport/mtfreport.pdf, last accessed 21/10/04
G.Haas, F. Wetterlich & U Köpke. “Comparing Intensive, Extensified and Organic Grassland Farming in Southern Germany by Process Life Cycle Assessment” Agriculture, Ecosystems and Environment 83 (2001) 43-53.
Hospido, A., Moreira, M. and Feijoo, G., (2003), Influence of farm size on the uncertainty of milk cycle inventory data, available at http://www.lcacenter.org/InLCA2004/scale.html, last accessed 4/1/06
IGD, (2003), Local Sourcing: Distribution advice for regional food and drink producers, IGD: Watford
Keoleian, G.A. and Spitzley, D.V., (1999), Guidance for improving life cycle design and management of milk packaging, Journal of Industrial Ecology, 3 (1), pp.111-126
185
KPMG, (2003), Prices and profitability in the British Dairy Chain, Available at http://www.mdcdatum.org.uk/PDF/KPMG%20Report.pdf
London Economics, (2003), Examination of UK Milk Prices and Financial Returns, Panorama of European Business, (2003)
Sonesson, U. and Berlin, J., (2002), Environmental impact of future milk supply chains in Sweden: a scenario study, Journal of Cleaner Production, 11, pp.253-266
Sonesson et al.2005. Ulf Sonesson, Frida Anteson, Jennifer Davis and Per-Olow Sjödén. Home Transport and Wastage: Environmentally Relevant Household Activities in the Life Cycle of Food. Ambio Vol. 34, No. 4–5, June 2005
United Nation Environment Programme (UNEP), (2000), Cleaner Production Assessment in Dairy Processing, available at www.agrifood-forum.net/publications/guide/d_chp0.pdf, last accessed 21/10/04
Williams, A.G., Audsley, E. and Sandars, D.L. (2006) Determining the environmental burdens and resource use in the production of agricultural and horticultural commodities. Main Report. Defra Research Project IS0205. Bedford: Cranfield University and Defra. Available on www.silsoe.cranfield.ac.uk, and www.defra.gov.uk
Yoghurt
BASF (2000), BASF’s polystyrene: economical, environmentally sound, eco-efficient, available at www.basf.de/polystyrol-oekoeffizienz, last accessed 24/02/06
BASF (2000), Environmentally friendly plastic cups, available at
www.corporate.basf.com/en/sustainability/oekoeffizienz/service/presse/000810,
last accessed 24/02/06
Berlin, J., (2004), Optimal product sequencing saves environmental impact: a model of production schedule in the yoghurt industry, presented at the SETAC conference, Portland: US, November 2004
186
Berlin, J. Sonesson, U. and Tillman, A., (2005), A life cycle based method to minimise environmental impact of dairy production through product sequencing, Journal of Cleaner Production, 2005
Berlin, J., (2005), Environmental improvements of the post-farm dairy chain: production management by systems analysis methods, PhD thesis, Chalmers University of Technology, Sweden
British Plastics Foundation, (2003), Sustainability Through Plastics, available at http://www.bpf.co.uk/bpfissues/Sustainability.cfm, last accessed 03/02/06
Dewick, P. Foster, C. and Green, K. (2006), Going to Pot? Technology, Sustainability and the Yoghurt Industry, submitted to Journal of Industrial Ecology, January 2006
DEFRA (2005a), Life cycle assessment of polyvinyl chloride and alternatives: summary report for consultation, available at www.defra.gov.uk/environment/consult/pvc/05.htm, last accessed 22/03/06
DEFRA (2005b) Department of Food and Rural Affairs, (2005), UK Dairy Industry, available at http://www.defra.gov.uk/foodrin/milk/dairyindustry.htm, last accessed 02/06/05
Environment and Plastics Industry Council, 2001, Stewardship throughout the life cycle of a product, available at http://www.cpia.ca/epic, last accessed 24/02/06
Fetiz, A., Lundie, S., Dennien, G. Morain, M. and Jones, M., (2005), Allocating intra-industry material and energy flows using physico-chemcial allocation matrices: Application to the Australian Dairy Industry, presented at The Fourth Australian Life Cycle Assessment Conference, Sydney, Australia, February 2005
Keynote (2004), Milk & dairy products, 18th edition, Hampton: Key Note
Muller, (2003), Short life diary products: Market Report 2003, available at http://www.Muller.co.uk/en_GB/us/news/company/index.php?start=5, last accessed 29/10/2004
Smile Plastics. http://www.smile-plastics.co.uk
Polystyrene Australia (2005), National Packaging Covenant: Strategic partnerships in packaging, available at
187

http://www.deh.gov.au/settlements/publications/waste/covenant/pubs/covenant.pdf last accessed 29/04/06
Tamine, A.Y. and Robinson, R.K. (1999), Yoghurt Science & Technology, Woodhead Publishing, Second Edition.
Williams, A.G., Audsley, E. and Sandars, D.L. (2006) Determining the environmental burdens and resource use in the production of agricultural and horticultural commodities. Main Report. Defra Research Project IS0205. Bedford: Cranfield University and Defra. Available on www.silsoe.cranfield.ac.uk, and www.defra.gov.uk
Cheese
California Energy Commission, (2005), Optimisation of product life cycles to reduce greenhouse gas emissions in California, available at http://ies.lbl.gov/iespubs/57029.pdf, last accessed 29/04/06
Garnett, 2006. Food Climate Research Network Draft Working Paper
Nissinen, A. Heiskanen, E., Gronroos, J., Honkanen, A., Katajajuuri, J.M., Kurppa, S., Makinen, T., Seppala, J., Timonen, P., Usva, K., Virtanen, Y. and Voutilainen, P., (2005), Developing LCA-based benchmarks for sustainable consumption – for and with users, available at
http://www.vito.be/erscp2005/documents/papers/PAPER145.PDF, last accessed 29/04/06
Beef
ABP 2005. Anglo Beef Processors, PPC permit application 2004
Casey, J. W. and Holden, N. M. “Quantification or GHG Emissions from Suckler-Beef Production in Ireland” Agricutural Systems In Press
Casey, J. W. and Holden, N. M. (2006) “Greenhouse Gas Emissions from Conventional, Agri-Enviornmental Scheme, and Organic Irish Suckler-Beef Units” Journal of Environmental Quality 35: 231-239
188

Cederberg, C. and Stadig, M. (2003) “System Expansion and Allocation in Life Cycle Assessment of Milk and Beef Production” International Journal of Life Cycle Analysis 8 (6) 350-356
DeRamus, H. A. Clement, T. C. Giampola, D. D. and Dickison, P. C. “Methane Emissions of Beef Cattle on Forages: Efficeincy of Grazing Management Systems” Journal of Environmental Quality 32: 269-277
Nunez, Y. Fermoso, J. Garcia, N. and Irusta, R (2005) “Comparative Life Cycle Assessment of Beef Pork and Ostrich Meat: A Critical Point of View” International Journal of Agricultural Resources, Governance and Ecology, 4: No. 2
Ogino, A., Katu., K., Osada, T. and K., Shimada (2004) ”Environmental Impacts of the Japanese Beef-Fattening System with Different Feeding Lengths as Evaluated by a Life-cycle Assessment Method” Journal of Animal Science 82: 2115-2122
Sonesson, U. and Davis, J. (2005) “Environmental Systems Analysis of Meals – Model Description and Data Used for Two Different Meals” The Swedish Institute for Food and Biotechnology
Subak, S. (1999) “Global Environmental Costs of Beef Production” Ecological Economics 30: 79-91
Williams, A.G., Audsley, E. and Sandars, D.L. (2006) Determining the environmental burdens and resource use in the production of agricultural and horticultural commodities. Main Report. Defra Research Project IS0205. Bedford: Cranfield University and Defra. Available on www.silsoe.cranfield.ac.uk, and www.defra.gov.uk
Lamb
Carlsson-Kanyama & Faist (2000). Carlsson-Kanyama & Faist 2000. “Energy Use in the Food Sector: A data survey” Annika Carlsson-Kanyama, Mireille Faist.
Pimentel, D. & Pimentel, M. (1996) “Food, Energy and Society”. University Press of Colorado
Williams, A.G., Audsley, E. and Sandars, D.L. (2006) Determining the environmental burdens and resource use in the production of agricultural and
189
horticultural commodities. Main Report. Defra Research Project IS0205. Bedford: Cranfield University and Defra. Available on www.silsoe.cranfield.ac.uk, and www.defra.gov.uk
Pork
Basset-Mens, C. and van der Werf H. (2005) Scenario-based environmental assessment of farming systems: the case of pig production in France. Agriculture, Ecosystems and Environment, 105: 127-144
Cederberg, C., (2003) Life Cycle Assessment of Animal Products. In Environmental-Friendly Food Production Woodhead-Publishing , England
DEFRA (2006) Livestock: Pigs - Facts & Figures. http://www.defra.gov.uk/farm/pigs
Erzinger, S., Dux, D., Zimmermann, A. and Badertscher, R. (2003), LCA of Animal Products from Different Housing Systems in Switzerland: Relevance of Feedstuffs, Infrastructure and Energy Use. Proceedings from the 4th International Conference, October 6-8, 2003, Bygholm, Denmark
Hakansson, S., Gavrilita, P. and Bengoa, X. (2005) Comparative Life Assessment of Pork vs Tofu. Life Cycle Assessment 1N1800 Stockholm.
Nemry, F. Theunis, J. Breceht TH. and Lopez, P. (2001) Green Gas Emissions Reduction and Material Flows. Federal Office for Scientific, Technical and Cultural Affairs, Belgium
Núñez J. Fermoso, N. Garcia, R. Irusta (2005) Comparative life cycle assessment of beef, pork and ostrich meat: a critical point of view. International Journal of Agricultural Resources, Governance and Ecology, 4 (2): 140 – 151
Williams, A.G., Audsley, E. and Sandars, D.L. (2006) Determining the environmental burdens and resource use in the production of agricultural and horticultural commodities. Main Report. Defra Research Project IS0205. Bedford: Cranfield University and Defra. Available on www.silsoe.cranfield.ac.uk, and www.defra.gov.uk
190
Zhu, X. and van Ierland, E. C. (2003) Protein Chains and Environmental Pressures: A Comparison of Pork and Novel Protein Foods. Environmental Sciences, 1 (3): 254-276.
Chicken
Danish LCA Food Database (2003 or later) www.lcafood.dk
Ellingsen and Aanondsen 2006. Environmental Impacts of Wild Caught Cod and Farmed Salmon – A Comparison with Chicken. Harald Ellingsen and Svein Aanond Aanondsen. Int J LCA 1 (1) 60 – 65 (2006)
RAC Environment Ltd. undated. Poultry UK. Mass Balance of the UK Poultry Industry
Silsoe Research Institute (SRI) (2005) “Determining the environmental burdens and resource use in the production of agricultural and horticultural commodities” Draft report for DEFRA Research project IS0205, unpublished.
Williams, A.G., Audsley, E. and Sandars, D.L. (2006) Determining the environmental burdens and resource use in the production of agricultural and horticultural commodities. Main Report. Defra Research Project IS0205. Bedford: Cranfield University and Defra. Available on www.silsoe.cranfield.ac.uk, and www.defra.gov.uk
Fish
Black K. 2001 "Environmental Impacts of Aquaculture", Sheffield Academic Press SECRU 2002
Carlsson-Kanyama, A & Faist, M. (2000), “Energy Use in the Food Sector: A data survey”
Competition Commission 2000. “Nutreco Holdings NV and Hydro Seafood GSP Ltd. – Report on the proposed Merger.”
Ellingsen, H. and Aanondsen, S. 2006. Environmental Impacts of Wild Caught Cod and Farmed Salmon – A Comparison with Chicken, International Journal of LCA 1 (1) 60 – 65 (2006)
191
Foster, C. (unpublished) Food Production and Consumption Systems – Form, Flows and Consequences. Cases of Fish – Salmon and Cod. Draft Working Paper, Manchester Business School 2005
Naylor 2000. Naylor, R.L et al. “Effect of Aquaculture on world fish supplies”. Nature, 405 June 2000, 1017 – 1024
RCEP Royal Commission on Environmental Pollution) (2004), “Turning the Tide: Addressing the Impact of Fisheries on the Marine Environment”. December 2004, London
Thrane, M. 2006. LCA of Danish Fish Products- New methods and insights, Int J LCA 11 (1) 66 – 74 (2006)
UNEP 2000. Cleaner Production Assessment in Fish Processing. COWI Consulting Engineers. UNEP/ Danish EPA 2000
University of Stirling 2003. “The potential impact of technological innovation on the aquaculture industry” Report to the Royal Commission on Environmental Pollution. Institute of Aquaculture & Department of Marketing, University of Stirling September 2003
Ziegler, F., Nilsson, P., Mattsson, B. and Walther, Y. (2002), Life Cycle Assessment of Frozen Cod Fillets Including Fishery-Specific Environmental Impacts, Int J LCA 2002 (OnlineFirst)
Eggs etc.
Aiking, H., de Boer, J. & Vereijken, J (ed) (2006), Sustainable Production and Consumption: Pigs or Peas? Springer, Dordrecht, 2006
Annika Carlsson-Kanyama “Climate change and dietary choices – how can emissions of greenhouse gases from food consumption be reduced?” Food Policy 1998 Vol 23 (3/4) pp 277 – 293
Danish LCA Food Database (2003 or later) www.lcafood.dk.
Williams, A.G., Audsley, E. and Sandars, D.L. (2006) Determining the environmental burdens and resource use in the production of agricultural and horticultural commodities. Main Report. Defra Research Project IS0205. Bedford: Cranfield University and Defra. Available on www.silsoe.cranfield.ac.uk, and www.defra.gov.uk
192

Beer
Australian Department of the Environment and Heritage report, Case Study of Cascade Brewery Company: Using technology modifications to reduce energy and water use and enhance materials recycling
http://www.deh.gov.au/settlements/industry/corporate/eecp/case-studies/cascade-brewery.html
British Beer and Pub Association Website: http://www.beerandpub.com
DEFRA, Report by the United Kingdom in compliance with Article 2.1(a) of Commission Regulation (EC) No 963/2001, April 2002, “Analyses of the Environmental Effects of Common Agricultural Policy Direct Aids” available at http://www.defra.gov.uk/farm/sustain/envimpacts/directaids.pdf
DEFRA (2003) Guidelines for the Measurement and Reporting of Emissions by Direct Participants in the UK Emissions Trading Scheme: Protocol 6: Calculation of process CO2 emissions in beer production
Downing, T. E., Butterfield, R. E. Edmonds, B., Knox, J. W., Moss, S.,Piper, B. S. and Weatherhead, E. K. (2003). Climate Change and the demand for Water, Research Report, Stockholm Environment Institute Oxford Office, Oxford
ENDS Report 2005. Scottish Courage: Learning to Live with IPPC. ENDS Report 371, December 2005
European Environment Agency (2005) Household consumption and the environment, European Environment Agency, Denmark
http://reports.eea.eu.int/eea_report_2005_11/en/EEA_report_11_2005.pdf
Fillaudeau L, Blanpain-Avet P. and Daufin, G. 'Water, Wastewater and waste Managment in Brewing Industries' Journal of Cleaner Production in press.
Garnett,T. “The Alcohol We Drink And Its Contribution To The UK's Greenhouse Gas Emissions: Draft Discussion Paper” Food Climate Research Network, May 2006 p.67
Hospido, A, Moreira, M T, Feijoo G. “Environmental analysis of beer production”. Int. J. Agricultural Resources Governance and Ecology, 4, pp152-162, 2005.
193
Koroneos et al (2005) 'Life Cycle Assessment of beer production in Greece' Journal of Cleaner Production 13 p433-439
T. Ekvall, L.Person, A.Ryberg, J.Widheden, N.Frees, P.Nielsen, B.Weidema Pedersen, M.Wesnaes. “Life Cycle Assessment of Packaging Systems for Beer and Soft Drinks. Main Report” Danish Environmental Protection Agency 1998.
Pauli, G. (1997) 'Zero Emissions: The Ultimate Goal of Cleaner Production' Journal of Cleaner Production 5 p109-113
Talve, S. 'Life Cycle Assessment of a Basic Lager Beer, International Journal of LCA 6 (5) p293-298
Takamoto, Y., Mitani, Y., Takashio, M., Itoi, K. and Muroyama, K. (2004) Life cycle inventory analysis of a beer production process. Master Brewers Association of the Americas Vol 41 no 4 pp363-365
http://www.mbaa.com/TechQuarterly/Articles/2004/1007-01.pdf
The ECE Committee on Environmental Policy launched the Environmental Performance Review of Slovenia in January 1996, Chapter 10: Environmental Concern in Agricultural p115-125. http://www.unece.org/env/epr/studies/slovenia/
UK Agriculture: Not for profit organisation to advance education and understanding of agriculture at www.ukagriculture.com
Vaughan, A. (1999), Bitter harvest, bitter beer. The impact of beer production and consumption on people and the environment, Food Facts No. 7, Sustain: the Alliance for Better Food and Farming, London http://www.sustainweb.org/ffact_index.asp
World Bank Group, (1998) Industry Description and Practices of Breweries, in the Pollution Prevention and Abatement Handbook p272-274 World Bank Group.http://ifcln1.ifc.org/ifcext/enviro.nsf/AttachmentsByTitle/gui_breweries_WB/$FILE/breweries_PPAH.pdf
Carbonated soft drinks and sugar
British Soft Drink Association. http://www.britishsoftdrinks.com. Accessed December 2005
194
British Soft Drink Association Annual Report 2003-4, http://www.britishsoftdrinks.com/htm/sv/PDFs/AnnualReport2005.pdf Accessed December 2005
British Sugar website: Soft Drinks in the European Community, http://www.britishsoftdrinks.com/htm/sv/PDFs/EuroEco.pdf Accessed December 2005
Coca-Cola Environmental Report 2003, available at http://www.environmentalreport2003.cocacola.com/docs/environmental_report2003.pdf. Accessed December 2005
DEFRA (2002) Sugar Beet and the Environment in the UK. Report by the United Kingdom with Article 47(3) of Council Regulation 1260/200 on the Environmental Situation of Agricultural Production. June 2002
The Dutch Soft Drinks Association, http://www.frisdrank.nl/english/frisdran/frfrisdr.htm. Accessed December 2005
Ekvall, T. Person, L Ryberg, A. Widheden, J. Frees, N., Nielsen Per H., and Wesnas (1998) "Life Cycle Assessment of Packaging Systems for Beer and Soft Drinks” Miljoprojekt nr 399 Danish Environmental Protection Agency, Ministry of Environment and Energy, Denmark.
Heathcote, pers. comm. R.Heathcote, Bulmers, Jan. 2006
House of Commons Environment, Food and Rural Affairs Committee (CEFRAC). Reform of the Sugar Regime. 12th Report of Session 2003-2004 Vol 1
Information-zentrum-Weiβblech e.v., undated. Life cycle assessments (LCA) - A practical decision instrument for politics and business?
Mintel (2005). Sugar and Artificial Sweeteners - UK - January 2005, Mintel International Group Limited
Mintel (2005) Carbonates - UK - February 2005 Market Intelligence Food and Drink, Market Intelligence UK, Market Intelligence Standard
Plinke, E., Schonert, M., Meckel, H., Detzel, A., Giegrich, J., Fehrenbach, H., Ostermayer, A., Schorb, A., Heinisch, J., Luxenhofer, K. & Schmitz, S., Umweltbundesamt n.d. Ökobilanz für Getränkeverpackungen II, Zwischenbericht zum Forschungsvorhaben 296 92 504, Texte 37/00
195
Renouf, M. (2006), Life Cycle Assessment (LCA) of sugarcane production in Queensland. Interim Results of work part of a broader research project - Evaluating the environmental implications of product diversification in the Australian sugar industry
The Swedish Brewers' Association is the trade organisation of the Swedish breweries, soft drinks, cider and bottled water producers. Available at http://www.sverigesbryggerier.se/eng/index.htm Accessed December 2005
UNESDA-CISDA The Union of EU Non-alcoholic Beverages Associations http://www.unesda-cisda.org/public/framestats.html
Water
Arnold, E. (2006) Bottled Water: Pouring Resources Down the Drain. Earth Policy Institute, 2006
Ekvall, T. Person, L Ryberg, A. Widheden, J. Frees, N., Nielsen Per H., and Wesnas (1998) "Life Cycle Assessment of Packaging Systems for Beer and Soft Drinks” Miljoprojekt nr 399 Danish Environmental Protection Agency, Ministry of Environment and Energy, Denmark
Ferrier, C. (2001) Bottled Water: Understanding a Social Phenomenon. World Wildlife Fund, Washington D.C.
Howard, B. (2003) Despite the Hype, Bottled Water is Neither Cleaner or Greener than Tap Water. The Environmental Magazine, 9 December 2003
Ministry of Environment and Energy, Denmark, Danish Environmental Protection Agency, Life Cycle Assessment of Packaging Systems for Beer and Soft Drinks,
http://www.mst.dk/udgiv/Publications/1998/87-7909-014-1/pdf/87-7909-014-1.PDF
Mintel (2005) Bottled Water – UK – June 2005, Market Intelligence Food and Drink
Richards, J. (2006) Turn back to your taps – we all pay the price for bottled water. Times Online, February 18 2006
196
Severn Trent Water, Delivering sustainability report 2006: http://www.stwater.co.uk/upload/pdf/Delivering_Sustainability_2005_Report_20060111112934.pdf
Coffee
Carlsson-Kanyama and Boström-Carlsson (2001) Energy Use for Cooking and Other Stages in the Life Cycle of Food A study of wheat, spaghetti, pasta, barley, rice, potatoes, couscous and mashed potatoes” Stockholm University fms Report no. 160, Jan 2001
Coltro, L., Mourad, A.L., Oliveira, P.A.P.L.V., Baddini, J.P.O.A. and Kletecke, R.M. (2006) Environmental Profile of Brazilian Green Coffee. Int J. LCA 11, 1, 16 – 21 (2006)
Jungbluth & Demmeler (2005) 'The Ecology of Scale: Assessment of Regional Energy Turnover and Comparison with Global Food' by Elmar Schlich and Ulla Fleissner. Letter to the Editor, Int J LCA 10 (3) 168 – 170 (2005)
Pelupessy, W. (2003): Environmental issues in the production of beverages: global coffee chain. Cap. 7, pp 95–115. In: Mattsson B, Sonesson U (2003): Environmentally-friendly food processing. Woodhead Publishing Limited, Cambridge England
Salomone, R. (2003) Life cycle assessment applied to coffee production: investigating environmental impacts to aid decision making for improvements at company level. Food, Agriculture & Environment 1 (2) 295–300
Schlich, E. H. and Fleissner, U. (2003), “Comparison of Regional Energy Turnover with Global Food”. Gate to EHS/Global Food/LCA Case Studies, June 2003 p 1-6. Available at http://dx.doi.org/10.1065/ehs2003.06.009
Wine
Notarnicola and Tassielli (2005) “Life cycle assessment of wine production”. In “Environmentally-friendly food processing”. B.Mattson & U.Sonesson (eds.) Woodhead, Cambridge, England 2005
197
Oils and Fats
Shonfield, P.K. and Dumelin, E.E., A life cycle assessment of spreads and margarines, in press, Lipid Technology
Others
C-Tech Innovation 2004. “UK Food & Drink Processing Mass Balance” C-Tech Innovation
Carlsson-Kanyama, A. (1998) “Climate change and dietary choices – how can emissions of greenhouse gases from food consumption be reduced?” Food Policy 1998 Vol 23 (3/4) pp 277 – 293.
DEFRA 2001 Guidelines for Company Reporting on Greenhouse Gas Emissions. 2001
National Assembly for Wales (NAW)/AEAT Technology 2003. The Composition of Municipal Waste in Wales - National Assembly for Wales (NAW)/AEAT Technology - December 2003
Jones, A., Nesaratnam, S. & Porteous, A. (2005) The Open University Household Waste Study: Key findings from 2004
Shultz and Stieβ 2006. Linking Sustainable Consumption to Everyday Life. A social-ecological approach to consumption research. Irmgard Schultz and Immanuel Stieß. Paper presented at the SCORE Workshop, Copenhagen, April 2006
Sonesson, U. and Davis, J. (2005) “Environmental Systems Analysis of Meals – Model Description and Data Used for Two Different Meals” The Swedish Institute for Food and Biotechnology
198

199
Nobel House 17 Smith Square LONDON SW1P 3 JR www.defra.gov.uk