1
Esri, DeLorme, GEBCO, NOAA NGDC, and other contributors, Sources: Esri, GEBCO, NOAA, National Geographic, DeLorme, HERE, Geonames.org, and other contributors Texas Florida Louisiana Alabama Mississippi Esri, DeLorme, GEBCO, NOAA NGDC, and other contributors, Sources: Esri, GEBCO, NOAA, National Geographic, DeLorme, HERE, Geonames.org, and other contributors Texas Florida Louisiana Alabama Mississippi Esri, DeLorme, GEBCO, NOAA NGDC, and other contributors, Sources: Esri, GEBCO, NOAA, National Geographic, DeLorme, HERE, Geonames.org, and other contributors Esri, DeLorme, GEBCO, NOAA NGDC, and other contributors, Sources: Esri, GEBCO, NOAA, National Geographic, DeLorme, HERE, Geonames.org, and other contributors Texas Florida Louisiana Alabama Mississippi Esri, DeLorme, GEBCO, NOAA NGDC, and other contributors, Sources: Esri, GEBCO, NOAA, National Geographic, DeLorme, HERE, Geonames.org, and other Texas Florida Louisiana Alabama Mississippi Esri, DeLorme, GEBCO, NOAA NGDC, and other contributors, Sources: Esri, GEBCO, NOAA, National Geographic, DeLorme, HERE, Geonames.org, and other Texas Florida Louisiana Alabama Mississippi Esri, DeLorme, GEBCO, NOAA NGDC, and other contributors, Sources: Esri, GEBCO, NOAA, National Geographic, DeLorme, HERE, Geonames.org, and other Texas Florida Louisiana Alabama Mississippi Esri, DeLorme, GEBCO, NOAA NGDC, and other contributors, Sources: Esri, GEBCO, NOAA, National Geographic, DeLorme, HERE, Geonames.org, and other Texas Florida Louisiana Alabama Mississippi Esri, DeLorme, GEBCO, NOAA NGDC, and other contributors, Sources: Esri, GEBCO, NOAA, National Geographic, DeLorme, HERE, Geonames.org, and other Texas Florida Louisiana Alabama Mississippi Esri, DeLorme, GEBCO, NOAA NGDC, and other contributors, Sources: Esri, GEBCO, NOAA, National Geographic, DeLorme, HERE, Geonames.org, and other Texas Florida Alabama Louisiana Mississippi Content may not reflect National Geographic's current map policy. Sources: National Geographic, Esri, DeLorme, HERE, UNEP-WCMC, USGS, NASA, ESA, METI, NRCAN, GEBCO, NOAA, increment P Corp. Louisiana Mississippi Alabama Esri, DeLorme, GEBCO, NOAA NGDC, and other contributors, Sources: Esri, GEBCO, NOAA, National Geographic, DeLorme, HERE, Geonames.org, and other contributors Environmental Impact Assessment of Petroleum Spill Using GIS Author: Simon Suo Email: [email protected] LinkedIn: https://www.linkedin.com/in/suosimon Organization: Department of City and Regional Planning, The University of Pennslyvania Legend Marine Mammals $3,000 per pixel per year Birds $2,000 per pixel per year Terrestrial Mammals $3,000 per pixel per year Reptiles $1,500 per pixel per year Invertebrates $1,000 per pixel per year Fish $1,500 per pixel per year Total biodiversity value per pixel per year in $ High : 17000 Low : 0 Total: $1 million loss per day Fish Habitat Birds Habitat Marine Mammals Habitat Invertebrate Habitat Terrestrial Mammal Habitat Reptile Habitat Legend ! ? Polluted recreational fishing sites EIA losses High : 5603169 Low : 329446 Gulf States Sample spill sites U.S. Coast Guard (USCG) Boundaries Annual Fishery Revenue by State (in thousand dollars) Annual fishery Revenue per pixel per year (in thousand dollars) Legend 71 609 928 8,828 60,693 Legend 17 83 324 433 980 1,220 5,597 Summary This study aims to illustrate the environmental impacts caused by oil spill in an ocean area. The Gulf of Mexico is selected as the study area with its abundant data sources. Three major factors are considered as the economic loss, namely economic activity loss, biodiversity loss and commercial fishery loss. The oil spill area in this poster is imaginary, but it will not affect the methodology behind the scene. The fishery and biodiversity loss are calculated based on economic loss per pixel per year in a dollar. The economic activity loss is calculated based on whether the oil spill area will cover the economic activity points. The final assessment result would be the total economic loss for the whole oil spill area per day in dollars. Acknowledgements I appreciate Prof. Dana Tomlin, in the Department of City and Regional Planning gave me insights about handling the difficulity to quantify biodiversity loss. Specially thanks to Tony LaVoi, NOAA Geospatial Information Officer from the NOAA Office of the CIO, and Jay Coady, NOAA Spatial Analyst from the NOAA Office of the CIO. Also, thanks to the Gulf of Mexico Alliance and Environmental Response Management Application® (ERMA) for their data. Legend Water intake $100m per point per year Diving $10m per point per year Camping $10m per point per year Recreational Fishing $14~110m per point per year beach $62~118m per point per year

Environmental Impact Assessment of Petroleum Spill Using GISpenniur.upenn.edu/uploads/media/Website-Poster-Simon-Suo.pdf · Esri, DeLorme, GEBCO, NOAA NGDC, and other contributors,

  • Upload
    hanga

  • View
    215

  • Download
    0

Embed Size (px)

Citation preview

Esri, DeLorme, GEBCO, NOAA NGDC, and other contributors, Sources: Esri, GEBCO, NOAA, NationalGeographic, DeLorme, HERE, Geonames.org, and other contributors

Texas

Florida

Louisiana

AlabamaMississippi

Esri, DeLorme, GEBCO, NOAA NGDC, and other contributors, Sources: Esri, GEBCO, NOAA, National Geographic,DeLorme, HERE, Geonames.org, and other contributors

Texas

Florida

Louisiana

AlabamaMississippi

Esri, DeLorme, GEBCO, NOAA NGDC, and other contributors, Sources: Esri, GEBCO, NOAA,National Geographic, DeLorme, HERE, Geonames.org, and other contributors

Esri, DeLorme, GEBCO, NOAA NGDC, and other contributors, Sources: Esri, GEBCO, NOAA, NationalGeographic, DeLorme, HERE, Geonames.org, and other contributors

TexasFlorida

LouisianaAlabamaMississippi

Esri, DeLorme, GEBCO, NOAA NGDC, andother contributors, Sources: Esri, GEBCO,NOAA, National Geographic, DeLorme,HERE, Geonames.org, and other

Texas

Florida

LouisianaAlabamaMississippi

Esri, DeLorme, GEBCO, NOAA NGDC, andother contributors, Sources: Esri, GEBCO,NOAA, National Geographic, DeLorme,HERE, Geonames.org, and other

Texas

Florida

LouisianaAlabamaMississippi

Esri, DeLorme, GEBCO, NOAA NGDC, andother contributors, Sources: Esri, GEBCO,NOAA, National Geographic, DeLorme,HERE, Geonames.org, and other

Texas

Florida

LouisianaAlabamaMississippi

Esri, DeLorme, GEBCO, NOAA NGDC, andother contributors, Sources: Esri, GEBCO,NOAA, National Geographic, DeLorme,HERE, Geonames.org, and other

Texas

Florida

LouisianaAlabamaMississippi

Esri, DeLorme, GEBCO, NOAA NGDC, andother contributors, Sources: Esri, GEBCO,NOAA, National Geographic, DeLorme,HERE, Geonames.org, and other

Texas

Florida

LouisianaAlabamaMississippi

Esri, DeLorme, GEBCO, NOAA NGDC, andother contributors, Sources: Esri, GEBCO,NOAA, National Geographic, DeLorme,HERE, Geonames.org, and other

Texas

Florida

Alabama

Louisiana

Mississippi

Content may not reflect National Geographic's current map policy. Sources: National Geographic, Esri, DeLorme, HERE, UNEP-WCMC, USGS, NASA, ESA, METI,NRCAN, GEBCO, NOAA, increment P Corp.

Louisiana

Mississippi Alabama

Esri, DeLorme, GEBCO, NOAA NGDC, and othercontributors, Sources: Esri, GEBCO, NOAA, NationalGeographic, DeLorme, HERE, Geonames.org, and othercontributors

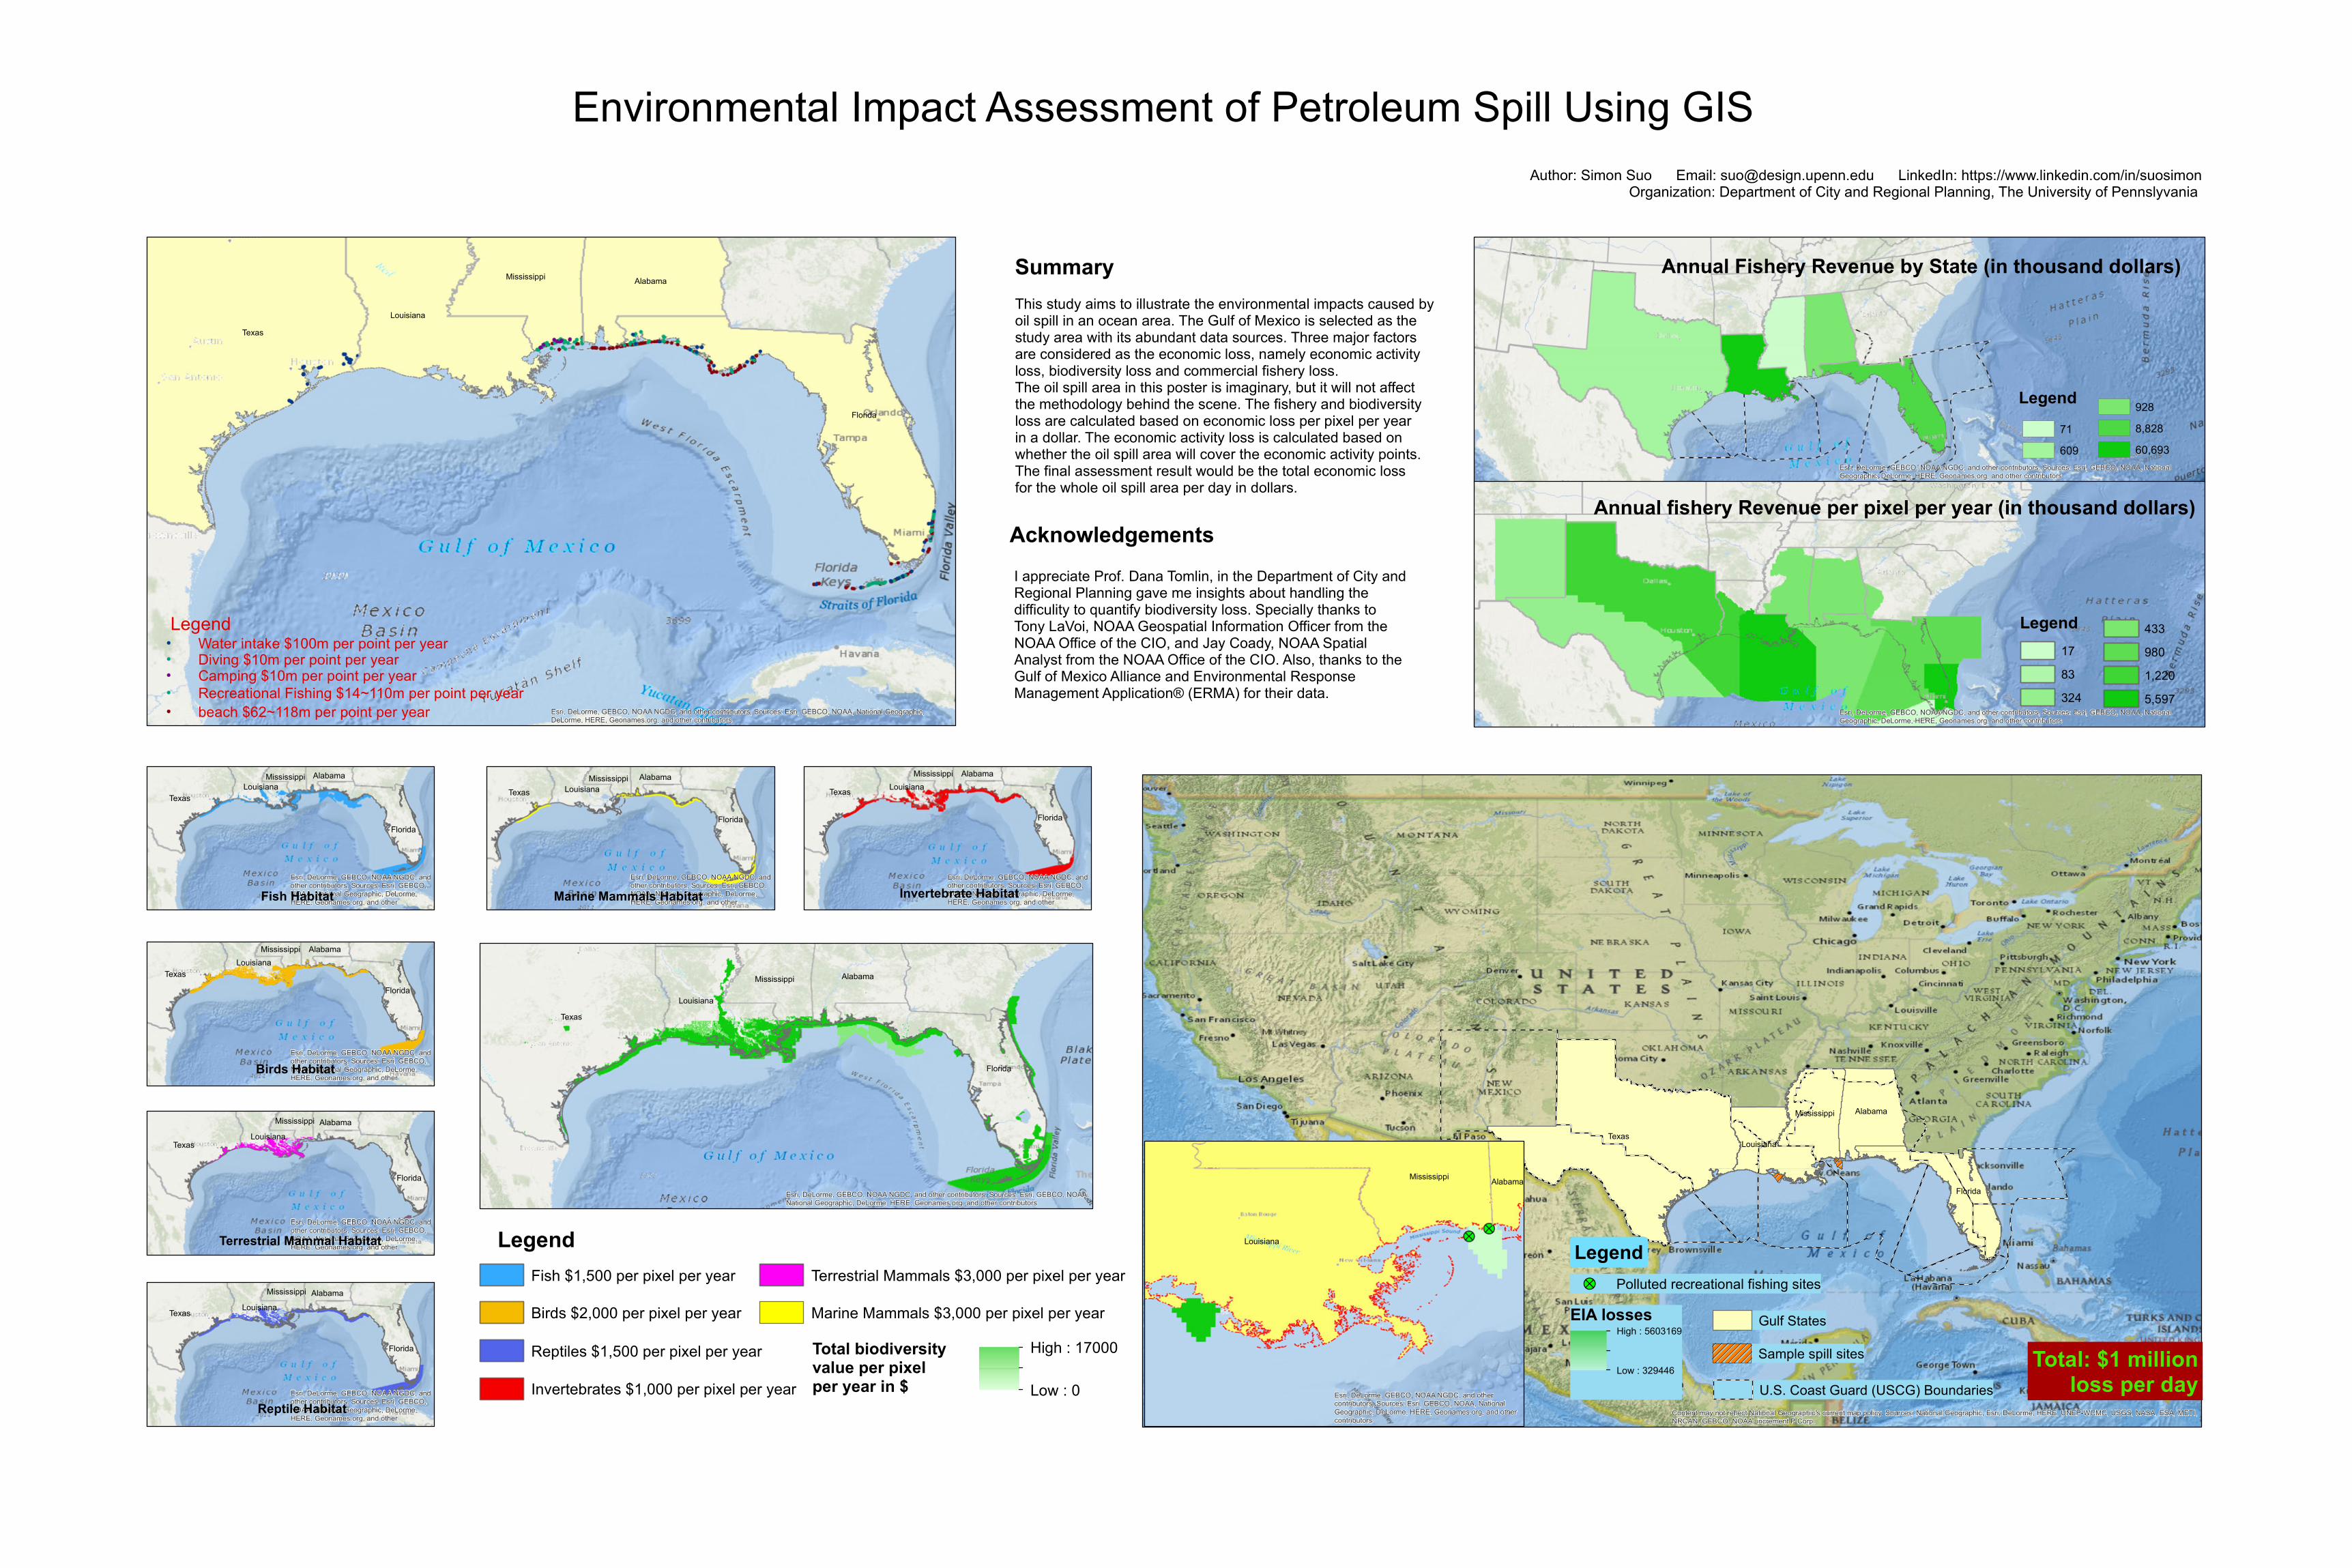
Environmental Impact Assessment of Petroleum Spill Using GISAuthor: Simon Suo Email: [email protected] LinkedIn: https://www.linkedin.com/in/suosimon

Organization: Department of City and Regional Planning, The University of Pennslyvania

Legend

Marine Mammals $3,000 per pixel per yearBirds $2,000 per pixel per year

Terrestrial Mammals $3,000 per pixel per year

Reptiles $1,500 per pixel per year

Invertebrates $1,000 per pixel per year

Fish $1,500 per pixel per year

Total biodiversityvalue per pixel per year in $

High : 17000

Low : 0Total: $1 million

loss per day

Fish Habitat

Birds Habitat

Marine Mammals Habitat Invertebrate Habitat

Terrestrial Mammal Habitat

Reptile Habitat

Legend!? Polluted recreational fishing sites

EIA lossesHigh : 5603169 Low : 329446

Gulf States

Sample spill sites

U.S. Coast Guard (USCG) Boundaries

Annual Fishery Revenue by State (in thousand dollars)

Annual fishery Revenue per pixel per year (in thousand dollars)

Legend71609

9288,82860,693

Legend1783324

4339801,2205,597

SummaryThis study aims to illustrate the environmental impacts caused by oil spill in an ocean area. The Gulf of Mexico is selected as the study area with its abundant data sources. Three major factors are considered as the economic loss, namely economic activity loss, biodiversity loss and commercial fishery loss. The oil spill area in this poster is imaginary, but it will not affect the methodology behind the scene. The fishery and biodiversity loss are calculated based on economic loss per pixel per year in a dollar. The economic activity loss is calculated based on whether the oil spill area will cover the economic activity points. The final assessment result would be the total economic loss for the whole oil spill area per day in dollars.

AcknowledgementsI appreciate Prof. Dana Tomlin, in the Department of City and Regional Planning gave me insights about handling the difficulity to quantify biodiversity loss. Specially thanks to Tony LaVoi, NOAA Geospatial Information Officer from the NOAA Office of the CIO, and Jay Coady, NOAA Spatial Analyst from the NOAA Office of the CIO. Also, thanks to theGulf of Mexico Alliance and Environmental Response Management Application® (ERMA) for their data.

LegendWater intake $100m per point per yearDiving $10m per point per yearCamping $10m per point per yearRecreational Fishing $14~110m per point per yearbeach $62~118m per point per year