Embed Size (px)
Citation preview
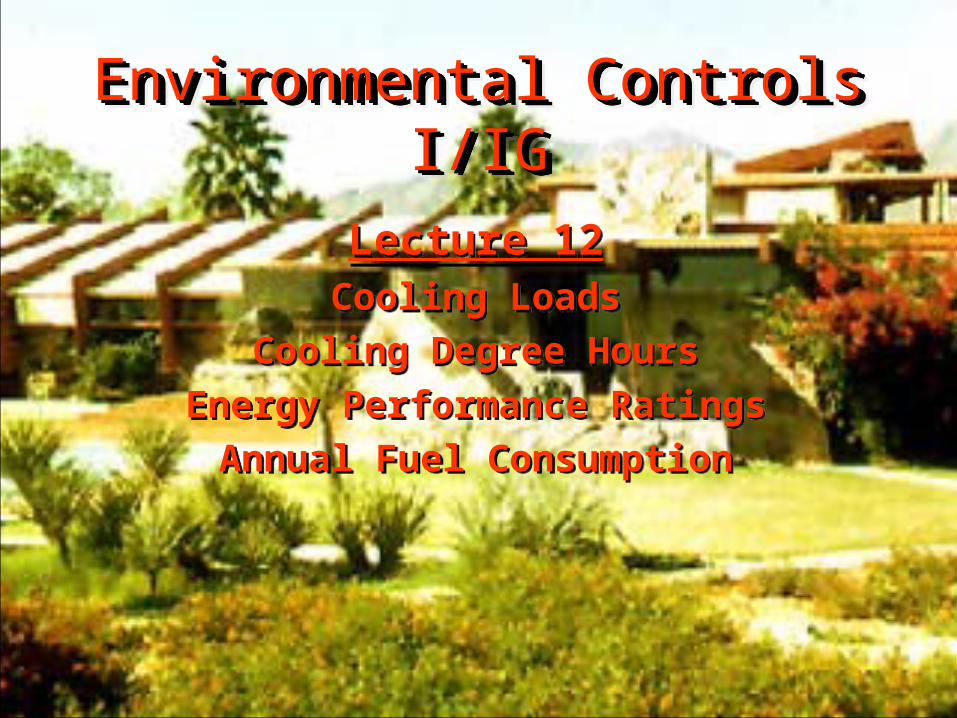
Environmental Controls I/IGEnvironmental Controls I/IGEnvironmental Controls I/IGEnvironmental Controls I/IG
Lecture 12Cooling Loads
Cooling Degree HoursEnergy Performance Ratings
Annual Fuel Consumption
Lecture 12Cooling Loads
Cooling Degree HoursEnergy Performance Ratings
Annual Fuel Consumption
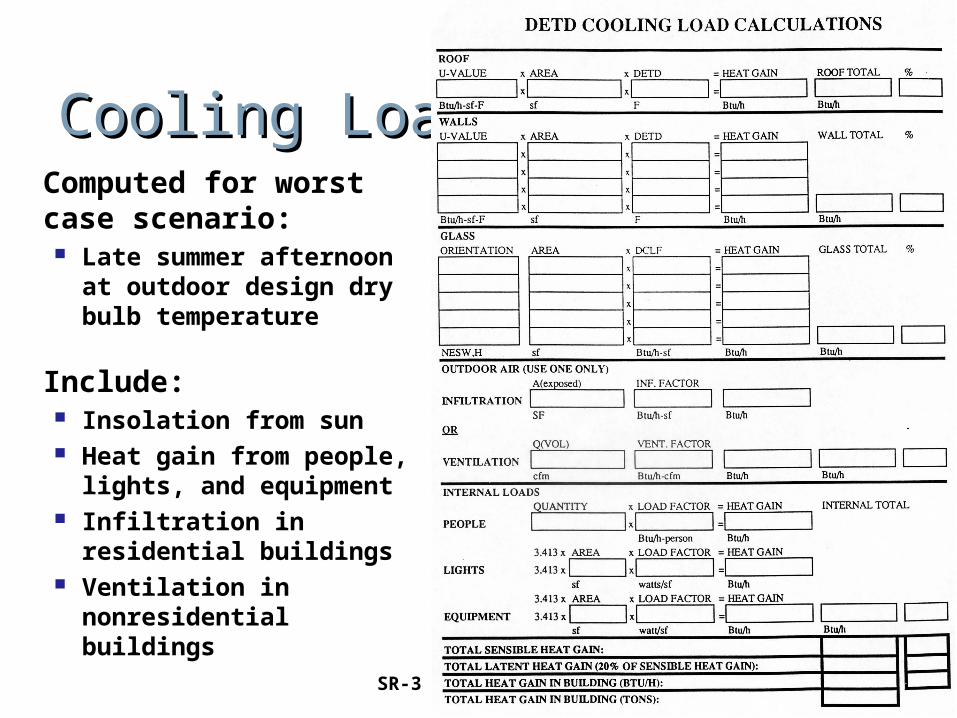
Cooling LoadsCooling LoadsComputed for worst case scenario: Late summer afternoon
at outdoor design dry bulb temperature
Include: Insolation from sun Heat gain from people,
lights, and equipment Infiltration in
residential buildings Ventilation in
nonresidential buildings
SR-3
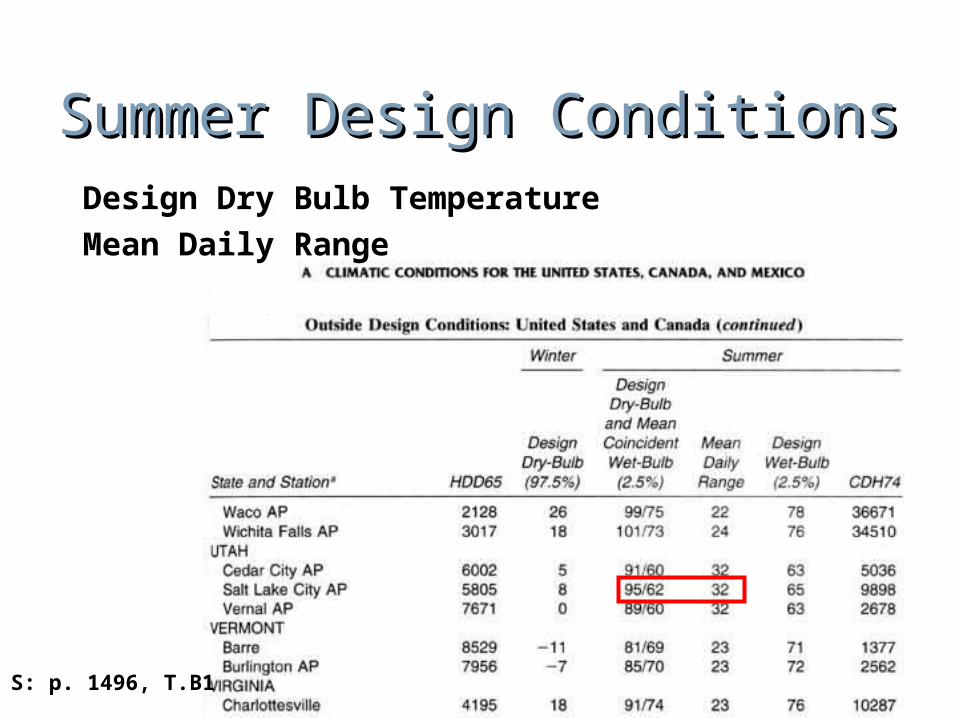
Summer Design ConditionsSummer Design ConditionsDesign Dry Bulb TemperatureMean Daily Range
S: p. 1496, T.B1
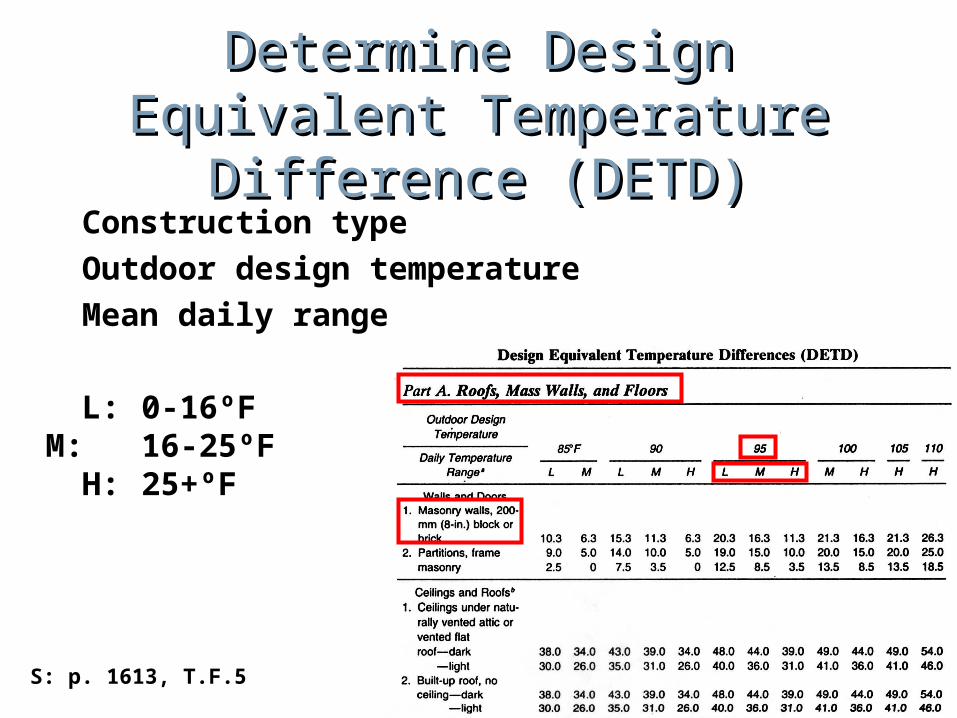
Determine Design Equivalent Determine Design Equivalent Temperature Difference Temperature Difference
(DETD)(DETD)Construction type Outdoor design temperatureMean daily range
L: 0-16ºFM: 16-25ºF
H: 25+ºF
S: p. 1613, T.F.5
Determine Envelope U-Determine Envelope U-valuesvalues
Calculate ΣR and then find U for walls and roofs.
Note: this method ignores floors, doors, and window U-values
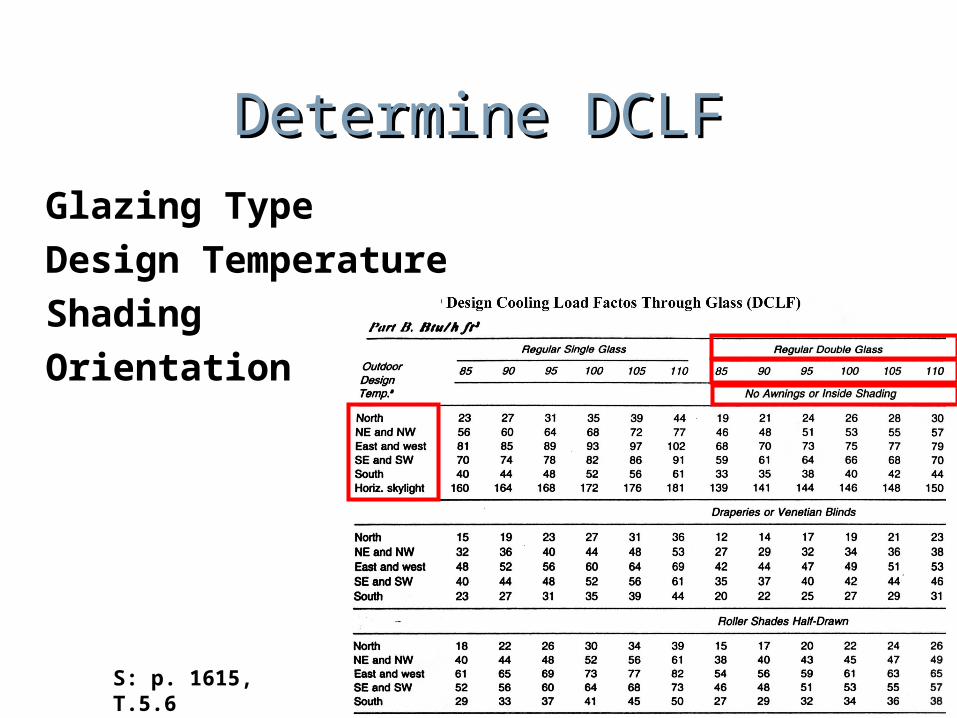
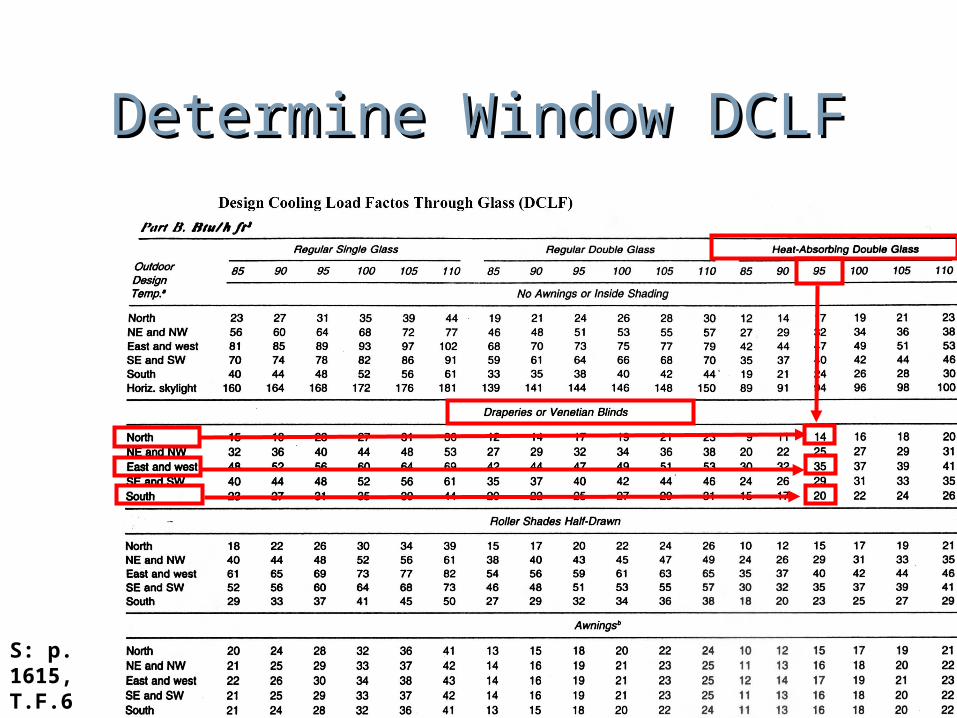
Determine DCLFDetermine DCLFGlazing TypeDesign TemperatureShadingOrientation
S: p. 1615, T.5.6
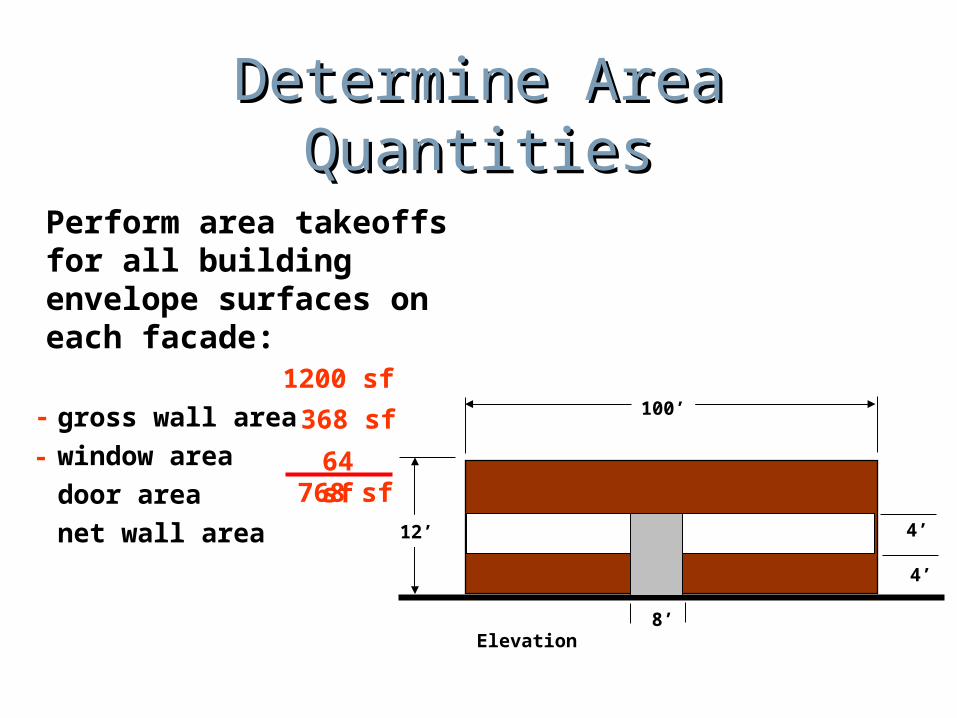
Determine Area QuantitiesDetermine Area Quantities
Perform area takeoffs for all building envelope surfaces on each facade:
gross wall areawindow areadoor areanet wall area
4’
Elevation
4’
12’
100’
8’
1200 sf
64 sf
368 sf
768 sf
-
-
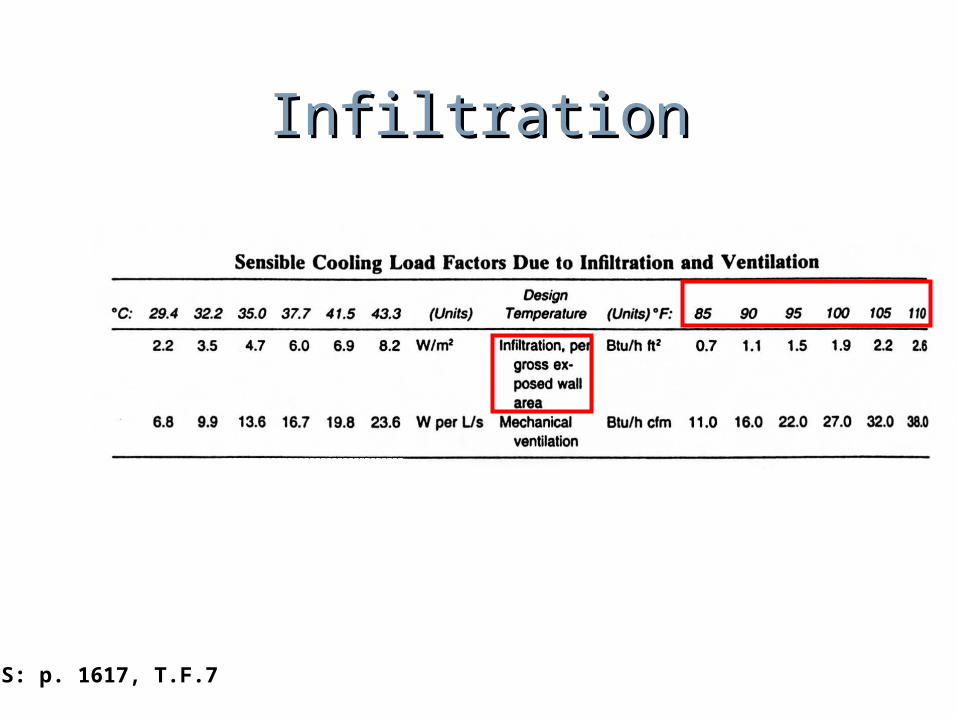
InfiltrationInfiltration
S: p. 1617, T.F.7
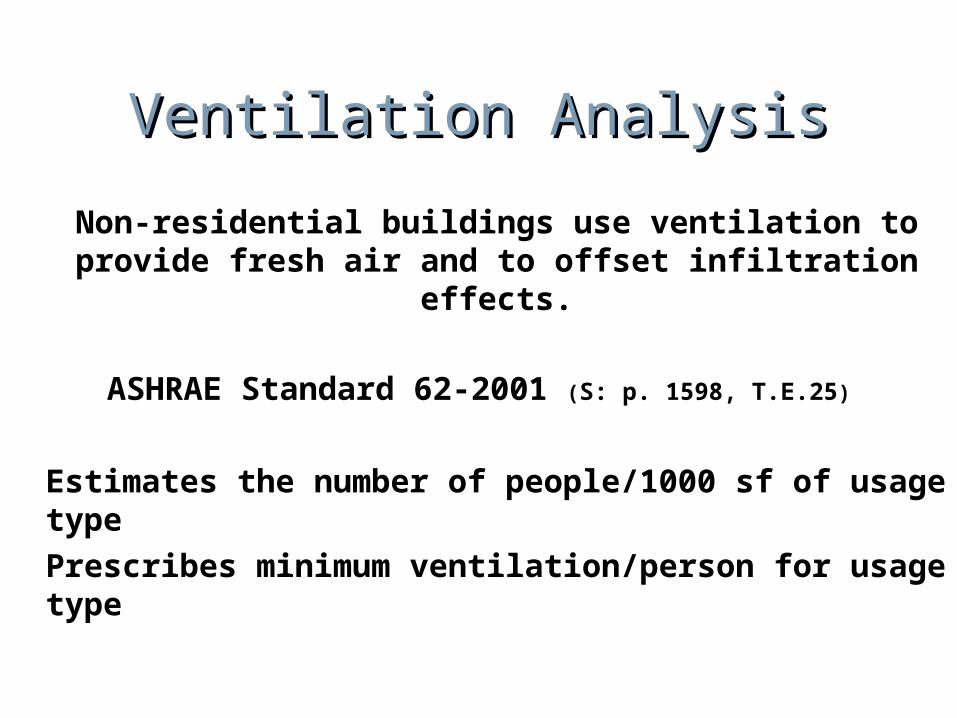
Ventilation AnalysisVentilation Analysis
Non-residential buildings use ventilation to provide fresh air and to offset infiltration effects.
ASHRAE Standard 62-2001 (S: p. 1598, T.E.25)
Estimates the number of people/1000 sf of usage typePrescribes minimum ventilation/person for usage type
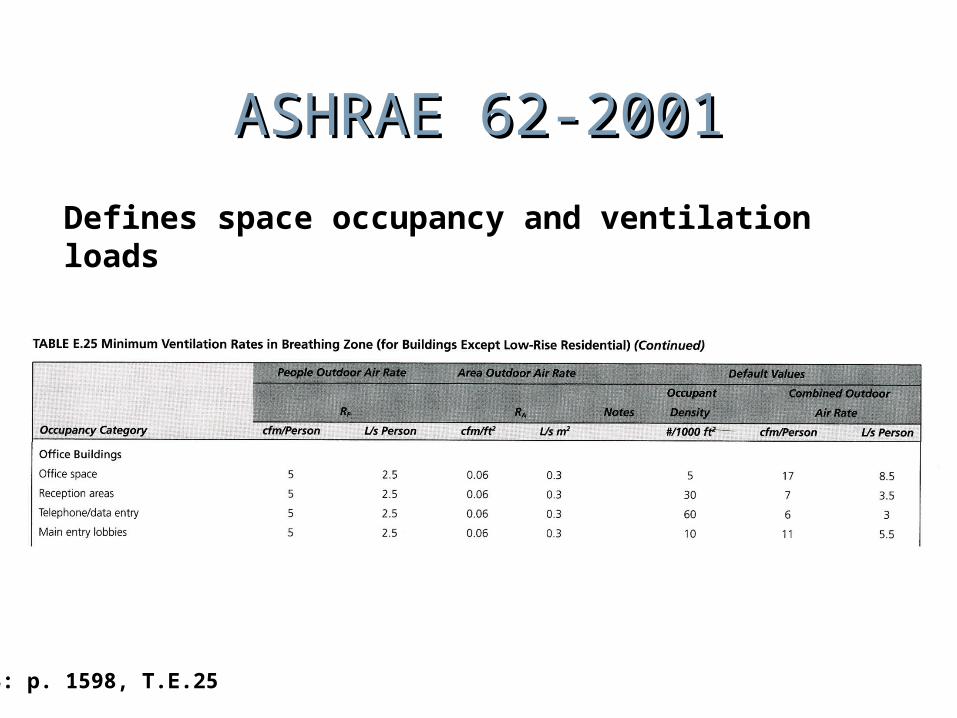
ASHRAE 62-2001ASHRAE 62-2001
Defines space occupancy and ventilation loads
S: p. 1598, T.E.25
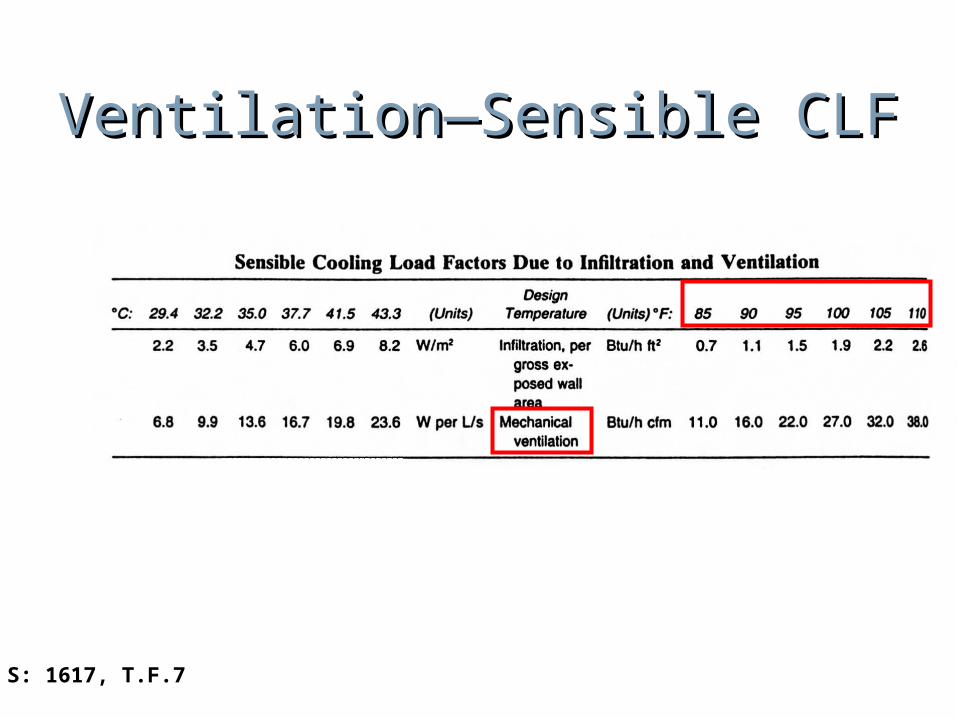
Ventilation—Sensible CLFVentilation—Sensible CLF
S: 1617, T.F.7
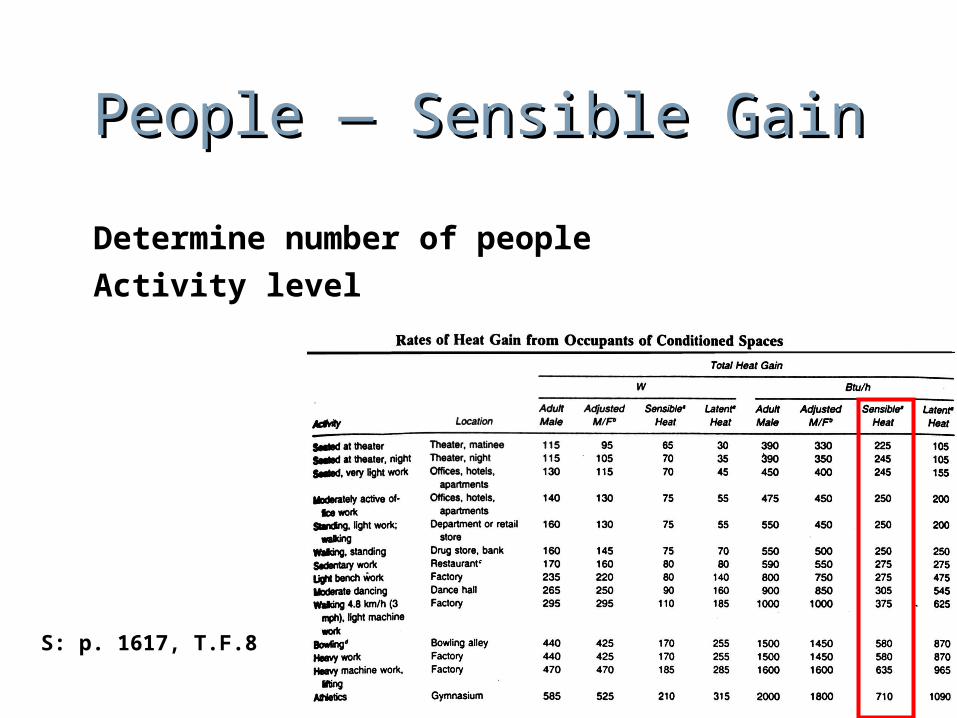
People — Sensible GainPeople — Sensible Gain
Determine number of people
Activity level
S: p. 1617, T.F.8
LightsLights
Determine wattage of lighting/square foot
ASHRAE 90.1 prescriptive levels Count fixture loads and add together
Note: add 15% for ballasts where applicable (e.g., fluorescent lights)
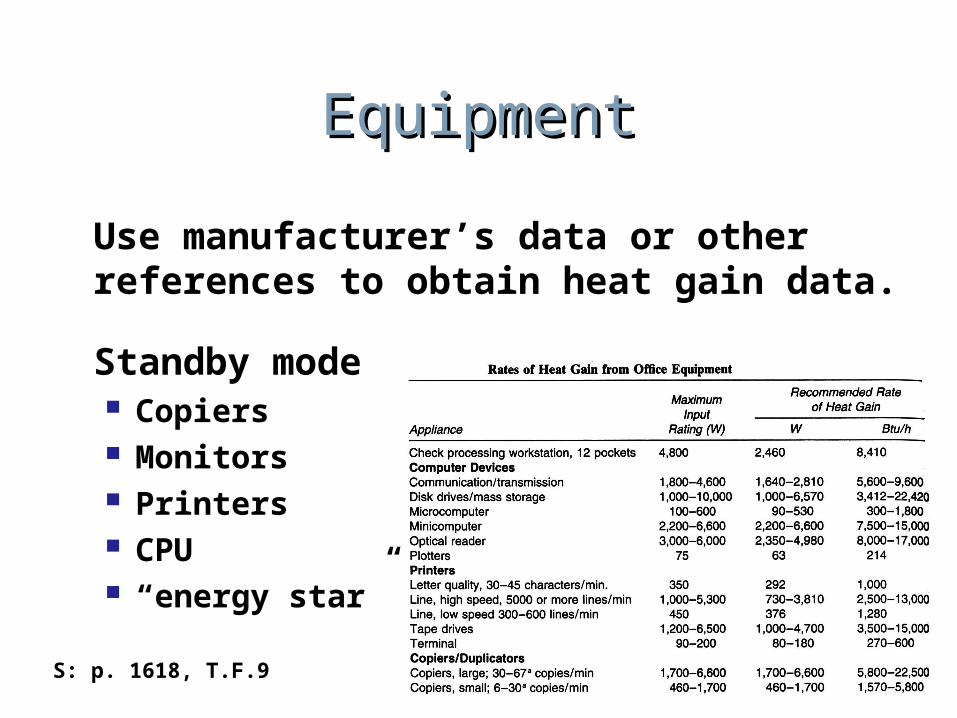
EquipmentEquipment
Determine operating wattage of equipment/square foot
ASHRAE 90.1 prescriptive levels Count actual loads and add together
Note: include a diversity factor (20-30%) if specific usage patterns are unknown.
EquipmentEquipment
Use manufacturer’s data or other references to obtain heat gain data.
Standby mode Copiers Monitors Printers CPU “energy star”
S: p. 1618, T.F.9
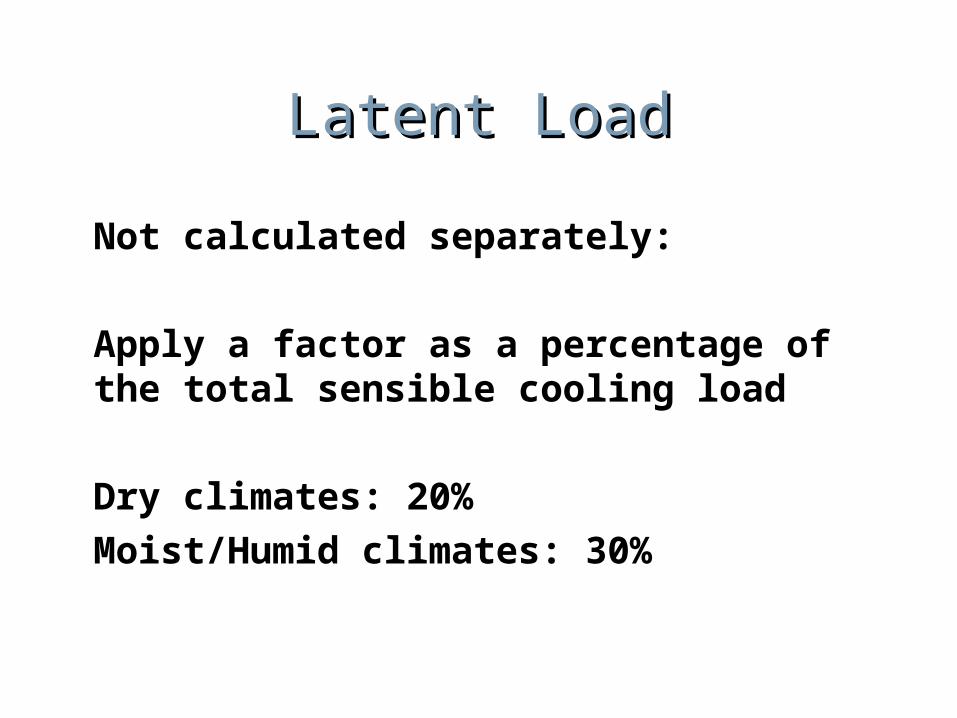
Latent LoadLatent Load
Not calculated separately:
Apply a factor as a percentage of the total sensible cooling load
Dry climates: 20%Moist/Humid climates: 30%
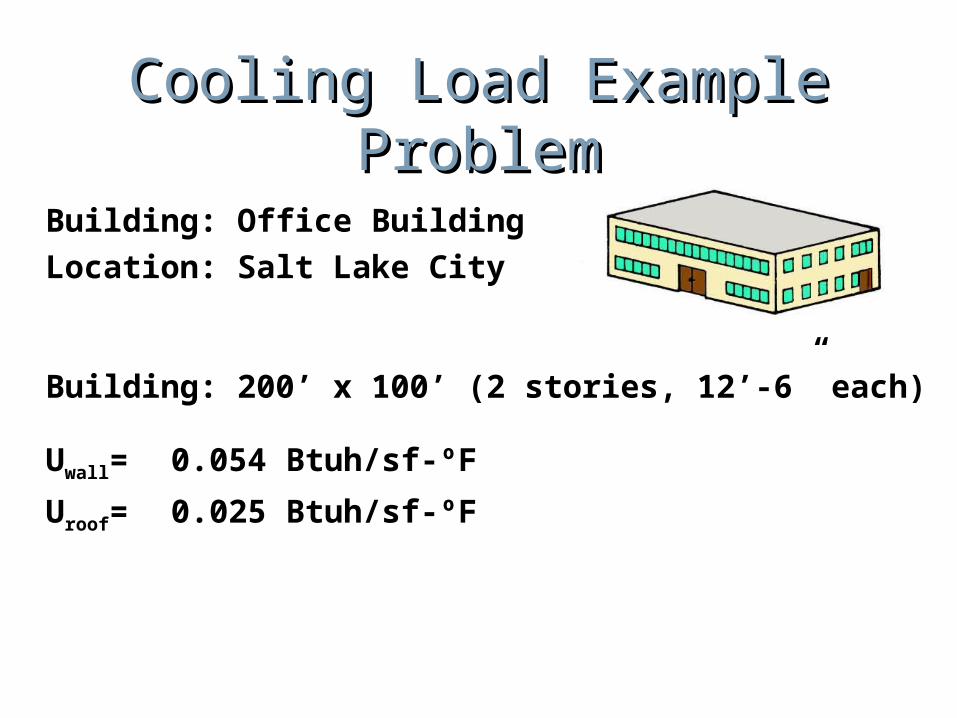
Cooling Load Example Cooling Load Example ProblemProblem
Building: Office BuildingLocation: Salt Lake City
Building: 200’ x 100’ (2 stories, 12’-6” each)
Uwall= 0.054 Btuh/sf-ºF
Uroof= 0.025 Btuh/sf-ºF
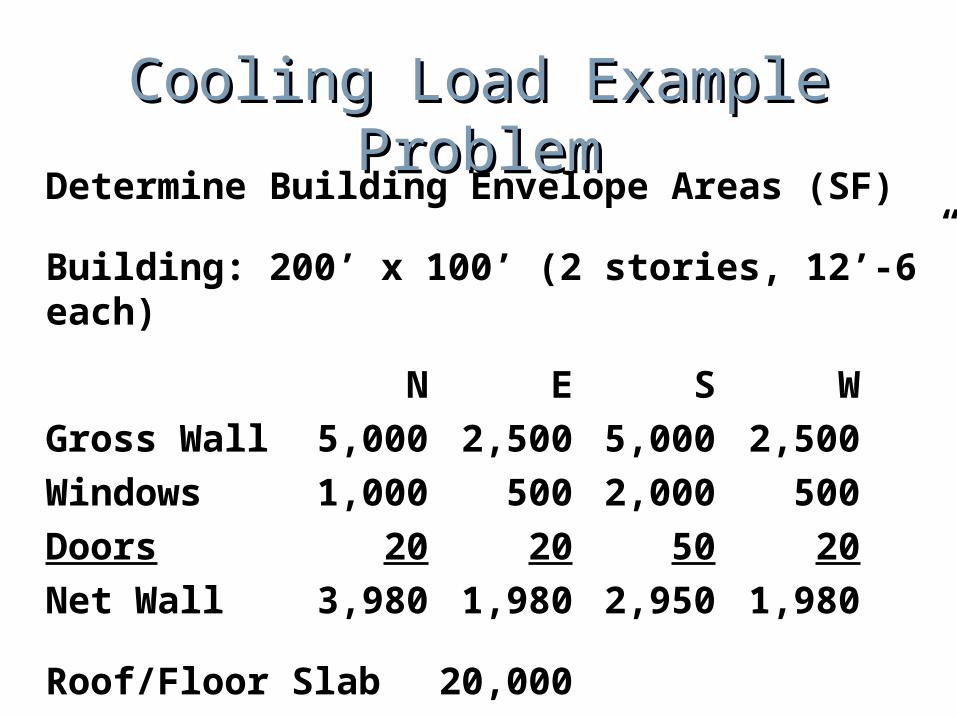
Cooling Load Example Cooling Load Example ProblemProblem
Determine Building Envelope Areas (SF)
Building: 200’ x 100’ (2 stories, 12’-6” each)
N E S WGross Wall 5,000 2,500 5,000 2,500Windows 1,000 500 2,000 500Doors 20 20 50 20Net Wall 3,980 1,980 2,950 1,980
Roof/Floor Slab 20,000
Determine Design Equivalent Determine Design Equivalent Temperature Difference Temperature Difference
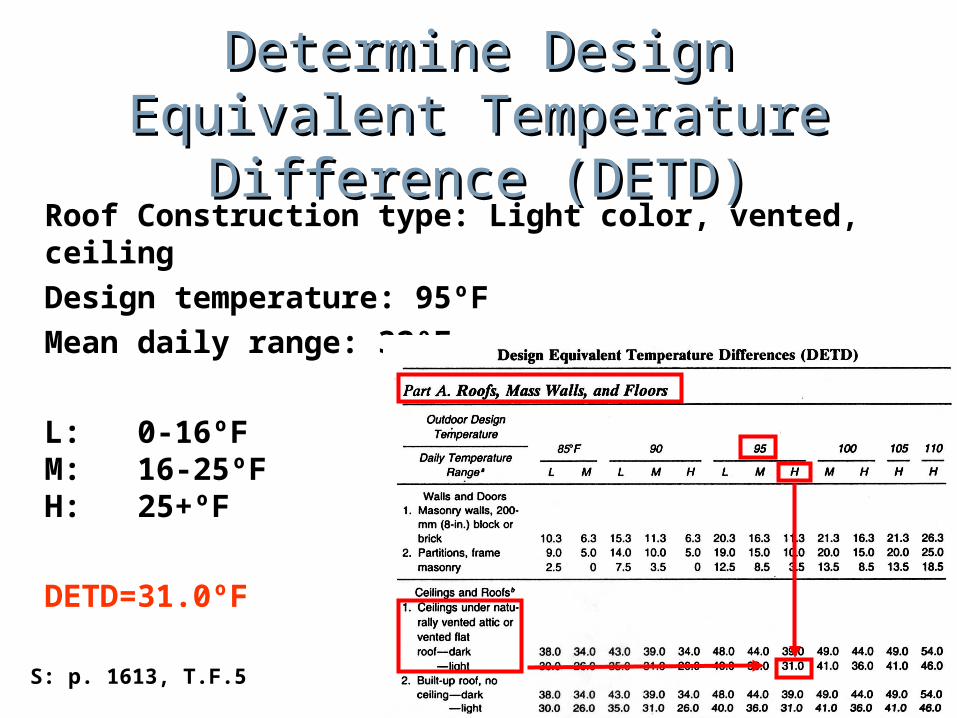
(DETD)(DETD)Roof Construction type: Light color, vented,
ceilingDesign temperature: 95ºFMean daily range: 32ºF
L: 0-16ºFM: 16-25ºF
H: 25+ºF
DETD=31.0ºF
S: p. 1613, T.F.5
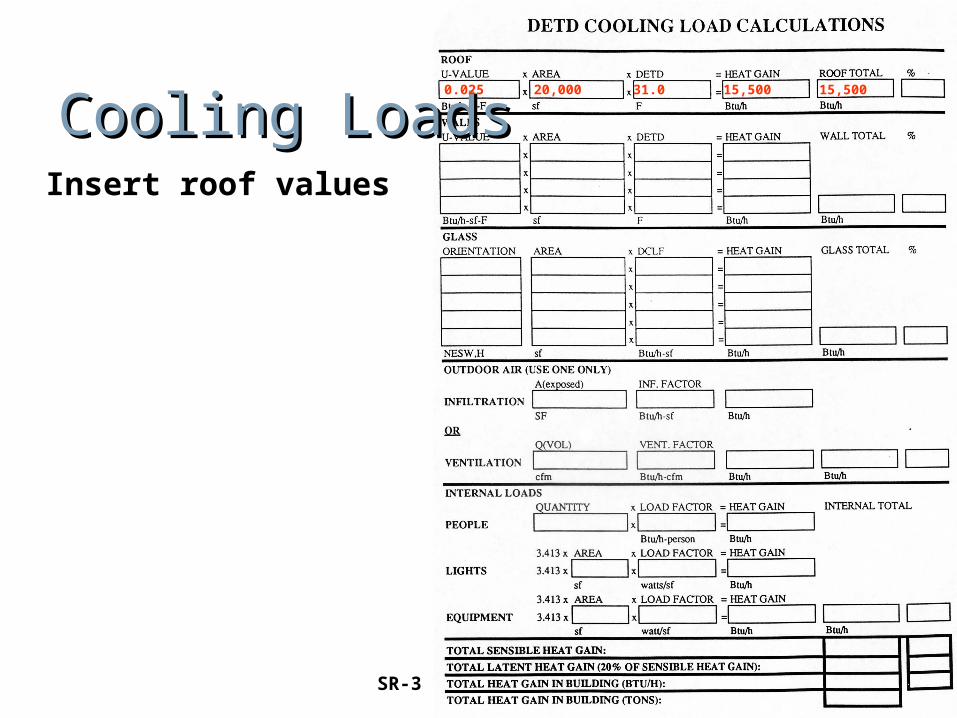
Cooling LoadsCooling LoadsInsert roof values
SR-3
0.025 20,000 31.0 15,500 15,500
Determine Design Equivalent Determine Design Equivalent Temperature Difference Temperature Difference
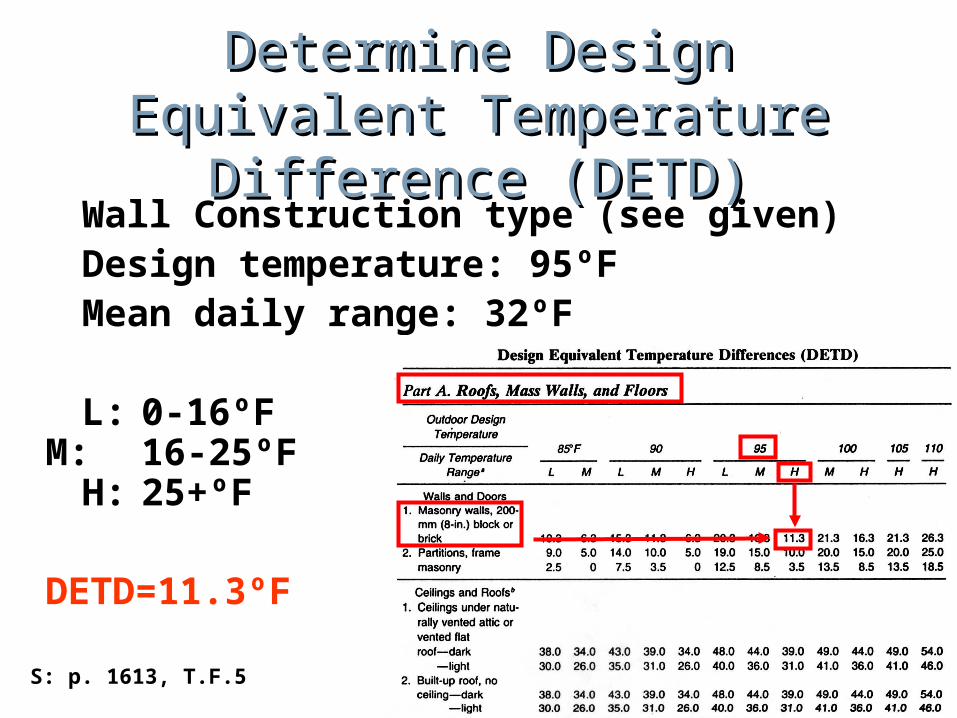
(DETD)(DETD)Wall Construction type (see given) Design temperature: 95ºFMean daily range: 32ºF
L: 0-16ºFM: 16-25ºF
H: 25+ºF
DETD=11.3ºF
S: p. 1613, T.F.5
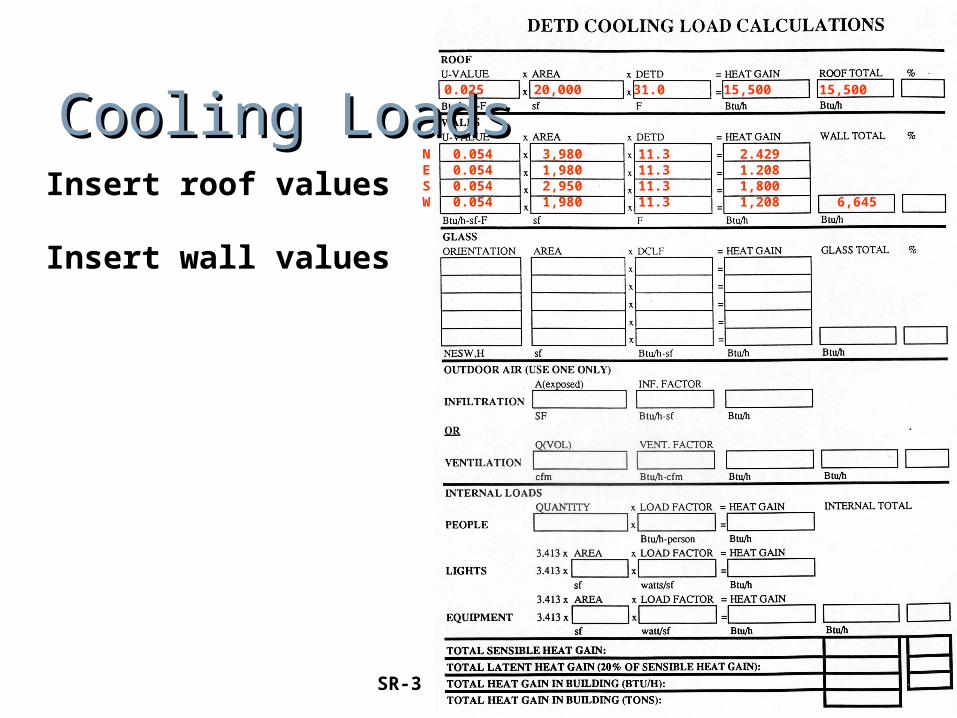
Cooling LoadsCooling LoadsInsert roof values
Insert wall values
SR-3
0.025 20,000 31.0 15,500 15,500
N 0.054 3,980 11.3 2.429E 0.054 1,980 11.3 1.208S 0.054 2,950 11.3 1,800W 0.054 1,980 11.3 1,208 6,645
Glazing TypeDesign TemperatureShadingOrientation
Determine Window DCLFDetermine Window DCLF
S: p. 1615, T.F.6
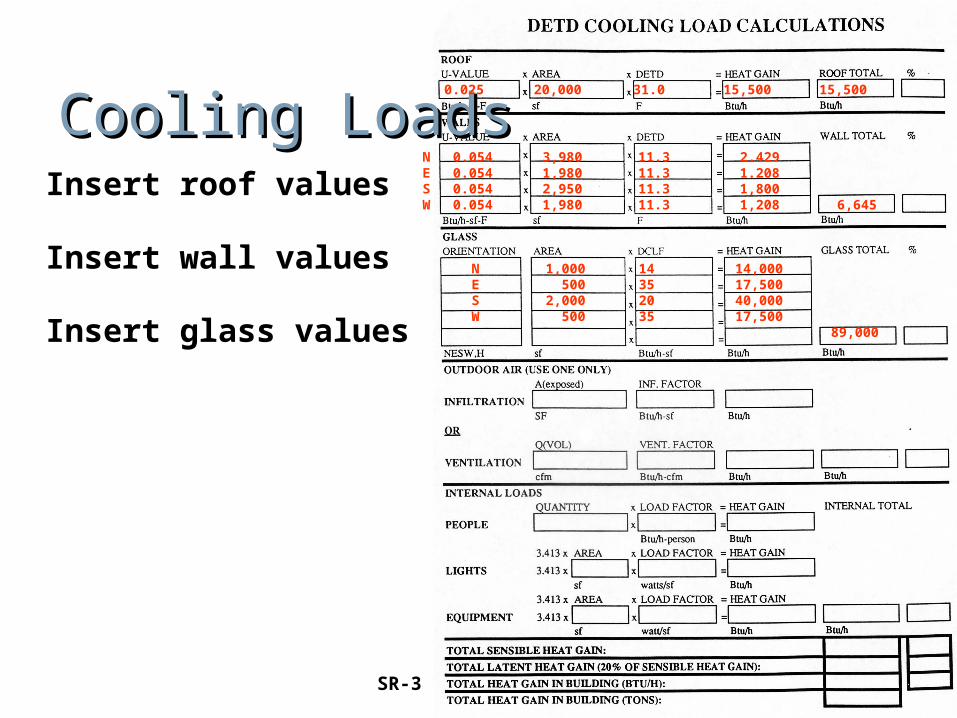
Cooling LoadsCooling LoadsInsert roof values
Insert wall values
Insert glass values
SR-3
0.025 20,000 31.0 15,500 15,500
N 0.054 3,980 11.3 2.429E 0.054 1,980 11.3 1.208S 0.054 2,950 11.3 1,800W 0.054 1,980 11.3 1,208 6,645
N 1,000 14 14,000E 500 35 17,500S 2,000 20 40,000W 500 35 17,500
89,000
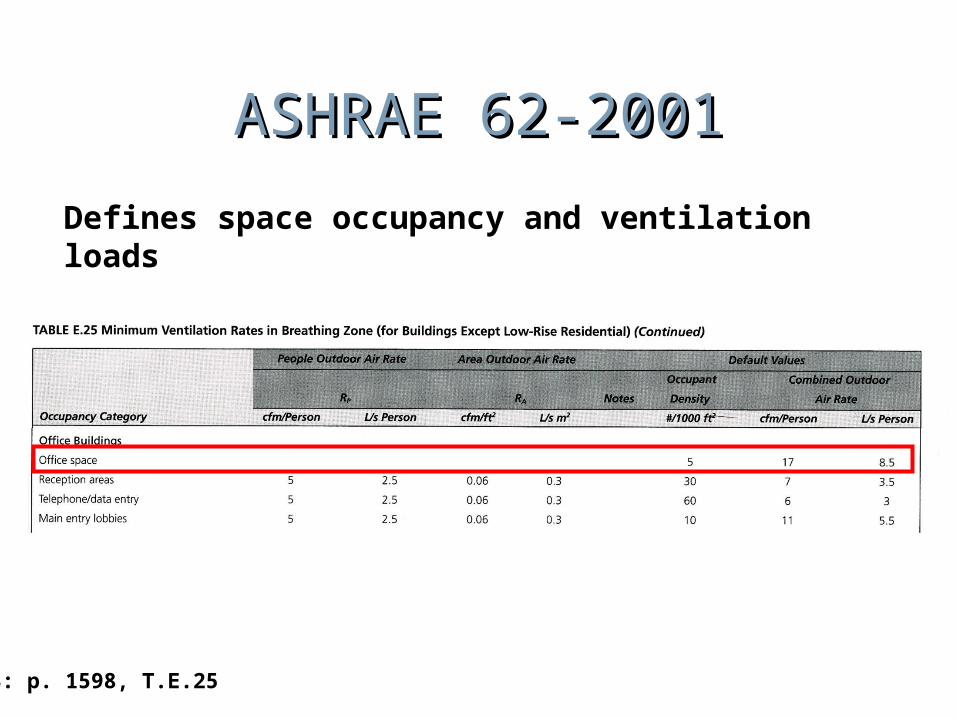
ASHRAE 62-2001ASHRAE 62-2001
Defines space occupancy and ventilation loads
S: p. 1598, T.E.25
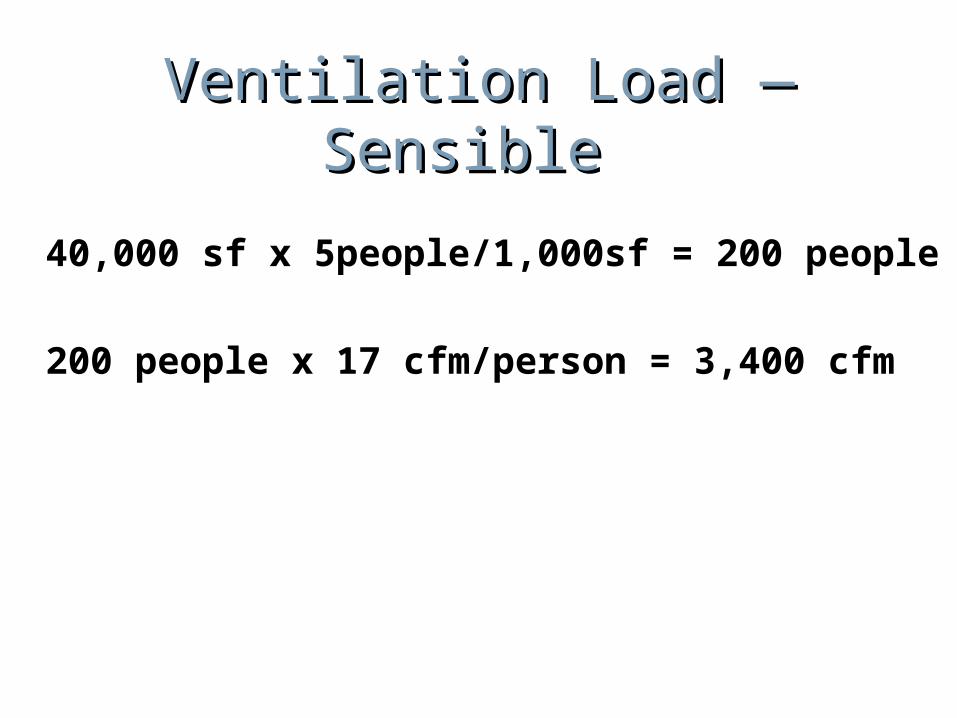
Ventilation Load — Sensible Ventilation Load — Sensible
40,000 sf x 5people/1,000sf = 200 people
200 people x 17 cfm/person = 3,400 cfm
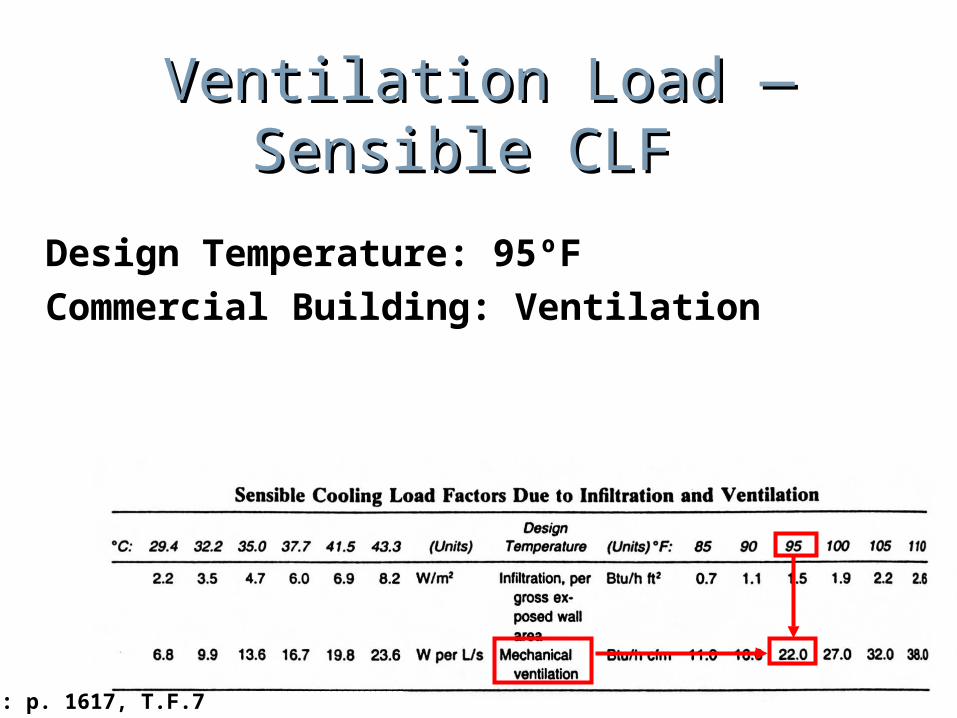
Ventilation Load — Sensible Ventilation Load — Sensible CLF CLF
Design Temperature: 95ºFCommercial Building: Ventilation
S: p. 1617, T.F.7
Cooling LoadsCooling LoadsInsert roof values
Insert wall values
Insert glass values
Insert outdoor air values
SR-3
0.025 20,000 31.0 15,500 15,500
N 0.054 3,980 11.3 2.429E 0.054 1,980 11.3 1.208S 0.054 2,950 11.3 1,800W 0.054 1,980 11.3 1,208 6,645
N 1,000 14 14,000E 500 35 17,500S 2,000 20 40,000W 500 35 17,500
89,000
N/A N/A N/A
3,400 22.0 74,800 74,800
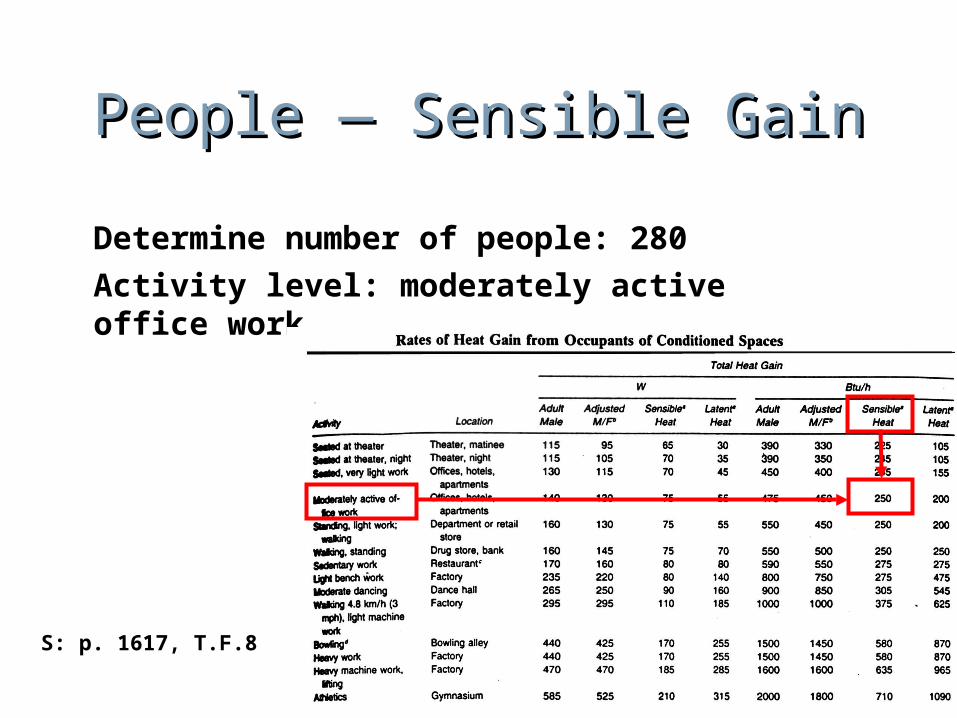
People — Sensible GainPeople — Sensible Gain
Determine number of people: 280
Activity level: moderately active office work
S: p. 1617, T.F.8
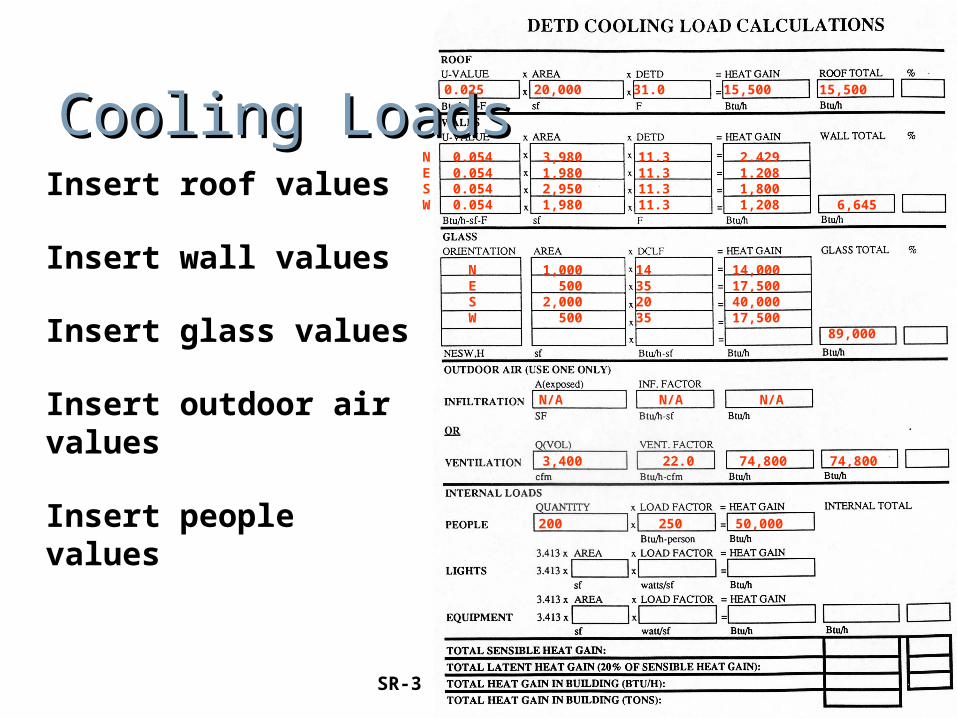
Cooling LoadsCooling LoadsInsert roof values
Insert wall values
Insert glass values
Insert outdoor air values
Insert people values
SR-3
0.025 20,000 31.0 15,500 15,500
N 0.054 3,980 11.3 2.429E 0.054 1,980 11.3 1.208S 0.054 2,950 11.3 1,800W 0.054 1,980 11.3 1,208 6,645
N 1,000 14 14,000E 500 35 17,500S 2,000 20 40,000W 500 35 17,500
89,000
N/A N/A N/A
3,400 22.0 74,800 74,800
200 250 50,000
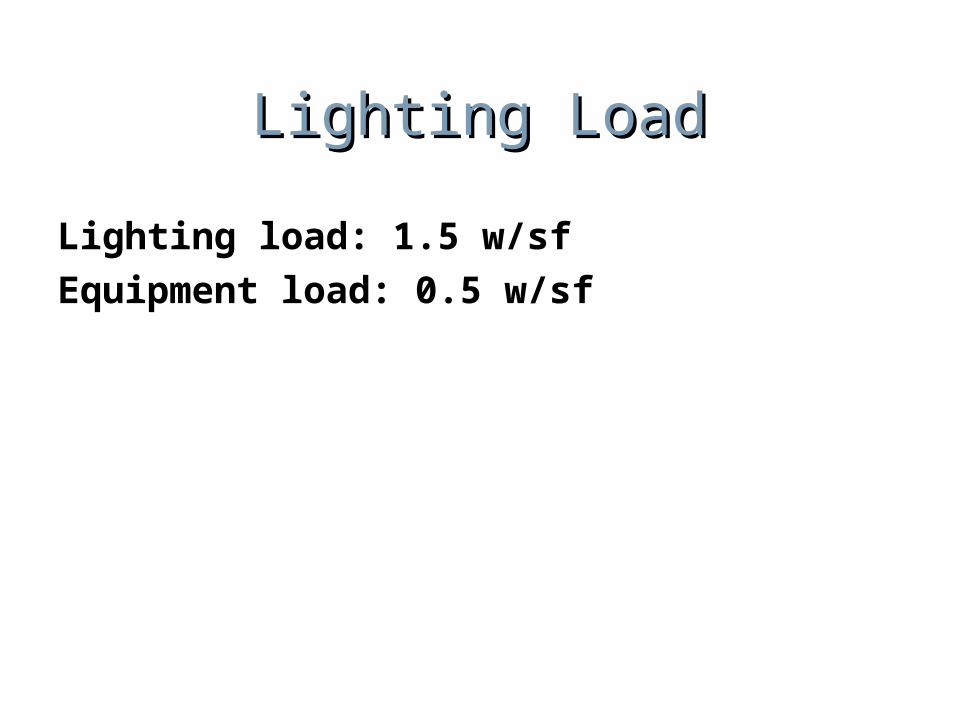
Lighting LoadLighting Load
Lighting load: 1.5 w/sfEquipment load: 0.5 w/sf
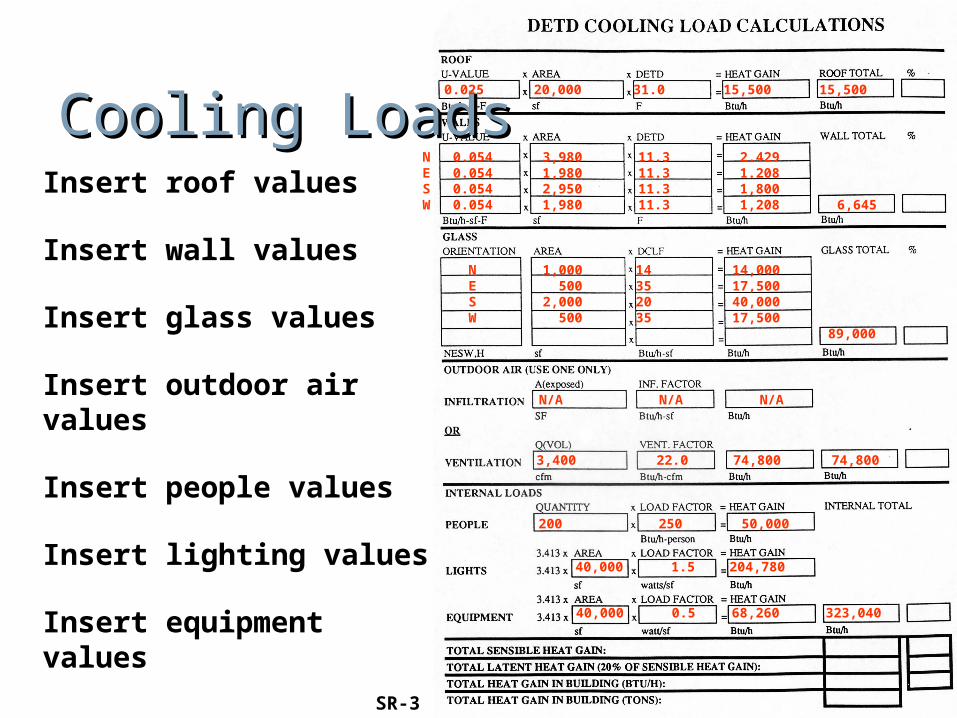
Cooling LoadsCooling LoadsInsert roof values
Insert wall values
Insert glass values
Insert outdoor air values
Insert people values
Insert lighting values
Insert equipment values SR-3
0.025 20,000 31.0 15,500 15,500
N 0.054 3,980 11.3 2.429E 0.054 1,980 11.3 1.208S 0.054 2,950 11.3 1,800W 0.054 1,980 11.3 1,208 6,645
N 1,000 14 14,000E 500 35 17,500S 2,000 20 40,000W 500 35 17,500
89,000
N/A N/A N/A
3,400 22.0 74,800 74,800
200 250 50,000
40,000 1.5 204,780
40,000 0.5 68,260 323,040
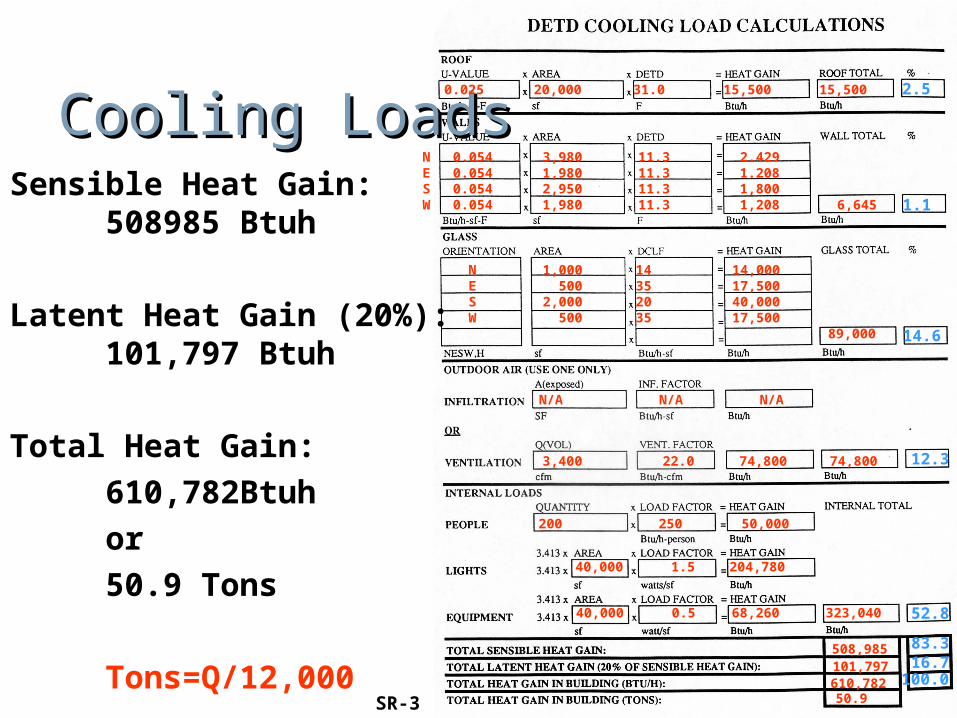
Cooling LoadsCooling LoadsSensible Heat Gain: 508985 Btuh
Latent Heat Gain (20%): 101,797 Btuh
Total Heat Gain:610,782Btuhor50.9 Tons
Tons=Q/12,000SR-3
0.025 20,000 31.0 15,500 15,500
N 0.054 3,980 11.3 2.429E 0.054 1,980 11.3 1.208S 0.054 2,950 11.3 1,800W 0.054 1,980 11.3 1,208 6,645
N 1,000 14 14,000E 500 35 17,500S 2,000 20 40,000W 500 35 17,500
89,000
N/A N/A N/A
3,400 22.0 74,800 74,800
200 250 50,000
40,000 1.5 204,780
40,000 0.5 68,260 323,040
508,985101,797610,78250.9
2.5
1.1
14.6
16.783.3
52.8
12.3
100.0

Cooling Degree HoursCooling Degree HoursCooling Degree HoursCooling Degree Hours
Cooling Degree HoursCooling Degree Hours
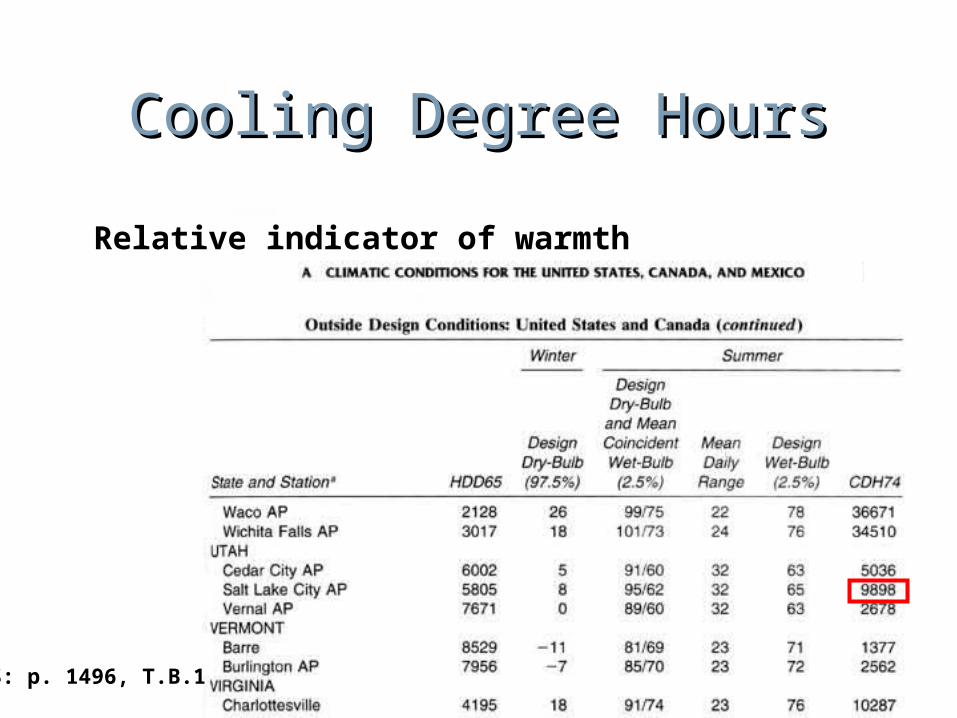
Relative indicator of warmth
S: p. 1496, T.B.1
Cooling Degree HoursCooling Degree Hours
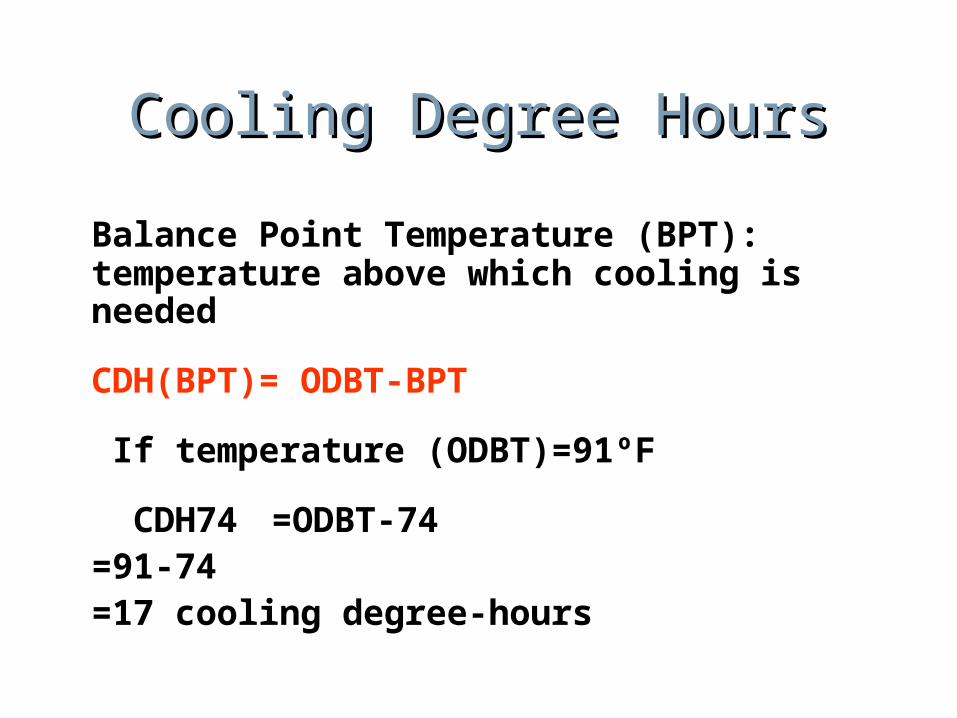
Balance Point Temperature (BPT): temperature above which cooling is needed
CDH(BPT)= ODBT-BPT
If temperature (ODBT)=91ºF
CDH74 =ODBT-74=91-74=17 cooling degree-hours
Energy Performance RatingsEnergy Performance RatingsEnergy Performance RatingsEnergy Performance Ratings
Performance RatingsPerformance Ratings
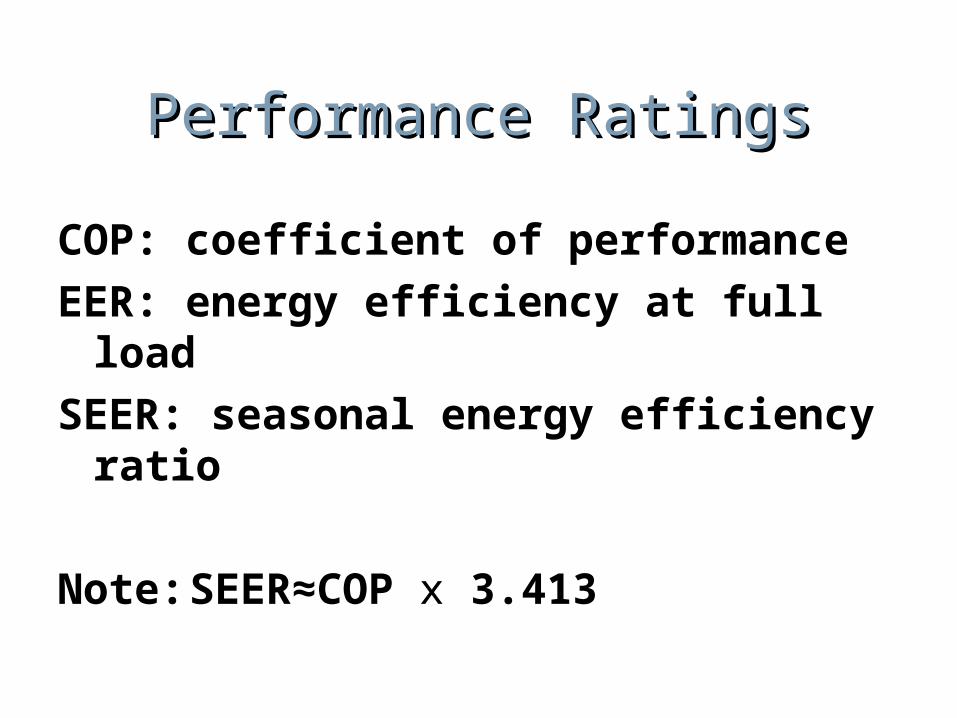
COP: coefficient of performanceEER: energy efficiency at full loadSEER: seasonal energy efficiency
ratio
Note:SEER≈COP x 3.413
Annual Fuel ConsumptionAnnual Fuel ConsumptionAnnual Fuel ConsumptionAnnual Fuel Consumption
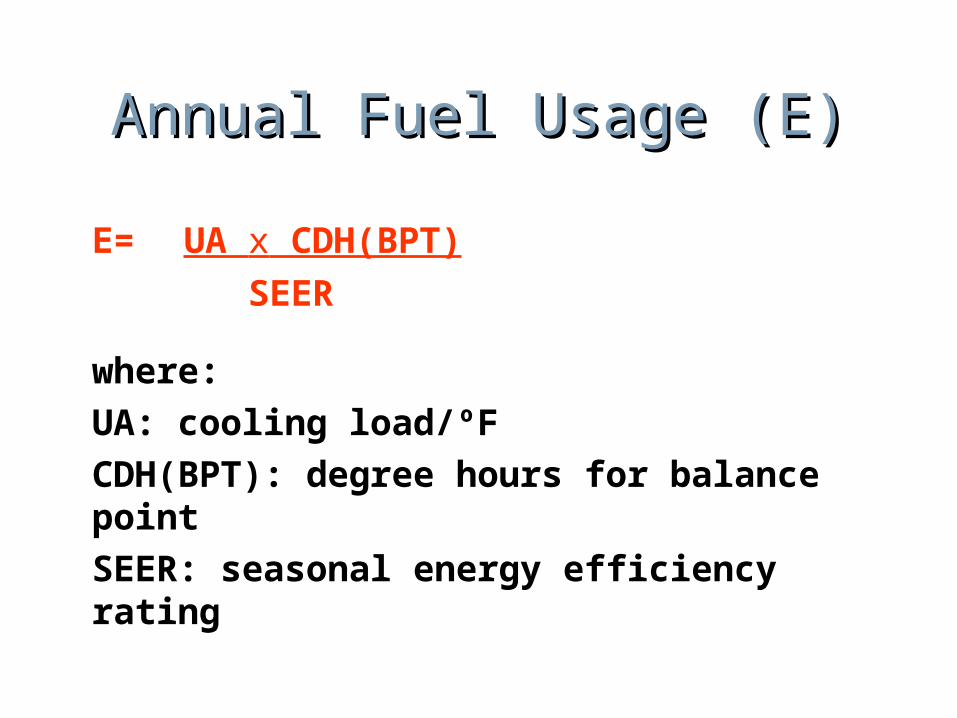
Annual Fuel Usage (E)Annual Fuel Usage (E)
E= UA x CDH(BPT)
SEER
where:UA: cooling load/ºFCDH(BPT): degree hours for balance pointSEER: seasonal energy efficiency rating
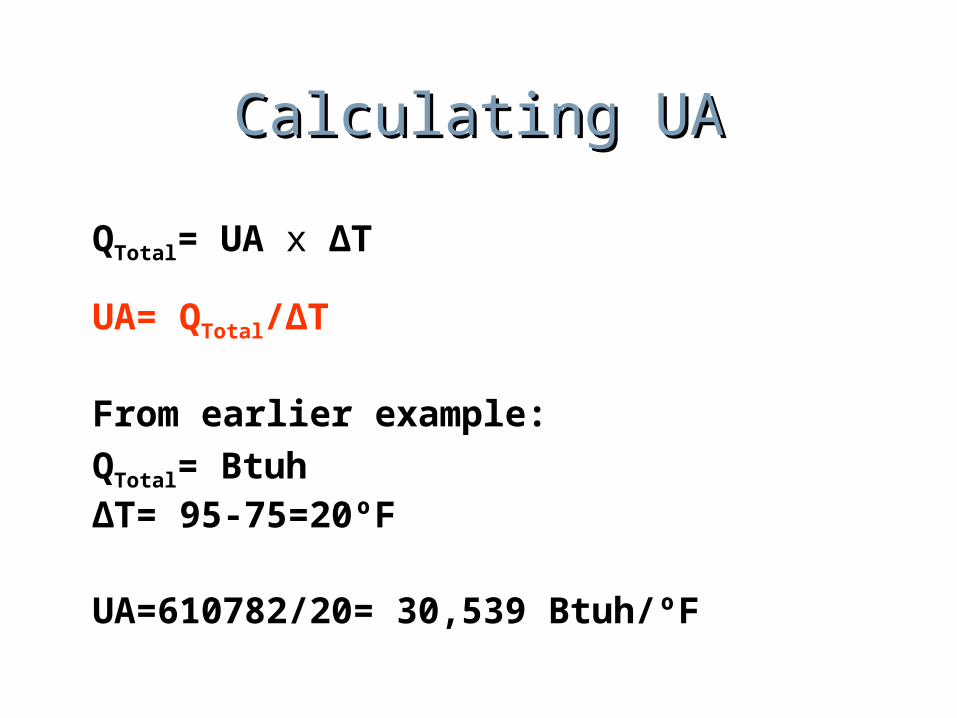
Calculating UACalculating UA
QTotal= UA x ΔT
UA= QTotal/ΔT
From earlier example:QTotal= Btuh ΔT= 95-75=20ºF
UA=610782/20= 30,539 Btuh/ºF
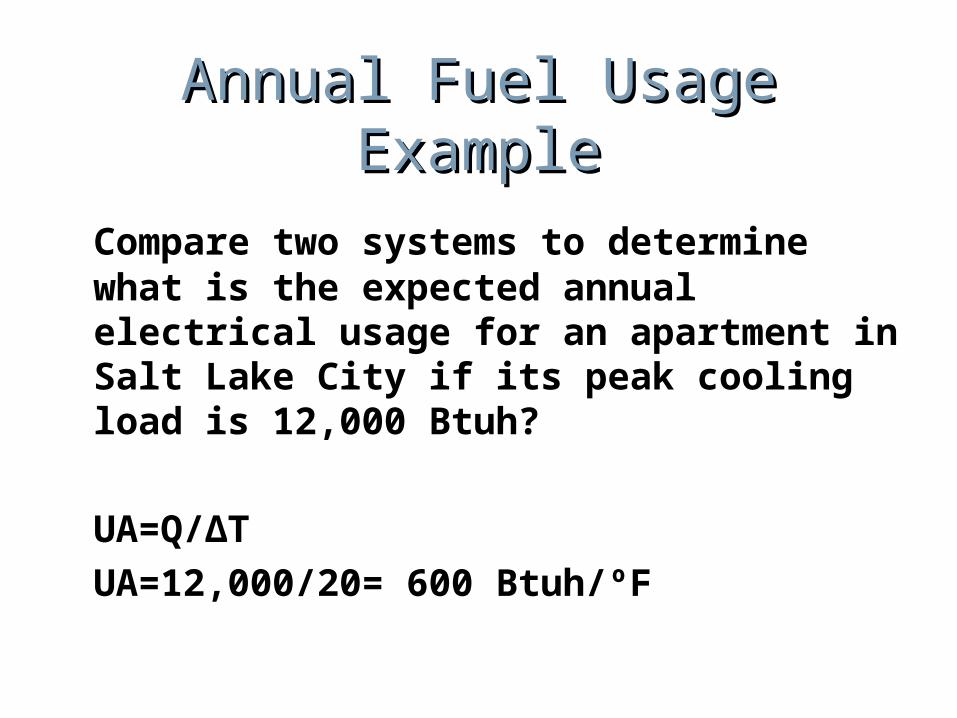
Annual Fuel Usage ExampleAnnual Fuel Usage Example
Compare two systems to determine what is the expected annual electrical usage for an apartment in Salt Lake City if its peak cooling load is 12,000 Btuh?
UA=Q/ΔTUA=12,000/20= 600 Btuh/ºF
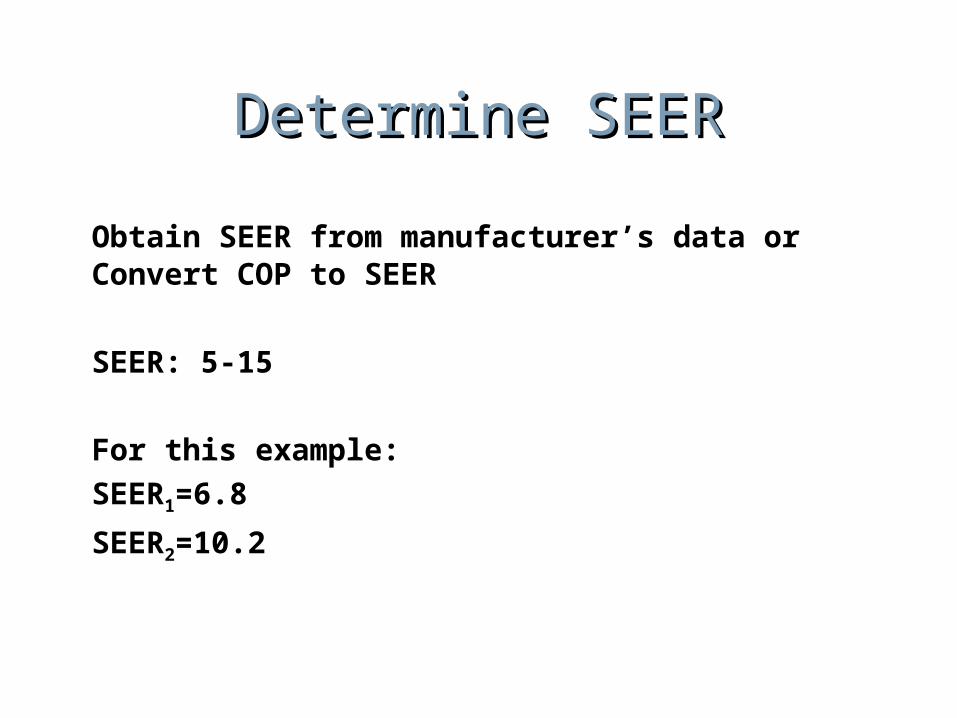
Determine SEERDetermine SEER
Obtain SEER from manufacturer’s data or Convert COP to SEER
SEER: 5-15
For this example:SEER1=6.8
SEER2=10.2
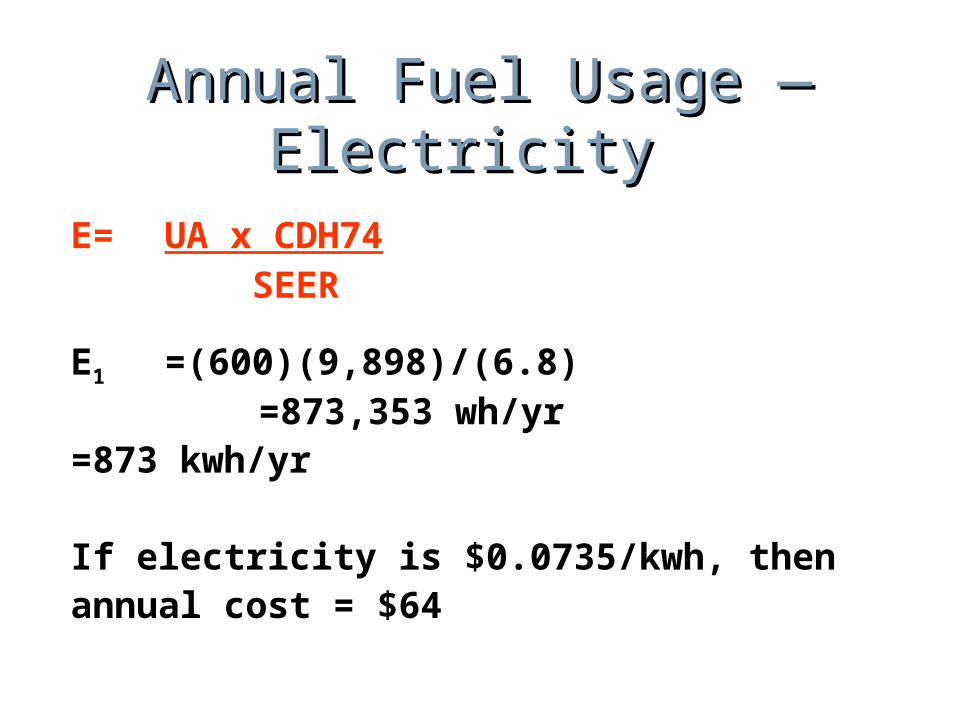
Annual Fuel Usage — Annual Fuel Usage — Electricity Electricity
E= UA x CDH74 SEER
E1 =(600)(9,898)/(6.8) =873,353 wh/yr
=873 kwh/yr
If electricity is $0.0735/kwh, thenannual cost = $64
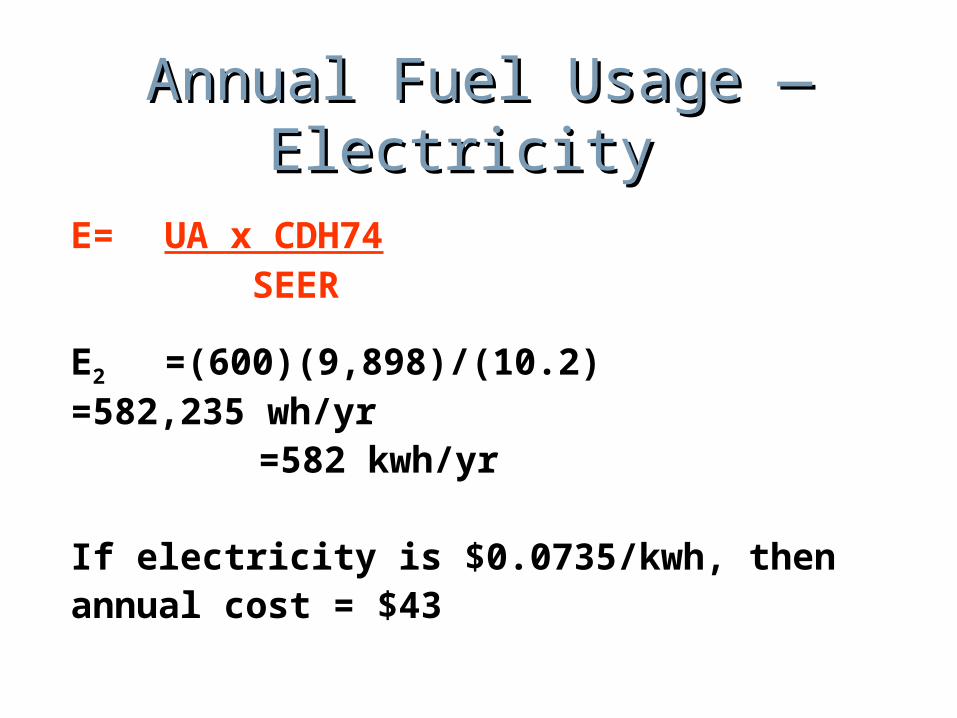
Annual Fuel Usage — Annual Fuel Usage — Electricity Electricity
E= UA x CDH74 SEER
E2 =(600)(9,898)/(10.2)=582,235 wh/yr
=582 kwh/yr
If electricity is $0.0735/kwh, thenannual cost = $43

Simple Payback AnalysisSimple Payback AnalysisSimple Payback AnalysisSimple Payback Analysis
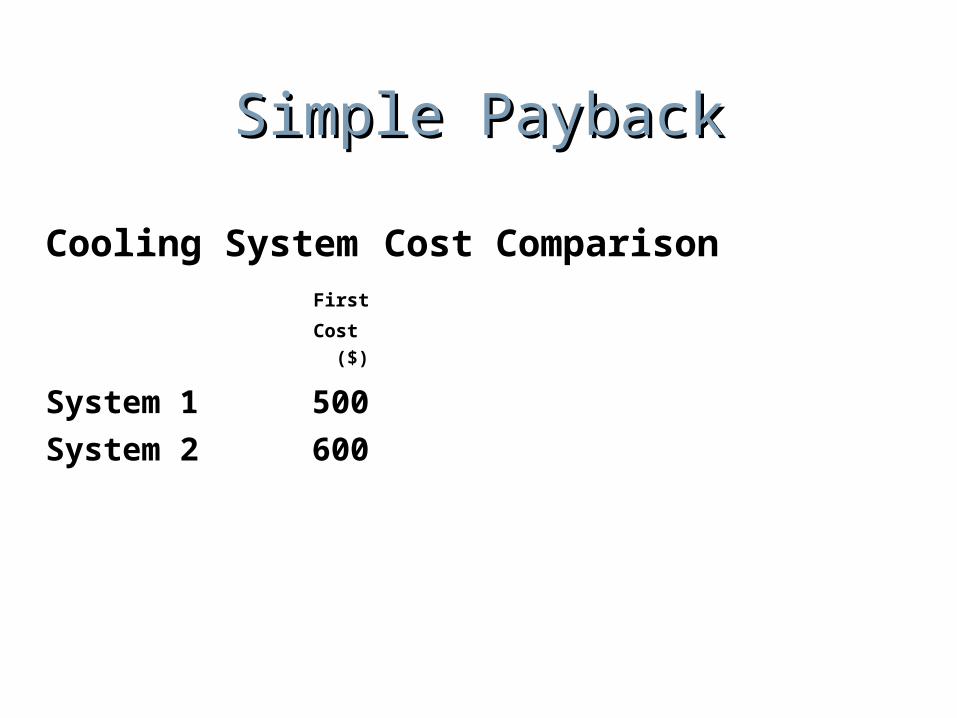
Simple PaybackSimple Payback
Cooling System Cost ComparisonFirst
Cost ($)
System 1 500
System 2 600
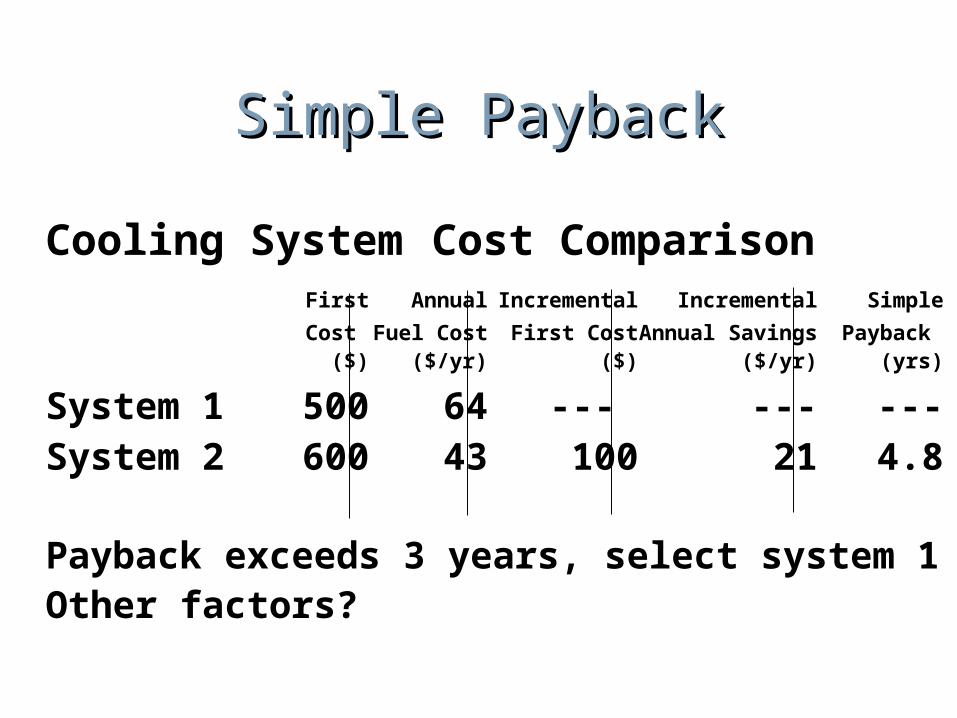
Simple PaybackSimple Payback
Cooling System Cost ComparisonFirst Annual Incremental Incremental Simple
Cost Fuel Cost First CostAnnual Savings Payback ($) ($/yr) ($) ($/yr) (yrs)
System 1 500 64 --- --- ---System 2 600 43 100 21 4.8
Payback exceeds 3 years, select system 1Other factors?