Embed Size (px)
DESCRIPTION
Environmental controlling and the use of indicators. Environmental policy Environmental targets. Planning of measures. Elements of environmental controlling. Mass and energy balances. Control. Organization Documentation Information. Implementation. Evaluation. Start. Management - PowerPoint PPT Presentation
Citation preview
Slides 7 - Indicators and environmental controlling
Environmental controlling and the use of indicators
Slides 7 - Indicators and environmental controlling
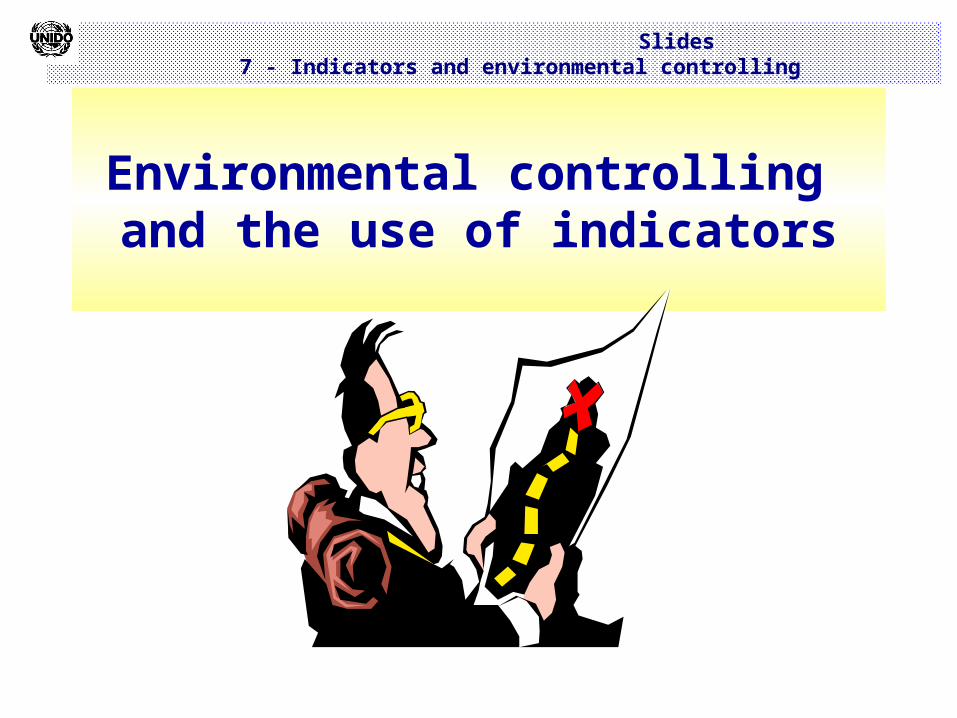
Elements of environmental controlling
Environmental policyEnvironmental targets
Mass and energybalances
Evaluation
Planning ofmeasures
Implementation
Control
Organization
Documentation
Information
Slides 7 - Indicators and environmental controlling
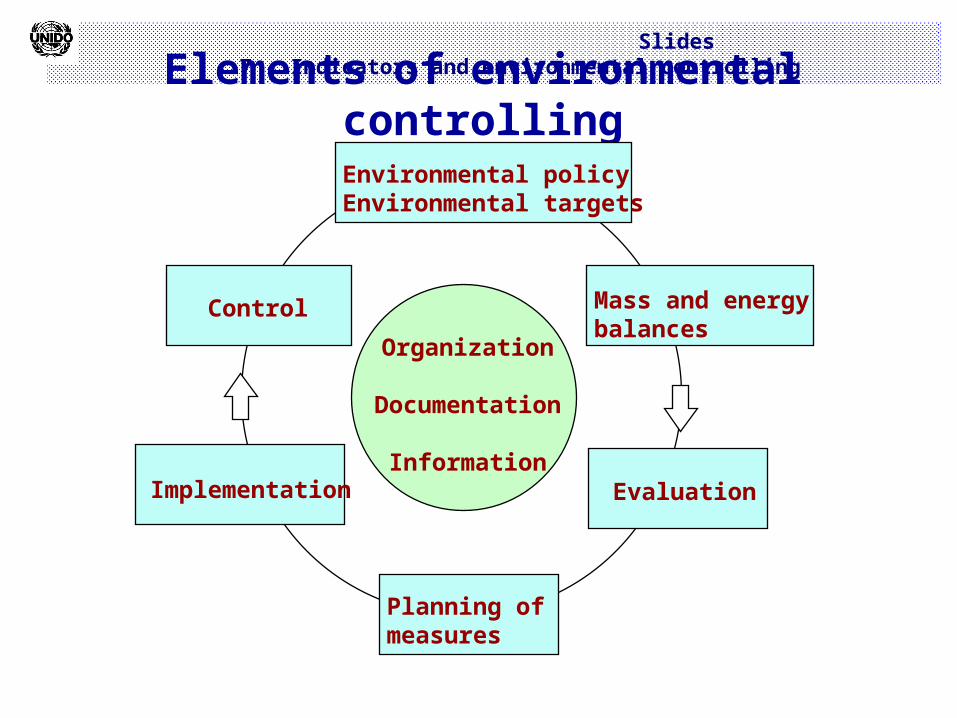
Managementreview
Managementreview
Planning
• Environmental aspects• Legal/other requirements
• Objectives and targets• Environmental
management programme
Monitoring/ Corrective action
• Monitoring and measurement• Nonconformance: corrective
and preventive action• Records
• EMS audits
Start
Implementation
• Structure and responsibility• Training, awareness, competence
• Communication• EMS documentation
• Document control• Operational control• Measures in case of
emergencies
Continualimprovement!
Environmentalpolicy
Slides 7 - Indicators and environmental controlling
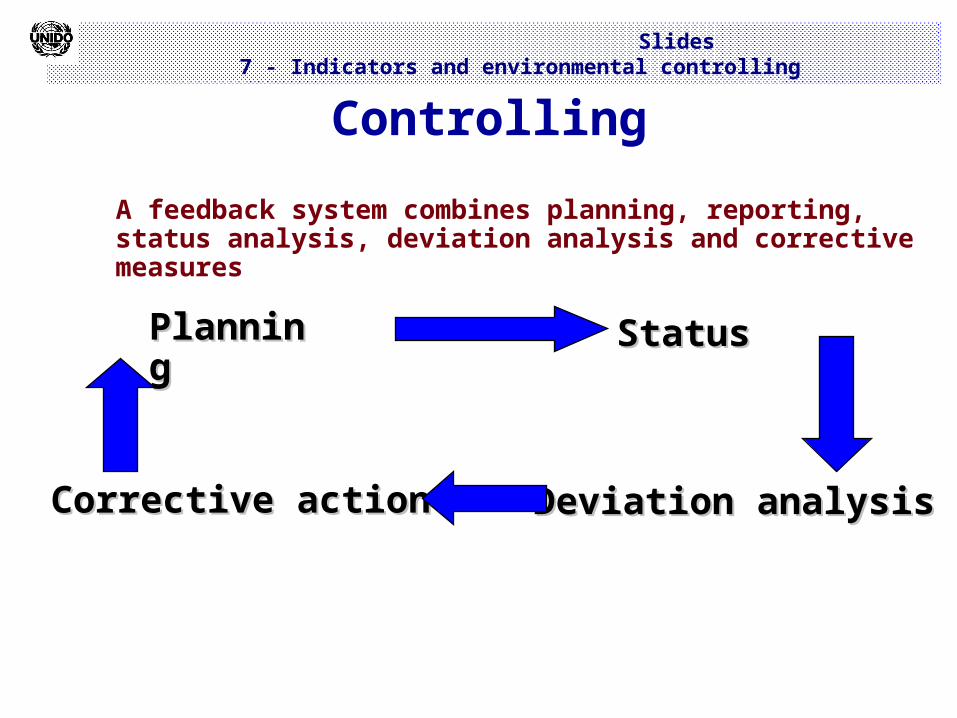
Controlling
A feedback system combines planning, reporting, status analysis, deviation analysis and corrective measures
PlanninPlanningg
StatusStatus
Deviation analysisDeviation analysisCorrective actionCorrective action
Slides 7 - Indicators and environmental controlling
Input/output analysis
Consistent dataIllustrates efficiency
Evaluation criteria: Quantities Financial values Environmental and toxicological properties
Slides 7 - Indicators and environmental controlling
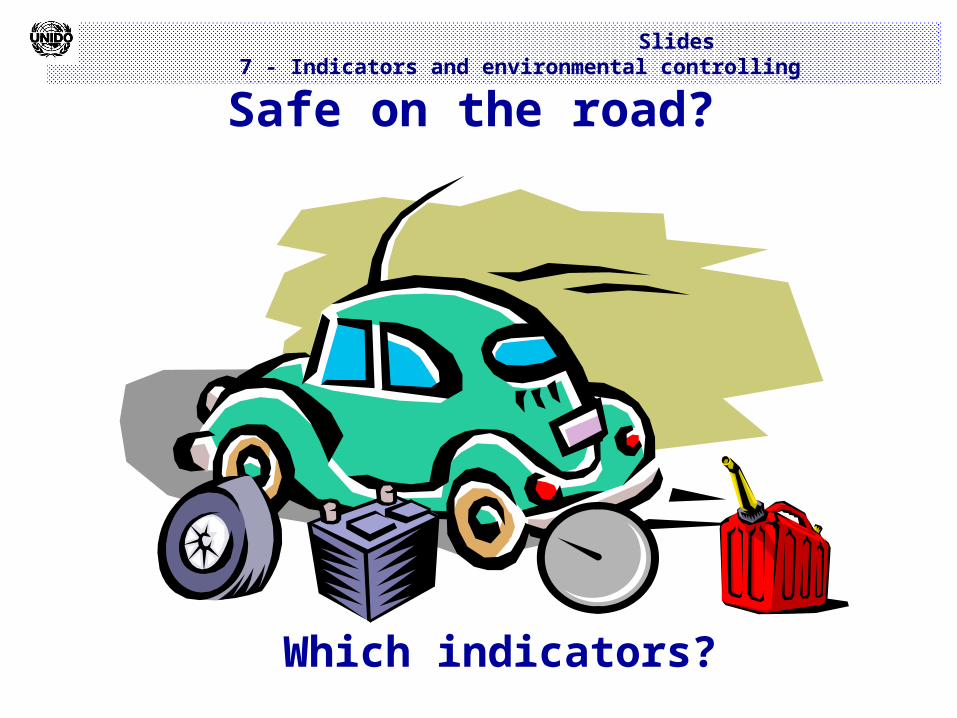
Safe on the road?
Which indicators?
Slides 7 - Indicators and environmental controlling
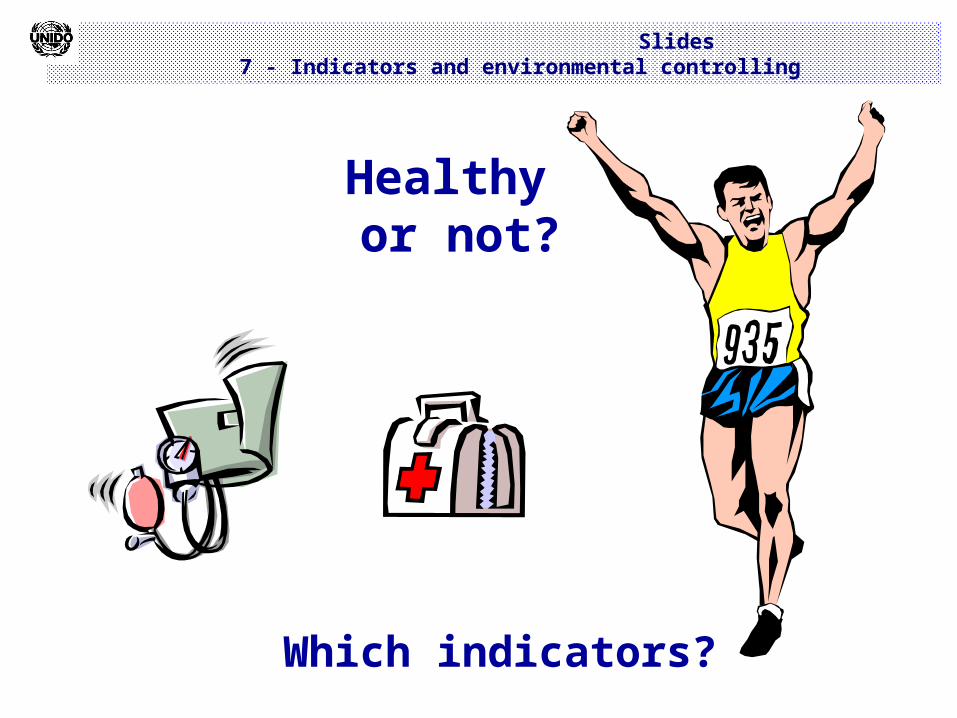
Healthy or not?
Which indicators?
Slides 7 - Indicators and environmental controlling
Aims of indicators
Comparison of the actual to the planned situation
Comparison of companiesComparison of variations
over a period of time
Slides 7 - Indicators and environmental controlling
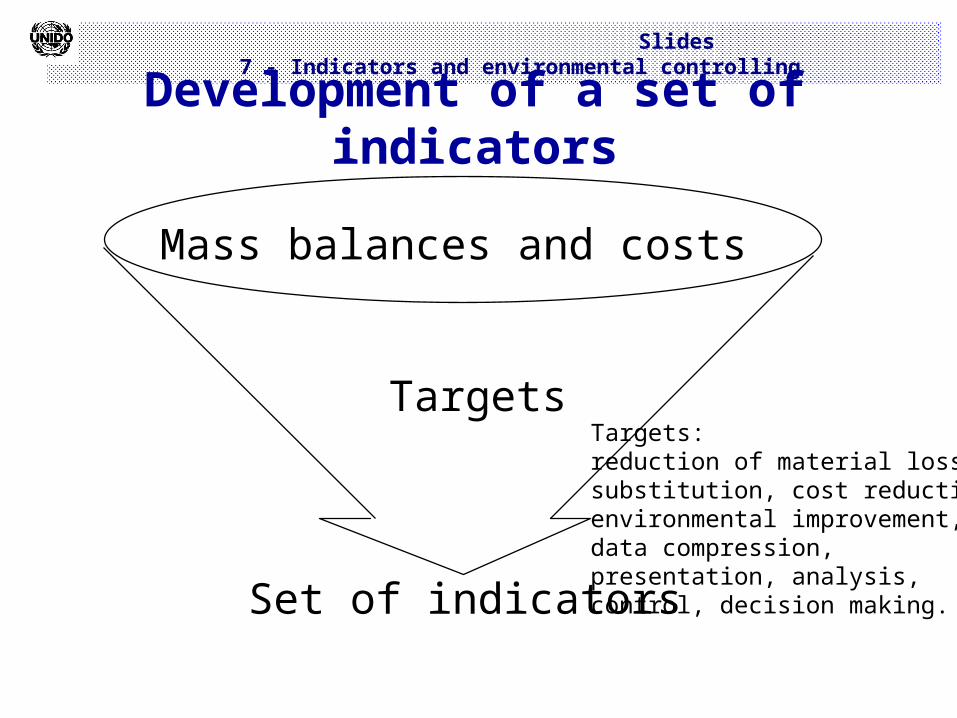
Development of a set of indicators
Mass balances and costs
Targets
Set of indicators
Targets: reduction of material losses,substitution, cost reduction,environmental improvement,data compression, presentation, analysis,control, decision making.
Slides 7 - Indicators and environmental controlling
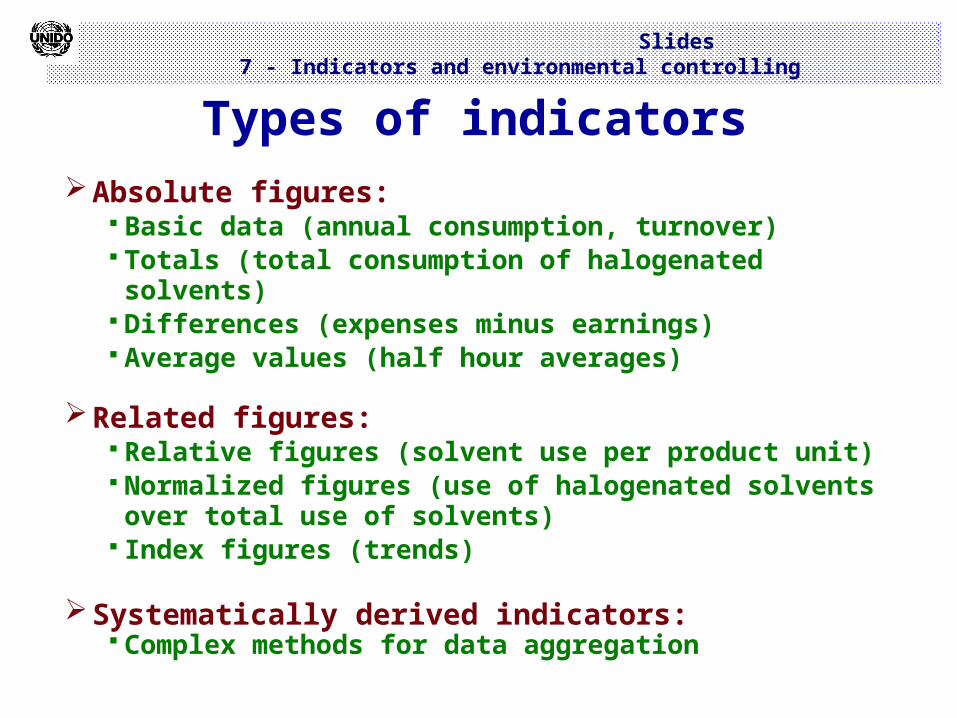
Types of indicatorsAbsolute figures:
Basic data (annual consumption, turnover) Totals (total consumption of halogenated solvents) Differences (expenses minus earnings) Average values (half hour averages)
Related figures: Relative figures (solvent use per product unit) Normalized figures (use of halogenated solvents over total use of solvents)
Index figures (trends)
Systematically derived indicators: Complex methods for data aggregation
Slides 7 - Indicators and environmental controlling
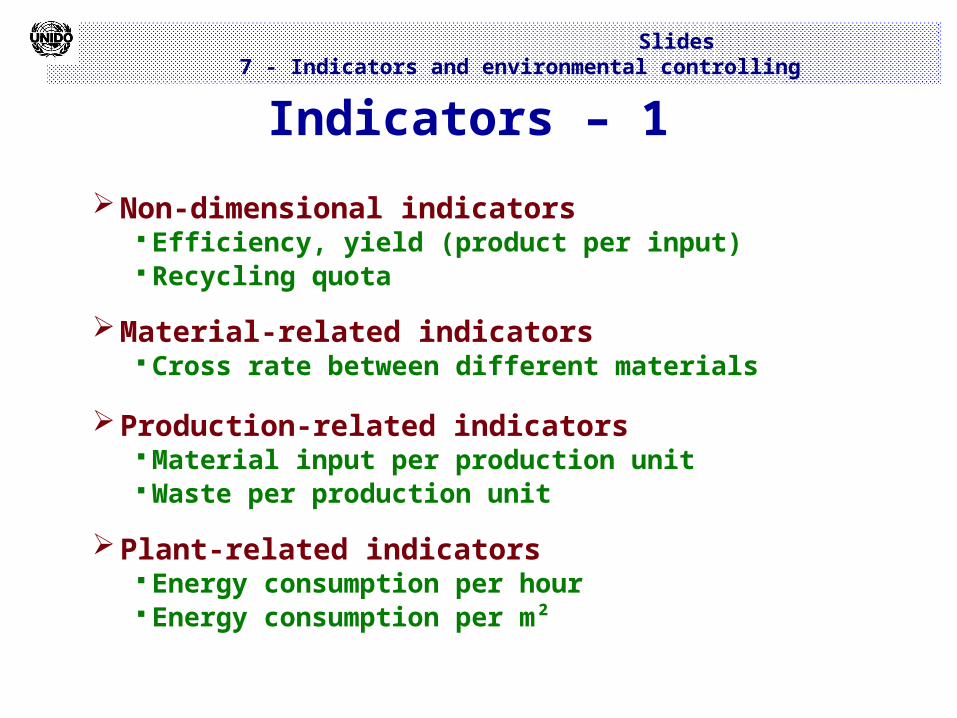
Indicators – 1
Non-dimensional indicators Efficiency, yield (product per input) Recycling quota
Material-related indicators Cross rate between different materials
Production-related indicators Material input per production unit Waste per production unit
Plant-related indicators Energy consumption per hour Energy consumption per m²
Slides 7 - Indicators and environmental controlling
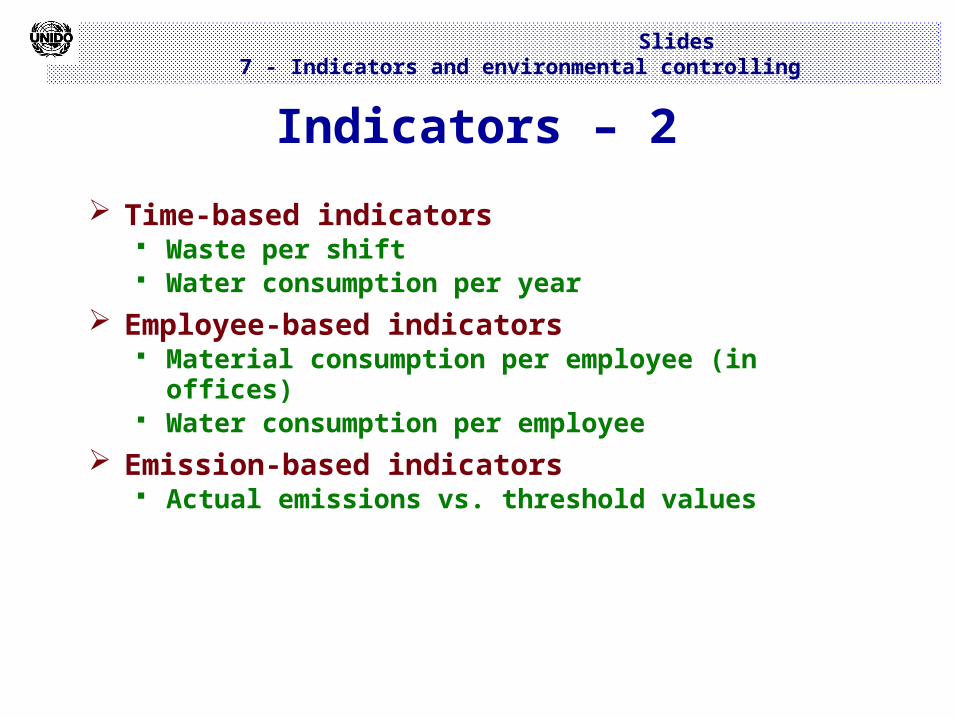
Indicators – 2
Time-based indicators Waste per shift Water consumption per year
Employee-based indicators Material consumption per employee (in offices) Water consumption per employee
Emission-based indicators Actual emissions vs. threshold values
Slides 7 - Indicators and environmental controlling
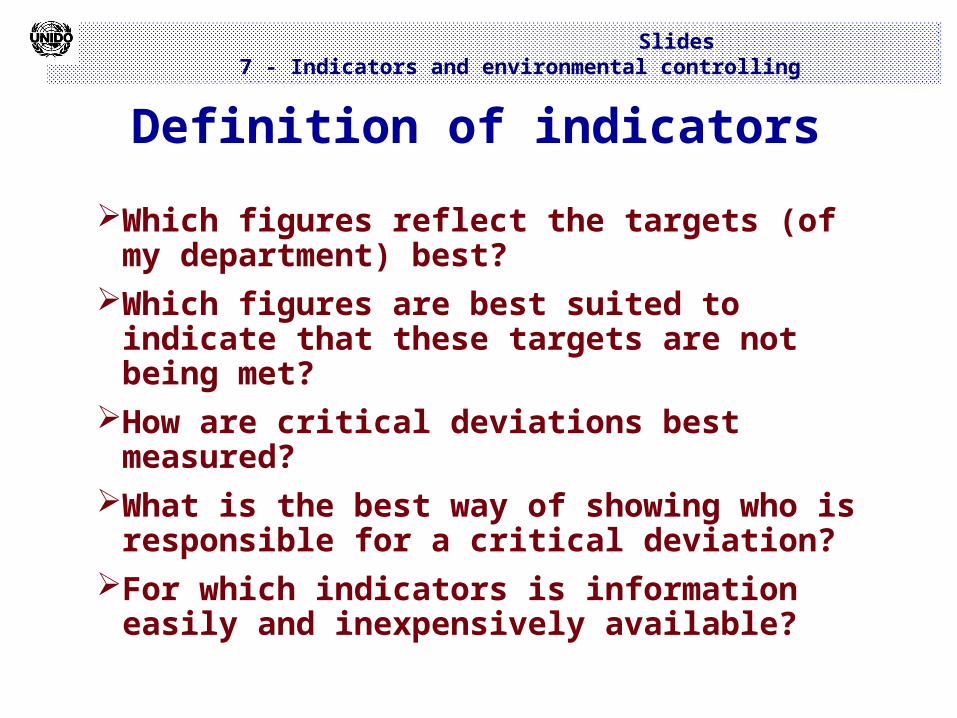
Definition of indicators
Which figures reflect the targets (of my department) best?
Which figures are best suited to indicate that these targets are not being met?
How are critical deviations best measured?
What is the best way of showing who is responsible for a critical deviation?
For which indicators is information easily and inexpensively available?
Slides 7 - Indicators and environmental controlling
Slides 7 - Indicators and environmental controlling
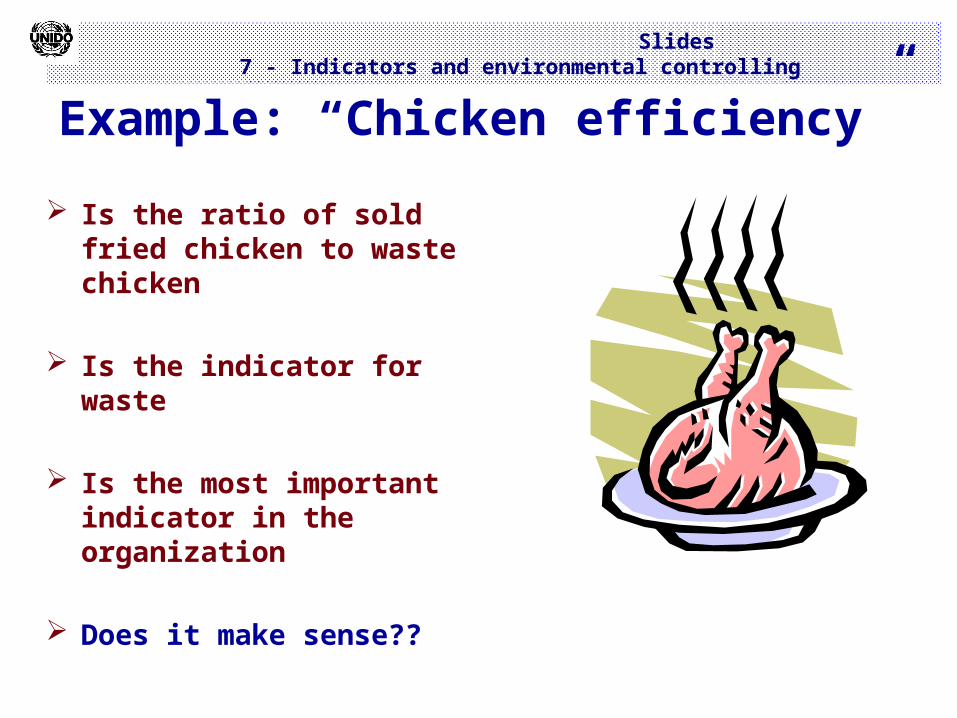
Example: “Chicken efficiency”
Is the ratio of sold fried chicken to waste chicken
Is the indicator for waste
Is the most important indicator in the organization
Does it make sense??
Slides 7 - Indicators and environmental controlling
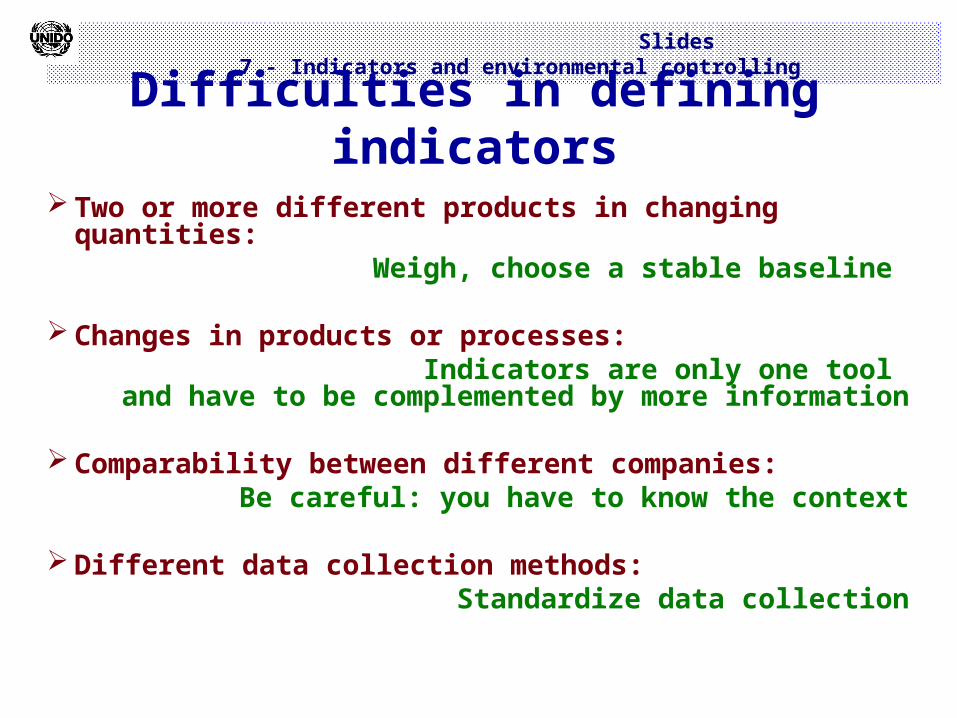
Difficulties in defining indicators
Two or more different products in changing quantities:
Weigh, choose a stable baseline
Changes in products or processes:Indicators are only one tool
and have to be complemented by more information
Comparability between different companies:Be careful: you have to know the context
Different data collection methods:Standardize data collection
Slides 7 - Indicators and environmental controlling
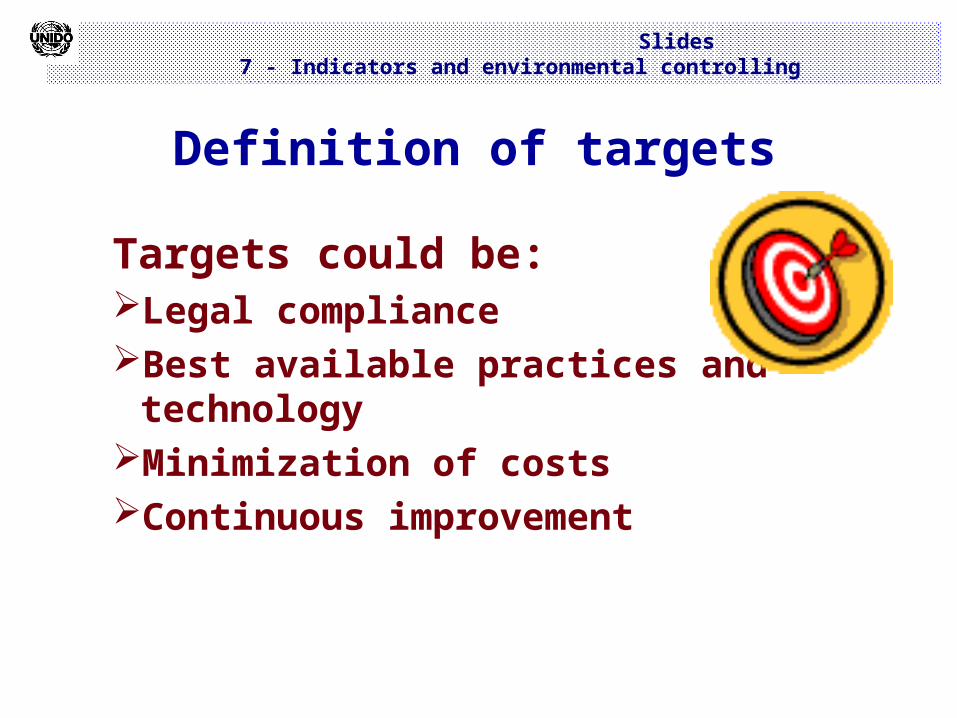
Definition of targets
Targets could be:Legal complianceBest available practices and
technologyMinimization of costsContinuous improvement
Slides 7 - Indicators and environmental controlling
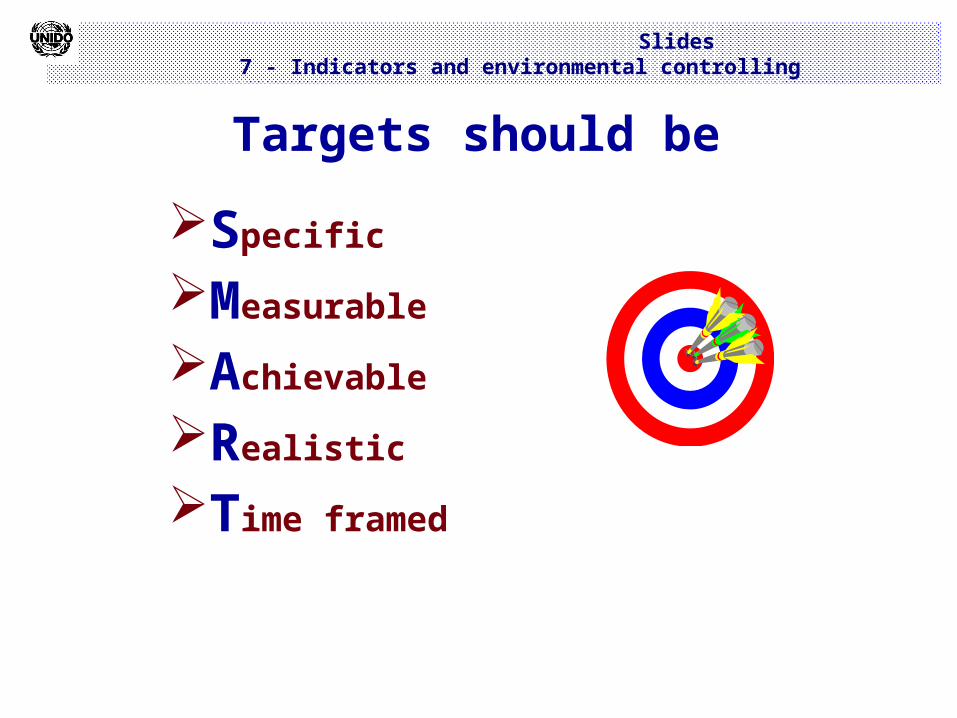
Targets should be
Specific
Measurable
Achievable
Realistic
Time framed
Slides 7 - Indicators and environmental controlling
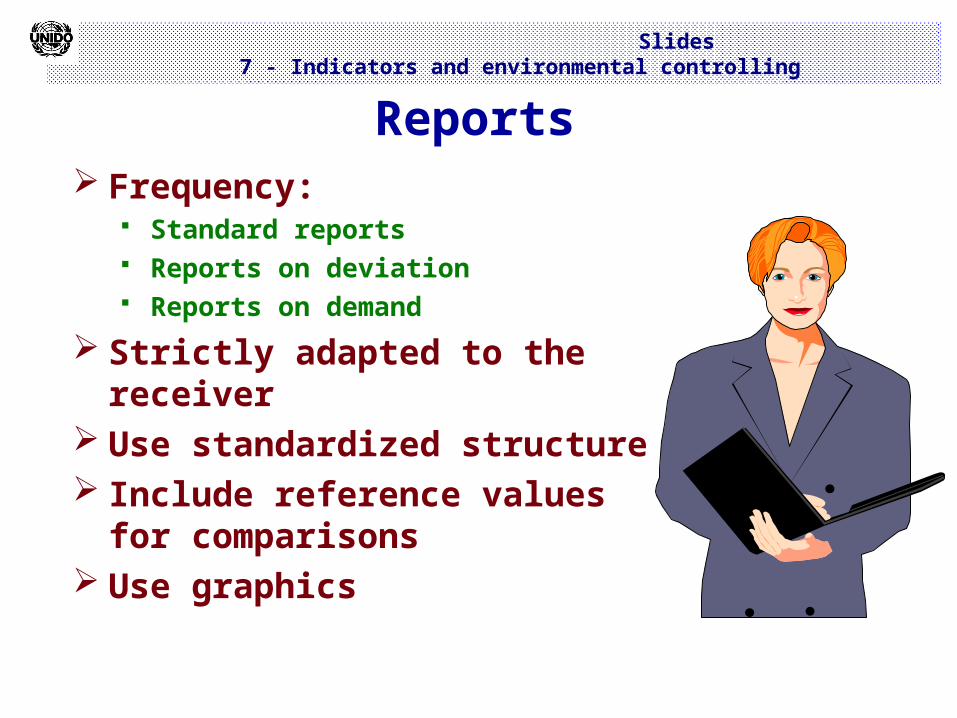
Reports Frequency:
Standard reports Reports on deviation Reports on demand
Strictly adapted to the receiver
Use standardized structure Include reference values for
comparisons Use graphics
Slides 7 - Indicators and environmental controlling
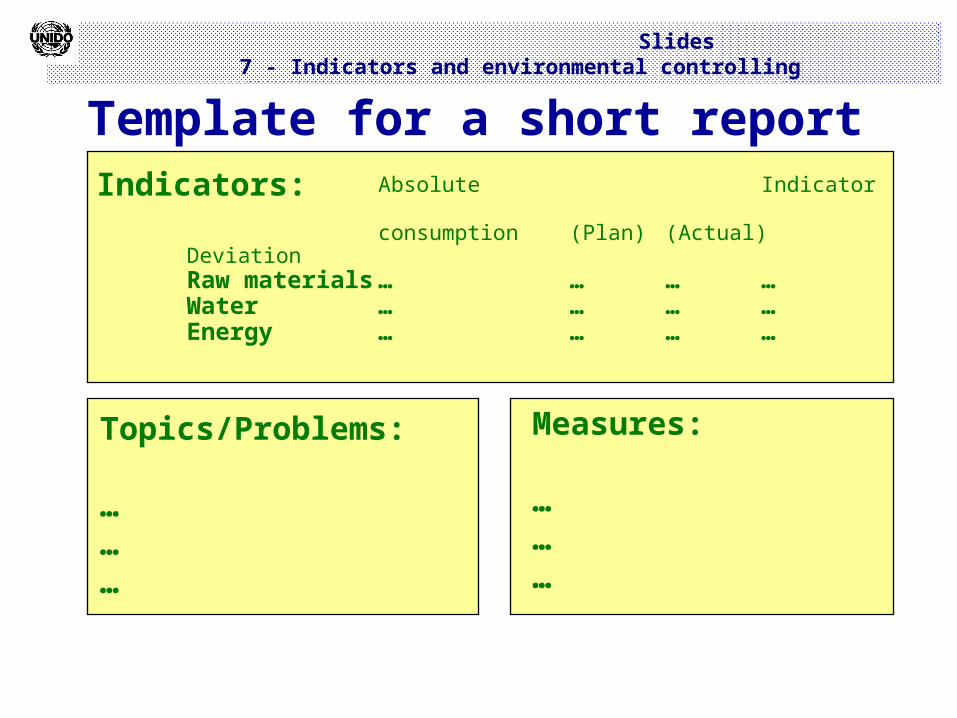
Template for a short report
Topics/Problems:
………
Measures:
………
Indicators: Absolute Indicator consumption (Plan) (Actual) Deviation
Raw materials … … … …Water … … … …Energy … … … …
Slides 7 - Indicators and environmental controlling
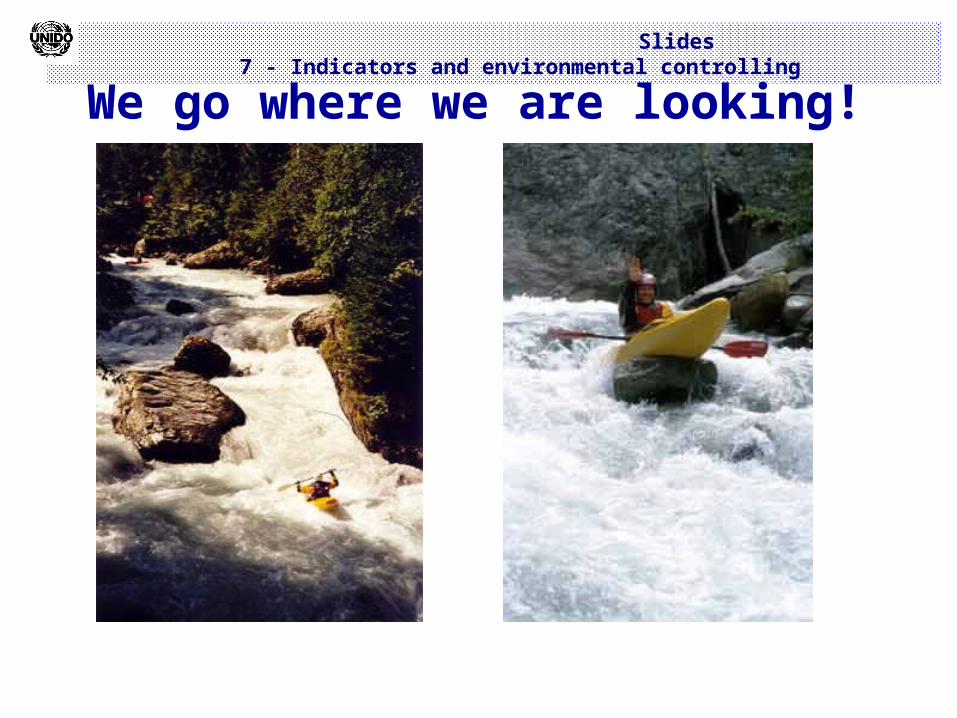
We go where we are looking!
Slides 7 - Indicators and environmental controlling
If we know where we want to go, we can take small
steps!